All posts by Ryan Bachman

Announcing General Availability of GitLab Duo with Amazon Q

Post Syndicated from Ryan Bachman original https://aws.amazon.com/blogs/devops/announcing-general-availability-of-gitlab-duo-with-amazon-q/

Announcing General Availability of GitLab Duo with Amazon Q

Today, we’re excited to announce the general availability of GitLab Duo with Amazon Q. This new offering is an integrated product, bringing together GitLab’s DevSecOps platform with Amazon Q’s generative AI capabilities. Gitlab Duo with Amazon Q embeds Amazon Q agent capabilities directly in GitLab’s DevSecOps platform to accelerate complex, multi-step tasks across the entire software development lifecycle.

In today’s fast-paced software development environment, developers are constantly looking for ways to improve productivity while maintaining best practices for code quality, security, and deployment. The integration of GitLab Duo with Amazon Q addresses these needs by combining GitLab’s comprehensive DevSecOps platform with Amazon Q’s intelligent coding assistance.

This integration enables developers to leverage AI throughout their entire workflow—from idea conception to deployment—all within the familiar GitLab environment they already use. For new and existing Amazon Q Developer users, this integration also leverages the same Q Developer agents available in the IDE, providing a consistent experience across different interfaces.

Key Benefits and Features

The GitLab Duo with Amazon Q integration delivers significant value to development teams by creating a more efficient, secure, and collaborative workflow.

This integration eliminates the need to switch between different tools and environments, as developers can access powerful AI assistance directly within GitLab. GitLab helps automate building, testing, packaging, and deployment of secure code, streamlining the entire development lifecycle. What makes this particularly powerful is how the AI agents utilize the context throughout a GitLab project to keep the SLDC “loop” going. So whether you are troubleshooting a failed pipeline, investigating a vulnerability, or writing a new feature, Amazon Q agents can leverage the appropriate context to assist you with the task at hand.

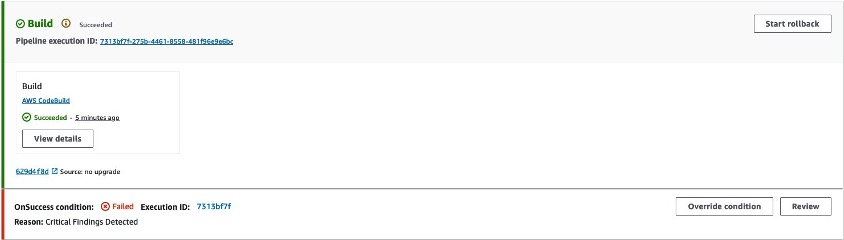
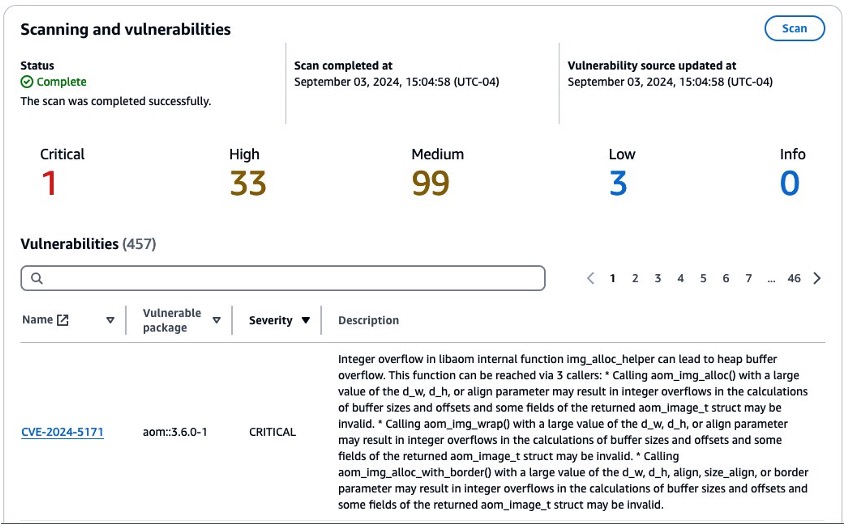
Security and compliance are foundational elements of this integration. End-to-end security controls are built directly into the platform. The Amazon Q agents come with appropriate guardrails to help customers meet compliance without affecting development velocity, all while leveraging AWS’s cloud infrastructure to scale your AI-enhanced development workflows with confidence. You can ask Amazon Q agents to help remediate a finding in the project’s vulnerability reports or help troubleshoot a failed pipeline.

Throughout your development workflow, you’ll find collaborative AI agents ready to assist with various tasks. Whether you need to upgrade Java code from version 8 or 11 to 17, get AI-powered code review suggestions, automatically generate comprehensive test cases, or transform ideas into complete merge requests—Amazon Q is there to help at every step. These intelligent agents work alongside your team, enhancing productivity.

Use Cases and Examples

To demonstrate how GitLab and Amazon Q complement each other to accelerate development productivity and help organizations with application security, I’ll be using a Java application enjoyed by puzzle enthusiasts.

A Video of playing Q Words

Idea to Merge Request

Whether you are looking to scale your developer teams or streamline the processes between feature requests and production, GitLab Duo with Amazon Q is now integrated into GitLab’s platform, so you can begin development simply by assigning a GitLab issue to Amazon Q Developer agents.

I start by creating a task in my GitLab project. I want to create a new feature to support multiple languages in the Q words game.

Creating a new issue for the Q Dev agent

From here I assign the task directly to the Amazon Q agent by using GitLab’s quick action /q dev in the issue’s comment section.

Invoking the Q Dev Agent with a quick action

The agent will automatically open up a merge request for me to review with suggested code changes. Here you can see changes the agent made across 11 files, accounting for front-end, API, and styling changes. In the past I would have opened my IDE, cloned the project, and coded these changes myself. Using GitLab Duo with Amazon Q, I just review and test the new code before I am ready to deploy.

The merge request created by the Q Dev Agent

Code Reviews

Code reviews play a critical function during the development life-cycle. They act as a quality gate to help maintain high quality security and coding standards. While important, code reviews add latency to software delivery, especially when reviewers are not available or when changes are complex.

The Amazon Q agent for Code Reviews in GitLab helps teams move faster through their code review. Using the quick action /q review in a merge request comment field sends the merge request to Amazon Q, where it will identify security and quality risks associated with code changes in the merge request.

I start by opening an open merge request. In this example, another developer had the task to add authentication to the Q words application.

I then invoke the agent with the /q review quick action.

Invoking the Q review agent

The review is returned as inline code suggestions to the merge request. Here you can see an example of a finding from the review agent. Comments include a description of the findings as well as guidance and links to help improve the code.

Amazon Q Review adds comments to the merge request

I next use the Gitlab Duo with Amazon Q chat agent in the web interface to ask for a summary of the change and ask it to highlight any critical issues. GitLab Duo chat allows me to ask questions about the current resource in the URL. In this example it is the merge request, but it could also be a GitLab issue I want to explain or a summary of a code file in a repository.

Chatting with GitLab Dou with Amazon Q

Test Generation

Next, I ask GitLab Duo with Amazon Q to generate tests using the /q test quick action. Adding this action to the comment field will generate recommended tests when the MR lacks sufficient tests.

A test recommened by the Q test agent

The summary I receive from GitLab Duo with Amazon Q helps me understand the scope of the changes and focuses my attention to the more important aspects of the change. Along with the tests that Q Developer agents recommended, I am able to approve the merge request in less time.

Java Transformation

Upgrading Java applications from older versions to Java 17 can be time-consuming and error-prone. With GitLab Duo and Amazon Q, I can leverage the transform agent to help me automate the migration from the current Java 8 code to Java 17 along with upgrading the project’s dependencies. I start by creating a new issue in my GitLab project that indicates the Java upgrade.

Creating a new issue for the Q Transform agent

To begin the upgrade, I use the GitLab Q quick action /q transform to begin the upgrade process. The Amazon Q transformation agent asks me to update the gitlab-ci.yaml file to continue the process.

Instructions on how to update your .gitlab-ci.yaml file

I can follow the agent’s progress by watching for updates in the Issue’s details. GitLab Duo with Amazon Q will also add a transformation plan to the issue so I can understand what types of changes will be involved to complete the upgrade.

The Amazon Q Agent will provide a transformation plan before it begins

When the transform is complete, a new merge request is opened for me to review. As you can see, my pom.xml file was updated to compile on Java 17 as well as additional changes to ensure the project compiles. It also includes a report detailing next steps to consider before merging and deploying the updated Java code.

A completed summary from the Q transform agent

Conclusion

In this post, I demonstrated how GitLab Duo with Amazon Q can help scale and improve application development. Using GitLab Duo with Amazon Q, I was able to quickly add additional features, review code changes, and upgrade my application to Java 17 all within GitLab’s collaborative interface. I now have a secure and modern java app that I can use to practice my Español.

The general availability of GitLab Duo with Amazon Q marks a significant milestone in AI-assisted software development. By combining GitLab’s comprehensive DevSecOps platform with Amazon Q ‘s generative AI capabilities, this integration empowers development teams to work more efficiently while maintaining high standards of security and compliance.

Organizations can now leverage this powerful integration to accelerate their software development lifecycle, reduce manual effort, and ship more secure code faster. The seamless developer experience, enterprise-grade security, and collaborative AI agents throughout the workflow make this integration a valuable addition to any development team’s toolkit. We’re excited to see how customers leverage this integration to transform their development processes and achieve new levels of productivity and innovation.

Learn More

About the Author:
Ryan Bachman profile image

Ryan Bachman

Ryan Bachman is a Sr. Specialist Solutions Architect with Amazon Web Services (AWS) Next Generation Developer Experience Team. Ryan is passionate about helping customers adopt process and services that increase their efficiency developing applications for the cloud. He has over 20 years professional experience as a technologist, including roles in development, network architecture, and technical product management.

Enhance release control with AWS CodePipeline stage-level conditions

Post Syndicated from Ryan Bachman original https://aws.amazon.com/blogs/devops/enhance-release-control-with-aws-codepipeline-stage-level-conditions/

It’s an established practice for development teams to build deployment pipelines, with services such as AWS CodePipeline, to increase the quality of application and infrastructure releases through reliable, repeatable and consistent automation.

Automating the deployment process helps build quality into our products by introducing continuous integration to build and test code, however enterprises may sometimes wish to implement certain conditions such as an approved deployment window to ensure more fine-grained control over pipeline executions.

AWS CodePipeline recently added stage-level conditions to implement pipeline gates. In this blog post, we will cover how you can implement stage-level conditions to improve your governance, code quality, and security by following a simple pipeline scenario detailed in the sections below.

AWS CodePipeline

AWS CodePipeline is a fully managed continuous delivery service that helps you automate your release pipelines for fast and reliable application and infrastructure updates.

AWS CodePipeline orchestration stages

Figure 1. AWS CodePipeline orchestration

CodePipeline has three core constructs:

  • Pipelines – A pipeline is a workflow construct that describes how software changes go through a release process. Each pipeline is made up of a series of stages.
  • Stages – A stage is a logical unit you can use to isolate an environment and to limit the number of concurrent changes in that environment. Each stage contains actions that are performed on the application artifacts.
  • Actions – An action is a set of operations performed on application code and configured so that the actions run in the pipeline at a specified point.

A pipeline execution is a set of changes released by a pipeline. Each pipeline execution is unique and has its own ID. An execution corresponds to a set of changes, such as a merged commit or a manual release of the latest commit.

You can now configure stage-level conditions to gate a pipeline execution before entering the stage, as well as when exiting a stage for both success and failure state. A condition consists of one or more rules, and a result (such as rolling back) to apply when the condition fails. Conditions are also referred to as gates because they allow you to specify when an execution will enter and run through a stage or exit the stage after running through it.

You can configure a stage-level condition from the console, API, CLI, AWS CloudFormation, or SDK. For the purposes of this blog post, we will showcase how you can configure the two gate scenarios using the console. You can see how you can create conditions using the CLI in the documentation.

Scenario

For this blog, we started with a four stage Pipeline based off the Amazon ECS deployment example from this tutorial. While this tutorial provides a getting started example on how to build a CI/CD pipeline for an ECS application, it lacks the quality gates we want to enforce to ensure what we deploy to production is safe and tested. For this we will turn to CodePipeline stage-level conditions to verify certain criteria is met throughout the pipeline execution.

In our environment, we started with a source repository in a Github organization and used AWS CodeConnections to connect the source stage to our pipeline. Inside our repository are files for a sample application, a Dockerfile to build our application, and a buildspec.yaml file to define the steps that will be executed in the build stage of our pipeline. We added a fourth stage to our pipeline which separated production deployments after a successful deployment to the staging environment. We released a change using this pipeline to ensure everything deployed as expected.

Example of a 4-Stage CodePipeline

Figure 2: Example of a 4-Stage CodePipeline

Applying Stage Conditions

One of the primary concerns in any development process is maintaining high code quality standards. With stage-level conditions, you can now include specific checks to verify that your organization’s security and governance standards are met throughout the entire execution of your pipelines. These checks can include restricting deployments to certain days of the week, monitoring Amazon CloudWatch alarms prior to progressing, and verifying the results of security testing before promoting code as examples.

The AWS CodePipeline documentation details what conditions are available and how they can be used.

You can add conditions to stages on the pipelines detail page by choosing Edit and then selecting Edit stage from the relevant stage.

Adding a stage condition in the AWS console

Figure 3: Adding a Stage Condition in the AWS console

In our pipeline, we added rules that address three scenarios:

  • Scenario 1 – “On Success” condition that fails if the Amazon Elastic Container Registry (Amazon ECR) image scanning detects a critical severity in the Docker image in the build stage.
  • Scenario 2 – “On Failure” condition that rolls back a deployment stage in the event a CloudWatch alarm triggers after a successful deployment.
  • Scenario 3 – “Entry” condition to prevent deploying to production on Fridays, Saturdays and Sundays

Scenario 1 – “On Success” condition

For the first gate we implemented an OnSuccess exit condition that would fail the execution using the AWS Lambda Invoke rule provider. If you would like to dive deeper into this implementation, you can take a look at Logging image scan findings from Amazon ECR in CloudWatch using an AWS Lambda function.

Lambda invoke rule in the console

Figure 4: Lambda invoke rule in the console

Before we added this condition rule, we created a Lambda function in the same region that was responsible for getting the findings from an image scan that Amazon ECR executed. If a critical finding was detected in the image, the Lambda function will fail the condition. You can read more about utilizing Lambda with CodePipeline in the documentation. The LambdaInvoke rule is able to use input artifacts to implement additional logic in the function. Here we passed in the artifact created during the build stage which contains the ECR image name and tag. This pattern allows you to re-use Lambda functions as conditions across many pipelines.

After configuring the rule, we reviewed our stage configuration and saved the pipeline.

Adding a stage condition to the build stage

Figure 5: Adding a stage condition to the build stage

Scenario 2 – “On Failure” condition

Next, we configured a condition to fail and rollback a deployment in our staging environment. If you would like to read more about implementing rollback in your CodePipeline pipelines, you can refer to De-risk releases with AWS CodePipeline rollbacks. Oftentimes a deployment will appear successful, but regressions in the code, or bugs in a new feature, may surface only when users interact with the application. To mitigate this risk, we configured a CloudWatch alarm to alert when error rates exceeded 3% of overall traffic.

CloudWatch alarm definition

Figure 6: Amazon CloudWatch alarm definition

We then added an OnSuccess condition to the DeployToStage stage with a rollback rule that tracks the CloudWatch alarm configured for the above error rate metric. A wait time was configured in the rule to allow time for CloudWatch to detect any increase in errors related to the new deployment.

AWS CodePipeline condition rule using Amazon CloudWatch

Figure 7: AWS CodePipeline condition rule using Amazon CloudWatch

Scenario 3 – “Entry” condition

Finally, we added a third condition as an entry condition to the DeployToProduction stage. We added an AWS DeploymentWindow rule provider with a cron expression to fail the condition if a deployment to production was executed outside of our defined window.

Cron rule for AWS CodePipeline stage conditions

Figure 8: Cron rule for AWS CodePipeline stage conditions

Testing Stage Conditions

Testing Scenario 1

To test our CodePipeline with these stage-level conditions, we executed a git push to the source repository, which triggered a new pipeline execution. Our build stage successfully built a Docker image and pushed that image to the ECR repository, triggering the OnSuccess condition to check for critical vulnerabilities. The Lambda function reported that the scan exceeded our vulnerability threshold and stopped our pipeline with a reason of “Critical Findings Detected”

ECR scan condition failure

Figure 9: Amazon ECR scan condition failure

Navigating to the Amazon Elastic Container Registry service console, we were able to identify the critical vulnerability.

Amazon ECR vulnerability report

Figure 10: Amazon ECR vulnerability report

By reading the CVE we learned that the finding was related to a system package present in the source image defined in our Dockerfile. To remediate this issue, we added a new line to the Dockerfile in our source repository. The full Dockerfile is shown below for example with the change highlighted.

FROM public.ecr.aws/docker/library/python:3.12

WORKDIR /qchess
COPY . /qchess/
RUN apt-get remove --purge git git-man -y
RUN cd /qchess && pip install -r requirements.txt
RUN apt update && apt upgrade -y

CMD ["flask","run","--host=0.0.0.0","--port=80"]

With this change, we ensured that our image’s system packages would be upgraded on every build along with the version of the vulnerable package discovered by our condition check. We committed and pushed to our source repository to trigger a new pipeline execution.

Testing Scenario 2

During the next run, our Pipeline made it to the DeployToStage stage and successfully deployed our code changes to our staging environment. However, when the OnSuccess condition was executed, it detected that the error rate alarm had transitioned to alarm status, resulting in the stage condition to issue a rollback. We had a bug in our new feature!

CloudWatch Rule triggering a stage rollback

Figure 11: CloudWatch Rule triggering a stage rollback

We reviewed the CloudWatch alarm and noticed the elevated error rates related to the deployment. The error rates returned to normal after the stage completed its rollback.

Amazon CloudWatch alarm details

Figure 12: Amazon CloudWatch alarm details

After this rollback we reviewed our code changes and discovered a bug in the code. We made the appropriate changes and pushed to our main branch.

Testing Scenario 3

In the final pipeline execution, the pipeline made it past our DeployToStage condition and entered the entry condition in our DeployToProduction stage. This condition verified that the deployment was being executed within the defined deployment window and successfully deployed our change to production.

Deployment window allowed by condition rule

Figure 13: Deployment window allowed by stage condition rule

Clean up

If you followed along you should remove any resources you created related to this scenario. These resources include:

  • ECS Services
  • ECR Repository
  • CodeBuild Project
  • CodePipeline Pipeline
  • Lambda Function
  • CloudWatch Alarm
  • Associated IAM roles

Conclusion

Adding conditions to your AWS CodePipeline pipelines allows you to have fine-grained control over your pipeline. We have seen how you can safely automate deployments based on variables relevant to your organization. To learn more about CodePipeline conditions, visit How do stage conditions work.

Further reading

About the Authors:
Ryan Bachman profile image

Ryan Bachman

Ryan Bachman is a Sr. Specialist Solutions Architect with Amazon Web Services (AWS) with a focus on DevOps. Ryan is passionate about helping customers adopt process and services that increase their efficiency developing applications for the cloud. He has over 20 years professional experience as a technologist, including roles in development, network architecture, and technical product management.

Mirabela Dan profile image

Mirabela Dan

Mirabela Dan is a Solutions Architect for AWS with a focus on Next Generation Developer Experience and building Generative AI applications. She is passionate about DevOps and making developers lives easier with automation and productivity solutions. Outside of work, Mirabela loves travelling (70+ countries) and is a keen museum-goer and reader of history books.

AWS CodeBuild adds support for AWS Lambda compute mode

Post Syndicated from Ryan Bachman original https://aws.amazon.com/blogs/devops/aws-codebuild-adds-support-for-aws-lambda-compute-mode/

AWS CodeBuild recently announced that it supports running projects on AWS Lambda. AWS CodeBuild is a fully managed continuous integration (CI) service that allows you to build and test your code without having to manage build servers. This new compute mode enables you to execute your CI process on the same AWS Lambda base images supported by the AWS Lambda service, providing consistency, performance, and cost benefits. If you are already building and deploying microservices or building code packages, its likely these light-weight and smaller code bases will benefit from the efficiencies gained by using Lambda compute for CI. In this post, I will explain the benefits of this new compute mode as well as provide an example CI workflow to demonstrate these benefits.

Consistency Benefits

One of the key benefits of running AWS CodeBuild projects using the AWS Lambda compute mode is consistency. By building and testing your serverless applications on the same base images AWS Lambda provides, you can ensure that your application works as intended before moving to production. This eliminates the possibility of compatibility issues that may arise when deploying to a different environment. Moreover, because the AWS Lambda runtime provides a standardized environment across all regions, you can build your serverless applications in Lambda on CodeBuild and have the confidence to deploy to any region where your customers are located.

Performance and Cost Benefits

Another significant advantage of running AWS CodeBuild projects on the AWS Lambda compute mode is performance. When you run your project with EC2 compute mode, there may be increased start-up latency that impacts the total CI process.  However, because AWS Lambda is designed to process events in near real-time, executing jobs on the AWS Lambda compute mode can result in significant time savings. As a result, by switching to this new compute mode, you save time within your CI process and increase your frequency of integration.

Related to performance, our customers are looking for opportunities to optimize cost and deliver business value at the lowest price point. Customers can see meaningful cost optimization when using Lambda. Lambda-based compute offers better price/performance than CodeBuild’s current Amazon Elastic Compute Cloud (Amazon EC2) based compute — with per-second billing, 6,000 seconds of free tier, and 10GB of ephemeral storage. CodeBuild supports both x86 and Arm using AWS Graviton Processors for the new compute mode. By using the Graviton option, customers can further achieve lower costs with better performance.

Considerations

There are a few things to consider before moving your projects to AWS Lambda compute mode. Because this mode utilizes the same AWS Lambda service used by customers, there is a maximum project duration of 15 minutes and custom build timeouts are not supported. Additionally, local caching, batch builds, and docker image builds are not supported with Lambda compute mode. For a full list of limitations please refer to the AWS CodeBuild User Guide.

Walk-Through

In this walk-through I used a simple React app to showcase the performance benefits of building using CodeBuild’s Lambda compute option. To get started, I created an AWS CodeCommit repository and used npm to create a sample application that I then pushed to my CodeCommit repo.

CodeCommit repository for react code

Figure 1: CodeCommit Repository

Once my sample application is stored in my code repository, I then navigated to the AWS CodeBuild console. Using the console, I created two different CodeBuild projects. I selected my CodeCommit repository for the projects’ source and selected EC2 compute for one and Lambda for the other.

CodeBuild compute mode options

Figure 2: CodeBuild compute mode options

The compute mode is independent from instructions included in the project’s buildspec.yaml, so in order to test and compare the CI job on the two different compute modes, I created a buildspec and pushed that to the CodeCommit repository where I stored my simple React app in the previous step.

buildspec.yaml
version: 0.2
phases:
  build:
    commands:
      - npm install -g yarn
      - yarn
      - npm run build
      - npm run test -- --coverage --watchAll=false --testResultsProcessor="jest-junit"
artifacts:
  name: "build-output"
  base-directory: 'react-app'
  files:
    - "**/*"
reports:
  test-report:
    base-directory: 'react-app'
    files:
      - 'junit.xml'
    file-format: 'JUNITXML'
  coverage-report:
    base-directory: 'react-app'
    files:
      - 'coverage/clover.xml'
    file-format: 'CLOVERXML'

Once my projects were ready, I manually started each project from the console. Below are screenshots of the details of the execution times for each.

EC2 compute mode details

Figure 3: EC2 compute mode details

Lambda Compute mode details

Figure 4: Lambda compute mode details

If you compare the provisioning and build times for this example you will see that the Lambda CodeBuild project executed significantly faster. In this example, the Lambda option was over 50% faster than the same build executed on EC2. If you are frequently building similar microservices that can take advantage of these efficiency gains, it is likely that CodeBuild on Lambda can save you both time and cost in your CI/CD pipelines.

Cleanup

If you followed along the walkthrough, you will want to remove the resources you created. First delete the two projects created in CodeBuild. This can be done by navigating to CodeBuild in the console, selecting each project and then hitting the “Delete build project” button. Next navigate to CodeCommit and delete the repository where you stored the code.

Conclusion

In conclusion, AWS CodeBuild using Lambda compute-mode provides significant benefits in terms of consistency, performance and cost. By building and testing your applications on the same runtime images executed by the AWS Lambda service, you can take advantage of benefits provided by the AWS Lambda service while reducing CI time and costs. We are excited to see how this new feature will help you build and deploy your applications faster and more efficiently. Get started today and take advantage of the benefits of running AWS CodeBuild projects on the AWS Lambda compute mode.

About the Author:
Ryan Bachman profile image

Ryan Bachman

Ryan Bachman is a Sr. Specialist Solutions Architect with Amazon Web Services (AWS) with a focus on DevOps. Ryan is passionate about helping customers adopt process and services that increase their efficiency developing applications for the cloud. He has over 20 years professional experience as a technologist, including roles in development, network architecture, and technical product management.

Managing Dev Environments with Amazon CodeCatalyst

Post Syndicated from Ryan Bachman original https://aws.amazon.com/blogs/devops/managing-dev-environments-with-amazon-codecatalyst/

An Amazon CodeCatalyst Dev Environment is a cloud-based development environment that you can use in CodeCatalyst to quickly work on the code stored in the source repositories of your project. The project tools and application libraries included in your Dev Environment are defined by a devfile in the source repository of your project.

Introduction

In the previous CodeCatalyst post, Team Collaboration with Amazon CodeCatalyst, I focused on CodeCatalyst’s collaboration capabilities and how that related to The Unicorn Project’s main protaganist. At the beginning of Chapter 2, Maxine is struggling to configure her development environment. She is two days into her new job and still cannot build the application code. She has identified over 100 dependencies she is missing. The documentation is out of date and nobody seems to know where the dependencies are stored. I can sympathize with Maxine. In this post, I will focus on managing development environments to show how CodeCatalyst removes the burden of managing workload specific configurations and produces reliable on-demand development environments.

Prerequisites

If you would like to follow along with this walkthrough, you will need to:

Have an AWS Builder ID for signing in to CodeCatalyst.

Belong to a space and have the space administrator role assigned to you in that space. For more information, see Creating a space in CodeCatalystManaging members of your space, and Space administrator role.

Have an AWS account associated with your space and have the IAM role in that account. For more information about the role and role policy, see Creating a CodeCatalyst service role.

Walkthrough

As with the previous posts in our CodeCatalyst series, I am going to use the Modern Three-tier Web Application blueprint.  Blueprints provide sample code and CI/CD workflows to help make getting started easier across different combinations of programming languages and architectures. To follow along, you can re-use a project you created previously, or you can refer to a previous post that walks through creating a project using the blueprint.

One of the most difficult aspects of my time spent as a developer was finding ways to quickly contribute to a new project. Whenever I found myself working on a new project, getting to the point where I could meaningfully contribute to a project’s code base was always more difficult than writing the actual code. A major contributor to this inefficiency, was the lack of process managing my local development environment. I will be exploring how CodeCatalyst can help solve this challenge.  For this walkthrough, I want to add a new test that will allow local testing of Amazon DynamoDB. To achieve this, I will use a CodeCatalyst dev environment.

CodeCatalyst Dev Environments are managed cloud-based development environments that you can use to access and modify code stored in a source repository. You can launch a project specific dev environment that will automate check-out of your project’s repo or you can launch an empty environment to use for accessing third-party source providers.  You can learn more about CodeCatalyst Dev Environments in the CodeCatalyst User Guide.

CodeCatalyst user interface showing Create Dev Environment

Figure 1. Creating a new Dev Environment

To begin, I navigate to the Dev Environments page under the Code section of the navigaiton menu.  I then use the Create Dev Environment to launch my environment.  For this post, I am using the AWS Cloud9 IDE, but you can follow along with the IDE you are most comfortable using.  In the next screen, I select Work in New Branch and assign local_testing for the new branch name, and I am branching from main.  I leave the remaining default options and Create.

Create Dev Environment user interface with work in a new branch selected

Figure 2. Dev Environment Create Options

After waiting less than a minute, my IDE is ready in a new tab and I am ready to begin work.  The first thing I see in my dev environment is an information window asking me if I want to navigate to the Dev Environment Settings.  Because I need to enable local testing of Dynamodb, not only for myself, but other developers that will collaborate on this project, I need to update the project’s devfile.  I select to navigate to the settings tab because I know that contains information on the project’s devfile and allows me to access the file to edit.

AWS Toolkit prompting to Open Dev Environment Settings.

Figure 3. Toolkit Welcome Banner

Devfiles allow you to model a Dev Environment’s configuration and dependencies so that you can re-produce consisent Dev Environments and reduce the manual effort in setting up future environments.  The tools and application libraries included in your Dev Environment are defined by the devfile in the source repository of your project.  Since this project was created from a blueprint, there is one provided.  For blank projects, a default CodeCatalyst devfile is created when you first launch an environment.  To learn more about the devfile, see https://devfile.io.

In the settings tab, I find a link to the devfile that is configured.  When I click the edit button, a new file tab launches and I can now make changes.  I first add an env section to the container that hosts our dev environment.  By adding an environment variable and value, anytime a new dev environment is created from this project’s repository, that value will be included.  Next, I add a second container to the dev environment that will run DynamoDB locally.  I can do this by adding a new container component.  I use Amazon’s verified DynamoDB docker image for my environment. Attaching additional images allow you to extend the dev environment and include tools or services that can be made available locally.  My updates are highlighted in the green sections below.

Devfile.yaml with environment variable and DynamoDB container added

Figure 4. Example Devfile

I save my changes and navigate back to the Dev Environment Settings tab. I notice that my changes were automatically detected and I am prompted to restart my development environment for the changes to take effect.  Modifications to the devfile requires a restart. You can restart a dev environment using the toolkit, or from the CodeCatalyst UI.

AWS Toolkit prompt asking to restart the dev environment

Figure 5. Dev Environment Settings

After waiting a few seconds for my dev environment to restart, I am ready to write my test.  I use the IDE’s file explorer, expand the repo’s ./tests/unit folder, and create a new file named test_dynamodb.py.  Using the IS_LOCAL environment variable I configured in the devfile, I can include a conditional in my test that sets the endpoint that Amazon’s python SDK ( Boto3 ) will use to connect to the Dynamodb service.  This way, I can run tests locally before pushing my changes and still have tests complete successfully in my project’s workflow.  My full test file is included below.

Python unit test with local code added

Figure 6. Dynamodb test file

Now that I have completed my changes to the dev environment using the devfile and added a test, I am ready to run my test locally to verify.  I will use pytest to ensure the tests are passing before pushing any changes.  From the repo’s root folder, I run the command pip install -r requirements-dev.txt.  Once my dependencies are installed, I then issue the command pytest -k unit.  All tests pass as I expect.

Result of the pytest shown at the command line

Figure 7. Pytest test results

Rather than manually installing my development dependencies in each environment, I could also use the devfile to include commands and automate the execution of those commands during the dev environment lifecycle events.  You can refer to the links for commands and events for more information.

Finally, I am ready to push my changes back to my CodeCatalyst source repository.  I use the git extension of Cloud9 to review my changes.  After reviewing my changes are what I expect, I use the git extension to stage, commit, and push the new test file and the modified devfile so other collaborators can adopt the improvements I made.

Figure 8.  Changes reviewed in CodeCatalyst Cloud9 git extension.

Figure 8.  Changes reviewed in CodeCatalyst Cloud9 git extension.

Cleanup

If you have been following along with this workflow, you  should delete the resources you deployed so you do not continue to incur  charges. First, delete the two stacks that CDK deployed using the AWS CloudFormation console in the AWS account you associated when you launched the blueprint. These stacks will have names like mysfitsXXXXXWebStack and mysfitsXXXXXAppStack. Second, delete the project from CodeCatalyst by navigating to Project settings and choosing Delete project.

Conclusion

In this post, you learned how CodeCatalyst provides configurable on-demand dev environments.  You also learned how devfiles help you define a consistent experience for developing within a CodeCatalyst project.  Please follow our DevOps blog channel as I continue to explore how CodeCatalyst solve Maxine’s and other builders’ challenges.

About the author:

Ryan Bachman

Ryan Bachman is a Sr. Specialist Solutions Architect at AWS, and specializes in working with customers to improve their DevOps practices. Ryan has over 20 years of professional experience as a technologist, and has held roles in many different domains to include development, networking architecture, and technical product management. He is passionate about automation and helping customers increase software development productivity.