Post Syndicated from Franco Abregu original https://aws.amazon.com/blogs/devops/streamlining-multi-account-infrastructure-with-aws-cloudformation-stacksets-and-aws-cdk/
Introduction
Organizations operating at scale on AWS often need to manage resources across multiple accounts and regions. Whether it’s deploying security controls, compliance configurations, or shared services, maintaining consistency can be challenging.
AWS CloudFormation StackSets (StackSets) has been helping organizations deploy resources across multiple accounts and regions since its launch. While the service is powerful on its own, combining it with Infrastructure as Code (IaC) tools and implementing automated deployments can significantly enhance its capabilities.
In this post, we’ll show you how to leverage AWS CloudFormation StackSets at scale using AWS CDK and implement a robust CI/CD pipeline for automated deployments with AWS CodePipeline.
StackSets key concepts
AWS CloudFormation StackSets allows you to create, update, or delete CloudFormation stacks across multiple AWS accounts and regions with a single operation. It’s essentially a way to manage infrastructure at scale across your AWS organization. Using an administrator account, you define and manage a CloudFormation template, and use the template as the basis for provisioning stacks into selected target accounts across specified AWS Regions:
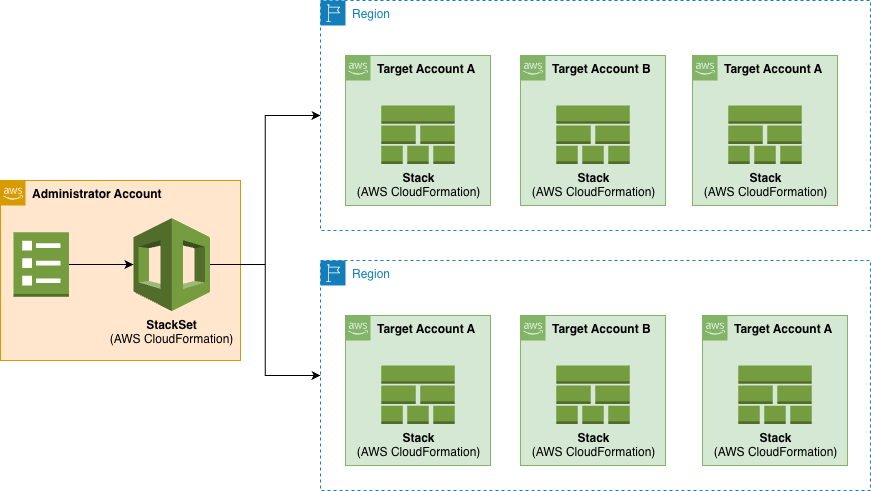
Figure 1. StackSets overview.
The Administrator Account is the AWS account where you create and manage StackSets and the Target Accounts are the AWS accounts where the stack instances are deployed.
The Stack Instances are individual stacks created from the StackSet template deployed to specific account-region combinations.
You can make the following operations using StackSets: Create, update, and delete actions performed on stack instances. These operations can be applied in concurrent or sequential way.
Sequential Deployment:
- Account-by-account deployment
- Region-by-region within accounts
- Configurable failure thresholds
Parallel Deployment:
- Concurrent account deployments
- Maximum concurrent account setting
- Region priority configuration
Hybrid Deployment:
- Combine sequential and parallel
- Account group-based deployment
- Regional deployment strategies
The power of StackSets
The use of StackSets allows us to extend AWS CloudFormation’s capabilities in several important ways:
Governance
It provides you with Centralized Management as a single point of control while including consistent deployment patterns and automated stack instance management across AWS accounts and regions.
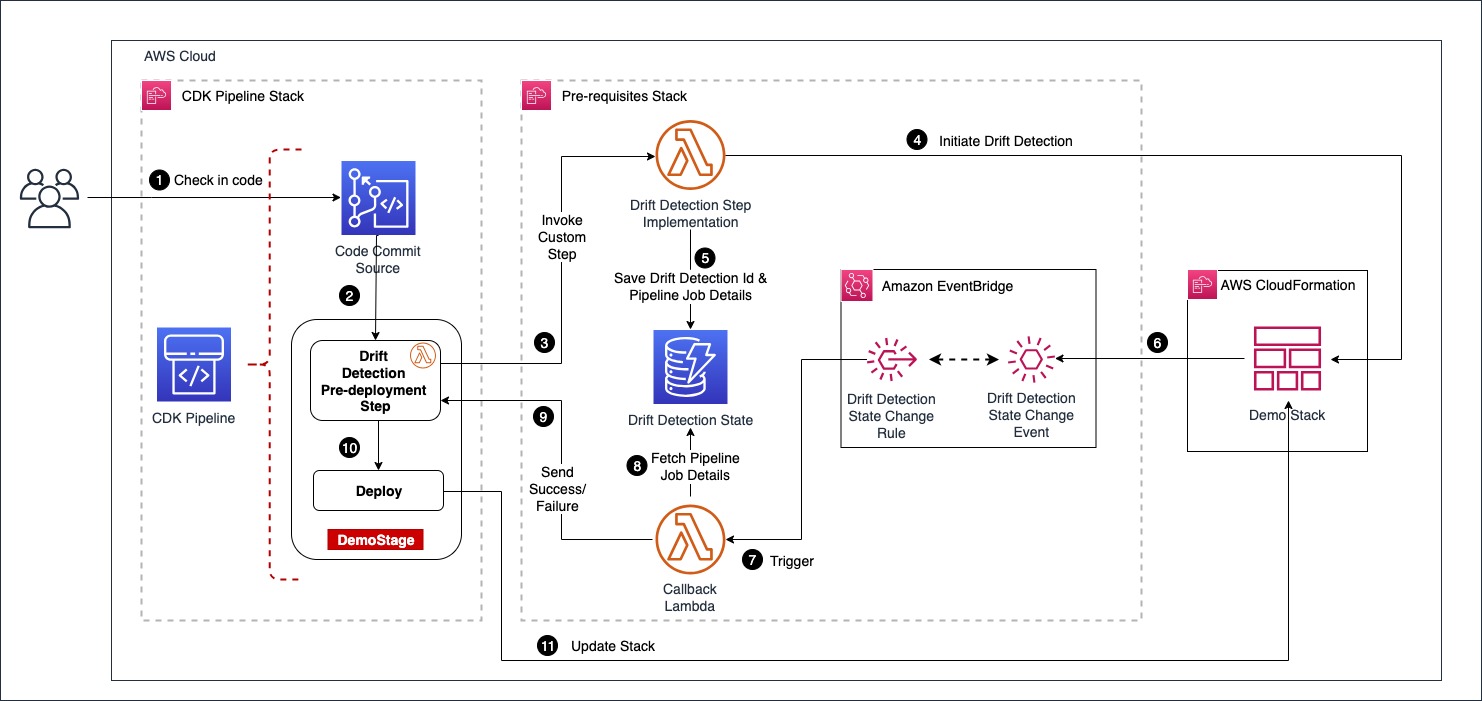
With Drift Detection feature, you can identify if any of the stack instances of your StackSet have configuration differences according to its expected configuration. You detect changes made outside CloudFormation and changes made to an instance stack through CloudFormation directly without using the StackSet.
Flexible Deployment
You also have flexible deployment options with controlled rollout. For example, with Concurrent Deployments you can deploy to multiple accounts within each region simultaneously while controlling deployment order. It also includes failure tolerance with automated retry failed operations.
Operational Efficiency
It reduces manual effort in managing multi-account and multi-region environments while minimizes human error in deployments.
Cost Management
It delivers comprehensive resource organization and streamlined tracking of resources across accounts and regions containing instance stacks. Using centralized management, simplifies the resource tracking and organization enabling you you to have:
- unified visibility: view all related stacks from a single StackSet console (with their deployment status)
- consistent tagging: apply standardized tags across all stack instances for cost allocation and resource grouping
- drift detection: run drift detection across all stack instances simultaneously
- operations tracking: track all operations (create, update and delete) across account/regions from one place
Built-in Safety
You can establish maximum concurrent operation limits, failure tolerance thresholds and automatic retry mechanisms. You also have recovery capabilities through update operations. All these features make a built-in safety mechanisms that prevent widespread failures.
Let’s say you have 100 target accounts, with the maximum concurrent limits, you can for example deploy a change to only 10 accounts. Also, with a failure threshold you can set how many failures do you allow before automatically stopping the process (e.g., stop if more than 5 accounts fail). This way you can gradually deploy and test your templates with a little group, establishing failure thresholds, instead of affecting the stacks preventing mass failures.
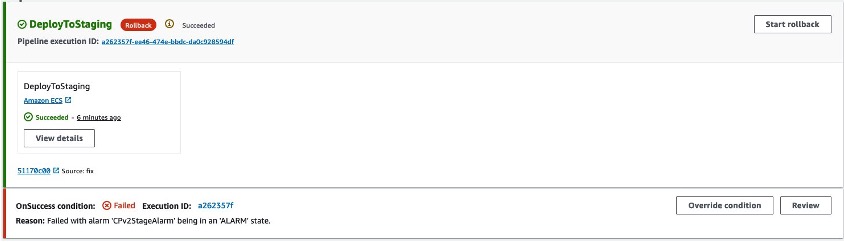
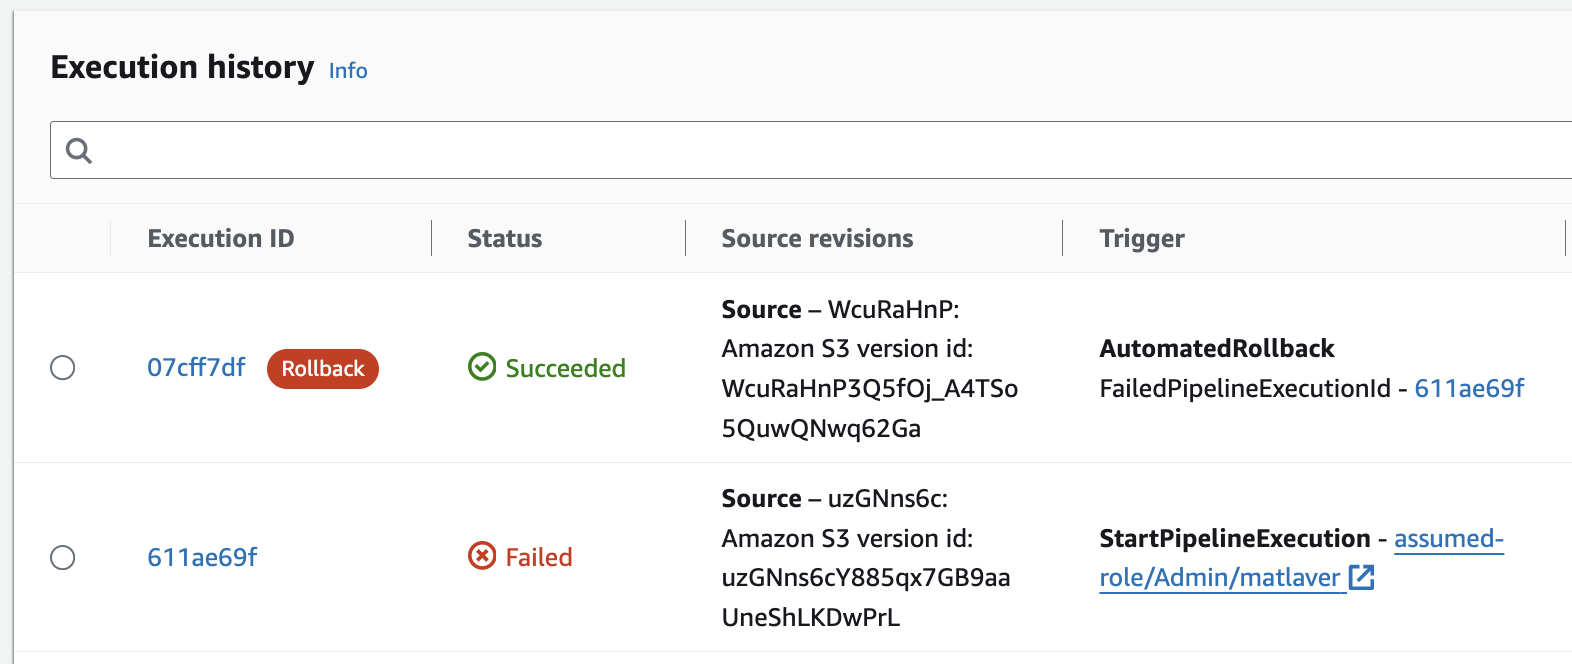
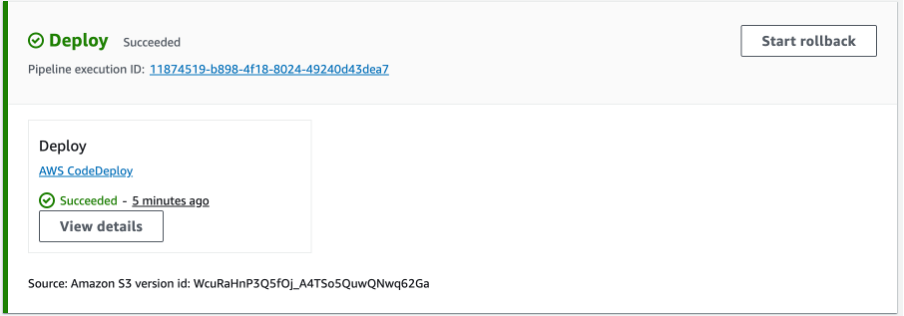
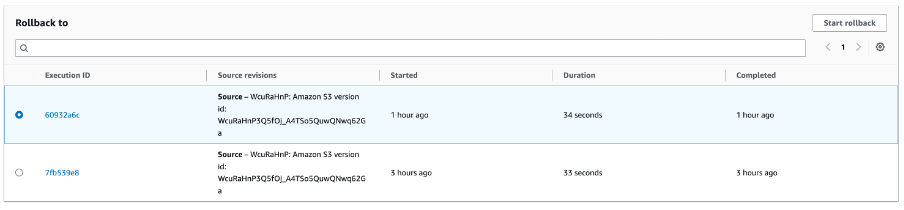
When an operation fails, AWS CloudFormation performs a rollback in the stack instances deploying the previous working template. You will still need to correct the template and apply it again in all the stack instances. With StackSets, you can fix the issues in the template and run again an update across all the stacks including the concurrent limit and failure threshold mentioned before to safety test the fix.
Security and Compliance management
This security-focused approach with StackSets helps organizations maintain a strong security posture across their AWS environment while reducing the operational overhead of managing security at scale.
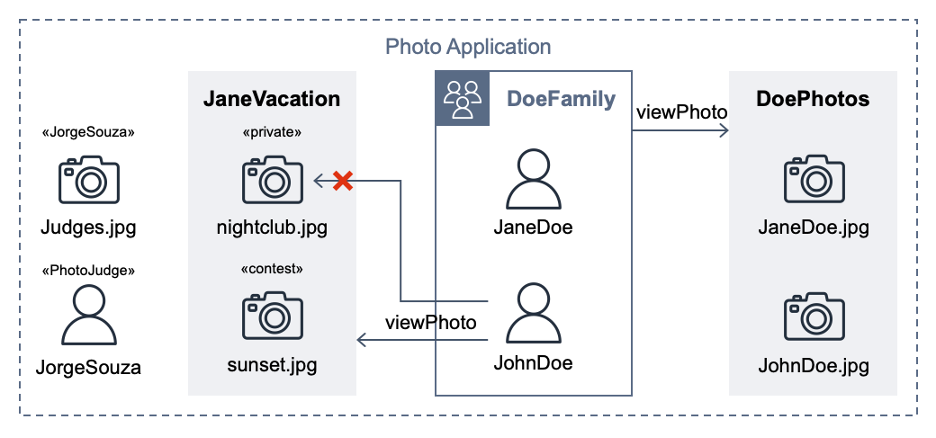
You can use StackSets to deploy standardized security policies across accounts, enforce security baselines automatically and implement security guardrails organization-wide. For example, you can deploy detective control resource and its configuration in all your accounts like Amazon GuardDuty or Amazon Macie. You can also deploy preventive controls like SCPs, AWS Firewall Manager or AWS Shield Advanced. For example you can deploy through StackSets the following CloudFormation template en each target account to block certain actions in a region:
Other capabilities include compliance-related resources consistently, maintain audit trails of security configurations and ensure regulatory requirements are met across all accounts. For example, you can enable CouldTrail and deploy AWS Config rules across all the instance stacks managed by the StackSet.
For both Security and Compliance incidents you can use StackSets to deploy automated response workflows, configure event notifications and implement remediation actions across your accounts and regions.
Import existing stacks into StackSets
A stack import operation can import existing stacks into new or existing StackSets, so that you can migrate existing stacks to a StackSet in one operation.
Solution Overview
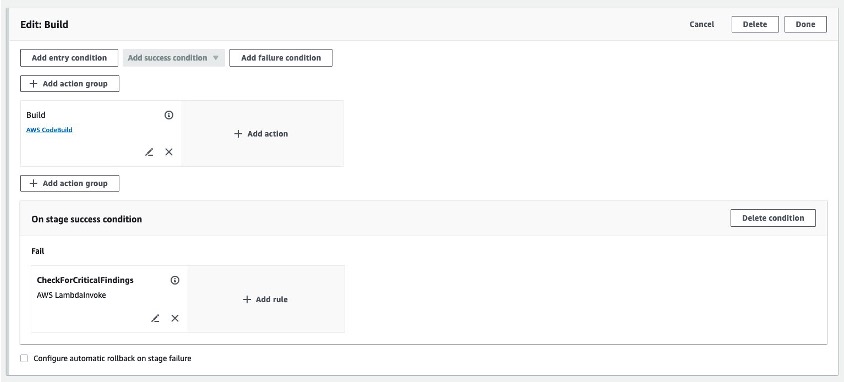
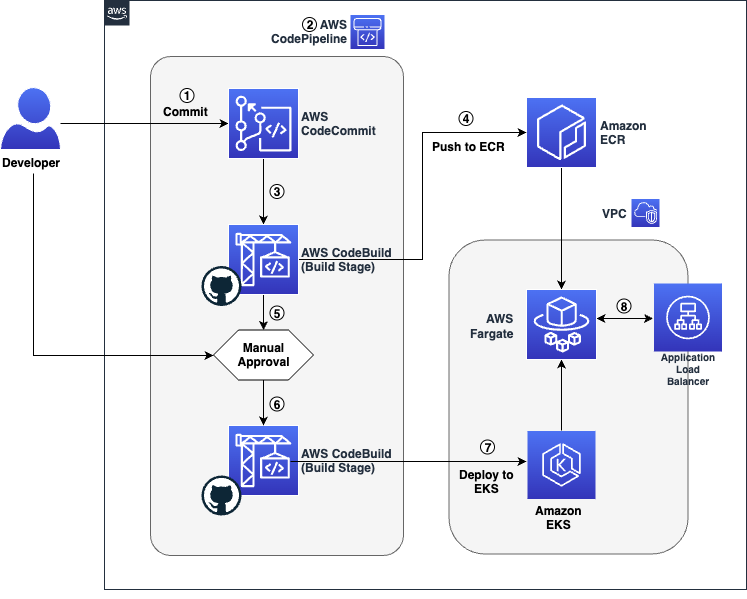
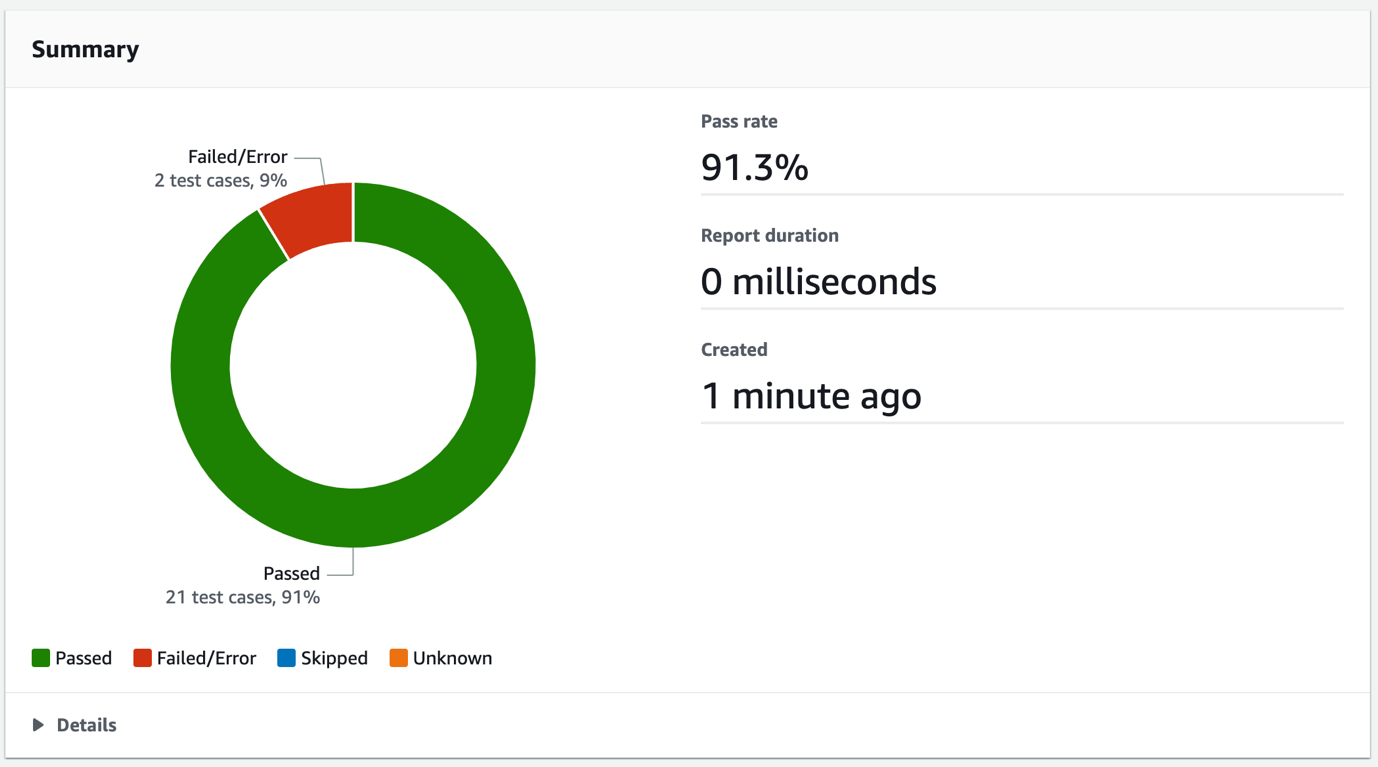
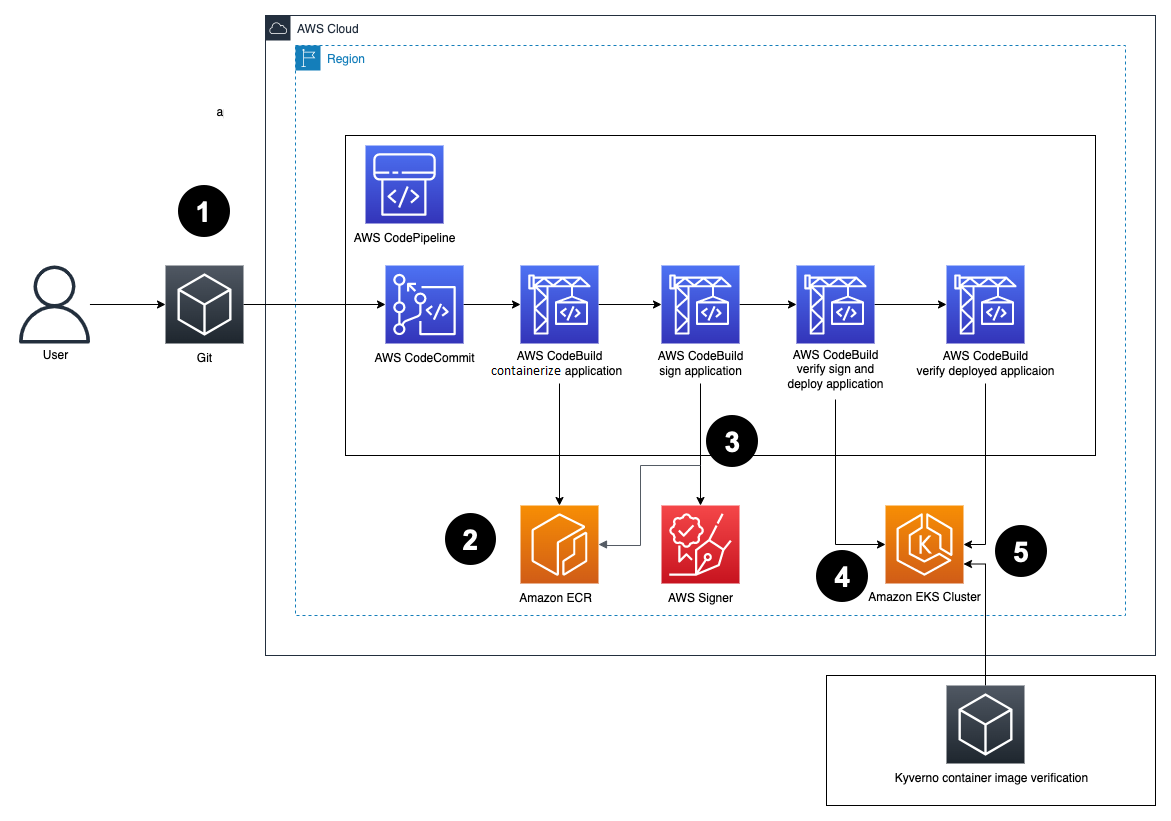
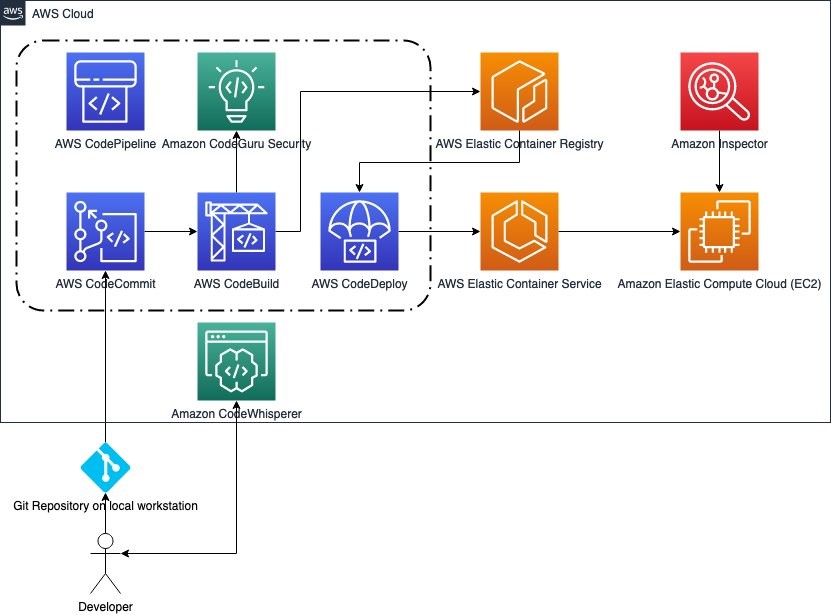
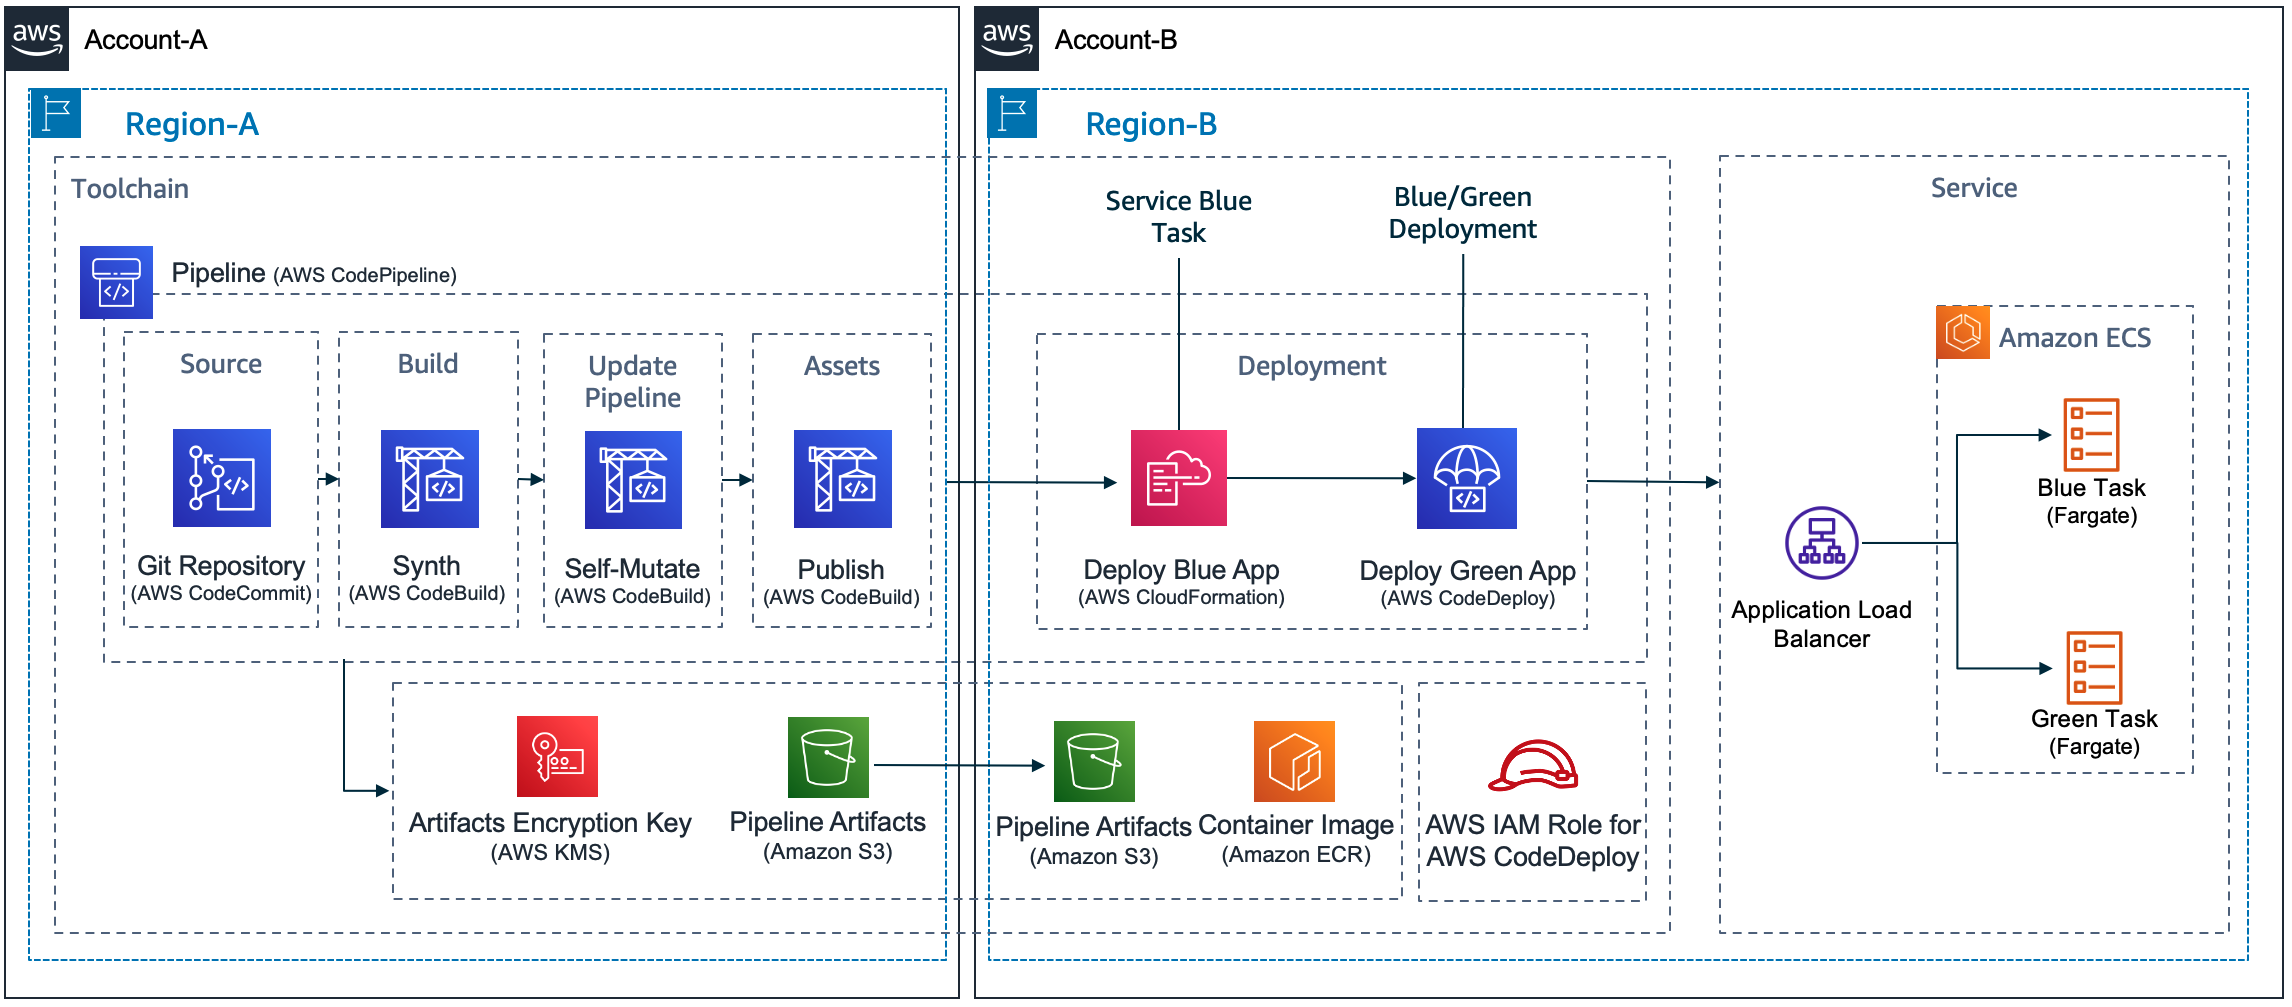
This solution includes an AWS CodePipeline stack that creates a CI/CD pipeline to deploy our StackSet. This pipeline deploys an application stack containing the AWS CloudFormation StackSet with a monitoring dashboard in AWS CloudWatch.
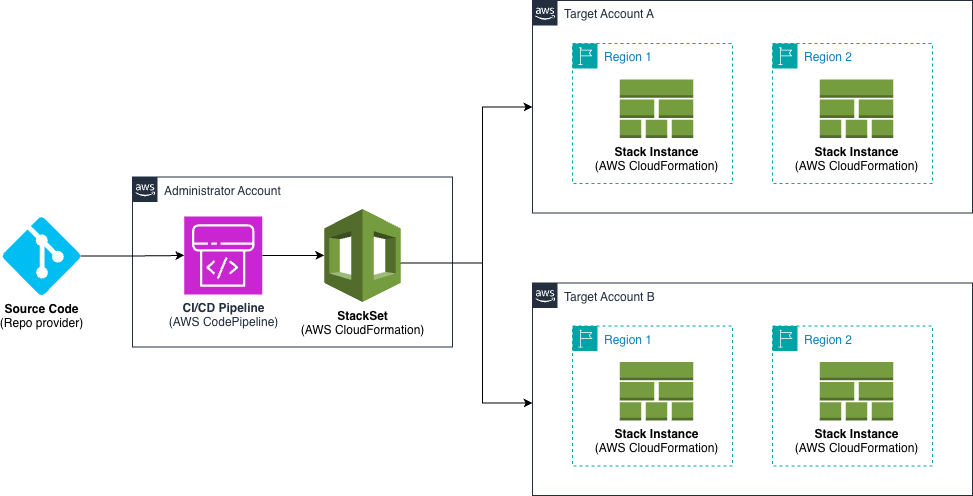
Figure 2. Solution overview
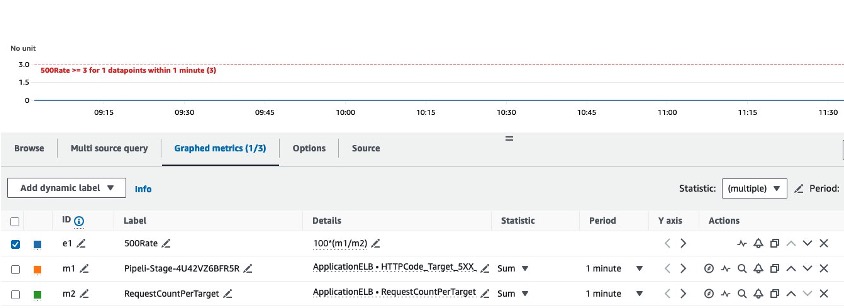
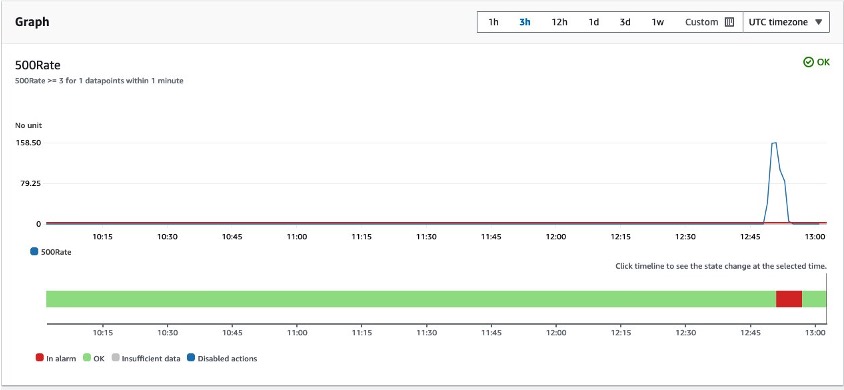
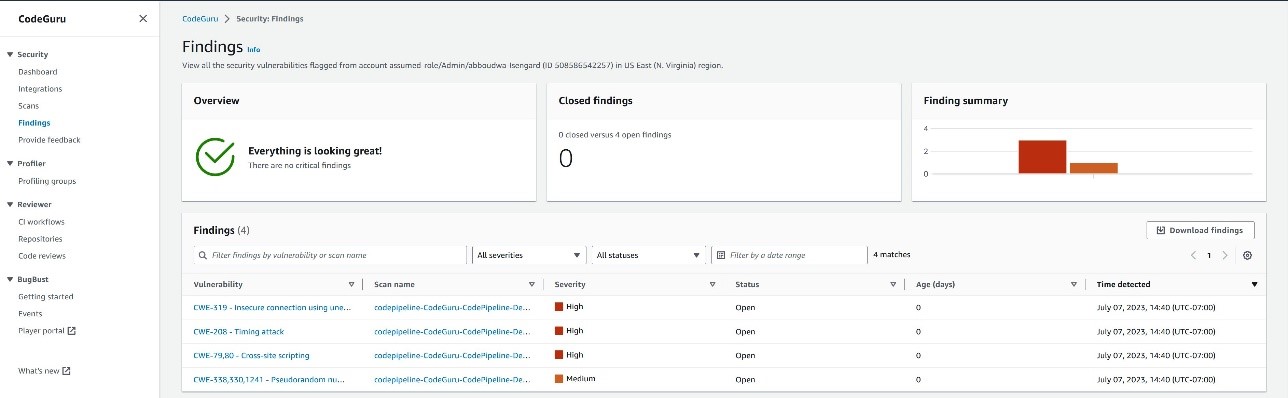
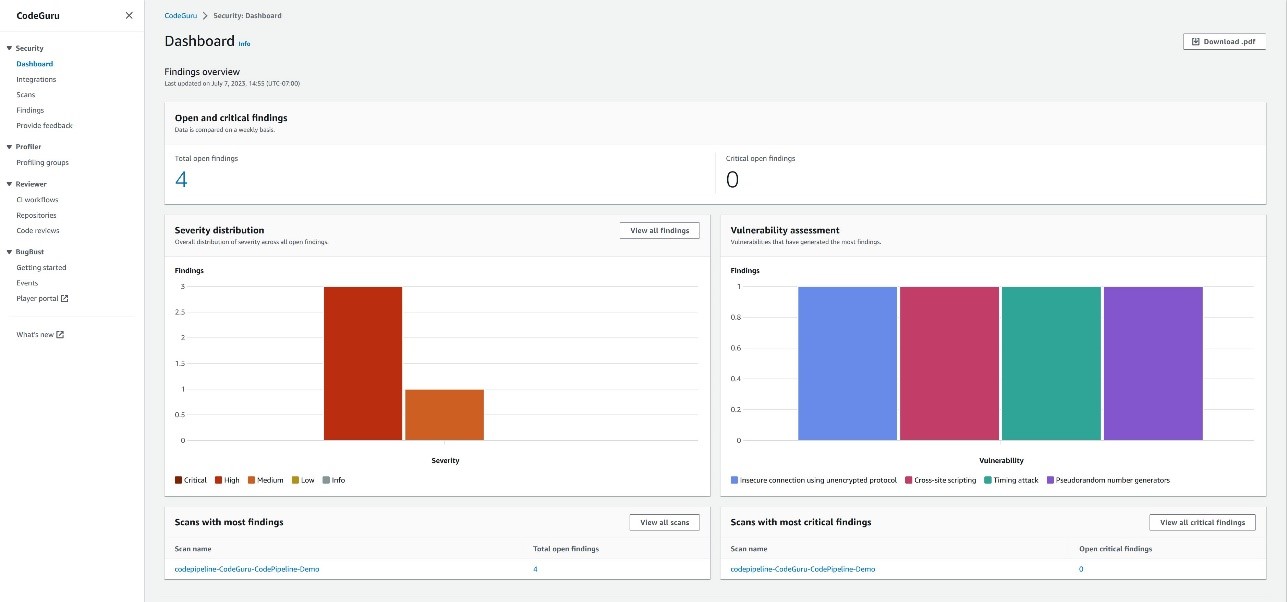
The following Amazon CloudWatch dashboard is an example of what you will in the target accounts after the StackSet is deployed:
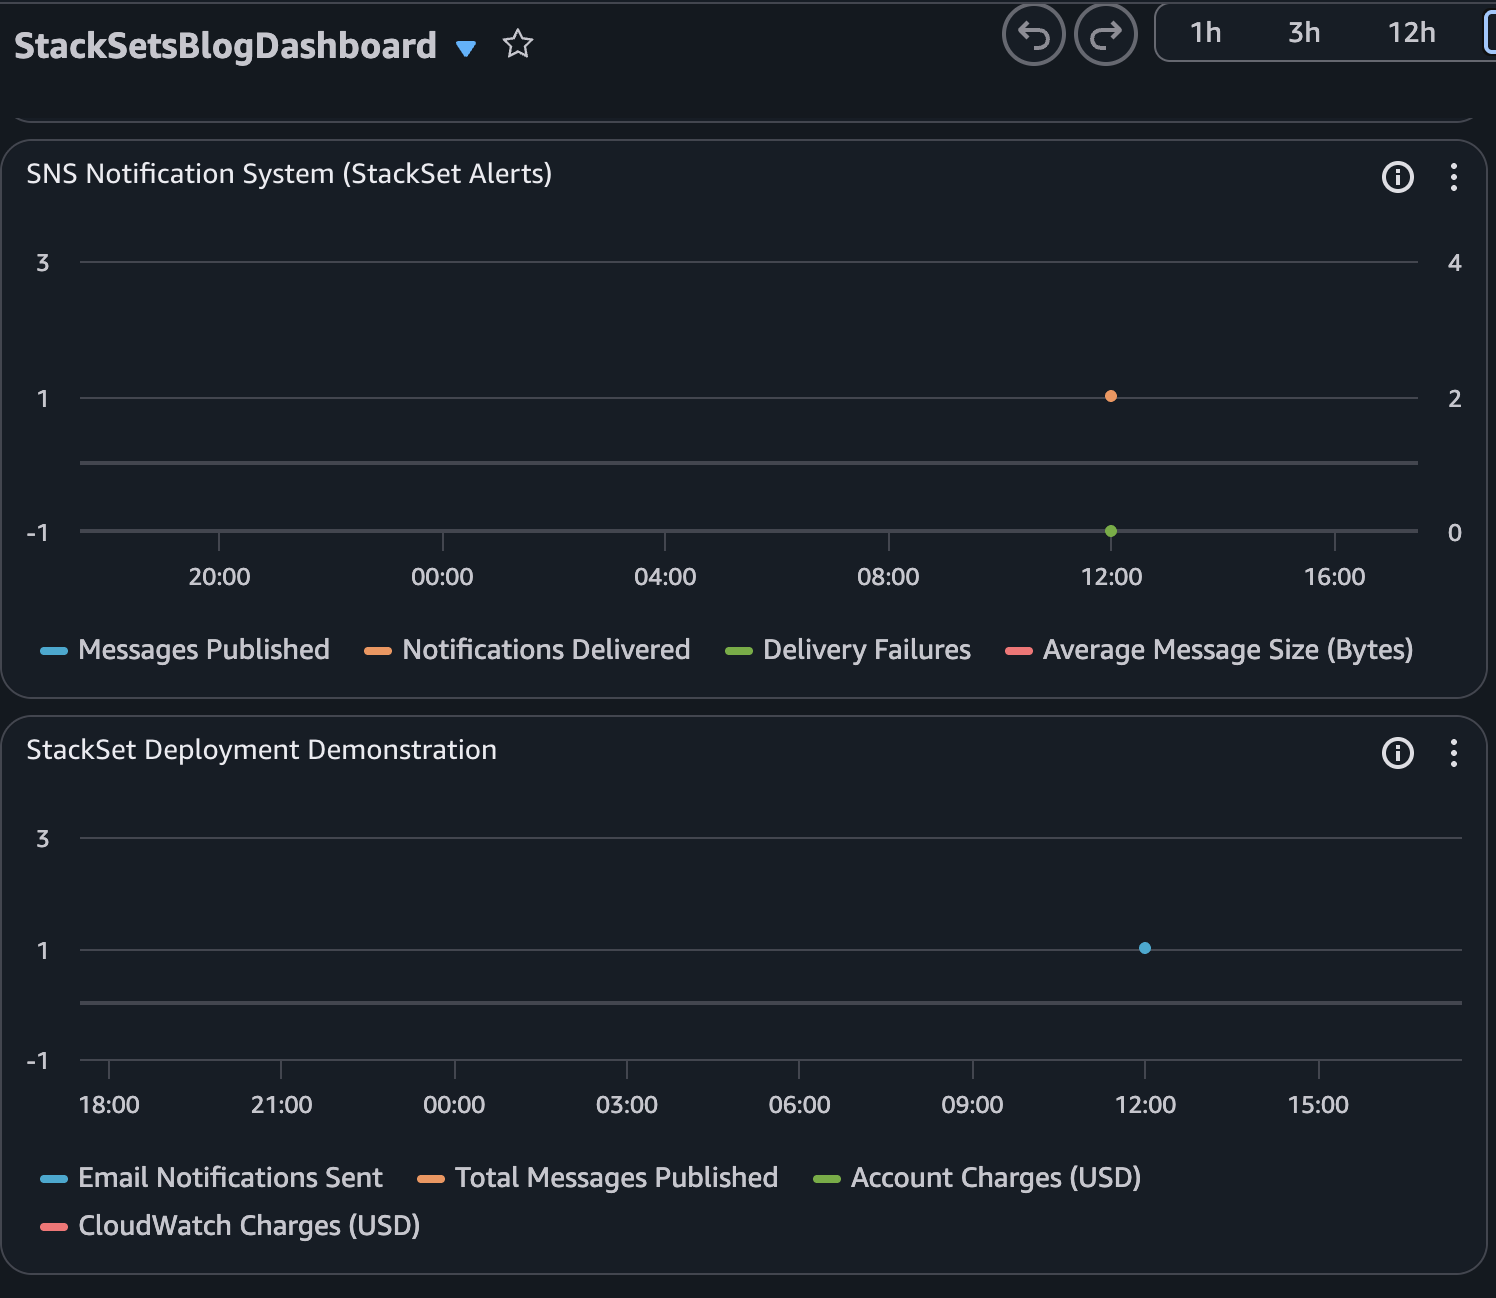
Figure 3. Dashboard example
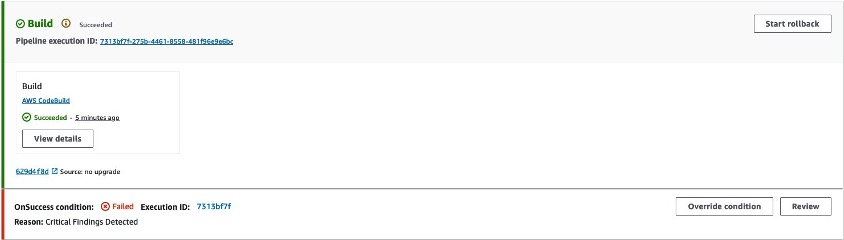
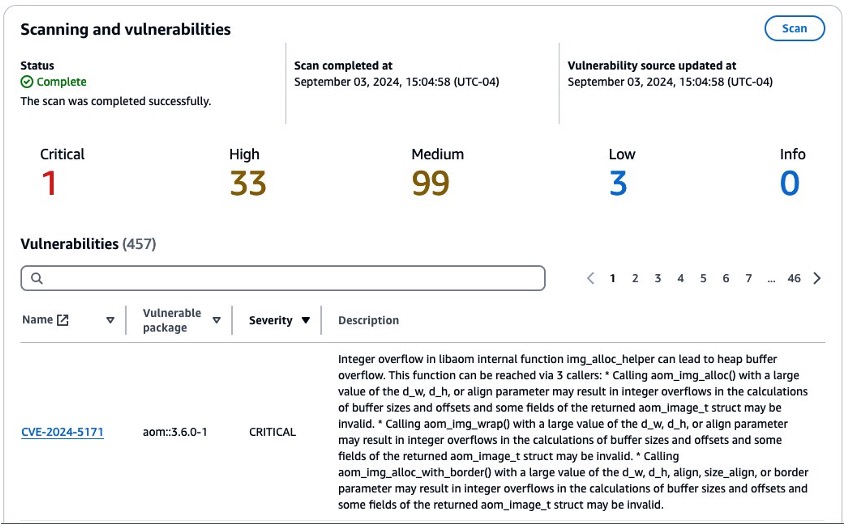
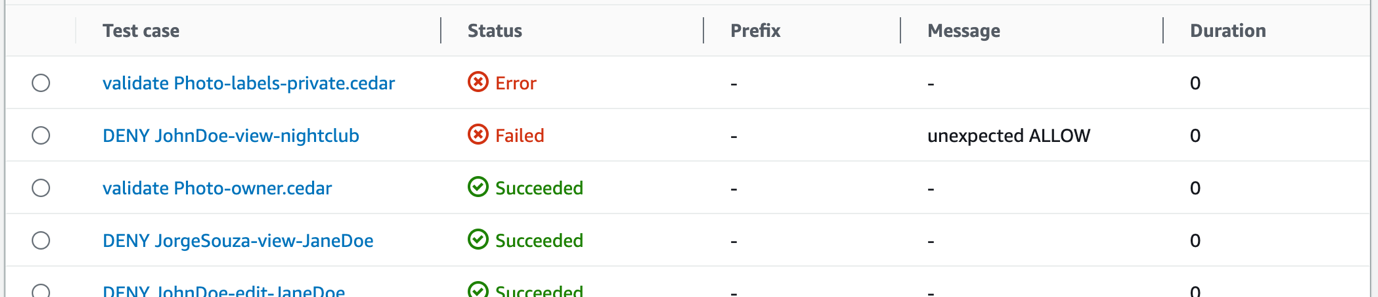
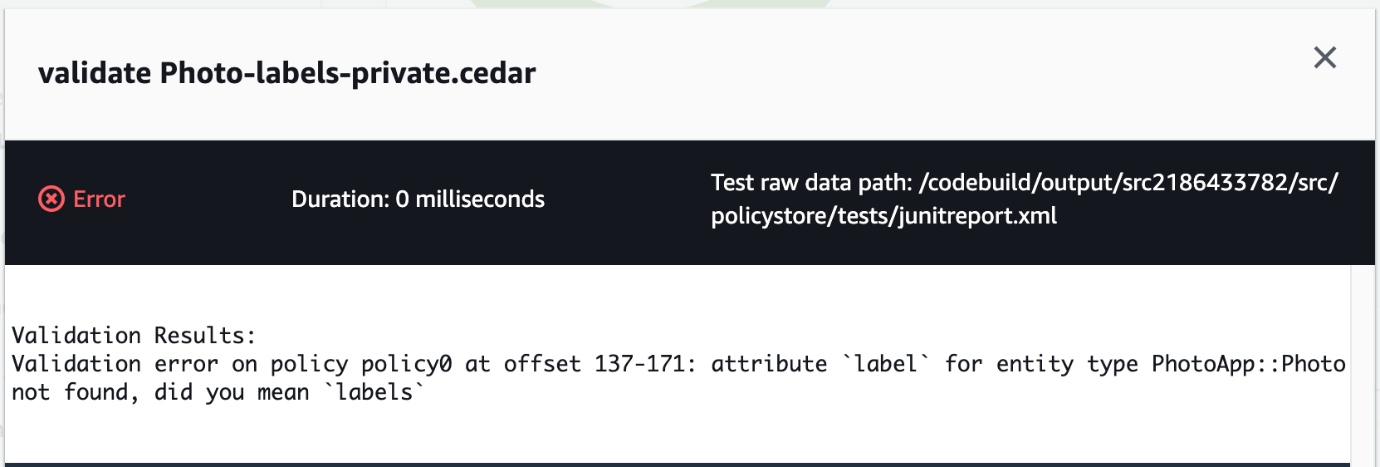
In the CI/CD pipeline, before running the deployment commands, it applies python security and quality code checks to ensure code quality and security and cdk-nag to ensure AWS Well Architected best practices. You can find more details about these checks in the solution repository in README.md file.
The solution includes 2 AWS CloudFormation stacks defined by in the AWS CDK application and a template for the StackSet that will be deployed in the target accounts and regions. This stack contains the monitoring dashboard that will be deployed en the target regions of each target account as a single unit.
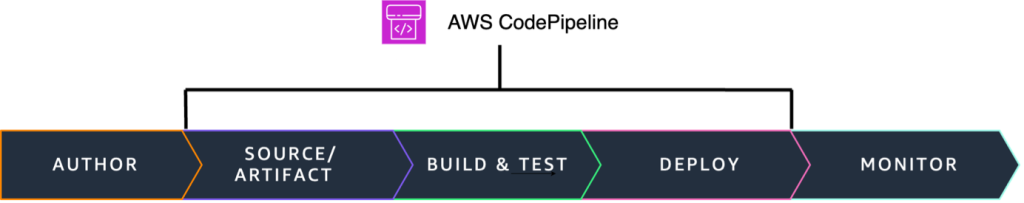
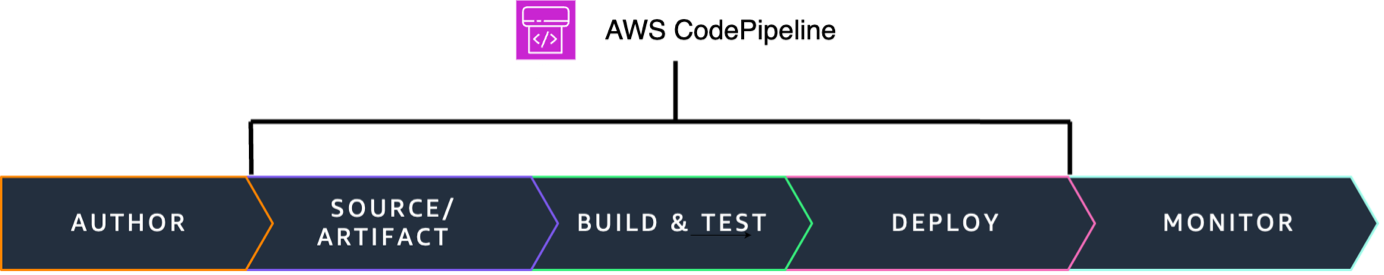
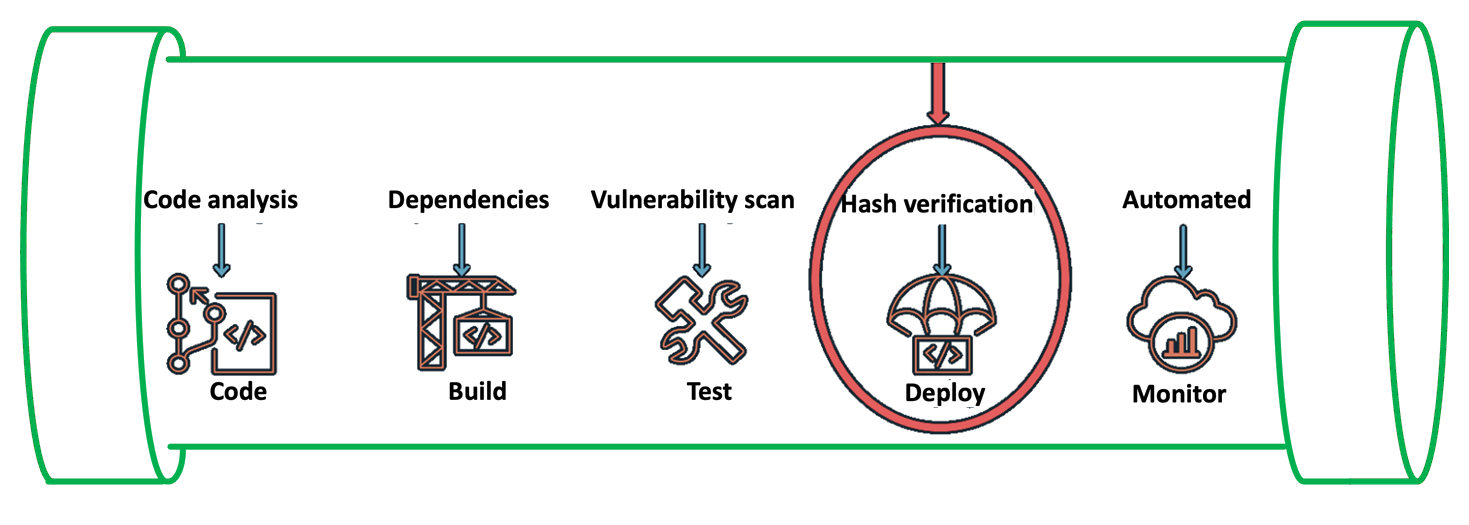
The idea of using AWS CodePipeline with IaC is that development teams can define and share “pipelines-as-code” patterns for deploying their applications making it easy to add stages. This way, security and quality code testing can run any time you change the source code.
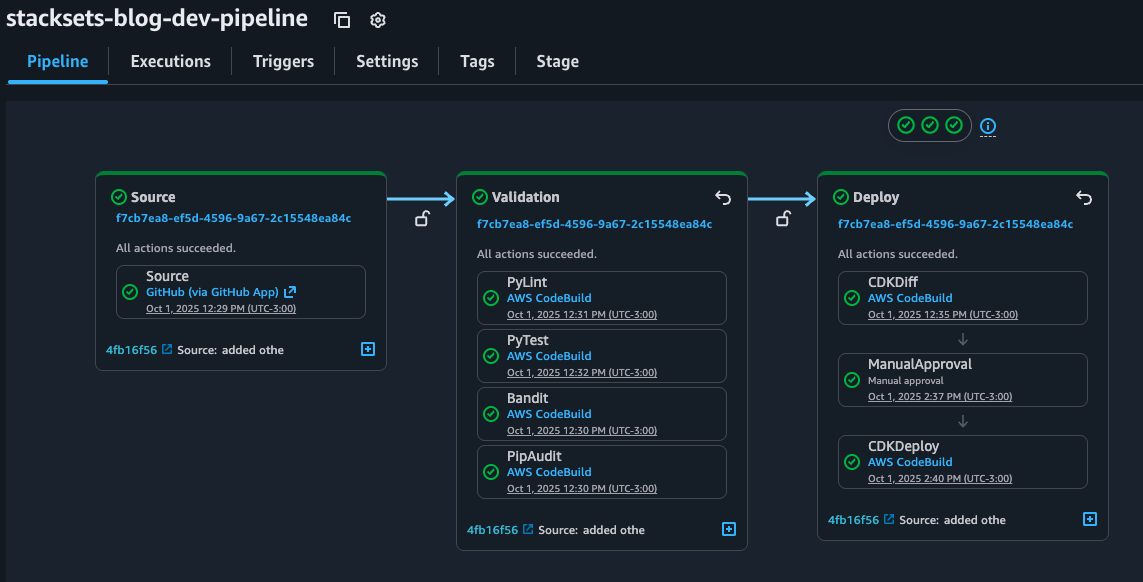
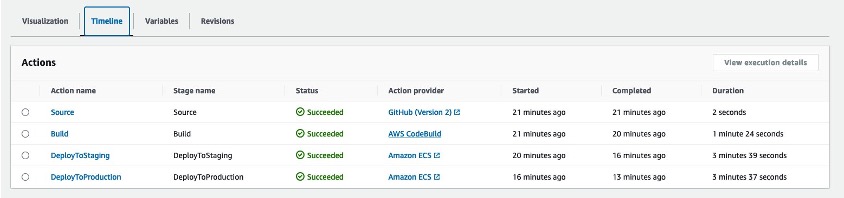
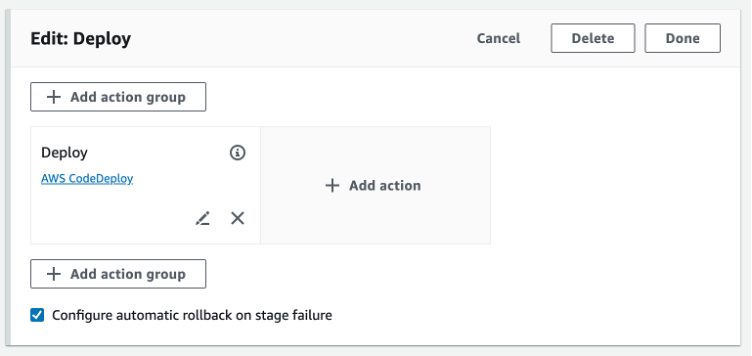
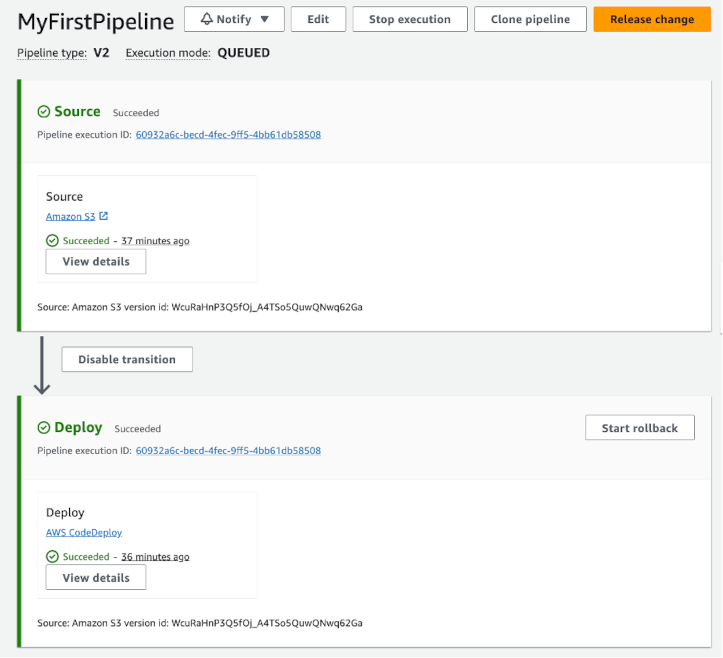
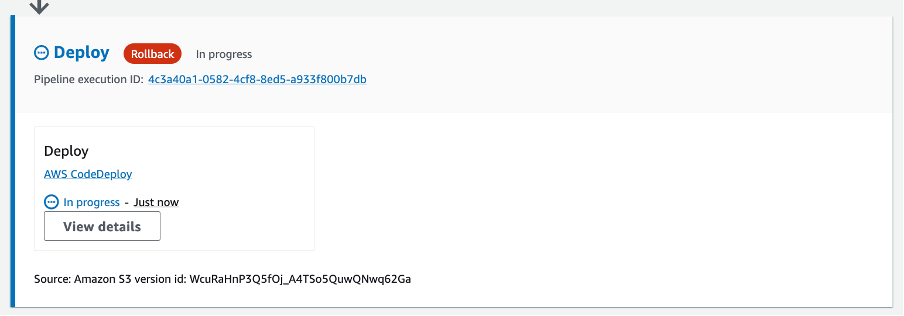
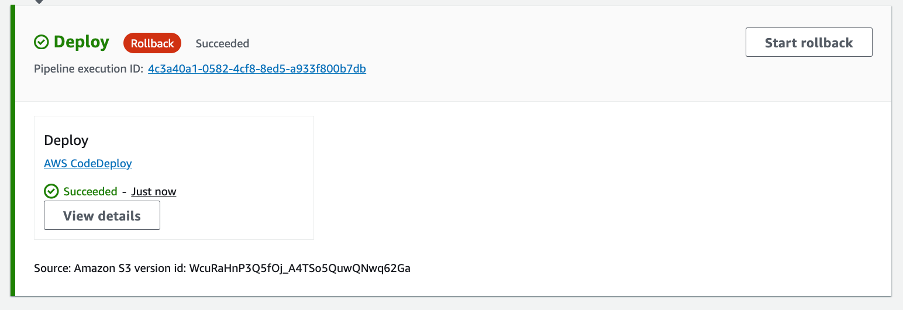
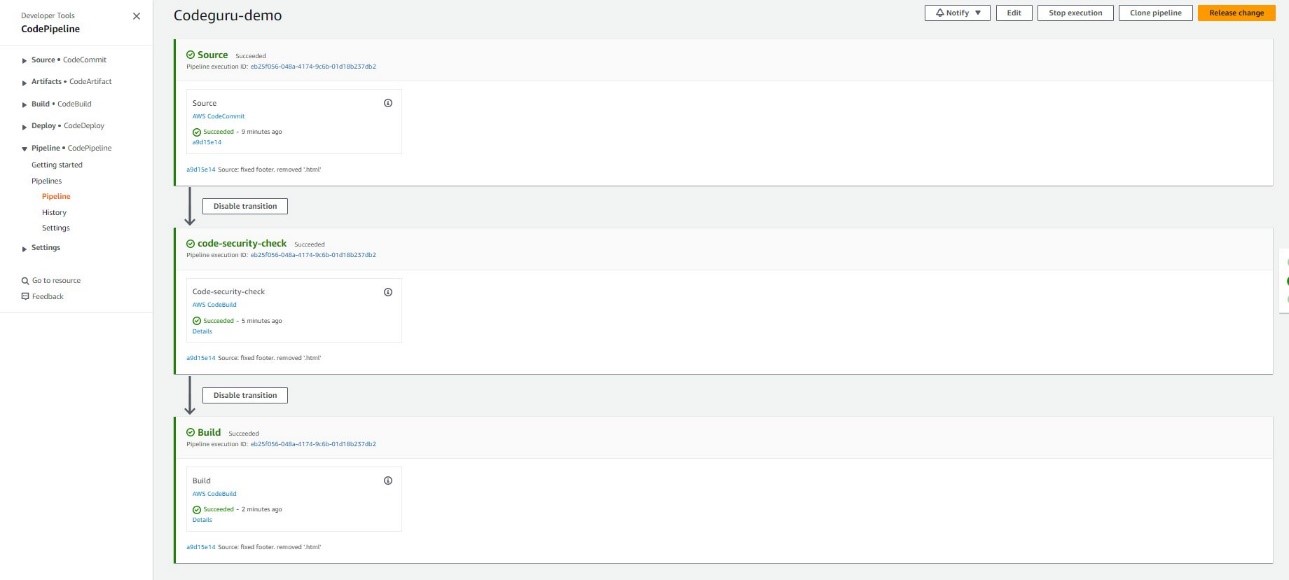
Figure 4. Pipeline overview
The best practice is to ensure shift-left: adding this checks to the earlier stages of the SDLC. You can accomplish this complementing your CI/CD pipeline with githooks or IDE Plugins. For example with Amazon Q Developer IDE extension you can use the review function to analyze the security of your code locally.
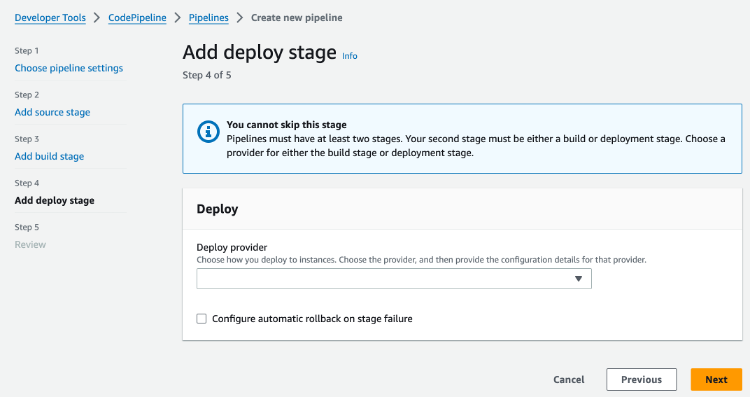
Walkthrough
If you’d like to try this solution out yourself, visit the walkthrough in the corresponding GitHub repo: https://github.com/aws-cloudformation/aws-cloudformation-templates/tree/main/CloudFormation/StackSets-CDK
To use the CI/CD pipeline just create a repository using any of the AWS CodeConnection git supported providers and add the contents of the folder. All details are included in the README.md so you can always get the latest version of the code and how it works.
Conclusion
In this post, we showed how to use AWS CDK to deploy AWS CloudFormation StackSets to reduce operational overhead and ensure consistency, compliance and security across multiple regions and accounts. We also learned how to create a CI/CD pipeline to guarantee a robust DevSecOps cycle for our Infrastructure as Code.
Now that we’ve explored the main concepts together, you can clone the example repository from the walkthrough section, follow the setup instructions, and customize the implementation to enhance AWS resources management across accounts and regions. Whether you’re managing a single account or multiple organizations, these practices can be adapted to your specific needs. Now that you learned the main concepts, go ahead and clone the example repository from walkthrough section, follow the setup instructions and customize the implementation to improve the AWS resources management across your accounts and regions.