Tag Archives: Development

Amazon Q Developer end-of-support announcement

Post Syndicated from Ankit Sharma original https://aws.amazon.com/blogs/devops/amazon-q-developer-end-of-support-announcement/

When we launched Amazon Q Developer, our goal was to bring AI assistance directly into the developer workflow. Customers adopted Q Developer across VS Code, JetBrains, Eclipse, and Visual Studio, using it for code generation, debugging, and chat-based guidance. Q Developer proved that AI belongs in the inner loop of software development.

Over the past year, we’ve learned that the most impactful AI developer experiences go far beyond code generation and completion. Developers need AI that understands their entire project: the architecture, the requirements, the tests, and the intent behind the code. It requires a purpose-built environment. That’s why we built Kiro.

What is Kiro? Kiro is an agentic development environment (IDE, CLI) built from the ground up for spec-driven development. Instead of reacting to individual prompts, Kiro works from structured specifications to plan, implement, and verify changes across your entire codebase. Key capabilities include:

  • Specs — Define what you want to build in structured, natural-language requirements that Kiro uses to drive implementation end to end.
  • Hooks — Automated triggers that run on file save, commit, or other events to enforce standards, run tests, or update documentation without manual intervention.
  • Steering files — Project-level configuration that gives Kiro persistent context about your architecture, conventions, and constraints.
  • Custom subagents — Specialized AI agents you define for domain-specific tasks like security review, API contract validation, or infrastructure provisioning.
  • Powers — Composable capability modules that extend Kiro’s agentic behavior for your specific workflows.

Kiro also includes everything developers rely on in Q Developer today: agentic coding, inline chat, terminal integration, and MCP support.

What’s changing Amazon Q Developer IDE plugins and paid Subscriptions will reach end of support on April 30, 2027, giving customers 12 months to transition to Kiro.

  • New signups will no longer available starting May 15, 2026. New Q Developer Free Tier account creation (via Builder ID in IDE plugins) and new Q Developer subscription creation (via the AWS Console) will be blocked.
  • Model changes: starting May 29, 2026, Opus 4.6 will no longer be available on Q Developer Pro. Opus 4.5 and all other existing models remain available. The latest coding models, including Opus 4.7, are available exclusively on Kiro.
  • Existing customers retain access. If you access Q Developer via a Q Developer Pro subscription or Kiro subscription, you will continue to have access to the Q Developer IDE plugins until April 30, 2027. The May 15, 2026 change affects new signups for Q Developer accounts and subscriptions.
  • IDE plugin listings remain live. Q Developer plugins will remain published on all four IDE marketplaces with a deprecation notice directing users to Kiro. Critical bugfixes will continue to be pushed to existing users through the transition window.

What’s not changing Amazon Q Developer in the AWS Management Console and first-party AWS experiences (AWS Marketing Website, AWS Documentation Website, AWS Console Mobile App, and Amazon Q Developer for Chat Apps – Slack & Microsoft Teams) are not impacted by this sunset and will continue to be available to AWS customers. Customers using Q Developer in these products will retain access to their current subscription benefits and capabilities.

What you should do

  • Explore Kiro today. Download Kiro at kiro.dev and try spec-driven development on your next project.
  • Review the migration guide for your specific IDE.
  • If you have questions about migrating, contact your AWS account team.

We’re excited about the future of AI-powered development and we’re committed to making this transition as smooth as possible for every customer.

Building a scalable code modernization solution with AWS Transform custom

Post Syndicated from Dinesh Prabakaran original https://aws.amazon.com/blogs/devops/building-a-scalable-code-modernization-solution-with-aws-transform-custom/

Introduction

Software maintenance and modernization is a critical challenge for enterprises managing hundreds or thousands of repositories. Whether upgrading Java versions, migrating to new AWS SDKs, or modernizing frameworks, the scale of transformation work can be overwhelming. AWS Transform custom uses agentic AI to perform large-scale modernization of software, code, libraries, and frameworks to reduce technical debt. It handles diverse scenarios including language version upgrades, API and service migrations, framework upgrades and migrations, code refactoring, and organization-specific transformations. Through continual learning, the agent improves from every execution and developer feedback, delivering high-quality, repeatable transformations without requiring specialized automation expertise.

Organizations need to run transformations using AWS Transform custom concurrently across their entire code estate to meet aggressive modernization timelines and compliance deadlines. Running it at enterprise scale requires a solution to process repositories in parallel, in a controlled remote cloud environment, manage credentials securely, and provide visibility into transformation progress. Today, we’re introducing an open-source solution that brings production-grade scalability, reliability, and monitoring to AWS Transform custom. This infrastructure enables you to run transformations on thousands of repositories in parallel using AWS Batch and AWS Fargate, with REST API access for programmatic control and comprehensive Amazon CloudWatch monitoring.

Requirements for Enterprise-Scale Code Modernization

AWS Transform custom provides powerful AI-driven code transformation capabilities through its CLI. To effectively scale transformations across enterprise codebases, organizations need:

Scale: Ability to run transformations on 1000+ repositories concurrently rather than one-by-one
Infrastructure: Dedicated compute resources for long-running transformations beyond developers’ laptops
API Access: REST API for programmatic orchestration and seamless integration with CI/CD pipelines
Monitoring: Centralized visibility into transformation progress and status across multiple repositories
Reliability: Automatic retries, secure credential management, and built-in fault tolerance

The Solution: Batch Infrastructure with REST API

This solution provides complete, production-ready infrastructure that addresses these challenges:

Core Capabilities

  • Scalable Batch Processing Run transformations on thousands of repositories in parallel using AWS Batch with Fargate. The default configuration (256 max vCPUs, 2 vCPUs per job) supports up to 128 concurrent jobs, with automatic queuing and resource management. The compute environment scales based on your needs and Fargate service quotas.
  • REST API for Programmatic Access Seven API endpoints provide complete job lifecycle management, enabling you to submit single jobs or bulk batches of thousands in one request. The API offers real-time status tracking and progress monitoring, with Amazon Identity and access Management (IAM) authentication ensuring secure access to transformation operations.
  • Multi-Language Container The solution includes a container supporting Java (8, 11, 17, 21), Python (3.8-3.13), and Node.js (16-24) with all build tools pre-installed, including Maven, Gradle, npm, and yarn. The AWS Transform CLI and AWS CLI v2 are bundled in. The container is fully extensible for custom requirements—you can add your own libraries, languages, or tools by customizing the Dockerfile to meet their specific needs
  • Enterprise-Grade Reliability Automatic IAM credential management eliminates long-lived keys, with credentials auto-refreshing every 45 minutes for jobs up to 12 hours. The system includes automatic retries for transient failures (default: 3 attempts), with configurable timeout and retry settings to match your transformation complexity.
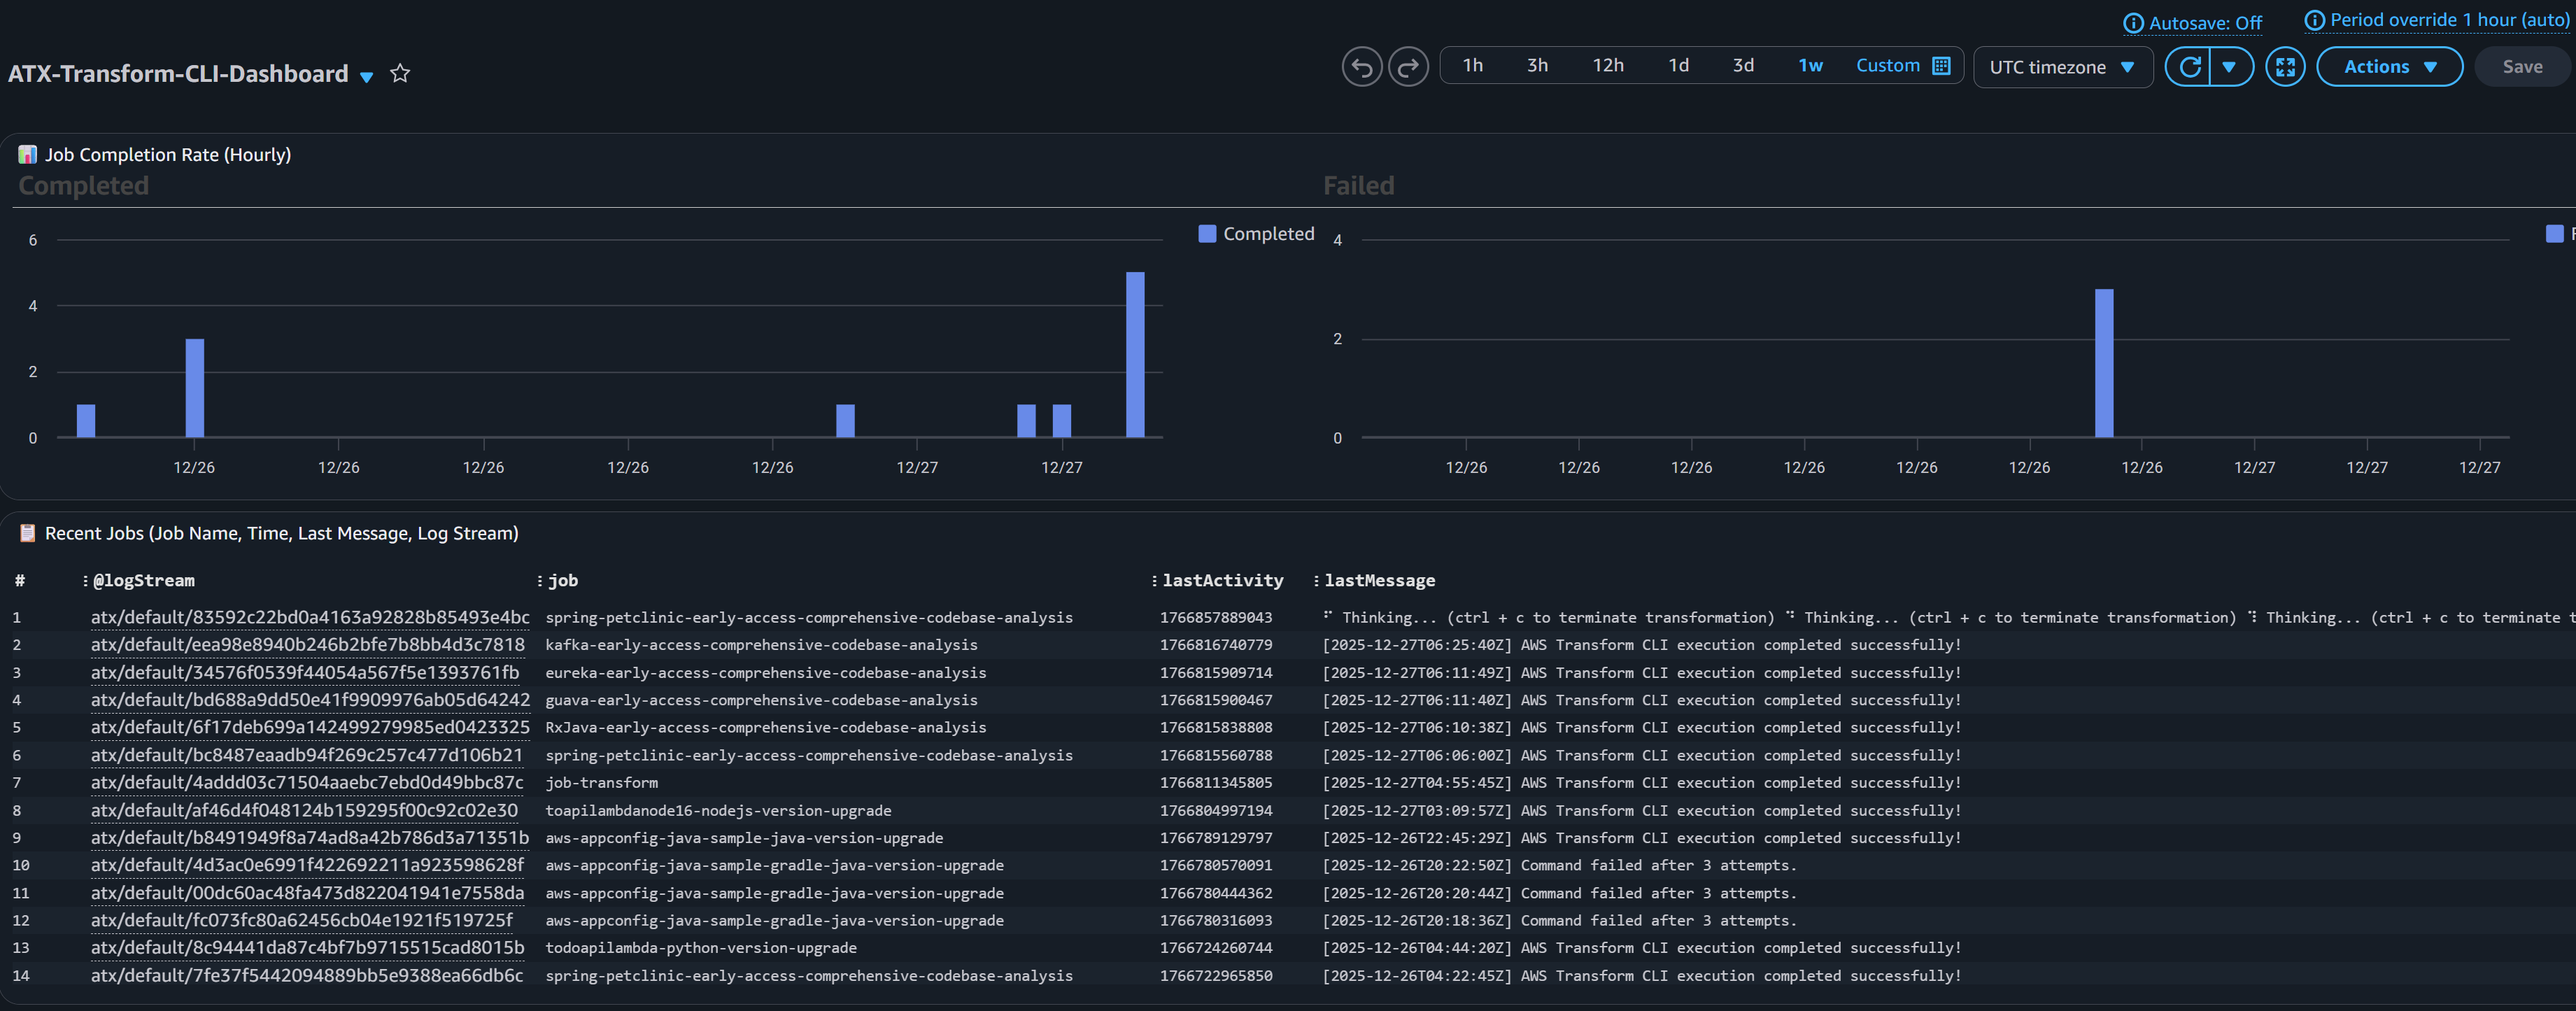
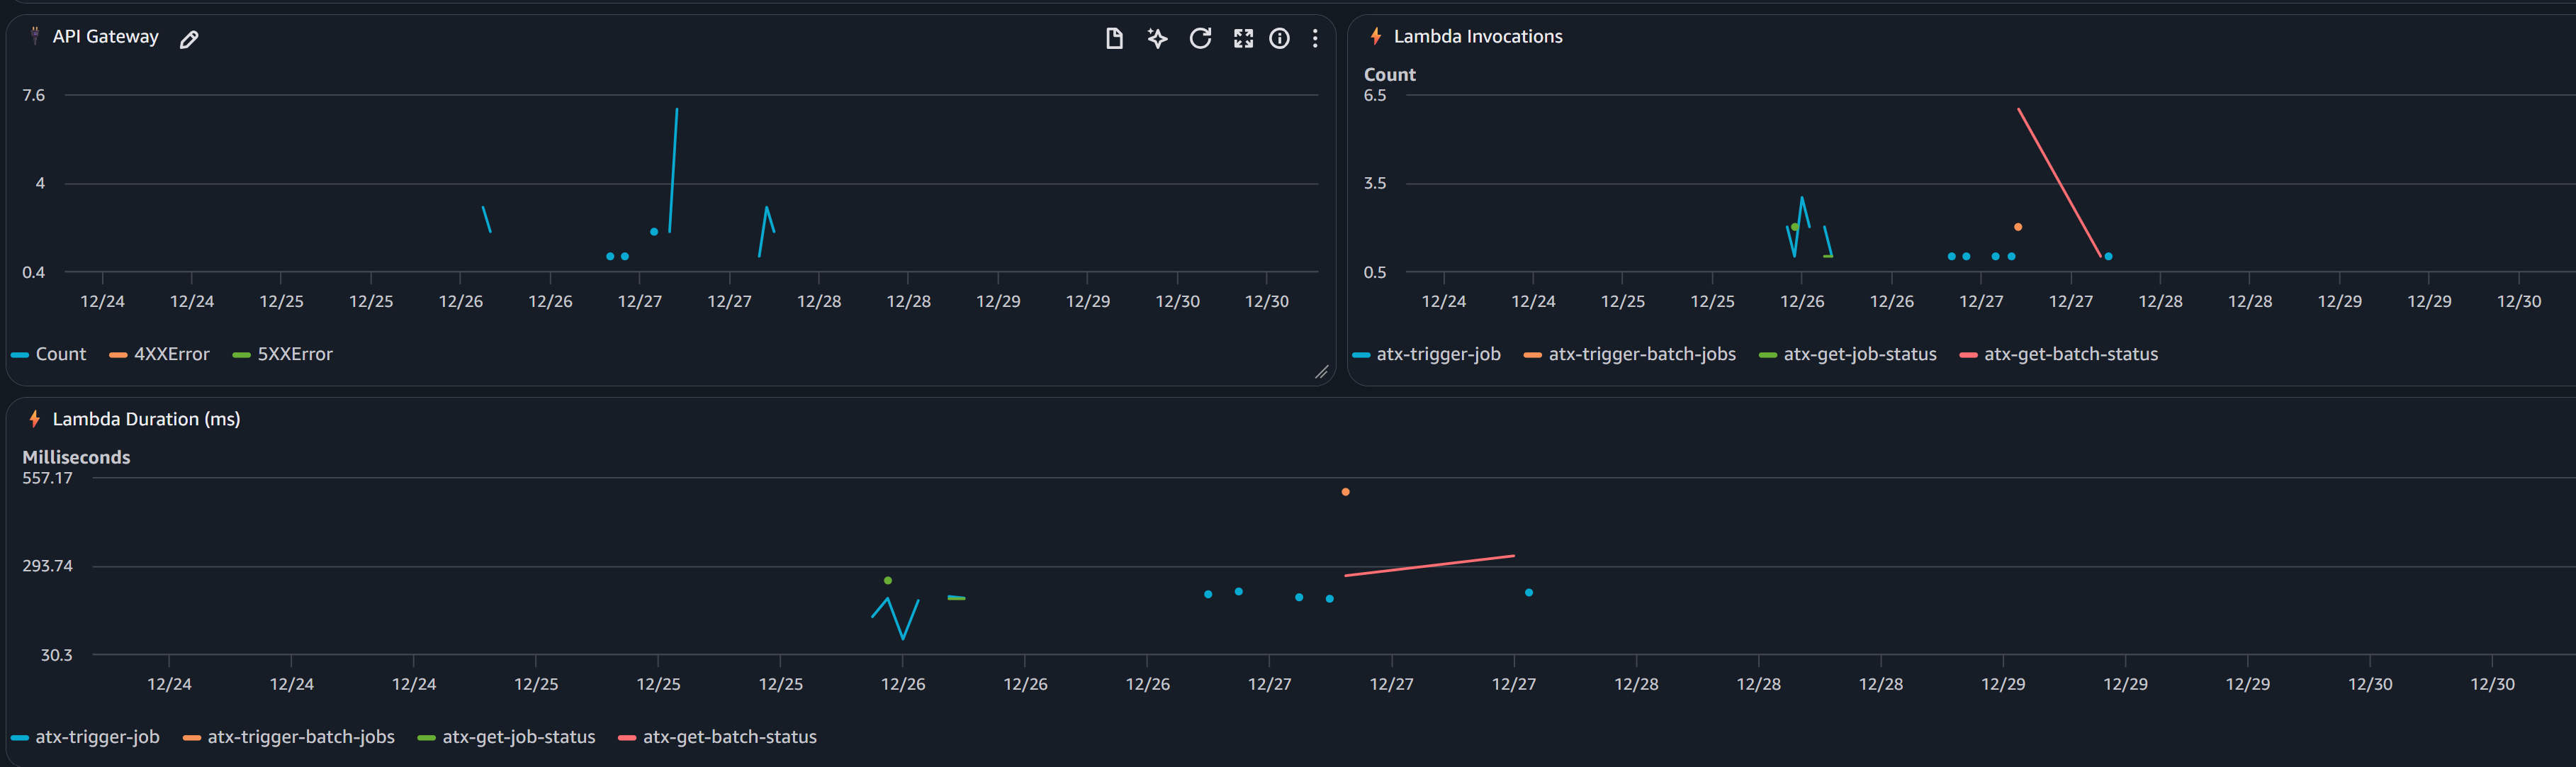
  • Comprehensive Monitoring A CloudWatch dashboard provides job tracking with success and failure rates, trends over time, and API and Lambda health metrics. Real-time log streaming enables you to monitor transformation progress and quickly diagnose issues.

Architecture

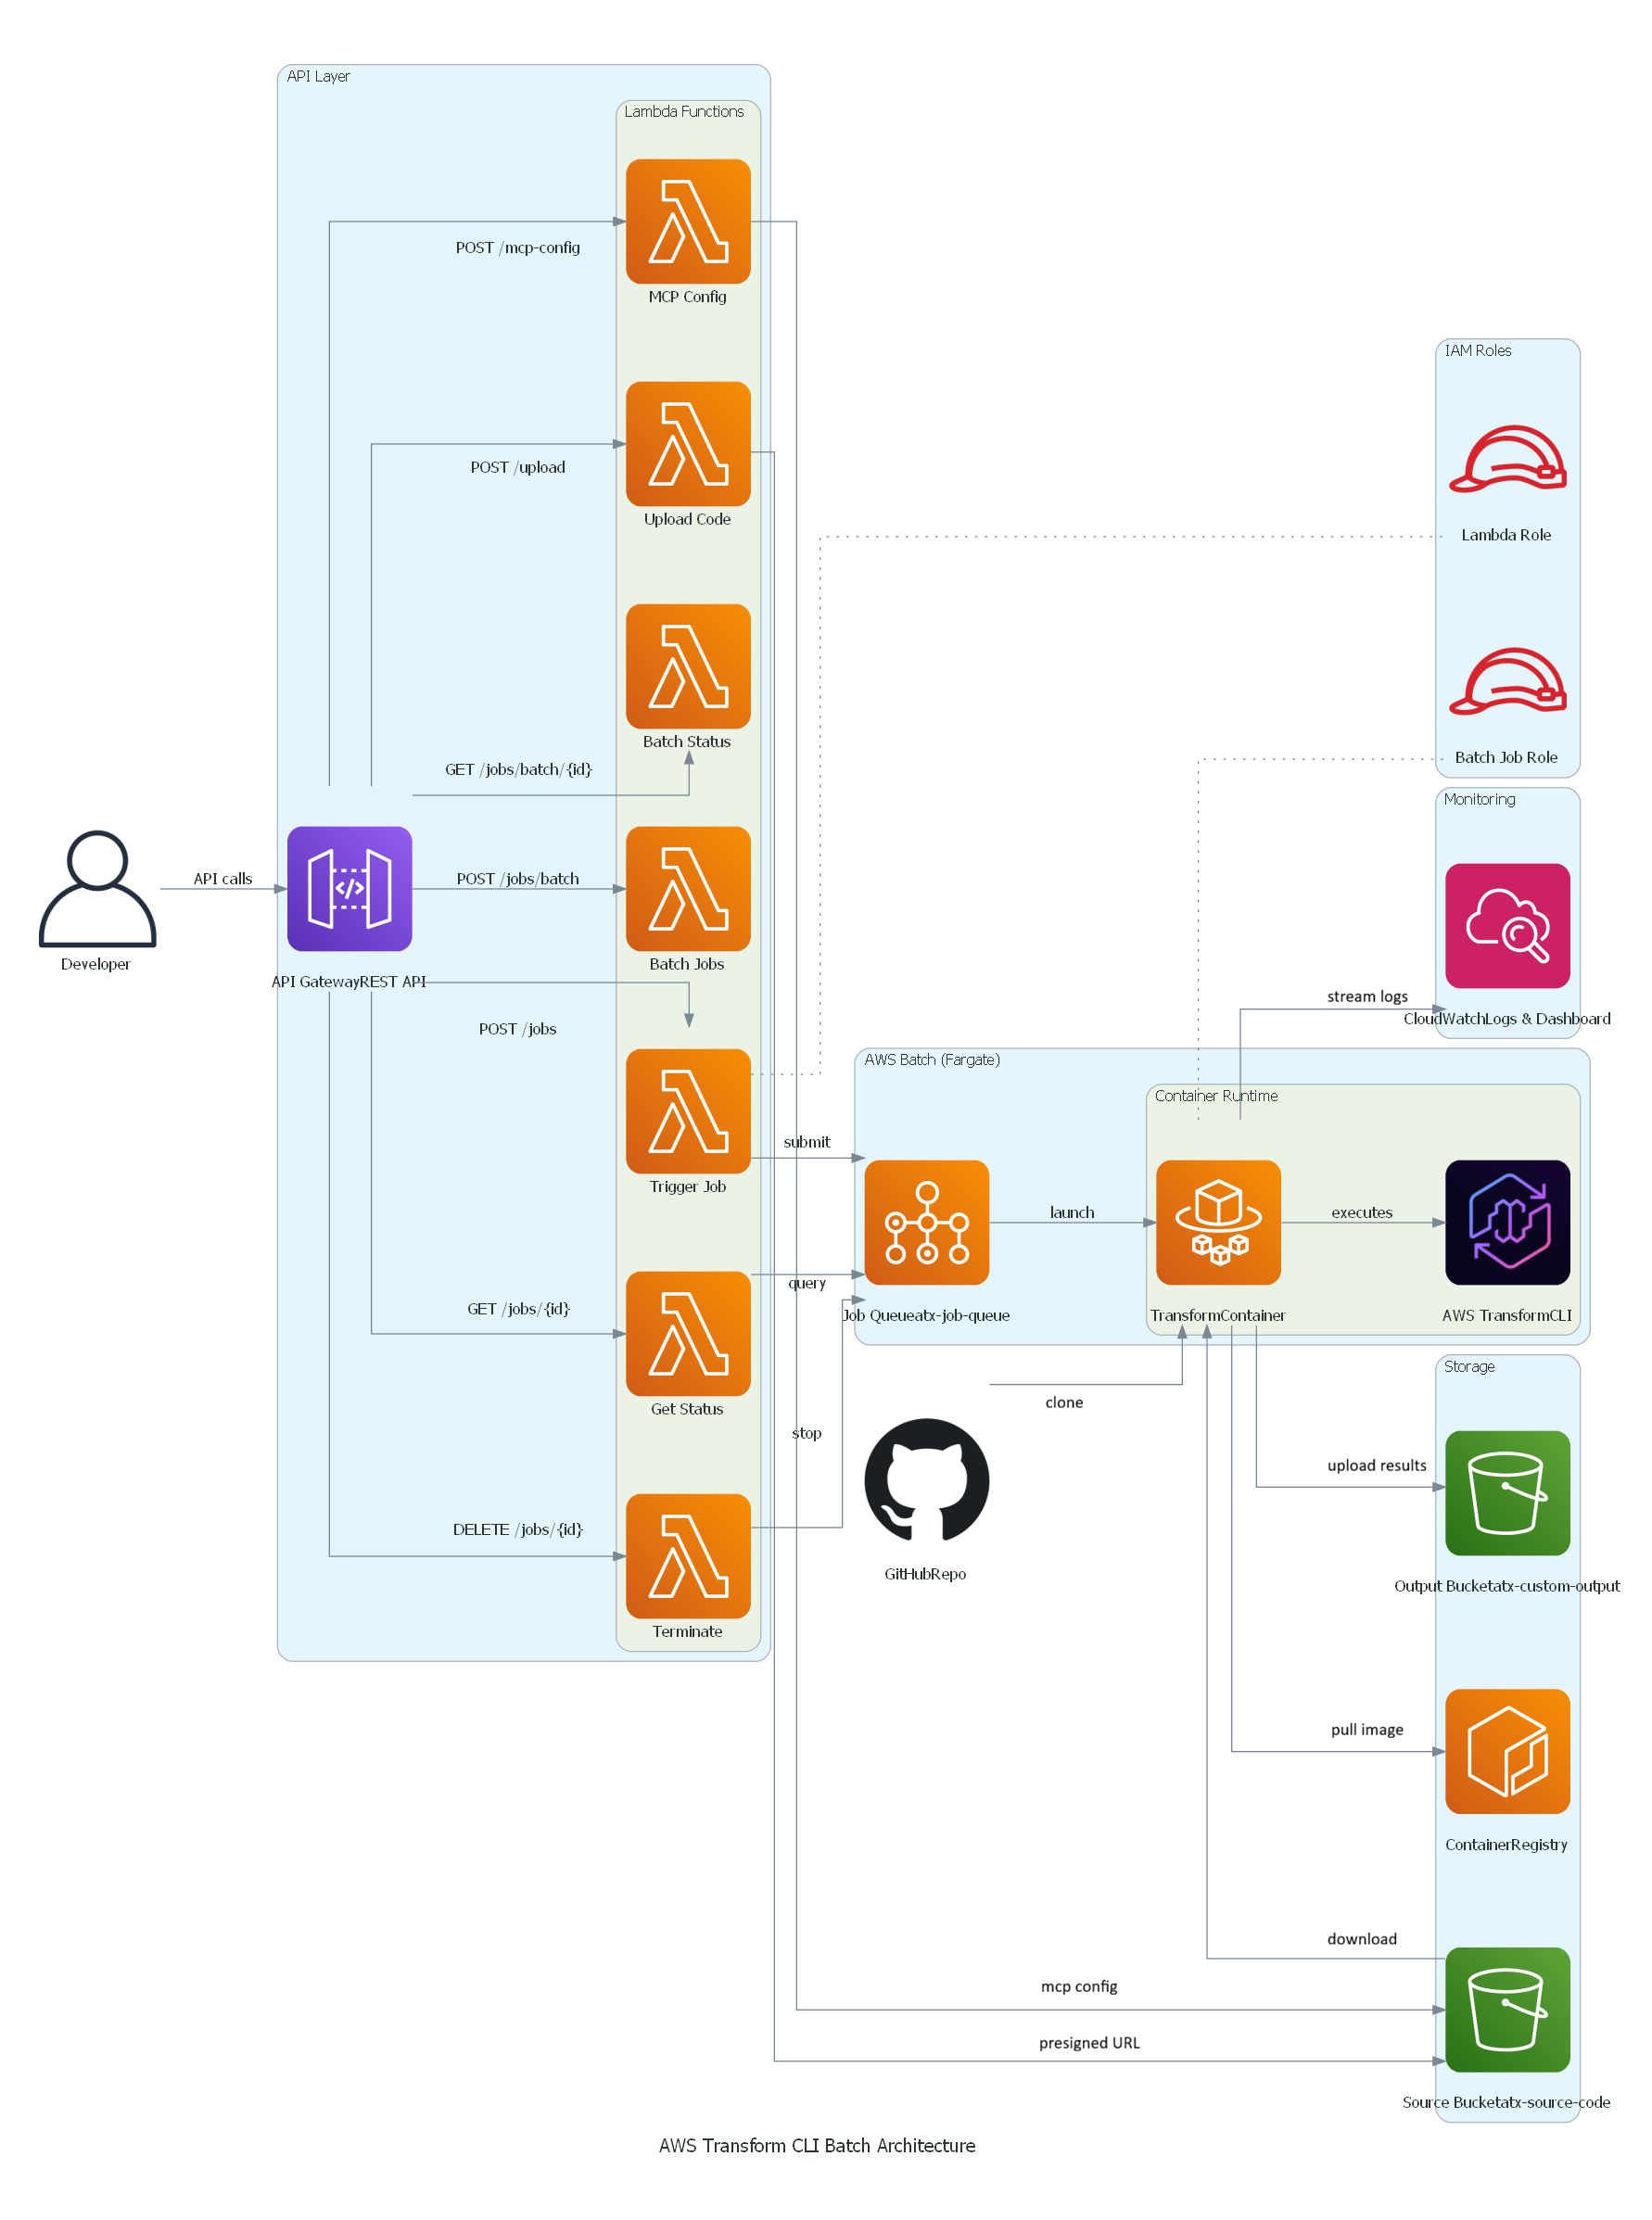
The solution uses a serverless architecture built on AWS managed services:

AWS Transform custom Batch solution architecture

Key Components:

  • API Gateway: REST API with IAM authentication
  • Lambda Functions: Job orchestration, status tracking, bulk submission
  • AWS Batch: Job queue and compute environment management
  • Fargate: Serverless container execution (no EC2 to manage)
  • S3: Source code input and transformation results output
  • CloudWatch: Logs, metrics, and operational dashboard

Getting Started

Prerequisites

Before deploying, ensure you have:

  • AWS Account with appropriate IAM permissions (ECR, S3, IAM, Batch, Lambda, API Gateway, CloudWatch)
  • AWS CLI v2 configured with credentials or AWS SSO login
  • Docker installed and running
  • Git for cloning the repository
  • Node.js 18+ and AWS CDK (for CDK deployment)
  • Python3for testing the APIs

Deployment Options

Option 1: CDK Deployment (Recommended)

Step 1: Clone the Repository

git clone https://github.com/aws-samples/aws-transform-custom-samples.git

cd aws-transform-custom-samples/scaled-execution-containers

Step 2: Set Environment Variables

export AWS_ACCOUNT_ID=$(aws sts get-caller-identity --query Account --output text)
export CDK_DEFAULT_ACCOUNT=$AWS_ACCOUNT_ID
export CDK_DEFAULT_REGION=us-east-1

Step 3: Verify prerequisites

This checks that Docker is installed and running, AWS CLI v2 is configured with credentials, Git is available, and your AWS account has the required VPC and public subnets.

cd deployment
chmod +x *.sh
./check-prereqs.sh

Step 4: Set up IAM Permissions (Optional, but recommended)

Generate a least-privilege IAM policy instead of using broad permissions:

./generate-custom-policy.sh

This creates iam-custom-policy.json with minimum permissions scoped to your specific resources.

Create and attach the policy:

aws iam create-policy \
  --policy-name ATXCustomDeploymentPolicy \
  --policy-document file://iam-custom-policy.json
aws iam attach-user-policy \
  --user-name YOUR_USERNAME \
  --policy-arn arn:aws:iam::$(aws sts get-caller-identity --query Account --output text):policy/ATXCustomDeploymentPolicy

Note: If you have administrator access, you can skip this step and proceed directly to deployment.

Step 5: Deploy with CDK (One Command Does Everything!)

cd ../cdk
chmod +x *.sh
./deploy.sh

Time: 20-25 minutes (all resources)

What CDK Does Automatically:

  1. Builds Docker image from Dockerfile
  2. Pushes image to ECR
  3. Creates all AWS resources
  4. Configures everything

What Gets Deployed:

  • ECR repository with Docker image
  • S3 buckets (output, source)
  • IAM roles with least-privilege
  • AWS Batch infrastructure (Fargate)
  • 7 Lambda functions
  • API Gateway REST API
  • CloudWatch logs and dashboard

See cdk/README.md for detailed instructions and configuration options.

Step 6: Get Your API Endpoint

After deployment completes, retrieve the API endpoint URL:

export API_ENDPOINT=$(aws cloudformation describe-stacks \
  --stack-name AtxApiStack \
  --query 'Stacks[0].Outputs[?OutputKey==`ApiEndpoint`].OutputValue' \
  --output text)

echo "API Endpoint: $API_ENDPOINT"

This endpoint is used in all subsequent API calls.

Option 2: Bash Scripts (Alternative)

If you prefer manual control over each deployment step or need to customize individual components, use the bash script deployment. See deployment/README.md for the complete 3-step process with detailed explanations of what each script deploys.

Using the Solution

Single Job Submission

Quick test: Run cd ../test && ./test-apis.sh to validate all API endpoints (MCP, transformations, bulk jobs, campaigns).

Submit a Python version upgrade transformation:

cd ..
python3 utilities/invoke-api.py \
  --endpoint "$API_ENDPOINT" \
  --path "/jobs" \
  --data '{
    "source": "https://github.com/venuvasu/todoapilambda",
    "command": "atx custom def exec -n AWS/python-version-upgrade -p /source/todoapilambda -c noop --configuration \"validationCommands=pytest,additionalPlanContext=The target Python version to upgrade to is Python 3.13. Python 3.13 is already installed at /usr/bin/python3.13\" -x -t"
  }'

This API call triggers a Python version upgrade transformation on the todoapilambda public git repository. The transformation uses the AWS Managed transformation to upgrade from the current Python version to Python 3.13. The configuration parameter specifies additional validation command to be run and plan context to specifies the location of python 3.13 installation in the container and the target version. The -x flag is for non-interactive mode of the transformation , and -t flag is to trust all tools for this transformation.

API returns a job ID for tracking. Job names are auto-generated from the source repository and transformation type.

See api/README.md for complete API documentation with examples for Java, Node.js, and other transformations.

Bulk Job Submission

Transform multiple repositories in a single API call:

python3 utilities/invoke-api.py \
  --endpoint "$API_ENDPOINT" \
  --path "/jobs/batch" \
  --data '{
    "batchName": "codebase-analysis-2025",
    "jobs": [
      {"source": "https://github.com/spring-projects/spring-petclinic", "command": "atx custom def exec -n AWS/early-access-comprehensive-codebase-analysis -p /source/spring-petclinic -x -t"},
      {"source": "https://github.com/venuvasu/todoapilambda", "command": "atx custom def exec -n AWS/early-access-comprehensive-codebase-analysis -p /source/todoapilambda -x -t"},
      {"source": "https://github.com/venuvasu/toapilambdanode16", "command": "atx custom def exec -n AWS/early-access-comprehensive-codebase-analysis -p /source/toapilambdanode16 -x -t"}
    ]
  }'

This API call triggers a deep static analysis of the codebase to generate hierarchical, cross-referenced documentation for three open source repositories in parallel. The transformation uses the AWS Managed transformation to generate behavioral analysis, architectural documentation, and business intelligence extraction to create a comprehensive knowledge base organized for maximum usability and navigation.

The API submits these jobs in a async manner. i.e the API returns a batch id upon submitting these jobs to AWS Batch. Then you can monitor the progress as specified below.

See api/README.md for status checking, MCP configuration, and other API endpoints.

Monitoring Progress

Check batch status:

python3 utilities/invoke-api.py \
  --endpoint "$API_ENDPOINT" \
  --method GET \
  --path "/jobs/batch/BATCH_ID"

Response shows real-time progress:

{
  "status": "RUNNING",
  "progress": 45.5,
  "totalJobs": 1000,
  "statusCounts": {
    "RUNNING": 195,
    "SUCCEEDED": 432,
    "FAILED": 23
  }
}

Viewing Results

After a job completes, the results are stored in your S3 output bucket.

S3 Output Structure:

Results are organized by job name and conversation ID:

s3://atx-custom-output-{account-id}/
└── transformations/
    └── {job-name}/                           # e.g., guava-early-access-comprehensive-codebase-analysis
        └── {timestamp}{conversation-id}/     # e.g., 20251227_051626_8f344f5f
            ├── code/                         # Full source code + transformed changes
            └── logs/                         # Execution logs and artifacts
                └── custom/
                    └── {timestamp}{conversation-id}/
                        └── artifacts/
                            └── validation_summary.md

Validation Summary:

AWS Transform CLI generates a validation summary showing all changes made:

s3://atx-custom-output-{account-id}/transformations/{job-name}/{timestamp}{conversation-id}/logs/custom/{timestamp}{conversation-id}/artifacts/validation_summary.md

This file contains:

  • Summary of all code changes
  • Files modified, added, or deleted
  • Validation results
  • Transformation statistics

Download Results:

# Download all results for a specific job
aws s3 sync s3://atx-custom-output-{account-id}/transformations/{job-name}/{timestamp}{conversation-id}/ ./local-results/

# Download just the validation summary
aws s3 cp s3://atx-custom-output-{account-id}/transformations/{job-name}/{timestamp}{conversation-id}/logs/custom/{timestamp}{conversation-id}/artifacts/validation_summary.md ./

# Download transformed code only
aws s3 sync s3://atx-custom-output-{account-id}/transformations/{job-name}/{timestamp}{conversation-id}/code/ ./transformed-code/

Monitoring and Observability

The solution includes a CloudWatch dashboard with operational metrics:

Job Tracking:

  • Completion rate with hourly trends (completed vs failed)
  • Recent jobs table showing job name, timestamp, last message, and log stream
  • Real-time visibility into job execution

CloudWatch Dashboard screenshot for Job tracking

API and Lambda Health:

  • API Gateway request counts and error rates
  • Lambda invocation metrics per function
  • Performance monitoring (duration by function)

CloudWatch Dashboard screenshot for API and Lambda Health

CloudWatch Logs:

All logs are centralized in CloudWatch Logs (/aws/batch/atx-transform) with real-time streaming.

View logs via AWS CLI:

aws logs tail /aws/batch/atx-transform --follow --region us-east-1

Or use the included utility:

python3 utilities/tail-logs.py JOB_ID --region us-east-1

View in AWS Console: CloudWatch → Log Groups → /aws/batch/atx-transform

Model Context Protocol (MCP) Integration

AWS Transform custom supports Model Context Protocol (MCP) servers to extend the AI agent with additional tools. Configure MCP servers via API:

python3 utilities/invoke-api.py \
  --endpoint "$API_ENDPOINT" \
  --path "/mcp-config" \
  --data '{
    "mcpConfig": {
      "mcpServers": {
        "github": {"command": "npx", "args": ["-y", "@modelcontextprotocol/server-github"]},
        "fetch": {"command": "uvx", "args": ["mcp-server-fetch"]}
      }
    }
  }'

The configuration is stored in S3 and automatically available to all transformations. Test with atx mcp tools to list configured servers.

See api/README.md for status checking, MCP configuration, and other API endpoints.

Customization for Private Repositories

You may need to access private repositories and artifact registries. Extend the base container to add credentials:

To access your private Git repositories or artifact registries during transformations:

Two approaches:

  1. AWS Secrets Manager (RECOMMENDED) – Credentials fetched at runtime, never stored in image
  2. Hardcode in Dockerfile (NOT RECOMMENDED) – For testing only

Steps:

  1. Uncomment placeholders in container/entrypoint.sh (Secrets Manager) or container/Dockerfile (hardcoded)
  2. Redeploy container (see below)

See container/README.md for complete setup instructions, examples, and security best practices.

Redeploying after customization:

If using CDK:

cd cdk && ./deploy.sh

CDK automatically detects Dockerfile changes and rebuilds. If changes aren’t detected, force rebuild:

cd cdk && ./deploy.sh —force

If using bash scripts:

cd deployment
./1-build-and-push.sh --rebuild
./2-deploy-infrastructure.sh

The infrastructure will use your custom container with private repository access. You can also customize the container to add support for additional language versions or entirely new languages based on their specific requirements.

See container/README.md for complete examples.

Note: For automated PR creation and pushing changes back to remote repositories after transformation, you have two options: (1) extend container/entrypoint.sh with git commands using your private credentials (see commented placeholder in the script), or (2) use a custom Transformation definition with MCP configured to connect to GitHub/GitLab for more sophisticated PR workflows.

Campaigns

Central platform teams can create campaigns through the AWS Transform web interface to manage enterprise-wide migration and modernization projects. For instance, to upgrade all repositories from Java 8 to Java 21, teams create a campaign with the Java upgrade transformation definition and target repository list. As developers execute transformations, repositories automatically register with the campaign, enabling you to track progress and monitor across your organization.

Creating a Campaign

  1. Setup Users and Login to AWS Transform web application
  2. Create a Workspace and Create a Job
  3. In the chat, specify the type of the job . For example , “I would like comprehensive code analysis on multiple repos”
  4. Based on your request, AWS Transform will display the list of transformation that matches the criteria, in this case “AWS/early-access-comprehensive-codebase-analysis (Early Access)”
  5. Once you confirm the transformation, AWS Transform will create a campaign and a command to execute for the transformation. You can just copy that command and execute via the API as described below replacing the repo details.
atx custom def exec \
--code-repository-path <path-to-repo> \
--non-interactive \
--trust-all-tools \
--campaign 0d0c7e9f-5cb2-4569-8c81-7878def8e49e \
--repo-name <repo-name> \
--add-repo

Executing the Transformation in a Campaign

python3 utilities/invoke-api.py \
  --endpoint "$API_ENDPOINT" \
  --path "/jobs" \
  --data '{
    "source": "https://github.com/spring-projects/spring-petclinic",
    "command": "atx custom def exec --code-repository-path /source/spring-petclinic --non-interactive --trust-all-tools --campaign 0d0c7e9f-5cb2-4569-8c81-7878def8e49e --repo-name spring-petclinic --add-repo"
  }'

Once this transformation Job is successful, you can view the results and dashboard in Web application as well.

Cleanup

To remove all deployed resources:

CDK Cleanup (Recommended)

cd cdk ./destroy.sh

Bash Scripts Cleanup (Alternate)

cd deployment ./cleanup.sh

This script deletes:

  • AWS Batch resources (compute environment, job queue, job definitions)
  • Lambda functions and API Gateway
  • IAM roles
  • S3 buckets (after emptying)
  • CloudWatch logs and dashboard
  • ECR repository

Conclusion

Enterprise software modernization requires infrastructure that can operate at scale with reliability and observability. This solution provides a production-ready platform for running AWS Transform custom transformations on thousands of repositories concurrently.

By combining AWS Batch’s scalability, Fargate’s serverless compute, and a REST API for programmatic access, you can:

  • Accelerate modernization initiatives
  • Reduce manual effort and human error
  • Gain visibility into transformation progress
  • Integrate with existing DevOps workflows

The code repository is open-source, fully automated, and ready for you to deploy in your AWS account today.

Get started today with AWS Transform custom

About the authors
Profile image for Venugopalan Vasudevan

Venugopalan Vasudevan

Venugopalan Vasudevan (Venu) is a Senior Specialist Solutions Architect at AWS, where he leads Generative AI initiatives focused on Amazon Q Developer, Kiro, and AWS Transform. He helps customers adopt and scale AI-powered developer and modernization solutions to accelerate innovation and business outcomes.

Profile image for Dinesh Balaaji Prabakaran

Dinesh Balaaji Prabakaran

Dinesh is a Enterprise Support Lead at AWS who specializes in supporting Independent Software Vendors (ISVs) on their cloud journey. With expertise in AWS Generative AI Services, he helps customers leverage Amazon Q Developer, Kiro, and AWS Transform to accelerate application development and modernization through AI-powered assistance.

Profile image for Brent Everman

Brent Everman

Brent Everman is a Senior Technical Account Manager with AWS, based out of Pittsburgh. He has over 17 years of experience working with enterprise and startup customers. He is passionate about improving the software development experience and specializes in the AWS Next Generation Developer Experience services.

AWS Transform custom: AI-driven Java modernization to reduce tech debt

Post Syndicated from Dinesh Prabakaran original https://aws.amazon.com/blogs/devops/aws-transform-custom-ai-driven-java-modernization-to-reduce-tech-debt/

In today’s rapidly evolving software landscape, maintaining and modernizing Java applications is a critical challenge for many organizations. As new Java versions are released and best practices evolve, the need for efficient code transformation becomes increasingly important. Organizations today face significant challenges when modernizing their Java applications. Legacy codebases often contain outdated patterns, deprecated APIs, and inefficient implementations that hinder performance and maintainability. Traditional manual refactoring approaches are time-consuming, error-prone, and difficult to scale across large codebases. In addition, as developers spend more time on new development and deployment, the volume of technical debt continues to rise, requiring transformation of legacy code at-scale.

AWS Transform custom addresses these challenges through intelligent automation, providing AWS-managed transformations – standardized transformation packages for common scenarios like Java version upgrades. These transformations enable teams to achieve quick wins through standardized, tested transformation patterns that can be executed at scale, bringing significant time and cost savings to customers. In addition, customers can create custom user defined transformations to address technical debt with code transformations across languages, frameworks, and more.

This post explores how to leverage AWS Transform custom’s out-of-the-box transformation for Java upgrades. By the end of this post, you’ll understand how to use these standardized transformations to modernize your Java applications efficiently while maintaining full control over the transformation process.

Introduction to AWS Transform custom

AWS Transform custom uses agentic AI to automate large-scale code modernization, handling language version upgrades, API migrations, framework updates, and organization-specific transformations. Through continual learning, the agent improves from every execution and developer feedback, delivering high-quality, repeatable transformations without requiring specialized automation expertise.

Prerequisites

Before starting your Java modernization journey with AWS Transform custom, ensure you have the necessary development environment, build tools, and AWS Transform custom command line interface (CLI) installed. For detailed prerequisites and setup instructions, refer to the AWS Transform custom Prerequisites Guide.

Understanding the Modernization Scenario

We’ll demonstrate AWS Transform custom using a Movie Service application – a Spring Boot REST API built on Java 8 with Gradle. This represents a typical enterprise modernization challenge with legacy dependencies, outdated patterns, and technical debt.

Leveraging AWS-Managed Transformations

AWS Transform custom focuses on leveraging AWS-managed transformations designed for common modernization tasks like Java version upgrades.

AWS-managed transformations are pre-built, AWS-vetted transformations for common use cases that are ready to use without any additional setup. These transformations provide immediate value with minimal configuration, making them ideal for standard upgrade scenarios.

Understanding AWS Transform custom CLI Capabilities

AWS Transform custom provides a comprehensive command-line interface that enables both interactive and automated transformation workflows:

atx --version                    # Display ATX version
atx --help                       # Display general help
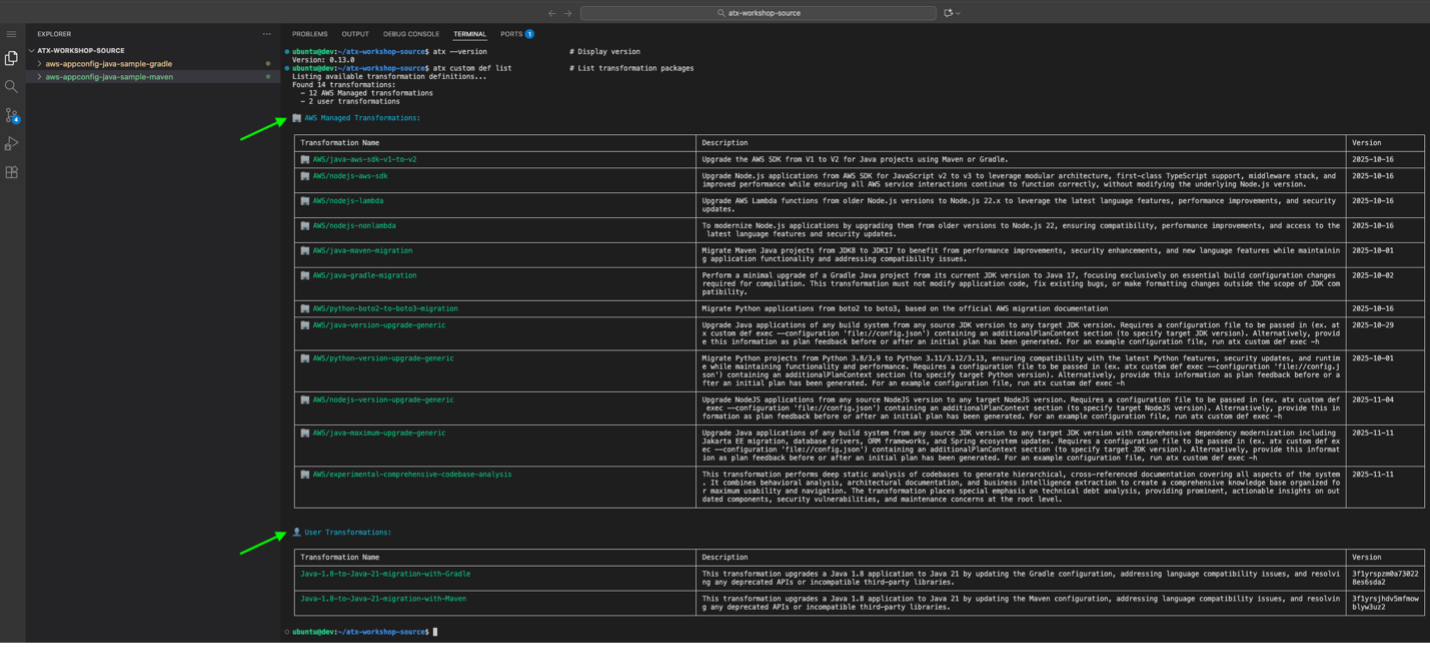
atx custom def list              # List transformation packages
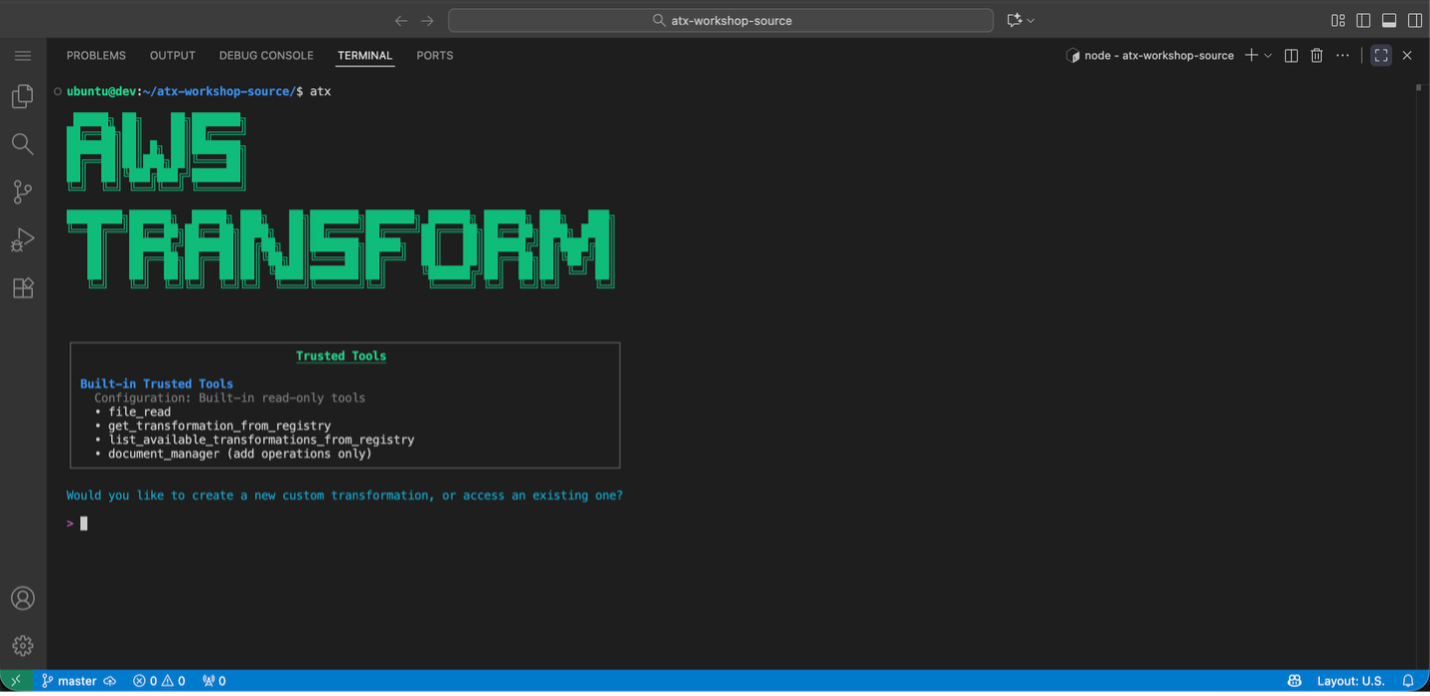
atx                              # Start interactive conversation

For detailed information on all available commands, refer to the AWS Transform custom command reference.

Screenshot of AWS Transform custom interactive mode.
Figure 1:AWS Transform custom interactive mode

Discovering Available Transformations

Use atx custom def list to view all available transformations, including AWS-managed transformations and custom-defined (user-defined) transformations created by your organization. Key AWS-managed transformations include Java/Python/Node.js version upgrades and AWS SDK migrations.

Screenshot of AWS Transform interface displaying categorized lists of AWS Managed transformations and user-defined custom
transformations.
Figure 2: AWS Transform custom lists available AWS Managed and custom-defined (user-defined) transformations

Applying AWS-Managed Transformations

Before applying any transformations, ensure your project is initialized with Git and that all build and test cases are working correctly with Java 8 (Test cases can be skipped when necessary by using the appropriate build command option and instructions to the agent). For Gradle projects, verify that ./gradlew build executes successfully.

The transformation process follows a structured approach:

  1. Ensure Clean Git State:
git status
git add .
git commit -m "Baseline before Java 21 transformation"
  1. Apply Transformation: You can apply transformations using either interactive or direct command modes. In this blog, we will use the interactive mode to walk through the process step-by-step:

Interactive Mode (used in this blog):

First, create a config.json file with your transformation configuration:

{
  "codeRepositoryPath": "/path/to/your/aws-appconfig-java-sample-gradle",
  "transformationName": "AWS/java-version-upgrade",
  "buildCommand": "./gradlew clean build",
  "validationCommands": "build and validate using \"./gradlew clean build\" after transformation to test with java 21",
  "additionalPlanContext": "This is a Java 8 to 21 transformation of a gradle app , also include all dependency migration as well. Use java path /path/to/your/java-8/bin/java and /path/to/your/java-21/bin/java when building before and after transformation. We are using gradle wrapper gradlew, update it if needed for java 21 upgrade. Check for deprecated methods and dependencies and update them."
}

Update the codeRepositoryPath in your config.json to point to your local project directory and update the Java path in additionalPlanContext to match your Java 8 and 21 installation. For more details about configuration files and their parameters, refer to Using Configuration Files.

Then execute the transformation in interactive mode (used for this blog walkthrough):

For Java version upgrade with Gradle using config.json (Interactive Mode):
atx custom def exec -t --configuration file://config.json

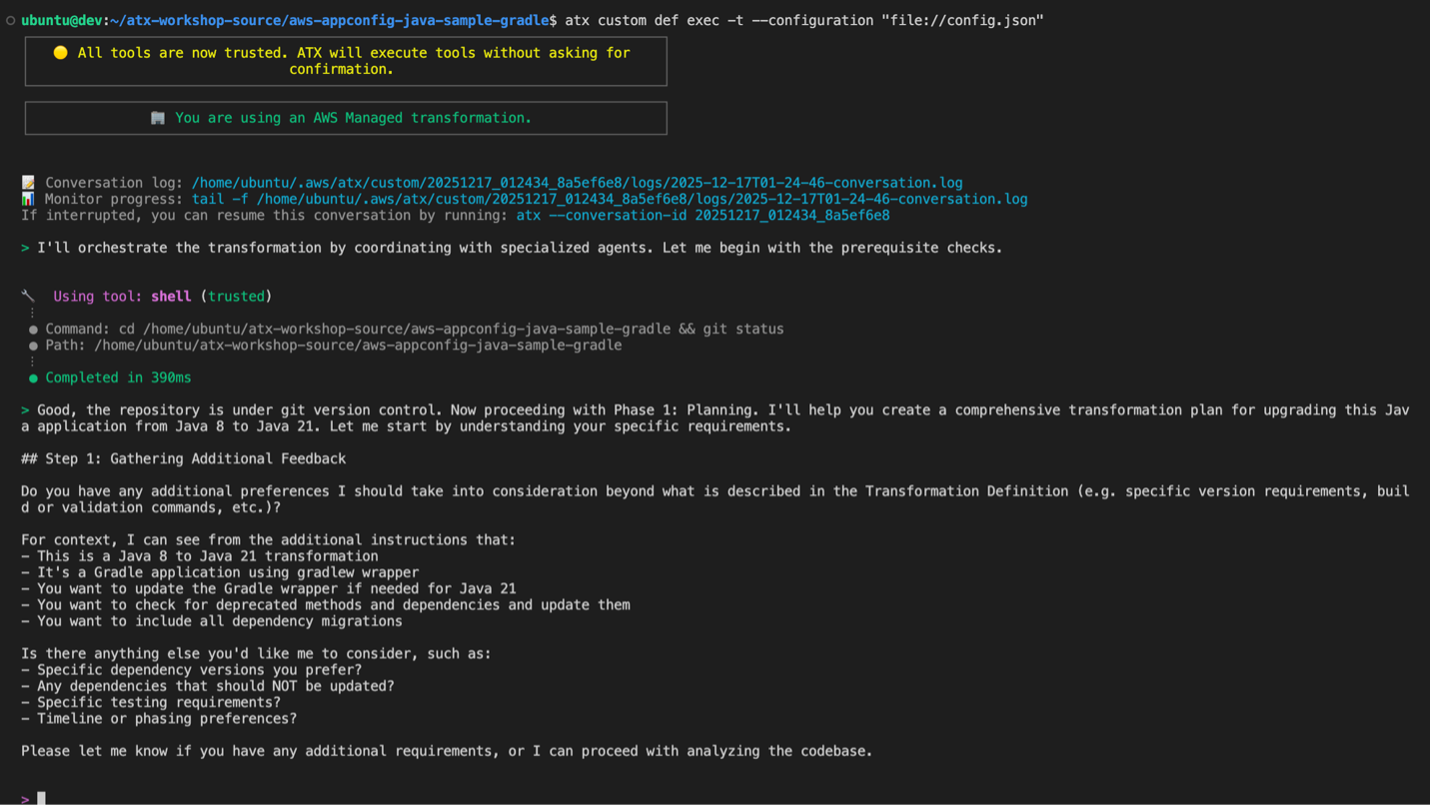
Screenshot of AWS Transform interface displaying categorized lists of AWS Managed transformations and user-defined custom transformations.
Figure 3: AWS Transform custom execute a gradle transformation in interactive mode with transformation configuration supplied from config.json

Direct Command Mode (alternative approach): Use this mode for automated CI/CD pipelines or when you want to execute transformations without interactive prompts.

atx custom def exec -x -t --configuration “file://config.json”

Parameter explanation:

--configuration: Specifies the configuration file for interactive mode

-x: Executes the transformation automatically without interactive prompts (direct mode)

-t: Enables test mode for validation during execution (direct mode)

--configuration: Specifies the configuration file path with file://prefix (direct mode)

ATX Execution Command Executing AWS managed Java version upgrade transformation for Gradle project using ATX CLI

  1. Review Transformation Plan: AWS Transform custom analyzes your project based on the configuration provided in config.json and generates a comprehensive transformation plan. This plan details all proposed changes, including:
  • Java version updates: Migration from Java 8 to Java 21 configurations
  • API migration patterns: Automatic updates for deprecated APIs and modern alternatives
  • Framework modernization: Spring Boot version upgrades and compatibility updates
  • Dependency modifications: Updated library versions compatible with Java 21
  • Build system updates: Gradle configuration and plugin changes for Java 21 compatibility
  • Code pattern improvements: Implementation of modern Java features and best practices

We recommend doing a thorough review of the transformation plan to ensure it encompasses all expected updates. The additionalPlanContext in your config.json helps guide the transformation to include dependency migrations and Gradle wrapper updates. If adjustments are needed, provide feedback through the CLI interface.

Additionally, if you want to customize the transformation to target additional changes, for example upgrading additional legacy dependencies contained in the project, you can provide this as feedback when reviewing the transformation plan. AWS Transform custom incorporates all feedback provided to refine the transformation plan before proceeding.

  1. Apply the Transformation: After confirming the transformation plan meets your requirements, type proceed and press Enter. AWS Transform custom executes the transformation according to the approved plan.

The transformation process automatically:

– Creates a new branch and commits the transformed changes in there

– Updates Gradle configuration for Java 21

– Migrates Java EE to Jakarta EE packages (if applicable)

– Updates framework dependencies for Java 21 compatibility

– Applies all necessary code changes

– Updates test cases and testing frameworks for Java 21 compatibility

– Runs comprehensive validation builds

Results of AWS-Managed Transformations

After applying the Java version upgrade transformation, below changes are observed:

Configuration Updates: – Java version: 1.8 → 21 – Spring Boot version upgrades – Gradle plugin and configuration updates – Dependency version modernization

To validate the changes, switch to Java 21 and run ./gradlew build to ensure the transformation was successful, then test the application functionality.

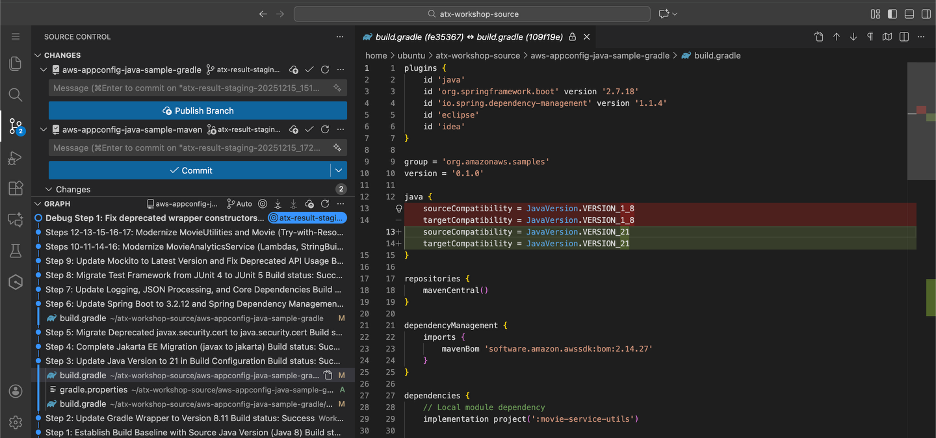
Figure 4: displaying Updated Gradle Configuration Gradle build.gradle showing updated Java 21 configuration and modernized
dependencies
Figure 4: Updated Gradle Configuration Gradle build.gradle showing updated Java 21 configuration and modernized dependencies

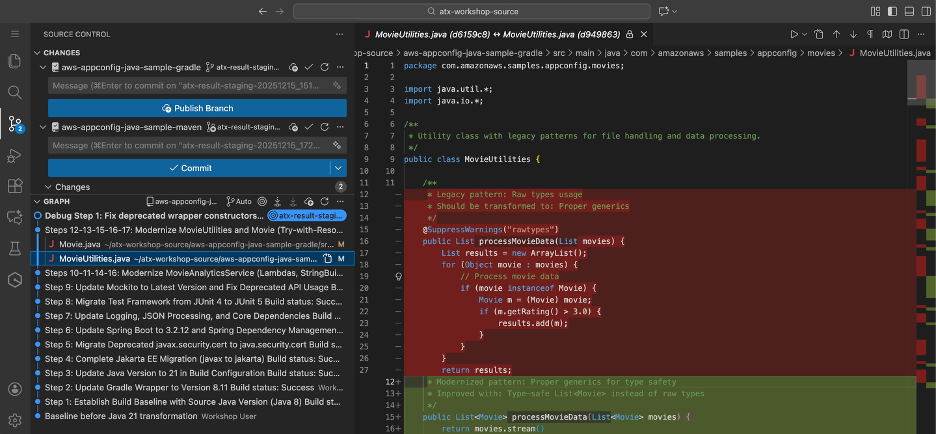
Figure 5: Updated code where legacy pattern of raw types usage is transformed to generics
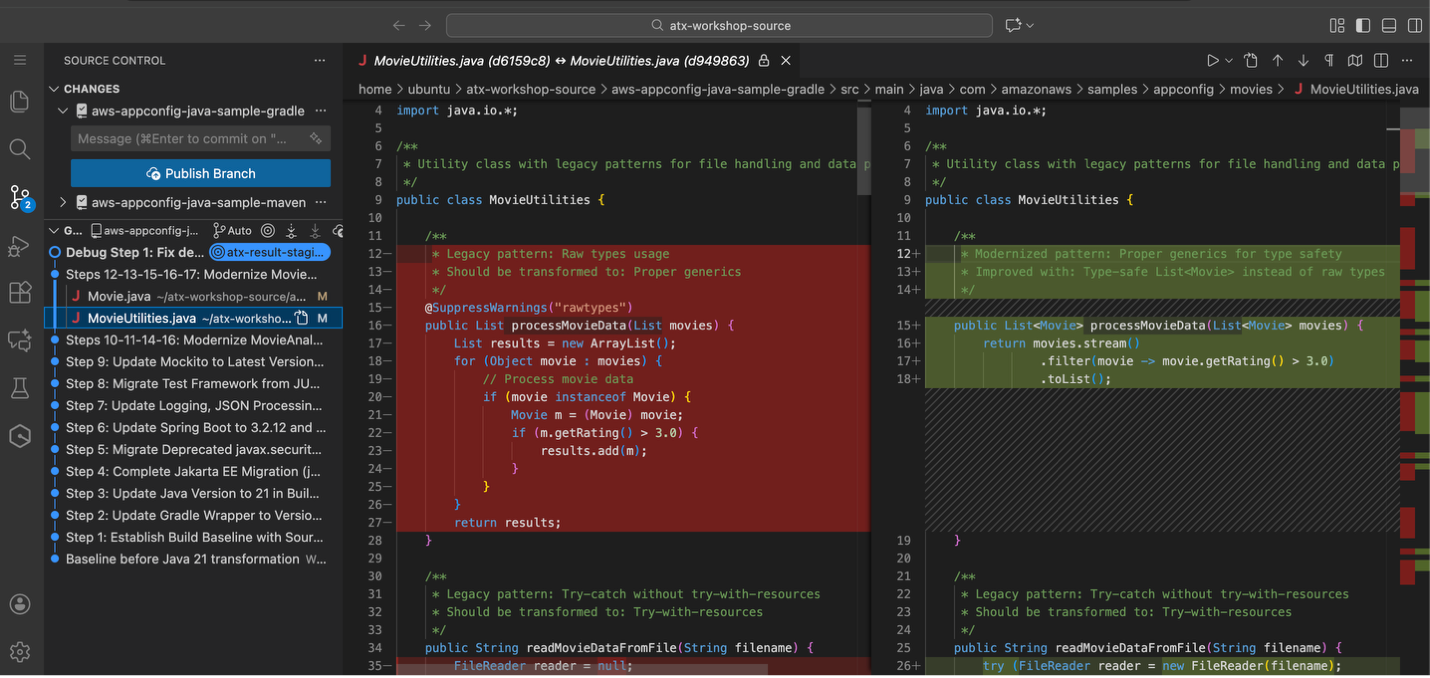
Figure 6: Second example of updated code where legacy pattern of raw types usage is transformed to generics
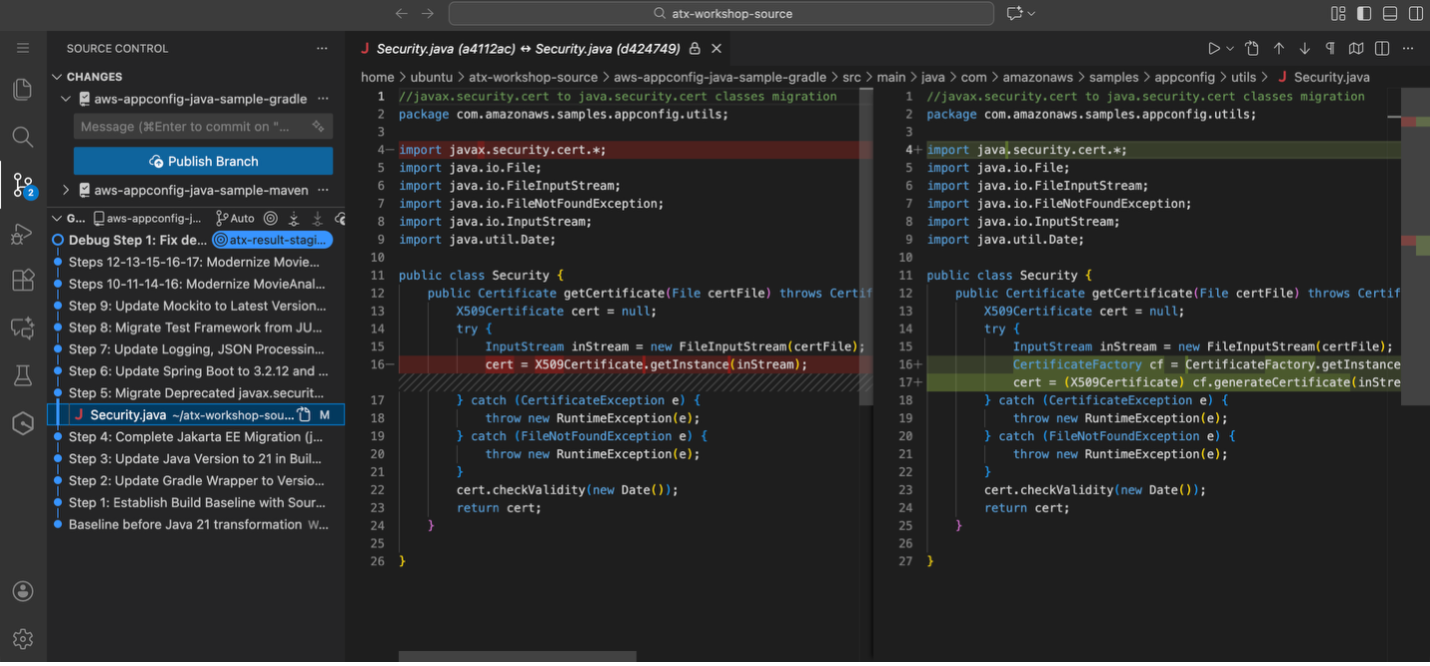
Figure 7: Updated dependency from javax.security to java.security and uses CertificateFactory to get X509Certificate
Figure 7: Updated dependency from javax.security to java.security and uses CertificateFactory to get X509Certificate
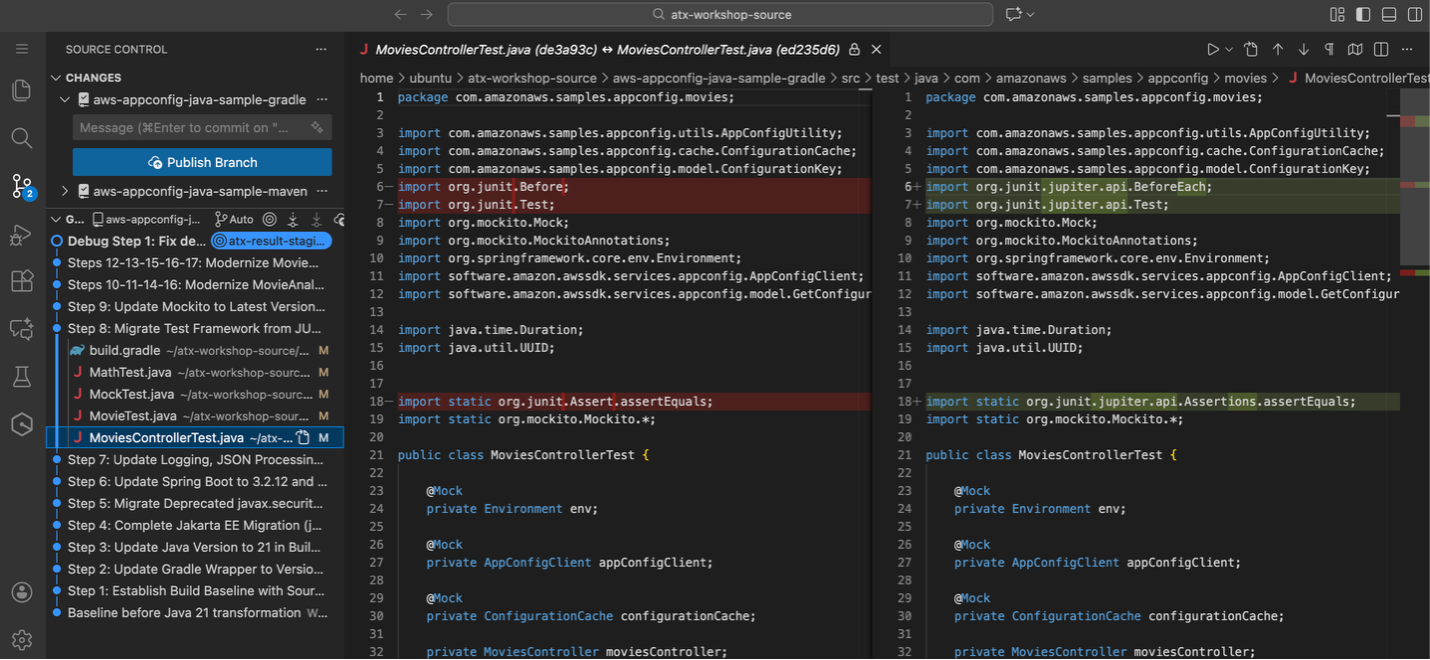
Figure 8: Updated Test cases from junit 4 to junit5

Beyond AWS-Managed Transformations: Custom-Defined Transformations

While AWS-managed transformations provide excellent coverage for standard Java modernization scenarios, there are cases where the available AWS-managed transformations may not address your specific transformation requirements. In such situations, AWS Transform custom enables users to create and test their own organization specific, custom-defined transformation definitions.

When to Create Custom-Defined Transformations

Custom-defined transformations become necessary when AWS-managed transformations don’t cover your specific needs, such as proprietary frameworks, organization-specific coding standards, or complex multi-step migration scenarios.

Creating Custom-Defined Transformations

AWS Transform custom enables teams to develop custom transformations using transformation rules and configuration files. This allows organizations to define transformation logic specific to their requirements, test on sample code, and share validated transformations across teams.

AWS Transform custom’s interactive mode (atx) is particularly beneficial for creating Custom-defined transformations, enabling conversational interaction to iteratively refine requirements and get real-time feedback. Custom-defined transformations provide flexibility to extend AWS Transform custom’s capabilities when AWS-managed transformations don’t meet specific modernization needs.

Continual Learning and Knowledge Items

AWS Transform custom automatically learns from each transformation execution to improve future results. For Java upgrades specifically, the service captures patterns like successful refactoring strategies, common dependency conflicts, and framework compatibility matrices across Java versions. This knowledge feeds back into future transformations, making them more accurate at predicting successful upgrade paths and reducing manual intervention.

Knowledge items are account-specific and remain within your AWS account boundaries. Users can enable or disable continual learning, providing full control over this preference.

Conclusion

In this blog, we demonstrated how AWS Transform custom enables efficient Java application modernization using AWS managed transformations. Starting with a legacy Movie Service application running Java 8 and Spring Boot 2.x, we successfully transformed it to Java 21 with modern dependencies and patterns.

The step-by-step process showed how to establish a baseline, discover available transformations using atx custom def list, and apply transformations through AWS Transform custom’s CLI. The result was a fully modernized application with updated Java versions, Spring Boot upgrades, and modern Java features like enhanced switch expressions and local variable type inference – all achieved in minutes rather than weeks of manual refactoring.

Beyond Java Modernization

Beyond Java modernization, AWS Transform custom’s transformation capabilities extend to other programming languages and frameworks, making it a versatile solution for comprehensive application portfolio modernization across diverse technology stacks. The agent supports diverse transformation use cases including:

  • Version upgrades for Java, Python, and Node.js
  • Runtime and API migrations (AWS SDK v1→v2, Boto2→Boto3)
  • Framework transitions and upgrades
  • Language translations and architectural changes
  • Organization-specific, custom-defined transformations

Through its define once, transform everywhere approach, AWS Transform custom enables organizations to capture and amplify transformation knowledge by defining transformations once and executing repeatable tasks across the entire organization. This reduces knowledge silos and ensures consistent quality regardless of team or project scope.

Getting Started

Ready to modernize your Java applications with AWS Transform custom? Here’s how to begin:

  1. Install AWS Transform custom CLI (atx) using the installation script and verify your environment
  2. Configure AWS credentials with transform-custom:* permissions
  3. Explore available AWS-managed transformations using atx custom def list
  4. Apply transformations to your Java applications using direct execution mode (atx custom def exec) or interactive mode (atx)
  5. Validate results through comprehensive testing with ./gradlew build for Gradle projects
  6. Scale across your application portfolio for consistent modernization

Additional Resources

For detailed setup instructions and documentation, visit:

Start your modernization journey today and experience the power of AI-driven code transformation at scale.

About the authors
Profile image for Venugopalan Vasudevan

Venugopalan Vasudevan

Venugopalan Vasudevan (Venu) is a Senior Specialist Solutions Architect at AWS, where he leads Generative AI initiatives focused on Amazon Q Developer, Kiro, and AWS Transform. He helps customers adopt and scale AI-powered developer and modernization solutions to accelerate innovation and business outcomes.

Profile image for Dinesh Balaaji Prabakaran

Dinesh Balaaji Prabakaran

Dinesh is a Enterprise Support Lead at AWS who specializes in supporting Independent Software Vendors (ISVs) on their cloud journey. With expertise in AWS Generative AI Services, he helps customers leverage Amazon Q Developer, Kiro, and AWS Transform to accelerate application development and modernization through AI-powered assistance.

Profile image for Sureshkumar Natarajan

Sureshkumar Natarajan

Sureshkumar Natarajan is a Senior Technical Account Manager at AWS, where he supports Enterprise customers in their cloud journey with a focus on Generative AI initiatives. He guides organizations in leveraging Amazon Q Developer, Kiro, and AWS Transform to unlock new capabilities, streamline development workflows, and achieve transformative business results.

Profile image for Anjan Dave

Anjan Dave

Anjan Dave is a Principal Solutions Architect at AWS with over 25 years of IT experience. He specializes in generative AI application modernization, infrastructure scalability, and developer productivity initiatives.
Anjan leads GenAI and modernization strategies across global projects, influencing technology roadmaps for HCM providers through event-driven and microservices architectures. He advocates for integrating Generative AI into the software development lifecycle to automate routine tasks, enabling engineering teams to focus on high-value architectural work.

The Future of AWS CodeCommit

Post Syndicated from Anthony Hayes original https://aws.amazon.com/blogs/devops/aws-codecommit-returns-to-general-availability/

Back in July 2024, we announced plans to de-emphasize AWS CodeCommit based on adoption patterns and our assessment of customer needs. We never stopped looking at the data or listening to you, and what you’ve shown us is clear: you need an AWS-managed solution for your code repositories. Based on this feedback, CodeCommit is returning to full General Availability, effective immediately.

We Listened, and We Heard You

After the de-emphasis announcement last year, we heard from many of you. Your feedback was direct and revealing. You told us that CodeCommit isn’t just another code repository for you—it’s a critical piece of your infrastructure. Its deep IAM integration, VPC endpoint support, CloudTrail logging, and seamless connectivity with CodePipeline and CodeBuild provide value that’s difficult to replicate with third-party solutions, especially for teams operating in regulated industries or those who want all their development infrastructure within AWS boundaries. In short, we learned that CodeCommit is essential for many of you, so we’re bringing it back.

We acknowledge the uncertainty the de-emphasis has caused. If you invested time and resources planning or executing a migration away from CodeCommit, we apologize. We’ve learned from this, and we’re committed to doing better.

What’s Changing Today

Here’s what you need to know:

CodeCommit is open to new customers again – New customer sign-ups are open as of today. If you’ve been waiting to onboard new accounts or create repositories, you can do so right now through the AWS Console, CLI, or APIs.

For current and former customers – If you already migrated away, we understand you may have completed your transition to GitHub, GitLab, Bitbucket, or another provider. Those are excellent platforms, and we fully support your decision to use them. If you’re interested in returning to CodeCommit, our support team and account teams are available to help.

If you’re mid-migration, you can pause or reverse your plans. Contact AWS Support or your account team to discuss your specific situation and determine the best path forward.

If you stayed with CodeCommit, thank you for your patience during this period. We’re working through the backlog of feature requests and support tickets that accumulated, prioritizing by customer need. Continue to tell us how we can improve the service and support your workflows (human, machine, and agentic) moving forward.

What’s Coming Next

We’re not just maintaining CodeCommit—we’re investing in it. Here’s what’s on the roadmap:

Git LFS Support (Q1 2026) – This has been your most requested feature. Git Large File Storage will enable you to efficiently manage large binary files like images, videos, design assets, and compiled binaries without bloating your repositories. You’ll get faster clones, better performance, and cleaner version history for large assets.

Regional Expansions (Starting Q3 2026) – CodeCommit will expand to additional AWS Regions in eu-south-2 and ca-west-1, bringing the service closer to where you’re building and deploying your applications.

We’ll share more details about these features and additional roadmap items in the coming months. Keep an eye on our What’s New feed for the latest AWS launches.

Pricing, SLA, and Getting Started

Pricing remains unchanged—you can review the current structure on the CodeCommit pricing page. We continue to maintain our 99.9% uptime SLA as defined in our service terms.

If you’re new to CodeCommit or returning after a migration, check out our Getting Started Guide for step-by-step instructions. For migration assistance or questions about your specific setup, contact AWS Support or your account team.

Available Now

AWS CodeCommit is available now in 29 regions. New customers can begin creating repositories immediately. Visit the CodeCommit console to get started.

Thank you for your feedback, your patience, and your continued trust in AWS. We’re committed to making CodeCommit the best integrated Git repository service for AWS development.

Learn More:

Your Guide to the Developer Tools Track at AWS re:Invent 2025

Post Syndicated from Brian Beach original https://aws.amazon.com/blogs/devops/your-guide-to-the-developer-tools-track-at-aws-reinvent-2025/

AWS re:Invent 2025 is just around the corner, and if you’re a developer looking to level up your skills, the Developer Tool (DVT) track has an incredible lineup waiting for you. From CI/CD pipelines and full-stack development to Infrastructure as Code and AI-powered coding agents, this year’s sessions will help you build faster, smarter, and more efficiently. Here’s your essential guide to navigating the week.

Must-Attend Sessions

AWS re:Invent is a learning focused conference and the best place for developer to learn is in one of the roughly 75 sessions on the Developer Tools track. With breakout sessions, lightening talks, chalk talks, code talks, workshops, builder sessions, and meetups, you are sure to find a something that appeals the developer in you. Check you the event catalog, or start with these stand out sessions.

  • DVT202: Continuous integration and continuous delivery (CI/CD) on AWS – Learn about creating complete CI/CD pipelines using infrastructure as code on AWS, with hands-on insights into planning work, collaborating on code, and deploying applications. Mandalay Bay – Monday 10:00 AM
  • DVT203: AWS infrastructure as code: A year in review – Discover the latest features and improvements for AWS CloudFormation and AWS CDK, and learn how these tools can bring rigor, clarity, and reliability to your application development. MGM Grand – Monday 10:30 AM
  • DVT204: What’s new in full-stack AWS app development – Find out how AWS is evolving to help web developers deliver differentiating experiences at 10x speed with solutions that empower you to get started easily, ship quickly, and iterate rapidly. Mandalay Bay – Monday 12:00 PM
  • DVT209: Kiro: Your agentic IDE for spec-driven development – Explore how Kiro is revolutionizing development with spec-driven workflows, agent hooks, multimodal agent chat, and MCP support to help you go from idea to production faster. MGM Grand – Wednesday 11:30 AM
  • DVT405: From Code completion to autonomous agents: The evolution of software development – Journey through the evolution of AI-powered coding agents from inline code completion to sophisticated autonomous tools, grounded in empirical evidence and real-world applications. MGM Grand – Wednesday 3:00 PM
  • DVT207: Developer experience economics: moving past productivity metrics – Learn Amazon’s approach to understanding the impact of developer experience and tooling, and discover how to bring strategic thinking to your team’s developer experience improvements. Mandalay Bay – Tuesday 5:30 PM

House of Kiro

Start your journey at the House of Kiro in the Venetian. Walk through Kiro’s haunted house filled with developer nightmares and horrors, and explore how Kiro brings structure to coding chaos through spec-driven development, vibe coding, and agent hooks. If you survive the haunted house, you will be rewarded with Kiro swag.

Rustic wooden cabin structure with "KIRO" branding and ghost logo on the roof, featuring boarded-up windows with glowing purple light emanating from behind, creating a haunted house aesthetic with a front porch and chimney.

AWS Village

Visit the AWS Village in the Expo at the Venetian Level 2 Hall B to speak with me and other experts at either the Kiro kiosk or the Developer Tools kiosk, covering CodePipeline, CodeBuild, CloudFormation, CDK, and all the essential developer tools.

  • The Venetian, Monday, Dec 1: 4:00 PM – 7:00 PM
  • Tuesday, Dec 2: 10:00 AM – 6:00 PM
  • Wednesday, Dec 3: 10:00 AM – 6:00 PM
  • Thursday, Dec 4: 10:00 AM – 4:00 PM

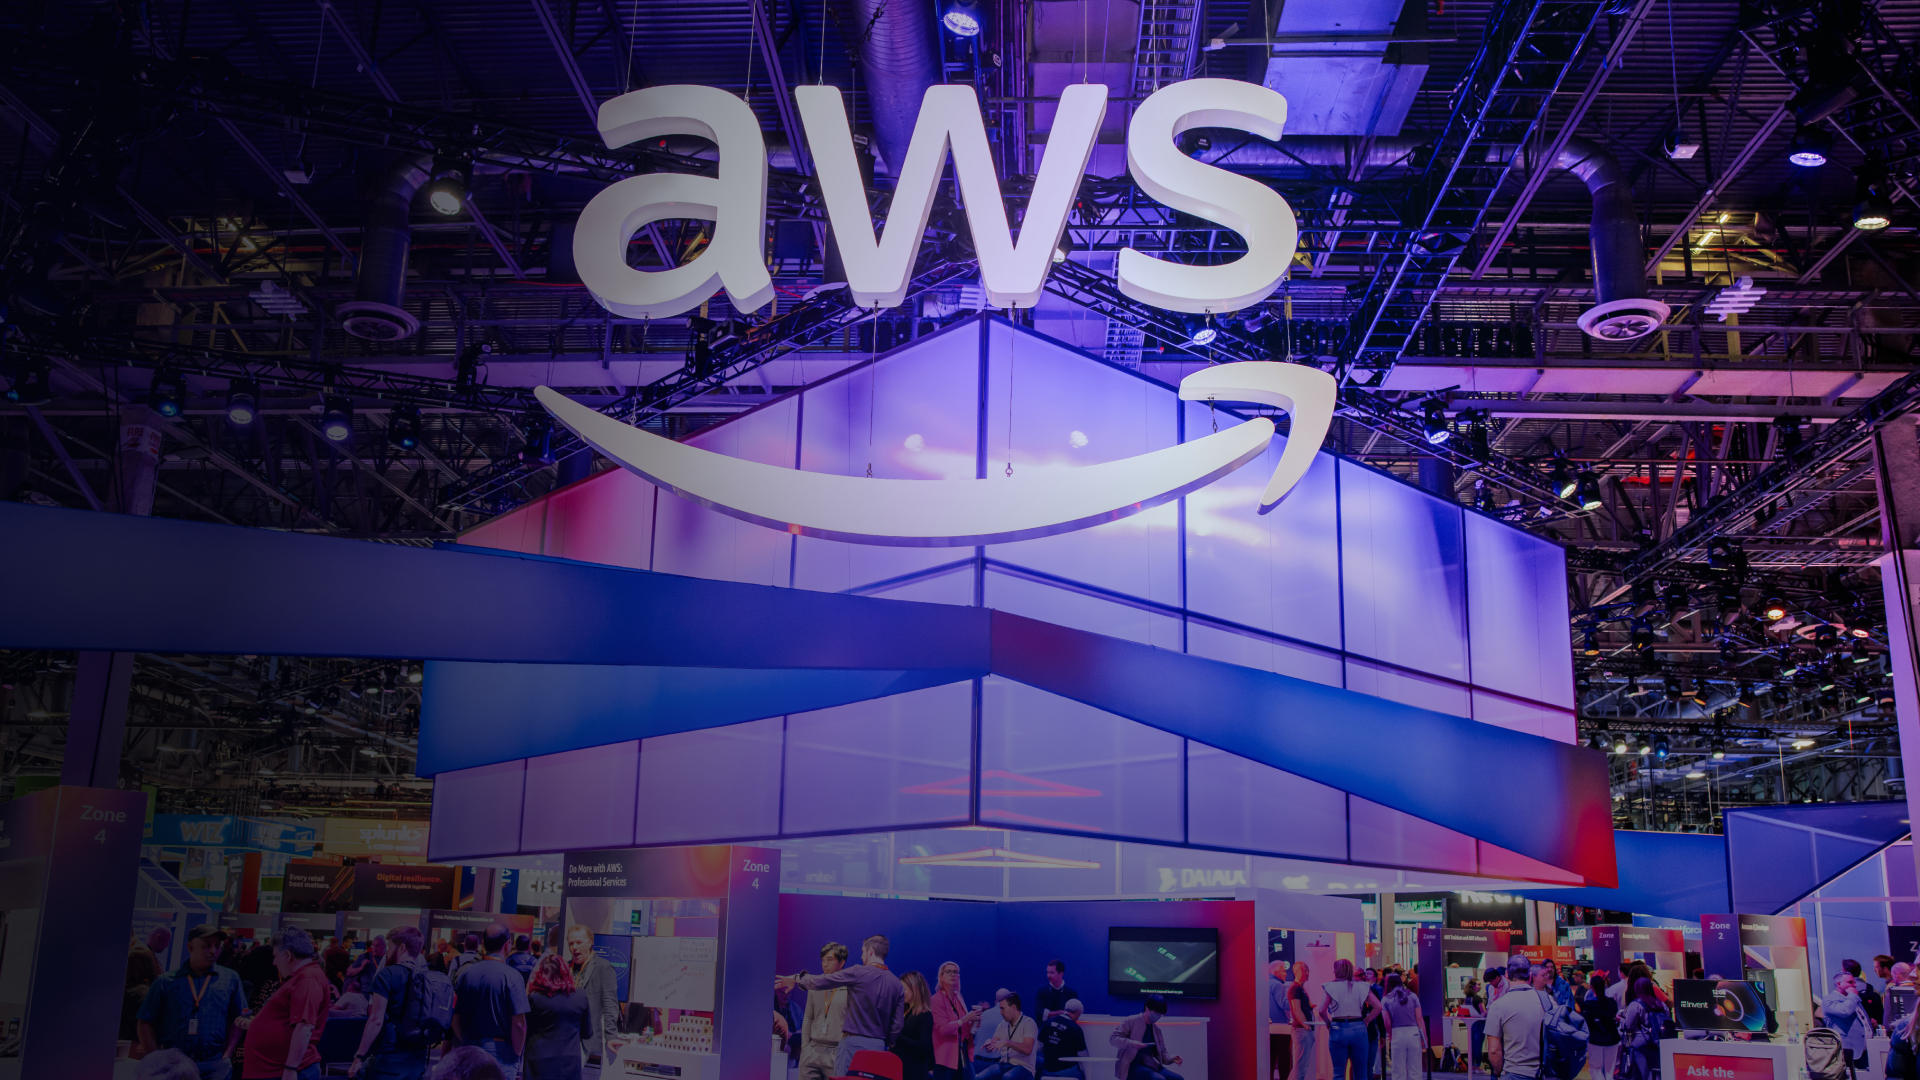
AWS booth at a conference or trade show featuring the iconic AWS logo and smile design suspended above a multi-level exhibition space with purple and blue gradient lighting, surrounded by attendees exploring various demo stations.

Builders Loft

Located at the south end of the strip in Mandalay Bay, the Builders Loft offers a collaborative workspace with dedicated co-working spaces and meetup zones. Enjoy coffee, snacks, SWAG, and daily tech challenges for a chance to win AWS credits. Kiro experts will be at the builders loft Monday-Thursday:

  • 8:00 AM – 12:00 PM: Co-working space for one-on-one consultations
  • 12:00 PM – 1:00 PM: Daily meetup in the meetup space
  • 4:50 PM – 5:00 PM: Q&A in the whiteboard section

Isometric 3D rendering of an AWS re:Invent expo floor layout featuring purple and pink branded kiosks, blue seating areas with round tables, interactive display stations, and workspace zones in a modern conference environment.

Hands-On Challenges

Kiro’s Labyrinth

Stop by the Kiro kiosk in the Venetian Expo to participate in Kiro’s Labyrinth, a coding challenge where you’ll help Kiro escape from a spooky Halloween maze and win prizes. The Kiro code champions will be crowned in DVT221 at Mandalay Bay on Thursday at 11:30 AM.

Atmospheric 3D render of a medieval dungeon or castle interior with dramatic red and orange lighting from wall-mounted torches, featuring stone archways, staircases, cobblestone floors, and blue accent lighting creating a moody gaming environment.

Kiroween Hackathon

Build something wicked for Kiroween, the annual hackathon that started on Halloween and ends on Friday, December 5th—the last day of re:Invent. Need help? Visit us at in the Builder Loft in Mandalay Bay: Monday-Friday, 8:30 AM – 12:00 PM or the Developer Pavilion in Venetian whenever the Expo is open.

Purple banner with "KIROWEEN" text in white, flanked by three ghost characters including the Kiro ghost mascot, a mummy ghost, and a skeleton ghost, creating aHalloween-themed branding element.

Conclusion

Make the most of your re:Invent experience by attending these sessions, connecting with experts at the AWS Village and Builders Loft, and participating in hands-on challenges. Whether you’re interested in CI/CD, infrastructure as code, AI-powered development, or just want to network with fellow builders, the Developer Tools track has something for everyone. See you in Vegas!

Multi-Cloud Code Deployments using Amazon Q Developer with Echo3D

Post Syndicated from Kevon Mayers original https://aws.amazon.com/blogs/devops/multi-cloud-code-deployments-using-amazon-q-developer-with-echo3d/

Banner showing echo3D logo and Amazon Q Developer logo

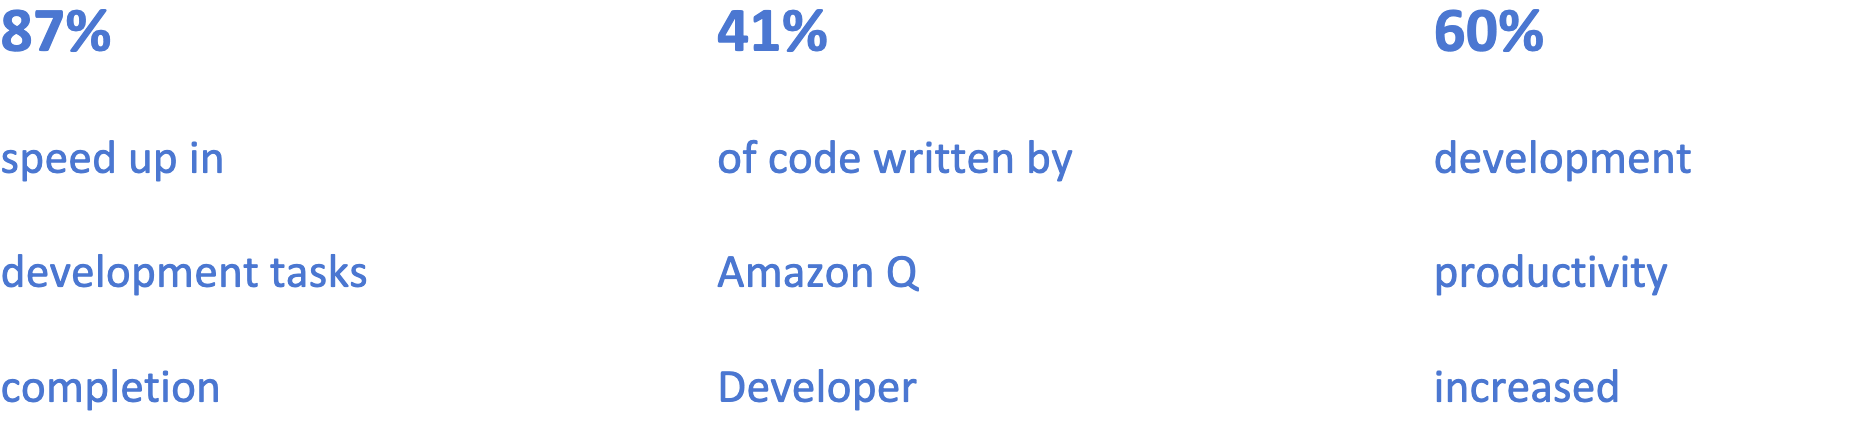
Image showing 87& speed up in development tasks completion, 41% of code written by Amazon Q Developer, and 60% development productivity increasedn

Overview

Founded in 2018, echo3D built a revolutionary 3D digital asset management (DAM) platform to address the surging demand for immersive content across industries. The company’s platform enables enterprises to seamlessly store, secure, optimize, and share 3D content, serving over 200,000 professionals across energy, healthcare, gaming, retail, and beyond.

echo3D’s platform has become the go-to solution for managing complex 3D assets at scale, supporting major enterprises across multiple sectors. With their technology operating within clients’ own AWS accounts, echo3D delivers critical infrastructure that powers real-time 3D content management for organizations worldwide.

As customer demand grew, echo3D faced increasing pressure to maintain rapid innovation while ensuring stable multi-cloud deployments. With a streamlined development team managing expanding cross-platform requirements, the company needed an efficient solution to accelerate their build and debug processes. This led them to explore Amazon Q Developer as a way to enhance their development capabilities and meet growing market demands.

Opportunity | Building for a Multi-Cloud Reality through Amazon Q Developer

echo3D specializes in 3D digital asset management, with a critical focus on multi-cloud deployments to serve their diverse enterprise client base. The company’s commitment to cross-platform functionality isn’t optional—it’s fundamental to their business model, with many clients specifically requiring AWS compatibility.

The company’s existing cloud infrastructure needed to support seamless migrations while maintaining robust performance across different environments. “For many of our clients, AWS is the ultimate destination,” explains Ben Pedazur, CTO at echo3D. “Amazon Q Developer has proven to be an indispensable guide for these migrations, both for our infrastructure and for the solutions we build for customers.”

After evaluating various solutions, echo3D identified Amazon Q Developer as their key tool for standardizing cross-platform development. “We needed a solution that could generate consistent code across different cloud environments while resolving platform-specific challenges,” notes Pedazur. This capability became particularly crucial during a recent customer migration project, which served as a perfect test case for Amazon Q Developer’s capabilities.

Solution | Streamlining the Journey to AWS with Amazon Q Developer

To streamline their cloud migration process, echo3D implemented Amazon Q Developer across their entire development workflow. The team utilized Amazon Q Developer to handle a critical migration from Azure Cosmos DB to Amazon DynamoDB, leveraging the AI assistant to generate comprehensive migration blueprints that included code modifications, configuration changes, and testing strategies.

Developers used detailed prompts to generate migration plans and receive context-aware guidance throughout the process. Amazon Q Developer provided not just code snippets, but complete architectural solutions that considered both the source and target platforms. During implementation, the team integrated Amazon Q Developer directly into their workflow, receiving real-time suggestions for code optimization and platform-specific adjustments.

The impact of Amazon Q Developer was immediate and measurable, with 41% of the new codebase being generated or auto-completed by the tool. “Amazon Q Developer has transformed our migration efficiency,” says Pedazur. “Our development time for cloud migrations has decreased by 87%, while significantly improving code quality.”

Amazon Q Developer assists throughout the entire development lifecycle, generating test cases, deployment scripts, and documentation. This comprehensive support has led to remarkable improvements: platform-specific bugs decreased by 75%, deployment success rates reached 99.8% across multiple clouds, and code review cycles shortened by 60%.

Beyond code generation, echo3D uses Amazon Q Developer to enhance team collaboration and knowledge sharing. The tool has cut onboarding time for new engineers in half, reducing it from four weeks to two weeks. Support tickets related to deployment errors have dropped by 68%, indicating improved code stability and reliability.

The new multi-cloud infrastructure, built with AWS services including DynamoDB, enables echo3D to scale efficiently while maintaining high performance across different cloud environments. The combination of Amazon Q Developer and AWS services has empowered echo3D to accelerate their development cycle while ensuring consistent quality across platforms.

“Amazon Q Developer isn’t just about coding faster—it’s about building better,” explains Pedazur. “We’ve seen improvements across every metric, from development speed to code quality, allowing our team to focus on innovation rather than troubleshooting.”

Outcome | Reimagining Development Through AI-Powered Workflows

With Amazon Q Developer, echo3D plans to further leverage Amazon Q Developer across their product lifecycle, from rapid prototyping to ongoing code maintenance and enhancement.

“Amazon Q Developer has revolutionized our approach to multi-cloud development,” says Pedazur. “It’s not just about automating tasks; it’s about reimagining our entire workflow. We’re now able to prototype, test, and deploy across cloud platforms with unprecedented speed and accuracy.”

Authors

Headshot of Lilly McDermott, Account Manager, AWS

Lilly McDermott

Lilly McDermott is an AWS account manager specializing in supporting gaming companies and game tech. As a trusted advisor, she guides customers through their cloud journey, helping them implement scalable solutions that drive innovation and growth in their games and services. Lilly is dedicated to guiding her customers in transforming their creative ideas into executable plans, empowering them to thrive in the competitive gaming market.

Headshot of Kevon Mayers, Infrastructure as Code Focus Area Lead and Games Solutions Architect, AWS

Kevon Mayers

Kevon Mayers is a Games Solutions Architect at AWS and is the Infrastructure as Code (IaC) Focus Area Lead for the NextGen Developer Experience Technical Field Community at AWS. Kevon is a Core Contributor for Terraform and has led multiple Terraform initiatives within AWS. Prior to joining AWS, he was working as a DevOps engineer and developer, and before that was working with the GRAMMYs/The Recording Academy as a studio manager, music producer, and audio engineer. He also owns a professional production company, MM Productions.

Headshot of Ben Pedazur, echo3D CTO

Ben Pedazur

Ben Pedazur (CTO at echo3D) holds a MSc in Electrical Engineering from Tel Aviv University specializing in computer vision and network communication, a BSc in Electrical Engineering from Afeka Academic College of Engineering specializing in image processing, is a former engineering manager at Cisco Systems, founder of an AR+Drones startup, and algorithm engineer at AdiMap. Ben is skilled in agile leadership, engineering management, and product research & development.

Headshot of Alon Grinshpoon, echo3D CEO

Alon Grinshpoon

Alon Grinshpoon (CEO at echo3D) holds MS in Computer Science from Columbia University specializing in 3D/AR/VR and human-computer interaction (HCI), BS in Computer Science and Electrical Engineering specializing in cloud technology, former NVIDIA engineer, published 3D UI researcher, a frequent speaker at CES, SXSW, Augmented World Expo (AWE), NYVR, Slush, and more. Alon has published papers in top engineering journals such as SIGGRAPH 2018 Emerging Technologies and IEEE Conference on Virtual Reality and 3D User Interfaces (VR) on AR system design and 3D interaction techniques in AR.

Accelerating AWS Infrastructure Deployment: A Practical Guide to Console-to-Code

Post Syndicated from Damola Oluyemo original https://aws.amazon.com/blogs/devops/accelerating-aws-infrastructure-deployment-a-practical-guide-to-console-to-code/

In today’s cloud-first environment, Infrastructure as Code (IaC) has become crucial for managing cloud resources effectively. However, organizations often face significant challenges in adopting IaC practices, including steep learning curves, complex syntax requirements, and difficulty translating manual operations into code.  Amazon Q Developer‘s Console-to-Code feature addresses these challenges by providing an intuitive bridge between manual AWS Console operations and infrastructure as code. This innovative solution helps organizations accelerate their automation journey while maintaining consistency and reliability in AWS deployments.

Understanding Amazon Q Developer and Console-to-Code

Console-to-Code is a feature of Amazon Q Developer that helps automate AWS infrastructure by recording manual actions performed in the AWS Management Console and converting them into infrastructure-as-code (IaC). It leverages generative AI to generate automation-ready code, allowing users to transition from manual operations to repeatable deployments effortlessly. Console-to-Code provides multi-language support, offering code generation in AWS Cloud Development Kit (CDK) formats such as Java, Python, and TypeScript, as well as AWS CloudFormation in JSON and YAML formats.

Console-to-Code records your console actions, then uses generative AI to suggest code in your preferred language and format.

In this blog post, we’ll explore how Console-to-Code can help you:

  1. Transform manual console actions into reusable infrastructure code
  2. Improve operational efficiency and reduce human error
  3. Accelerate the transition from manual to automated deployments

Supported AWS Services

Console-to-Code currently supports automation for several essential AWS services. These include Amazon EC2, which allows for the provisioning and management of virtual machines; Amazon VPC, which enables configuration of networking components such as subnets, route tables, and gateways; and Amazon RDS, which facilitates the management of database instances, configurations, and scaling options

Potential Use Cases:

Now that we’ve covered the basics of Console-to-Code and its supported services, let’s explore some potential use cases for this feature.

DevOps and Agile Development

In the fast-paced world of DevOps and agile development, Console-to-Code enables teams to rapidly prototype and iterate on infrastructure configurations. The ability to quickly create and replicate consistent environments across development, staging, and production stages ensures infrastructure reliability while maintaining agile velocity.

Compliance-Focused Industries

Organizations in regulated industries benefit from Console-to-Code’s systematic approach to implementing and maintaining compliant infrastructure. By recording proven, compliant configurations, organizations ensure that all subsequent deployments maintain the same level of security and compliance, creating an automatic audit trail for regulatory requirements.

Step-by-Step Guide to Using Console-to-Code

Follow these steps to automate AWS services using Amazon Q Developer’s Console-to-Code feature:

Prerequisites

Before getting started with Amazon Q Developer’s Console-to-Code feature, ensure you have the following:

  • Service Access:
    • AWS Management Console access
    • Access and permissions to supported AWS services such as: Amazon EC2, Amazon VPC, and Amazon RDS
  • Required Permissions:
    • The q:GenerateCodeFromCommands permission for Amazon Q Developer to use Console-to-Code (added by default, no additional requirement from the user)
  • Subscription Tiers:

Free Tier:

    • No fixed monthly limit for recording console actions
    • No fixed monthly limit for generating CLI commands
    • Monthly limit applies to AWS CDK and CloudFormation code generation

Pro Tier:

    • Requires IAM Identity Center authentication
    • IAM Identity Center identity must be subscribed to Amazon Q Developer Pro
    • No fixed monthly limit for AWS CDK or CloudFormation code generation

For this demonstration the Free Tier would suffice.

  1. Supported Code Formats:

Console-to-Code can generate infrastructure-as-code in the following formats:

  • AWS CDK: Java, Python, and TypeScript
  • AWS CloudFormation: JSON and YAML

Getting Started

Step 1: Start Recording

To start recording with Console-to-Code, follow these steps:

  1. Sign in to the AWS Management Console.
  2. Navigate to the console of one of the supported services (Amazon VPC, Amazon RDS, or Amazon EC2)
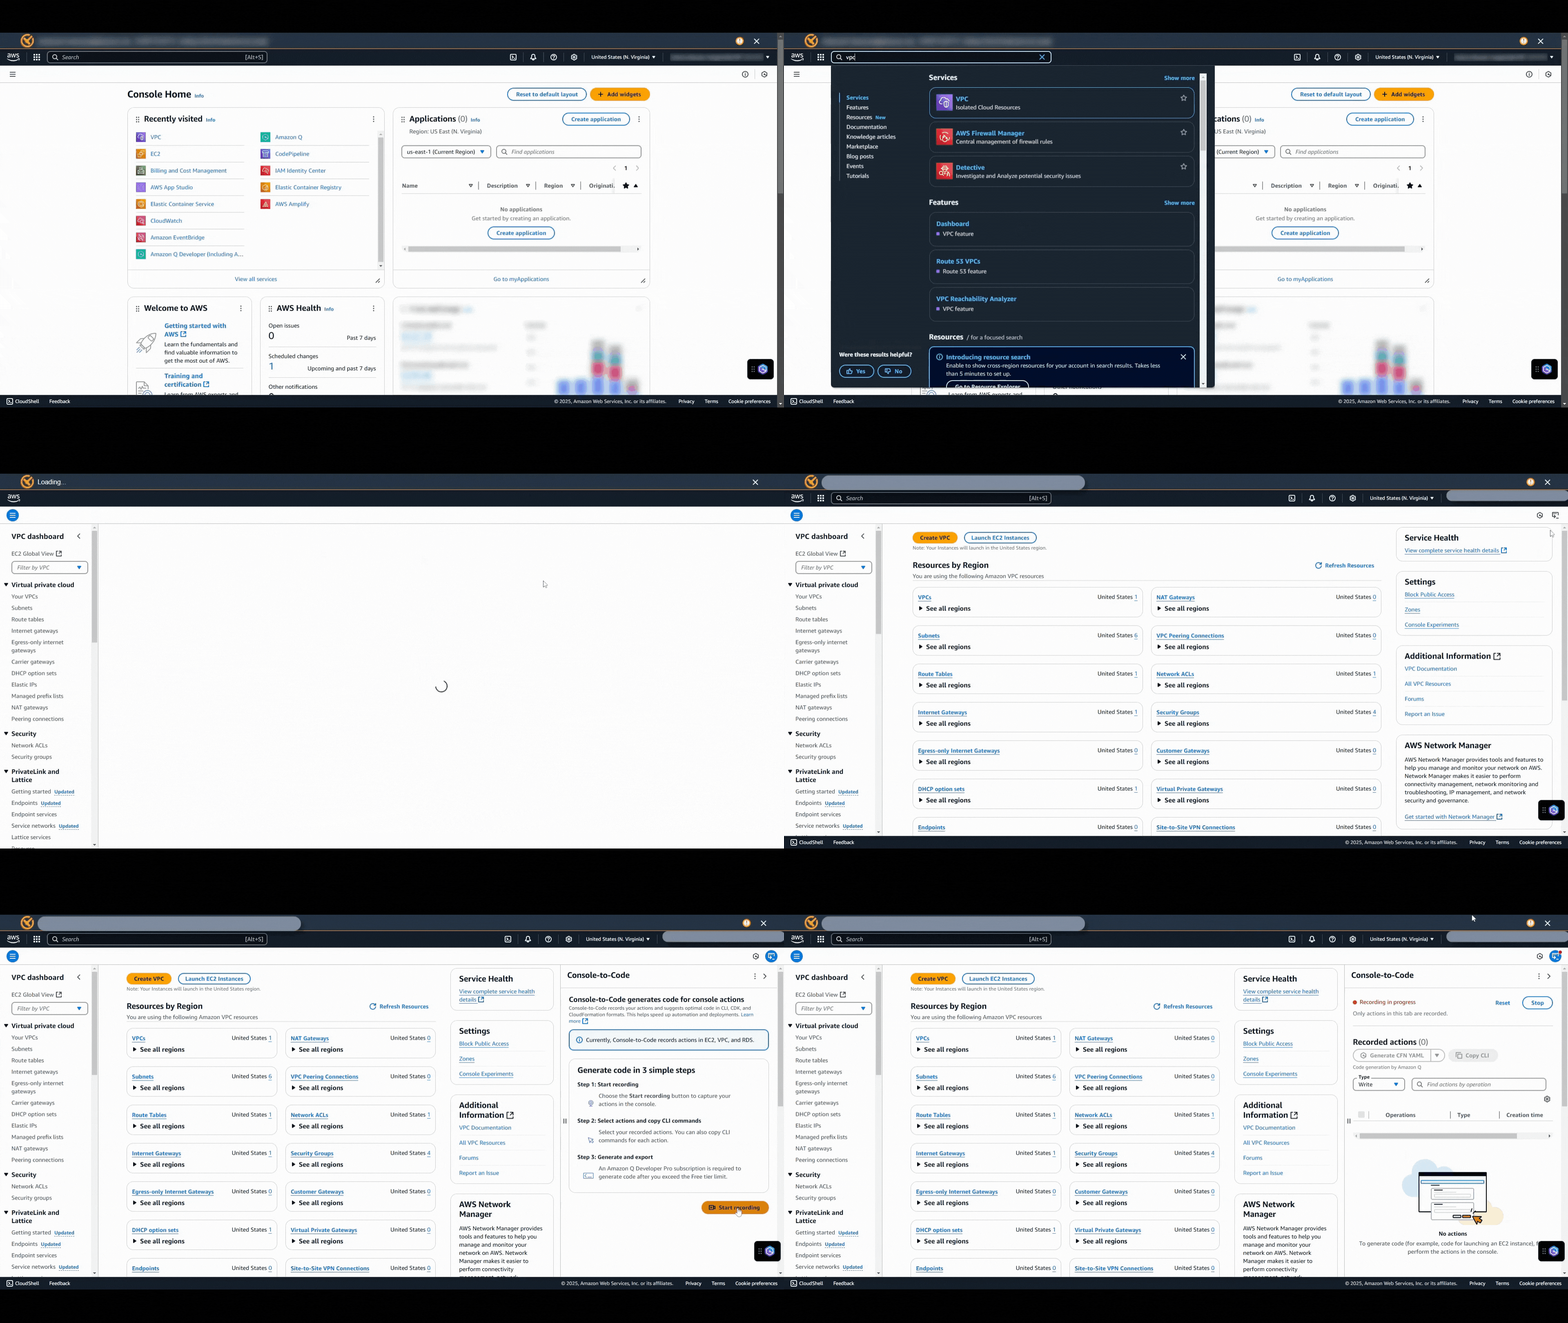
  3. On the right edge of the browser window, choose the Console-to-Code icon.
  4. Click Start recording.

Note: While recording actions is free, you will still be charged for any AWS resources created during the recording process.

This gif shows the user opening the Console-to-Code panel and starting a recording session in the VPC console

Figure 1: Opening the Console-to-Code panel and starting a recording session in the VPC console.

Step 2: Perform Actions in AWS Console

  1. Go to the AWS service (e.g., EC2, S3) you want to automate.
  2. Perform desired actions such as launching an EC2 instance or creating an S3 bucket.

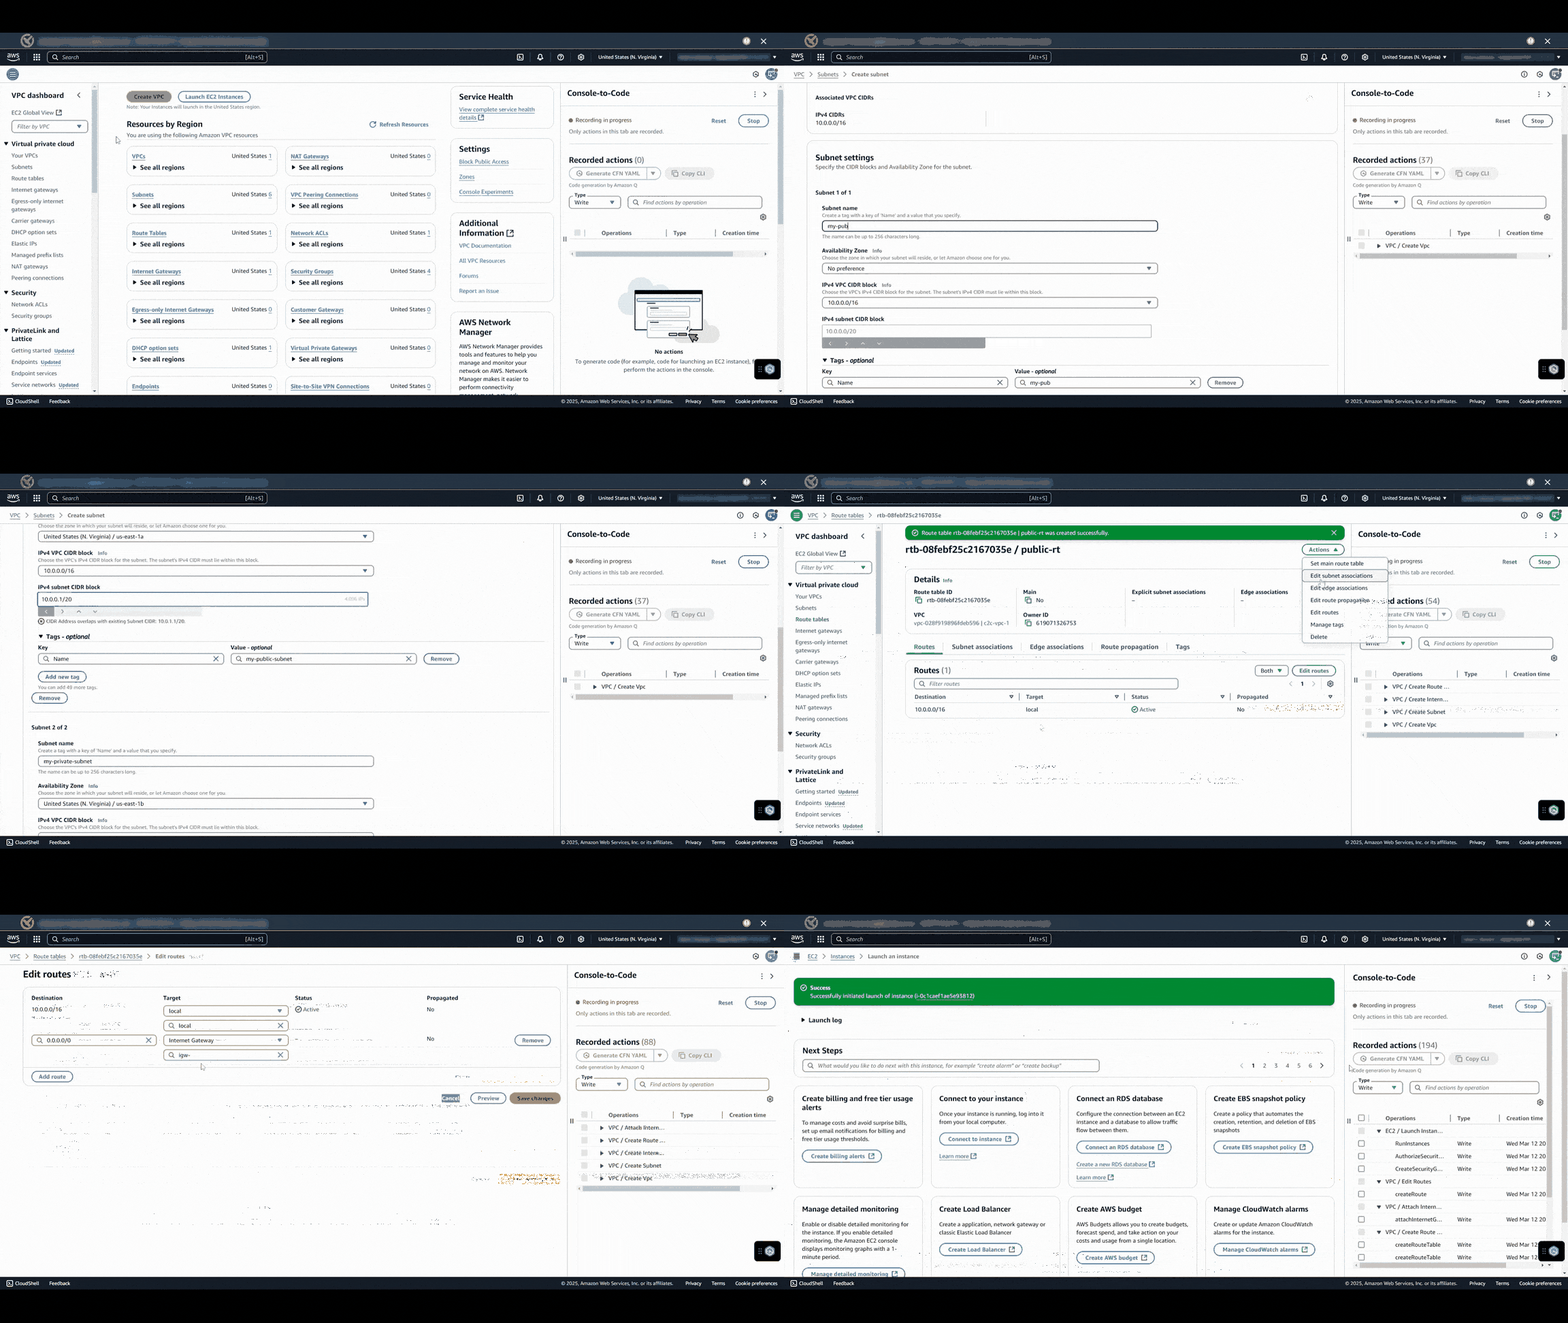
This gif demonstrates creating and configuring resources while Console-to-Code records all actions in real-time

Figure 2: Demonstration of creating and configuring resources while Console-to-Code records all actions in real-time.

The Console-to-Code panel will record all of these actions as you perform them. You can move between different service consoles (such as VPC and EC2) during a single recording session, allowing you to create a comprehensive recording that involves actions across multiple supported services

Step 3: Generate Code & Stop Recording

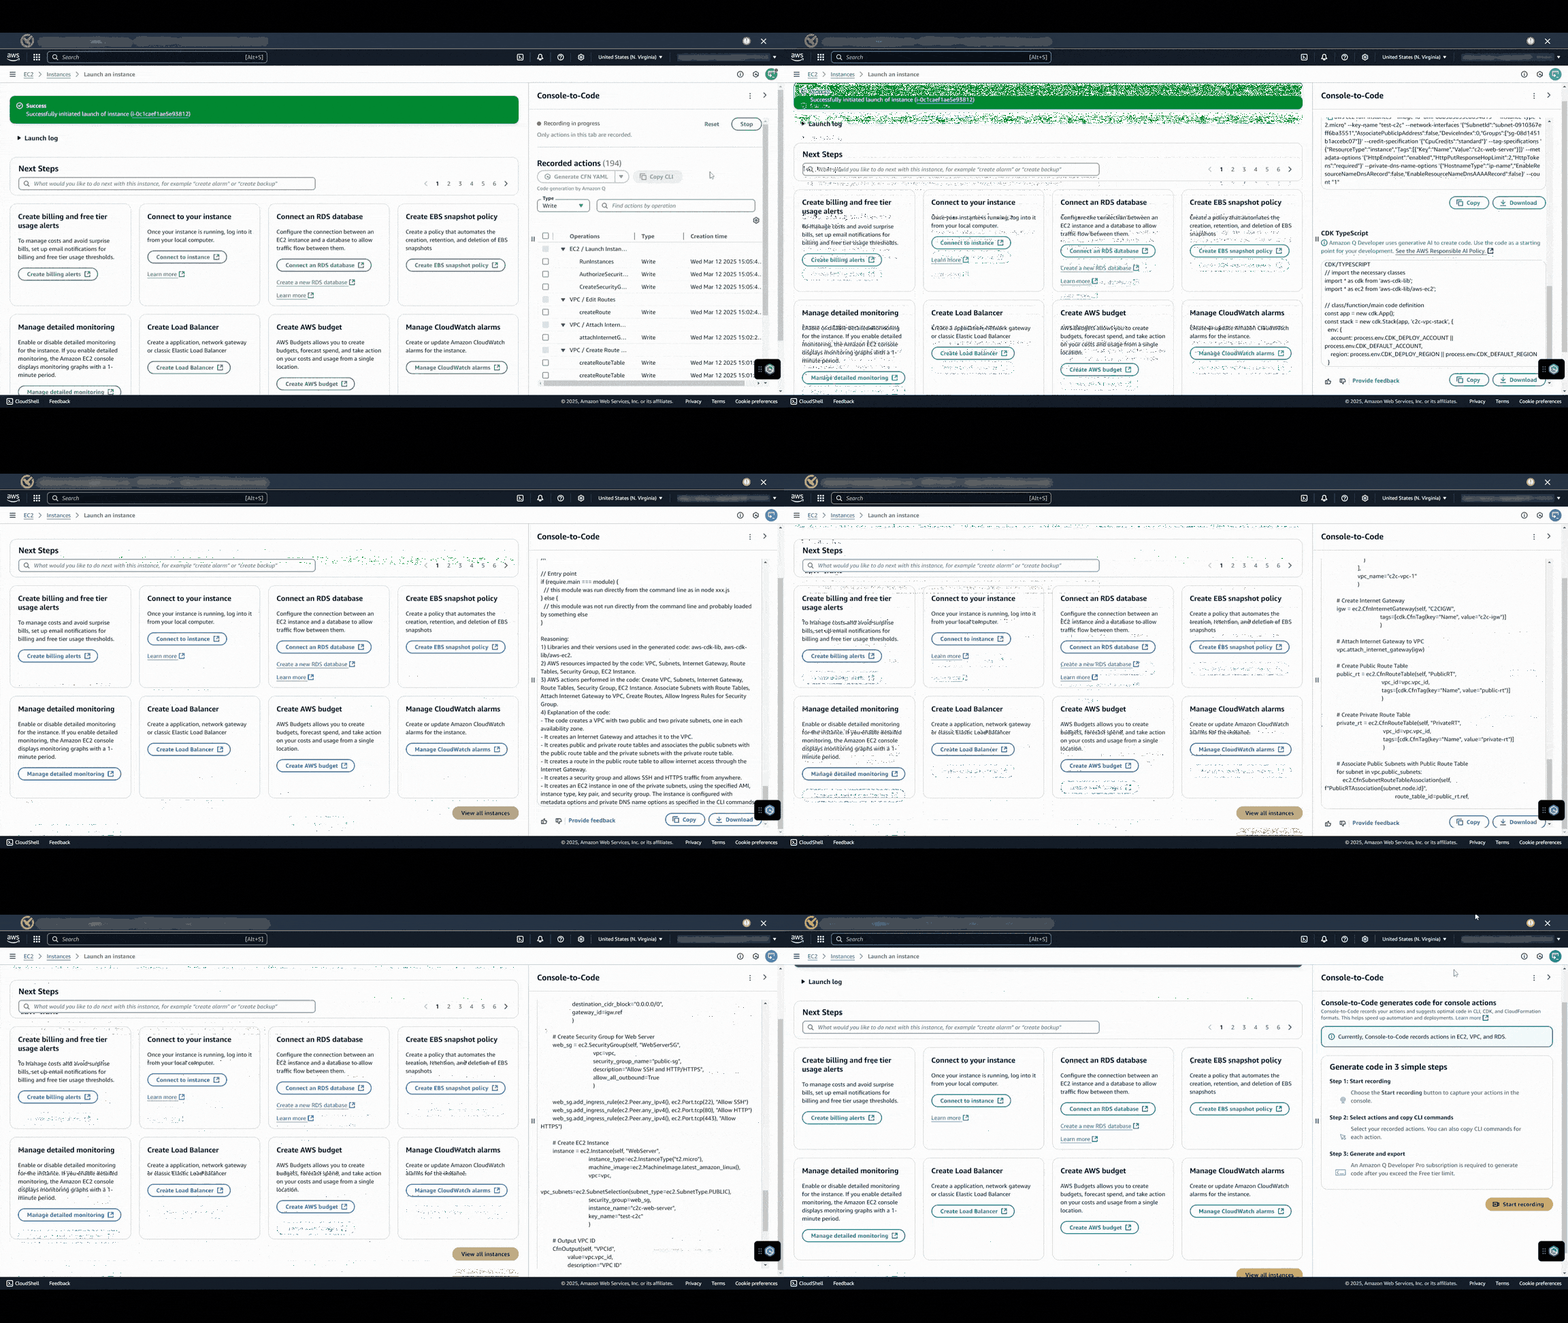
  1. In the Console-to-Code panel, review your recorded actions. You can filter the recorded actions using the dropdown, search box, or filter widget at the top of the Console-to-Code panel.
  2. Select the actions that you want to convert into code. Only the actions with checked boxes will be used in the following steps.
  3. Indicate the type of code that you want to generate. From the reverse dropdown menu at the lower right of the Console-to-Code panel, select the language and (if applicable) format of the code to be generated.
  4. Choose Generate chosen language. The generated code will appear, along with the equivalent CLI commands.

This gif shows the user stopping the recording, selecting desired actions, and generating infrastructure code in your preferred language through the Console-to-Code panel

Figure 3: Stopping the recording, selecting desired actions, and generating infrastructure code in your preferred language through the Console-to-Code panel.

Benefits of Using Console-to-Code

The implementation of Console-to-Code offers numerous advantages to AWS users. It increases time efficiency by reducing manual effort on repetitive console tasks and ensures consistency and compliance with organizational security and governance policies. The tool minimizes human errors through the generation of syntactically accurate infrastructure code, enables rapid prototyping for quick transitions from experimentation to production, and serves as a valuable learning resource for new AWS users to understand infrastructure-as-code best practices

Best Practices

Planning and Organization

Success with Console-to-Code requires thorough planning and organization. Document your infrastructure requirements comprehensively, establish clear naming conventions and tagging strategies, and maintain a systematic approach to version control for generated code.

Maintenance and Updates

Regular review and testing of generated code ensure continued reliability and efficiency. Implement a code review process for infrastructure changes and maintain comprehensive documentation of your deployment patterns and configurations.

Troubleshooting Guidelines

Common issues during recording sessions can often be resolved by using a single browser tab and ensuring proper permissions are in place. For code generation issues, validate service compatibility and review action sequences carefully. Clear browser cache and verify IAM permissions when encountering persistent issues.

Conclusion

Amazon Q Developer’s Console-to-Code represents a significant advancement in infrastructure automation, making IaC accessible to teams of all skill levels. By following the strategies and best practices outlined in this guide, organizations can effectively leverage this tool to accelerate their cloud journey while maintaining security, compliance, and operational excellence.

The future of infrastructure automation looks promising with tools like Console-to-Code, enabling organizations to focus more on innovation and less on manual operations. As AWS continues to enhance this feature, users can expect even more capabilities and integrations to support their infrastructure automation needs.

Ready to accelerate your infrastructure automation journey? Start exploring Console-to-Code today by signing into your AWS Management Console and recording your first infrastructure deployment. For additional resources and documentation, visit the AWS Console-to-Code documentation page.

About the Authors:

Adeogo Olajide

Adeogo is a Solutions Architect at AWS, where he supports GovTech customers and other public sector customers in their cloud transformation journey. He specializes in designing secure, scalable, and compliant architectures that help public sector organizations modernize their digital services. Outside of work, he enjoys playing and watching soccer.

Jehu Gray

Jehu Gray is a Prototyping Architect at Amazon Web Services where he helps customers design solutions that fits their needs. He enjoys exploring what’s possible with IaC.

Damola Oluyemo

Damola Oluyemo is a Solutions Architect at Amazon Web Services focused on Enterprise customers. He helps customers design cloud solutions while exploring the potential of Infrastructure as Code and generative AI in software development.

Abiola Olanrewaju

Abiola Olanrewaju is a Solutions Architect at AWS, specializing in helping Financial services customers implement scalable solutions that drive business outcomes. He has a keen interest in Data Analytics, Security and Generative AI.

Ibraheem Ojelade

Ibraheem Ojelade is a Solutions Architect at Amazon Web Services, focused on supporting Independent Software Vendors (ISVs). He partners with customers to accelerate their cloud adoption, optimize performance, and strengthen security. With a strong background in cybersecurity and cloud solutions, he helps ISVs design scalable architectures while exploring emerging technologies to drive innovation and growth.

Multi Agent Collaboration with Strands

Post Syndicated from Aaron Sempf original https://aws.amazon.com/blogs/devops/multi-agent-collaboration-with-strands/

In the evolving landscape of autonomous systems, multi-agent collaboration is becoming not only feasible but necessary. As agents gain more capabilities, like advanced reasoning, adaptation, and tool use, the challenge shifts from individual performance to effective coordination. The question is no longer “can an agent solve a task?” but “how do we organize execution across many intelligent agents?”

A foundational step toward answering this came with the Supervisor pattern, introduced in our article on creating asynchronous AI agents with Amazon Bedrock. The Supervisor addresses the first generation of coordination challenges by acting as a centralized orchestrator, monitoring and delegating tasks across agents in a structured, serverless workflow. It provides asynchronous orchestration, fallback handling, and state tracking across loosely coupled agents, giving organizations a reliable way to move from single-agent prototypes to multi-agent systems.

Yet as agentic systems scale and become more dynamic, the limitations of static supervision become clear. The Supervisor model assumes a relatively stable set of agents and predictable workflows; but modern systems face constantly shifting tasks, emergent capabilities, and the need for adaptive coordination. This is where the Arbiter pattern emerges as the natural evolution: a next-generation supervisory model that extends the Supervisor with dynamic agent generation, semantic task routing, and blackboard-model-based coordination. By addressing the unpredictability and fluidity of large, evolving agent ecosystems, the Arbiter pattern enables systems not only to manage complexity but to thrive in it.

The Arbiter pattern builds directly on this by adding three key capabilities:

  1. Semantic Capability Matching: Instead of only assigning known tasks to known agents, the Arbiter reasons about what kind of agent should exist for a task—even if that agent doesn’t exist yet.
  2. Delegated Agent Creation: If no suitable agent is found, the Arbiter escalates the request to a Fabricator agent that dynamically generates a task-specific agent on demand. This moves beyond delegation to true adaptive generation.
  3. Task Planning + Contextual Memory: Building on the Supervisors task coordination capability, Arbiter decomposes complex inputs into structured task plans, and uses contextual memory to track execution, retry logic, and agent performance.

In short, the Arbiter transforms static orchestration into adaptive coordination.

The Blackboard Model Revisited

To enable loose, extensible collaboration across agents, the Arbiter Pattern incorporates principles from the blackboard model – a classic architecture from distributed AI. In this model, agents contribute opportunistically to a shared data space (the “blackboard”), reacting to changes and collectively solving problems.

Reference: See “The Blackboard Model of Control” (Hayes-Roth et al.), and early applications like Hearsay-II for foundational research.

In our extended Arbiter Pattern, the blackboard becomes a semantic event substrate. Agents, including the Arbiter, publish and consume task-relevant state, enabling loosely coupled, event-driven collaboration.

How It Works

When an event enters the system, the Arbiter takes on the supervisory role but extends it with greater dynamism and adaptability. Like the Supervisor pattern, it begins by interpreting the event and identifying the required objectives and sub-tasks. It then performs a capability assessment, using a local index or peer-published manifests, much like the Supervisor querying an Agents config table.

  1. Interpretation: The Arbiter uses LLM-based reasoning to extract task objectives and sub-tasks.
  2. Capability Assessment: It evaluates which agents can handle each sub-task using a local index or peer capability manifests.
  3. Delegation or Generation:
    • If a suitable agent exists, the task is routed accordingly.
    • If not, the Arbiter sends a generation request to the fabricator agent.
  4. Blackboard Coordination: All agents involved read/write to a shared semantic blackboard, contributing as needed based on observed task state.
  5. Reflection and Adaptation: Performance data is logged and used to inform future agent creation, adaptation, or deprecation.

Arbiter Pattern Architecture

Unlike the Supervisor, which maintains orchestration through a static config list, the Arbiter introduces a shared semantic blackboard that allows all participating agents to read, write, and coordinate based on evolving task state. This blackboard serves as a dynamic collaboration space, enabling mid-task adaptation and richer multi-agent coordination.

The following Diagram 1: Agentic AI Arbiter pattern implemented as a code example can be downloaded here

Architecture diagram of the Arbiter Pattern for Agentic AI. The diagram illustrates the components and flow of the pattern, showing how multiple AI agents interact with an arbiter to coordinate tasks and decision-making in a structured system

Diagram 1: Agentic AI Arbiter pattern

The following sequence describes the Arbiter pattern, according to the numbered steps in the diagram 1: Agentic AI Arbiter pattern

  1. Events entering the system trigger the Supervisor function
  2. Supervisor queries Agents Config table for agent capabilities
  3. Supervisor uses Agents config list as context to plan orchestration of tasks

Option: New Agent:

If no capable agent is found, the Arbiter goes further than the basic supervisor pattern: it issues a generation request to a fabricator agent, which synthesizes new worker code, stores it for runtime access, and updates the capability registry so the agentic system can immediately benefit from the new skill.

  1. Task cannot be completed, request create new capability
  2. Request to fabricate triggers Fabrication agent instance
  3. Fabrication agent queries resources register for available tools (capabilities)
  4. Fabricator generates worker agent code
  5. Worker agent code stored in bucket for runtime access
  6. New worker added to Agents config list with agent capabilities description
  7. Result of fabrication posted to message bus

Repeat steps 1, 2 & 3

Option: Orchestrate workflow:

If a suitable agent exists, the Arbiter orchestrates the workflow by invoking the appropriate worker agents, tracking progress and state as in the Supervisor model.

  1. Orchestration of tasks is stored for tracking end-to-end process
  2. Request to invoke worker agent, by name/id. Add workflow state for agent invocation.
  3. Request to invoke worker agent triggers worker agent wrapper instance
  4. Worker agent wrapper loads agent code
  5. Worker agent reasons and takes action
  6. Worker agent sends response to message bus
  7. Supervisor agent updates workflow state and tracks against orchestration

The Arbiter incorporates a reflection and adaptation loop: performance data from task execution is logged, analyzed, and fed back into the fabricator and coordination logic. This ensures that not only are tasks completed in the moment, but the system continuously adapts, retires underperforming agents, and evolves toward greater efficiency.

The Arbiter Agent: Event Orchestration Engine

The Supervisor Agent (Arbiter Agent) serves as the central coordinator component, managing complex event-driven workflows through intelligent task delegation.

Event Processing Workflow:

The Arbiter pattern follows a structured approach to handle incoming events

  1. Configuration Loading: Loads available agent configurations from Amazon DynamoDB via load_config_from_dynamodb()
  2. LLM Invocation: Invokes Amazon Bedrock LLM with event context and available tool specifications
  3. Decision Analysis: LLM analyzes the event and returns tool invocation decisions with parameters
  4. Task Dispatch: For each specified tool call:
    • Extracts tool name, input parameters, and tool use ID
    • Dispatches message to corresponding Amazon Simple Queue Service (SQS) queue via process_tool_call()
    • Maintains tool invocation list for workflow tracking

Workflow State Management:

The system maintains comprehensive state tracking throughout execution

  • Creates workflow tracking record in DynamoDB with create_workflow_tracking_record()
  • Initializes all invoked agents as incomplete
  • Associates unique request ID with orchestration instance
  • Persists orchestration state including conversation history and request mapping

Completion Coordination:

The Arbiter coordinates task completion through a systematic process

  1. Event Reception: Receives agent completion events via Amazon EventBridge
  2. Status Updates: Updates workflow tracking with update_workflow_tracking()
  3. Completion Check: Performs completion check across all tracked agents
  4. Result Aggregation: When all agents complete:
    • Aggregates results from DynamoDB data field
    • Appends tool results to conversation as user messages
    • Re-invokes orchestration with updated context
  5. Continuation: Continues until LLM provides final response without tool calls

The Fabricator Agent: Dynamic Capability Generation

The Fabricator Agent implements just-in-time agent development using the Strands agents framework, creating new capabilities when required functionality doesn’t exist in the system.

Agent Development Architecture:

The Fabricator operates as a specialized Strands Agent with specific characteristics

  • Implemented as a Strands Agent with specialized system prompt for code generation
  • Triggered by “New worker agent” events from the Arbiter
  • Receives capability requirements through prompt augmentation with agent directive
  • System prompt includes:
    • Strands Agent implementation examples
    • Complete catalog of available Strands Tools
    • Code generation patterns and conventions
    • Standardized handler() function requirements

Code Generation Process:

The agent follows a structured development workflow

  1. Requirement Analysis: LLM analyzes capability requirements and generates Python implementation
  2. Tool Selection: Prioritizes use of existing Strands Tools over custom @tool implementations
  3. Code Structure: Creates agents following standardized patterns:
    • Bedrock model initialization with models.BedrockModel()
    • Agent instantiation with appropriate tool selection
    • Standardized handler() function interface
    • Event-driven completion signaling
  4. File Creation: Writes generated code to /tmp/ directory for immediate availability

Capability Registration Pipeline:

New capabilities are registered through a multi-step process

  1. File Storage: File upload to Amazon Simple Storage Service (S3) via upload_file_to_s3() tool
  2. Metadata Registration: Registration in DynamoDB via store_agent_config_dynamo():
    • toolId: Unique capability identifier
    • filename: S3 object reference
    • schema: OpenAPI specification for LLM tool calling
    • description: Human-readable capability documentation
    • action: SQS queue routing configuration for Generic Wrapper
  3. Completion Notification: Completion event publication to Arbiter via complete_task() tool

Testing Considerations:

The original implementation revealed important insights about testing approaches

  • Previous Approach: Agent testing within the Fabricator resulted in:
    • Unstructured testing leading to false negatives
    • Overzealous optimization of generated agents
  • Recommendation: Separate testing agent with standardized harness for validation feedback

The Generic Wrapper: Dynamic Execution Runtime

The Generic Wrapper implements a hot-loading pattern that enables unlimited agent creation without infrastructure scaling, providing a universal execution environment for Fabricator-generated agents.

This hot-loading approach is critical because it decouples capability growth from infrastructure scaling. Instead of provisioning and maintaining new infrastructure components for every new agent, which could be dozens or even hundreds of agents, the system reuses a single execution wrapper that can dynamically load and execute arbitrary agent code.

This not only makes agent creation effectively limitless but also ensures infrastructure efficiency, cost optimization, and simplified operations, allowing the Arbiter and Fabricator to evolve system capabilities without operational bottlenecks.

In the AWS Samples code, found here, the Hot-loading handler is implemented as am AWS Lambda function, represented in the following code snippet:

def process_event(event, context):
    orchestration_id = event["orchestration_id"]
    tool_use_id = event["tool_use_id"]
    request = event["tool_input"]
    tool_name = event['node']

    # Based on the tool from the event, load the details from DDB
    tool = load_config_from_dynamodb(tool_name)
    config = tool['config']

    if isinstance(config, str):
        config = json.loads(config)

    file_name = config['filename']

    load_file_from_s3_into_tmp(os.environ["AGENT_BUCKET_NAME"], file_name)

    # Hot load the module from the tmp directory
    spec = importlib.util.spec_from_file_location("module.name", "/tmp/loaded_module.py")
    loaded_module = importlib.util.module_from_spec(spec)
    sys.modules["module.name"] = loaded_module
    spec.loader.exec_module(loaded_module)

    # Invoke the generic handler with whatever args were passed in by the Arbiter
    try:
        print("attempting to use module")
        response = loaded_module.handler(**request)
        print(f"response: {response}")
    except Exception as e:
        print(f"error running module: {e}")
        response = "The task could not be completed, this agent has issues, please ignore for now."

    # Finally. report back to the Arbiter. Handled by the wrapper. To avoid the Frabricator from attempting to code this part itself
    post_task_complete(response, tool_use_id, tool_name, orchestration_id)

Although this example is demonstrated through a lambda function, the Hot-Loading code can be executed in Amazon Bedrock AgentCore Runtime, or AWS native container services, such as Amazon Elastic Container Service (ECS) or Amazon Elastic Kubernetes Service (EKS)

Hot-Loading Architecture:

The wrapper implements several key architectural principles

  • Single infrastructure component handles execution of all dynamically created agents
  • Eliminates need for separate infrastructure provisioning per agent
  • Implements runtime code loading from S3 storage
  • Accepts latency trade-off for infrastructure efficiency in non-ultra-low-latency environment

Dynamic Loading Process:

The system follows a precise loading sequence

  1. Message Processing: Extracts agent identifier from incoming SQS message
  2. Configuration Retrieval: Queries DynamoDB for agent configuration via load_config_from_dynamodb()
  3. Code Download: Downloads agent implementation from S3 to /tmp/ directory
  4. Runtime Loading: Module loading using importlib.util:
    • spec_from_file_location() creates module specification
    • module_from_spec() instantiates module object
    • exec_module() performs actual code loading and execution

Execution Management:

The wrapper provides comprehensive execution oversight

  • Invokes standardized handler() function with provided parameters
  • Captures execution results and handles error conditions gracefully
  • Maintains execution isolation between different agent invocations
  • Implements resource cleanup after agent execution completion

Standardized Communication Protocol:

Communication follows strict standardization to ensure system reliability, which is critical in multi-agent environments where dozens or even hundreds of dynamically generated agents may interact. Without consistent message formats, routing rules, and completion signals, orchestration would become brittle, errors would propagate unpredictably, and debugging would be nearly impossible. Standardization guarantees that every agent, no matter when it was created, can interoperate seamlessly, enabling the Arbiter to maintain end-to-end visibility, traceability, and fault-tolerance across the entire system.

Event Handling Principles:

  • Event posting handled exclusively by Generic Wrapper, not individual agents
  • Ensures consistent event-driven communication patterns across all agents

Completion Event Structure:

  • orchestration_id: Workflow context linkage
  • tool_use_id: LLM tool invocation mapping
  • node: Agent identifier for tracking
  • data: Execution results or error information

Reliability Measures:

  • Publishes completion events to EventBridge for Arbiter processing
  • Guarantees workflow tracking receives completion signals regardless of execution outcome

Scalability Characteristics:

The hot-loading approach provides significant scalability benefits

  • Enables agent scaling creation without minimal infrastructure impact
  • S3 download latency acceptable within overall system performance profile
  • Single wrapper instance can execute multiple agent types
  • Memory and resource management handled at container level

Conclusion

The Arbiter Pattern represents a significant evolution beyond the Supervisor architecture, delivering the flexibility required for truly autonomous agentic systems. By introducing semantically rich, context-aware orchestration, it enables dynamic scalability, where agent capabilities grow in step with task demands. The architecture is resilient, redistributing or regenerating tasks when agents fail, and it achieves loose coupling by having agents interact through semantically meaningful events rather than rigid APIs. Most importantly, it embeds continuous adaptation through Arbiter-guided feedback loops, allowing systems to learn and evolve over time. This marks a shift from pre-programmed logic to generative, blackboard-model-based coordination, paving the way for decentralized, intelligent systems that can learn, adapt, and collaborate effectively at scale.

The system delivers several critical capabilities

  • Asynchronous Processing: SQS-based message passing for scalable execution
  • Persistent State Management (Short-term memory): DynamoDB-based workflow tracking
  • Scalability: Hot-loading architecture for unlimited agent creation
  • Intelligent Orchestration: LLM-driven task decomposition and sequencing
  • Self-Expanding Capabilities: Strands-based agent creation on demand
  • Standardized Communication: Reliable event-driven protocols

This architecture enables processing of arbitrary event types by dynamically creating necessary processing capabilities and coordinating their execution through LLM-driven workflow orchestration, while maintaining infrastructure efficiency through hot-loading patterns.


About the Authors

aaron sempfAaron Sempf is Next Gen Tech Lead for the AWS Partner Organization in Asia-Pacific and Japan. With over 20 years in distributed system engineering design and development, he focuses on solving for large scale complex integration and event driven systems. In his spare time, he can be found coding prototypes for autonomous robots, IoT devices, distributed solutions, and designing agentic architecture patterns for generative AI assisted business automation.

josh tothJoshua Toth is a Senior Prototyping Engineer with over a decade of experience in software engineering and distributed systems. He specializes in solving complex business challenges through technical prototypes, demonstrating the art of the possible. With deep expertise in proof of concept development, he focuses on bridging the gap between emerging technologies and practical business applications. In his spare time, he can be found developing next-generation interactive demonstrations and exploring cutting-edge technological innovations.

AWS Cloud Development Kit (CDK) Launches Refactor

Post Syndicated from Natalie White original https://aws.amazon.com/blogs/devops/aws-cloud-development-kit-cdk-launches-refactor/

We are excited to announce a new AWS Cloud Development Kit (CDK) feature that makes it easier and safer to refactor your infrastructure as code. CDK Refactor aims to preserve your AWS resources as you rename constructs, move resources between stacks, and reorganize your CDK applications – operations that previously risked resource replacement.

When writing infrastructure as code with the CDK, developers occasionally need to rename Constructs or move them between Stacks or directories. Whether they need to better organize their code, adhere to coding best practices, or take advantage of object-oriented programming patterns like class inheritance, these changes can be risky in environments with deployed resources, because they change the CDK-generated logical ID of those resources. During a CDK deploy, AWS CloudFormation interprets these changes as new resources, which often requires deletion of the existing resource and creation of a new resource with the new logical ID. For stateful resources, this could cause potential downtime and even data loss. To mitigate this effect of ID changes, developers had to stage their changes to create new resources, create a data or network migration plan, and then delete the old resources to prevent these refactoring effects. Sometimes, developers decide the risk of these changes outweigh the benefit of the refactor and choose not perform the refactor at all.

Today, developers can use the new CDK refactor command to detect, review, confirm, and safely apply refactored changes to their resources without resource replacement. This feature leverages the recently-launched AWS CloudFormation refactor feature, but the CDK automatically computes the mappings that CloudFormation needs to redefine the refactored resources, providing a layer of abstraction that allows developers to focus on code rather than resource configuration. Let’s walk through an example to demonstrate the benefits of this refactor capability.

Prerequisites

Along with the usual CDK prerequisites, if you bootstrapped your CDK project before this launch, you need to re-bootstrap your environment to obtain the new permissions associated with the CDK refactor capabilities before attempting your refactor.

Monolith to micro-service example

For this example, let’s say that we have a legacy CDK App that deploys a monolithic Stack with Amazon DynamoDB tables for users, products, and orders, and an AWS Lambda function that implements CRUD operations on all entities.

Architecture diagram of a monolithic application with an API Gateway, single Lambda function, and three DynamoDB tables for users, products, and orders. The application is contained in a single CDK Stack within the CDK App.

Monolithic application

function monolithApp() {
  const monolith = new CdkAppStack(app, monolithStackName, {env});
  const usersTable = makeTable(monolith, 'users');
  const productsTable = makeTable(monolith, 'products');
  const ordersTable = makeTable(monolith, 'orders');

  // We have a single Lambda function in our application
  const func = new Function(monolith, `MonolithFunction`, {
    code: Code.fromInline(`Some code that accesses all three tables`),
    runtime: Runtime.NODEJS_22_X,
    handler: 'index.handler',
  });

  usersTable.grantReadWriteData(func);
  productsTable.grantReadWriteData(func);
  ordersTable.grantReadWriteData(func);

  // This function creates a REST API, resources, methods, and links
  // everything together to the functions. Right now, we are passing
  // the same function in three places.
  makeApi(monolith, {
    usersFunction: func,
    productsFunction: func,
    ordersFunction: func,
  });
}

monolithApp();

We’ve been asked to adhere to Well Architected Framework best practices and break up the monolith into separate Lambda functions so they can scale independently. Because they’re so similar, we’re also going to create an inheritable Lambda class that we can reuse to improve readability and maintainability of the code, and avoid having to re-define Lambda configuration settings that are consistent across all of the functions.

Finally, the monolith uses only L1 CDK Constructs. To further abstract our code and take advantage of helper functions, we’re going to start using L2 CDK Constructs for DynamoDB, Lambda, and API Gateway. This change will allow the IAM Roles and permissions to be defined automatically, further simplifying our code.

Architecture diagram of the same application refactored into four child stacks: one for the APIGateway and three for the user, product, and order domains. Each child Stack has its own respective Lambda function and DynamoDB table.

Proposed refactored application into separate stacks for each domain.

Without the refactor feature, CloudFormation would delete and re-create the Lambda and DynamoDB resources, which would cause all of the data in the latter to be lost. Alternatively, you could create net-new Lambdas and Amazon DynamoDB tables in one deployment, execute an out-of-band, point-in time and streaming data migration from the old tables to the new ones, update the API Gateway configuration to target the new Lambdas in a second deploy, and turn off the streaming migration process.

With the refactor feature, we can move the resource definitions to new files, update them to L2 Constructs, and leave the stateful resources in place!

Replace stateless resources
First, let’s refactor our CDK code to break the monolithic Lambda into 3 domain-specific Lambdas. CloudFormation’s refactor capability doesn’t support creating new resources or updating configuration of existing resources, so we will deploy these changes as usual, without using the new refactor feature. All resources will stay inside the monolithic stack for now.

Architecture diagram of the same application with the single Lambda function broken into separate functions corresponding to the three DynamoDB tables for users, products, and orders. All resources are still contained in the single API Stack and CDK App.

Refactor stateless single lambda function into 3 functions as a prerequisite to the refactor of stateful DynamoDB tables.

function singleStackMicroservicesApp() {
  // We still have a single stack
  const monolith = new CdkAppStack(app, monolithStackName, {env});

  // makeFunctionAndTable creates a different Lambda function and a DynamoDB table
  // for each domain that is passed as a parameter.
  // In a real CDK application, you would probably define each of them independently.
  makeApi(monolith, {
    usersFunction: makeFunctionAndTable(monolith, 'users'),
    productsFunction: makeFunctionAndTable(monolith, 'products'),
    ordersFunction: makeFunctionAndTable(monolith, 'orders'),
  });
}

singleStackMicroservicesApp();

Refactor stateful resources
Now we can refactor the stateful DynamoDB tables and their respective Lambdas to their own stacks, using cdk refactor to map their new IDs without replacing the resources.

Before refactoring, though, we need to create the new stacks that will receive the functions and tables:

  singleStackMicroservicesApp();

  const usersStack = new Stack(app, 'Users', {env});
  const productsStack = new Stack(app, 'Products', {env});
  const ordersStack = new Stack(app, 'Orders', {env});
Architecture diagram of the final refactored application with four child stacks: one for the APIGateway and three for the user, product, and order domains. Each child Stack has its own respective Lambda function and DynamoDB table.

Refactored Lambda functions and DynamoDB tables into their own separate stacks.

function fullMicroservicesApp() {
    const monolith = new Stack(app, monolithStackName, {env});

    const usersStack = new Stack(app, 'Users', {env});
    const productsStack = new Stack(app, 'Products', {env});
    const ordersStack = new Stack(app, 'Orders', {env});

    makeApi(monolith, {
        // Now each pair function + table is in its own stack
        usersFunction: makeFunctionAndTable(usersStack, 'users'),
        productsFunction: makeFunctionAndTable(productsStack, 'products'),
        ordersFunction: makeFunctionAndTable(ordersStack, 'orders'),
    });
}

fullMicroservicesApp();

Running cdk refactor –unstable=refactor starts the process. (The unstable flag is required as this feature is still subject to breaking changes.) The CDK will compare the current state of your application (the deployed monolithic app) with the new state (the output of your refactored CDK application).

Screenshot of the CDK CLI confirmation dialog while executing the refactor command. The output has three columns: Resource Type, Old Construct Path, and New Construct Path, with rows of resources that will be refactored from one ID to another. The confirmation prompt asks "Do you want to refactor these resources? (yes/no)"

CDK refactor confirmation dialog

As expected, it shows a table of resources that were moved from the Monolith stack to their respective refactored stacks. By default, the CLI asks for confirmation before proceeding. Bypass the confirmation by passing the –force flag, or confirm the changes and execute the refactor:
All resources, including the stateful tables, were safely moved to other stacks, and we now have our well-architected application.

Screenshot of the CDK CLI results after completing the refactor command. The output is similar to the confirmation with three columns: Resource Type, Old Construct Path, and New Construct Path, with rows of resources that were refactored from one ID to another.

CDK refactor results

Conclusion
With the CDK refactor feature, developers can take full advantage of the object-oriented definition of AWS resources, including the ability to change the structure and layers of abstraction without orchestrating complex migration mechanisms or scheduled downtime. Since the CDK is open source, you can learn more about how the CDK automatically determines what resources need to be refactored via the README. Understanding when resources need to be replaced and refactored will help you plan your infrastructure as code roadmap and when you should use this new refactoring capability.

If you’ve got a refactor that you’ve been waiting to execute, read more about the feature set in the CDK refactor documentation and start refactoring your own CDK App today!

Authors

Natalie White

Natalie White is a Principal Solutions Architect at Amazon Web Services. She helps Healthcare and Life Sciences customers deploy solutions to AWS, and uses her software development background to accelerate infrastructure as code automation using the AWS Cloud Development Kit (CDK). She also consults engineering leaders on DevOps cultural transformations.

Otavio Macedo

Otavio Macedo is a Software Development Engineer at Amazon Web Services. He has been with the AWS Cloud Development Kit (CDK) team since 2021, helping deliver the unique experience that CDK provides for customers.

Introducing an Interactive Code Review Experience with Amazon Q Developer in GitHub

Post Syndicated from Sundaresh Iyer original https://aws.amazon.com/blogs/devops/introducing-an-interactive-code-review-experience-with-amazon-q-developer-in-github/

Code reviews are one of the most valuable rituals in software development. They help ensure quality, maintain consistency, and foster growth as engineers. But they’re also one of the most time consuming steps in the software development lifecycle. A common pattern I’ve seen is a developer opening a pull request (PR), receiving automated or peer comments, and then needing to search through documentation, Slack threads, or past code just to understand why a change was suggested. That search for missing context creates a friction that slows teams down, adds back-and-forth cycles, and often distracts from the bigger picture of building great products.

In the initial preview experience, teams used Amazon Q Developer in GitHub across issues and PRs for feature work, automated code reviews, and common modernization tasks. This kept work inside GitHub and reduced handoffs. Automatic reviews on new or reopened PRs surfaced findings early, but teams still wanted more context and a tighter loop inside the PR.

Today we’re introducing an interactive code review experience for PRs You can ask Amazon Q Developer questions about any finding using /q, see a concise summary with threaded findings, and apply suggested changes without leaving GitHub. Code reviews by Amazon Q Developer now complete quicker than before, which reduces wait time and shortens the review cycle so teams can merge sooner and spend more time building.

What’s new and why it matters

  • Interactive Conversations in the pull request: Comment with /q to get inline answers, or ask Q Developer to propose a code change you can apply in the PR. For example:/q explain this finding or /q propose a change that replaces class toggles with a data attribute for state.
  • Code review summaries with threaded findings: Each code review begins with a concise summary and findings are threaded underneath. This makes updates easier to follow and reduces noise.
  • Faster execution with clearer notifications: Amazon Q Developer completes its analysis quicker and notifications are organized and easier to scan. This reduces wait time and shortens the review cycle.
    When you create or open a new PR, Amazon Q Developer automatically starts a code review if the code review feature is enabled for your GitHub installation in the Amazon Q Developer console. Subsequent commits do not trigger another automatic review. To run a fresh analysis, post /q review as a new comment on the PR.

Getting Started with Amazon Q Developer in GitHub

To get started, install the Amazon Q Developer GitHub App in your GitHub organization or repository. The app is available through the GitHub Marketplace and can be used without an AWS account during the preview. During installation, you choose whether to provide access to all repositories or only selected repositories in your GitHub organization. You can increase free usage by registering the app installation in the Amazon Q Developer console.
For more details on installation, permissions, and configuration options, see the Amazon Q Developer for GitHub documentation. Once the app is installed, you can begin using Q Developer to review PRs automatically.

Using Amazon Q Developer in Pull Requests

To dive deeper, here’s an end-to-end walk-through of the new interactive code review experience using a simple card game I built with Amazon Q Developer.

  1. Create a new pull request : In this example, I started by creating a feature branch and named it demo, added atailwind.css file to the JavaScript and HTML card game app, pushed the branch, and opened a PR for review.
    • GitHub interface showing the creation of a new pull request for a demo branch, with changes to a tailwind.css file in a card game application
  2. Amazon Q Developer automatically starts a code review, analyzing code quality, potential issues, and adherence to best practices. A concise summary appeared at the top, with individual findings threaded underneath. This gave me the big picture and the specifics in one place.
    •  GitHub pull request interface showing a notification that Amazon Q Developer has automatically initiated a code review and is analyzing the changes, with a progress indicator
    • GitHub interface displaying Amazon Q Developer's completed review with a concise summary at the top and detailed findings organized in threaded comments below, highlighting code quality issues and suggested improvements
  3. Code review the summary and findings: I reviewed the summary and threaded findings to decide which change to take on first. Seeing both the rationale and the exact lines called out meant I knew where to begin, without hunting through files.
    •         GitHub interface showing Amazon Q Developer's threaded findings, where each finding is organized as a separate comment thread with detailed explanations of identified issues in the code
    •        
  4. Ask for Clarification with /q : One of the findings suggested using state property to track the card status in my card game application. so I asked Q Developer for clarification. It responded quickly with concrete context and pointers, which reduced back and forth and improved the quality of the review.
    •         Screenshot showing a conversation thread where a developer uses the /q command to ask Amazon Q Developer for clarification about state property implementation in the card game
    •         GitHub interface displaying Amazon Q Developer's detailed response to the clarification request, providing context and specific explanations about the state property implementation recommendation
  5. Continue the conversation (if needed) : I reviewed Q Developer’s suggestion and responded back stating that I preferred an alternate approach and Q Developer quickly returned a complete implementation I could apply in the PR
    •      GitHub interface showing a follow-up exchange between the developer and Amazon Q Developer, where the developer proposes an alternate approach and receives implementation suggestions
  6. Apply Fixes : After reviewing the implementation suggestion, I clicked on Commit suggestion to create a new commit on the PR branch with my username as the author.
  7. Re-run the review : I didn’t need this for my example, but if you push additional changes, you can run a fresh analysis by posting /q review as a new top-level comment. Q Developer will run the review and post updated findings.

With the code review complete and checks passing, I merged. The new interactive code review experience reduced wait time and review cycles and made the “why” behind each finding and suggested change clear.

Conclusion

Amazon Q Developer for GitHub is available today in preview. Whether you are an individual developer or part of a large engineering team, this update helps you ship cleaner code with fewer cycles and makes code reviews something to look forward to rather than avoid.
Try it out on your next PR. Type /q, ask a question, and see how smarter conversational reviews transform your workflow.

Measuring Developer Productivity with Amazon Q Developer and Jellyfish

Post Syndicated from Madhu Balaji original https://aws.amazon.com/blogs/devops/measuring-developer-productivity-with-amazon-q-developer-and-jellyfish/

Modern software development teams face increasing pressure to deliver high-quality code faster, while managing growing system complexity. Developers often spend significant time on necessary, but undifferentiated work, or “toil”. Toil is often manual, repetitive, and of limited enduring value, making it a strong candidate for automation or delegation to generative AI tools. The re:Invent 2024 session Unleashing generative AI: Amazon’s journey with Amazon Q Developer (DOP214) discussed how toil and productivity have an inverse relationship. Amazon Q Developer can help decrease toil and free up your developers to work on more productive tasks. Until now, that impact has been hard to show.

This post shows you how to integrate Amazon Q Developer with Jellyfish to measure AI’s impact on developer productivity. You’ll learn how to set up the integration, understand key metrics, and make data-driven decisions about your AI investments.

The Evolution of Developer Productivity Measurement

The initial Amazon Q Developer Dashboard, released in October 2023, provided basic visibility into subscription usage, code generation statistics, and security scans. While these metrics gave customers visibility into basic usage patterns, they wanted deeper insights into how the metrics connected to developer productivity and business outcomes. Since then, updates to the Amazon Q Developer Dashboard provided additional user-level insights, with the most recent changes discussed in the May 2025 blog post: Unlocking the power of Amazon Q: Metrics-driven strategies for better AI coding.

Amazon Q Developer dashboard in AWS Console showing subscription metrics, usage statistics with a donut chart of code suggestions by category, and an active users trend line graph

Amazon Q Dashboard in AWS Console

Many organizations face challenges when measuring generative AI impact due to complex organizational structures, fragmented tool chains, and rapidly evolving AI capabilities.

Leaders can make more informed decisions about metrics by working backwards from their desired business outcomes. When customers begin using generative AI tools, they focus on basic usage metrics such as subscription counts and active users. As generative AI adoption grows within an organization, teams want to understand AI impact on productivity and business value. By collecting the right data, leaders can measure how generative AI affects development workflows and business outcomes in their organizations.

Why Integrated Metrics Matter

The April 2025 blog “How generative AI is transforming developer workflows at Amazon” shared that developer productivity metrics are more complex than what any single tool measures. This aligns with established frameworks like DORA and SPACE. Understanding AI’s impact requires visibility across the entire development lifecycle. Organizations are looking for ways to combine data from multiple data sources to get a complete view. Some have created home-grown tools and dashboards while others like Genesys, a global cloud leader in AI-Powered Experience Orchestration, have taken advantage of partners like Jellyfish.

“At Jellyfish, our customers have been asking us for an Amazon Q Developer integration so they can understand the complete picture of how generative AI has transformed, improved and accelerated their software development workflows” – Billy Robbins, Jellyfish Head of Partnerships

The Jellyfish Solution

Jellyfish is an engineering management solution that combines metrics from various development tools. When integrated with Amazon Q Developer, Jellyfish helps you understand how Amazon Q Developer affects your development productivity by analyzing AI usage data alongside engineering metrics. Jellyfish understands the taxonomy of customer organizations allowing you to gain insights at the organizational levels that matter to you. This integration helps engineering leaders measure AI impact on development velocity, track adoption and usage patterns, and calculate the return on investment from AI spend.

“At Genesys, we’ve long been committed to data-driven engineering and deep telemetry across our software development lifecycle. However, quantifying AI’s impact on our development teams was challenging, as the insights from isolated tools were too fragmented to give us a clear overall picture. By partnering with AWS and Jellyfish, we’ve integrated the AI developer tooling our engineers trust with the platforms our leadership team relies on for visibility and alignment. This unified view empowers us to go beyond measuring AI adoption and on to operational metrics like productivity improvements and return on investment, enabling more informed decision-making at every level.” – Craig Dahlinger, Genesys Senior Director, Platform Engineering

Solution Overview

The Amazon Q Developer and Jellyfish integration connects your AI-assisted development metrics with broader engineering analytics. Through secure, automated data flow, the solution provides insights into how AI is transforming your development processes.

Architecture diagram showing Amazon Q Developer Metrics for a single account, illustrating data flow between various AWS services including Lambda, CloudTrail, IAM Identity Center, EventBridge, S3, and integration with a third-party analytics partner

Amazon Q Developer log data ingestion setup

How It Works

Amazon Q Developer automatically captures detailed usage data and prompt logs in your AWS environment. This data flows to a designated Amazon Simple Storage Service (Amazon S3) bucket, which Jellyfish securely accesses through pre-defined IAM roles. Jellyfish processes the information alongside data from your other development tools, providing comprehensive insights through their analytics system.

Key Metrics & Insights

Jellyfish’s AI Impact Dashboard surfaces several important metrics across your development lifecycle:

Engineering Adoption

Visualize how many engineers have adopted Amazon Q Developer across your organization. Users are categorized by cohort: Power, Casual, Idle, and New, giving you a clear picture of adoption. The following screenshot shows a breakdown by user cohorts: out of 77 total engineers, you see 22 Power Users, 20 Casual Users, 6 Idle Users, and 12 New Users. This view helps you understand where you’re succeeding in driving adoption and where there might be room for improvement.

Jellyfish dashboard's Manage Adoption view showing user adoption metrics through a donut chart, usage trends over time, team-based adoption data, and programming language statistics for Amazon Q

JellyFish Dashboard Manage Adoption

Usage Patterns and Trends
Through intuitive graphs, you can see daily active usage data, adoption trends, and usage patterns over time. This temporal view is crucial to understand how usage evolves and helps you identify successful adoption strategies and potential barriers to consistent use.

You can also see which programming languages benefit most from AI assistance. For example, the Manage Adoption dashboard screenshot above shows higher acceptance rates for AI suggestions in React compared to SQL (2,415 vs. 54), guiding your efforts to expand AI usage across different development areas.

Impact Measurement

Perhaps most crucially, this integration provides concrete impact metrics. You can now measure the reduction in time from first commit to pull request open. For example, the following screenshot shows a 24% reduction, with work time decreasing from 2 days and 23 hours to 2 days and 6 hours. You can also track changes in review time, which might show slight increases as AI-assisted code often requires more thorough review. Throughput improvements are also measurable, with some teams seeing a 142% increase in average monthly pull requests per user, jumping from 2.6 to 6.3 PRs per month.

Jellyfish dashboard showing development metrics and AI assistance trends comparing performance with and without Amazon Q integration

JellyFish Dashboard Maximum Impact

You can use the dashboard to view the percentage of pull requests assisted by Amazon Q Developer over time and track AI adoption. You can also understand the ratio of AI-written to human-written code, providing insight into the level of AI integration in your development process.

Investment Analysis

To round out the picture, you can visualize the impact of tool utilization on investment across different areas such as Growth, KTLO (Keep The Lights On), and Support. This helps you understand how your AI investment is affecting various aspects of your development lifecycle.

Implementation Guide

Prerequisites

Before implementing this integration, make sure you have:

    • Configure S3 buckets
    • Manage IAM roles
    • Set up CloudTrail logs (optional)

Setup Process

The implementation involves three steps:

Step 1: Enable Amazon Q Developer data collection: Follow the setup process found in this repository, containing automation scripts and detailed instructions. In this step, you configure the necessary AWS resources to collect Amazon Q Developer metrics.

This repository includes:

  • Python scripts for local execution
  • AWS Lambda functions for serverless deployment
  • Comprehensive documentation and testing procedures

Step 2: S3 Access: To grant the JellyFish account/role access to the S3 bucket for logs, update the bucket policy

Sample: Provide Jellyfish the name of your amazon-q-log-bucket

S3 Bucket ARN: <your-amazon-q-log-bucket-arn>

Update S3 Bucket Policy

  1. Go to AWS S3 Console → Select your Amazon Q log bucketPermissions tab.
  2. Click Edit Bucket Policy and add:
{
    "Version": "2012-10-17",
    "Statement": [
        {
            "Effect": "Allow",
            "Principal": {
                "AWS": "arn:aws:iam::0XXXXXXXX5:role/<AccessRoleName>"
            },
            "Action": ["s3:GetObject", "s3:ListBucket"],
            "Resource": [
                "arn:aws:s3:::<your-amazon-q-log-bucket>",
                "arn:aws:s3:::<your-amazon-q-log-bucket>/*"
            ]
        }
    ]
}

Step 3: Verify Setup: Confirm that the data is appearing in your S3 bucket and check with Jellyfish team to validate they have access to the S3 bucket and are receiving the logs.

Clean up

Follow automated or the manual cleanup steps provided in the README.md

Conclusion

The Amazon Q Developer integration with Jellyfish represents a significant step forward in your ability to measure and optimize the impact of AI in software development. By providing engineering leaders with powerful, actionable insights into AI adoption and impact, organizations are enabled to make informed decisions about their AI investments, optimize developer workflows, and drive greater efficiency across their engineering teams.

To learn more about this integration, visit the Amazon Q Developer documentation, contact your Jellyfish representative, or visit the Jellyfish website if you’re new to their resources.

Madhu Balaji

Madhu is a Senior Specialist Solutions Architect at AWS who helps customers design and implement innovative cloud solutions. With 20+ years of experience in development and application architecture, he focuses on enabling customers to accelerate their time-to-market and solve complex business challenges using AWS services.

Austin Butler

Austin is a Senior Go-To-Market Specialist at Amazon Web Services (AWS) focusing on generative AI across the software development lifecycle. He works with strategic customers and partners to understand their software development practices and how AWS services like Amazon Q Developer can deliver value in their SDLC. Prior to joining AWS, Austin spent 10 years working in Finance & Accounting.

Overcome development disarray with Amazon Q Developer CLI custom agents

Post Syndicated from Brian Beach original https://aws.amazon.com/blogs/devops/overcome-development-disarray-with-amazon-q-developer-cli-custom-agents/

As a developer who has embraced the power of the Model Context Protocol (MCP)to enhance my workflows, I’m thrilled to see the addition of custom agents in the Amazon Q Developer CLI. This new feature takes the capabilities I’ve come to rely on to a whole new level, allowing me to seamlessly manage different development contexts and easily switch between them.

In my previous post, I discussed how MCP servers have revolutionized the way I interact with AWS services, databases, and other essential tools. MCP integration in Amazon Q Developer allows me to query my database schemas, automate infrastructure deployments, and so much more. However, as I started juggling multiple projects, each with their own unique tech stacks and requirements, I found myself needing a more structured approach to managing these diverse development environments.

Enter custom agents. With this new feature, I can now create and use a custom agent by bringing together specific tools, prompt, context and tool permissions for tasks appropriate for the stage of development. In this post I will explain how to configure a cusom agent for front-end and back-end development. Allowing me to easily optimize Amazon Q Developer for each task.

Background

Imagine that I am working on a multi-tier web application. The application has a React front-end written in Typescript and a FastAPI back-end written in Python. In addition to me, the team includes a designer that uses Figma, and the database administrator that manages a PostgreSQL database. There are subtle differences in how I communicate with the designer and the database administrator. For example, when I discuss a “table” with the designer, I’m likely referring to an HTML table and how the page is structured. However, when I discuss a table with the database administrator, I’m likely talking about a SQL table and how data is stored.

In the past, I had both the Figma Dev Mode MCP server and Amazon Aurora PostgreSQL MCP server configured in my environment. While this allowed me to easily work on either the front-end or back-end code, it introduced some challenges. If I asked Amazon Q Developer “how many tables do I have?” Amazon Q Developer would have to guess if I was talking about HTML tables or SQL tables. If the question is about HTML, it should use the Figma server. If the question is about SQL, it should use the Aurora server. This is not a technical limitation, it’s a language limitation. Just as I have to adjust my assumptions to talk with the designer and database administrator, Amazon Q Developer has to make the same adjustments.

Enter Amazon Q Developer CLI custom agents. Custom agents allow me to optimize Q Developer’s configuration for each scenario. Let’s walk through my front-end and back-end configuration to understand the impact.

Front-end agent

My front-end custom agent is optimized for front-end web development using React and Figma. The following code example is the configuration for my front-end agent stored in ~/.aws/amazonq/agents/front-end.json. Let’s discuss the major sections of the configuration.

  • mcpServers – Here I have configured the Figma Dev Mode MCP Server. This simply communicates with the Figma Web Design App installed locally. Note that this replaces the MCP configuration that was stored in ~/.aws/amazonq/mcp.json
  • tools and allowedTools – These two sections are related, so I will discuss them together. tools defines the tools are available to Amazon Q Developer while allowedTools defines which tools are trusted. In other words, Q Developer is able to use all configured tools, and it does not have to ask my permission to use fs_read, fs_write, and @Figma. @Figma allows Amazon Q Developer to use all Figma tools without asking for permission. More on this in the next section.
  • resources – Here I have configured the files that should be added to the context. I have included the README.md (stored in the project folder) and my own preferences for React (stored in my profile). You can read more in the context management section of the user guide.
  • hooks – In addition to the resources, I have also included a hook. This hook will run a command and inject it into the context at runtime. In the example, I am adding the current git status. You can read more in the context hooks section of the user guide.
{
  "description": "Optimized for front-end web development using React and Figma",
  "mcpServers": {
    "Figma": {
      "command": "npx",
      "args": [
        "mcp-remote",
        "http://127.0.0.1:3845/sse"
      ]
    }
  },
  "tools": ["*"],
  "allowedTools": [
    "fs_read",
    "fs_write",
    "report_issues",
    "@Figma"
  ],
  "resources": [
    "file://README.md",
    "file://~/.aws/amazonq/react-preferences.md"
  ],
  "hooks": {
    "agentSpawn": [
      {
        "command": "git status"
      }
    ]
  }
}

Back-end agent

My back-end custom agent is optimized for back-end development with Python and PostgreSQL. The following code example is the configuration for my back-end agent stored in ~/.aws/amazonq/agents/back-end.json. Rather than describing the sections, as I did earlier, I will focus on the differences between the front-end and back-end.

  • mcpServers – Here I have configured the Amazon Aurora PostgreSQL MCP Server. This allows Amazon Q Developer to query my dev database to learn about the schema. Notice that I have configured a read-only connection to ensure that I don’t accidentally update the database.
  • tools and allowedTools – Once again, I have enabled Amazon Q Developer to use all tools. However, notice that I am more restrictive about what tools are trusted. Amazon Q Developer will need to ask permission to use fs_write or @PostgreSQL/run_query. Notice that I can allow the entire MCP server as I did with Figma or specific tools as I did here.
  • resources – Again, I have included the README.md (stored in the project folder) and my own preferences for Python and SQL (both stored in my profile). Note that I can also use glob patterns here. For example, file://.amazonq/rules/**/*.md would include the rules created by the Amazon Q Developer IDE plugins.
  • hooks – Finally, I have also included the hook for the front-end and back-end. However, I could have included project specific options such as npm run for the front-end and pip freeze for the back-end.
{
  "description": "Optimized for back-end development with Python and PostgreSQL",
  "mcpServers": {
    "PostgreSQL": {
      "command": "uvx",
      "args": [
        "awslabs.postgres-mcp-server@latest",
        "--resource_arn", "arn:aws:rds:us-east-1:xxxxxxxxxxxx:cluster:xxxxxx",
        "--secret_arn", "arn:aws:secretsmanager:us-east-1:xxxxxxxxxxxx:secret:rds!cluster-xxxxxxxx-xxxx-xxxx-xxxx-xxxxxxxx-xxxxxx",
        "--database", "dev",
        "--region", "us-east-1",
        "--readonly", "True"
      ]
    }
  },
  "tools": ["*"],
  "allowedTools": [
    "fs_read",
    "report_issues",
    "@PostgreSQL/get_table_schema"
  ],
  "resources": [
    "file://README.md",
    "file://~/.aws/amazonq/python-preferences.md",
    "file://~/.aws/amazonq/sql-preferences.md"
  ],
  "hooks": {
    "agentSpawn": [
      {
        "command": "git status"
      }
    ]
  }
}

Using custom agents

The real power of agents becomes evident when I need to switch between these different development contexts. I can now simply run q chat --agent front-end when I am working on React and Figma or q chat --agent back-end when I am working with Python and SQL. Amazon Q Developer will configure the correct agent with all my preferences.

In the following image, you can see the configuration in the Amazon Q Developer CLI. Notice that the front-end agent has an additional tool called Figma while the back-end agent has an additional tool called PostgreSQL. In addition, the front-end agent trusts fs_write and all of the Figma tools while the back-end agent will ask permission to use fs_write and only trusts one of the two PostgreSQL tools.

A split terminal view showing tool permissions for front-end and back-end environments. Both displays list built-in commands like execute_bash, fs_read, fs_write, report_issue, and use_aws, along with their permission status (trusted, not trusted, or trust read-only commands). The front-end environment also shows Figma (MCP) related permissions, while the back-end shows PostgreSQL (MCP) permissions. At the bottom of each view is a note that trusted tools will run without confirmation and instructions to use "/tools help" to edit permissions.

Similarly, let’s look at the context configuration in both the front-end and back-end agents. In the following image, I have included my React preferences for front-end development, and both Python and SQL preferences for back-end development.

A split terminal view showing the output of "/context show" command for both front-end and back-end environments. The front-end agent shows matches for "~/.aws/amazonq/react-preferences.md" and "README.md", while the back-end agent shows matches for "~/.aws/amazonq/python-preferences.md", "~/.aws/amazonq/sql-preferences.md", and "README.md". Each file is marked with "(1 match)" in green text.

As you can see, custom agents allow me to optimize the Amazon Q Developer CLI for each task. Of course, front-end and back-end agents are just an example. You might have a developer and testing agents, data science and analytics agents, etc. Custom agents allow you to tailor the configuration to most any task.

Conclusion

Amazon Q Developer CLI custom agents represent a significant improvement in managing complex development environments. By allowing developers to seamlessly switch between different contexts, they eliminate the cognitive overhead of manually reconfiguring tools and permissions for different tasks. Ready to streamline your development workflow? Get started with Amazon Q Developer today.

AI-Driven Development Life Cycle: Reimagining Software Engineering

Post Syndicated from Raja SP original https://aws.amazon.com/blogs/devops/ai-driven-development-life-cycle/

Business and technology leaders are constantly striving to improve productivity, increase velocity, foster experimentation, reduce time-to-market (TTM), and enhance the developer experience. These North Star goals drive innovation in software development practices. This innovation is increasingly being powered by artificial intelligence. Particularly, generative AI powered tools such as Amazon Q Developer and Kiro have already begun to revolutionize how software is created. As things stand, organizations employ AI in software development through two primary approaches: AI-assisted development, where AI enhances specific tasks like documentation, code completion, and testing; and AI-autonomous development, where AI generates entire applications with human oversight.

Why do we need a transformative approach to AI in software?

Our existing software development methods, are designed for human-driven, long running processes, with product owners, developers, architects alike spending most of their time on non-core activities such as planning, meetings, and other software development lifecycle (SDLC) rituals. Simply retrofitting AI as an assistant not only constrains its capabilities but also reinforces outdated inefficiencies. To truly harness AI’s power and achieve the productivity North Star goals, we need to reimagine our entire approach to the software development lifecycle.

To achieve transformative results, we need to position AI as a central collaborator and teammate in the development process, and leverage its capabilities throughout the software development lifecycle. This is why we’re introducing the AI-Driven Development Lifecycle (AI-DLC), a new methodology designed to fully ingrain AI capabilities into the very fabric of software development.

What is AI Driven Development Life Cycle (AI-DLC)?

AI-DLC is an AI-centric transformative approach to software development that emphasizes two powerful dimensions:

  • AI Powered Execution with Human Oversight: AI systematically creates detailed work plans, actively seeks clarification and guidance, and defers critical decisions to humans. This is critical since only humans possess the contextual understanding and knowledge of business requirements needed to make informed choices.
  • Dynamic Team Collaboration: As AI handles the routine tasks, teams unite in collaborative spaces for real-time problem solving, creative thinking and rapid-decision-making. This shift from isolated work to high-energy teamwork accelerates innovation and delivery.

Depicts an AI-centric approach to software development, with AI in the center, with cross functional team members around it, working collaboratively with one another.

These two dimensions enable you to deliver software faster without compromising on quality.

How does AI-DLC work?

At its core, AI-DLC operates by having AI initiate and direct workflows through a new mental model:

AI creates plans, seeks clarification, & implements plans, while humans make critical decisions

This pattern, where AI creates a plan, asks clarifying questions to seek context, and implements solutions only after receiving human validation, repeats rapidly for every SDLC activity, to provide a unified vision and approach for all development pathways.

With this mental model at its core, the software development in AI-DLC takes place in three straightforward phases:

  • In the Inception phase, AI transforms business intent into detailed requirements, stories and units through “Mob Elaboration” – where the entire team actively validates AI’s questions and proposals.
  • In the Construction phase, using the validated context from the Inception phase, AI proposes a logical architecture, domain models, code solution and tests through “Mob Construction” – where the team provides clarification on technical decisions and architectural choices in real time.
  • In the Operations phase, AI applies the accumulated context from previous phases to manage infrastructure as code and deployments, with team oversight.

Each phase provides richer context for the next, thus enabling AI to provide increasingly informed suggestions.

The three phases of AI-DLC: Inception, Construction, Operation

AI saves and maintains persistent context across all phases by storing plans, requirements, and design artifacts to your project repository, ensuring seamless continuation of work across multiple sessions.

AI-DLC introduces new terminology and rituals to reflect its AI-driven, highly collaborative approach. Traditional ‘sprints’ are replaced by ‘bolts’ – shorter, more intense work cycles measured in hours or days rather than weeks; Epics are replaced by Units of Work. This shift in terminology underscores the method’s emphasis on speed and continuous delivery. Similarly, other familiar Agile terms are reimagined to align with the AI-centric workflow, creating a vocabulary that better represents the methodology’s innovative approach to software development.

What are the benefits of this methodology?

  • Velocity: The foremost benefit that AI-DLC offers is acceleration in development velocity, as AI rapidly generates and refines artifacts, such as requirements, stories, designs, code, and tests allowing product owners, architects, and developers to complete tasks in hours or days that previously took weeks.
  • Innovation: Consequently, this acceleration and heavy lifting by AI, frees up significant time for innovation, enabling builders to explore creative solutions and push the boundaries of what’s possible.
  • Quality: With continuous clarification, teams build precisely what they have in mind, rather than an abstract AI interpretation of the intent. This results in products that are more closely aligned with business objectives. AI enhances quality by consistently applying organization-specific standards – your coding practices, design patterns, and security requirements – while generating comprehensive test suites. This end-to-end AI integration improves coherence and traceability from requirements to deployment.
  • Market Responsiveness: The rapid development cycles of AI-DLC enable us to quickly respond to market demands and user feedback, and consequently faster adaptation to requirements.
  • Developer Experience: AI-DLC transforms the developer experience by shifting focus from routine coding tasks to critical problem-solving. AI helps reduce cognitive load by handling repetitive tasks, while satisfaction is enhanced as developers gain deeper business context and witness how their work directly impacts business value.

How do I get started with this?

Begin your journey with AI-DLC, through three clear paths: Read the comprehensive AI-DLC white paper, explore how Amazon Q Developer rules and Kiro custom workflows can help you implement AI-DLC in your organization consistently or connect with your AWS account team to discuss how AI-DLC can be tailored to your organization’s specific needs.

The future of software development is here. We are excited to help you leverage AI to not only build systems faster but also maintain fidelity and quality through critical human oversight and collaboration. Start your AI-DLC journey today and join the growing community of organizations transforming their development practices through AI-driven innovation.

Raja SP

Raja is a Principal Solutions Architect at AWS, where he leads Developer Transformation Programs. He has worked with more than 100 large customers, helping them design and deliver mission critical systems built on modern architectures, platform engineering practices, and Amazon inspired operating models. As generative AI reshapes the software development landscape, Raja and his team created the AI Driven Development Lifecycle (AI DLC) — an end to end, AI native methodology that reimagines how large teams collaboratively build production grade software in the AI era.

GitOps continuous delivery with ArgoCD and EKS using natural language

Post Syndicated from Jagdish Komakula original https://aws.amazon.com/blogs/devops/gitops-continuous-delivery-with-argocd-and-eks-using-natural-language/

Introduction

ArgoCD is a leading GitOps tool that empowers teams to manage Kubernetes deployments declaratively, using Git as the single source of truth. Its robust feature set, including automated sync, rollback support, drift detection, advanced deployment strategies, RBAC integration, and multi-cluster support, makes it a go-to solution for Kubernetes application delivery. However, as organizations scale, several pain points and operational challenges become apparent.

Pain Points with Traditional ArgoCD Usage

  • ArgoCD’s UI and CLI are designed for users with extensive technical background. Interacting with YAML manifests, understanding Kubernetes resource relationships, and troubleshooting sync errors require specialized knowledge. This limits access to GitOps workflows for less technical stakeholders and increases reliance on DevOps engineers.
  • Managing ArgoCD across multiple clusters or environments (using hub-spoke, per-cluster, or grouped models) introduces significant operational complexity. Teams must handle multiple ArgoCD instances, maintain consistent configuration, and coordinate deployments, which can become a bottleneck as service footprints grow.
  • ArgoCD excels at syncing and monitoring Kubernetes resources but lacks built-in mechanisms for pre-deployment (e.g., image scanning) or post-deployment (e.g., load testing) tasks. This forces teams to rely on external tools or custom scripts, fragmenting the deployment pipeline and increasing maintenance effort.
  • Promoting applications across environments (Dev → Test → Prod) is not natively streamlined. Teams must manually orchestrate or script these promotions, slowing down urgent fixes and complicating the release process.
  • As organizations adopt multi-cluster strategies, managing ArgoCD’s access, RBAC, and resource visibility across environments becomes cumbersome, often leading to fragmented workflows and potential security gaps.

How ArgoCD MCP Server with Amazon Q CLI addresses these challenges:

  • The integration of the ArgoCD MCP (Model Context Protocol) Server with Amazon Q CLI fundamentally transforms the user experience by introducing natural language interaction for GitOps operations.
  • With MCP, users can manage deployments, monitor application states, and perform sync or rollback operations using plain conversational language rather than technical commands or YAML. For example, a user can simply ask, “What applications are out of sync in production?” or “Sync the api-service application,” and the system executes the appropriate ArgoCD API calls in the background.
  • This democratizes access to GitOps, enabling less technical team members (such as QA, product managers, or support engineers) to safely interact with deployment workflows.
  • Natural language interfaces abstract away the complexity of multi-cluster and multi-environment management. Users can query or act on resources across clusters without memorizing resource names, namespaces, or API endpoints.
  • The MCP server handles authentication, session management, and robust error handling, reducing the need for manual troubleshooting and custom scripting.
  • The integration provides detailed feedback, intelligent endpoint handling, and comprehensive error messages, making it easier to diagnose and resolve issues. Full static type checking and environment-based configuration further enhance reliability and maintainability.
  • By leveraging Amazon Q CLI’s extensibility, users gain access to pre-built integrations and context-aware prompts, accelerating development and deployment workflows.
  • The MCP server enables AI assistants and language models to automate routine tasks, recommend actions, and even debug issues, acting as a virtual DevOps engineer. This can significantly reduce manual effort and speed up incident response.

Traditional ArgoCD vs. ArgoCD MCP Server with Amazon Q CLI

Feature/Challenge Traditional ArgoCD With MCP Server + Amazon Q CLI
User Interface Technical UI/CLI, YAML required Natural language, conversational
Access for Non-Engineers Limited Broad, democratized
Multi-Cluster Management Complex, manual Simplified, abstracted
Pre-Post Deployment Tasks External tools/scripts needed (Still external, but easier to invoke)
Application Promotion Manual or scripted Natural language, easier orchestration
Troubleshooting Technical, error-prone Guided, AI-assisted, detailed feedback
Automation Scripting required AI/agent-driven, proactive

You can perform the following actions using natural language using Amazon Q CLI integration with ArgoCD MCP server.

  • Application Management: List, create, update, and delete ArgoCD applications
  • Sync Operations: Trigger sync operations and monitor their status
  • Resource Tree Visualization: View the hierarchy of resources managed by applications
  • Health Status Monitoring: Check the health of applications and their resources
  • Event Tracking: View events related to applications and resources
  • Log Access: Retrieve logs from application workloads
  • Resource Actions: Execute actions on resources managed by applications

Setting Up Your Environment

Pre-requisites

Following are the pre-requisites for setting up your EKS environment to be managed by ArgoCD using Amazon Q CLI.

  • An AWS account with appropriate permissions
  • AWS CLI v2.13.0 or later
  • Node.js v18.0.0 or later
  • npm v9.0.0 or later
  • Amazon Q CLI v1.0.0 or later (npm install -g @aws/amazon-q-cli)
  • An EKS cluster (v1.27 or later) with ArgoCD v2.8 or later installed

Connecting to your EKS cluster

  1. Use AWS CLI to update your kubeconfig

aws eks update-kubeconfig --name <cluster_name> --region <region> --role-arn <iam_role_arn>

  1. Verify ArgoCD pods are running properly in the argocd namespace

kubectl get pods -n argocd

  1. Access the ArgoCD server UI locally using port forwarding command

kubectl port-forward svc/blueprints-addon-argocd-server -n argocd 8080:443

Create AgroCD API Token

  1. Access the ArgoCD UI at https://localhost:8080
  2. Log in with the admin credentials
  3. Navigate to User Settings > API Tokens
  4. Click “Generate New” to create a token
  5. Create an Amazon Q CLI MCP configuration file at .amazonq/mcp.json and update the ARGOCD_BASE_URL and ARGOCD_API_TOKEN as per your environment setup.

Integrating with Amazon Q CLI

{ 
  "mcpServers": {
    "argocd-mcp-stdio": { 
      "type": "stdio", 
      "command": "npx", 
      "args": [ 
         "argocd-mcp@latest", 
         "stdio" 
      ], 
      "env": { 
        "ARGOCD_BASE_URL": "<ARGOCD_BASE_URL>",
        "ARGOCD_API_TOKEN": "<ARGOCD_API_TOKEN>", 
        "NODE_TLS_REJECT_UNAUTHORIZED": "0" 
      } 
    } 
  }
}

Once configured, you can start using natural language commands with Amazon Q CLI to interact with your ArgoCD applications.

Managing ArgoCD applications using natural language

Listed below are some example prompts to interact with ArgoCD applications in your EKS cluster.

List ArgoCD application

Prompt: “List all ArgoCD applications in my cluster

Amazon Q listing all ArgoCD applications in my clusterAmazon Q will use the ArgoCD MCP server to retrieve and display all applications

Create new ArgoCD application

Prompt: Create new argocd application using App name: game-2048   Repo: https://github.com/aws-ia/terraform-aws-eks-blueprints  Path: patterns/gitops/getting-started-argocd/k8s. Branch: main  Namespace: argocd

Amazon Q creating new argocd application using MCP ServerAmazon Q will create a new application from GitRepo information provided

Viewing deployment status

Prompt: “Show me the resource tree for team-carmen app

Amazon Q showing Resource tree of argocd application
Amazon Q will display the hierarchy of Kubernetes resources managed by the application

Synchronizing applications

Prompt: “Show me the applications that’s out of sync

Amazon Q showing argocd out of sync applicationsAmazon Q will display the out of sync applications

Prompt: “Sync the application

Amazon Q syncing argocd applicationsAmazon Q syncing application

Amazon Q will:

  • Initiate a sync operation for the specified application
  • Monitor the sync progress
  • Report the final status of the sync operation

Healthchecks and monitoring

Prompt:”Check the health of all resources in the team-geordie application

Amazon Q showing health status of all the resources in an applicationAmazon Q showing health status of all the resources in an application

Amazon Q will:

  • Retrieve the health status of all resources
  • Identify any unhealthy components
  • Provide recommendations for addressing issues

Prompt: “Show me the logs for the failing pod in the team-platform application

Amazon Q showing logs for the failing podAmazon Q showing logs of problematic pod

Amazon Q will:

  • Identify problematic pods
  • Retrieve and display relevant logs
  • Highlight potential error messages

Conclusion

The integration of Amazon Q CLI with ArgoCD through the MCP server marks a transformative advancement in Kubernetes management, combining ArgoCD’s GitOps capabilities with Amazon Q’s natural language processing. By transforming complex Kubernetes operations into simple conversational interactions, this solution allows teams to focus on what truly matters – creating value for their business. Rather than spending time memorizing commands or navigating technical complexities, teams can now manage their cloud infrastructure through natural dialogue, making the cloud-native journey more accessible and efficient for everyone.Ready to transform your EKS and ArgoCD experience? It’s highly recommended to try out Amazon Q CLI integration with ArgoCD MCP and discover why DevOps teams are making it an essential part of their toolkit.


About the authors

Jagdish Komakula Picture Jagdish Komakula is a passionate Sr. Delivery Consultant working with AWS Professional Services. With over two decades of experience in Information Technology, he helped numerous enterprise clients successfully navigate their digital transformation journeys and cloud adoption initiatives.
Aditya Ambati Picture Aditya Ambati, Is an experienced DevOps Engineer with 12 plus years of experience in IT. Excellent reputation for resolving problems, improving customer satisfaction, and driving overall operational improvements.
Anand Krishna Varanasi Picture Anand Krishna Varanasi, is a seasoned AWS builder and architect who began his career over 16 years ago. He guides customers with cutting-edge cloud technology migration strategies (the 7 Rs) and modernization. He is very passionate about the role that technology plays in bridging the present with all the possibilities for our future.


Streamline Operational Troubleshooting with Amazon Q Developer CLI

Post Syndicated from Kirankumar Chandrashekar original https://aws.amazon.com/blogs/devops/streamline-operational-troubleshooting-with-amazon-q-developer-cli/

Amazon Q Developer is the most capable generative AI–powered assistant for software development, helping developers perform complex workflows. Amazon Q Developer command-line interface (CLI) combines conversational AI with direct access to AWS services, helping you understand, build, and operate applications more effectively. The Amazon Q Developer CLI executes commands, analyzes outputs, and provides contextual recommendations based on best practices for troubleshooting tools and platforms available on your local machine.

In today’s cloud-native environments, troubleshooting production issues often involves juggling multiple terminal windows, parsing through extensive log files, and navigating numerous AWS console pages. This constant context-switching delays problem resolution and adds cognitive burden to teams managing cloud infrastructure.

In this blog post, you will explore how Amazon Q Developer CLI transforms the troubleshooting experience by streamlining challenging scenarios through conversational interactions.

The Traditional Troubleshooting Experience

When issues arise, engineers typically spend hours manually examining infrastructure configurations, reviewing logs across services, and analyzing error patterns. The process requires switching between multiple interfaces, correlating information from various sources, and deep AWS knowledge. This complex workflow often extends problem resolution from hours into days and increase the burden on the infrastructure teams.

Solution: Amazon Q Developer CLI

Amazon Q Developer CLI streamlines the entire troubleshooting process, from initial investigation to problem resolution, making complex AWS troubleshooting accessible and efficient through simple conversations.

How Amazon Q Developer CLI works:

  • Natural Language Interface: Execute AWS CLI commands and interact with AWS services using conversational prompts
  • Automated Discovery: Map out infrastructure and analyze configurations
  • Intelligent Log Analysis: Parse, correlate, and analyze logs across services
  • Root Cause Identification: Pinpoint issues through AI-powered reasoning
  • Guided Remediation: Implement fixes with minimal human intervention
  • Validation: Test solutions and explain complex issues simply

One of the built-in tools within the Amazon Q Developer CLI, use_aws, enables natural language interaction with AWS services, as shown in Figure 1. This tool leverages the AWS CLI permissions configured on your local machine, allowing secure and authorized access to your AWS resources.

A command line interface showing a list of tools and their permissions. The display is titled "/tools" and shows several built-in tools including execute_bash, fs_read, fs_write, report_issue, and use_aws. Each tool has an associated permission level indicated by asterisks. The use_aws tool is highlighted with "trust read-only commands" permission. At the bottom, there's a note stating "Trusted tools will run without confirmation" and a tip to "Use /tools help to edit permissions".

Figure 1: Tools selection in Amazon Q Developer CLI

Real-World Troubleshooting Scenario

Demonstration Environment Setup

This demonstration was performed with the following environment configuration:

The environment includes a local development machine with necessary tools, appropriate AWS account permissions, and terminal access. By starting Amazon Q Developer CLI in the project directory, it has immediate access to relevant code and configuration files.

Scenario: Troubleshooting NGINX 5XX Errors

The scenario demonstrates troubleshooting a multi-tier application architecture as shown in figure 2 deployed on Amazon ECS Fargate with:

  • Application Load Balancer (ALB) distributing traffic across availability zones
  • NGINX reverse proxy service handling incoming requests
  • Node.js backend service processing business logic
  • Service discovery enabling internal communication
  • CloudWatch Logs providing centralized logging

An AWS cloud architecture diagram showing the flow of traffic from an Internet user through multiple components. The diagram includes: At the top: An Internet user connecting to an Internet Gateway Within a VPC (Virtual Private Cloud): Two public subnets containing a NAT Gateway and Application Load Balancer Two private subnets within an ECS Cluster containing: An NGINX service (Fargate) A Backend service (Fargate) A 10-second timeout between them A Cloud Map Service Discovery component at the bottom CloudWatch Logs integration on the right side The diagram includes a note about gateway timeouts: "504 Gateway Timeout - Backend takes 15s to respond, NGINX timeout is 10s" All components are connected with arrows showing the flow of traffic and data through the system. The infrastructure follows AWS best practices with public and private subnet separation for security.

Figure 2: AWS Architecture diagram for the app used in this blog post

Traditional Troubleshooting Steps

For the architecture in figure 2, when 502 Gateway Timeout errors occur, traditional troubleshooting requires:

  1. Checking ALB target group health
  2. Examining ECS service status across multiple consoles
  3. Analyzing CloudWatch logs from different log groups
  4. Correlating error patterns between services
  5. Reviewing infrastructure code for configuration issues
  6. Implementing and deploying fixes

Amazon Q Developer CLI Approach

Instead, let’s see how Amazon Q Developer CLI handles this systematically, step by step:

Step1: Initial Problem Report

Amazon Q Developer CLI is provided with the initial prompt as a problem statement within the application project directory as shown in the following screenshot in figure 3. Amazon Q Developer responds back and says it is going investigate the 502 Gateway Timeout errors in the NGINX application.

Prompt:

Our production NGINX application is experiencing 502 Gateway Timeout errors. 
I have checked out the application and infrastructure code locally and the AWS CLI 
profile 'demo-profile' is configured with access to the AWS account where the 
infrastructure and application is deployed to. Can you help investigate and diagnose the issue?

A Visual Studio Code window showing a debugging session for an NGINX application. The interface has three main sections: a file explorer on the left showing project files including 'app.ts' and 'nginx-config-task.json', a terminal tab in the center displaying an "Amazon Q" ASCII art logo, and a conversation where a user is reporting 502 Gateway Timeout errors. The terminal shows AWS CLI command execution using a tool called "use_aws" with parameters including the service name "ecs" and region "us-west-2". The interface has red annotations highlighting key areas like "project files", "User provided initial prompt", and "Q CLI executing AWS CLI calls.

Figure 3: Amazon Q Developer CLI with initial prompt and problem statement

Step2: Systematic Infrastructure Discovery

Amazon Q Developer CLI start to systematically discovering the infrastructure as shown in the following screenshot in figure 4. If you see the initial prompt did not include that the app is hosted on ECS, but Amazon Q Developer CLI understood the context and executes the AWS CLI calls to describe the Cluster and the services within it. It made sure that the ECS tasks are running for both the services within the Cluster. It is a key discovery that both services show healthy status (1/1 desired count), indicating the issue isn’t service availability.

A terminal window showing three sequential AWS CLI commands being executed through a "use_aws" tool: First command: "list-clusters" operation for ECS service in us-west-2 region using demo-profile, completing in 1.244 seconds Second command: "list-services" operation targeting the NginxSimulationCluster, completing in 0.877 seconds with confirmation of finding both nginx-service and backend-service Third command: "describe-services" operation examining both services in detail, completing in 0.968 seconds with confirmation that both services are running as expected (1/1 desired count) Each command includes execution details, parameters, and completion status, with the system preparing to check CloudWatch logs next.

Figure 4: AWS Infrastructure discovery by Amazon Q Developer CLI

Step 3: Intelligent Log Analysis

Amazon Q Developer CLI retrieves and analyzes recent CloudWatch logs from the NGINX container, immediately identifying the critical error pattern as shown in the following screenshot in figure 5, where Amazon Q Developer responds: “Perfect! I found the issue. The NGINX logs show clear 504 gateway timeout with upstream timeout messages.”

A terminal window showing two AWS CloudWatch Logs commands being executed: First command: "describe-log-streams" operation for the "/ecs/nginx-service" log group, limiting to 5 most recent entries, ordered by LastEventTime in descending order Second command: "get-log-events" operation retrieving 50 log entries from a specific NGINX container log stream The output reveals a critical error message highlighted at the bottom showing an upstream timeout (error 110) occurring while reading response headers. The error details include client IP 10.0.0.247, upstream server at http://10.0.3.18:3000/, and host 52.35.62.210.

Figure 5: CloudWatch Log analysis by Amazon Q Developer CLI

Step 4: Amazon Q Developer CLI Analysis and Root Cause Identification

Amazon Q Developer examines backend service logs and discovers a mismatch between the backend service response time and NGINX timeout settings, as seen in the following screenshot in figure 6.

A terminal window showing AWS CloudWatch Logs commands and their output. The first command describes log streams for a backend container, and the second retrieves log events. The output reveals a debugging analysis showing that while health checks work fine, regular requests are being delayed by about 15 seconds, causing NGINX timeout issues. The log group is "/ecs/backend-service" in the us-west-2 region using a demo-profile.

Figure 6: Root cause identification by Amazon Q Developer CLI

Step 5: Amazon Q Developer CLI Root Cause Analysis

Amazon Q Developer CLI examines the ECS task definitions to identify the exact configuration mismatch, as shown in the following screenshot in figure 7. Amazon Q Developer finds that:

  • Backend service is configured with response_delay=15000 (15 secs)
  • NGINX proxy is configured with proxy_read_timeout 10s

This mismatch causes 504 gateway timeout errors when the backend response exceeds NGINX’s timeout threshold.

A terminal window showing two AWS CLI commands to describe ECS task definitions in the us-west-2 region. Below the commands is a highlighted "Root Cause Analysis" section that explains a timeout mismatch: the backend service is configured with a 15-second response delay while NGINX has a 10-second proxy timeout, resulting in 502 Gateway Timeout errors. Both commands use a demo-profile and are labeled as checking timeout and response delay configurations.

Figure 7: Root cause analysis and issue detection by Amazon Q Developer CLI

Step 6: Automated Code Fix

Here’s where Amazon Q Developer CLI truly excels—it doesn’t just diagnose; it implements the fix. Since Amazon Q Developer CLI is started within the project where the CDK code for ECS task definition is defined, it identified the code configuration and also modified it, as shown in the following screenshot in figure 8.

A terminal window showing file operations using fs_read and fs_write tools. The code changes show an NGINX configuration update in ecs-nginx-cdk.ts, where the proxy_read_timeout is being modified from '10s' to '20s'. The file also shows additional timeout configurations being added, including proxy_connect_timeout and proxy_send_timeout. The update is confirmed with a user prompt and completed in 0.2 seconds.

Figure 8: CDK code fix by Amazon Q Developer CLI

Step 7: Deployment

Amazon Q Developer CLI builds and deploys the fix by executing cdk synth and cdk deploy using the ‘demo-profile‘ AWS CLI profile that was initially provided in the prompt, as shown in the following screenshot in figure 9.

A terminal window showing two execute_bash commands running in sequence. The first command builds a CDK project using 'npm run build' in the nginx-app directory, completing in 4.102s. The second command deploys the updated CDK stack using 'cdk deploy' with the demo-profile, showing deployment progress including some warnings about minHealthyPercent configurations and CloudFormation stack updates in us-west-2 region.

Figure 9: CDK code build and deployment by Amazon Q Developer CLI

Step 8: Validation

Amazon Q Developer CLI validates the solution by sending a curl request to the ALB endpoint after the successful deployment, as shown in the following screenshot in figure 10.

A terminal window showing the execution of a curl command to test an NGINX application on AWS. The command targets an Elastic Load Balancer in the us-west-2 region. The response shows a successful HTTP 200 OK status after 14 seconds, with a JSON response containing the message "Hello from backend". The test completes in 15.100 seconds, indicating the fix for previous 502 errors was successful.

Figure 10: Fix validation by Amazon Q Developer CLI

In addition to that, Amazon Q Developer also sends a request to the health check endpoint and validates everything is working after the fix was deployed, as shown in the following screenshot in figure 11.

A terminal screenshot showing the results of a health check on an Nginx server using curl. The command executed shows a successful response with "healthy" status, completing in 0.65 seconds. The output displays various metrics including download speed (386 B/s), 100% completion rate, and timing statistics for real, user, and system processes.

Figure 11: Health endpoint validation by Amazon Q Developer CLI

What Amazon Q Developer CLI Accomplished

Using just conversational commands, Amazon Q Developer CLI performed a complete troubleshooting cycle:

  • Infrastructure Discovery: Automatically mapped ECS clusters, services, and dependencies
  • Log Correlation: Analyzed thousands of log entries across multiple services
  • Root Cause Analysis: Identified exact configuration mismatch between NGINX’s timeout (10s) and the backend’s response delay (15s)
  • Code-Level Diagnosis: Located problematic timeout setting in CDK infrastructure code
  • Automated Implementation: Modified infrastructure code to increase the NGINX timeout
  • End-to-End Deployment: Built, deployed, and validated the complete solution
  • Comprehensive Testing: Verified both fix effectiveness and overall system health

Amazon Q Developer CLI handles troubleshooting tasks through a single, conversational interface, eliminating the need for multiple tools or AWS CLI commands.

Conclusion

Amazon Q Developer CLI represents a significant evolution in how we troubleshoot cloud infrastructure issues. By combining natural language understanding with powerful command execution capabilities, it transforms complex troubleshooting workflows into efficient, action-oriented dialogues. Whether you’re dealing with NGINX 5XX errors or similar issues across other AWS services, Amazon Q Developer CLI can help you diagnose issues, implement fixes, and validate solutions—all through a conversational interface that feels natural and intuitive.

Give Amazon Q Developer CLI a try the next time you encounter a troubleshooting challenge, and experience the difference it can make in your operational workflow.

To learn more about Amazon Q Developer’s features and pricing details, visit the Amazon Q Developer product page.

About the Author

kirankumar.jpeg

Kirankumar Chandrashekar is a Generative AI Specialist Solutions Architect at AWS, focusing on Amazon Q Developer. Bringing deep expertise in AWS cloud services, DevOps, modernization, and infrastructure as code, he helps customers accelerate their development cycles and elevate developer productivity through innovative AI-powered solutions. By leveraging Amazon Q Developer, he enables teams to build applications faster, automate routine tasks, and streamline development workflows. Kirankumar is dedicated to enhancing developer efficiency while solving complex customer challenges, and enjoys music, cooking, and traveling.

Use Model Context Protocol with Amazon Q Developer for context-aware IDE workflows

Post Syndicated from Ritik Khatwani original https://aws.amazon.com/blogs/devops/use-model-context-protocol-with-amazon-q-developer-for-context-aware-ide-workflows/

Earlier today, Amazon Q Developer announced Model Context Protocol (MCP) support in their Integrated Development Environment (IDE) plugins for Visual Studio Code and JetBrains. This allows developers to connect external tools or MCP servers to Q Developer, enabling more context-aware responses and complex workflows. MCP support has already been available in Amazon Q Developer for Command Line since April 29, 2025.

Introduction

Q Developer already had the ability to use tools within the IDE such as executing shell commands, reading local files, and generating code with the addition of the agentic coding experience. Now, developers have the ability to add additional tools that support MCP to their toolkit. MCP is an open protocol that standardizes how Large Language Models (LLMs) integrate with applications. It provides a way to share context, access data sources, and interact with APIs. You can read more about MCP in this introduction.

This ability to add additional context and tools allows Q Developer to write more accurate code, integrate with your planning tools, create UI components from designs, generate database documentation by examining your actual schema, and execute complex multi-tool tasks – all without the need for custom integration code. I’m excited to see this functionality coming to Q Developer IDE plugins, enhancing the development process right where developers spend most of their time.

In this post, I’ll walk you through a common scenario where I, as a developer, am tasked with working on an issue defined in a project management tool like Jira. The issue contains a user story, acceptance criteria, a link to a Figma design of the user interface, and additional technical implementation notes. To accomplish this efficiently, I’ll demonstrate how Q Developer can streamline the entire process by using two separate MCP servers to interact with Jira and Figma independently. Rather than manually switching between browser tabs, copying information, and trying to keep track of requirements across multiple tools, I’ll show how Q Developer can automatically fetch details using MCP and help me implement the feature while maintaining context across both platforms as shown in the figure below.

Q Developer extension in Visual Studio Code interacting with external tools using MCP servers

Figure 1: Q Developer extension in Visual Studio Code interacting with external tools using MCP servers

Configuring MCP Servers

To begin setup, click on the Configure MCP servers button at the top of the Chat tab bar as shown in the image below. This will bring up the list of MCP servers currently configured. Click the + (Add new MCP) button to add a new server.

Add MCP server configuration in Visual Studio Code’s Q Developer extension

Figure 2: Add MCP server configuration in Visual Studio Code’s Q Developer extension

You will set the scope of your MCP servers during configuration. A Global scope allows you to use the MCP server across all your projects, whereas a Workspace scope sets it up for only the current IDE workspace. Here’s an example configuration for the Atlassian and Figma MCPs I’ll be using:

Atlassian
Scope: This workspace
Name: Atlassian
Transport: stdio
Command: npx
Arguments:
-y
mcp-remote
https://mcp.atlassian.com/v1/sse
Figma
Scope: This workspace
Name: Figma
Transport: stdio
Command: npx
Arguments:
-y
mcp-remote
http://127.0.0.1:3845/sse

Note: The first time you set up the Atlassian MCP server, you’ll be asked to complete the OAuth authentication flow in your browser and provide access permissions to your Jira projects. Similarly, to connect to the Figma Dev Mode MCP server, you’ll need to enable it via the Figma desktop app.

Q Developer’s MCP management window showing configured Figma and Atlassian MCPs servers

Figure 3: Q Developer’s MCP management window showing configured Figma and Atlassian MCPs servers

To understand an MCP server’s individual tools, click on the expand icon next to its name as shown in the image below. Tools are executable functions exposed by the MCP server. They enable Q Developer’s agentic chat to perform actions and interact with external systems on your behalf. You can also configure permissions for individual tools. Each tool presents the option to Ask, Always allow, or Deny it such that Q Developer can’t invoke it. In my example, I’ll set all tools that only read data to Always allow for my workspace and set the rest of the tools to Ask.

MCP tool descriptions and configuration dropdown with options to Ask, Always allow or Deny

Figure 4: MCP tool descriptions and configuration dropdown with options to Ask, Always allow or Deny

With the MCP servers configured, let’s see how I can integrate them into my workflow.

Walkthrough

Q Developer is now enriched with additional information and tools available via the configured MCP servers. To demonstrate how this accelerates my developer productivity, I’ll be working with the Q Words game.

Scenario

Q-Words is an interactive word guessing game used in our customers’ workshops to demonstrate Q Developer’s capabilities. I’ve been tasked by the Product Manager to add a dark mode to the game. The User Story is logged in Jira and links to a Figma design that our designers have prepared.

Jira ticket showing user story and acceptance criteria for adding dark mode to a Q-Words game application

Figure 5: Jira ticket showing user story and acceptance criteria for adding dark mode to a Q-Words game application

Figma design showing dark and light mode interfaces for a QWords game application

Figure 6: Figma design showing dark and light mode interfaces for a QWords game application

Integrating MCPs into your development workflow

Let’s begin by asking Q Developer to check on tasks assigned to me in Jira by typing the following prompt in the agentic chat:

List issues that I need to work on

Q Developer will understand your intent and interact with your Atlassian MCP server to filter and show Jira issues that are assigned to you and in the To Do state. You can optionally prompt Q Developer to use a particular MCP server. Just as with any prompt, providing clear instructions will yield better results. In the image below, Q Developer retrieves details for the issue I’m assigned to work on.

Q Developer retrieves and describes issues assigned to me in Jira using the Atlassian MCP server

Figure 7: Q Developer retrieves and describes issues assigned to me in Jira using the Atlassian MCP server

Let’s begin work on the issue with the following prompt:

Move issue CRM-9 to In Progress and checkout a new git branch named after the issue id to begin working on it

Prompt Q Developer to begin working on an assigned issue

Figure 8: Prompt Q Developer to begin working on an assigned issue

Next, I’d like to understand the impact of the design changes on the current application. I can use the following prompt to accomplish this:

Analyze the Jira User Story and linked Figma design. Give me a technical implementation plan explaining the UI components that will need to be modified in the existing code.

Prompt Q Developer to help you analyze changes in existing code to implement the new UI

Figure 9: Prompt Q Developer to help you analyze changes in existing code to implement the new UI

Q Developer automatically pulls in issue details from Jira, along with the design specifics like colors from Figma. Before MCP, I would have had to add those details directly into the prompt or provided them as context from a local file. Now, my prompt only includes the description of the task whereas the context is enriched with details from the MCP servers. Review the proposed plan and suggest edits if needed. Once satisfied, prompt Q Developer to begin working on the changes:

Implement the plan

The diff view of changes by Q Developer to implement a dark mode feature in HTML and CSS

Figure 10: The diff view of changes by Q Developer to implement a dark mode feature in HTML and CSS

After reviewing the diff of the files changed by Q Developer, I can verify that the new Dark Mode feature has been implemented as desired. Let’s test the changes and ensure all acceptance criteria is met. To run the application, I use the following prompt:

Run the application locally

Q Developer will ask permission and run commands to spin up the local web server. I can then test the changes in my browser.

Updated application with dark mode toggle button implemented by Q Developer using MCP

Figure 11: Updated application with dark mode toggle button implemented by Q Developer using MCP

After a bit of testing, I can confirm that we’ve met all the acceptance criteria for the story. Let’s update the rest of the team on what we’ve accomplished with the following prompt:

Update the Jira issue status to Done and add a comment summarizing the changes made.

This convenient integration between Q Developer and Jira via MCP, saves me the back and forth between different tools to document the work accomplished.

A Jira ticket comment detailing the completed implementation of dark mode features, including theme toggle, CSS variables, and UI components

Figure 12: A Jira ticket comment detailing the completed implementation of dark mode features, including theme toggle, CSS variables, and UI components

Conclusion

The addition of MCP support in Amazon Q Developer for the IDE provides a standardized way to share context and interact with additional tools. In this post, I’ve demonstrated how I can use Q Developer in the IDE to interact with Atlassian Jira for task management and Figma for UI updates. I was able to do this without explicitly including user story details in my prompts or separately downloading design assets from UI mockups. Instead, Q Developer could automatically access user story context and easily integrate design assets using tools exposed by MCP servers. I encourage you to explore the new MCP capabilities and also check out the AWS MCP Servers repository on GitHub. Refer MCP configuration for Q Developer in the IDE to learn more.

To learn more about Amazon Q Developer’s features and pricing details, visit the Amazon Q Developer product page.

About the Author

Ritik Khatwani

Ritik Khatwani

Ritik is a Generative AI Specialist Solutions Architect at AWS based in New York City. He has deep expertise in building products as an engineer, architect, and founder. At AWS, he previously advised startups on how to build and grow in the cloud and now works with developers to reimagine their software development lifecycle using Amazon Q Developer.

Amazon Q Developer Java Upgrades: A Deep Dive into the New Selective Transformation Feature

Post Syndicated from Venugopalan Vasudevan original https://aws.amazon.com/blogs/devops/amazon-q-developer-java-upgrades-a-deep-dive-into-new-selective-transformation-feature/

In the ever-evolving landscape of Java development, keeping applications up-to-date while minimizing risk has become increasingly challenging. Amazon Q Developer transformation capabilities now support customization of Java upgrades in Java upgrade transformation CLI (command line interface) with a new selective transformation feature. Selective transformation empowers development teams with greater control over their modernization journey. Instead of risky “big bang” upgrades, teams can now precisely target specific components and libraries for transformation while maintaining application stability. This surgical approach to modernization supports two key scenarios: individual developer-driven upgrades and orchestrated transformation campaigns managed by Center of Excellence (CoE) teams.

Using this feature, you can use natural language chat and/or an input file to tailor transformation plans and exercise greater control over Java upgrades. The following options are supported:

  1. Selection of steps from a transformation plan and breakdown of a transformation job for granular code reviews.
  2. Selection of first-party and third-party dependencies, along with their versions, that should be upgraded during JDK version upgrades.

In this blog post, we’ll explore how Java upgrade transformation CLI’s selective transformation capabilities help development teams efficiently manage Java version upgrades, reduce technical debt, and modernize their applications with minimal disruption. We’ll demonstrate practical examples of various scenarios of upgrading First-Party and Third-Party dependencies and also using an input file or natural language to guide the transformation process.

About Selective Transformation

With introduction of this selective transformation feature, the java upgrades will be completed in two phases:

  • Job 1 – Minimum JDK Upgrade: The first qct transform command will focus on performing the minimum changes necessary to upgrade the project JDK version.
  • Job 2 – Dependency Upgrade: To upgrade the project’s dependencies, run the qct transform command again on the newly upgraded Java 17/21 project. This second job will then handle only the dependency upgrades.

Dependency Upgrade Input file

Dependency upgrade file is an optional input to the qct transform command where the user can specify the versions of first-party and third-party dependencies that needs to be upgraded.

  • Structure the dependency_upgrade.yml (or any other name you prefer) in the following format:
name: dependency-upgrade
description: "Custom dependency version management for Java migration from JDK 8/11/17 to JDK 17/21"

dependencyManagement:
  dependencies:
    - identifier: "groupId:artifactId" # Required
      targetVersion: "2.1.0" # Required
      versionProperty: "library1.version"  # Optional
      originType: "FIRST_PARTY" # or "THIRD_PARTY"  # Required
    - identifier: "com.example:library2" # Required
      targetVersion: "3.0.0" # Required
      originType: "THIRD_PARTY" # Required
  plugins:
    - identifier: "groupId:artifactId"
      targetVersion: "1.2.0"
      originType: "THIRD_PARTY"
      versionProperty: "plugin.version"  # Optional
  • For each dependency or plugin you want to upgrade:
    • Under dependencies or plugins, add a new entry.
    • Specify the identifier
    • Set the targetVersion to the desired version.
    • Specify originType as “FIRST_PARTY” or “THIRD_PARTY”.
    • Optionally, include versionProperty if the version is managed by a property.
  • When running the migration command, include the --dependency_upgrade_file flag followed by the path to your YML file:
qct transform \
--source_folder <path-to-folder>\
--target_version <17 or 21> \
--dependency_upgrade_file <path-to-dependency_upgrade.yml>\
--no-interactive

Interactive and No-Interactive Mode

You can run the selective transformation upgrades in either no-interactive or interactive mode

For no-interactive mode , you need to specify --no-interactive flag , where the transformation will proceed with planning and execution without waiting for any user input in an interactive fashion.

Interactive mode is a new “chat” option in the CLI where once the plan is generated, user can type feedback in natural language and specify to skip steps or specify particular versions of dependencies to be upgraded to guide the transformation process.

Interactive Mode Usage Examples:

  1. Ask to change dependencies “Can you upgrade junit to version 4.15 instead of 4.12?”
  2. Ask to remove steps “Can you skip plan step 3”
  3. Ask to remove certain dependencies “I don’t want my springboot to be upgraded at this time”
  4. Invalid Input (should be thrown away and will prompt again) “What is the capital of France?”
  5. Start message: “The plan looks good” or “Go ahead with transformation” or “Looks Good”
  6. Add first party dependency “Could you help me also upgrade the dependency XXX:XXXX”

Example Transformation

Pre-requisites:

  1. Refer to the link for general instructions on installation of transformation CLI : https://docs.aws.amazon.com/amazonq/latest/qdeveloper-ug/run-CLI-transformations.html
  2. Clone the repo from https://github.com/aws-samples/aws-appconfig-java-sample

Mode 1 : Interactive : Upgrade Java v1.8 to Java v21

We will use interactive mode to transform this 1.8 project to 21 along with a 1P dependency upgrade to 21 as well.

Refer to example 1p dependency upgrade file

Initiate the transformation using command below:

qct transform \
--source_folder /home/ec2-user/qct/aws-appconfig-java-sample\
--target_version 21 \
--dependency_upgrade_file /home/ec2-user/qct/dependency_upgrade_1p.yml\
--no-interactive

Amazon Q performs transformations based on your project's requests, descriptions, and content. To maintain security, avoid including external, unvetted artifacts in your project repository and always validate transformed code for both functionality and security. Do you want to proceed? [Y/N]: Y

Choose Y to proceed with the transformation.

Once the Job is accepted, during the planning phase, agent will display the plan based on the input dependency upgrade file provided to include 1P upgrade as part of the plan. (if no dependency upgrade file is provided, user can still provide feedback on the plan). Here we say Looks good, proceed with the transformation.

For this transformation, I'll make the necessary changes to upgrade your Java 8 application to Java 21.

Here is the transformation plan that includes your first party dependencies:
Step 0: Minimal migration to Java 21
Step 1:

            * Update/Add 1P dependency com.amazonaws.samples:movie-service-utils to version 0.3.0

If you would like to modify the plan, you can ask me to:

    * Add first party dependencies and versions to upgrade to
    * Change the target versions of the first party dependencies

You can enter plan feedback, or let me know if you want to start the transformation now: Looks good, proceed with the transformation

If is there is any user feedback , the agent will display the revised plan for the user to accept, if not it will proceed with the transformation. Upon completion, the agent will display the status, provide the location of the summary file containing the changes, and confirm the creation of a new branch with these changes. You can run git diff mainlineto review the changes and accept.

Fig 1 part of pom.xml changes after transformation from 8 to 21

Fig 1: part of pom.xml changes after transformation from 8 to 21

The transformation agent was able to upgrade Java 8 to Java 21 version along with dependencies minimally required for v21 and also the 1P dependency specified in the upgrade file.

Mode 1 : Interactive : Upgrade dependencies

Initiate the transformation using the same command as seen below:

qct transform \
--source_folder /home/ec2-user/qct/aws-appconfig-java-sample\
--target_version 21 \

Once the Job is accepted, during the planning phase, the transformation agent will display the transformation plan and ask the user input for any feedback to upgrade 3P dependencies to a specified version if needed.

For this transformation, I'll upgrade libraries and other dependencies to modernize your Java 21 application.

Here is the transformation plan:
Step 1:

        * Update javax.validation:javax.validation-api

Step 2:

        * Update org.mockito:*
        * Update org.springframework.boot:spring-boot-starter-parent to version 3.3.4
        * Update org.springframework.boot:spring-boot-starter-test to version 3.3.4

Step 3:

        * Update org.apache.logging.log4j:*

Step 4:

        * Update org.springframework.boot:spring-boot-maven-plugin to version 3.3.4
        * Update org.springframework.boot:spring-boot-starter-web to version 3.3.4

Step 5:

        * Update org.apache.logging.log4j:log4j-api to version 2.24.0
        * Update org.apache.logging.log4j:log4j-core to version 2.24.0

Step 6:

        * Update org.json:json to version 20240303

Step 7:

        * Update software.amazon.awssdk:appconfig to version 2.28.6
        * Update software.amazon.awssdk:bom to version 2.28.6

If you would like to modify the plan, you can ask me to:

* Only upgrade certain libraries
* Change the target version of a library
* Only perform certain steps in the plan

You can enter plan feedback, or let me know if you want to start the transformation now:

For this example,

Let’s say "Skip Step 6, upgrade org.springframework.boot:spring-boot related libraries and plugin to 3.4.5, upgrade software.amazon.awssdk:appconfig to version 2.31.40 and Update software.amazon.awssdk:bom to version to 2.31.40"

Transformation agent will display the revised plan for the user to accept, and ask confirmation to proceed with the transformation.

Here is the updated transformation plan:
Step 1:

        * Update javax.validation:javax.validation-api

Step 2:

        * Update org.mockito:*
        * Update org.springframework.boot:spring-boot-starter-parent to version 3.4.5
        * Update org.springframework.boot:spring-boot-starter-test to version 3.4.5

Step 3:

        * Update org.apache.logging.log4j:*

Step 4:

        * Update org.springframework.boot:spring-boot-maven-plugin to version 3.4.5
        * Update org.springframework.boot:spring-boot-starter-web to version 3.4.5

Step 5:

        * Update org.apache.logging.log4j:log4j-api to version 2.24.0
        * Update org.apache.logging.log4j:log4j-core to version 2.24.0

Step 6:

        * Update software.amazon.awssdk:appconfig to version 2.31.40
        * Update software.amazon.awssdk:bom to version 2.31.40

If you would like to modify the plan, you can ask me to:

* Only upgrade certain libraries
* Change the target version of a library
* Only perform certain steps in the plan

You can modify the plan 4 more time(s) before I start the transformation.

You can enter plan feedback, or let me know if you want to start the transformation now: Looks good

Fig 2 part of pom.xml changes after dependency upgradesFig 2: part of pom.xml changes after dependency upgrades

The transformation agent was able to upgrade 3P dependencies specified via the interactive mode during the planning stage.

Mode 2 : No-Interactive : Java v1.8 to Java v21

We will use no-interactive mode to transform this 1.8 project to 21 along with 1P version upgrades with dependency upgrade

The transformation agent will not wait for any user inputs and directly upgrade the project from Java 1.8 to 21 with along with dependencies minimally required for this upgrade.

Refer to example 1p dependency upgrade file

Initiate the transformation using command below:

qct transform \
--source_folder /home/ec2-user/qct/aws-appconfig-java-sample \
--target_version 21 \
--dependency_upgrade_file /home/ec2-user/qct/dependency_upgrade_1p.yml \
--no-interactive

Fig 3 part of pom.xml changes showing 1P upgrades

Fig 3: part of pom.xml changes showing 1P upgrades

The transformation agent was able to upgrade the Java version along with 1P dependency specified.

Mode 2 : No-Interactive : Upgrade dependencies

We will use no-interactive mode to upgrade the 3P dependencies

Refer to example 3p dependency upgrade file

Initiate the command below:

qct transform \
--source_folder /home/ec2-user/qct/aws-appconfig-java-sample \
--target_version 21 \
--dependency_upgrade_file /home/ec2-user/qct/dependency_upgrade_3p.yml \
--no-interactive

Fig 4 of pom.xml changes showing 3P upgrades

Fig 4: part of pom.xml changes showing 3P upgrades

The transformation agent was able to upgrade 3P dependencies along with the versions provided by the user via the dependency upgrade file.

Conclusion

The introduction of selective transformation in Java upgrade transformation CLI marks a significant evolution in how teams can approach Java modernization. By offering granular control over upgrade paths, supporting natural language interactions, and enabling targeted dependency management, this feature transforms what was once a daunting technical challenge into a manageable, incremental process. As a next step, start by identifying your most critical components that need upgrading, and leverage the selective transformation feature to create a tailored upgrade strategy. Visit the Amazon Q Developer transformation CLI documentation to learn more about implementing these capabilities in your development workflow, and join the growing community of developers who are revolutionizing their approach to Java modernization. The future of efficient, risk-managed Java upgrades is here – it’s time to embrace it.

About the authors

saptob Saptarshi Banerjee serves as a Senior Solutions Architect at AWS, collaborating closely with AWS Partners to design and architect mission-critical solutions. With a specialization in generative AI, AI/ML, serverless architecture, Next-Gen Developer Experience tools and cloud-based solutions, Saptarshi is dedicated to enhancing performance, innovation, scalability, and cost-efficiency for AWS Partners within the cloud ecosystem.
sureshnt Sureshkumar Natarajan is a Senior Technical Account Manager at AWS based in Denver, CO. He specializes in supporting Greenfield and SMB customers on the AWS platform. His expertise includes AWS Generative AI Services, AWS ECS/EKS Container solutions, and helping Enterprise Support customers to build well-architected solutions in AWS
vasudeve Venugopalan is a Senior Specialist Solutions Architect at Amazon Web Services (AWS), where he specializes in AWS Generative AI services. His expertise lies in helping customers leverage cutting-edge services like Amazon Q, and Amazon Bedrock to streamline development processes, accelerate innovation, and drive digital transformation.

Access Claude Sonnet 4 in Amazon Q Developer CLI

Post Syndicated from Kirankumar Chandrashekar original https://aws.amazon.com/blogs/devops/access-claude-sonnet-4-in-amazon-q-developer-cli/

Amazon Q Developer now supports Claude Sonnet 4 within the CLI, bringing advanced coding and reasoning capabilities to your development workflows at no additional cost. This latest model excels in coding with a state-of-the-art 72.7% for agentic coding on the SWE-bench (see Claude 4 announcement for more information). With enhanced coding and reasoning capabilities, it helps you analyze complex code, optimize everyday development tasks, implementing bug fixes, running bash commands, and developing new features with immediate feedback loops and more precise responses.

To help you leverage Claude Sonnet 4, Amazon Q Developer lets you easily select specific Claude Sonnet models, giving you increased flexibility the CLI.

  • Claude Sonnet 4: High-performance model with balanced intelligence
  • Claude Sonnet 3.7: High-performance model with extended thinking capability
  • Claude Sonnet 3.5: High-performance intelligent model

For detailed information about Claude model capabilities and comparison, refer to the Anthropic models overview.

In this blog, I will show you how to select Claude Sonnet 4 as your model within the Q Developer CLI and then walk you through a quick demo.

How to Choose Claude Sonnet 4

Make sure to update to the latest version (v1.11.0 onwards) of Amazon Q Developer CLI. Refer installing Amazon Q for command line for installation instructions. You can access Claude Sonnet 4 through these options:

  • During an active chat, use the /model command and select claude-4-sonnet
  • Start a new chat with q chat --model claude-4-sonnet
  • Set it as your default model using q settings chat.defaultModel claude-4-sonnet.

The supported model names for the --model parameter and settings are:

  • claude-3.5-sonnet
  • claude-3.7-sonnet (default)
  • claude-4-sonnet

Model Selection Priority Order

Q Developer CLI selects models in the following order:

  1. Current session model selections (via /model or --model)
  2. User-configured preferences in settings
  3. System default (Claude 3.7 Sonnet)

Key Behaviors

The Q Developer CLI agent defaults to Claude 3.7 Sonnet when no specific model is selected. During active chat sessions, you can seamlessly switch between models using the /model command. Chat continuity is maintained across sessions, with the system retaining the previously selected model when conversations are resumed. If you prefer Claude Sonnet 4, setting it as the default model in user settings will automatically apply to all new chat sessions, though this can be overridden with specific model selections as needed.

qcli-model-selection

Figure 1: Q Developer CLI showing the model loaded for the session

Claude Sonnet 4 with Q Developer CLI in Action

After switching to Claude Sonnet 4 in Q Developer CLI, let’s explore its capabilities with a practical coding example. Here’s the prompt I’ll use for this demonstration:

Create a Python command-line to-do list app with these features:
- Add tasks with descriptions and priorities (low/medium/high)
- Mark tasks as complete by index
- Display tasks sorted by priority, then insertion order
- Show completion status ([x] done, [ ] pending)
- Handle errors for empty tasks and invalid indices
- Store tasks in memory only
Please provide the code to implement this application.

qcli-model-selection-claude-sonnet-in-action

Figure 2: Q Developer CLI interface showing Claude Sonnet 4 in action

In the above demonstration, Q Developer CLI with Claude Sonnet 4 went beyond what was asked in the provided requirements in the prompt by implementing sophisticated command parsing with quoted descriptions, comprehensive error handling, and clean object-oriented design enhanced by type hints. The interface features a helpful guidance system with clear error messages, elegant enum-based priority management, and formatted output for clear task representation.

Additionally, Q Developer CLI with Claude Sonnet 4 also generated documentation in the README for the to-do application, including practical error handling examples and clear usage instructions – transforming the prompt requirements into a well-structured, user-friendly application.

Conclusion

The availability of Claude Sonnet 4 represents a significant advancement in Amazon Q Developer’s capabilities. From intricate code refactoring to streamlined documentation creation, Claude Sonnet 4 helps you accomplish both complex and routine development tasks efficiently.

Whether selecting Claude Sonnet 4 for complex tasks or using other models for specific needs, Amazon Q Developer adapts to your preferences, optimizing AI assistance while maintaining efficiency in your workflow.

The latest version(v1.11.0) of Amazon Q Developer awaits in the CLI, ready to support your development journey with enhanced model capabilities and selection options. Refer Installing Amazon Q for Command line for installation instructions.

To learn more about Amazon Q Developer’s features and pricing details, visit the Amazon Q Developer product page.

About the Author

kirankumar.jpeg

Kirankumar Chandrashekar is a Generative AI Specialist Solutions Architect at AWS, focusing on Amazon Q Developer. Bringing deep expertise in AWS cloud services, DevOps, modernization, and infrastructure as code, he helps customers enhance their development workflows using Amazon Q Developer. Kirankumar is passionate about solving complex customer challenges and enjoys music, cooking, and traveling.

Streamline your Eclipse workflows with Amazon Q Developer, now generally available

Post Syndicated from Madhu Balaji original https://aws.amazon.com/blogs/devops/streamline-your-eclipse-workflows-with-amazon-q-developer-now-generally-available/

Today, we’re excited to announce the general availability of Amazon Q Developer plugin for the Eclipse integrated development environments (IDE). This release builds upon the developer experience introduced in our November 2024 public preview, bringing powerful AI-assisted development capabilities directly into Eclipse 2025-03(4.35.0) and later versions. The integration significantly improves how developers write, test, and maintain code by providing intelligent code suggestions, automated code generation, and real-time AI assistance within their familiar IDE environment.

Understanding the agentic coding experience

At its core, Amazon Q Developer functions as an intelligent coding companion in your Eclipse IDE, offering real-time collaboration through natural language interaction. What sets it apart is its agentic nature – Amazon Q Developer understands your project structure, can read and modify files, execute commands, and maintain conversation history throughout your development session. This deep integration helps developers stay focused within their IDE while leveraging AI assistance for various development tasks.

As a developer working on complex projects, I’m particularly excited to see Amazon Q Developer’s agentic coding experience now available in Eclipse IDE. It’s not just a passive tool – it’s an active participant that provides transparent reasoning for its suggestions and gives developers choice between automated modifications or step-by-step confirmation of changes. Amazon Q Developer maintains awareness of your entire conversation history and project workspace, making each interaction more meaningful and productive. This deep contextual understanding allows developers to receive accurate and targeted assistance, bringing the same powerful development experience that has already transformed how developers work in other IDEs.

Key Capabilities and Features

Amazon Q Developer brings a comprehensive set of capabilities designed to enhance your development workflow in Eclipse IDE:

Interactive development support: Through natural language interactions, Amazon Q Developer assists with code generation, bug fixing, tests and optimization. You can describe your requirements conversationally, and the Amazon Q Developer will suggest implementations while explaining its reasoning. This includes generating entire functions, classes, or application components while maintaining consistency with your existing codebase.

Context actions: Using special prompts like @workspace, @files, and @folders, Amazon Q Developer can access and understand specific parts of your project. For example, @workspace provides full visibility of your project structure, while @files lets you focus on specific files for targeted assistance. This granular control ensures that Amazon Q Developer’s responses are precisely tailored to the relevant parts of your codebase.

Rules and standards configuration: Teams can establish custom development standards by configuring rules in the .amazonq/rules/ directory. These rules govern coding standards, testing requirements, security protocols, and documentation practices. For example, you can define specific patterns for error handling, logging standards, or architectural preferences that Amazon Q Developer will follow in its suggestions and code generation.

Multi-language Support: Amazon Q Developer supports interactions in multiple languages, including English, Mandarin, French, German, Italian, Japanese, Spanish, Korean, Hindi, and Portuguese. This allows developers to communicate with Amazon Q Developer in their preferred language while maintaining the same level of development support.

Let’s see it in Action

To begin using Amazon Q Developer for the first time, follow the steps in the Getting Started with Amazon Q Developer guide to access Amazon Q Developer. When using Amazon Q Developer, you can choose between Amazon Q Developer Pro, a paid subscription service, or Amazon Q Developer Free tier with AWS Builder ID user authentication.

For existing users, update to the new version. Refer to Using Amazon Q Developer in the IDE for activation instructions.

To start, you select the Amazon Q Developer icon in the IDE to open the chat interface. By default, agentic chat is turned on. You can turn off the agentic chat by toggling the button in the chat.

Eclipse IDE interface showing Amazon Q Developer chat window with welcome message and file navigation panel on the left side

Amazon Q Developer’s welcome interface within Eclipse IDE

Start by describing your requirement in plain language

I started by asking Amazon Q Developer to help me create a REST API endpoint for user registration.

Help me create a REST API endpoint for user registration in the @workspace

After analyzing my workspace, Amazon Q Developer outlined a comprehensive plan that included creating a User model, registration controller, and setting up project dependencies. Noticing my project needed a proper build configuration, Amazon Q Developer proposed creating a Maven-based Spring Boot application structure and provided the necessary directory setup commands – demonstrating how Amazon Q Developer guides developers through the development process step by step.

Amazon Q Developer conversation interface showing step-by-step guidance for creating a REST API endpoint, including project structure analysis and Maven configuration setup

Step-by-step project setup guidance from Amazon Q Developer

Amazon Q Developer provides a structured solution with explanation

Following Amazon Q Developer’s guidance, I quickly had a fully functional REST API endpoint for user registration. Amazon Q Developer provided a comprehensive implementation, including a proper Maven project structure, essential model classes with validation, a REST controller, and the main application class. Amazon Q Developer even outlined the API usage, showing the expected JSON request format and response structure. It’s impressive how Amazon Q Developer not only generated the code but also included practical notes on validation and suggestions for production-ready improvements, demonstrating its understanding of best practices in software development.

Detailed summary screen showing the complete implementation of a REST API endpoint, including project structure, model classes, controller configuration, and JSON request/response examples

Complete REST API implementation summary with code examples

Build and run the application

With Amazon Q Developer’s guidance, I progressed from project setup to a running application. Amazon Q Developer helped me build the project successfully, and I was able to run the Spring Boot application, watching as it initialized and started up. The console output confirmed that Tomcat was running and my UserApiApplication had launched successfully, demonstrating how Amazon Q Developer streamlines the development process from code generation to a functioning API endpoint.

Terminal output showing successful Spring Boot application build and succesful startup with Maven build logs

Amazon Q Develeper agentic coding builds the application

Console output showing successful Spring Boot application startup logs with Tomcat server initialization, displaying timestamps and INFO messages indicating the application started on port 8080 with a total startup time of 1.57 seconds.

Successful build and launch of the Spring Boot REST API application

Multi-language support in Eclipse IDE

Side-by-side comparison of Amazon Q Developer conversations in English, Spanish, French and Hindi, all discussing the creation of a REST API endpoint for user registration in SpringBoot.

Q Developer supports multiple languages

Sample rules and standard setup for a project

A sample rule file for Spring Boot applications, stored in the .amazonq/rules directory at the project root, guides Amazon Q Developer’s actions.

# Spring Boot Project Setup for Eclipse IDE

Rules for setting up a standard Java Spring Boot 3-tier web application backend in Eclipse IDE

## Project Structure

Standard Spring Boot 3-tier application structure:
- `src/main/java/${packagePath}/controller`: REST controllers
- `src/main/java/${packagePath}/service`: Business logic services
- `src/main/java/${packagePath}/repository`: Data access repositories
- `src/main/java/${packagePath}/model`: Domain models/entities
- `src/main/java/${packagePath}/dto`: Data Transfer Objects
- `src/main/java/${packagePath}/exception`: Custom exceptions
- `src/main/java/${packagePath}/config`: Configuration classes
- `src/main/resources`: Configuration files, static resources, templates
- `src/test/java`: Test source code
- `src/test/resources`: Test configuration and resources

## Eclipse Configuration

Eclipse-specific settings:
- Java Compiler: Java 17
- Project Facets: Java
- Maven Integration
- Spring Tools 4 support

## Maven Configuration

Standard Maven configuration for Spring Boot:
- groupId: `${groupId:com.example}`
- artifactId: `${artifactId:demo}`
- version: `${version:0.0.1-SNAPSHOT}`
- name: `${name:demo}`
- description: `${description:Spring Boot Demo Project}`

### Dependencies
- org.springframework.boot:spring-boot-starter-web
- org.springframework.boot:spring-boot-starter-data-jpa
- org.springframework.boot:spring-boot-starter-validation
- org.springframework.boot:spring-boot-starter-test
- org.springframework.boot:spring-boot-devtools
- com.h2database:h2

## Application Properties

Standard application properties configuration:
```properties
# Server configuration
server.port=${serverPort:8080}
spring.application.name=${applicationName:demo}

# Database configuration
spring.datasource.url=jdbc:h2:mem:testdb
spring.datasource.driverClassName=org.h2.Driver
spring.datasource.username=sa
spring.datasource.password=password
spring.jpa.database-platform=org.hibernate.dialect.H2Dialect
spring.h2.console.enabled=true

# Logging
logging.level.root=INFO
logging.level.org.springframework.web=INFO
logging.level.org.hibernate=ERROR
```

Amazon Q Developer analyzes the workspace and creates a complete Spring Boot REST API project structure, including the Maven POM file, application properties, and appropriate directory hierarchy. It follows defined standard rules to ensure the project setup aligns with best practices, saving developers time and reducing setup complexity.

Getting Started

To begin using Amazon Q Developer in Eclipse IDE:

  1. Install Eclipse IDE 2025-03 or later
  2. Configure AWS credentials in your environment
  3. Install Amazon Q Developer plugin from Eclipse Marketplace or go to Help > Eclipse Marketplace , search for Amazon Q > Install

Conclusion

With the addition of Amazon Q Developer in Eclipse IDE, developers now have access to AI-assisted development capabilities directly within their familiar development environment. The agentic coding experience brings an intelligent, interactive coding companion to Eclipse IDE users, enabling them to write, test, and maintain code more efficiently. Features like multi-language support , customizable rules for team standards, and powerful workspace commands make Amazon Q Developer a valuable addition to the Eclipse IDE ecosystem.

As we continue to enhance Amazon Q Developer’s agentic coding capabilities in Eclipse IDE, we remain committed to supporting developers in their daily development tasks. Amazon Q Developer actively participates in your development process, offering real-time suggestions, generating code, and adapting to your project’s specific needs. We invite you to explore Amazon Q Developer in Eclipse IDE and experience how this agentic AI can transform your development workflow.

To learn more about Amazon Q Developer’s features and pricing details, visit the Amazon Q Developer product page.


Madhu Balaji

Madhu is a Senior Specialist Solutions Architect at AWS who helps customers design and implement innovative cloud solutions. With 20+ years of experience in development and application architecture, he focuses on enabling customers to accelerate their time-to-market and solve complex business challenges using AWS services.

Introducing an agentic coding experience in Visual Studio and JetBrains IDEs

Post Syndicated from Artur Rodrigues original https://aws.amazon.com/blogs/devops/introducing-an-agentic-coding-experience-in-visual-studio-and-jetbrains-ides/

Developers spend countless hours on repetitive tasks like debugging code, writing unit tests, and validating build processes – time that could be better spent on innovation and problem-solving. To address these challenges, Amazon Q Developer has expanded its intelligent coding assistant capabilities to Visual Studio and JetBrains Integrated development environments (IDEs). This new agentic experience works proactively on your behalf, automatically analyzing your workspace, generating code fixes, and executing commands to streamline your development workflow.

In this blog post, we’ll explore how Amazon Q Developer automates unit test creation and execution to validate code changes, streamlines build processes by identifying and resolving common issues.

In May 2025, our colleague Brian Beach wrote about the new agentic coding experience in Amazon Q Developer for VS Code. By extending the agentic experience to Visual Studio and JetBrains IDEs, Amazon Q Developer now brings intelligent automation to even more developers.

Benefits for Developers

Amazon Q Developer transforms the way developers work by seamlessly integrating AI assistance into their daily workflow without switching contexts or leaving their preferred development environment. Using features like @workspace and @files, you can get highly relevant recommendations in your IDE. With Q Developer’s ability to take actions like generating code diffs and running commands, you can automate repetitive coding tasks, implement complex features faster, and troubleshoot issues without breaking your flow. With support for multiple languages including English, Mandarin, Japanese, and Spanish, Amazon Q Developer makes advanced AI assistance accessible to development teams worldwide, fostering inclusive collaboration across global organizations.

Maximizing Development Efficiency with Amazon Q Developer

Amazon Q Developer revolutionizes your development workflow by offering a comprehensive set of capabilities within your IDE. Let’s explore how this powerful tool leverages context to enhance your coding experience by using context features, codebase’s folders and rules.

You can explicitly guide Q Developer by defining specific files or folders in the prompt context. Don’t know where to find particular information? No problem! Q Developer can efficiently navigate through your codebase using @workspaces to gather relevant code snippets from multiple files. This is particularly important when you want to create documentation that spans multiple files or when you need to fix a bug and have no idea where you should start.

The agentic chat feature automatically derives context from the codebase’s folders and executes commands on your behalf. It has the same intelligent reasoning capability used in the Q Developer CLI, which has already won the hearts of many developers.

Context management extends to configuration through the .amazonq/rules/ directory. Within this directory, you can define rules for coding standards, testing requirements, security protocols, and documentation practices. Some customers have already created a rule that defines how Q Developer commits changes. This rule provides a template for a Git commit that details the message and for the agentic actions that modify files. It makes it much easier to identify and review the contributions of the Q Developer to your codebase.

Quick Tour of the Agentic Experience

Let us walk you through two use cases. In our example, we will use the Visual Studio IDE. Similar agentic capabilities are now supported in JetBrains IDEs as well. We invite you to follow along by cloning the Bob’s Used Books sample repo and opening it in Visual Studio 2022. Don’t forget to add or update the Amazon Q Developer extension.

Creating unit tests

The Bookstore.Domain project contains domain objects such as Book and ShoppingCart.

Bookstore.Domain project contains Book and Shopping cart classes.

Figure 1: Domain objects in Bookstore.Domain

We have a separate project called Bookstore.Domain.Tests that contains tests for the Book class.

A separate project - Bookstore.Domain.Tests contains tests for the Book class. BookTests class contains these tests.

Figure 2: Tests for Book class

We want to add unit tests for the ShoppingCart class. Let’s ask Amazon Q Developer to create unit tests for ShoppingCart. We also want Amazon Q Developer to follow the existing pattern of creating test classes in a separate test project.

By default, the agentic experience is on. If you are in the planning phase of the Software Development Lifecycle (SDLC) and prefer to use a traditional back-and-forth chat, you can turn the agentic experience. To toggle the agentic experience on and off, choose the angle bracket pair in the bottom left corner of your Q Developer chat window.

Then, we ask Q Developer “Can you create a test for @ShoppingCart.cs? Look at existing test and use the same libraries”. First, notice that we are giving a command instead of just asking a question. Second, we are referencing the file ShoppingCart.cs explicitly to provide Q Developer the appropriate context. In the following image, you can see that Q Developer is acting on our behalf. In agentic coding mode, Q Developer can take actions and run commands. In our example, it is reading files, writing to files, and running commands with your permission.

The agentic experience in Amazon Q Developer responding to our prompt and reading files in our workspace to gather context.

Figure 3: Prompt to create new tests

Using commands, Q Developer was able to analyze our solution structure, understand that we have a project called Bookstore.Domain.Tests, and create a new file containing unit tests for ShoppingCart.

The agentic experience in Amazon Q Developer generating a summary of the test cases it has created.

Figure 4: Summary of test cases

We can verify that there is a new file called ShoppingCartTests in the Bookstore.Domain.Tests project, which is aligned with our existing test creation strategy.

New file - ShoppingCartTests.cs contains the tests for ShoppingCart. Following the existing pattern in our code, Q Developer creates this file in the Bookstore.Domain.Tests project.

Figure 5: New file with generated test cases

In Visual Studio, we can now run the unit tests and verify that they pass.

Test results for the existing as well as new tests.

Figure 6: Successful test run of new tests

Resolving build errors

In the following example, we will demonstrate the power of the agentic coding experience by using Q Developer to build our application and resolve build errors.

In our example, we have deliberately misspelled one of the methods in the IShoppingCartRepository interface. The AddAsync method is now incorrectly spelled AddAsyn.

Spelling mistake in the name of a method. It is called AddAsyn instead of AddAsync.

Figure 7: Spelling mistake in a method name

When we try to build the Bookstore.Domain project, we get a build error as expected. Let’s ask Q Developer to fix the error. Without the agentic coding experience, we would have to copy the text of the build error into the chat window and ask Q Developer to provide recommendations. Then we would have to act on its recommendations by manually making changes and trying to build. This is one of many examples of the power of the agentic chat, which runs commands and uses the command’s output to enrich the context of the prompt to take actions.

With the agentic coding experience, we just ask Q Developer “Can you fix the error I am getting while building the solution? Please build and check it”. In the following image, you will see how Q Developer runs the .NET build commands to get build errors and read the relevant files.

Amazon Q Developer builds the solution, uses the build error to read the appropriate file, and finds the issue.

Figure 8: Building the solution

After it reads the files, it finds the spelling mistake and fixes it automatically. As shown in the following image, it then builds the solution to verify that its fix worked.

Amazon Q Developer fixes the spelling mistake in the code and runs the build again to confirm a successful build.

Figure 9: Fixing the spelling mistake

In the following image, Amazon Q Developer provides a summary of the error, the actions it took to build it. It even helps me with some recommendations to fix the warnings it got while running the build.

Amazon Q Developer provides a summary of build error, the resolution, and suggestions to resolve build warnings.

Figure 10: Summary of changes and suggestions

Conclusion

The addition of Amazon Q Developer’s agentic experience in Microsoft Visual Studio and JetBrains IDEs takes Amazon Q Developer beyond traditional chat-based interactions to intelligent, action-oriented assistance. The ability to automatically read files, generate code diffs, run shell commands, and validate changes demonstrates a level of autonomy that can significantly accelerate development tasks while maintaining code quality. The examples we’ve explored, from automated test creation to build error resolution, showcase how the agentic experience can streamline common development tasks that traditionally required multiple manual steps. This new capability, combined with multi-language support and customizable development standards, makes Amazon Q Developer a powerful ally in modern software development workflows. As development teams continue to seek ways to improve productivity without compromising code quality, Amazon Q Developer’s agentic experience represents a meaningful step forward in IDE-integrated AI assistance. Whether you’re writing tests, fixing bugs, or optimizing code, the ability to have an AI assistant that can not only suggest solutions but also implement them while maintaining context awareness is a game-changing addition to the developer’s toolkit.

Artur Rodrigues

Artur Rodrigues is a Principal Solutions Architect for Generative AI at Amazon Web Services (AWS), focused on the Next Generation Developer experience, enabling developers to work more efficiently and creatively through the integration of Generative AI into their workflows. Artur enjoys cycling and exploring the great outdoors of beautiful British Columbia in Canada. He is also a gelato aficionado and a fan of soccer and jiu-jitsu.

Neeraj Handa

Neeraj Handa is a Specialist Solutions Architect at Amazon Web Services, where he partners with enterprise customers to accelerate application development and modernization using Amazon Q Developer. He is passionate about helping organizations transform their software development lifecycle to achieve higher productivity and software quality through the use of AI technologies.