Plan and measure EC2 flexibility with Amazon EC2 Capacity Manager

Post Syndicated from Yagya Vir Singh original https://aws.amazon.com/blogs/compute/plan-and-measure-ec2-flexibility-with-amazon-ec2-capacity-manager/

Global enterprises that run thousands of workloads across hundreds of accounts often configure them to use multiple instance types and Availability Zones. This flexibility gives Amazon Elastic Compute Cloud (Amazon EC2) more options to fulfill each request. At that scale, you need to decide which instance types and Availability Zones to include, and have visibility into how well those choices are working.

To gain these insights, Amazon EC2 Capacity Manager offers real-time supportability checks and capacity fulfillment metrics. Supportability checks help you find capacity when you plan a workload by scoring how well each instance type and Availability Zone can support a request. They do this without launching or reserving instances. Capacity fulfillment metrics show whether you configured your launch requests to use multiple instance types and Availability Zones, their fulfillment rate, and where that capacity came from. They measure your actual launches, not the accuracy of a check. Together, they cover both sides of a scale up: deciding where to run, and measuring what was delivered.

Both capabilities are included with AWS Unified Operations, the AWS Support plan for global enterprises that run workloads at large scale. You can query data from all commercial AWS Regions using the Region in which you enabled EC2 Capacity Manager.
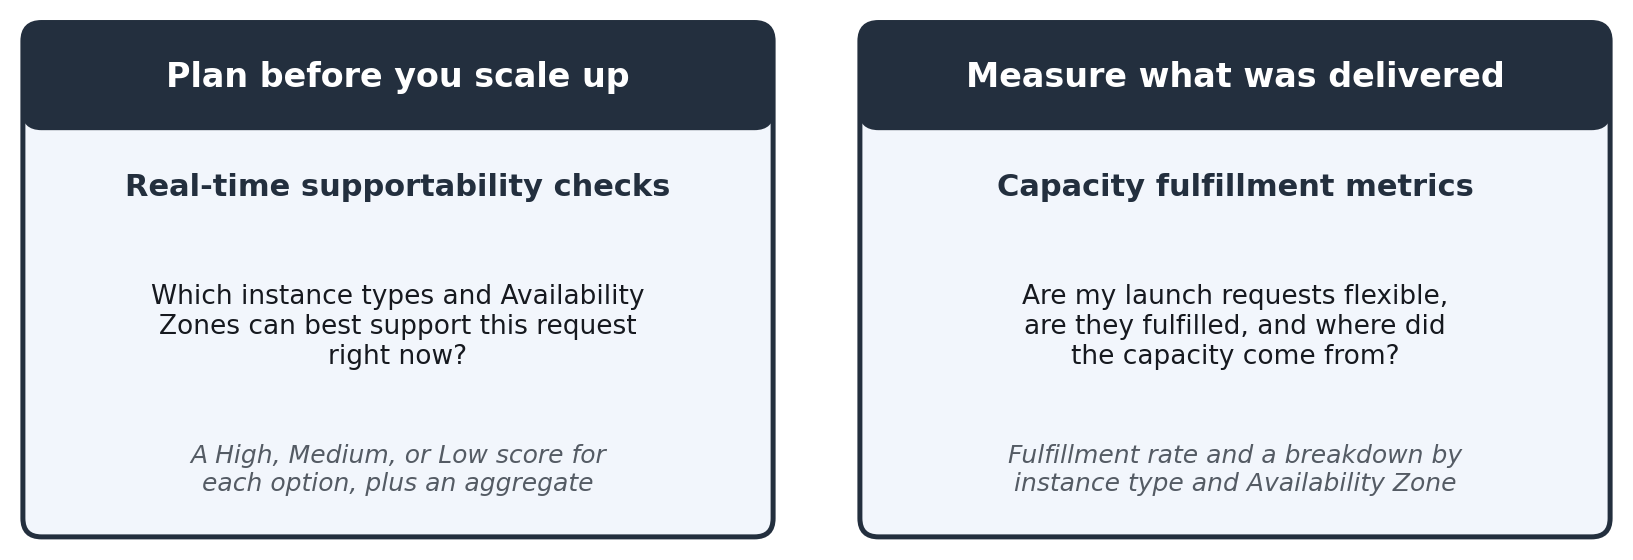
Two panels. Plan before you scale up: real-time supportability checks return a High, Medium, or Low score for each option plus an aggregate. Measure what was delivered: capacity fulfillment metrics show a fulfillment rate and a breakdown by instance type and Availability Zone.

Figure 1: Supportability checks score options before you scale up. Fulfillment metrics measure how your actual launches were fulfilled.

This post follows the platform team at AnyCompany, a global enterprise that supports several large scale ups each year. Before each one, the team wants to know which instance types and Availability Zones will best support a workload. In this post, a combination means one instance type in one Availability Zone, such as r5.16xlarge in use1-az5. Capacity Manager measures capacity in vCPUs, and each step shows the AWS Management Console path and the AWS Command Line Interface (AWS CLI) command.

Before you begin

  • Turn on Capacity Manager at the organization level (from the management account or a delegated administrator) or for a single account. Both capabilities work at either level. See Enabling EC2 Capacity Manager.
  • Confirm your support plan. Your account must be covered by AWS Unified Operations.
  • (Optional) To see metrics by workload, activate a workload tag as a monitored tag key. Some tags, including aws:eks:cluster-name and aws:autoscaling:groupName, are always available and need no activation. This post uses aws:eks:cluster-name. For more information, see Managing monitored tag keys.

Step 1: See whether your workloads are getting the capacity they need

Capacity fulfillment metrics start at the request level. A request that can use several combinations is fulfilled if any one of them delivers, so a high request fulfillment rate means flexibility is working. Capacity Manager tracks four request-level metrics.

Metric Console label What it tells you
CapacityTotalRequestedVcpu Requested (vCPUs) Capacity requested. Retries within five minutes for the same configuration count once.
CapacityTotalFulfilledVcpu Fulfilled (vCPUs) Capacity delivered.
CapacityRequestFulfillmentRate Request fulfillment rate Fulfilled divided by requested, vCPU-weighted.
AvgInstAzCountPerRequestedVcpu Instance Type x AZ count (avg) Combinations each request is configured to use. A value above 1 means the request is flexible.

These metrics break down by account, Region, and tag. To review them on the console, complete the following steps.

  1. Open the Fulfillment tab.
  2. Choose a date range and a metric set (On-Demand or Spot).
  3. Filter by a dimension, such as Region, account, or tag, to see one row for each value.
  4. Sort by Requested (vCPUs) to see your largest workloads first, or by request fulfillment rate to find the ones with the most room to improve.
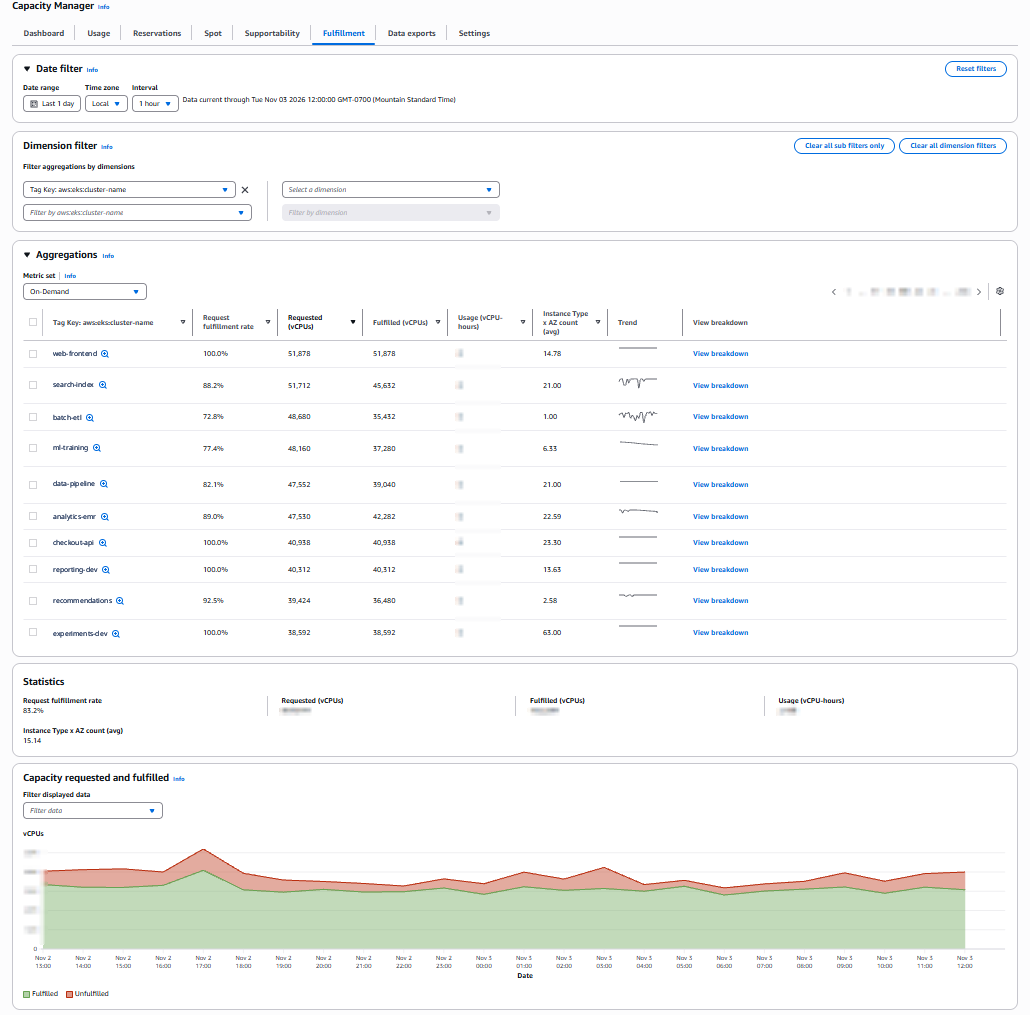
Capacity Manager Fulfillment tab listing workloads by the aws:eks:cluster-name tag, each row showing its request fulfillment rate and Instance Type x AZ count

Figure 2: The Fulfillment tab for an example account, filtered by the aws:eks:cluster-name tag. Each row shows one workload’s request fulfillment rate and Instance Type x AZ count.

At AnyCompany, the search-index workload requested 51,712 vCPUs and received 45,632, an 88.2 percent request fulfillment rate. Its requests could use an average of 21 combinations. Compare batch-etl, which can use only one combination and fulfills 72.8 percent. Step 2 shows where the search-index capacity came from and where it fell short.

To get the same data with the AWS CLI, call get-capacity-manager-metric-data. Spot metrics use a Spot prefix, such as SpotCapacityRequestFulfillmentRate.

aws ec2 get-capacity-manager-metric-data \
--metric-names capacity-request-fulfillment-rate avg-inst-az-count-per-requested-vcpu \
--start-time 2026-11-02T19:00:00Z --end-time 2026-11-03T19:00:00Z \
--period 86400 \
--filter-by 'DimensionCondition={Dimension=tag:aws:eks:cluster-name,Comparison=equals,Values=[search-index]}'

Step 2: See where your flexibility is paying off

The breakdown measures each combination on its own, so per-combination rates are usually lower than the request rate, which includes the benefit of diversification.
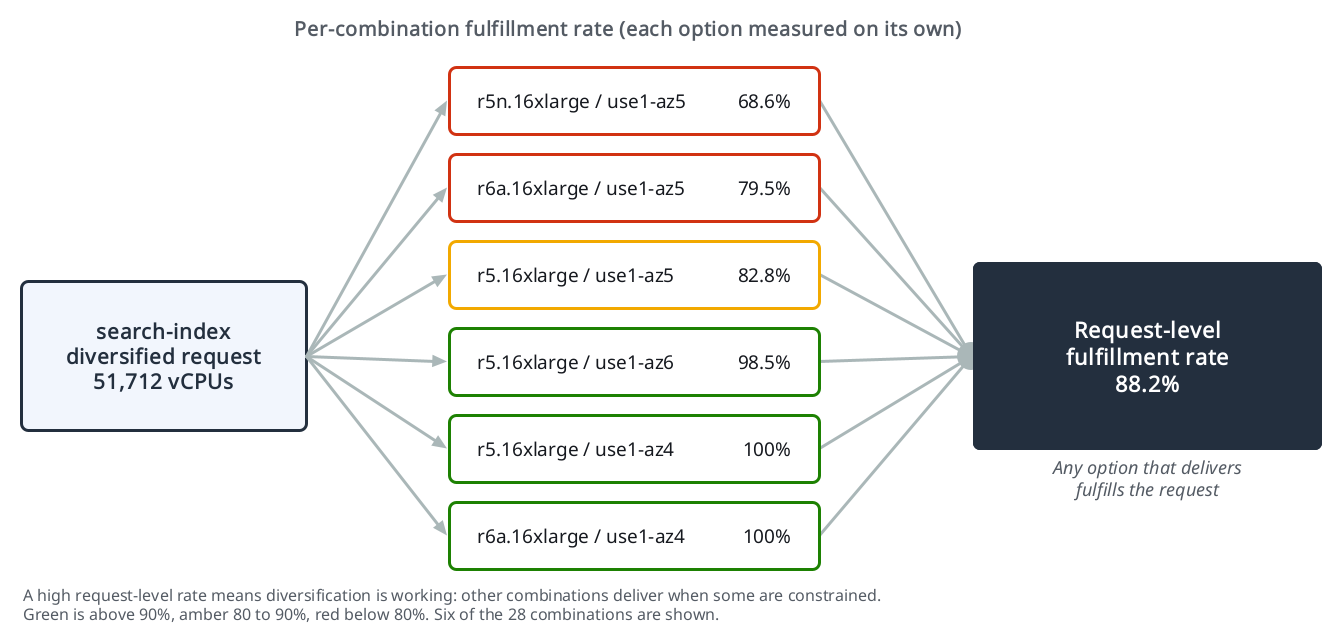
Breakdown for the search-index workload showing lower per-combination fulfillment rates against the 88.2 percent request rate

Figure 3: The search-index request is 88.2 percent fulfilled, while each combination is measured on its own.

In Figure 3, the three search-index combinations in use1-az5 deliver 68.6–82.8 percent of what is asked. Outside use1-az5, r5.16xlarge delivers 98.5–100 percent in use1-az4 and use1-az6, and r6a.16xlarge delivers 100 percent in use1-az4. Because the request can use any of these combinations, the other zones cover part of what use1-az5 can’t. So those zones are worth keeping, and use1-az5 is where to add options or reserve capacity.

On the console, choose View breakdown on any row of the Fulfillment tab. The breakdown lists each combination, and you can sort by fulfillment rate, fulfilled vCPUs, or usage. It adds instance type, instance family, and Availability Zone to the dimensions from Step 1.
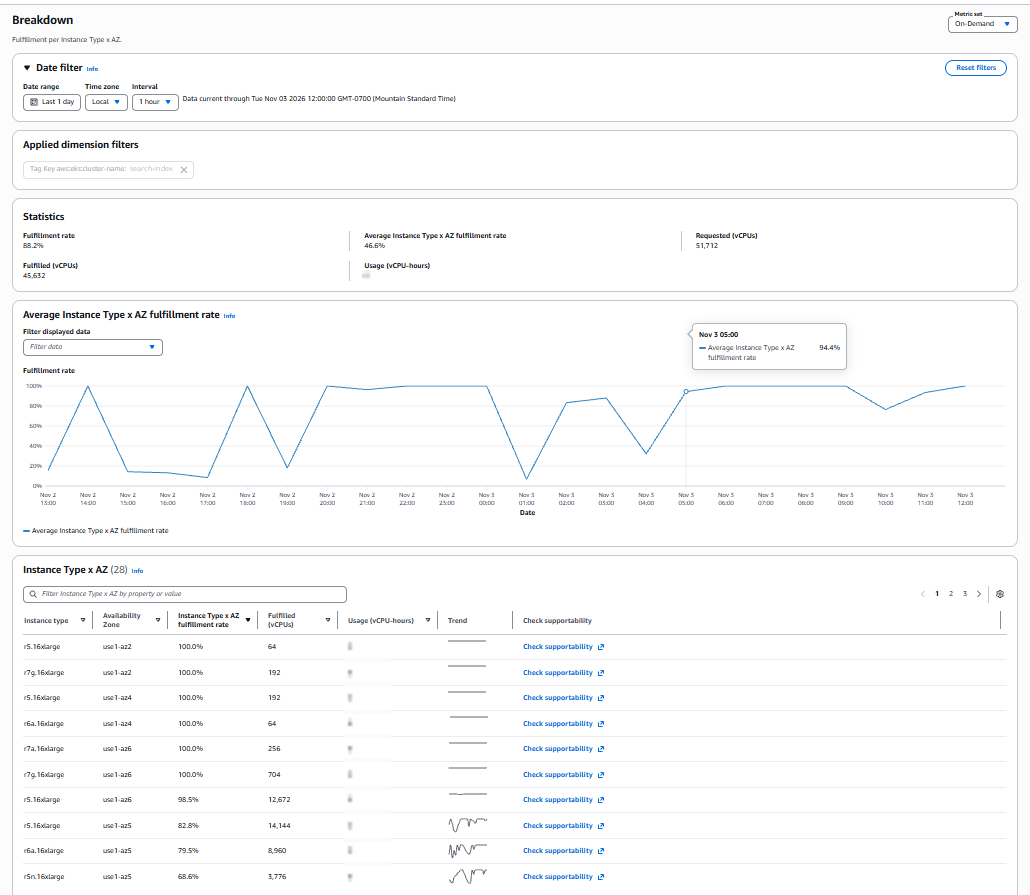
Fulfillment breakdown for search-index with per-combination rates and a Check supportability link on each row

Figure 4: The breakdown for the search-index workload, with a Check supportability link on each row.

In Figure 4, search-index fulfills 88.2 percent of requested capacity, while its 28 combinations average 46.6 percent on their own. The difference is what flexibility adds: when some combinations come up short, others deliver. The three use1-az5 combinations delivered 26,880 vCPUs, more than half of the 45,632 total, so that zone has the most room to improve. The Check supportability link on each row opens a check for that combination.

Through the API, query InstAzFulfillmentRate. The request must include the availability-zone-id dimension and either instance-type or instance-family.

aws ec2 get-capacity-manager-metric-data \
--metric-names inst-az-fulfillment-rate \
--start-time 2026-11-02T19:00:00Z --end-time 2026-11-03T19:00:00Z \
--period 86400 \
--group-by availability-zone-id instance-type \
--filter-by 'DimensionCondition={Dimension=tag:aws:eks:cluster-name,Comparison=equals,Values=[search-index]}'

Step 3: Find where capacity is strongest before you scale up

Before a large scale up or migration, the platform team runs a supportability check. They provide the market type (On-Demand or Spot), the capacity amount, the Availability Zones, and the instance types to consider. The check returns a High, Medium, or Low score for each combination, plus an aggregate score for the set. The following example checks a scale up for search-index: 100 instances across its three Availability Zones, with its three current instance types and two candidates, r6i.16xlarge and r7i.16xlarge.

aws ec2 get-capacity-manager-supportability-scores \
--market-type "on-demand" \
--capacity-amount 100 \
--capacity-unit "instances" \
--capacity-availability-zone-ids '["use1-az4", "use1-az5", "use1-az6"]' \
--instance-types '["r5.16xlarge", "r6a.16xlarge", "r7a.16xlarge", "r6i.16xlarge", "r7i.16xlarge"]'
{
  "AggregateScore": "high",
  "CapacityManagerSupportabilityScores": [
    {"InstanceType": "r5.16xlarge", "AvailabilityZoneId": "use1-az4", "Score": "high"},
    {"InstanceType": "r6a.16xlarge", "AvailabilityZoneId": "use1-az4", "Score": "medium"},
    {"InstanceType": "r7i.16xlarge", "AvailabilityZoneId": "use1-az6", "Score": "medium"},
    {"InstanceType": "r7a.16xlarge", "AvailabilityZoneId": "use1-az4", "Score": "low"},
    ...
  ]
}

Instead of a list, you can also pass --instance-requirements-with-metadata, with the vCPU and memory ranges inside an InstanceRequirements object. Capacity Manager scores each matching instance type. For Spot, set the market type to spot.

--instance-requirements-with-metadata '{
  "InstanceRequirements": {
    "VCpuCount": {"Min": 64, "Max": 64},
    "MemoryMiB": {"Min": 524288}
  }
}'

The Supportability tab on the console runs the same check. Enter the amount, type, Availability Zones, and instance types or attributes, then choose Check supportability. One check can include up to 10 Availability Zones, from more than one Region, and up to 100 combinations. Figure 5 shows the search-index check on the console. The aggregate score is High, so together the set can support 100 instances. r5.16xlarge scores High in all three zones, and r7a.16xlarge scores High in use1-az6. r6a.16xlarge scores Medium in all three zones, and the new candidate r7i.16xlarge scores Medium in use1-az4 and use1-az6. The other six combinations, including every r6i.16xlarge combination, score Low.
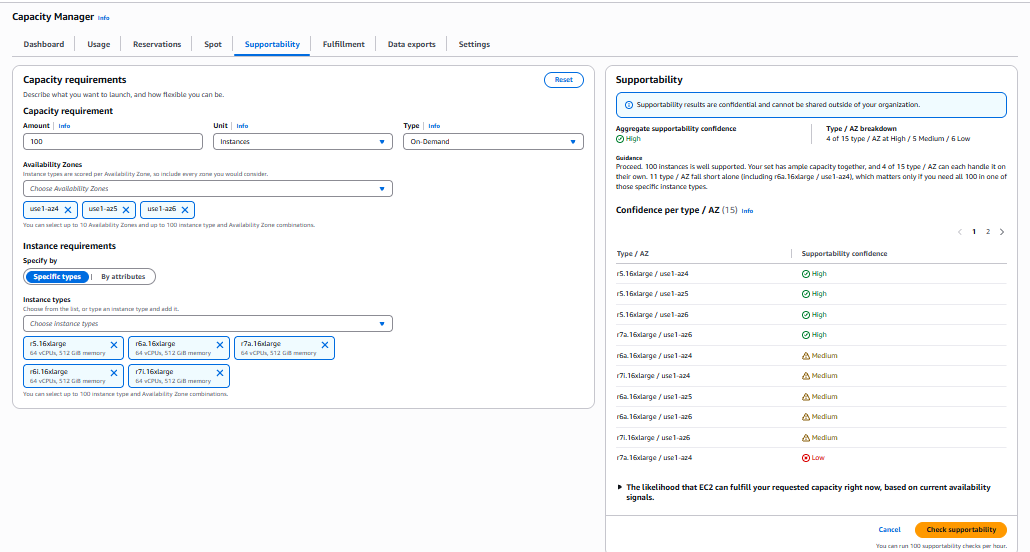
Screenshot of the Capacity Manager Supportability tab. The left panel sets 100 On-Demand instances, Availability Zones use1-az4, use1-az5, and use1-az6, and instance types r5.16xlarge, r6a.16xlarge, r7a.16xlarge, r6i.16xlarge, and r7i.16xlarge. The right panel shows High aggregate supportability confidence, 4 of 15 combinations at High, 5 at Medium, and 6 at Low, with a confidence for each combination.

Figure 5: A check for 100 instances of five instance types across the three search-index Availability Zones, with High aggregate confidence.

High means a combination holds more than enough to serve your request. Medium means it can cover the request with little to spare, and Low means it holds less than you asked for. For details, see What the scores mean and What to do based on your score in the Amazon Elastic Compute Cloud User Guide.

Scores are guidance, not commitments. If you need assurance capacity will be there when you launch, use Capacity Reservations or future-dated Capacity Reservations.

Run the check when you plan a workload, not on every launch. You call it in the Region where Capacity Manager is turned on, so per-launch calls would add a cross-Region dependency and use up the hourly quota.

Step 4: Add the flexibility to your fleet

After a check shows which combinations can support a workload, add them to your Auto Scaling group, Amazon EC2 Fleet, or Karpenter configuration. You configure flexibility once, and every later launch benefits from it.

Flow: supportability check and fulfillment metrics, then identify the instance types and zones that support the workload, then add that flexibility to Auto Scaling group, EC2 Fleet, or Karpenter, then launch as usual.

Figure 6: Use the capabilities to plan flexibility, then configure it in your fleet.

Add flexibility

For an Auto Scaling group, a mixed instances policy lists instance types in priority order. This example keeps r5.16xlarge, r6a.16xlarge, and r7a.16xlarge, which each delivered 98.5–100 percent outside use1-az5 in Figure 4. It adds r7i.16xlarge, which the check in Figure 5 scored Medium in two zones, and leaves out r6i.16xlarge, which scored Low.

aws autoscaling update-auto-scaling-group \
--auto-scaling-group-name search-index-asg \
--mixed-instances-policy file://mixed-instances.json
# mixed-instances.json
{
  "LaunchTemplate": {
    "LaunchTemplateSpecification": {"LaunchTemplateName": "search-index-lt", "Version": "$Latest"},
    "Overrides": [{"InstanceType": "r5.16xlarge"}, {"InstanceType": "r6a.16xlarge"},
      {"InstanceType": "r7a.16xlarge"}, {"InstanceType": "r7i.16xlarge"}]
  },
  "InstancesDistribution": {"OnDemandAllocationStrategy": "prioritized"}
}

For workloads defined by vCPU and memory, attribute-based instance type selection draws on every type that fits. Afterward, watch AvgInstAzCountPerRequestedVcpu (the Instance Type x AZ count (avg) column) to confirm the change.

Reserve where you need certainty

In use1-az5, r5.16xlarge delivered 82.8 percent in Figure 4, even though the check in Figure 5 scores it High right now. If the team needs that type in that zone, it can reserve its steady-state baseline with an On-Demand Capacity Reservation and let the rest stay flexible.

aws ec2 create-capacity-reservation \
--instance-type r5.16xlarge --instance-platform Linux/UNIX \
--availability-zone-id use1-az5 --instance-count 10 \
--instance-match-criteria open --end-date-type unlimited

AWS bills you for Capacity Reservations whether or not you use them, so size them to your baseline. If you create one to try this example, cancel it when you no longer need it. Use the reservation ID from the create-capacity-reservation output.

aws ec2 cancel-capacity-reservation \
--capacity-reservation-id cr-1234567890abcdef0

Canceling an active reservation that has no commitment duration, like this one, has no charge. Any instances running in it keep running at On-Demand rates.

Conclusion

Real-time supportability checks and capacity fulfillment metrics in Amazon EC2 Capacity Manager make flexibility visible. You can find the best instance types and Availability Zones before you scale up, see where flexibility is paying off, and know where to add more.

To make this routine, review fulfillment rates each week and open the breakdown for any workload below target. Add a supportability check to change management, so capacity is validated before a change that adds or scales a workload goes live.

To get started, open the Fulfillment tab on the AWS console under Capacity Manager. To learn more, go to EC2 Capacity Manager on AWS Console.




About the authors

Yagya Vir Singh

Yagya Vir Singh

Yagya is a Senior Technical Account Manager at AWS based in Nashville, Tennessee. He helps enterprise customers plan and operate their workloads on AWS, with a focus on monitoring and observability, cloud governance, cloud financial management, and generative AI.

Brian Phillippi

Brian Phillippi

Brian is a Principal Product Manager – Technical for Amazon EC2, based in Arizona. He works on EC2 capacity products, including EC2 Capacity Manager, and helps large customers plan and secure the capacity they need. Before joining EC2 product management, he spent several years in AWS infrastructure and demand planning, forecasting and planning the capacity behind AWS Regions.

[$] Plasma X11 session removal surprises some Fedora users

Post Syndicated from jzb original https://lwn.net/Articles/1105130/

The KDE Project announced, in 2025, that Plasma 6.7 would
be the last version of the desktop environment that would support X11
sessions. Those who keep up with KDE’s announcements no doubt expected it when
Plasma 6.8
dropped X11 support as promised. What seems to have come as a surprise, at
least to a number of Fedora KDE Plasma
Desktop
users, is that the Fedora 44 release—which shipped in
April with Plasma 6.6—received
an update to Plasma 6.8 that swept away the X11 session without much warning.
Despite the surprise, it is gone for good: the Fedora Engineering Steering
Committee
(FESCo) has voted
against
a request to revert the update for Fedora 44 and the just-released
Fedora 45.

Rapid7 Achieves ISO/IEC 42001 Certification for its AI Management System

Post Syndicated from Rapid7 original https://www.rapid7.com/blog/post/ai-iso-iec-42001-certification-achieved

Exciting news for AI governance! Rapid7 has achieved ISO/IEC 42001:2023 certification for our Artificial Intelligence Management System (AIMS). The certificate was issued by Schellman Compliance, LLC, an ANAB accredited certification body, following an independent audit of how we govern the AI systems we develop in our role as an AI provider.

What is ISO/IEC 42001?

ISO/IEC 42001 is the first international management system standard for artificial intelligence. Where ISO/IEC 27001 focuses on information security, ISO/IEC 42001 focuses on how an organization governs AI. What exactly does “governing AI” mean?  Essentially, it means how AI risks and impacts are assessed, how data is managed, how systems are monitored once they’re in production, and how humans stay in the loop across the AI lifecycle.

This certification means an accredited third party has audited our AIMS and confirmed that it aligns to the standard. To note, this isn’t a one-time exercise, as the certification is maintained through annual surveillance audits. This means our AI governance program is held to the standard for as long as the certificate is active.

Why is ISO/IEC 42001 certification important?

AI is continually evolving how security teams work, and it’s also causing teams to reconsider the questions they ask their vendors. Where does the model come from? What data does it use? Who reviews its outputs? How do we maintain the integrity and quality of our AI products?

ISO/IEC 42001 certification gives customers independent evidence that Rapid7 has a management system in place to address those questions. It demonstrates that the in-scope AI systems are developed and operated under a structured program covering risk assessment, transparency, human oversight, and accountability.

It also supports customers in their own governance work. Many organizations are building AI risk into their third party risk programs and preparing for frameworks and regulations such as the NIST AI Risk Management Framework and the EU AI Act. A vendor’s certified AIMS doesn’t replace a customer’s own due diligence, but it provides a credible, audited starting point.

As with cloud security, AI follows a shared responsibility model. Rapid7 is certified in the role of an AI provider, meaning we’re accountable for how we design, build, and operate these AI systems. Customers remain in control of how they use AI outputs within their own security operations.

Which AI systems are in scope?

The certification covers the AIMS supporting the following AI systems developed within Rapid7 products:

  • Agentic AI Workflow for MDR (Managed Detection and Response)

  • AI Dashboard Summary Card (Managed Detection and Response)

  • AI-Generated Risk Summaries (Exposure Command and Surface Command)

  • AI-Powered Log Search (Incident Command / InsightIDR)

  • AI-Powered Log Summary (Incident Command / InsightIDR)

  • Attack Surface Management (Surface Command)

  • ICS Runtime Event Story (InsightCloudSec / Cloud Runtime)

Most of these are capabilities customers use directly within the product. Agentic AI Workflow for MDR supports Rapid7’s own SOC analysts as they investigate and respond on behalf of MDR customers.

What’s next?

ISO/IEC 42001 certification joins Rapid7’s existing security and compliance program, which includes ISO/IEC 27001, SOC 2, FedRAMP, IRAP, ENS, BSI C5, as well as U.S. and international cybersecurity regulations. Each is independently assessed against its own defined scope, with details available in the Rapid7 Trust Center (reach out to your Account Executive for access).

As our AI capabilities grow, our AI governance program will grow with them. As such, we’ll update this post if the scope of certification changes.

Customers can request a copy of the certificate through their Account Executive or Rapid7 representative. The certificate can also be independently verified in Schellman’s public certificate directory.

[$] Portable Python scripts with dependencies

Post Syndicated from jake original https://lwn.net/Articles/1104646/

A basic Python script is portable: it can be copied between machines with little concern about compatibility.
A script that depends on third-party packages requires quite a bit more
care and consideration, however.
In 2023, PEP
723
(“Inline script metadata”) introduced a standard for declaring a Python script’s
dependencies inside the script itself.
Several third-party tools can now automatically install and manage those dependencies, but there is still little official support for this standard within Python itself.

Security updates for Wednesday

Post Syndicated from jzb original https://lwn.net/Articles/1105378/

Security updates have been issued by AlmaLinux (cockpit, dpdk, fence-agents, firefox, freerdp, gimp, opentelemetry-collector, python-dns, qemu-kvm, and raptor2), Debian (apt and squid), Fedora (ags, apptainer, chromium, fractal, mingw-harfbuzz, mingw-qt5-qtwebkit, mingw-qt6-qt5compat, python-mistune, python3-docs, python3.14, python3.9, rubygem-gist, rust-app-store-connect, rust-qemu-rdp, rust-redlib, and selenium-manager), Mageia (java-latest-openjdk, java-17-openjdk, java-21-openjdk, timezone), Oracle (.NET 10.0, .NET 8.0, .NET 9.0, bind, bind9.16, cockpit, firefox, freerdp, gcc, ghostscript, glibc, grafana, java-17-openjdk, java-21-openjdk, kernel, kernel-uek, libXi, pipewire, pki-deps:10.6, podman, python-jwt, python-pillow, python-pyasn1, qt5-qtbase, thunderbird, tomcat, util-linux, and wireshark), Red Hat (dnsmasq, fence-agents, freerdp, pki-core:10.6, and thunderbird), SUSE (amazon-ssm-agent, aom-tools, apache2, brotli, cadvisor, chromium, cups, curl, distribution-registry, eog, gh, go-containerregistry, google-guest-agent, gvfs, haproxy, hauler, helm3, kernel, libBasicUsageEnvironment2, libcdio, libinstpatch-1_0-2, libosmocore, libreoffice, libX11, nodejs22, nvidia-open-driver-G06-signed, openssh, parted, perl-DBI, perl-mime-tools, python-pypdf, rootlesskit, rqlite, rsyslog, sssd, tomcat10, warewulf4, and xen), and Ubuntu (apt-cacher, bind9, bitlbee, cakephp, deluge, dmitry, e17, feh, gnome-shell, golang-github-gin-contrib-cors, gvfs, haproxy, jabberd2, libmspack, libnet-easytcp-perl, libphp-swiftmailer, libsoup2.4, libsoup3, libuser, pcre2, rear, ruby-rack, ruby-sprockets, rxvt-unicode, shapelib, sogo, vips, and yaws).

The Race Against the 3-Day Clock: How Rapid7 Helps Meet BOD 26-04 Compliance

Post Syndicated from Rapid7 original https://www.rapid7.com/blog/post/it-racing-the-three-day-clock-cisa-bod-26-04

Introduction to BOD 26-04

On June 10, 2026, CISA issued Binding Operational Directive 26-04, “Prioritizing Security Updates Based on Risk.” Strip away the regulatory language and it reads like a single operational fact: for a vulnerability that is actively exploited, publicly reachable, and grants an attacker full control, you now have three calendar days to remediate it — and you must run a forensic investigation in parallel to determine whether you’ve already been breached.

The 2026 Verizon Data Breach Investigations Report puts the industry’s median full-remediation time at 43 days, adding that only 26% of Known Exploited Vulnerabilities were fully remediated in 2025, down from 38% the year before. That’s a 43-day reality vs. a 3-day mandate; a gap you don’t exactly just close by hiring more workers.

This blog aims to break down what BOD 26-04 actually requires, mapping each point to the Rapid7 capability that helps to make compliance operationally achievable for all.

What did CISA actually change?

BOD 26-04 supersedes and revokes two prior directives: BOD 19-02 (2019), which prioritized internet-facing vulnerabilities by static CVSS score, and BOD 22-01 (2021), which created the Known Exploited Vulnerabilities (KEV) Catalog but applied a 14-day patch deadline to every entry regardless of context.

Note that flat timeline: under BOD 22-01, an actively exploited bug on an air-gapped internal server carried the same 14-day urgency as one on a public-facing web server granting full admin control. Teams burned cycles patching low-risk systems to satisfy a checklist. BOD 26-04 replaces that with a dynamic model: prioritize what attackers are actually exploiting, and formally defer what they aren’t.

The four variables to BOD 26-04

BOD 26-04 abandons CVSS as the sole trigger and evaluates every vulnerability against four binary variables, derived from the SSVC decision framework (CMU CERT/CC and CISA):

  1. Asset Exposure: Is the asset reachable by untrusted entities over a public network?

  2. KEV Status: Is the CVE on CISA’s Known Exploited Vulnerabilities Catalog?

  3. Exploit Automation: Can an attacker automate the full exploit chain, enabling mass exploitation?

  4. Technical Impact: Does successful exploitation grant Total control (arbitrary code execution, full/admin privileges) or only Partial control (limited access, information exposure, denial of service)?

Asset exposure is the highest-leverage variable. If you remove an asset from public reach, you flip the exposure variable from Yes to No, and the required timeline relaxes accordingly. Rapid7 Labs data underscores why exposure dominates: half of the vulnerabilities actively exploited in the wild in Q1 2026 were zero-click, network-facing issues requiring no authentication, and by Q2 2026 nearly two-thirds required no user interaction at all. Attackers are going straight at exposed, unauthenticated surfaces.

CISA’s new remediation tiers

The four variables combine into a graduated timeline (CISA BOD 26-04, Appendix A, Table 1). The tiers, simplified:

Tier

Timeline

Core criteria

1 (Critical)

3 days + forensic triage

On KEV and Total control

2 (High)

3 days (no triage)

Publicly exposed + Automatable + Total control, not yet on KEV

3 (Accelerated)

14 days

KEV-listed without Total control; or exposed + Partial control

4 (Standard)

60 days

Internal, automatable, Partial control

5 (Deferred)

Fix on next system upgrade

Internal + not KEV + not automatable + Partial control

Note that these timelines are dynamic. If a dormant vulnerability is added to the KEV, its clock can compress from 60 days to 3 overnight. Conversely, if you isolate an exposed asset, its clock relaxes. CISA explicitly counts isolation, mitigation, and uninstalling the vulnerable software as valid remediation; as such, a compensating control is a legitimate, compliant way to buy time for a safe patch.

The forensic triage mandate

This is the first of the requirements to have no precedent in earlier directives. For Tier 1 vulnerabilities (KEV + Total control), you must not only patch within three days, but run a concurrent forensic investigation to determine whether the asset is already compromised. Why? When an attacker exploits an exposed edge device, they establish persistence within hours; thus, patching three days later closes the door with the intruder already inside.

CISA’s implementation guidance lays out a six-step, 72-hour protocol:

Phase

Window

What happens

1. Scoping

0–2 hrs

Identify in-scope devices; activate response team; open out-of-band comms

2. Preserve evidence

2–24 hrs

Capture volatile data (RAM, cache, registries) before any change

3. Patch & stabilize

2–24 hrs

Apply patches only after evidence is collected

4. Contain

6–24 hrs

Isolate infrastructure without tipping off the attacker

5. Triage analysis

24–48 hrs

Hunt IOCs; look for lateral movement and data staging

6. Escalation decision

48–72 hrs

Formal report; if compromised, report to CISA and pivot to full IR

Note the built-in tension between Step 2 and Step 3: patching reboots systems and overwrites the exact volatile memory that proves or disproves a compromise. You have to capture forensic evidence before you patch — at speed, across every affected endpoint. Doing that manually inside 72 hours is not always realistic.

Who CISA’s BOD 26-04 applies to

BOD 26-04 is compulsory for all Federal Civilian Executive Branch agencies. It excludes national security systems and DoD/Intelligence Community systems.

It reaches the private sector indirectly, but firmly. Agencies must review contracts and push compliance onto supply-chain partners. For FedRAMP and cloud offerings, agencies stay responsible for their hosted systems’ compliance, which forces CSPs handling federal data to adopt the same 3-day triage standard. If you’re a contractor or CSP touching federal data, treat this as your standard too.

Mapping Rapid7 to the directive

Meeting a 3-day clock with mandatory forensics is impossible through manual process. Here’s how the Rapid7 Command Platform maps to each requirement.

Variable 1 (Exposure) → Surface Command

You can’t calculate a timeline if you don’t know what’s exposed. Surface Command combines Cyber Asset Attack Surface Management (CAASM) with External Attack Surface Management (EASM), correlating continuous external scanning against an internal asset inventory ingested from your existing tools. The result is a single view of your true external attack surface — including the shadow IT attackers can see but your team can’t. When it flags an exposed asset carrying a KEV-listed CVE, you can sever exposure to flip Variable 1 and de-escalate the timeline while you test the patch.

Variables 2 & 3 (KEV + Automation) → InsightVM and Active Risk

InsightVM tracks the KEV Catalog natively in its Threat Feed Dashboard, continuously updating which assets carry actively targeted vulnerabilities. Its Active Risk score — a 0–1,000 scale — moves beyond static CVSS by ingesting exploit intelligence from Metasploit, ExploitDB, the CISA KEV list, and Rapid7 Labs research. That mirrors the directive’s own logic: a CVSS 7.5 bug with a weaponized Metasploit module will outrank a CVSS 9.8 bug with no known exploit — exactly the prioritization BOD 26-04 demands.

The NVD scoring gap → Exposure Command AI CVSS

The National Vulnerability Database can’t keep pace with disclosure volume, leaving many CVEs unscored — a blind spot when a zero-day drops and you need a timeline immediately. Exposure Command fills it with an AI model trained on historical NVD data. On its own the model returns the correct severity classification 76% of the time; combined with Active Risk, that rises to 87%, with any miss never more than one classification off. Exposure Command also enriches every asset with business criticality and threat telemetry, and its Remediation Hub surfaces the fixes that cut the most risk.

The forensic mandate → Velociraptor

Velociraptor — the open-source DFIR project Rapid7 acquired in April 2021 — is built for exactly the scale and speed the triage mandate requires. It maps directly to the protocol: agents capture volatile memory and running-process data across thousands of endpoints simultaneously (Step 2), and analysts use Velociraptor Query Language to hunt CISA-provided IOCs enterprise-wide in real time, returning only relevant artifacts instead of pulling full disk images over the network (Step 5). That lets you satisfy the evidentiary requirement without delaying the Step 3 patch.

From severity to dollars

BOD 26-04 shares a core idea with modern risk management: technical severity isn’t business impact. A high CVSS score doesn’t answer the board’s question of “how likely is this to cost us?”

The FAIR framework closes that gap by expressing risk as expected annual loss: Annualized Loss Expectancy = Loss Event Frequency × Loss Magnitude

BOD 26-04 is effectively a mechanism for pinning down Loss Event Frequency: by isolating vulnerabilities that are exploited (KEV), reachable (exposure), and scalable (automation), it identifies the ones statistically most likely to become a loss event. Feed Active Risk into the frequency side and FAIR into the cost side, and you can brief leadership in the language of capital, not CVE IDs.

Rapid7 case studies in the wild

Recent discoveries from Rapid7 Intelligence show the top tier in action:

Vulnerability

Impact

Why it’s Tier 1

Rapid7 action

Microsoft SharePoint (CVE-2026-55040 + CVE-2026-63520)

Chained, the two flaws yield unauthenticated RCE via JWT bypass, running commands as the SharePoint service account

Internet-facing + total control (via the chain) + added to KEV after in-the-wild exploitation

Authenticated checks shipped to InsightVM/Exposure Command customers; Active Risk escalated to trigger triage

Palo Alto PAN-OS (CVE-2026-0300)

Unauthenticated buffer overflow in the User-ID Auth Portal; arbitrary code execution as root (CVSSv4 9.3)

Firewalls are exposed by definition; total impact; added to KEV May 6, 2026

Threat Feed integrated KEV status instantly; Velociraptor captured volatile RAM ahead of the patch

N-able N-central (CVE-2026-18577 + CVE-2026-18556)

Authentication bypass enabling full takeover of remote-management endpoints

High-value management assets; total control; added to KEV August 2026

Checks shipped via content release; Velociraptor hunted endpoint artifacts to satisfy triage

What’s next for federal agencies and contractors?

If you’re an FCEB agency or a contractor or CSP handling federal data, the following three moves matter most:

  1. Get exposure right. Everything downstream depends on knowing what’s publicly reachable. Establish continuous external-plus-internal asset visibility now.

  2. Wire KEV into prioritization, not a spreadsheet. The clock starts the moment CISA updates the catalog. Ingestion has to be automated and continuous.

  3. Pre-stage forensics. Decide today how you’ll capture volatile evidence across endpoints inside 72 hours. If that’s a manual runbook, it will fail under a real Tier 1 event.

CISA BOD 26-04’s bottom line

BOD 26-04 retires “patch everything” in favor of operational precision: remediate the actively exploited, exposed, high-impact vulnerabilities in 72 hours, prove whether you’ve already been breached, and defer the rest. Meeting it takes continuous asset discovery, live threat intelligence, context-aware prioritization, and forensics at scale — which is precisely the shape of the Rapid7 Platform. For federal agencies it’s a mandate; for everyone else, it’s the clearest blueprint yet for risk-based vulnerability management.


Sources: CISA BOD 26-04 and its implementation guidance; 2026 Verizon DBIR; Rapid7 2026 Global Threat Landscape Report and Q1/Q2 2026 threat data; Rapid7 product documentation for InsightVM, Active Risk, Surface Command, Exposure Command, and Velociraptor.

See the agents, set the terms: new visibility and control for personal agents

Post Syndicated from Marina Elmore original https://blog.cloudflare.com/personal-agents-visibility-control/

Personal agents are the intermediary between humans and the Internet, turning a person’s instructions into requests and actions on websites. A customer might ask a personal agent to compare products across your site, find support articles, or complete a purchase. To a site owner, all three interactions show up as automated traffic — and without a clear view of which agents are visiting and what they are doing, it can be difficult to know whether that traffic is helping your business or creating risk. Blocking agents altogether can feel like the safest choice, but it can mean losing customers. Better visibility into agent activity allows you to decide what access makes sense for your site.

Today, we’re launching new analytics to help you understand how personal agents access your site on behalf of humans, along with more granular access policies to put those decisions into practice. Together, they let you welcome agents on your own terms, and in ways that support your business.

See how agents access your site

Knowing which agent is behind a request turns unexplained automated traffic into traffic you can act on with confidence. Cloudflare maintains the largest verified bot directory in the world, and we are now bringing that intelligence into your traffic details. In Security Analytics, the Bot Analysis chart now shows Personal Assistants as a new category, next to Verified Bot, Likely Human, Likely Automated, and Automated. Security teams can select it to see only personal agent traffic over time.

In Top statistics, a new Personal Assistants widget lists which agents are visiting your site and how many requests each one sends. Filter on one agent and every other widget updates to show only its traffic details: the paths it requests, the status codes it receives, and the networks it comes from. At a glance, you can see whether an agent is logging in, reading your product pages, reaching your checkout, or hitting errors on pages it cannot use.

For sites that protect user accounts with Account Abuse Protection (currently in early access), site owners and fraud teams are able to see which user each agent represents. The population overview page shows which personal agents are active across your users and how many accounts use them, so you can determine whether agent traffic is a meaningful part of your business. Every login and sign-up event now shows whether a personal agent made the request, and which one. Fraud teams can filter accounts by AI assistant events or number of AI assistants.

Additionally, each user's account overview shows the agents acting for that account. A fraud analyst investigating an unusual login can tell whether it came from an agent the customer has relied on for weeks, or from an agent that appeared for the first time today and needs a closer look. If it looks like an attacker is using an agent on an account, fraud analysts can mitigate that account directly, with a WAF rule on its Hashed User ID, without blocking the agent for everyone else who relies on it.

Together, these views give you a clearer basis for deciding which personal agents to welcome, limit, or block.

Set access policies that reflect your preferences

We introduced AI bot policies this summer so site owners could make separate access control choices for AI bots used for Search, Training, and Agent behaviors. Now we’re expanding the existing Agents policy to include granular control options for supported personal agents. To reflect this broader scope, we’re renaming the setting AI Crawler and Agent access policies.

In Security Settings, you can set an overall Agents policy, then choose a different policy for each supported personal agent: Allow (do not block), Block on pages with ads, or Block. For example, you can set the overall Agents policy to Block on pages with ads, then choose Allow (do not block) for a supported personal agent you want to welcome. Your existing Search and Training policies stay as they are.

You can also make these choices when you add a new zone to Cloudflare. During onboarding, we ask whether you monetize pages with ads and then tailor the recommended policies to your answer. You can always revisit your access controls later in Security Settings.

The right policy depends on your site. One publisher may allow a supported personal agent throughout its site so readers can find its articles, while another may block that same agent on pages where ads support the content. Both publishers are choosing the access control that works for their business.

Agent identity is only part of the story

The analytics and policies we’re launching today give site owners visibility into personal agent activity and control over their access. Our next goal is to help site owners preserve the context of their relationships with users when personal agents act as intermediaries. A site may recognize the agent making a request but lack information it would otherwise have about the user: whether they are an existing customer, what they authorized the agent to do, whether they have a subscription, or which protections should apply.

Reaching that goal will require privacy-aware ways to (1) carry user context through an agent, (2) help sites assess reputation, and (3) establish clear accountability when something goes wrong. We’ll be sharing more as we work with agent operators and others across the ecosystem, so site owners can choose whether to grant agents greater access while continuing to build relationships with their users.

Make the choice for your site

That person asking a personal agent to compare products, find support, or complete a purchase is still a customer trying to reach your business. Review how personal agents are accessing your site, then visit Security Settings → AI Crawler and Agent access policies to set the terms that work for your site.

Celebrating the UK’s National Engineering Day 2026

Post Syndicated from Philippa Hanman original https://www.raspberrypi.org/blog/celebrating-the-uks-national-engineering-day-2026/

We’re celebrating National Engineering Day in the UK with our friends at the Royal Academy of Engineering. National Engineering Day aims to make the UK’s engineers and engineering more visible, and celebrate how they improve everyday lives and shape the world around us.

The engineers of 2076

Now hiring: The engineers of 2076

This year, the Royal Academy of Engineering is marking its 50th anniversary by looking 50 years into the future. Through job ads for roles that don’t exist yet, they invite us to imagine the engineering careers that will build life on the Moon, Mars, and beyond.

Scientific investigations in space

Some of those future engineers could be taking their first steps today. They might be getting their first experience with space science in the European Astro Pi Challenge, for example. This ESA Education project is run in collaboration with the Raspberry Pi Foundation and offers young people the amazing opportunity to conduct scientific investigations in space by writing computer programs that run on Raspberry Pi computers aboard the International Space Station (ISS). 

We spoke to Geraint Ballinger, a Software Development and Deployment Engineer who works on the Astro Pi Challenge, to find out what engineering roles he thought could be important in the future. We also discussed how the engineers of 2076 need opportunities to experiment, solve problems, and build confidence today.

Hi Geraint. Can you tell us a bit about your role as a Software Development and Deployment Engineer at the Raspberry Pi Foundation?

I like to describe it as a blend between traditional software engineering and teaching. The overall aim of my work is to help young people run code on the Astro Pi computers aboard the International Space Station, which means designing systems that hide unnecessary complexity so students can learn and solve problems effectively, while ensuring the software deployed to orbit remains secure and compliant.

Part of the role is to create applications and code libraries that young people can use to simplify the routine things so they can focus their energy on the interesting aspects of running code in space: taking pictures of the Earth and investigating various scientific concepts. I also oversee the pipeline that receives their work — reviewing submissions, moderating Mission Zero images, and building internal tools to streamline the review process.

On the flight software side, I am jointly responsible for delivering the Astro Pi operating system on the ISS. This involves preparing and delivering system updates, coordinating security reviews, and developing internal astronaut-facing applications such as the application used by the astronauts to focus the Astro Pi cameras.

What do you most enjoy about your role?

I enjoy the sheer variety of engineering challenges to which I am exposed. In any given week, I might be writing a Python library, developing a Typescript web application, or diagnosing a low-level hardware failure on the ISS — like debugging corrupted SD cards.  In particular, I have really enjoyed the challenge of maintaining a system on real physical hardware in space. Operating a Raspberry Pi in orbit makes it impossible to ignore the physical machine: you have to actively design around constraints such as solar radiation, tight power and bandwidth budgets, and hardware degradation over the mission lifecycle.  It’s been really interesting to learn about the procedures and processes involved in delivering software and hardware into orbit.

How does your work help young people’s Astro Pi programs run on the ISS?

I developed the Astro Pi Replay tool, an online browser emulator that simplifies testing and code submission for Mission Space Lab. This allows anyone with a standard school laptop to test their code as if it were running on the ISS, without the need for physical hardware.

Alongside the software tooling, I am also involved in writing the educational materials that guide young people and mentors through the core concepts required for Mission Space Lab.  These resources hopefully enable participants to get up to speed quickly, and to produce working code within a few hours.

What skills do you see young people practising through Astro Pi that future space engineers will need?

Problem-solving, patience, critical thinking, and creativity are vital skills for future space engineers that young people put into practice through the Astro Pi Challenge.

In Mission Space Lab, the more advanced of the Astro Pi missions, young people learn to break down complex tasks into manageable pieces and to coordinate independent pieces of work as a team.

Becauses technical failures and software bugs are inevitable realities of operating in space, Mission Space Lab gives participants practical opportunities to hone their debugging skills, to build resilience and a constructive approach to problem-solving, and foster an active curiosity about underlying system processes.

National Engineering Day is imagining the engineers of 2076. What space engineering job would you invent, and what would someone need to know or be able to do to succeed in it?

I’d invent the role of Interplanetary Communications Manager. If we’ve reached Mars by 2076, then keeping a reliable link back to Earth will be critical infrastructure, and someone will need to look after it.

The job would sit across software and hardware. Software will be a big part of it, but you’d always be working with physical systems, particularly radio transmission. I don’t think we’ll find a fundamentally new way to communicate across space, so I’d expect the role to build on radio and optical technology we already use today. So the key knowledge would be the physics of communication, such as how radio waves and light travel over huge distances, along with how networks are designed to stay reliable.

I also expect AI to touch almost every area of engineering, but I doubt something this critical (and expensive!) would be left entirely without human oversight. There will always be a need for people who truly understand how the system works and can judge whether it can be trusted. That understanding is what I’d want a candidate to bring to the role.

Thanks, Geraint! And we hope any future Interplanetary Communications Managers try out the Astro Pi Challenge, which is open for submissions now!

Get involved with National Engineering Day

Now it’s your turn. What engineering role would you create for 2076? Find out more about how to take part on the Royal Academy of Engineering website.  

And if your young people and future engineers would like to enter the European Astro Pi Challenge 26/27, visit: https://astro-pi.org/ to select a mission.

The post Celebrating the UK’s National Engineering Day 2026 appeared first on Raspberry Pi Foundation.

The collective thoughts of the interwebz