Have you ever encountered a bug while streaming Netflix? Did your title stop unexpectedly, or not start at all? In the first installment of this blog series on sequential testing, we described our canary testing methodology for continuous metrics such as play-delay. One of our readers commented
What if the new release is not related to a new play/streaming feature? For example, what if the new release includes modified login functionality? Will you still monitor the “play-delay” metric?
Netflix monitors a large suite of metrics, many of which can be classified as counts. These include metrics such as the number of logins, errors, successful play starts, and even the number of customer call center contacts. In this second installment, we describe our sequential methodology for testing count metrics, outlined in the NeurIPS paper Anytime Valid Inference for Multinomial Count Data.
Spot the Difference
Suppose we are about to deploy new code that changes the login behavior. To de-risk the software rollout we A/B test the new code, known also as a canary test. Whenever an event such as a login occurs, a log flows through our real-time backend and the corresponding timestamp is recorded. Figure 1 illustrates the sequences of timestamps generated by devices assigned to the new (treatment) and existing (control) software versions. A question that naturally concerns us is whether there are fewer login events in the treatment. Can you tell?
Figure 1: Timestamps of events occurring in control and treatment
It is not immediately obvious by simple inspection of the point processes in Figure 1. The difference becomes immediately obvious when we visualize the observed counting processes, shown in Figure 2.
Figure 2: Visualizing the counting processes — the number of events observed by time t
The counting processes are functions that increment by 1 whenever a new event arrives. Clearly, there are fewer events occurring in the treatment than in the control. If these were login events, this would suggest that the new code contains a bug that prevents some users from being able to log in successfully.
This is a common situation when dealing with event timestamps. To give another example, if events corresponded to errors or crashes, we would like to know if these are accruing faster in the treatment than in the control. Moreover, we want to answer that question as quickly as possible to prevent any further disruption to the service. This necessitates sequential testing techniques which were introduced in part 1.
Time-Inhomogeneous Poisson Process
Our data for each treatment group is a realization of a one-dimensional point process, that is, a sequence of timestamps. As the rate at which the events arrive is time-varying (in both treatment and control), we model the point process as a time-inhomogeneous Poisson point process. This point process is defined by an intensity function λ: ℝ → [0, ∞). The number of events in the interval [0,t), denoted N(t), has the following Poisson distribution
N(t) ~ Poisson(Λ(t)), where Λ(t) = ∫₀ᵗ λ(s) ds.
We seek to test the null hypothesis H₀: λᴬ(t) = λᴮ(t) for all t i.e. the intensity functions for control (A) and treatment (B) are the same. This can be done semiparametrically without making any assumptions about the intensity functions λᴬ and λᴮ. Moreover, the novelty of the research is that this can be done sequentially, as described in section 4 of our paper. Conveniently, the only data required to test this hypothesis at time t is Nᴬ(t) and Nᴮ(t), the total number of events observed so far in control and treatment. In other words, all you need to test the null hypothesis is two integers, which can easily be updated as new events arrive. Here is an example from a simulated A/A test, in which we know by design that the intensity function is the same for the control (A) and the treatment (B), albeit nonstationary.
Figure 3: (Left) An A/A simulation of two inhomogeneous Poisson point processes. (Right) Confidence sequence on the log-difference of intensity functions, and sequential p-value.
Figure 3 provides an illustration of an A/A setting. The left figure presents the raw data and the intensity functions, and the right figure presents the sequential statistical analysis. The blue and red rug plots indicate the observed arrival timestamps of events from the treatment and control streams respectively. The dashed lines are the observed counting processes. As this data is simulated under the null, the intensity functions are identical and overlay each other. The left axis of the right figure visualizes the evolution of the confidence sequence on the log-difference of intensity functions. The right axis of the right figure visualizes the evolution of the sequential p-value. We can make the two following observations
Under the null, the difference of log intensities is zero, which is correctly covered by the 0.95 confidence sequence at all times.
The sequential p-value is greater than 0.05 at all times
Now let’s consider an illustration of an A/B setting. Figure 4 shows observed arrival times for treatment and control when the intensity functions differ. As this is a simulation, the true difference between log intensities is known.
Figure 4: (Left) An A/B simulation of two inhomogeneous Poisson point processes. (Right) Confidence sequence on the difference of log of intensity functions, and sequential p-value.
We can make the following observations
The 0.95 confidence sequence covers the true log-difference at all times
The sequential p-value falls below 0.05 at the same time the 0.95 confidence sequence excludes the null value of zero
Now we present a number of case studies where this methodology has rapidly detected serious problems in a number of count metrics
Case Study 1: Drop in Successful Title Starts
Figure 2 actually presents counts of title start events from a real canary test. Whenever a title starts successfully, an event is sent from the device to Netflix. We have a stream of title start events from treatment devices and a stream of title start events from control devices. Whenever fewer title starts are observed among treatment devices, there is usually a bug in the new client preventing playback.
In this case, the canary test detected a bug that was later determined to have prevented approximately 60% of treatment devices from being able to start their streams. The confidence sequence is shown in Figure 5, in addition to the (sequential) p-value. While the exact units of time have been omitted, this bug was detected at the sub-second level.
Figure 5: 0.99 Confidence sequence on the difference of log-intensities with sequential p-value.
Case Study 2: Increase in Abnormal Shutdowns
In addition to title start events, we also monitor whenever the Netflix client shuts down unexpectedly. As before, we have two streams of abnormal shutdown events, one from treatment devices, and one from control devices. The following screenshots are taken directly from our Lumen dashboards.
Figure 6: Counts of Abnormal Shutdowns over time, cumulative and non-cumulative. Treatment (Black) and Control (Blue)
Figure 6 illustrates two important points. There is clearly nonstationarity in the arrival of abnormal shutdown events. It is also not easy to visibly see any difference between treatment and control from the non-cumulative view. The difference is, however, much easier to see from the cumulative view by observing the counting process. There is a small but visible increase in the number of abnormal shutdowns in the treatment. Figure 7 shows how our sequential statistical methodology is even able to identify such small differences.
Figure 7: Abnormal Shutdowns. (Top Panel) Confidence sequences on λᴮ(t)/λᴬ(t) (shaded blue) with observed counting processes for treatment (black dashed) and control (blue dashed). (Bottom Panel) sequential p-values.
Case Study 3: Increase in Errors
Netflix also monitors the number of errors produced by treatment and control. This is a high cardinality metric as every error is annotated with a code indicating the type of error. Monitoring errors segmented by code helps developers diagnose issues quickly. Figure 8 shows the sequential p-values, on the log scale, for a set of error codes that Netflix monitors during client rollouts. In this example, we have detected a higher volume of 3.1.18 errors being produced by treatment devices. Devices experiencing this error are presented with the following message:
“We’re having trouble playing this title right now”
Figure 8: Sequential p-values for start play errors by error codeFigure 9: Observed error-3.1.18 timestamps and counting processes for treatment (blue) and control (red)
Knowing which errors increased can streamline the process of identifying the bug for our developers. We immediately send developers alerts through Slack integrations, such as the following
Figure 10: Notifications via Slack Integrations
The next time you are watching Netflix and encounter an error, know that we’re on it!
Try it Out!
The statistical approach outlined in our paper is remarkably easy to implement in practice. All you need are two integers, the number of events observed so far in the treatment and control. The code is available in this short GitHub gist. Here are two usage examples:
Netflix was thrilled to be the premier sponsor for the 2nd year in a row at the 2023 Conference on Digital Experimentation (CODE@MIT) in Cambridge, MA. The conference features a balanced blend of academic and industry research from some wicked smart folks, and we’re proud to have contributed a number of talks and posters along with a plenary session.
Our contributions kicked off with a concept that is crucial to our understanding of A/B tests: surrogates!
Our first talk was given by Aurelien Bibaut (with co-authors Nathan Kallus, Simon Ejdemyr and Michael Zhao) in which we discussed how to confidently measure long-term outcomes using short term surrogates in the presence of bias. For example, how do we estimate the effects of innovations on retention a year later without running all our experiments for a year? We proposed an estimation method using cross-fold procedures, and construct valid confidence intervals for long term effects before that effect is fully observed.
Later on, Michael Zhao (with Vickie Zhang, Anh Le and Nathan Kallus) spoke about the evaluation of surrogate index models for product decision making. Using 200 real A/B tests performed at Netflix, we showed that surrogate-index models, constructed using only 2 weeks of data, lead to the same product ship decisions ~95% of the time when compared to making a call based on 2 months of data. This means we can reliably run shorter tests with confidence without needing to wait months for results!
Our next topic focused on how to understand and balance competing engagement metrics; for example, should 1 hour of gaming equal 1 hour of streaming? Michael Zhao and Jordan Schafer shared a poster on how they built an Overall Evaluation Criterion (OEC) metric that provides holistic evaluation for A/B tests, appropriately weighting different engagement metrics to serve a single overall objective. This new framework has enabled fast and confident decision making in tests, and is being actively adapted as our business continues to expand into new areas.
In the second plenary session of the day, Martin Tingley took us on a compelling and fun journey of complexity, exploring key challenges in digital experimentation and how they differ from the challenges faced by agricultural researchers a century ago. He highlighted different areas of complexity and provided perspectives on how to tackle the right challenges based on business objectives.
Our final talk was given by Apoorva Lal (with co-authors Samir Khan and Johan Ugander) in which we show how partial identification of the dose-response function (DRF) under non-parametric assumptions can be used to provide more insightful analyses of experimental data than the standard ATE analysis does. We revisited a study that reduced like-minded content algorithmically, and showed how we could extend the binary ATE learning to answer how the amount of like-minded content a user sees affects their political attitudes.
We had a blast connecting with the CODE@MIT community and bonding over our shared enthusiasm for not only rigorous measurement in experimentation, but also stats-themed stickers and swag!
One of our stickers this year, can you guess what this is showing?!
We look forward to next year’s iteration of the conference and hope to see you there!
Psst! We’re hiring Data Scientists across a variety of domains at Netflix — check out our open roles.
This is the last post in an overview series on experimentation at Netflix. Need to catch up? Earlier posts covered the basics of A/B tests (Part 1 and Part 2 ), core statistical concepts (Part 3 and Part 4), how to build confidence in a decision (Part 5), and the the role of Experimentation and A/B testing within the larger Data Science and Engineering organization at Netflix (Part 6).
Earlier posts in this series covered the why, what and how of A/B testing, all of which are necessary to reap the benefits of experimentation for product development. But without a little magic, these basics are still not enough.
The secret sauce that turns the raw ingredients of experimentation into supercharged product innovation is culture. There are never any shortcuts when developing and growing culture, and fostering a culture of experimentation is no exception. Building leadership buy-in for an approach to learning that emphasizes A/B testing, building trust in the results of tests, and building the technical capabilities to execute experiments at scale all take time — particularly within an organization that’s new to these ideas. But the pay-offs of using experimentation and the virtuous cycle of product development via the scientific method are well worth the effort. Our colleagues at Microsoft have shared thoughtful publications on how to Kickstart the Experimentation Flywheel and build a culture of experimentation, while their “Crawl, Walk, Run, Fly” model is a great tool for assessing the maturity of an experimentation practice.
At Netflix, we’ve been leveraging experimentation and the scientific method for decades, and are fortunate to have a mature experimentation culture. There is broad buy-in across the company, including from the C-Suite, that, whenever possible, results from A/B tests or other causal inference approaches are near-requirements for decision making. We’ve also invested in education programs to up-level company-wide understanding of how we use A/B tests as a framework for product development. In fact, most of the material from this blog series has been adapted from our internal Experimentation 101 and 201 classes, which are open to anyone at Netflix.
Netflix is organized to learn
As a company, Netflix is organized to emphasize the importance of learning from data, including from A/B tests. Our Data and Insights organization has teams that partner with all corners of the company to deliver a better experience to our members, from understanding content preferences around the globe to delivering a seamless customer support experience. We use qualitative and quantitative consumer research, analytics, experimentation, predictive modeling, and other tools to develop a deep understanding of our members. And we own the data pipelines that power everything from executive-oriented dashboards to the personalization systems that help connect each Netflix member with content that will spark joy for them. This data-driven mindset is ubiquitous at all levels of the company, and the Data and Insights organization is represented at the highest echelon of Netflix Leadership.
As discussed in Part 6, there are experimentation and causal inference focussed data scientists who collaborate with product innovation teams across Netflix. These data scientists design and execute tests to support learning agendas and contribute to decision making. By diving deep into the details of single test results, looking for patterns across tests, and exploring other data sources, these Netflix data scientists build up domain expertise about aspects of the Netflix experience and become valued partners to product managers and engineering leaders. Data scientists help shape the evolution of the Netflix product through opportunity sizing and identifying areas ripe for innovation, and frequently propose hypotheses that are subsequently tested.
We’ve also invested in a broad and flexible experimentation platform that allows our experimentation program to scale with the ambitions of the company to learn more and better serve Netflix members. Just as the Netflix product itself has evolved over the years, our approach to developing technologies to support experimentation at scale continues to evolve. In fact, we’ve been working to improve experimentation platform solutions at Netflix for more than 20 years — our first investments in tooling to support A/B tests came way back in 2001.
Early experimentation tooling at Netflix, from 2001.
Learning and experimentation are ubiquitous across Netflix
Netflix has a unique internal culture that reinforces the use of experimentation and the scientific method as a means to deliver more joy to all of our current and future members. As a company, we aim to be curious, and to truly and honestly understand our members around the world, and how we can better entertain them. We are also open minded, knowing that great ideas can come from unlikely sources. There’s no better way to learn and make great decisions than to confirm or falsify ideas and hypotheses using the power of rigorous testing. Openly and candidly sharing test results allows everyone at Netflix to develop intuition about our members and ideas for how we can deliver an ever better experience to them — and then the virtuous cycle starts again.
In fact, Netflix has so many tests running on the product at any given time that a member may be simultaneously allocated to several tests. There is not one Netflix product: at any given time, we are testing out a large number of product variants, always seeking to learn more about how we can deliver more joy to our current members and attract new members. Some tests, such as the Top 10 list, are easy for users to notice, while others, such as changes to the personalization and search systems or how Netflix encodes and delivers streaming video, are less obvious.
At Netflix, we are not afraid to test boldly, and to challenge fundamental or long-held assumptions. The Top 10 list is a great example of both: it’s a large and noticeable change that surfaces a new type of evidence on the Netflix product. Large tests like this can open up whole new areas for innovation, and are actively socialized and debated within the company (see below). On the other end of the spectrum, we also run tests on much smaller scales in order to optimize every aspect of the product. A great example is the testing we do to find just the right text copy for every aspect of the product. By the numbers, we run far more of these smaller and less noticeable tests, and we invest in end-to-end infrastructure that simplifies their execution, allowing product teams to rapidly go from hypothesis to test to roll out of the winning experience. As an example, the Shakespeare project provides an end-to-end solution for rapid text copy testing that integrates with the centralized Netflix experimentation platform. More generally, we are always on the lookout for new areas that can benefit from experimentation, or areas where additional methodology or tooling can produce new or faster learnings.
Debating tests and the importance of humility
Netflix has mature operating mechanisms to debate, make, and socialize product decisions. Netflix does not make decisions by committee or by seeking consensus. Instead, for every significant decision there is a single “Informed Captain” who is ultimately responsible for making a judgment call after digesting relevant data and input from colleagues (including dissenting perspectives). Wherever possible, A/B test results or causal inference studies are an expected input to this decision making process.
In fact, not only are test results expected for product decisions — it’s expected that decisions on investment areas for innovation and testing, test plans for major innovations, and results of major tests are all summarized in memos, socialized broadly, and actively debated. The forums where these debates take place are broadly accessible, ensuring a diverse set of viewpoints provide feedback on test designs and results, and weigh in on decisions. Invites for these forums are open to anyone who is interested, and the price of admission is reading the memo. Despite strong executive attendance, there’s a notable lack of hierarchy in these forums, as we all seek to be led by the data.
Netflix data scientists are active and valued participants in these forums. Data scientists are expected to speak for the data, both what can and what cannot be concluded from experimental results, the pros and cons of different experimental designs, and so forth. Although they are not informed captains on product decisions, data scientists, as interpreters of the data, are active contributors to key product decisions.
Product evolution via experimentation can be a humbling experience. At Netflix, we have experts in every discipline required to develop and evolve the Netflix service (product managers, UI/UX designers, data scientists, engineers of all types, experts in recommendation systems and streaming video optimization — the list goes on), who are constantly coming up with novel hypotheses for how to improve Netflix. But only a small percentage of our ideas turn out to be winners in A/B tests. That’s right: despite our broad expertise, our members let us know, through their actions in A/B tests, that most of our ideas do not improve the service. We build and test hundreds of product variants each year, but only a small percentage end up in production and rolled out to the more than 200 million Netflix members around the world.
The low win rate in our experimentation program is both humbling and empowering. It’s hard to maintain a big ego when anyone at the company can look at the data and see all the big ideas and investments that have ultimately not panned out. But nothing proves the value of decision making through experimentation like seeing ideas that all the experts were bullish on voted down by member actions in A/B tests — and seeing a minor tweak to a sign up flow turn out to be a massive revenue generator.
At Netflix, we do not view tests that do not produce winning experience as “failures.” When our members vote down new product experiences with their actions, we still learn a lot about their preferences, what works (and does not work!) for different member cohorts, and where there may, or may not be, opportunities for innovation. Combining learnings from tests in a given innovation area, such as the Mobile UI experience, helps us paint a more complete picture of the types of experiences that do and do not resonate with our members, leading to new hypotheses, new tests, and, ultimately, a more joyful experience for our members. And as our member base continues to grow globally, and as consumer preferences and expectations continue to evolve, we also revisit ideas that were unsuccessful when originally tested. Sometimes there are signals from the original analysis that suggest now is a better time for that idea, or that it will provide value to some of our newer member cohorts.
Because Netflix tests all ideas, and because most ideas are not winners, our culture of experimentation democratizes ideation. Product managers are always hungry for ideas, and are open to innovative suggestions coming from anyone in the company, regardless of seniority or expertise. After all, we’ll test anything before rolling it out to the member base, and even the experts have low success rates! We’ve seen time and time again at Netflix that product suggestions large and small that arise from engineers, data scientists, even our executives, can result in unexpected wins.
(Left) Very few of our ideas are winners. (Right) Experimentation democratizes ideation. Because we test all ideas, and because most do not win, there’s an openness to product ideas coming from all corners of the business: anyone can raise their hand and make a suggestion.
A culture of experimentation allows more voices to contribute to ideation, and far, far more voices to help inform decision making. It’s a way to get the best ideas from everyone working on the product, and to ensure that the innovations that are rolled out are vetted and approved by members.
A better product for our members and an internal culture that is humble and values ideas and evidence: experimentation is a win-win proposition for Netflix.
Emerging research areas
Although Netflix has been running experiments for decades, we’ve only scratched the surface relative to what we want to learn and the capabilities we need to build to support those learning ambitions. There are open challenges and opportunities across experimentation and causal inference at Netflix: exploring and implementing new methodologies that allow us to learn faster and better; developing software solutions that support research; evolving our internal experimentation platform to better serve a growing user community and ever increasing size and throughput of experiments. And there’s a continuous focus on evolving and growing our experimentation culture through internal events and education programs, as well as external contributions. Here are a few themes that are on our radar:
Increasing velocity: beyond fixed time horizon experimentation.
This series has focused on fixed time horizon tests: sample sizes, the proportion of traffic allocated to each treatment experience, and the test duration are all fixed in advance. In principle, the data are examined only once, at the conclusion of the test. This ensures that the false positive rate (see Part 3) is not increased by peeking at the data numerous times. In practice, we’d like to be able to call tests early, or to adapt how incoming traffic is allocated as we learn incrementally about which treatments are successful and which are not, in a way that preserves the statistical properties described earlier in this series. To enable these benefits, Netflix is investing in sequential experimentation that permits for valid decision making at any time, versus waiting until a fixed time has passed. These methods are already being used to ensure safe deployment of Netflix client applications. We are also investing in support for experimental designs that adaptively allocate traffic throughout the test towards promising treatments. The goal of both these efforts is the same: more rapid identification of experiences that benefit members.
Scaling support for quasi experimentation and causal inference.
Netflix has learned an enormous amount, and dramatically improved almost every aspect of the product, using the classic online A/B tests, or randomized controlled trials, that have been the focus of this series. But not every business question is amenable to A/B testing, whether due to an inability to randomize at the individual level, or due to factors, such as spillover effects, that may violate key assumptions for valid causal inference. In these instances, we often rely on the rigorous evaluation of quasi-experiments, where units are not assigned to a treatment or control condition by a random process. But the term “quasi-experimentation” itself covers a broad category of experimental design and methodological approaches that differ between the myriad academic backgrounds represented by the Netflix data science community. How can we synthesize best practices across domains and scale our approach to enable more colleagues to leverage quasi-experimentation?
Our early successes in this space have been driven by investments in knowledge sharing across business verticals, education, and enablement via tooling. Because quasi-experiment use cases span many domains at Netflix, identifying common patterns has been a powerful driver in developing shared libraries that scientists can use to evaluate individual quasi-experiments. And to support our continued scale, we’ve built internal tooling that coalesces data retrieval, design evaluation, analysis, and reproducible reporting, all with the goal to enable our scientists.
We expect our investments in research, tooling, and education for quasi-experiments to grow over time. In success, we will enable both scientists and their cross functional partners to learn more about how to deliver more joy to current and future Netflix members.
Experimentation Platform as a Product.
We treat the Netflix Experimentation Platform as an internal product, complete with its own product manager and innovation roadmap. We aim to provide an end-to-end paved path for configuring, allocating, monitoring, reporting, storing and analyzing A/B tests, focusing on experimentation use cases that are optimized for simplicity and testing velocity. Our goal is to make experimentation a simple and integrated part of the product lifecycle, with little effort required on the part of engineers, data scientists, or PMs to create, analyze, and act on tests, with automation available wherever the test owner wants it.
However, if the platform’s default paths don’t work for a specific use case, experimenters can leverage our democratized contribution model, or reuse pieces of the platform, to build out their own solutions. As experimenters innovate on the boundaries of what’s possible in measurement methodology, experimental design, and automation, the Experimentation Platform team partners to commoditize these innovations and make them available to the broader organization.
Three core principles guide product development for our experimentation platform:
Complexities and nuances of testing such as allocations and methodologies should, typically, be abstracted away from the process of running a single test, with emphasis instead placed on opinionated defaults that are sensible for a set of use cases or testing areas.
Manual intervention at specific steps in the test execution should, typically, be optional, with emphasis instead on test owners being able to invest their attention where they feel it adds value and leave other areas to automation.
Designing, executing, reporting, deciding, and learning are all different phases of the experiment lifecycle that have differing needs and users, and each stage benefits from purpose built tooling for each use.
Conclusion
Netflix has a strong culture of experimentation, and results from A/B tests, or other applications of the scientific method, are generally expected to inform decisions about how to improve our product and deliver more joy to members. To support the current and future scale of experimentation required by the growing Netflix member base and the increasing complexity of our business, Netflix has invested in culture, people, infrastructure, and internal education to make A/B testing broadly accessible across the company.
And we are continuing to evolve our culture of learning and experimentation to deliver more joy to Netflix members around the world. As our member base and business grows, smaller differences between treatment and control experiences become materially important. That’s also true for subsets of the population: with a growing member base, we can become more targeted and look to deliver positive experiences to cohorts of users, defined by geographical region, device type, etc. As our business grows and expands, we are looking for new places that could benefit from experimentation, ways to run more experiments and learn more with each, and ways to accelerate our experimentation program while making experimentation accessible to more of our colleagues.
But the biggest opportunity is to deliver more joy to our members through the virtuous cycle of experimentation.
Interested in learning more? Explore our research site.
Earlier posts in this series covered the basics of A/B tests (Part 1 and Part 2 ), core statistical concepts (Part 3 and Part 4), and how to build confidence in decisions based on A/B test results (Part 5). Here we describe the role of Experimentation and A/B testing within the larger Data Science and Engineering organization at Netflix, including how our platform investments support running tests at scale while enabling innovation. The subsequent and final post in this series will discuss the importance of the culture of experimentation within Netflix.
Experimentation and causal inference is one of the primary focus areas within Netflix’s Data Science and Engineering organization. To directly support great decision-making throughout the company, there are a number of data science teams at Netflix that partner directly with Product Managers, engineering teams, and other business units to design, execute, and learn from experiments. To enable scale, we’ve built, and continue to invest in, an internal experimentation platform (XP for short). And we intentionally encourage collaboration between the centralized experimentation platform and the data science teams that partner directly with Netflix business units.
Experimentation and causal inference data scientists who work directly with Netflix business units develop deep domain understanding and intuition about the business areas where they work. Data scientists in these roles apply the scientific method to improve the Netflix experience for current and future members, and are involved in the whole life cycle of experimentation: data exploration and ideation; designing and executing tests; analyzing results to help inform decisions on tests; synthesizing learnings from numerous tests (and other sources) to understand member behavior and identify opportunity areas for innovation. It’s a virtuous, scientifically rigorous cycle of testing specific hypotheses about member behaviors and preferences that are grounded in general principles (deduction), and generalizing learning from experiments to build up our conceptual understanding of our members (induction). In success, this cycle enables us to rapidly innovate on all aspects of the Netflix service, confident that we are delivering more joy to our members as our decisions are backed by empirical evidence.
Success in these roles requires a broad technical skill set, a self-starter attitude, and a deep curiosity about the domain space. Netflix data scientists are relentless in their pursuit of knowledge from data, and constantly look to go the extra distance and ask one more question. “What more can we learn from this test, to inform the next one?” “What information can I synthesize from the last year of tests, to inform opportunity sizing for next year’s learning roadmap?” “What other data and intuition can I bring to the problem?” “Given my own experience with Netflix, where might there be opportunities to test and improve on the current experience?” We look to our data scientists to push the boundaries on both the design and analysis of experiments: what new approaches or methods may yield valuable insights, given the learning agenda in a particular part of the product? These data scientists are also sought after as trusted thought partners by their business partners, as they develop deep domain expertise about our members and the Netflix experience.
Here are quick summaries of a few of the experimentation areas at Netflix and some of the innovative work that’s come out of each. This is not an exhaustive list, and we’ve focused on areas where opportunities to learn and deliver a better member experience through experimentation may be less obvious.
A/B tests are used throughout Netflix to deliver more joy to current and future members.
Growth Advertising
At Netflix, we want to entertain the world! Our growth team advertises on social media platforms and other websites to share news about upcoming titles and new product features, with the ultimate goal of growing the number of Netflix members worldwide. Data Scientists play a vital role in building automated systems that leverage causal inference to decide how we spend our advertising budget.
In advertising, the treatments (the ads that we purchase) have a direct monetary cost to Netflix. As a result, we are risk averse in decision making and actively mitigate the probability of purchasing ads that are not efficiently attracting new members. Abiding by this risk aversion is challenging in our domain because experiments generally have low power (see Part 4). For example we rely on difference-in-differences techniques for unbiased comparisons between the potentially different audiences experiencing each advertising treatment, and these approaches effectively reduce the sample size (more details for the very interested reader). One way to address these power reductions would be to simply run longer experiments — but that would slow down our overall pace of innovation.
Here we highlight two related problems for experimentation in this domain and briefly describe how we address them while maintaining a high cadence of experimentation.
Recall that Part 3 and Part 4 described two types of errors: false positives (or Type-I errors) and false negatives (Type-II errors). Particularly in regimes where experiments are low-powered, two other error types can occur with high probability, so are important to consider when acting upon a statistically significant test result:
A Type-S error occurs when, given that we observe a statistically-significant result, the estimated metric movement has the opposite sign relative to the truth.
A Type-M error occurs when,given that we observe a statistically-significant result, the size of the estimated metric movement is magnified (or exaggerated) relative to the truth.
If we simply declare statistically significant test results (with positive metric movements) to be winners, a Type-S error would imply that we actually selected the wrong treatment to promote to production, and all our future advertising spend would be producing suboptimal results. A Type-M error means that we are over-estimating the impact of the treatment. In the short term, a Type-M error means we would overstate our result, and in the long-term it could lead to overestimating our optimal budget level, or even misprioritizing future research tracks.
To reduce the impact of these errors, we take a Bayesian approach to experimentation in growth advertising. We’ve run many tests in this area and use the distribution of metric movements from past tests as an additional input to the analysis. Intuitively (and mathematically) this approach results in estimated metric movements that are smaller in magnitude and that feature narrower confidence intervals (Part 3). Combined, these two effects reduce the risk of Type-S and Type-M errors.
As the benefits from ending suboptimal treatments early can be substantial, we would also like to be able to make informed, statistically-valid decisions to end experiments as quickly as possible.This is an active research area for the team, and we’ve investigated Group Sequential Testing and Bayesian Inference as methods to allow for optimal stopping (see below for more on both of those). The latter, when combined with decision theoretic concepts like expected loss (or risk) minimization, can be used to formally evaluate the impact of different decisions — including the decision to end the experiment early.
Payments
The payments team believes that the methods of payment (credit card, direct debit, mobile carrier billing, etc) that a future or current member has access to should never be a barrier to signing up for Netflix, or the reason that a member leaves Netflix. There are numerous touchpoints between a member and the payments team: we establish relationships between Netflix and new members, maintain those relationships with renewals, and (sadly!) see the end of those relationships when members elect to cancel.
We innovate on methods of payment, authentication experiences, text copy and UI designs on the Netflix product, and any other place that we may smooth the payment experience for members. In all of these areas, we seek to improve the quality and velocity of our decision-making, guided by the testing principles laid out in this series.
Decision quality doesn’t just mean telling people, “Ship it!” when the p-value (see Part 3) drops below 0.05. It starts with having a good hypothesis and a clear decision framework — especially one that judiciously balances between long-term objectives and getting a read in a pragmatic timeframe. We don’t have unlimited traffic or time, so sometimes we have to make hard choices. Are there metrics that can yield a signal faster? What’s the tradeoff of using those? What’s the expected loss of calling this test, versus the opportunity cost of running something else? These are fun problems to tackle, and we are always looking to improve.
We also actively invest in increasing decision velocity, often in close partnership with the Experimentation Platform team. Over the past year, we’ve piloted models and workflows for three approaches to faster experimentation: Group Sequential Testing (GST), Gaussian Bayesian Inference, and Adaptive Testing. Any one of these techniques would enhance our experiment throughput on their own; together, they promise to alter the trajectory of payments experimentation velocity at Netflix.
Partnerships
We want all of our members to enjoy a high quality experience whenever and however they access Netflix. Our partnerships teams work to ensure that the Netflix app and our latest technologies are integrated on a wide variety of consumer products, and that Netflix is easy to discover and use on all of these devices. We also partner with mobile and PayTV operators to create bundled offerings to bring the value of Netflix to more future members.
In the partnerships space, many experiences that we want to understand, such as partner-driven marketing campaigns, are not amenable to the A/B testing framework that has been the focus of this series. Sometimes, users self-select into the experience, or the new experience is rolled out to a large cluster of users all at once. This lack of randomization precludes the straightforward causal conclusions that follow from A/B tests. In these cases, we use quasi experimentation and observational causal inference techniques to infer the causal impact of the experience we are studying. A key aspect of a data scientist’s role in these analyses is to educate stakeholders on the caveats that come with these studies, while still providing rigorous evaluation and actionable insights, and providing structure to some otherwise ambiguous problems. Here are some of the challenges and opportunities in these analyses:
Treatment selection confounding. When users self-select into the treatment or control experience (versus the random assignment discussed in Part 2), the probability that a user ends up in each experience may depend on their usage habits with Netflix. These baseline metrics are also naturally correlated with outcome metrics, such as member satisfaction, and therefore confound the effect of the observed treatment on our outcome metrics. The problem is exacerbated when the treatment choice or treatment uptake varies with time, which can lead to time varying confounding. To deal with these cases, we use methods such as inverse propensity scores, doubly robust estimators, difference-in-difference, or instrumental variables to extract actionable causal insights, with longitudinal analyses to account for the time dependence.
Synthetic controls and structural models. Adjusting for confounding requires having pre-treatment covariates at the same level of aggregation as the response variable. However, sometimes we do not have access to that information at the level of individual Netflix members. In such cases, we analyze aggregate level data using synthetic controls and structural models.
Sensitivity analysis. In the absence of true A/B testing, our analyses rely on using the available data to adjust away spurious correlations between the treatment and the outcome metrics. But how well we can do so depends on whether the available data is sufficient to account for all such correlations. To understand the validity of our causal claims, we perform sensitivity analyses to evaluate the robustness of our findings.
Messaging
At Netflix, we are always looking for ways to help our members choose content that’s great for them. We do this on the Netflix product through the personalized experience we provide to every member. But what about other ways we can help keep members informed about new or relevant content, so they’ve something great in mind when it’s time to relax at the end of a long day?
Messaging, including emails and push notifications, is one of the key ways we keep our members in the loop. The messaging team at Netflix strives to provide members with joy beyond the time when they are actively watching content. What’s new or coming soon on Netflix? What’s the perfect piece of content that we can tell you about so you can plan “date time movie night” on the go? As a messaging team, we are also mindful of all the digital distractions in our members’ lives, so we work tirelessly to send just the right information to the right members at the right time.
Data scientists in this space work closely with product managers and engineers to develop messaging solutions that maximize long term satisfaction for our members. For example, we are constantly working to deliver a better, more personalized messaging experience to our members. Each day, we predict how each candidate message would meet a members’ needs, given historical data, and the output informs what, if any, message they will receive. And to ensure that innovations on our personalized messaging approach result in a better experience for our members, we use A/B testing to learn and confirm our hypotheses.
An exciting aspect of working as a data scientist on messaging at Netflix is that we are actively building and using sophisticated learning models to help us better serve our members. These models, based on the idea of bandits, continuously balance learning more about member messaging preferences with applying those learnings to deliver more satisfaction to our members. It’s like a continuous A/B test with new treatments deployed all the time. This framework allows us to conduct many exciting and challenging analyses without having to deploy new A/B tests every time.
Evidence Selection
When a member opens the Netflix application, our goal is to help them choose a title that is a great fit for them. One way we do this is through constantly improving the recommendation systems that produce a personalized home page experience for each of our members. And beyond title recommendations, we strive to select and present artwork, imagery and other visual “evidence” that is likewise personalized, and helps each member understand why a particular title is a great choice for them — particularly if the title is new to the service or unfamiliar to that member.
Creative excellence and continuous improvements to evidence selection systems are both crucial in achieving this goal. Data scientists working in the space of evidence selection use online experiments and offline analysis to provide robust causal insights to power product decisions in both the creation of evidence assets, such as the images that appear on the Netflix homepage, and the development of models that pair members with evidence.
Sitting at the intersection of content creation and product development, data scientists in this space face some unique challenges:
Predicting evidence performance. Say we are developing a new way to generate a piece of evidence, such as a trailer. Ideally, we’d like to have some sense of the positive outcomes of the new evidence type prior to making a potentially large investment that will take time to pay off. Data scientists help inform investment decisions like these by developing causally valid predictive models.
Matching members with the best evidence. High quality and properly selected evidence is key to a great Netflix experience for all of our members. While we test and learn about what types of evidence are most effective, and how to match members to the best evidence, we also work to minimize the potential downsides by investing in efficient approaches to A/B tests that allow us to rapidly stop suboptimal treatment experiences.
Providing timely causal feedback on evidence development. Insights from data, including from A/B tests, are used extensively to fuel the creation of better artwork, trailers, and other types of evidence. In addition to A/B tests, we work on developing experimental design and analysis frameworks that provide fine-grained causal inference and can keep up with the scale of our learning agenda. We use contextual bandits that minimize regret in matching members to evidence, and through a collaboration with our Algorithms Engineering team, we’ve built the ability to log counterfactuals: what would a different selection policy have recommended? These data provide us with a platform to run rich offline experiments and derive causal inferences that meet our challenges and answer questions that may be slow to answer with A/B tests.
Streaming
Now that you’ve signed up for Netflix and found something exciting to watch, what happens when you press play? Behind the scenes, Netflix infrastructure has already kicked into gear, finding the fastest way to deliver your chosen content with great audio and video quality.
The numerous engineering teams involved in delivering high quality audio and video use A/B tests to improve the experience we deliver to our members around the world. Innovation areas include the Netflix app itself (across thousands of types of devices), encoding algorithms, and ways to optimize the placement of content on our global Open Connect distribution network.
Data science roles in this business area emphasize experimentation at scale and support for autonomous experimentation for engineering teams: how do we enable these teams to efficiently and confidently execute, analyze, and make decisions based on A/B tests? We’ll touch upon four ways that partnerships between data science and engineering teams have benefited this space.
Automation. As streaming experiments are numerous (thousands per year) and tend to be short lived, we’ve invested in workflow automations. For example, we piggyback on Netflix’s amazing tools for safe deployment of the Netflix client by integrating the experimentation platform’s API directly with Spinnaker deployment pipelines. This allows engineers to set up, allocate, and analyze the effects of changes they’ve made using a single configuration file. Taking this model even further, users can even ‘automate the automation’ by running multiple rounds of an experiment to perform sequential optimizations.
Beyond average treatment effects. As many important streaming video and audio metrics are not well approximated by a normal distribution, we’ve found it critical to look beyond average treatment effects. To surmount these challenges, we partnered with the experimentation platform to develop and integrate high-performance bootstrap methods for compressed data, making it fast to estimate distributions and quantile treatment effects for even the most pathological metrics. Visualizing quantiles leads to novel insights about treatment effects, and these plots, now produced as part of our automated reporting, are often used to directly support high-level product decisions.
Alternatives to A/B testing. The Open Connect engineering team faces numerous measurement challenges. Congestion can cause interactions between treatment and control groups; in other cases we are unable to randomize due to the nature of our traffic steering algorithms. To address these and other challenges, we are investing heavily in quasi-experimentation methods. We use Metaflow to pair existing infrastructure for metric definitions and data collection from our Experimentation Platform with custom analysis methods that are based on a difference-in-difference approach. This workflow has allowed us to quickly deploy self-service tools to measure changes that cannot be measured with traditional A/B testing. Additionally, our modular approach has made it easy to scale quasi-experiments across Open Connect use cases, allowing us to swap out data sources or analysis methods depending on each team’s individual needs.
Support for custom metrics and dimensions. Last, we’ve developed a (relatively) frictionless path that allows all experimenters (not just data scientists) to create custom metrics and dimensions in a snap when they are needed. Anything that can be logged can be quickly passed to the experimentation platform, analyzed, and visualized alongside the long-lived quality of experience metrics that we consider for all tests in this domain. This allows our engineers to use paved paths to ask and answer more precise questions, so they can spend less time head-scratching and more time testing out exciting ideas.
Scaling experimentation and investing in infrastructure
To support the scale and complexity of the experimentation program at Netflix, we’ve invested in building out our own experimentation platform (referred to as “XP” internally). Our XP provides robust and automated (or semi automated) solutions for the full lifecycle of experiments, from experience management through to analysis, and meets the data scale produced by a high throughput of large tests.
XP provides a framework that allows engineering teams to define sets of test treatment experiences in their code, and then use these to configure an experiment. The platform then randomly selects members (or other units we might experiment on, like playback sessions) to assign to experiments, before randomly assigning them to an experience within each experiment (control or one of the treatment experiences). Calls by Netflix services to XP then ensure that the correct experiences are delivered, based on which tests a member is part of, and which variants within those tests. Our data engineering systems collect these test metadata, and then join them with our core data sets: logs on how members and non members interact with the service, logs that track technical metrics on streaming video delivery, and so forth. These data then flow through automated analysis pipelines and are reported in ABlaze, the front end for reporting and configuring experiments at Netflix. Aligned with Netflix culture, results from tests are broadly accessible to everyone in the company, not limited to data scientists and decision makers.
The Netflix XP balances execution of the current experimentation program with a focus on future-looking innovation. It’s a virtuous flywheel, as XP aims to take whatever is pushing the boundaries of our experimentation program this year and turn it into next year’s one-click solution. That may involve developing new solutions for allocating members (or other units) to experiments, new ways of tracking conflicts between tests, or new ways of designing, analyzing, and making decisions based on experiments. For example, XP partners closely with engineering teams on feature flagging and experience delivery. In success, these efforts provide a seamless experience for Netflix developers that fully integrates experimentation into the software development lifecycle.
For analyzing experiments, we’ve built the Netflix XP to be both democratized and modular. By democratized, we mean that data scientists (and other users) can directly contribute metrics, causal inference methods for analyzing tests, and visualizations. Using these three modules, experimenters can compose flexible reports, tailored to their tests, that flow through to both our frontend UI and a notebook environment that supports ad hoc and exploratory analysis.
This model supports rapid prototyping and innovation as we abstract away engineering concerns so that data scientists can contribute code directly to our production experimentation platform — without having to become software engineers themselves. To ensure that platform capabilities are able to support the required scale (number and size of tests) as analysis methods become more complex and computationally intensive, we’ve invested in developing expertise in performant and robust Computational Causal Inference software for test analysis.
It takes a village to build an experimentation platform: software engineers to build and maintain the backend engineering infrastructure; UI engineers to build out the ABlaze front end that is used to manage and analyze experiments; data scientists with expertise in causal inference and numerical computing to develop, implement, scale, and socialize cutting edge methodologies; user experience designers who ensure our products are accessible to our stakeholders; and product managers who keep the platform itself innovating in the right direction. It’s an incredibly multidisciplinary endeavor, and positions on XP provide opportunities to develop broad skill sets that span disciplines. Because experimentation is so pervasive at Netflix, those working on XP are exposed to challenges, and get to collaborate with colleagues, from all corners of Netflix. It’s a great way to learn broadly about ‘how Netflix works’ from a variety of perspectives.
Summary
At Netflix, we’ve invested in data science teams that use A/B tests, other experimentation paradigms, and the scientific method more broadly, to support continuous innovation on our product offerings for current and future members. In tandem, we’ve invested in building out an internal experimentation platform (XP) that supports the scale and complexity of our experimentation and learning program.
In practice, the dividing line between these two investments is blurred and we encourage collaboration between XP and business-oriented data scientists, including through internal events like A/B Experimentation Workshops and Causal Inference Summits. To ensure that experimentation capabilities at Netflix evolve to meet the on-the-ground needs of experimentation practitioners, we are intentional in ensuring that the development of new measurement and experiment management capabilities, and new software systems to both enable and scale research, is a collaborative partnership between XP and experimentation practitioners. In addition, our intentionally collaborative approach provides great opportunities for folks to lead and contribute to high-impact projects that deliver new capabilities, spanning engineering, measurement, and internal product development. And because of the strategic value Netflix places on experimentation, these collaborative efforts receive broad visibility, including from our executives.
So far, this series has covered the why, what and how of A/B testing, all of which are necessary to reap the benefits of an experimentation-based approach to product development. But without a little magic, these basics are still not enough. That magic will be the focus of the next and final post in this series: the learning and experimentation culture that pervades Netflix. Follow the Netflix Tech Blog to stay up to date.
This is the fifth post in a multi-part series on how Netflix uses A/B tests to inform decisions and continuously innovate on our products. Need to catch up? Have a look at Part 1 (Decision Making at Netflix), Part 2 (What is an A/B Test?), Part 3 (False positives and statistical significance), and Part 4 (False negatives and power). Subsequent posts will go into more details on experimentation across Netflix, how Netflix has invested in infrastructure to support and scale experimentation, and the importance of developing a culture of experimentation within an organization.
In Parts 3 (False positives and statistical significance) and 4 (False negatives and power), we discussed the core statistical concepts that underpin A/B tests: false positives, statistical significance and p-values, as well as false negatives and power. Here, we’ll get to the hard part: how do we use test results to support decision making in a complex business environment?
The unpleasant reality about A/B testing is that no test result is a certain reflection of the underlying truth. As we discussed in previous posts, good practice involves first setting and understanding the false positive rate, and then designing an experiment that is well powered so it is likely to detect true effects of reasonable and meaningful magnitudes. These concepts from statistics help us reduce and understand error rates and make good decisions in the face of uncertainty. But there is still no way to know whether the result of a specific experiment is a false positive or a false negative.
Figure 1: Inspiration from Voltaire.
In using A/B testing to evolve the Netflix member experience, we’ve found it critical to look beyond just the numbers, including the p-value, and to interpret results with strong and sensible judgment to decide if there’s compelling evidence that a new experience is a “win” for our members. These considerations are aligned with the American Statistical Association’s 2016 Statement on Statistical Significance and P-Values, where the following three direct quotes (bolded) all inform our experimentation practice.
“Proper inference requires full reporting and transparency.” As discussed in Part 3:(False positives and statistical significance), by convention we run experiments at a 5% false positive rate. In practice, then, if we run twenty experiments (say to evaluate if each of twenty colors of jelly beans are linked to acne) we’d expect at least one significant result — even if, in truth, the null hypothesis is true in each case and there is no actual effect. This is the Multiple Comparisons Problem, and there are a number of approaches to controlling the overall false positive rate that we’ll not cover here. Of primary importance, though, is to report and track not only results from tests that yield significant results — but also those that do not.
Figure 2: All you need to know about false positives, in cartoon form.
“A p-value, or statistical significance, does not measure the size of an effect or the importance of a result.” In Part 4 (False negatives and power), we talked about the importance, in the experimental design phase, of powering A/B tests to have a high probability of detecting reasonable and meaningful metric movements. Similar considerations are relevant when interpreting results. Even if results are statistically significant (p-value < 0.05), the estimated metric movements may be so small that they are immaterial to the Netflix member experience, and we are better off investing our innovation efforts in other areas. Or the costs of scaling out a new feature may be so high relative to the benefits that we could better serve our members by not rolling out the feature and investing those funds in improving different areas of the product experience.
“Scientific conclusions and business or policy decisions should not be based only on whether a p-value passes a specific threshold.” The remainder of this post gives insights into practices we use at Netflix to arrive at decisions, focusing on how we holistically evaluate evidence from an A/B test.
Building a data-driven case
One practical way to evaluate the evidence in support of a decision is to think in terms of constructing a legal case in favor of the new product experience: is there enough evidence to “convict” and conclude, beyond that 5% reasonable doubt, that there is a true effect that benefits our members? To help build that case, here are some helpful questions that we ask ourselves in interpreting test results:
Do the results align with the hypothesis? If the hypothesis was about optimizing compute resources for back-end infrastructure, and results showed a major and statistically significant increase in user satisfaction, we’d be skeptical. The result may be a false positive — or, more than likely, the result of a bug or error in the execution of the experiment (Twyman’s Law). Sometimes surprising results are correct, but more often than not they are either the result of implementation errors or false positives, motivating us to dig deep into the data to identify root causes.
Does the metric story hang together? In Part 2 (What is an A/B Test?), we talked about the importance of describing the causal mechanism through which a change made to the product impacts both secondary metrics and the primary decision metric specified for the test. In evaluating test results, it’s important to look at changes in these secondary metrics, which are often specific to a particular experiment, to assess if any changes in the primary metric follow the hypothesized causal chain. With the Top 10 experiment, for example, we’d check if inclusion in the Top 10 list increases title-level engagement, and if members are finding more of the titles they watch from the home page versus other areas of the product. Increased engagement with the Top 10 titles and more plays coming from the home page would help build our confidence that it is in fact the Top 10 list that is increasing overall member satisfaction. In contrast, if our primary member satisfaction metric was up in the Top 10 treatment group, but analysis of these secondary metrics showed no increase in engagement with titles included in the Top 10 list, we’d be skeptical. Maybe the Top 10 list isn’t a great experience for our members, and its presence drives more members off the home page, increasing engagement with the Netflix search experience — which is so amazing that the result is an increase in overall satisfaction. Or maybe it’s a false positive. In any case, movements in secondary metrics can cast sufficient doubt that, despite movement in the primary decision metric, we are unable to confidently conclude that the treatment is activating the hypothesized causal mechanism.
Is there additional supporting or refuting evidence, such as consistent patterns across similar variants of an experience? It’s common to test a number of variants of an idea within a single experiment. For example, with something like the Top 10 experience, we may test a number of design variants and a number of different ways to position the Top 10 row on the homepage. If the Top 10 experience is great for Netflix members, we’d expect to see similar gains in both primary and secondary metrics across many of these variants. Some designs may be better than others, but seeing broadly consistent results across the variants helps build that case in favor of the Top 10 experience. If, on the other hand, we test 20 design and positioning variants and only one yields a significant movement in the primary decision metric, we’d be much more skeptical. After all, with that 5% false positive rate, we expect on average one significant result from random chance alone.
Do results repeat? Finally, the surest way to build confidence in a result is to see if results repeat in a follow-up test. If results of an initial A/B test are suggestive but not conclusive, we’ll often run a follow-up test that hones in on the hypothesis based on learnings generated from the first test. With something like the Top 10 test, for example, we might observe that certain design and row positioning choices generally lead to positive metric movements, some of which are statistically significant. We’d then refine these most promising design and positioning variants, and run a new test. With fewer experiences to test, we can also increase the allocation size to gain more power. Another strategy, useful when the product changes are large, is to gradually roll out the winning treatment experience to the entire user or member based to confirm benefits seen in the A/B test, and to ensure there are no unexpected deleterious impacts. In this case, instead of rolling out the new experience to all users at once, we slowly ramp up the fraction of members receiving the new experience, and observe differences with respect to those still receiving the old experience.
Connections with decision theory
In practice, each person has a different framework for interpreting the results of a test and making a decision. Beyond the data, each individual brings, often implicitly, prior information based on their previous experiences with similar A/B tests, as well as a loss or utility function based on their assessment of the potential benefits and consequences of their decision. There are ways to formalize these human judgements about estimated risks and benefits using decision theory, including Bayesian decision theory. These approaches involve formally estimating the utility of making correct or incorrect decisions (e.g., the cost of rolling out a code change that doesn’t improve the member experience). If, at the end of the experiment, we can also estimate the probability of making each type of mistake for each treatment group, we can make a decision that maximizes the expected utility for our members.
Decision theory couples statistical results with decision-making and is therefore a compelling alternative to p-value-based approaches to decision making. However, decision-theoretic approaches can be difficult to generalize across a broad range of experiment applications, due to the nuances of specifying utility functions. Although imperfect, the frequentist approach to hypothesis testing that we’ve outlined in this series, with its focus on p-values and statistical significance, is a broadly and readily applicable framework for interpreting test results.
Another challenge in interpreting A/B test results is rationalizing through the movements of multiple metrics (primary decision metric and secondary metrics). A key challenge is that the metrics themselves are often not independent (i.e. metrics may generally move in the same direction, or in opposite directions). Here again, more advanced concepts from statistical inference and decision theory are applicable, and at Netflix we are engaged in research to bring more quantitative approaches to this multimetric interpretation problem. Our approach is to include in the analysis information about historical metric movements using Bayesian inference — more to follow!
Finally, it’s worth noting that different types of experiments warrant different levels of human judgment in the decision making process. For example, Netflix employs a form of A/B testing to ensure safe deployment of new software versions into production. Prior to releasing the new version to all members, we first set up a small A/B test, with some members receiving the previous code version and some the new, to ensure there are no bugs or unexpected consequences that degrade the member experience or the performance of our infrastructure. For this use case, the goal is to automate the deployment process and, using frameworks like regret minimization, the test-based decision making as well. In success, we save our developers time by automatically passing the new build or flagging metric degradations to the developer.
Summary
Here we’ve described how to build the case for a product innovation through careful analysis of the experimental data, and noted that different types of tests warrant differing levels of human input to the decision process.
Decision making under uncertainty, including acting on results from A/B tests, is difficult, and the tools we’ve described in this series of posts can be hard to apply correctly. But these tools, including the p-value, have withstood the test of time, as reinforced in 2021 by the American Statistical Association president’s task force statement on statistical significance and replicability: “the use of p-values and significance testing, properly applied and interpreted, are important tools that should not be abandoned. . . . [they] increase the rigor of the conclusions drawn from data.”
The notion of publicly sharing and debating results of key product tests is ingrained in the Experimentation Culture at Netflix, which we’ll discuss in the last installment of this series. But up next, we’ll talk about the different areas of experimentation across Netflix, and the different roles that focus on experimentation. Follow the Netflix Tech Blog to stay up to date.
This is the fourth post in a multi-part series on how Netflix uses A/B tests to inform decisions and continuously innovate on our products. Need to catch up? Have a look at Part 1 (Decision Making at Netflix), Part 2 (What is an A/B Test?), Part 3 (False positives and statistical significance). Subsequent posts will go into more details on experimentation across Netflix, how Netflix has invested in infrastructure to support and scale experimentation, and the importance of the culture of experimentation within Netflix.
In Part 3: False positives and statistical significance, we defined the two types of mistakes that can occur when interpreting test results: false positives and false negatives. We then used simple thought exercises based on flipping coins to build intuition around false positives and related concepts such as statistical significance, p-values, and confidence intervals. In this post, we’ll do the same for false negatives and the related concept of statistical power.
Figure 1: As in Part 3, we’ll use thought exercises based on flipping coins, such as this one displaying Caesar Augustus, to build up intuition about core statistical concepts.
False negatives and power
A false negative occurs when the data do not indicate a meaningful difference between treatment and control, but in truth there is a difference. Continuing on an example from Part 3, a false negative corresponds to labeling the photo of the cat as a “not cat.” False negatives are closely related to the statistical concept of power, which gives the probability of a true positive given the experimental design and a true effect of a specific size. In fact, power is simply one minus the false negative rate.
Power involves thinking about possible outcomes given a specific assumption about the actual state of the world — similar to how in Part 3 we defined significance by first assuming the null hypothesis is true. To build intuition about power, let’s go back to the same coin example from Part 3, where the goal is to decide if the coin is unfair using an experiment that calculates the fraction of heads in 100 flips. The distribution of outcomes under the null hypothesis that the coin is fair is shown in black in Figure 2. To make the diagram easier to interpret, we’ve smoothed over the tops of the histograms.
What would happen in this experiment if the coin is not fair? To make the thought exercise more specific, let’s work through what happens when we have a coin where heads occurs, on average, 64% of the time (the choice of that peculiar number will become clear later on). Because there is uncertainty or noise in our experiment, we don’t expect to see exactly 64 heads in 100 flips. But as with the null hypothesis that the coin is fair, we can calculate all the possible outcomes if this specific alternative hypothesis is true. This distribution is shown with the red curve in Figure 2.
Figure 2: Illustrating power using the example of flipping a coin 100 times and calculating the fraction of heads. The black and red dashed lines show, respectively, the distribution of outcomes assuming the probability of heads is 50% (null hypothesis) and 64% (specific value of the alternative hypothesis). Here, the power against this alternative is 80% (red shading).
Visually, power is the fraction of this alternative (red) distribution that lies beyond the critical values under the null hypothesis (the blue lines and black curve; see Part 3). Here, 80% of the alternative distribution (red) falls to the right of the taller blue line that demarcates the critical value of the upper rejection region. Assuming that the truth about the coin is that the probability of heads is 64%, then the power of this test is 80%. To be complete, there is also a negligibly small part of the alternative (red) distribution that falls within the lower rejection region (to the left of the short blue line).
The power of a test corresponds to a specific, postulated effect size. In our example, the test has 80% power to detect that a coin is unfair, if that unfair coin in truth has a probability of heads equal to 64%. The interpretation is as follows: if the coin has probability of heads equal to 64%, and we repeatedly run the experiment of flipping 100 times and making a decision at the 5% significance level, then we will correctly reject the null hypothesis that the coin is fair in about 4 out of every 5 experiments. And 20% of those repeated experiments will result in a false negative: we’ll not reject the null hypothesis that the coin is fair, even though it is unfair.
Ways to increase power
In designing an A/B test, we first fix the significance level (the convention is 5%: if there is no difference between treatment and control, we’ll see false positives 5% of the time), and then design the experiment to control false negatives. There are three primary levers we can pull to increase power and reduce the probability of false negatives:
Effect size. Simply put, the larger the effect size — the difference in metric values between Groups A and B — the higher the probability that we’ll be able to correctly detect that difference. To build intuition, think about running an experiment to determine if a coin is unfair, where the data we collect is the fraction of heads in 100 flips. Now think of two scenarios. In the first scenario, the true probability of heads is 55%, and in the second it is 75%. Intuitively (and mathematically!) it is more likely that our experiment identifies the coin as unfair in the second scenario. The true probability of heads is further from the null value of 50%, so it’s more likely that an experiment will produce an outcome that falls in the rejection region. In the product development context, we can increase the expected magnitude of metric movements by being bold vs incremental with the hypotheses we test. Another strategy to increase effect sizes is to test in new areas of the product, where there may be room for larger improvements in member satisfaction. That said, one of the joys of learning through experimentation is the element of surprise: at times, seemingly small changes can have a major impact on top-line metrics.
Sample size. The more units in the experiment, the higher the power and the easier it is to correctly identify smaller effects. To build intuition, think again about running an experiment to determine if a coin is unfair, where the data we collect is the fraction of heads in a fixed number of flips and the true probability of heads is 64%. Consider two scenarios: in the first, we flip the coin 20 times, and in the second, we flip the coin 100 times. Intuitively (and mathematically!), it is more likely that our experiment identifies the coin as unfair in the second scenario. With more data, the result from the experiment is going to be closer to the true rate of 64% heads, while the outcomes under the assumption of a fair coin concentrate around 0.50, causing the rejection region to encroach on the 50% value. These effects combine, so that with more data there is a greater probability that the result from the experiment with the unfair coin will fall in that rejection region, resulting in a true positive. In the product development context, we can increase the power by allocating more members (or other units) to the test or by reducing the number of test groups, though there is a tradeoff between the sample size in each test and the number of non-overlapping tests that can be run at the same time.
The variability of the metric in the underlying population. The more homogenous the metric within the population we are testing on, the easier it is to correctly identify true effects. The intuition for this one is a bit trickier, and our simple coin examples finally break down. Say at Netflix that we run a test that aims to reduce some measure of latency, such as the delay between a member pressing play and video playback commencing. Given the variety of devices and internet connections that people use to access Netflix, there is a lot of natural variability in this metric across our users. As a result, if the test treatment results in a small reduction in the latency metric, it’s hard to successfully identify — the “noise” from the variability across members overwhelms the small signal. In contrast, if we ran the test on a set of members that used similar devices with similar web connections, then the small signal is easier to identify — there is less noise that might drown out the signal. We spend a lot of time at Netflix building statistical analysis models that exploit this intuition, and increase power by effectively lowering the variability; see here for a technical description of our approach.
Powering for reasonable and meaningful effects
Power and the false negative rate are functions of a postulated effect size. Much like how the 5% false positive rate is a widely-accepted convention, the rule of thumb with power is to aim for 80% power for a reasonable and meaningful effect size (we’ll get to each of those below). That is, we postulate an effect size and then design the experiment, primarily through setting the sample size, such that, if the true impact of the treatment experience is as we’ve postulated, the test will correctly identify that there is an effect 80% of the time. And 20% of the time the result from the test will be a false negative: in truth, there is an effect, but our observation from the test does not lie in the rejection region and we fail to conclude that there is an effect. That’s why the examples above used a 64% probability of heads: an experiment with 100 flips then has 80% power.
What constitutes a reasonable effect size can be tricky, as tests can surprise us. But a mix of domain knowledge and common sense can generally provide solid estimates. In an area where testing has a long history, such as optimizing the recommendation systems that help Netflix members choose content that’s great for them, we have a solid idea about the effect sizes that our tests tend to produce (be they positive or negative). Given an understanding of past effect sizes, as well as the analysis strategy, we can set the sample size to ensure the test has 80% power for a reasonable metric movement.
The second consideration, both in this experimental design phase and in deciding where to invest efforts, is to determine what constitutes a meaningful impact to the primary metrics used to decide the test. What is meaningful will depend on the impact area of the experiment (member satisfaction, playback latency, technical performance of back end systems, etc.), and potentially the effort or costs associated with the new product experience. As a hypothetical, say that, for effect sizes smaller than a 0.1% change in the primary metric, the cost of supporting the new product feature outweighs the benefits. In this case, there’s little point in powering a test to detect a 0.01% change in the metric, as successfully identifying an effect of that size won’t result in a meaningful change in decisions. Likewise, if the effect sizes seen in tests in a given innovation area are consistently immaterial to the user experience or the business, that’s a sign that experimentation resources can be more efficiently deployed elsewhere.
Summary
Parts 3 and 4 of this series have focussed on defining and building intuition around the core concepts used to analyze test results: false positives and negatives, statistical significance, p-values, and power.
An uncomfortable truth about experimentation is that we can’t simultaneously minimize both false positives and false negatives. In fact, false positives and negatives trade off with one another. If we used a more stringent false positive rate, such as 0.01%, we’d reduce the number of false positives for tests where there is no difference between A and B — but we’d also reduce the power of the test, increasing the rate of false negatives, for those tests where there is a meaningful difference. Using a 5% false positive rate and targeting 80% power are well-established conventions that balance between limiting false discovery and enabling true discovery. However, in instances where a false positive (or false negative) poses a larger risk, researchers may deviate from these rules of thumb to minimize one type of uncertainty over another.
Our goal is not to eliminate uncertainty, but to understand and quantify the uncertainty in order to make sound decisions. In many cases, results from A/B tests require nuanced interpretation, and in fact the test result itself is only one input into a business decision. In the next post, we’ll cover how to build confidence in a decision using test results. Follow the Netflix Tech Blog to stay up to date.
Quality of a client application is of paramount importance to global digital products, as it is the primary way customers interact with a brand. At Netflix, we have significant investments in ensuring new versions of our applications are well tested. However, Netflix is available for streaming on thousands of types of devices and it is powered by hundreds of micro-services which are deployed independently, making it extremely challenging to comprehensively test internally. Hence, it became important to supplement our release decisions with strong evidence received from the field during the update process.
Our team was formed to mine health signals from the field to quickly evaluate new versions of the client applications. As we invested in systems to enable this vision, it led to increased development velocity, which arguably led to better development practices and quality of the applications. The goal of this blog post is to highlight the investment areas for this vision and the challenges we are facing today.
Client Applications
We deal with two classes of client application updates. The first is where an application package is downloaded from the service or a CDN. An example of this is Netflix’s video player or the TV UI javascript package. The second is one where an application is hosted behind an app store, for example mobile phones or even game consoles. We have more flexibility to control the distribution of the application in the former than in the latter case.
Deployment Strategies
We are all familiar with the advantages of releasing frequently and in smaller chunks. It helps bring a healthy balance to the velocity and quality equation. The challenge for clients is that each instance of the application runs on a Netflix member’s device and signals are derived from a firehose of events being sent by devices across the globe. Depending on the type of client, we need to determine the right strategy to sample consumer devices, and provide a system that can enable various client engineering teams to look for their signals. Hence, the sampling strategy is different if it is a mobile application versus a smart TV. In contrast, a server application runs on servers which are typically identical and a routing abstraction can serve sampled traffic to new versions. And the signals to evaluate a new version are derived from comparatively few thousands of homogenous servers instead of millions of heterogeneous devices.
Staged rollouts of apps mimic the different phases of moon
A widely adopted technique for client applications is gradually rolling out a new version of software rather than making the release available to all users instantly, also known as staged or phased rollout. There are two main benefits to this approach.
First, if something were to fail catastrophically, the release can be paused for triage, limiting the number of customers impacted.
Second, backend services or infrastructure can be scaled intelligently as adoption ramps up.
Application version adoption over time for a staged rollout
This chart represents a counter metric, which exhibits version adoption over the duration of a staged rollout. There is a gradual increase in the percentage of devices switching to N+1 version. In the past, during this period client engineering teams would visually monitor their metric dashboards to evaluate signals as more consumers migrated to a new version of their application.
Client-side error rate during the staged rollout
The chart of client-side error rate during the same time period as the version migration is shown here. We observe that the metric for the new version N+1 stabilizes as the rollout ramps up and reaches closer to 100%, whereas the metric for the current version N becomes noisy over the same time duration. Trying to compare any metric during this time period can be a futile effort, as obvious in this case where there was no customer impacting shift in the error rate but we cannot interpret that from the chart. Typically, teams time-shift one metric over the other to visually detect metric deviations, but time can still be a confounder. Staged rollouts have a lot of benefits, but there is a significant opportunity cost to wait before the new version reaches a critical level of adoption.
AB Tests/Client Canaries
So we brought the science of controlled testing into this decision framework by using what has been utilized for feature evaluations. The main goal of A/B testing is to design a robust experiment that is going to yield repeatable results and enable us to make sound decisions about whether or not to launch a product feature (read more about A/B tests at Netflix here). In the application update use case, we recommend an extreme version of A/B testing: we test the entire application. The new version may include a user facing feature which is designed to be A/B tested and resides behind a feature flag. However, most times it is adding new obvious improvements, simple bug fixes, performance enhancements, productizing outcomes from previous A/B tests, logging etc that are being shipped in the application. If we apply A/B tests methodology (or client canaries as we like to call them to differentiate from traditional feature based A/B tests) the allocation would look identical for both the versions at any time.
Client Canary and Control allocation along with the client-side error rate metric
This chart is showing the new and the baseline version allocations growing over time. Although, majority of users are already on the baseline version we are randomly “allocating” a fraction of those users to be the control group of our experiment. This ensures there is no sampling mismatch between the treatment and the control group. It is easier to visually compare the client side error rate for both versions and even apply statistical inference to change the conversation from “we think” there is a shift in metrics to “we know”.
Client Canaries and A/B tests
But there are differences between feature related A/B tests at Netflix and the incremental product changes used for Client Canaries. The main distinctions are: a shorter runtime, multiple executions of analysis sometimes concurrent with allocation, and use of data to support the null hypothesis. The runtime is predetermined, which in a way, is the stopping rule for client canaries. Unlike feature A/B tests at Netflix, we limit our evidence collection to a few hours, so we can release updates within a working day. We continuously analyze metrics to find egregious regressions sooner rather than once all the evidence has been collected.
Phases of A/B Tests
The three key phases of any A/B tests can be split into Allocation, Metric Collection and Analysis. We use orchestration to connect and manage client applications through the A/B test lifecycle, thereby reducing the cognitive load of deploying them frequently.
Allocation
Sampling is the first stage once your new application has been packaged, tested and published. As time is of the essence here, we rely on dynamic allocation and allocate devices which come to the service during the canary time period based on pre-configured rules. We leverage the allocation service used for all experimentation at Netflix for this purpose.
However, for applications gated behind an external app store (example mobile apps), we only have access to staged rollout solutions provided by the app stores. We can control the percentage of users receiving updated apps, which can increase over time. In order to mimic the client canary solution, we built a synthetic allocation service to perform sampling post-installation of the app updates. This service tries to allocate a device to the control group that typically matches the profile of a device seen in the treatment group, which was allocated by the app store’s staged rollout solution. This ensures we are controlling for key variables which have the potential to impact the analysis.
Metrics
Metrics are a foundational component for client canaries and A/B tests as they give us the necessary insight required to make decisions. And for our use case, metrics need to be computed in real time from millions of user events being sent to our service. Operating at Netflix’s scale, we have to process the event streams on a scalable platform like Mantis and store the time-series data in Apache Druid. To be further cost-efficient with the time-series data we store the metrics for a sliding time window of a few weeks and compress it to a 1 minute time granularity.
The other challenge is to enable client application engineers to contribute to metrics and dimensions as they are aware of what can be a valuable insight. To do this, our real-time metric data pipeline provides the right abstractions to remove the complexity of a distributed stream processing system and also enables these contributions to be used in offline computations for feature A/B test evaluations.The former reduces the barrier to entry and the latter provides additional motivation for client engineers to contribute. Additionally, this gets us closer to consistent metric definitions in both realtime and offline systems.
As we accept contributions, we have to have the right checks in place to ensure the data pipeline is reliable and robust. Changes in user events, stream processing jobs or even in the platform can impact metrics, and so it is imperative that we actively monitor the data pipeline and ingestion.
Analysis
Historically, we have relied on conventional statistical tests built into Kayenta to detect metric shifts for the release of new versions of applications. It has served us well over the last few years, however at Netflix we are always looking to improve. Some reasons to explore alternate solutions:
Under the hood ACA uses a fixed horizon statistical hypothesis test which is subject to peeking due to frequent analysis execution during the canary time period. And without a correction, this can erode our false positive guarantees, and the correction itself is a function of the number of peeks — which is not known in advance. This often leads to more false errors in the outcomes.
Due to limited time for the canary, rare event metrics such as errors can often be missing from control or treatment and hence might not get evaluated.
Our intuition suggests any form of metric compression, like aggregating to 1 minute granularity, leads to a loss in power for the analysis, and the tradeoff is that we need more time to confidently detect the metric shifts.
We are actively working on a promising solution to tackle some of these limitations and hope to share more in future.
Orchestration
Orchestration reduces the cognitive load of frequently setting up, executing, analyzing and making decisions for client application canaries. To manage A/B test lifecycle, we decided to build a node.js powered extensible backend service to serve the javascript competency of client engineers while complementing the continuous deployment platform Spinnaker. The drawbacks of most orchestration solutions is the lack of version control and testing. So the main design tenets for this service along with reusability and extensibility are testability and traceability.
Conclusion
Today, most client applications at Netflix use the client canary model to continuously update their applications. We have seen a significant increase in adoption of this methodology over the past 4 years as shown in this cumulative graph of client canary counts.
Year-over-year increase in Client Canaries at Netflix
Time constraints, the need for speed and quality have created several challenges in the client application’s frequent update domain that our team at Netflix aims to solve. We covered some metric related ones in a previous post describing “How Netflix uses Druid for Real-time Insights to Ensure a High-Quality Experience”. We intend to share more in the future diving into the challenges and solutions in the Allocation, Analysis and Orchestration space.
This is the third post in a multi-part series on how Netflix uses A/B tests to inform decisions and continuously innovate on our products. Need to catch up? Have a look at Part 1 (Decision Making at Netflix) and Part 2 (What is an A/B Test?). Subsequent posts will go into more details on experimentation across Netflix, how Netflix has invested in infrastructure to support and scale experimentation, and the importance of the culture of experimentation within Netflix.
In Part 2: What is an A/B Test we talked about testing the Top 10 lists on Netflix, and how the primary decision metric for this test was a measure of member satisfaction with Netflix. If a test like this shows a statistically significant improvement in the primary decision metric, the feature is a strong candidate for a roll out to all of our members. But how do we know if we’ve made the right decision, given the results of the test? It’s important to acknowledge that no approach to decision making can entirely eliminate uncertainty and the possibility of making mistakes. Using a framework based on hypothesis generation, A/B testing, and statistical analysis allows us to carefully quantify uncertainties, and understand the probabilities of making different types of mistakes.
There are two types of mistakes we can make in acting on test results. A false positive (also called a Type I error) occurs when the data from the test indicates a meaningful difference between the control and treatment experiences, but in truth there is no difference. This scenario is like having a medical test come back as positive for a disease when you are healthy. The other error we can make in deciding on a test is a false negative (also called a Type II error), which occurs when the data do not indicate a meaningful difference between treatment and control, but in truth there is a difference. This scenario is like having a medical test come back negative — when you do indeed have the disease you are being tested for.
As another way to build intuition, consider the real reason that the internet and machine learning exist: to label if images show cats. For a given image, there are two possible decisions (apply the label “cat” or “not cat”), and likewise there are two possible truths (the image either features a cat or it does not). This leads to a total of four possible outcomes, shown in Figure 1. The same is true with A/B tests: we make one of two decisions based on the data (“sufficient evidence to conclude that the Top 10 list affects member satisfaction” or “insufficient evidence”), and there are two possible truths, that we never get to know with complete uncertainty (“Top 10 list truly affects member satisfaction” or “it does not”).
Figure 1: The four possible outcomes when labeling an image as either showing a cat or not.
The uncomfortable truth about false positives and false negatives is that we can’t make them both go away. In fact, they trade off with one another. Designing experiments so that the rate of false positives is minuscule necessarily increases the false negative rate, and vice versa. In practice, we aim to quantify, understand, and control these two sources of error.
In the remainder of this post, we’ll use simple examples to build up intuition around false positives and related statistical concepts; in the next post in this series, we’ll do the same for false negatives.
False positives and statistical significance
With a great hypothesis and a clear understanding of the primary decision metric, it’s time to turn to the statistical aspects of designing an A/B test. This process generally starts by fixing the acceptable false positive rate. By convention, this false positive rate is usually set to 5%: for tests where there is not a meaningful difference between treatment and control, we’ll falsely conclude that there is a “statistically significant” difference 5% of the time. Tests that are conducted with this 5% false positive rate are said to be run at the 5% significance level.
Using the 5% significance level convention can feel uncomfortable. By following this convention, we are accepting that, in instances when the treatment and control experience are not meaningfully different for our members, we’ll make a mistake 5% of the time. We’ll label 5% of the non-cat photos as displaying cats.
The false positive rate is closely associated with the “statistical significance” of the observed difference in metric values between the treatment and control groups, which we measure using the p-value. The p-value is the probability of seeing an outcome at least as extreme as our A/B test result, had there truly been no difference between the treatment and control experiences. An intuitive way to understand statistical significance and p-values, which have been confusing students of statistics for over a century (your authors included!), is in terms of simple games of chance where we can calculate and visualize all the relevant probabilities.
Figure 2: Thinking about simple games of chance, such as flipping coins like this one displaying Julius Caesar, is a great way to build up intuition about statistics.
Say we want to know if a coin is unfair, in the sense that the probability of heads is not 0.5 (or 50%). It may sound like a simple scenario, but it is directly relevant to many businesses, Netflix included, where the goal is to understand if a new product experience results in a different rate for some binary user activity, from clicking on a UI feature to retaining the Netflix service for another month. So any intuition we can build through simple games with coins maps directly to interpreting A/B tests.
To decide if the coin is unfair, let’s run the following experiment: we’ll flip the coin 100 times and calculate the fraction of outcomes that are heads. Because of randomness, or “noise,” even if the coin were perfectly fair we wouldn’t expect exactly 50 heads and 50 tails — but how much of a deviation from 50 is “too much”? When do we have sufficient evidence to reject the baseline assertion that the coin is in fact fair? Would you be willing to conclude that the coin is unfair if 60 out of 100 flips were heads? 70? We need a way to align on a decision framework and understand the associated false positive rate.
To build intuition, let’s run through a thought exercise. First, we’ll assume the coin is fair — this is our “null hypothesis,” which is always a statement of status quo or equality. We then seek compelling evidence against this null hypothesis from the data. To make a decision on what constitutes compelling evidence, we calculate the probability of every possible outcome, assuming that the null hypothesis is true. For the coin flipping example, that’s the probability of 100 flips yielding zero heads, one head, two heads, and so forth up to 100 heads — assuming that the coin is fair. Skipping over the math, each of these possible outcomes and their associated probabilities are shown with the black and blue bars in Figure 3 (ignore the colors for now).
We can then compare this probability distribution of outcomes, calculated under the assumption that the coin is fair, to the data we’ve collected. Say we observe that 55% of 100 flips are heads (the solid red line in Figure 3). To quantify if this observation is compelling evidence that the coin is not fair, we count up the probabilities associated with every outcome that is less likely than our observation. Here, because we’ve made no assumptions about heads or tails being more likely, we sum up the probabilities of 55% or more of the flips coming up heads (the bars to the right of the solid red line) and the probabilities of 55% or more of the flips coming up tails (the bars to the left of the dashed red line).
This is the mythical p-value: the probability of seeing a result as extreme as our observation, if the null hypothesis were true. In our case, the null hypothesis is that the coin is fair, the observation is 55% heads in 100 flips, and the p-value is about 0.32. The interpretation is as follows: were we to repeat, many times, the experiment of flipping a coin 100 times and calculating the fraction of heads, with a fair coin (the null hypothesis is true), in 32% of those experiments the outcome would feature at least 55% heads or at least 55% tails (results at least as unlikely as our actual observation).
Figure 3: Flipping a fair coin 100 times, the probability of each outcome expressed as the fraction of heads.
How do we use the p-value to decide if there is statistically significant evidence that the coin is unfair — or that our new product experience is an improvement on the status quo? It comes back to that 5% false positive rate that we agreed to accept at the beginning: we conclude that there is a statistically significant effect if the p-value is less than 0.05. This formalizes the intuition that we should reject the null hypothesis that the coin is fair if our result is sufficiently unlikely to occur under the assumption of a fair coin. In the example of observing 55 heads in 100 coin flips, we calculated a p-value of 0.32. Because the p-value is larger than the 0.05 significance level, we conclude that there is not statistically significant evidence that the coin is unfair.
There are two conclusions that we can make from an experiment or A/B test: we either conclude there is an effect (“the coin is unfair”, “the Top 10 feature increases member satisfaction”) or we conclude that there is insufficient evidence to conclude there is an effect (“cannot conclude the coin is unfair,” “cannot conclude that the Top 10 row increases member satisfaction”). It’s a lot like a jury trial, where the two possible outcomes are “guilty” or “not guilty” — and “not guilty” is very different from “innocent.” Likewise, this (frequentist) approach to A/B testing does not allow us to make the conclusion that there is no effect — we never conclude the coin is fair, or that the new product feature has no impact on our members. We just conclude we’ve not collected enough evidence to reject the null assumption that there is no difference. In the coin example above, we observed 55% heads in 100 flips, and concluded we had insufficient evidence to label the coin as unfair. Critically, we did not conclude that the coin was fair — after all, if we gathered more evidence, say by flipping that same coin 1000 times, we might find sufficiently compelling evidence to reject the null hypothesis of fairness.
Rejection Regions and Confidence Intervals
There are two other concepts in A/B testing that are closely related to p-values: the rejection region for a test, and the confidence interval for an observation. We cover them both in this section, building on the coin example from above.
Rejection Regions. Another way to build a decision rule for a test is in terms of what’s called a “rejection region” — the set of values for which we’d conclude that the coin is unfair. To calculate the rejection region, we once more assume the null hypothesis is true (the coin is fair), and then define the rejection region as the set of least likely outcomes with probabilities that sum to no more than 0.05. The rejection region consists of the outcomes that are the most extreme, provided the null hypothesis is correct — the outcomes where the evidence against the null hypothesis is strongest. If an observation falls in the rejection region, we conclude that there is statistically significant evidence that the coin is not fair, and “reject” the null. In the case of the simple coin experiment, the rejection region corresponds to observing fewer than 40% or more than 60% heads (shown with blue shaded bars in Figure 3). We call the boundaries of the rejection region, here 40% and 60% heads, the critical values of the test.
There is an equivalence between the rejection region and the p-value, and both lead to the same decision: the p-value is less than 0.05 if and only if the observation lies in the rejection region.
Confidence Intervals. So far, we’ve approached building a decision rule by first starting with the null hypothesis, which is always a statement of no change or equivalence (“the coin is fair” or “the product innovation does not impact member satisfaction”). We then define possible outcomes under this null hypothesis and compare our observation to that distribution. To understand confidence intervals, it helps to flip the problem around to focus on the observation. We then go through a thought exercise: given the observation, what values of the null hypothesis would lead to a decision not to reject, assuming we specify a 5% false positive rate? For our coin flipping example, the observation is 55% heads in 100 flips and we do not reject the null of a fair coin. Nor would we reject the null hypothesis that the probability of heads was 47.5%, 50%, or 60%. There’s a whole range of values for which we would not reject the null, from about 45% to 65% probability of heads (Figure 4).
This range of values is a confidence interval: the set of values under the null hypothesis that would not result in a rejection, given the data from the test. Because we’ve mapped out the interval using tests at the 5% significance level, we’ve created a 95% confidence interval. The interpretation is that, under repeated experiments, the confidence intervals will cover the true value (here, the actual probability of heads) 95% of the time.
There is an equivalence between the confidence interval and the p-value, and both lead to the same decision: the 95% confidence interval does not cover the null value if and only if the p-value is less than 0.05, and in both cases we reject the null hypothesis of no effect.
Figure 4: Building the confidence interval by mapping out the set of values that, when used to define a null hypothesis, would not result in rejection for a given observation.
Summary
Using a series of thought exercises based on flipping coins, we’ve built up intuition about false positives, statistical significance and p-values, rejection regions, confidence intervals, and the two decisions we can make based on test data. These core concepts and intuition map directly to comparing treatment and control experiences in an A/B test. We define a “null hypothesis” of no difference: the “B” experience does not alter affect member satisfaction. We then play the same thought experiment: what are the possible outcomes and their associated probabilities for the difference in metric values between the treatment and control groups, assuming there is no difference in member satisfaction? We can then compare the observation from the experiment to this distribution, just like with the coin example, calculate a p-value and make a conclusion about the test. And just like with the coin example, we can define rejection regions and calculate confidence intervals.
But false positives are only of the two mistakes we can make when acting on test results. In the next post in this series, we’ll cover the other type of mistake, false negatives, and the closely related concept of statistical power. Follow the Netflix Tech Blog to stay up to date.
This is the second post in a multi-part series on how Netflix uses A/B tests to inform decisions and continuously innovate on our products. See here for Part 1: Decision Making at Netflix. Subsequent posts will go into more details on the statistics of A/B tests, experimentation across Netflix, how Netflix has invested in infrastructure to support and scale experimentation, and the importance of the culture of experimentation within Netflix.
An A/B test is a simple controlled experiment. Let’s say — this is a hypothetical! — we want to learn if a new product experience that flips all of the boxart upside down in the TV UI is good for our members.
Figure 1: How do we decide if Product Experience B, with the Upside Down box art, is a better experience for our members?
To run the experiment, we take a subset of our members, usually a simple random sample, and then use random assignment to evenly split that sample into two groups. Group “A,” often called the “control group,” continues to receive the base Netflix UI experience, while Group “B,” often called the “treatment group”, receives a different experience, based on a specific hypothesis about improving the member experience (more on those hypotheses below). Here, Group B receives the Upside Down box art.
We wait, and we then compare the values of a variety of metrics from Group A to those from Group B. Some metrics will be specific to the given hypothesis. For a UI experiment, we’ll look at engagement with different variants of the new feature. For an experiment that aims to deliver more relevant results in the search experience, we’ll measure if members are finding more things to watch through search. In other types of experiments, we might focus on more technical metrics, such as the time it takes the app to load, or the quality of video we are able to provide under different network conditions.
Figure 2: A simple A/B test. We split a random sample of Netflix members into two groups using random assignment. Group “A” receives the current product experience, while Group “B” receives some change that we think is an improvement to the Netflix experience. Here, Group “B” receives the “Upside Down” product experience. We then compare metrics between the two groups. Critically, random assignment ensures that, on average, everything else is held constant between the two groups.
With many experiments, including the Upside Down box art example, we need to think carefully about what our metrics are telling us. Suppose we look at the click through rate, measuring the fraction of members in each experience that clicked on a title. This metric alone may be a misleading measure of whether this new UI is a success, as members might click on a title in the Upside Down product experience only in order to read it more easily. In this case, we might also want to evaluate what fraction of members subsequently navigate away from that title versus proceeding to play it.
In all cases, we also look at more general metrics that aim to capture the joy and satisfaction that Netflix is delivering to our members. These metrics include measures of member engagement with Netflix: are the ideas we are testing helping our members to choose Netflix as their entertainment destination on any given night?
There’s a lot of statistics involved as well — how large a difference is considered significant? How many members do we need in a test in order to detect an effect of a given magnitude? How do we most efficiently analyze the data? We’ll cover some of those details in subsequent posts, focussing on the high level intuition.
Holding everything else constant
Because we create our control (“A”) and treatment (“B”) groups using random assignment, we can ensure that individuals in the two groups are, on average, balanced on all dimensions that may be meaningful to the test. Random assignment ensures, for example, that the average length of Netflix membership is not markedly different between the control and treatment groups, nor are content preferences, primary language selections, and so forth. The only remaining difference between the groups is the new experience we are testing, ensuring our estimate of the impact of the new experience is not biased in any way.
To understand how important this is, let’s consider another way we could make decisions: we could roll out the new Upside Down box art experience (discussed above) to all Netflix members, and see if there’s a big change in one of our metrics. If there’s a positive change, or no evidence of any meaningful change, we’ll keep the new experience; if there’s evidence of a negative change, we’ll roll back to the prior product experience.
Let’s say we did that (again — this is a hypothetical!), and flipped the switch to the Upside Down experience on the 16th day of a month. How would you act if we gathered the following data?
Figure 3: Hypothetical data for the release of the new Upside Down box art product experience on Day 16.
The data look good: we release a new product experience and member engagement goes way up! But if you had these data, plus the knowledge that Product B flips all the box art in the UI upside down, how confident would you be that the new product experience really is good for our members?
Do we really know that the new product experience is what caused the increase in engagement? What other explanations are possible?
What if you also knew that Netflix released a hit title, like a new season of Stranger Things or Bridgerton, or a hit movie like Army of the Dead, on the same day as the (hypothetical) roll out of the new Upside Down product experience? Now we have more than one possible explanation for the increase in engagement: it could be the new product experience, it could be the hit title that’s all over social media, it could be both. Or it could be something else entirely. The key point is that we don’t know if the new product experience caused the increase in engagement.
What if instead we’d run an A/B test with the Upside Down box art product experience, with one group of members receiving the current product (“A”) and another group the Upside Down product (“B”) over the entire month, and gathered the following data:
Figure 4: Hypothetical data for an A/B test of a new product experience.
In this case, we are led to a different conclusion: the Upside Down product results in generally lower engagement (not surprisingly!), and both groups see an increase in engagement concurrent with the launch of the big title.
A/B tests let us make causal statements. We’ve introduced the Upside Down product experience to Group B only, and because we’ve randomly assigned members to groups A and B, everything else is held constant between the two groups. We can therefore conclude with high probability (more on the details next time) that the Upside Down product caused the reduction in engagement.
This hypothetical example is extreme, but the broad lesson is that there is always something we won’t be able to control. If we roll out an experience to everyone and simply measure a metric before and after the change, there can be relevant differences between the two time periods that prevent us from making a causal conclusion. Maybe it’s a new title that takes off. Maybe it’s a new product partnership that unlocks Netflix for more users to enjoy. There’s always something we won’t know about. Running A/B tests, where possible, allows us to substantiate causality and confidently make changes to the product knowing that our members have voted for them with their actions.
It all starts with an idea
An A/B test starts with an idea — some change we can make to the UI, the personalization systems that help members find content, the signup flow for new members, or any other part of the Netflix experience that we believe will produce a positive result for our members. Some ideas we test are incremental innovations, like ways to improve the text copy that appears in the Netflix product; some are more ambitious, like the test that led to “Top 10” lists that Netflix now shows in the UI.
As with all innovations that are rolled out to Netflix members around the globe, Top 10 started as an idea that was turned into a testable hypothesis. Here, the core idea was that surfacing titles that are popular in each country would benefit our members in two ways. First, by surfacing what’s popular we can help members have shared experiences and connect with one another through conversations about popular titles. Second, we can help members choose some great content to watch by fulfilling the intrinsic human desire to be part of a shared conversation.
Figure 5: An example of the Top 10 experience on the Web UI.
We next turn this idea into a testable hypothesis, a statement of the form “If we make change X, it will improve the member experience in a way that makes metric Y improve.” With the Top 10 example, the hypothesis read: “Showing members the Top 10 experience will help them find something to watch, increasing member joy and satisfaction.” The primary decision metric for this test (and many others) is a measure of member engagement with Netflix: are the ideas we are testing helping our members to choose Netflix as their entertainment destination on any given night? Our research shows that this metric (details omitted) is correlated, in the long term, with the probability that members will retain their subscriptions. Other areas of the business in which we run tests, such as the signup page experience or server side infrastructure, make use of different primary decision metrics, though the principle is the same: what can we measure, during the test, that is aligned with delivering more value in the long-term to our members?
Along with the primary decision metric for a test, we also consider a number of secondary metrics and how they will be impacted by the product feature we are testing. The goal here is to articulate the causal chain, from how user behavior will change in response to the new product experience to the change in our primary decision metric.
Articulating the causal chain between the product change and changes in the primary decision metric, and monitoring secondary metrics along this chain, helps us build confidence that any movement in our primary metric is the result of the causal chain we are hypothesizing, and not the result of some unintended consequence of the new feature (or a false positive — much more on that in later posts!). For the Top 10 test, engagement is our primary decision metric — but we also look at metrics such as title-level viewing of those titles that appear in the Top 10 list, the fraction of viewing that originates from that row vs other parts of the UI, and so forth. If the Top 10 experience really is good for our members in accord with the hypothesis, we’d expect the treatment group to show an increase in viewing of titles that appear in the Top 10 list, and for generally strong engagement from that row.
Finally, because not all of the ideas we test are winners with our members (and sometimes new features have bugs!) we also look at metrics that act as “guardrails.” Our goal is to limit any downside consequences and to ensure that the new product experience does not have unintended impacts on the member experience. For example, we might compare customer service contacts for the control and treatment groups, to check that the new feature is not increasing the contact rate, which may indicate member confusion or dissatisfaction.
Summary
This post has focused on building intuition: the basics of an A/B test, why it’s important to run an A/B test versus rolling out a feature and looking at metrics pre- and post- making a change, and how we turn an idea into a testable hypothesis. Next time, we’ll jump into the basic statistical concepts that we use when comparing metrics from the treatment and control experiences. Follow the Netflix Tech Blog to stay up to date.
What is an A/B Test? was originally published in Netflix TechBlog on Medium, where people are continuing the conversation by highlighting and responding to this story.
This introduction is the first in a multi-part series on how Netflix uses A/B tests to make decisions that continuously improve our products, so we can deliver more joy and satisfaction to our members. Subsequent posts will cover the basic statistical concepts underpinning A/B tests, the role of experimentation across Netflix, how Netflix has invested in infrastructure to support and scale experimentation, and the importance of the culture of experimentation within Netflix.
Netflix was created with the idea of putting consumer choice and control at the center of the entertainment experience, and as a company we continuously evolve our product offerings to improve on that value proposition. For example, the Netflix UI has undergone a complete transformation over the last decade. Back in 2010, the UI was static, with limited navigation options and a presentation inspired by displays at a video rental store. Now, the UI is immersive and video-forward, the navigation options richer but less obtrusive, and the box art presentation takes greater advantage of the digital experience.
Figure 1: The Netflix TVUI in 2010 (top) and in 2020 (bottom).
Transitioning from that 2010 experience to what we have today required Netflix to make countless decisions. What’s the right balance between a large display area for a single title vs showing more titles? Are videos better than static images? How do we deliver a seamless video-forward experience on constrained networks? How do we select which titles to show? Where do the navigation menus belong and what should they contain? The list goes on.
Making decisions is easy — what’s hard is making the right decisions. How can we be confident that our decisions are delivering a better product experience for current members and helping grow the business with new members? There are a number of ways Netflix could make decisions about how to evolve our product to deliver more joy to our members:
Let leadership make all the decisions.
Hire some experts in design, product management, UX, streaming delivery, and other disciplines — and then go with their best ideas.
Have an internal debate and let the viewpoints of our most charismatic colleagues carry the day.
Copy the competition.
Figure 2: Different ways to make decisions. Clockwise from top left: leadership, internal experts, copy the competition, group debate.
In each of these paradigms, a limited number of viewpoints and perspectives contribute to the decision. The leadership group is small, group debates can only be so big, and Netflix has only so many experts in each domain area where we need to make decisions. And there are maybe a few tens of streaming or related services that we could use as inspiration. Moreover, these paradigms don’t provide a systematic way to make decisions or resolve conflicting viewpoints.
At Netflix, we believe there’s a better way to make decisions about how to improve the experience we deliver to our members: we use A/B tests. Experimentation scales. Instead of small groups of executives or experts contributing to a decision, experimentation gives all our members the opportunity to vote, with their actions, on how to continue to evolve their joyful Netflix experience.
More broadly, A/B testing, along with other causal inference methods like quasi-experimentation are ways that Netflix uses the scientific method to inform decision making. We form hypotheses, gather empirical data, including from experiments, that provide evidence for or against our hypotheses, and then make conclusions and generate new hypotheses. As explained by my colleague Nirmal Govind, experimentation plays a critical role in the iterative cycle of deduction (drawing specific conclusions from a general principle) and induction (formulating a general principle from specific results and observations) that underpins the scientific method.
Curious to learn more? Follow the Netflix Tech Blog for future posts that will dive into the details of A/B tests and how Netflix uses tests to inform decision making.
Decision Making at Netflix was originally published in Netflix TechBlog on Medium, where people are continuing the conversation by highlighting and responding to this story.
Within the rapid expansion of data-related roles in the last decade, the title Data Scientist has emerged as an umbrella term for myriad skills and areas of business focus. What does this title mean within a given company, or even within a given industry? It can be hard to know from the outside. At Netflix, our data scientists span many areas of technical specialization, including experimentation, causal inference, machine learning, NLP, modeling, and optimization. Together with data analytics and data engineering, we comprise the larger, centralized Data Science and Engineering group.
Learning through data is in Netflix’s DNA. Our quasi-experimentation helps us constantly improve our streaming experience, giving our members fewer buffers and ever better video quality. We use A/B tests to introduce new product features, such as our daily Top 10 row that help our members discover their next favorite show. Our experimentation and causal inference focused data scientists help shape business decisions, product innovations, and engineering improvements across our service.
In this post, we discuss a day in the life of experimentation and causal inference data scientists at Netflix, interviewing some of our stunning colleagues along the way. We talked to scientists from areas like Payments & Partnerships, Content & Marketing Analytics Research, Content Valuation, Customer Service, Product Innovation, and Studio Production. You’ll read about their backgrounds, what best prepared them for their current role at Netflix, what they do in their day-to-day, and how Netflix contributes to their growth in their data science journey.
Who we are
One of the best parts of being a data scientist at Netflix is that there’s no one type of data scientist! We come from many academic backgrounds, including economics, radiotherapy, neuroscience, applied mathematics, political science, and biostatistics. We worked in different industries before joining Netflix, including tech, entertainment, retail, science policy, and research. These diverse and complementary backgrounds enrich the perspectives and technical toolkits that each of us brings to a new business question.
We’ll turn things over to introduce you to a few of our data scientists, and hear how they got here.
What brought you to the field of data science? Did you always know you wanted to do data science?
Roxy Du (Product Innovation)
[Roxy D.] A combination of interest, passion, and luck! While working on my PhD in political science, I realized my curiosity was always more piqued by methodological coursework, which led me to take as many stats/data science courses as I could. Later I enrolled in a data science program focused on helping academics transition to industry roles.
Reza Badri (Content Valuation)
[Reza B.] A passion for making informed decisions based on data. Working on my PhD, I was using optimization techniques to design radiotherapy fractionation schemes to improve the results of clinical practices. I wanted to learn how to better extract interesting insight from data, which led me to take several courses in statistics and machine learning. After my PhD, I started working as a data scientist at Target, where I built mathematical models to improve real-time pricing recommendation and ad serving engines.
Gwyn Bleikamp (Payments)
[Gwyn B.]: I’ve always loved math and statistics, so after college, I planned to become a statistician. I started working at a local payment processing company after graduation, where I built survival models to calculate lifetime value and experimented with them on our brand new big data stack. I was doing data science without realizing it.
What best prepared you for your current role at Netflix? Are there any experiences that particularly helped you bring a unique voice/point of view to Netflix?
David Cameron (Studio Production)
[David C.] I learned a lot about sizing up the potential impact of an opportunity (using back of the envelope math), while working as a management consultant after undergrad. This has helped me prioritize my work so that I’m spending most of my time on high-impact projects.
Aliki Mavromoustaki (Content & Marketing)
[Aliki M.] My academic credentials definitely helped on the technical side. Having a background in research also helps with critical thinking and being comfortable with ambiguity. Personally I value my teaching experiences the most, as they allowed me to improve the way I approach and break down problems effectively.
What we do at Netflix
But what does a day in the life of an experimentation/causal inference data scientist at Netflix actually look like? We work in cross-functional environments, in close collaboration with business, product and creative decision makers, engineers, designers, and consumer insights researchers. Our work provides insights and informs key decisions that improve our product and create more joy for our members. To hear more, we’ll hand you back over to our stunning colleagues.
Tell us about your business area and the type of stakeholders you partner with on a regular basis. How do you, as a data scientist, fill in the pieces between product, engineering, and design?
[Roxy D.] I partner with product managers to run AB experiments that drive product innovation. I collaborate with product managers, designers, and engineers throughout the lifecycle of a test, including ideation, implementation, analysis, and decision-making. Recently, we introduced a simple change in kids profiles that helps kids more easily find their rewatched titles. The experiment was conceived based on what we’d heard from members in consumer research, and it was very gratifying to address an underserved member need.
[David C.] There are several different flavors of data scientist in the Artwork and Video team. My specialties are on the Statistics and Optimization side. A recent favorite project was to determine the optimal number of images to create for titles. This was a fun project for me, because it combined optimization, statistics, understanding of reinforcement learning bandit algorithms, as well as general business sense, and it has far-reaching implications to the business.
What are your responsibilities as the data scientist in these projects? What technical skills do you draw on most?
[Gwyn B.] Data scientists can take on any aspect of an experimentation project. Some responsibilities I routinely have are: designing tests, metrics development and defining what success looks like, building data pipelines and visualization tools for custom metrics, analyzing results, and communicating final recommendations with broad teams. Coding with statistical software and SQL are my most widely used technical skills.
[David C.] One of the most important responsibilities I have is doing the exploratory data analysis of the counterfactual data produced by our bandit algorithms. These analyses have helped our stakeholders identify major opportunities, bugs and tighten up engineering pipelines. One of the most common analyses that I do is a look-back analysis on the explore-data. This data helps us analyze natural experiments and understand which type of images better introduce our content to our members.
Wenjing Zheng (Partnerships)Stephanie Lane (Partnerships)
[Stephanie L. & Wenjing Z.] As data scientists in Partnerships, we work closely with our business development, partner marketing, and partner engagement teams to create the best possible experience of Netflix on every device. Our analyses help inform ways to improve certain product features (e.g., a Netflix row on your Smart TV) and consumer offers (e.g., getting Netflix as part of a bundled package), to provide the best experiences and value for our customers. But randomized, controlled experiments are not always feasible. We draw on technical expertise in varied forms of causal inference — interrupted time series designs, inverse probability weighting, and causal machine learning — to identify promising natural experiments, design quasi-experiments, and deliver insights. Not only do we own all steps of the analysis and communicate findings within Netflix, we often participate in discussions with external partners on how best to improve the product. Here, we draw on strong business context and communication to be most effective in our roles.
What non-technical skills do you draw on most?
[Aliki M.] Being able to adapt my communication style to work well with both technical and non-technical audiences. Building strong relationships with partners and working effectively in a team.
[Gwyn B.] Written communication is among the topmost valuable non-technical assets. Netflix is a memo-based culture, which means we spend a lot of time reading and writing. This is a primary way we share results and recommendations as well as solicit feedback on project ideas. Data Scientists need to be able to translate statistical analyses, test results, and significance into recommendations that the team can understand and action on.
How is working at Netflix different from where you’ve worked before?
[Reza B.] The Netflix culture makes it possible for me to continuously grow both technically and personally. Here, I have the opportunity to take risks and work on problems that I find interesting and impactful. Netflix is a great place for curious researchers that want to be challenged everyday by working on interesting problems. The tooling here is amazing, which made it easy for me to make my models available at scale across the company.
Mihir Tendulkar (Payments)
[Mihir T.] Each company has their own spin on data scientist responsibilities. At my previous company, we owned everything end-to-end: data discovery, cleanup, ETL, analysis, and modeling. By contrast, Netflix puts data infrastructure and quality control under the purview of specialized platform teams, so that I can focus on supporting my product stakeholders and improving experimentation methodologies. My wish-list projects are becoming a reality here: studying experiment interaction effects, quantifying the time savings of Bayesian inference, and advocating for Mindhunter Season 3.
[Stephanie L.] In my last role, I worked at a research think tank in the D.C. area, where I focused on experimentation and causal inference in national defense and science policy. What sets Netflix apart (other than the domain shift!) is the context-rich culture and broad dissemination of information. New initiatives and strategy bets are captured in memos for anyone in the company to read and engage in discourse. This context-rich culture enables me to rapidly absorb new business context and ultimately be a better thought partner to my stakeholders.
Data scientists at Netflix wear many hats. We work closely with business and creative stakeholders at the ideation stage to identify opportunities, formulate research questions, define success, and design studies. We partner with engineers to implement and debug experiments. We own all aspects of the analysis of a study (with help from our stellar data engineering and experimentation platform teams) and broadly communicate the results of our work. In addition to company-wide memos, we often bring our analytics point of view to lively cross-functional debates on roll-out decisions and product strategy. These responsibilities call for technical skills in statistics and machine learning, and programming knowledge in statistical software (R or Python) and SQL. But to be truly effective in our work, we also rely on non-technical skills like communication and collaborating in an interdisciplinary team.
You’ve now heard how our data scientists got here and what drives them to be successful at Netflix. But the tools of data science, as well as the data needs of a company, are constantly evolving. Before we wrap up, we’ll hand things over to our panel one more time to hear how they plan to continue growing in their data science journey at Netflix.
How are you looking to develop as a data scientist in the near future, and how does Netflix help you on that path?
[Reza B.] As a researcher, I like to continue growing both technically and non-technically; to keep learning, being challenged and work on impactful problems. Netflix gives me the opportunity to work on a variety of interesting problems, learn cutting-edge skills and be impactful. I am passionate about improving decision making through data, and Netflix gives me that opportunity. Netflix culture helps me receive feedback on my non-technical and technical skills continuously, providing helpful context for me to grow and be a better scientist.
[Aliki M.] True to our Netflix values, I am very curious and want to continue to learn, strengthen and expand my skill set. Netflix exposes me to interesting questions that require critical thinking from design to execution. I am surrounded by passionate individuals who inspire me and help me be better through their constructive feedback. Finally, my manager is highly aligned with me regarding my professional goals and looks for opportunities that fit my interests and passions.
[Roxy D.] I look forward to continuously growing on both the technical and non-technical sides. Netflix has been my first experience outside academia, and I have enjoyed learning about the impact and contribution of data science in a business environment. I appreciate that Netflix’s culture allows me to gain insights into various aspects of the business, providing helpful context for me to work more efficiently, and potentially with a larger impact.
As data scientists, we are continuously looking to add to our technical toolkit and to cultivate non-technical skills that drive more impact in our work. Working alongside stunning colleagues from diverse technical and business areas means that we are constantly learning from each other. Strong demand for data science across all business areas of Netflix affords us the ability to collaborate in new problem areas and develop new skills, and our leaders help us identify these opportunities to further our individual growth goals. The constructive feedback culture in Netflix is also key in accelerating our growth. Not only does it help us see blind spots and identify areas of improvement, it also creates a supportive environment where we help each other grow.
Learning more
Interested in learning more about data roles at Netflix? You’re in the right place! Check out our post on Analytics at Netflix to find out more about two other data roles at Netflix — Analytics Engineers and Data Visualization Engineers — who also drive business impact through data. You can search our open roles in Data Science and Engineering here. Our culture is key to our impact and growth: read about it here.
At Netflix, when we can’t run A/B experiments we run quasi experiments! We run quasi experiments with various objectives such as non-member experiments focusing on acquisition, member experiments focusing on member engagement, or video streaming experiments focusing on content delivery. Consolidating on one methodology could be a challenge, as we may face different design or data constraints or optimization goals. We discuss some key challenges and approaches Netflix has been using to handle small sample size and limited pre-intervention data in quasi experiments.
Within-country quasi design to measure the impact of TV ads in France and Germany. Geographic units are defined based on the lowest level of media buying capability.
Design and Randomization
We face various business problems where we cannot run individual level A/B tests but can benefit from quasi experiments. For instance, consider the case where we want to measure the impact of TV or billboard advertising on member engagement. It is impossible for us to have identical treatment and control groups at the member level as we cannot hold back individuals from such forms of advertising. Our solution is to randomize our member base at the smallest possible level. For instance, TV advertising can be bought at TV media market level only in most countries. This usually involves groups of cities in closer geographic proximity.
One of the major problems we face in quasi experiments is having small sample size where asymptotic properties may not practically hold. We typically have a small number of geographic units due to test limitations and also use broader or distant groups of units to minimize geographic spillovers. We are also more likely to face high variation and uneven distributions in treatment and control groups due to heterogeneity across units. For example, let’s say we are interested in measuring the impact of marketing Lost in Space series on sci-fi viewing in the UK. London with its high population is randomly assigned to the treatment cell, and people in London love sci-fi much more than other cities. If we ignore the latter fact, we will overestimate the true impact of marketing — which is now confounded. In summary, simple randomization and mean comparison we typically utilize in A/B testing with millions of members may not work well for quasi experiments.
Completely tackling these problems during the design phase may not be possible. We use some statistical approaches during design and analysis to minimize bias and maximize precision of our estimates. During design, one approach we utilize is running repeated randomizations, i.e. ‘re-randomization’. In particular, we keep randomizing until we find a randomization that gives us the maximum desired level of balance on key variables across test cells. This approach generally enables us to define more similar test groups (i.e. getting closer to apples to apples comparison). However, we may still face two issues: 1) we can only simultaneously balance on a limited number of observed variables, and it is very difficult to find identical geographic units on all dimensions, and 2) we can still face noisy results with large confidence intervals due to small sample size. We next discuss some of our analysis approaches to further tackle these problems.
Analysis
Going Beyond Simple Comparisons
Difference in differences (diff-in-diff or DID) comparison is a very common approach used in quasi experiments. In diff-in-diff, we usually consider two time periods; pre and post intervention. We utilize the pre-intervention period to generate baselines for our metrics, and normalize post intervention values by the baseline. This normalization is a simple but very powerful way of controlling for inherent differences between treatment and control groups. For example, let’s say our success metric is signups and we are running a quasi experiment in France. We have Paris and Lyon in two test cells. We cannot directly compare signups in two cities as populations are very different. Normalizing with respect to pre-intervention signups would reduce variation and help us make comparisons at the same scale. Although the diff-in-diff approach generally works reasonably well, we have observed some cases where it may not be as applicable as we discuss next.
Success Metrics With Historical Observations But Small Sample Size
In our non-member focused tests, we can observe historical acquisition metrics, e.g. signup counts, however, we don’t typically observe any other information about non-members. High variation in outcome metrics combined with small sample size can be a problem to design a well powered experiment using traditional diff-in-diff like approaches. To tackle this problem, we try to implement designs involving multiple interventions in each unit over an extended period of time whenever possible (i.e. instead of a typical experiment with single intervention period). This can help us gather enough evidence to run a well-powered experiment even with a very small sample size (i.e. few geographic units).
In particular, we turn the intervention (e.g. advertising) “on” and “off” repeatedly over time in different patterns and geographic units to capture short term effects. Every time we “toggle” the intervention, it gives us another chance to read the effect of the test. So even if we only have few geographic units, we can eventually read a reasonably precise estimate of the effect size (although, of course, results may not be generalizable to others if we have very few units). As our analysis approach, we can use observations from steady-state units to estimate what would otherwise have happened in units that are changing. To estimate the treatment effect, we fit a dynamic linear model (aka DLM), a type of state space model where the observations are conditionally Gaussian. DLMs are a very flexible category of models, but we only use a narrow subset of possible DLM structures to keep things simple. We currently have a robust internal package embedded in our internal tool, Quasimodo, to cover experiments that have similar structure. Our model is comparable to Google’s CausalImpact package, but uses a multivariate structure to let us analyze more than a single point-in-time intervention in a single region.
Success Metrics Without Historical Observations
In our member focused tests, we sometimes face cases where we don’t have success metrics with historical observations. For example, Netflix promotes its new shows that are yet to be launched on service to increase member engagement once the show is available. For a new show, we start observing metrics only when the show launches. As a result, our success metrics inherently don’t have any historical observations making it impossible to utilize the benefits of similar time series based approaches.
In these cases, we utilize the benefits of richer member data to measure and control for members’ inherent engagement or interest with the show. We do this by using relevant pre-treatment proxies, e.g. viewing of similar shows, interest in Netflix originals or similar genres. We have observed that controlling for geographic as well as individual level differences work best in minimizing confounding effects and improving precision. For example, if members in Toronto watch more Netflix originals than members in other cities in Canada, we should then control for pre-treatment Netflix originals viewing at both individual and city level to capture within and between unit variation separately.
This is in nature very similar to covariate adjustment. However, we do more than just running a simple regression with a large set of control variables. At Netflix, we have worked on developing approaches at the intersection of regression covariate adjustment and machine learning based propensity score matching by using a wide set of relevant member features. Such combined approaches help us explicitly control for members’ inherent interest in the new show using hundreds of features while minimizing linearity assumptions and degrees of freedom challenges we may face. We thus gain significant wins in both reducing potential confounding effects as well as maximizing precision to more accurately capture the treatment effect we are interested in.
Next Steps
We have excelled in the quasi experimentation space with many measurement strategies now in play across Netflix for various use cases. However we are not done yet! We can expand methodologies to more use cases and continue to improve the measurement. As an example, another exciting area we have yet to explore is combining these approaches for those metrics where we can use both time series approaches and a rich set of internal features (e.g. general member engagement metrics). If you’re interested in working on these and other causal inference problems, join our dream team!
To provide the best experiences, we use technologies like cookies to store and/or access device information. Consenting to these technologies will allow us to process data such as browsing behavior or unique IDs on this site. Not consenting or withdrawing consent, may adversely affect certain features and functions.
Functional
Always active
The technical storage or access is strictly necessary for the legitimate purpose of enabling the use of a specific service explicitly requested by the subscriber or user, or for the sole purpose of carrying out the transmission of a communication over an electronic communications network.
Preferences
The technical storage or access is necessary for the legitimate purpose of storing preferences that are not requested by the subscriber or user.
Statistics
The technical storage or access that is used exclusively for statistical purposes.The technical storage or access that is used exclusively for anonymous statistical purposes. Without a subpoena, voluntary compliance on the part of your Internet Service Provider, or additional records from a third party, information stored or retrieved for this purpose alone cannot usually be used to identify you.
Marketing
The technical storage or access is required to create user profiles to send advertising, or to track the user on a website or across several websites for similar marketing purposes.

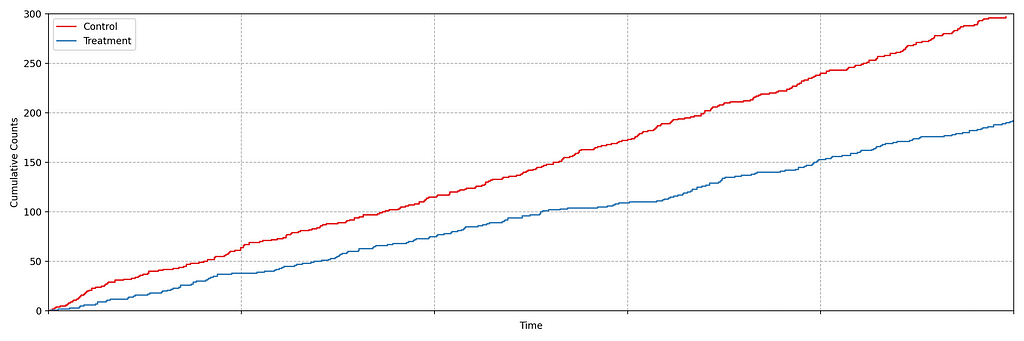
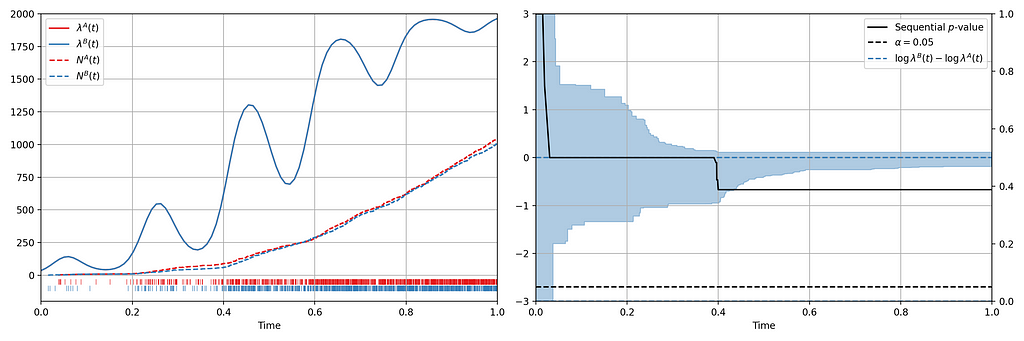
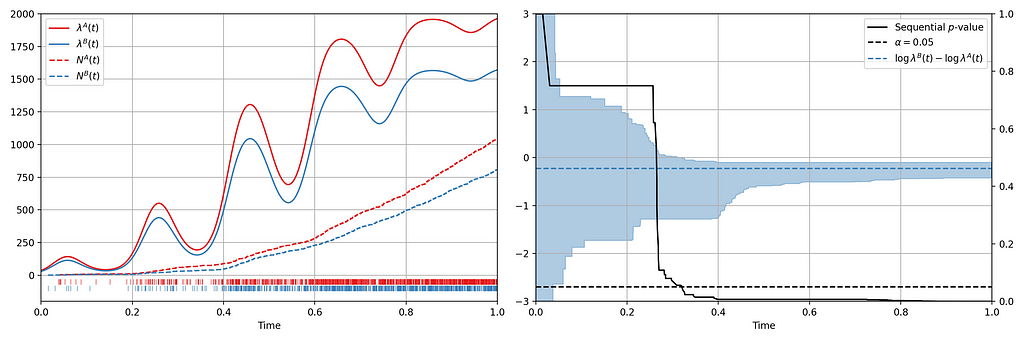
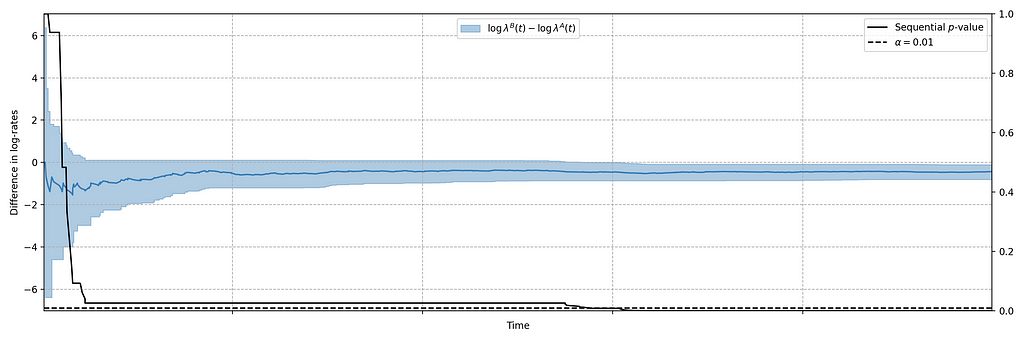
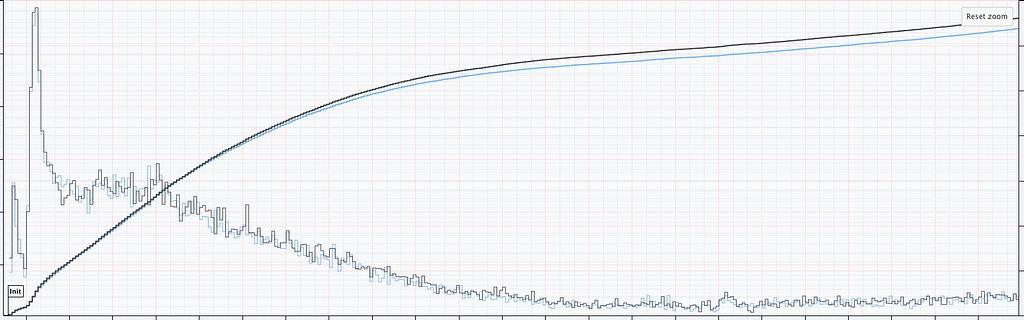
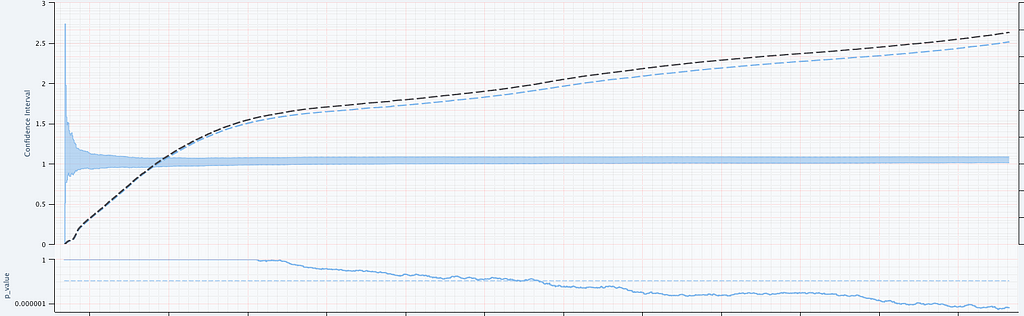
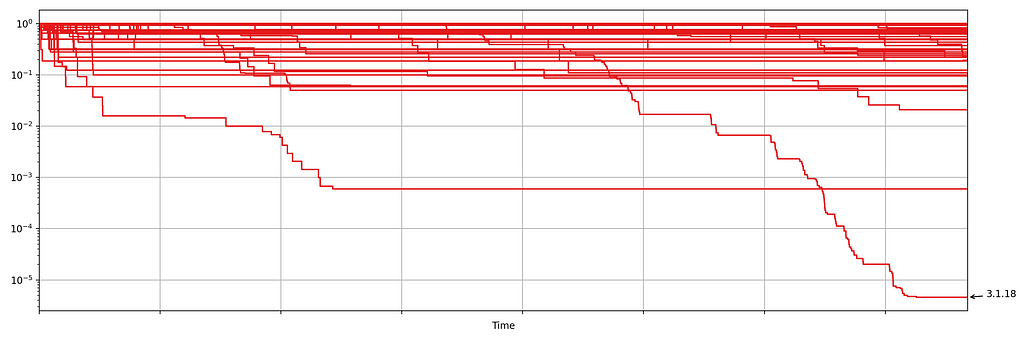
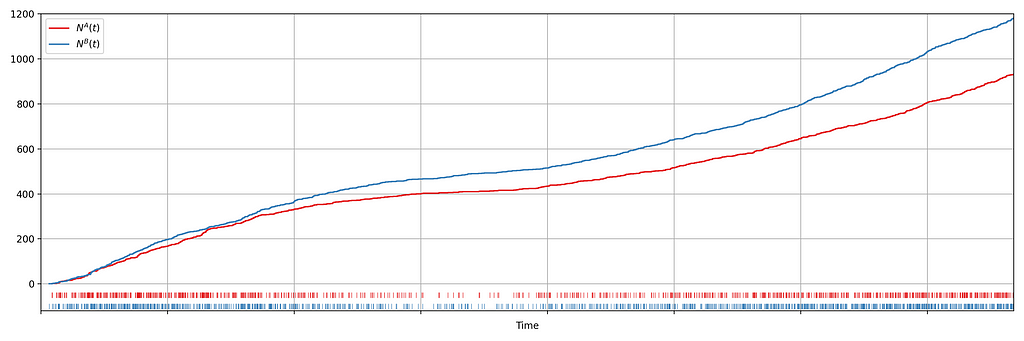
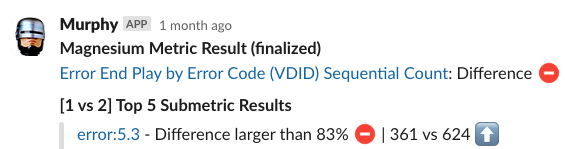
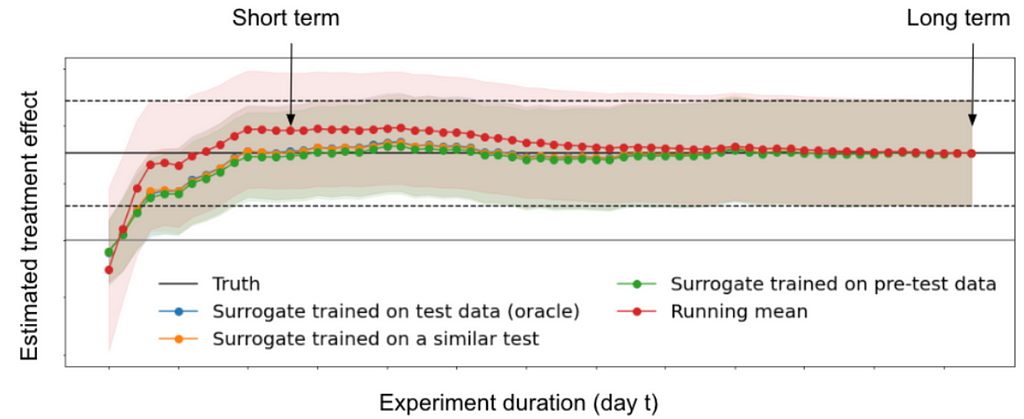
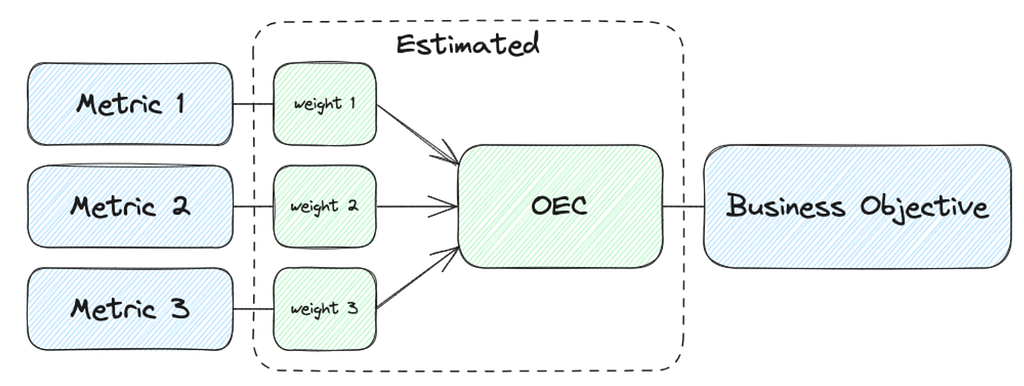
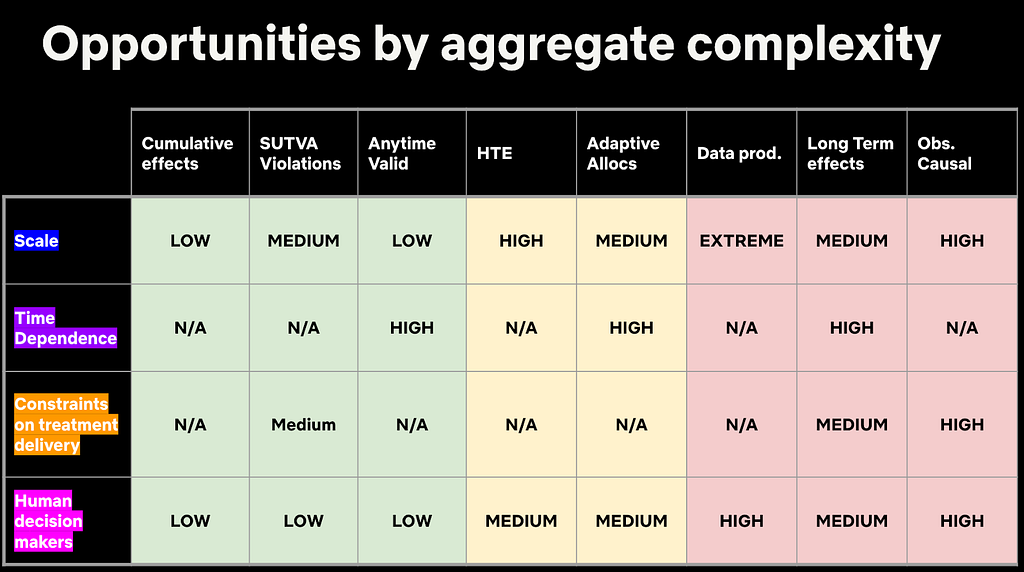


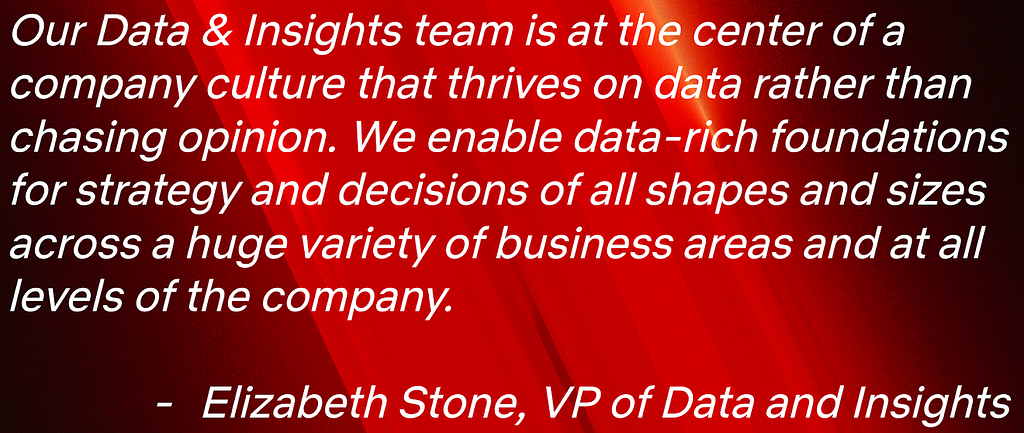
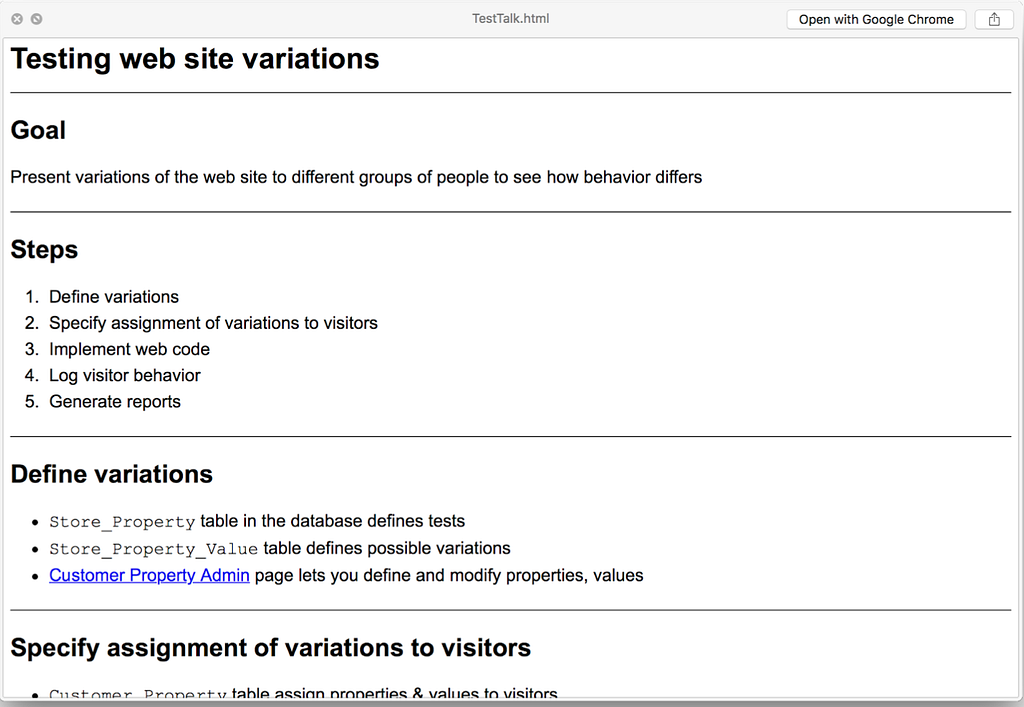

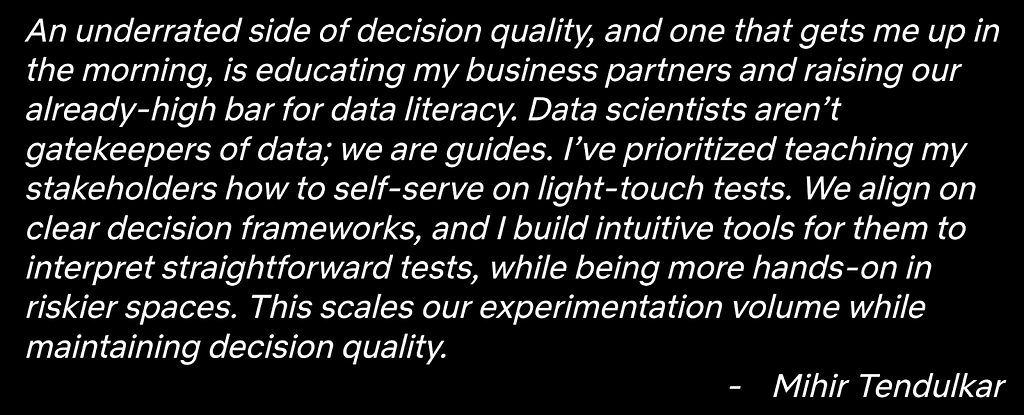

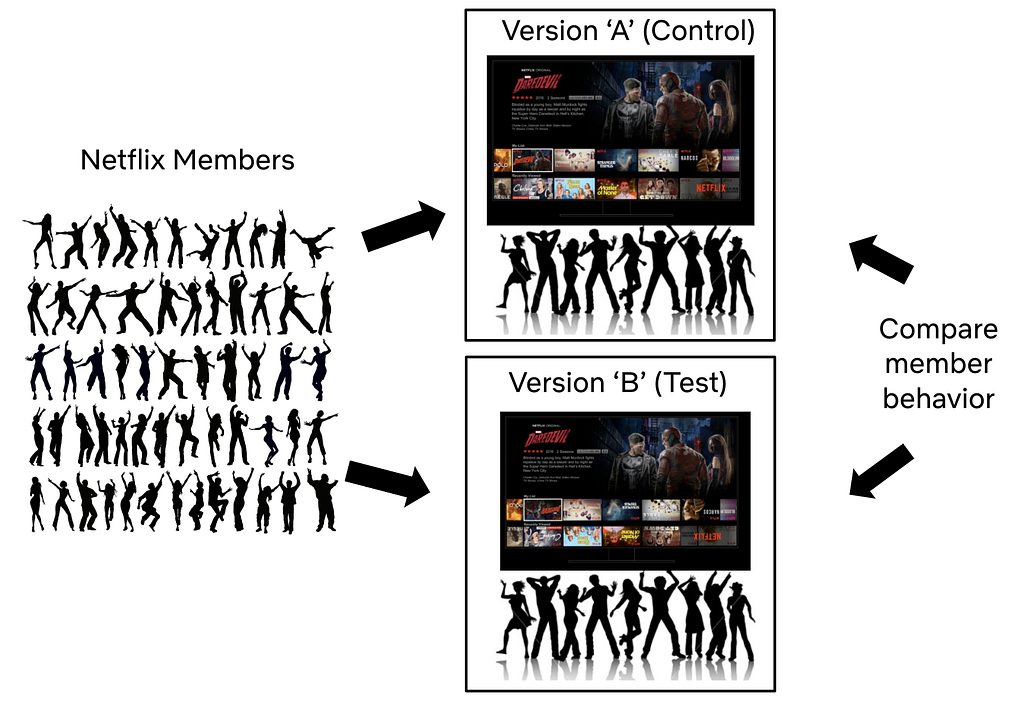


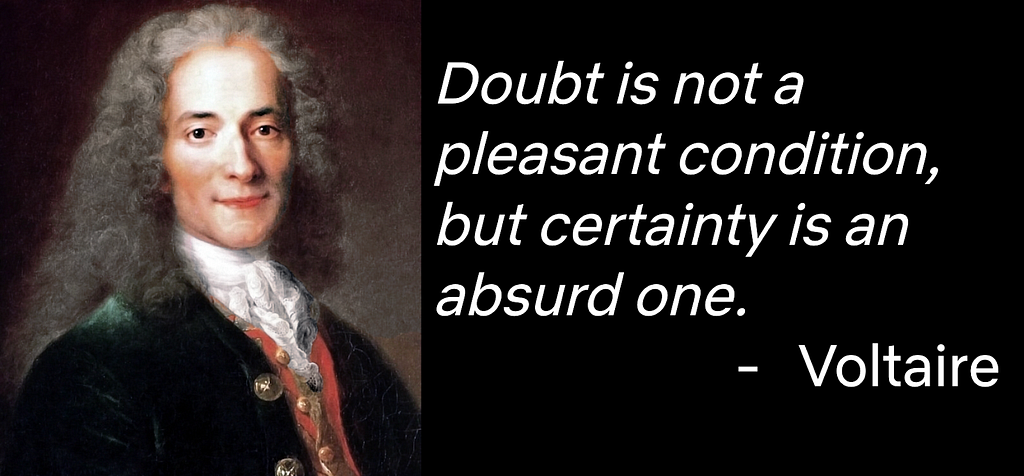


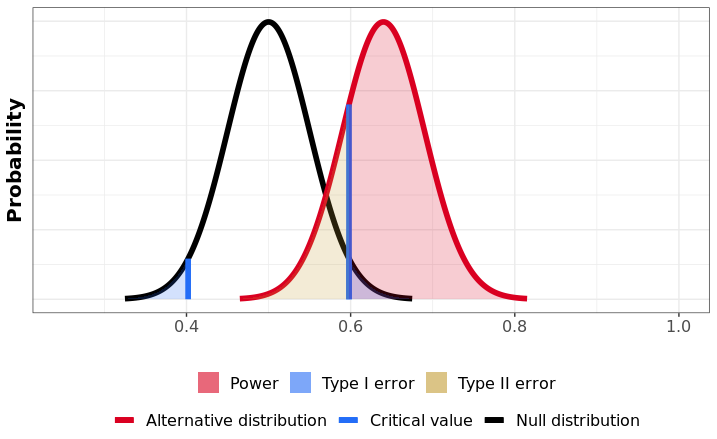

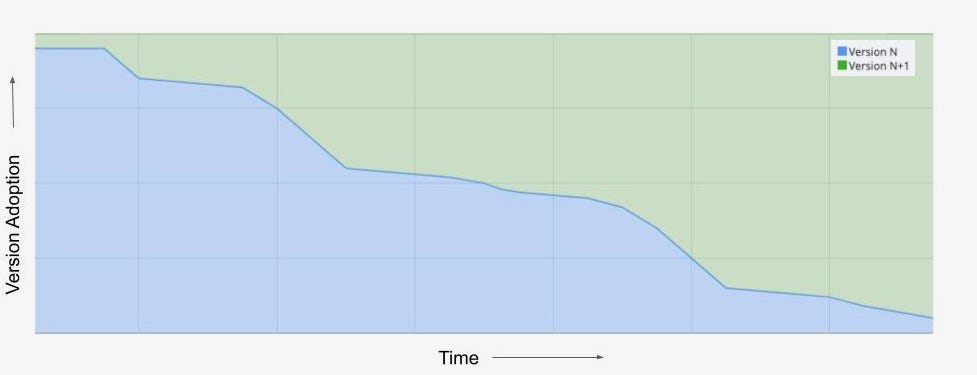
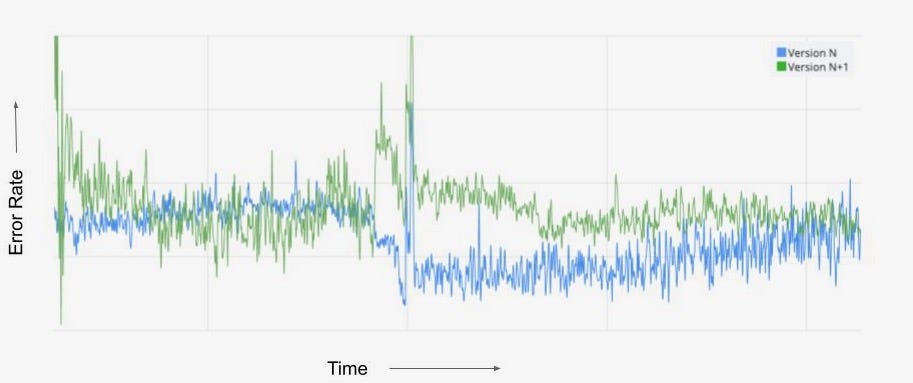
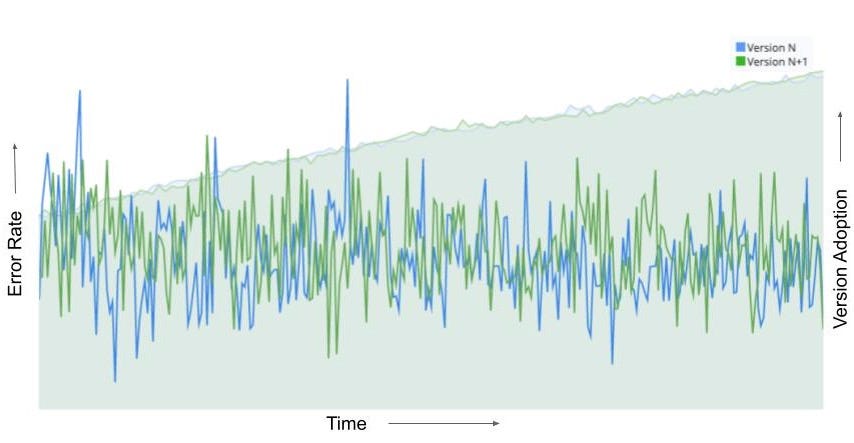


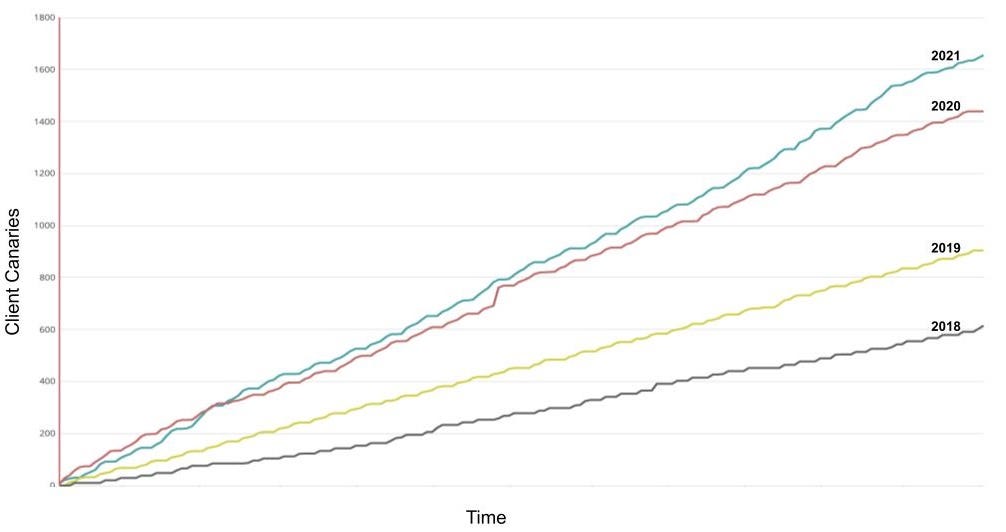
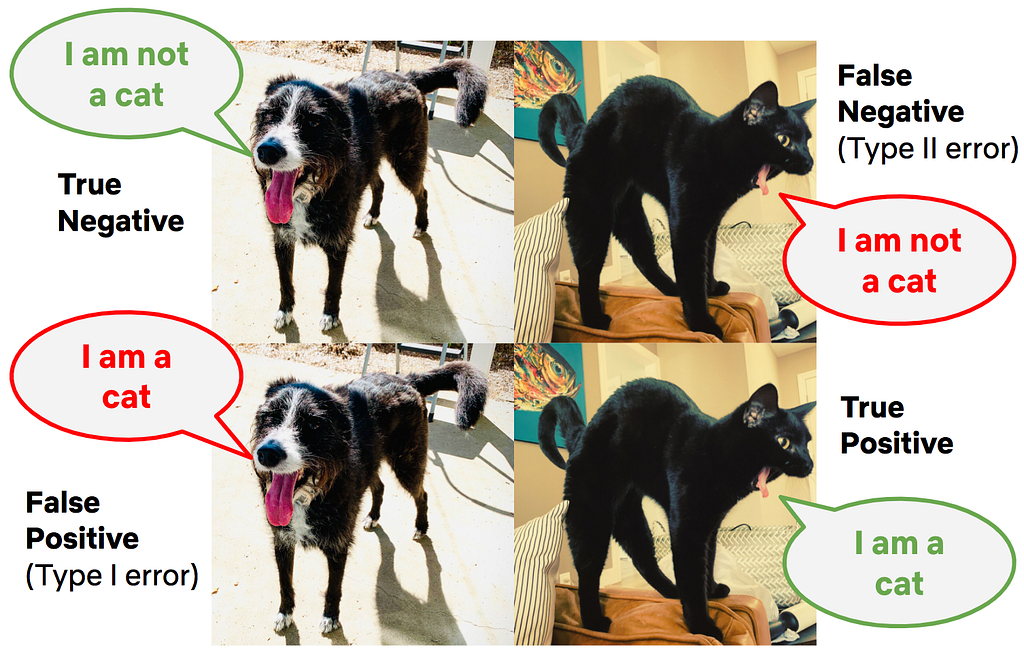

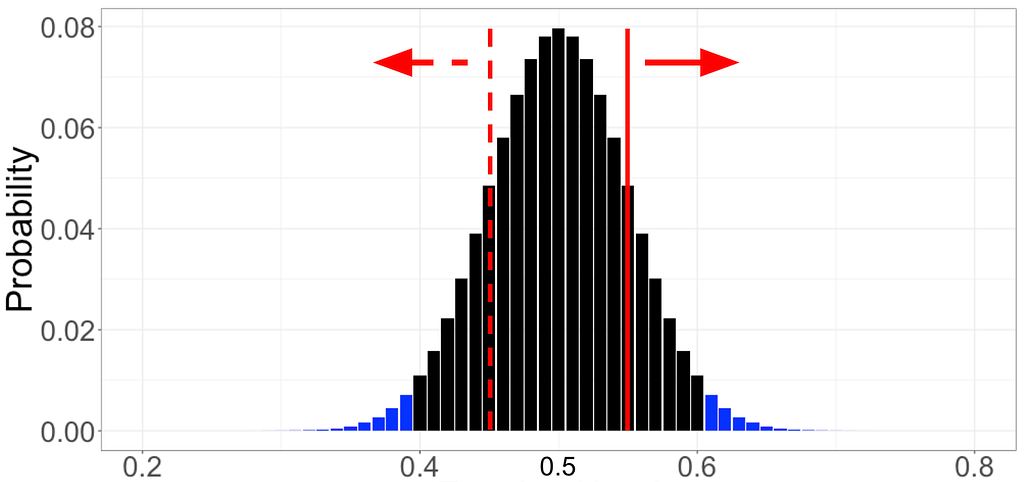


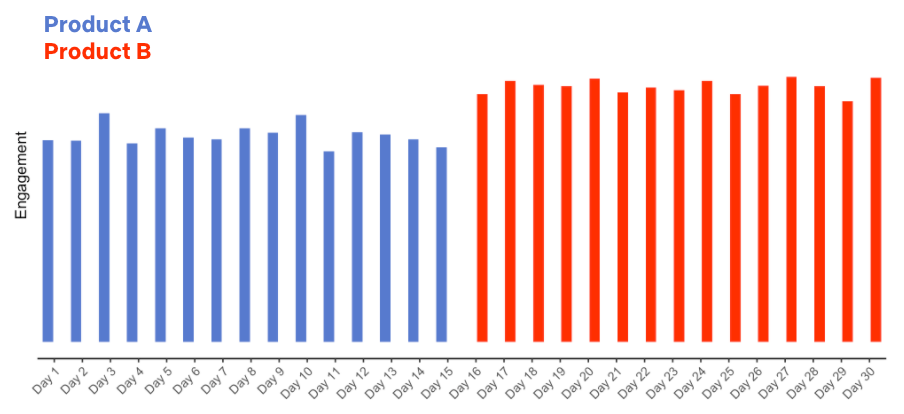


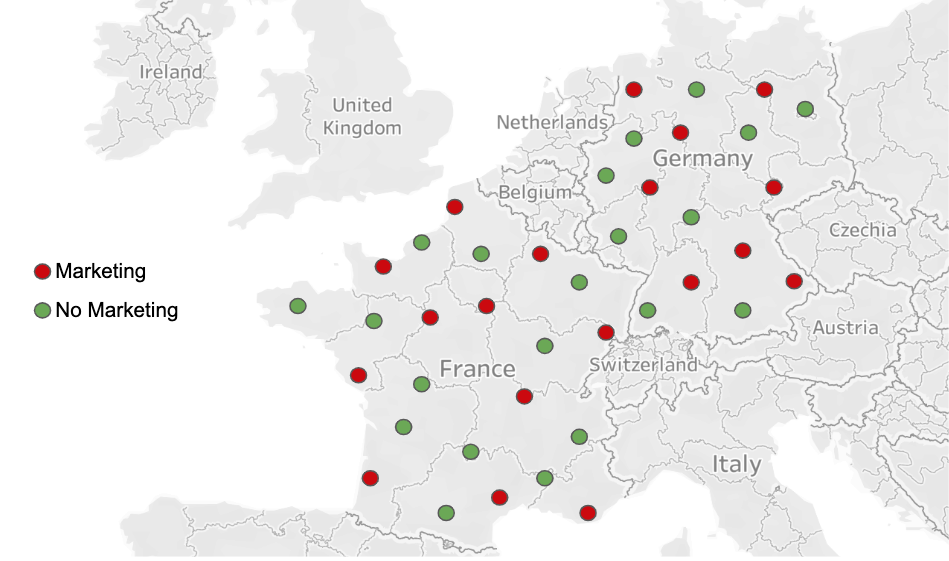