An AS, or Autonomous System, is a group of routable IP prefixes belonging to a single entity, and is one of the key building blocks of the Internet. Internet providers, public clouds, governments, and other organizations have one or more ASes that they use to connect their users or systems to the rest of the Internet by advertising how to reach them.
Per AS traffic statistics and trends help when we need insight into unusual events, like Internet outages, infrastructure anomalies, targeted attacks, or any other changes from service providers.
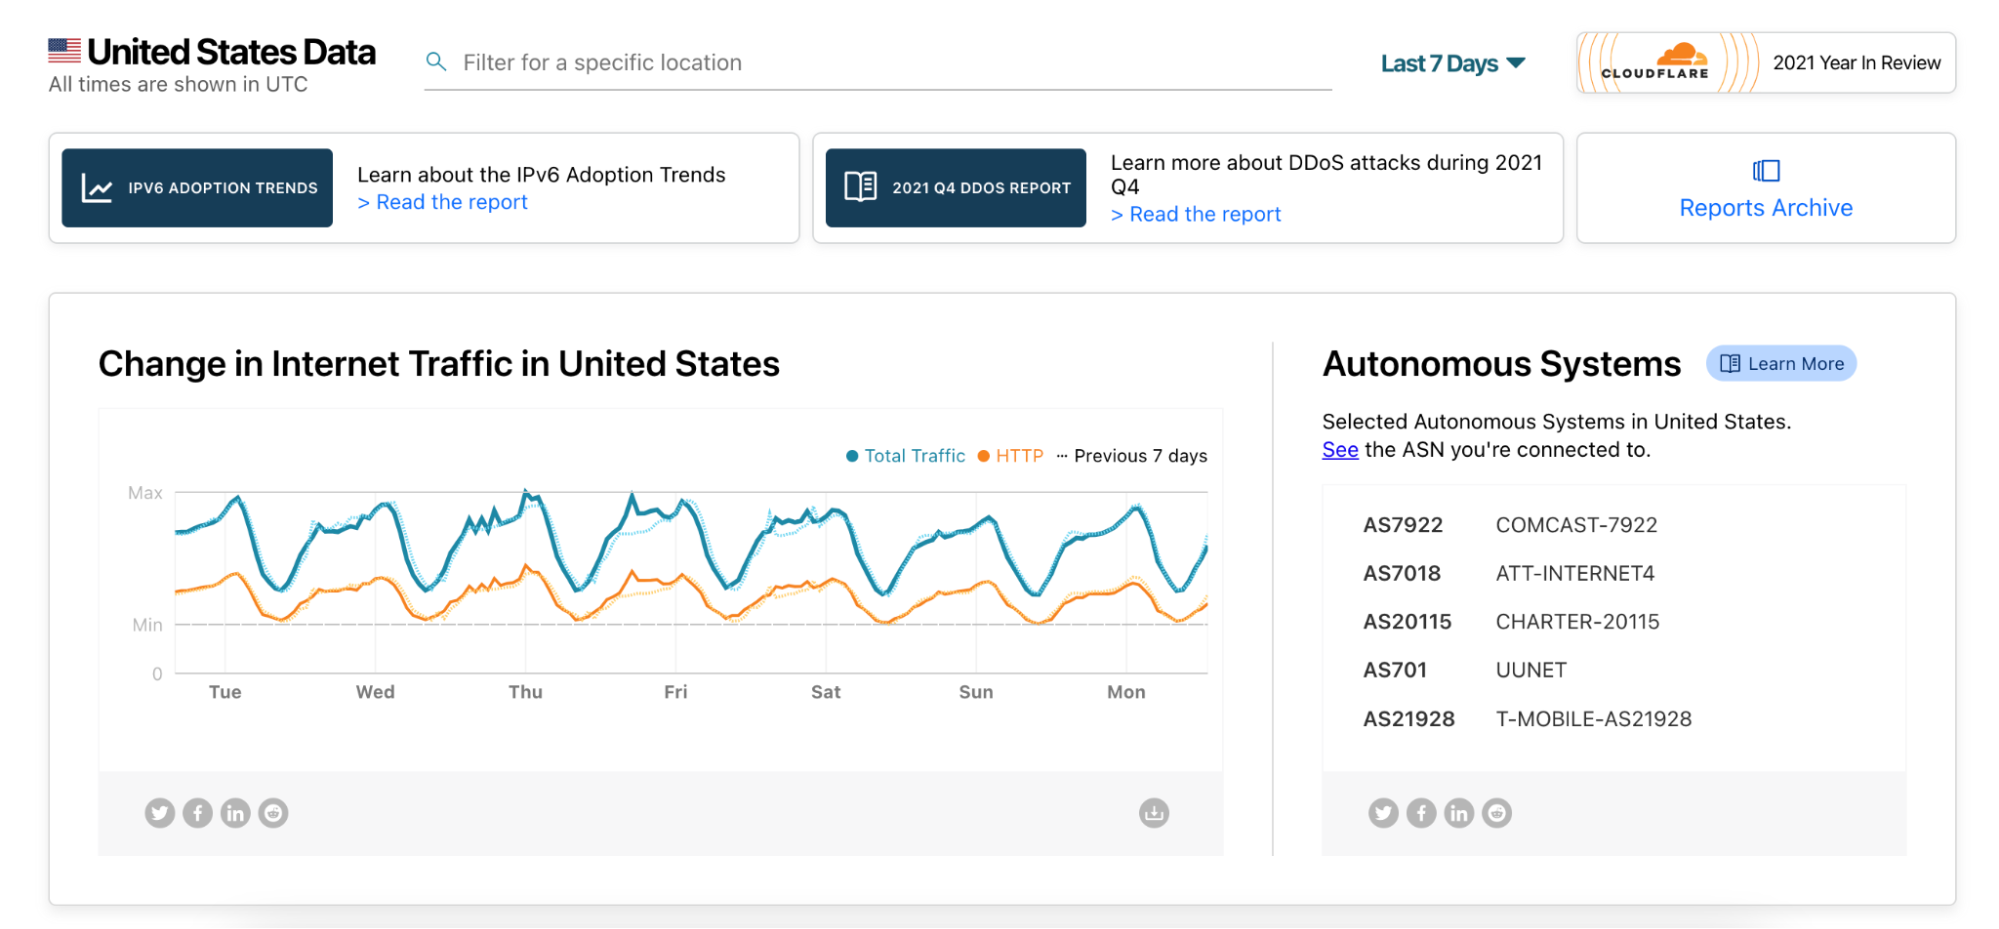
Today, we are opening more of our data and launching the Cloudflare Radar pages for Autonomous Systems. When navigating to a country or region page on Cloudflare Radar you will see a list of five selected ASes for that country or region. But you shouldn’t feel limited to those, as you can deep dive into any AS by plugging its ASN (Autonomous System Number) into the Radar URL (https://radar.cloudflare.com/asn/<number>). We have excluded some statistical trends from ASes with small amounts of traffic as that data would be difficult to interpret.
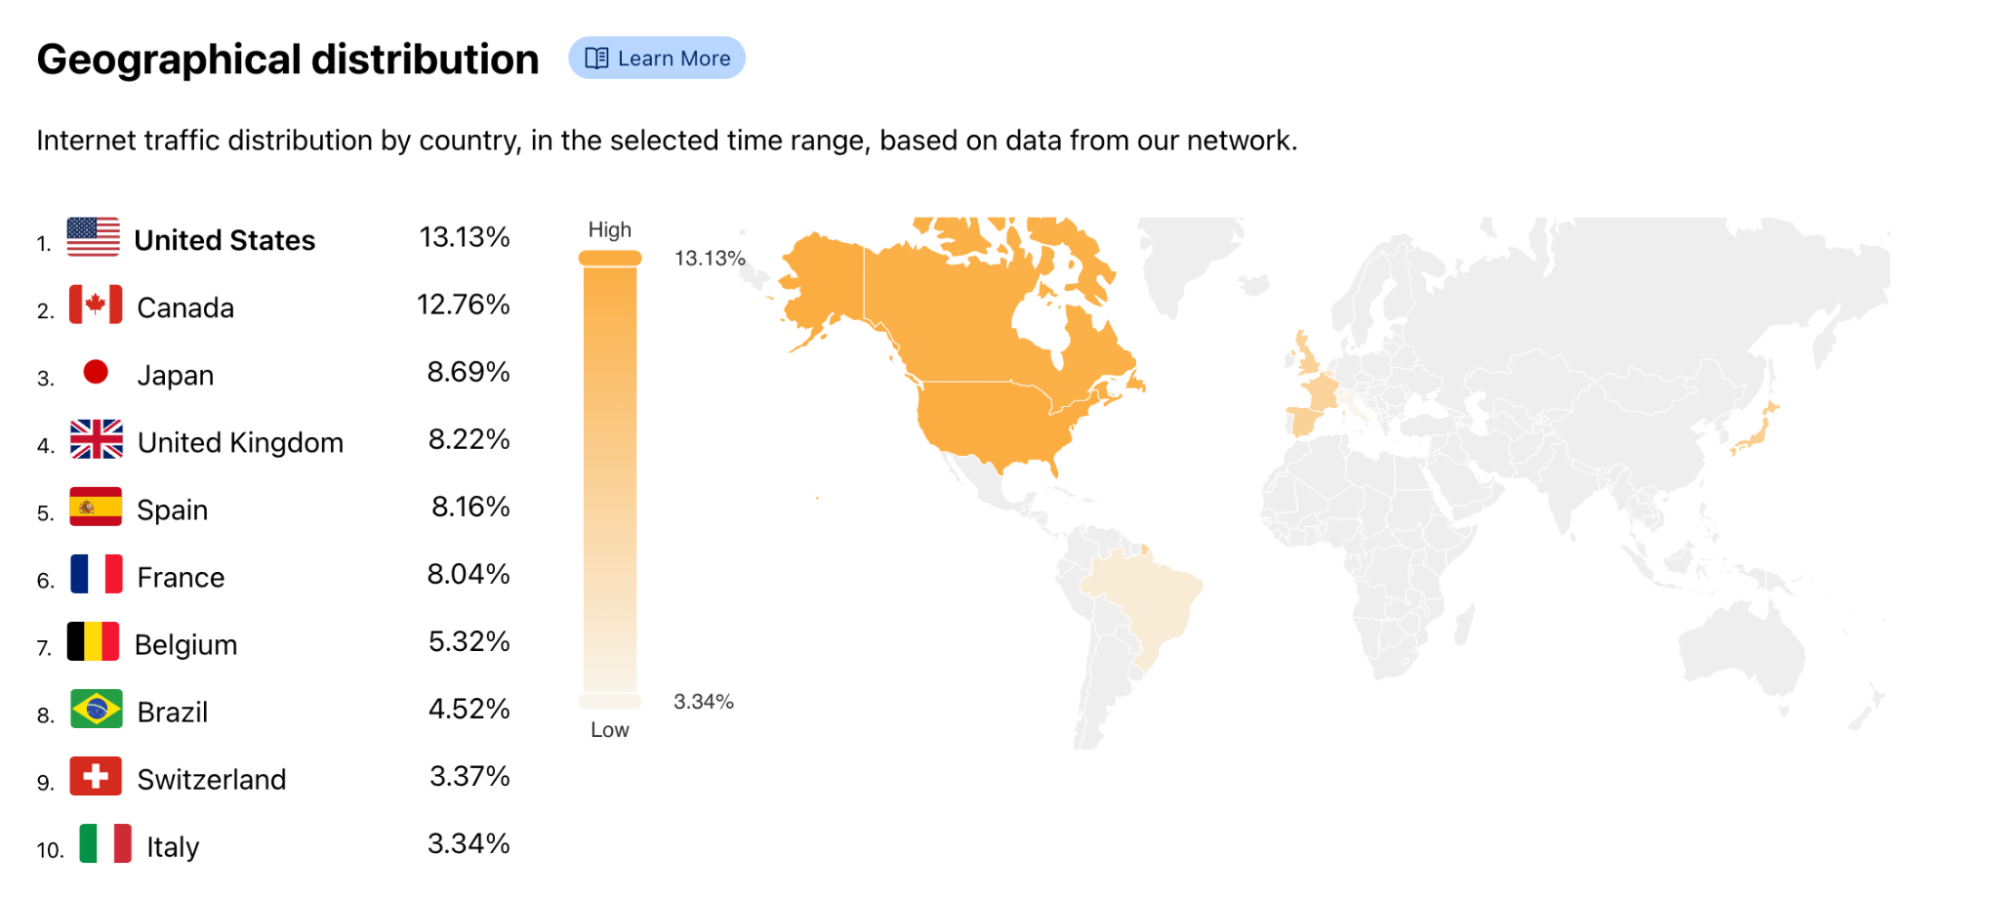
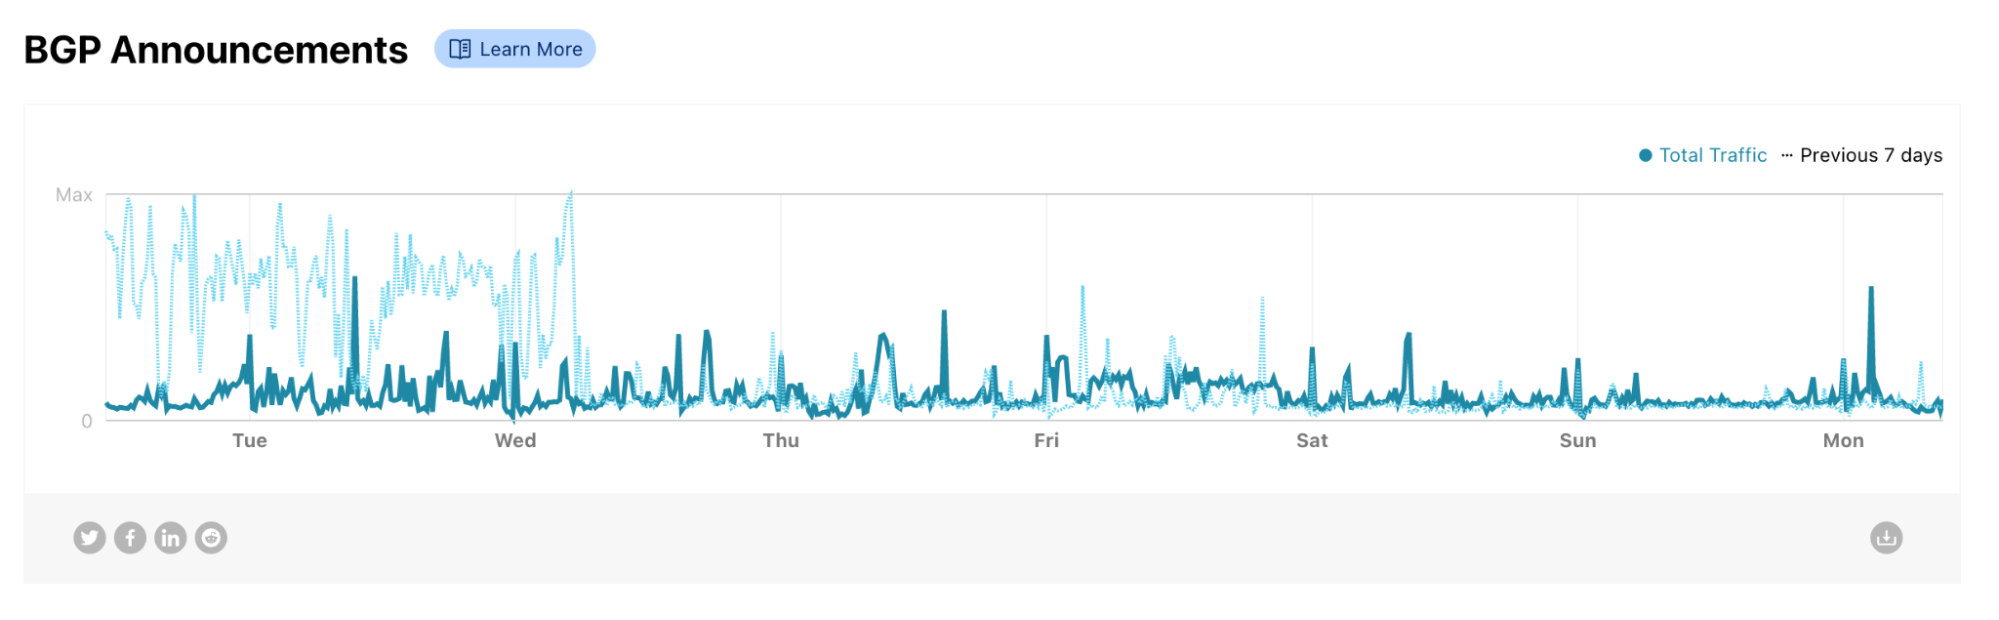
The AS page is similar to the country page on Cloudflare Radar. You can find traffic levels, protocol use, and security details such as application and network-level DDoS attack information. Additionally, we show a geographical distribution map of the traffic and the volume of BGP announcements we see for the list of prefixes associated with the specific AS.
A sudden increase in BGP announcements often suggests disruptive changes to the Internet in the region or institution associated with the AS. Spikes in BGP announcements were visible when the submarine cable was cut in Tonga in 2022, on the Facebook outage in October 2021, and when governments limited the Internet access in their countries (as seen in Sudan and Syria in 2021).
At Cloudflare, we are committed to keep increasing transparency on the inner workings of the Internet, so that we can all do our part in keeping the Internet more open and secure for everyone. Keep an eye on Cloudflare Radar for more insights like these.
Developers, bloggers, business owners, and large corporations all rely on Cloudflare to keep their applications secure, available, and performant.
To meet these goals, over the last twelve years we have built a smart network capable of protecting many millions of Internet properties. As of March 2022, W3Techs reports that:
“Cloudflare is used by 80.6% of all the websites whose reverse proxy service we know. This is 19.7% of all websites”
Netcraft, another provider who crawls the web and monitors adoption puts this figure at more than 20M active sites in their latest Web Server Survey (February 2022):
“Cloudflare continues to make strong gains amongst the million busiest websites, where it saw the only notable increases, with an additional 3,200 sites helping to bring its market share up to 19.4%”
The breadth and diversity of the sites we protect, and the billions of browsers and devices that interact with them, gives us unique insight into the ever-changing application security trends on the Internet. In this post, we share some of those insights we’ve gathered from the 32 million HTTP requests/second that pass through our network.
Definitions
Before we examine the data, it is useful to define the terminology we use. Throughout this post, we will refer to the following terms:
Mitigated Traffic: any eyeball HTTP* request that had a “terminating” action applied to by the Cloudflare platform. These include actions such as BLOCK, CHALLENGE (such as captchas or JavaScript based challenges). This does not include requests that had the following actions applied: LOG, SKIP, ALLOW.
Bot Traffic/Automated Traffic: any HTTP request identified by Cloudflare’s Bot Management system as being generated by a bot. This includes requests scored between 1 and 29.
API Traffic: any HTTP request with a response content type of XML, JSON, gRPC, or similar. Where the response content type is not available, such as for mitigated requests, the equivalent Accept content type (specified by the user agent) is used instead. In this latter case API traffic won’t be fully accounted for, but for insight purposes it still provides a good representation.
Unless otherwise stated, the time frame evaluated in this post is the three-month period from December 1, 2021, to March 1, 2022.
Finally, please note that the data is calculated based only on traffic observed across the Cloudflare network and does not necessarily represent overall HTTP traffic patterns across the Internet.
*When referring to HTTP traffic we mean both HTTP and HTTPS.
Global Traffic Insights
The first thing we can look at is traffic mitigated across all HTTP requests proxied by the Cloudflare network. This will give us a good baseline view before drilling into specific traffic types, such as bot and API traffic.
8% of all Cloudflare HTTP traffic is mitigated
Cloudflare proxies ~32 million HTTP requests per second on average, with more than ~44 million HTTP requests per second at peak. Overall, ~2.5 million requests per second are mitigated by our global network and never reach our caches or the origin servers, ensuring our customers’ bandwidth and compute power is only used for clean traffic.
Site owners using Cloudflare gain access to tools to mitigate unwanted or malicious traffic and allow access to their applications only when a request is deemed clean. This can be done both using fully managed features, such as our DDoS mitigation, WAF managed ruleset or schema validation, as well as custom rules that allow users to define their own filters for blocking traffic.
If we look at the top five Cloudflare features (sources) that mitigated traffic, we get a clear picture of how much each Cloudflare feature is contributing towards helping keep customer sites and applications online and secure:
Tabular format for reference:
Source
Percentage %
Layer 7 DDoS mitigation
66.0%
Custom WAF Rules
19.0%
Rate Limiting
10.5%
IP Threat Reputation
2.5%
Managed WAF Rules
1.5%
Looking at each mitigation source individually:
Layer 7 DDoS mitigation, perhaps unsurprisingly,is the largest contributor to mitigated HTTP requests by total count (66% overall). Cloudflare’s layer 7 DDoS rules are fully managed and don’t require user configuration: they automatically detect a vast array of HTTP DDoS attacks including those generated by the Meris botnet, Mirai botnet, known attack tools, and others. Volumetric DDoS attacks, by definition, create a lot of malicious traffic!
Custom WAF Rules contribute to more than 19% of mitigated HTTP traffic. These are user-configured rules defined using Cloudflare’s wirefilter syntax. We explore common rule patterns further down in this post.
Our Rate Limiting feature allows customers to define custom thresholds based on application preferences. It is often used as an additional layer of protection for applications against traffic patterns that are too low to be detected as a DDoS attack. Over the time frame analyzed, rate limiting contributed to 10.5% of mitigated HTTP requests.
IP Threat Reputation is exposed in the Cloudflare dashboard as Security Level. Based on behavior we observe across the network, Cloudflare automatically assigns a threat score to each IP address. When the threat score is above the specified threshold, we challenge the traffic. This accounts for 2.5% of all mitigated HTTP requests.
Our Managed WAF Rules are rules that are handcrafted by our internal security analyst team aimed at matching only against valid malicious payloads. They contribute to about 1.5% of all mitigated requests.
HTTP anomalies are the most common attack vector
If we drill into Managed WAF Rules, we get a clear picture of what type of attack vectors malicious users are attempting against the Internet properties we protect.
The vast majority (over 54%) of HTTP requests blocked by our Managed WAF Rules contain HTTP anomalies, such as malformed method names, null byte characters in headers, non-standard ports or content length of zero with a POST request.
Common attack types in this category are shown below. These have been grouped when relevant:
Rule Type
Description
Missing User Agent
These rules will block any request without a User-Agent header. All browsers and legitimate crawlers present this header when connecting to a site. Not having a user agent is a common signal of a malicious request.
Not GET, POST or HEAD Method
Most applications only allow standard GET or POST requests (normally used for viewing pages or submitting forms). HEAD requests are also often sent from browsers for security purposes. Customers using our Managed Rules can easily block any other method – which normally results in blocking a large number of vulnerability scanners.
Missing Referer
When users navigate applications, browsers use the Referer header to indicate where they are coming from. Some applications expect this header to always be present.
Non-standard port
Customers can configure Cloudflare Managed Rules to block HTTP requests trying to access non-standard ports (such as 80 and 443). This is activity normally seen by vulnerability scanners.
Invalid UTF-8 encoding
It is common for attackers to attempt to break an application server by sending “special” characters that are not valid in UTF-8 encoding.
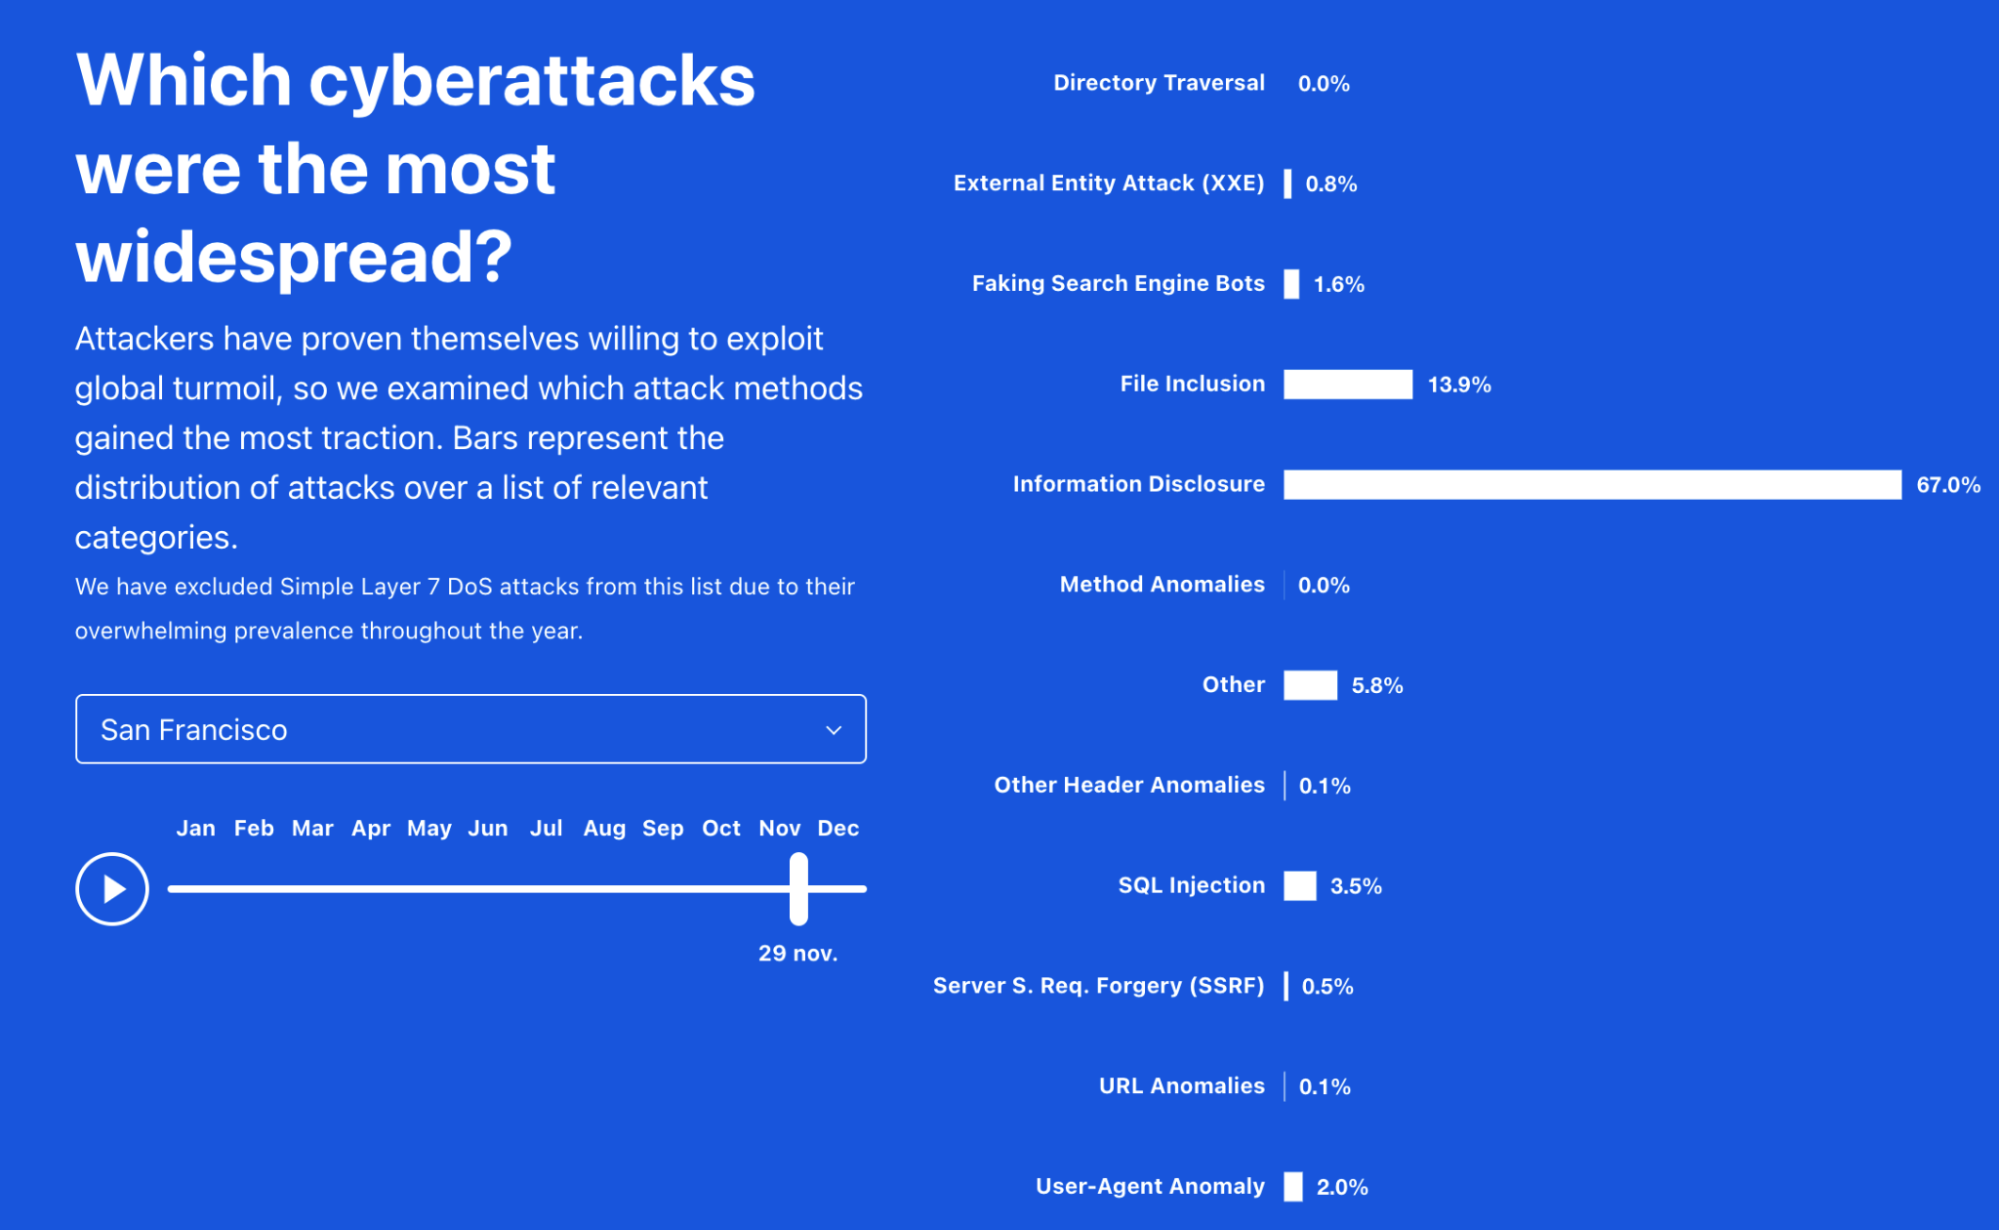
More commonly known and referenced attack vectors such as XSS and SQLi only contribute to about 13% of total mitigated requests. More interestingly, attacks aimed at information disclosure are third most popular (10%) and software-specific CVE-based attacks account for about 12% of mitigated requests (more than SQLi alone) highlighting both the importance of needing to patch software quickly, and the likelihood of CVE proof-of-concepts (PoCs) being used to compromise applications, such as with the recent Log4J vulnerability. The top 10 attack vectors by percentage of mitigated requests are shown below:
Tabular format for reference:
Source
Percentage %
HTTP Anomaly
54.5%
Vendor Specific CVE
11.8%
Information Disclosure
10.4%
SQLi
7.0%
XSS
6.1%
File Inclusion
3.3%
Fake Bots
3.0%
Command Injection
2.7%
Open Redirects
0.1%
Other
1.5%
Businesses still rely on IP address-based access lists to protect their assets
In the prior section, we noted that 19% of mitigated requests come from Custom WAF Rules. These are rules that Cloudflare customers have implemented using the wirefilter syntax. At time of writing, Cloudflare customers had a total of ~6.5 million Custom WAF rules deployed.
It is interesting to look at what rule fields customers are using to identify malicious traffic, as this helps us focus our efforts on what other fully automated mitigations could be implemented to improve the Cloudflare platform.
The most common field, found in approximately 64% of all custom rules, remains the source IP address or fields easily derived from the IP address, such as the client country location. Note that IP addresses are becoming less useful signals for security policies, but they are often the quickest and simplest type of filter to implement during an attack. Customers are also starting to adopt better approaches such as those offered in our Zero Trust portfolio to further reduce reliance on IP address-based fields.
The top 10 fields are shown below:
Tabular format for reference:
Field name
Used in % of rules
ip
64.9%
ip_geoip_country
27.3%
http_request_uri
24.1%
http_user_agent
21.8%
http_request_uri_path
17.8%
http_referer
8.6%
cf_client_bot
8.3%
http_host
7.8%
ip_geoip_asnum
5.8%
cf_threat_score
4.4%
Beyond IP addresses, standard HTTP request fields (URI, User-Agent, Path, Referer) tend to be the most popular. Note, also, that across the entire rule corpus, the average rule combines at least three independent fields.
Bot Traffic Insights
Cloudflare has long offered a Bot Management solution to allow customers to gain insights into the automated traffic that might be accessing their application. Using Bot Management classification data, we can perform a deep dive into the world of bots.
38% of HTTP traffic is automated
Over the time period analyzed, bot traffic accounted for about 38% of all HTTP requests. This traffic includes bot traffic from hundreds of Verified Bots tracked by Cloudflare, as well as any request that received a bot score below 30, indicating a high likelihood that it is automated.
Overall, when bot traffic matches a security configuration, customers allow 41% of bot traffic to pass to their origins, blocking only 6.4% of automated requests. Remember that this includes traffic coming from Verified Bots like GoogleBot, which ultimately benefits site owners and end users. It’s a reminder that automation in and of itself is not necessarily detrimental to a site. This is why we segment Verified Bot traffic, and why we give customers a granular bot score, rather than a binary “bot or not bot” indicator. Website operators want the flexibility to be precise with their response to different types of bot traffic, and we can see that they do in fact use this flexibility. Note that our self-serve customers can also decide how to handle bot traffic using our Super Bot Fight Mode feature.
Tabular data for reference:
Action on all bot traffic
Percentage %
allow
40.9%
log
31.9%
bypass
19.0%
block
6.4%
jschallenge
0.5%
More than a third of non-verified bot HTTP traffic is mitigated
31% of all bot traffic observed by Cloudflare is not verified, and comes from thousands of custom-built automated tools like scanners, crawlers, and bots built by hackers. As noted above, automation does not necessarily mean these bots are performing malicious actions. If we look at customer responses to identified bot traffic, we find that 38.5% of HTTP requests from non-verified bots are mitigated. This is obviously a much more defensive configuration compared to overall bot traffic actions shown above:
Tabular data for reference:
Action on non-verified bot traffic
Percentage %
block
34.0%
log
28.6%
allow
14.5%
bypass
13.2%
managed_challenge
3.7%
You’ll notice that almost 30% of customers log traffic rather than take immediate action. We find that many enterprise customers choose to not immediately block bot traffic, so they don’t give a feedback signal to attackers. Rather, they prefer to tag and monitor this traffic, and either drop at a later time or redirect to alternate content. As targeted attack vectors have evolved, responses to those attacks have had to evolve and become more sophisticated as well. Additionally, nearly 3% of non-verified bot traffic is automatically mitigated by our DDoS protection (connection_close). These requests tend to be part of botnets used to attack customer applications.
API Traffic Insights
Many applications built on the Internet today are not meant to be consumed by humans. Rather, they are intended for computer-to-computer communication. The common way to expose an application for this purpose is to build an Application Programming Interface (API) that can be accessed using HTTP.
Due to the underlying format of the data in transit, API traffic tends to be a lot more structured than standard web applications, causing all sorts of problems from a security standpoint. First, the structured data often causes Web Application Firewalls (WAFs) to generate a large number of false positives. Secondly, due to the nature of APIs, they often go unnoticed, and many companies end up exposing old and unmaintained APIs without knowing, often referred to as “shadow APIs”.
Below, we look at some differences in API trends compared to the global traffic insights shown above.
10% of API traffic is mitigated at the edge
A good portion of bot traffic is accessing API endpoints, and as discussed previously, API traffic is the fastest growing traffic type on the Cloudflare network, currently accounting for 55% of total requests.
API endpoints globally receive more malicious requests compared to standard web applications (10% vs 8%) potentially indicating that attackers are focusing more on APIs for their attack surface as opposed to standard web apps.
Our DDoS mitigation is still the top source of mitigated events for API endpoints, accounting for just over 63% of the total mitigated requests. More interestingly, Custom WAF rules account for 35% compared to 19% when looking at global traffic. Customers have, to date, been heavily using WAF Custom Rules to lock down and validate traffic to API endpoints, although we expect our API Gateway schema validation feature to soon surpass Custom WAF Rules in terms of mitigated traffic.
SQLi is the most common attack vector on API endpoints
If we look at our WAF Managed Rules mitigations on API traffic only, we see notable differences compared to global trends. These differences include much more equal distribution across different types of attacks, but more noticeably, SQL injection attacks in the top spot.
Command Injection attacks are also much more prominent (14.3%), and vectors such as Deserialization make an appearance, contributing to more than 1% of the total mitigated requests.
Tabular data for reference:
Source
Percentage %
SQLi
34.5%
HTTP Anomaly
18.2%
Vendor Specific CVE
14.5%
Command Injection
14.3%
XSS
7.3%
Fake Bots
5.8%
File Inclusion
2.3%
Deserialization
1.2%
Information Disclosure
0.6%
Other
1.3%
Looking ahead
In this post we shared some initial insights around Internet application security trends based on traffic to Cloudflare’s network. Of course, we have only just scratched the surface. Moving forward, we plan to publish quarterly reports with dynamic filters directly on Cloudflare Radar and provide much deeper insights and investigations.
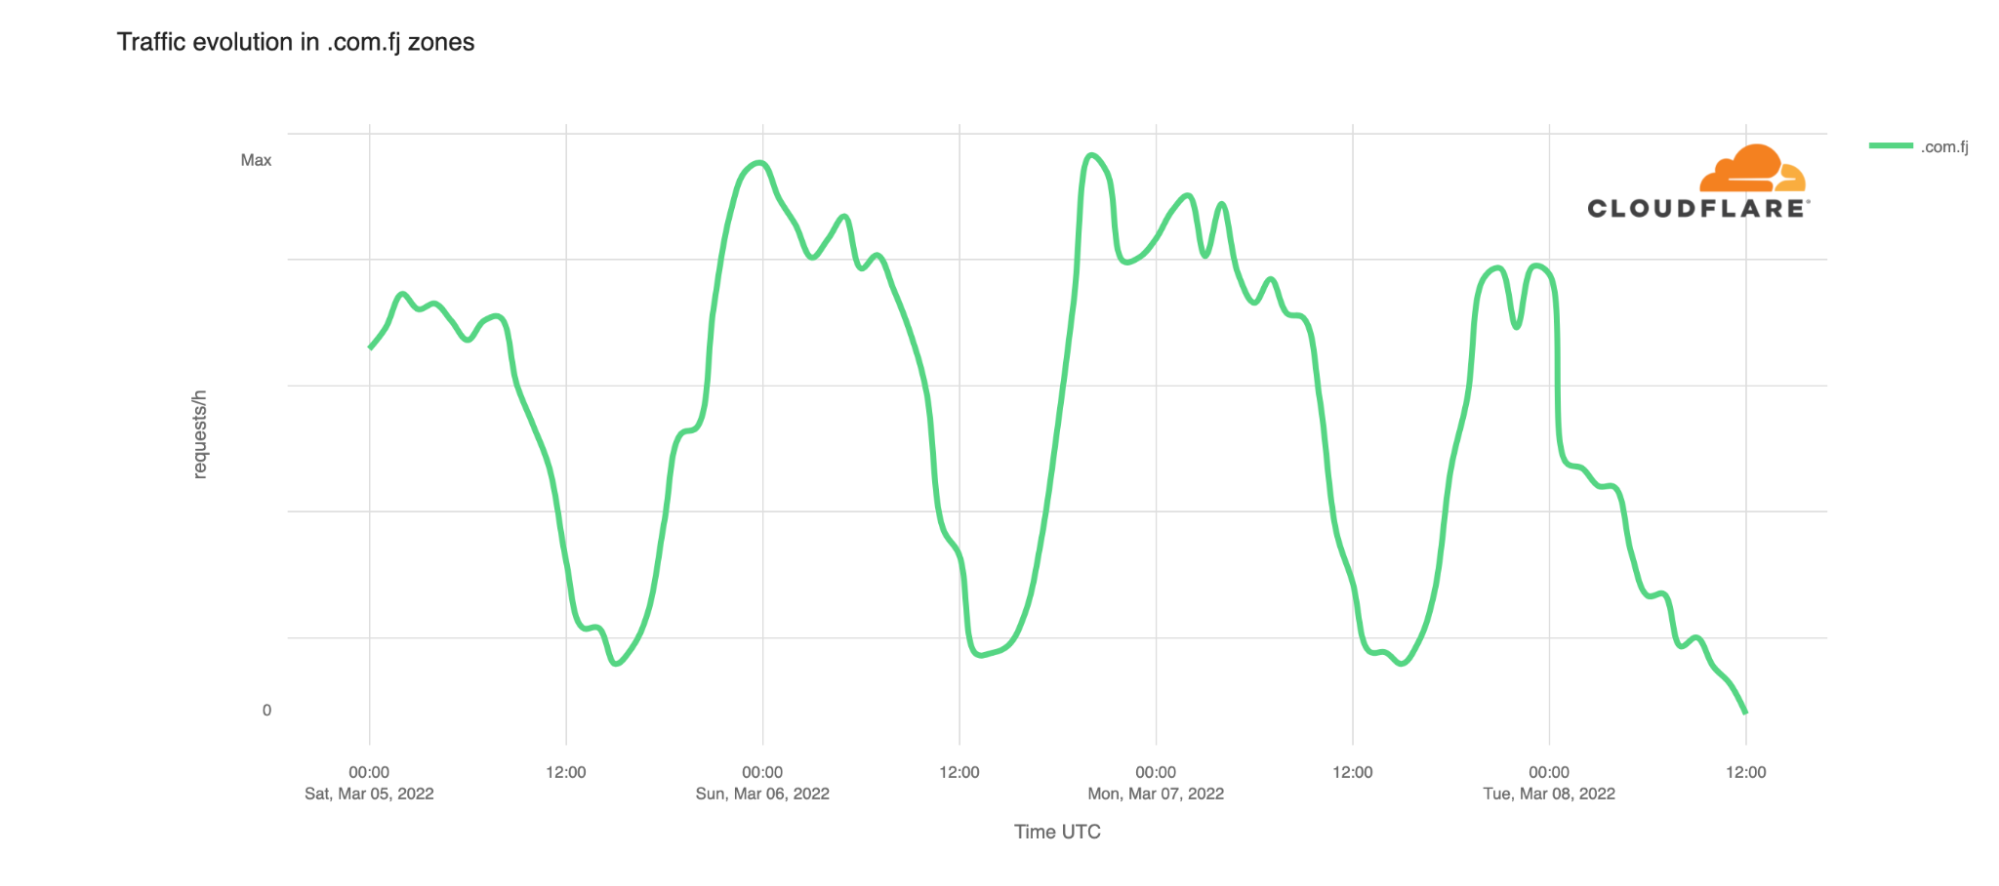
On the morning of March 8, a post to Hacker News stated that “All .fj domains have gone offline”, listing several hostnames in domains within the Fiji top level domain (known as a ccTLD) that had become unreachable. Commenters in the associated discussion thread had mixed results in being able to reach .fj hostnames—some were successful, while others saw failures. The fijivillage news site also highlighted the problem, noting that the issue also impacted Vodafone’s M-PAiSA app/service, preventing users from completing financial transactions.
The impact of this issue can be seen in traffic to Cloudflare customer zones in the .com.fj second-level domain. The graph below shows that HTTP traffic to these zones dropped by approximately 40% almost immediately starting around midnight UTC on March 8. Traffic volumes continued to decline throughout the rest of the morning.
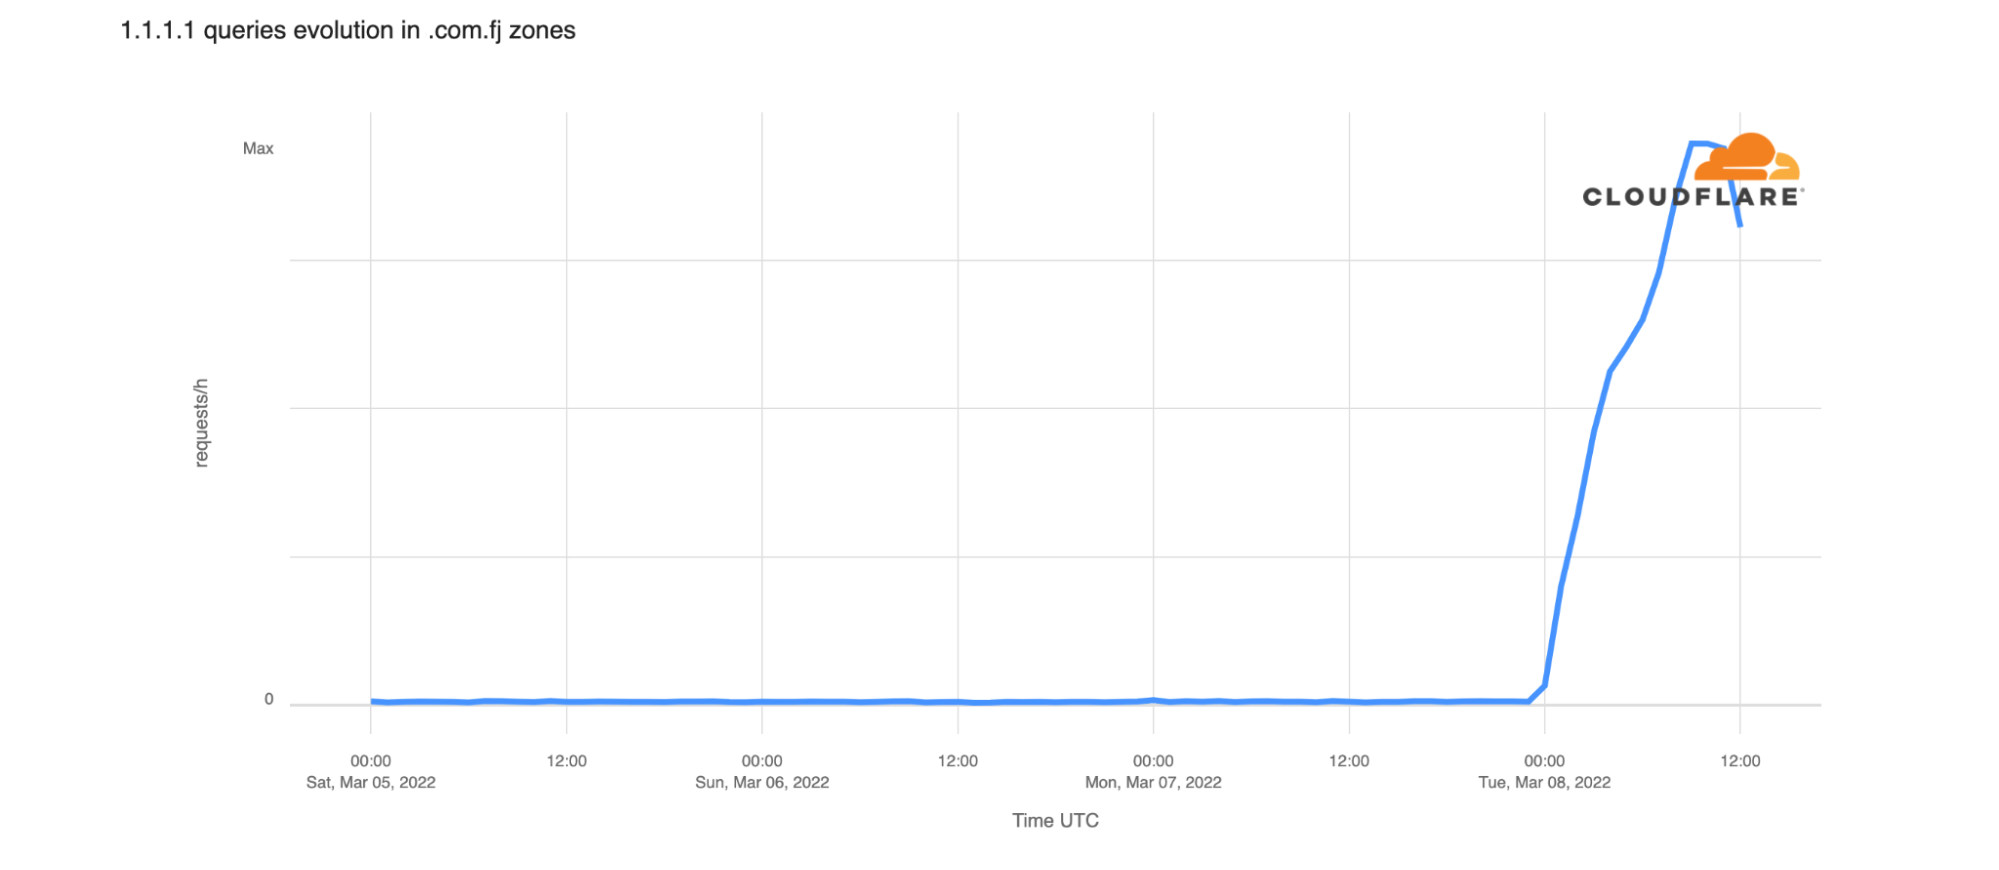
Looking at Cloudflare’s 1.1.1.1 resolver data for queries for .com.fj hostnames, we can also see that error volume associated with those queries climbs significantly starting just after midnight as well. This means that our resolvers encountered issues with the answers from .fj servers.
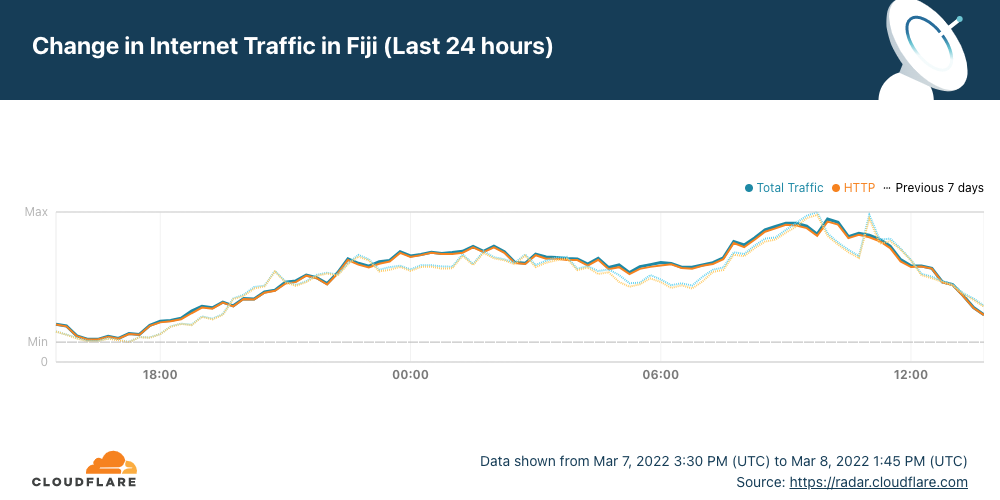
This observation suggests that the problem was strictly DNS related, rather than connectivity related—Cloudflare Radar does not show any indication of an Internet disruption in Fiji coincident with the start of this problem.
It was suggested within the Hacker News comments that the problem could be DNSSEC related. Upon further investigation, it appears that may be the cause. In verifying the DNSSEC record for the .fj ccTLD, shown in the dig output below, we see that it states EDE: 9 (DNSKEY Missing): 'no SEP matching the DS found for fj.'
kdig fj. soa +dnssec @1.1.1.1
;; ->>HEADER<<- opcode: QUERY; status: SERVFAIL; id: 12710
;; Flags: qr rd ra; QUERY: 1; ANSWER: 0; AUTHORITY: 0; ADDITIONAL: 1

;; EDNS PSEUDOSECTION:
;; Version: 0; flags: do; UDP size: 1232 B; ext-rcode: NOERROR
;; EDE: 9 (DNSKEY Missing): 'no SEP matching the DS found for fj.'

;; QUESTION SECTION:
;; fj.                          IN      SOA

;; Received 73 B
;; Time 2022-03-08 08:57:41 EST
;; From 1.1.1.1@53(UDP) in 17.2 ms
Extended DNS Error 9 (EDE: 9) is defined as “A DS record existed at a parent, but no supported matching DNSKEY record could be found for the child.” The Cloudflare Learning Center article on DNSKEY and DS records explains this relationship:
The DS record is used to verify the authenticity of child zones of DNSSEC zones. The DS key record on a parent zone contains a hash of the KSK in a child zone. A DNSSEC resolver can therefore verify the authenticity of the child zone by hashing its KSK record, and comparing that to what is in the parent zone’s DS record.
Ultimately, it appears that around midnight UTC, the .fj zone started to be signed with a key that was not in the root zone DS, possibly as the result of a scheduled rollover that happened without checking that the root zone was updated first by IANA, which updates the root zone. (IANA owns contact with the TLD operators, and instructs the Root Zone Publisher on the changes to make in the next version of the root zone.)
DNSSEC problems as the root cause of the observed issue align with the observation in the Hacker News comments that some were able to access .fj websites, while others were not. Users behind resolvers doing strict DNSSEC validation would have seen an error in their browser, while users behind less strict resolvers would have been able to access the sites without a problem.
Conclusion
Further analysis of Cloudflare resolver metrics indicates that the problem was resolved around 1400 UTC, when the DS was updated. When DNSSEC is improperly configured for a single domain name, it can cause problems accessing websites or applications in that zone. However, when the misconfiguration occurs at a ccTLD level, the impact is much more significant. Unfortunately, this seems to occur all too often.
(Thank you to Ólafur Guðmundsson for his DNSSEC expertise.)
Cloudflare operates in more than 250 cities worldwide where we connect our equipment to the Internet to provide our broad range of services. We have data centers in Ukraine, Belarus and Russia and across the world. To operate our service we monitor traffic trends, performance and errors seen at each data center, aggregate data about DNS, and congestion and packet loss on Internet links.
Internet Traffic
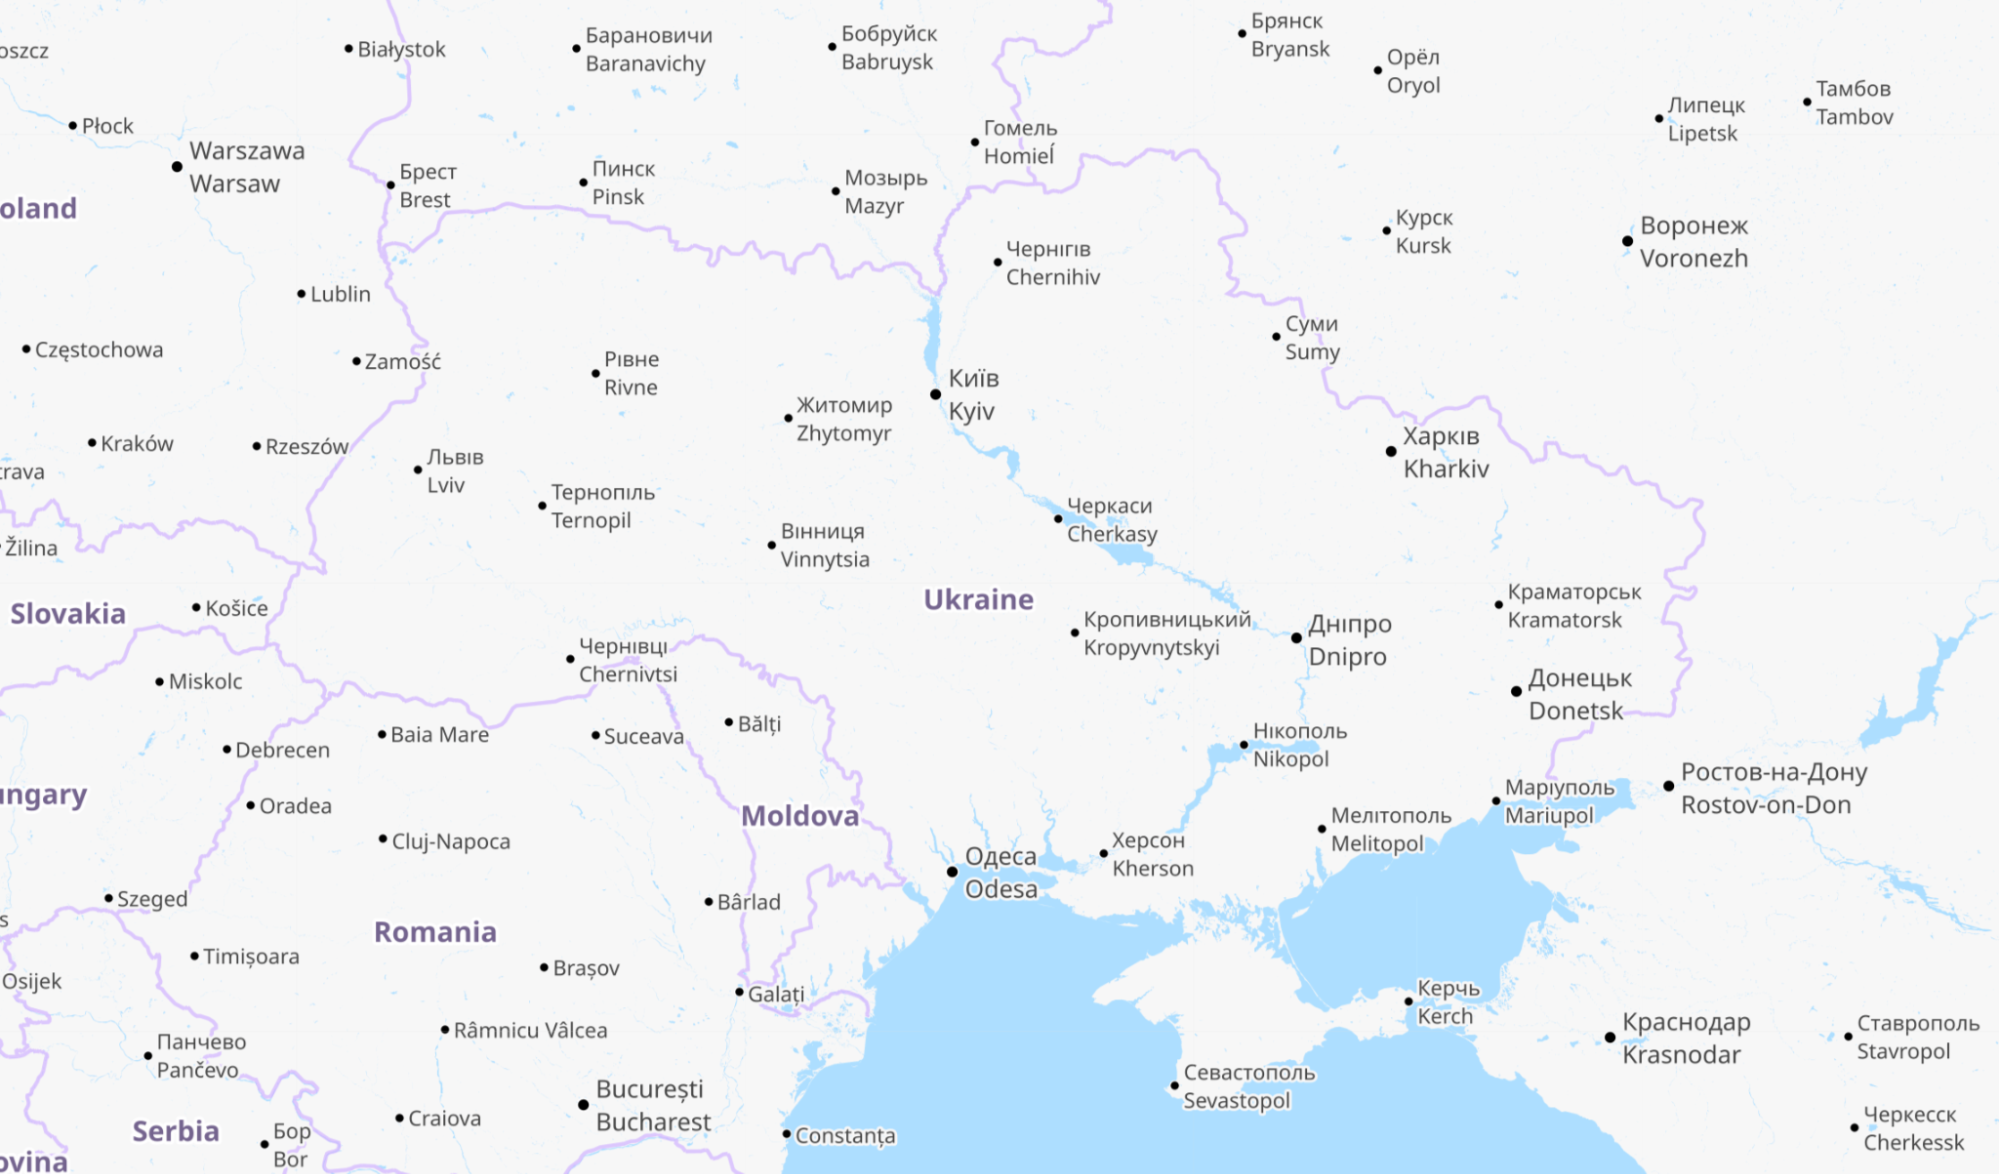
For reference, here is a map of Ukraine showing its major cities. Note that whenever we talk about dates and times in this post, we are using UTC. Ukraine’s current time zone is UTC+2.
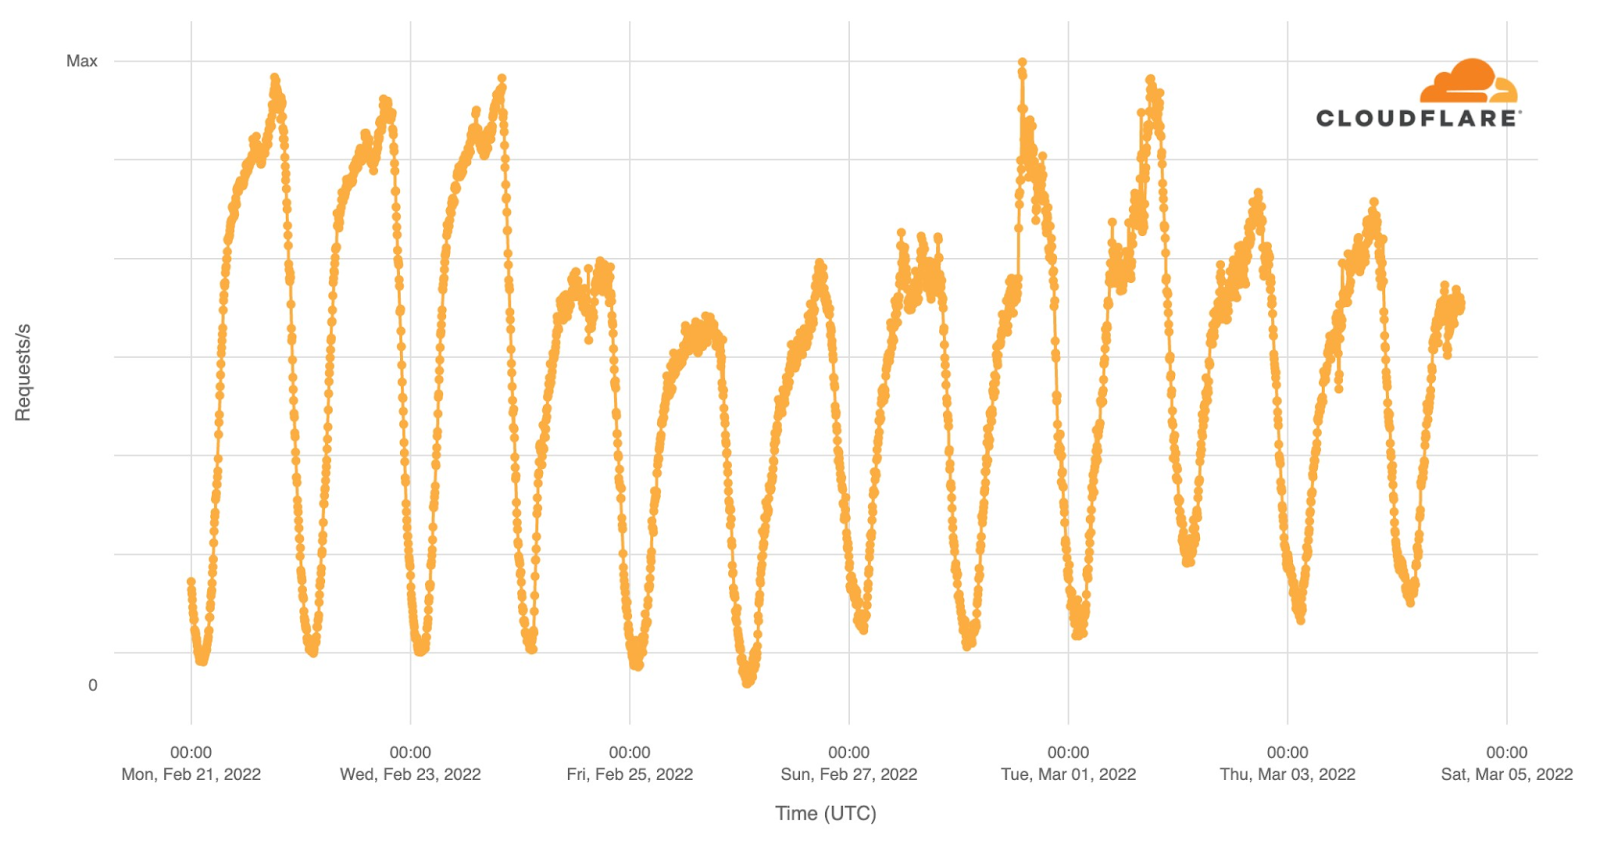
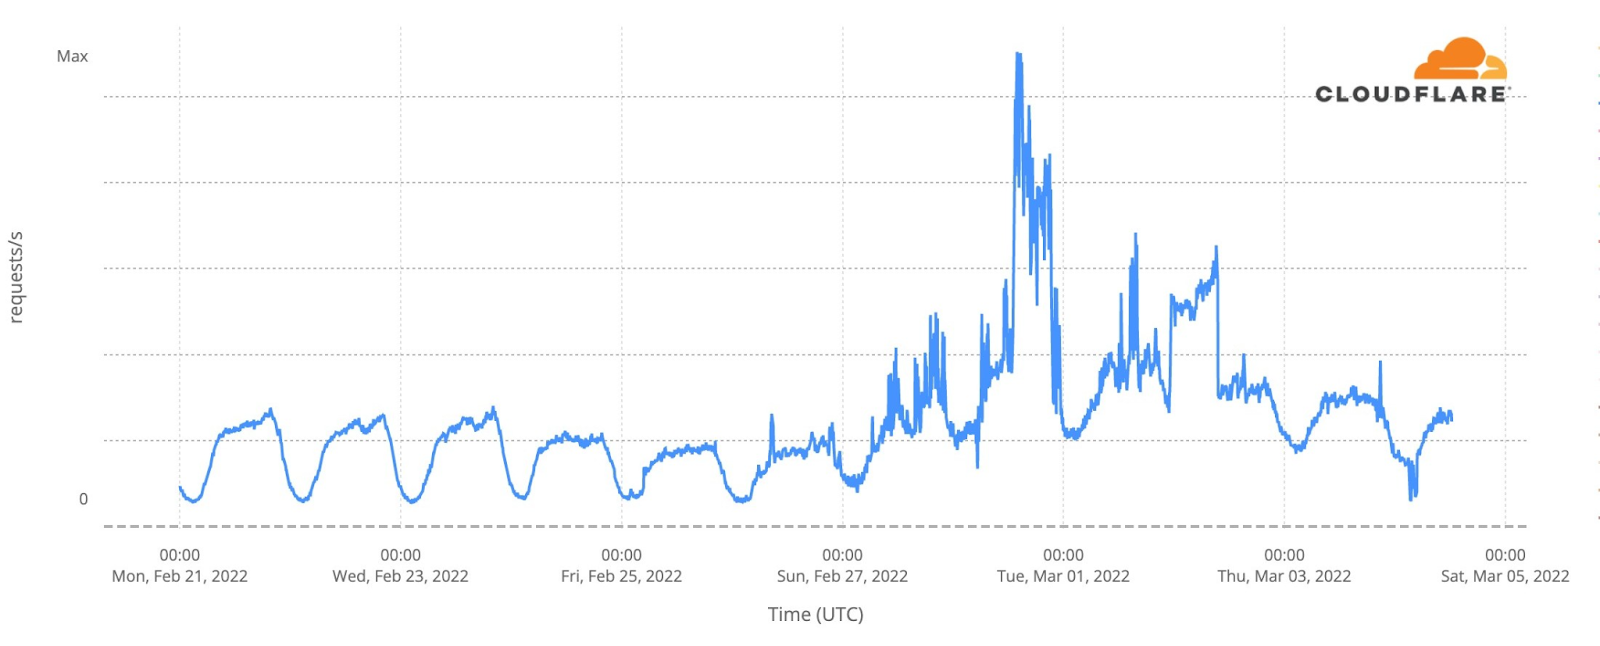
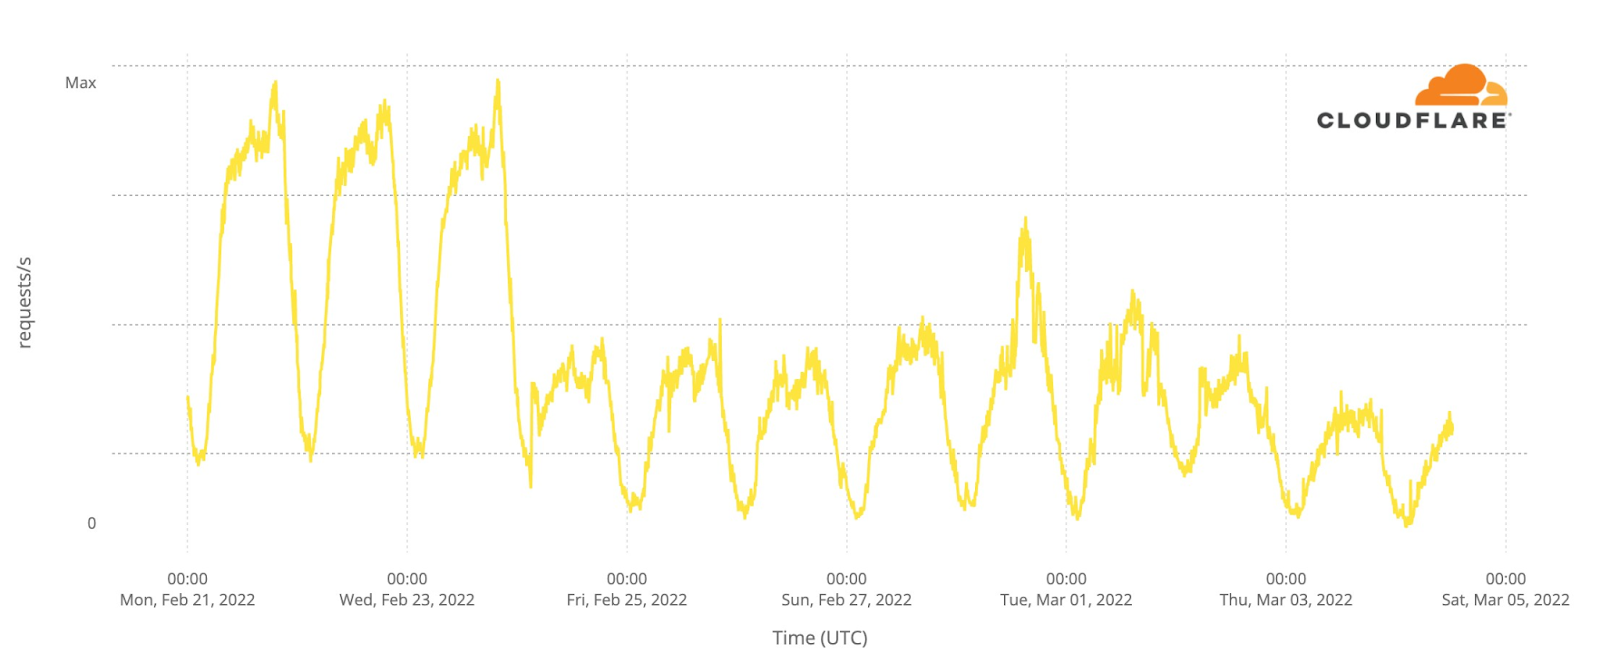
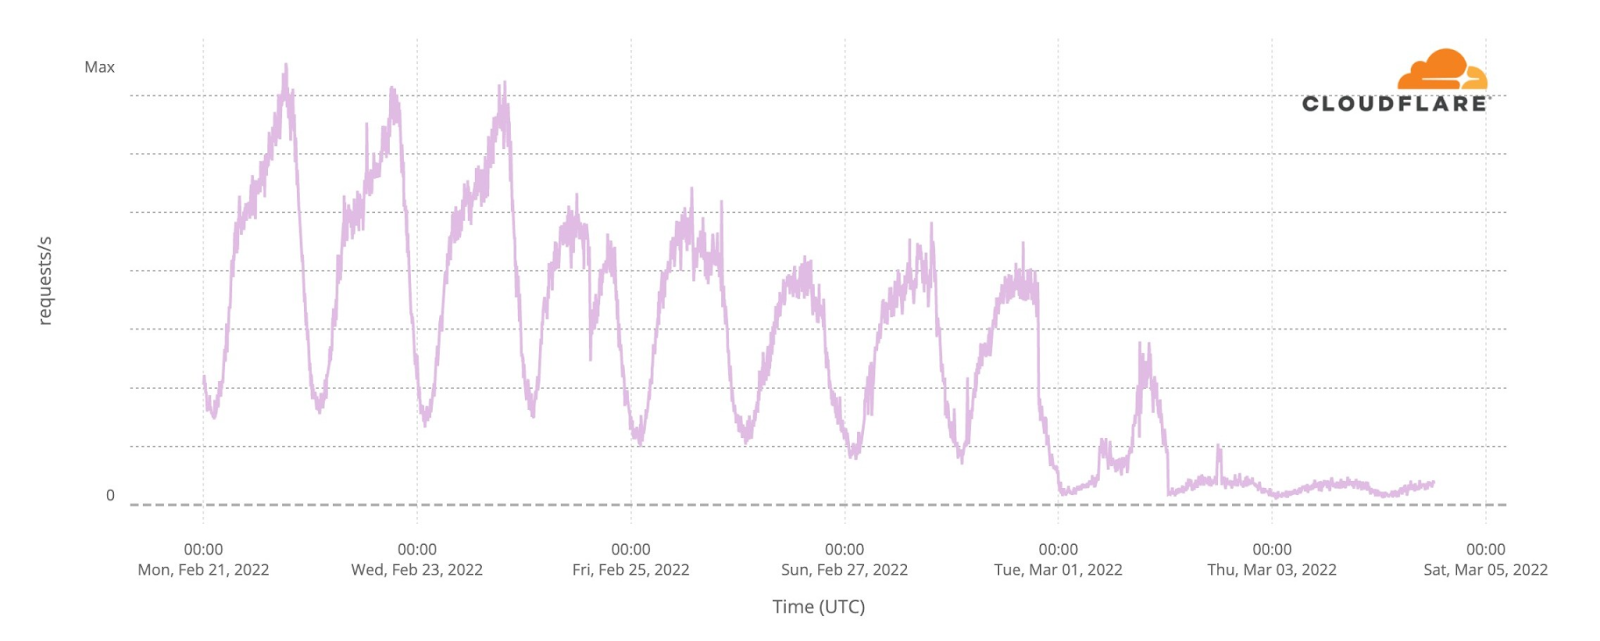
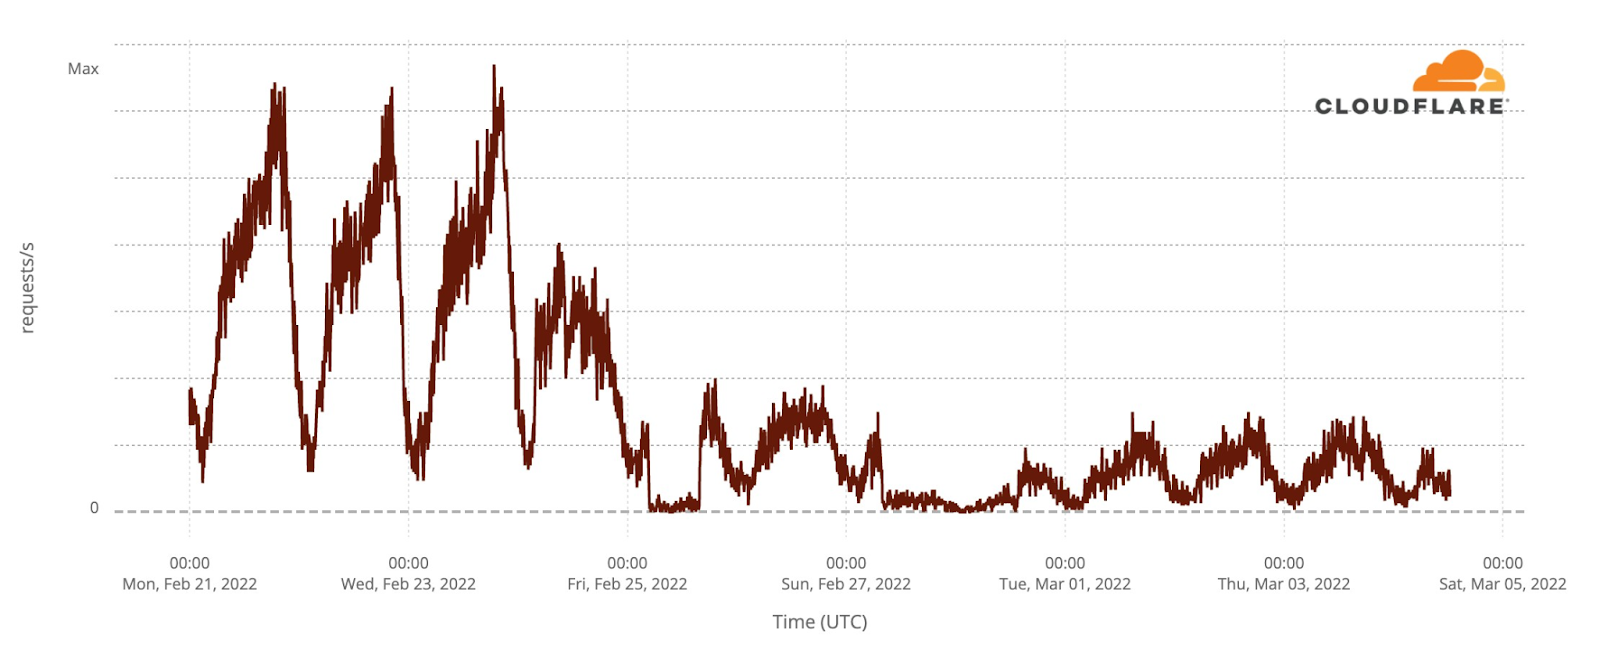
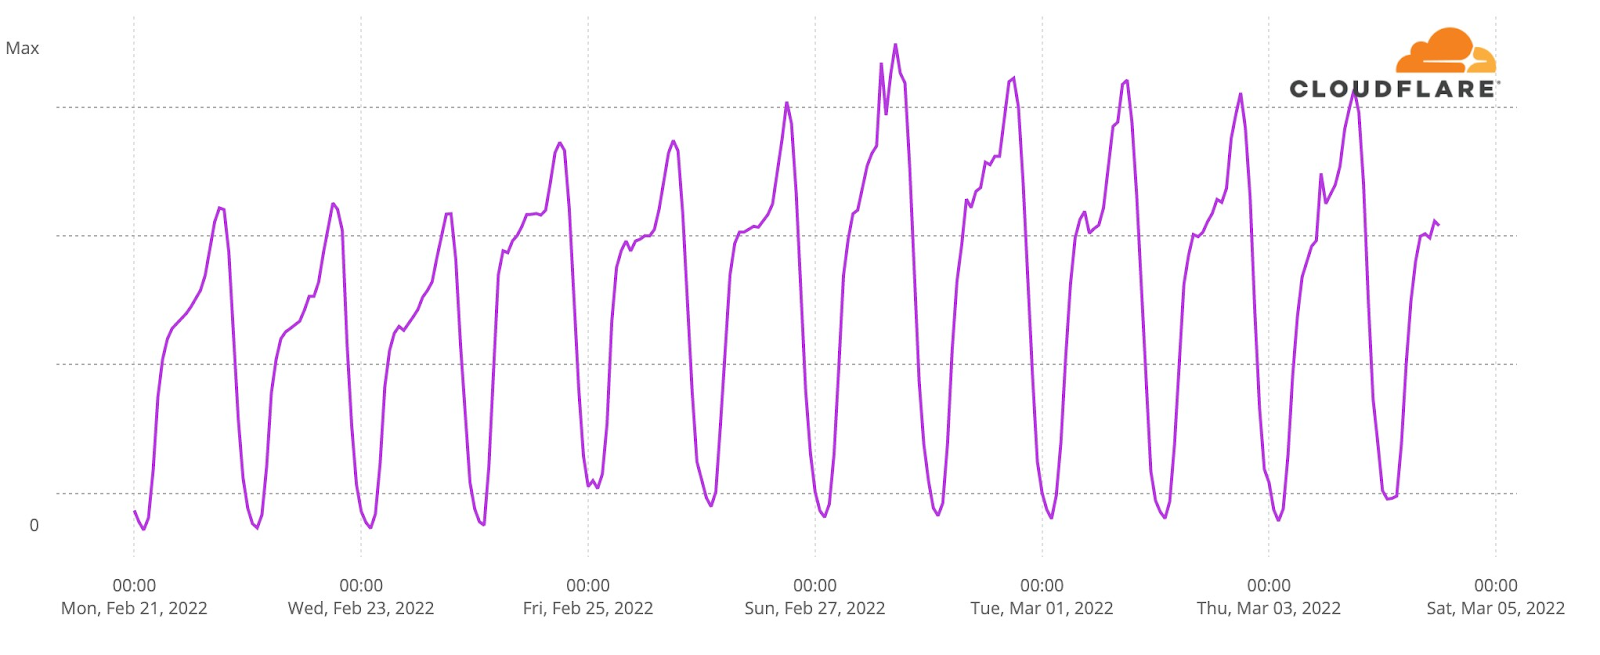
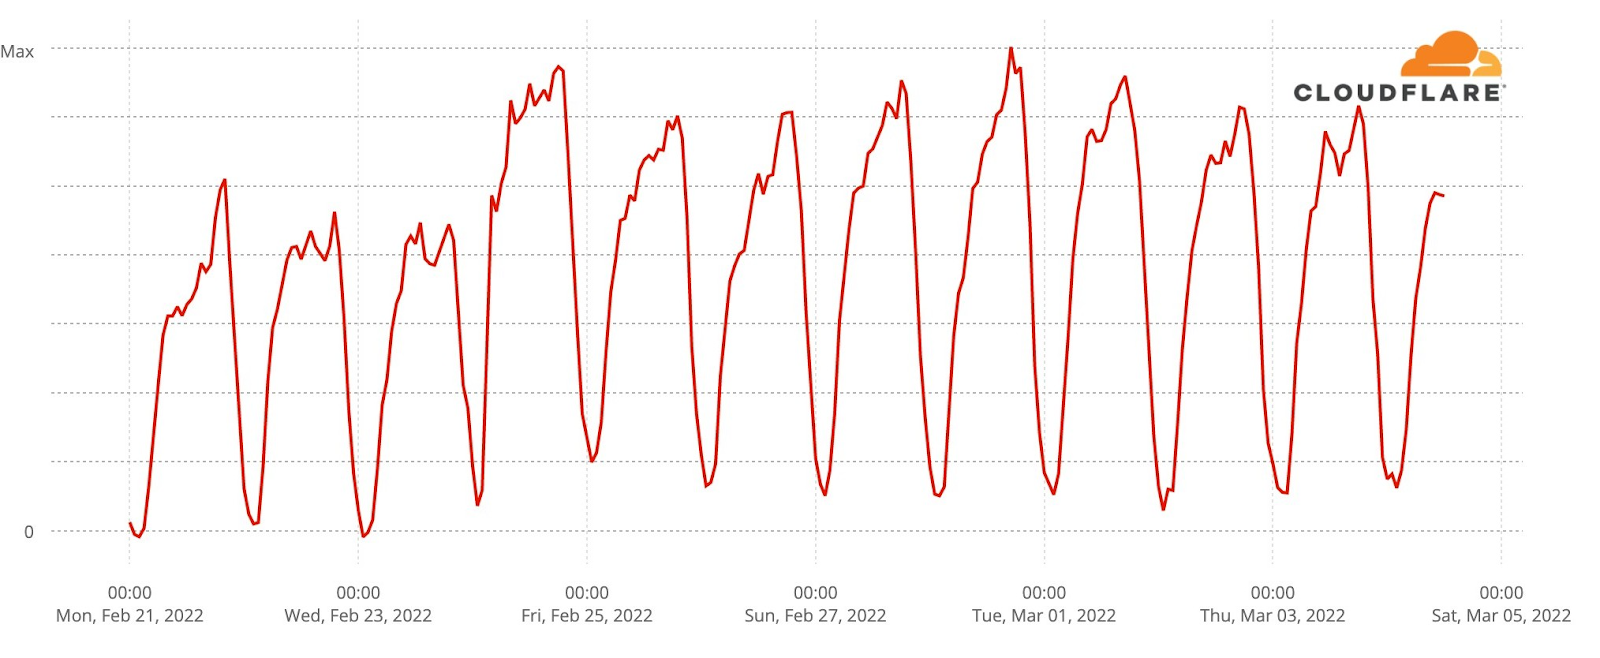
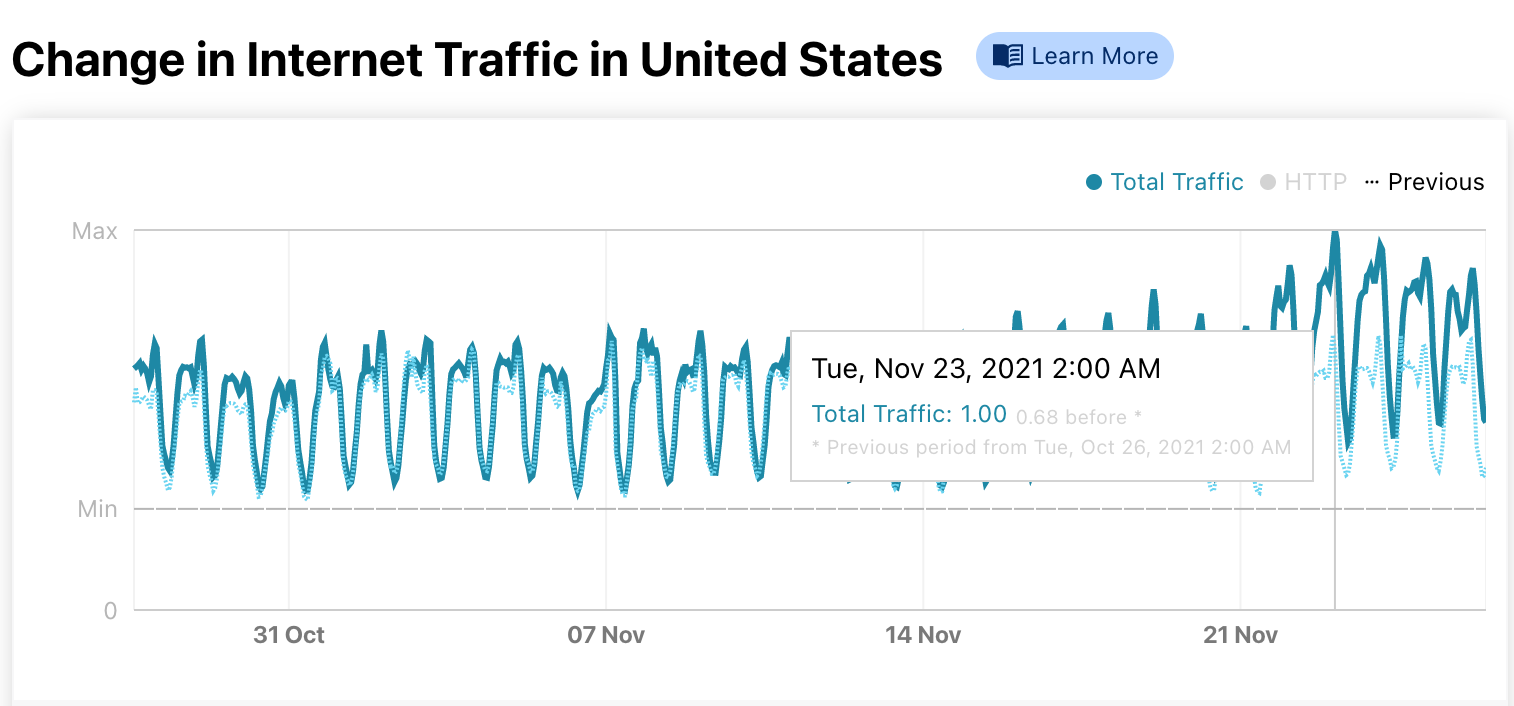
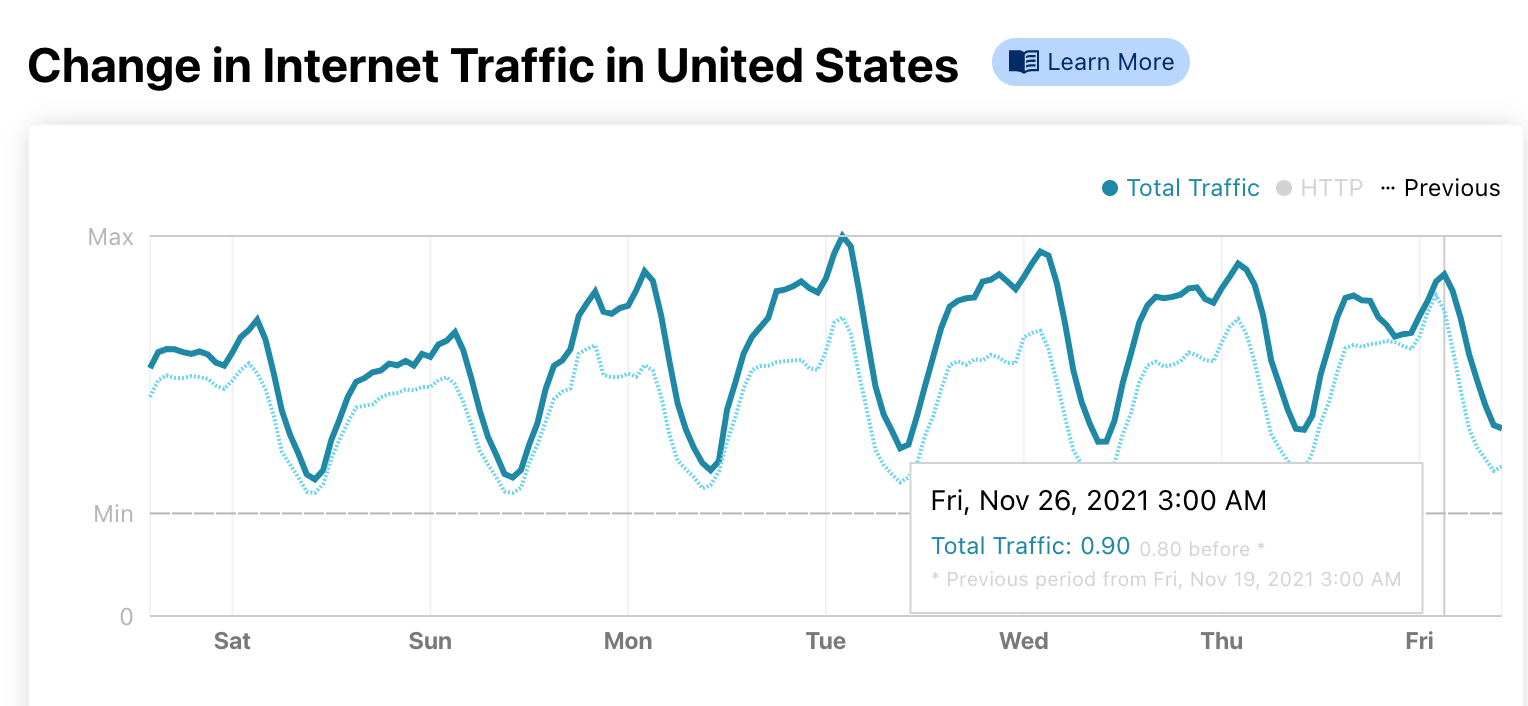
Internet traffic in Ukraine generally follows a pretty predictable pattern based on day and night. Lowest in the hours after local midnight and picking up as people wake up. It’s not uncommon to see a dip around lunchtime and a peak when people go home in the evening. That pattern is clearly visible in this chart of overall Internet traffic seen by Cloudflare for Ukrainian networks on Monday, Tuesday, and Wednesday prior to the invasion.
Starting Thursday, traffic was significantly lower. On Thursday, we saw about 70% of our normal request volume and about 60% on Friday. Request volumes recovered to 70% of pre-invasion volume on Saturday and Sunday before peaking on Monday and Tuesday because of attacks that we mitigated coming from networks in Ukraine.
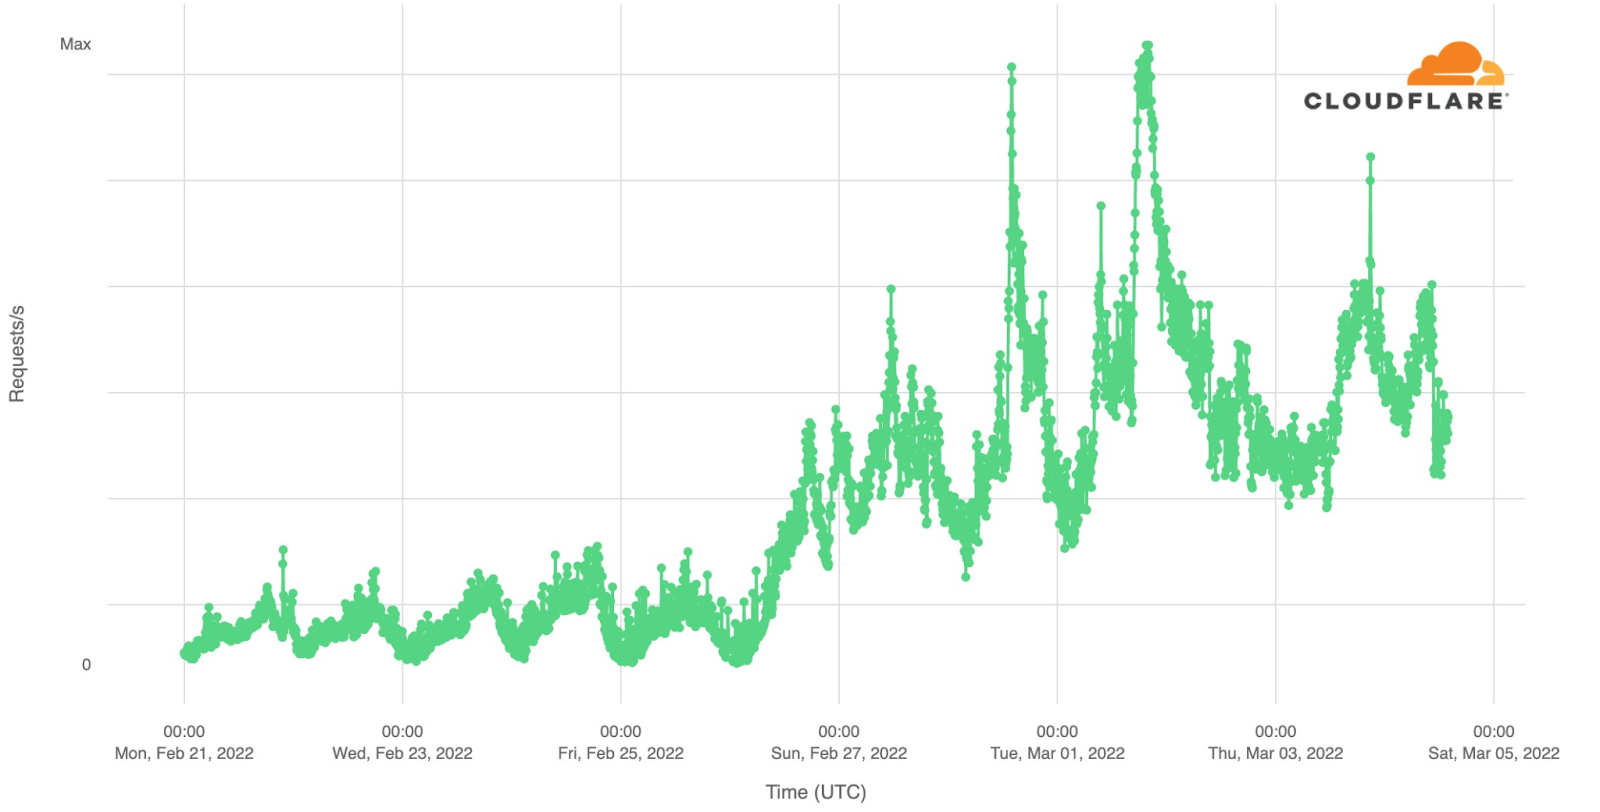
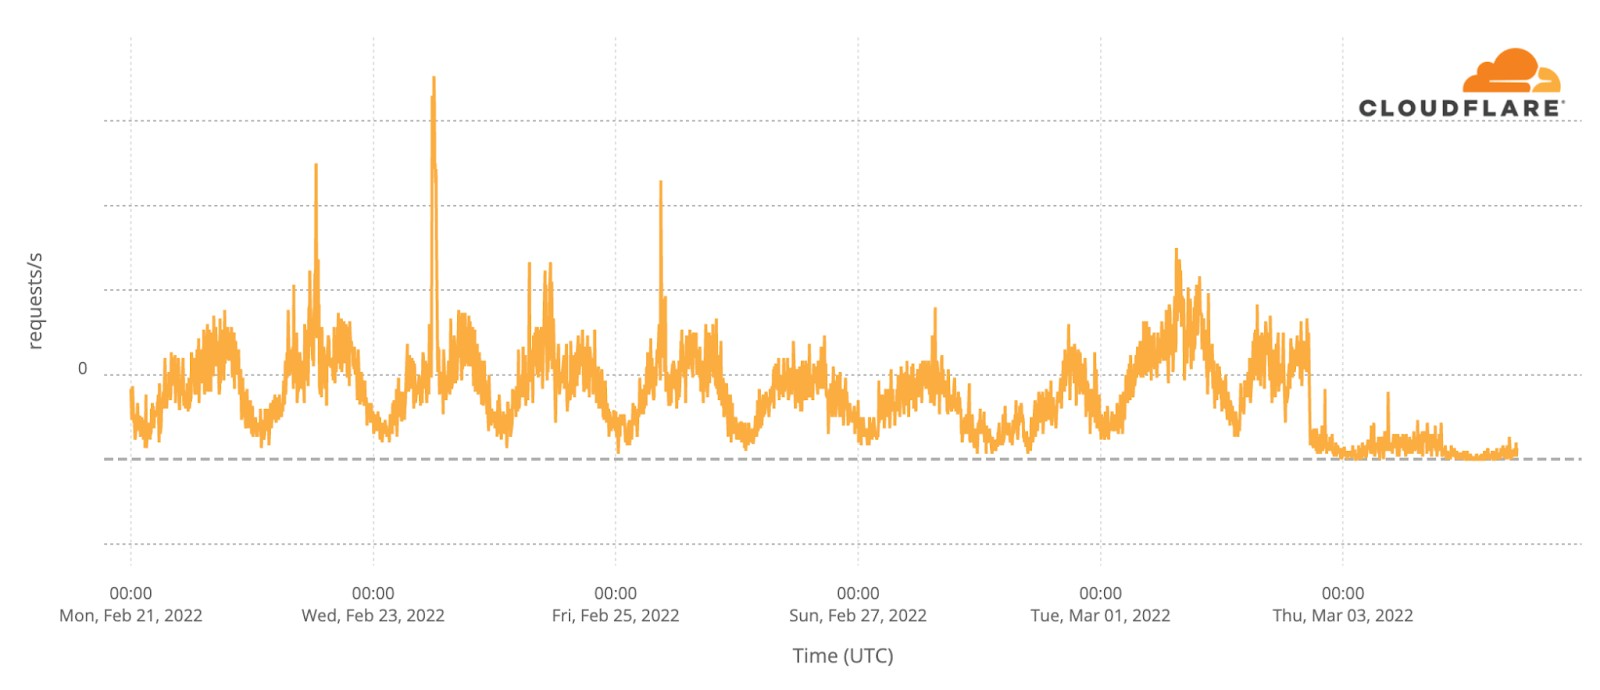
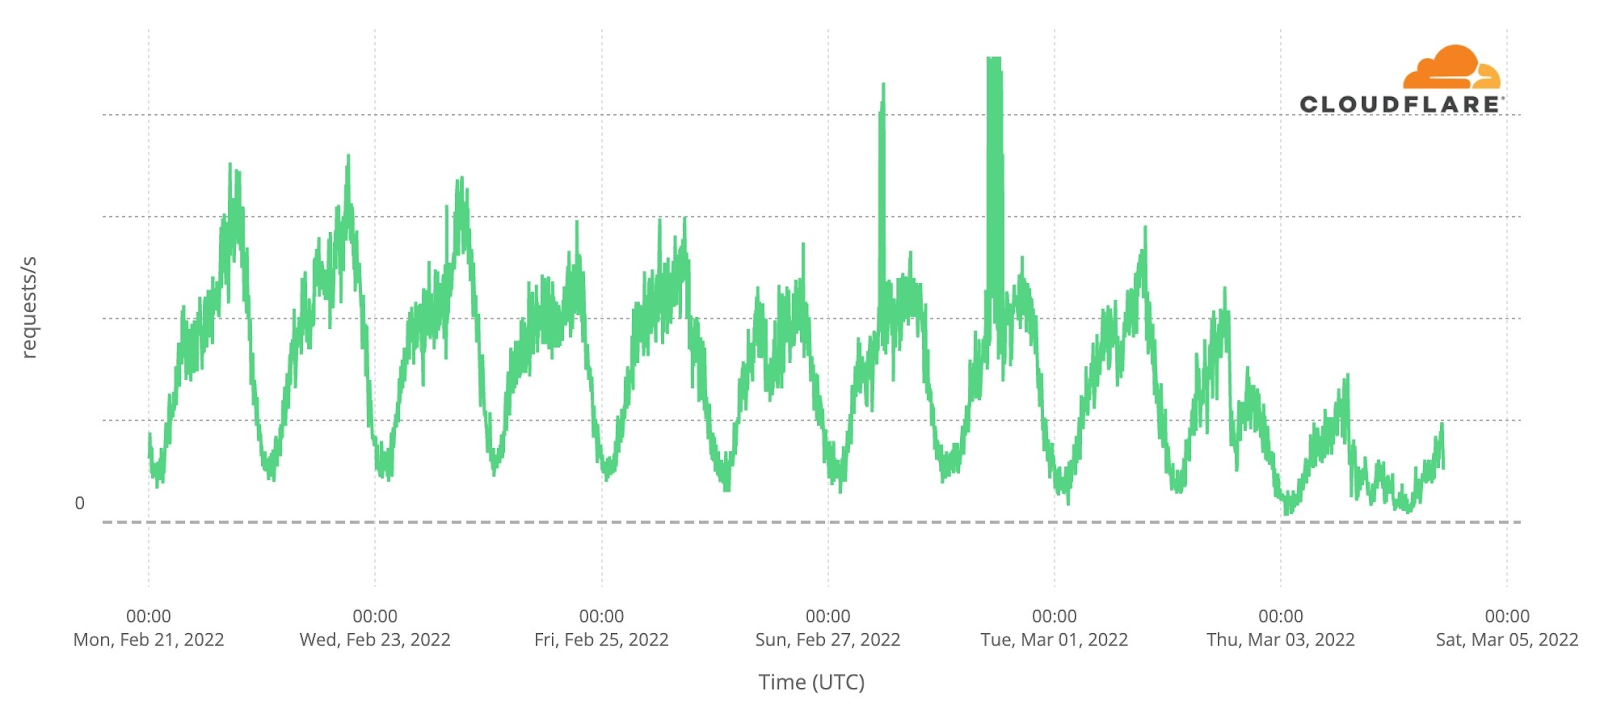
This chart shows attack traffic blocked by Cloudflare that originated on networks in Ukraine. Note that this is quite different from attacks against .ua domains, which can originate anywhere in the world and are discussed below.
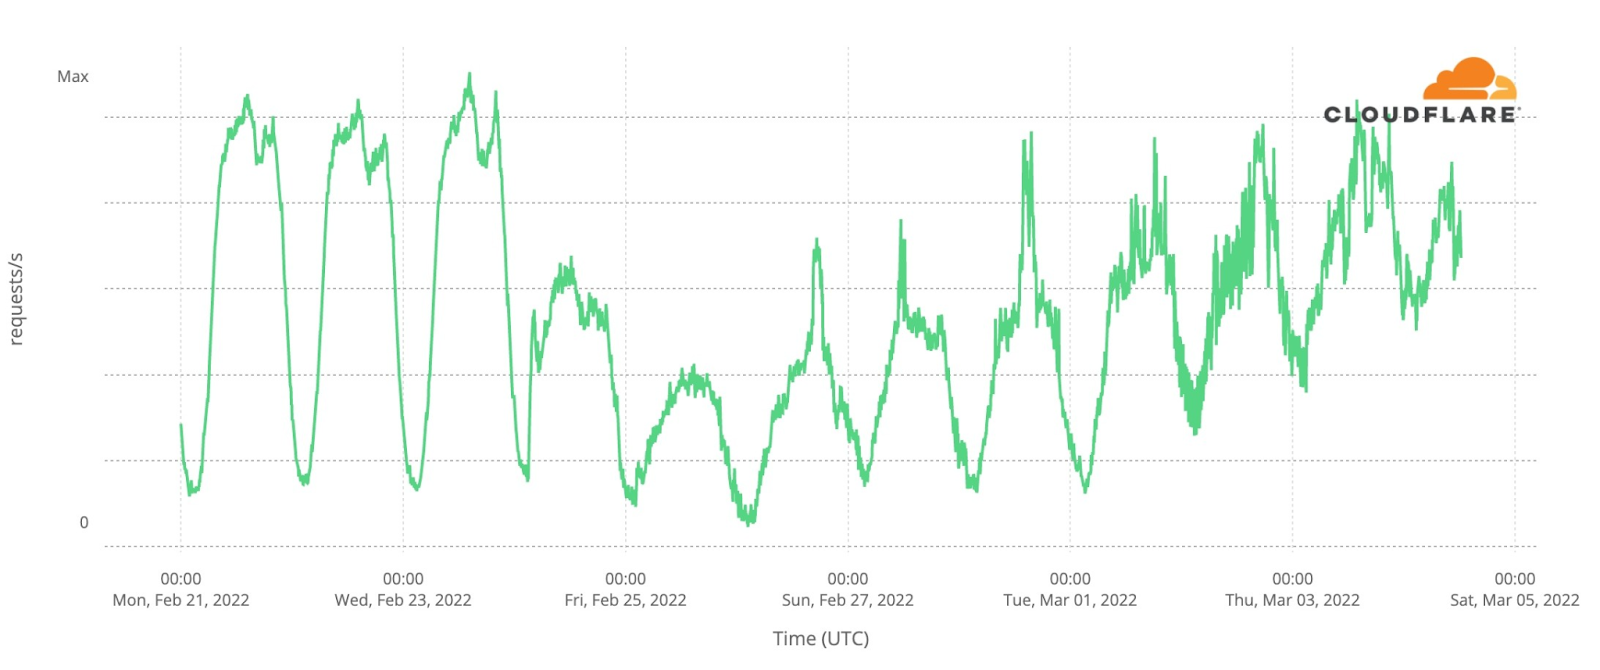
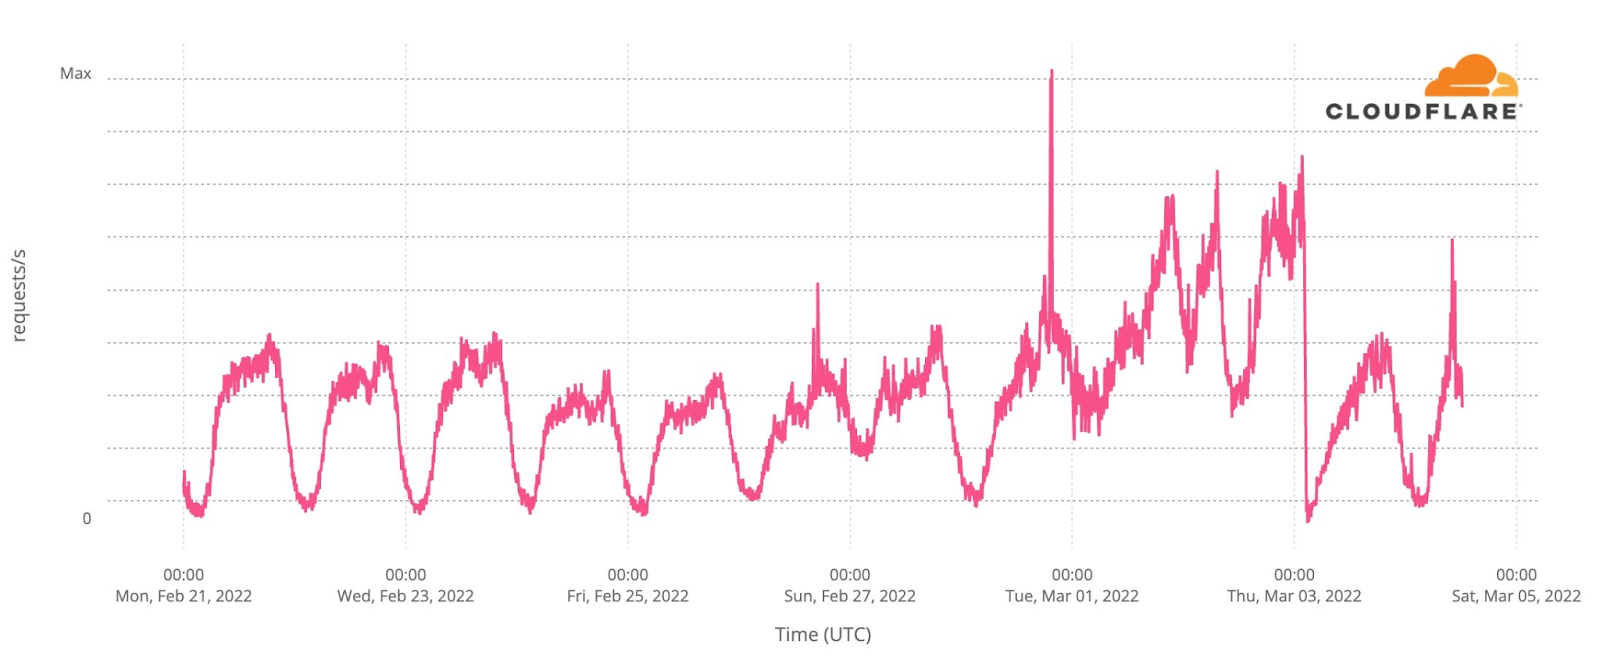
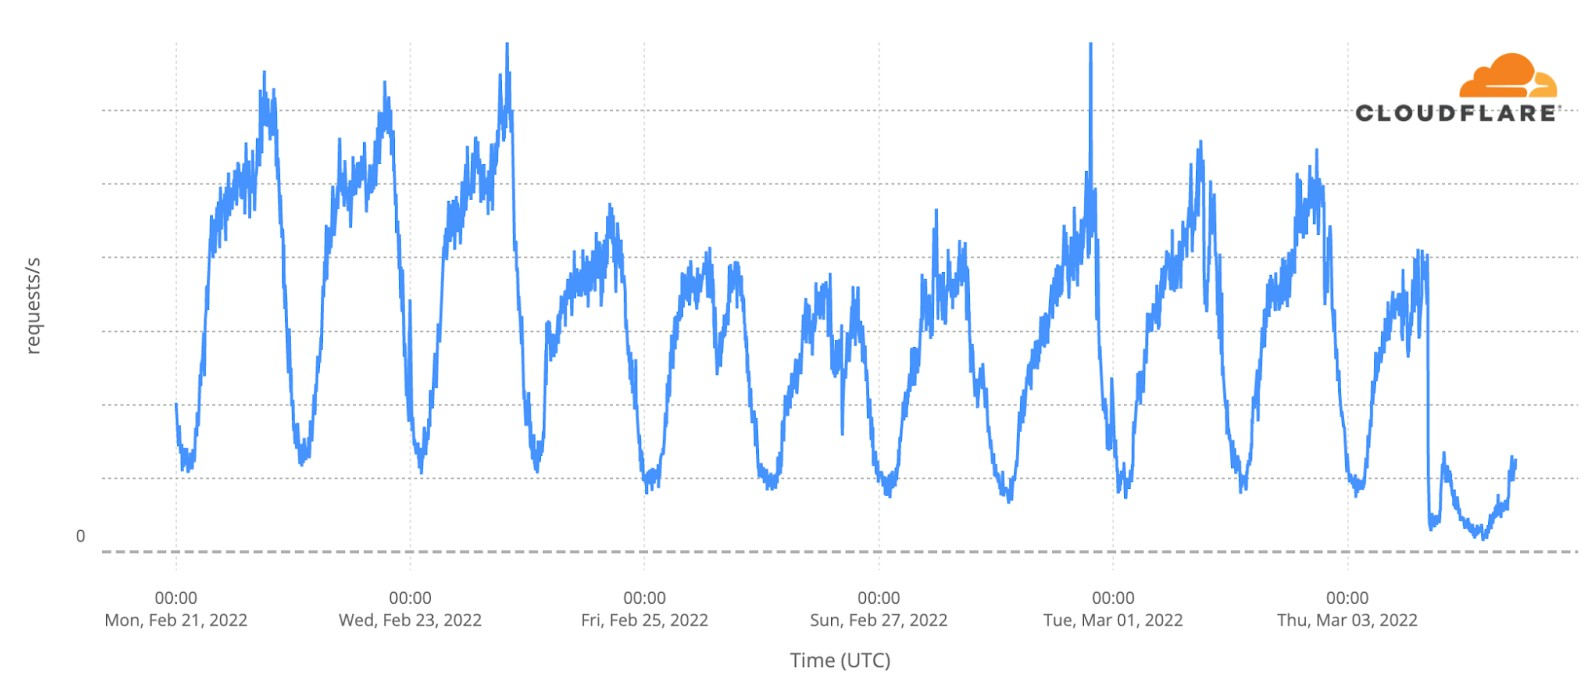
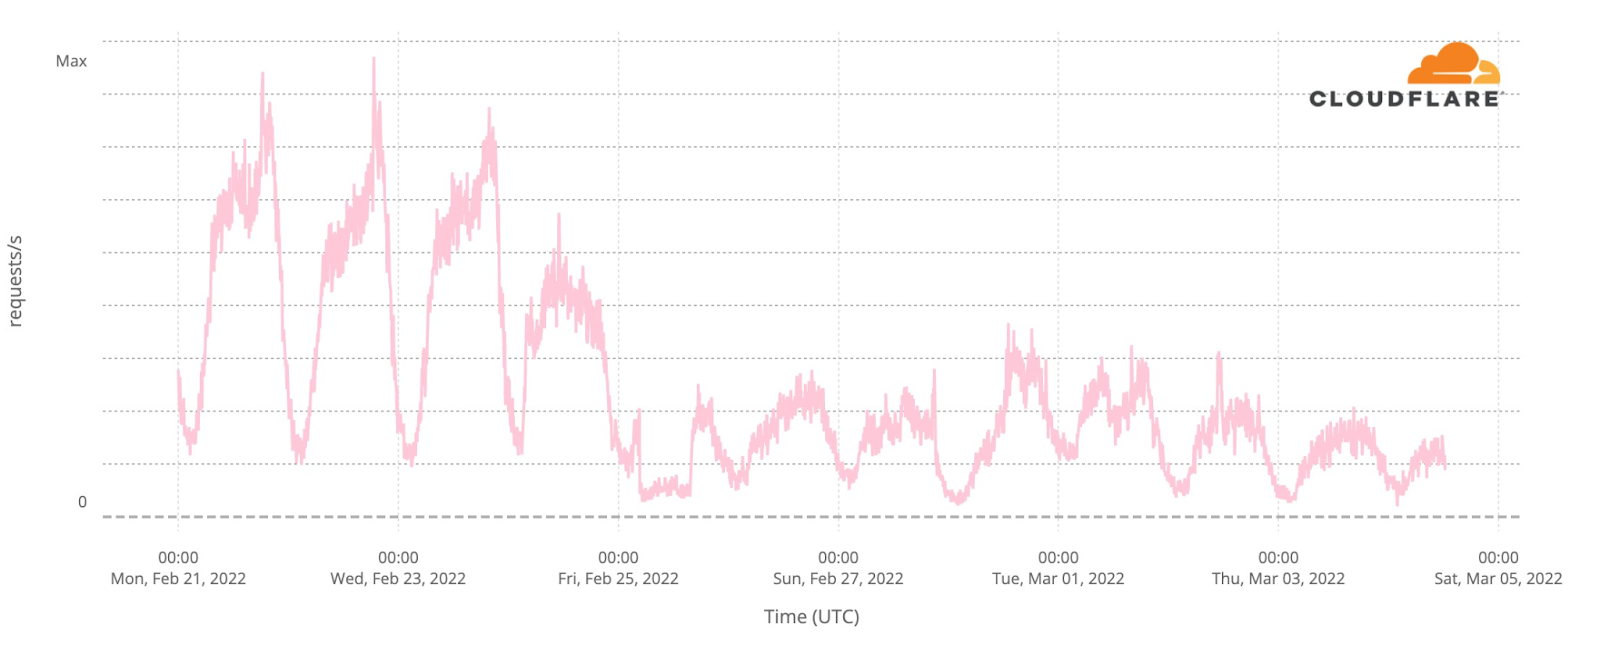
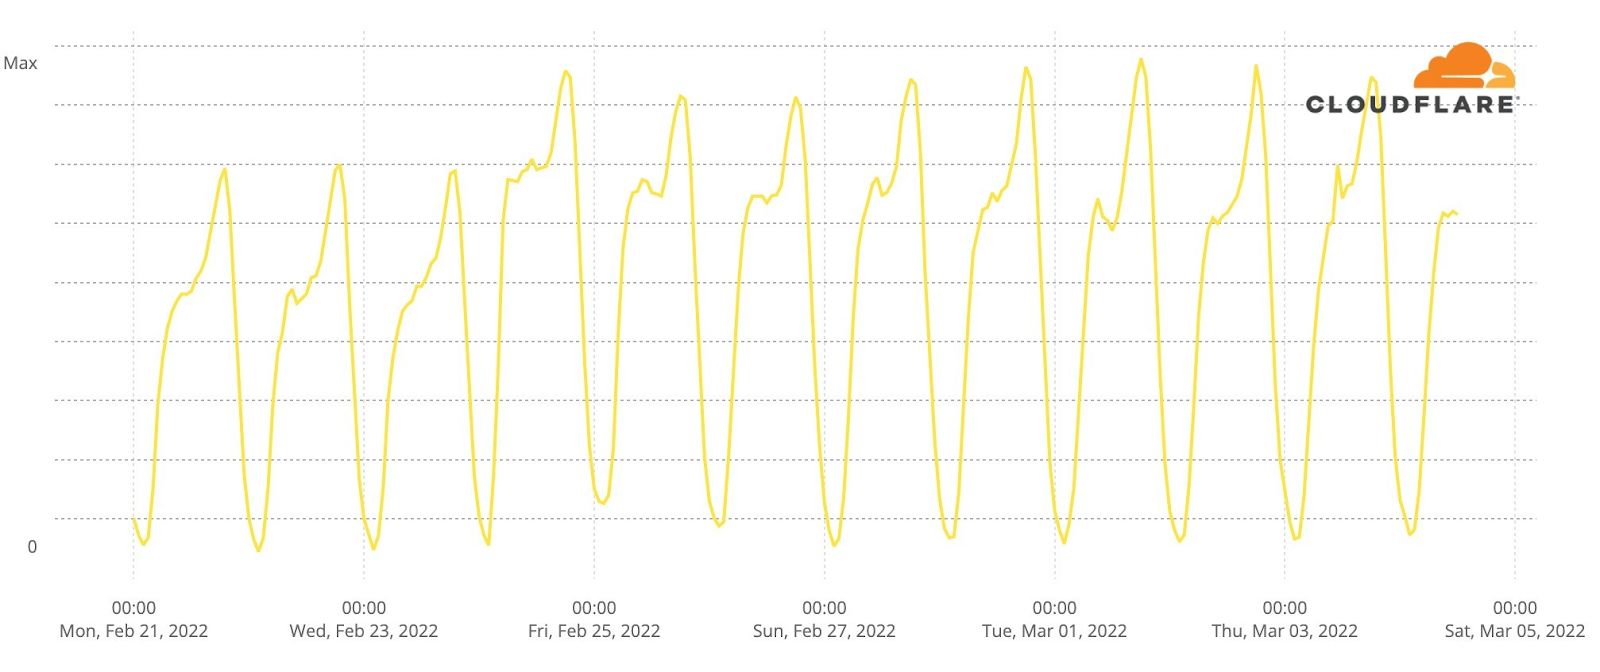
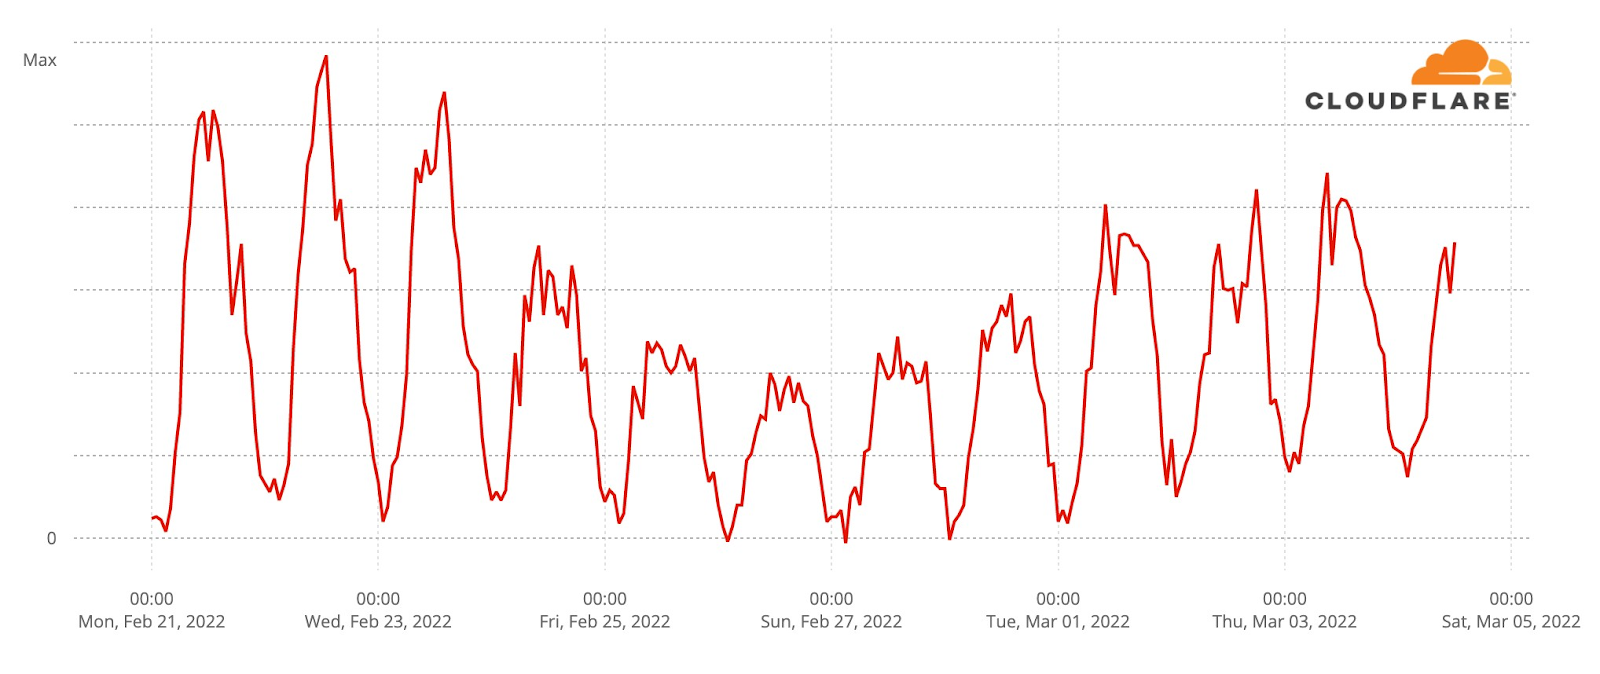
Analysis of network traffic from different cities in Ukraine gives us some insight into people’s use of the Internet and availability of Internet access. Here’s Internet traffic from the capital, Kyiv:
Once again the “normal” ebb and flow of Internet traffic is seen on Monday, Tuesday, and Wednesday. Early on Thursday morning, Internet traffic picks up after Vladimir Putin’s announcement of the attack but never reaches normal levels that day. Friday is even lower, but traffic in Kyiv has gradually increased since then.
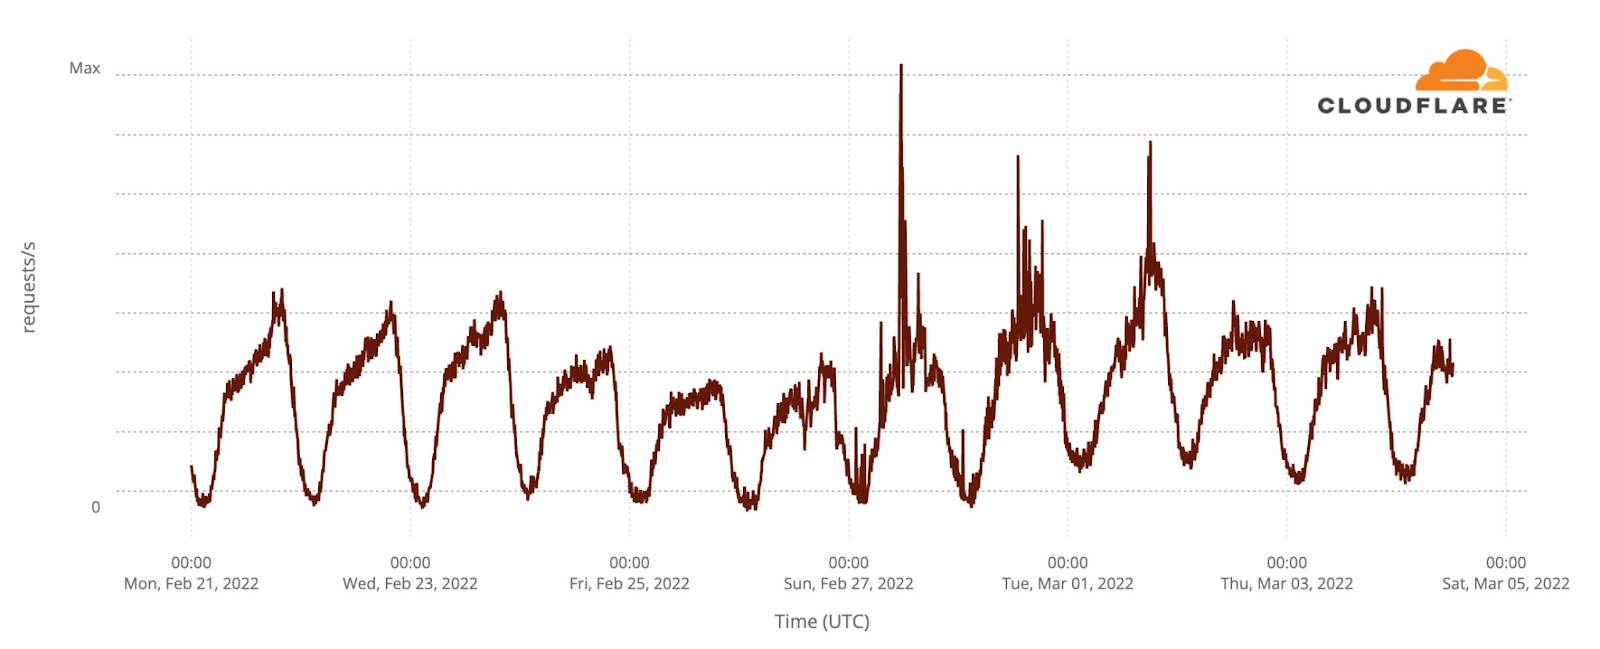
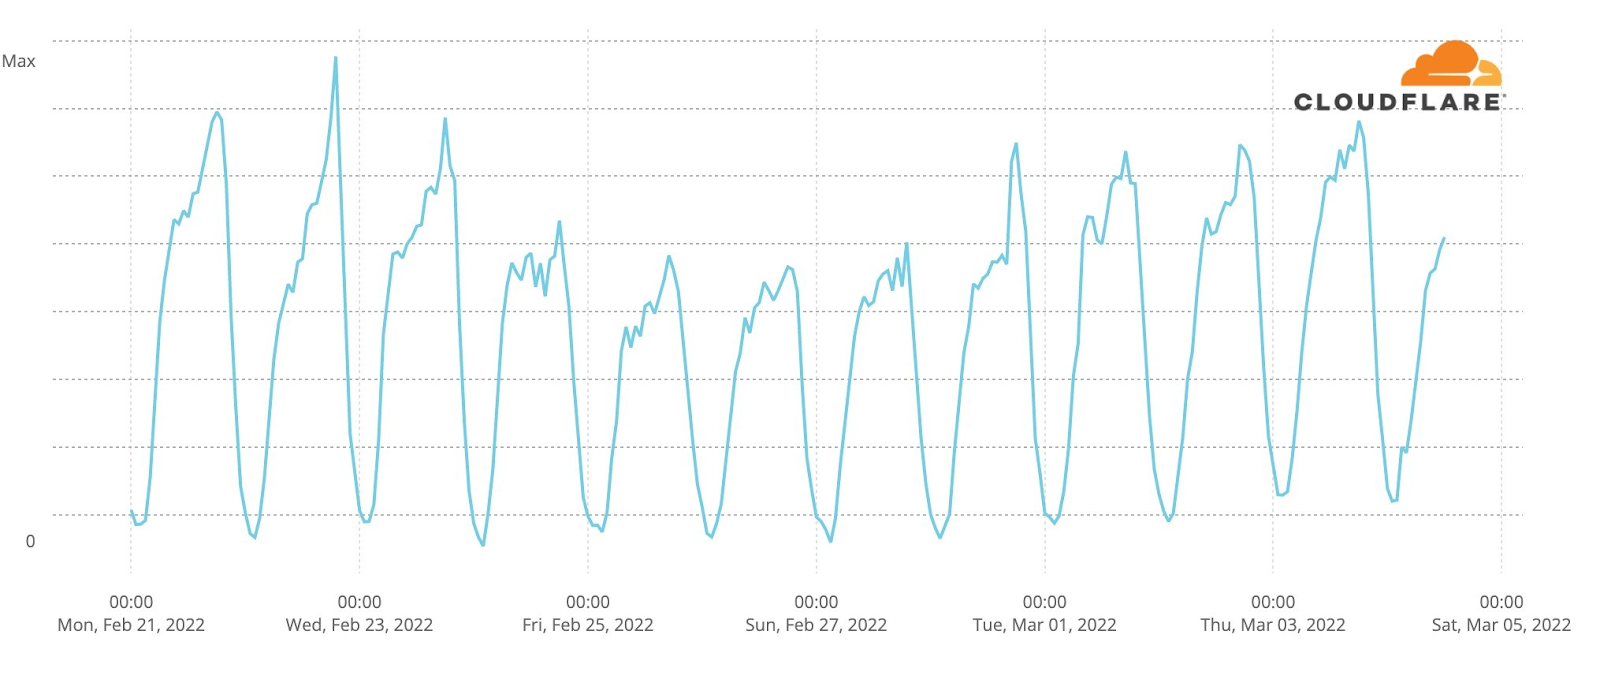
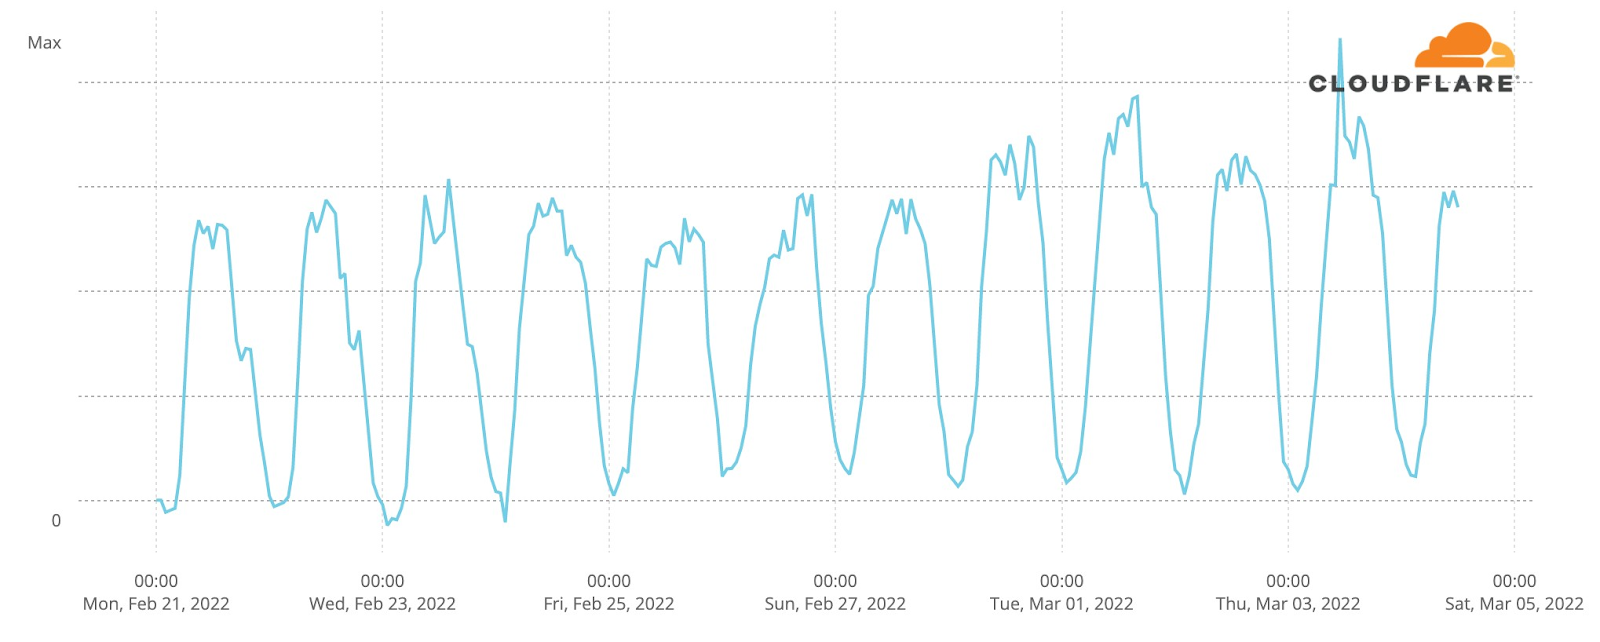
Moving westward to Lviv, we see a very different pattern of use.
The same normal flows on Monday to Wednesday are visible, followed by a smaller drop for three days and then a dramatic increase in traffic. As many Ukrainians have moved westward towards Poland, Slovakia and Romania, away from the fighting, it appears that Internet traffic has grown with their arrival in Lviv.
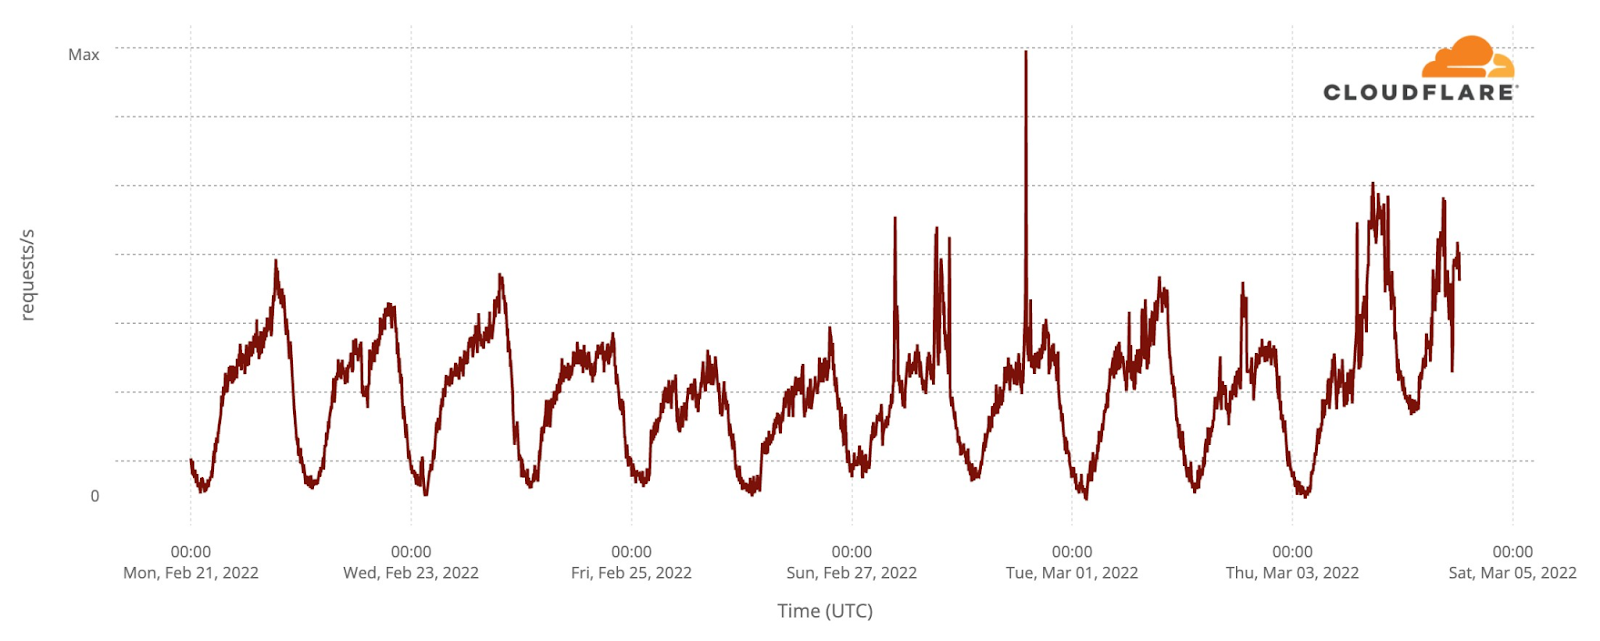
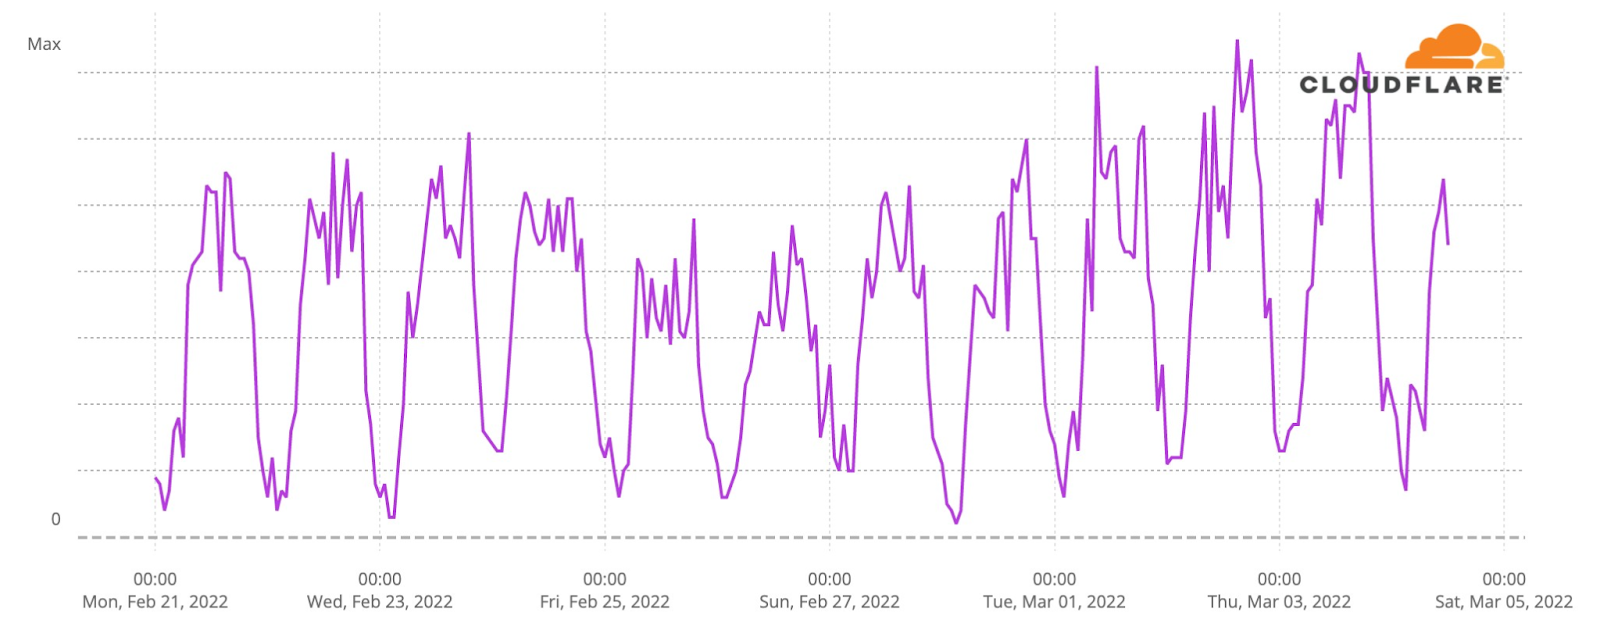
The city of Uzhhorod on the Slovakian border shows a similar pattern.
To the east of Lviv, the city of Ternopil has also seen an increase in Internet traffic.
As has Rivne.
Looking at Rivne, Ternopil, Uzhhorod, and Lviv, it’s possible that the peaks in Internet traffic on different days show the movement of people westward as they try to escape fighting around the capital and in the east and south.
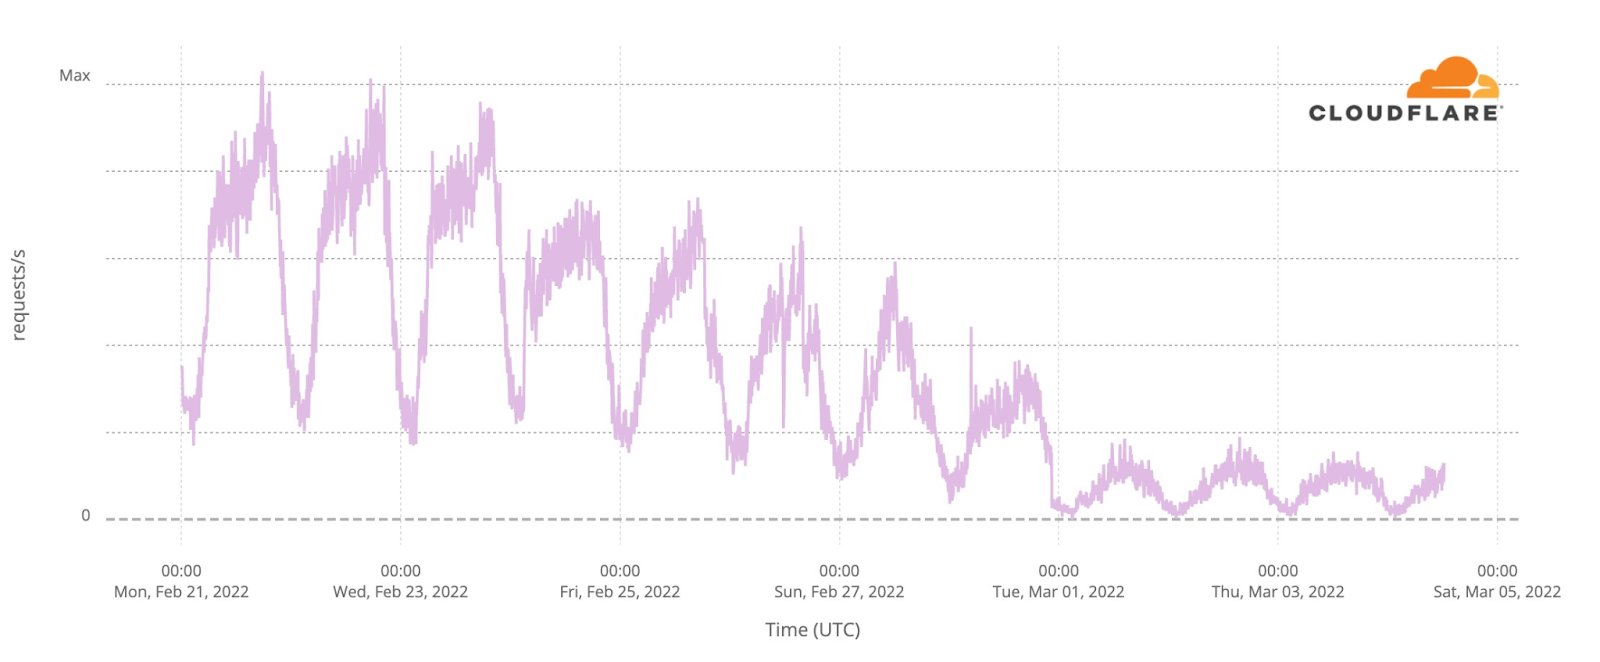
On the opposite side of Ukraine, the situation is quite different. Here’s the traffic pattern for the city of Kharkiv. It has stayed at roughly between 50% and 60% (March 3) of the usual rate since the beginning of the invasion.
North of Kharkiv, the city of Sumy (north-eastern Ukraine, near the Russian border), traffic levels are very low since yesterday, March 3, 2022.
A similar trend can be seen in the city Izyum, south of Kharkiv (east of Ukraine), where traffic is very low since March 2.
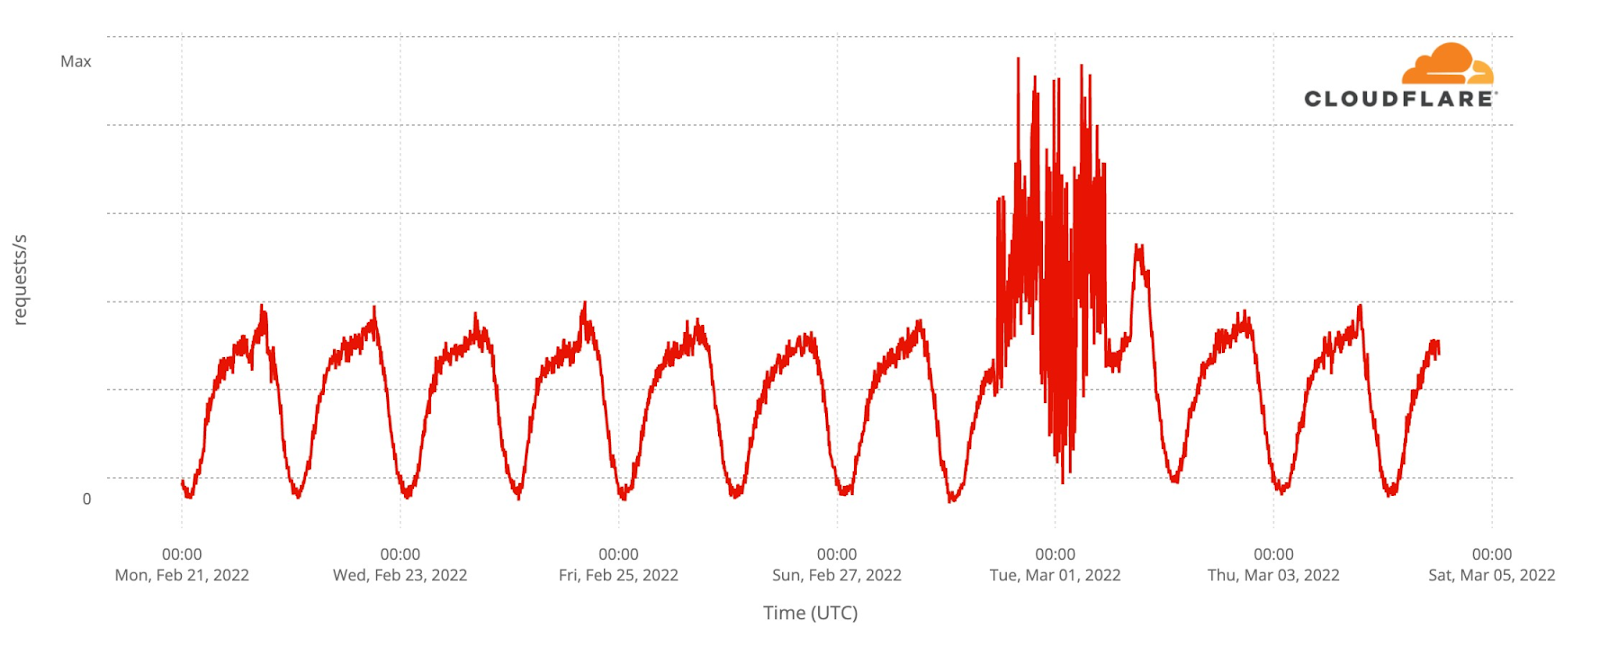
Traffic in Donetsk has remained fairly consistent throughout the invasion, except for March 1 when there was a dramatic change in traffic. This was most likely caused by an attack against a single .ua domain name, with the attack traffic coming, at least in part, from Donetsk.
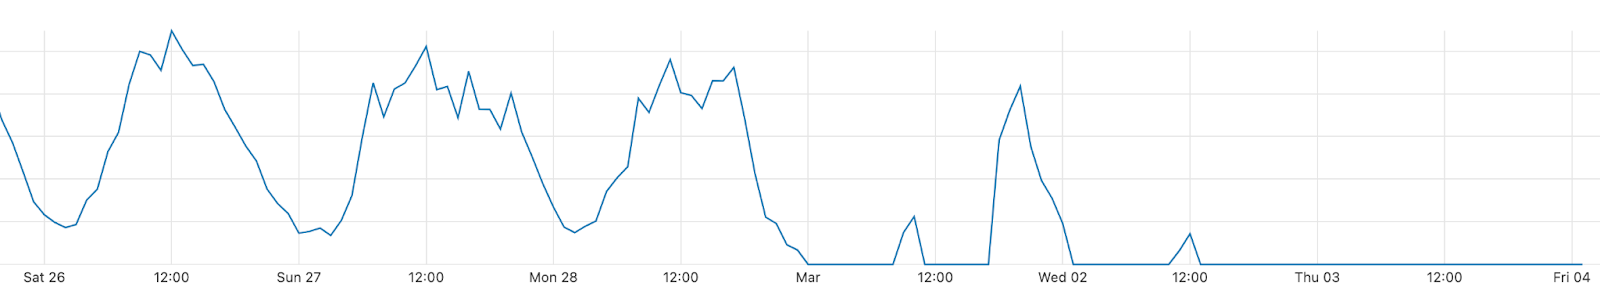
Some other areas with fighting have experienced the largest drops and partial Internet outages. Moving to the south, traffic in Mariupol declined after the invasion and has dropped dramatically in the last three days with outages on local networks.
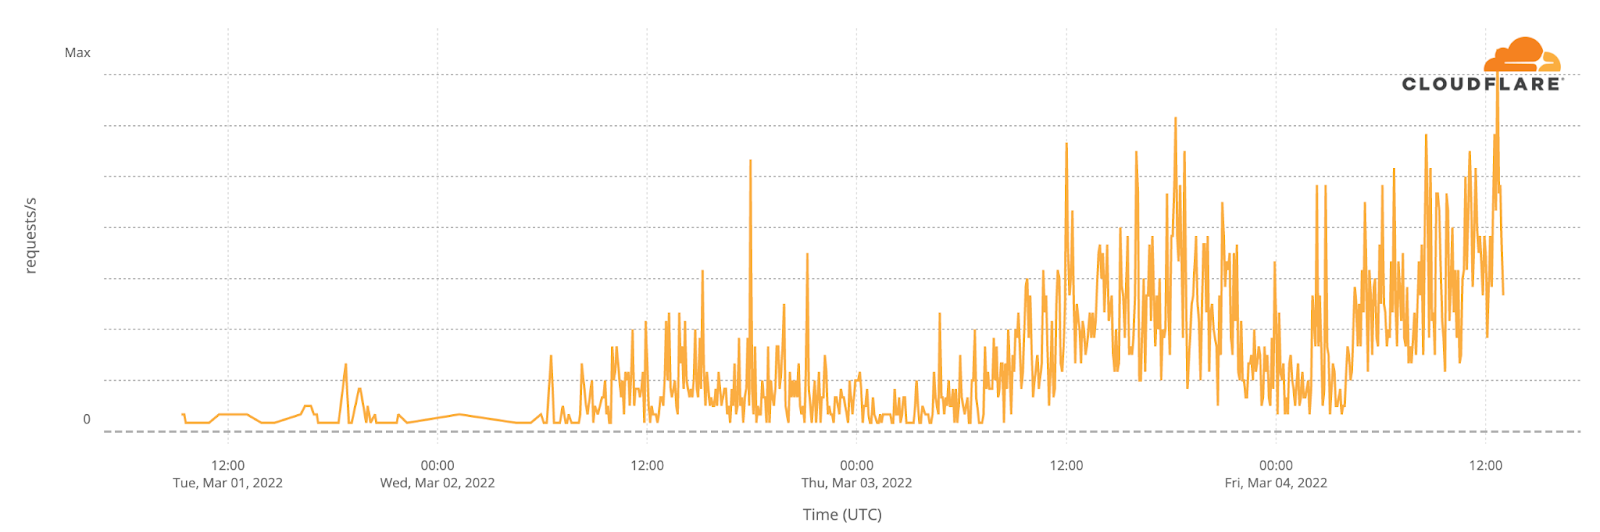
Here’s a view of traffic from AS43554 in Mariupol showing what seems to be a total outage on March 1 that continued through March 4.
To the west of Mariupol, Osypenko shows a gradual decline in traffic followed by three days of minimal Internet use.
Similar large drops are seen in Irpin (just outside Kyiv to the northwest).
And in Bucha, which is next to Irpin; both Bucha and Irpin are close to Hostomel airport.
There has also been minimal traffic (or possible outage) from Severodonetsk (north of Luhansk) for the past four of days.
We have started to see traffic from Starlink terminals in Ukraine, although traffic levels remain very low.
Cyberattacks
The physical world invasion has been accompanied by an increase in cyberattacks against Ukrainian domain names and networks.
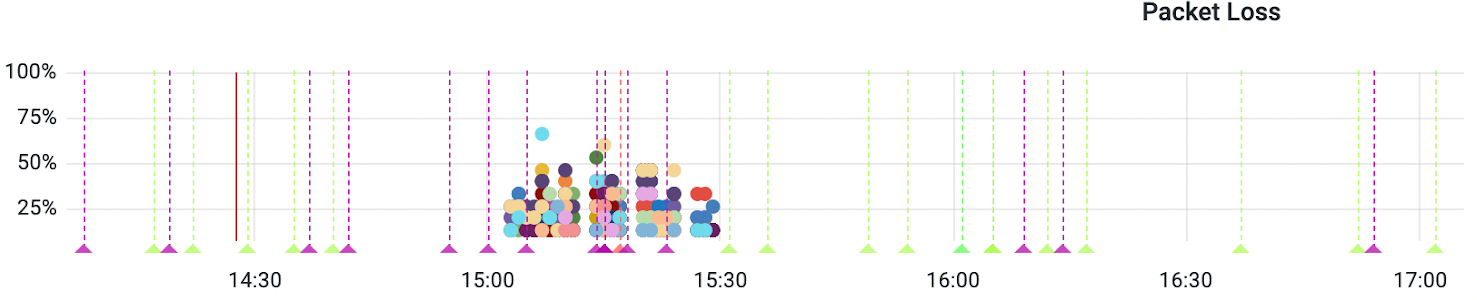
Just prior to the invasion, on February 23, Cloudflare’s automated systems detected a large amount of packet loss on a major Internet connection to our Kyiv data center and automatically mitigated the problem by routing traffic onto other networks. This packet loss was caused by congestion on the transit provider’s network, which in turn was caused by a large DDoS attack. It appeared in our dashboards as packet loss over a 30-minute period between 1500-1530 (the different colors are different parts of our network infrastructure in Kyiv).
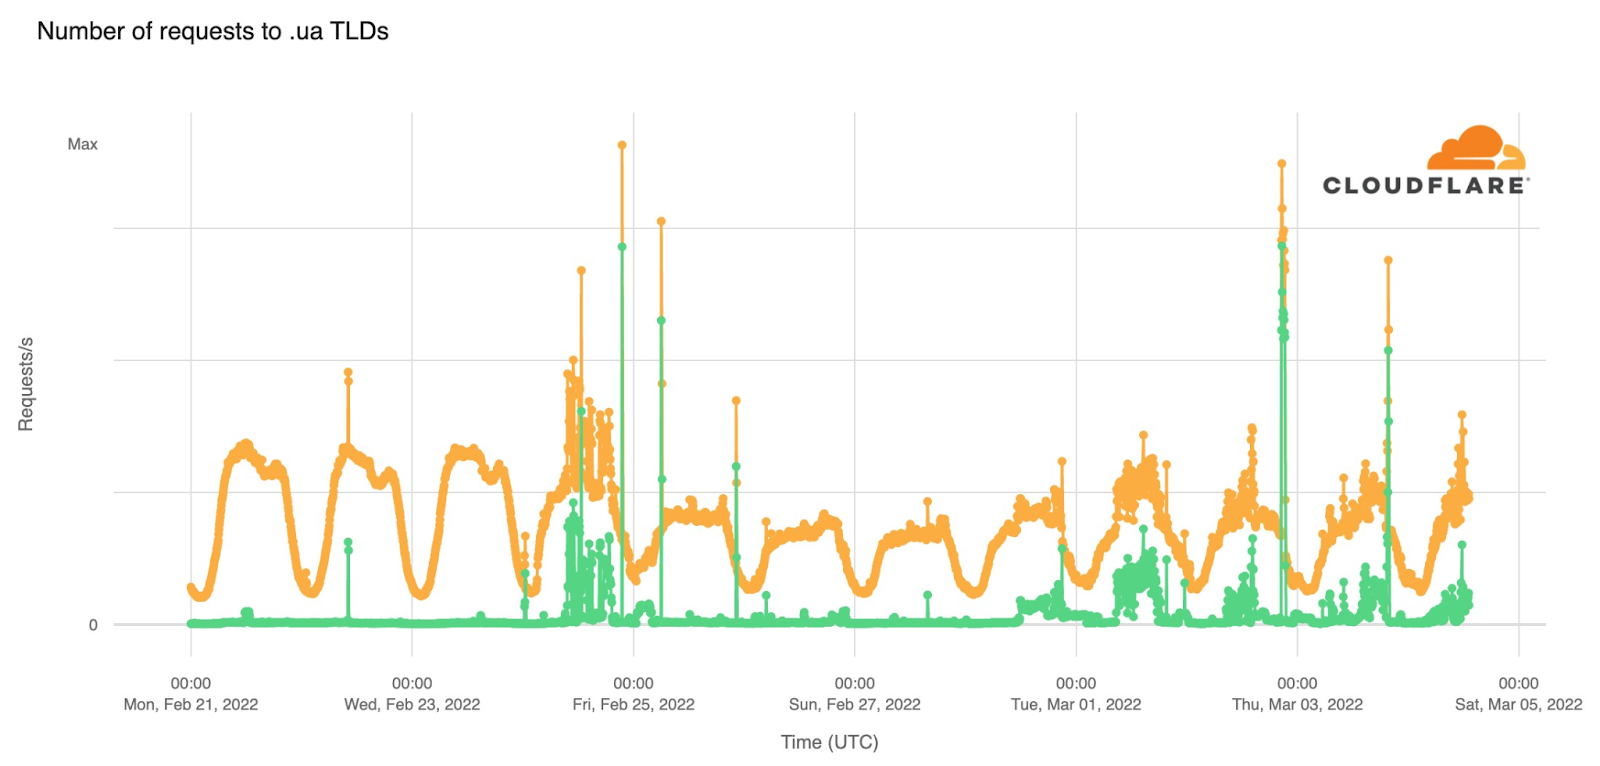
This next chart gives an overview of traffic to .ua domains protected by Cloudflare and requests that are “mitigated” (i.e. blocked by our firewall products). The chart shows only layer 7 traffic and does not give information about layer 3/4 DDoS, which is covered separately below.
On the first day of the invasion attacks against .ua domains were prevalent and at times responsible for almost 50% of the requests being sent to those domains. From Friday, February 25 attacks returned to levels seen prior to the invasion and started picking up again on Tuesday, March 1.
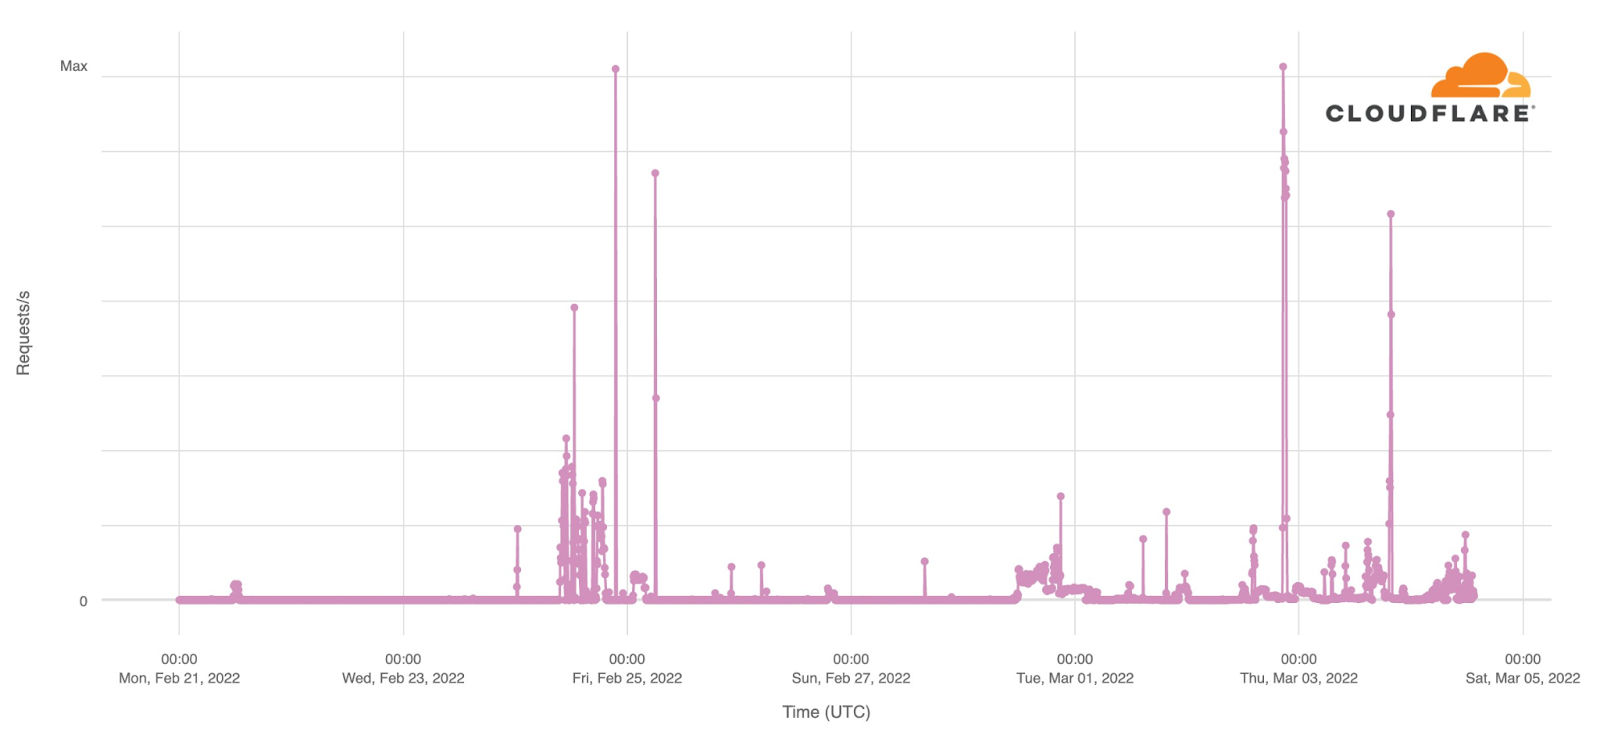
Digging into the layer 7 mitigations we can see that the biggest attacks over all are layer 7 DDoS attacks.
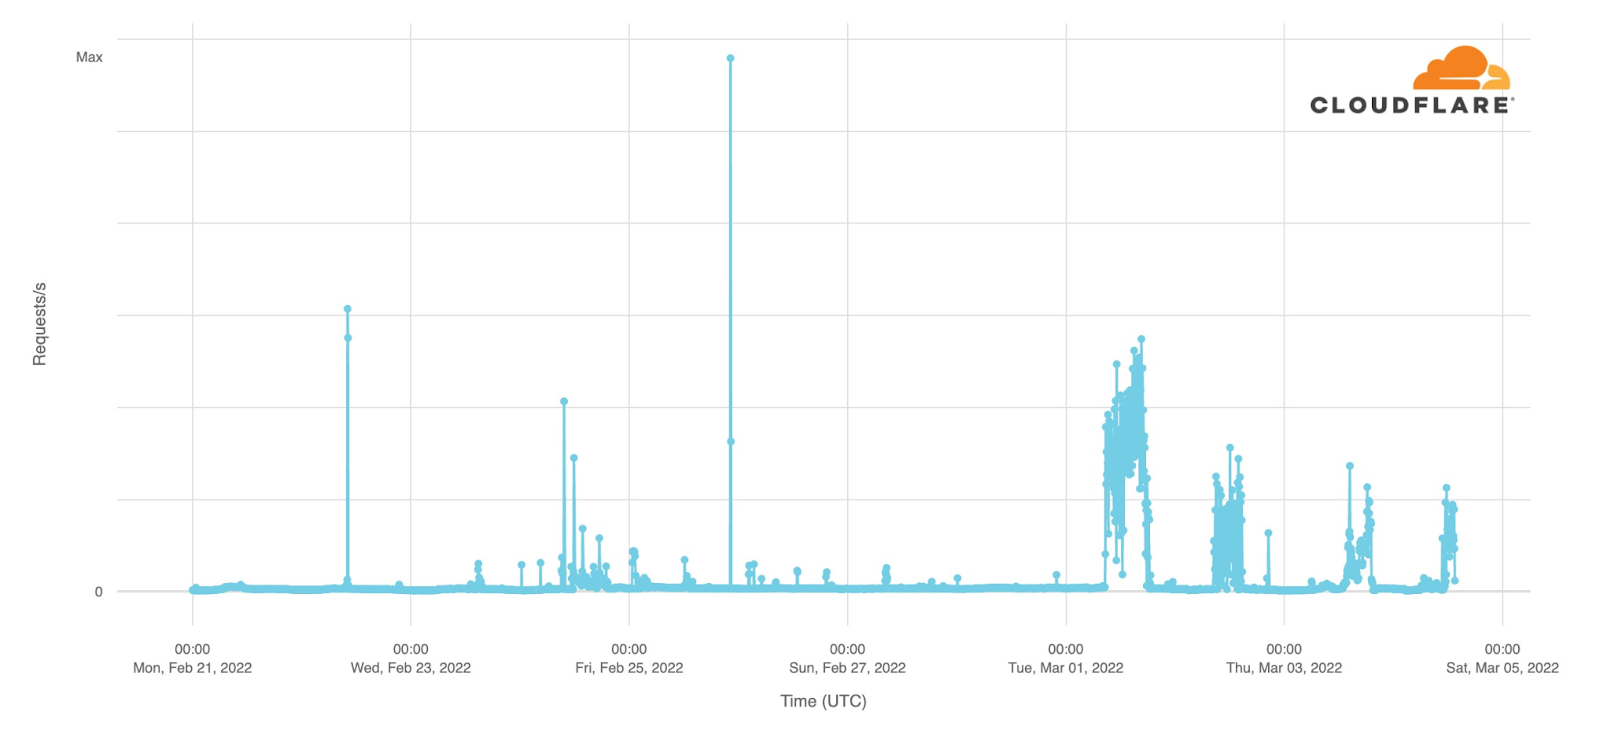
The next largest attacks are being mitigated by firewall rules put in place by customers.
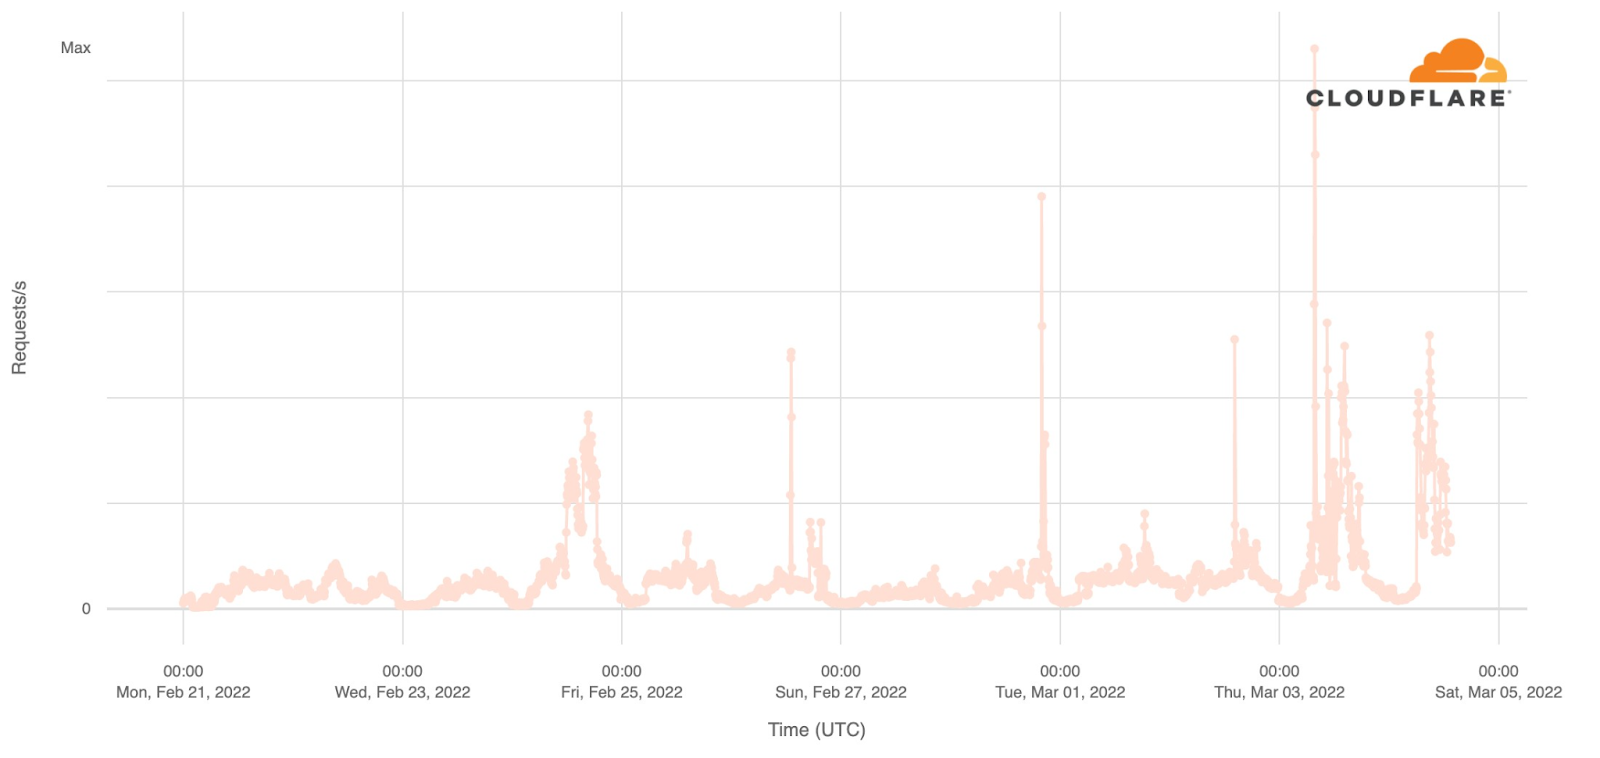
Followed by blocking requests based on our IP threat reputation database.
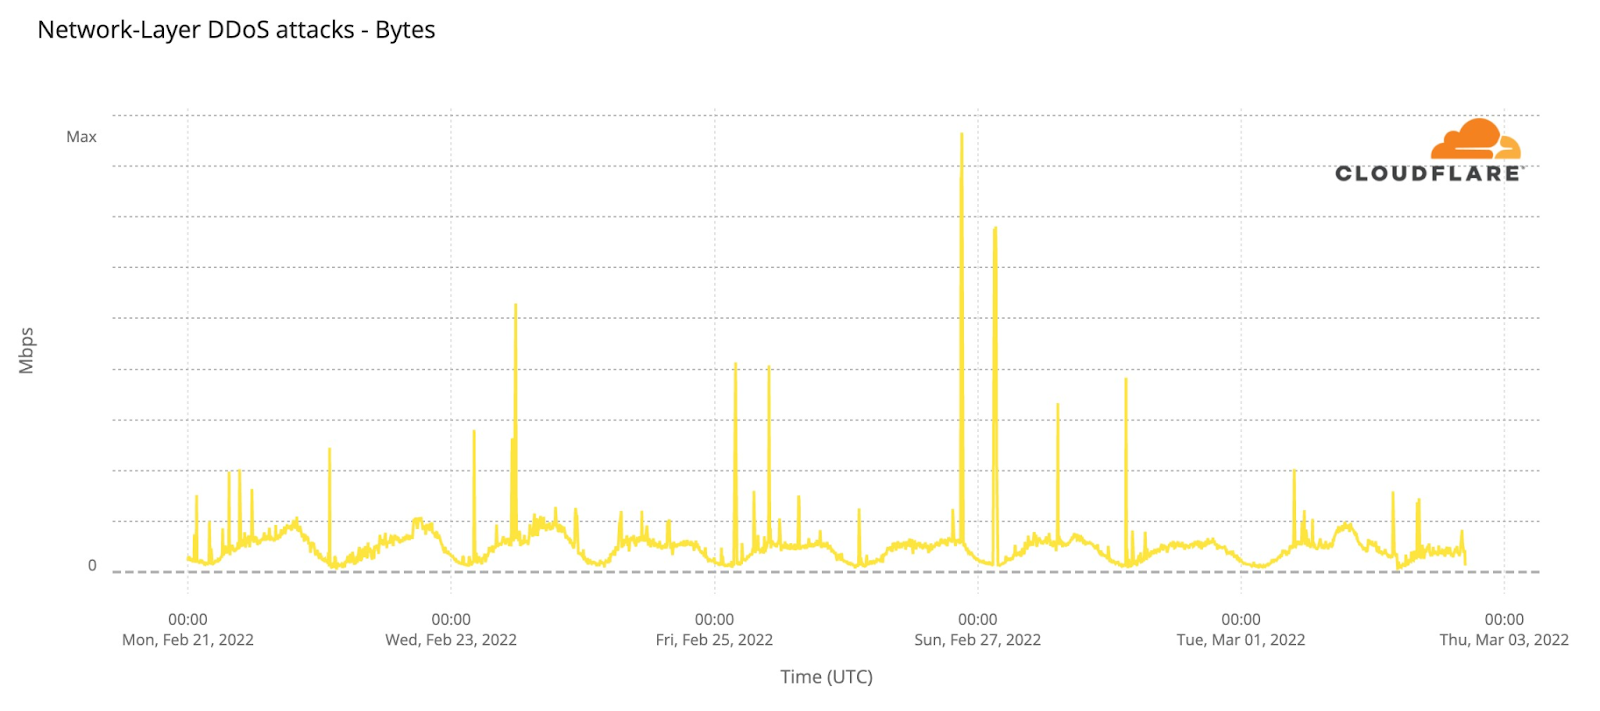
Layer 3/4 traffic is harder to attribute to a specific domain or target as IP addresses are shared across different customers. Looking at network-level DDoS traffic hitting our Kyiv data center, we see occasional peaks of DDoS traffic reaching a high of nearly 1.8 Gbps.
Note that although the layer 3/4 and layer 7 attacks we are mitigating have been relatively small, that does not mean they are not devastating or problematic. A small website or service can be taken down by relatively small attacks, and the layer 7 attack traffic often includes vulnerability scanning, credential stuffing, SQL injection, and the usual panoply of techniques carried out to either deface or penetrate an Internet service.
Unprotected Internet properties are vulnerable to even small attacks and need protection.
Social media and communications
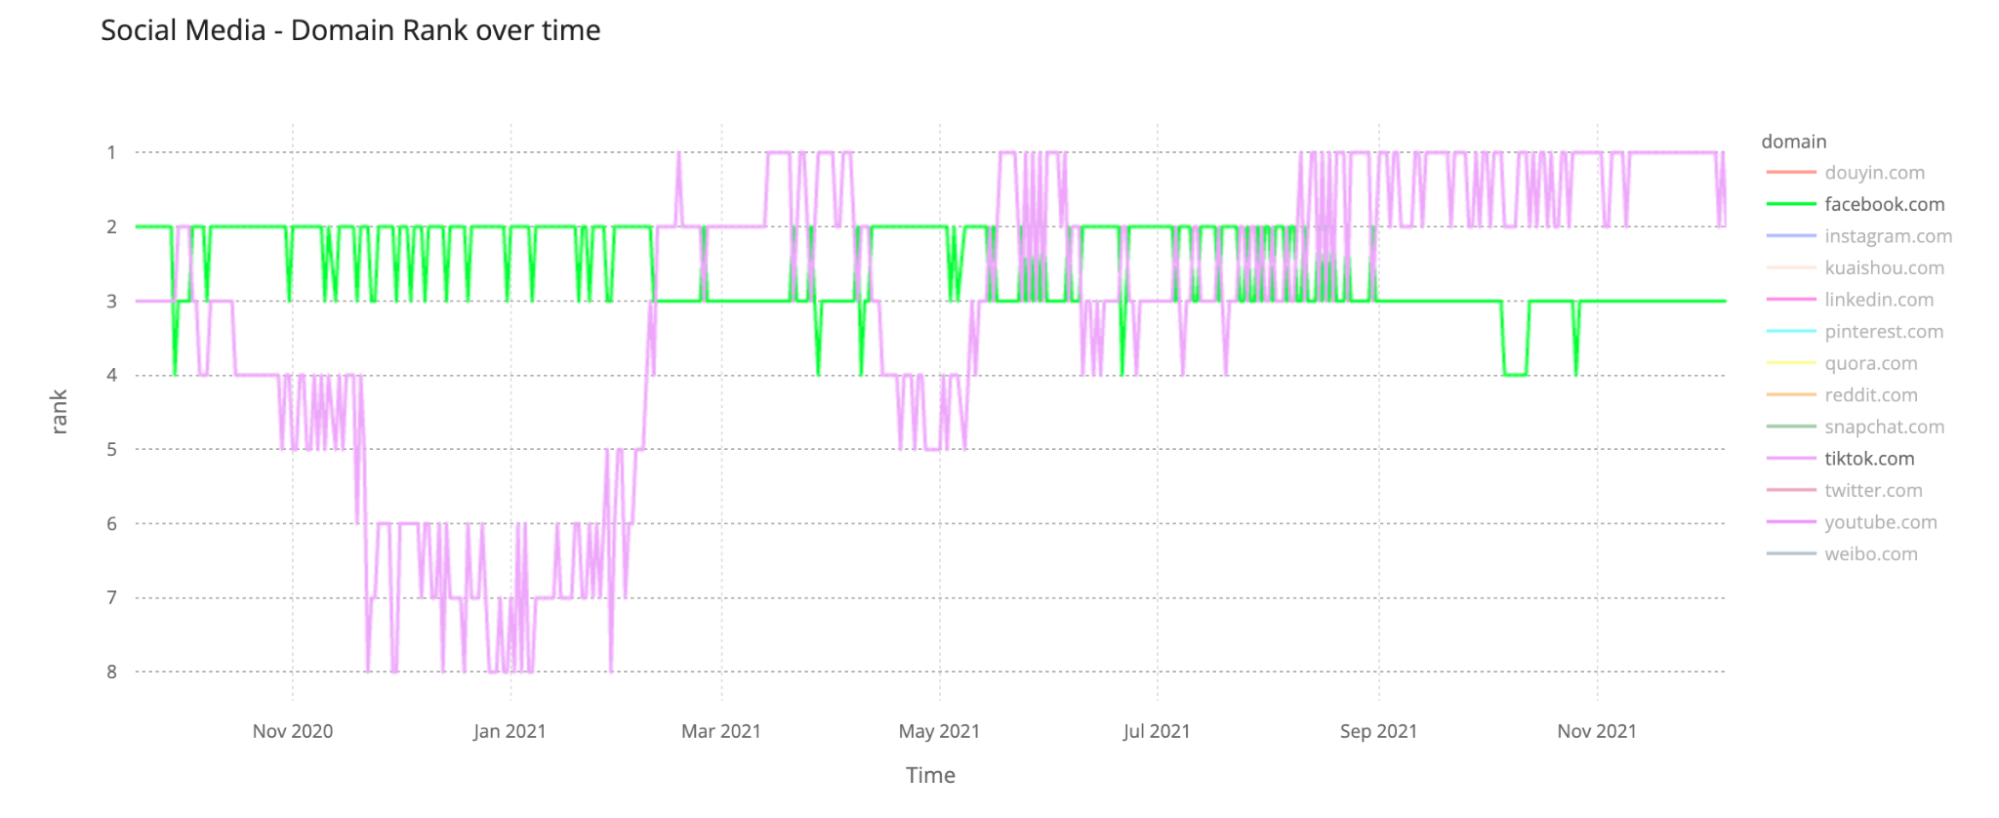
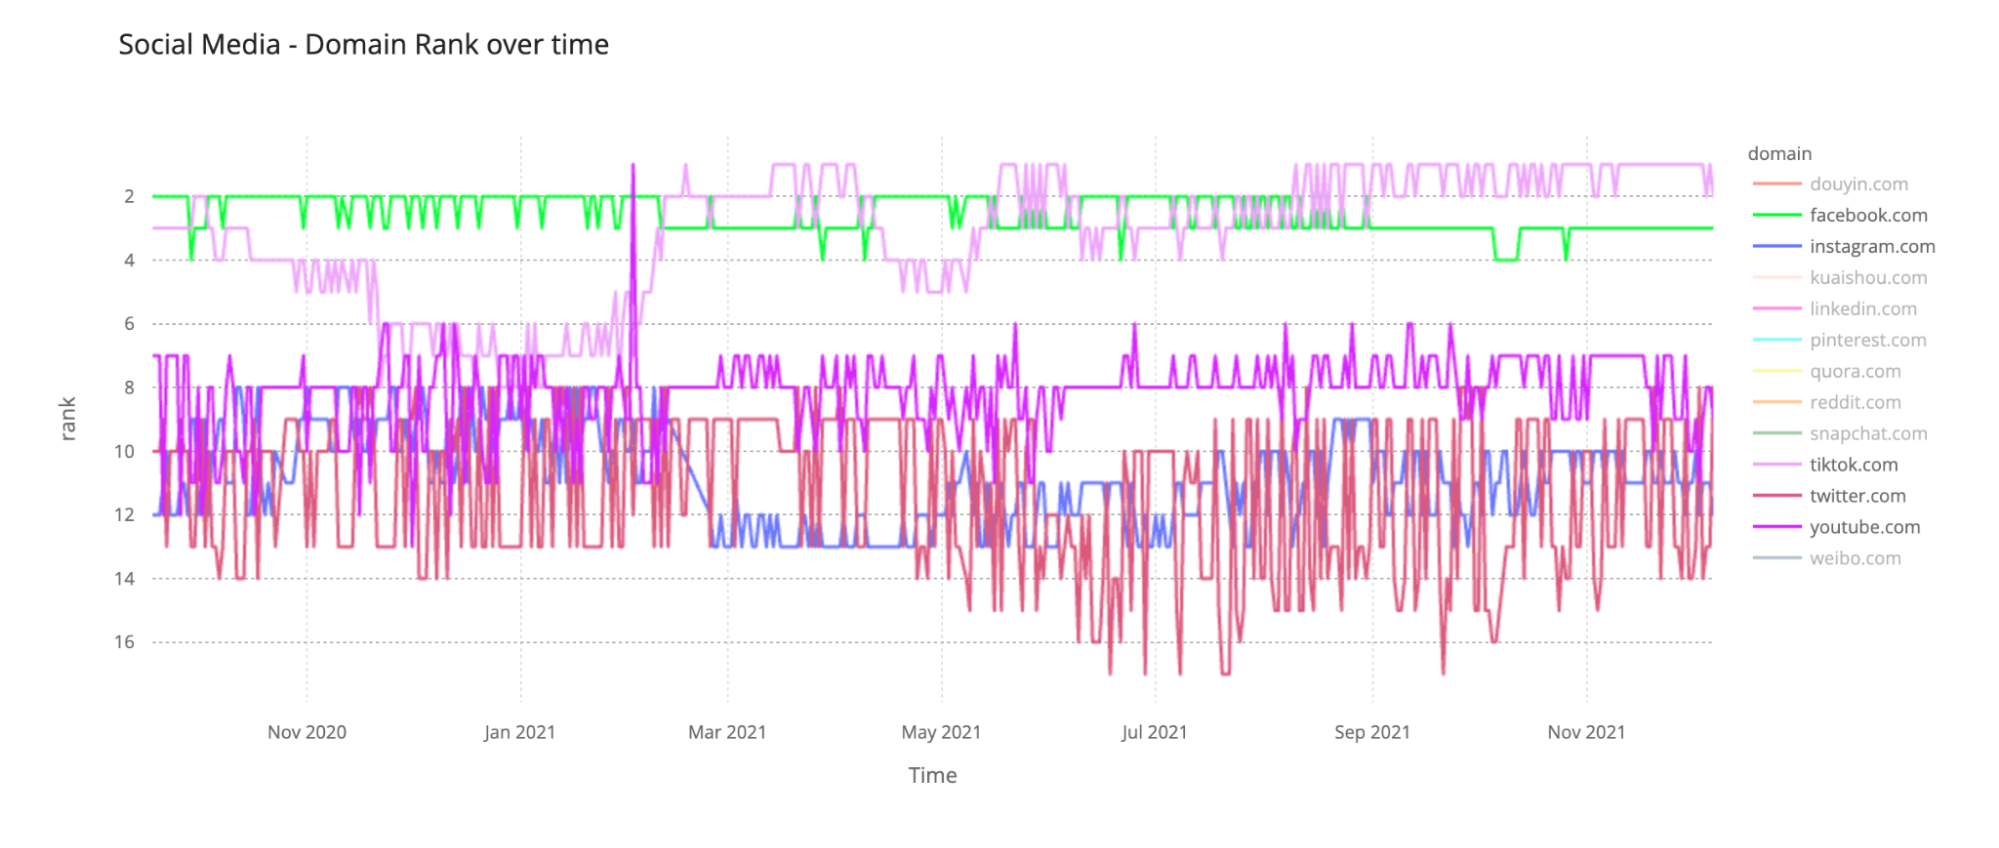
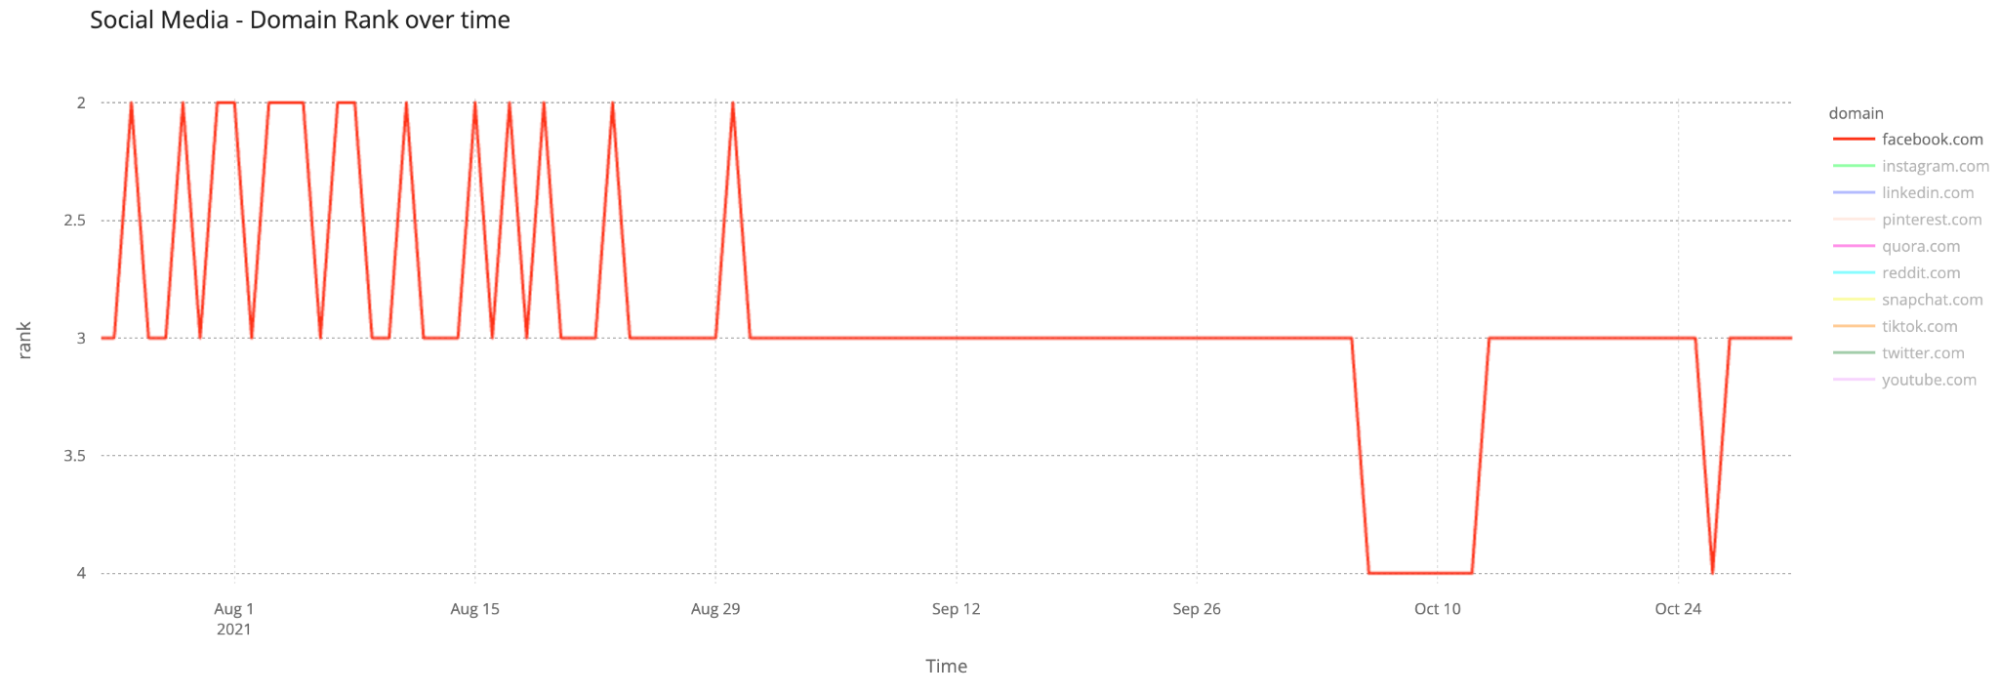
Much of the imagery and information coming out of Ukraine is being shared on social networks. Looking at social networks in Ukraine via DNS data shows that Facebook use has increased.
As has Instagram.
However, TikTok seems to have lost traffic initially, but it has started to return (although not to its pre-conflict levels) in the last two days.
Twitter usage increased and has remained higher than levels seen before the invasion.
Turning to messaging apps, we can compare Messenger, Signal, Telegram and WhatsApp. WhatsApp traffic appears to have declined inline with the broad change in Internet traffic across Ukraine.
Telegram stayed largely unchanged until early this week, when we observed a small increase in use.
Messenger shows a similar pattern.
But the largest change has been traffic to the end-to-end encrypted messaging app Signal, which has seen dramatic growth since the invasion began. We are seeing 8x to 10x the DNS volume for Signal as compared to the days before the start of the conflict.
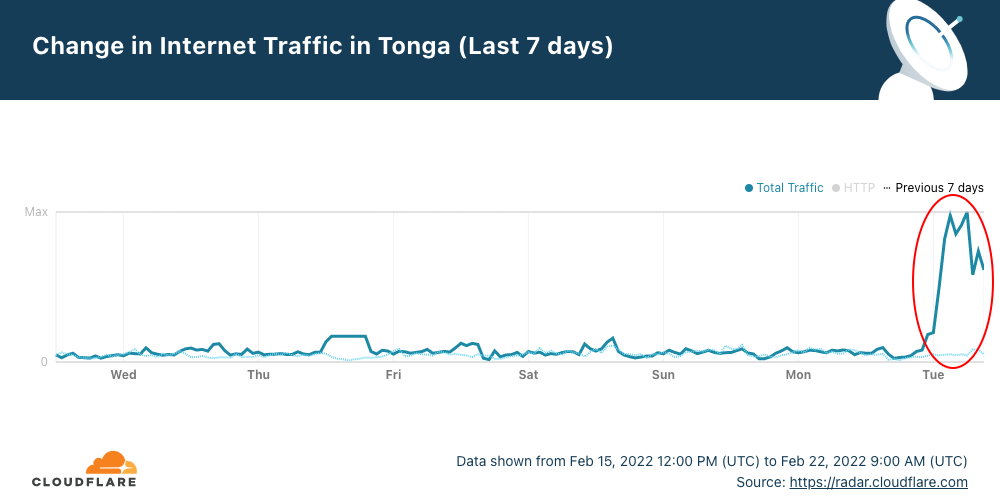
Tonga, the South Pacific archipelago nation (with 169 islands), was reconnected to the Internet this early morning (UTC) and is back online after successful repairs to the undersea cable that was damaged on Saturday, January 15, 2022, by the January 14, volcanic eruption.
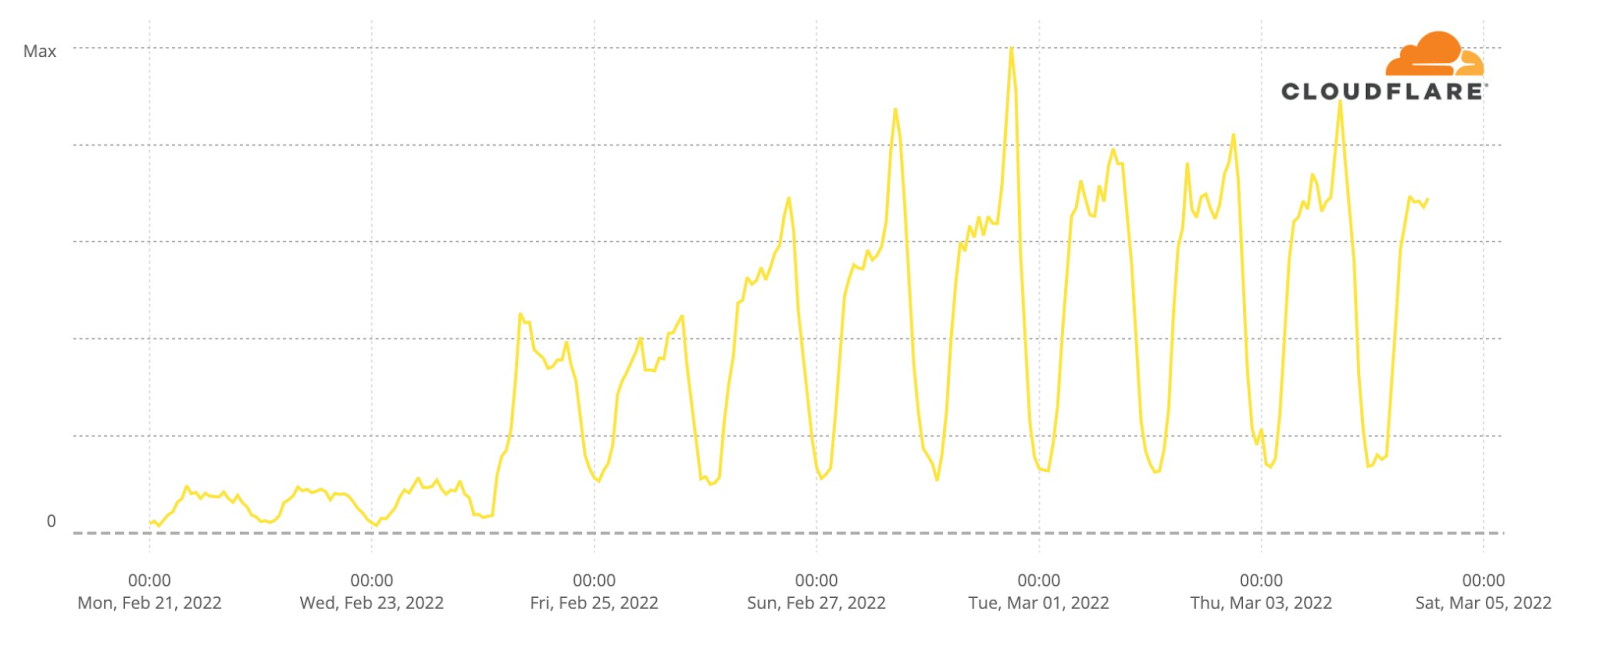
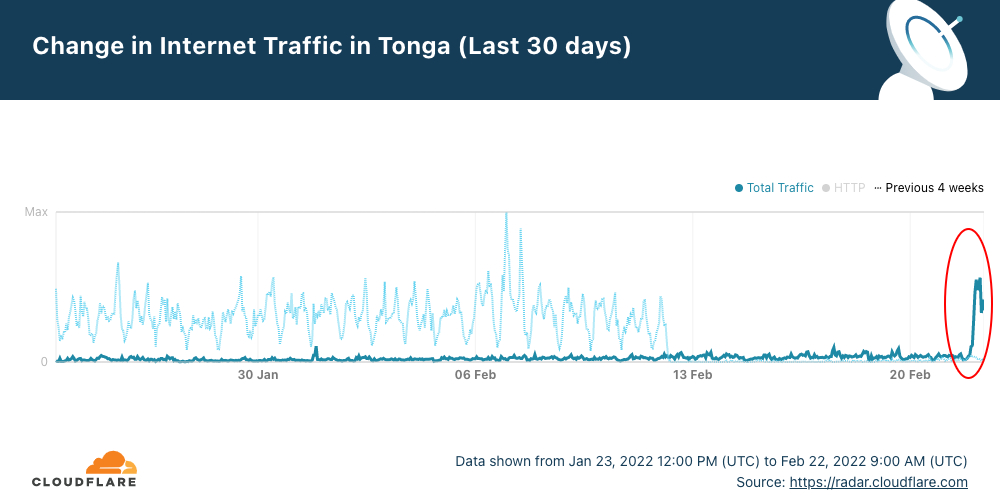
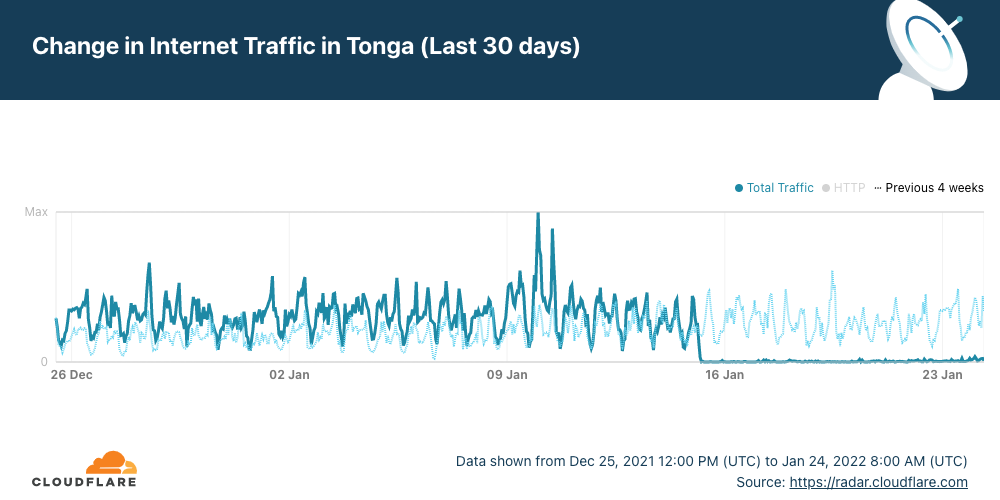
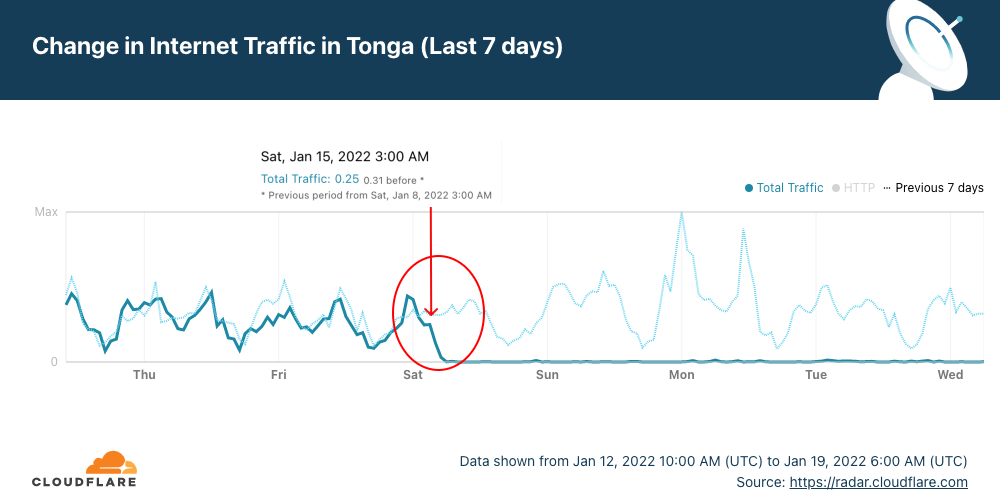
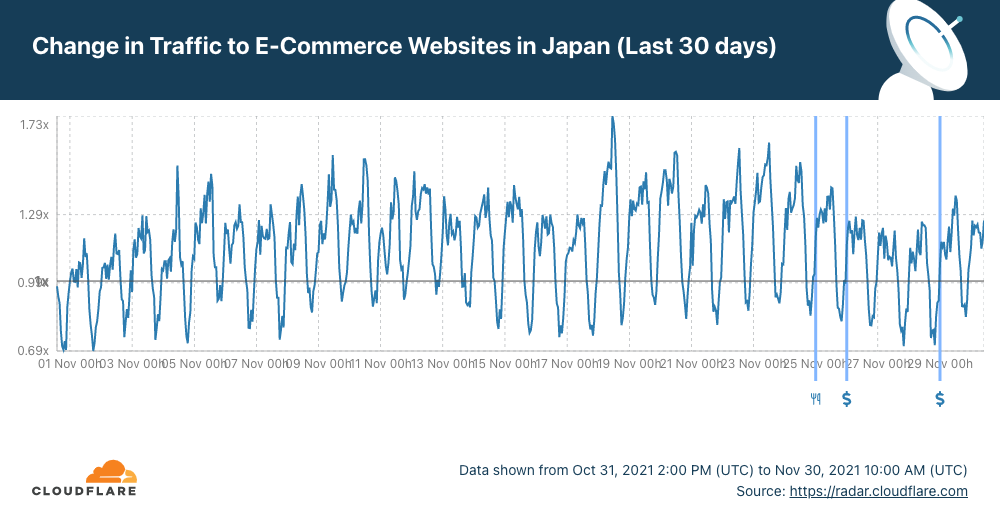
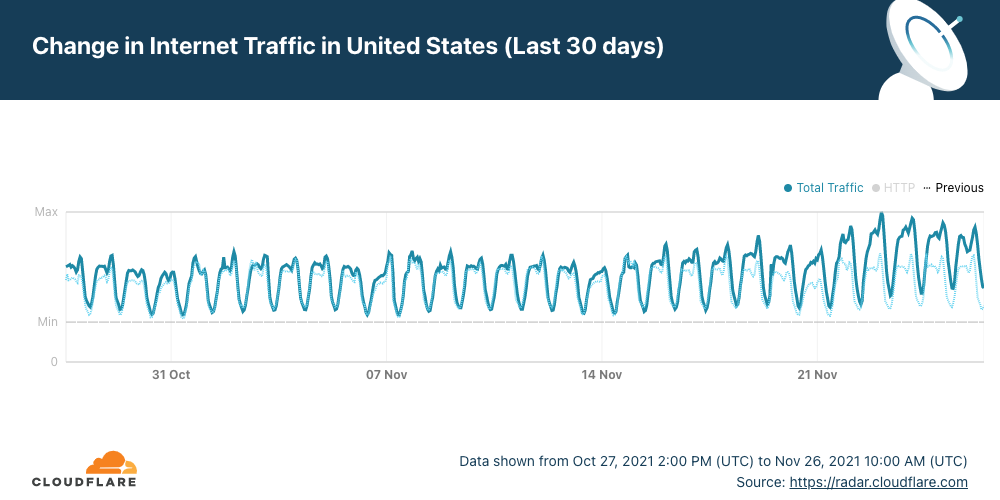
After 38 days without full access to the Internet, Cloudflare Radar shows that a little after midnight (UTC) — it was around 13:00 local time — on February 22, 2022, Internet traffic in Tonga started to increase to levels similar to those seen before the eruption.
The faded line shows what was normal in Tonga at the start of the year, and the dark blue line shows the evolution of traffic in the last 30 days. Digicel, Tonga’s main ISP announced at 02:13 UTC that “data connectivity has been restored on the main island Tongatapu and Eua after undersea submarine cable repairs”.
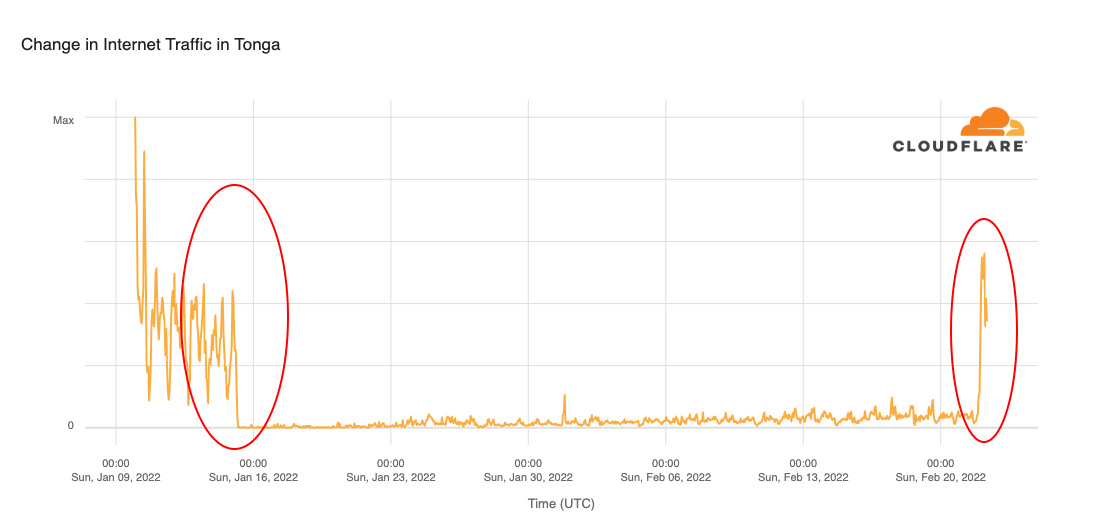
When we expand the view to the previous 45 days, we can see more clearly how Internet traffic evolved before the volcanic eruption and after the undersea cable was repaired.
The repair ship Reliance took 20 days to replace a 92 km (57 mile) section of the 827 km submarine fiber optical cable that connects Tonga to Fiji and international networks and had “multiple faults and breaks due to the volcanic eruption”, according to Digicel.
Tonga Cable chief executive James Panuve told Reuters that people on the main island “will have access almost immediately”, and that was what we saw on Radar with a large increase in traffic persisting.
The residual traffic we saw from Tonga a few days after January 15, 2022, comes from satellite services that were used with difficulty by some businesses.
James Panuve also highlighted that the undersea work is still being finished to repair the domestic cable connecting the main island of Tongatapu with outlying islands that were worst hit by the tsunami, which, he told Reuters, could take six to nine months more.
So, for some of the people who live on the 36 inhabited islands, normal use of the Internet could take a lot longer. Tonga has a population of around 105,000, 70% of whom reside on the main island, Tongatapu and around 5% (5,000) live on the nearby island of Eua (now also connected to the Internet).
Telecommunication companies in neighboring Pacific islands, particularly New Caledonia, provided lengths of cable when Tonga ran out, said Panuve.
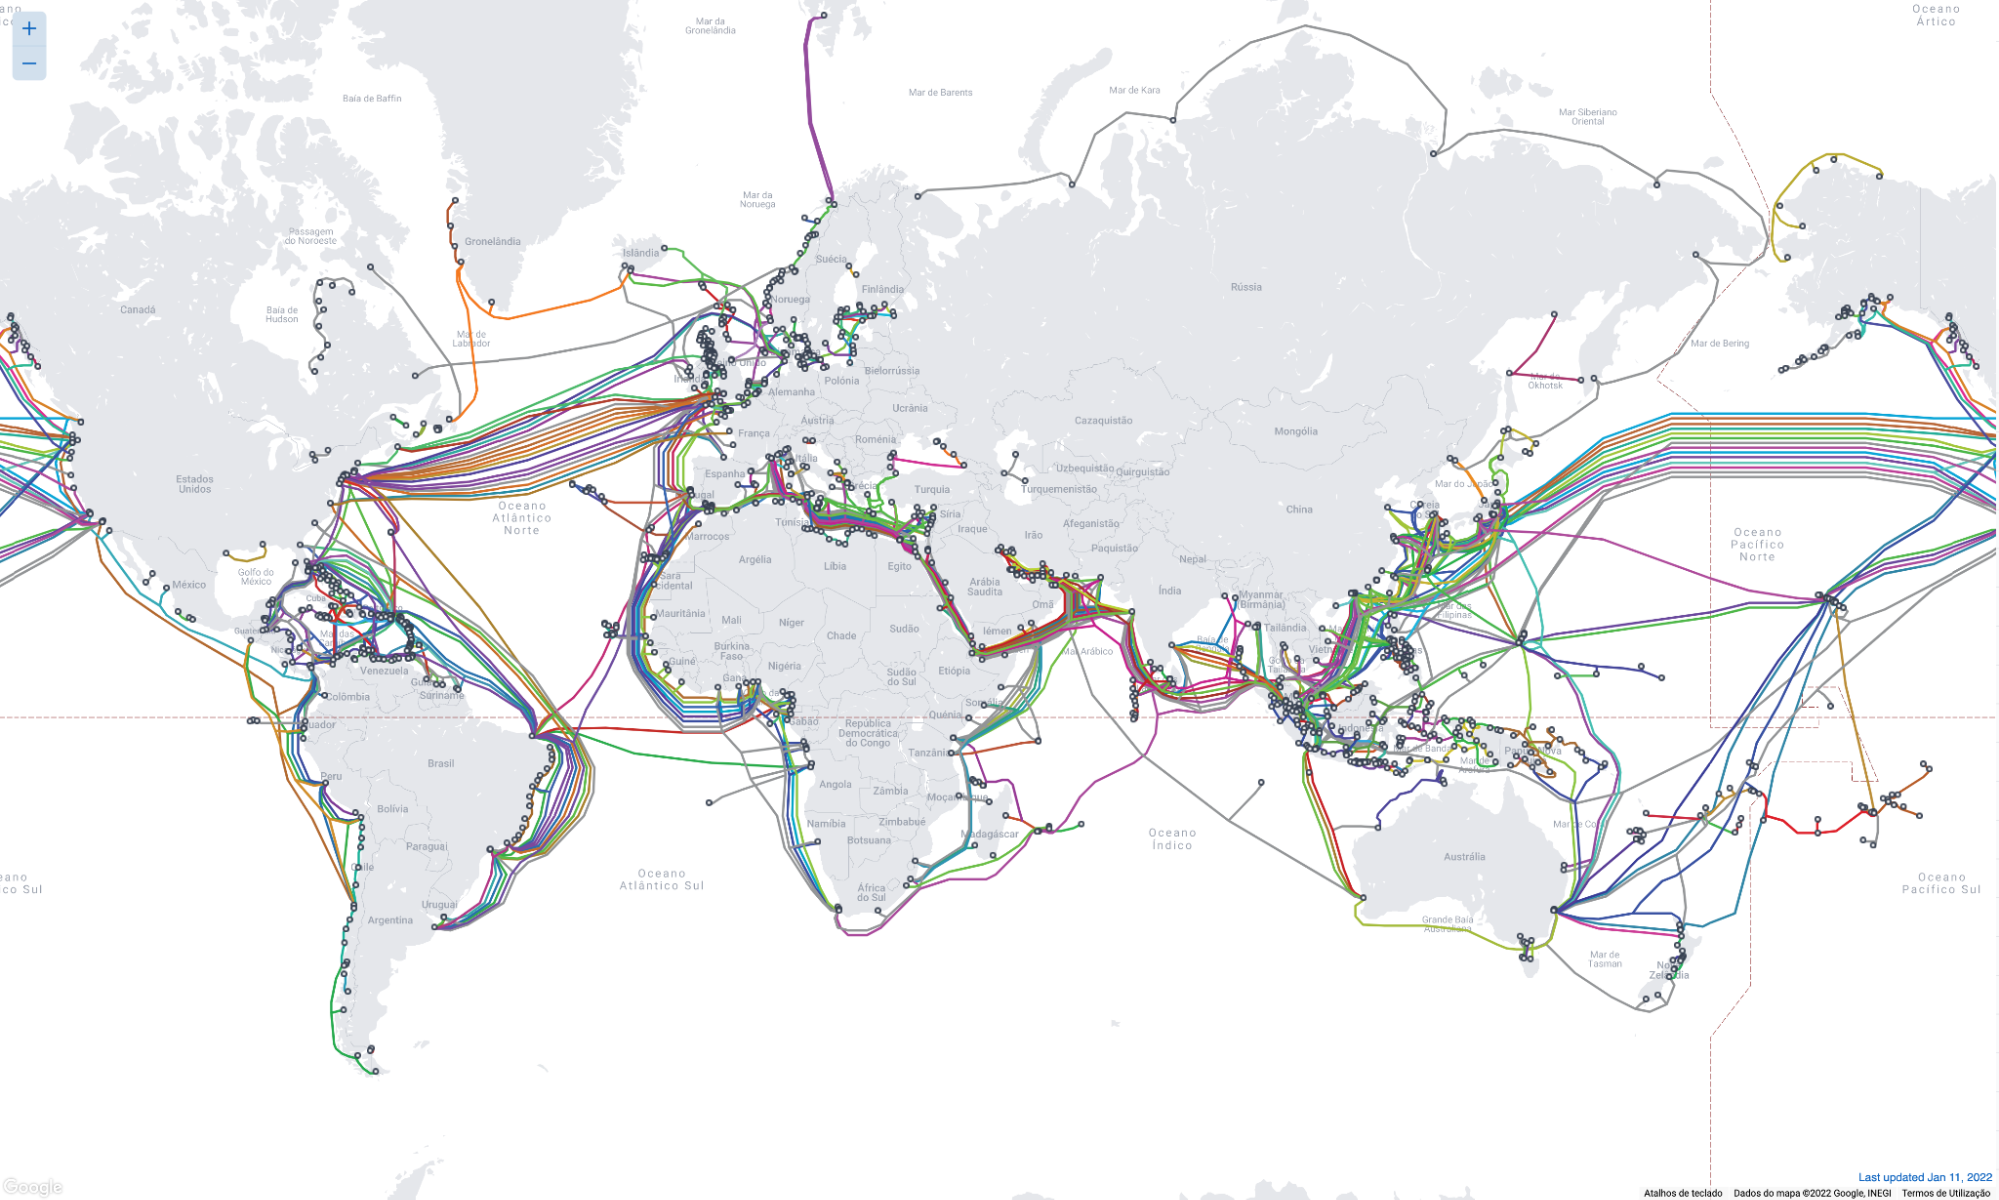
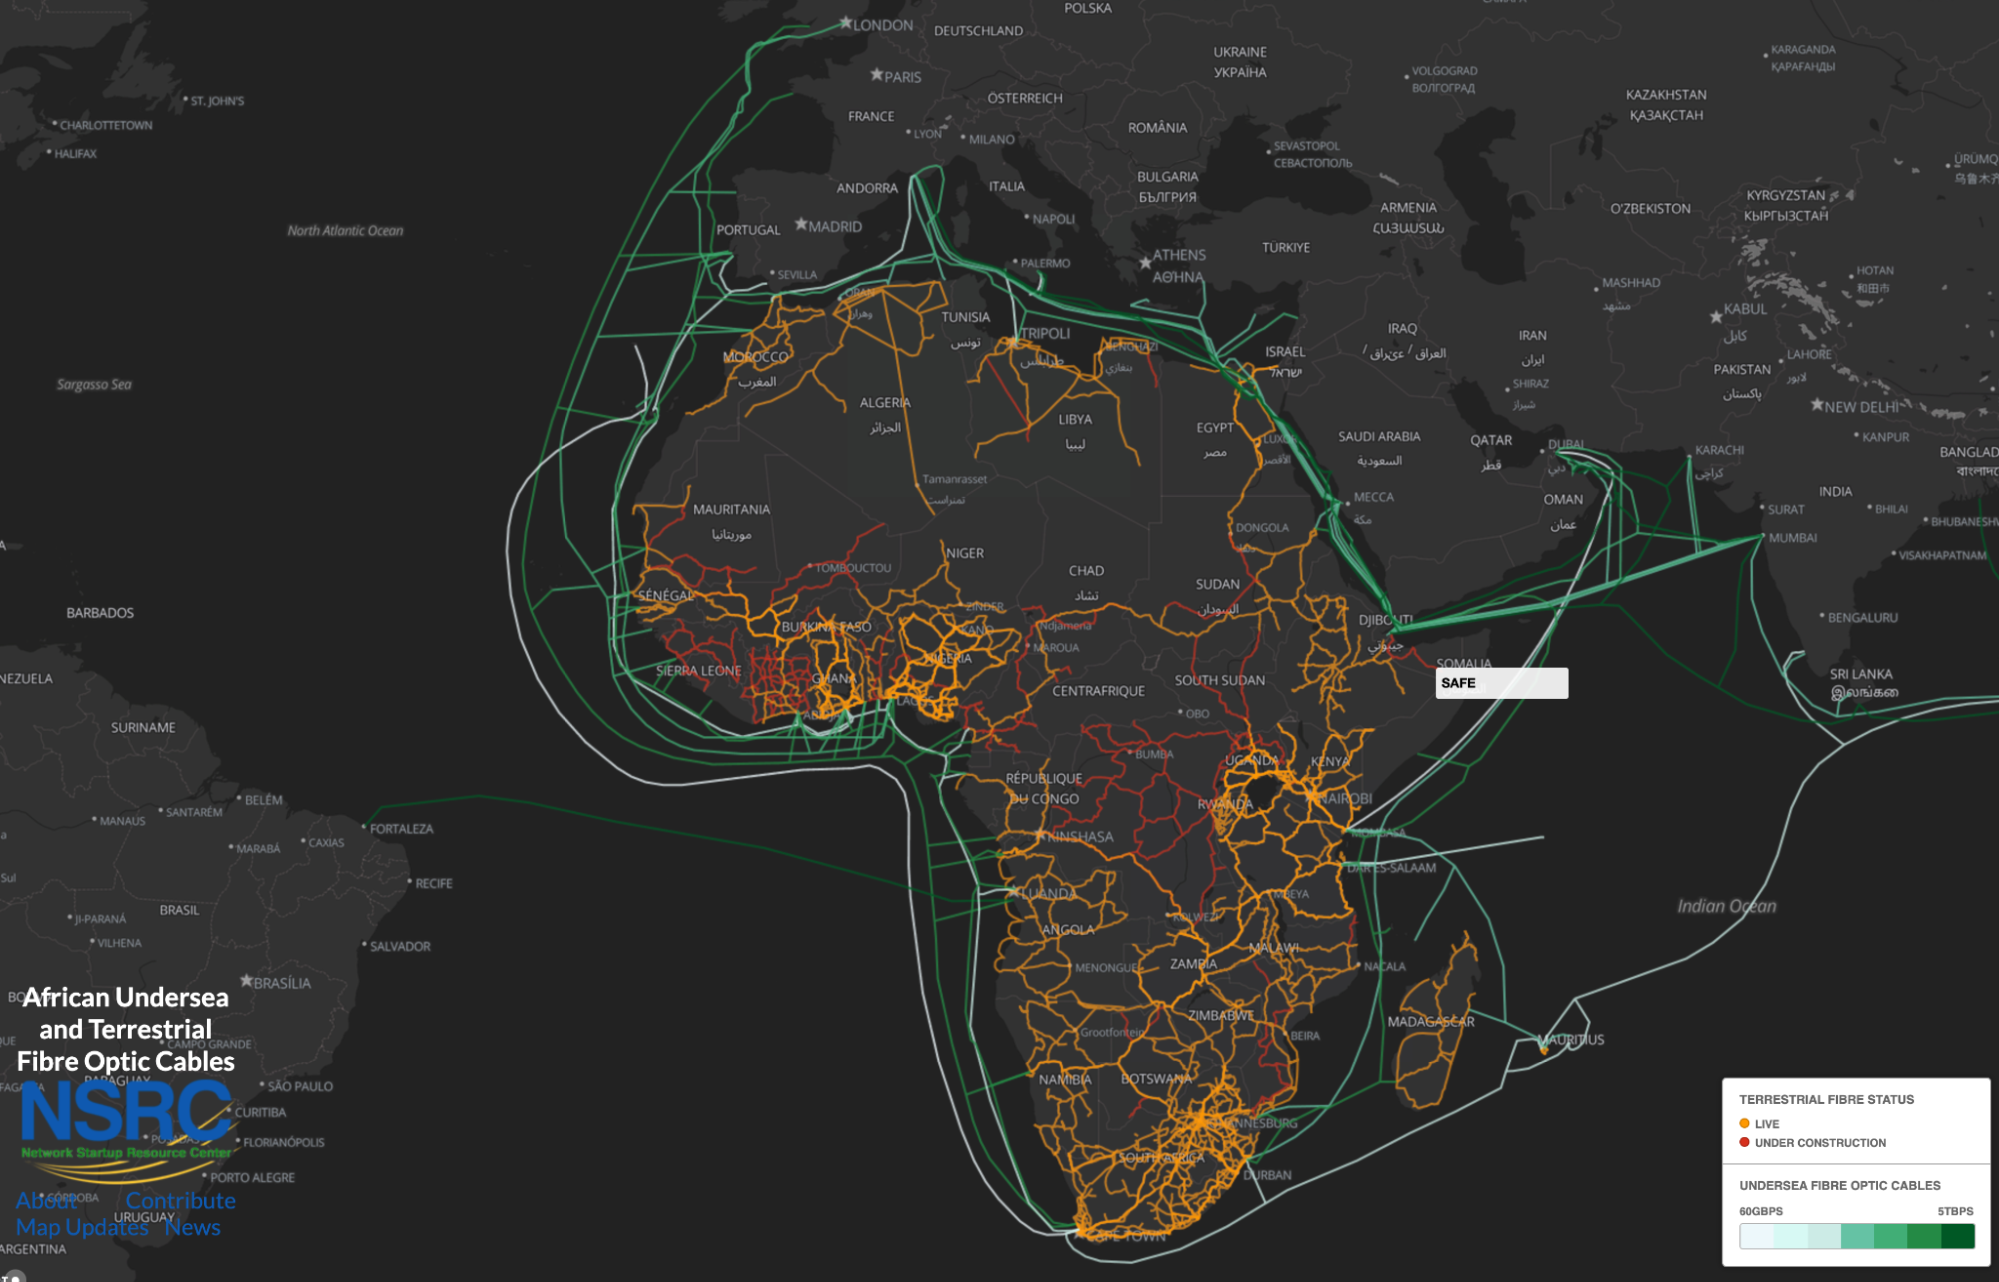
A world of undersea cables for the world’s communications
We have mentioned before, for example in our first blog post about the Tonga outage, how undersea cables are important to global Internet traffic that is mostly carried by a complex network that connects countries and continents.
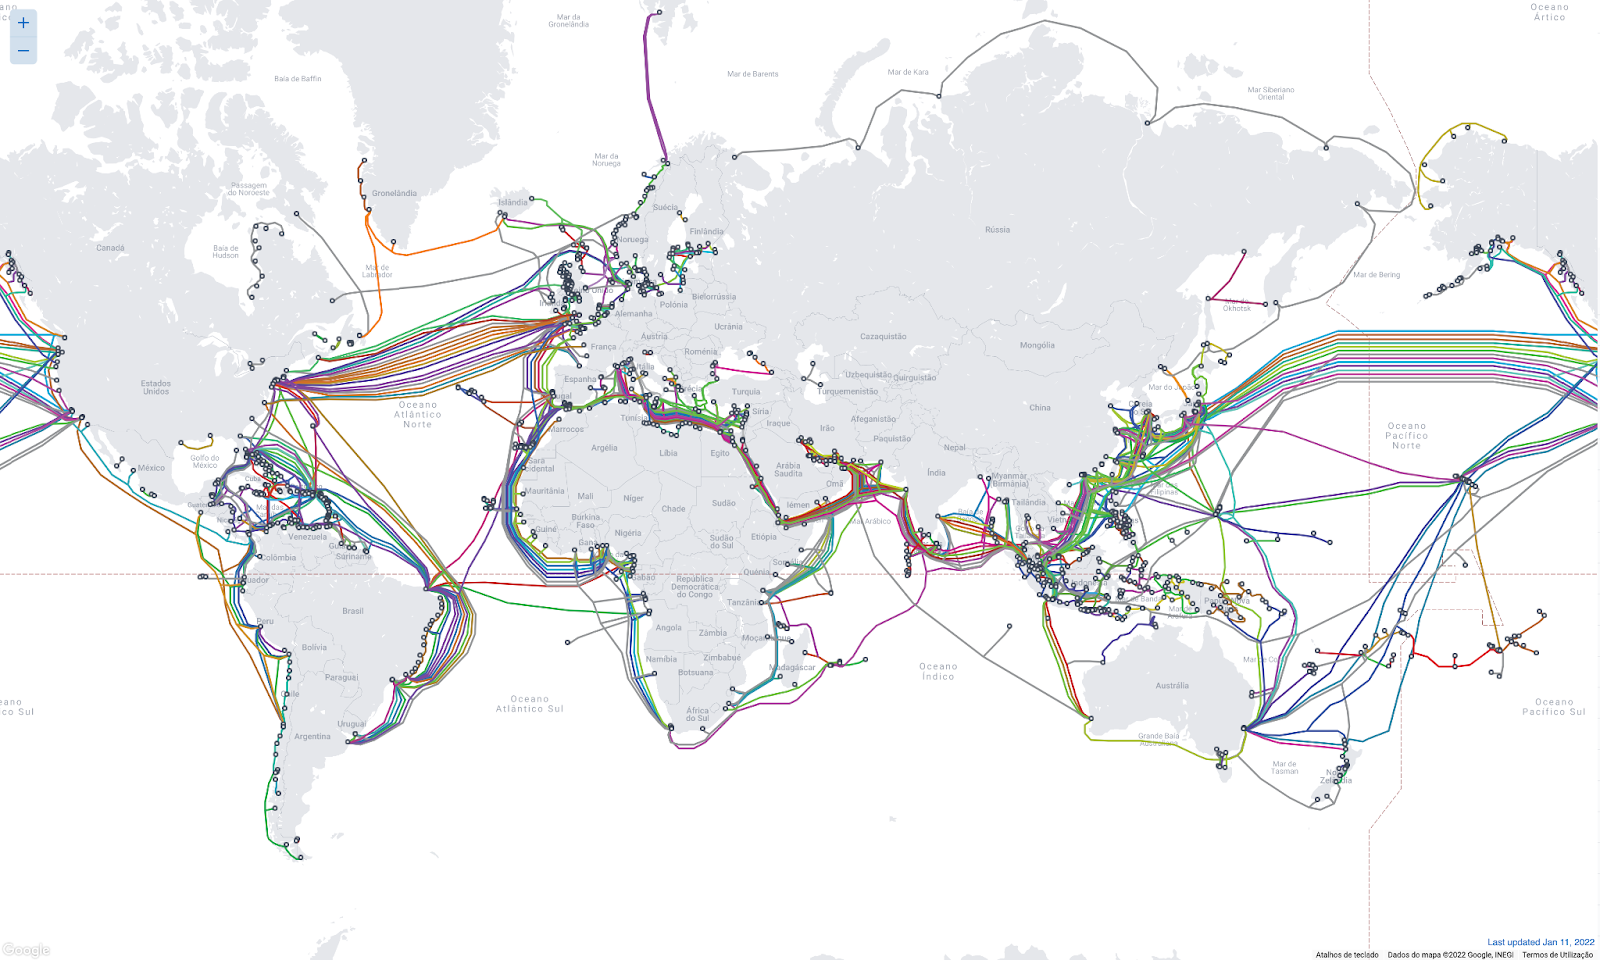
The full submarine cable system (the first communications cables laid were from the 1850s and carried telegraphy traffic) is what makes most of the world’s Internet function between countries and continents. There are 428 active submarine cables (36 are planned), running to an estimated 1.3 million km around the globe.
World map of submarine cables. Antartida is the only continent not yet reached by a submarine telecommunications cable. Source: TeleGeography (www.submarinecablemap.com
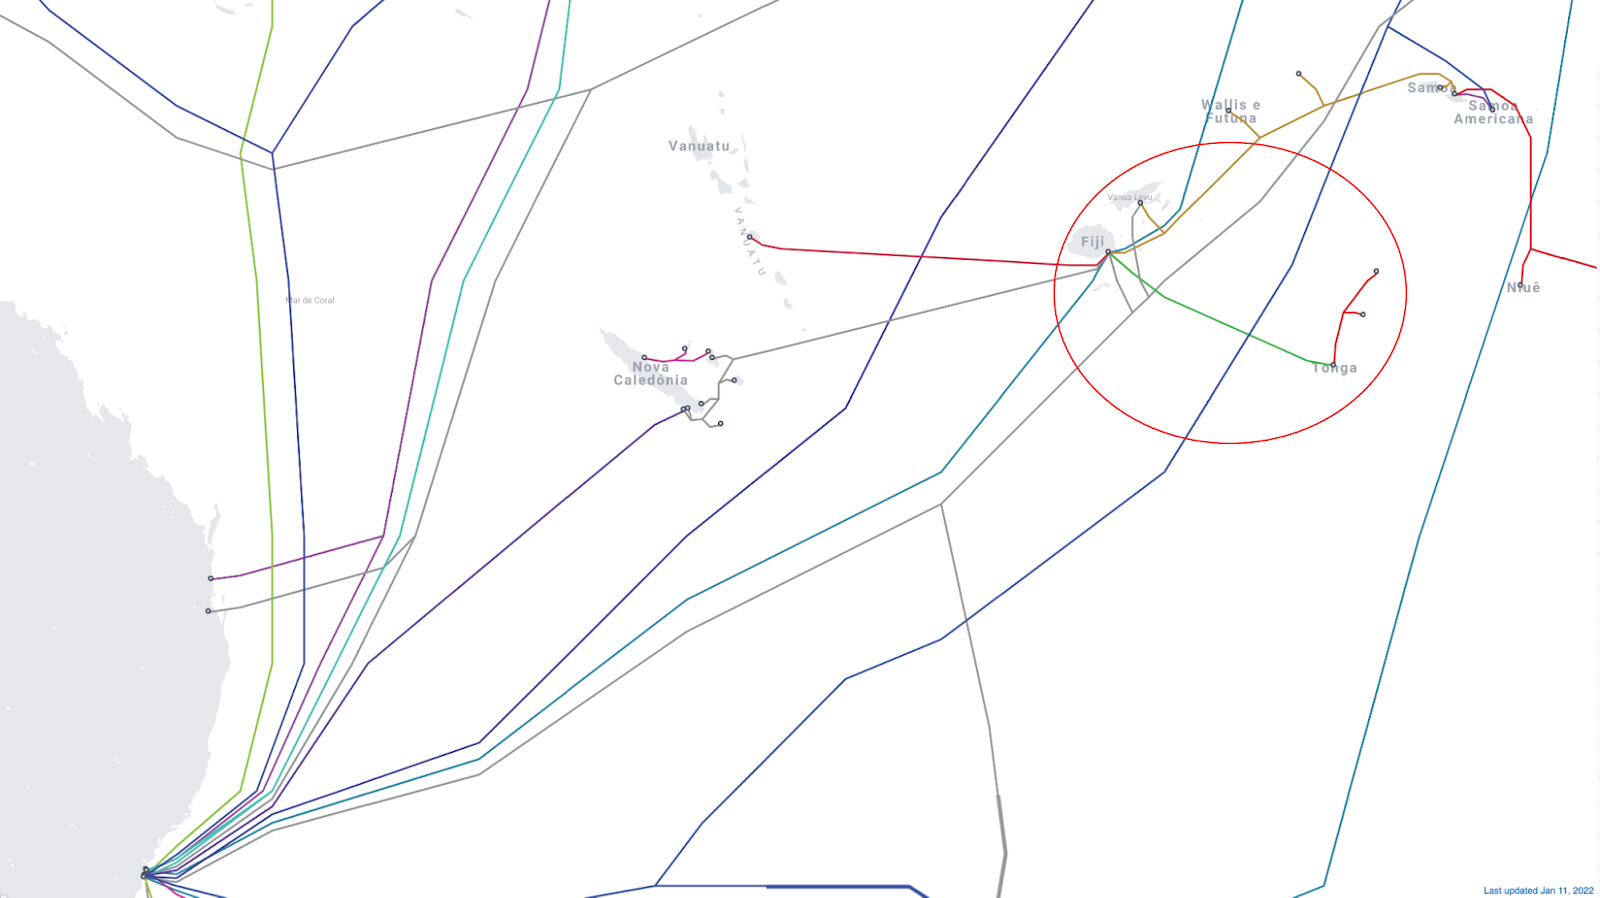
The reliability of submarine Internet is high, especially when multiple paths are available in the event of a cable break. That wasn’t the case for the Tonga outage, given that the 827 km submarine cable only connects Fiji to the Tonga archipelago — Fiji is connected to the main Southern Cross Cable, as the next image illustrates.
Submarine Cable Map shows the undersea cables that connect Australia to Fiji and the following connections to other archipelagos like Tonga. Source: TeleGeography (www.submarinecablemap.com)
In a recent conversation on a Cloudflare TV segment we discussed the importance of undersea cables with Tom Paseka, Network Strategist who is celebrating 10 years at Cloudflare and worked previously for undersea cable companies in Australia. Here’s a clip:
“It’s ridiculous for a country to get all worked up about a game—except the Super Bowl, of course. Now that’s important.” – Andy Rooney, American radio and television writer
When the Super Bowl is on, there are more winners than just one of the teams playing, especially when we look at Internet trends. By now, everyone knows that the Los Angeles Rams won, but we also want to look at which Super Bowl advertisers were the biggest winners, and how traffic to food delivery services, social media and messaging apps, and sports and betting websites changed throughout the game.
We covered some of these questions during our Super Bowl live-tweeting on our Cloudflare Radar account. (Hint: follow us if you’re interested in Internet trends).
Cloudflare Radar uses a variety of sources to provide aggregate information about Internet traffic and attack trends. In this blog post, as we did last year, we use DNS name resolution data to estimate traffic to websites. We can’t see who visited the websites mentioned, or what anyone did on the websites, but DNS can give us an estimate of the interest generated by the ads or across a set of sites in the categories listed above.
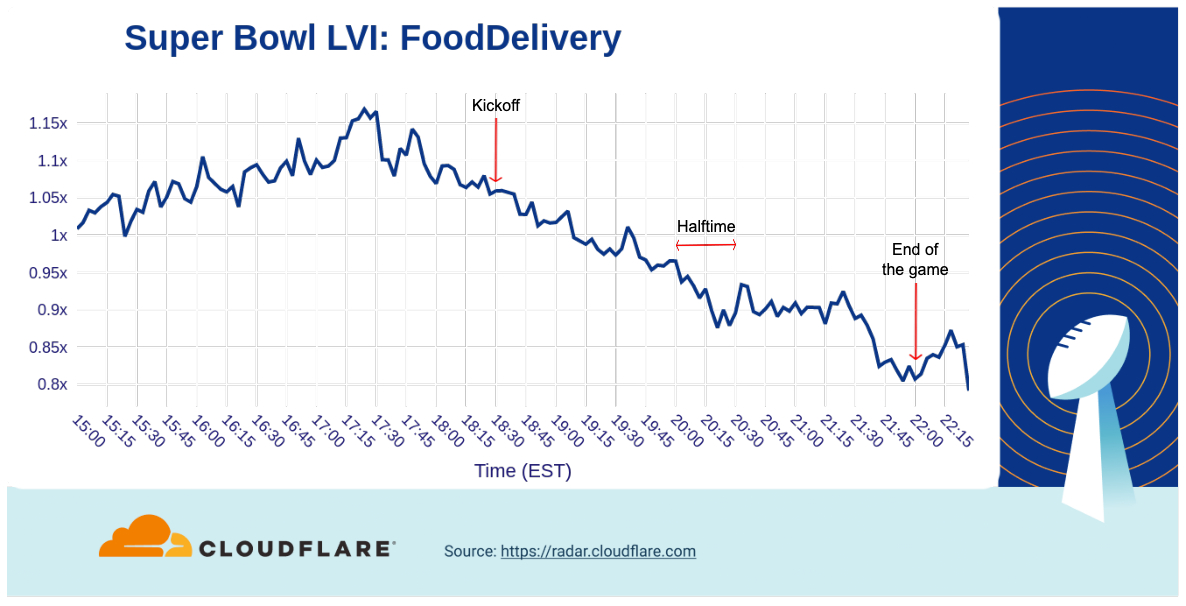
The baseline value for the charts was calculated by taking the mean traffic level for the associated websites during 12:00 – 15:00 EST on Super Bowl Sunday (February 13, 2022).
The Big Picture
Focusing on the two teams that made it to the big game and to get the ball rolling already, the Bengals website had some spikes before kickoff and during the second half, but the Rams website had a great run and just like on the field, had their biggest peak at the end.
The @Bengals website had some spikes before kickoff and during the second half but @RamsNFL had a great run and just like on the field, had their biggest peak at the end. Congratulations to the #Rams for winning the #SuperBowl. pic.twitter.com/YfJgv0RHXP
Super Bowl Sunday is not only about the ads – part of the excitement around watching the game with friends and family is having a great assortment of food and snacks. So, let’s start with the aggregated traffic to a set of food delivery services that clearly builds to a peak around 17:30, one hour before kickoff. After that, traffic generally decreases but increases slightly after the second half starts.
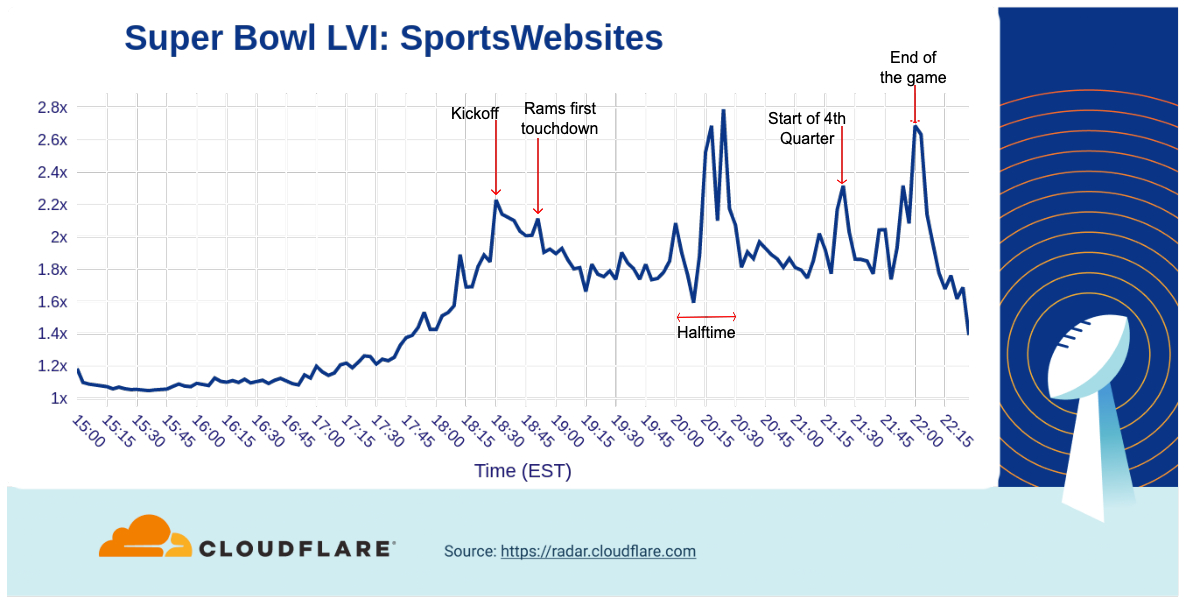
When we look at traffic to sports websites, there’s a build up to a peak as the game began at 18:30.
As the game progressed, traffic dropped off, but spiked three times during halftime (between 20:00 and 20:30). After the Rams victory was assured, traffic to those websites saw a final peak.
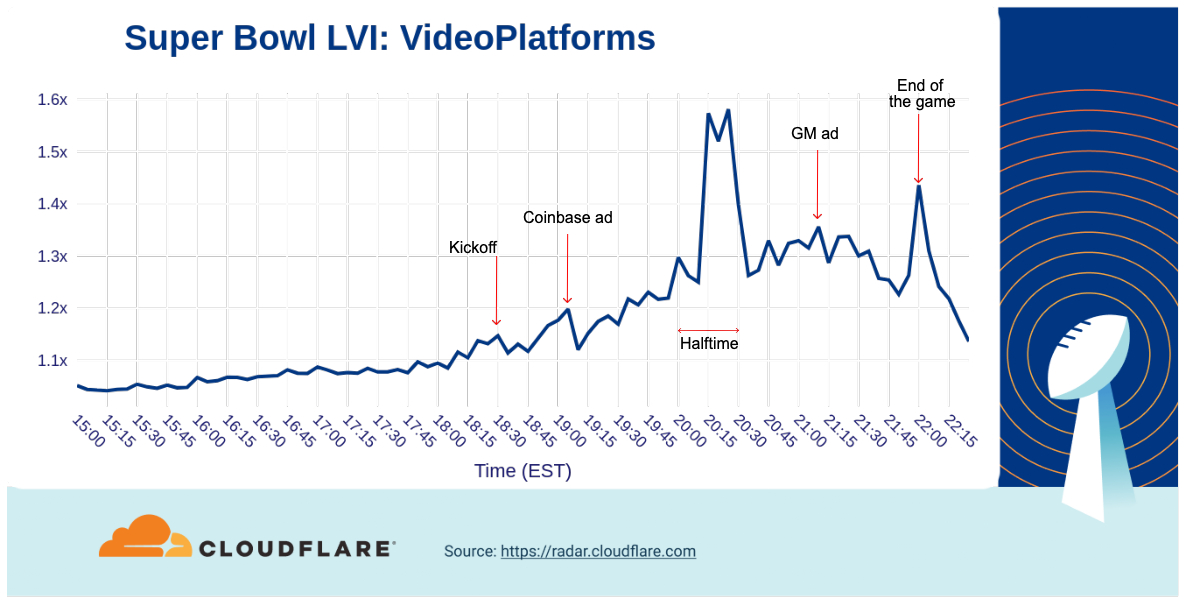
We can also see below that aggregated traffic to video platforms had a pattern similar to sports websites, with two peaks at halftime and a third notable one at the end of the game. After kickoff (18:30) the first peak occurred around the same time Coinbase’s bouncing QR code commercial aired.
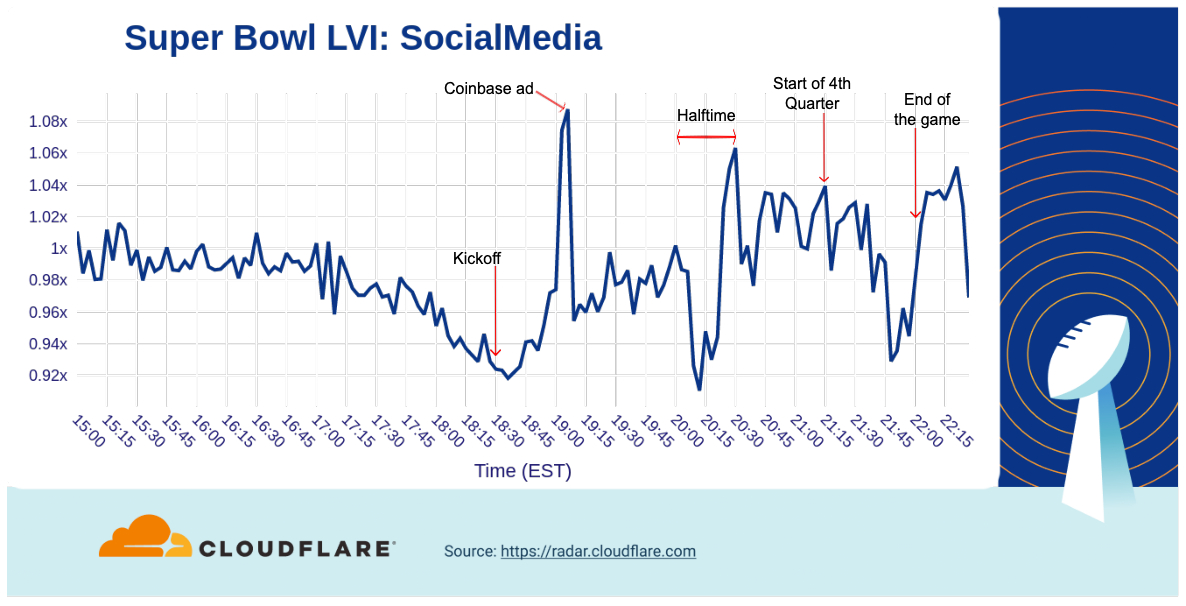
How about social media? Aggregate traffic to social media sites started to decrease after 17:00, hitting its lowest point just before kickoff.
During the game, there was a clear spike (the biggest of the afternoon/evening) after the Coinbase QR code ad aired. At halftime, social media traffic dropped off before peaking again right before the second half started. A final peak occurred after the game ended.
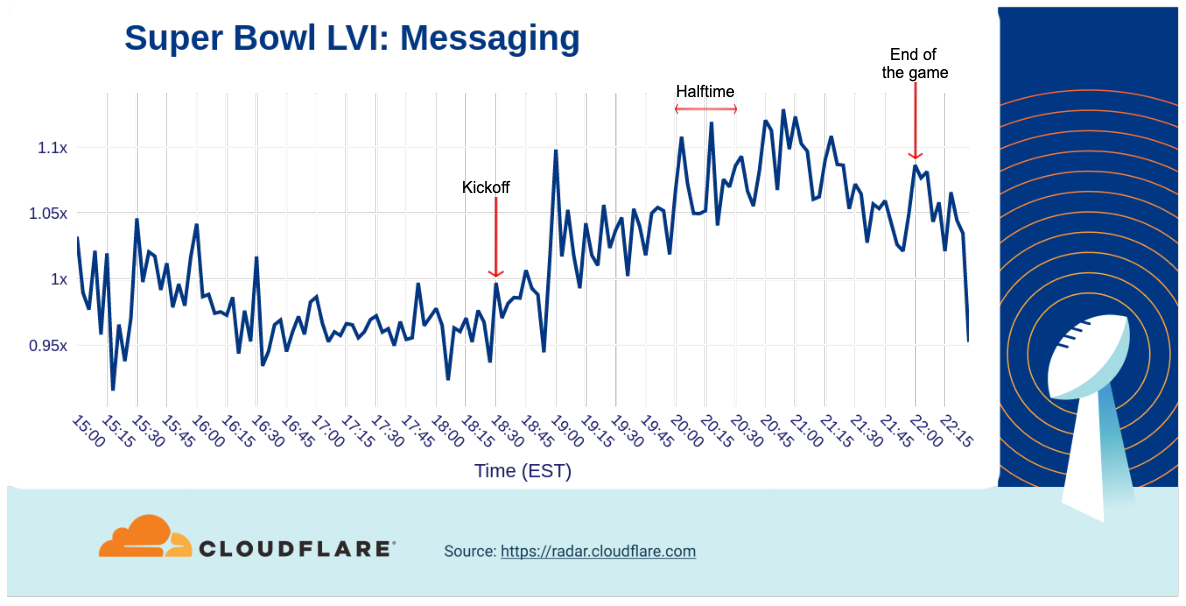
Finally, let’s look at messaging services. Among this set of domains, there wasn’t as much of a decrease as we saw in social media heading into kickoff, but there was a spike around 19:00 after the second batch of commercials was aired. Traffic continued to grow through halftime and into the third quarter before starting to drop heading towards the end of the game. Similar to several of the other categories above, messaging traffic again rose after the end of the game.
The Internet Impact of Commercials
Historically, many people have watched the Super Bowl as much for the ads as the actual football game. (Maybe even more so some years…) Many of the advertisements are now posted online ahead of Super Bowl Sunday. Given that, do these commercials still drive traffic to the company’s web site while the game is on?” As we saw in 2021, the answer remains a resounding yes.
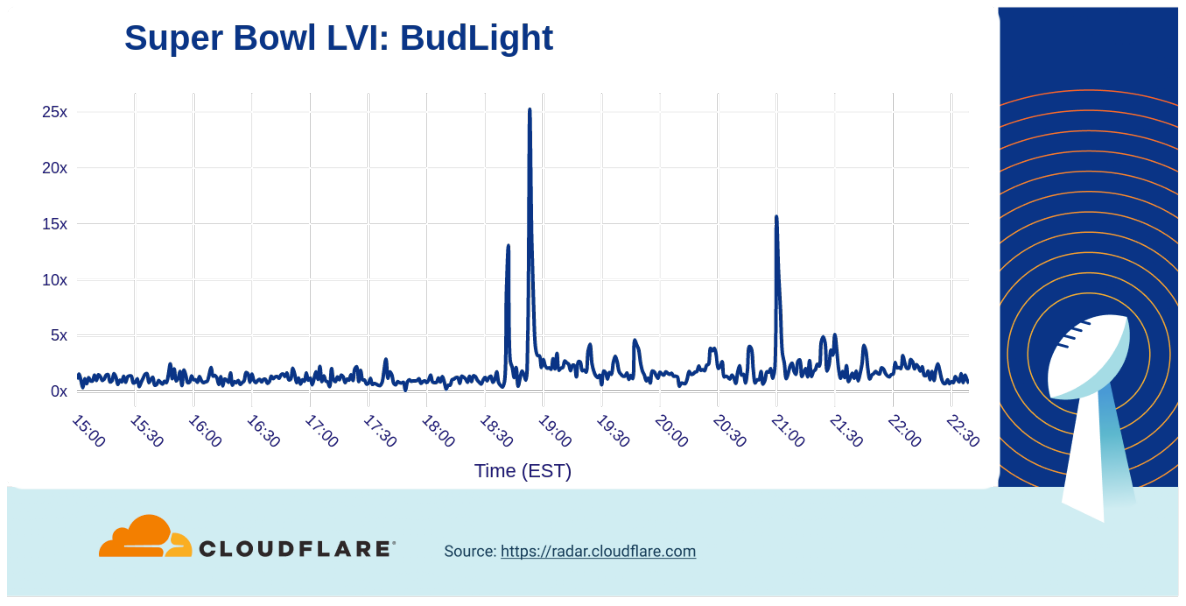
The first Bud Light ad during the game (at 18:52) drove a more than 25x increase to their site, and the Bud Light Seltzer Hard Soda ad with Guy Fieri at 21:00 drove a second peak in traffic, with a 15x increase over baseline.
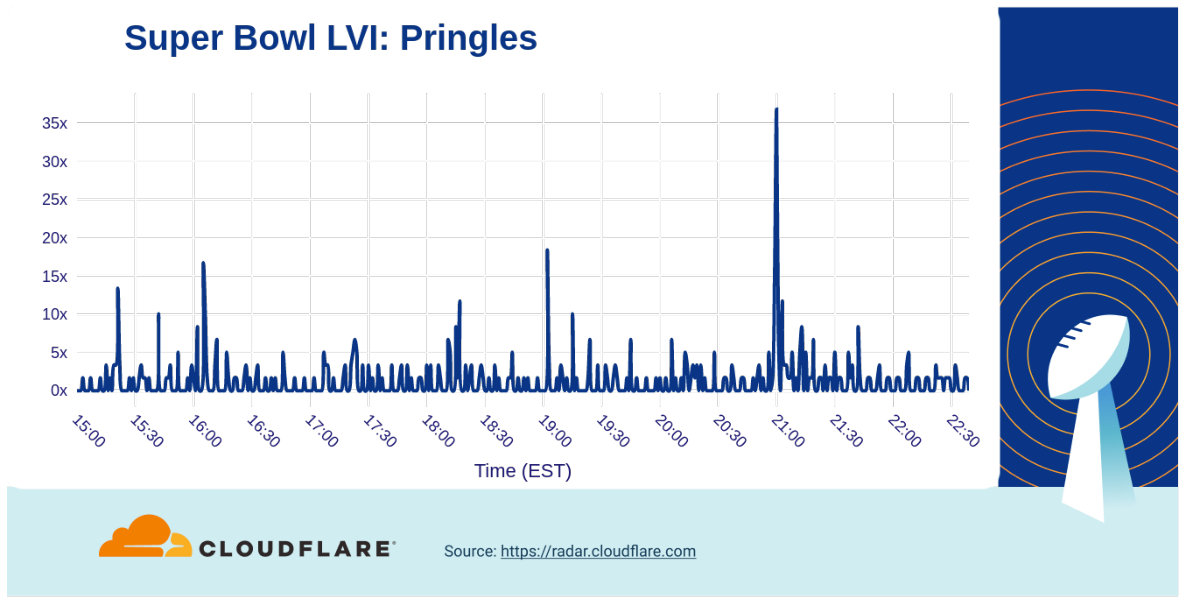
The Pringles commercial (at 21:00), where a hand stuck in a Pringles can really stuck with viewers, resulted in a greater than 35x increase. On the other hand, Lays got a 30x bump in traffic from their wedding memories ad at 20:53.
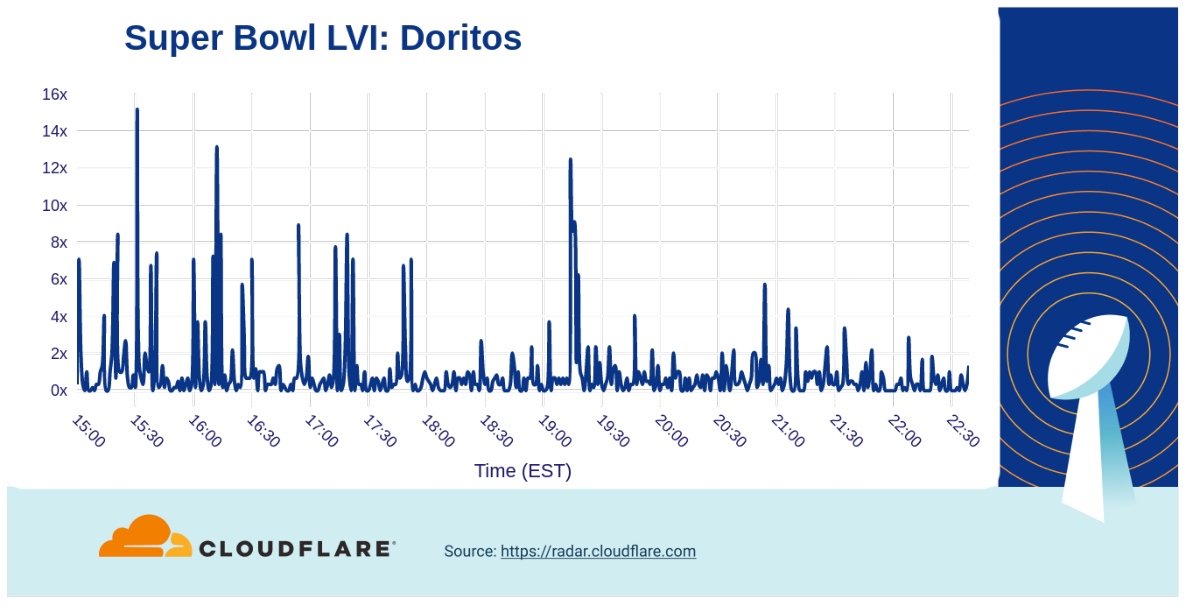
The Doritos website had already experienced some spikes throughout the afternoon, but jungle animals singing the Salt-N-Pepa hit ‘Push It’ (19:13) drove a more than 12x increase in traffic. However, last year’s ad with a flat virtual Matthew McConaughey seemed to have more impact.
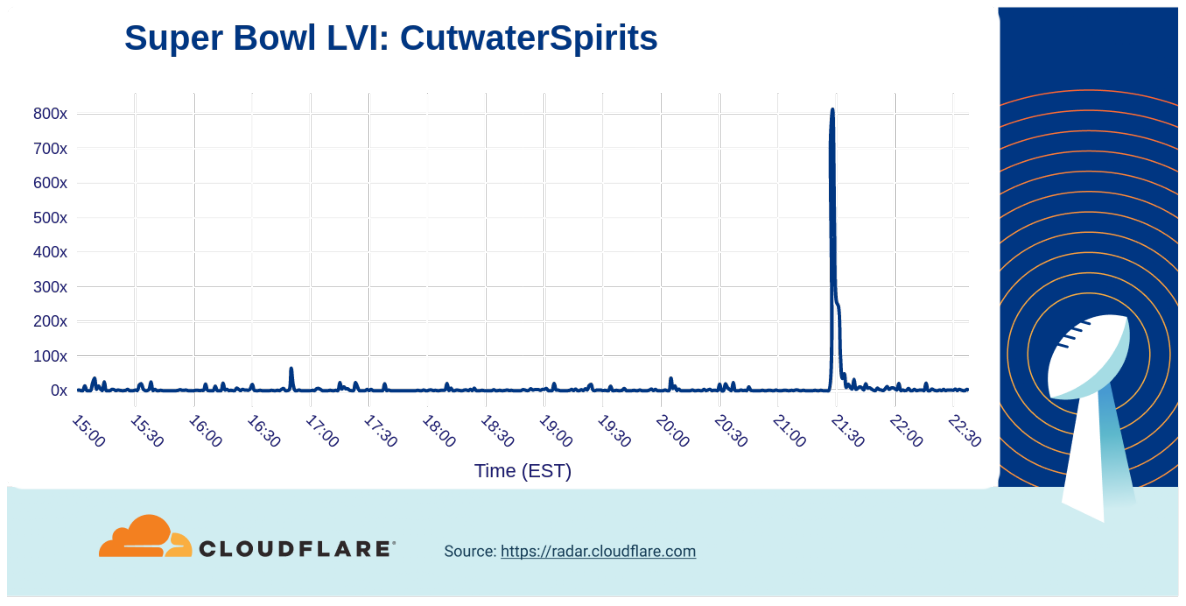
Brands that might not be so well known often get a large traffic boost from their Super Bowl commercials. For example, the cocktail company Cutwater Spirits “here’s to the lazy ones” ad, their first at the Super Bowl, resulted in an 800x increase in traffic. (The Michelob Ultra bowling ad with Peyton Manning drive a similar increase in traffic.:
Financial services: the QR code
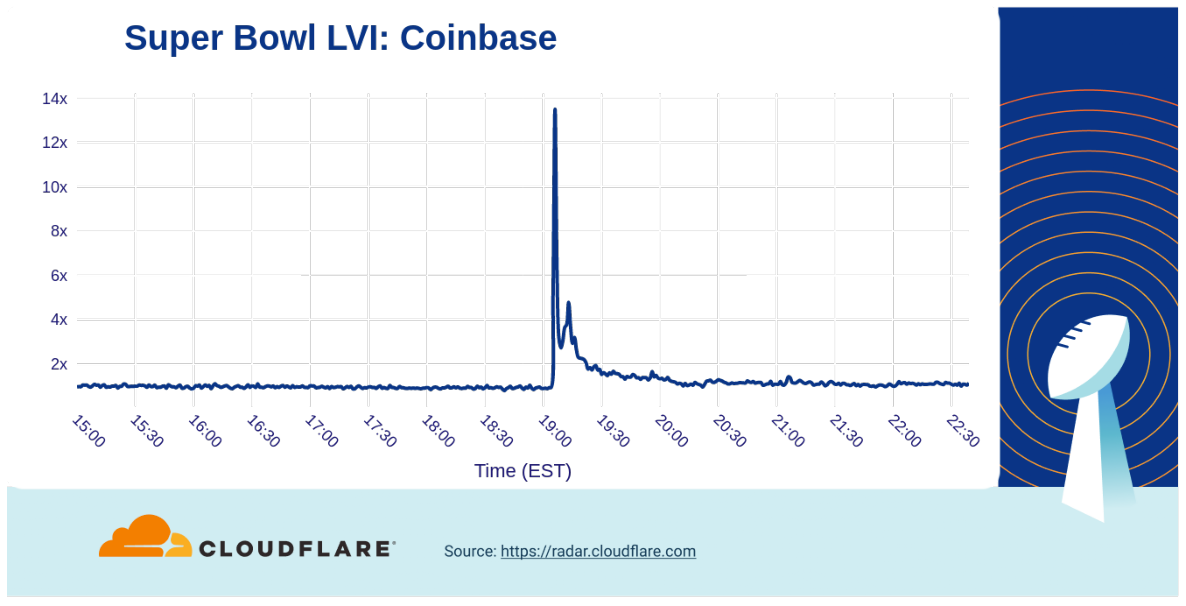
We already saw that the Coinbase ad seems to have made social media tick up after its ad aired, but what about traffic to them? The ad drove a 14x increase in traffic. (However, it is worth noting that scanning the QR code in the advertisement took viewers to drops.coinbase.com – this specific hostname is not included in the traffic analyzed for this graph.)
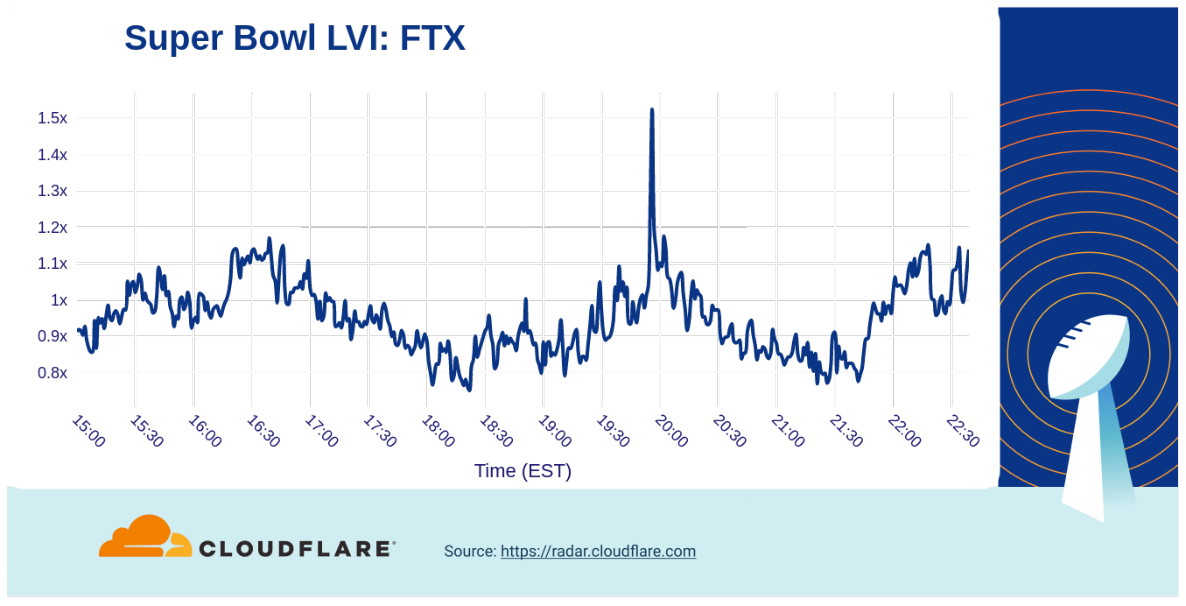
In comparison, the Crypto.com ad featuring LeBron James having a conversation with his 2003 self generated a 3x increase in traffic to their website, while the FTX ad where Larry David gives bad advice through human history only resulted in 1.5x traffic growth.
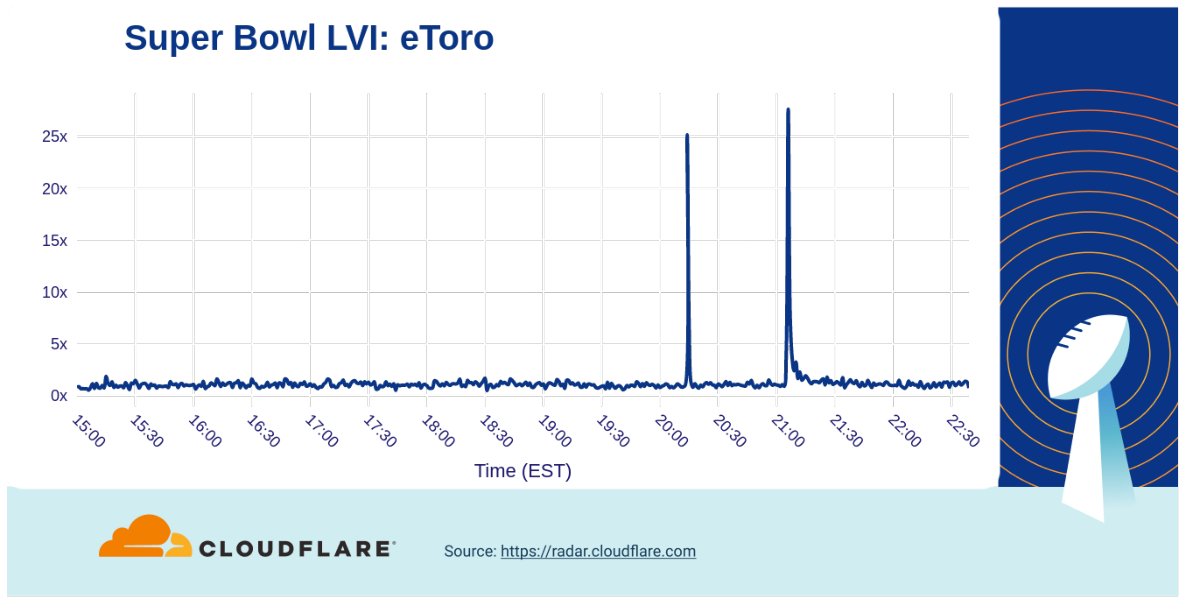
On the other hand, the eToro “to the moon” ad that ran during the second half of the game drove a 25x increase in traffic (at halftime there was another 20x bump).
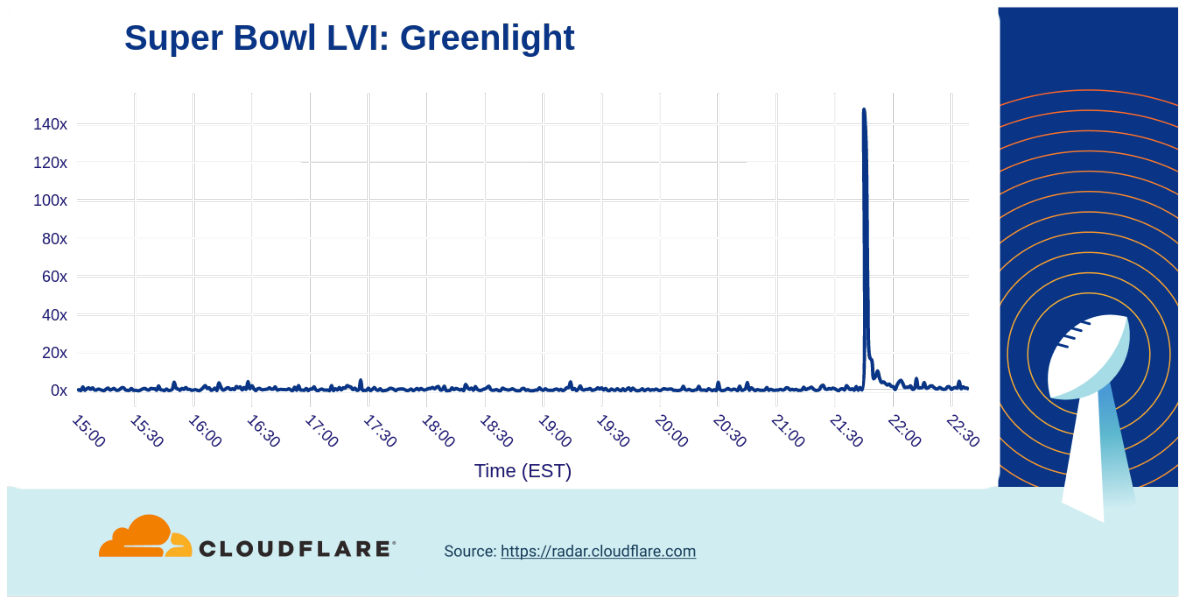
In the classic financial services world, there was another kid on the block that experienced a much bigger bump (140x) in traffic growth. The Greenlight ad featuring Modern Family’s Phil Dunphy’s (Ty Burrell) purchasing habits aired late in the game, (21:45) but clearly made an impact.
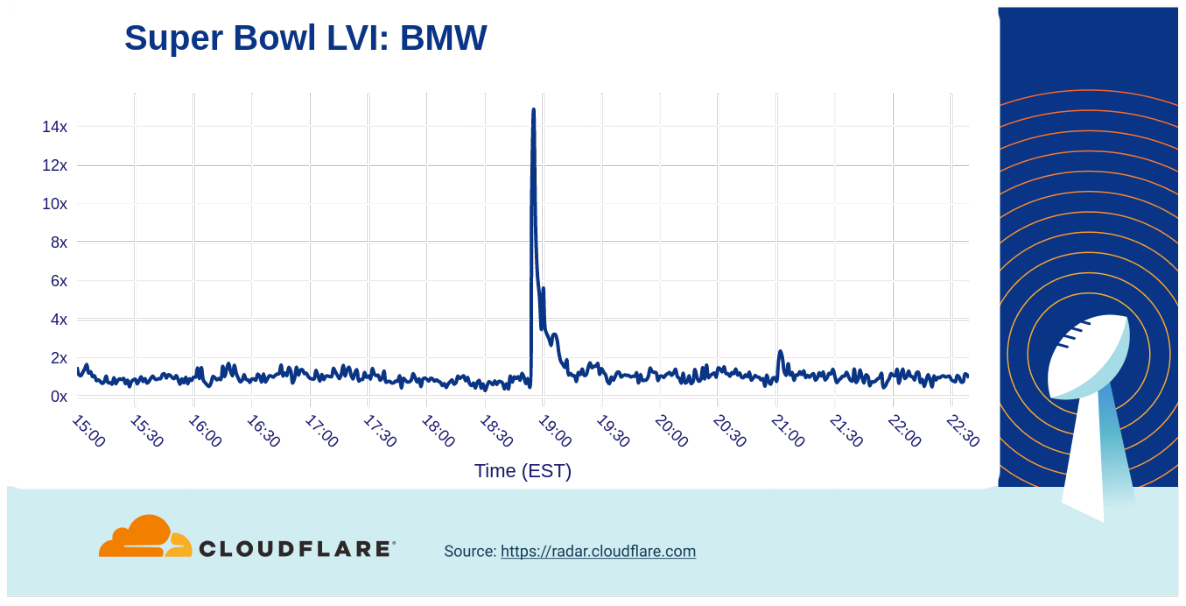
Electric cars (Dr. Evil) takeover
Car commercials have aired for many years during the Super Bowl, teasing new models and technologies. In 2022, electric cars were (again) a popular subject of Super Bowl ads. Bending modern day, 80’s nostalgia, and ancient mythology, BMW rocked down to Electric Avenue as their ad (18:54) resulted in a 14x increase over baseline in traffic.
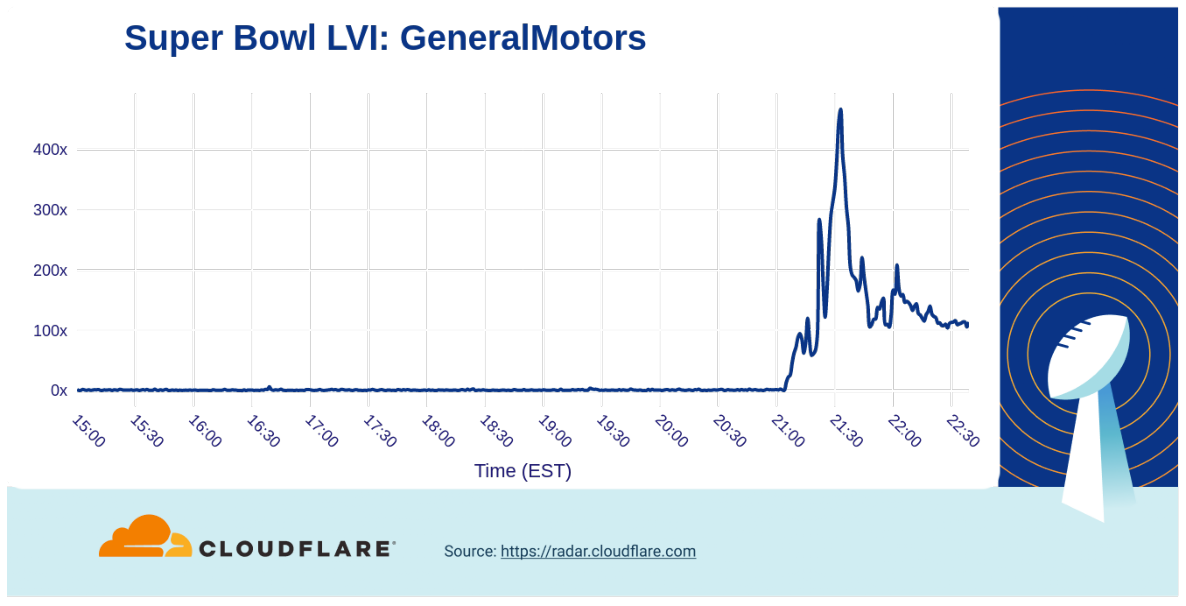
However, our data showed that there was a clear winner among automobile makers: the Dr. Evil (one of Mike Myers’s characters from Austin Powers) takeover of General Motors ad drove traffic to a peak of over 400x above baseline.
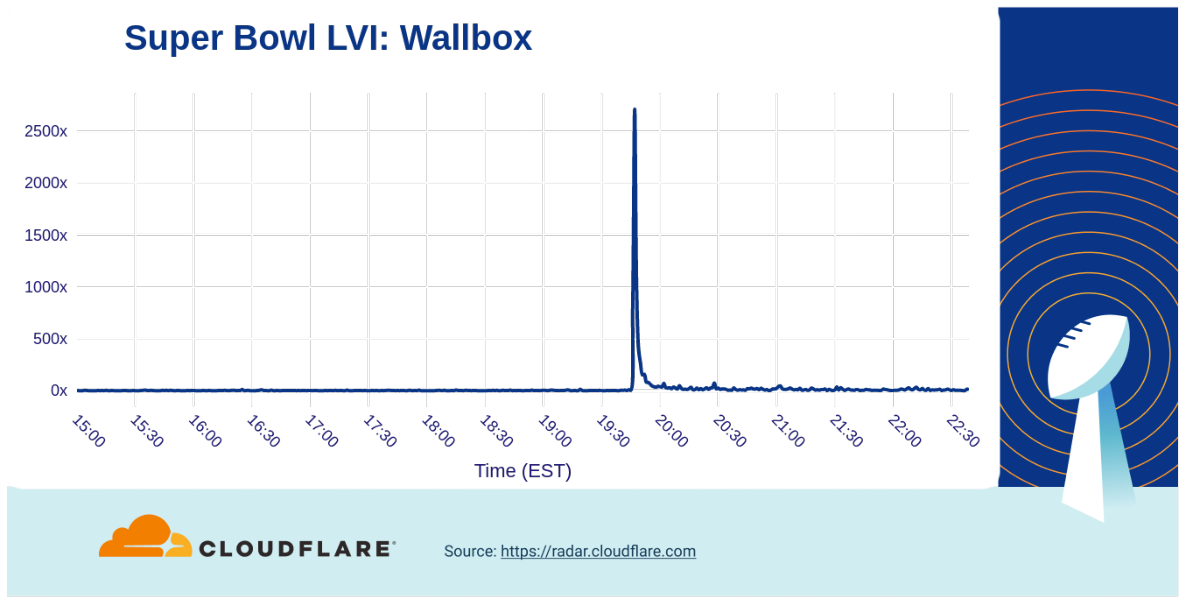
Ads from other car vendors including Toyota (5x), Kia (16x), Vroom (70x), Nissan (30x) also generated attention and increased traffic to their websites. Highlighting the importance of charging to the electric car ecosystem, the first ever Super Bowl ad from Wallbox (a manufacturer of electric car chargers) powered a huge increase in traffic to their website, reaching a peak over 2,500x higher than baseline.
Last but not least
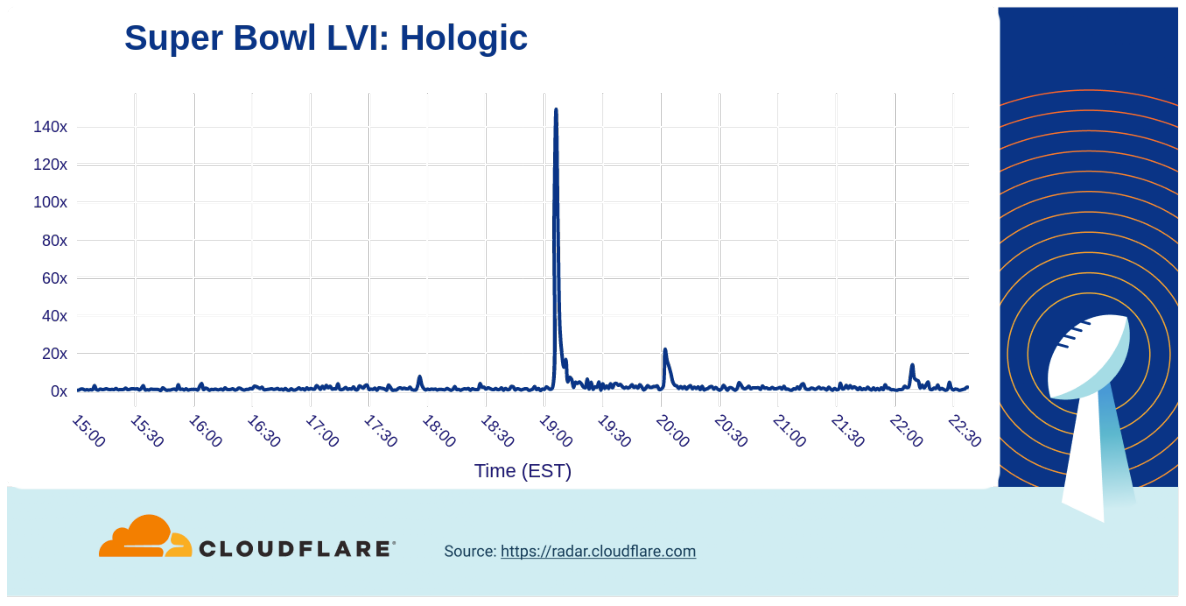
One of the health-related products that had made its mark on the Super Bowl was the early detection medical service Hologic that featured Mary J. Blige. They experienced a 140x traffic spike.
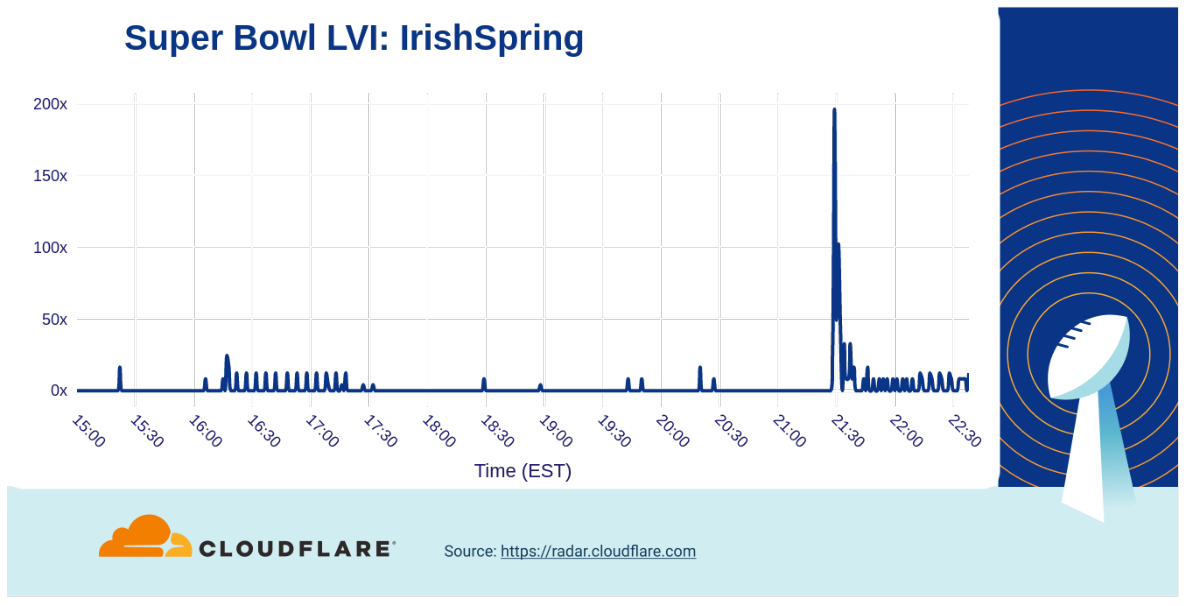
Another example that really showed that having a successful Super Bowl commercial doesn’t stink was for Irish Spring soap. Their good ‘smelling’ ad drove a traffic increase to their website of nearly 200x over baseline.
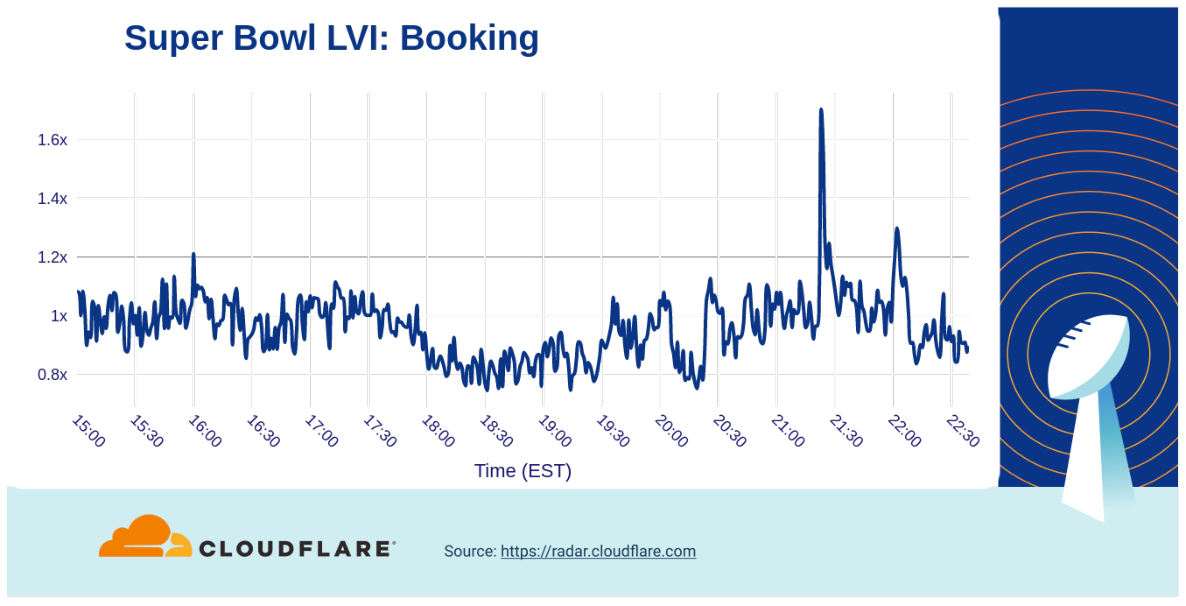
Among ads for travel-related companies, the biggest increase in traffic we saw was from Booking.com (21:23), with the adventures of Idris Elba gaining them a 1.6x bump.
Several ads promoted shows and movie trailers, including Dr. Strange 2 and Amazon Prime Video’s The Rings of Power, but the trailer for Jordan Peele’s Nope movie generated a nearly 40x increase in traffic.
And the winner is…
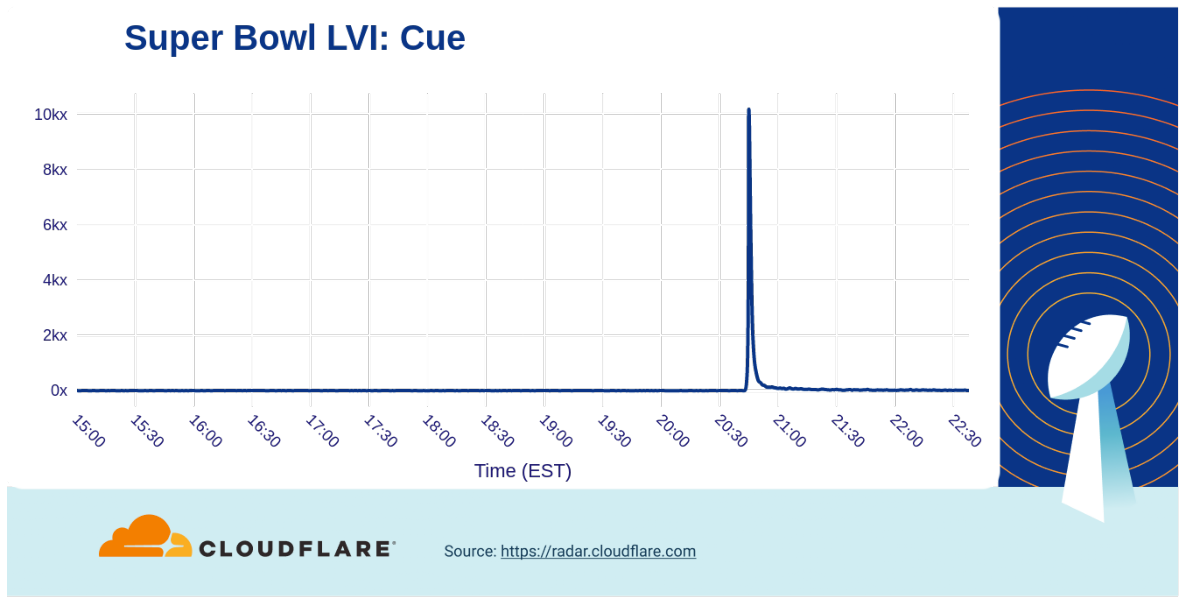
Popular smart home gadgets appeared to be jealous of the new COVID-19 testing device from Cue Health, but Super Bowl viewers were clearly curious about it. The company’s ad drove an astronomical 10,000x increase in traffic to their website after it aired.
Conclusion
We saw again that when humans change their behavior that impacts the Internet traffic (the network of networks is, after all, a human invention for humans).
Remember, visit Cloudflare Radar for up to date Internet traffic and attack trends and follow the Cloudflare Radar Twitter account for regular insights on Internet events.
In recent years we have witnessed an explosion of Internet-connected applications. Whether it is a new mobile app to find your soulmate, the latest wearable to monitor your vitals, or an industrial solution to detect corrosion, our life is becoming packed with connected systems.
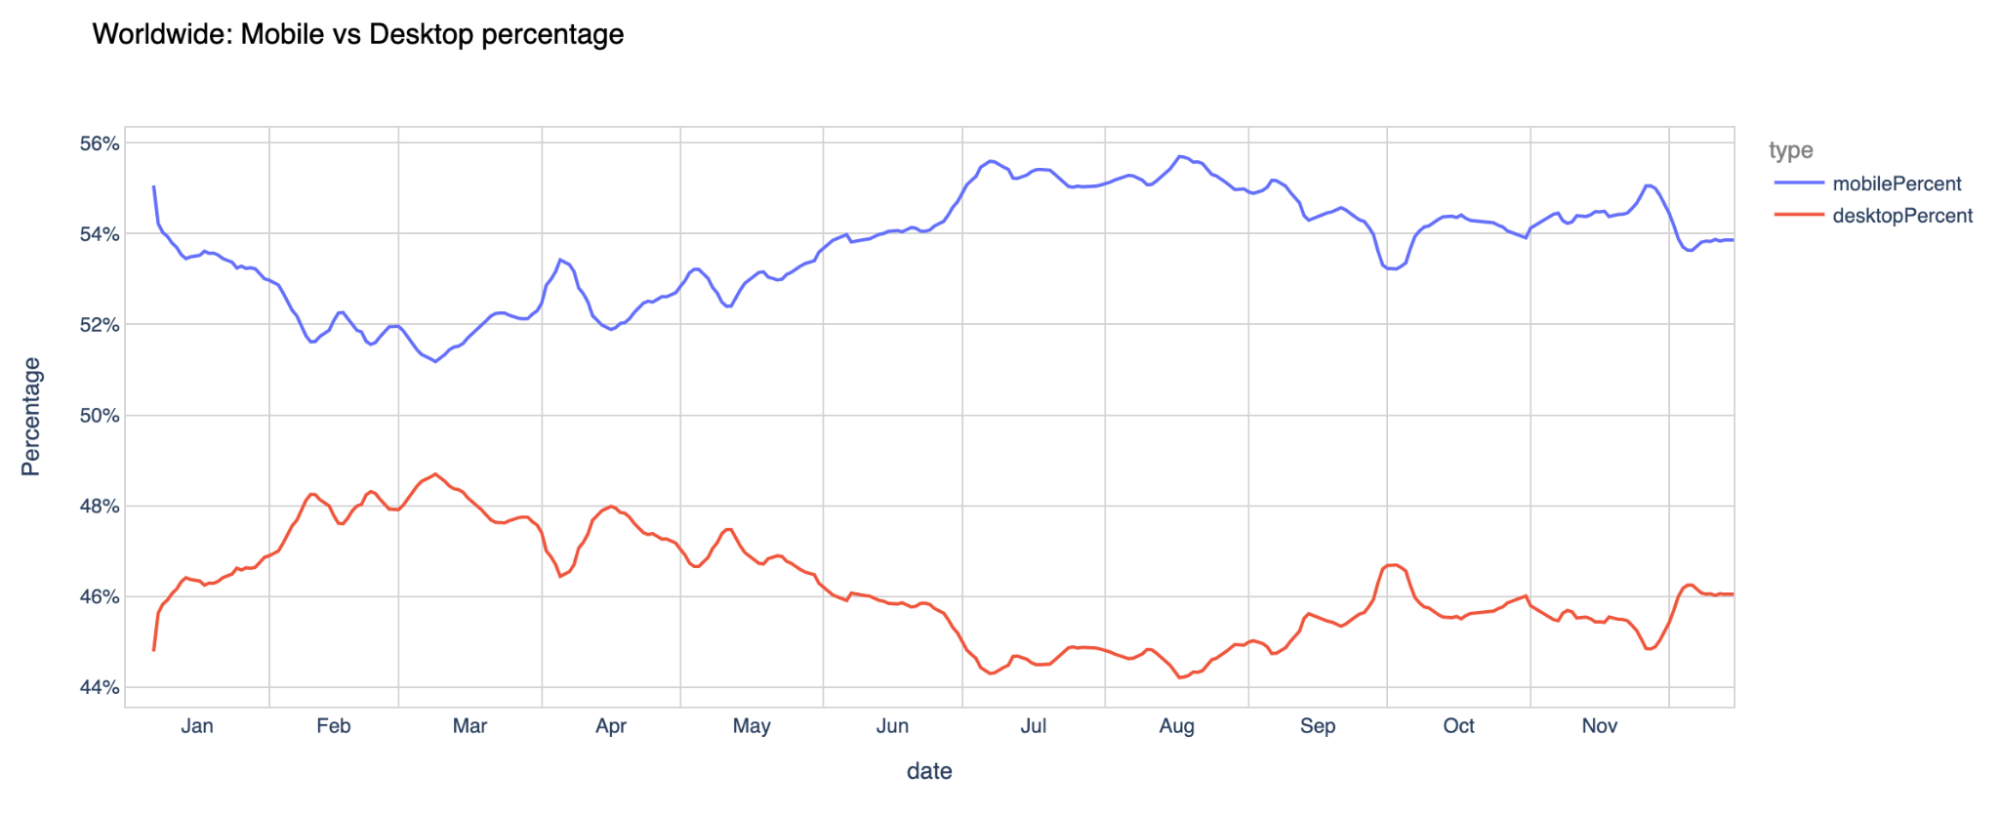
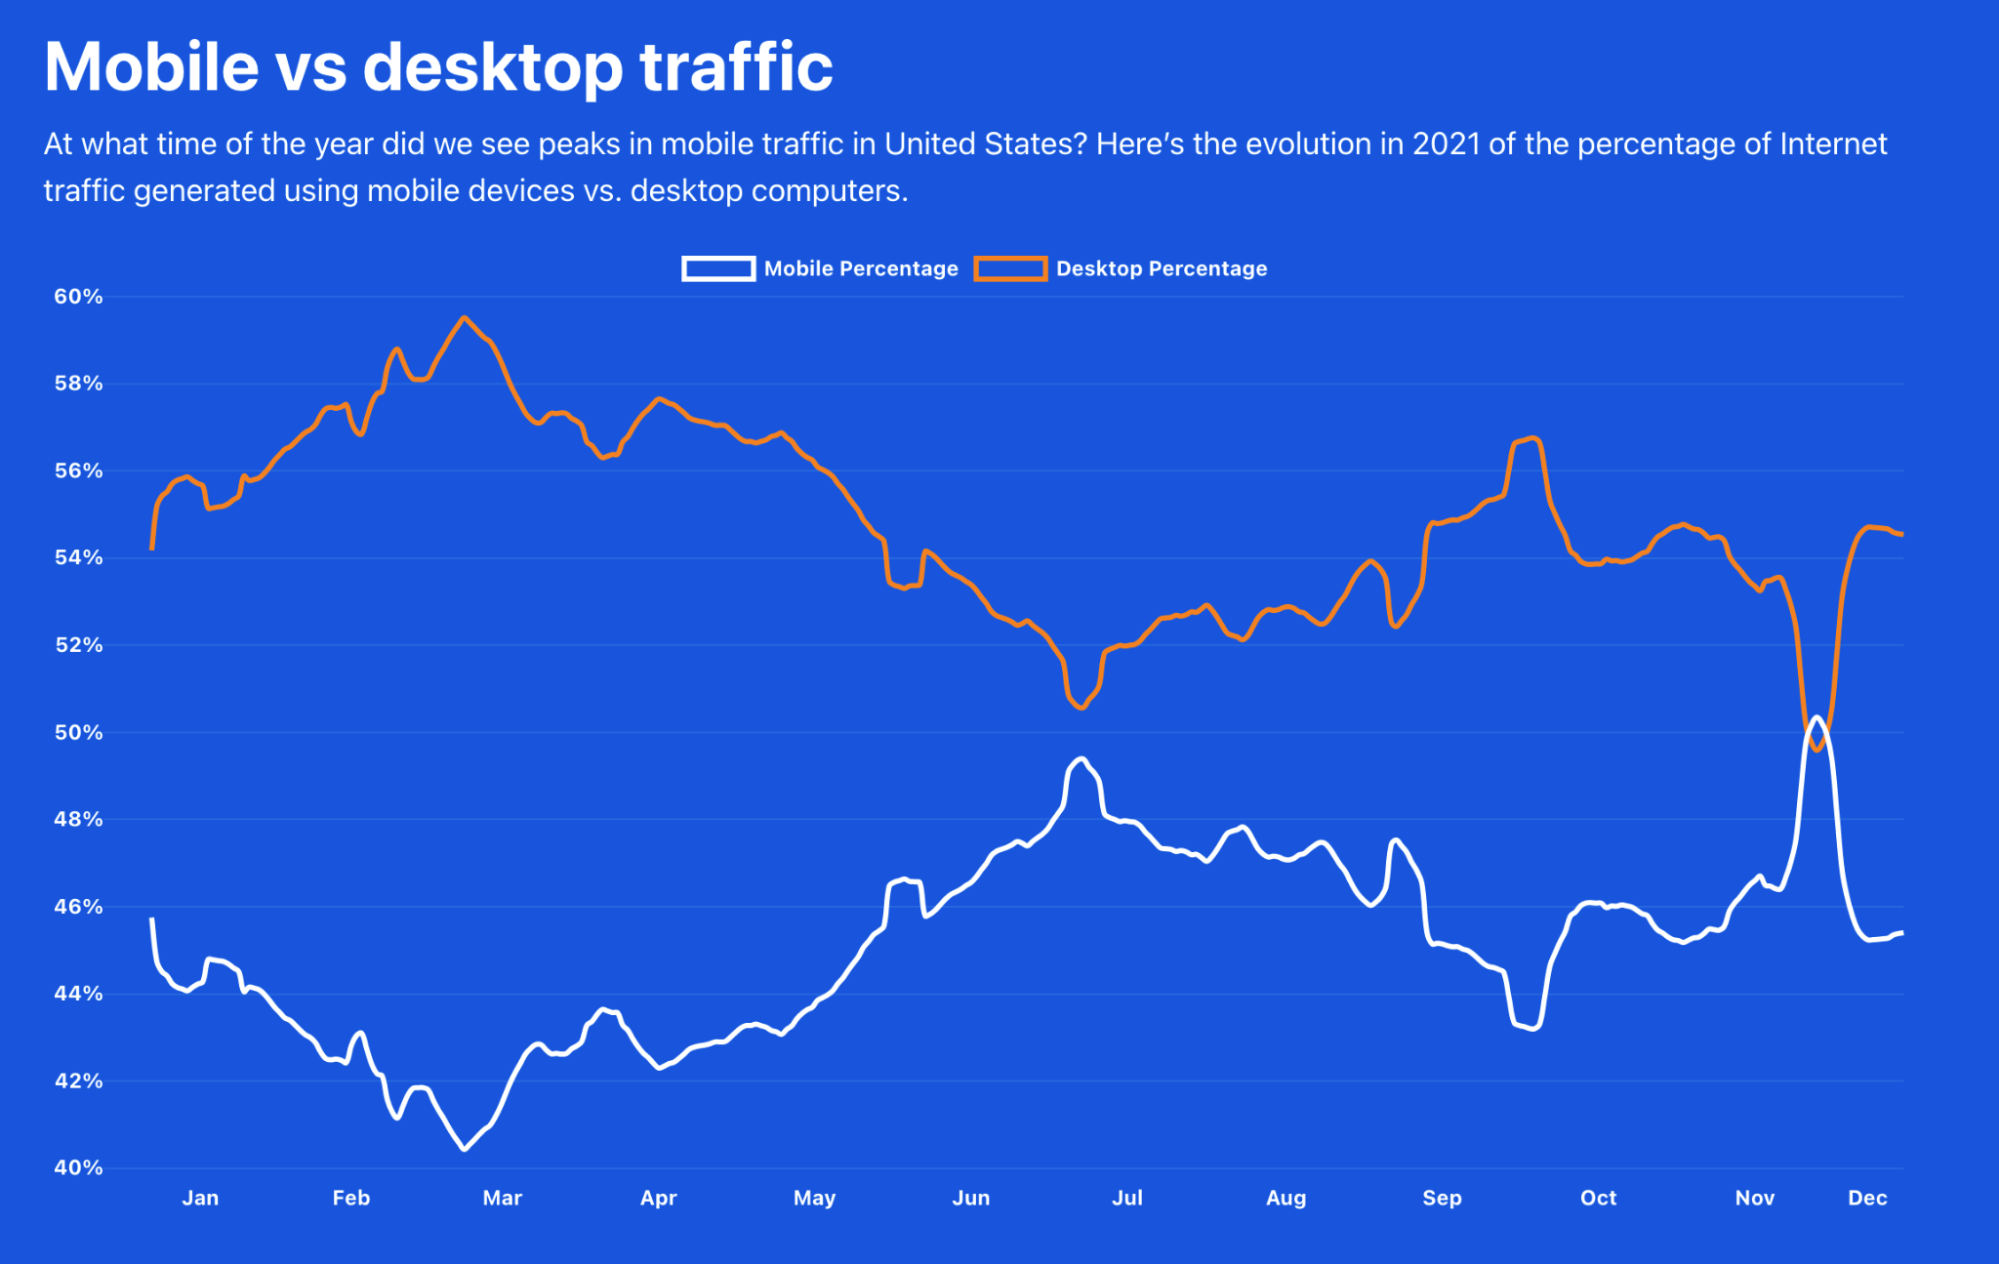
How is the Internet changing because of this shift? This blog provides an overview of how Internet traffic is evolving as Application Programming Interfaces (APIs) have taken the centre stage among the communication technologies. With help from the Cloudflare Radar team, we have harnessed the data from our global network to provide this snapshot of global APIs in 2021.
The huge growth in API traffic comes at a time when Cloudflare has been introducing new technologies that protect applications from nascent threats and vulnerabilities. The release of API Shield with API Discovery, Schema Validation, mTLS and API Abuse Detection has provided customers with a set of tools designed to protect their applications and data based on how APIs work and their challenges.
We are also witnessing increased adoption of new protocols. Among encryption protocols, for example, TLS v1.3 has become the most used protocol for APIs on Cloudflare while, for transport protocols, we saw an uptake of QUIC and gRPC (Cloudflare support announced in 2018 and 2020 respectively).
In the following sections we will quantify the growth of APIs and identify key industries affected by this shift. We will also look at the data to better understand the source and type of traffic we see on our network including how much malicious traffic our security systems block.
Why is API use exploding?
By working closely with our customers and observing the broader trends and data across our network in application security, we have identified three main trends behind API adoption: how applications are built is changing, API-first businesses are thriving, and finally machine-to-machine and human-to-machine communication is evolving.
During the last decade, APIs became popular because they allowed developers to separate backend and frontend, thus creating applications with better user experience. The Jamstack architecture is the most recent trend highlighting this movement, where technologies such as JavaScript, APIs and markup are being used to create responsive and high-performance applications. The growth of microservices and serverless architectures are other drivers behind using efficient HTTP-powered application interfaces.
APIs are also enabling companies to innovate their business models. Across many industries there is a trend of modularizing complex processes by integrating self-contained workflows and operations. The product has become the service delivered via APIs, allowing companies to scale and monetize their new capabilities. Financial Services is a prime example where a monolithic industry with vertically integrated service providers is giving way to a more fragmented landscape. The new Open Banking standard (PSD2) is an example of how small companies can provide modular financial services that can be easily integrated into larger applications. Companies like TrueLayer have productized APIs, allowing e-commerce organizations to onboard new sellers to a marketplace within seconds or to deliver more efficient payment options for their customers. A similar shift is happening in the logistics industry as well, where Shippo allows the same e-commerce companies to integrate with services to initiate deliveries, print labels, track goods and streamline the returns process. And of course, everything is powered by APIs.
Finally, the increase of connected devices such as wearables, sensors and robots are driving more APIs, but another aspect of this is the way manual and repetitive tasks are being automated. Infrastructure-as-Code is an example of relying on APIs to replace manual processes that have been used to manage Internet Infrastructure in the past. Cloudflare is itself a product of this trend as our solutions allow customers to use services like Terraform to configure how their infrastructure should work with our products.
Labelling traffic
The data presented in the following paragraphs is based on the total traffic proxied by Cloudflare and traffic is classified according to the Content-Type header generated in the response phase. Only requests returning a 200 response were included in the analysis except for the analysis in the ‘Security’ section where other error codes were included. Traffic generated by identified bots is not included.
When looking at trends, we compare data from the first week of February 2021 to the first week of December 2021. We chose these dates to compare how traffic changed over the year but excluding January which is affected by the holiday season.
Specifically, API traffic is labelled based on responses with types equal application/json, application/xml, and text/xml, while Web accounts for text/html, application/x-javascript, application/javascript, text/css, and text/javascript. Requests categorised as Text are text/plain; Binary are application/octet-stream; Media includes all image types, video and audio.
Finally, Other catches everything that doesn’t clearly fall into the labels above, which includes empty and unknown. Part of this traffic might be API and the categorisation might be missing due to the client or server not adding a Content-Type header.
API use in 2021
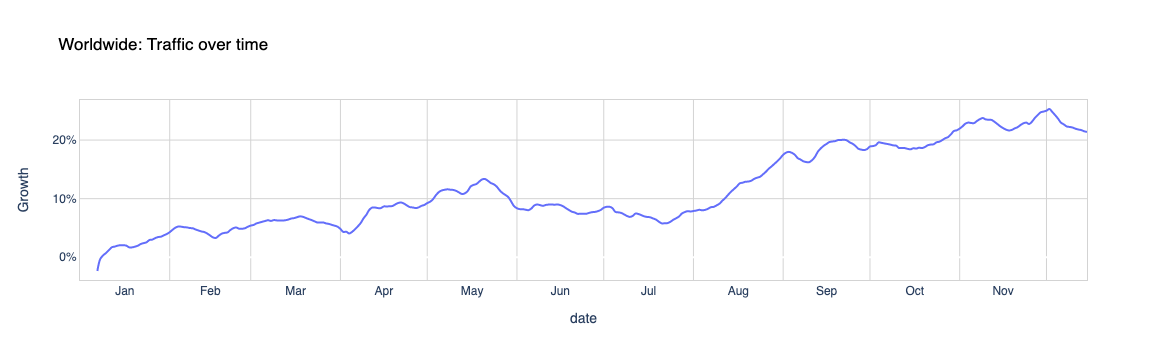
We begin by examining the current state of API traffic at our global network and the types of content served. During the first week of December 2021, API calls represented 54% of total requests, up from 52% during the first week of February 2021.
When looking at individual data types, API was by far the fastest growing data type (+21%) while Web only grew by 10%. Media (such as images and videos) grew just shy of 15% while binary was the only traffic that in aggregate experienced a reduction of 6%.
In summary, APIs have been one of the drivers of the traffic growth experienced by the Cloudflare network in 2021. APIs account for more than half of the total traffic generated by end users and connected devices, and they’re growing twice as fast as traditional web traffic.
New industries are contributing to this increase
We analysed where this growth comes from in terms of industry and application types. When looking at the total volume of API traffic, unsurprisingly the general Internet and Software industry accounts for almost 40% of total API traffic in 2021. The second-largest industry in terms of size is Cryptocurrency (7% of API traffic) followed by Banking and Retail (6% and 5% of API traffic respectively).
The following chart orders industries according to their API traffic growth. Banking, Retail and Financial Services have experienced the largest year-on-year growth with 70%, 51% and 50% increases since February 2021, respectively.
The growth of Banking and Financial Services traffic is aligned with the trends we have observed anecdotally in the sector. The industry has seen the entrance of a number of new platforms that aggregate accounts from different providers, streamline transactions, or allow investing directly from apps, all of which rely heavily on APIs. The new “challenger banks” movement is an example where newer startups are offering captivating mobile services based on APIs while putting pressure on larger institutions to modernise their infrastructure and applications.
A closer look at the API characteristics
Generally speaking, a RESTful API request is a call to invoke a function. It includes the address of a specific resource (the endpoint) and the action you want to perform on that resource (method). A payload might be present to carry additional data and HTTP headers might be populated to add information about the origin of the call, what software is requesting data, requisite authentication credentials, etc. The method (or verb) expresses the action you want to perform, such as retrieve information (GET) or update information (POST).
It’s useful to understand the composition and origin of API traffic, such as the most commonly used methods, the most common protocol used to encode the payload, or what service generates traffic (like Web, mobile apps, or IoT). This information will help us identify the macro source of vulnerabilities and design and deploy the best tools to protect traffic.
Methods
The vast majority of API traffic is the result of POST or GET requests (98% of all requests). POST itself accounts for 53.4% of all requests and GET 44.4%. Generally speaking, GET tends to transfer sensitive data in the HTTP request header, query and in the response body, while POST typically transfers data in the request header and body. While many security tools apply to both of these types of calls, this distinction can be useful when deploying tools such as API Schema Validation (request and response) or Data Loss Prevention/Sensitive Data Detection (response), both launched by Cloudflare in March 2021.
Payload encoding review
API payloads encode data using different rules and languages that are commonly referred to as transport protocols. When looking at the breakdown between two of the most common protocols, JSON has by far the largest number of requests (~97%) while XML has a smaller share of requests as it still carries the heaviest traffic. In the following figure, JSON and XML are compared in terms of response sizes. XML is the most verbose protocol and the one handling the largest payloads while JSON is more compact and results in smaller payloads.
Since we have started supporting gRPC (September 2020), we have seen a steady increase in gRPC traffic and many customers we speak with are in the planning stages of migrating from JSON to gRPC, or designing translation layers at the edge from external JSON callers to internal gRPC services.
Source of API traffic
We can look at the HTTP request headers to better understand the origin and intended use of the API. The User-Agent header allows us to identify what type of client made the call, and we can divide it into three broader groups: “browser”, “non-browser” and “unknown” (which indicates that the User-Agent header was not set).
About 38% of API calls are made by browsers as part of a web application built on top of backend APIs. Here, the browser loads an HTML page and populates dynamic fields by generating AJAX API calls against the backend service. This paradigm has become the de-facto standard as it provides an effective way to build dynamic yet flexible Web applications.
The next 56% comes from non-browsers, including mobile apps and IoT devices with a long tail of different types (wearables, connected sport equipment, gaming platforms and more). Finally, approximately 6% are “unknown” and since well-behaving browsers and tools like curl send a User-Agent by default, one could attribute much of this unknown to programmatic or automated tools, some of which could be malicious.
Encryption
A key aspect of securing APIs against snooping and tampering is encrypting the session. Clients use SSL/TLS to authenticate the server they are connecting with, for example, by making sure it is truly their cryptocurrency vendor. The benefit of transport layer encryption is that after handshaking, all application protocol bytes are encrypted, providing both confidentiality and integrity assurances.
The protocol that is growing fastest is QUIC. While QUIC can be used to carry many types of application protocols, Cloudflare has so far focused on HTTP/3, the mapping of HTTP over IETF QUIC. We started supporting draft versions of QUIC in 2018 and when QUIC version 1 was published as RFC 9000 in May 2021, we enabled it for everyone the next day. QUIC uses the TLS 1.3 handshake but has its own mechanism for protecting and securing packets. Looking at HTTP-based API traffic, we see HTTP/3 going from less than 3% in early February 2021 to more than 8% in December 2021. This growth broadly aligns RFC 9000 being published and during the periodHTTP/3 support being stabilized and enabled in a range of client implementations.
Mutual TLS, which is often used for mobile or IoT devices, accounts for 0.3% of total API traffic. Since we released the first version of mTLS in 2017 we’ve seen a growing number of inquiries from users across all Cloudflare plans, as we have recently made it easier for customers to start using mTLS with Cloudflare API Shield. Customers can now use Cloudflare dashboard to issue and manage certificates with one-click avoiding all the complexity of having to manage a Private Key Infrastructure and root certificates themselves.
Finally, unencrypted traffic can provide a great opportunity for attackers to access plain communications. The total unencrypted API traffic dropped from 4.6% of total requests in early 2021 to 2.6% in December 2021. This represents a significant step forward in establishing basic security for all API connections.
Security
Given the huge amount of traffic that Cloudflare handles every second, we can look for trends in blocked traffic and identify common patterns in threats or attacks.
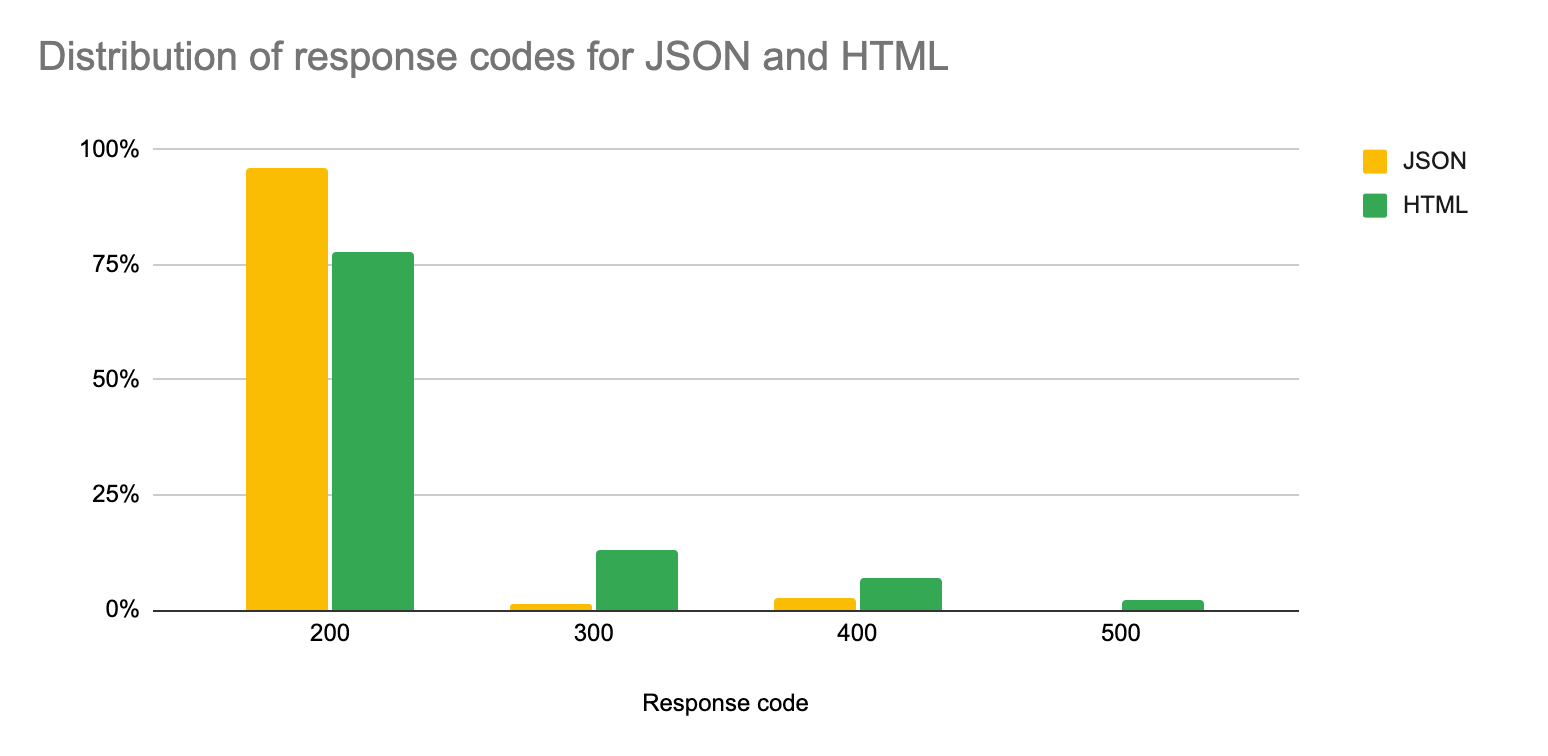
When looking at the Cloudflare security systems, an HTML request is twice as likely to be blocked than an API request. Successful response codes (200, 201, 301 and 302) account for 91% of HTML and 97% of API requests, while 4XX error codes (like 400, 403, 404) are generated for 2.8% of API calls as opposed to 7% of HTML. Calls returning 5XXs codes (such as Internal Server Error, Bad Gateway, Service Unavailable) are almost nonexistent for APIs (less than 0.2% of calls) while are almost 2% of requests for HTML.
The relatively larger volume of unmitigated API requests can be explained by the automated nature of APIs, for example more API calls are generated in order to render a page that would require a single HTML request. Malicious or malformed requests are therefore diluted in a larger volume of calls generated by well-behaving automated systems.
We can further analyse the frequency of specific error codes to get a sense of what the most frequent malformed (and possibly malicious) requests are. In the following figure, we plot the share of a particular error code when compared to all 4XXs.
We can identify three groups of issues all equally likely (excluding the more obvious “404 Not Found” case): “400 Bad Request” (like malformed, invalid request), “429 Too Many Requests” (“Rate Limiting”), and the combination of Authentication and Authorization issues (“403 Forbidden” and “401 Unauthorized”). Those codes are followed by a long tail of other errors, including “422 Unprocessable Entity”, “409 Conflict”, and “402 Payment Required”.
This analysis confirms that the most common attacks rely on sending non-compliant requests, brute force efforts (24% of generated 4XXs are related to rate limiting), and accessing resources with invalid authentication or permission.
We can further analyse the reason why calls were blocked (especially relative to the 400s codes) by looking at what triggered the Cloudflare WAF. The OWASP and the Cloudflare Managed Ruleset are tools that scan incoming traffic looking for fingerprints of known vulnerabilities (such as SQLi, XSS, etc.) and they can provide context on what attack was detected.
A portion of the blocked traffic has triggered a managed rule for which we can identify the threat category. Although a malicious request can match multiple categories, the WAF assigns it to the first threat that is identified. User-Agent anomaly is the most common reason why traffic is blocked. This is usually triggered by the lack of or by a malformed User-Agent header, capturing requests that do not provide enough credible information on what type of client has sent the request. The next most common threat is cross-site scripting. After these two categories, there is a long tail of other anomalies that were identified.
Conclusions
More than one out of two requests we process is an API call, and industries such as Banking, Retail and Financial Services are leading in terms of adoption and growth.
Furthermore, API calls are growing twice as fast as HTML traffic, making it an ideal candidate for new security solutions aimed at protecting customer data.
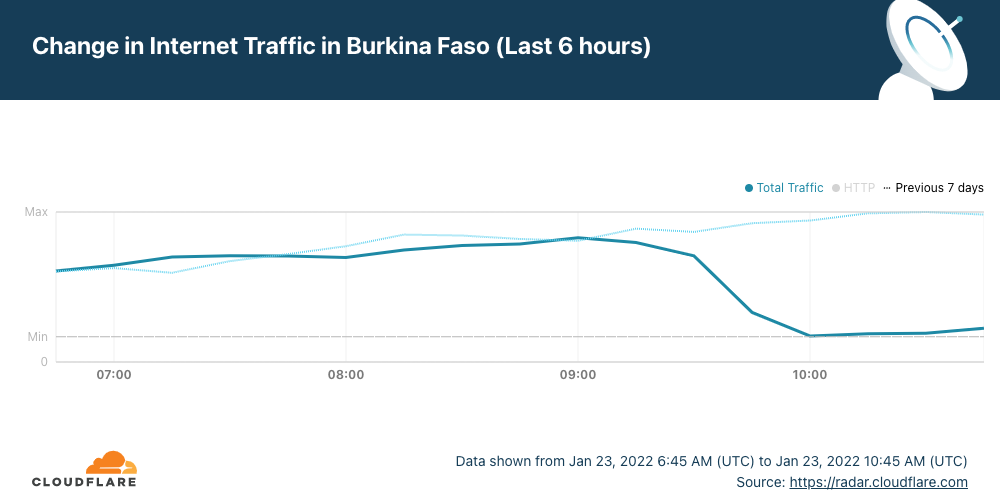
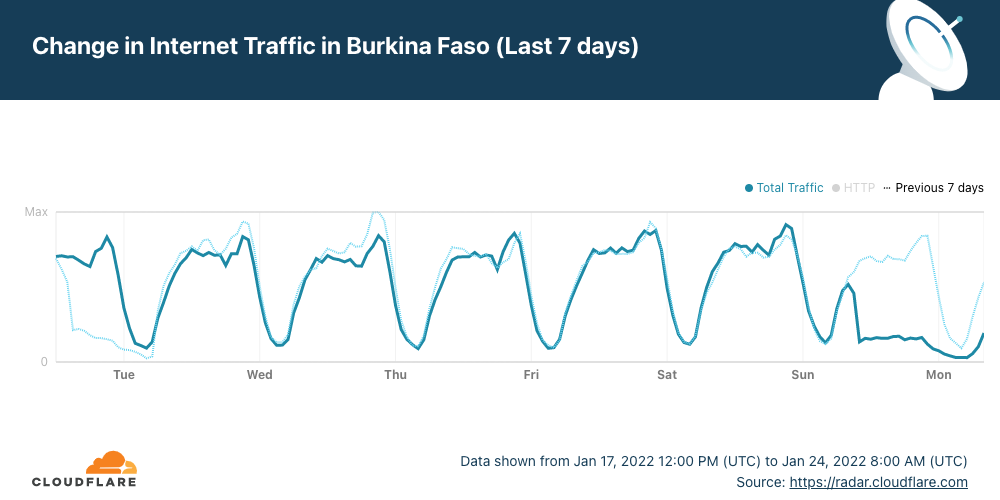
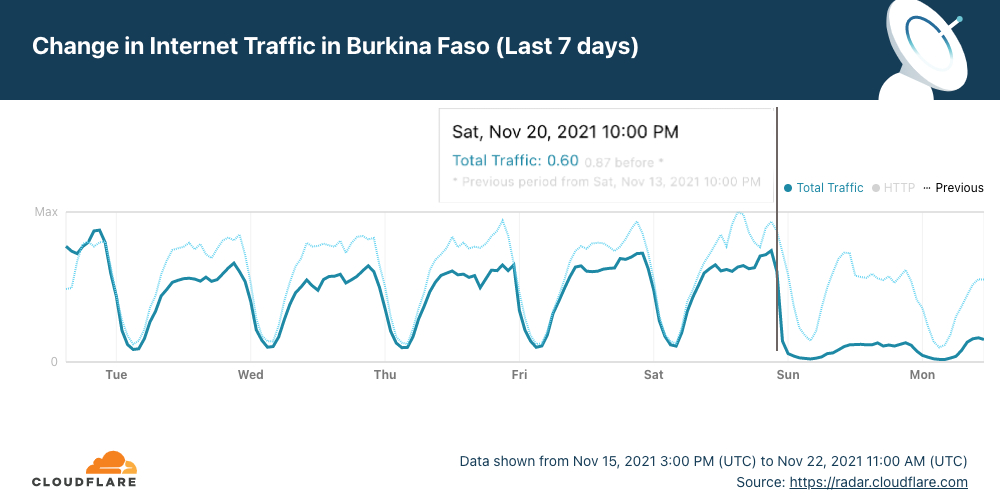
The early hours of Sunday, January 23, 2022, started in Burkina Faso with an Internet outage or shutdown. Heavy gunfire in an army mutiny could be related to the outage according to the New York Times (“mobile Internet services were shut down”). As of today, there are three countries affected by major Internet disruptions — Tonga and Yemen are the others.
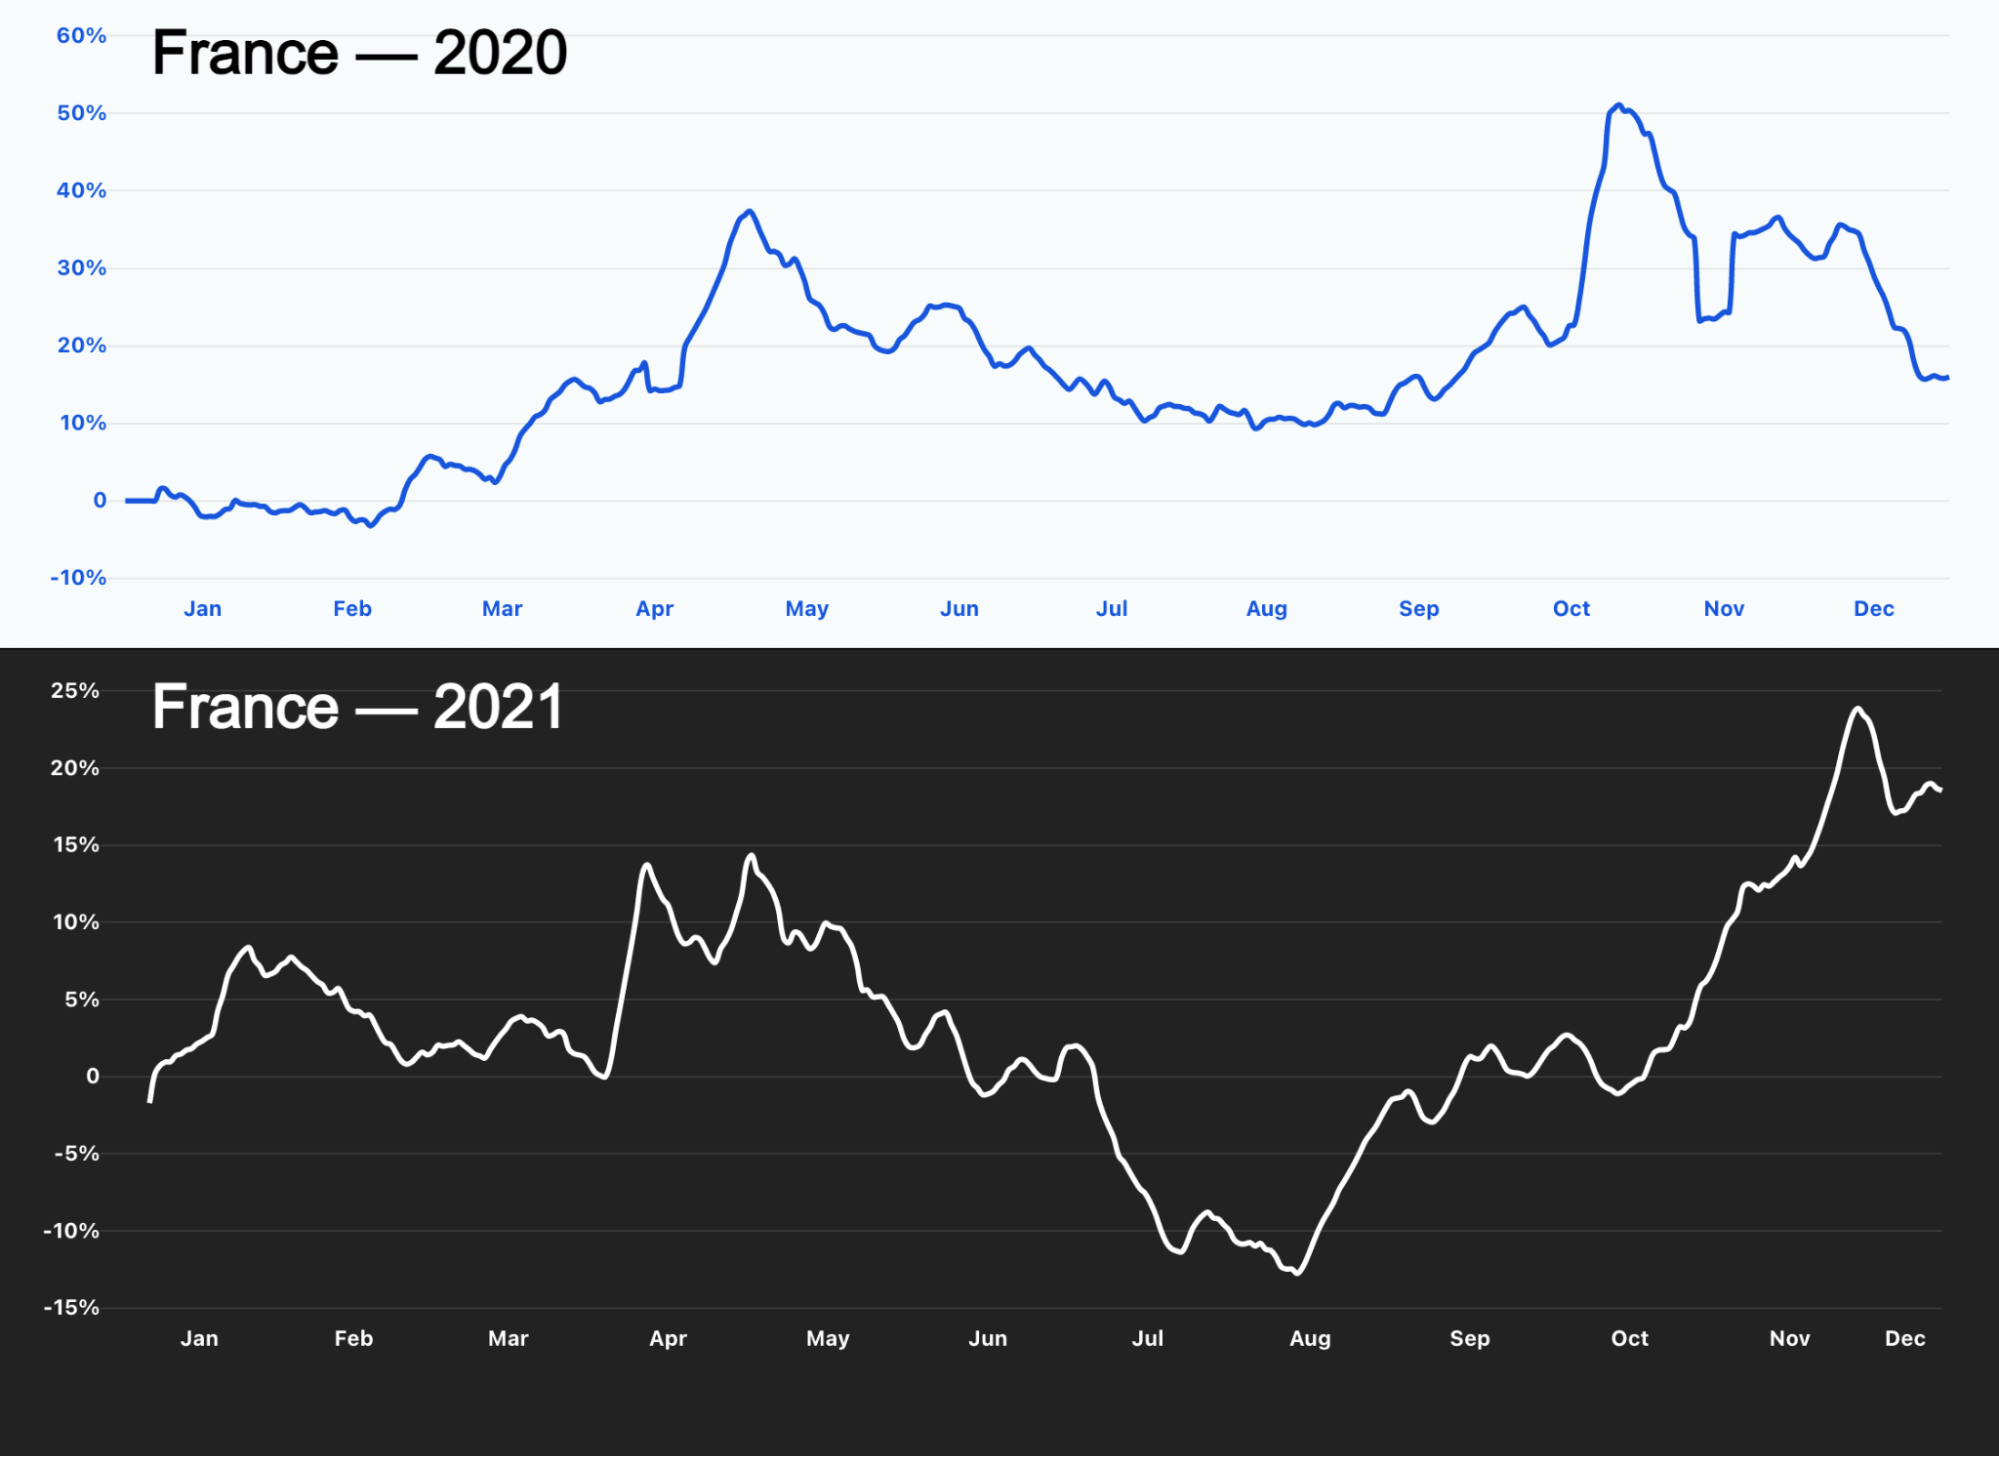
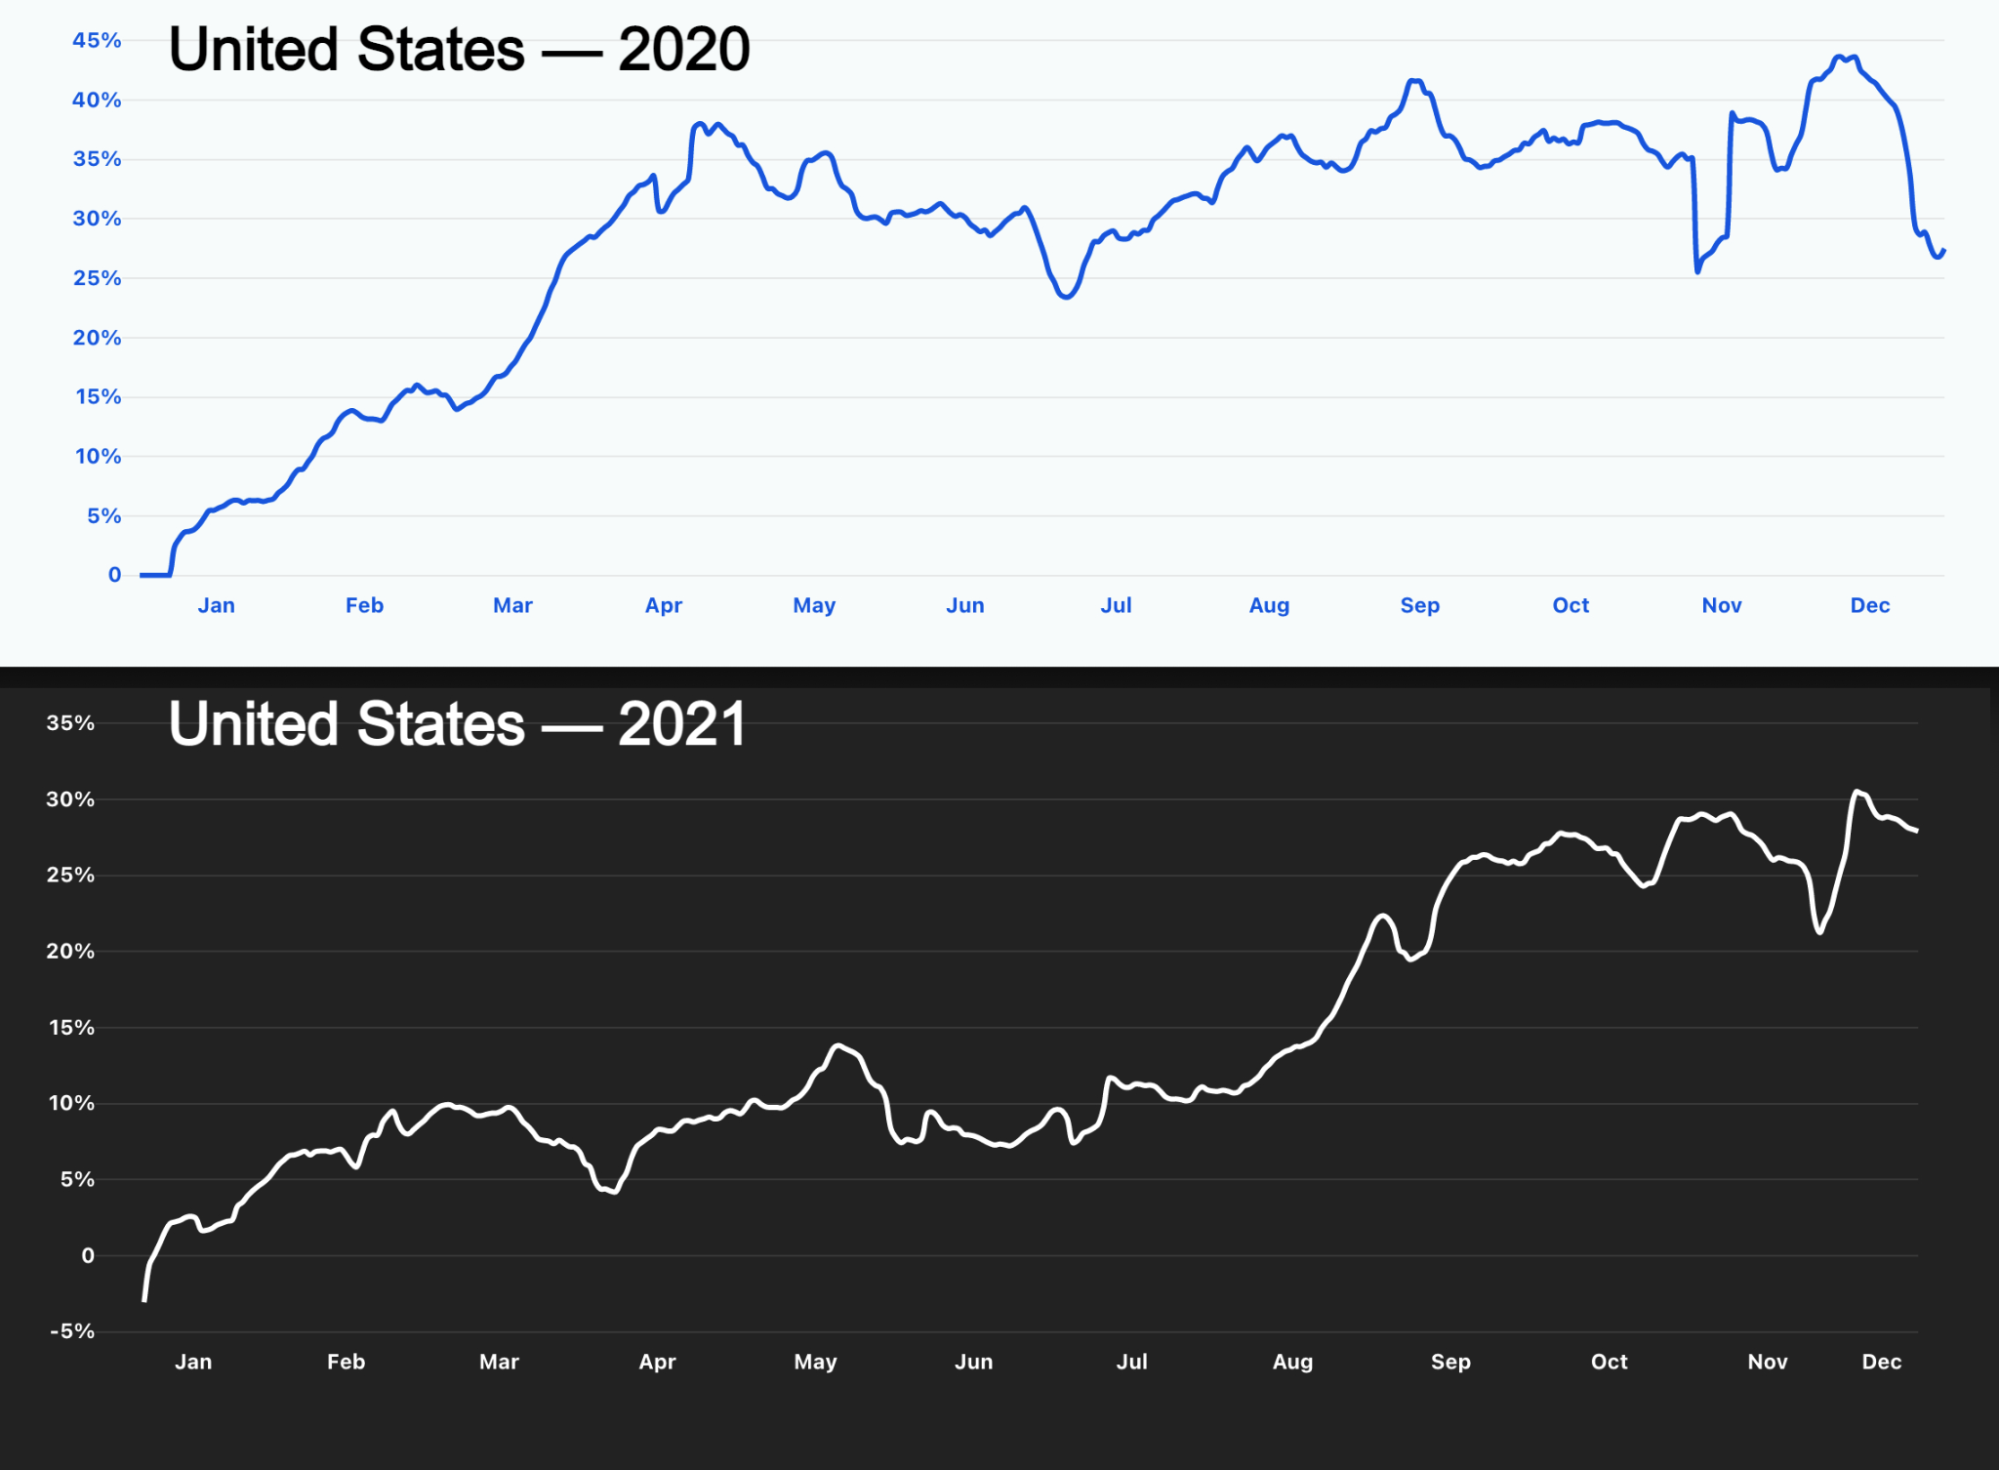
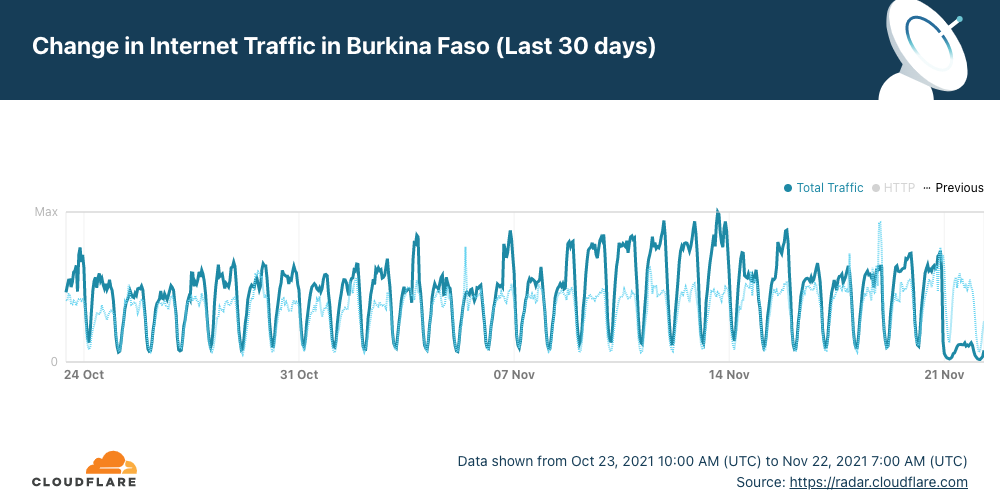
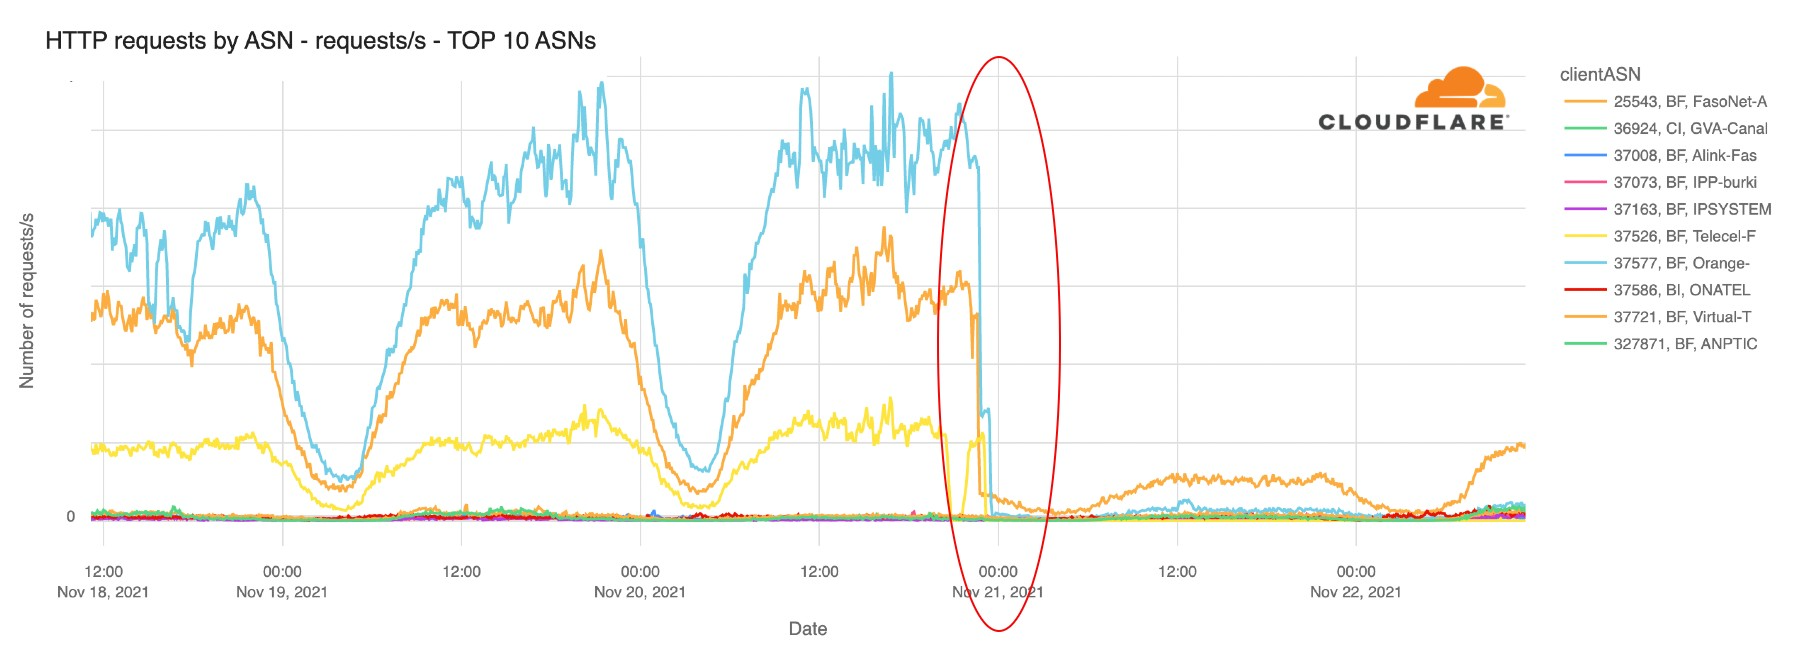
Cloudflare Radar shows that Internet traffic dropped significantly in the West African country after ~09:15 UTC (the same in local time) and remains low more than 24 hours later. Burkina Faso also had a mobile Internet shutdown on January 10, 2022, and another we reported in late November 2021.
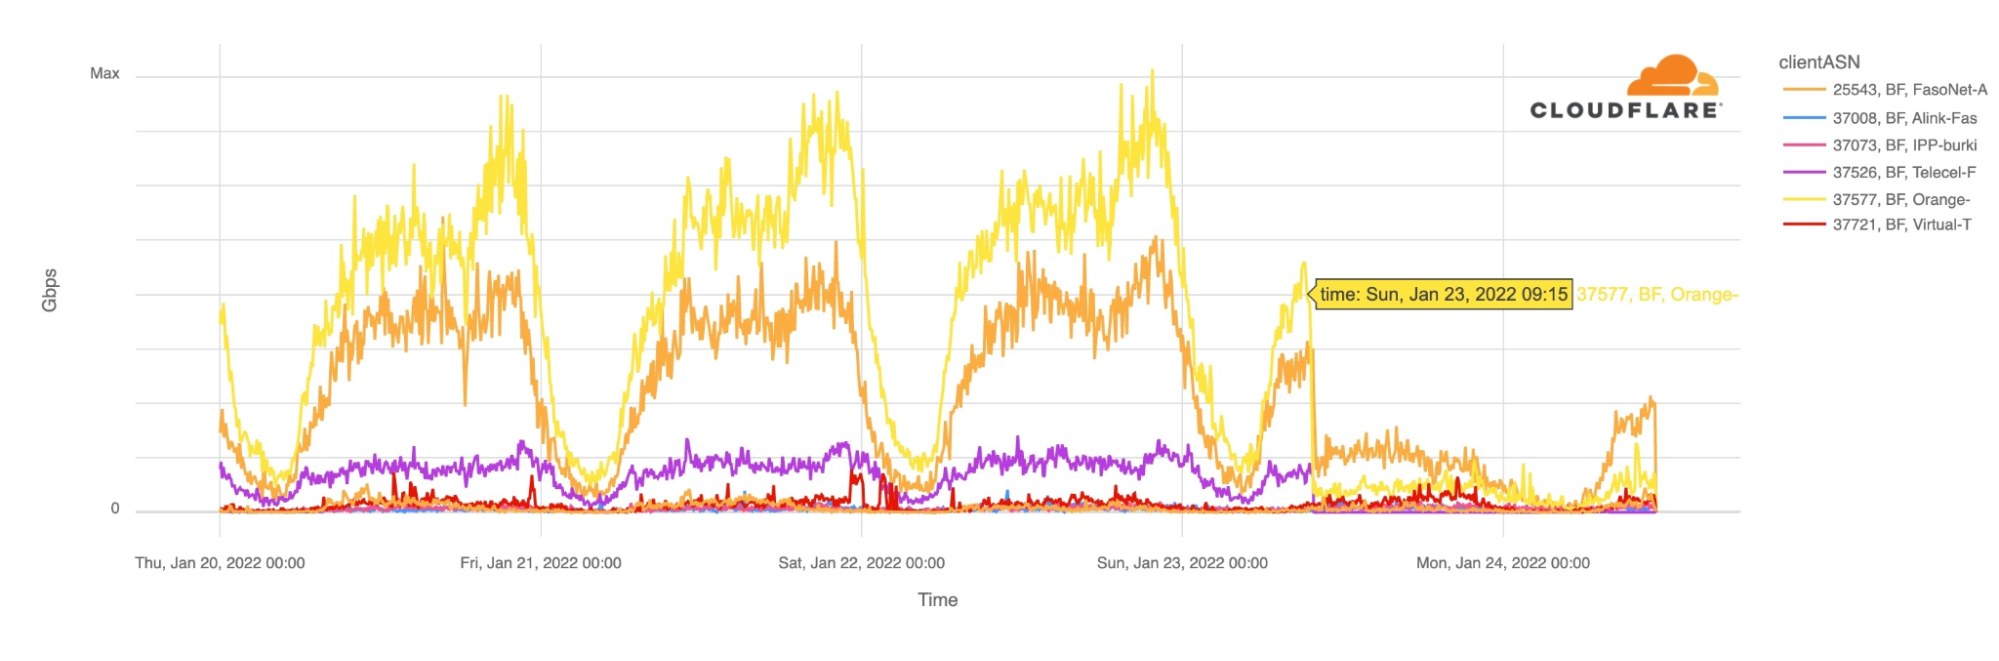
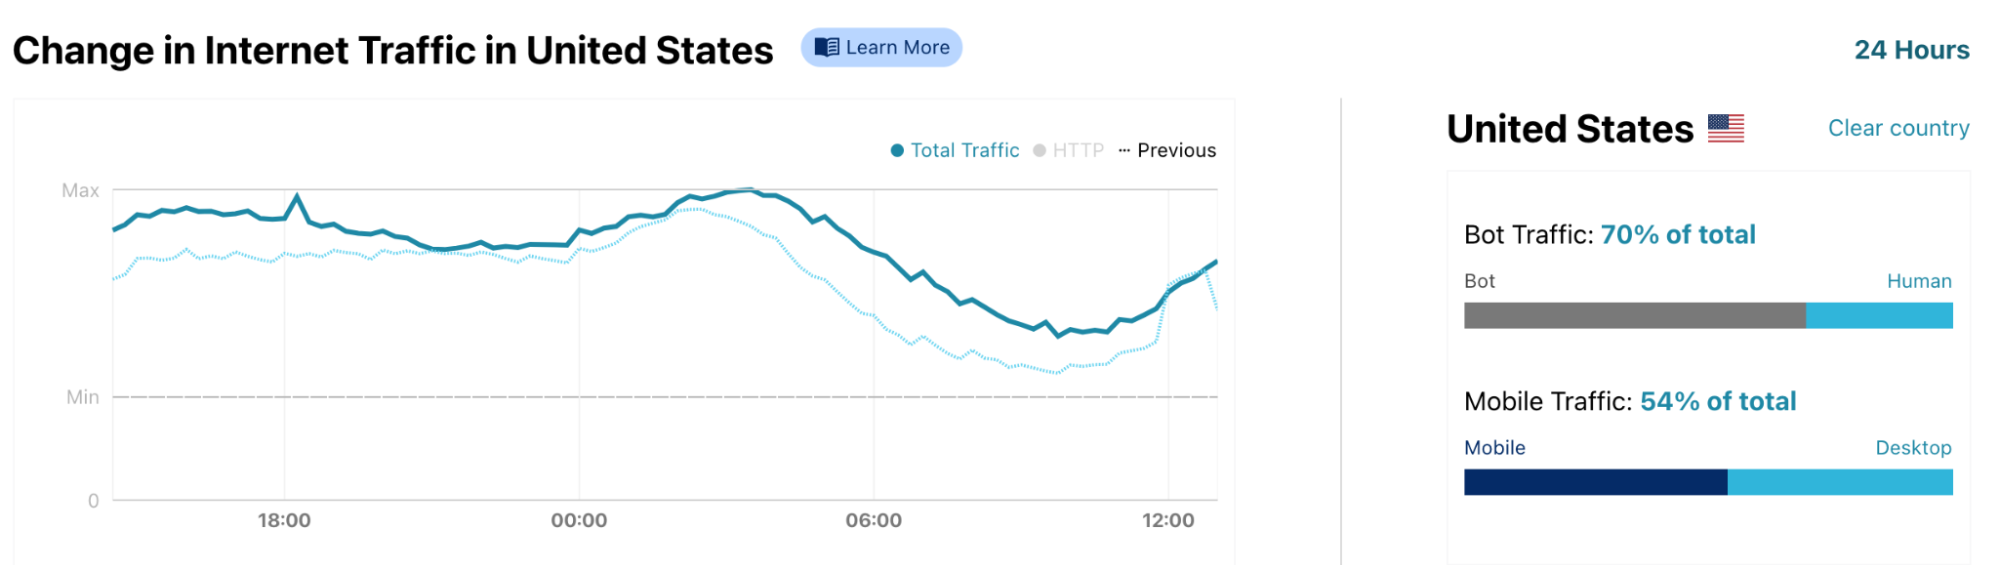
The main ISPs from Burkina Faso were affected. The two leading Internet Service Providers Orange and FasoNet lost Internet traffic after 09:15 UTC, but also Telecel Faso, as the next chart shows. This morning, at around 10:00 UTC there was some traffic from FasoNet but less than half of what we saw at the same time in preceding days.
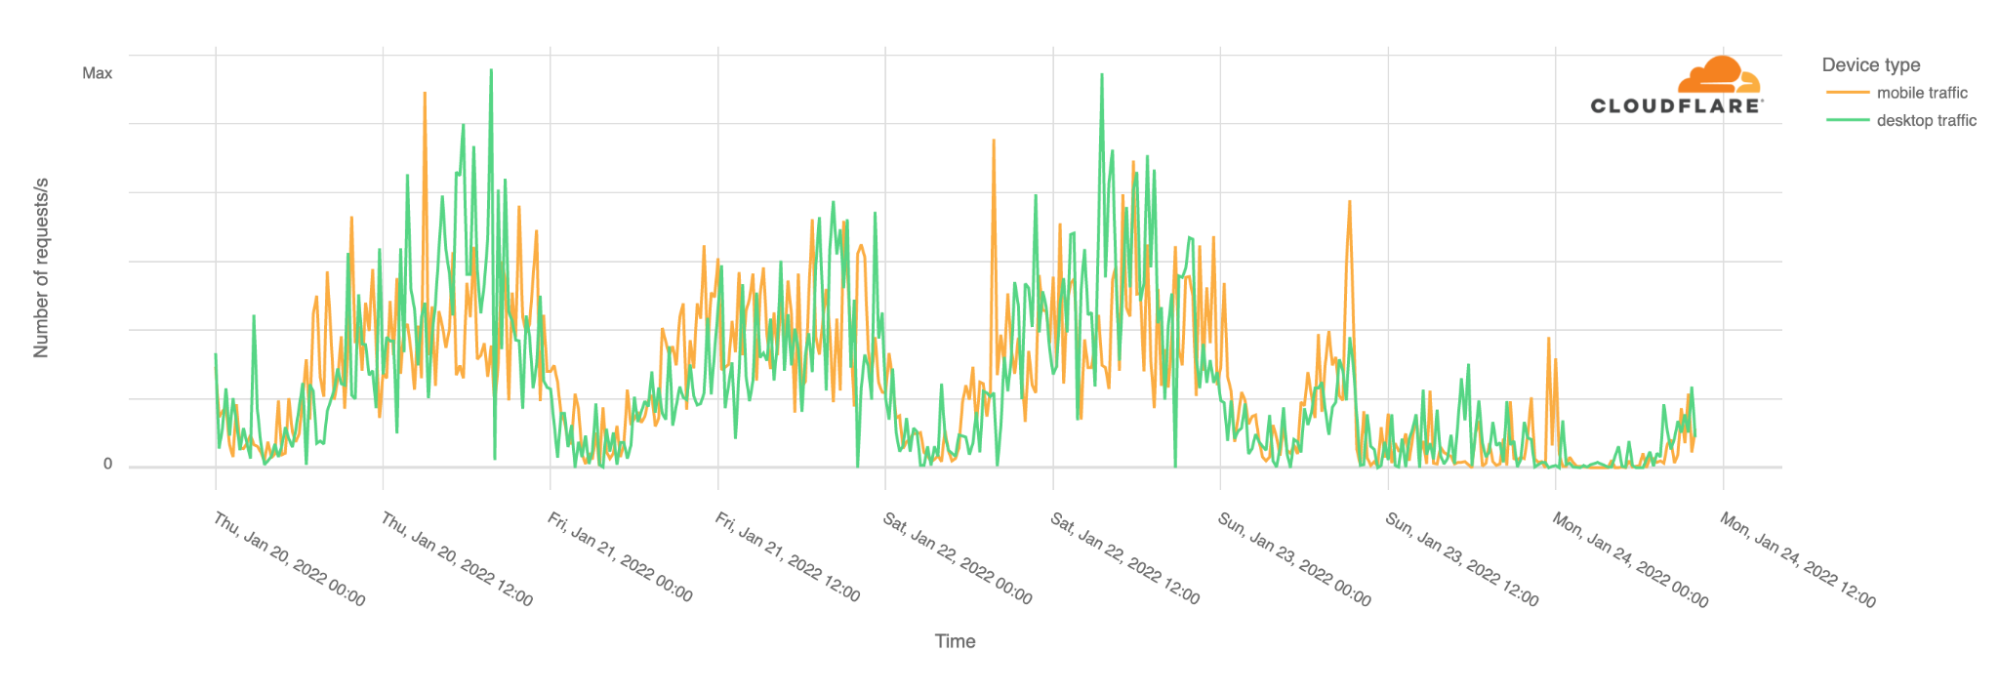
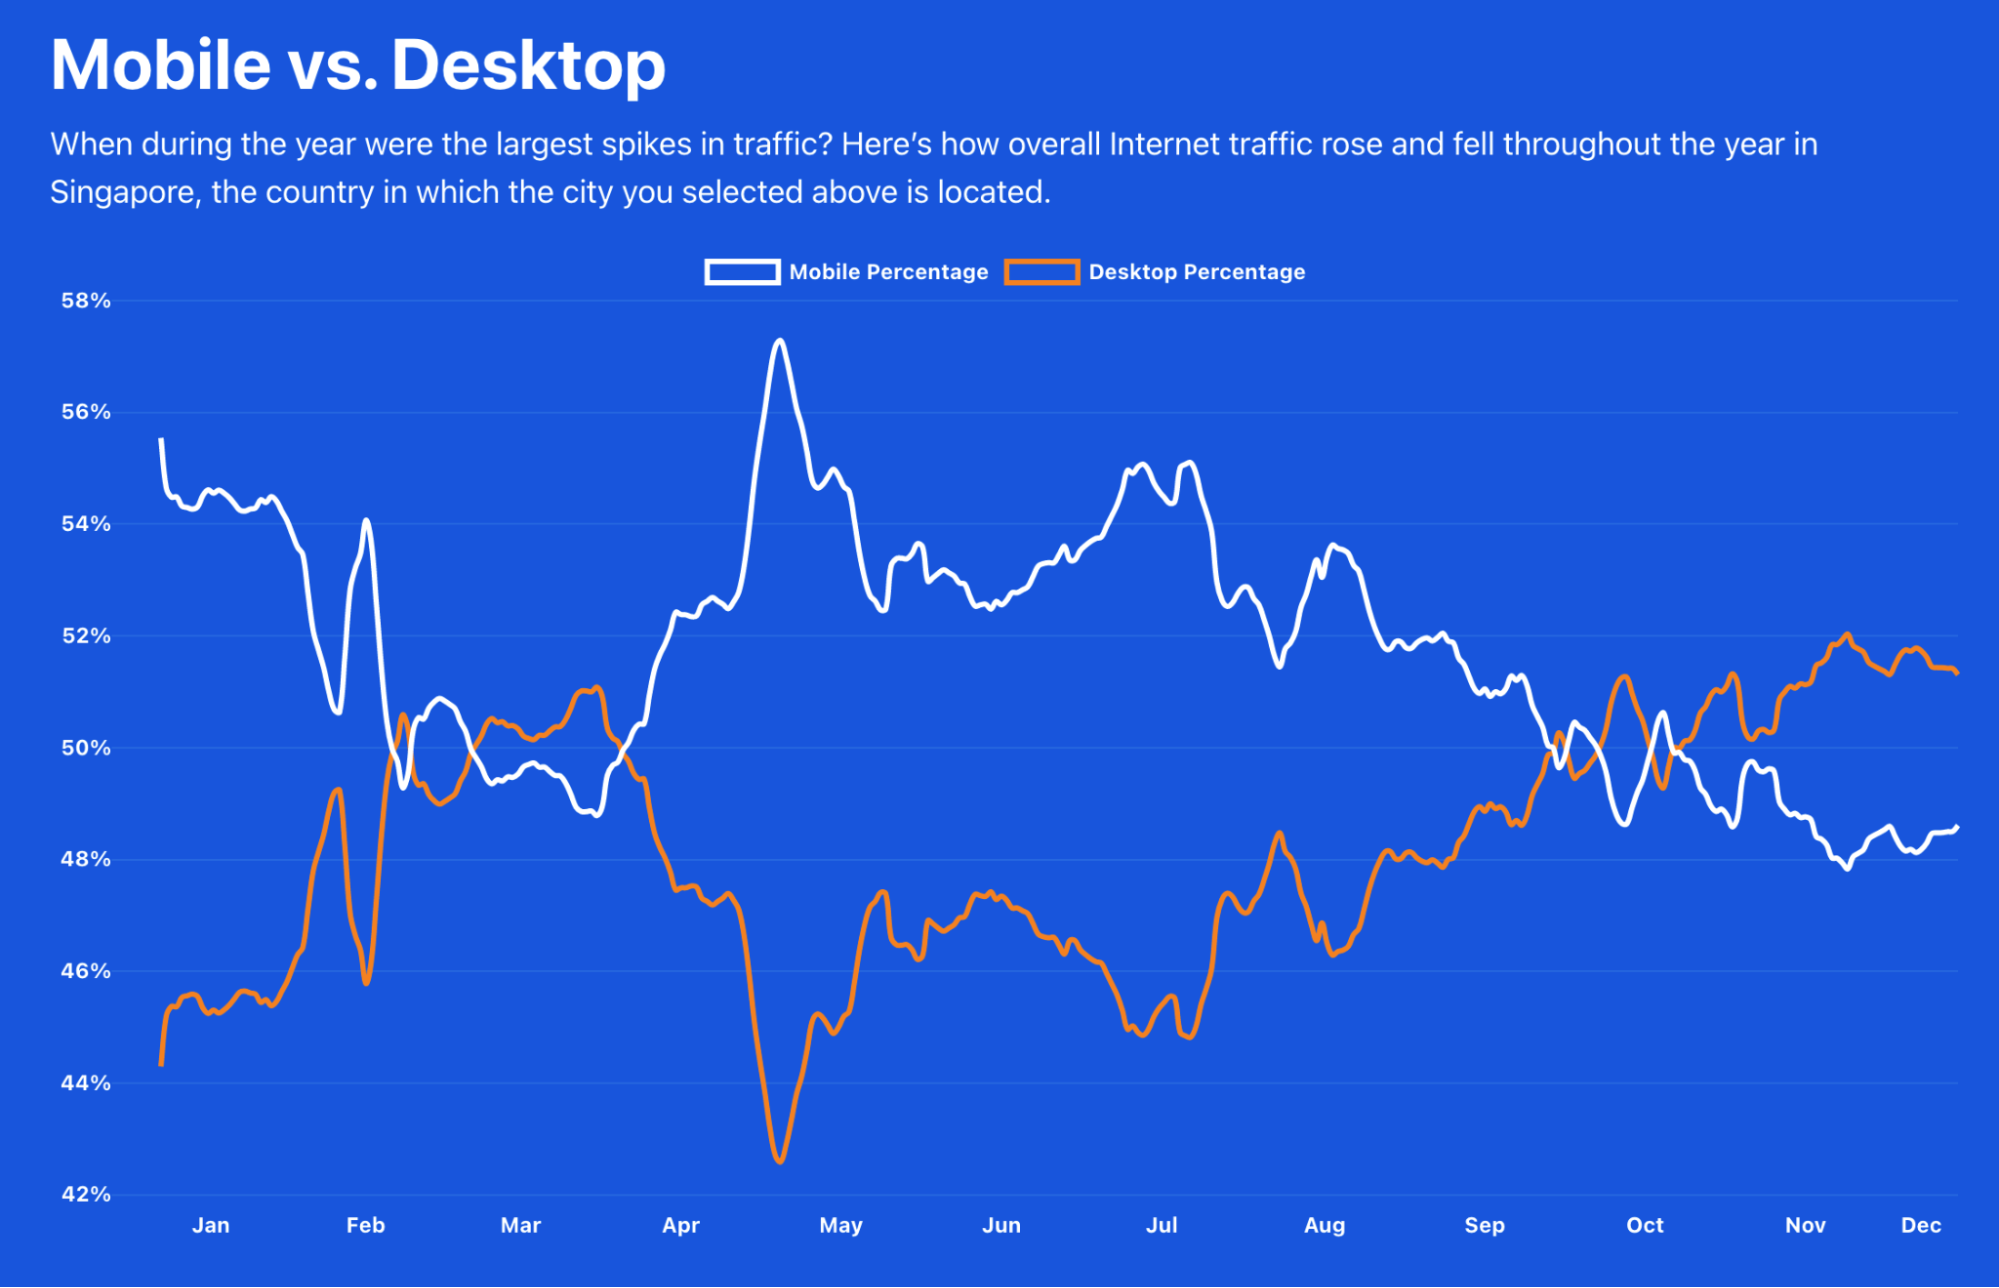
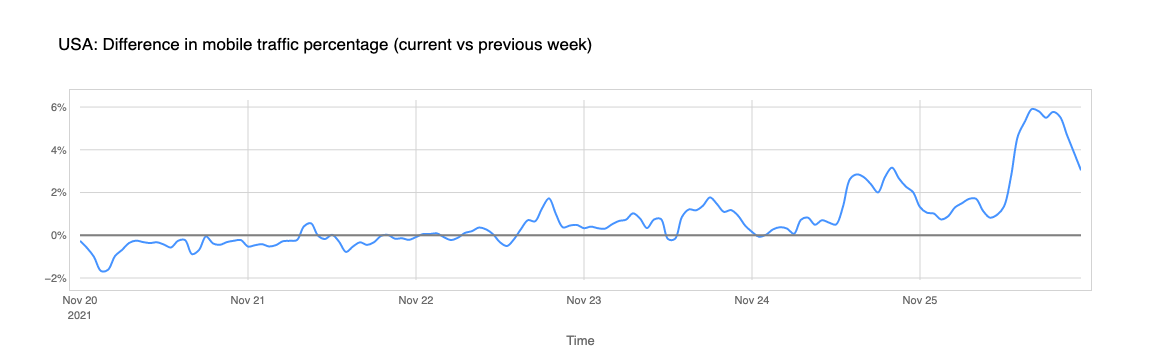
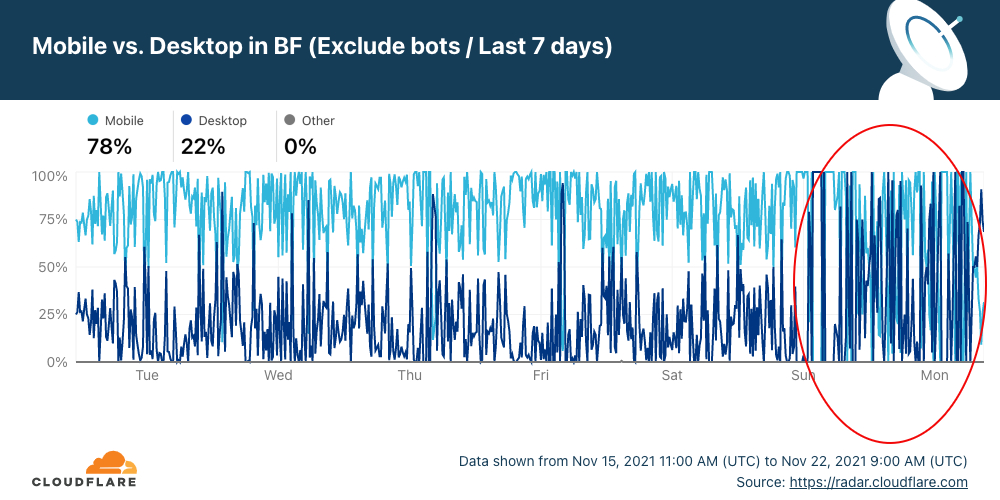
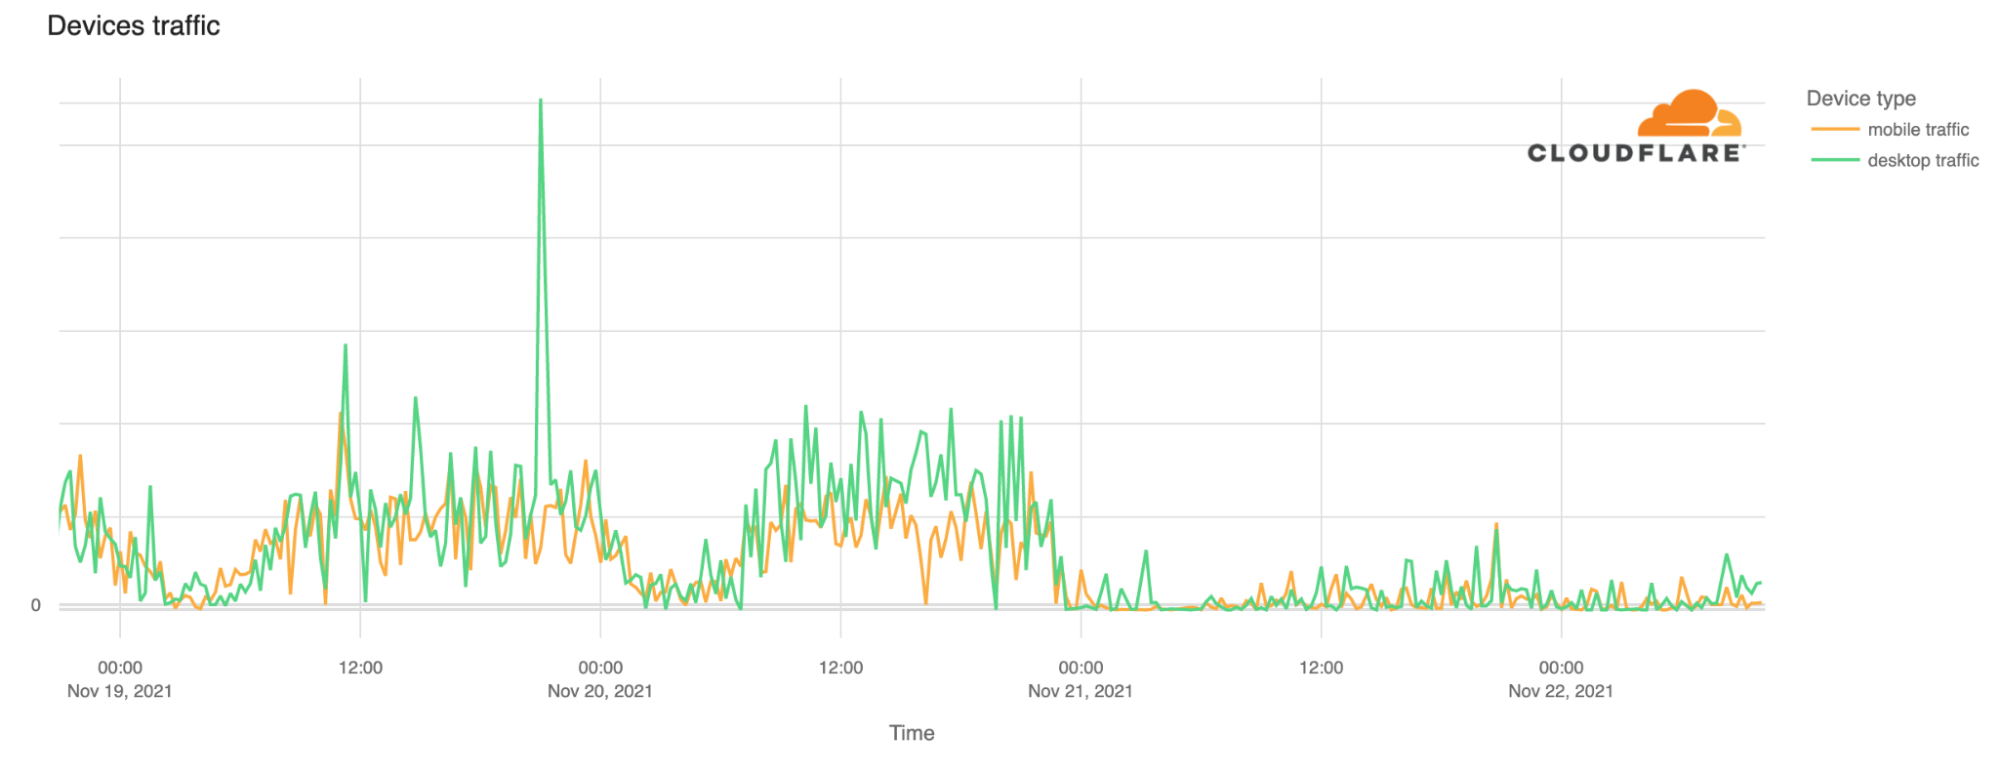
It’s not only mobile traffic that is affected. Desktop traffic is also impacted. In Burkina Faso, our data shows that mobile devices normally represent 70% of Internet traffic.
With the Burkina Faso disruption, three countries are currently mostly without access to the Internet for different reasons.
In Tonga, the nine day-long outage that we also explained is related to problems in the undersea cable caused by the large volcanic eruption in the South Pacific archipelago.
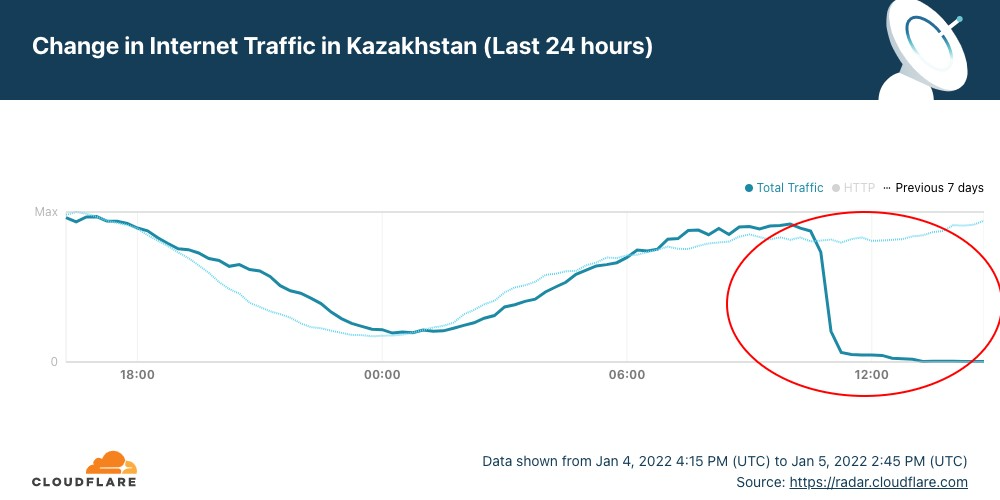
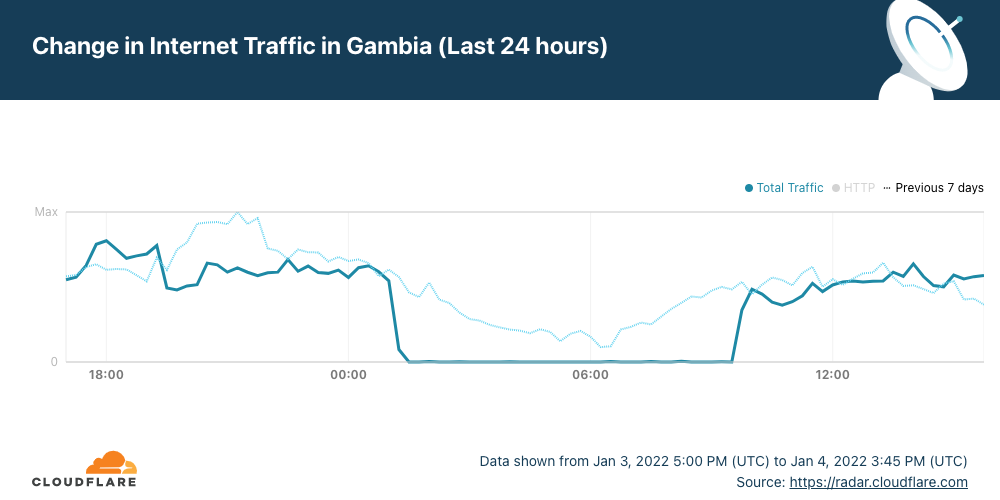
Several significant Internet disruptions have already occurred in 2022 for different reasons:
1. An Internet outage that lasted a few hours in The Gambia because of a cable problem (on January 4). 2. A six days Internet shutdown in Kazakhstan because of unrest (from January 5 to January 11). 3. A mobile Internet shutdown in Burkina Faso because of a coup plot (on January 10). 4. An Internet outage in Tonga because of a volcanic eruption (ongoing since January 15). 5. An Internet outage in Yemen because of airstrikes that affected a telecommunications building (ongoing since January 20,). 6. This second Internet disruption in Burkina Faso is related to military unrest (ongoing since January 23).
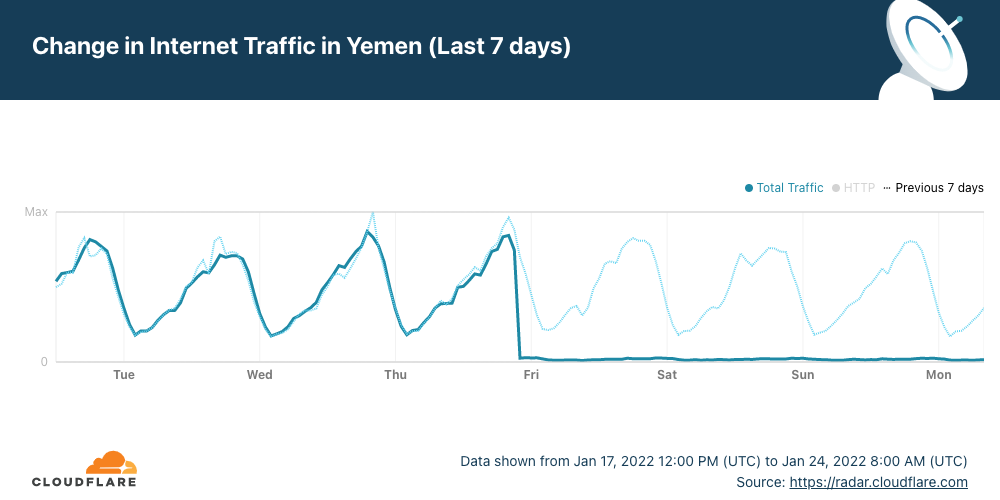
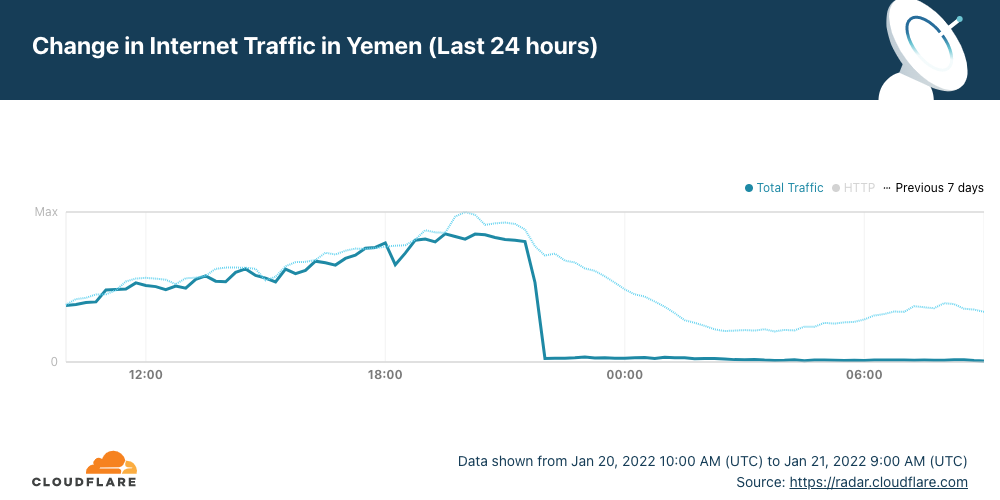
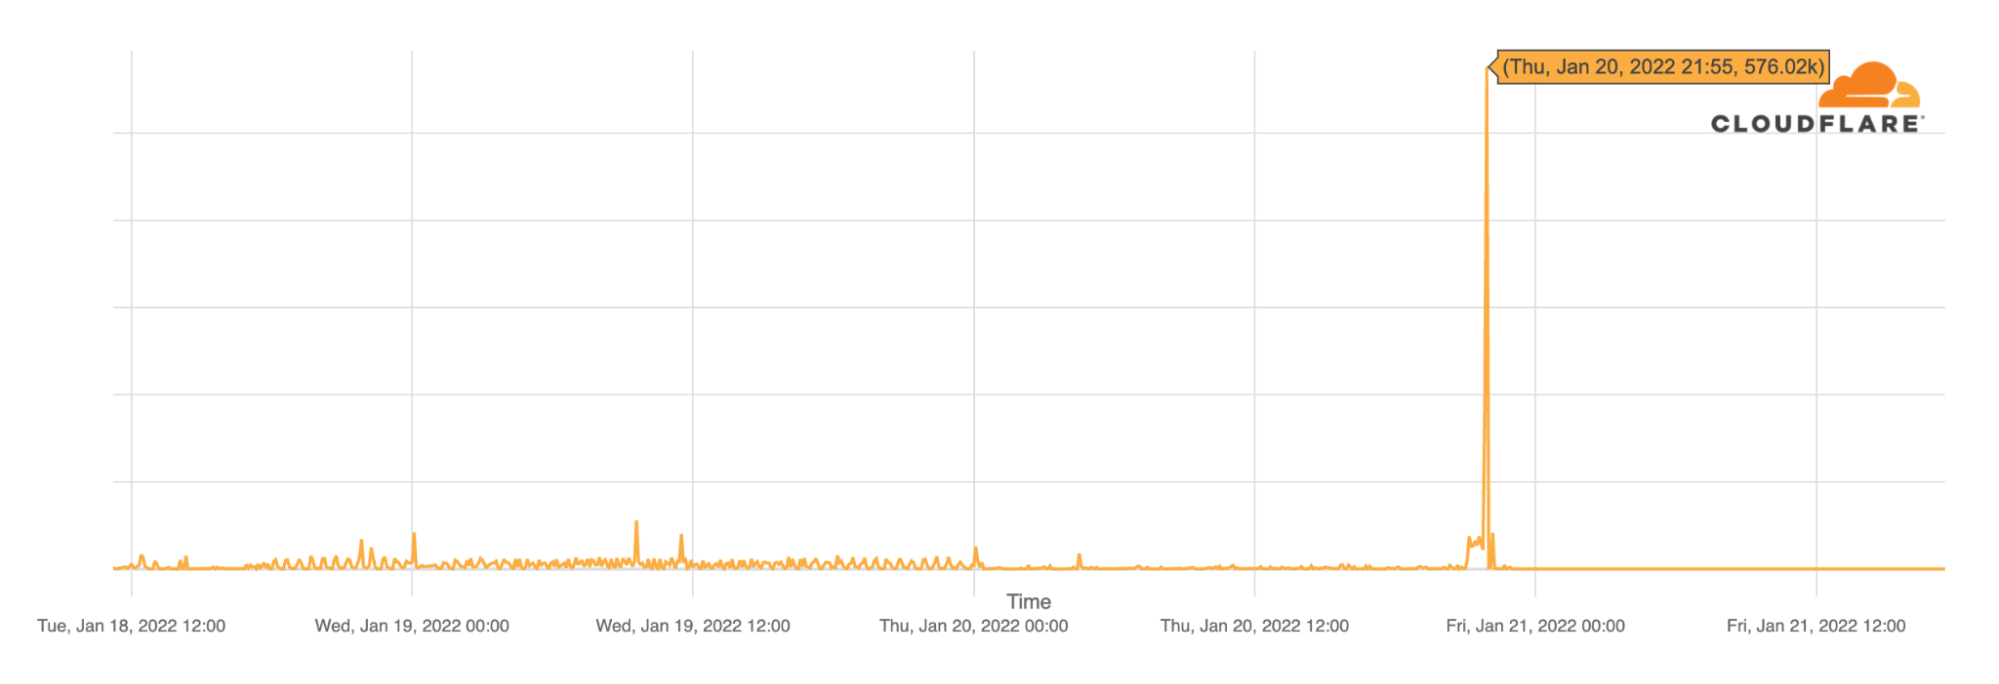
The early hours of Friday, January 21, 2022, started in Yemen with a country-wide Internet outage. According to local and global news reports airstrikes are happening in the country and the outage is likely related as there are reports that a telecommunications building in Al-Hudaydah where the FALCON undersea cable lands.
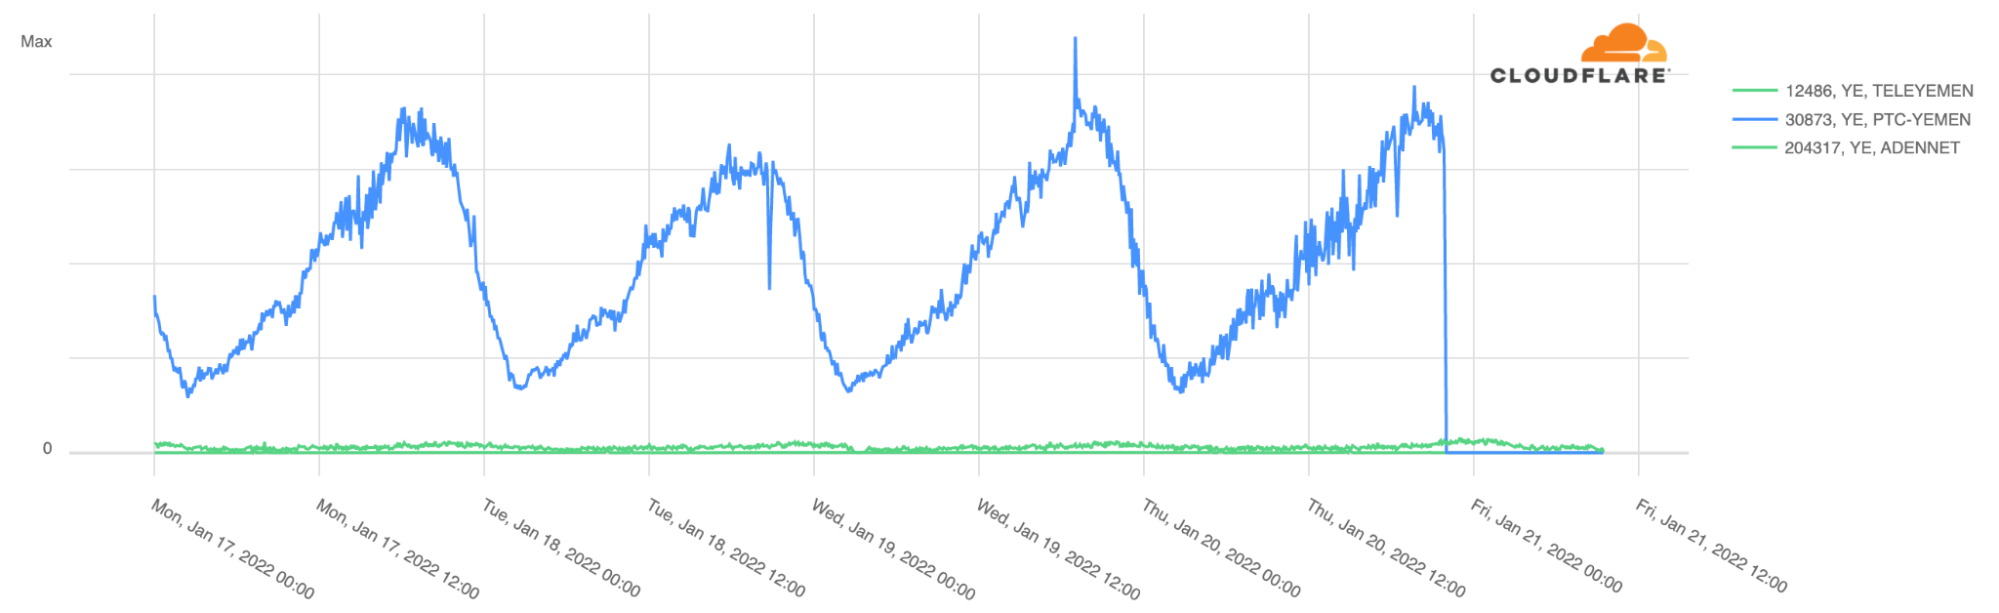
The outage affected the main state-owned ISP, Public Telecommunication Corporation (AS30873 in blue in the next chart), which represents almost all the Internet traffic in the country.
Looking at BGP (Border Gateway Protocol) updates from Yemen’s ASNs around the time of the outage, we see a clear spike at the same time the main ASN was affected ~21:55 UTC, January 20, 2022. These update messages are BGP signalling that Yemen’s main ASN was no longer routable, something similar to what we saw happening in The Gambia and Kazakhstan but for very different reasons.
So far, 2022 has started with a few significant Internet disruptions for different reasons:
1. An Internet outage in The Gambia because of a cable problem. 2. An Internet shutdown in Kazakhstan because of unrest. 3. A mobile Internet shutdown in Burkina Faso because of a coup plot. 4. An Internet outage in Tonga because of a volcanic eruption (still ongoing).
You can keep an eye on Cloudflare Radar to monitor this situation as it unfolds.
2022 only has 19 days of existence but so far this January, there have already been four significant Internet disruptions:
1. An Internet outage in The Gambia because of a cable problem. 2. An Internet shutdown in Kazakhstan because of unrest. 3. A mobile Internet shutdown in Burkina Faso because of a coup plot. 4. An Internet outage in Tonga because of a volcanic eruption.
The latest Internet outage, in the South Pacific country of Tonga (with 169 islands), is still ongoing. It started with the large eruption of Hunga Tonga–Hunga Haʻapai, an uninhabited volcanic island of the Tongan archipelago on Friday, January 14, 2022. The next day, Cloudflare Radar shows that the Internet outage started at around 03:00 UTC (16:00 local time) — Saturday, January 15, 2022 — and is ongoing for more than four days. Tonga’s 105,000 residents are almost entirely unreachable, according to the BBC.
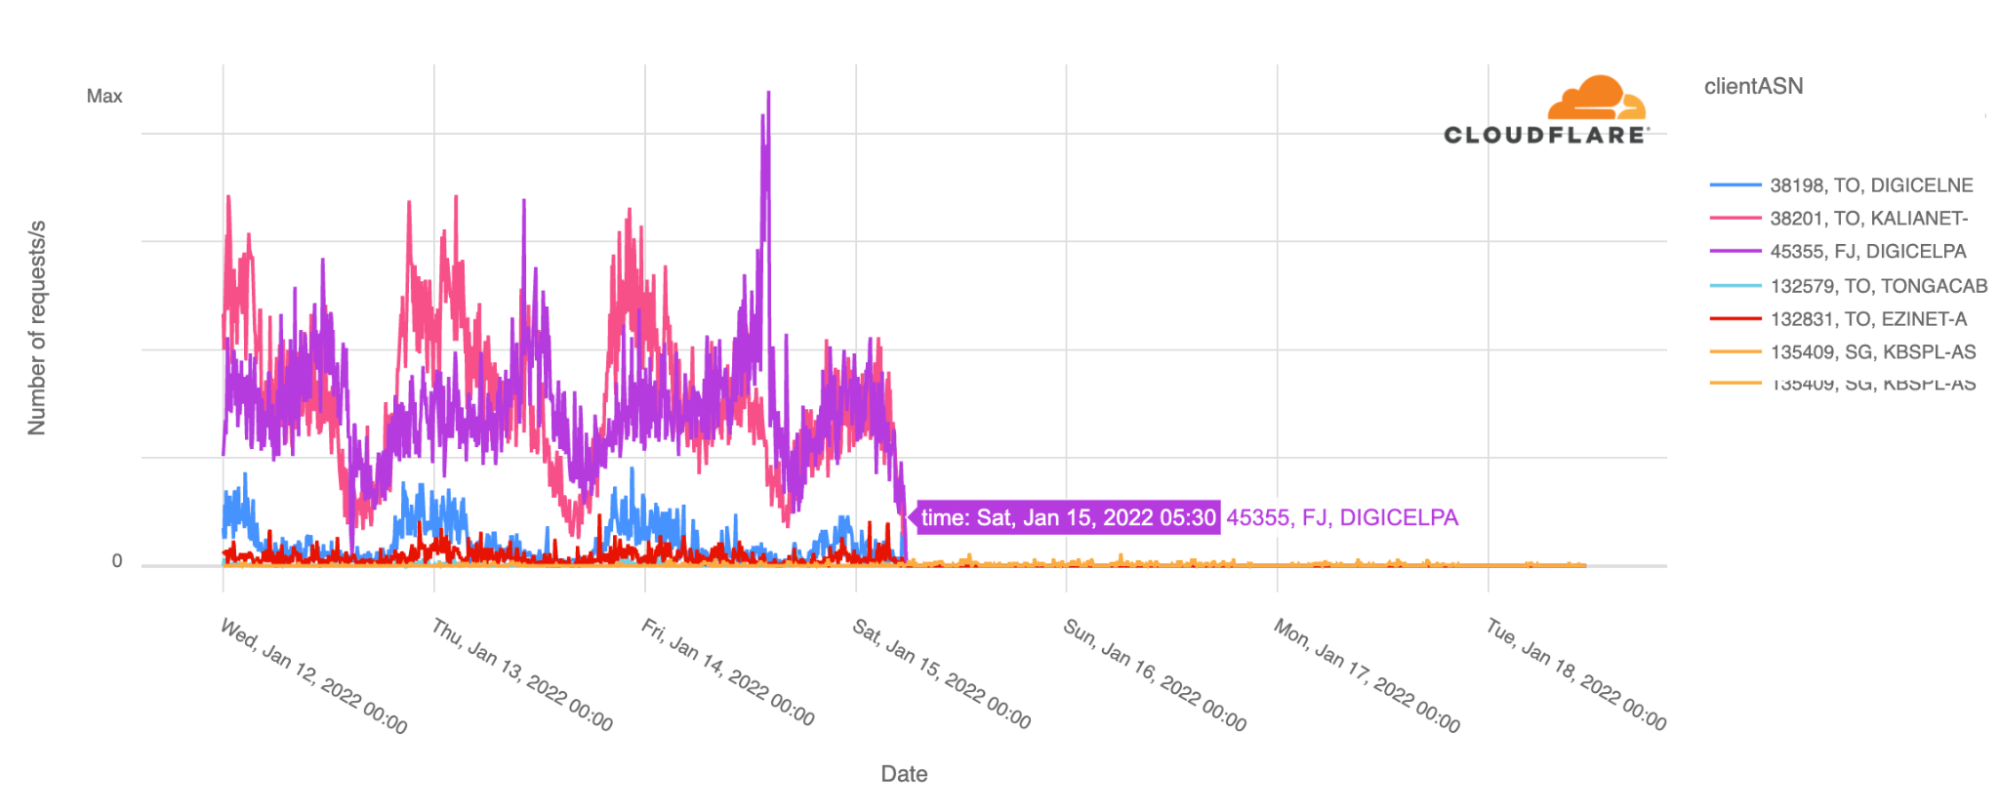
When we focus on the number of requests by ASN, the country’s main ISPs Digicel and Kalianet started to lose traffic after 03:00 UTC and by 05:30 UTC January 15, 2022, Cloudflare saw close to no traffic at all from them, as shown in the graph below.
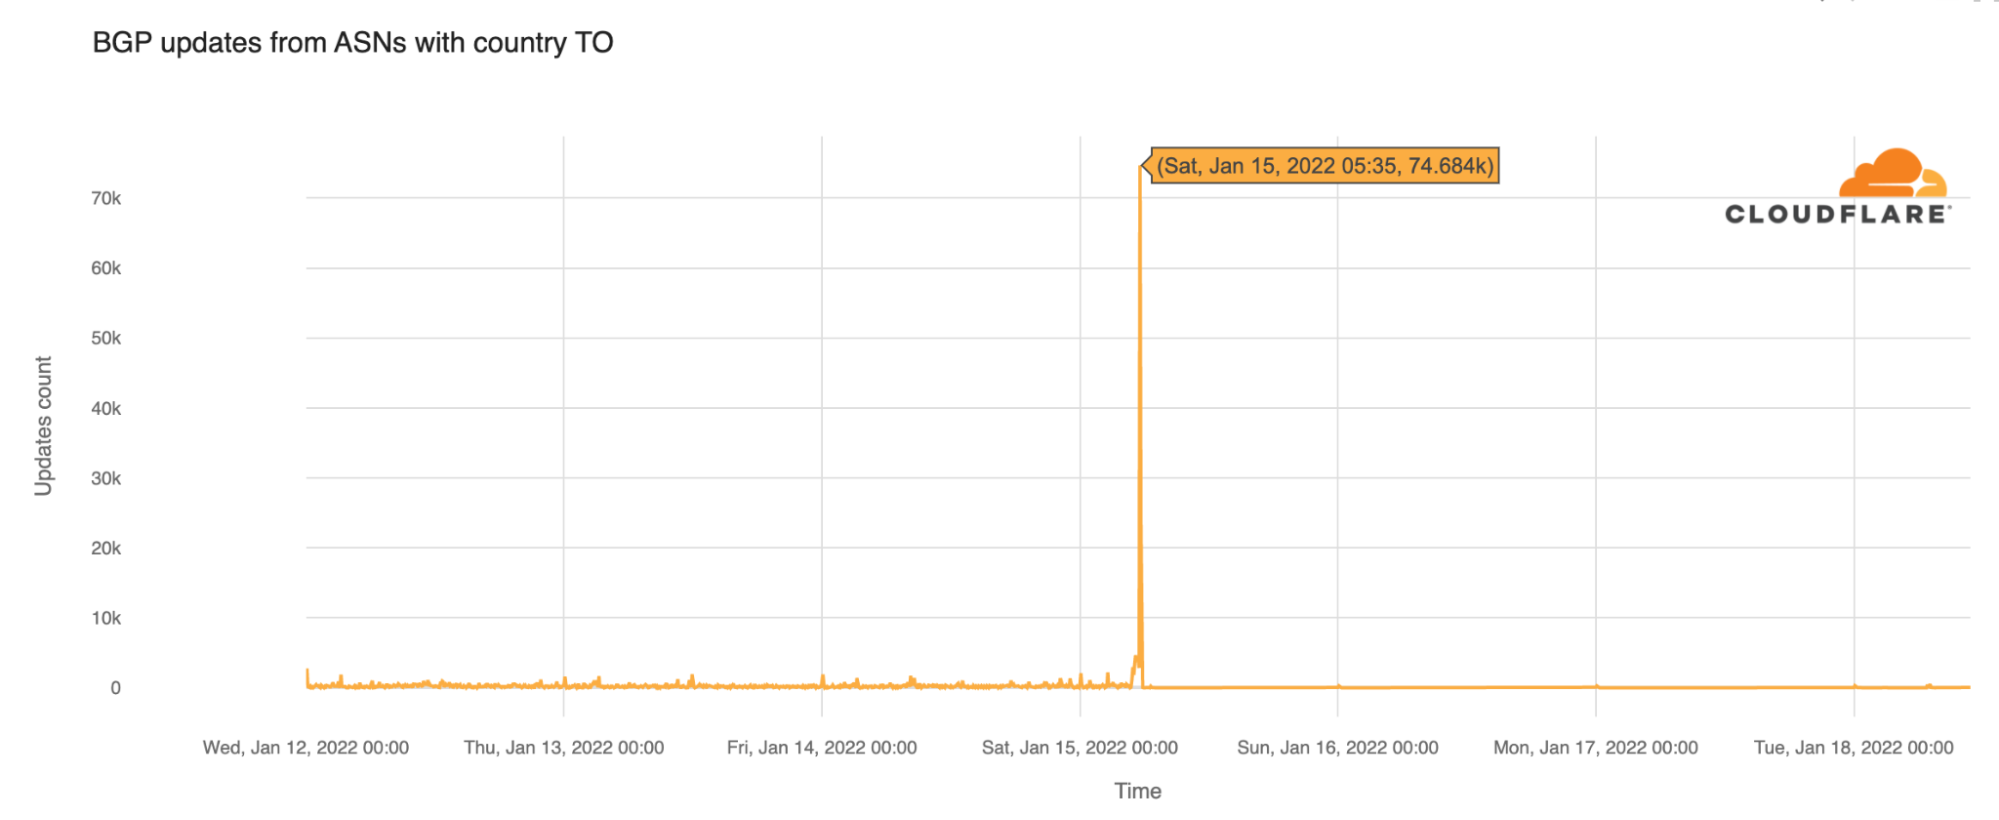
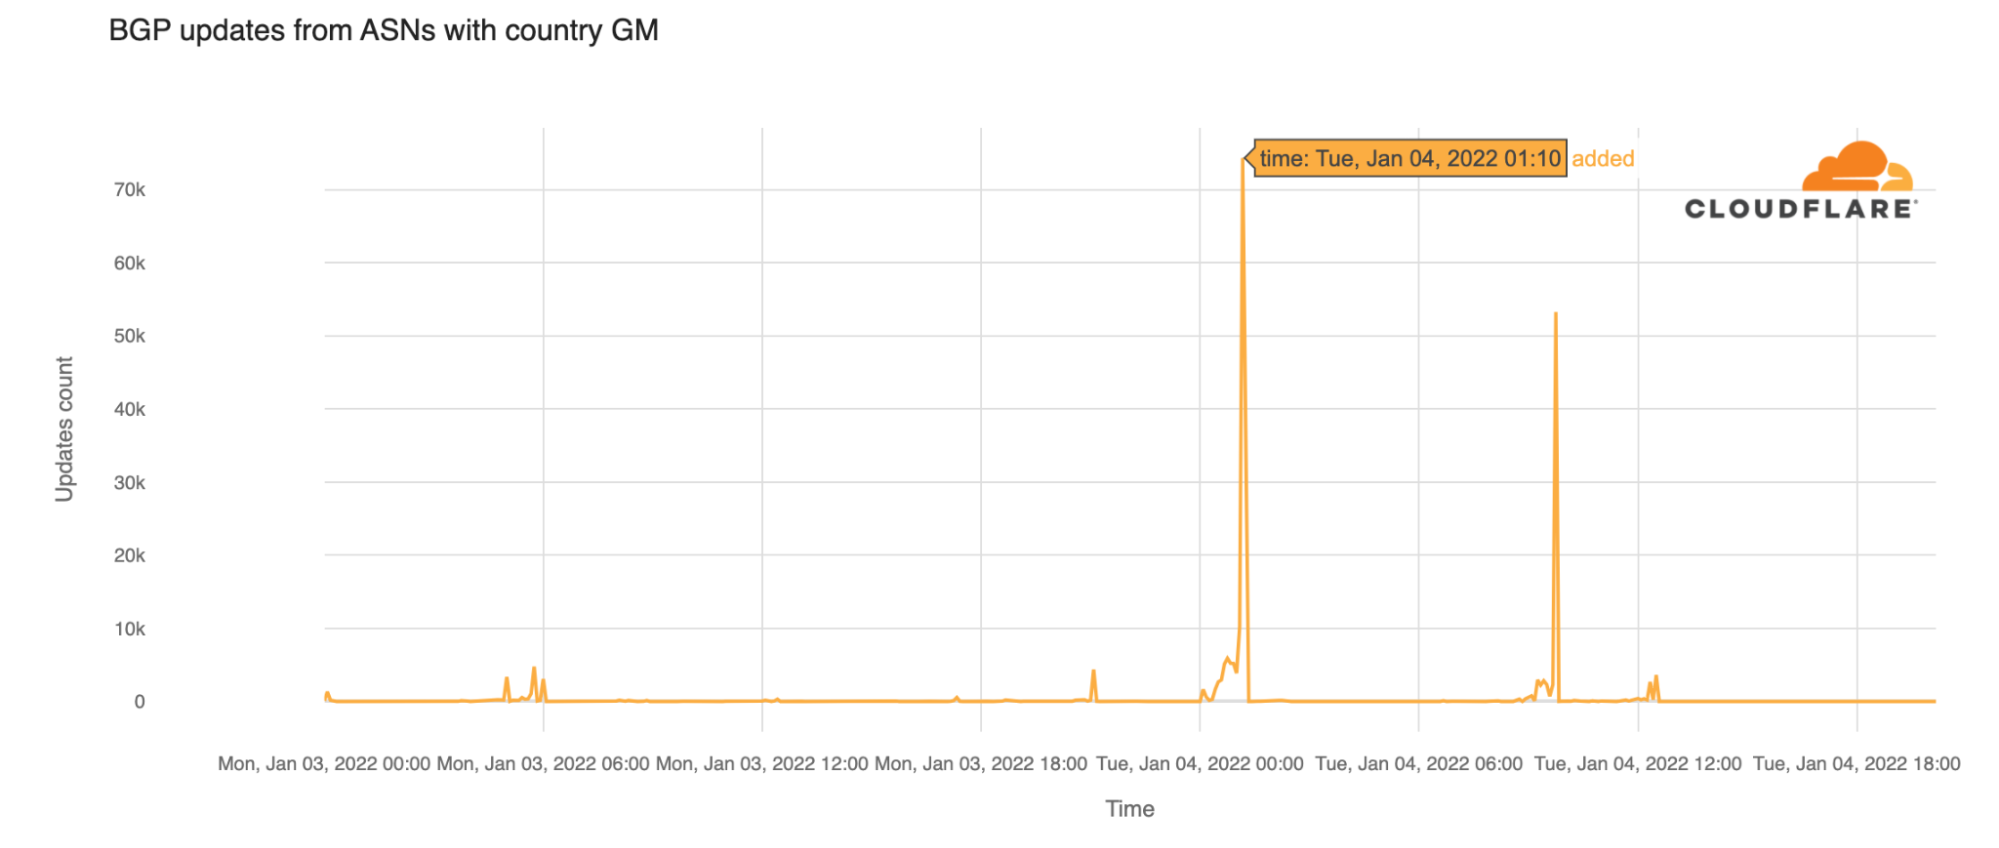
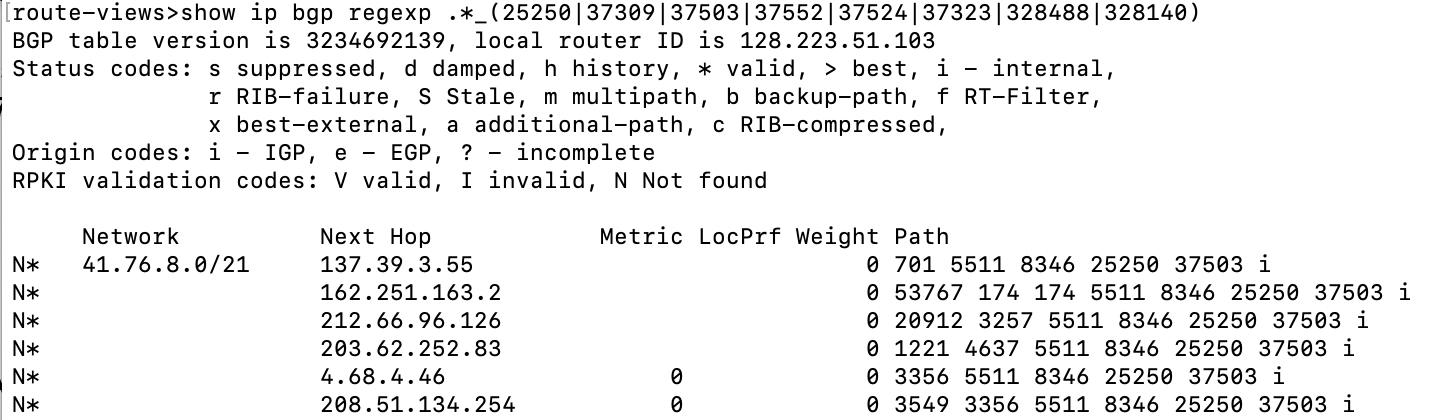
Looking at the BGP (Border Gateway Protocol) updates from Tonga’s ASNs around the time of the outage, we see a clear spike at 05:35 UTC (18:35 local time). These update messages are BGP signalling that the Tongan ASNs are no longer routable. We saw the same trend in The Gambia outage of January 4, 2022 — there you can read about the importance of BGP as a mechanism to exchange routing information between autonomous systems on the Internet, something that was also seen in the 2021 Facebook outage.
BGP updates from Tongan ASNs around the time of the outage.
Cloudflare Radar data doesn’t show any significant disruptions for Internet traffic in Tonga’s neighbours American Samoa (although there was a small decrease in traffic on Friday and Saturday, January 14 and 15, 2022 in comparison with the previous week) and Fiji. In American Samoa, all schools were closed on Friday, January 14, because of severe weather, and on the same day, after the volcanic eruption, there were tsunami warnings and evacuation to higher ground was advised (that continued through the weekend).
Tonga, as a geographically remote Polynesian country more than 800 km from the Fiji archipelago, is highly dependent on the Internet for communications. That is something that was improved five years ago with an infrastructure connectivity program from the World Bank. Prior to that, the country was dependent on satellite links for Internet that included a very small percentage of the population.
Repairs could take a few weeks
Southern Cross Cable Network confirmed that the 827 km fiber-optic undersea communications cable connecting Tonga to the outside world may have been broken. The company is assisting Tonga Cable Limited (TCL), which owns the single cable that provides Internet access and almost all communications to and from the archipelago.
The eruption resulted in a fault in the international cable 37 kilometres from Nukuʻalofa (Tonga’s capital), and a further fault in a domestic cable 47 km from the capital.
TCL announced that it has already met with the US cable company SubCom to start preparations for SubCom’s cable repair ship Reliance to be dispatched from Papua New Guinea to Tonga, possibly via Samoa (more than 4,000 km away).
The repairs could take “at least” four weeks, given that a repair to a fiber-optic cable that has been cut on the seabed is considered more complicated than misconfigurations, power outages or other types of infrastructure damage. “The site conditions in Tonga have to be assessed thoroughly because of volcanic activities,” according to TCL chairman Samiuela Fonua.
Fonua also mentioned that the last cable cut (back in 2019) took nearly two weeks to repair, but this time the site conditions will determine the time it will take — the two cables are not far away from the eruption site (the volcano is still active). According to ZDNet, in 2019 Tonga signed a 15-year deal with Kacific for satellite connectivity, but since then the satellite provider says it is waiting on the Tongan government to activate its contract.
Svalbard Undersea Cable System also disrupted in January
Also in January, Space Norway, the operator of the world’s most northern submarine cable — the Svalbard Undersea Cable System — announced that on January 7 it located a disruption in one of the two twin submarine fiber optic communication cables connecting Longyearbyen with Andøya north of Harstad in northern Norway (in the area where the seabed goes from 300 meters down to 2,700 meters in the Greenland Sea). A repair mission is being planned.
A world of undersea cables for the world’s communications
A significant amount of Internet traffic is carried by a complex network of undersea fiber-optic cables that connect countries and continents. The full submarine cable system (the first communications cables laid were from the 1850s and carried telegraphy traffic) is what makes most of the world’s Internet function between countries and continents. There are 428 active submarine cables (36 are planned), running in an estimate of 1.3 million km around the globe.
World map of submarine cables. Antarctica is the only continent not yet reached by a submarine telecommunications cable. Source: TeleGeography (www.submarinecablemap.com)
This gives a sense that the Internet is literally a network of networks in a world where estimates indicate that around 99% of the data traffic that is crossing oceans is carried by these undersea cables (satellite Internet, so far, is still residual — SpaceX has around 145,000 users).
The reliability of submarine cables is high, especially when multiple paths are available in the event of a cable break. That’s not the case for the Tonga outage, given that the 827 km submarine cable only connects Fiji to the Tonga archipelago — Fiji is connected to the main Southern Cross Cable, as the next image illustrates.
Submarine Cable Map shows the undersea cables that connect Australia to Fiji and the following connections to other archipelagos like Tonga. Source: TeleGeography (www.submarinecablemap.com)
🇹🇴Volcano Tonga-Hunga erupted Sat 15JAN22, causing extensive damage to the region, cutting off communications over both the TDCE domestic cable and the 🇹🇴-🇫🇯 international cable
The total carrying capacity of submarine cables is enormous (EllaLink, the optical submarine cable linking the European and South American continents, for example, has 100 Tbps capacity) and grows year after year as the world gets more and more connected. For example, Google has recently finished a new cable with 350 Tbps of capacity. But, a transoceanic submarine cable system costs several hundred million dollars to construct. One of the latest, between Portugal and Egypt, with a total of 8,700 kilometers, is budgeted at 326 million euros.
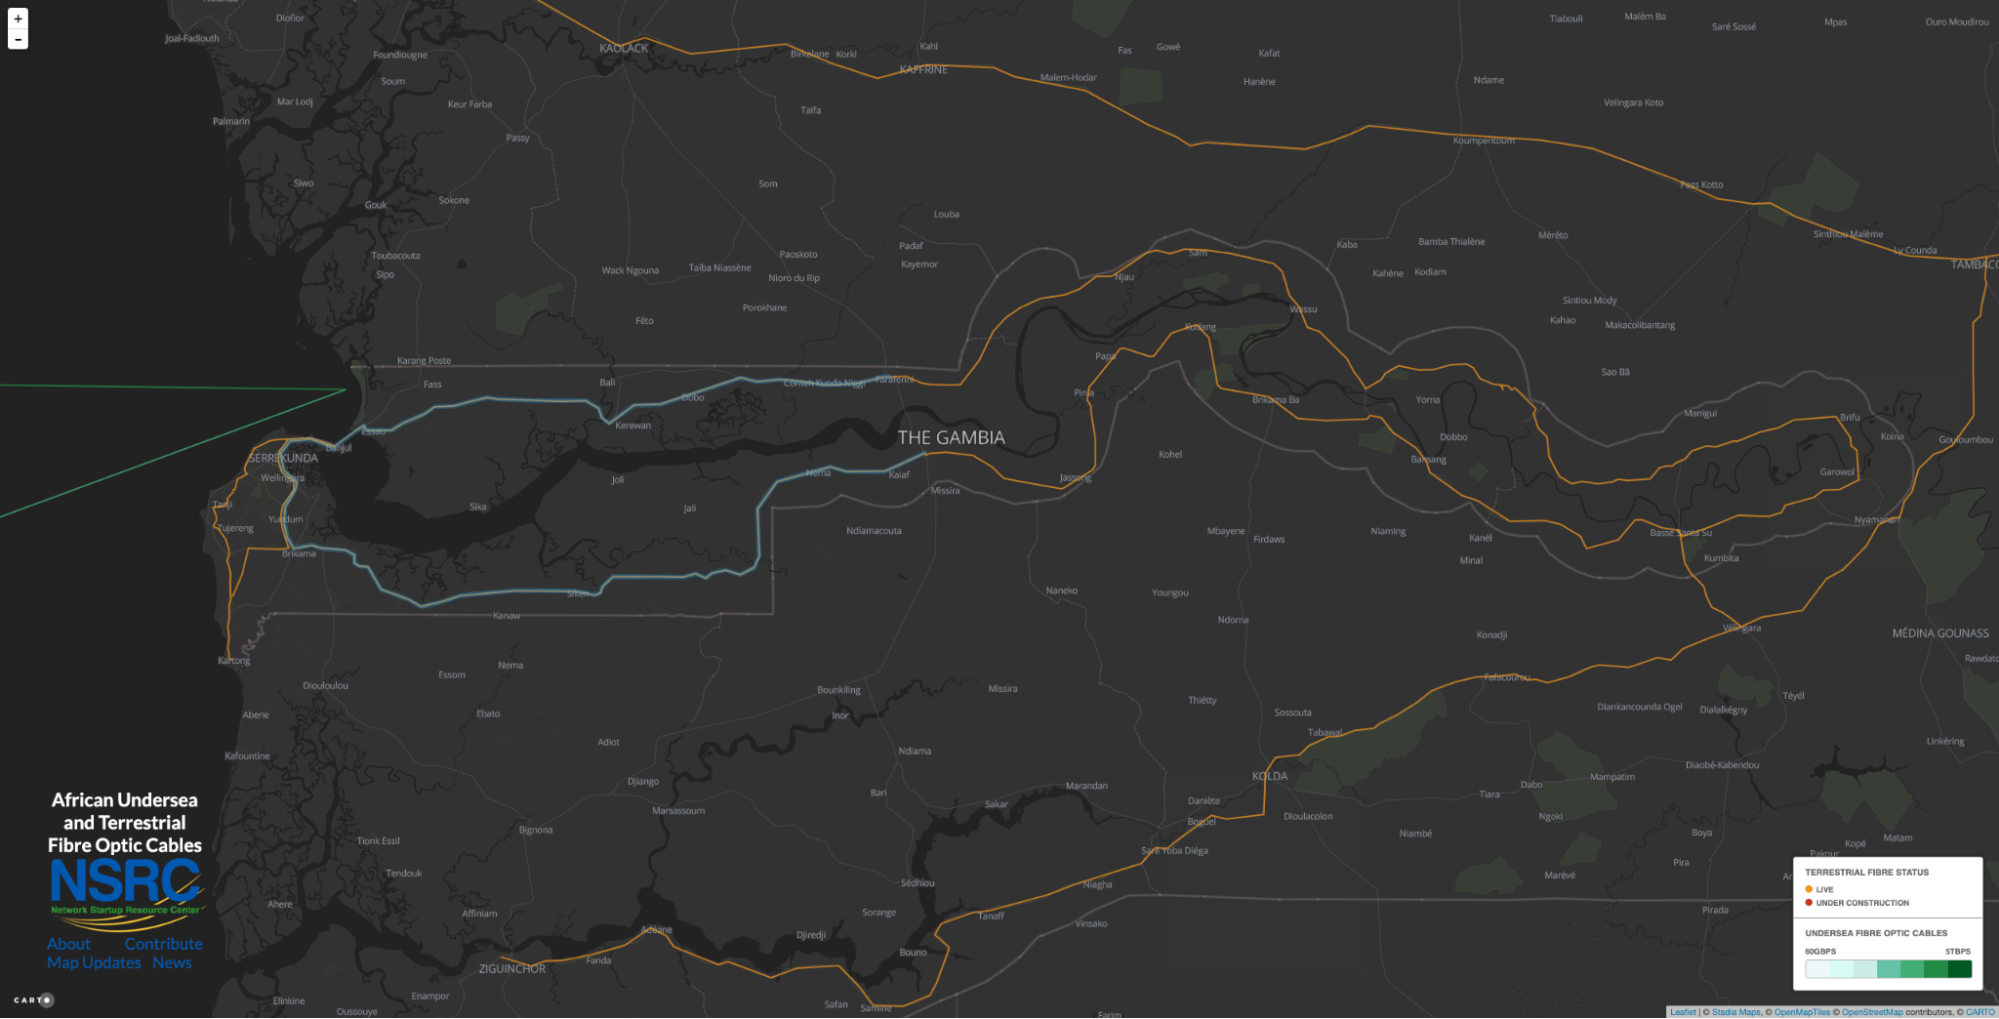
The Tonga outage was not the only one of 2022 (so far) that happened because of cable problems. The Gambia outage that affected the country’s main ISP, Gamtel, was because of “a primary link failure at ACE”, the cable system that serves 24 countries, from Europe to Africa, namely in the points of cable connections from Senegal to The Gambia.
In spite of these two fiber cable problems being separated by a few days at the start of 2022, Internet outages are more common because of situations like misconfigurations, power outages, extreme weather or the frequent state-imposed shutdowns to deal with unrest, elections or exams — recently this was the case of Sudan or Kazakhstan.
The first half of 2021 witnessed massive ransomware and ransom DDoS attack campaigns that interrupted aspects of critical infrastructure around the world (including one of the largest petroleum pipeline system operators in the US) and a vulnerability in IT management software that targeted schools, public sector, travel organizations, and credit unions, to name a few.
The second half of the year recorded a growing swarm of one of the most powerful botnets deployed (Meris) and record-breaking HTTP DDoS attacks and network-layer attacks observed over the Cloudflare network. This besides the Log4j2 vulnerability (CVE-2021-44228) discovered in December that allows an attacker to execute code on a remote server — arguably one of the most severe vulnerabilities on the Internet since both Heartbleed and Shellshock.
Prominent attacks such as the ones listed above are but a few examples that demonstrate a trend of intensifying cyber-insecurity that affected everyone, from tech firms and government organizations to wineries and meat processing plants.
Here are some DDoS attack trends and highlights from 2021 and Q4 ‘21 specifically:
In December alone, one out of every three survey respondents reported being targeted by a ransom DDoS attack or threatened by the attacker.
Application-layer DDoS attacks
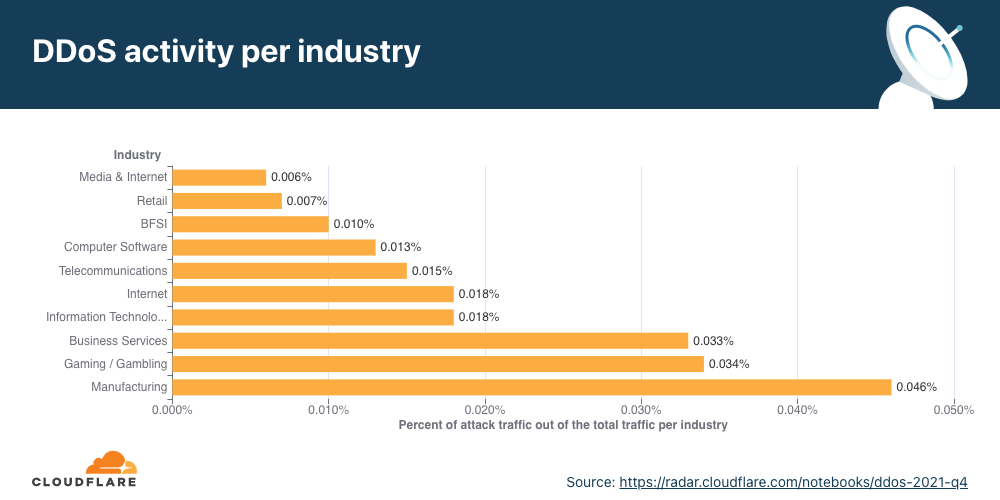
The Manufacturing industry was the most attacked in Q4 ’21, recording a whopping 641% increase QoQ in the number of attacks. The Business Services and Gaming/Gambling industries were the second and third most targeted industries by application-layer DDoS attacks.
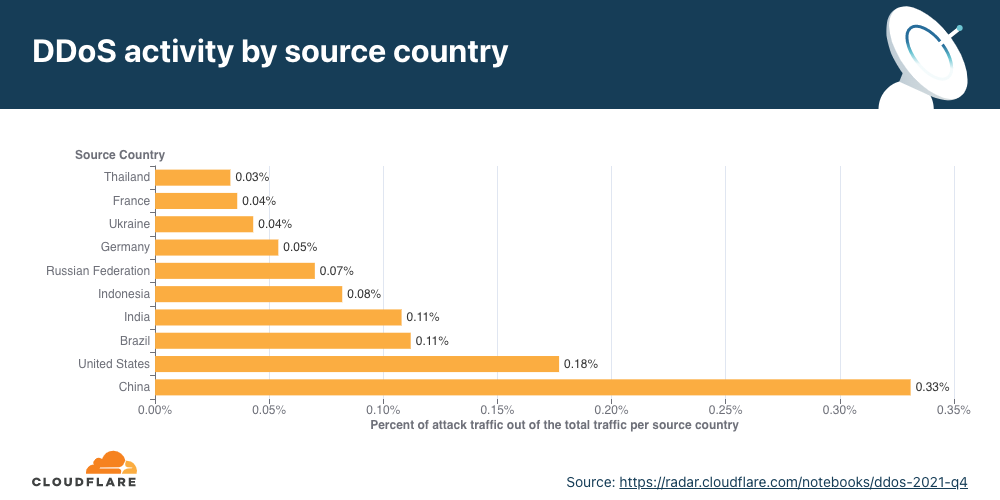
For the fourth time in a row this year, China topped the charts with the highest percentage of attack traffic originating from its networks.
Q4 ’21 was the busiest quarter for attackers in 2021. In December 2021 alone, there were more than all the attacks observed in Q1 and Q2 ’21 separately.
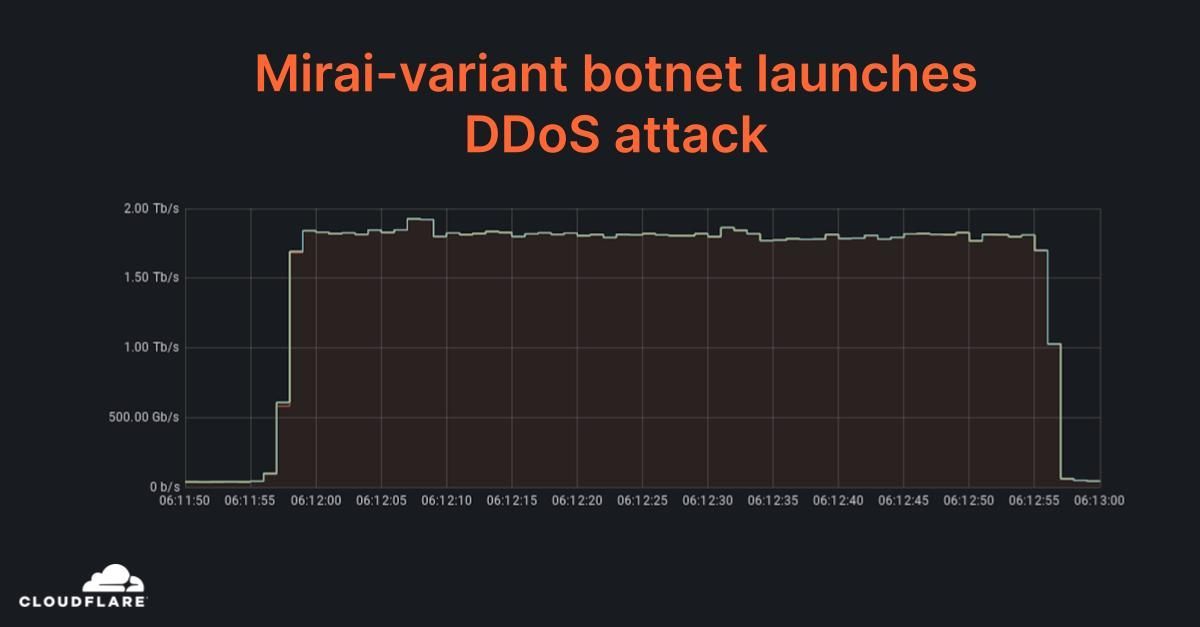
While the majority of attacks were small, terabit-strong attacks became the new norm in the second half of 2021. Cloudflare automatically mitigated dozens of attacks peaking over 1 Tbps, with the largest one peaking just under 2 Tbps — the largest we’ve ever seen.
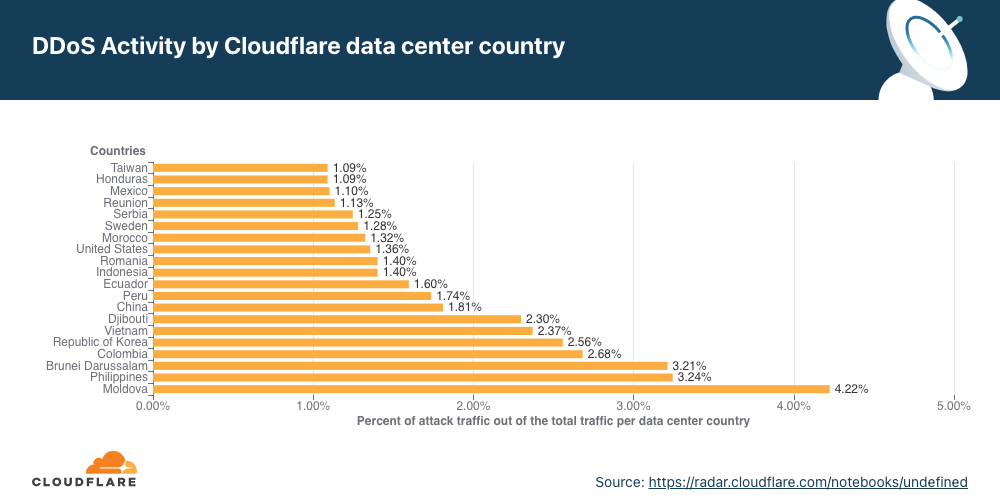
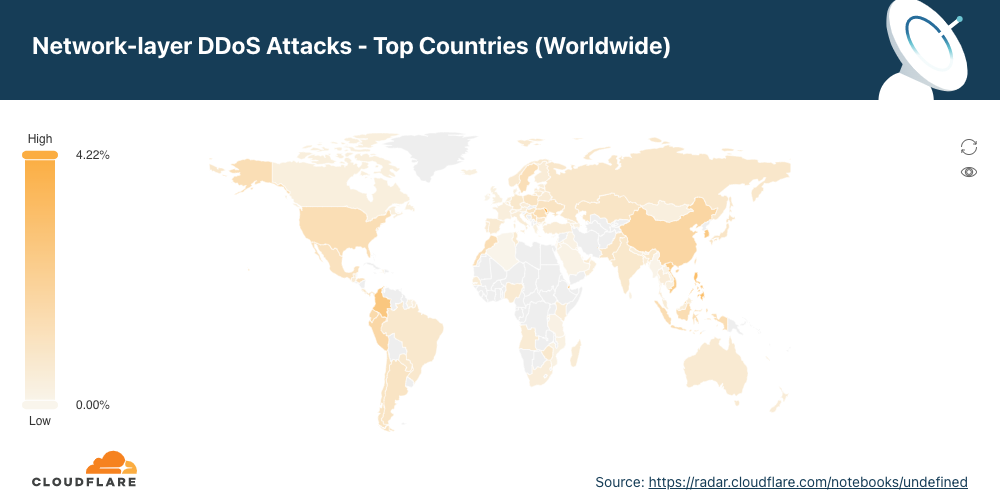
Attacks originating from Moldova quadrupled in Q4 ’21 QoQ, making it the country with the highest percentage of network-layer DDoS activity.
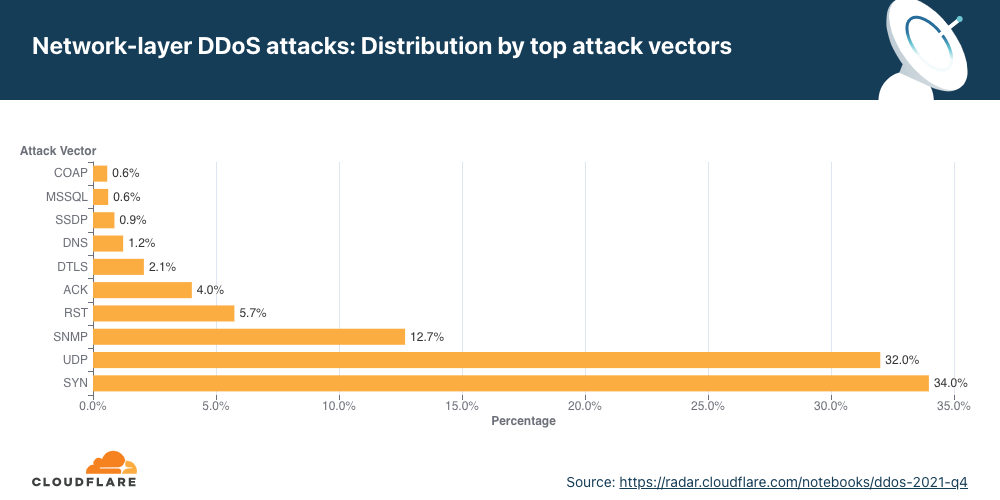
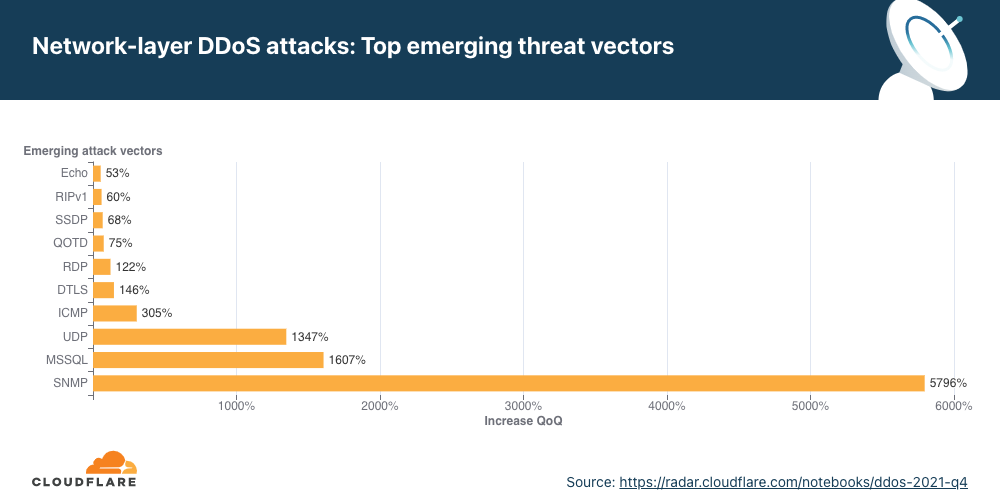
SYN floods and UDP floods were the most frequent attack vectors while emerging threats such as SNMP attacks increased by nearly 5,800% QoQ.
This report is based on DDoS attacks that were automatically detected and mitigated by Cloudflare’s DDoS Protection systems. To learn more about how it works, check out this deep-dive blog post.
A note on how we measure DDoS attacks observed over our network
To analyze attack trends, we calculate the “DDoS activity” rate, which is the percentage of attack traffic out of the total traffic (attack + clean) observed over our global network. Measuring attack numbers as a percentage of the total traffic observed allows us to normalize data points and avoid biases reflected in absolute numbers towards, for example, a Cloudflare data center that receives more total traffic and likely, also more attacks.
An interactive version of this report is available on Cloudflare Radar.
Ransom Attacks
Our systems constantly analyze traffic and automatically apply mitigation when DDoS attacks are detected. Each DDoS’d customer is prompted with an automated survey to help us better understand the nature of the attack and the success of the mitigation.
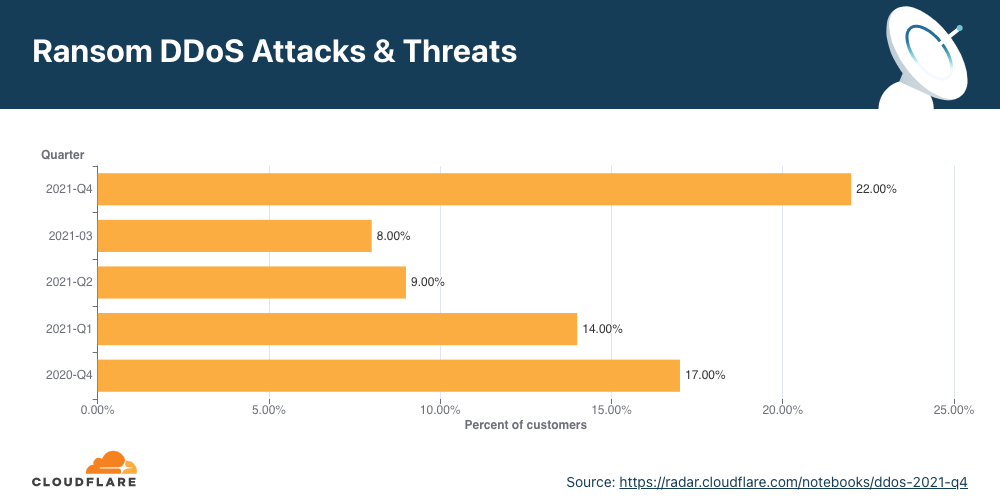
For over two years now, Cloudflare has been surveying attacked customers — one question on the survey being if they received a ransom note demanding payment in exchange to stop the DDoS attack. Q4 ’21 recorded the highest survey responses ever that indicated ransom threats — ransom attacks increased by 29% YoY and 175% QoQ. More specifically, one out of every 4.5 respondents (22%) reported receiving a ransom letter demanding payment by the attacker.
The percentage of respondents reported being targeted by a ransom DDoS attack or that have received threats in advance of the attack.
When we break it down by month, we can see that December 2021 topped the charts with 32% of respondents reporting receiving a ransom letter — that’s nearly one out of every three surveyed respondents.
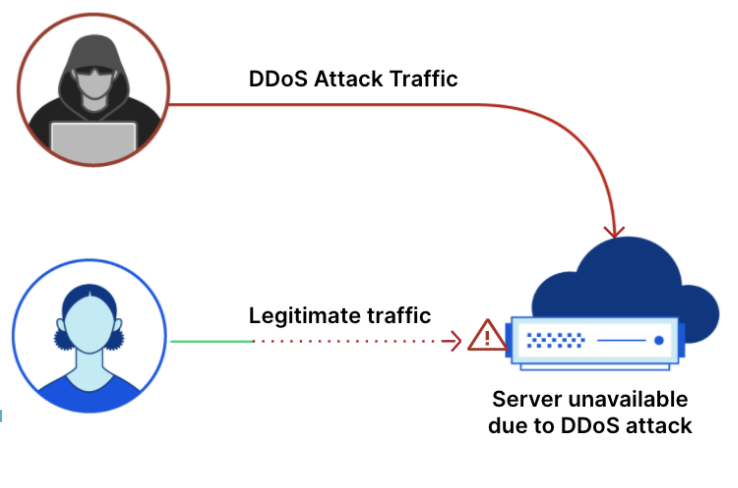
Application-layer DDoS attacks
Application-layer DDoS attacks, specifically HTTP DDoS attacks, are attacks that usually aim to disrupt a web server by making it unable to process legitimate user requests. If a server is bombarded with more requests than it can process, the server will drop legitimate requests and — in some cases — crash, resulting in degraded performance or an outage for legitimate users.
Application-layer DDoS attacks by industry
In Q4, DDoS attacks on Manufacturing companies increased by 641% QoQ, and DDoS attacks on the Business Services industry increased by 97%.
When we break down the application-layer attacks targeted by industry, the Manufacturing, Business Services, and Gaming/Gambling industries were the most targeted industries in Q4 ’21.
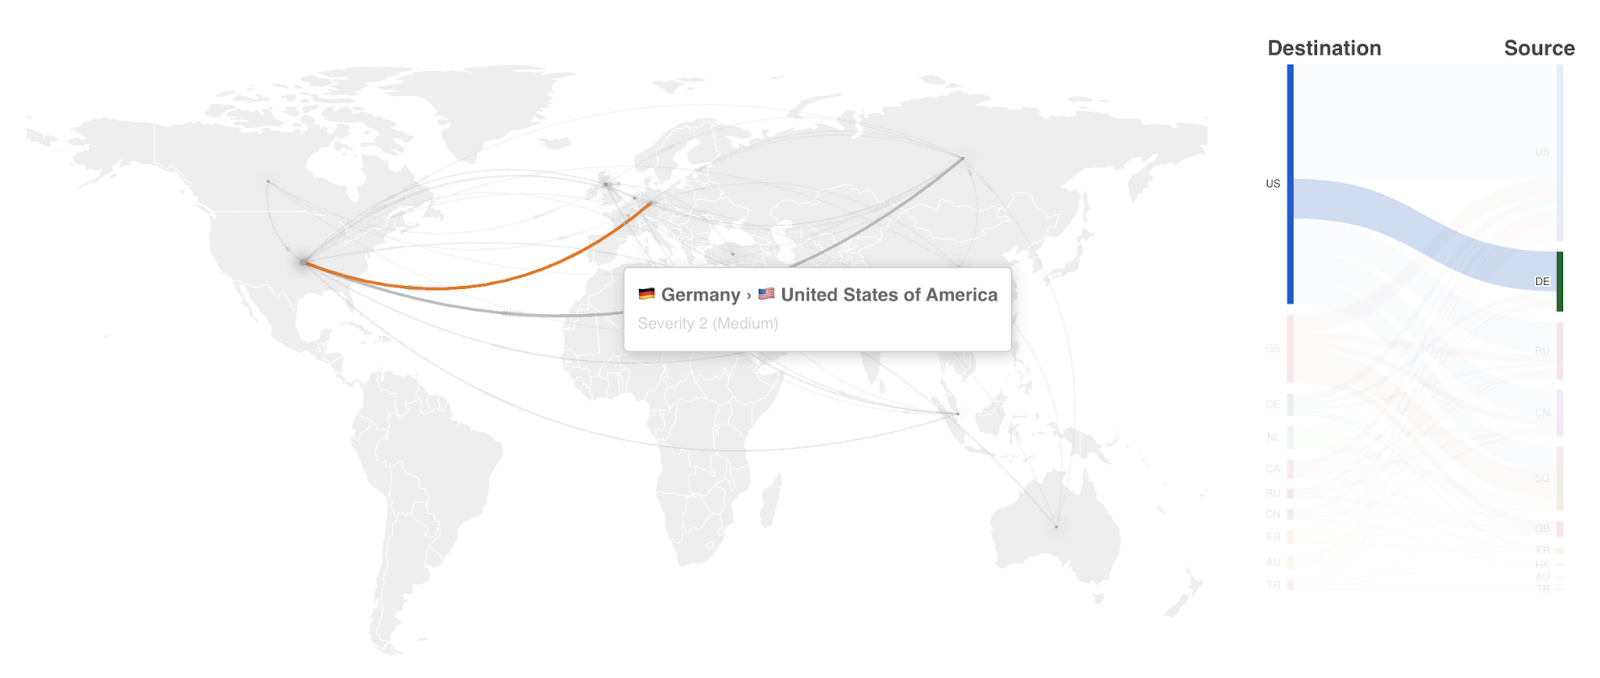
Application-layer DDoS attacks by source country
To understand the origin of the HTTP attacks, we look at the geolocation of the source IP address belonging to the client that generated the attack HTTP requests. Unlike network-layer attacks, source IP addresses cannot be spoofed in HTTP attacks. A high percentage of DDoS activity in a given country usually indicates the presence of botnets operating from within the country’s borders.
For the fourth quarter in a row, China remains the country with the highest percentage of DDoS attacks originating from within its borders. More than three out of every thousand HTTP requests that originated from Chinese IP addresses were part of an HTTP DDoS attack. The US remained in second place, followed by Brazil and India.
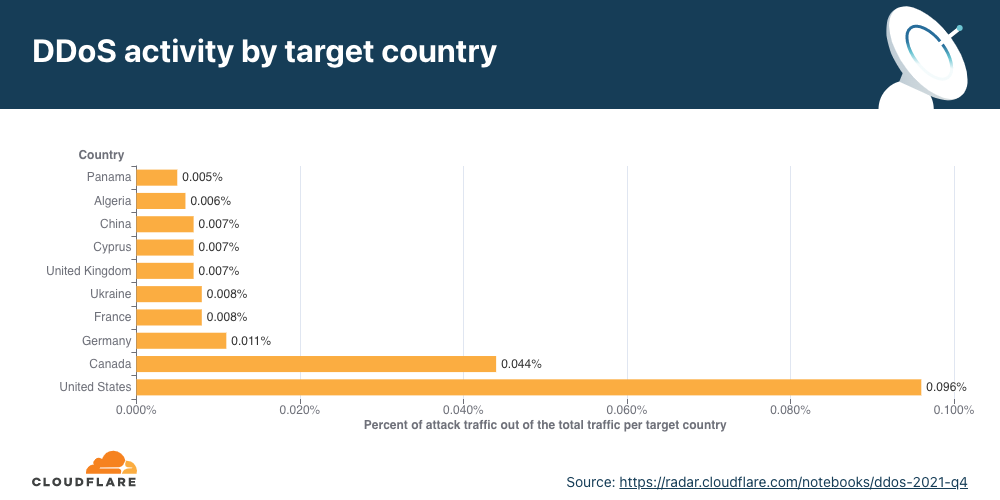
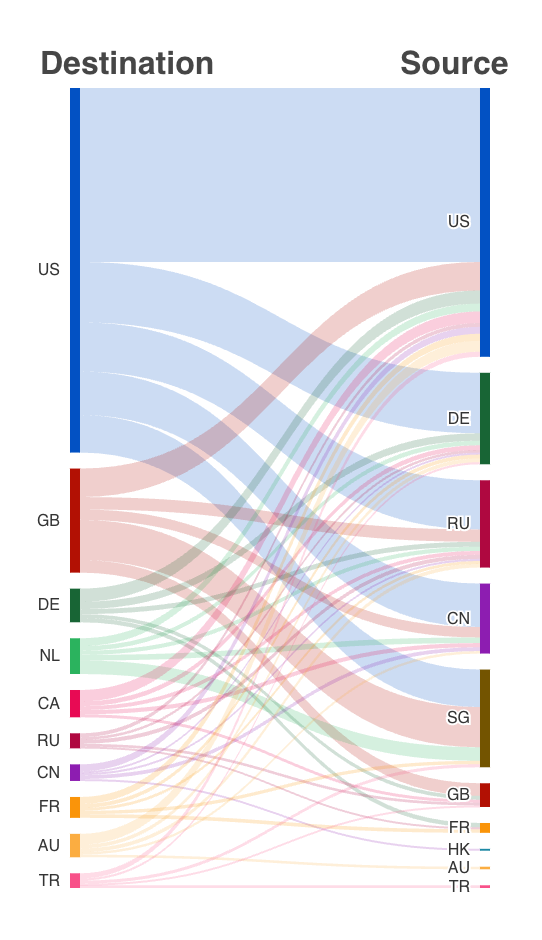
Application-layer DDoS attacks by target country
In order to identify which countries are targeted by the most HTTP DDoS attacks, we bucket the DDoS attacks by our customers’ billing countries and represent it as a percentage out of all DDoS attacks.
For the third consecutive time this year, organizations in the United States were targeted by the most HTTP DDoS attacks, followed by Canada and Germany.
Network-layer DDoS attacks
While application-layer attacks target the application (Layer 7 of the OSI model) running the service that end users are trying to access, network-layer attacks aim to overwhelm network infrastructure (such as in-line routers and servers) and the Internet link itself.
Cloudflare thwarts an almost 2 Tbps attack
In November, our systems automatically detected and mitigated an almost 2 Tbps DDoS attack. This was a multi-vector attack combining DNS amplification attacks and UDP floods. The entire attack lasted just one minute. The attack was launched from approximately 15,000 bots running a variant of the original Mirai code on IoT devices and unpatched GitLab instances.
Network-layer DDoS attacks by month
December was the busiest month for attackers in 2021.
Q4 ‘21 was the busiest quarter in 2021 for attackers. Over 43% of all network-layer DDoS attacks took place in the fourth quarter of 2021. While October was a relatively calmer month, in November, the month of the Chinese Singles’ Day, the American Thanksgiving holiday, Black Friday, and Cyber Monday, the number of network-layer DDoS attacks nearly doubled. The number of observed attacks increased towards the final days of December ’21 as the world prepared to close out the year. In fact, the total number of attacks in December alone was higher than all the attacks in Q2 ’21 and almost equivalent to all attacks in Q1 ’21.
Network-layer DDoS attacks by attack rate
While most attacks are still relatively ‘small’ in size, terabit-strong attacks are becoming the norm.
There are different ways of measuring the size of an L3/4 DDoS attack. One is the volume of traffic it delivers, measured as the bit rate (specifically, terabits per second or gigabits per second). Another is the number of packets it delivers, measured as the packet rate (specifically, millions of packets per second).
Attacks with high bit rates attempt to cause a denial-of-service event by clogging the Internet link, while attacks with high packet rates attempt to overwhelm the servers, routers, or other in-line hardware appliances. These devices dedicate a certain amount of memory and computation power to process each packet. Therefore, by bombarding it with many packets, the appliance can be left with no further processing resources. In such a case, packets are “dropped,” i.e., the appliance is unable to process them. For users, this results in service disruptions and denial of service.
The distribution of attacks by their size (in bit rate) and month is shown below. As seen in the graph above, the majority of attacks took place in December. However, the graph below illustrates that larger attacks, over 300 Gbps in size, took place in November. Most of the attacks between 5-20 Gbps took place in December.
Distribution by packet rate
An interesting correlation Cloudflare has observed is that when the number of attacks increases, their size and duration decrease. In the first two-thirds of 2021, the number of attacks was relatively small, and correspondingly, their rates increased, e.g., in Q3 ’21, attacks ranging from 1-10 million packets per second (mpps) increased by 196%. In Q4 ’21, the number of attacks increased and Cloudflare observed a decrease in the size of attacks. 91% of all attacks peaked below 50,000 packets per second (pps) — easily sufficient to take down unprotected Internet properties.
Larger attacks of over 1 mpps decreased by 48% to 28% QoQ, while attacks peaking below 50K pps increased by 2.36% QoQ.
Distribution by bit rate
Similar to the trend observed in packet-intensive attacks, the amount of bit-intensive attacks shrunk as well. While attacks over 1 Tbps are becoming the norm, with the largest one we’ve ever seen peak just below 2 Tbps, the majority of attacks are still small and peaked below 500 Mbps (97.2%).
In Q4 ’21, larger attacks of all ranges above 500 Mbps saw massive decreases ranging from 35% to 57% for the larger 100+ Gbps attacks.
Network-layer DDoS attacks by duration
Most attacks remain under one hour in duration, reiterating the need for automated always-on DDoS mitigation solutions.
We measure the duration of an attack by recording the difference between when it is first detected by our systems as an attack and the last packet we see with that attack signature towards that specific target. In the last quarter of 2021, 98% of all network-layer attacks lasted less than one hour. This is very common as most of the attacks are short-lived. Even more so, a trend we’ve seen is that when the number of attacks increases, as in this quarter, their rate and duration decreases.
Short attacks can easily go undetected, especially burst attacks that, within seconds, bombard a target with a significant number of packets, bytes, or requests. In this case, DDoS protection services that rely on manual mitigation by security analysis have no chance in mitigating the attack in time. They can only learn from it in their post-attack analysis, then deploy a new rule that filters the attack fingerprint and hope to catch it next time. Similarly, using an “on-demand” service, where the security team will redirect traffic to a DDoS provider during the attack, is also inefficient because the attack will already be over before the traffic routes to the on-demand DDoS provider.
It’s recommended that companies use automated, always-on DDoS protection services that analyze traffic and apply real-time fingerprinting fast enough to block short-lived attacks.
Attack vectors
SYN floods remain attackers’ favorite method of attack, while attacks over SNMP saw a massive surge of almost 5,800% QoQ.
An attack vector is a term used to describe the method that the attacker uses to launch their DDoS attack, i.e., the IP protocol, packet attributes such as TCP flags, flooding method, and other criteria.
For the first time in 2021, the percentage of SYN flood attacks significantly decreased. Throughout 2021, SYN floods accounted for 54% of all network-layer attacks on average. While still grabbing first place as the most frequent vector, its share dropped by 38% QoQ to 34%.
However, it was a close-run for SYN attacks and UDP attacks. A UDP flood is a type of denial-of-service attack in which a large number of User Datagram Protocol (UDP) packets are sent to a targeted server with the aim of overwhelming that device’s ability to process and respond. Oftentimes, the firewall protecting the targeted server can also become exhausted as a result of UDP flooding, resulting in a denial-of-service to legitimate traffic. Attacks over UDP jumped from fourth place in Q3 ’21 to second place in Q4 ’21, with a share of 32% of all network-layer attacks — a 1,198% increase in QoQ.
In third place came the SNMP underdog that made a massive leap with its first time 2021 appearance in the top attack vectors.
Emerging threats
When we look at emerging attack vectors — which helps us understand what new vectors attackers are deploying to launch attacks — we observe a massive spike in SNMP, MSSQL, and generic UDP-based DDoS attacks.
Both SNMP and MSSQL attacks are used to reflect and amplify traffic on the target by spoofing the target’s IP address as the source IP in the packets used to trigger the attack.
Simple Network Management Protocol (SNMP) is a UDP-based protocol that is often used to discover and manage network devices such as printers, switches, routers, and firewalls of a home or enterprise network on UDP well-known port 161. In an SNMP reflection attack, the attacker sends out a large number of SNMP queries while spoofing the source IP address in the packet as the targets to devices on the network that, in turn, reply to that target’s address. Numerous responses from the devices on the network results in the target network being DDoSed.
Similar to the SNMP amplification attack, the Microsoft SQL (MSSQL) attack is based on a technique that abuses the Microsoft SQL Server Resolution Protocol for the purpose of launching a reflection-based DDoS attack. The attack occurs when a Microsoft SQL Server responds to a client query or request, attempting to exploit the Microsoft SQL Server Resolution Protocol (MC-SQLR), listening on UDP port 1434.
Network-layer DDoS attacks by country
Attacks originating from Moldova quadrupled, making it the country with the highest percentage of network-layer DDoS activity.
When analyzing network-layer DDoS attacks, we bucket the traffic by the Cloudflare edge data center locations where the traffic was ingested, and not by the source IP. The reason for this is that, when attackers launch network-layer attacks, they can spoof the source IP address in order to obfuscate the attack source and introduce randomness into the attack properties, which can make it harder for simple DDoS protection systems to block the attack. Hence, if we were to derive the source country based on a spoofed source IP, we would get a spoofed country.
Cloudflare is able to overcome the challenges of spoofed IPs by displaying the attack data by the location of the Cloudflare data center in which the attack was observed. We are able to achieve geographical accuracy in our report because we have data centers in over 250 cities around the world.
To view all regions and countries, check out the interactive map.
Summary
Cloudflare’s mission is to help build a better Internet. A better Internet is one that is more secure, faster, and reliable for everyone — even in the face of DDoS attacks. As part of our mission, since 2017, we’ve been providing unmetered and unlimited DDoS protection for free to all of our customers. Over the years, it has become increasingly easier for attackers to launch DDoS attacks. To counter the attacker’s advantage, we want to make sure that it is also easy and free for organizations of all sizes to protect themselves against DDoS attacks of all types.
In Kazakhstan, the year had barely got going when yesterday disruptions of Internet access ended up in a nationwide Internet shutdown from today, January 5, 2022. The disruptions and subsequent shutdown happened amid mass protests against sudden energy price rises.
Cloudflare Radar shows that the full shutdown happened after 10:30 UTC (16:30 local time). But it was preceded by restrictions to mobile Internet access yesterday.
Our data confirm that Kazakhstan’s ASNs were affected after that time (around 18:30 local time). That’s particularly evident with the largest telecommunication company in the country, Kaz Telecom, as the next chart shows.
The first disruptions reported affected mobile services, and we can see that at around 14:30 UTC yesterday, January 4, 2022, there was significantly less mobile devices traffic than the day before around the same time. Kazakhstan is a country where mobile represents something like 75% of Internet traffic (shown on Radar), a usual trend in the region. So mobile disruption has a big impact on the country’s Internet, even before the shutdown that affected almost all connectivity.
When we focus on other ASNs besides Kaz Telecom such as the leading mobile Internet services Tele2 or Kcell we can see a big drop in traffic yesterday after 16:00 UTC, confirming local reports. Mobile traffic did not drop to zero which may indicate throttling rather than a full shutdown. Today, however, the Internet, mobile or not, is shut down.
Looking at BGP (Border Gateway Protocol) updates from Kazakhstan’s ASNs around the time of the shutdown, we see a clear spike at exactly the same time the bigger ASNs were affected ~10:45 UTC, January 5, 2022. These update messages are BGP signaling that Kazakhstan’s ASNs are no longer routable, something similar to what we saw happening in The Gambia yesterday but for very different reasons.
The Kazakhstan case is similar to other state-imposed shutdowns that also happen all too frequently, generally used to deal with situations of unrest, elections or even exams. There are similarities with the Sudan 25-day shutdown that we reported at the end of 2021, the Sudanese prime minister resigned this week in the aftermath of those shutdowns, but it’s very different from the Internet outage in The Gambia that we reported today.
You can keep an eye on Cloudflare Radar to monitor how we see Internet traffic globally and in every country.
Internet outages are more common than most people think, and may be caused by misconfigurations, power outages, extreme weather, or infrastructure damage. Note that such outages are distinct from state-imposed shutdowns that also happen all too frequently, generally used to deal with situations of unrest, elections or even exams.
On the morning of January 4, 2022, citizens of The Gambia woke up to a country-wide Internet outage. Gamtel (the main state-owned telecommunications company of the West Africa country), announced that it happened due to “technical issues on the backup links” — we elaborate more on this below.
Cloudflare Radar shows that the outage had a significant impact on Internet traffic in the country and started after 01:00 UTC (which is the same local time), lasting until ~09:45 — a disruption of over 8 hours.
Looking at BGP (Border Gateway Protocol) updates from Gambian ASNs around the time of the outage, we see a clear spike at 01:10 UTC. These update messages are BGP signaling that the Gambian ASNs are no longer routable.
It is important to know that BGP is a mechanism to exchange routing information between autonomous systems (networks) on the Internet. The routers that make the Internet work have huge, constantly updated lists of the possible routes that can be used to deliver every network packet to their final destinations. Without BGP, the Internet routers wouldn’t know what to do, and the Internet wouldn’t work. As we saw in our blog post in 2021 about how Facebook disappeared from the Internet, the Internet is literally a network of networks, and it’s bound together by BGP.
The Gambia’s Internet access is solely dependent on a single provider, Gamtel. Because The Gambia’s international Internet connectivity via the ACE submarine cable was unavailable, it was reliant on the “backup links” referenced above – terrestrial connectivity via Senegal and the provider Sonatel. This is visible in BGP data. If we look at the ASNs that are allocated to networks in The Gambia (AS25250, AS37309, AS37503, AS37552, AS37524, AS37323, AS328488, AS328140), and put those into a regular expression on BGP routing tools like route-views as so:
route-views>show ip bgp regexp .*_(25250|37309|37503|37552|37524|37323|328488|328140)
We are able to see all the possible upstream ASN paths from these networks to the rest of the Internet.
Looking at the “Path” results, we see that AS8346 (Sonatel) and AS25250 (Gamtel) are in the path for all the Gambian networks.
Visualized, you can see the dependency on this network path for The Gambia’s Internet access.
No interruptions were seen in Sonatel (AS8346), so this indicates that the single network path between Sonatel and Gamtel (AS25250) is a critical point for connectivity. A failure in either of these networks could result in The Gambia going offline again.
Yesterday’s outage in The Gambia outage illustrates something we frequently reference here in the blog: the Internet is literally a network of networks. A significant amount of Internet traffic is carried by a complex network of undersea fiber-optic cables that connect countries and continents — all the cable systems used have landing points in two or more countries. So a problem in one country can easily affect others.
Going back to The Gambia, Gamtel explained in a January 5, 2022, press release that there was “a primary link failure at ACE” — the cable system that serves 24 countries, from Europe to Africa. “The ACE cable repair is expected to be completed in mid-January, 2022,” explained the company.
The full ACE (Africa Coast to Europe) submarine cable system. From NSRC
The “backup failure” here was “due to a faulty card at Toubakota, in Senegal”. That problem affects “both the Karang and Seleti links [points of cable connections from Senegal to The Gambia] as both North and South links converges there”. “Thus, the reason for the complete isolation on the Sonatel link”, concludes Gamtel.
Recognizing the critical importance of reliable Internet connectivity, The Gambia Public Utilities Regulatory Authority also issued a statement noting “The Authority, operators, MOICI, and the Government are exploring other options of making sure that the Gambia has a second fibre cable backup considering the impact that these failures are having on our national security, economy, and social activities.”
In 2021, we continued to live with the effects of the COVID pandemic and Internet traffic was also impacted by it. Although learning and exercising may have started to get back to something close to normal (depending on the country), the effects of what started almost two years ago on the way people work and communicate seems to be here to stay, and the lockdowns or restrictions continue to have an impact on where and how people go online.
So, Cloudflare Radar’s 2021 Year In Review is out with interactive maps and charts you can use to explore what changed on the Internet throughout this past year. Year In Review is part of Cloudflare Radar. We launched Radar in September 2020 to give anyone access to Internet use and abuse trends.
This year we’ve added a mobile vs desktop traffic chart, but also the attack distribution that shows the evolution throughout the year — the beginning of July 2021, more than a month after the famous Colonial Pipeline cyberattack, was the time of the year when attacks worldwide peaked.
There are also interesting pandemic-related trends like the (lack) of Internet activity in Tokyo with the Summer Olympics in town and how Thanksgiving week in the US in late November affected mobile traffic in the United States.
In 2020 by late April we saw that the Internet had seen incredible, sudden growth in traffic because of lockdowns and that was sustained throughout the year as we showed in our 2020 Year In Review. 2021 told a slightly different story, depending on the country.
The big April-March and May Internet traffic peak from 2020 related to the pandemic wasn’t there, in the same way, this year — it was more distributed depending on the local restrictions. In 2021, Internet traffic, globally, continued to grow throughout the year, and it was at the end of the year that was higher (a normal trend, given there’s a growth in categories like online shopping and the colder season in the Northern Hemisphere, where most Internet traffic occurs, affects human behaviour).
The day of the year with the highest growth in traffic worldwide, from our standpoint, was December 2, 2021, with 20% more than the first week of the year — the Y-axis shows the percentage change in Internet traffic using a cohort of top domains from each country. But in May there was also a bump (highlighted in red as a possible pandemic-related occurrence), although not as high as we saw in the March-May period of last year.
Spikes in Internet traffic — Worldwide 2021
#1 November-December1 (+23%) #2 September (+20%) #3 October (+19%) #4 August (+16%) #5 May (+13%) 1Beginning of December
When we focus on specific countries using our Year In Review 2021 page you can see that new restrictions or lockdowns affected (again) Internet traffic and, in some countries, that is more evident than others.
In the following table, we show the months with the highest traffic growth (the percentage shown focus on the spikes). From our standpoint the last four months of the year usually have the highest growth in traffic after September, but Canada, the UK, Germany, France, Portugal, South Korea and Brazil seemed to show (in red) an impact of restrictions in their Internet traffic — with higher increases in the first five months of the year.
Months with the largest traffic growth — 2021
United States
#1 November-Dec (+30%) #2 October (+26%) #3 September (+25%) #4 August (+15%) #5 May (+13%)
Canada
#1 November-Dec (+21%) #2 October (+10%) #3 April (+9%) #4 May (+8%) #5 March (+7%)
UK
#1 November-Dec (+23%) #2 March (+13%) #3 October (+12%) #4 February (+7%) #5 September (+5%)
Germany
#1 November-Dec (+25%) #2 October (+15%) #3 May (+7%) #4 February (+6%) #5 September (+5%)
France
#1 November-Dec (+24%) #2 May (+14%) #3 April (+13%) #4 January (+8%) #5 February (+7%)
Japan
#1 November-Dec (+32%) #2 October (+28%) #3 September (+28%) #4 August (+24%) #5 July (+18%)
Australia
#1 November-Dec (+42%) #2 September (+38%) #3 October (+37%) #4 August (+32%) #5 July (+27%)
Singapore
#1 November-Dec (+62%) #2 October (+58%) #3 September (+58%) #4 August (+41%) #5 July (+31%)
Portugal
#1February (+38%) #2 March (+23%) #3 January (+22%) #4 November-Dec (+18%) #5 April (+17%)
South Korea
#1 April (+21%) #2 May (+16%) #3 February (+10%) #4 August (+7%) #5 September (+7%)
Brazil
#1 May (+25%) #2 June (+23%) #3 November-Dec (+22%) #4 April (+21%) #5 July (+21%)
India
#1 November-Dec (+24%) #2 September (+22%) #3 October (+21%) #4 August (+19%) #5 July (+10%)
When we look at those countries’ trends we can see that Canada had lockdowns at the beginning of February that went through March and May, depending on the area of the country. That is in line with what we’ve seen in 2020: when restrictions/lockdowns are up, people tend to use the Internet more to communicate, work, exercise and learn.
Most of Europe also started 2021 with lockdowns and restrictions that included schools — so online learning was back on. That’s clear in the UK. From January to March showed a high increase in traffic percentage that went down when restrictions were relaxed.
The lines here show Internet traffic growth from our standpoint throughout 2020 and 2021 in the UK
The same happens in Portugal, where new measures on January 21, 2021, put the three first months of the year in the top 3 of the year in terms of growth of traffic, and April was #5.
We can also check the example of France. Lockdowns were imposed again especially during April and May 2021, and we can see the growth in Internet traffic during those months, slightly more timid than the first lockdown of 2020, but nonetheless evident in the 2021 chart.
Germany had the same situation in May (in April work from home was again the rule and the relaxation of measures for vaccinated people only began in mid-May), but in February the lockdown that started at the end of 2020 (and included schools) was also having an impact on Internet traffic.
In South Korea there was also an impact of the beginning of the year lockdown seen in spikes through February, April and May 2021.
Internet traffic growth in the United States had a very different year in 2021 than it had the year before, when the first lockdown had a major effect on Internet growth, but still, May was a month of high growth — it was in mid-May that there were new guidelines from the CDC about masks.
Mobile traffic: The Thanksgiving effect
Another trend worldwide from 2021 is the mobile traffic percentage evolution. Worldwide, from our standpoint, the more mobile-friendly months of the year — where mobile devices were more prevalent to go online — were July and August (typical vacations months in most of the Northern Hemisphere), but January and November were also very strong.
On our Year in Review page, you can also see the new mobile vs desktop traffic chart. The evolution of the importance of mobile traffic is different depending on the country.
For example, the United States has more desktop traffic throughout the year, but in 2021, during the Thanksgiving (November 25) week, mobile traffic took the lead for the first and only time in the whole year. We can also see that in July mobile traffic was also high in terms of relevance.
The UK has a similar trend, with June, July and August being the only months of the year when mobile traffic is prevalent compared to desktop.
If we go to the other side of the planet, to Singapore, there the mobile percentage is usually higher than desktop, and we see a completely different trend than in the US. Mobile traffic was higher in May, and desktop only went above mobile in some days of February, some in March, and especially after the end of October.
Where people accessed the Internet
We also have, again, available the possibility of selecting a city from the map of our Year in Review to zoom into a city to see the change in Internet use throughout the year. Let’s zoom in on San Francisco.
The following agglomeration of maps highlights (all available in our Year in Review site) the change in Internet use comparing the start of 2020, mid-January to mid-March — you can see that there’s still some increase in traffic, in orange —, to the total lockdown situation of April and May, with more blue areas (decrease in traffic).
The red circles shows San Francisco and its surroundings (home of a lot of companies) in a map that compares working hours Internet use on a weekday between two months.
The same trend is seen already in May 2021 in a time when remote work continued to be strong — especially in tech companies (employees moved from the Bay Area). Only in June of this year, there was some increase in traffic (more orange areas), especially further away from San Francisco (in residential areas).
London: From lockdown to a Euro Championship final
London tells us a different story. Looking through the evolution since the start of 2020 we can see that in March (compared to January) we have an increase in traffic (in orange) outside London (where blue is dominant).
The Internet activity only starts to get heavier in June, in time for the kick-off of the 2020 UEFA European Championship. The tournament played in several cities in Europe had a lot of restrictions and a number of games were played in London at Wembley Stadium — where Italy won the final by beating England on penalties. But at the time of the final, July, and especially August, blue was already dominant again — so people seemed to leave the London area. Only in September and October did the traffic start to pick up again, but mostly outside the city centre.
The Summer Olympics impact? Tokyo with low activity
After the UEFA European Championship, came the other big event postponed back in 2020, the Tokyo Summer Olympics. Our map seems to show the troubled months before the event with the pandemic numbers and the restrictions rising before the dates of the major event — late July and the first days of August.
There were athletes, but not fans from around the world and even locals weren’t attending — it was largely an event held behind closed doors with no public spectators permitted due to the declaration of a state of emergency in the Greater Tokyo Area. We can see that in our charts, especially when looking at the increase in activity in March (compared to January) and the decrease in August (compared to June), even with a global event in town (Tokyo is in the red circle).
There’s also another interesting trend pandemic-related in Lisbon, Portugal. With the lockdowns put in place since mid-January, the comparison with March shows the centre of the city losing Internet traffic and the residential areas outside Lisbon gaining it (in orange in the animation). But in April the activity decreased even around Lisbon and only started to get heavier in May when restrictions were more a lot more relaxed.
Lockdowns bring more traffic to Berlin
A different trend can be seen in Berlin, Germany. Internet activity in the city and its surroundings was very high in March and in April (compared to the previous two months) at a time when lockdowns were in place — nonetheless, in 2020 the activity decreased in April with the first major lockdown.
But in May and June, with the relaxation in restrictions, Internet activity decreased (blue) giving the idea that people left the city or, at least, weren’t using the Internet so much. Only in August did Internet activity begin to pick up again, but decreased once more in the colder months of November and December.
Cyberattacks: Threats that came in July
In terms of worldwide attacks, July and November (the month of Black Friday, when it reached a 78% in increase) were definitely the months with the highest peak of the year. The biggest peak was at the beginning of July 2021, when it reached 82%. That was more than a month after the Colonial Pipeline ransomware cyberattack — May was also the month of an attack on part of Toshiba and, in the same week, the Irish health system and of the meat processing company JBS.
The week of December 6 (the same when the Log4j vulnerability was disclosed) also had an increase in attacks — 42% more, and there was also a clear increase (42%) in the beginning of October, around the time of the Facebook outage.
In our dedicated page you can check — for the first time this year — the attack distribution in a selection of countries.
The UK had a very noticeable peak in overall Internet attacks (a growth of 150%) in August and that continued through September. We already saw that the beginning of the year, because of lockdowns, also had an increase in Internet traffic, and we can also see an increase in attacks in January 2021, but also in late November — around the time of the Black Friday week.
The United States, on the other hand, saw a growth in threats that was more uniform throughout the year. The biggest spike was between August and September (a time when students, depending on the state, were going back to school), with 65% of growth. July also had a big spike in threats (58%), but also late May (48%) — that was the month of the Colonial Pipeline ransomware cyberattack. Late November also had a spike (29%).
Countries like France had their peak in attacks (420% more) in late September and Germany it was in June (425%), but also in October (380%) and in November (350%).
The same trend can be seen in Singapore, but with an even higher growth. It reached 1,000% more threats in late November and 900% in the same month, around the time of the famous Singles’ Day (11.11, on November 11), the main e-commerce event in the region.
Also in the region, Australia, for example, also saw a big increase (more than 100%) in attacks in the beginning of September. In Japan, it was more in late May (over 40% of growth in threats).
What people did online in 2021
Last year we saw how the e-commerce category jumped in several countries after the first major lockdown — late March.
In New York, Black Friday, November 26, 2021, was the day of the whole year that e-commerce traffic peaked — it represented 31.9% of traffic, followed by Cyber Monday, November 29, with 26.6% (San Francisco has the same trend). It’s also interesting to see that in 2020 the same category peaked Black Friday, November 27, 2020 (24.3%) but April 22, during the first lockdowns, was a close second at 23.1% (this year the category only had ~14% in April).
Also with no surprise, messaging traffic peaked (20.6%) in the city that never sleeps on the first day of the year, January 1, 2021, to celebrate the New Year.
London calling (pre-Valentine messages)
But countries, cities and the people who live there have different patterns and in London messaging traffic actually peaks at 21.5% of traffic on Friday, February 12, 2021 (two days before Valentine’s Day). While in London, let’s check if Black Friday was also big outside the US. And the answer is: yes! E-commerce traffic peaked at 20.7% of traffic precisely on Black Friday, November 26.
The pandemic also has an influence in the types of websites people use and in London, travel websites had the biggest percentage in traffic on August 8, with only 1.4% — in Munich it was 1.1% on August 11. On the other hand, in New York and San Francisco, travel websites always had less than 1% of traffic.
Going back to Europe, Paris, France, saw a different trend. Travel websites had 1.9% of traffic on June 7, 2021, precisely the week that the pandemic restrictions were lifted — France opened to international travelers on June 9, 2021. The “City of Light” (and love) had its biggest day of the year for messaging websites (24.4%) on Sunday, January 31 — a time when there were new restrictions announced to try to avoid a total lockdown.
The hacker attack: 2021 methods
Our Year in Review site also lets you dig into which attack methods gained the most traction in 2021. It is a given that hackers continued to run their tools to attack websites, overwhelm APIs, and try to exfiltrate data — recently the Log4j vulnerability exposed the Internet to new possible exploitation.
Just to give some examples, in Paris “faking search engine bots” represented 48.3% of the attacks selected for the chart on January 14, 2021, but “SQL Injection” got to 59% on April 29.
Cyberattacks distribution throughout the year in San Francisco
In London “User-Agent Anomaly” was also relevant in some parts of the year, but in San Francisco it was mostly “information disclosure” that was more prevalent, especially in late November, at a time when online shopping was booming — in December “file inclusion” vulnerability had a bigger percentage.
Now it’s your turn: explore more
To explore data for 2021 (but also 2020), you can check out Cloudflare Radar’s Year In Review page. To go deep into any specific country with up-to-date data about current trends, start at Cloudflare Radar’s homepage.
The years come and go, Internet traffic continues to grow (at least so far and with some ‘help’ from the pandemic), and Internet applications, be they websites, IoT devices or mobile apps, continue to evolve throughout the year, depending on if they attract human beings.
We’ll have a more broad Internet traffic-related Year in Review 2021 in the next few days (you can check the 2020 one here), but for now, let’s focus on the most popular domains this year according to our data on Cloudflare Radar and those domains’ changes in our popularity ranking. With Alexa.com going away, if you need a domain ranking, you can get it from Cloudflare.
We’ll focus on space (NASA and SpaceX flew higher), e-commerce (Amazon and Taobao rule), and social media (TikTok ‘danced’ to take the crown from Facebook). We’ll also take a little ‘bite’ on video streaming wars. Netflix is a Squid Game of its own and January 2021 was at the highest in our ranking — probably lockdown and pandemic-related.
Chat domains (WhatsApp, what else) will also be present and, of course, the less established metaverse domains of sorts (Roblox took the lead from Fortnite late in the game). Come with us, let’s travel through 2021.
The following will show the way Cloudflare saw Internet traffic focusing on specific domains (some of which have many websites aggregated into them) and their highs and lows in our global popularity ranking.
Top Sites: Google dethroned by the young ‘padawan’ TikTok
Let’s start with our Top Domains Ranking and 2021 brought us a very interesting duel for the Number 1 spot in our global ranking. Google.com (which includes Maps, Translate, Photos, Flights, Books, and News, among others) ended 2020 as the undefeated leader in our ranking — from September to December of last year it was always on top. Back then TikTok.com was only ranked #7 or #8.
Amazon was #5 in November, but Netflix surpassed in December 2020 (on some days it was higher than Apple, in #4); Instagram and Twitter were constantly changing positions throughout November and December.
2021 told a different story. It was on February 17, 2021, that TikTok got the top spot for a day. Back in March, TikTok got a few more days and also in May, but it was after August 10, 2021, that TikTok took the lead on most days. There were some days when Google was #1, but October and November were mostly TikTok’s days, including on Thanksgiving (November 25) and Black Friday (November 26).
There are other trends we can see comparing both years — for 2020 we only show data of the end of the year, after September (Cloudflare Radar was launched that month). For example, Facebook.com was steadily number #2 across 2020, but with TikTok.com going up Facebook is now a solid #3, followed by Microsoft.com (Office365 and Teams numbers are included there) and by Apple.com (App Store and Apple TV+ numbers are included), the same trend as in 2020.
Amazon.com is the juggernaut that follows, but it is interesting to see that since January 2021 the e-commerce website (we will talk more about that category in a few paragraphs) jumped in front of Apple.com. But Apple got back in front, after September, with some exceptions like November 28, 2021, the day before Cyber Monday — and also December 1 and 6.
Christmas time, Netflix time
Netflix had a great 2020 Christmas but also January 2021, especially at the weekend
Another trend is that Netflix surpassed Amazon in December 2020, especially around Christmas week. On some days around 2020 Christmas, Netflix was even higher than Apple, in #4, that is the case with December 23, 25, and from December 29 to January 2, 2021.
February 2, 2021: The day YouTube (and an aerobics instructor) ruled the world
In our global popularity ranking we also saw another trend: YouTube, usually ranked #6 or #7, got to the top spot of our list on February 2, 2021 — and only on that day.
This fitness instructor video that happened while the Myanmar coup d’état was happening went viral on February 2, 2021, leading to the creation of thousands of memes
Why? One can only guess, but back then, although it was the week of the Super Bowl (some commercials, like the one from Doritos with Matthew McConaughey, were out on that day), there was another big newsworthy event: the Myanmar coup d’état on February 1, 2021. How can a coup in a Southeast Asian country have an impact on YouTube? A video of a fitness instructor who unwittingly filmed as the takeover unfolds behind her took the Internet by storm and became viral as the memes started to pour in.
That February day was also the one where Donald Trump announced his new legal team for the impeachment trial after the previous one quit, and Jeff Bezos announced he would step down as Amazon’s CEO. That was also the week prior to a record in YouTube’s history. On February 11, 2021, the video “Baby Shark Dance” from Korean education brand Pinkfong was the new most-viewed YouTube video of all time, surpassing the former record holder “Despacito” by Luis Fonsi.
Google Trends also shows that the week of February 2 was the one in 2021 that “YouTube” was more searched on Google.
Social media: There’s a new kid in town
In what was the second year of the pandemic, social media domains continued high on our ranking. The nine main social media applications were all in our top 100 list of most popular global domains — the only one out is Quora.com (during 2021 it was between #687 and #242).
We can see that TikTok (who also surpassed Google, as we explained before in the global #1 spot) took Facebook from its crown of the most popular social media website-domain in our ranking. So, that should mean that TikTok got more Internet traffic from our standpoint (our ranking is derived from our public DNS resolver 1.1.1.1 and so it’s not related to the number of unique users or visitors it gets per month) — Facebook is, by far, the platform with more users worldwide).
Top 10 — Most popular social media domains (late) 2021
The Facebook outage — that we explained from our standpoint extensively — on October 4, 2021, also had an impact on Facebook’s position in our ranking, leading to Facebook.com losing its #3 position (it was #4) for seven days in a row in that week. This number of days in #4 was something that never happened before (since September 2020) to the social media giant.
Looking to the top 10 list, it’s also clear that, just looking to social media domains, YouTube comes third and Twitter got a bump up and beat Instagram in 2021, getting the #5 place (barely, in what was a very close race). Back in late 2020 Twitter was behind Instagram in our ranking.
LinkedIn is the ninth most popular social media domain in our ranking and is still in our top 100 and throughout 2021 it got higher in our list, especially in February and March. The social media for professionals then started to drop in June and July (in the Northern Hemisphere’s summer), starting in late August to climb again and by November it reached the #52 place, the highest of the year in our global ranking — in January it was ~#78. In a year when terms like The Great Resignation and the reset of people and organizations’ mindsets were talked about, it makes sense to see this social media platform growing.
Streaming: The (Squid) Netflix Game rules
The so-called video streaming wars got another important round in 2021 with new players appearing and old ones having amazing numbers — not only in subscribers, revenue, and content budgets but also in… Internet traffic. In our ranking, Netflix is still the undefeated hero.
We added YouTube.com (its most important service is free) to the list to compare with the big numbers from Netflix, and still, the Squid Game phenomenon platform won our ranking for most of the year. Amazon Prime is not included because the streaming service mainly uses Amazon.com (ranked #5 or #6 most of the year) as a domain.
The days of the year when Netflix was more popular? January was a great month with Netflix reaching the #4 spot in our global ranking in the first two days of the year (and also all the weekends of January, Fridays included), going through February in the #5 place. For the rest of 2021, the platform was mostly #7. Yes, on the weekends Netflix seems to have a better performance in our ranking.
Roku.com seems to be the next video streaming platform after those two traffic giants, getting around the #80 position in our ranking through 2021. In late 2020 Hulu.com was the next one, but HBOMax.com surpassed Hulu in July 2021 and entered our top 100 list. In 2021, Disneyplus.com also rose in our ranking and surpassed the app-based TV service Sling.com later in the year. Our top 10 chart also includes Iq.com (iQiyi), the Chinese online video platform.
Top 10 — Most popular video streaming domains (late) 2021
In the chart Netflix.com, more dominant in most days, is in pink and YouTube.com is in yellowNetflix and YouTube, but also Roku, HBOMax, Hulu.com and Peacocktv are a lot higher in our list than the others — Disney+ is getting there
E-commerce: Podium to Amazon, Taobao and eBay
Since the pandemic started e-commerce has continued to strive and grow at an even faster pace than before. The top four e-commerce domains (Amazon, Taobao, eBay and Walmart) in our global ranking are all in the top 100 and that happens steadily throughout the year.
The fifth in the e-commerce list, the Chinese giant Jd.com had a few periods that it also entered the top 100 mainly in May and especially June — on the day of the 618 shopping event, on June 18, 2021, it reached #68 on our list, beating Walmart.com and almost catching Ebay.com.
In the following list it is easy to see that Jd.com surpassed Shopify.com in 2021, occupying the #5 place, and also Bestbuy.com and Target.com rose from one year to another.
Top 10 — Most popular e-commerce domains (late) 2021
Shein.com went ahead of Bestbuy.com and Target.com from December 19 to 24, 2020*
Here are other trends:
Amazon.com is a domain, as we already explained, with more than e-commerce services (that’s why globally it ranks between #4 and #6). In 2021, it had some good days in January and in late April 2021, reaching #4, but by the end of the year it got its best days in our ranking, especially on the day before Cyber Monday, November 28, and on December 1 and 6 — it reached #5.
Taobao.com had its best day of the year in our global ranking on August 20 — #15 — and by the popular Chinese shopping day, Singles’ Day, November 11, it was #17.
Ebay.com had a solid year and a good late August (#29 on August 31) and grew more after Cyber Monday, peaking on December 1, reaching #27.
Shopify had a great August (reaching #100 on August 18), the same with Etsy.com that peaked at #128 on August 21. Walmart had a great June (#66) and also end of November (it reached #70).
Ikea.com had a big increase in importance throughout the year and got very near to Homedepot.com’s position in September (peaked in the #695 position in our global ranking), staying up through November.
Best Buy peaked on October 6 and had a high growth throughout November, also matching Shopify in December.
When we look to Shein.com we see that it peaked last Christmas and is on the rise since November 2021
Shein.com, the global Chinese online fast-fashion retailer, went high in our ranking for the Christmas of 2020 — it went ahead of Bestbuy.com and Target.com from December 19 to 24, 2020, reaching the #253 position. In March, it had another peak, and it got the best position in 2021 in our ranking after Cyber Monday — it reached #301 on December 1, 2021.
2021: A Space Odyssey (for NASA, SpaceX, Blue Origin and Virgin Galactic)
This year was also a big year for space travel with several achievements. Spacecraft from three Mars exploration programs from the United Arab Emirates, China, and the United States arrived at Mars in February — NASA’s Perseverance rover landed on February 18, 2021, and after that the Ingenuity drone made history, being the first powered aircraft flight on another planet in human history. And there is also another big space event just around the corner — the James Webb Telescope launch.
Virgin Galactic (July 11), Blue Origin (July 20) and SpaceX (September 16 — but with several other events before that regarding satellites and reuse of space capsules) also stormed the Internet with space tourism achievements with different scopes. Only SpaceX offered an orbital ride.
In terms of domains, NASA.gov was way ahead of the others, but Elon Musk’s SpaceX.com was definitely second in our global ranking, followed by Blueorigin.com. Virgingalactic.com only appears once in our top 100k ranking on July 17 and 18 (a few days after Richard Branson’s spaceflight).
Since last year NASA is high on our global ranking, in the top 1,000 domains of our list, but after the rover Perseverance landed on Mars on February 18 NASA.gov entered our top 700 ranking — the highest day of that month was February 25, when it reached #657. In the summer it went down in our ranking, but it picked up in late September and on October 13, 2021, reached the highest position of the year (#637). That was the day the press conference about NASA’s Lucy mission, the agency’s first to Jupiter’s Trojan asteroids, took place (the launch was on October 16).
SpaceX.com had a great start of February, it entered our top 8,000, a month with a launch of 60 new Starlink internet satellites into orbit amidst a missed rocket landing and a fresh $850 million of new investment. And then it was after September 16, 2021, with the first orbital launch of an all-private crew, Inspiration4, that it flew again in our ranking.
For Blue Origin, after a strong start of the year — it reached our #32,000 on January 10 (a few days before New Shepard 4’s first test flight) — it went up between July 20- 27 after its first crewed flight, with Jeff Bezos onboard. It also went up in our ranking a few days after October 13, 2021 (the day William Shatner flew aboard a Blue Origin suborbital capsule).
Messaging or chat: WhatsApp, what else?
There aren’t as many messaging or chat platforms as there are popular social media sites, video streaming, or e-commerce platforms. So, this ranking is slim, and even slimmer because Messenger (uses Facebook.com) or iMessage (uses Apple.com) aren’t included. Snapchat is both a social media platform and a messaging app — the same with Instagram — and we added them in the social media ranking. If they were here they would be higher than WeChat but behind WhatsApp — Instagram actually started 2021 (it got to #8) in front of WhatsApp until February and went as low as #13 and Snapchat went between #29 to #16.
From our standpoint, WhatsApp is the undisputed leader of the messaging apps ranging from as low as #13 in our global ranking to as high as #8. Its best parts of the year were late March, late April, late October and then late November going through December 2021 as #8 in our ranking.
How Signal skyrocketed in January (and WeChat in February)
All the others are far away in our ranking, but 2021 brought three trends we should highlight:
Signal.org had an incredible month of January — on January 3 it was in #1815 in our ranking and by January 20 it rose to #766, a climb in more than 1,000 positions in just 17 days. Why? WhatsApp’s new privacy policy was in the headlines in the second week of January.
WeChat.com also had an amazing jump in our ranking, but more in February and by April it surpassed Signal.org — it went from #3142 at the start of February to #979 by April 25 and by October both of the messaging apps were almost tied at ~#370 and had a significantly higher place in our ranking than in late 2020.
Telegram.com on the other hand had a decrease in ranking throughout the year and ended up in the top 38,000.
“You can’t just materialize anywhere in the Metaverse, like Captain Kirk beaming down from on high. This would be confusing and irritating to the people around you. It would break the metaphor. Materializing out of nowhere (or vanishing back into Reality) is considered to be a private function best done in the confines of your own House.“ ― Neal Stephenson, Snow Crash (1992)
Metaverse: Don’t mess with Roblox
Back in November, we heard in the halls of Web Summit — the 42,000 in-person tech global event in Lisbon — that in a way the metaverse is already here (Roblox’s Global Head of Music had some thoughts on virtual concerts). But we’re still far from the promise of almost living in the virtual world that books like Neal Stephenson’s Snow Crash or Ernest Cline’s Ready Player One showed us.
Oculus shipped a lot of headsets and there are immersive experiences out there that are Metaverse-like (a step further than the now-usual-for-most spending all day working, learning, communicating through a screen) and we focused on that ones, like Fortnite, Roblox, Second Life (the oldest, from 2003), Minecraft and Oculus. But Oculus.com doesn’t have enough direct traffic (playing games using Oculus headset could direct the traffic elsewhere) to be in our top 100k domains ranking, and the same happens with Minecraft.
Oculus.com and Minecraft.net are not in our 100,000 ranking
The (short) list from 2020 and 2021 shows us that Roblox.com surpassed Epicgames.com (the home of the popular Fortnite) for the first time in July reaching back then #27 in our list. But it was after late September that it was consistently in front of the rival game platform, ending the year on a good note reaching #20 in our ranking.
Epicgames.com (Fortnite) started the year a lot better, reaching #14 on January 5, 2021, but it started to lose importance in February and that deepened after May, but mostly in July and August. It never truly recovered and ended the year between #26 and #47, depending on the day.
Conclusion: Human (online) trends
The Internet is not a quiet place, the same way humans on Earth (especially during a pandemic) aren’t quiet or passive but active and reactive. Although on the top of our domain ranking there don’t seem to be drastic ups and downs throughout the year (TikTok, and YouTube, were the exceptions), we saw how an event like the Myanmar coup and the subsequent viral video may have brought YouTube to #1 on our ranking. We also saw how e-commerce was affected throughout the year, how space-related websites had a big (online) year with important events, and how Netflix rose around Christmas time.
And remember: you can keep an eye on Cloudflare Radar to monitor how we see Internet traffic globally and in every country.
November comes, the temperatures start to get colder for most of the planet’s population (87% live in the Northern Hemisphere) and many are also starting to prepare for the festive season. That also brings significant changes in Internet traffic, most notably the online shopping kind of traffic.
So, what were the November days that e-commerce websites had the most traffic in the US and what about worldwide? Is humanity using more mobile Internet at this time? And what are the most popular days online — is Black Friday the winner?
Let’s start with e-commerce — we added a chart to Radar that shows trends for e-commerce by country. The worldwide trend is pretty evident: Cyber Monday, the day for supposedly last-minute discounts, was the clear winner.
Worldwide most popular days for e-commerce
#1. Cyber Monday, November 29.
#2. Monday, November 23.
#3. Black Friday, November 26 — November 24 is pretty close to Black Friday. All in all a very good week in terms of e-commerce traffic.
US: November e-commerce traffic ‘rain’
When we focus on the United States, the country that instituted Black Friday (the day after US Thanksgiving has since become a “retail bonanza” in other countries), the trend is a little different when we look to the full month of November.
US most popular days for e-commerce
#1. Cyber Monday, November 29.
#2. Monday, November 2.
#3. Sunday, November 1.
The Black Friday week definitely had a big impact on e-commerce traffic, but besides the clear winner, Cyber Monday, the podium was actually completed with the first two days in November. Those days have a big traffic peak, but the Black Friday week has more sustained traffic over five days.
When we look just at last week, Black Friday isn’t actually the most popular day, it’s Monday, November 22 — that isn’t surprising given that shoppers also “returned to stores” on Black Friday 2021 and didn’t do everything online.
Despite this, Black Friday 2021 had definitely more sustained traffic throughout the day. The line in the next chart stays up on November 26 (Black Friday) for several hours after 12:00 UTC, early morning in the US, more than in the previous days.
For example, when we look at the 00:00 UTC mark in those red circles (19:00 US East Coast time; 16:00 US West Coast time), Black Friday evening was the most popular evening of the week — even more than November 22. In the past few days, only Cyber Monday had (a lot) more traffic than Black Friday.
And we can also notice the “pause” in online shopping for Thanksgiving Day (we wrote a blog post about that).
2021: How about the UK, France, Germany or India?
With our new Radar tool for e-commerce websites, everyone can see the trends for their country looking back to the previous seven or 30 days. We can give some interesting examples by looking at some countries.
In the UK, for example, the most popular day was Black Friday, followed by Cyber Monday.
In Germany, Black Friday 2021, followed by Cyber Monday, were the most popular days although there’s a bigger traffic peak on November 2.
In the neighbourhood, ‘down’ in France, the most popular days for e-commerce were Thursday, November 18, and Tuesday, November 23. Those days were even bigger than Black Friday or Cyber Monday — there’s also a clear sustained increase in traffic in the Black Friday week.
Now let’s ‘travel’ to India, the fastest growing online retail market in the world, which also had the Black Friday week as the best week of the month for online shopping. Cyber Monday was the most popular day, followed by Wednesday, November 24, and also Black Friday.
One exception seems to be Japan. The start of the Black Friday week and the end of the previous week were the better periods for online shopping traffic — November 18, 23 and 20 were much better days than Black Friday or Cyber Monday.
The mobile traffic percentage rose by the end of November
So how about November? If we look at the worldwide trend, it’s pretty clear that after Sunday, November 22, the mobile traffic percentage went up — Internet traffic from mobile devices represented 55% of the total in the past week.
We can also see in the next chart that Black Friday, November 26, saw an increase of more than 4% in the mobile traffic percentage, compared to the same period of the previous month. So, people were using their mobile devices a lot more to go online — 4% more.
Now let’s go to the US, where Thanksgiving (as we explained before) had a big influence on Internet traffic. That trend is even more pronounced, specifically on Thanksgiving day, November 25 (mobile traffic percentage grew more than 6%), but also on Black Friday, November 26. At the weekend mobile traffic went back down.
And remember: you can keep an eye on Cloudflare Radar to monitor how we see Internet traffic globally and in every country.
Cloudflare Radar launched as part of last year’s Birthday Week. We described it as a“newspaper for the Internet”, that gives“any digital citizen the chance to see what’s happening online [which] is part of our pursuit to help build a better, more informed, Internet”.
Since then, we have made considerable strides, including adding dedicated pages to cover how key events such as the UEFA Euro 2020 Championship and the Tokyo Olympics shaped Internet usage in participating countries, and added a Radar section for interactive deep-dive reports on topics such as DDoS.
Today, Radar has four main sections:
Main page with near real-time information about global Internet usage.
Internet usage details by country (see, for example, Portugal).
Domain insights, where searching for a domain returns traffic, registration and certificate information about it.
Deep-dive reports on complex and often underreported topics.
Cloudflare’s global network spans more than 250 cities in over 100 countries. Because of this, we have the unique ability to see both macro and micro trends happening online, including insights on how traffic is flowing around the world or what type of attacks are prevalent in a certain country.
Radar Maps will make this information even richer and easier to consume.
Introducing Radar Maps
Starting today, Radar has two new data visualizations to help us share more insights from our data and represent what’s happening on the Internet.
Geographical distribution of application-level attacks
Note: The identified location of the devices involved in the attack may not be the actual location of the people performing the attack.
Geographical distribution of application-level attacks, in both directions
Cyber threats are more common than ever. In the third quarter of 2021 Cloudflare blocked an average of 76 billion cyber threats each day and had visibility over many more. Helping build a better Internet also means giving people more visibility over our data. That’s why we’ve made a near real-time view of the types of attacks, protocol distribution, and attack volume over time available on Radar from day one.
Now we’re adding a geographical representation of origin and target of such attacks using two new visualizations.
First, we have a global map drawing near real-time directional lines of the attacks, also known as a “pew pew” map — thank you, 1983 and WarGames.
Second, we have Sankey diagrams that are great for representing how strongly the attacks are flowing from one country to the other.
We hope you like what we’ve built with our new Radar Maps. Radar, unlike any other insights platform out there, is totally built on Cloudflare components and our edge computing platform — Workers and Workers KV. This gives us new and unique ways of representing data at scale. So do keep checking back radar.cloudflare.com to see the Internet evolving in (near) real-time.
So, if you like to keep up with the tradition in the United States you and your family yesterday (November 25, 2021) celebrated Thanksgiving. So on a special day, with family gatherings for many and with a lot of cooking if you’re into the tradition (roast turkey, stuffing and pumpkin pie), it makes sense that different Internet patterns show up on Cloudflare Radar.
First, let’s look at shopping habits. After a busy Monday, Tuesday and Wednesday, online shopping paused for Thanksgiving Day and dipped at lunchtime. So in a very good week for e-Commerce, Thanksgiving was an exception, especially at the extended lunchtime.
Now, let’s focus on Internet traffic at the time of the Thanksgiving Dinner. First, what time is that? Every family is different, but a 2018 survey of US consumers showed that for 42% early afternoon (between 13:00 and 15:00 is the preferred time to sit at the table and start to dig in). But 16:00 seems to be the “correct time” — The Atlantic explains why.
Cloudflare Radar shows that Internet traffic in the US increased this past seven days, compared with the previous period, and that makes sense given that it’s traditionally a good week for online shopping. But we can also see in the next chart that the time of Thanksgiving dinner in the continental US was a clear exception.
The circle in red in the chart clearly shows us that yesterday afternoon in the US the Internet traffic was a lot slower than the previous days at the same time and that’s more evident between 21:00 and 01:00 UTC (we use that as a standard timezone in Radar). That time period is “translated” for the East Coast between 16:00 and 20:00 EST and for the West Coast the time between 13:00 to 17:00 PST.
Internet traffic is going up
We can also use Cloudflare Radar to see that in the last two weeks Internet traffic in the US has been increasing (compared with the same period of the previous month). In a time of the year when temperatures go down, Internet traffic was definitely going up. That’s more evident this week after Sunday, November 21.
The biggest spike of the last 30 days, so far (maybe today, Black Friday, November 26, will change that — you can see the live trends using Radar), was definitely in the evening of Monday, November 22 (~02:00 UTC, November 23). This past Tuesday night, November 23, was the second day of the month with the highest traffic in the US, and the third day was actually the next day (Wednesday, November 24).
We can also see on Radar (represented in the next chart) that after several days of the Internet traffic peaks being reached at around 02:00 UTC (which “translates” to 21:00 EST and 18:00 PST), this Thanksgiving Day it was reached later, at about 03:00 UTC (22:00 EST and 19:00 PST).
Mobile traffic goes up in the busiest online week of the month
Another interesting trend regarding Thanksgiving week in the US is how there are more people this week using mobile devices to access the Internet than in the previous weeks.
Yesterday, November 25, mobile traffic represented 54% of the Internet traffic in the US. That’s 8% more than the usual 46% of mobile traffic percentage in the US that we registered in the last 30 days — in the last seven days that number goes up to 49%.
We can actually see this more clearly when we only focus on mobile traffic. This past Thursday, Thanksgiving Day, the mobile traffic percentage in the US increased by about 6% compared to the previous week:
Conclusion
When we announced Cloudflare Radar, back in September 2020, we explained how Internet use follows patterns that humans create. Throughout the pandemic we saw different trends caused by people being more at home than usual, but Internet patterns also change at specific times of the year (like when students go back to school or when it’s colder outside) or on some holidays like Thanksgiving.
Like we saw in the US yesterday, a holiday can affect Internet traffic as a whole, but also the time of the day we are online most, the devices we use to access the Internet and the types of websites we visit (e-commerce websites are getting an increase in traffic this week).
And remember: you can keep an eye on Cloudflare Radar to monitor how we see Internet traffic globally and in every country.
Opening night of Web Summit 2021, at the Altice Arena in Lisbon, Portugal. Photo by Sam Barnes/Web Summit
Global in-person events were back in a big way at the start of November (1-4) in Lisbon, Portugal, with Web Summit 2021 gathering more than 42,000 attendees from 128 countries. I was there to discover Internet trends and meet interesting people. What I saw was the contagious excitement of people from all corners of the world coming together for what seemed like a type of normality in a time when the Internet “is almost as important as having water”, according to Sonia Jorge from the World Wide Web Foundation.
Here’s some of what I heard in the halls.
With a lot happening on a screen, the lockdowns throughout the pandemic showed us a glimpse of what the metaverse could be, just without VR or AR headsets. Think about the way many were able to use virtual tools to work all day, learn, collaborate, order food, supplies, and communicate with friends and family — all from their homes.
While many had this experience, many others were unable to, with some talks at the event focusing on the digital divide and how “Internet access is a basic human right”, according to the grandson of Nelson Mandela — we interviewed him, and you can watch the conversation below.
The future already has some paths laid out, and many were discussed at the event.
The pandemic helped to accelerate most of them, especially by bringing more people (in some countries) to the digital world.
The CPO of Meta, Chris Cox, shared how the company previously known as Facebook has some ideas about the future of augmented reality, and how they want to see those ideas play out in the next five to 10 years. “We want to get the conversation going,” he said.
Also present at the event was Jon Vlassopulos, Global Head of Music, Roblox. He explained how virtual concerts on the video game platform could be the future of music performances, and even bring free tickets to fans of famous music stars like Adele. Stars like Zara Larsson, KSI and Ava Max have already performed on Roblox and “they’re making big money from selling digital merchandise”.
On the other hand, Paddy Cosgrave, CEO of Web Summit, says that there’s something magical about in-person big events that can’t be replicated in full online events. However, the real and virtual world can complement each other — it was announced that CES 2022 will use a combination of Web Summit online and offline software.
Web3 was another big part of the discussion, sometimes in clear sight, other times embedded in the many conversations about blockchain, NFTs and cryptocurrencies, and as a vision for a decentralized web (we’re actually working on that).
Speakers also focused on data privacy and security, ethics in AI and data protection. Ownership to the user and sovereignty were topics discussed and emphasized by Sir Tim Berners-Lee on the last day of the event.
The workplace was also a popular topic, as well as the changes it underwent in the past couple of years. We heard about the importance of diversity in the workplace, as well as the future of work — is it going to be flexible, hybrid, full remote or something in between? Speakers also mentioned The Great Resignation and the reset of people’s and organizations’ mindsets.
Using AI to hire and motivate people was also in the air, as well as big topics like the digitalization of healthcare, mental health, behaviour changes in humans (young and adult) who are more and more on the Internet and even the decentralization of financial services.
And here are some examples of the different speakers at the event we talked to:
Vice-Admiral Gouveia e Melo: Vaccination, misinformation and leadership
Portuguese Navy officer and coordinator of the Task Force for the Portugal COVID-19 vaccination plan
Portugal has achieved an 86% vaccination rate on the vice-admiral’s watch. He brought a sense of mission to a task that involved organization, focus and the use of both digital and communication tools.
The country started the vaccination process late but is now one of the countries with a higher vaccination rate in the world. We talked with the vice-admiral about how the Internet helped, but also how it created problems related to disinformation and misinformation, and we asked about the dangers of controlling speech online. Finally, we asked for bits of leadership advice.
Sonia Jorge: The need for Internet — affordable, fast and for everyone
Executive Director World Wide Web Foundation (Alliance for Affordable Internet)
“The Internet is now an essential public good that everybody needs at this time just like we need to drink water or to have electricity and shelter. We should do more to bring everyone into the digital society.”
In some countries around the world Internet access is very limited. In some places people have to go to a particular plaza to have access to the Internet — five years ago John Graham-Cumming saw something similar in Cuba. Sonia Jorge knows that very well. She is trying to bring affordable Internet to everyone and that challenge is more difficult than it appears.
She explains that the world is far behind in the UN’s goals for Internet access — today only about half of the earth’s population has any Internet access at all. But many of those who have access to the World Wide Web have limited possibilities to be online: “some have access once a month, for example.” So the digital divide is real, and it “should worry everyone”.
The pandemic caused health and economic difficulties that didn’t help the mission of bringing good, fast and reliable Internet to everyone. Nevertheless, Sonia — who is Portuguese and moved to the US to study when she was 17 — saw that many African countries like Nigeria began to realize that the Internet is really important for knowledge and also for the possibilities it opens in terms of cultural, financial and societal growth.
Sonia also highlights that there is a big disparity in the world between men and women in terms of Internet access.
David Kiron: The future of work and how AI (and philosophy) can help
Editorial director of MIT Sloan Management Review
Technology will play a significant role in the future of work. In a way, that “future” is already here, but isn’t evenly distributed — and researchers are just beginning to study it. David Kiron goes on to explain the challenge for some people to be “really seen by their leadership when you’re not in the office.”
The former senior researcher at Harvard Business School tells us how companies started valuing employees even more through the pandemic. There’s also an opportunity for different ways of work interaction through digital tools — “Zoom calls aren’t it.” He’s also worried that the pandemic caused a great reset that is driving many out of the workforce entirely: “There’s a trend of working moms opting out,” for example.
About the metaverse and a universe of universes:“If tech leaders spent more time reading philosophy they might have a better sense of where the world is going (…) more and more leaders of companies are taking on the philosopher’s role.”
And how can AI help? “Once you get AI going in a company we saw in our new study that there’s a big bump in morale, collaboration, learning and people’s sense on what they should be doing”. AI can also help better identify talent and match candidates to skills that are already represented in a company, but he also highlights that “humans play a role in all the stages of the hiring and working process.”
David Kiron explains that “if you’re not asking the right questions to your AI teams you’re going to be behind other companies that are doing better questions”. He adds that AI can help with performance, but it also helps “redefine what performance means in your organization by finding other metrics to look at.”
Ana Maiques: neuroscience & women in tech
Co-founder and CEO of neuroscience-based medical device company Neuroelectrics
We talked to Ana about the future of the Internet. She thinks moving forward there will be more fluid interfaces — not only limited to computers and smartphones, but we will have different devices that go beyond VR headsets and that will lead to new types of interactions. In the neuroscience field, she has big hopes in the technology that Neuroelectrics, her company, is developing in Barcelona, Spain. They work with devices that use non-invasive transcranial electrical stimulation to treat the brain in diseases like epilepsy, depression and Alzheimer.
Neuroelectricsis also developing a process called digital copy (for better personalized treatments) that could be useful in the future if someone develops one of these problems. But she says humankind is still very far from the dangers of something like a mind-reading device or the possibility of reading and downloading thoughts and dreams: “it’s fun to think of science fiction possibilities, but we need to act now on things and problems that are affecting us today.”
She also talks about the difficulties of being a woman in the tech business and raising money. “But little by little I see more women and that’s why it’s important to get out there and explain to women that they can do it.”
Siyabulela Mandela: The Internet is a human right
Director for Africa Journalists for Human Rights
The grandson of Nelson Mandela is on a mission to help journalists in Africa to be free to publish human rights stories. He explains how the Internet is critical for this mission and “a human rights issue”. Not only does the Internet give communities access to trustworthy information, but it also helps them become aware of their rights, gives access to financial tools and allows them to grow in our era.
He also highlights how the Internet can be misused, for example when it becomes a vehicle for misinformation, or when governments shut down Internet access to control communities — in Sudan the Internet has been cut off since October 25, 2021 (you can track that information on Cloudflare Radar).
Carlos Moedas: The light (and innovation) in Lisbon
Newly elected Mayor of Lisbon; previous European Commissioner for Research, Science and Innovation
Why is Lisbon attracting so many tech companies and talent? Carlos Moedas welcomes Cloudflare to his city — we’re growing fast in the city, and we have more than 80 job openings in the country. He also talks about why Portugal’s capital is so special and should be considered by company leaders who want to grow innovative companies. Paddy Cosgrave, from the Web Summit, told us something similar four weeks ago.
The ambition? “Make Lisbon the capital of innovation of the world” or, at least, of Europe. The new mayor also has a project called Unicorn Factory to achieve just that.
Sudarsan Reddy: Why is Cloudflare Tunnel relevant?
Cloudflare engineer from the Tunnel Team
Also, at the event was our very own engineer Sudarsan Reddy (based in Lisbon). We asked him some questions about Cloudflare Tunnel, our tunneling software that lets you quickly secure and encrypt application traffic to any type of infrastructure, so you can hide your server IP addresses, block direct attacks, and get back to delivering great applications.
Sudarsan focuses on what Tunnel is, why it is relevant, how it works and examples of situations where it can make a difference.
Yusuf Sherwani: Addiction treated online
Co-founder & CEO, Quit Genius
Yusuf graduated as a doctor from Imperial College School of Medicine, in London, but joined two passions, healthcare and technology, when he co-founded Quit Genius. He explains how in just 18 months the pandemic accelerated the adoption of digital health by 10 years, and there’s no going back. “The Internet enables people to unlock improvements to their lives, and digital healthcare went from being convenient to a necessity”.
We dig into the benefits of digital healthcare, but also the scrutiny that is needed in technology, now that it is more powerful than ever and cemented in people’s lives. Yusuf also gives examples of how his digital clinic is helping people in treating tobacco, vaping, alcohol, and opioid addictions.
Yusuf has co-authored 12 peer-reviewed studies on behavioural health and substance addictions. He was featured on the Forbes 30 Under 30 List of 2018 and in Fast Company’s 100 Most Creative People in Business.
David Shrier: From sharing economy to blockchain
American futurist and Professor of Practice, AI & Innovation with Imperial College Business School in London
David sums up how the pandemic has affected people’s relationship with technology: “Everyone is tired of Zoom calls, but the convenience opened people’s minds”.
We also talk about the digital divide, about human-centered ways of working with AI, and we also address the potential in VR and AR and how nobody saw the sharing economy coming 20 years ago and, now, “it’s incredible to see how people embraced blockchain and the digitalization of financial services”.
Dame Til Wykes: The mental health discussion went viral
Professor of Clinical Psychology and Rehabilitation at King’s College London, Director of the NIHR Clinical Research Network: Mental Health
As someone with experience in the psychology field for more than 50 years, Dame Til Wykes still had to learn new ways of engaging with patients throughout the pandemic — and even learn which buttons to push on a computer to make Zoom calls. COVID-19 and the hardships of the pandemic made people more aware and ready to talk about their mental health issues, like anxiety or depression. But the pandemic wasn’t the same for everyone and Dame Til Wykes is worried about some of the effects, “most of them remain to be seen”.
Remote consultations were a big help, but she reminds us that in her field it is important to see the whole person and not just the face — for example, “if someone is tapping a foot nervously while giving us a smile, that tells us something that we cannot see in a Zoom call”. She also mentions the adoption of meditation apps bringing a form of help to some was another positive trend in this difficult period, as well as the reset button the pandemic brought to some people’s lives.
A few days after Sudan restored access to the Internet, people living in Burkina Faso are facing an Internet shutdown. On Saturday, Cloudflare Radar shows that after 22:00 UTC (the same local time) Internet traffic went down significantly, something that has happened in the context of social tensions in the country that started on November 14, 2021, and after this Saturday’s shooting of protesters that tried to block a French military convoy.
It is clear when we look at the last 30 days, that Sunday and today, Monday, November 22, are days almost without Internet traffic in Burkina Faso.
All the Internet Service Providers (ISP) of the country were significantly affected by what we could see in our data. That is evident when we look at HTTP traffic by ASN (Autonomous System Number). Orange, FasoNet and Telecel are the three most used ISPs in the country and this chart clearly shows how they were impacted.
Mobile traffic affected
Burkina Faso is a mobile-first country because mobile is the main way of accessing the Internet — in the last 30 days the mobile traffic percentage represented 77% of the total Internet traffic in the country.
We can also see in Cloudflare Radar that desktop traffic percentage went up after Saturday night (the dark blue line in the chart), something that indicates that mobile networks were the main focus of the shutdown.
Looking at the number of requests we get a better ‘picture’ of the situation and how the desktop traffic percentage started to take over compared to mobile traffic in the last few days.
In the case of Sudan, the Internet shutdown went on for 25 days. You can keep an eye on Cloudflare Radar to monitor how the Burkina Faso situation evolves, but also you can see the Internet traffic globally and in every country.
The collective thoughts of the interwebz
Manage Consent
To provide the best experiences, we use technologies like cookies to store and/or access device information. Consenting to these technologies will allow us to process data such as browsing behavior or unique IDs on this site. Not consenting or withdrawing consent, may adversely affect certain features and functions.
Functional
Always active
The technical storage or access is strictly necessary for the legitimate purpose of enabling the use of a specific service explicitly requested by the subscriber or user, or for the sole purpose of carrying out the transmission of a communication over an electronic communications network.
Preferences
The technical storage or access is necessary for the legitimate purpose of storing preferences that are not requested by the subscriber or user.
Statistics
The technical storage or access that is used exclusively for statistical purposes.The technical storage or access that is used exclusively for anonymous statistical purposes. Without a subpoena, voluntary compliance on the part of your Internet Service Provider, or additional records from a third party, information stored or retrieved for this purpose alone cannot usually be used to identify you.
Marketing
The technical storage or access is required to create user profiles to send advertising, or to track the user on a website or across several websites for similar marketing purposes.