Cloudflare Radar was launched two years ago to give everyone access to the Internet trends, patterns and insights Cloudflare uses to help improve our service and protect our customers.
Until then, these types of insights were only available internally at Cloudflare. However, true to our mission of helping build a better Internet, we felt everyone should be able to look behind the curtain and see the inner workings of the Internet. It’s hard to improve or understand something when you don’t have clear visibility over how it’s working.
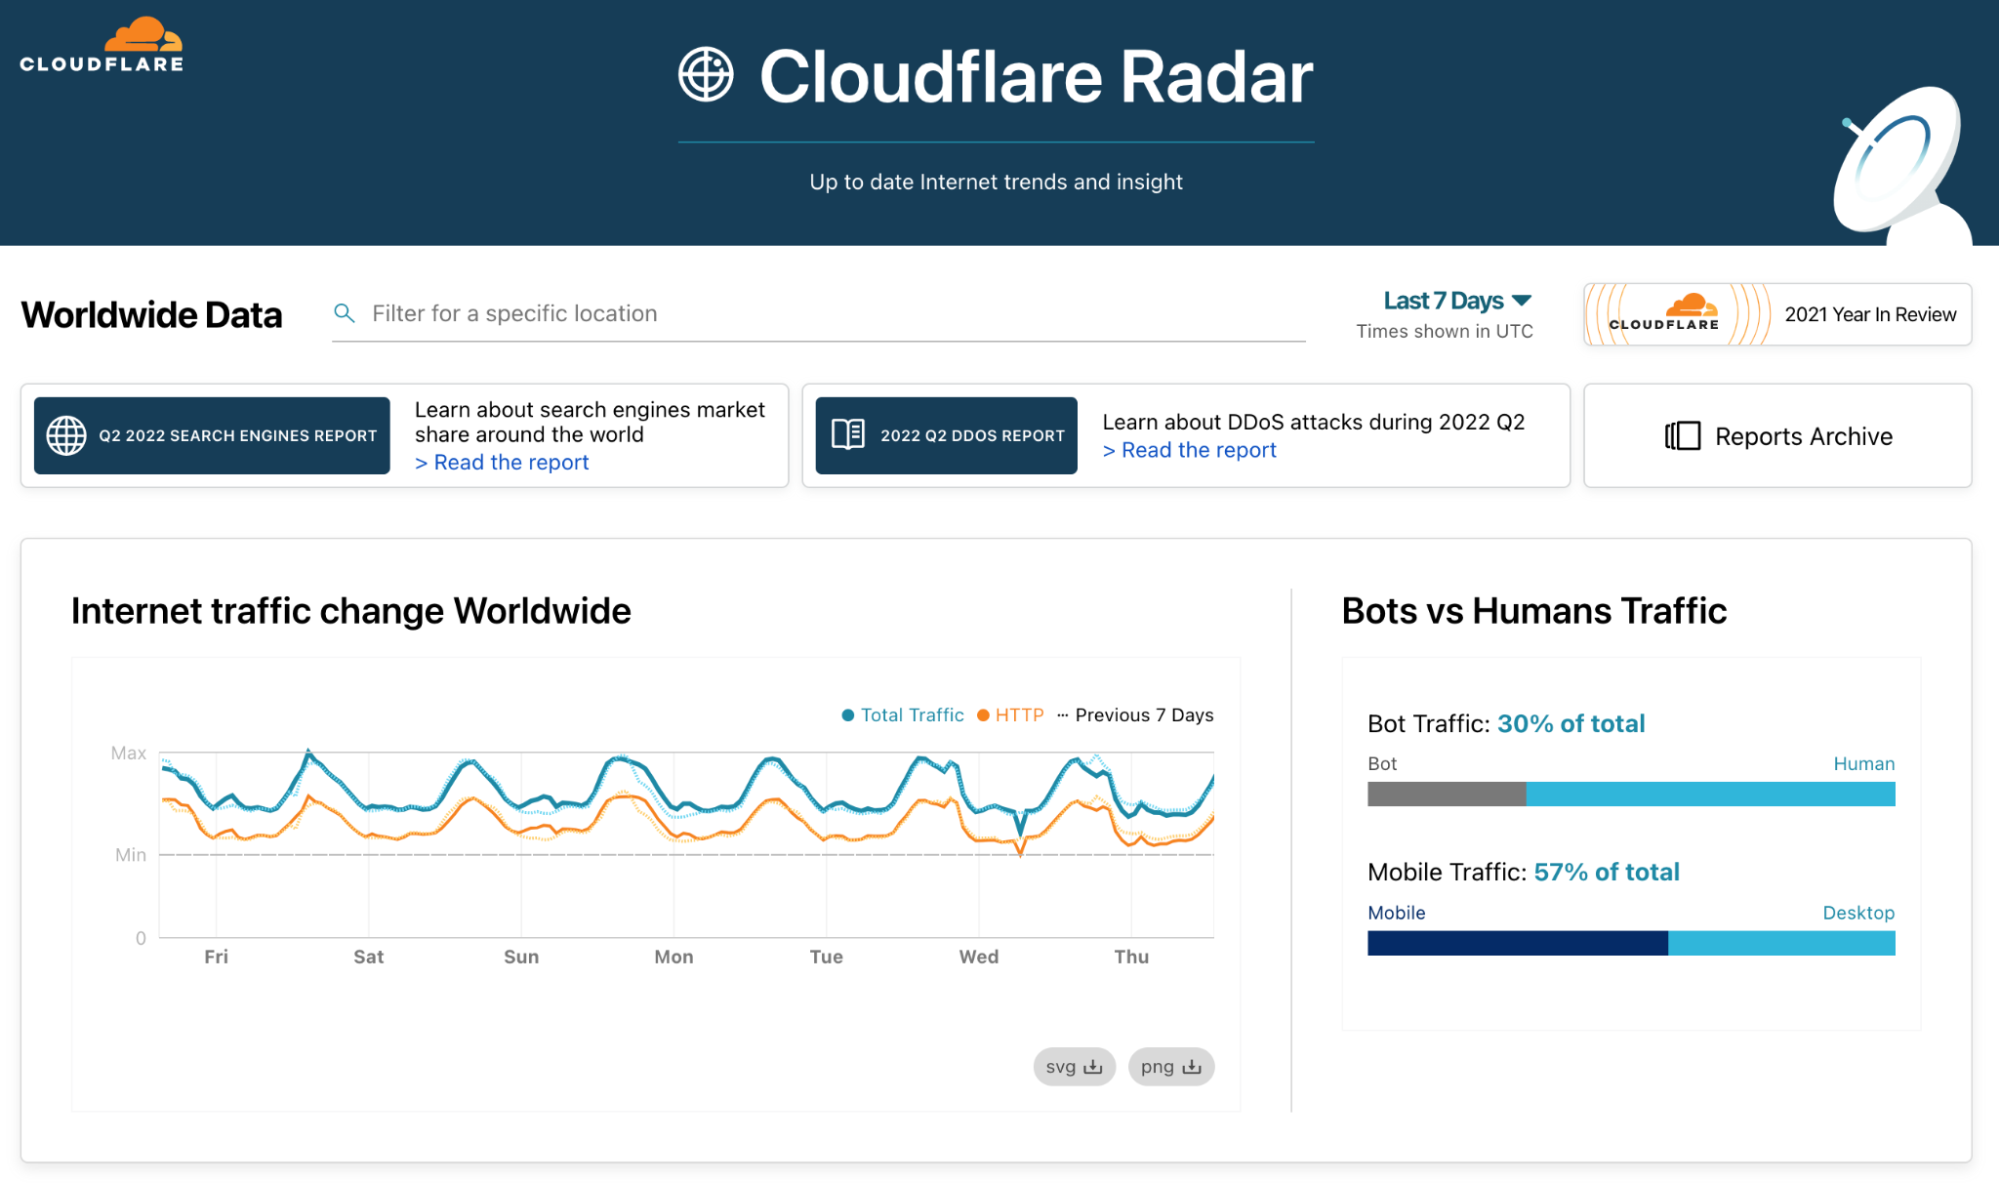
On Cloudflare Radar you can find timely graphs and visualizations on Internet traffic, security and attacks, protocol adoption and usage, and outages that might be affecting the Internet. All of these can be narrowed down by timeframe, country, and Autonomous System (AS). You can also find interactive deep dive reports on important subjects such as DDoS and the Meris Botnet. It’s also possible to search for any domain name to see details such as SSL usage and which countries their visitors are coming from.
Since launch, Cloudflare Radar has been used by NGOs to confirm the Internet disruptions their observers see in the field, by journalists looking for Internet trends related to an event in a country of interest or at volume of cyberattacks as retaliation to political sanctions, by analysts looking at the prevalence of new protocols and technologies, and even by brand PR departments using Cloudflare Radar data to analyze the online impact of a major sports event.
Cloudflare Radar has clearly become an important tool for many and, most importantly, we find it has helped shed light on parts of the Internet that deserve more attention and investment.
Introducing Cloudflare Radar 2.0
What has made Cloudflare Radar so valuable is that the data and insights it contains are unique and trustworthy. Cloudflare Radar shows aggregate data from across the massive spectrum of Internet traffic we see every day, presenting you with datasets you won’t find elsewhere.
However, there were still gaps. Today, on the second anniversary of Cloudflare Radar, we are launching Cloudflare Radar 2.0 in beta. It will address three common pieces of feedback from users:
Ease of finding insights and data. The way information was structured on Cloudflare Radar made finding information daunting for some people. We are redesigning Cloudflare Radar so that it becomes a breeze.
Number of insights. We know many users have wanted to see insights about other important parts of the Internet, such as email. We have also completely redesigned the Cloudflare Radar backend so that we can quickly add new insights over the coming months (including insights into email).
Sharing insights.The options for sharing Cloudflare Radar insights were limited. We will now provide you the options you want, including downloadable and embeddable graphs, sharing to social media platforms, and an API.
Finding insights and data
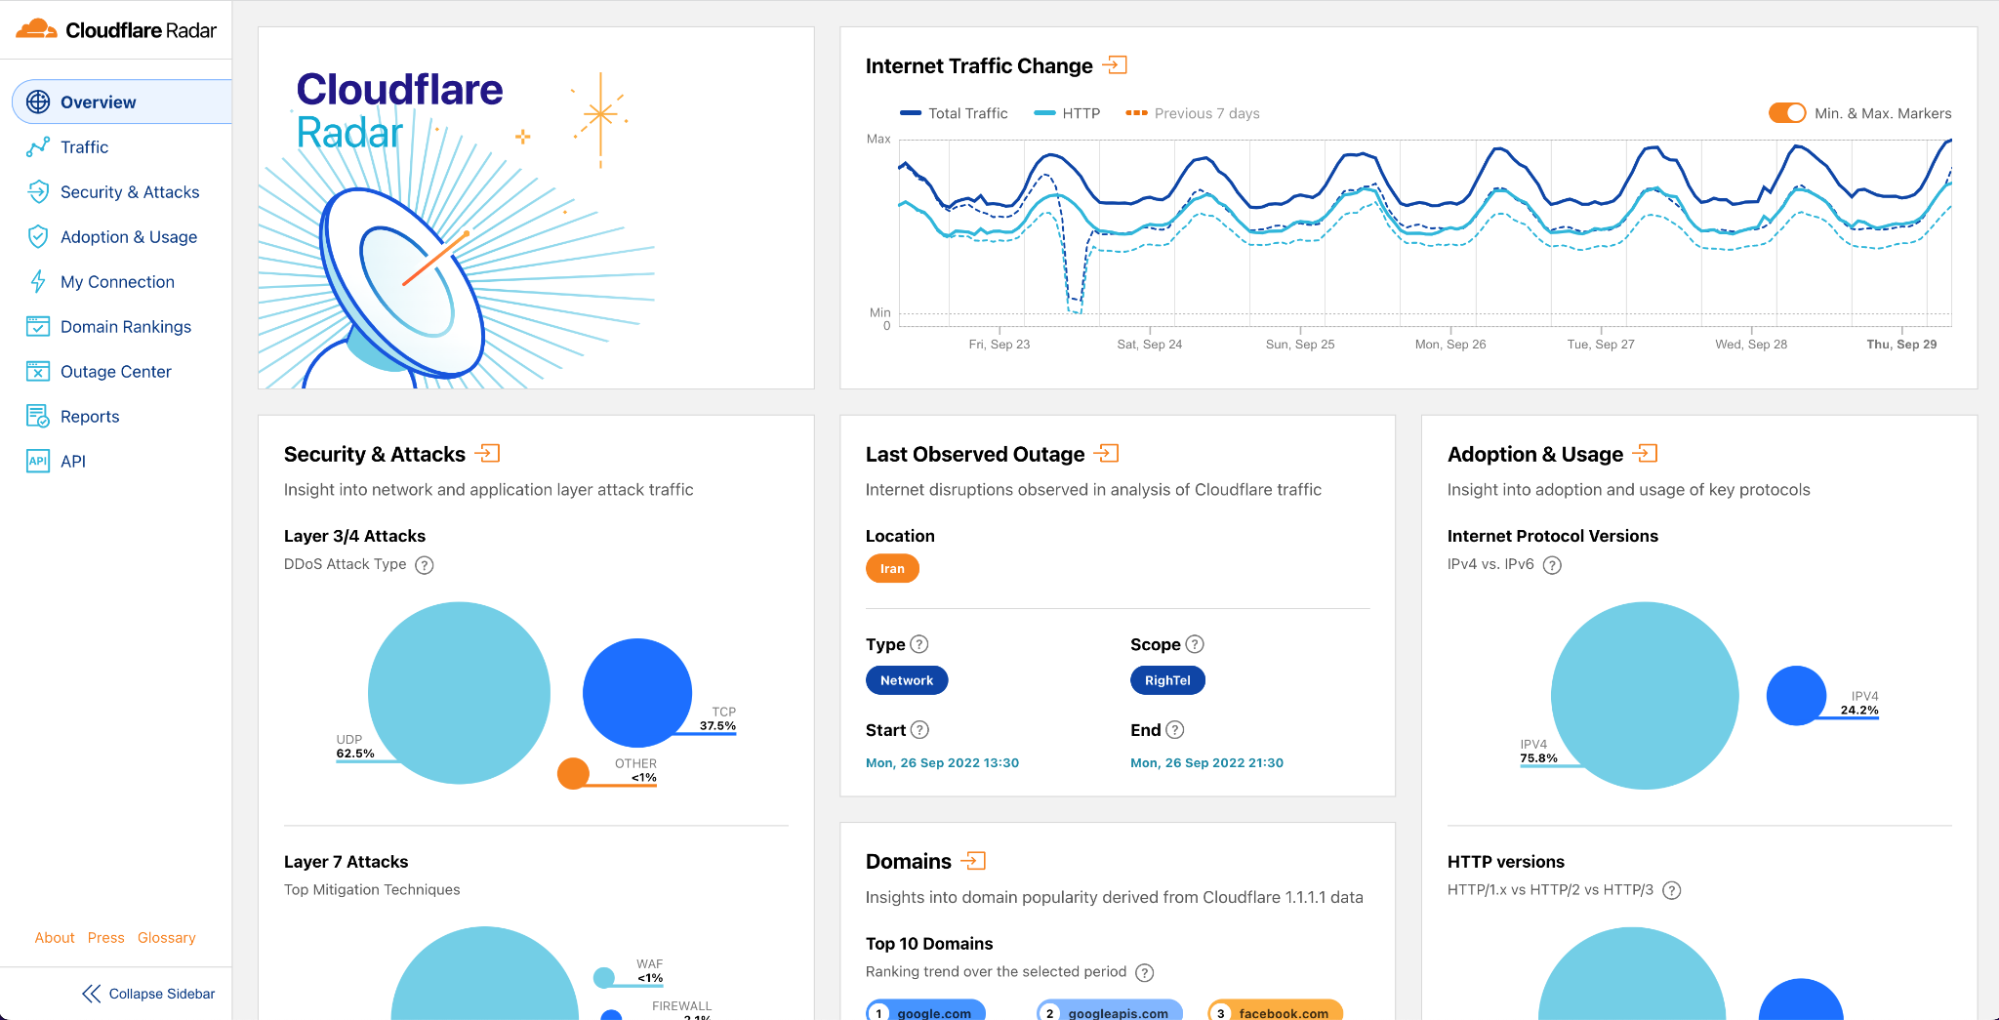
On a first visit to the redesigned Cloudflare Radar homepage one will notice:
Prominent and intuitive filtering capabilities on the top bar. A global search bar is also coming soon.
Content navigation on the sidebar.
Content cards showing glanceable and timely information.
The content you find on the homepage are what we call “quick bytes”. Those link you to more in-depth content for that specific topic, which can also be found through the sidebar navigation.
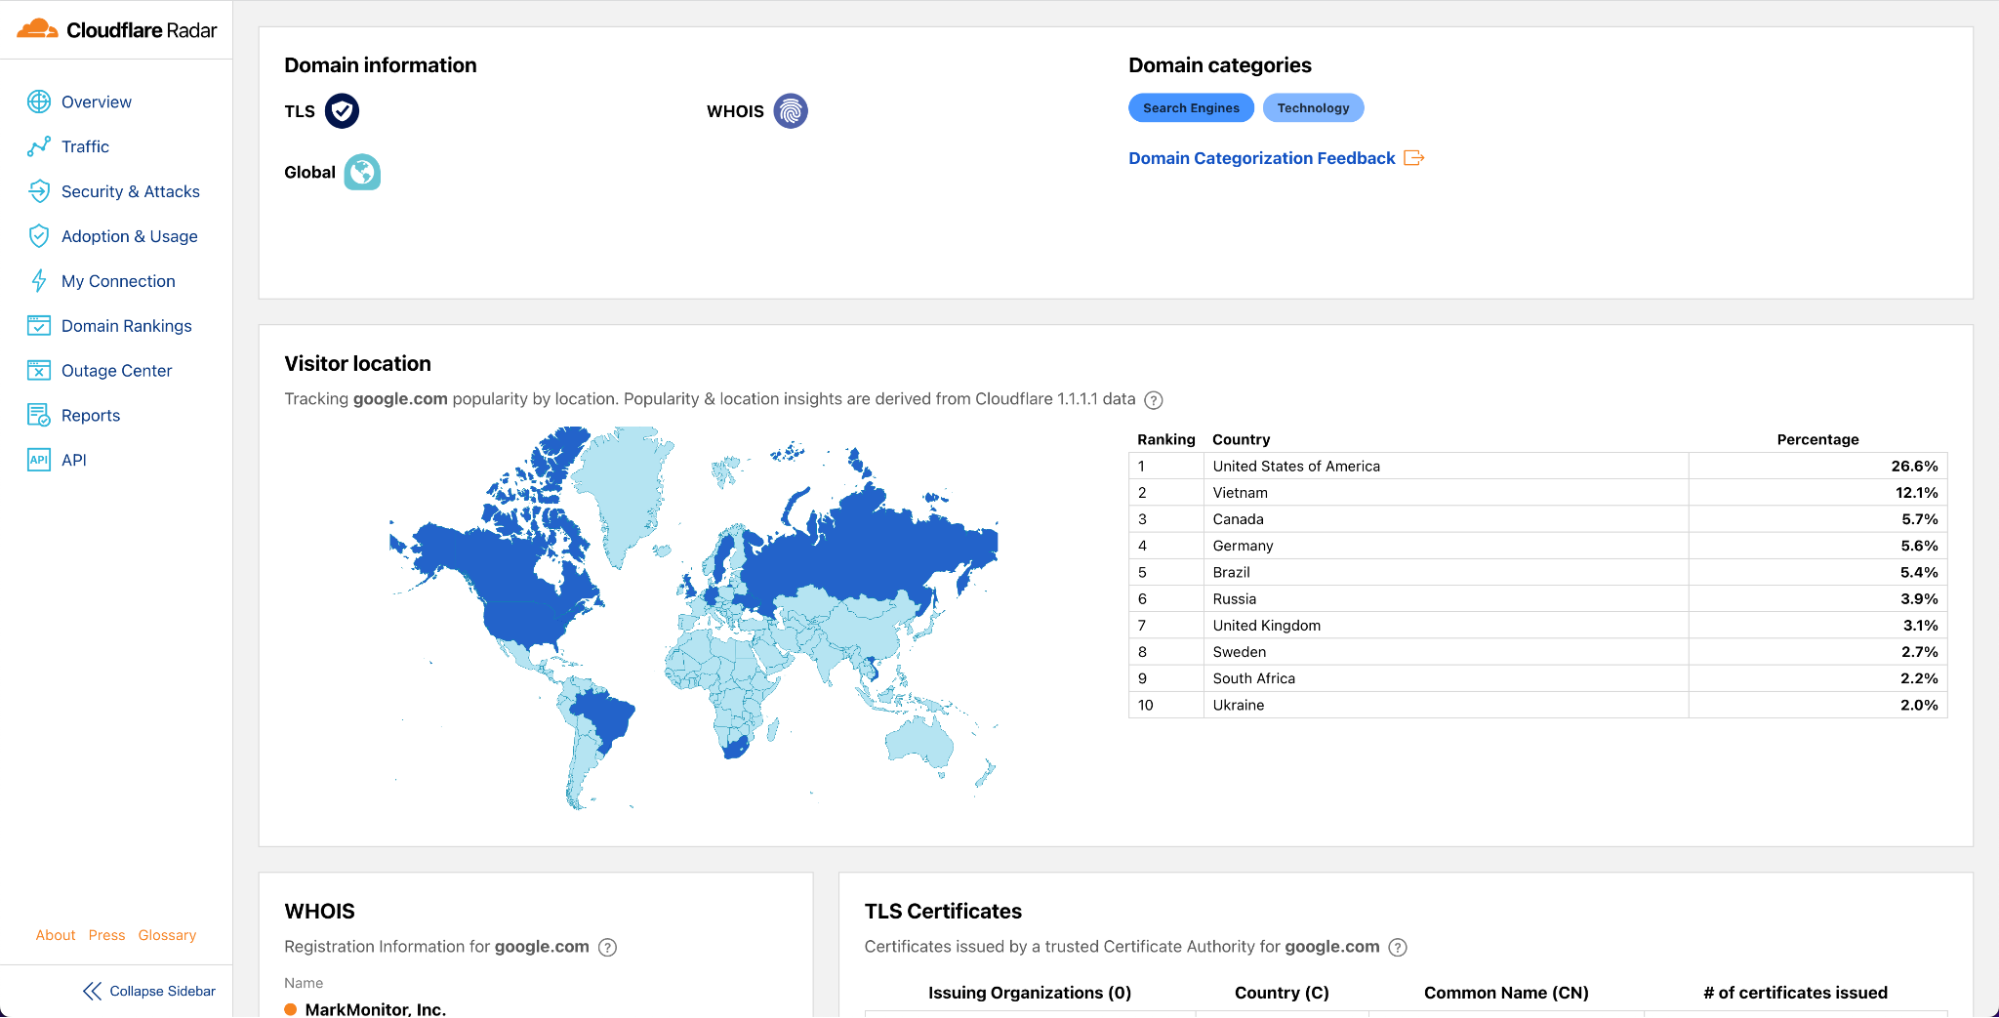
At the top of the page you can search for a country, autonomous system number (ASN), domain, or report to navigate to a home page for that specific content. For example, the domain page for google.com:
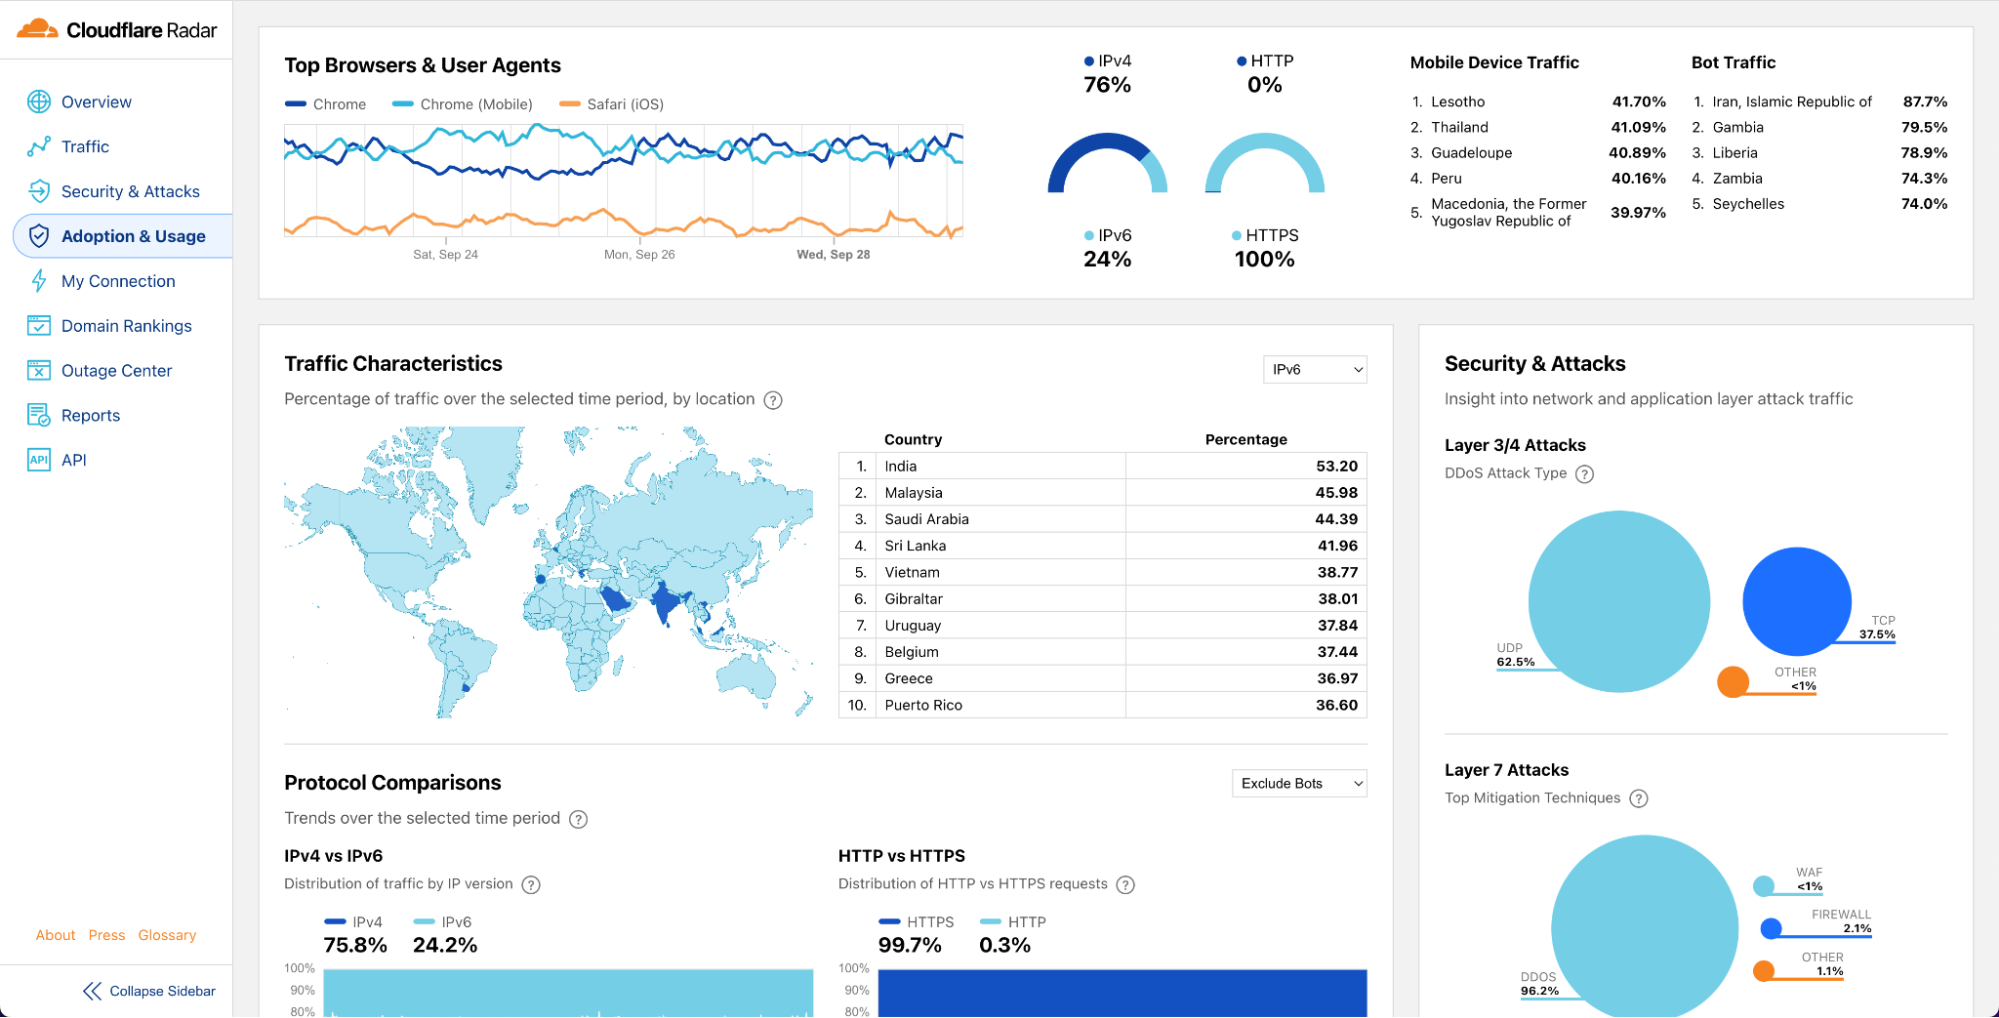
The navigation sidebar allows you to find more detailed insights and data related to Traffic, Security & Attacks, Adoption & Usage, and Domains. (We will be adding additional topic areas in the future.) It also gives you quick access to the Cloudflare Radar Outage Center, a tool for tracking Internet disruptions around the world and to which we are dedicating a separate blog post, and to Radar Reports, which are interactive deep dive reports on important subjects such as DDoS and the Meris Botnet.
Within these topic pages (such as the one for Adoption & Usage shown above), you will find the quick bytes for the corresponding topic at the top, and quick bytes for related topics on the right. The quick bytes on the right allow you to quickly glance at and navigate to related sections.
In the middle of the page are the more detailed charts for the topic you’re exploring.
Sharing insights
Cloudflare Radar’s reason to exist is to make Internet insights available to everyone, but historically we haven’t been as flexible as our users would want. People could download a snapshot of the graph, but not much more.
With Cloudflare Radar 2.0 we will be introducing three major new ways of using Radar insights and data:
Social share. Cloudflare Radar 2.0 charts have a more modern and clean look and feel, and soon you’ll be able to share them directly on the social media platform of your choice. No more dealing with low quality screenshots.
Embeddable charts. The beautiful charts will also be able to be embedded directly into your webpage or blog – it will work just like a widget, always showing up-to-date information.
API. If you like the data on Cloudflare Radar but want to manipulate it further for analysis, visualization, or for posting your own charts, you’ll have the Cloudflare Radar API available to you starting today.
Note: The API is available today. To use the Cloudflare API you need an API token or key (more details here). Embedding charts and sharing directly to social are new features to be released later this year.
Technology changes
Cloudflare Radar 2.0 was built on a new technology stack; we will write a blog post about why and how we did it soon. A lot changed: we now have proper GraphQL data endpoints and a public API, the website runs on top of Cloudflare Pages and Workers, and we’re finally doing server-side rendering using Remix. We adopted SVG whenever possible, built our reusable data visualization components system, and are using Cosmos for visual TDD. These foundational changes will provide a better UX/UI to our users and give us speed when iterating and improving Cloudflare Radar in the future.
We hope you find this update valuable, and recommend you keep an eye on radar.cloudflare.com to see the new insights and topics we’ll be adding regularly. If you have any feedback, please send it to us through the Cloudflare Community.
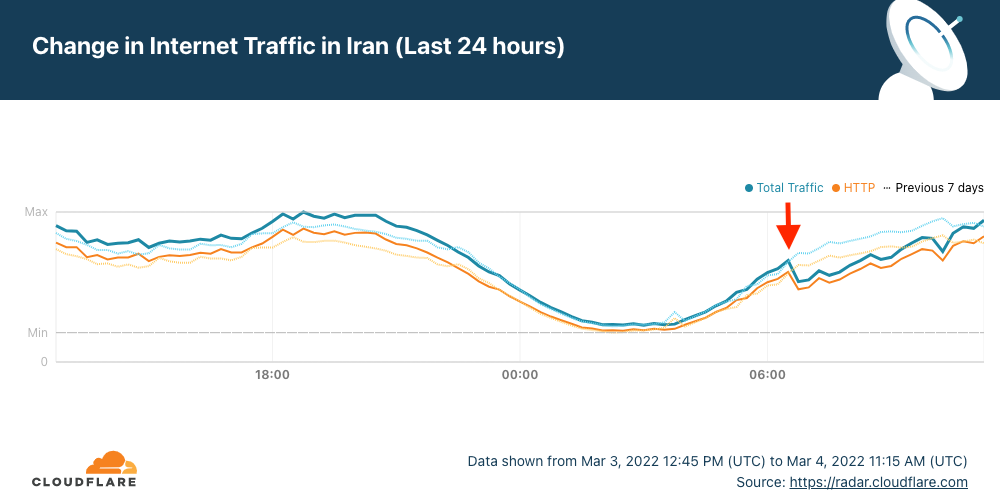
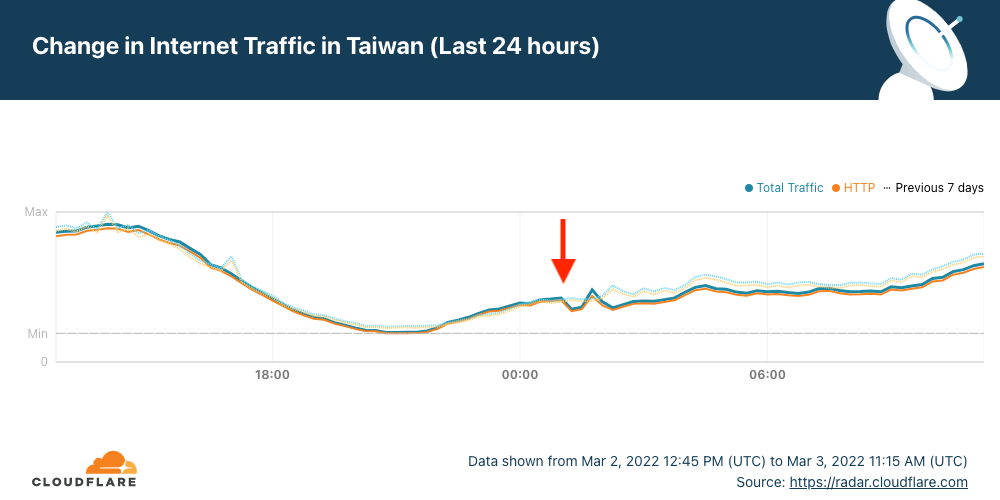
Published reports indicate that the growing protests have resulted in at least eight deaths. Iran has a history of restricting Internet connectivity in response to protests, taking such steps in May 2022, February 2021, and November 2019. They have taken a similar approach to the current protests, including disrupting Internet connectivity, blocking social media platforms, and blocking DNS. The impact of these actions, as seen through Cloudflare’s data, are reviewed below.
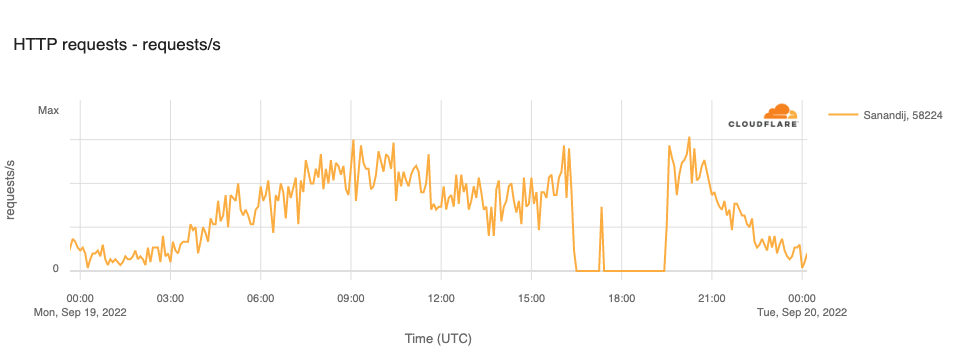
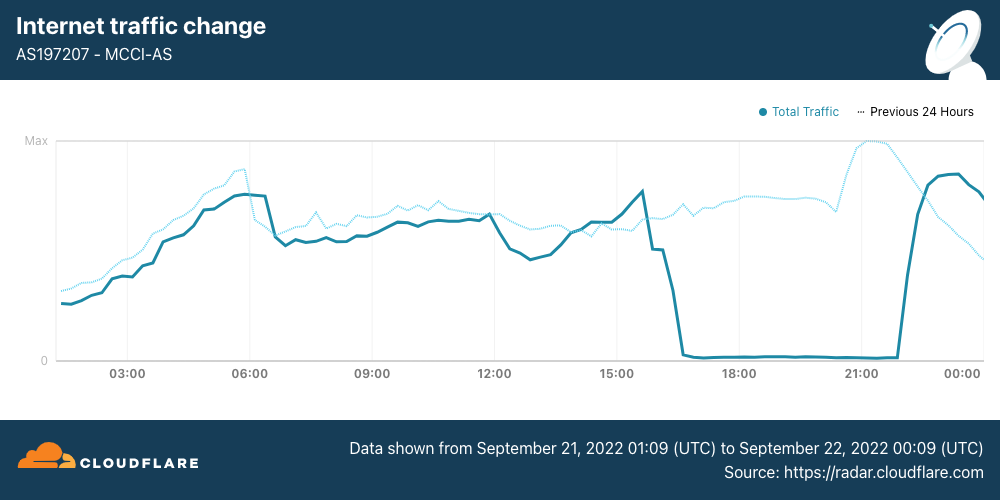
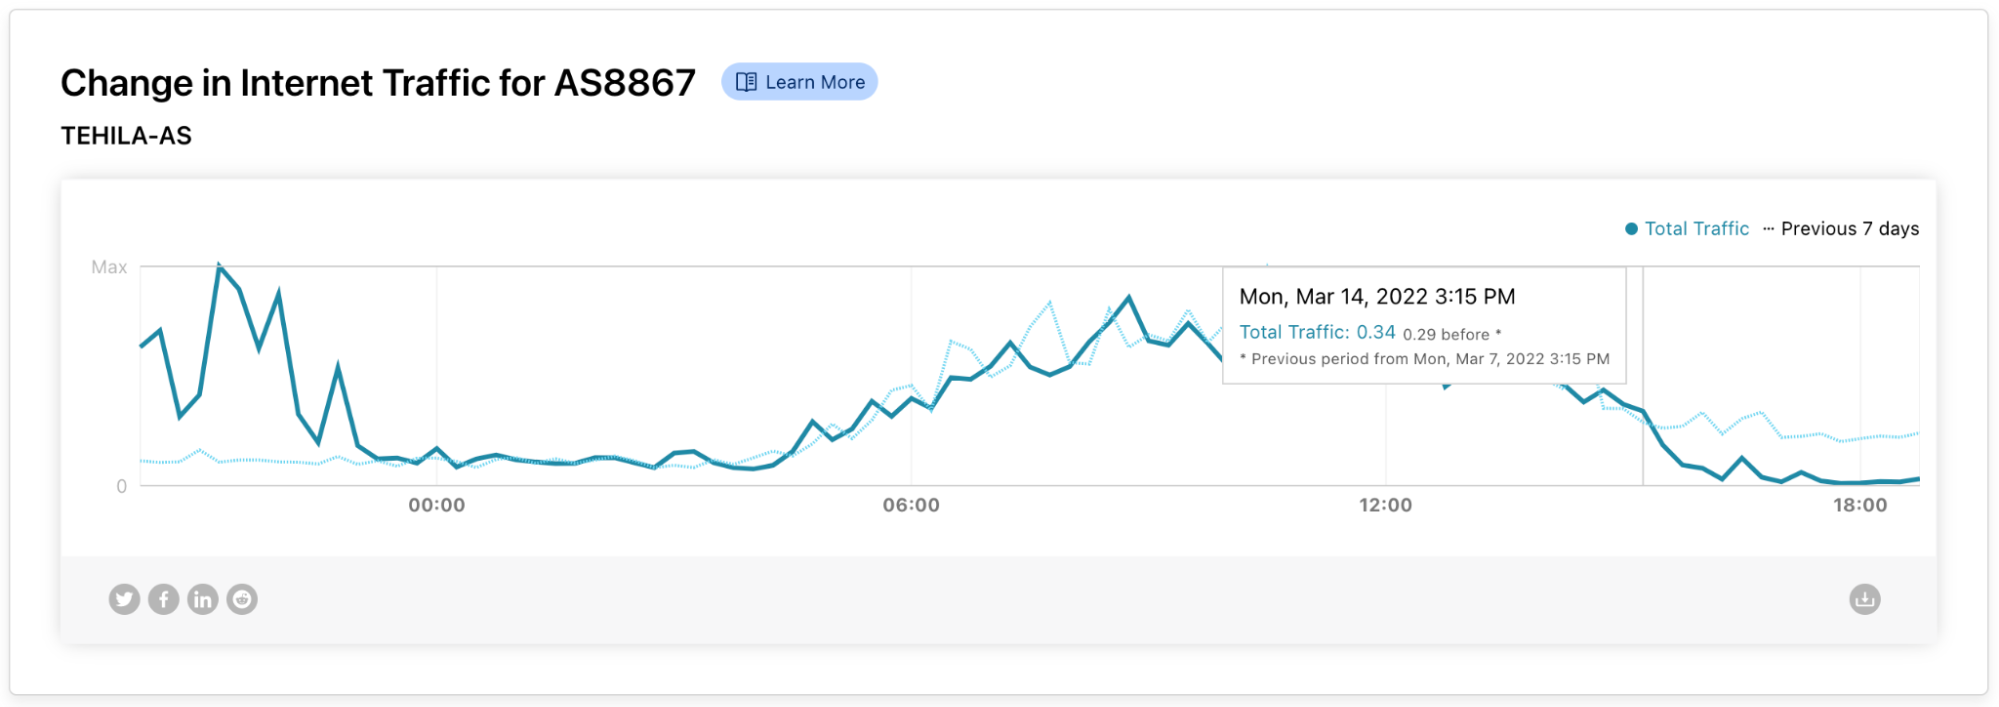
On September 21, Internet disruptions started to become more widespread, with mobile networks effectively shut down nationwide. (Iran is a heavily mobile-centric country, with Cloudflare Radar reporting that 85% of requests are made from mobile devices.) Internet traffic from Iran Mobile Communications Company (AS197207) started to decline around 1530 UTC, and remained near zero until it started to recover at 2200 UTC, returning to “normal” levels by the end of the day.
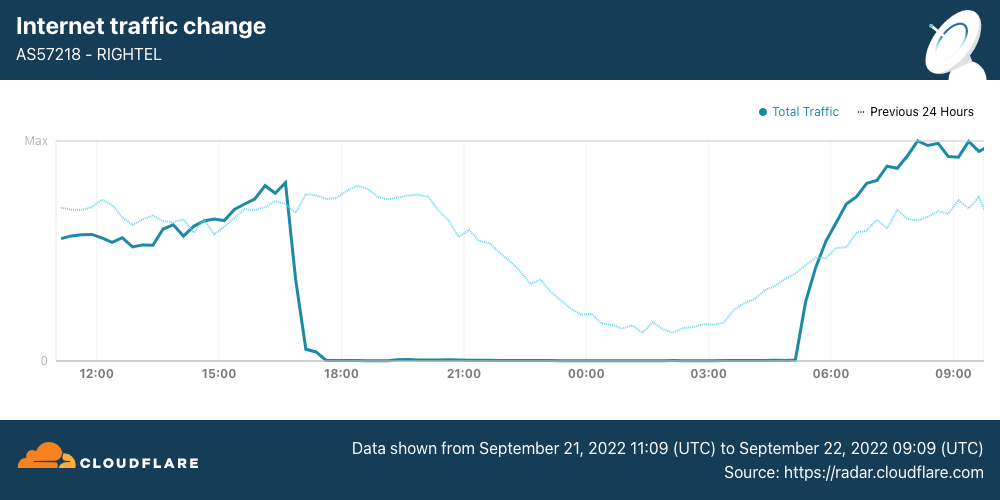
Internet traffic from RighTel (AS57218) began to decline around 1630 UTC. After an outage lasting more than 12 hours, traffic returned at 0510 UTC.
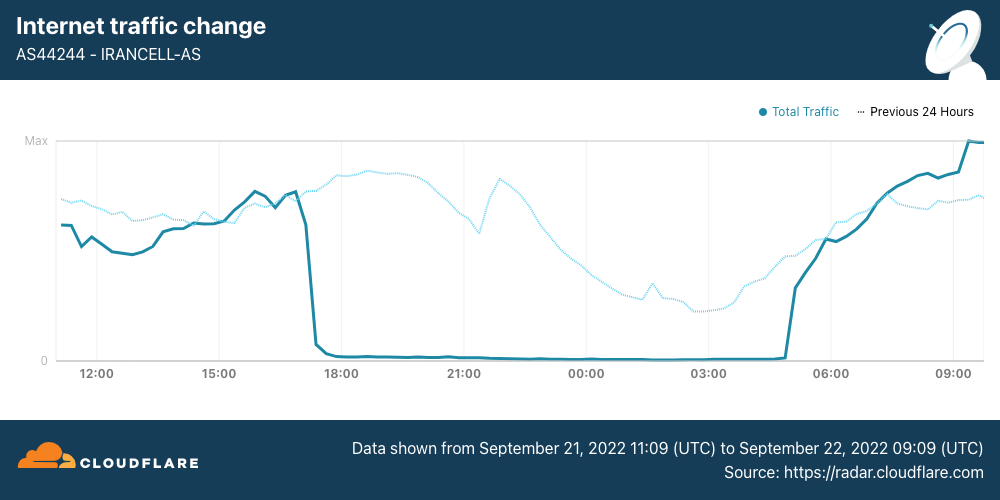
Internet traffic from MTN Irancell (AS44244) began to drop just before 1700 UTC. After a 12-hour outage, traffic began recovering at 0450 UTC.
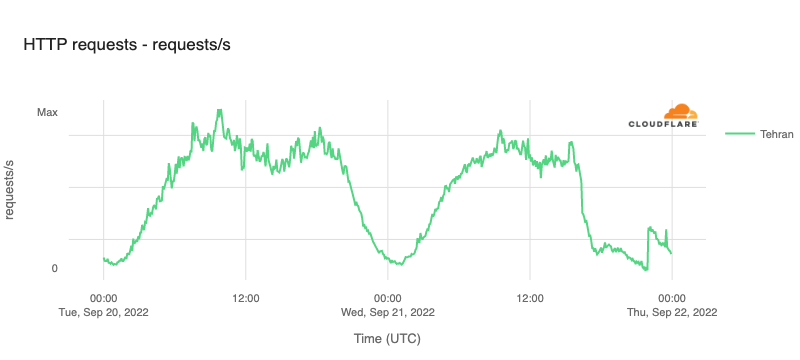
The impact of these disruptions is also visible when looking at traffic at both a regional and national level. In Tehran Province, HTTP request volume declined by approximately 70% around 1600 UTC, and continued to drop for the next several hours before seeing a slight recovery at 2200 UTC, likely related to the recovery also seen at that time on AS197207.
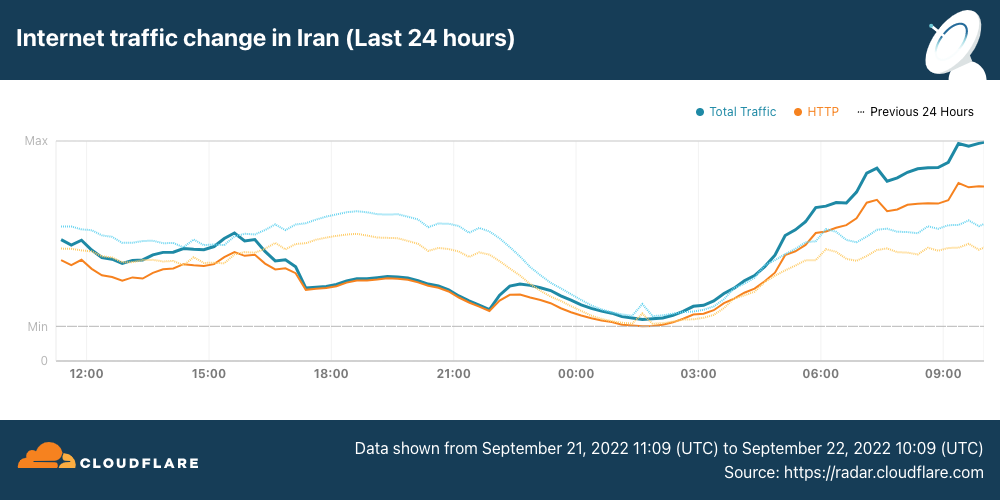
Similarly, Internet traffic volumes across the whole country began to decline just after 1600 UTC, falling approximately 40%. Nominal recovery at 2200 UTC is visible in this view as well, again likely from the increase in traffic from AS197207. More aggressive traffic growth is visible starting around 0500 UTC, after the remaining two mobile network providers came back online.
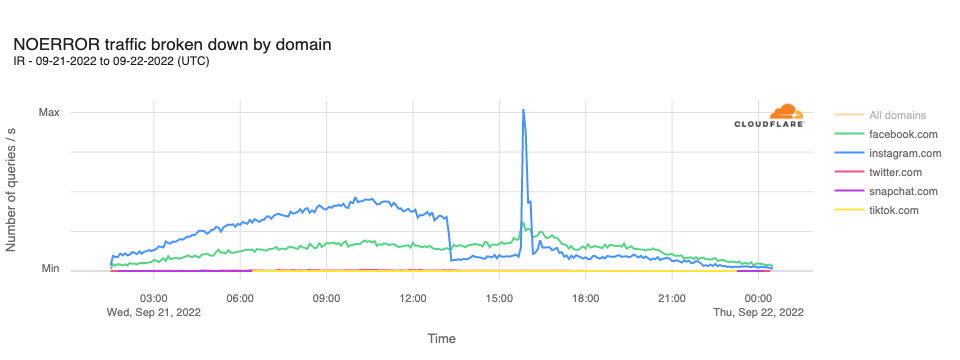
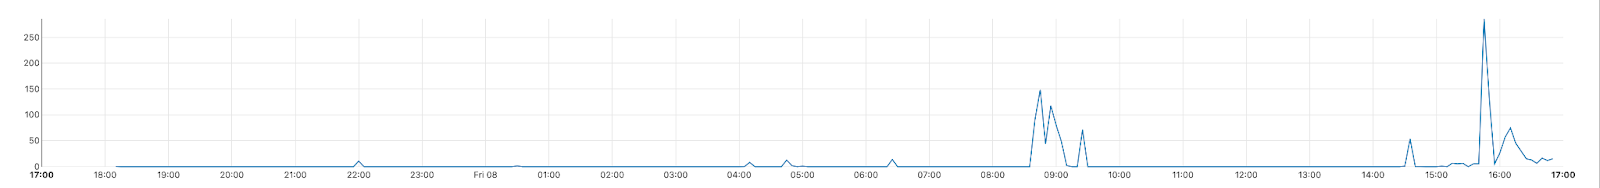
In analyzing DNS requests to Cloudflare’s resolver for domains associated with leading social media platforms, we observe that requests for instagram.com hostnames drop sharply at 1310 UTC, remaining lower for the rest of the day, except for a significant unexplained spike in requests between 1540 and 1610 UTC. Request volumes for hostnames associated with other leading social media platforms did not appear to be similarly affected.
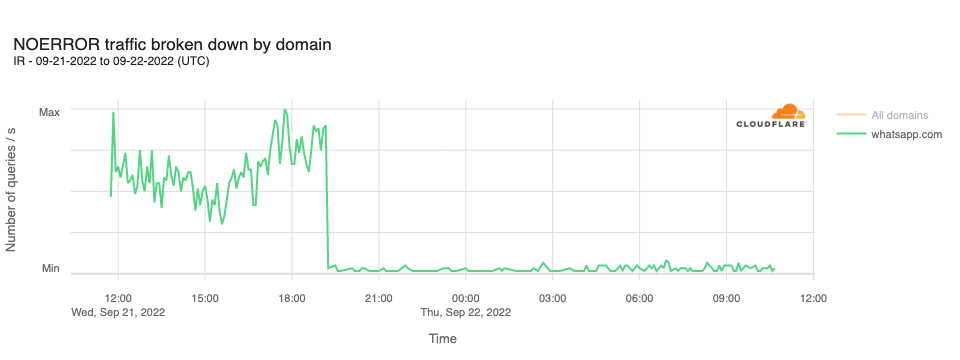
In addition, it was reported that access to WhatsApp had also been blocked in Iran. This can be seen in resolution requests to Cloudflare’s resolver for whatsapp.com hostnames. The graph below shows a sharp decline in query traffic at 1910 UTC, dropping to near zero.
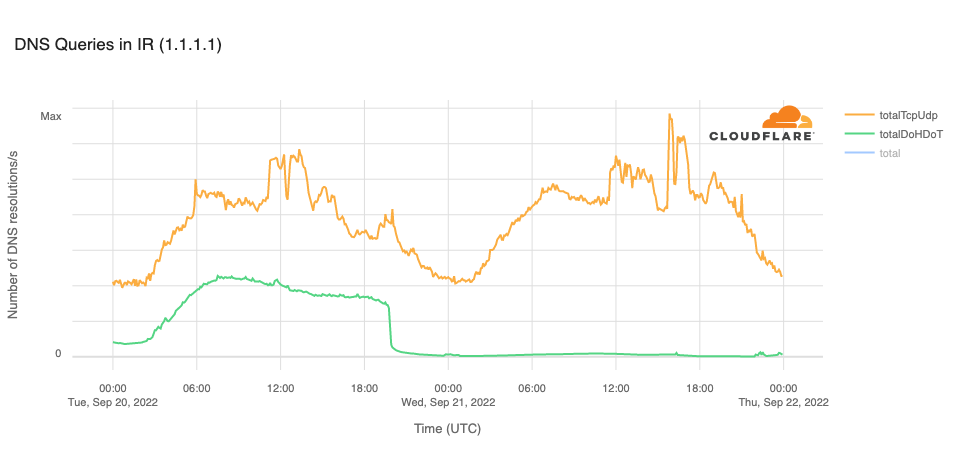
The Open Observatory for Network Interference (OONI), an organization that measures Internet censorship, reported in a Tweet that the cloudflare-dns.com domain name, used for DNS-over-HTTPS (DoH) and DNS-over-TLS (DoT) connections to Cloudflare’s DNS resolver, was blocked in Iran on September 20. This is clearly evident in the graph below, with resolution volume over DoH and DoT dropping to zero at 1940 UTC. The OONI tweet also noted that the 1.1.1.1 IP address “remains blocked on most networks.” The trend line for resolution over TCP or UDP (on port 53) in the graph below suggests that the IP address is not universally blocked, as there are still resolution requests reaching Cloudflare.
Interested parties can use Cloudflare Radar to monitor the impact of such government-directed Internet disruptions, and can follow @CloudflareRadar on Twitter for updates on Internet disruptions as they occur.
The James Webb Telescope reveals emerging stellar nurseries and individual stars in the Carina Nebula that were previously obscured. Credits: NASA, ESA, CSA, and STScI. Full image here.
“Somewhere, something incredible is waiting to be known.” — Carl Sagan
In the past few years, space technology and travel have been trending with increased attention and endeavors (including private ones). In our 2021 Year in Review we showed how NASA and SpaceX flew higher, at least in terms of interest on the Internet.
This week, NASA in collaboration with the European Space Agency (ESA) and the Canadian Space Agency (CSA), released the first images from the James Webb Telescope (JWST) which conducts infrared astronomy to “reveal the unseen universe”.
Webb’s First Deep Field is the first operational image taken by the James Webb Space Telescope, depicting a galaxy cluster with a distance of 5.12 billion light-years from Earth. Revealed to the public on 11 July 2022. Credits: NASA, ESA, CSA, and STScI. Full image here.
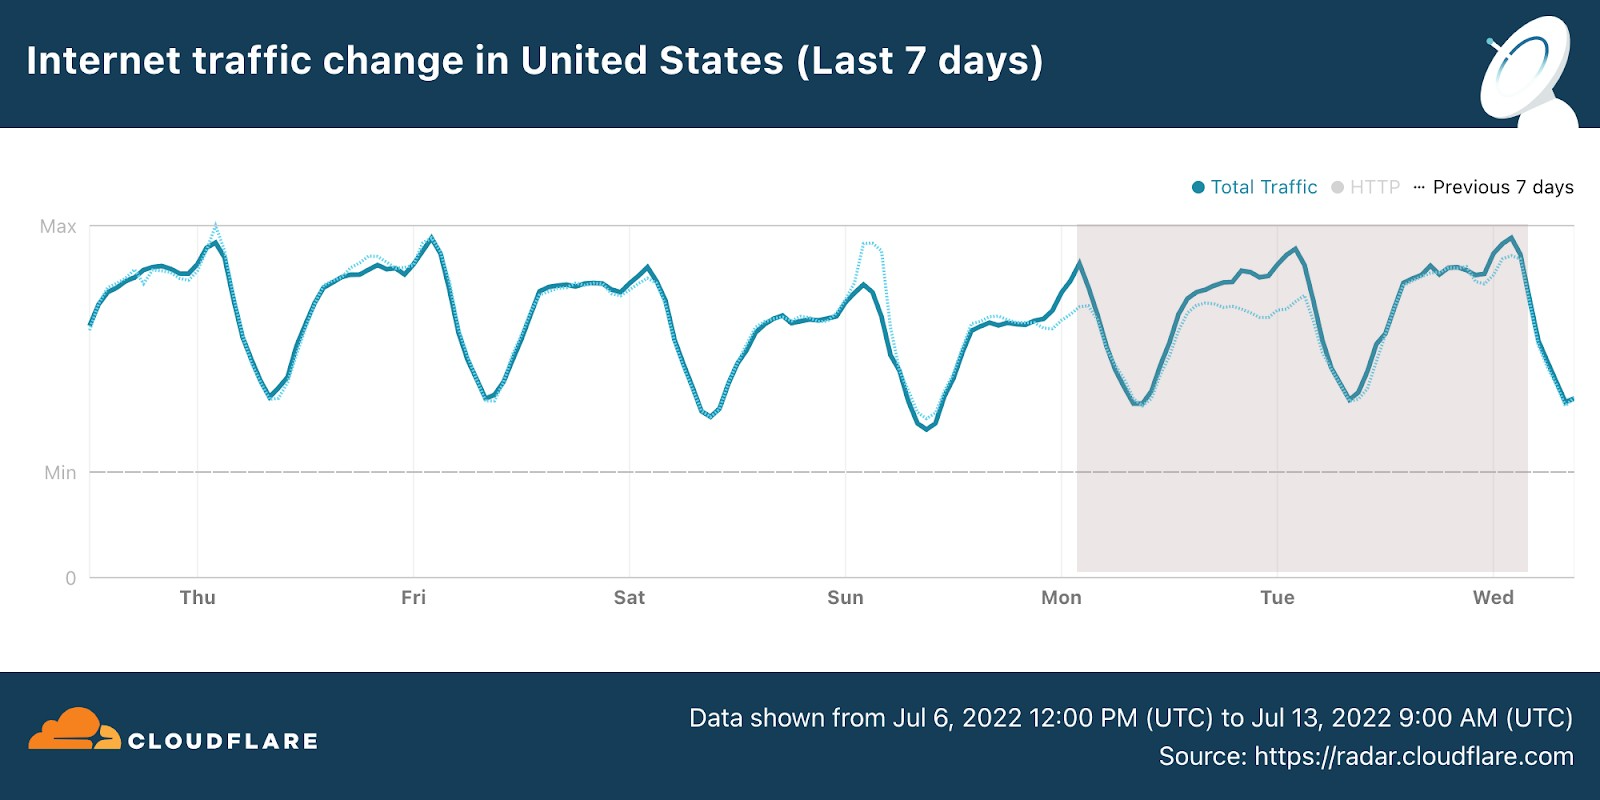
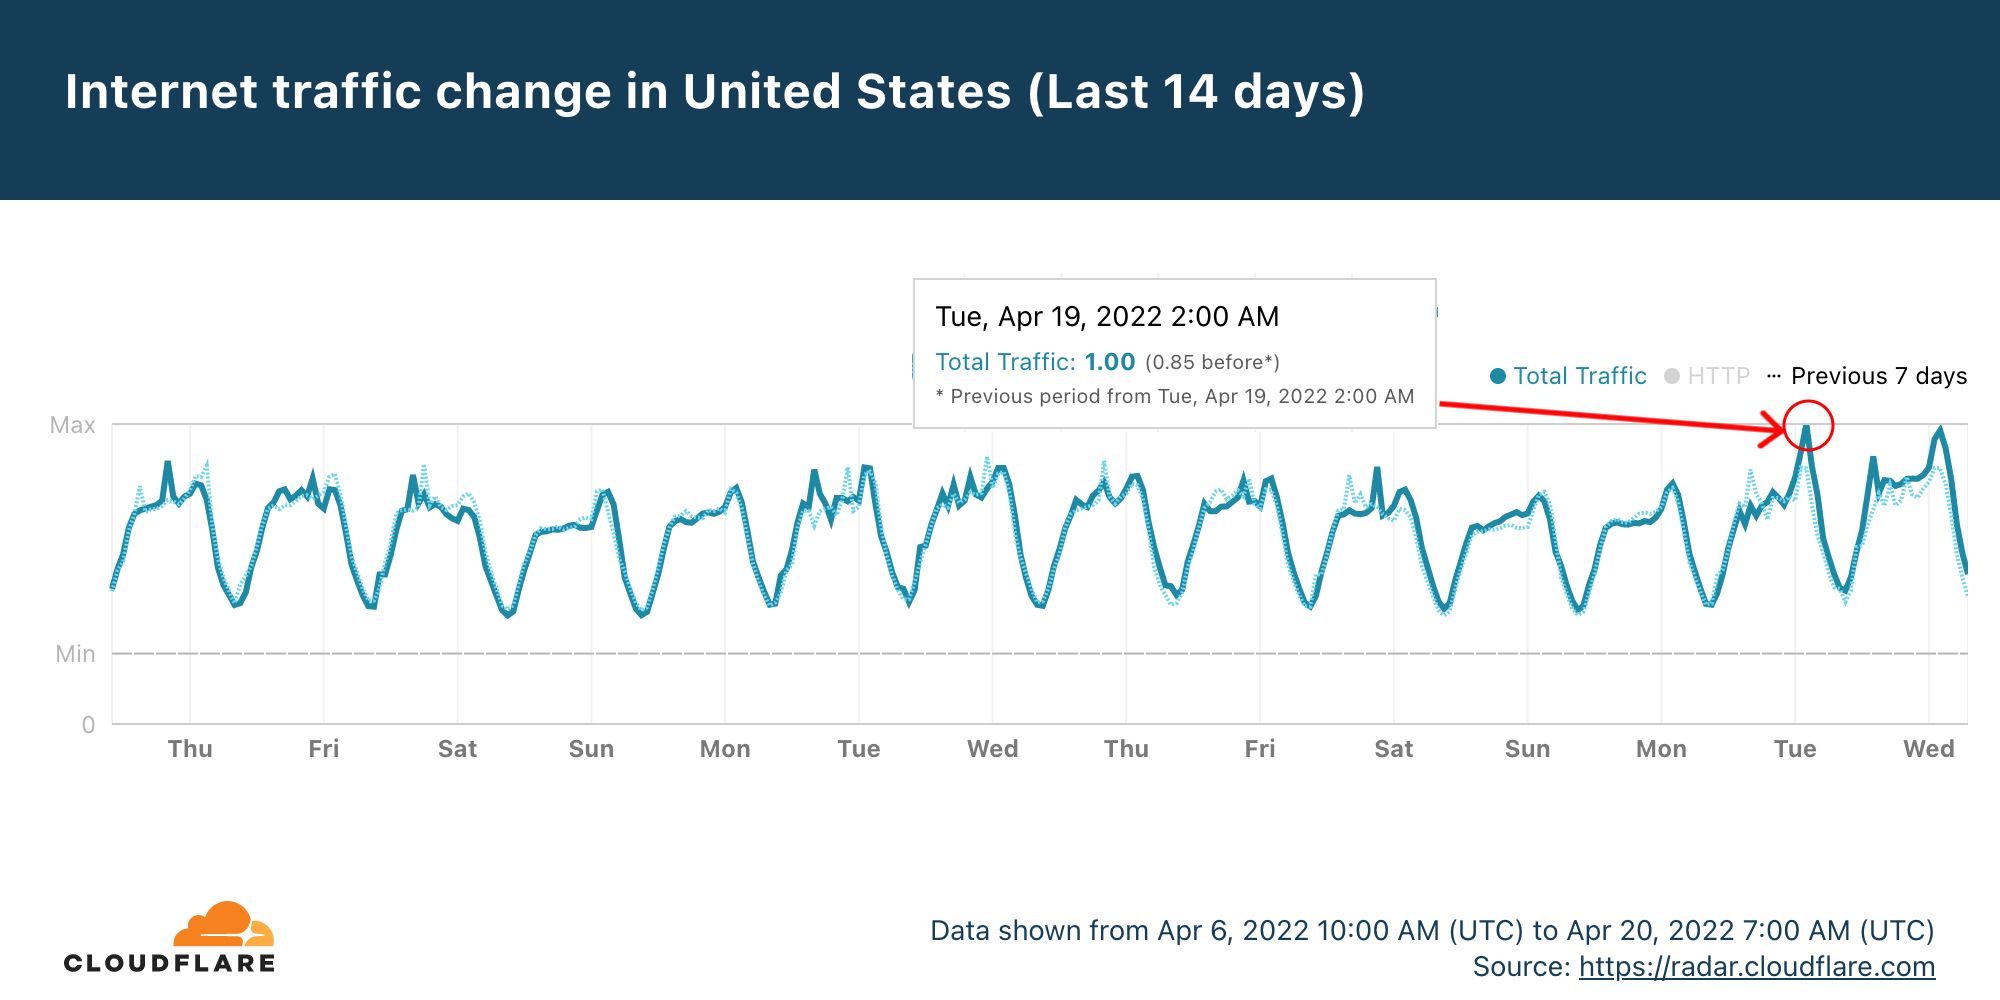
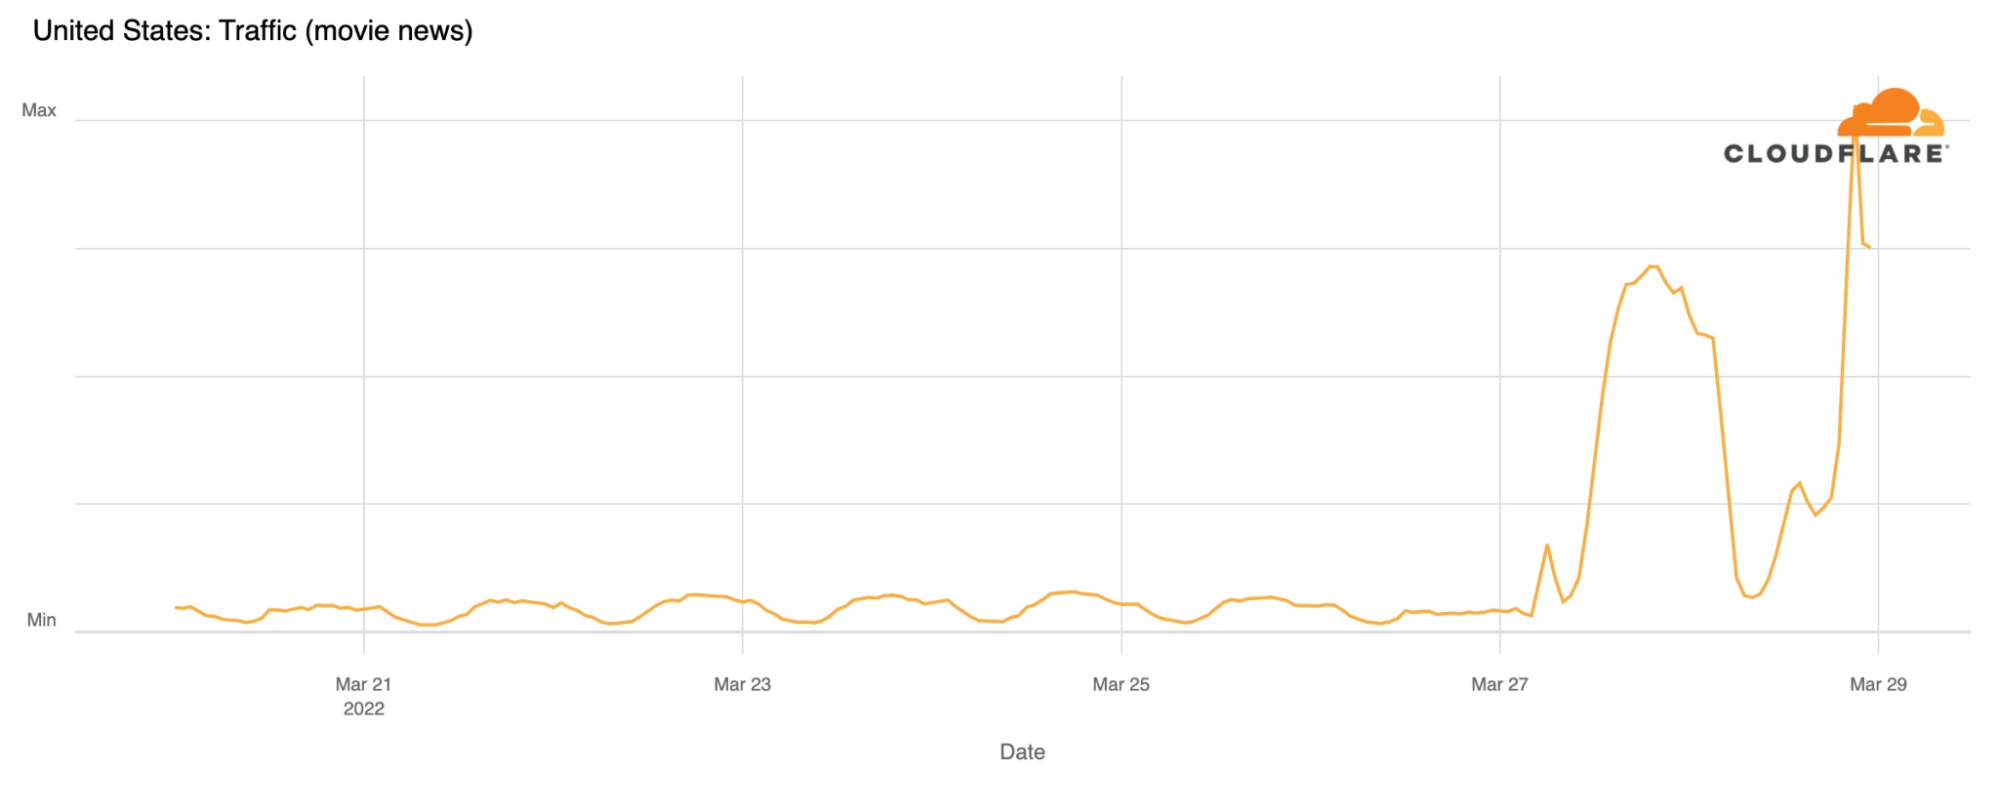
So, let’s dig into something we really like here at Cloudflare, checking how real life and human interest has an impact on the Internet. In terms of general Internet traffic in the US, Radar shows us that there was an increase both on July 11 and July 12, compared to the previous week (bear in mind that July 4, the previous Monday, was the Independence Day holiday in the US).
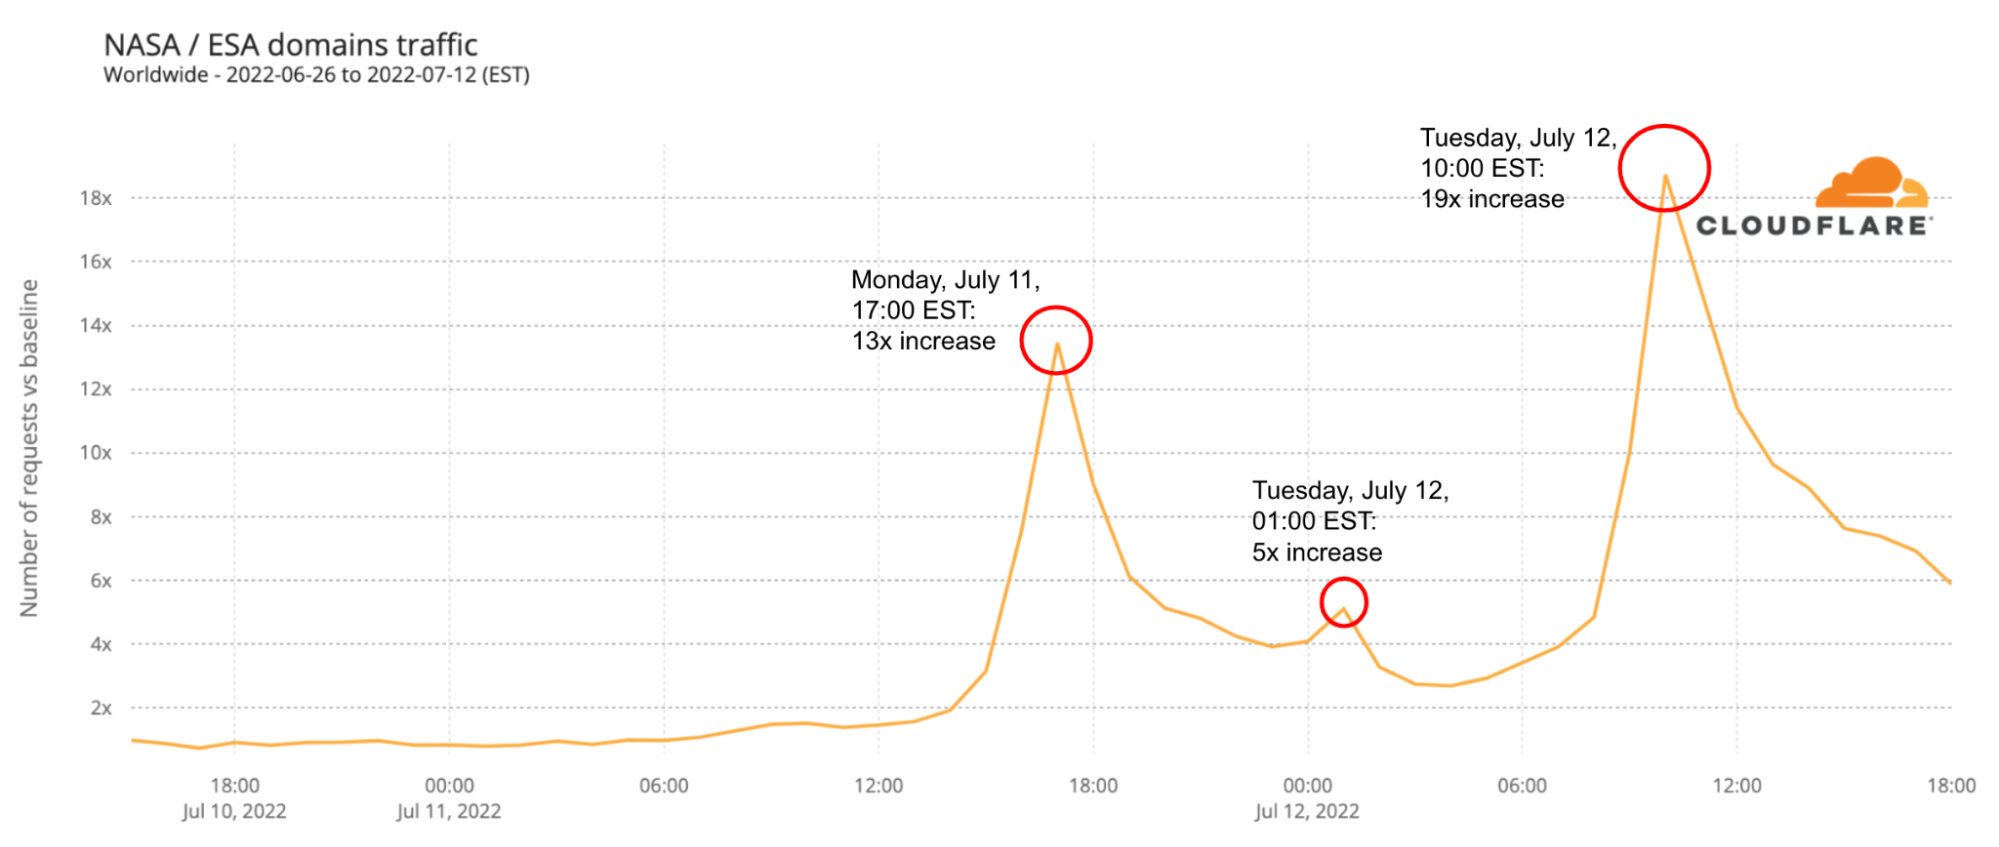
Next, we look at DNS request trends to get a sense of traffic to Internet properties (and using from this point on EST time in all the charts). Let’s start with the cornucopia of NASA, ESA and other websites (there are many, some dedicated just to the James Webb Telescope findings).
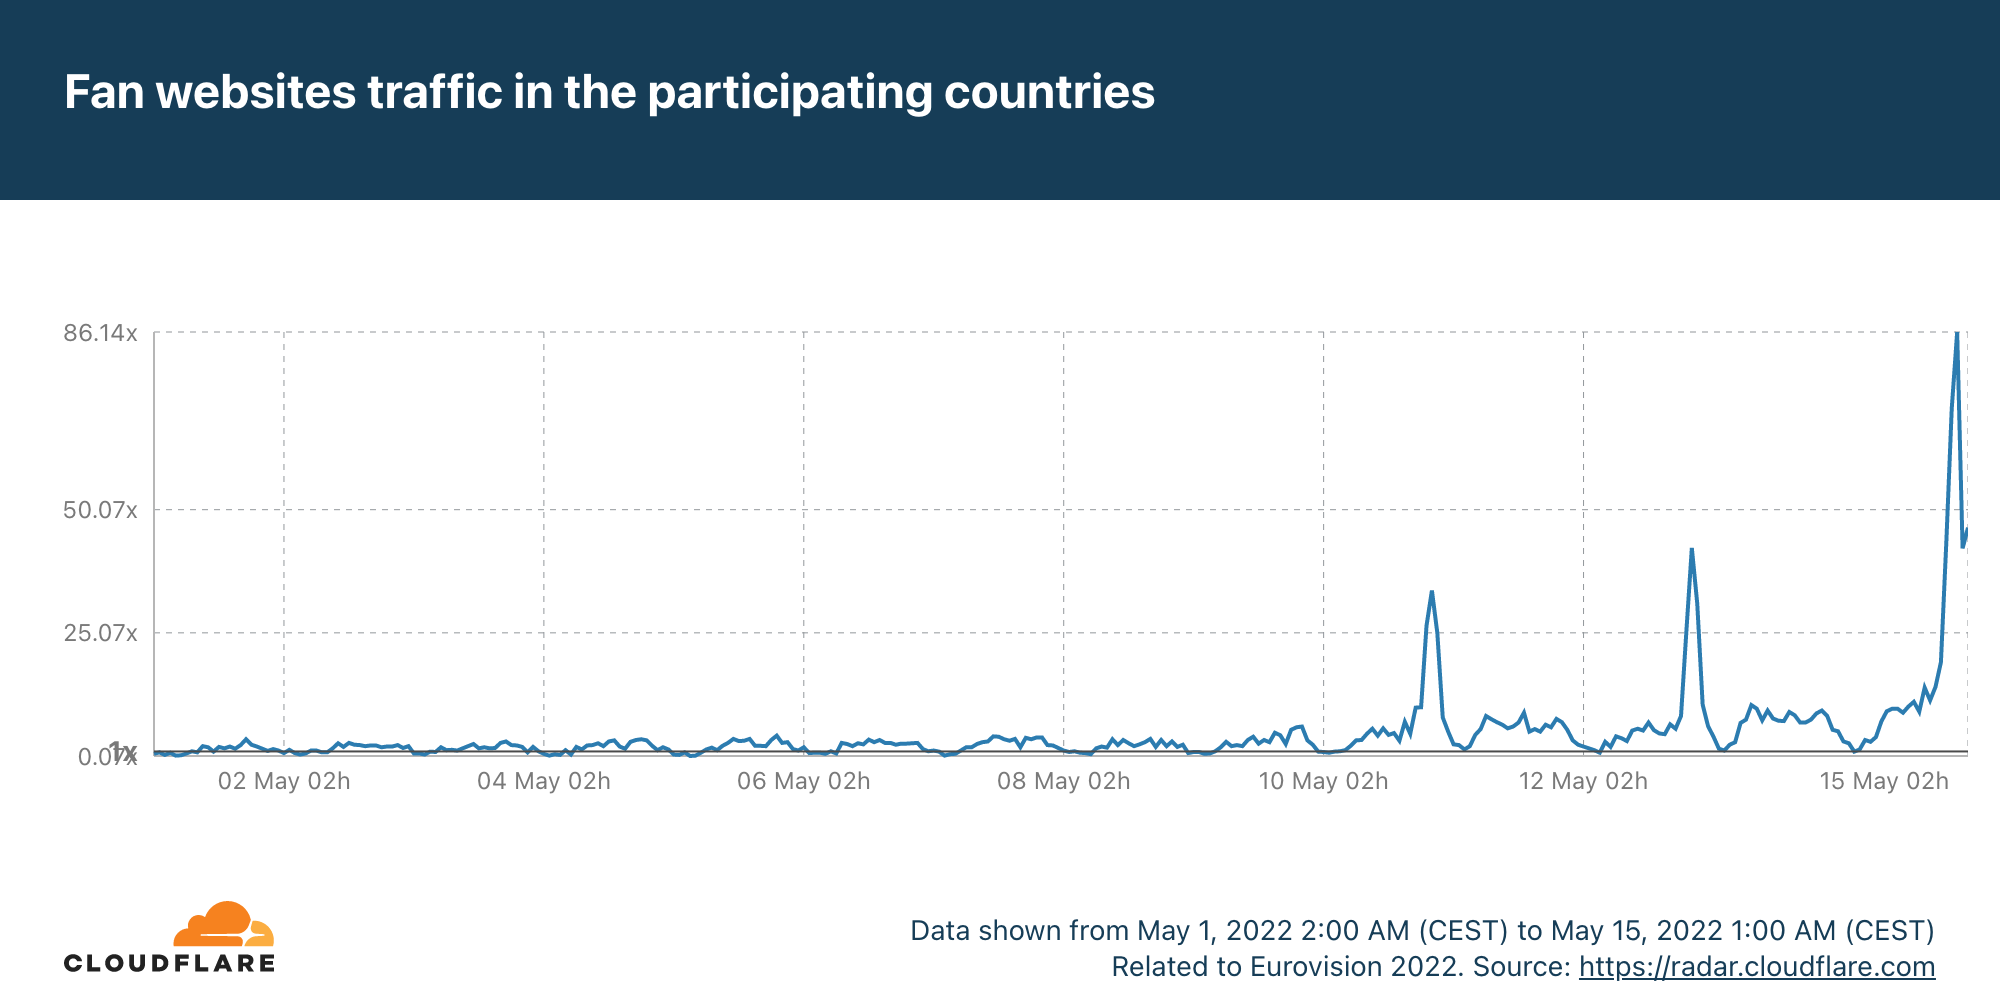
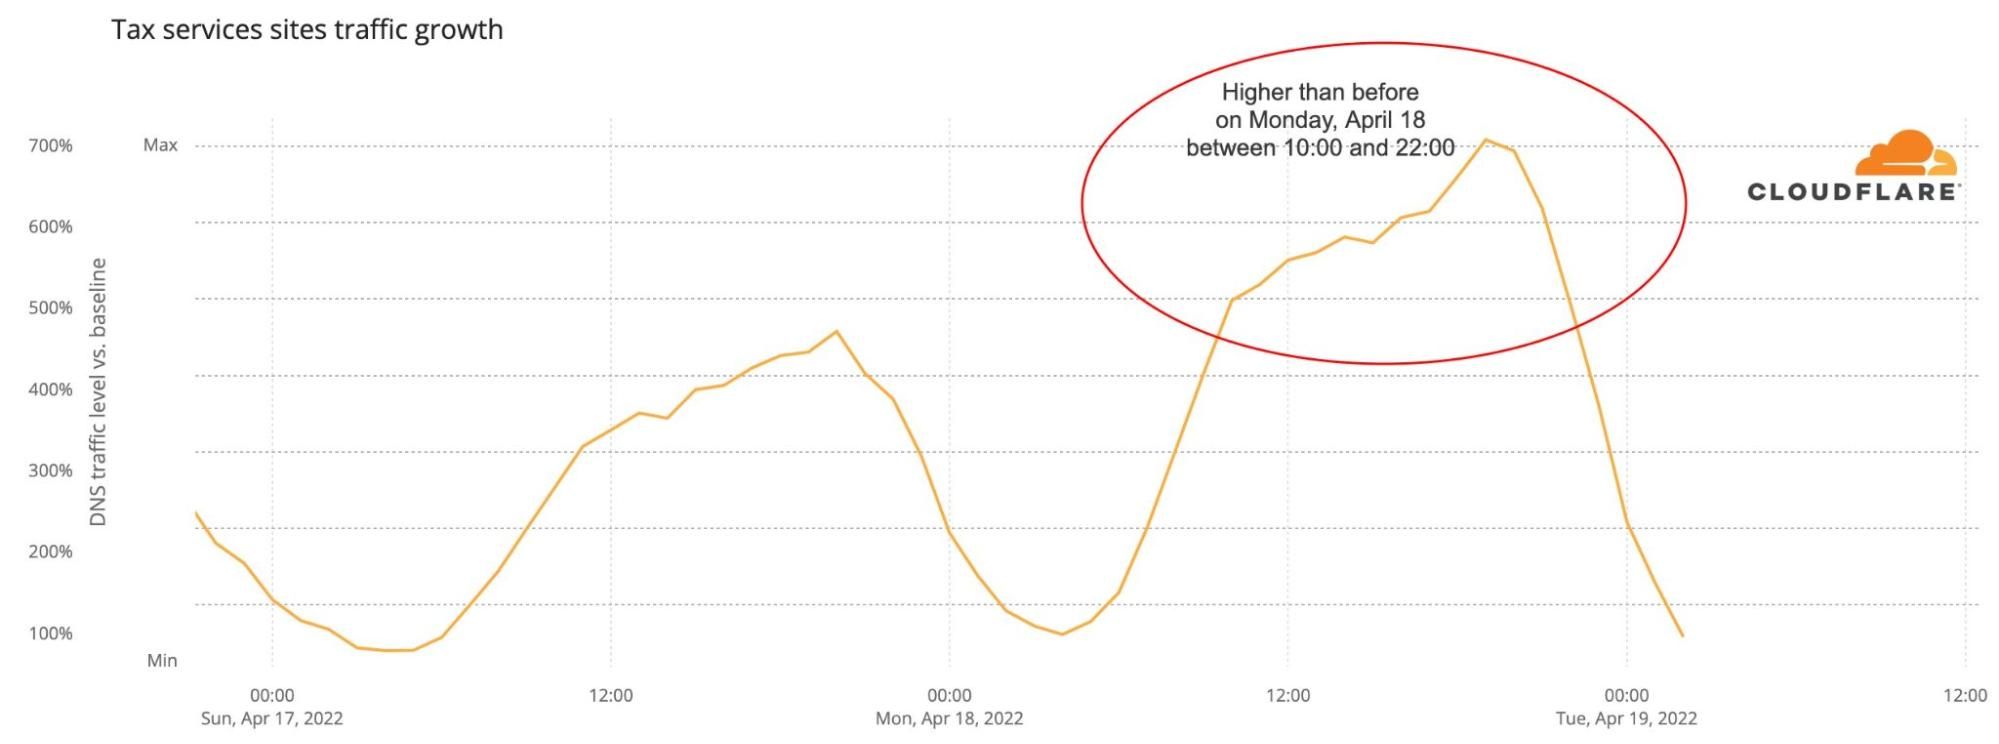
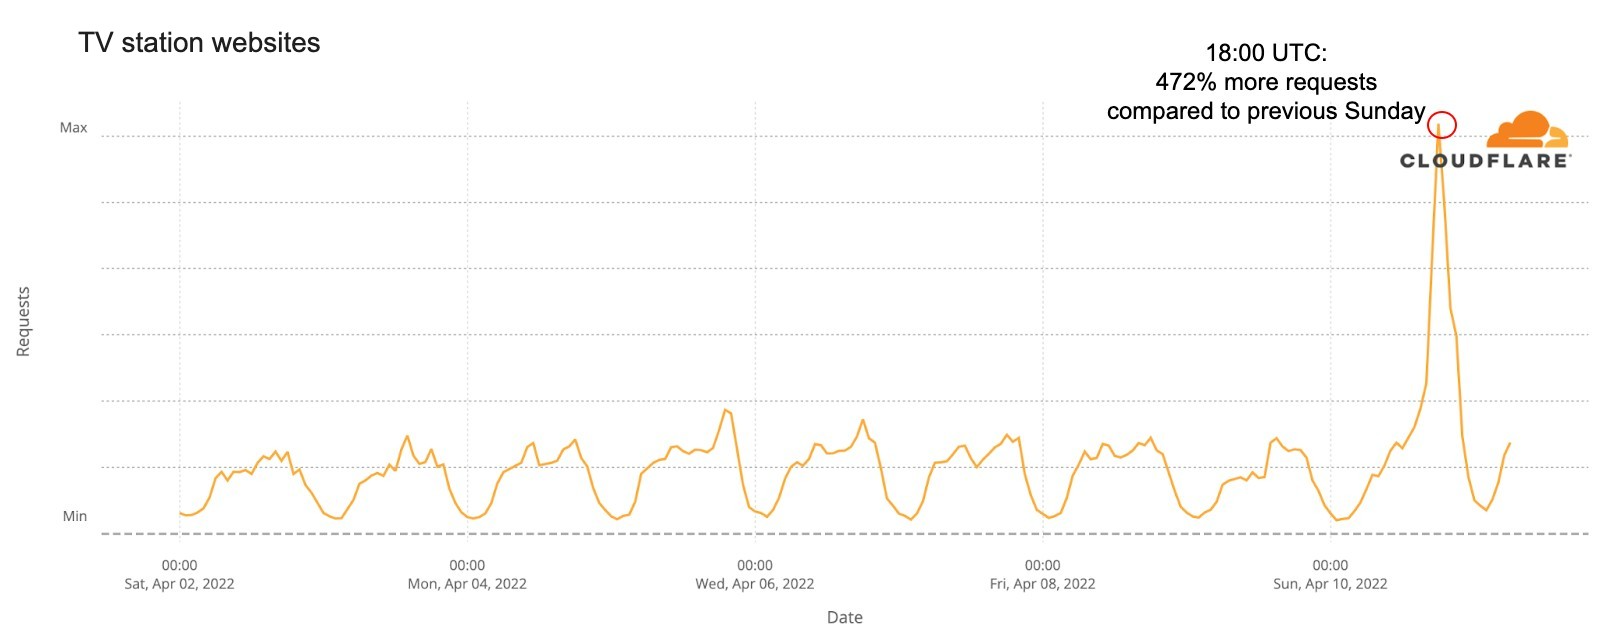
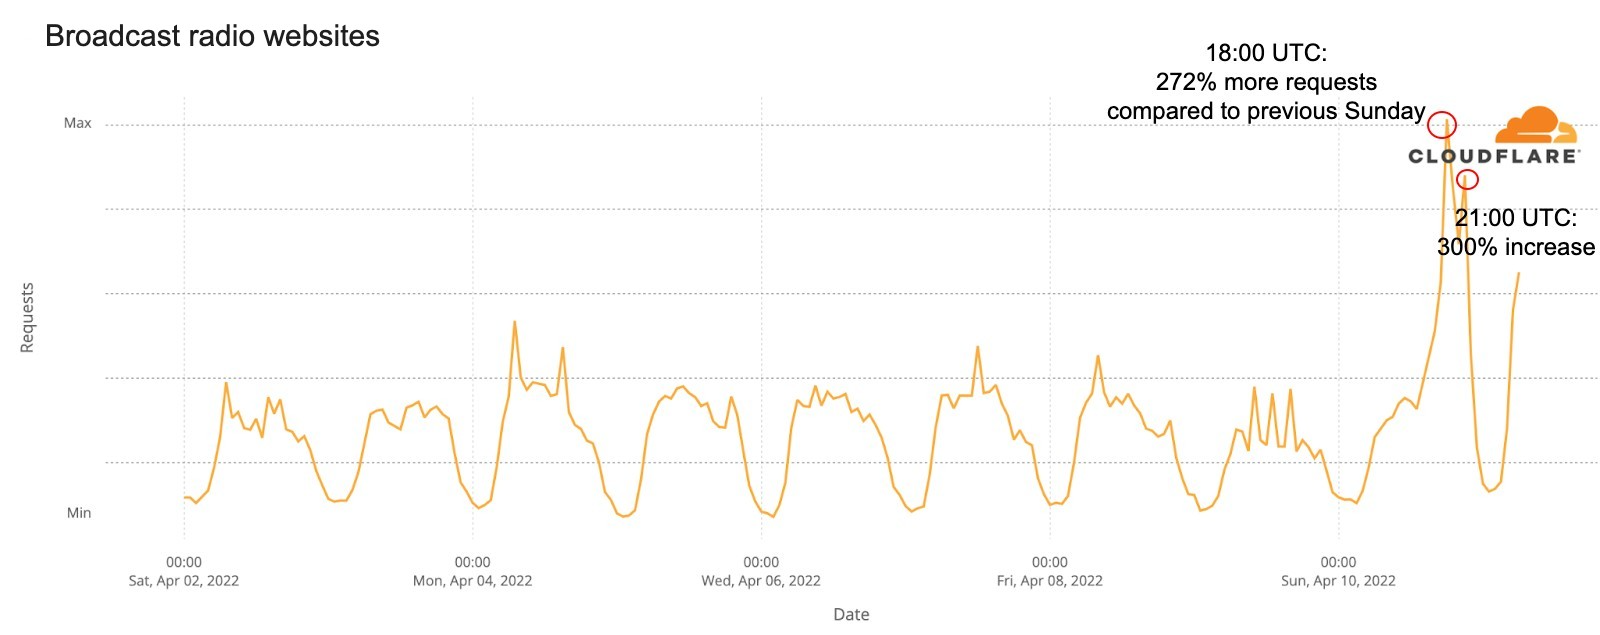
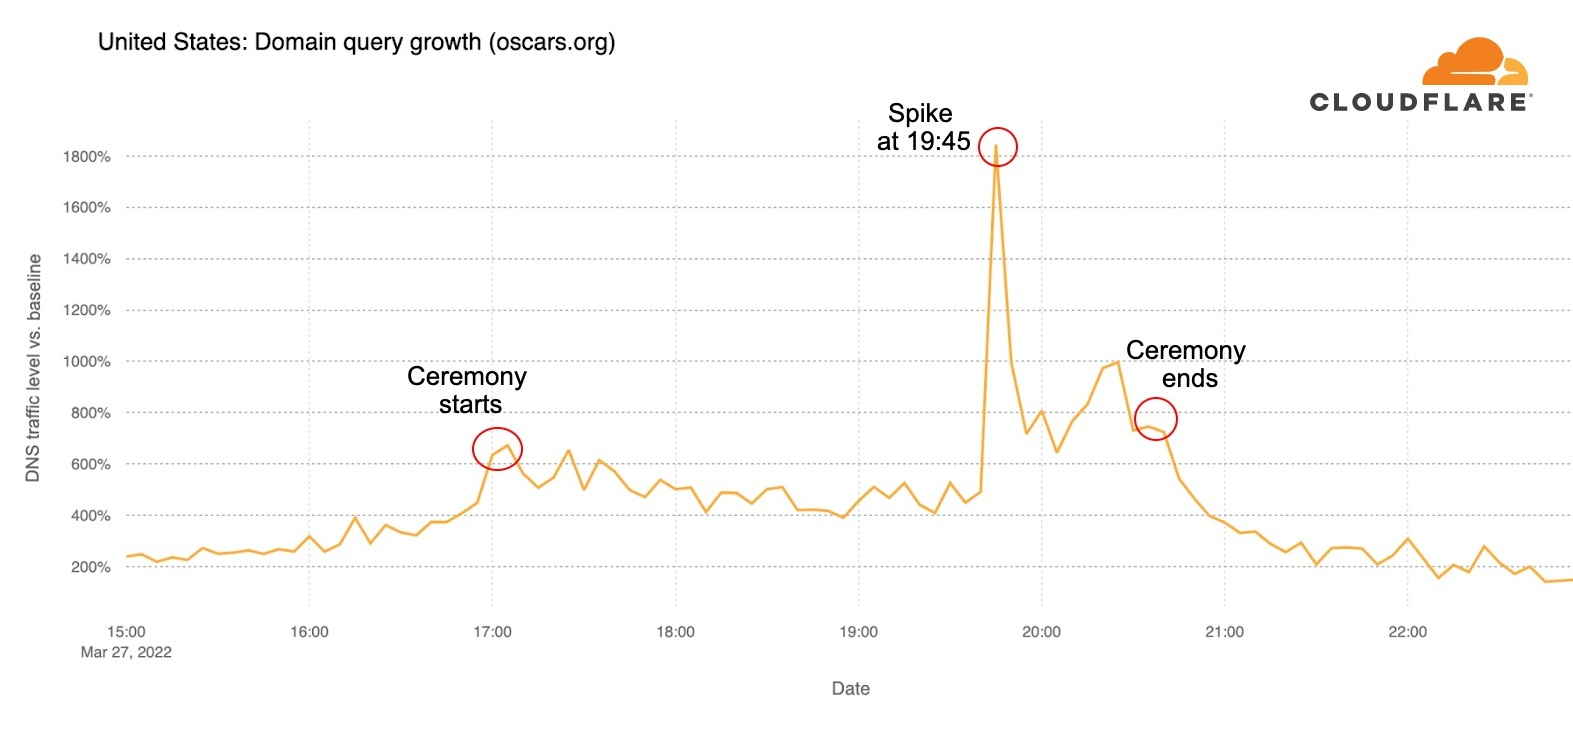
There are two clear spikes in the next chart. The first was around the time the first galaxy cluster infrared image was announced by Joe Biden, on Monday, July 11, 2022 (at 17:00), with traffic rising 13x higher than in the previous week. There was also a 5x spike at 01:00 EST that evening. The second spike was higher and longer and happened during Tuesday, July 12, 2022, when more images were revealed. Tuesday’s peak was at 10:00, with traffic being 19x higher than in the previous week — traffic was higher than 10x between 09:00 and 13:00.
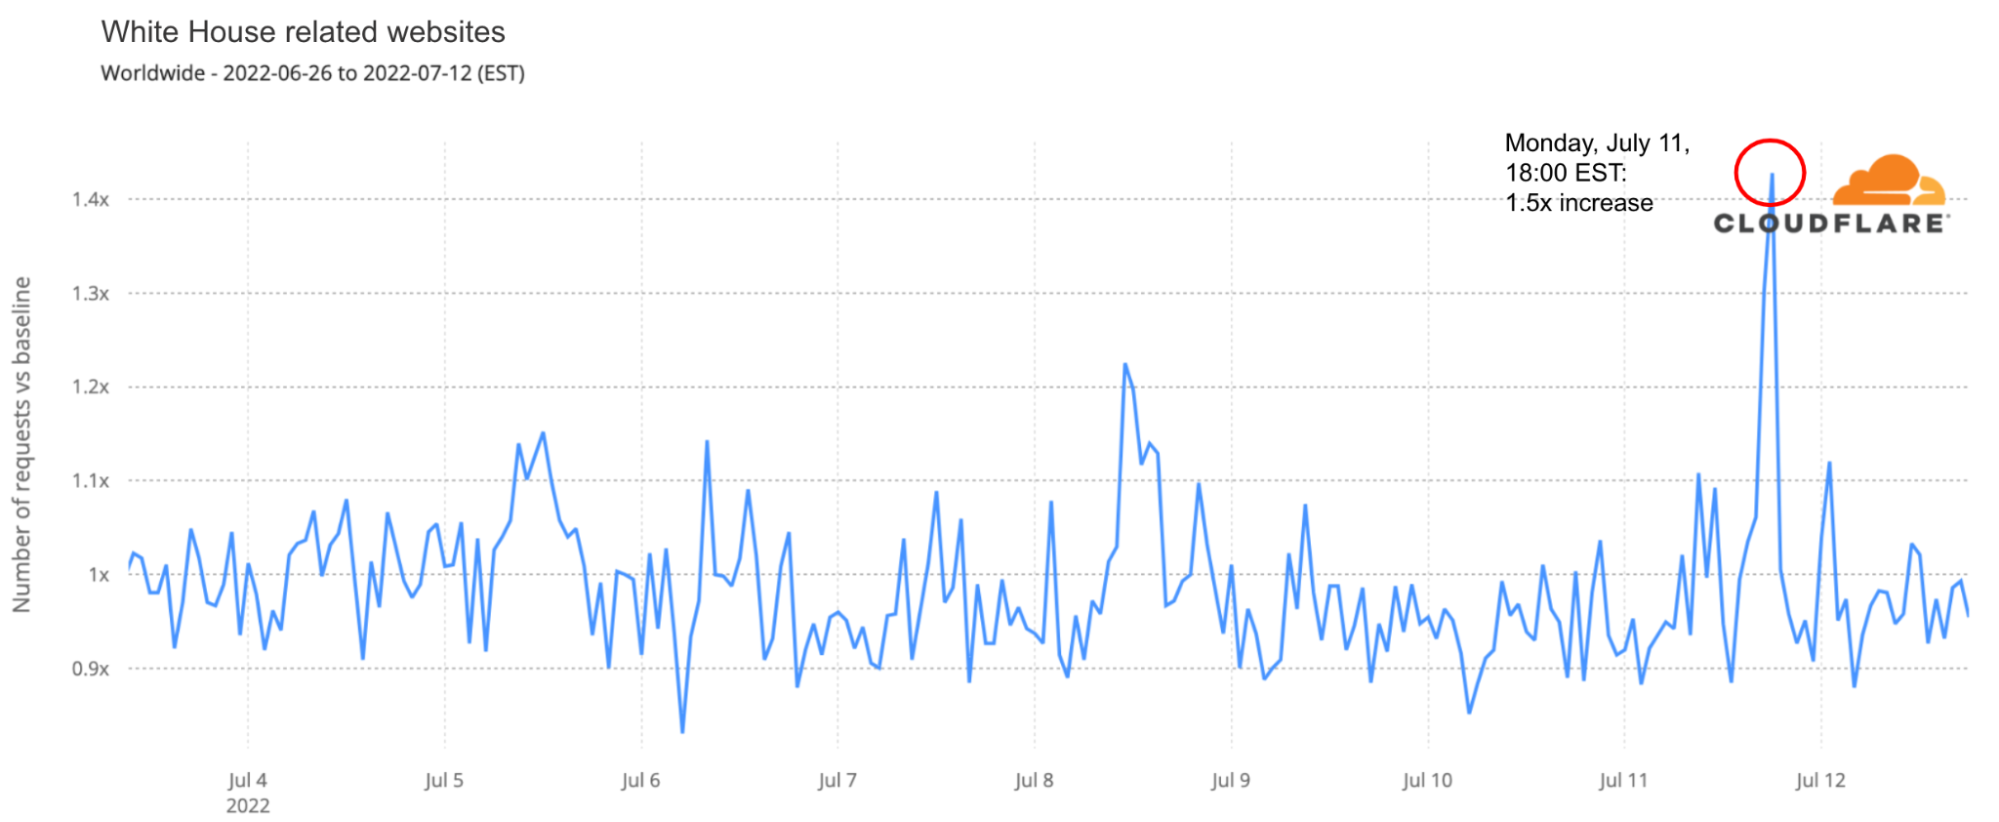
The first image was presented by US president at around 17:00 on July 11. DNS traffic was 1.5x higher to White House-related websites than any time in the preceding month.
Conclusion: space, the final frontier
As we saw in 2021, space projects and announcements continue to have a clear impact on the Internet, in this case in our DNS request view of Internet traffic. So far, what the James Webb Telescope images are showing us is a glimpse of a never-before-seen picture of parts of the universe (there’s no lack of excitement in Cloudflare’s internal chat groups).
You can keep an eye on these and other trends using Cloudflare Radar and follow @CloudflareRadar on Twitter — recently we covered extensively Canada’s Internet outage.
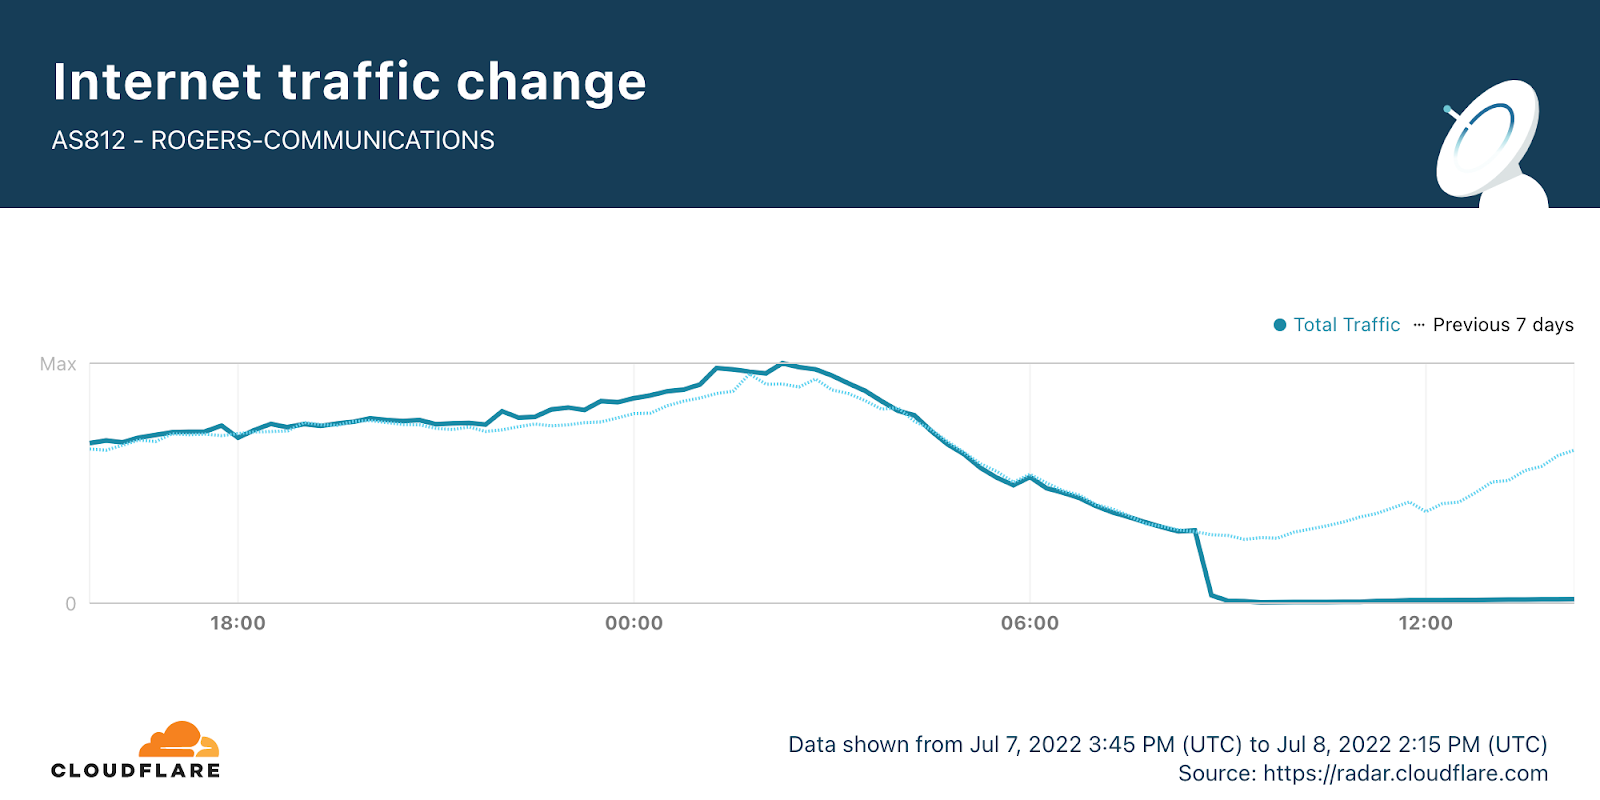
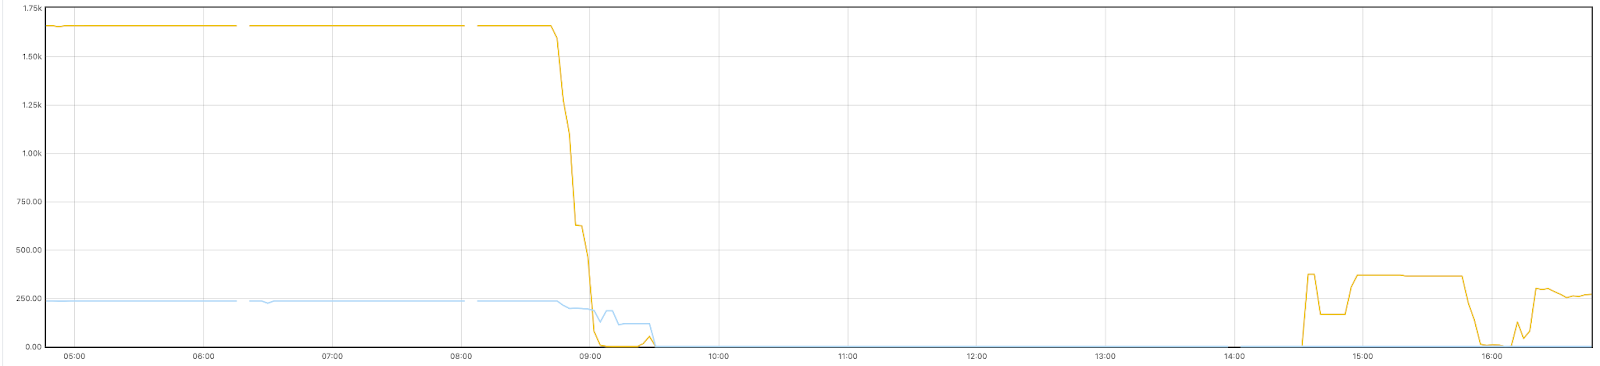
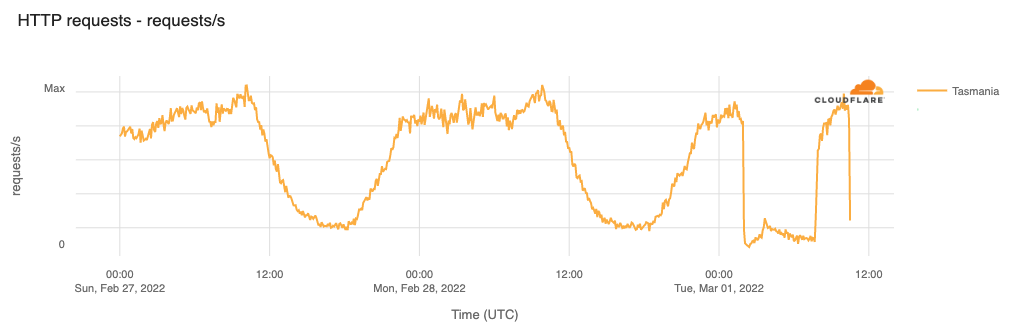
An outage at one of the largest ISPs in Canada, Rogers Communications, started earlier today, July 8, 2022, and is ongoing (eight hours and counting), and is impacting businesses and consumers. At the time of writing, we are seeing a very small amount of traffic from Rogers, but we are only seeing residual traffic, and nothing close to a full recovery to normal traffic levels.
Based on what we’re seeing and similar incidents in the past, we believe this is likely to be an internal error, not a cyber attack.
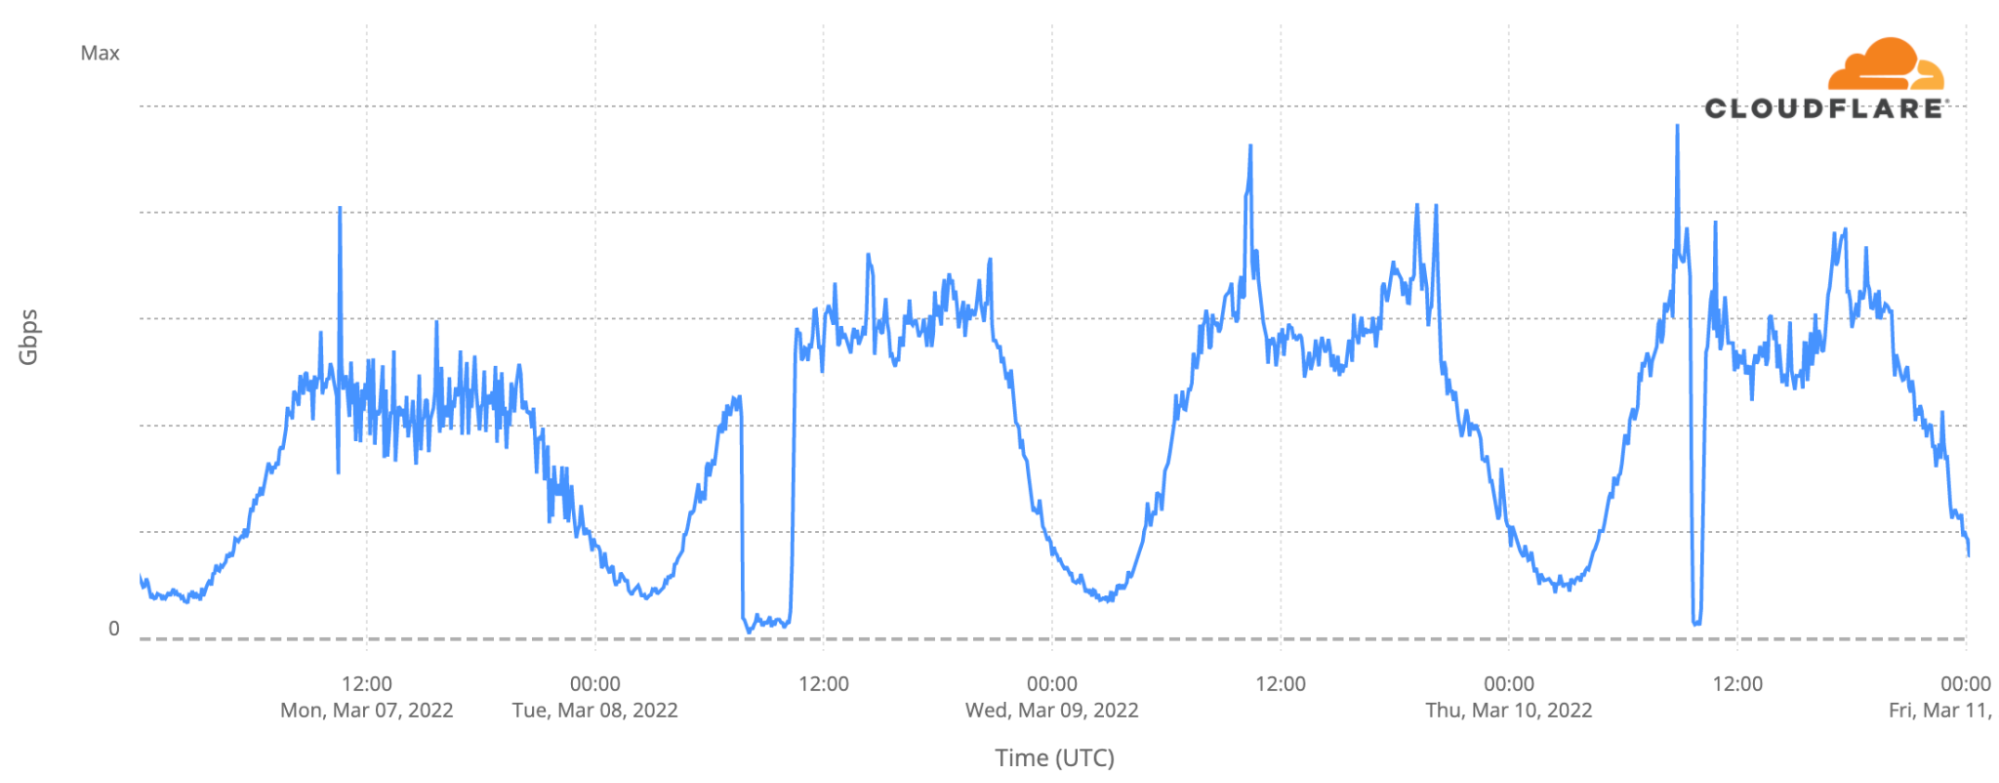
Cloudflare Radar shows a near complete loss of traffic from Roger’s ASN, AS812, that started around 08:45 UTC (all times in this blog are UTC).
What happened?
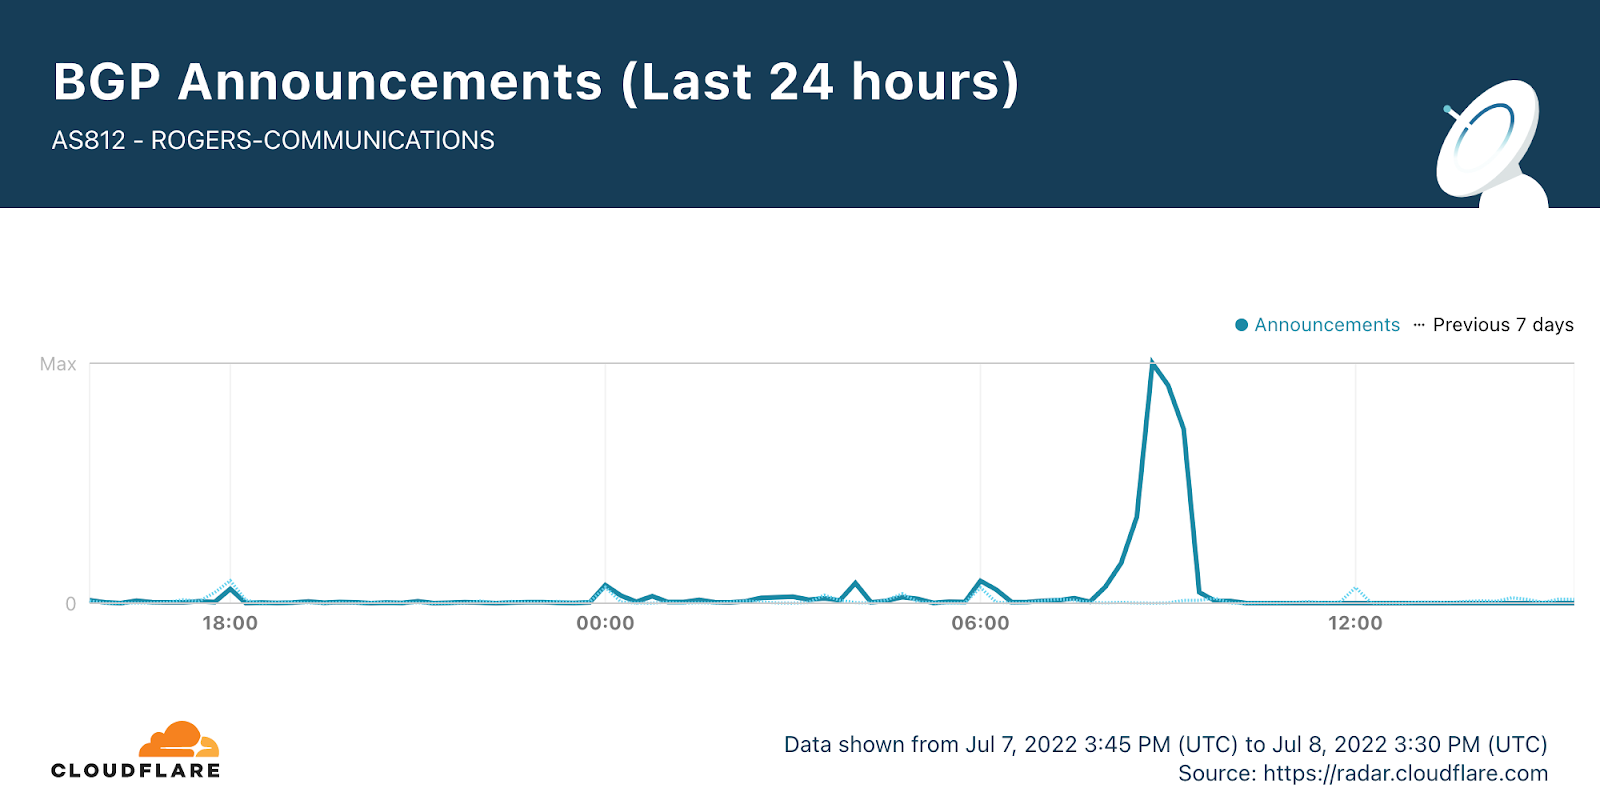
Cloudflare data shows that there was a clear spike in BGP (Border Gateway Protocol) updates after 08:15, reaching its peak at 08:45.
BGP is a mechanism to exchange routing information between networks on the Internet. The big routers that make the Internet work have huge, constantly updated lists of the possible routes that can be used to deliver each network packet to its final destination. Without BGP, the Internet routers wouldn’t know what to do, and the Internet wouldn’t exist.
The Internet is literally a network of networks, or for the maths fans, a graph, with each individual network a node in it, and the edges representing the interconnections. All of this is bound together by BGP. BGP allows one network (say Rogers) to advertise its presence to other networks that form the Internet. Rogers is not advertising its presence, so other networks can’t find Roger’s network and so it is unavailable.
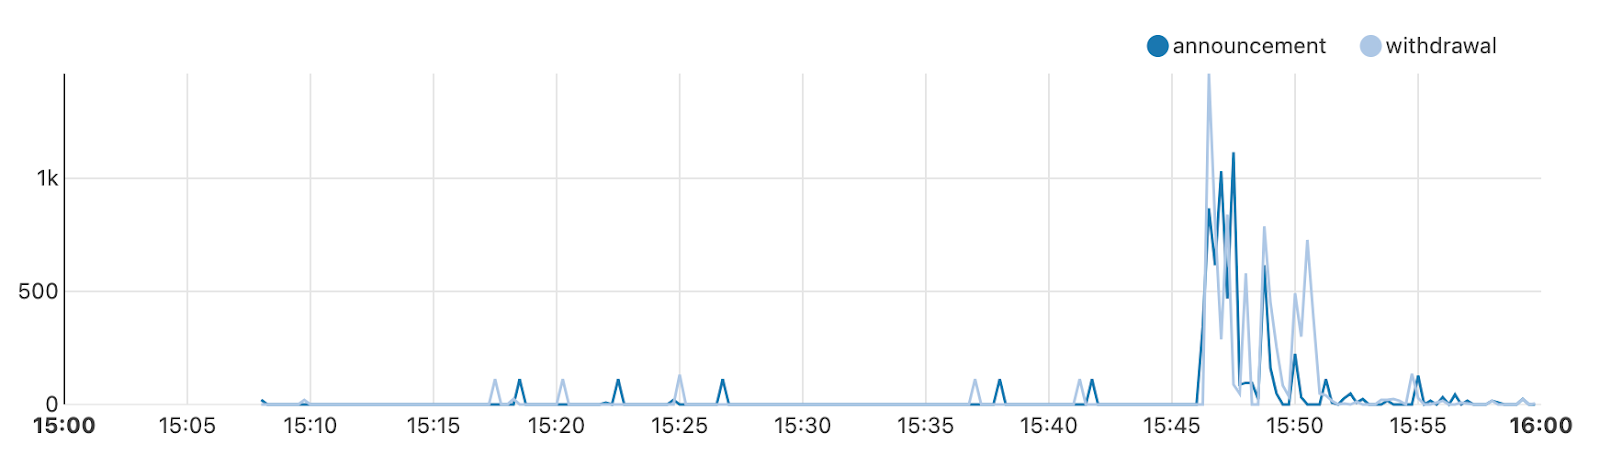
A BGP update message informs a router of changes made to a prefix (a group of IP addresses) advertisement or entirely withdraws the prefix. In this next chart, we can see that at 08:45 there was a withdrawal of prefixes from Roger’s ASN.
Since then, at 14:30, attempts seem to be made to advertise their prefixes again. This maps to us seeing a slow increase in traffic again from Rogers’ end users.
The graph below, which shows the prefixes we were receiving from Rogers in Toronto, clearly shows the withdrawal of prefixes around 08:45, and the slow start in recovery at 14:30, with another round of withdraws at around 15:45.
Outages happen more regularly than people think. This week we did an Internet disruptions overview for Q2 2022 where you can get a better sense of that, and on how collaborative and interconnected the Internet (the network of networks) is. And not so long ago Facebook had an hours long outage where BGP updates showed Facebook itself disappearing from the Internet.
Follow @CloudflareRadar on Twitter for updates on Internet disruptions as they occur, and find up-to-date information on Internet trends using Cloudflare Radar.
Welcome to our 2022 Q2 DDoS report. This report includes insights and trends about the DDoS threat landscape — as observed across the global Cloudflare network. An interactive version of this report is also available on Radar.
In Q2, we’ve seen some of the largest attacks the world has ever seen including a 26 million request per second HTTPS DDoS attacks that Cloudflare automatically detected and mitigated. Furthermore, attacks against Ukraine and Russia continue, whilst a new Ransom DDoS attack campaign emerged.
The Highlights
Ukrainian and Russian Internet
The war on the ground is accompanied by attacks targeting the spread of information.
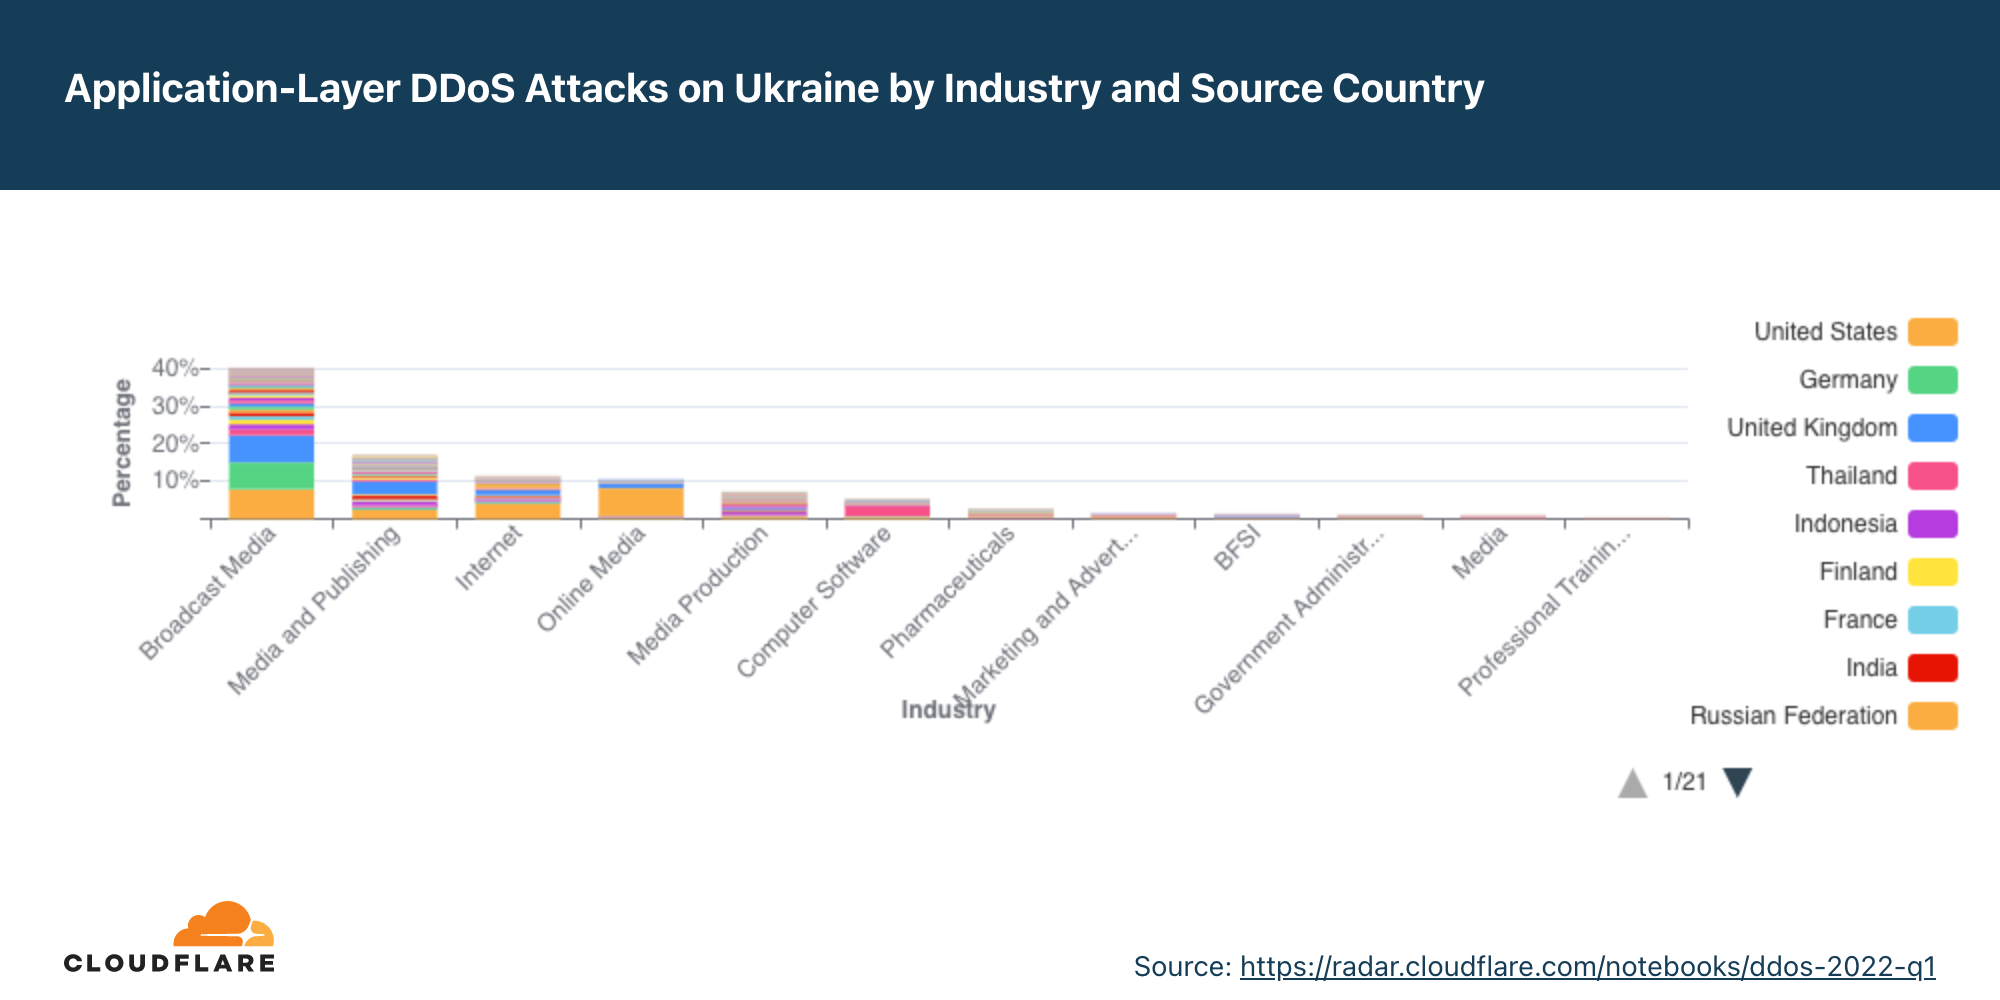
Broadcast Media companies in the Ukraine were the most targeted in Q2 by DDoS attacks. In fact, all the top five most attacked industries are all in online/Internet media, publishing, and broadcasting.
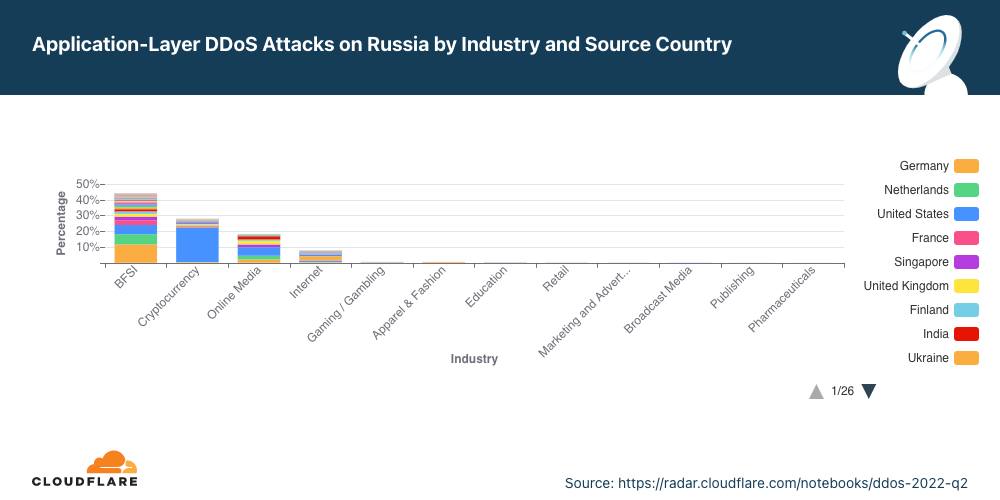
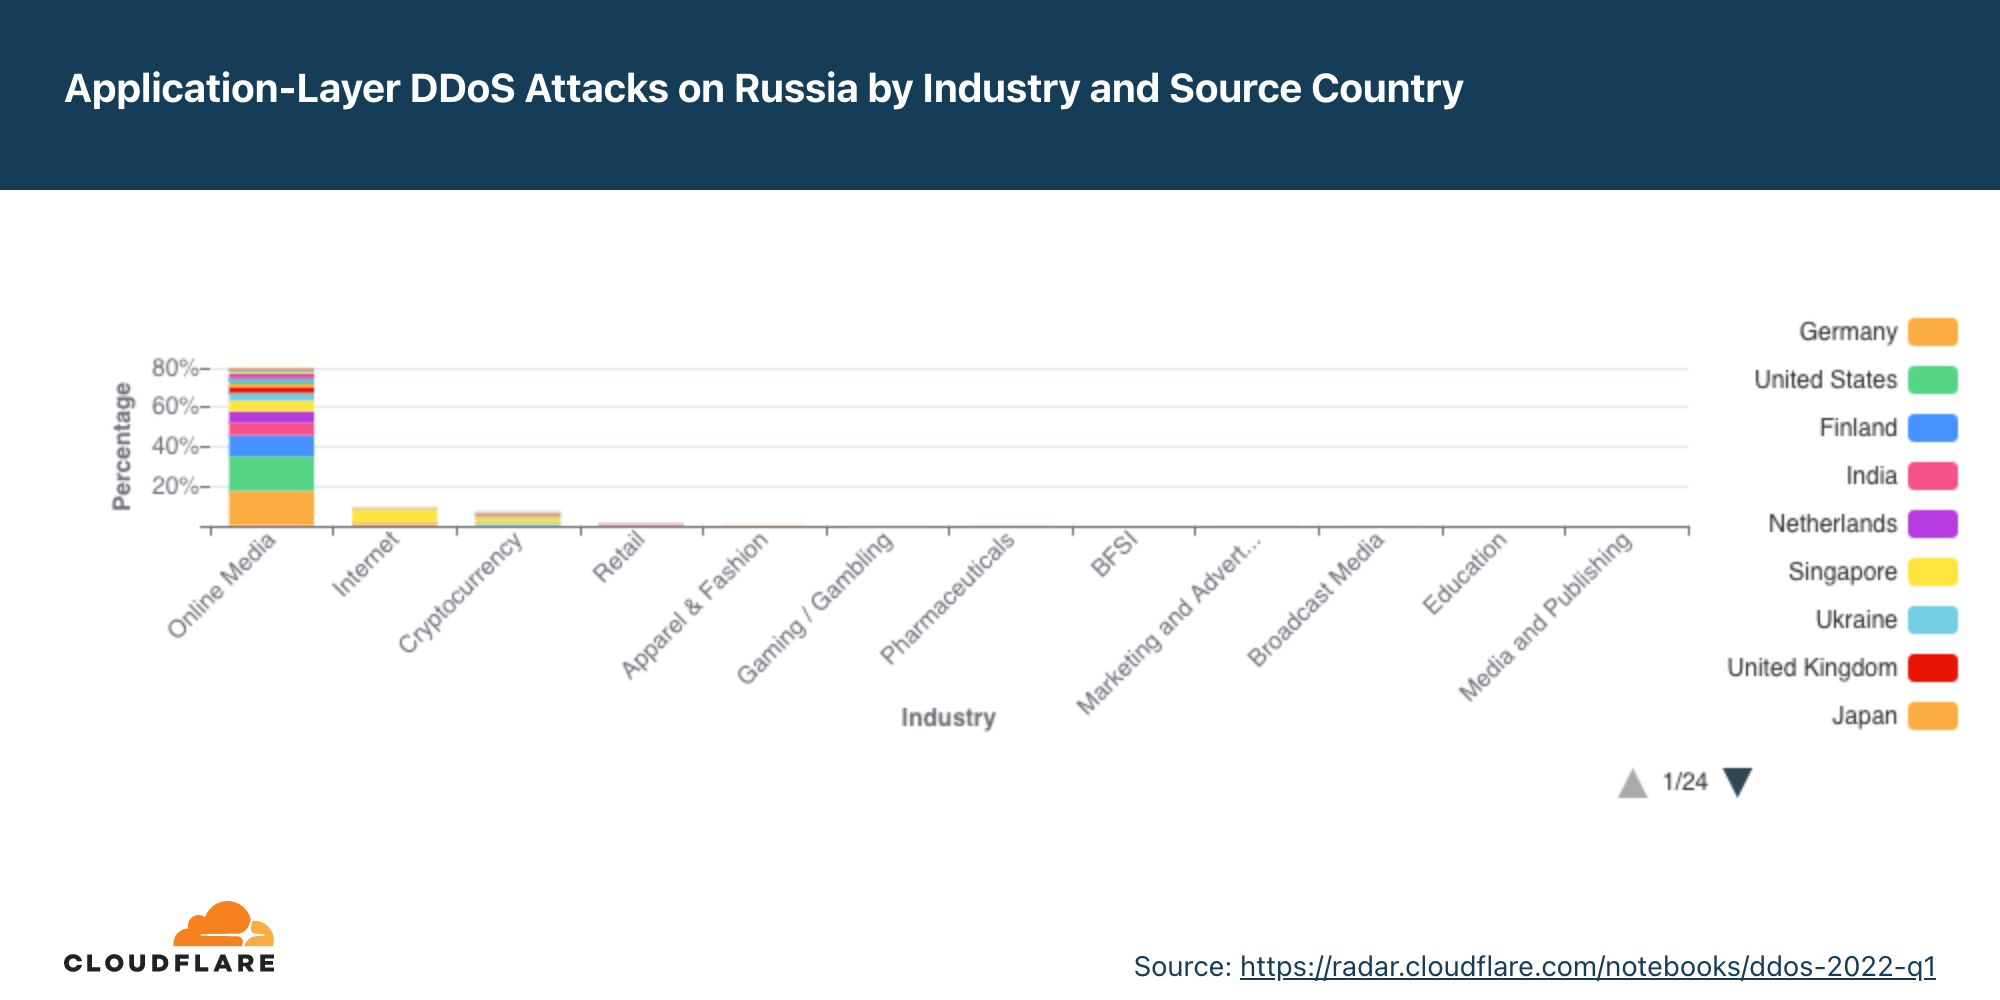
In Russia on the other hand, Online Media drops as the most attacked industry to the third place. Making their way to the top, Banking, Financial Services and Insurance (BFSI) companies in Russia were the most targeted in Q2; almost 45% of all application-layer DDoS attacks targeted the BFSI sector. Cryptocurrency companies in Russia were the second most attacked.
We’ve seen a new wave of Ransom DDoS attacks by entities claiming to be the Fancy Lazarus.
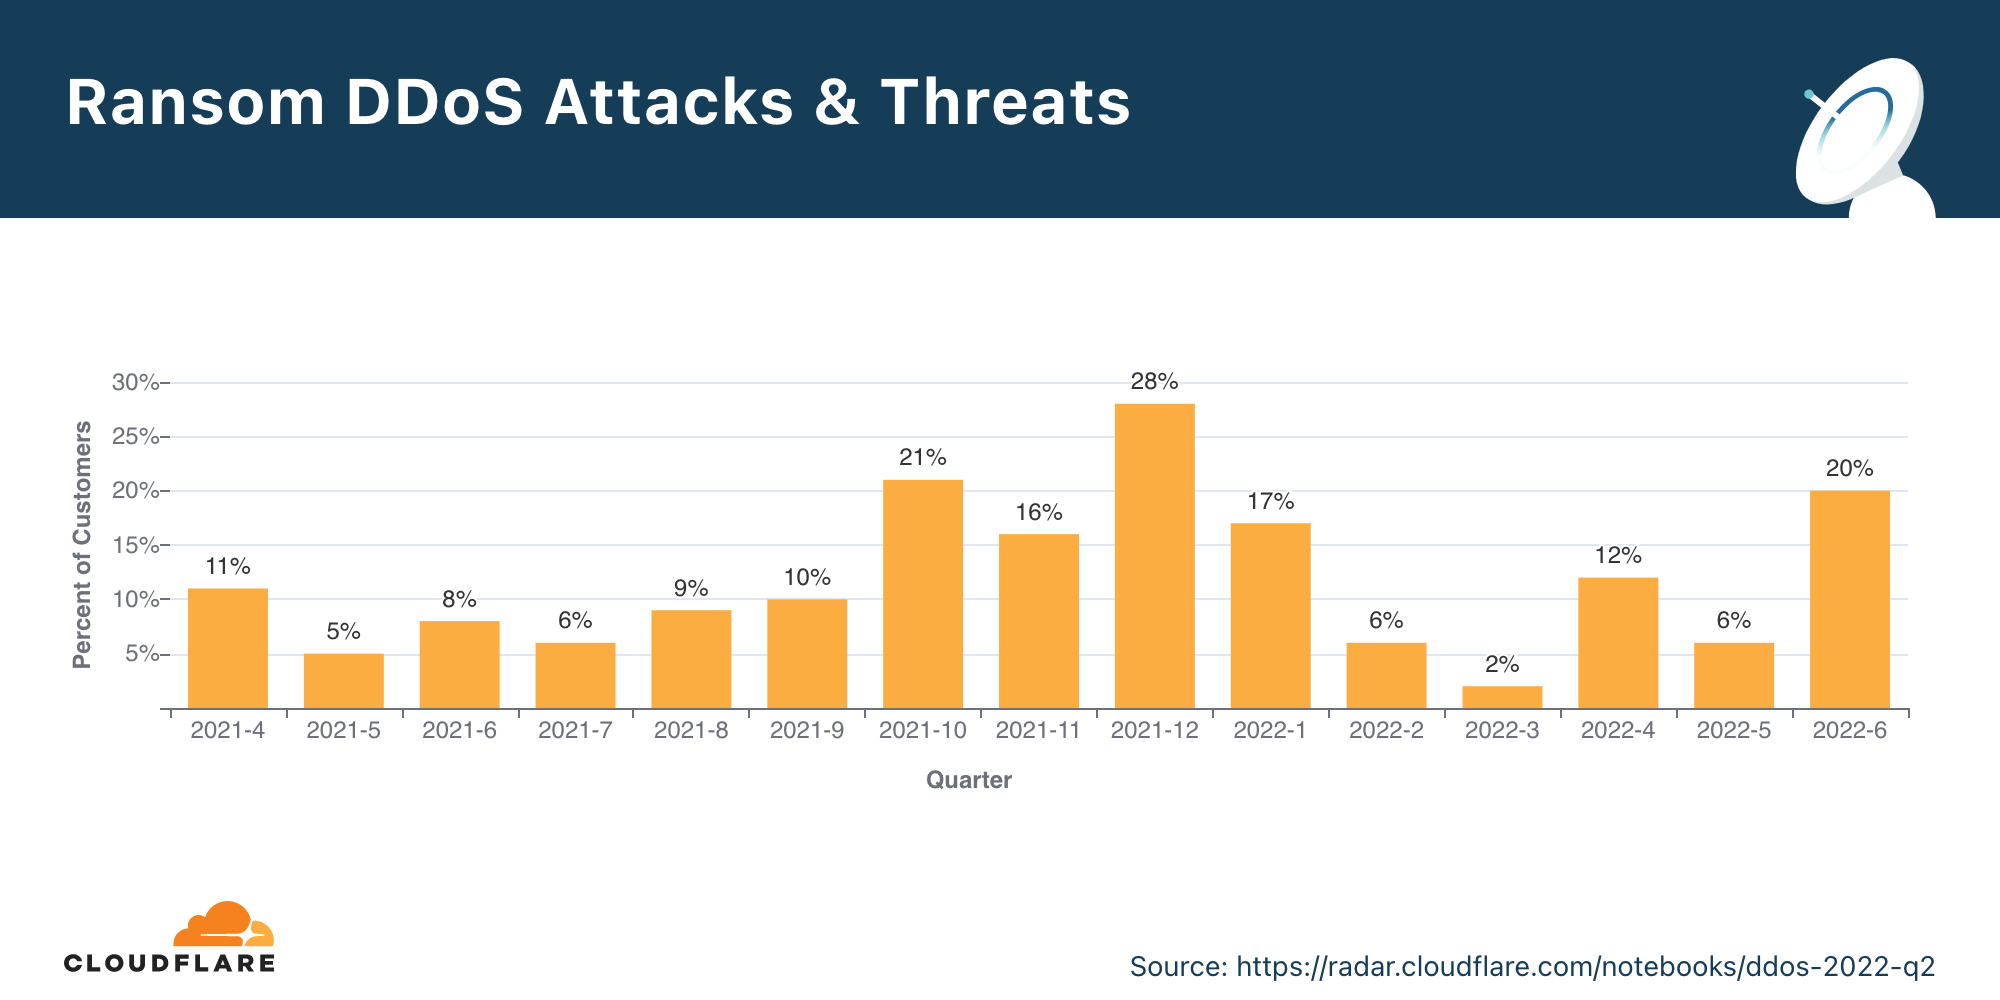
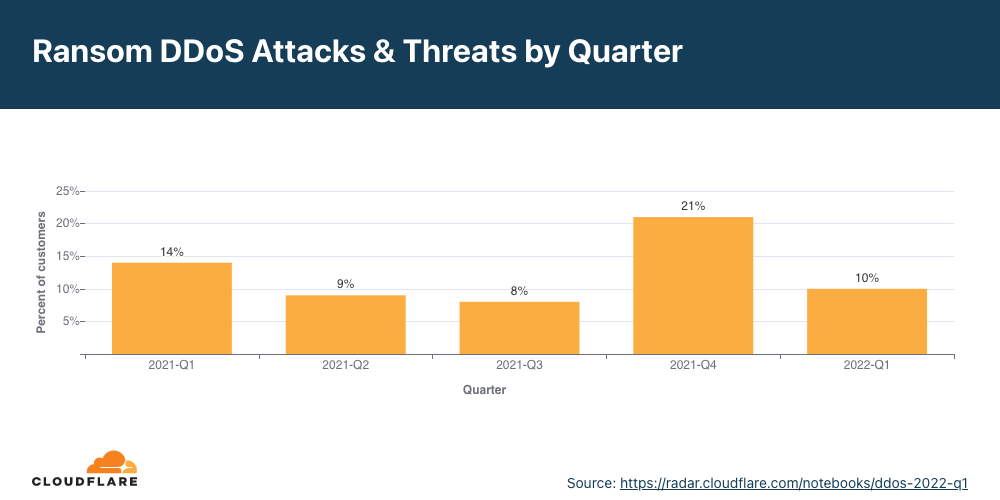
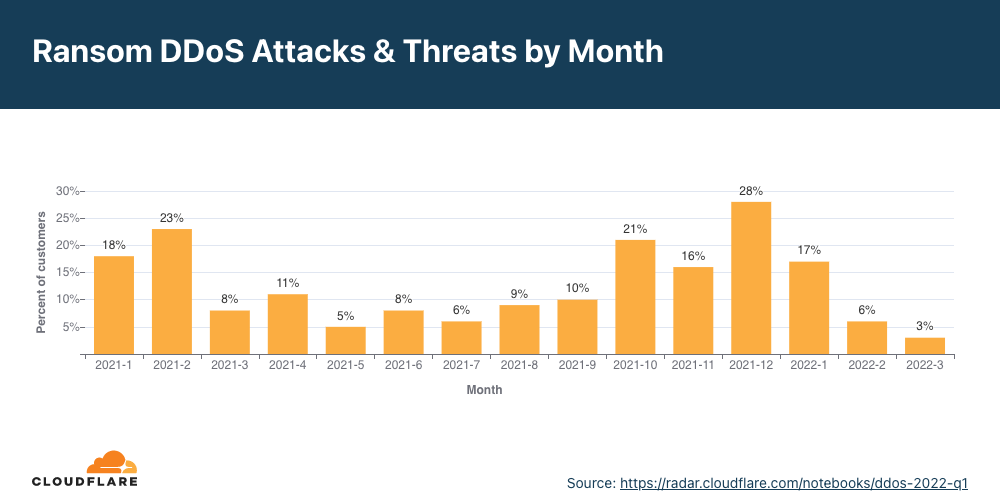
In June 2022, ransom attacks peaked to the highest of the year so far: one out of every five survey respondents who experienced a DDoS attack reported being subject to a Ransom DDoS attack or other threats.
Overall in Q2, the percent of Ransom DDoS attacks increased by 11% QoQ.
Application-layer DDoS attacks
In 2022 Q2, application-layer DDoS attacks increased by 72% YoY.
Organizations in the US were the most targeted, followed by Cyprus, Hong Kong, and China. Attacks on organizations in Cyprus increased by 166% QoQ.
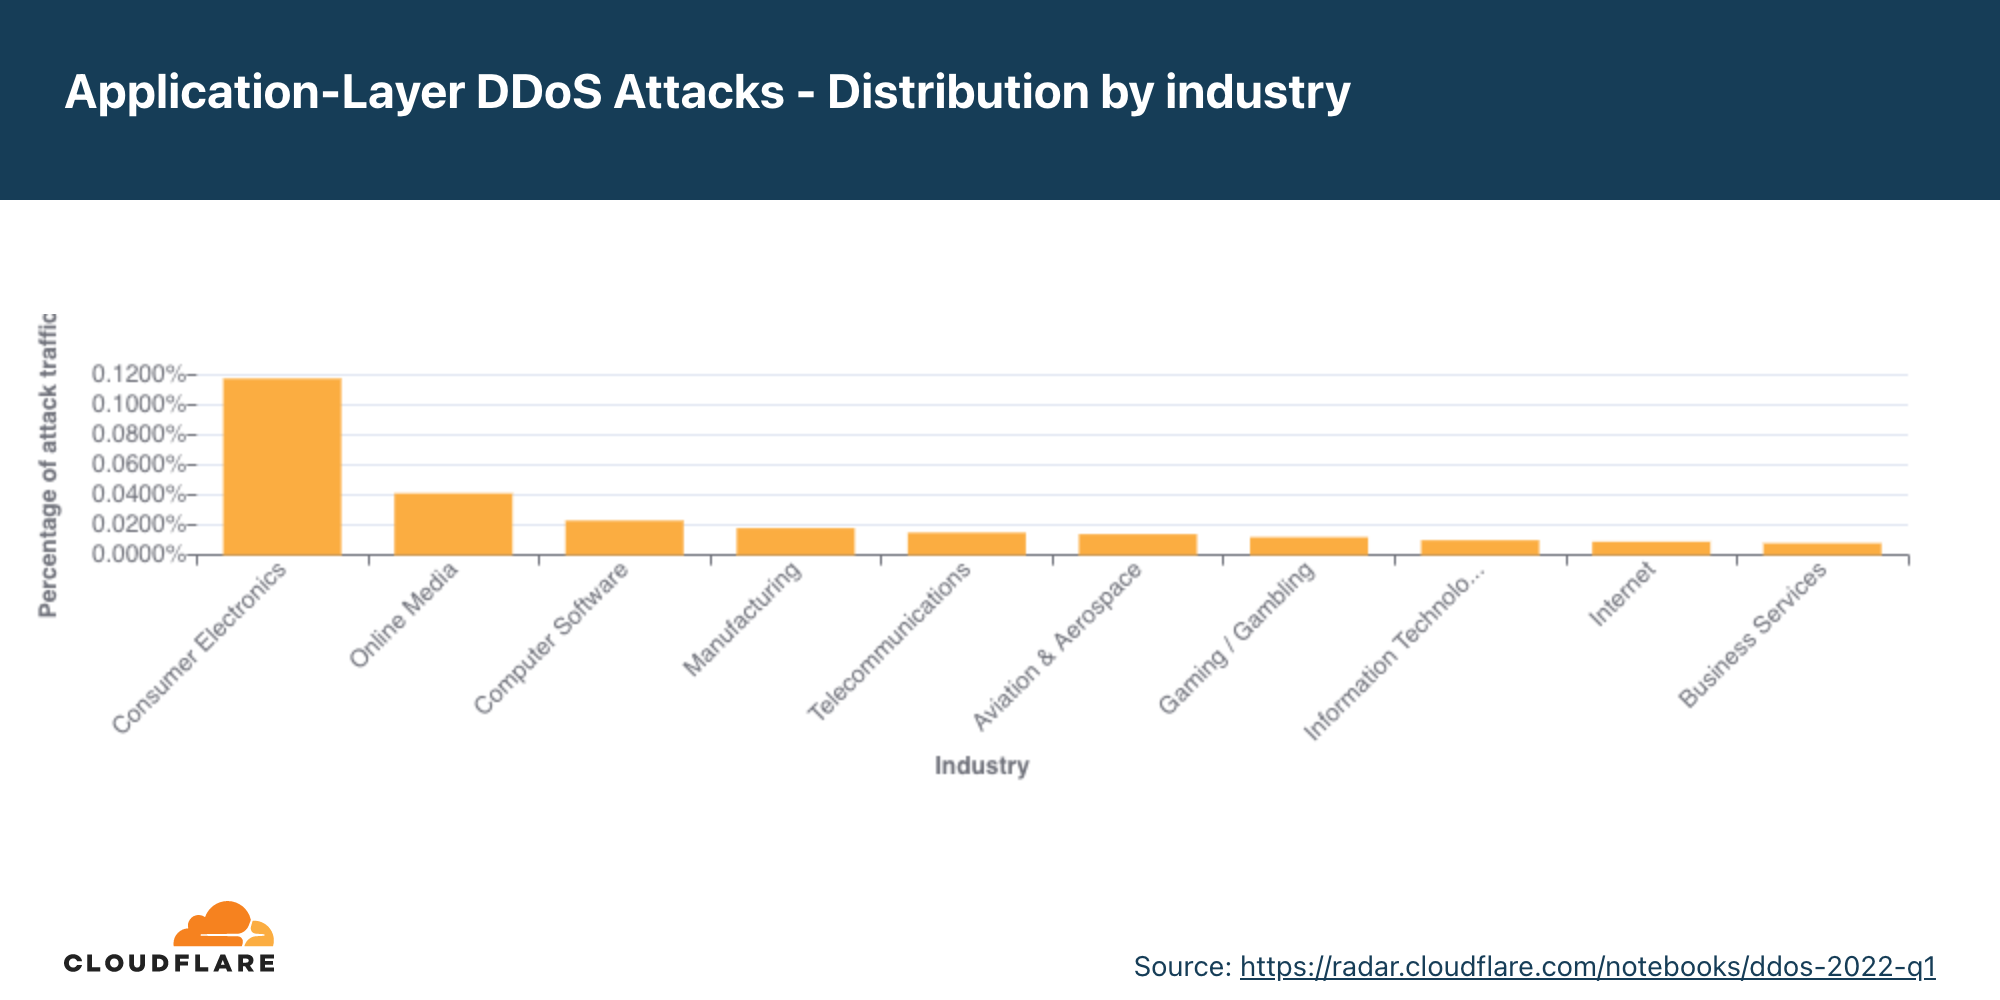
The Aviation & Aerospace industry was the most targeted in Q2, followed by the Internet industry, Banking, Financial Services and Insurance, and Gaming / Gambling in fourth place.
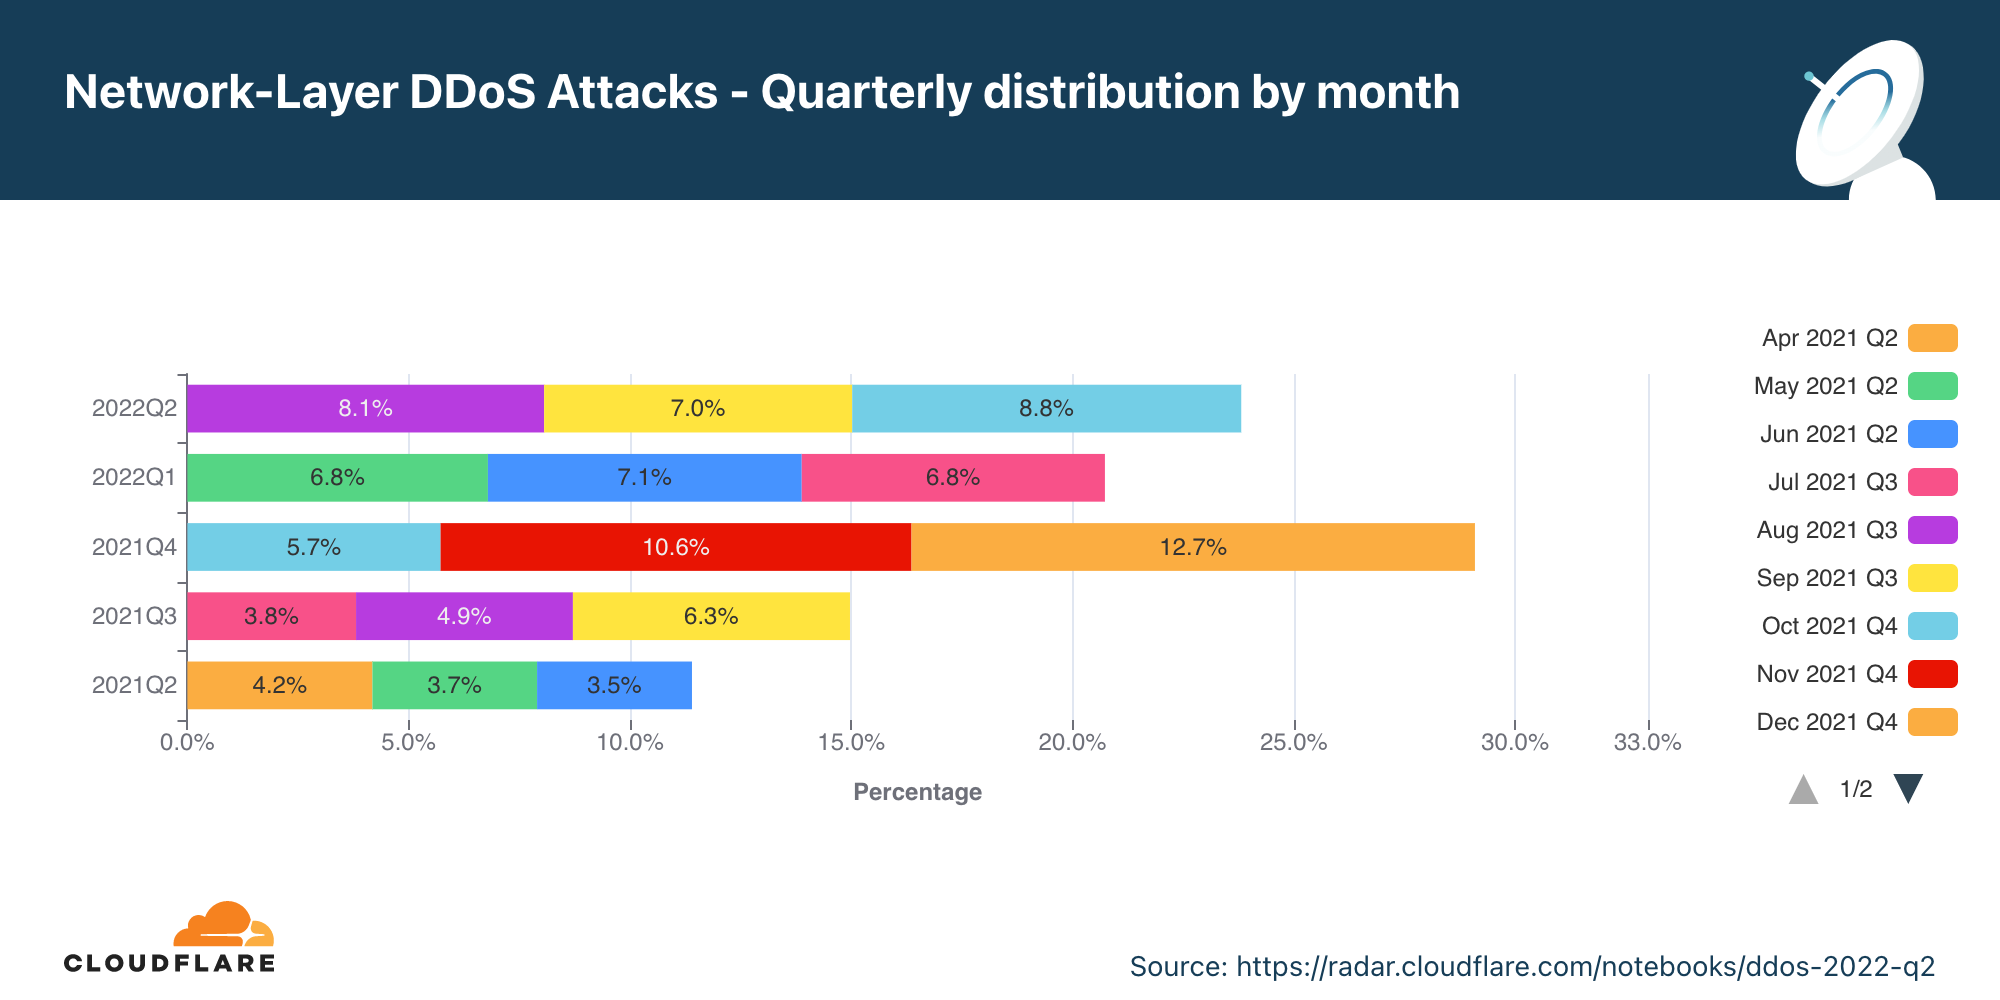
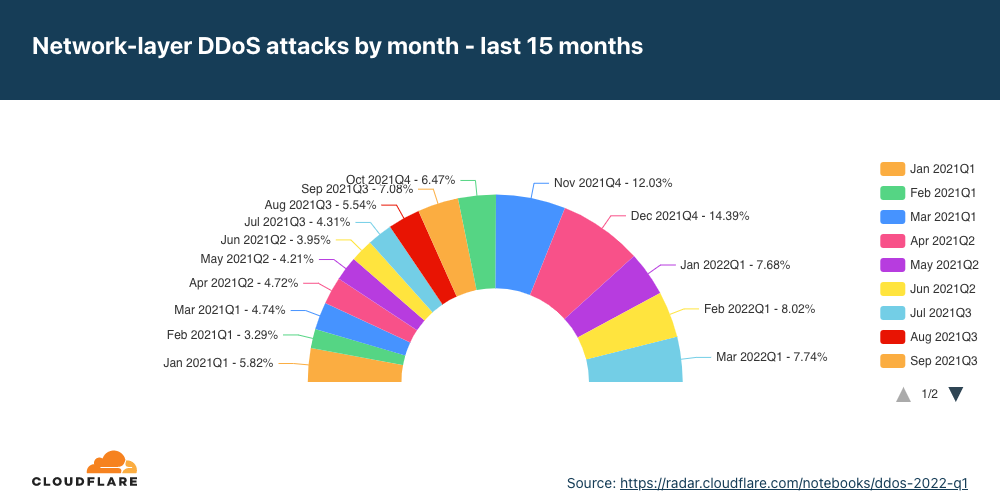
Network-layer DDoS attacks
In 2022 Q2, network-layer DDoS attacks increased by 109% YoY. Attacks of 100 Gbps and larger increased by 8% QoQ, and attacks lasting more than 3 hours increased by 12% QoQ.
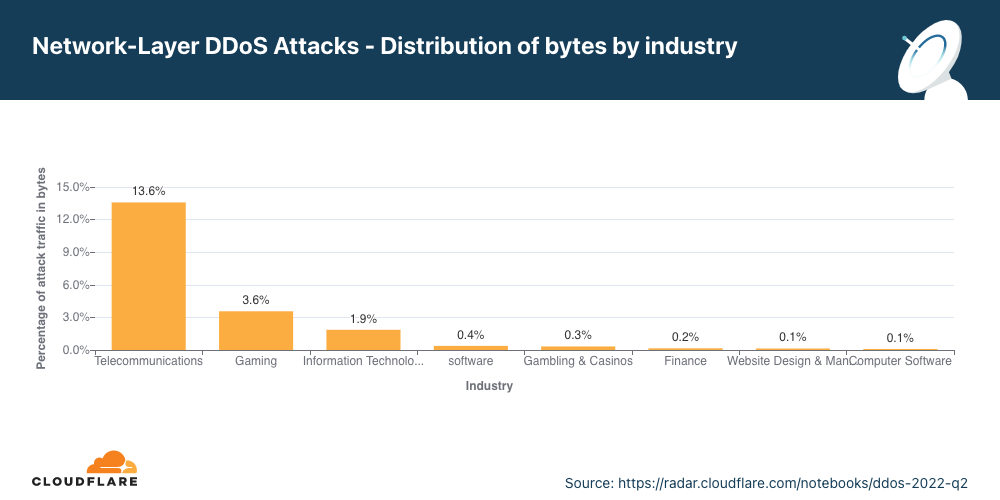
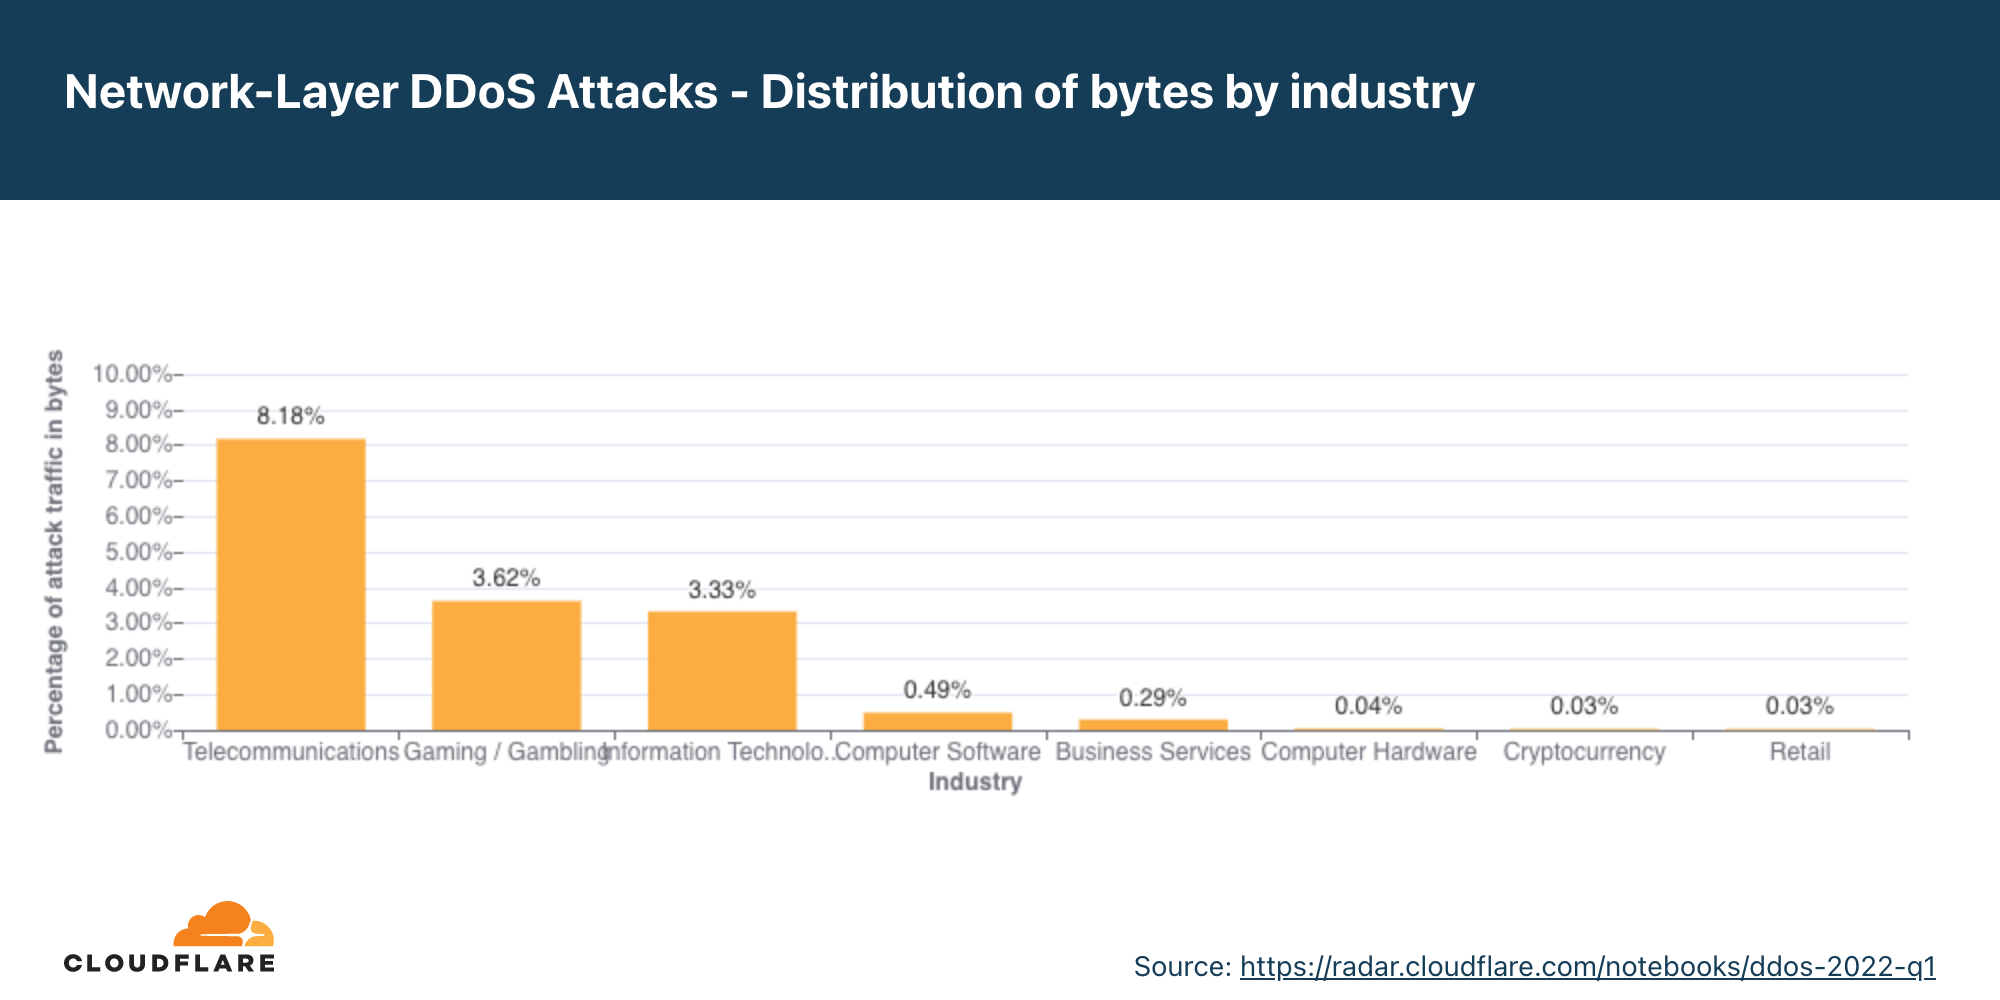
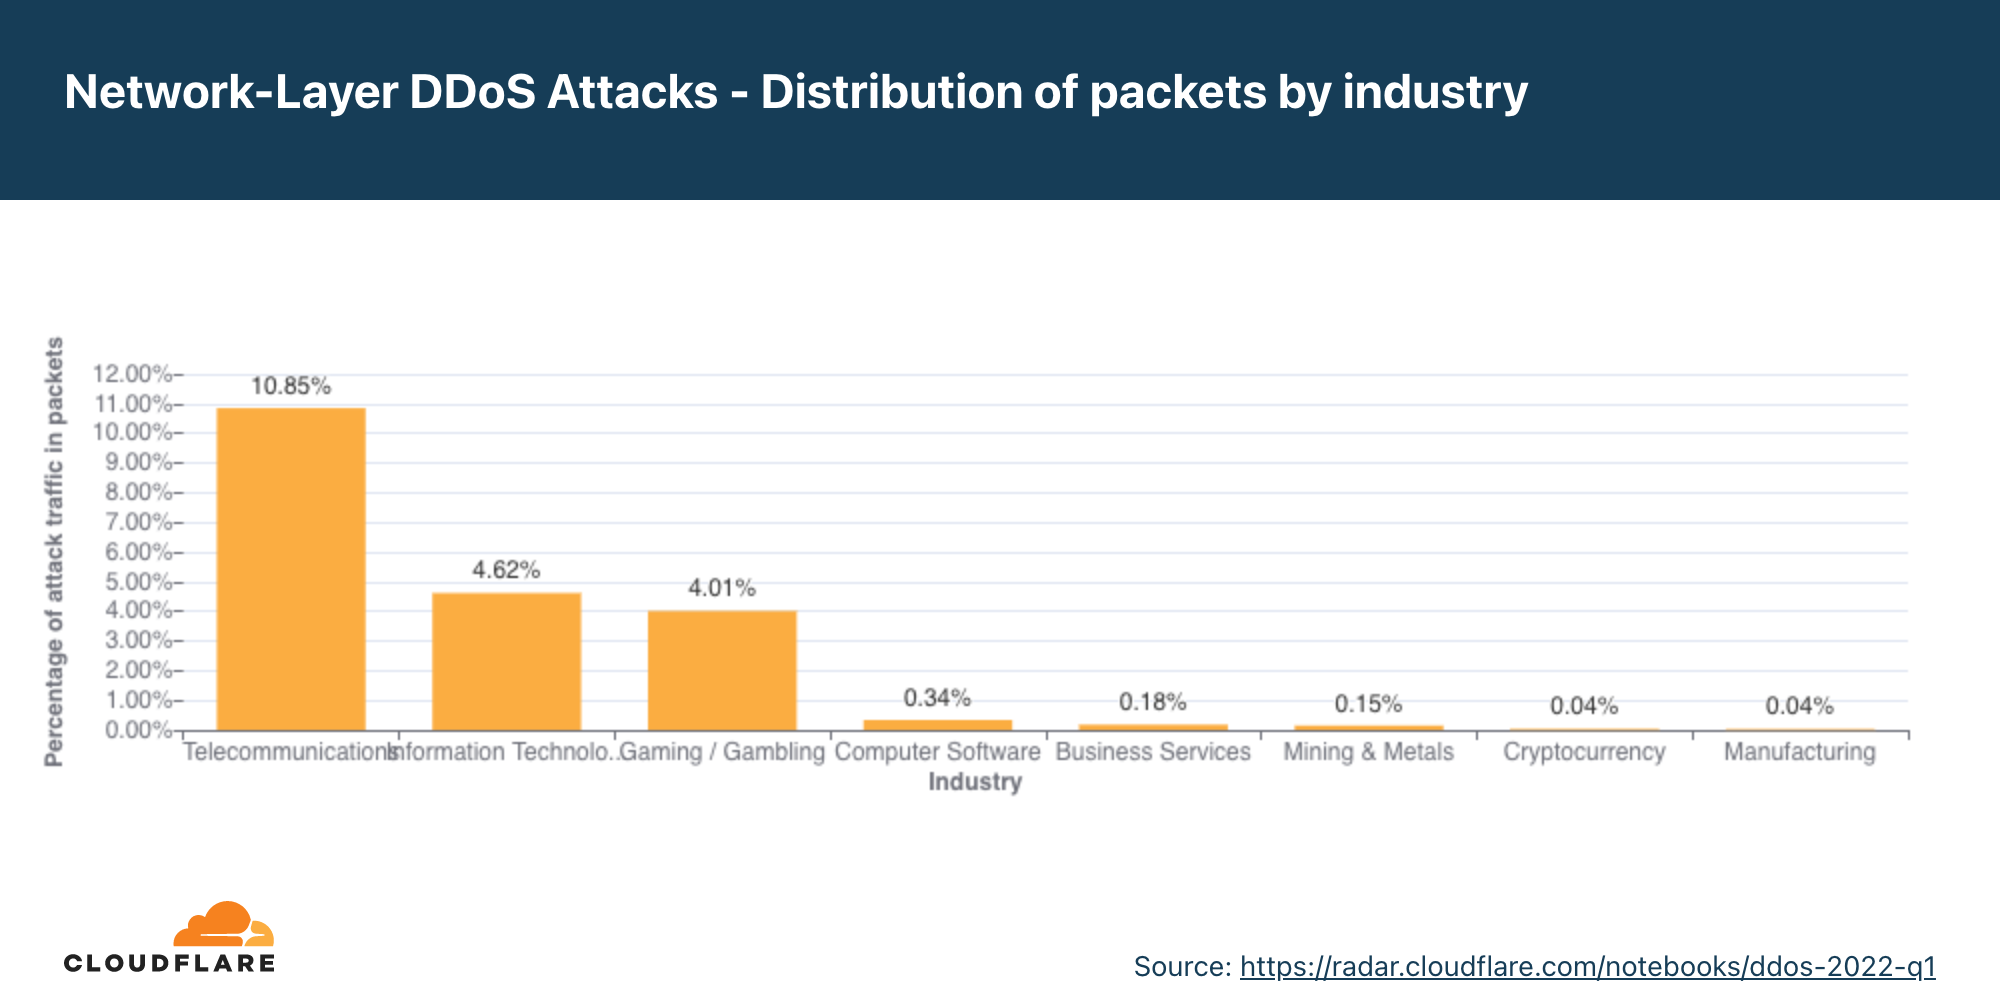
The top attacked industries were Telecommunications, Gaming / Gambling and the Information Technology and Services industry.
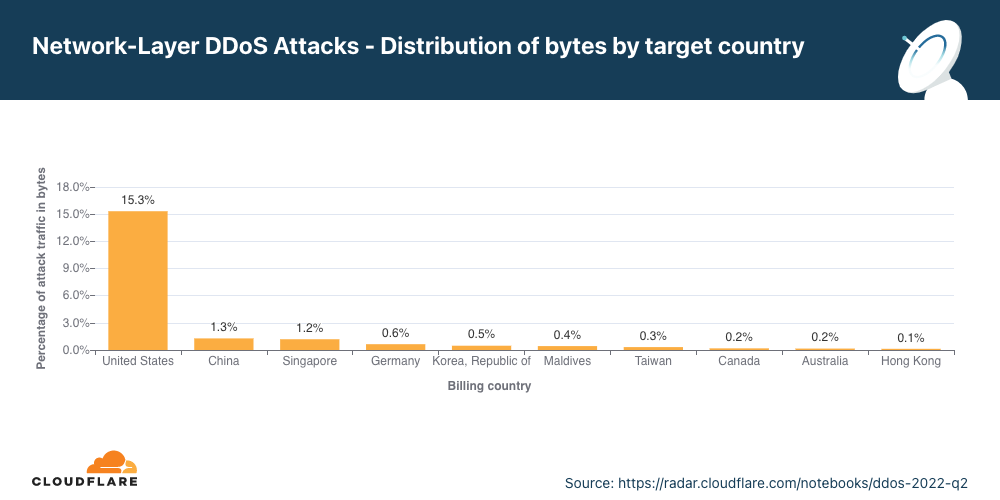
Organizations in the US were the most targeted, followed by China, Singapore, and Germany.
This report is based on DDoS attacks that were automatically detected and mitigated by Cloudflare’s DDoS Protection systems. To learn more about how it works, check out this deep-dive blog post.
A note on how we measure DDoS attacks observed over our network
To analyze attack trends, we calculate the “DDoS activity” rate, which is either the percentage of attack traffic out of the total traffic (attack + clean) observed over our global network, or in a specific location, or in a specific category (e.g., industry or billing country). Measuring the percentages allows us to normalize data points and avoid biases reflected in absolute numbers towards, for example, a Cloudflare data center that receives more total traffic and likely, also more attacks.
Ransom Attacks
Our systems constantly analyze traffic and automatically apply mitigation when DDoS attacks are detected. Each DDoS’d customer is prompted with an automated survey to help us better understand the nature of the attack and the success of the mitigation.
For over two years now, Cloudflare has been surveying attacked customers — one question on the survey being if they received a threat or a ransom note demanding payment in exchange to stop the DDoS attack.
The number of respondents reporting threats or ransom notes in Q2 increased by 11% QoQ and YoY. During this quarter, we’ve been mitigating Ransom DDoS attacks that have been launched by entities claiming to be the Advanced Persistent Threat (APT) group “Fancy Lazarus”. The campaign has been focusing on financial institutions and cryptocurrency companies.
The percentage of respondents reported being targeted by a ransom DDoS attack or that have received threats in advance of the attack.
Drilling down into Q2, we can see that in June one out of every five respondents reported receiving a ransom DDoS attack or threat — the highest month in 2022, and the highest since December 2021.
Application-layer DDoS attacks
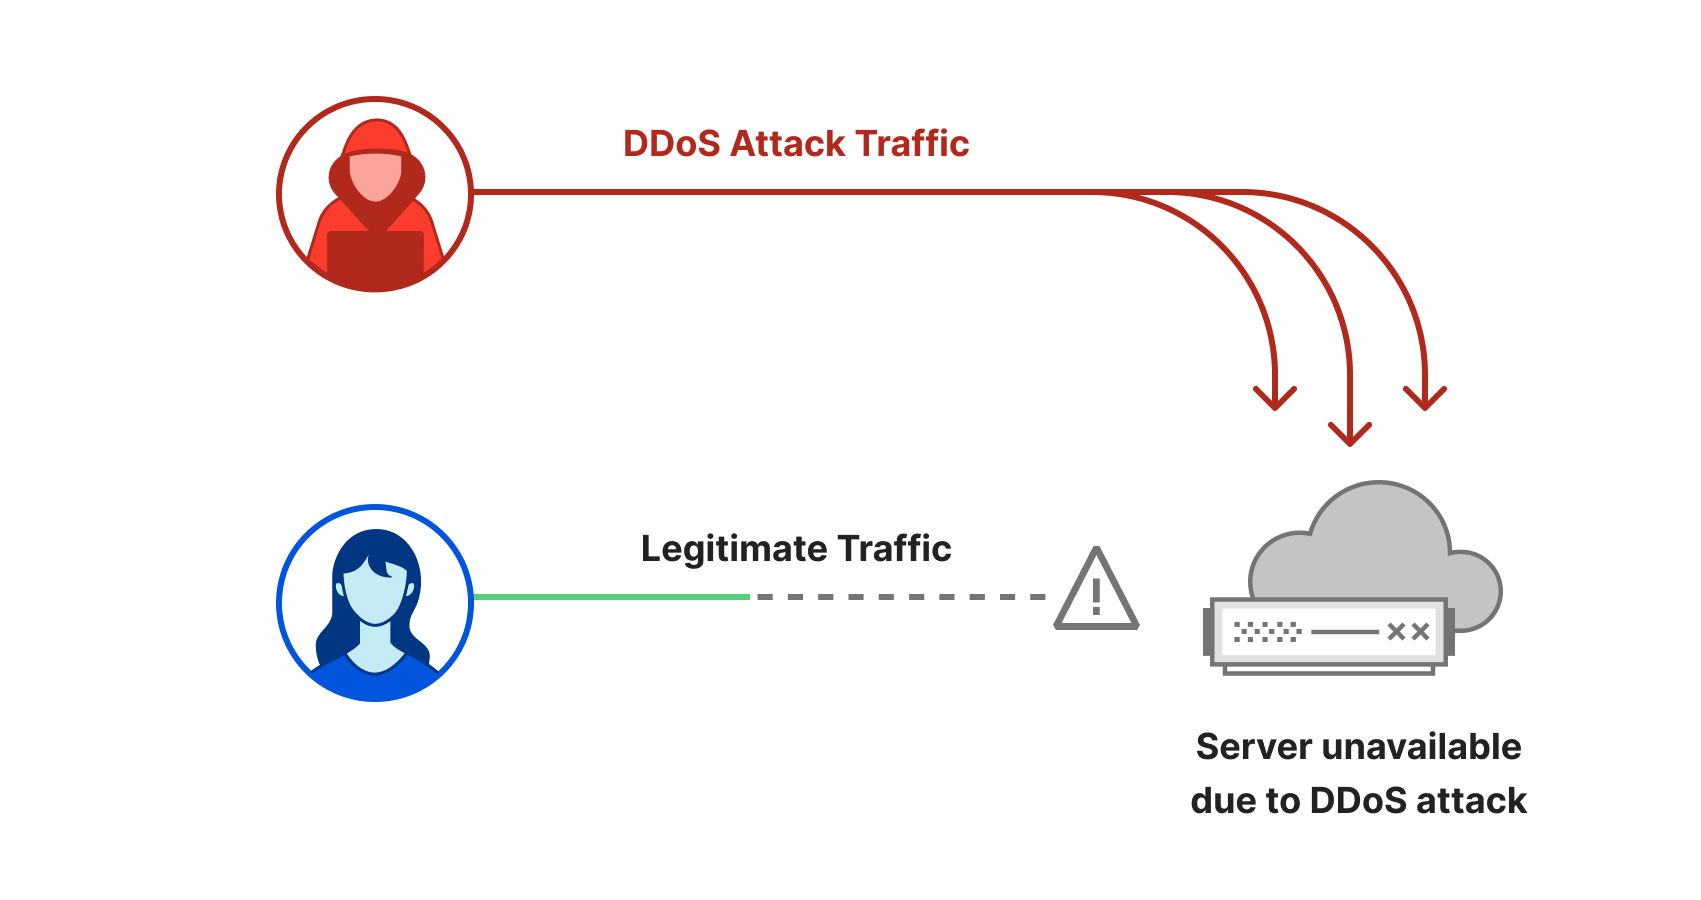
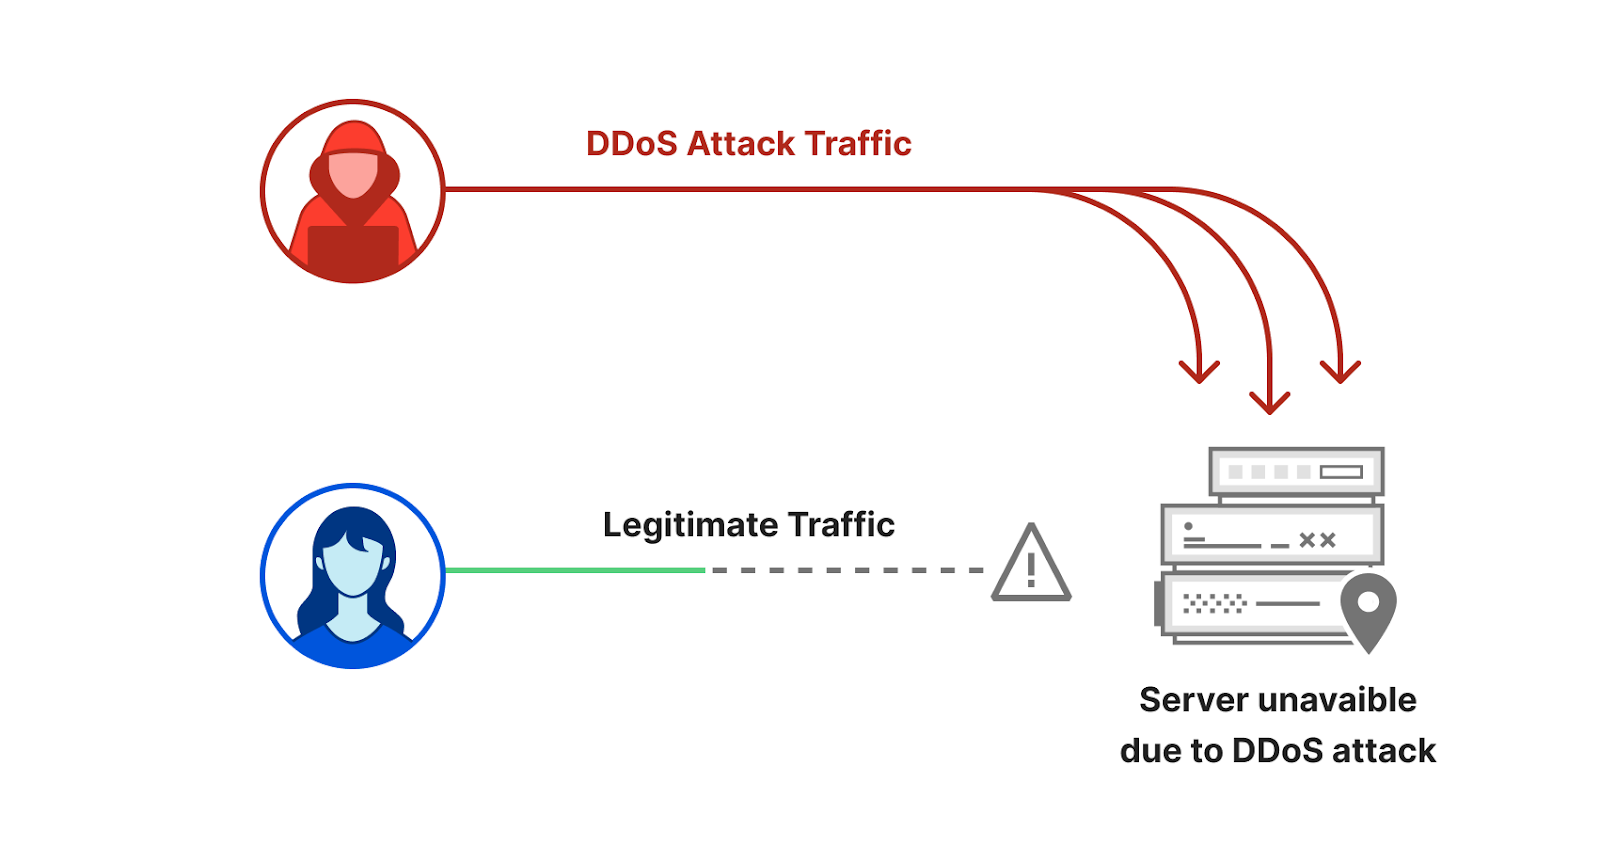
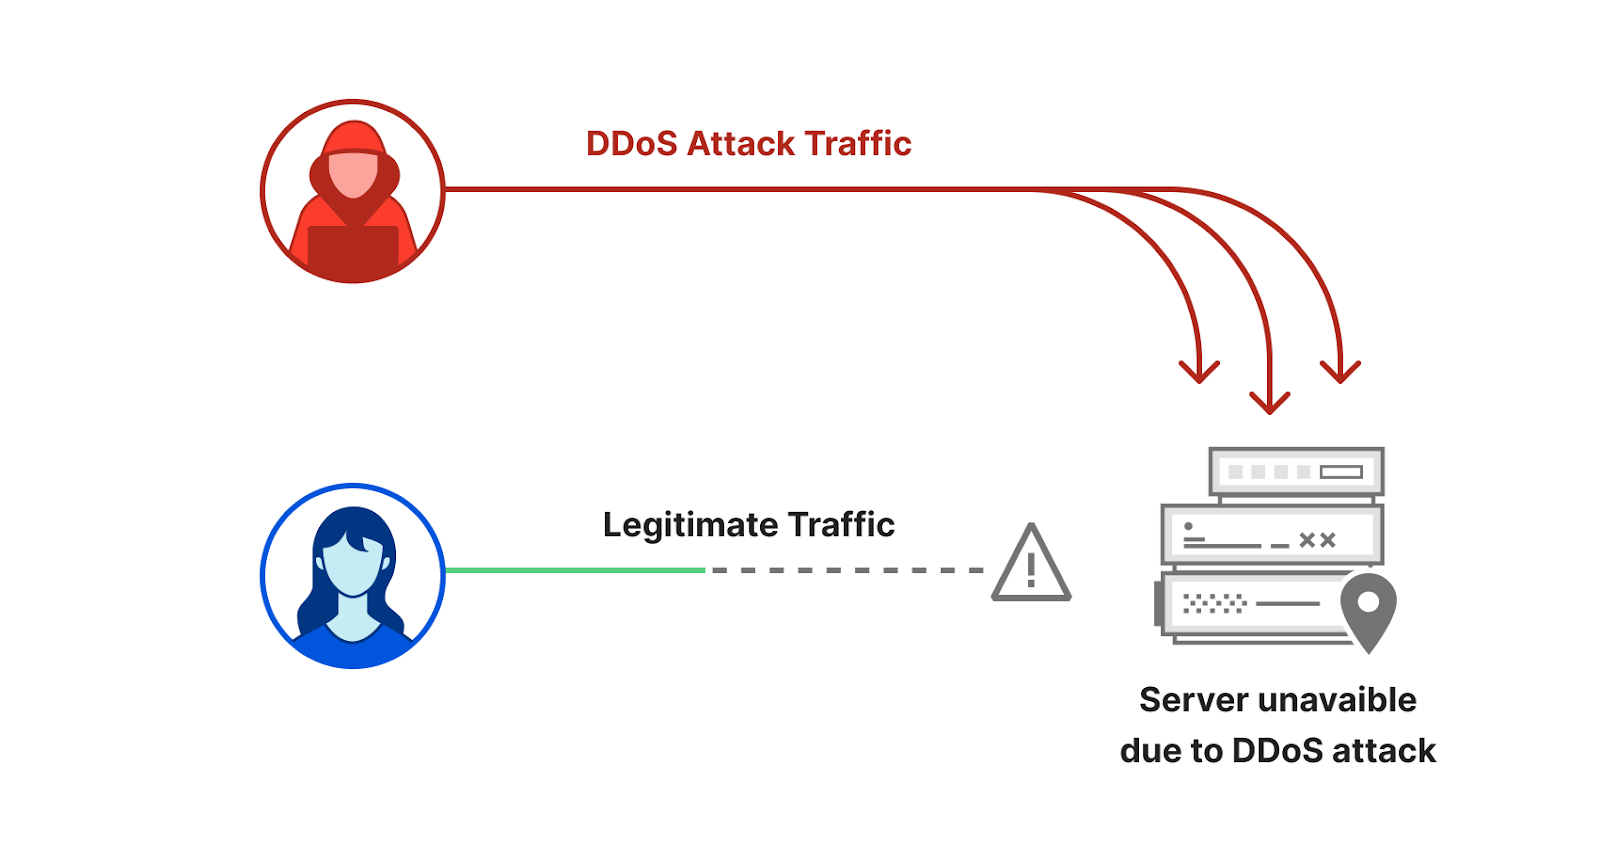
Application-layer DDoS attacks, specifically HTTP DDoS attacks, are attacks that usually aim to disrupt a web server by making it unable to process legitimate user requests. If a server is bombarded with more requests than it can process, the server will drop legitimate requests and — in some cases — crash, resulting in degraded performance or an outage for legitimate users.
Application-layer DDoS attacks by month
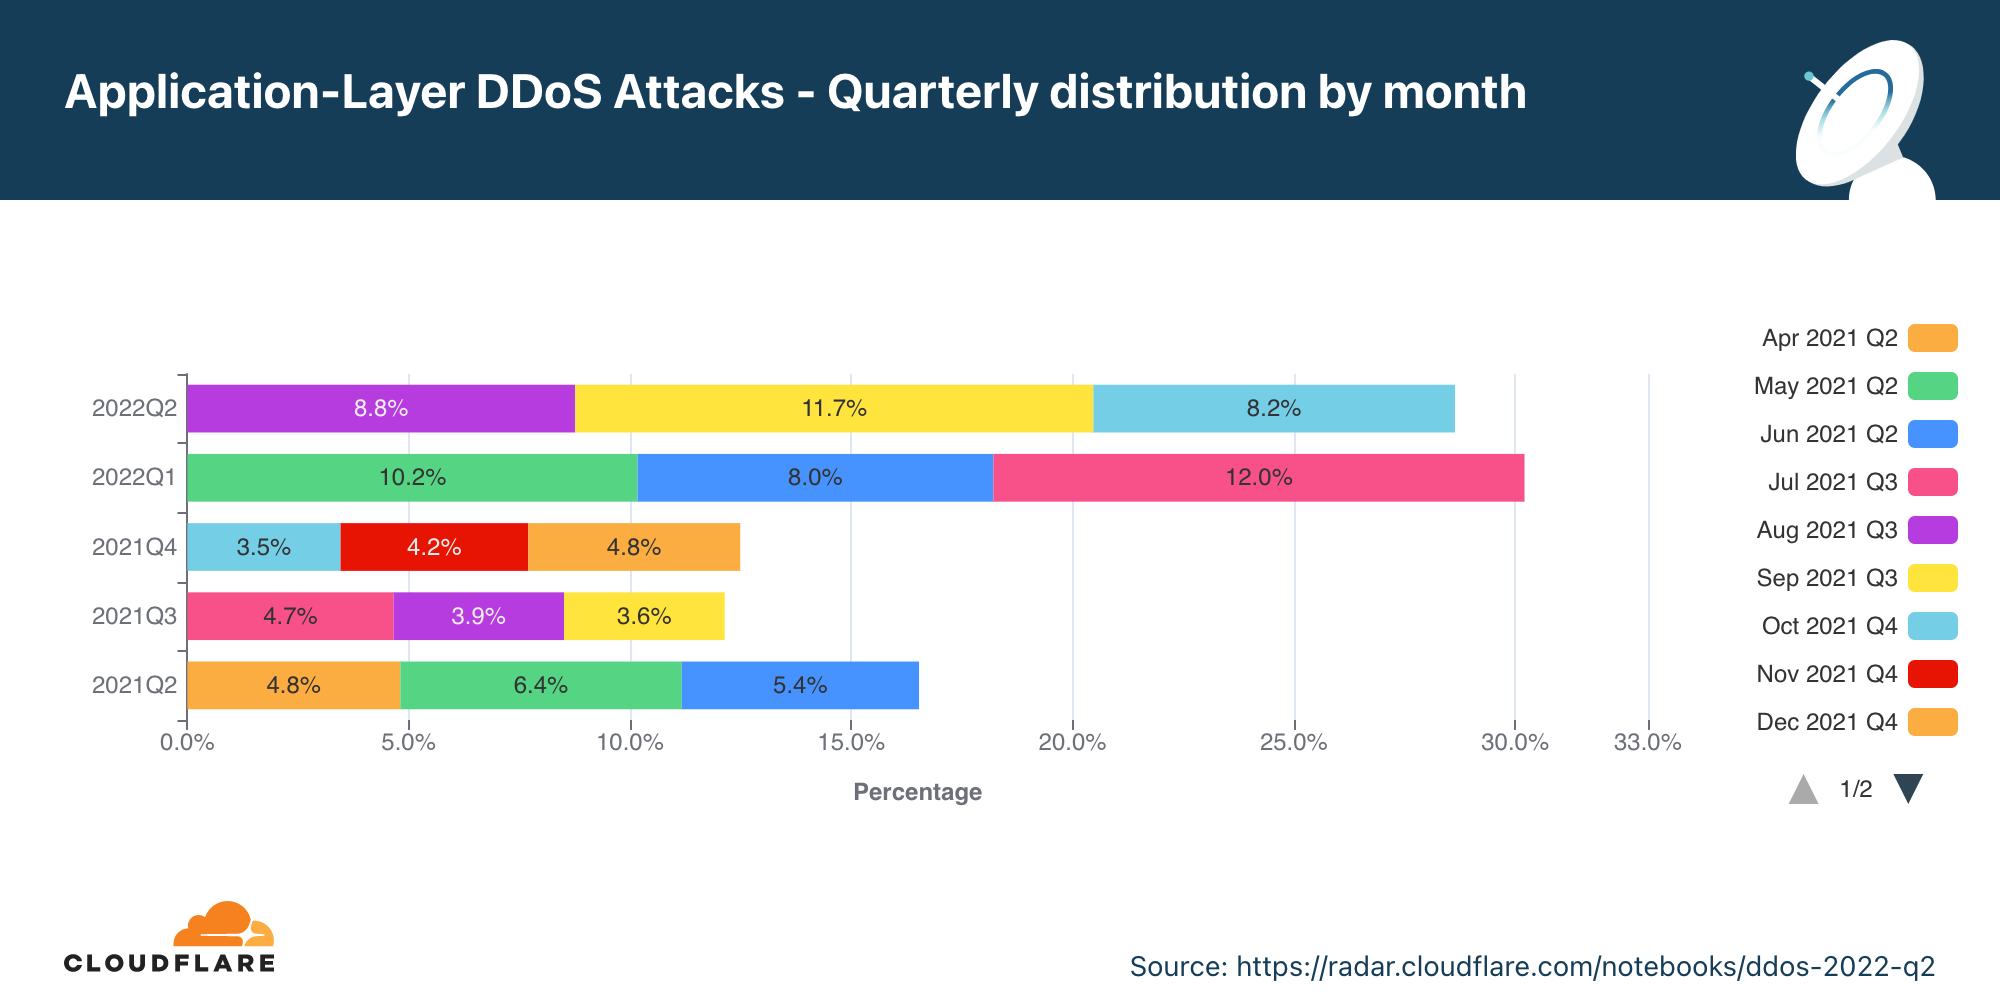
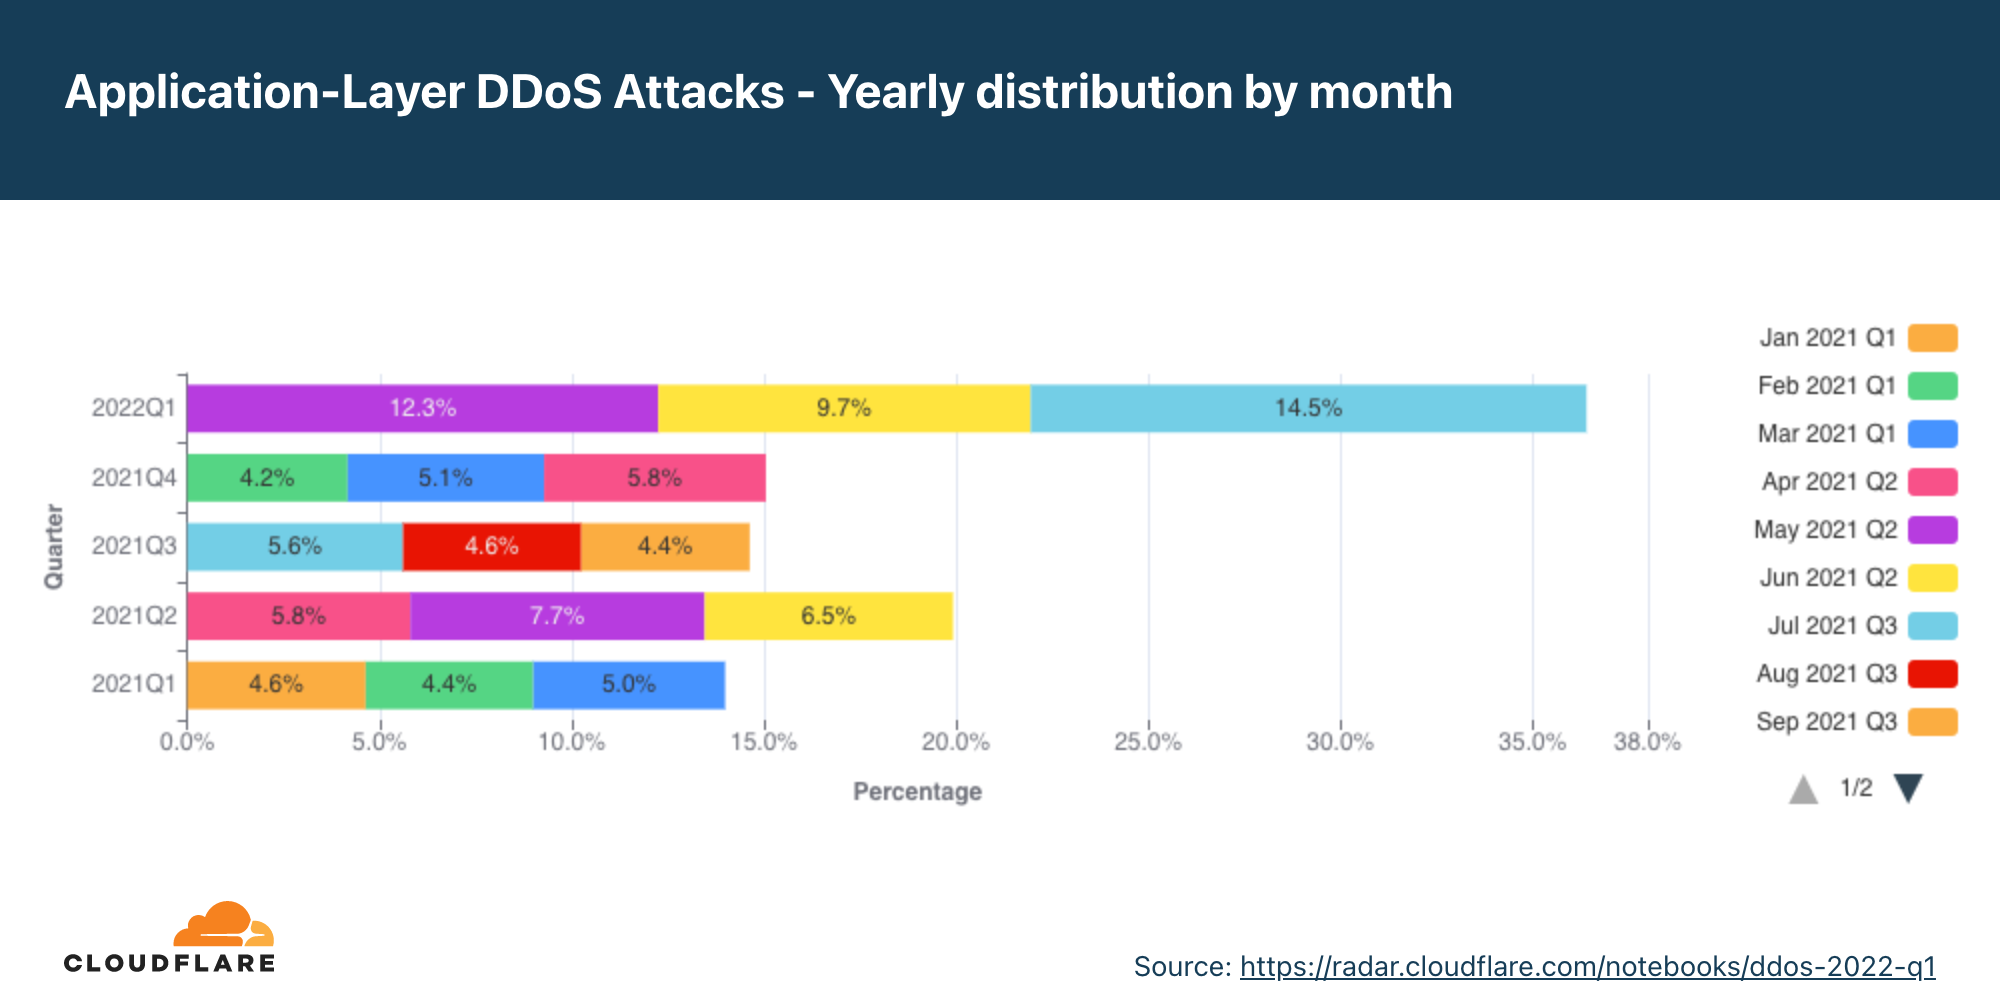
In Q2, application-layer DDoS attacks increased by 72% YoY.
Overall, in Q2, the volume of application-layer DDoS attacks increased by 72% YoY, but decreased 5% QoQ. May was the busiest month in the quarter. Almost 41% of all application-layer DDoS attacks took place in May, whereas the least number of attacks took place in June (28%).
Application-layer DDoS attacks by industry
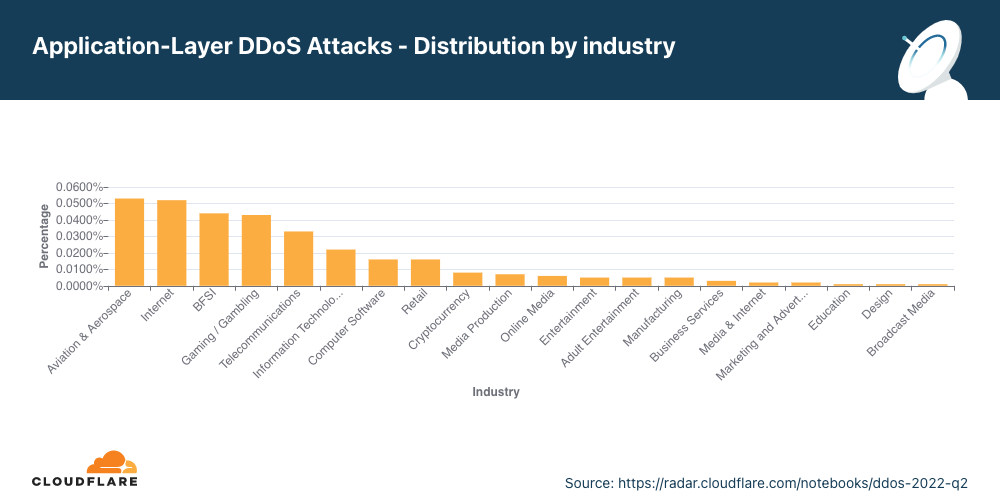
Attacks on the Aviation and Aerospace industry increased by 493% QoQ.
In Q2, Aviation and Aerospace was the most targeted industry by application-layer DDoS attacks. After it, was the Internet industry, Banking, Financial Institutions and Insurance (BFSI) industry, and in fourth place the Gaming / Gambling industry.
Ukraine and Russia cyberspace
Media and publishing companies are the most targeted in Ukraine.
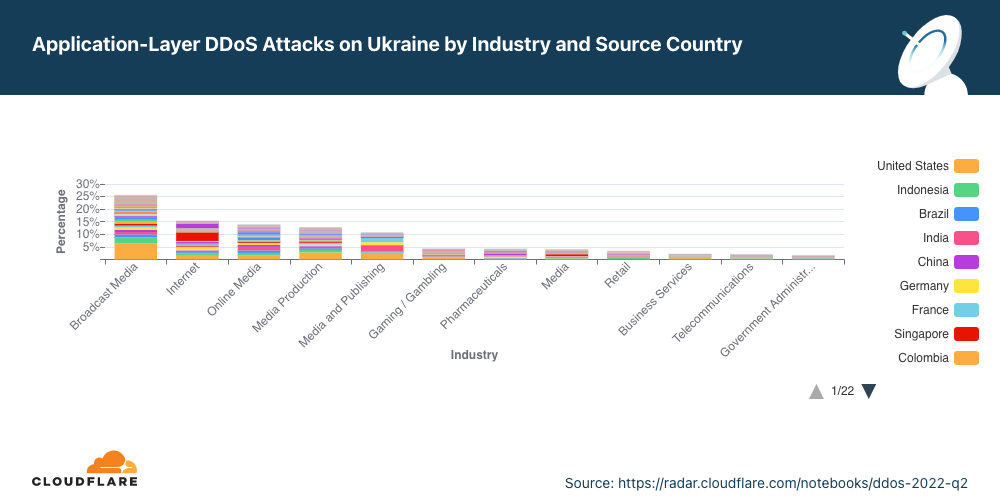
As the war in Ukraine continues on the ground, in the air and on the water, so does it continue in cyberspace. Entities targeting Ukrainian companies appear to be trying to silence information. The top five most attacked industries in the Ukraine are all in broadcasting, Internet, online media, and publishing — that’s almost 80% of all DDoS Attacks targeting Ukraine.
On the other side of the war, the Russian Banks, Financial Institutions and Insurance (BFSI) companies came under the most attacks. Almost 45% of all DDoS attacks targeted the BFSI sector. The second most targeted was the Cryptocurrency industry, followed by Online media.
In both sides of the war, we can see that the attacks are highly distributed, indicating the use of globally distributed botnets.
Application-layer DDoS attacks by source country
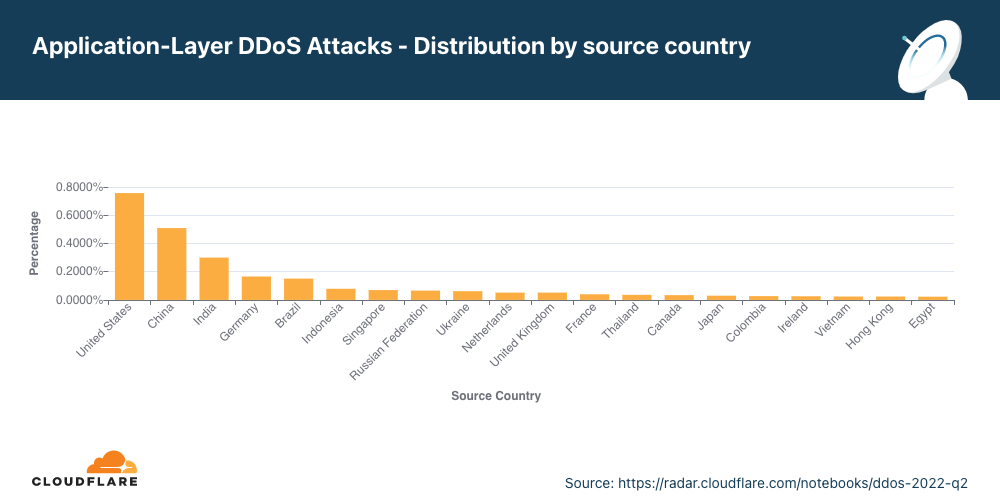
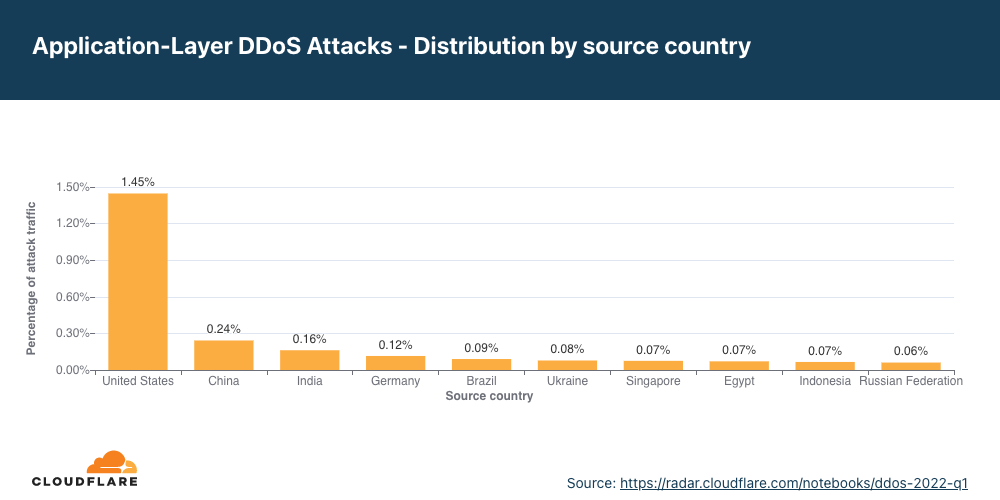
In Q2, attacks from China shrank by 78%, and attacks from the US shrank by 43%.
To understand the origin of the HTTP attacks, we look at the geolocation of the source IP address belonging to the client that generated the attack HTTP requests. Unlike network-layer attacks, source IP addresses cannot be spoofed in HTTP attacks. A high percentage of DDoS activity in a given country doesn’t mean that that specific country is launching the attacks but rather indicates the presence of botnets operating from within the country’s borders.
For the second quarter in a row, the United States tops the charts as the main source of HTTP DDoS attacks. Following the US is China in second place, and India and Germany in the third and fourth. Even though the US remained in the first place, attacks originating from the US shrank by 48% QoQ while attacks from other regions grew; attacks from India grew by 87%, from Germany by 33%, and attacks from Brazil grew by 67%.
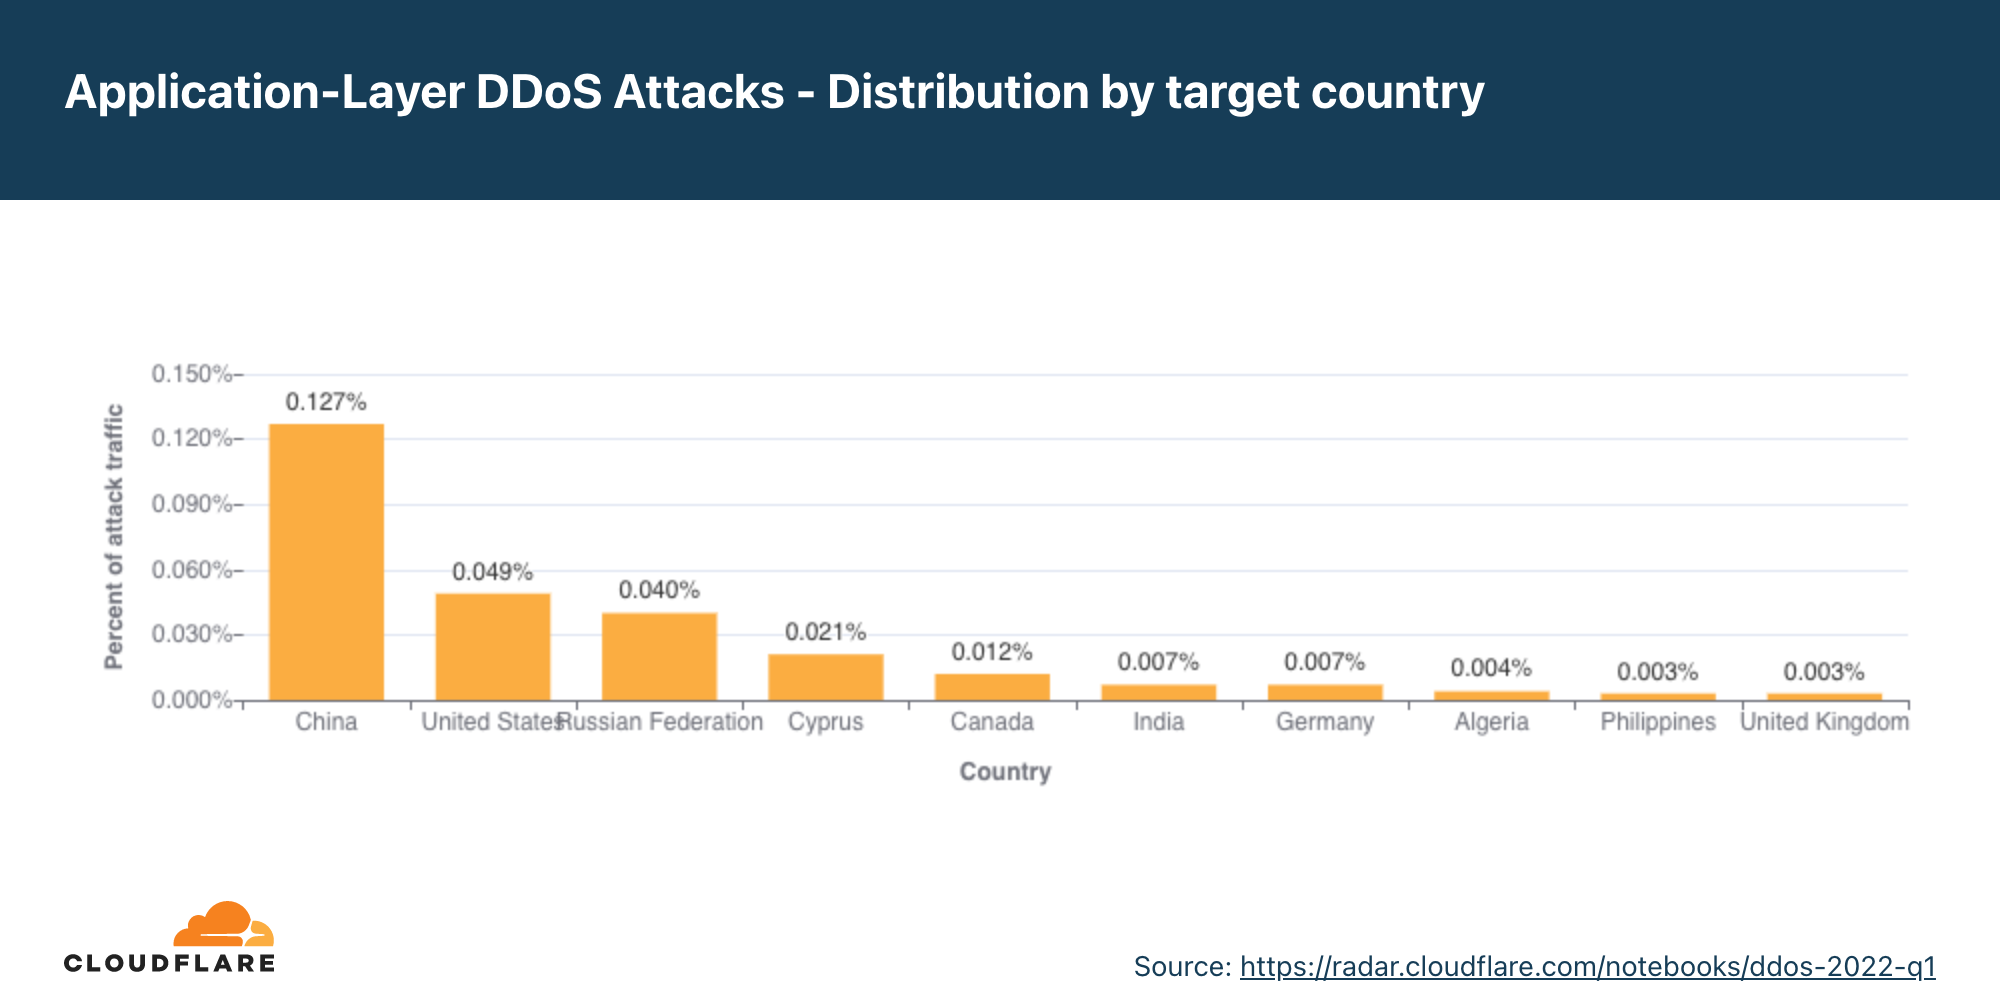
Application-layer DDoS attacks by target country
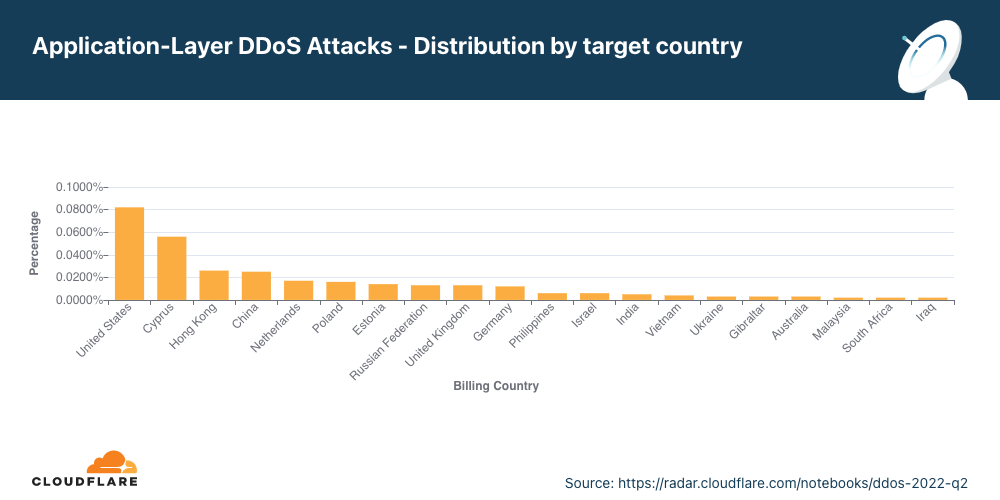
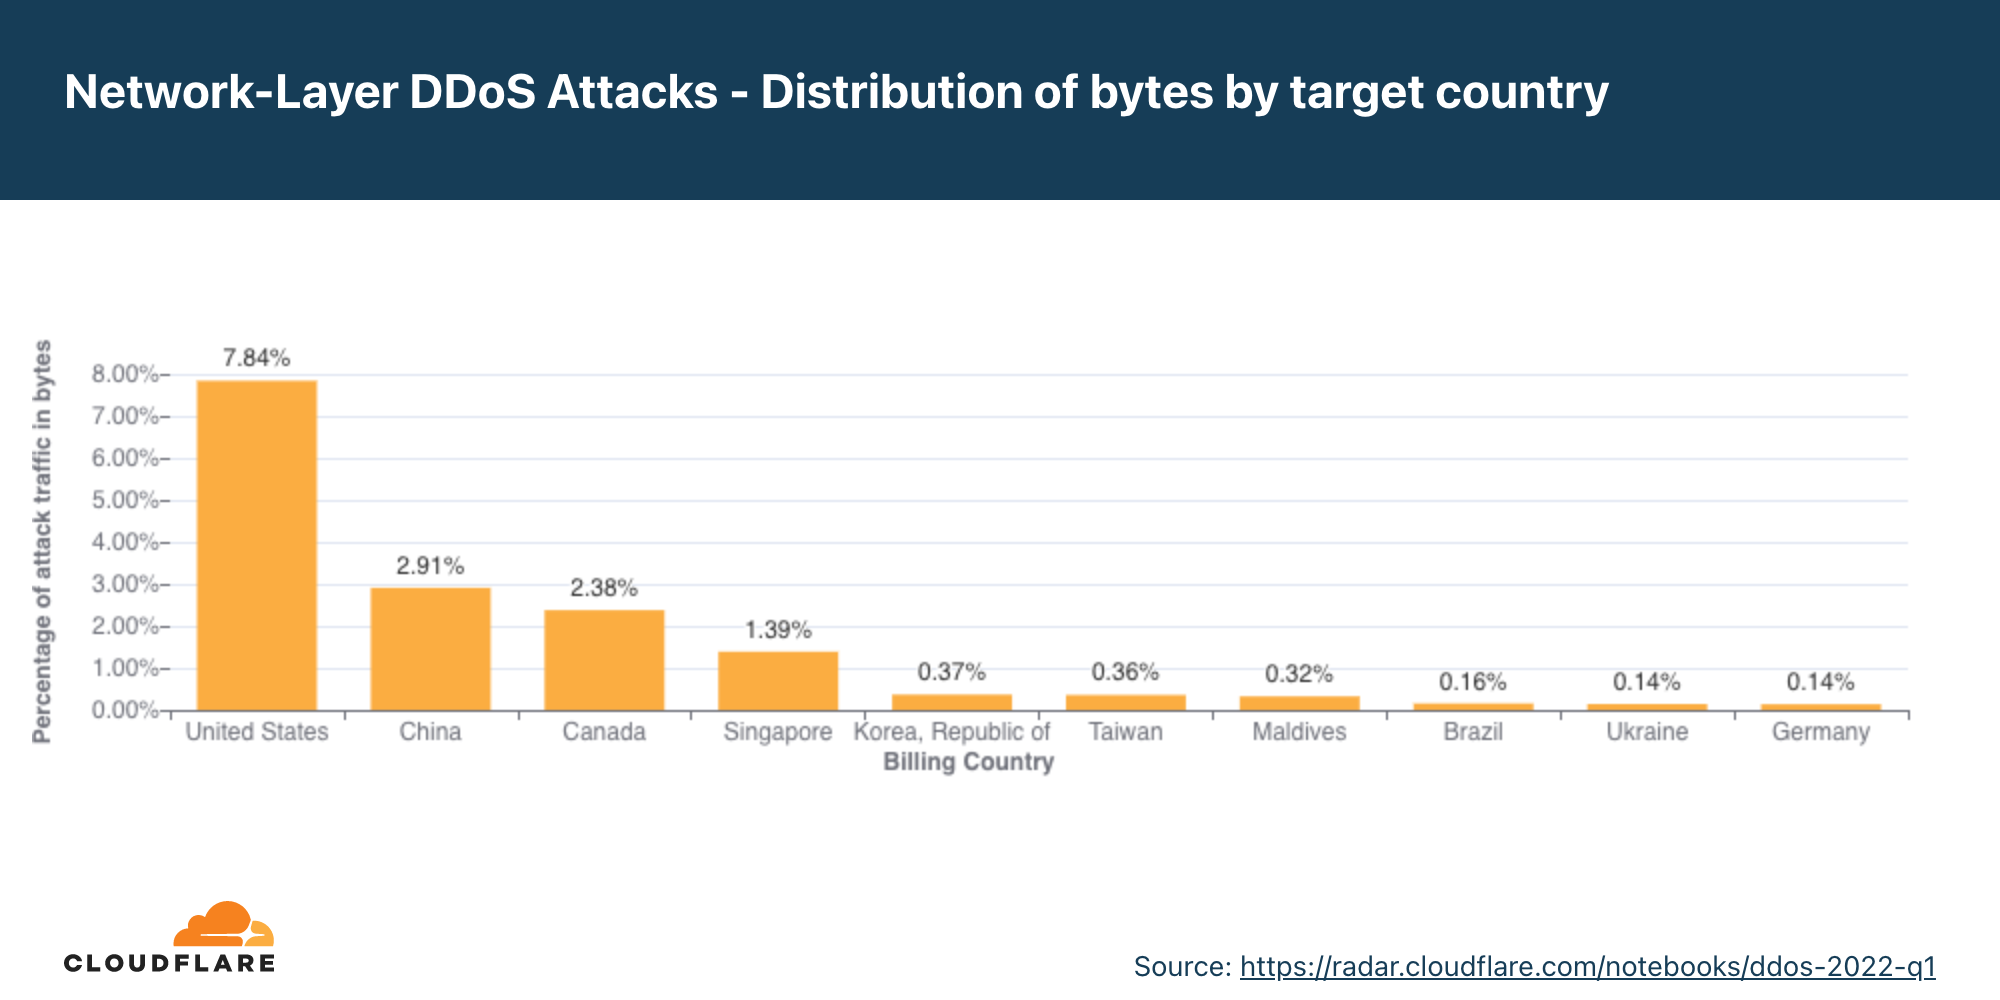
In order to identify which countries are targeted by the most HTTP DDoS attacks, we bucket the DDoS attacks by our customers’ billing countries and represent it as a percentage out of all DDoS attacks.
HTTP DDoS attacks on US-based countries increased by 67% QoQ pushing the US back to the first place as the main target of application-layer DDoS attacks. Attacks on Chinese companies plunged by 80% QoQ dropping it from the first place to the fourth. Attacks on Cyprus increase by 167% making it the second most attacked country in Q2. Following Cyprus is Hong Kong, China, and the Netherlands.
Network-layer DDoS attacks
While application-layer attacks target the application (Layer 7 of the OSI model) running the service that end users are trying to access (HTTP/S in our case), network-layer attacks aim to overwhelm network infrastructure (such as in-line routers and servers) and the Internet link itself.
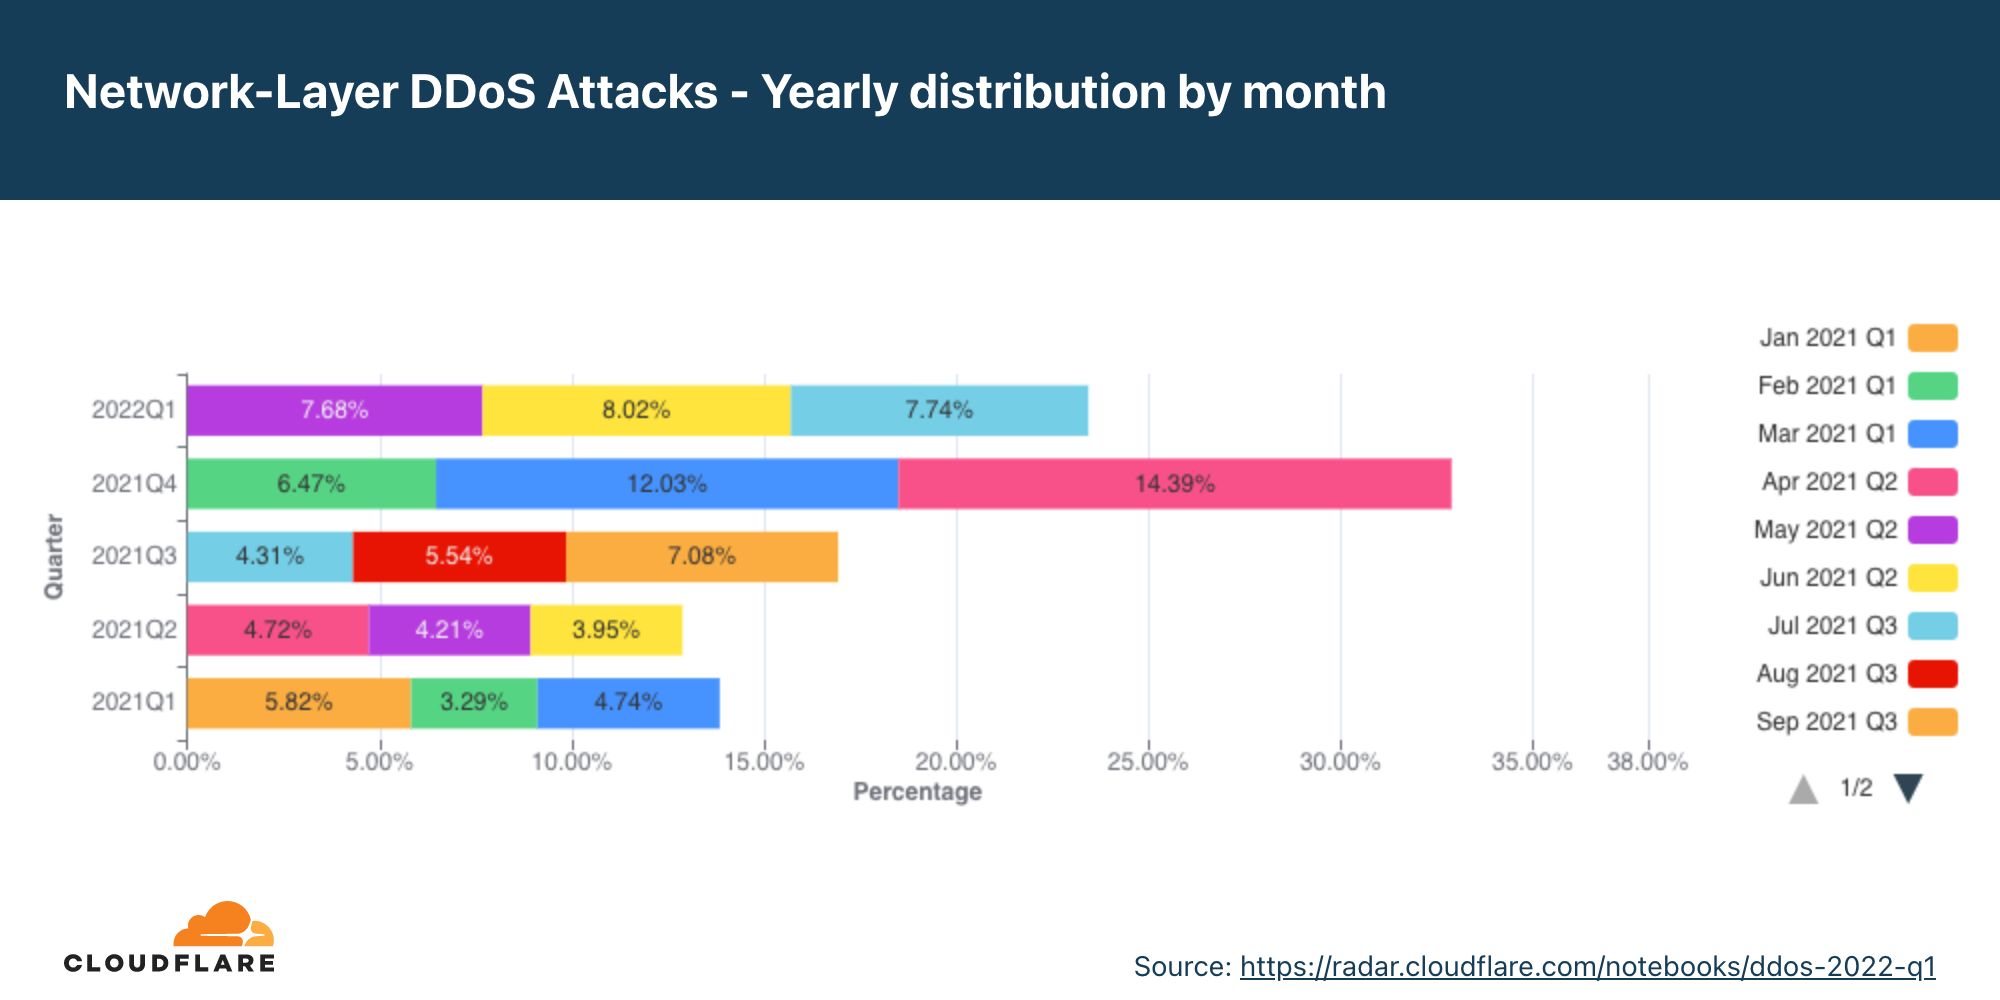
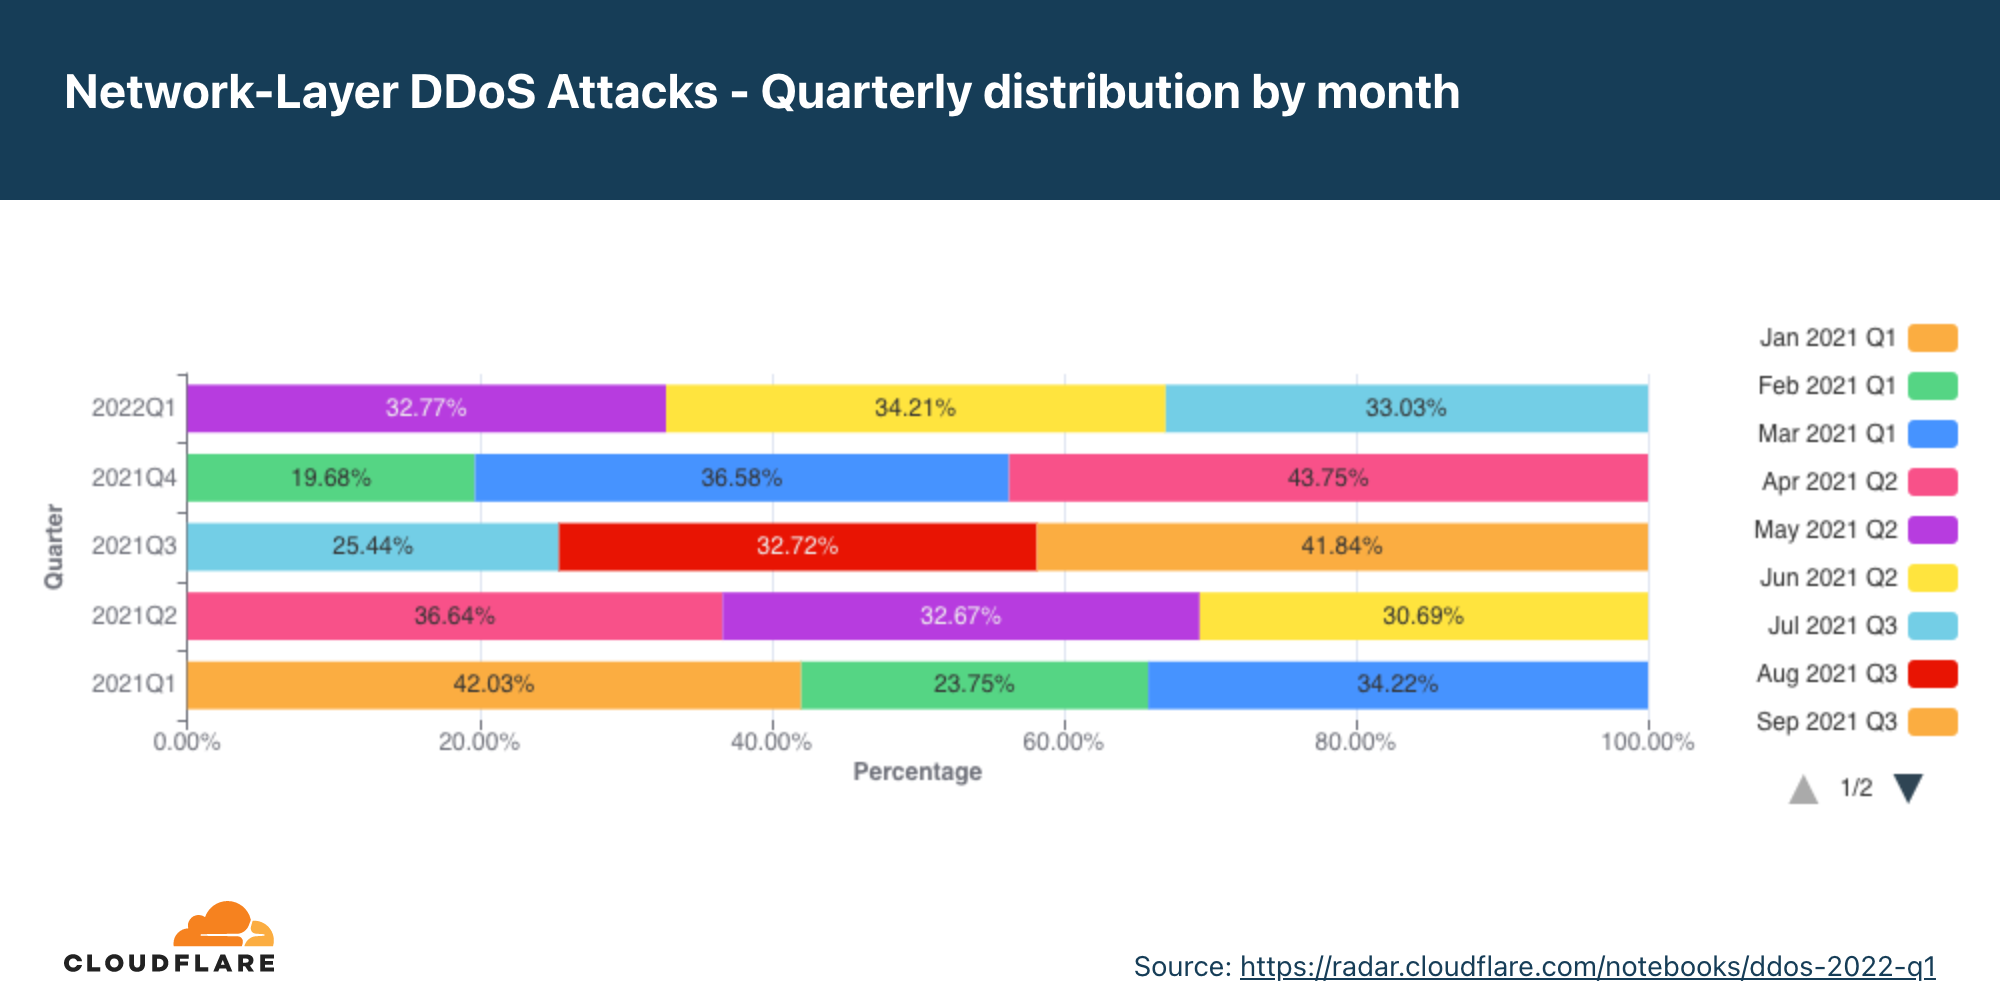
Network-layer DDoS attacks by month
In Q2, network-layer DDoS attacks increased by 109% YoY, and volumetric attacks of 100 Gbps and larger increased by 8% QoQ.
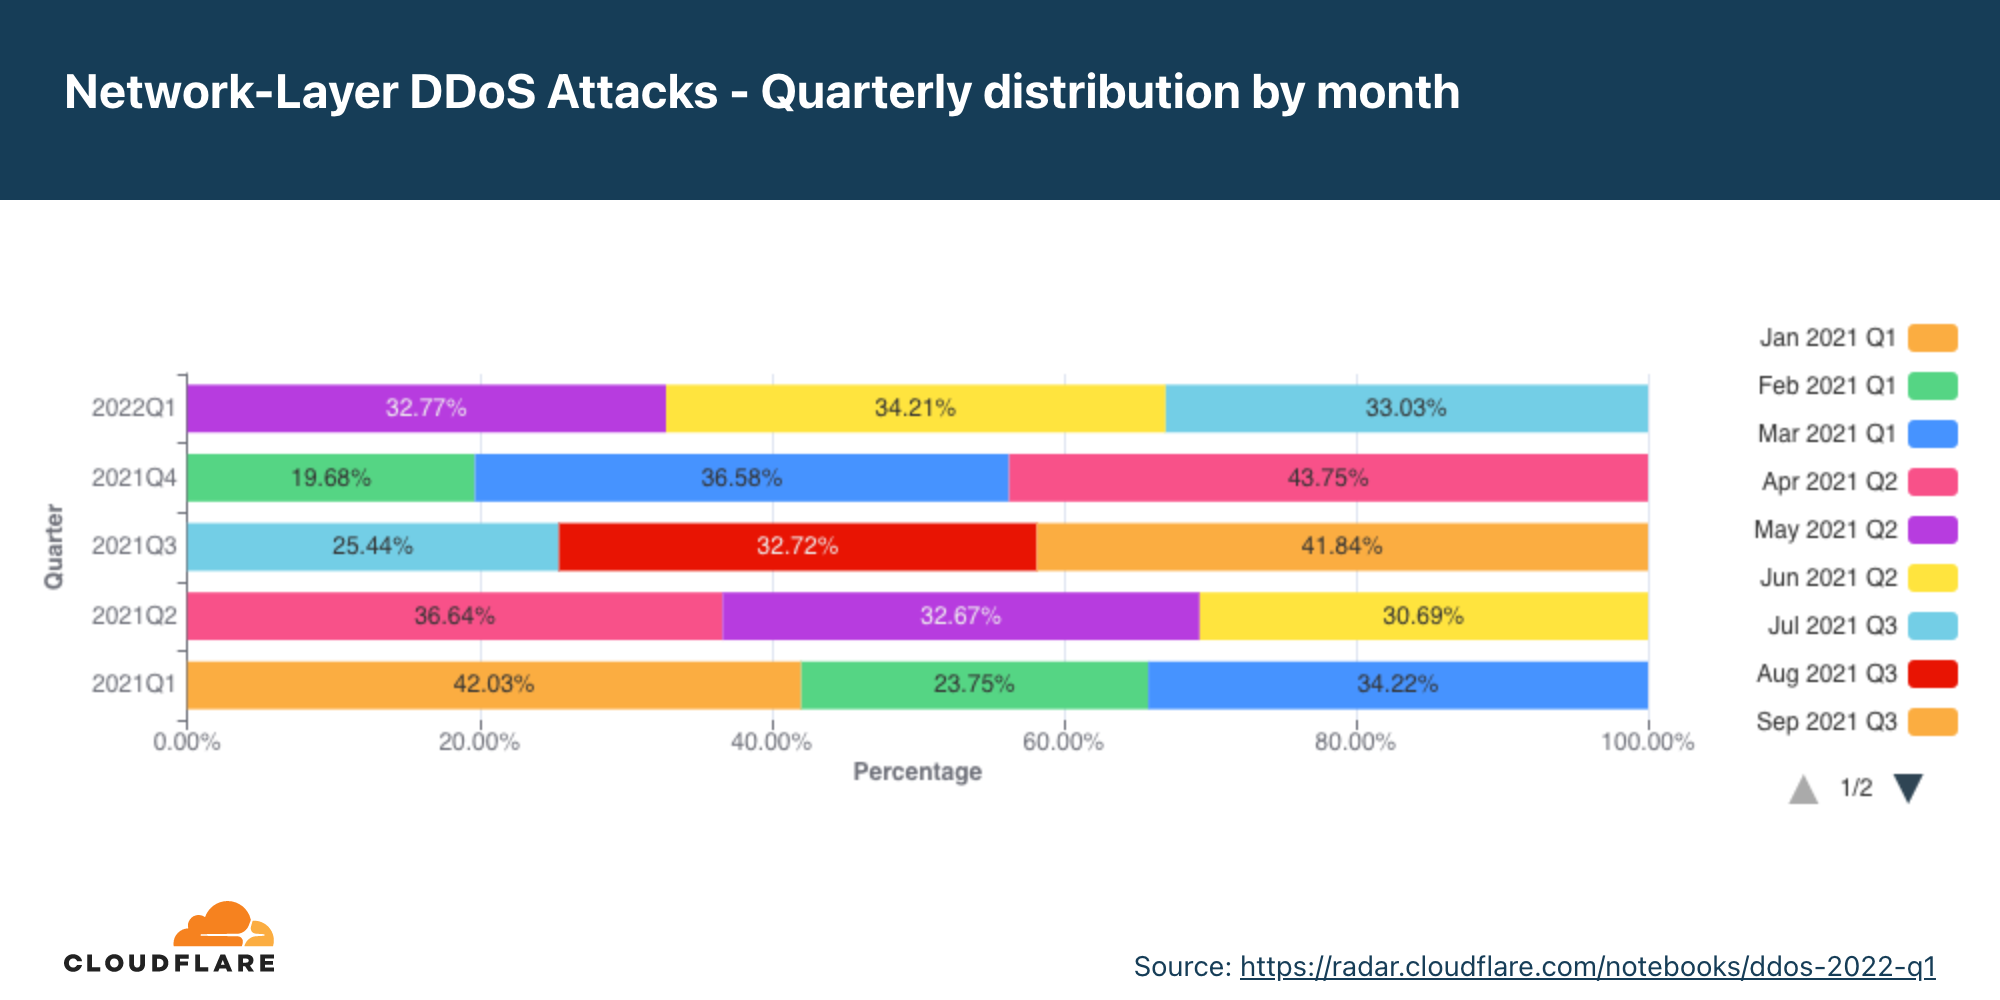
In Q2, the total amount of network-layer DDoS attacks increased by 109% YoY and 15% QoQ. June was the busiest month of the quarter with almost 36% of the attacks occurring in June.
Network-layer DDoS attacks by industry
In Q2, attacks on Telecommunication companies grew by 66% QoQ.
For the second consecutive quarter, the Telecommunications industry was the most targeted by network-layer DDoS attacks. Even more so, attacks on Telecommunication companies grew by 66% QoQ. The Gaming industry came in second place, followed by Information Technology and Services companies.
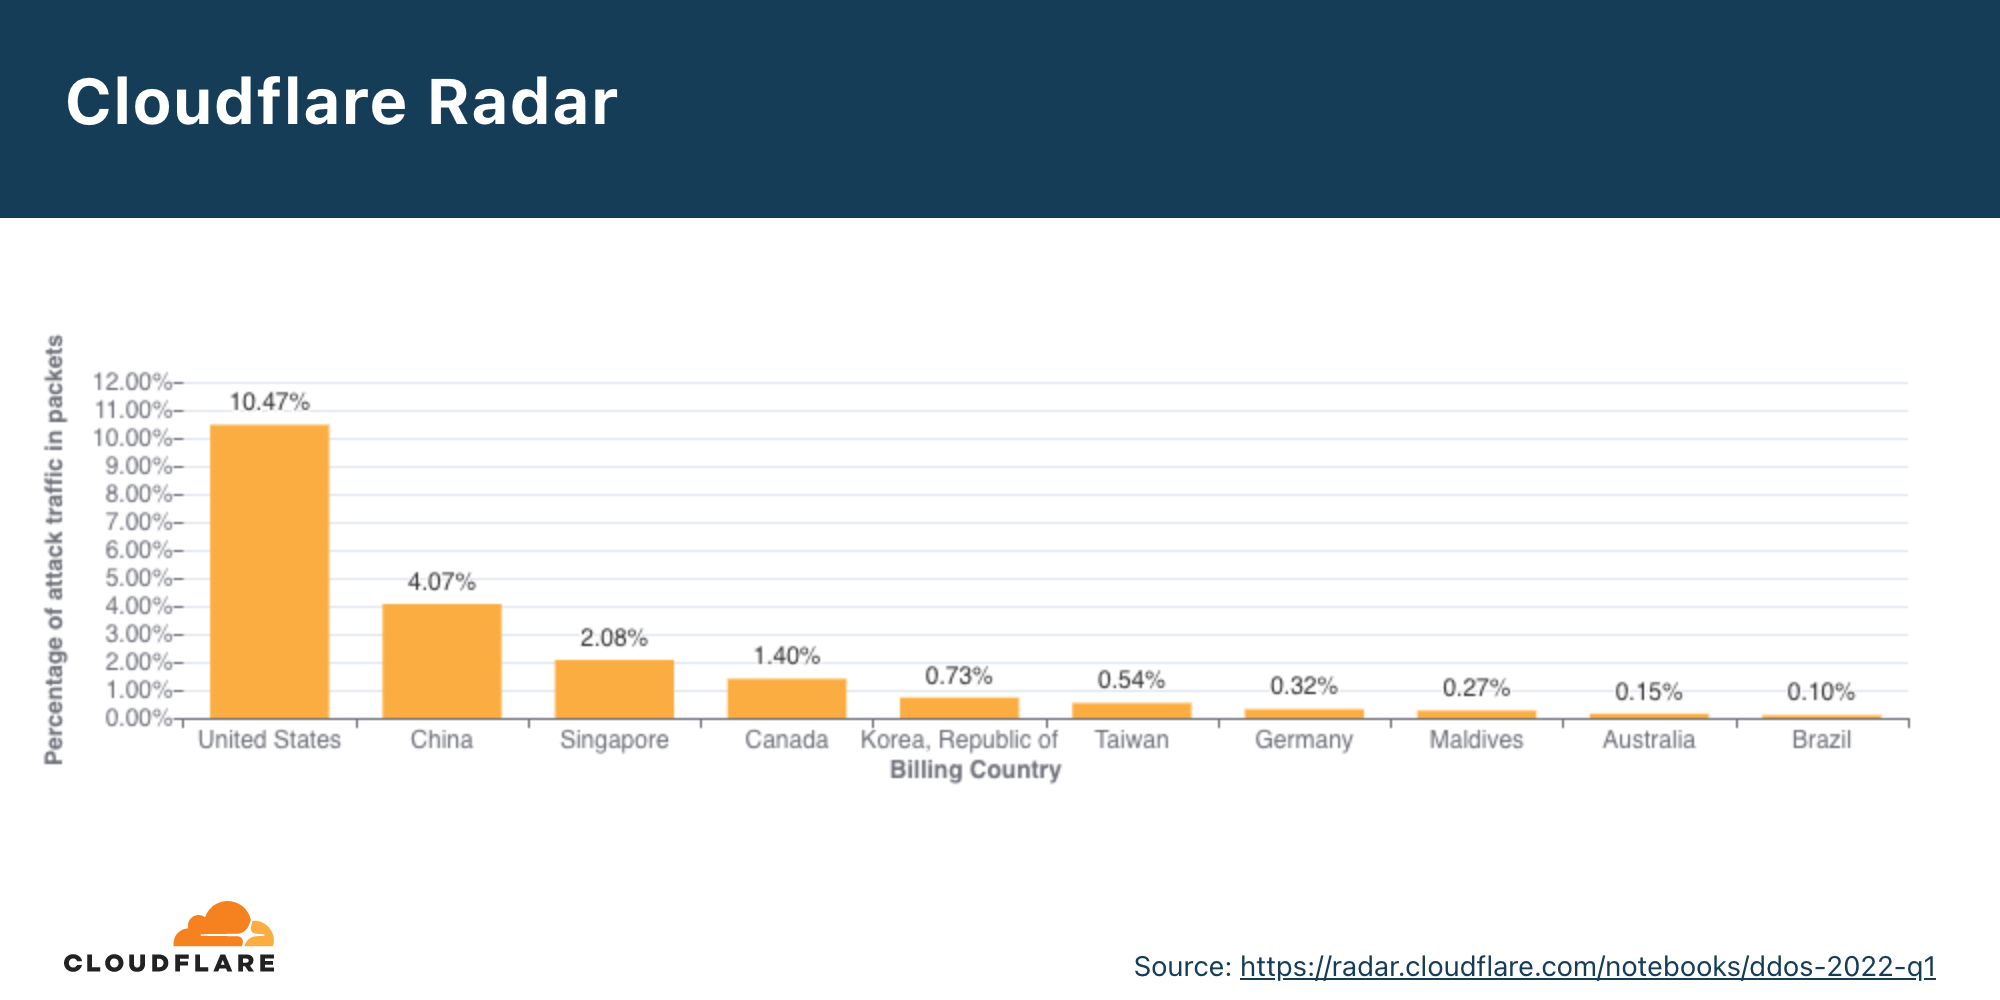
Network-layer DDoS attacks by target country
Attacks on US networks grew by 95% QoQ.
In Q2, the US remains the most attacked country. After the US came China, Singapore and Germany.
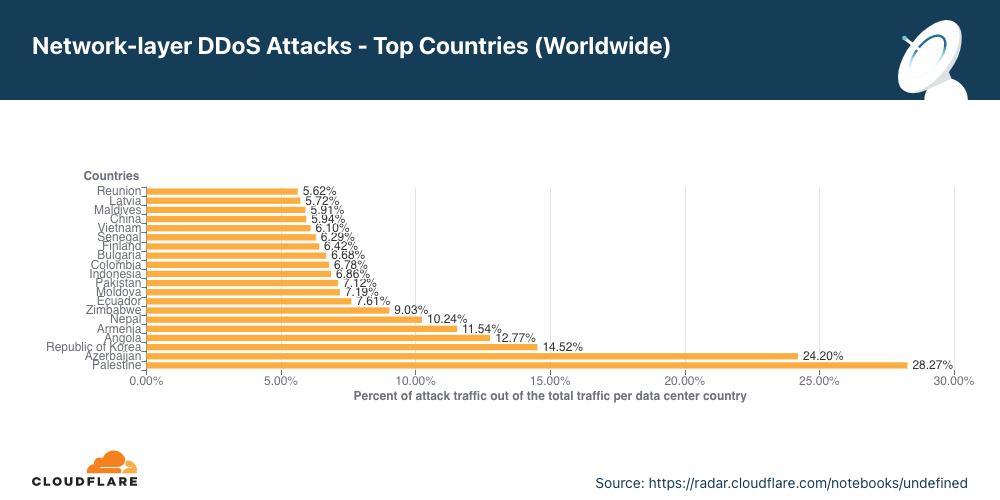
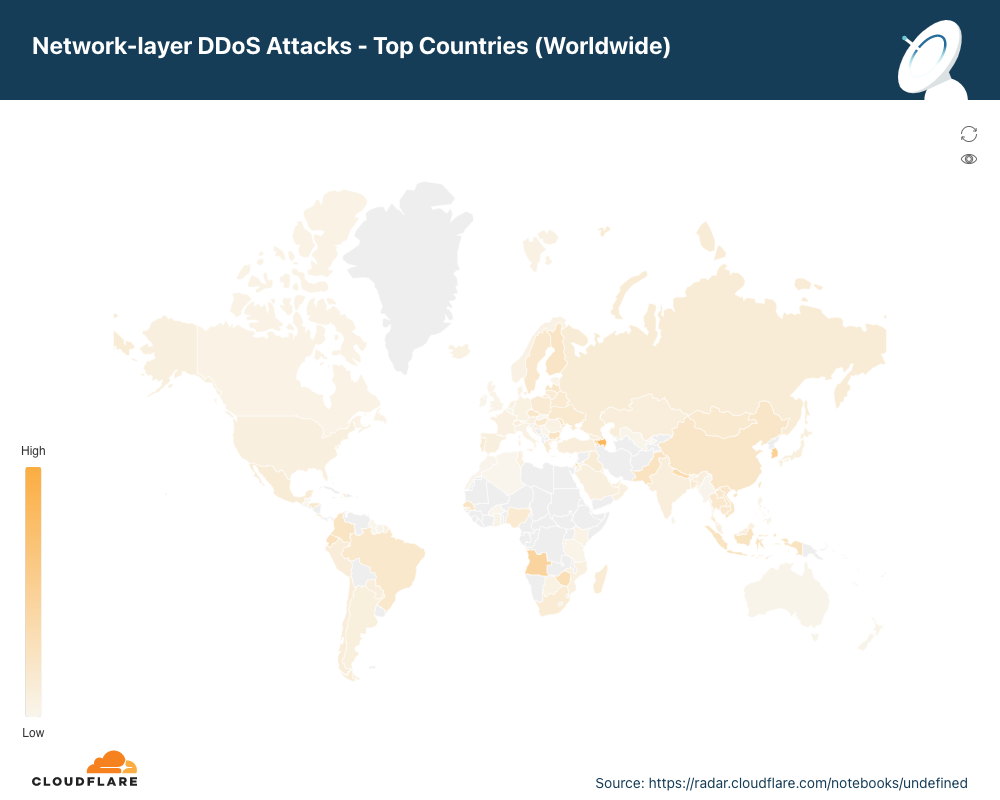
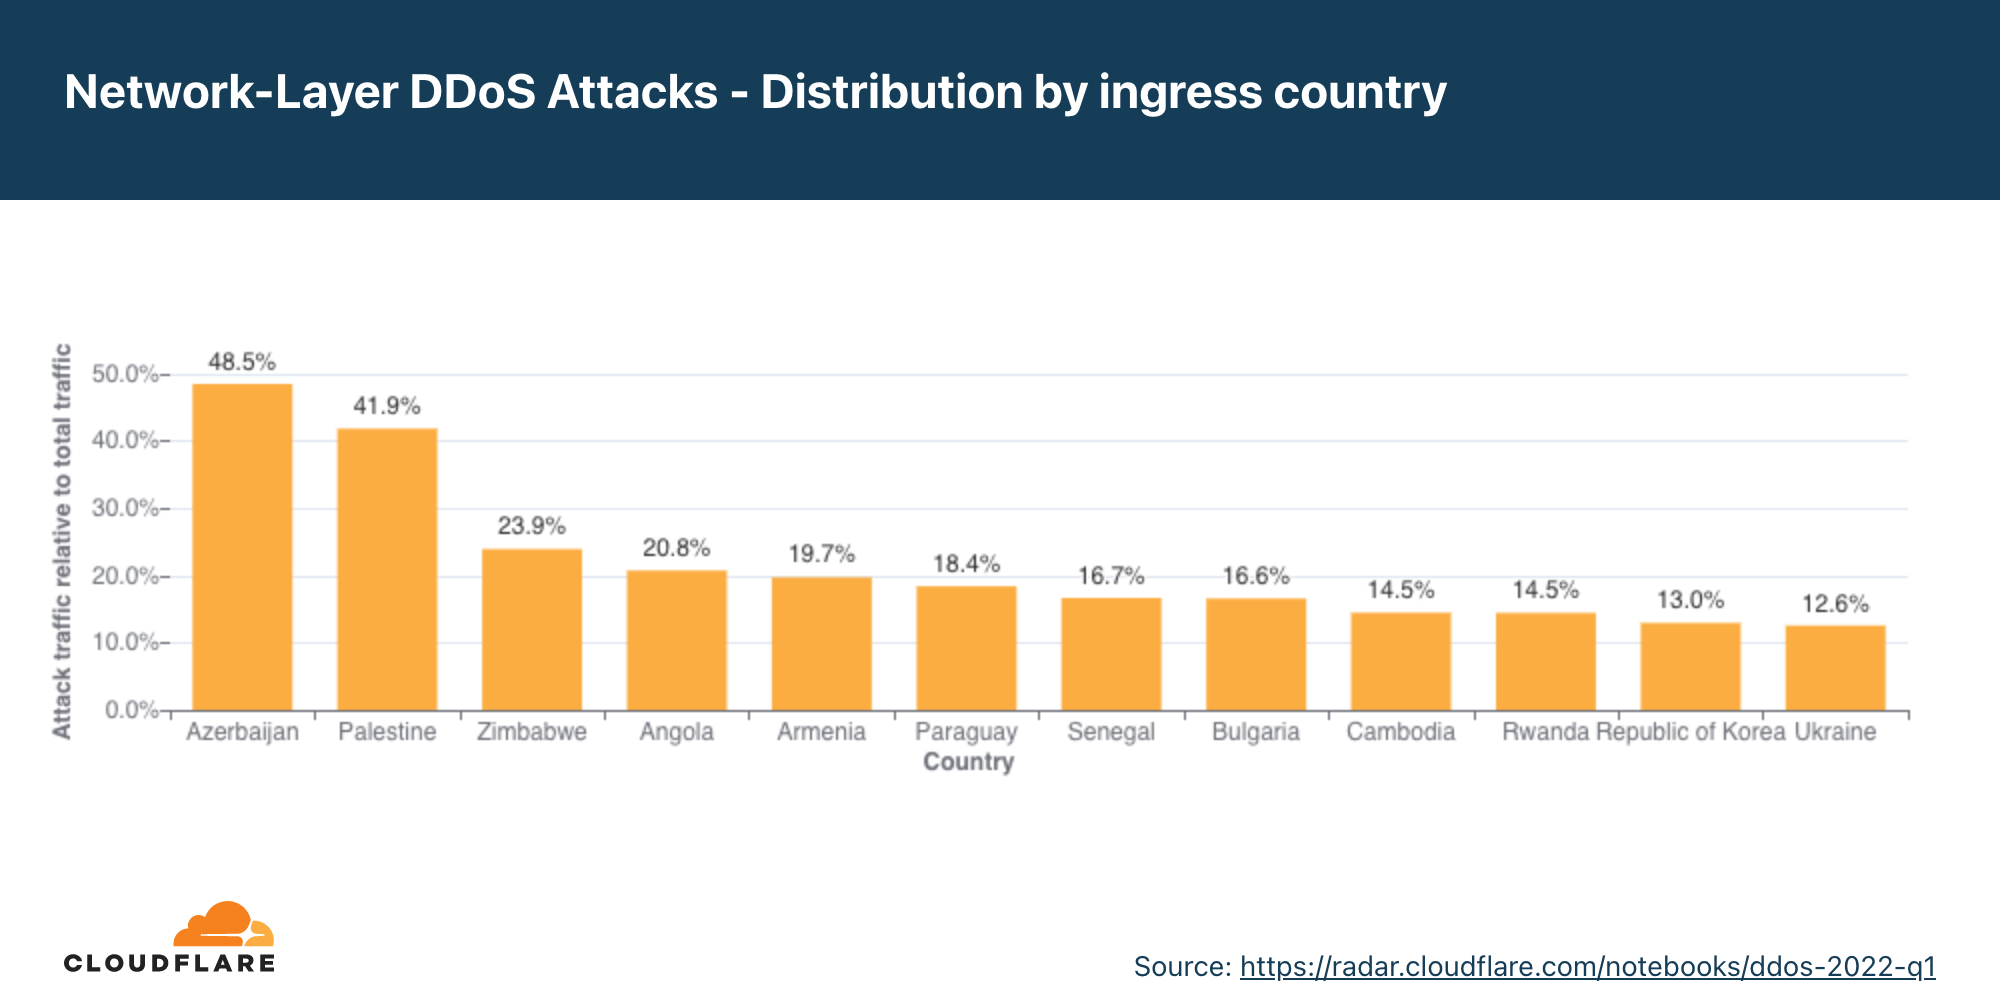
Network-layer DDoS attacks by ingress country
In Q2, almost a third of the traffic Cloudflare observed in Palestine and a fourth in Azerbaijan was part of a network-layer DDoS attack.
When trying to understand where network-layer DDoS attacks originate, we cannot use the same method as we use for the application-layer attack analysis. To launch an application-layer DDoS attack, successful handshakes must occur between the client and the server in order to establish an HTTP/S connection. For a successful handshake to occur, the attacks cannot spoof their source IP address. While the attacker may use botnets, proxies, and other methods to obfuscate their identity, the attacking client’s source IP location does sufficiently represent the attack source of application-layer DDoS attacks.
On the other hand, to launch network-layer DDoS attacks, in most cases, no handshake is needed. Attackers can spoof the source IP address in order to obfuscate the attack source and introduce randomness into the attack properties, which can make it harder for simple DDoS protection systems to block the attack. So if we were to derive the source country based on a spoofed source IP, we would get a ‘spoofed country’.
For this reason, when analyzing network-layer DDoS attack sources, we bucket the traffic by the Cloudflare data center locations where the traffic was ingested, and not by the (potentially) spoofed source IP to get an understanding of where the attacks originate from. We are able to achieve geographical accuracy in our report because we have data centers in over 270 cities around the world. However, even this method is not 100% accurate, as traffic may be back hauled and routed via various Internet Service Providers and countries for reasons that vary from cost reduction to congestion and failure management.
Palestine jumps from the second to the first place as the Cloudflare location with the highest percentage of network-layer DDoS attacks. Following Palestine is Azerbaijan, South Korea, and Angola.
To view all regions and countries, check out the interactive map.
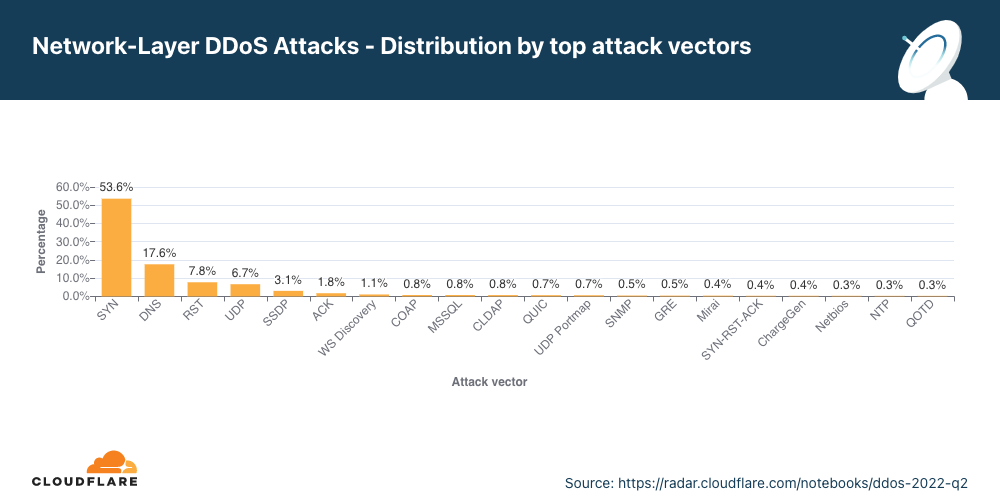
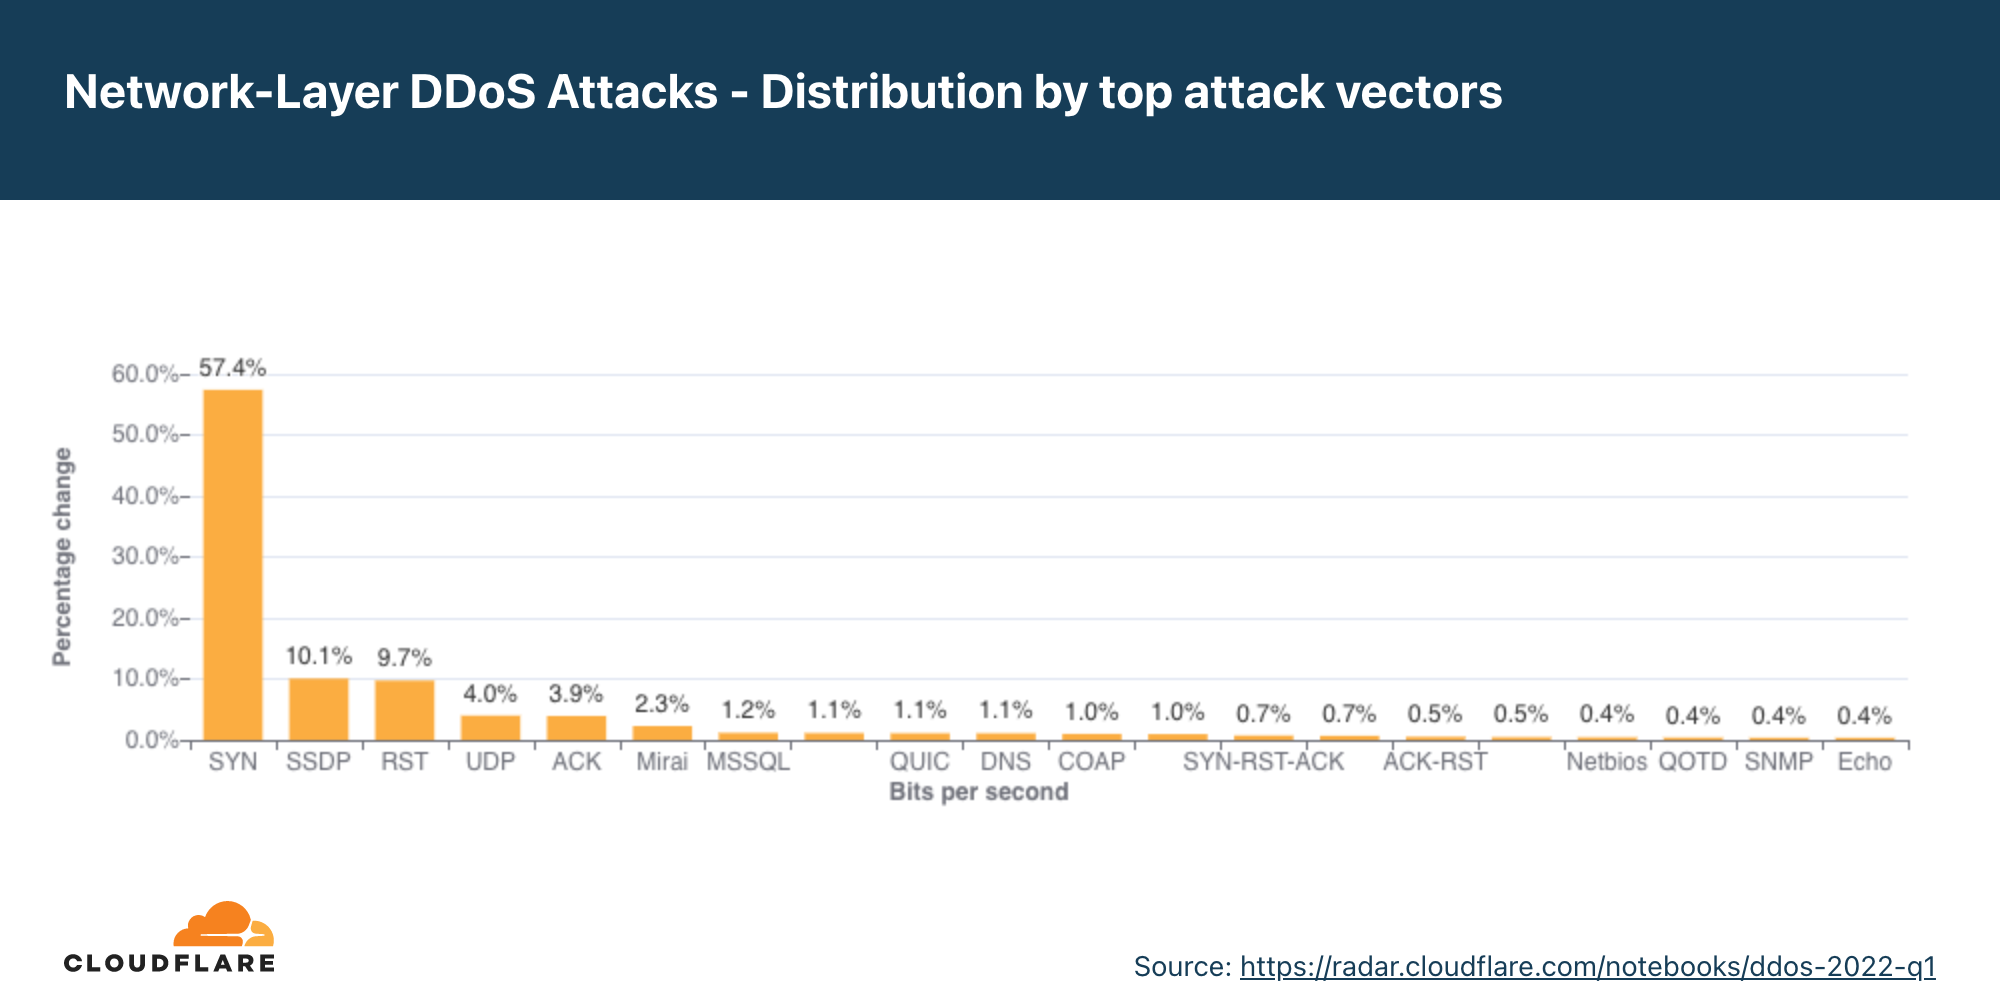
Attack vectors
In Q2, DNS attacks increased making it the second most frequent attack vector.
An attack vector is a term used to describe the method that the attacker uses to launch their DDoS attack, i.e., the IP protocol, packet attributes such as TCP flags, flooding method, and other criteria.
In Q2, 53% of all network-layer attacks were SYN floods. SYN floods remain the most popular attack vector. They abuse the initial connection request of the stateful TCP handshake. During this initial connection request, servers don’t have any context about the TCP connection as it is new and without the proper protection may find it hard to mitigate a flood of initial connection requests. This makes it easier for the attacker to consume an unprotected server’s resources.
After the SYN floods are attacks targeting DNS infrastructure, RST floods again abusing TCP connection flow, and generic attacks over UDP.
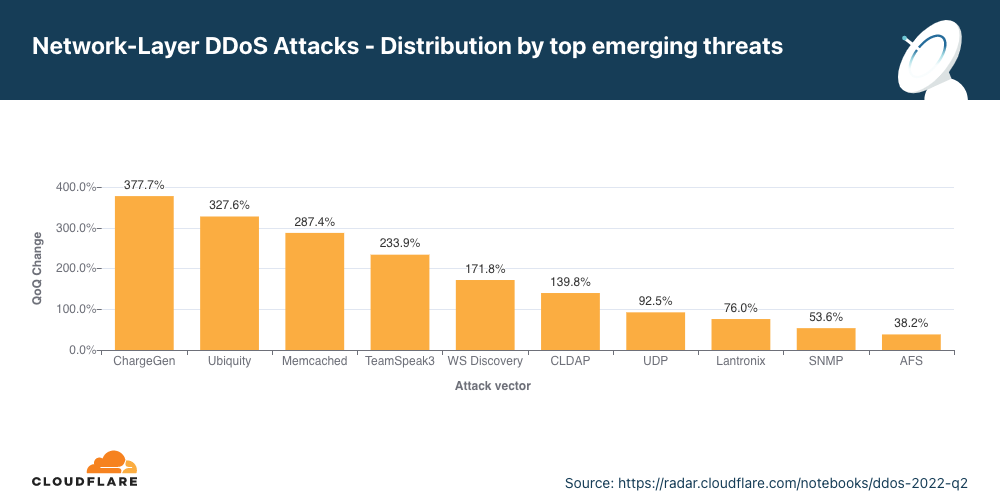
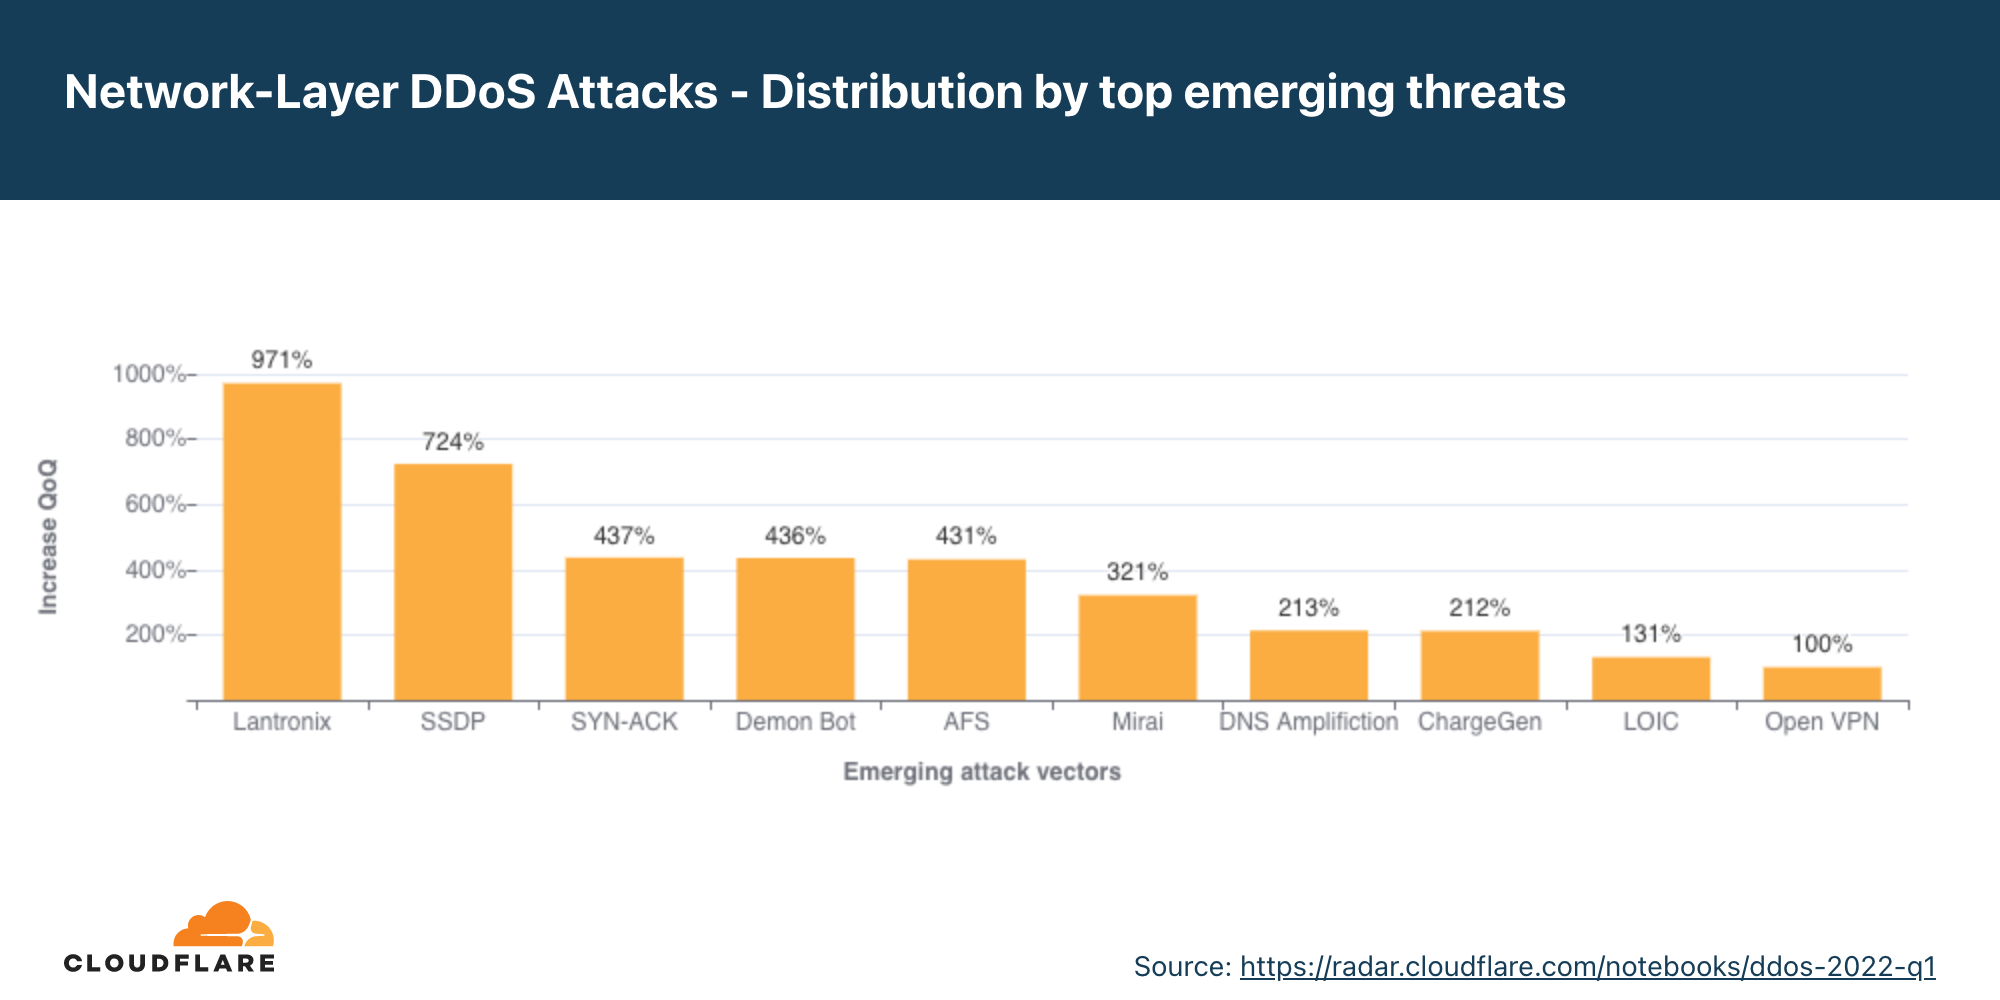
Emerging threats
In Q2, the top emerging threats included attacks over CHARGEN, Ubiquiti and Memcached.
Identifying the top attack vectors helps organizations understand the threat landscape. In turn, this may help them improve their security posture to protect against those threats. Similarly, learning about new emerging threats that may not yet account for a significant portion of attacks, can help mitigate them before they become a significant force.
In Q2, the top emerging threats were amplification attacks abusing the Character Generator Protocol (CHARGEN), amplification attacks reflecting traffic off of exposed Ubiquiti devices, and the notorious Memcached attack.
Abusing the CHARGEN protocol to launch amplification attacks
In Q2, attacks abusing the CHARGEN protocol increased by 378% QoQ.
Initially defined in RFC 864 (1983), the Character Generator (CHARGEN) protocol is a service of the Internet Protocol Suite that does exactly what it says it does – it generates characters arbitrarily, and it doesn’t stop sending them to the client until the client closes the connection. Its original intent was for testing and debugging. However, it’s rarely used because it can so easily be abused to generate amplification/reflection attacks.
An attacker can spoof the source IP of their victim and fool supporting servers around the world to direct a stream of arbitrary characters “back” to the victim’s servers. This type of attack is amplification/reflection. Given enough simultaneous CHARGEN streams, the victim’s servers, if unprotected, would be flooded and unable to cope with legitimate traffic — resulting in a denial of service event.
Amplification attacks exploiting the Ubiquiti Discovery Protocol
In Q2, attacks over Ubiquity increased by 327% QoQ.
Ubiquiti is a US-based company that provides networking and Internet of Things (IoT) devices for consumers and businesses. Ubiquiti devices can be discovered on a network using the Ubiquiti Discovery protocol over UDP/TCP port 10001.
Similarly to the CHARGEN attack vector, here too, attackers can spoof the source IP to be the victim’s IP address and spray IP addresses that have port 10001 open. Those would then respond to the victim and essentially flood it if the volume is sufficient.
Memcached DDoS attacks
In Q2, Memcached DDoS attacks increased by 287% QoQ.
Memcached is a database caching system for speeding up websites and networks. Similarly to CHARGEN and Ubiquiti, Memcached servers that support UDP can be abused to launch amplification/reflection DDoS attacks. In this case, the attacker would request content from the caching system and spoof the victim’s IP address as the source IP in the UDP packets. The victim will be flooded with the Memcache responses which can be amplified by a factor of up to 51,200x.
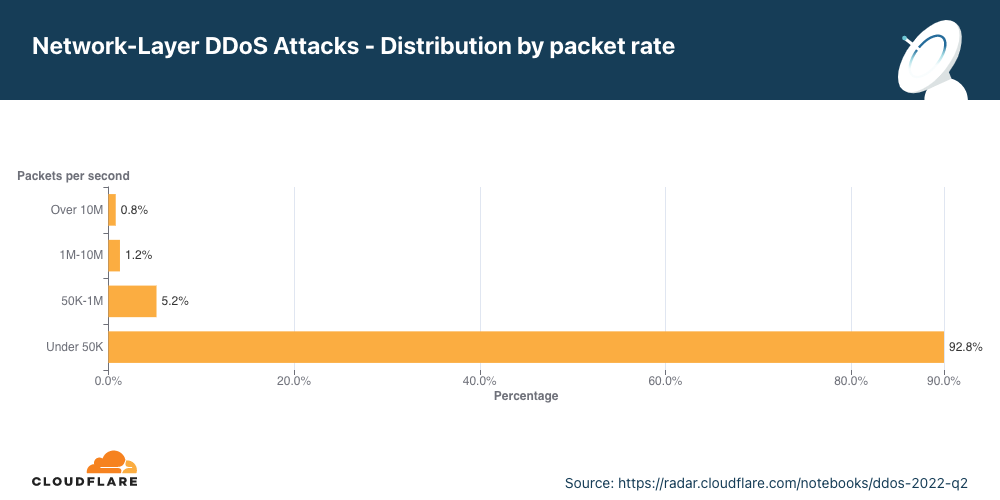
Network-layer DDoS attacks by attack rate
Volumetric attacks of over 100 Gbps increase by 8% QoQ.
There are different ways of measuring the size of an L3/4 DDoS attack. One is the volume of traffic it delivers, measured as the bit rate (specifically, terabits per second or gigabits per second). Another is the number of packets it delivers, measured as the packet rate (specifically, millions of packets per second).
Attacks with high bit rates attempt to cause a denial-of-service event by clogging the Internet link, while attacks with high packet rates attempt to overwhelm the servers, routers, or other in-line hardware appliances. These devices dedicate a certain amount of memory and computation power to process each packet. Therefore, by bombarding it with many packets, the appliance can be left with no further processing resources. In such a case, packets are “dropped,” i.e., the appliance is unable to process them. For users, this results in service disruptions and denial of service.
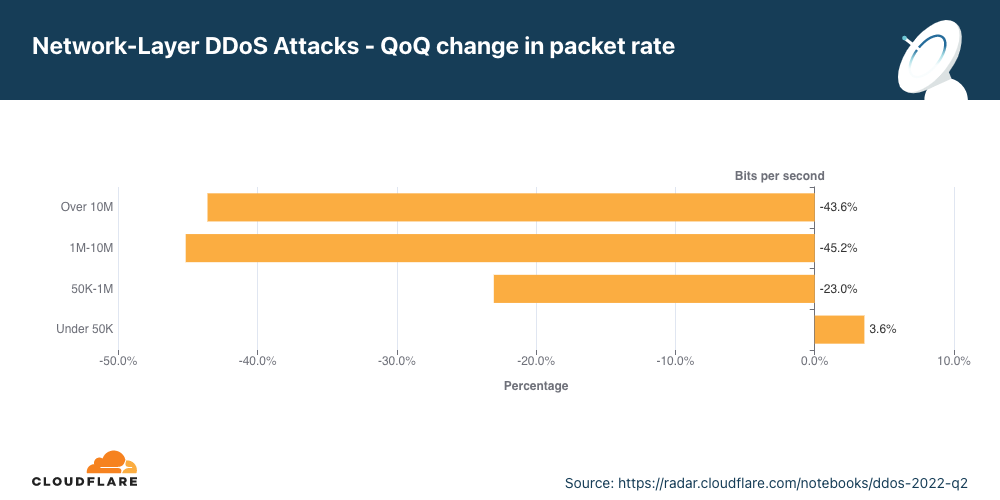
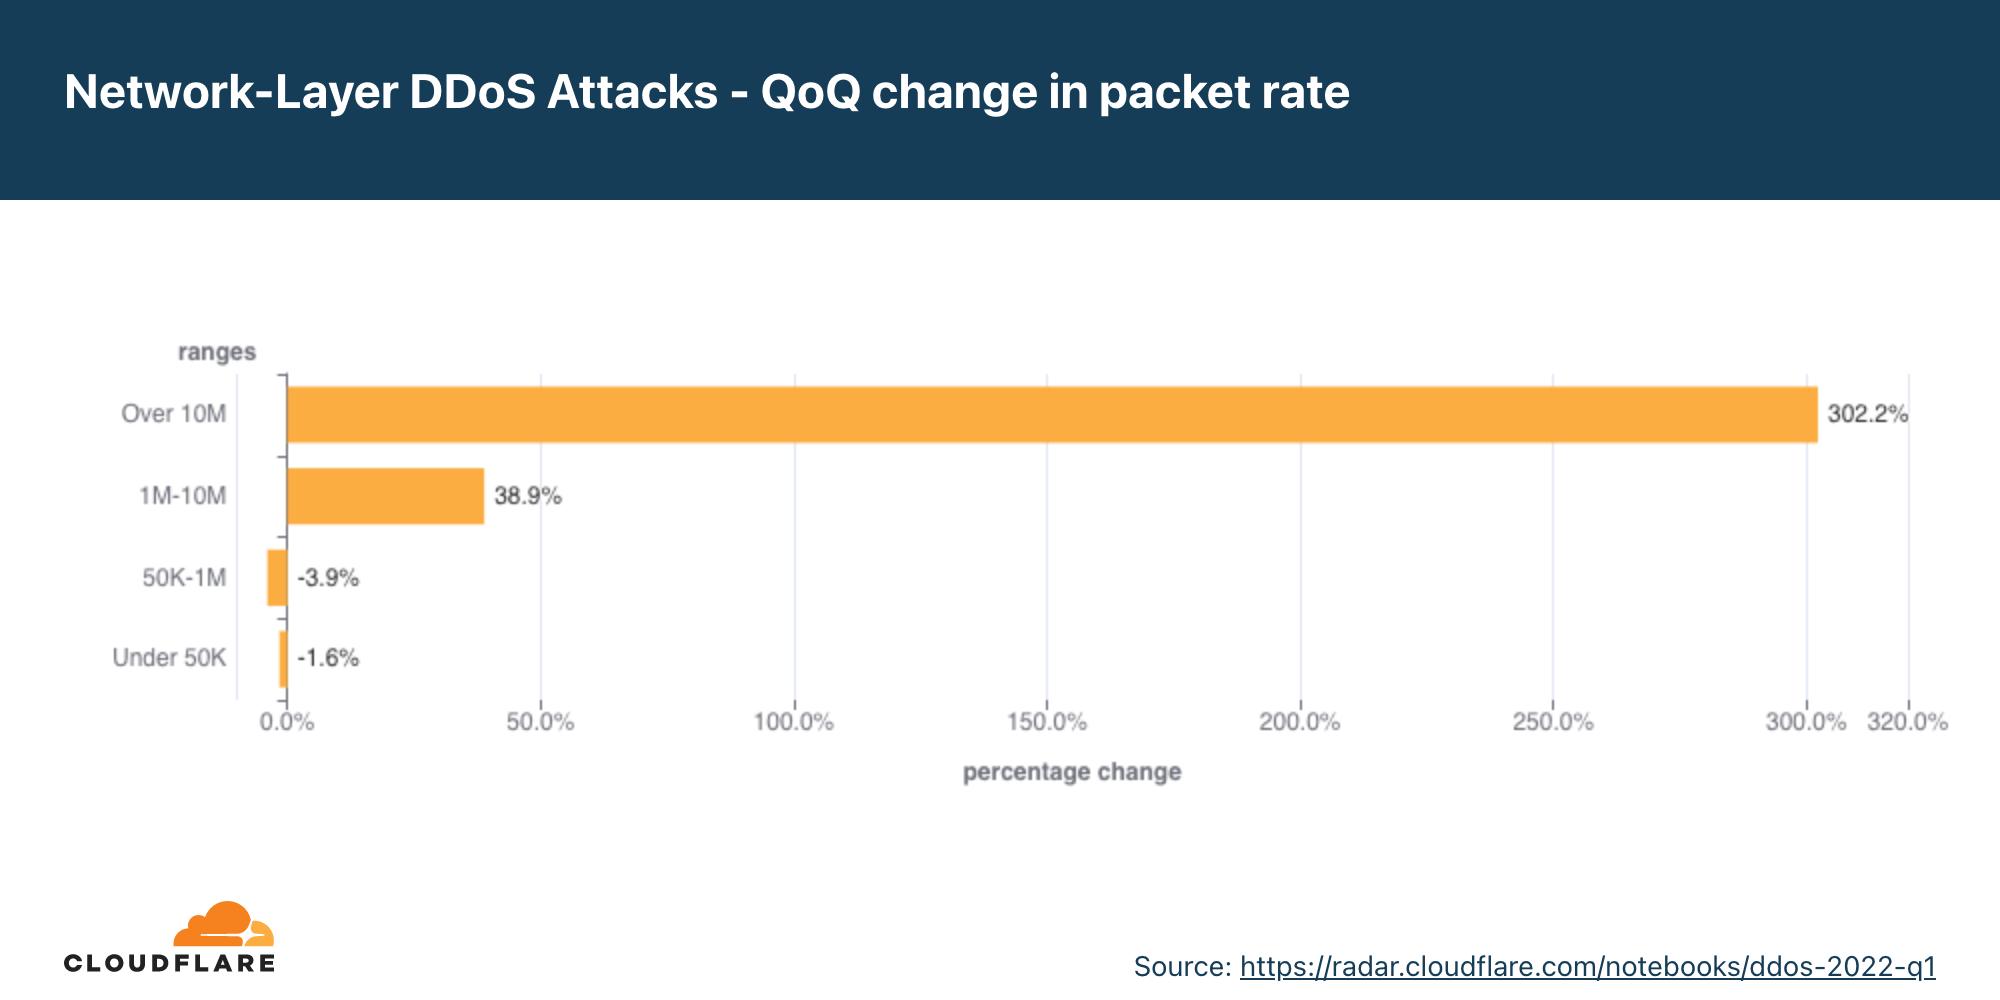
Distribution by packet rate
The majority of network-layer DDoS attacks remain below 50,000 packets per second. While 50 kpps is on the lower side of the spectrum at Cloudflare scale, it can still easily take down unprotected Internet properties and congest even a standard Gigabit Ethernet connection.
When we look at the changes in the attack sizes, we can see that packet-intensive attacks above 50 kpps decreased in Q2, resulting in an increase of 4% in small attacks.
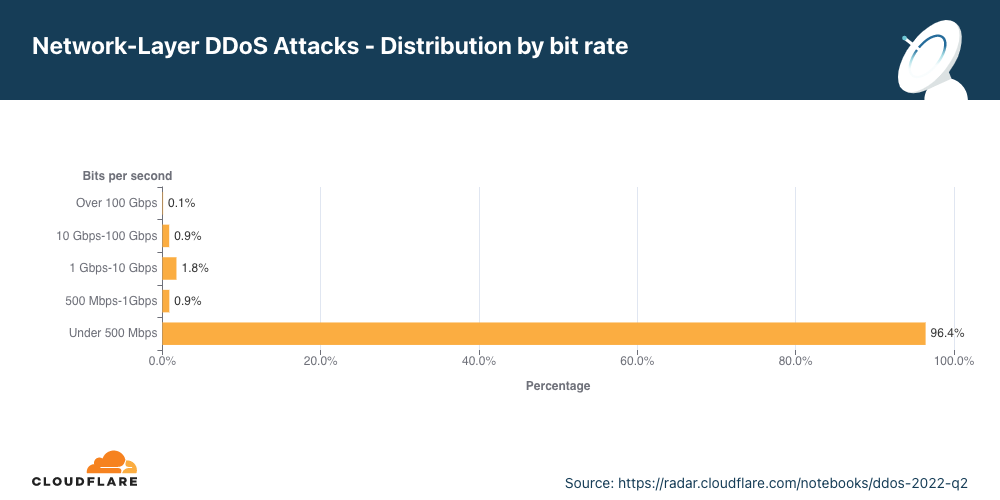
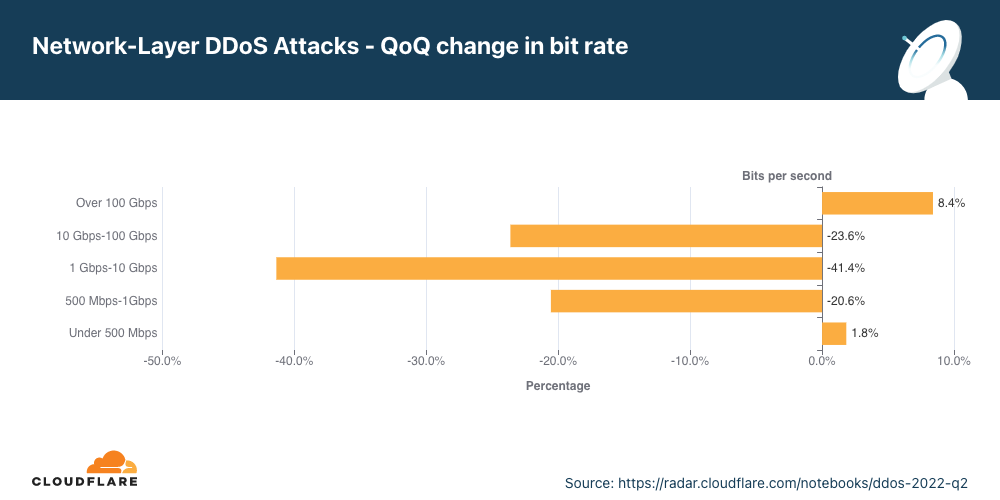
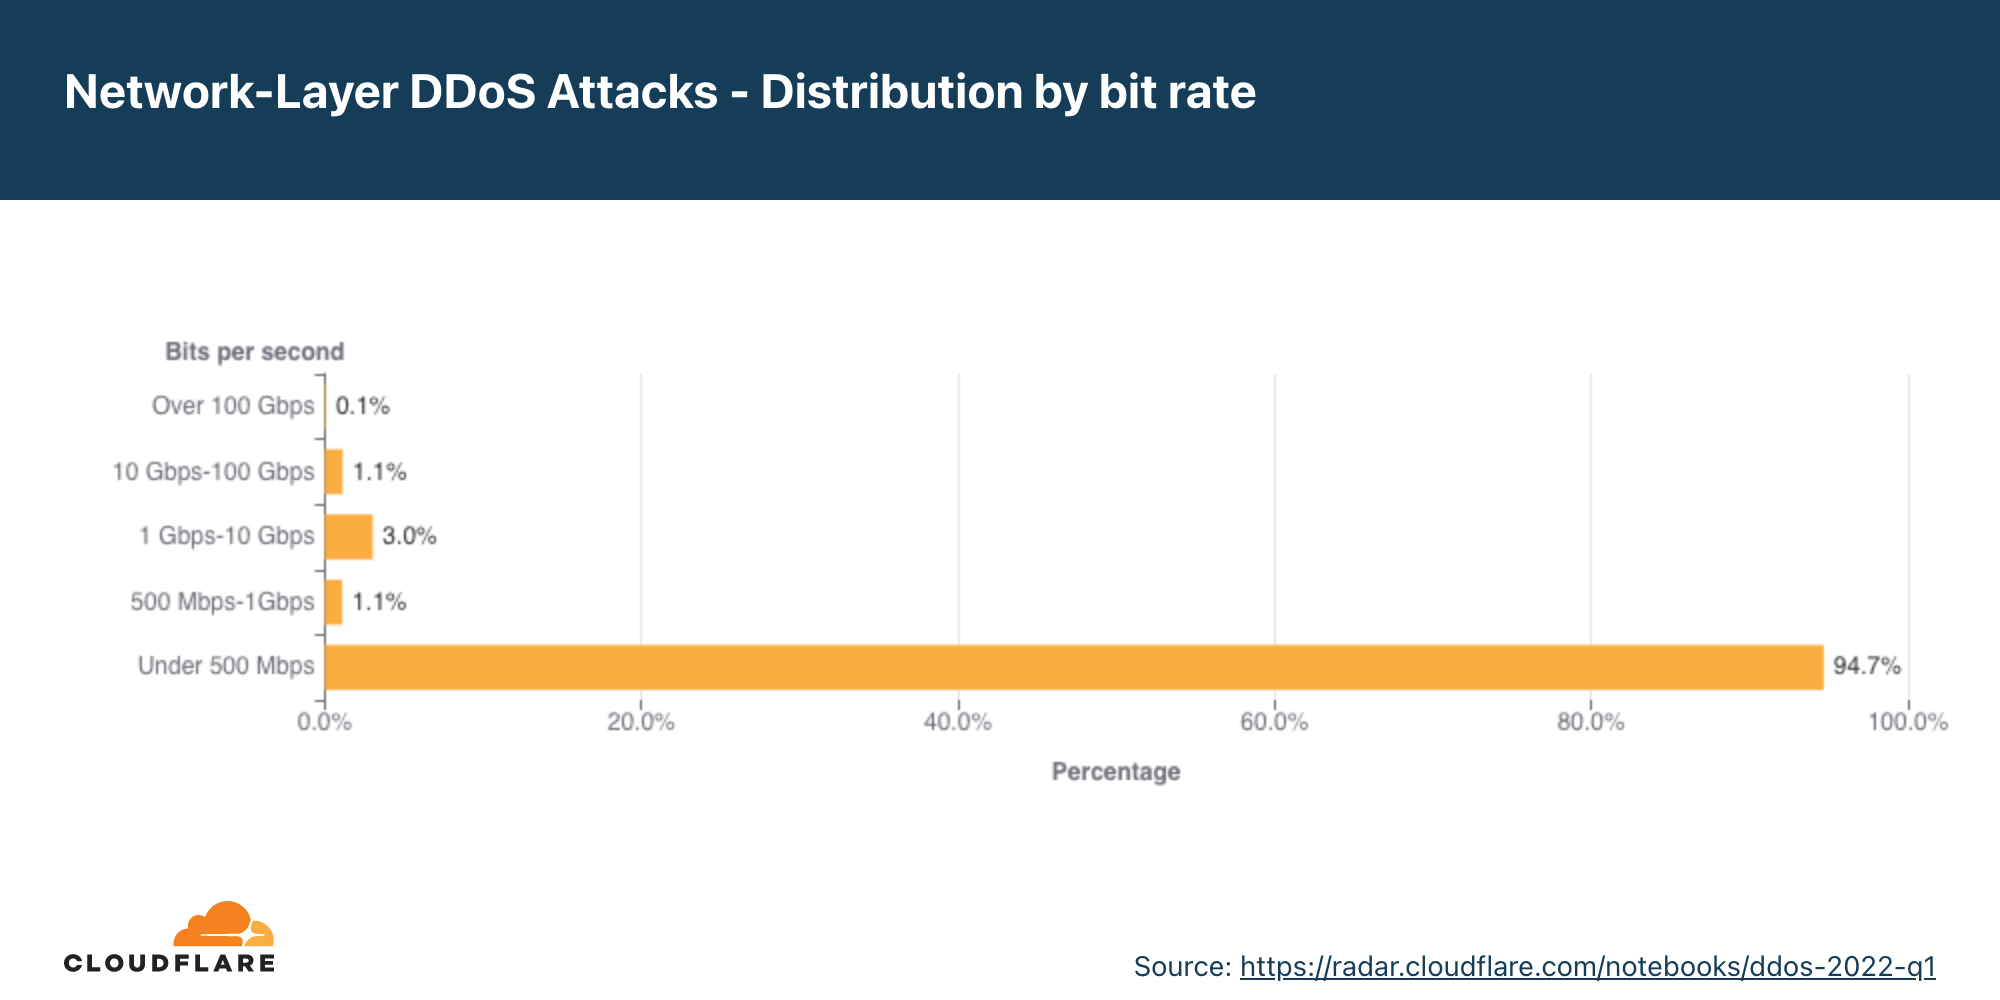
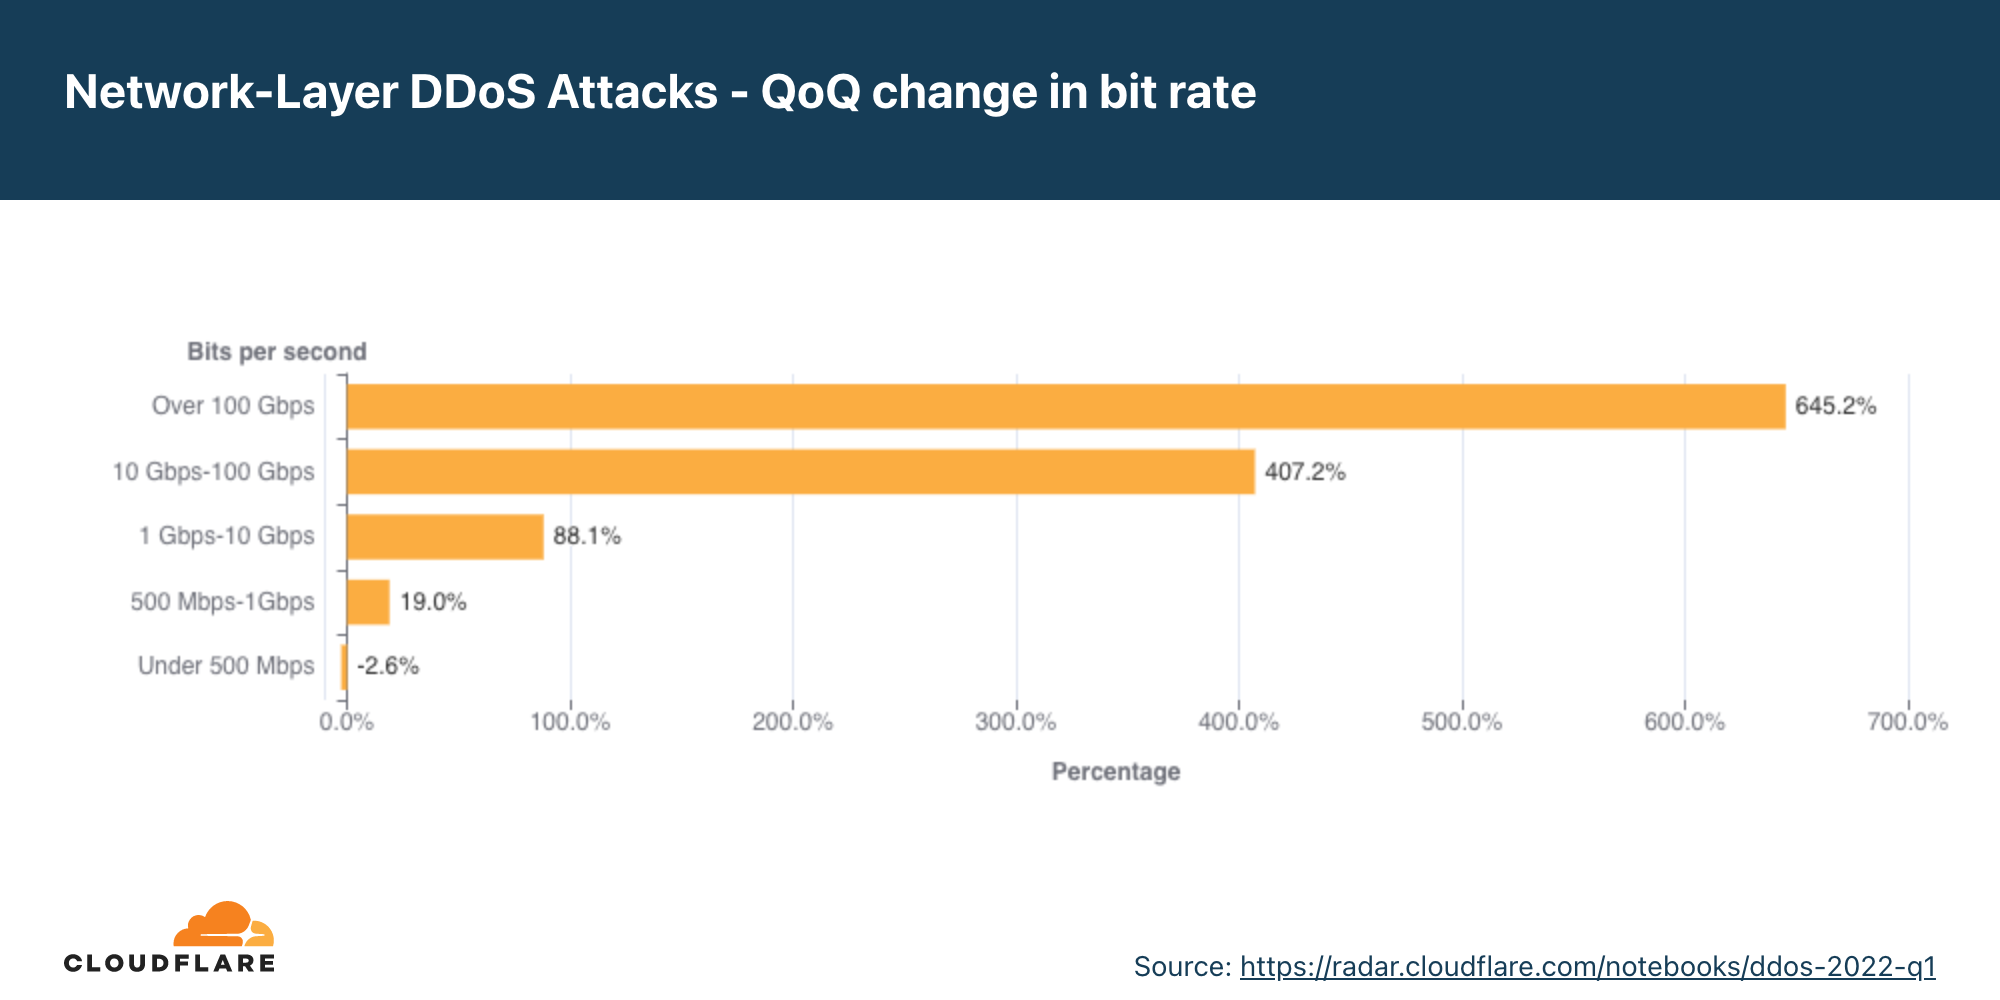
Distribution by bitrate
In Q2, most of the network-layer DDoS attacks remain below 500 Mbps. This too is a tiny drop in the water at Cloudflare scale, but can very quickly shut down unprotected Internet properties with less capacity or at the very least cause congestion for even a standard Gigabit Ethernet connection.
Interestingly enough, large attacks between 500 Mbps and 100 Gbps decreased by 20-40% QoQ, but volumetric attacks above 100 Gbps increased by 8%.
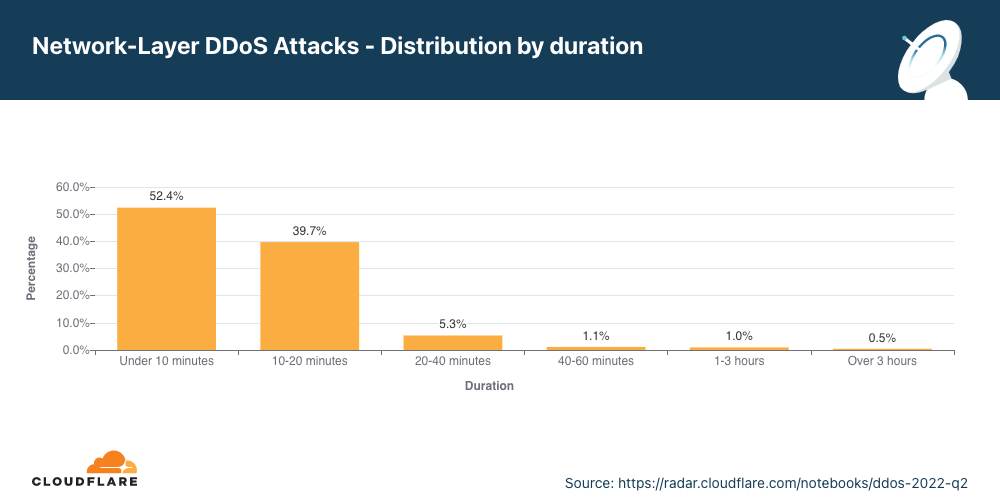
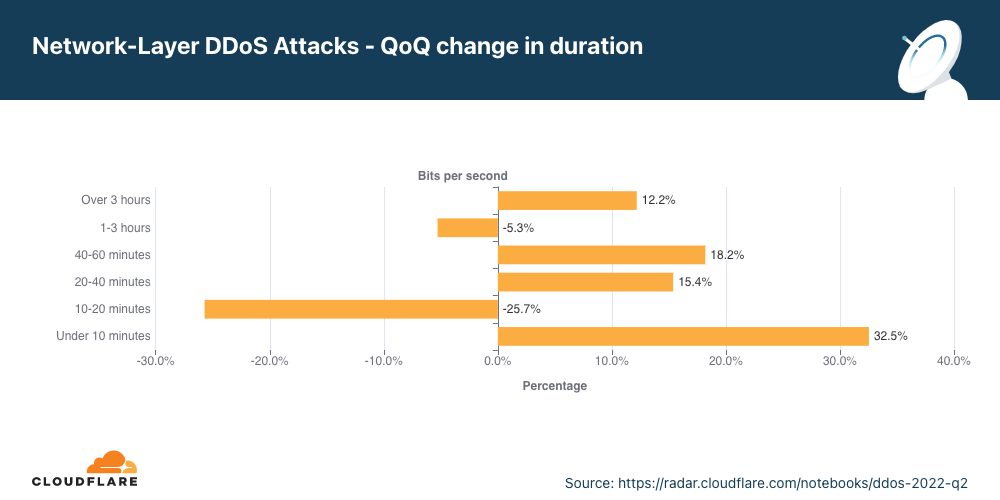
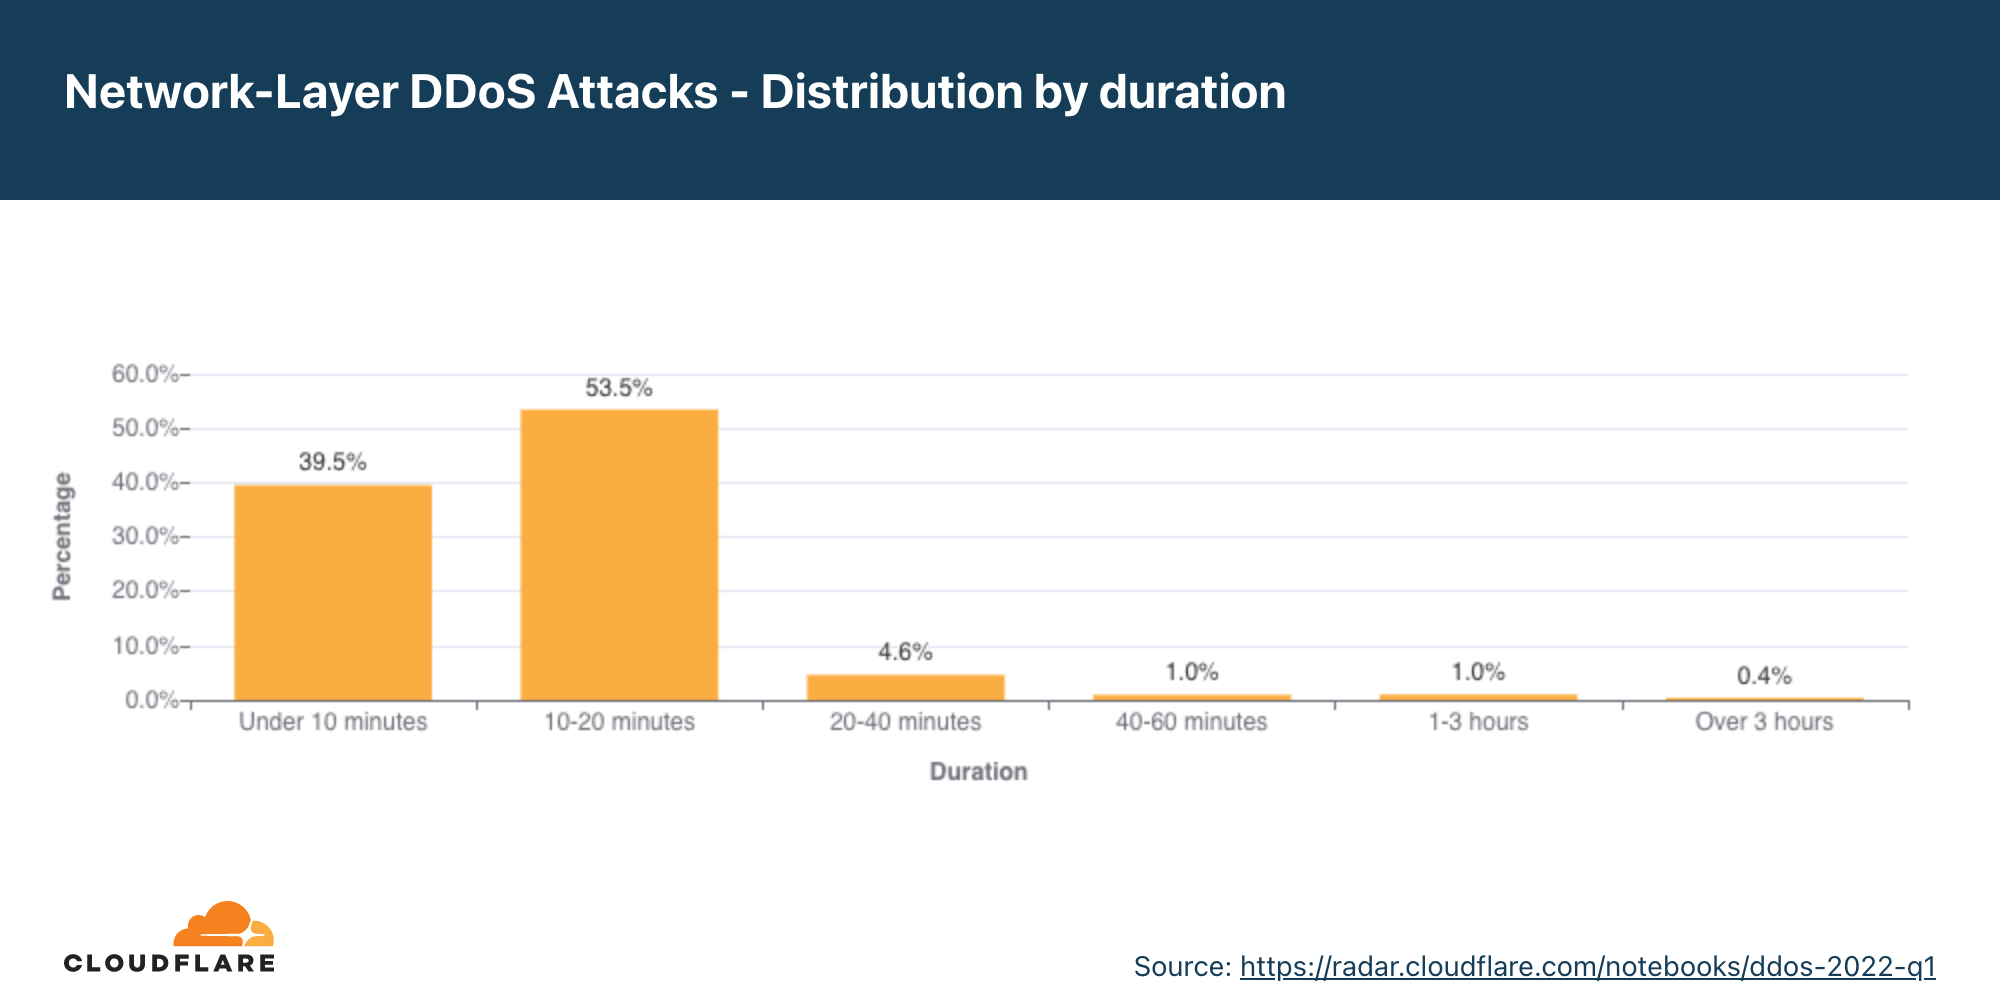
Network-layer DDoS attacks by duration
In Q2, attacks lasting over three hours increased by 9%.
We measure the duration of an attack by recording the difference between when it is first detected by our systems as an attack and the last packet we see with that attack signature towards that specific target.
In Q2, 52% of network-layer DDoS attacks lasted less than 10 minutes. Another 40% lasted 10-20 minutes. The remaining 8% include attacks ranging from 20 minutes to over three hours.
One important thing to keep in mind is that even if an attack lasts only a few minutes, if it is successful, the repercussions could last well beyond the initial attack duration. IT personnel responding to a successful attack may spend hours and even days restoring their services.
While most of the attacks are indeed short, we can see an increase of over 15% in attacks ranging between 20-60 minutes, and a 12% increase of attacks lasting more than three hours.
Short attacks can easily go undetected, especially burst attacks that, within seconds, bombard a target with a significant number of packets, bytes, or requests. In this case, DDoS protection services that rely on manual mitigation by security analysis have no chance in mitigating the attack in time. They can only learn from it in their post-attack analysis, then deploy a new rule that filters the attack fingerprint and hope to catch it next time. Similarly, using an “on-demand” service, where the security team will redirect traffic to a DDoS provider during the attack, is also inefficient because the attack will already be over before the traffic routes to the on-demand DDoS provider.
It’s recommended that companies use automated, always-on DDoS protection services that analyze traffic and apply real-time fingerprinting fast enough to block short-lived attacks.
Summary
Cloudflare’s mission is to help build a better Internet. A better Internet is one that is more secure, faster, and reliable for everyone — even in the face of DDoS attacks. As part of our mission, since 2017, we’ve been providing unmetered and unlimited DDoS protection for free to all of our customers. Over the years, it has become increasingly easier for attackers to launch DDoS attacks. But as easy as it has become, we want to make sure that it is even easier — and free — for organizations of all sizes to protect themselves against DDoS attacks of all types.
Not using Cloudflare yet? Start now with our Free and Pro plans to protect your websites, or contact us for comprehensive DDoS protection for your entire network using Magic Transit.
Cloudflare operates in more than 270 cities in over 100 countries, where we interconnect with over 10,000 network providers in order to provide a broad range of services to millions of customers. The breadth of both our network and our customer base provides us with a unique perspective on Internet resilience, enabling us to observe the impact of Internet disruptions. In many cases, these disruptions can be attributed to a physical event, while in other cases, they are due to an intentional government-directed shutdown. In this post, we review selected Internet disruptions observed by Cloudflare during the second quarter of 2022, supported by traffic graphs from Cloudflare Radar and other internal Cloudflare tools, and grouped by associated cause or common geography.
Optic outages
This quarter, we saw the usual complement of damage to both terrestrial and submarine fiber-optic cables, including one that impacted multiple countries across thousands of miles, and another more localized outage that was due to an errant rodent.
Comcast
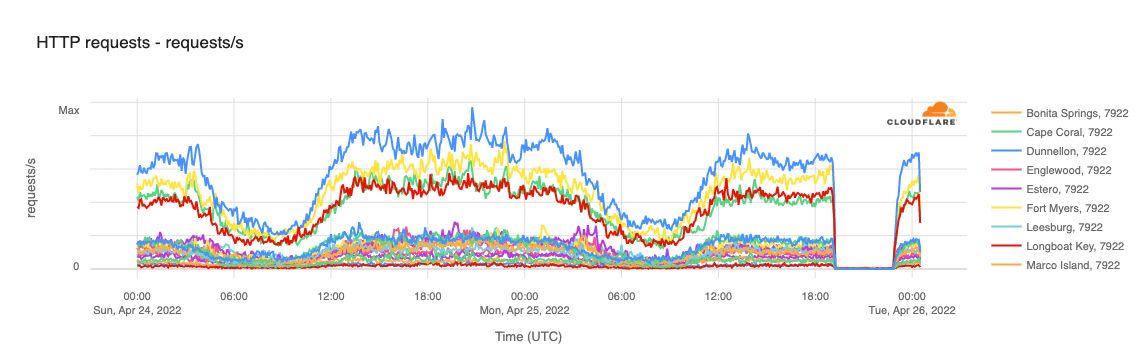
On April 25, Comcast subscribers in nearly 20 southwestern Florida cities experienced an outage, reportedly due to a fiber cut. The traffic impact of this cut is clearly visible in the graph below, with Cloudflare traffic for these cities dropping to zero between 1915–2050 UTC (1515–1850 local time).
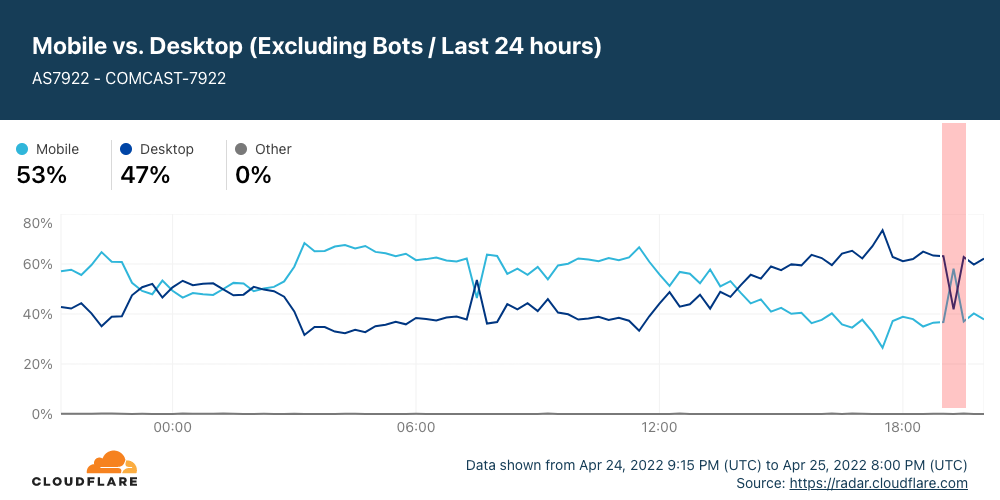
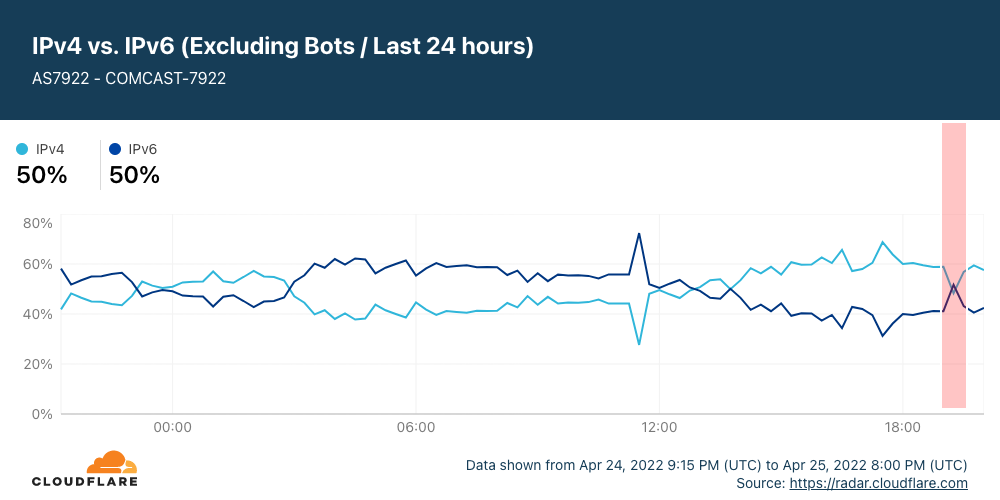
Not only did the fiber cut force a significant number of Comcast subscribers offline, but it also impacted the types of traffic observed across Comcast as a whole. The graphs below illustrate the mix of mobile vs desktop clients, as well as IPv4 vs. IPv6 request volume across AS7922, Comcast’s primary autonomous system. During the brief disruption period, the percentage of Comcast traffic from mobile devices increased, while desktop devices dropped, and the percentage of IPv4 traffic dropped, with a corresponding increase in IPv6 traffic share.
South Africa
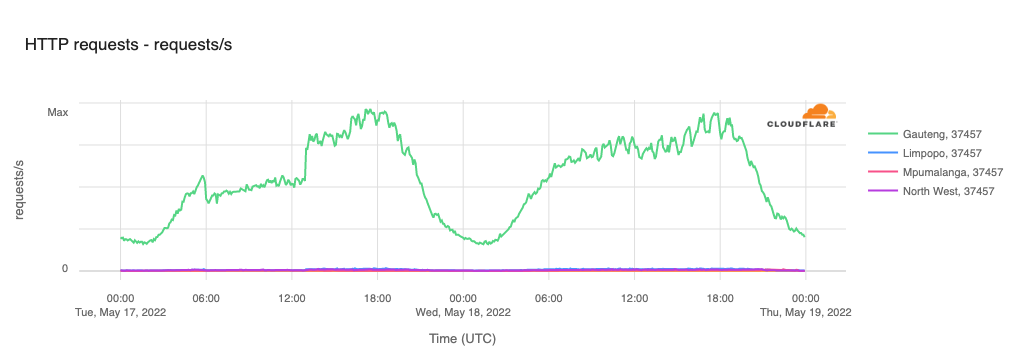
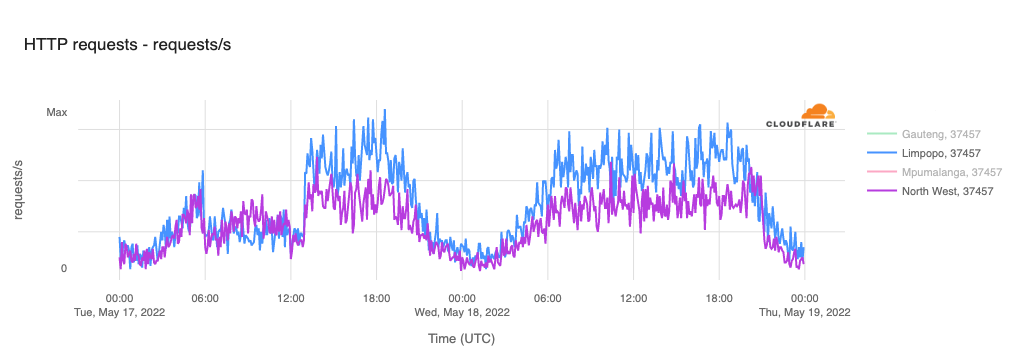
On the morning of May 17, Telkom SA, a South African telecommunications provider, tweeted an “important notice” to customers, noting that “Damage to a Fibre cable was detected on the Telkom network around 8:00am on Tuesday, 17 May 2022.” and outlining the impacted services and geographies. The graphs below show the impact to Cloudflare traffic from the Telkom autonomous system in three South African provinces. The top graph shows the impact to traffic in Gauteng, while the lower graph shows the impact in Limpopo and North West. Across all three, traffic falls at 0600 UTC (0800 local time), recovering around 1300 UTC (1500 local time). Telkom SA did not provide any additional information on where the fiber cut occurred or what caused it.
Venezuela
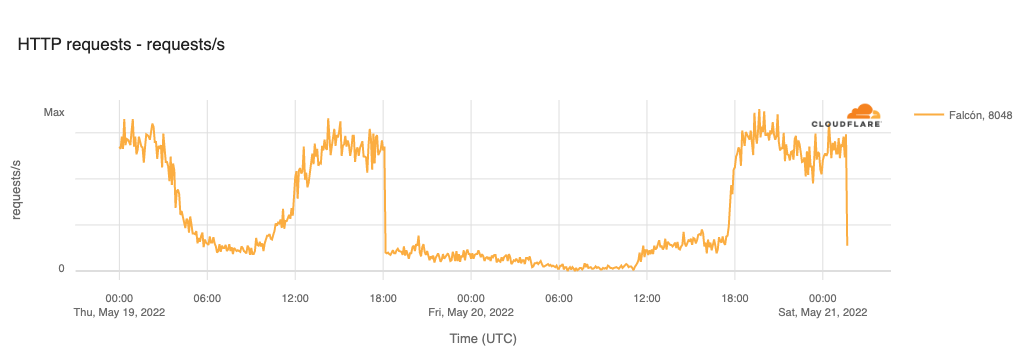
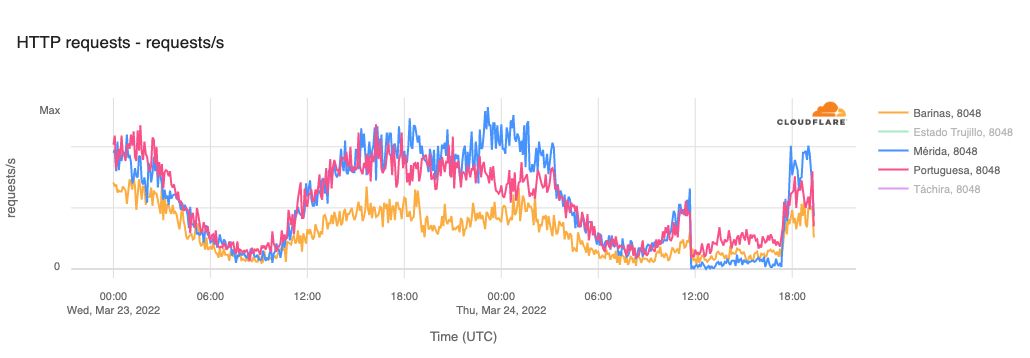
Although unconfirmed, a fiber cut was suspected to be the cause of an Internet disruption experienced by CANTV subscribers in Venezuela on May 19, the latest of several such incidents affecting that provider. Although the fiber cut reportedly impacted subscribers in multiple states, the most significant impact was measured in Falcón, as shown in the graph below. In this state, traffic dropped precipitously at 1800 UTC (1400 local time), finally recovering approximately 24 hours later.
AAE-1 & SMW-5
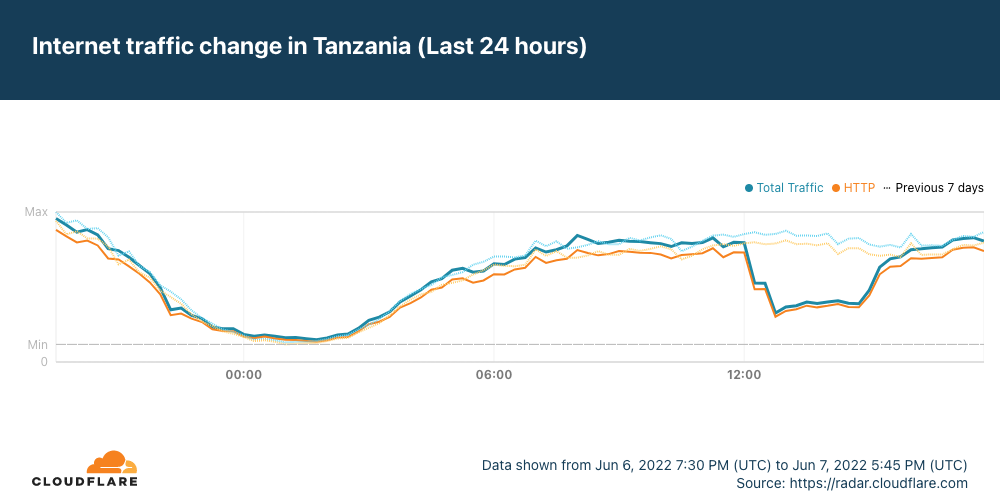
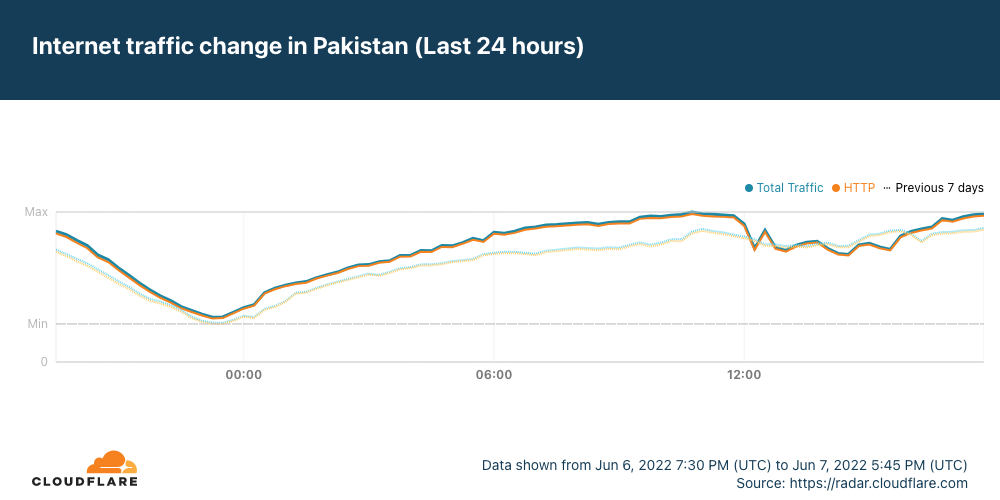
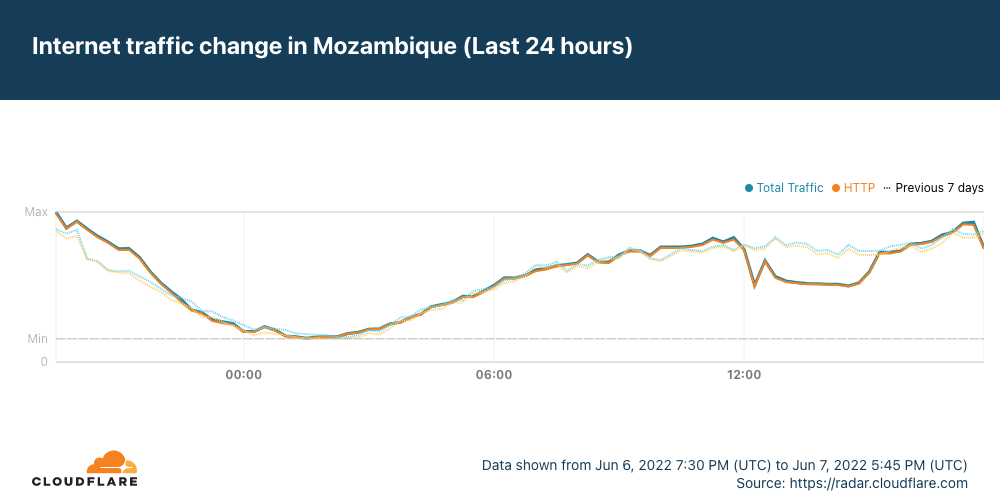
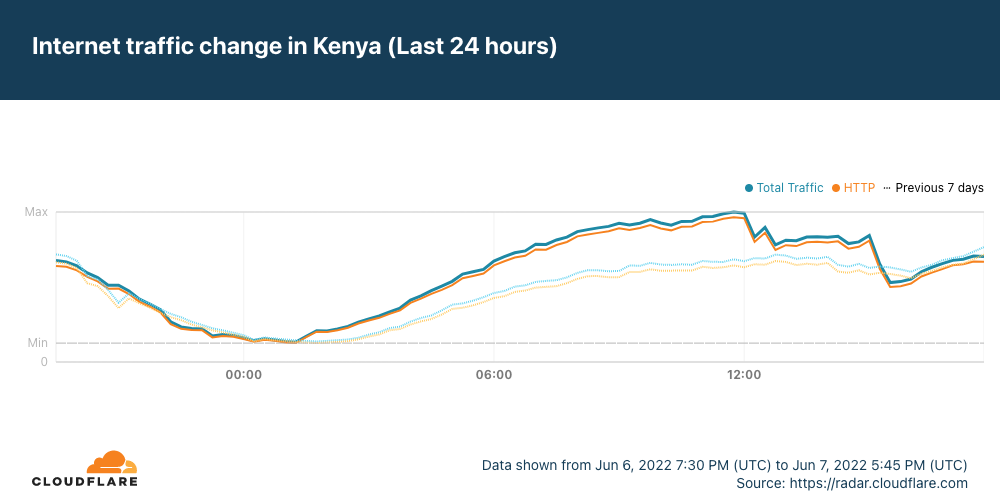
Just after 1200 UTC on Tuesday, June 7, the Africa-Asia-Europe-1 (AAE-1) and SEA-ME-WE-5 (SMW-5) submarine cables suffered cable cuts, impacting Internet connectivity for millions of Internet users across multiple countries in the Middle East and Africa, as well as thousands of miles away in Asia. Although specific details are sparse, the cable damage reportedly occurred in Egypt – both of the impacted cables land in Abu Talat and Zafarana, which also serve as landing points for a number of other submarine cables.
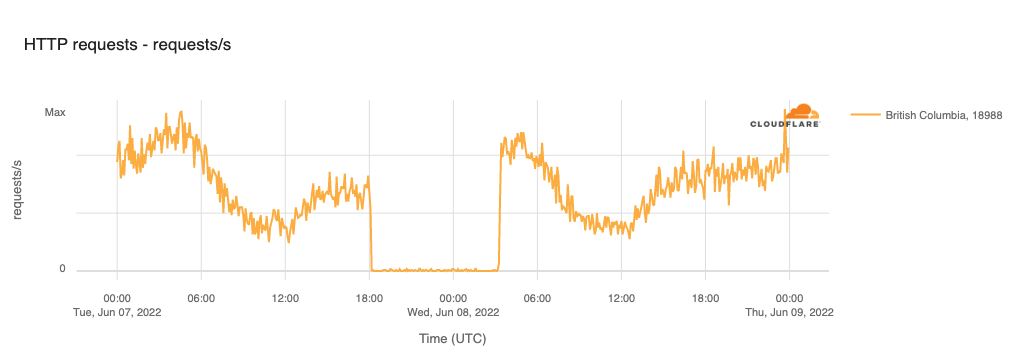
Finally, on June 13, a beaver was responsible for an outage that impacted Internet users in British Columbia, Canada. According to a published report, a beaver gnawed its way through a tree, causing it to fall on both power lines and a Telus fiber optic cable. The damage to the fiber optic cable affected connectivity customers in over a dozen communities across British Columbia, including those using CityWest (AS18988), a utility company that uses the Telus cable. In the graph below, the impact of the damage to the fiber optic cable is clearly visible, with no traffic to Cloudflare from CityWest subscribers in British Columbia between 1800 UTC on June 7 until 0310 UTC on June 8 (1100–2010 local time).
School’s in, Internet’s out
Nationwide Internet shutdowns have, unfortunately, become a popular approach taken by authoritarian regimes over the past half dozen years to prevent cheating on secondary school exams. It is not clear that this heavy-handed tactic is actually effective in preventing cheating, but the associated damage to the national economies has been estimated to be in the tens to hundreds of millions of US dollars, depending on the duration and frequency of the shutdowns.
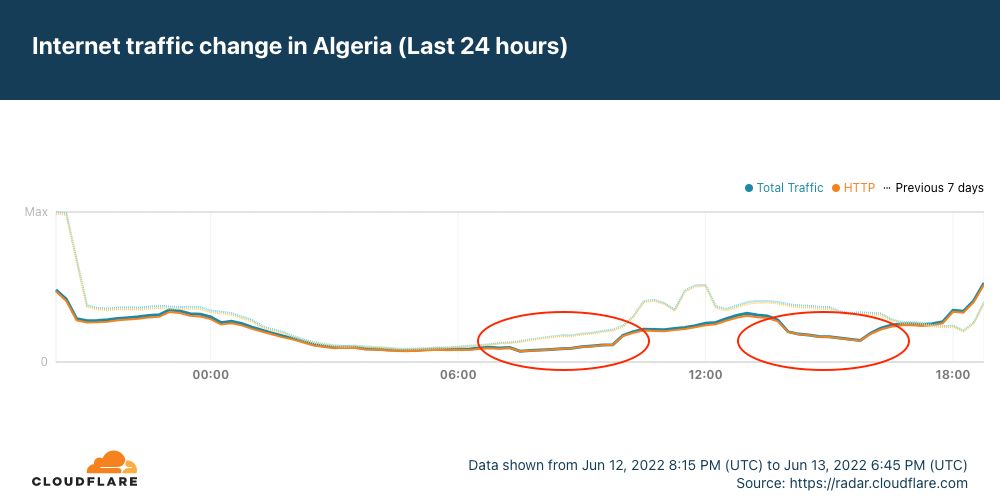
This year, governments in Sudan and Syria implemented a number of multi-hour shutdowns in late May into June, while Algeria’s government appears to have resorted to more targeted content blocking. Additional details on these Internet disruptions can be found in the recent “Exam time means Internet disruptions in Syria, Sudan and Algeria” blog post.
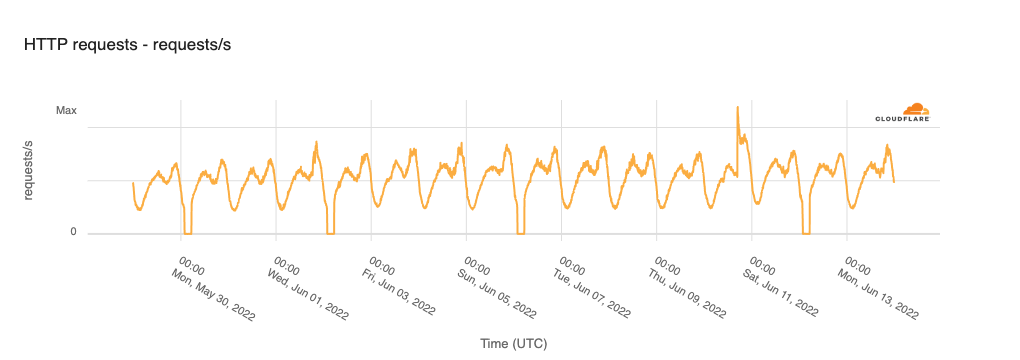
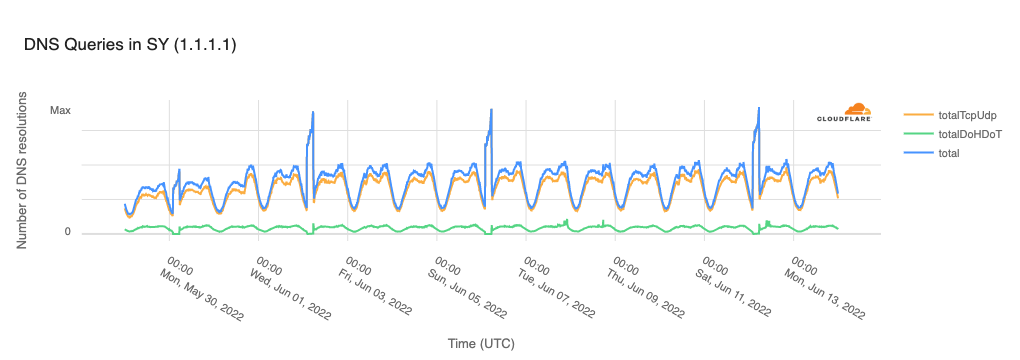
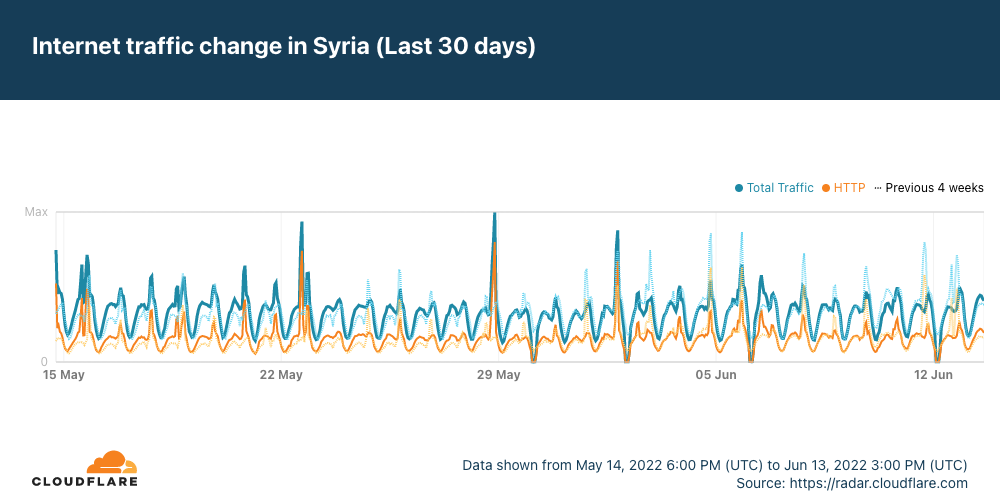
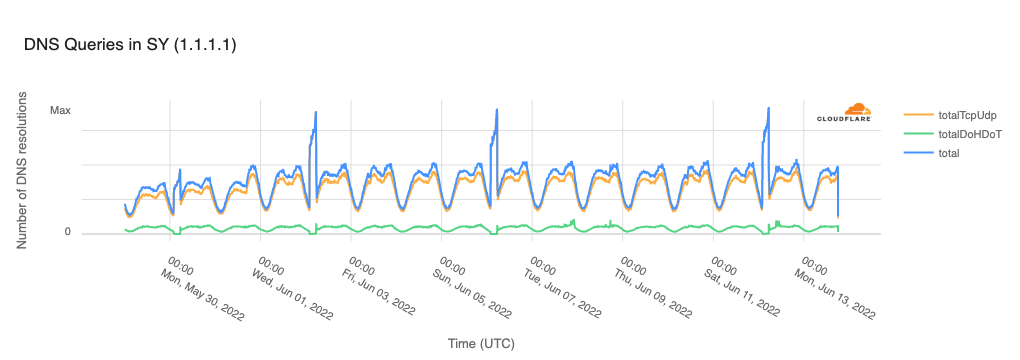
Starting on May 30, Syria implemented the first of four nationwide Internet shutdowns, the last of which occurred on June 12, as seen in the graph below. Interestingly, we have observed that these shutdowns tend to be “asymmetric” in nature — that is, inbound traffic (into the country) is disabled, but egress traffic (from the country) remains. One effect of this is visible as spikes in the DNS graph below. During three of the four shutdowns, requests to Cloudflare’s 1.1.1.1 resolver from clients in Syria increased because DNS queries were able to exit the country, but responses couldn’t return, leading to retry floods.
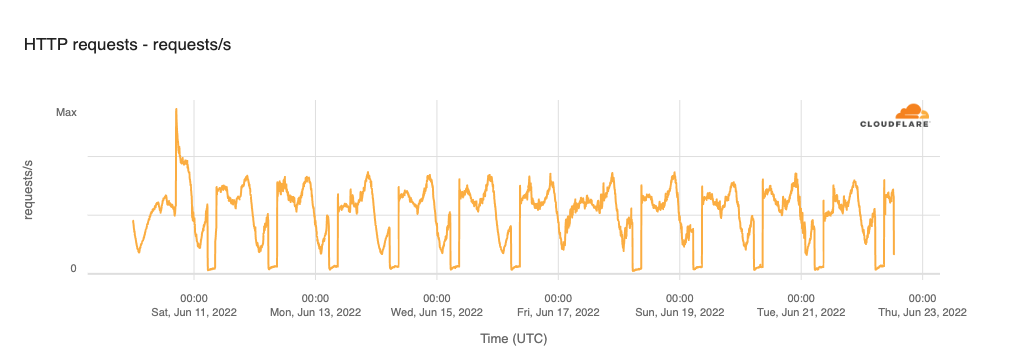
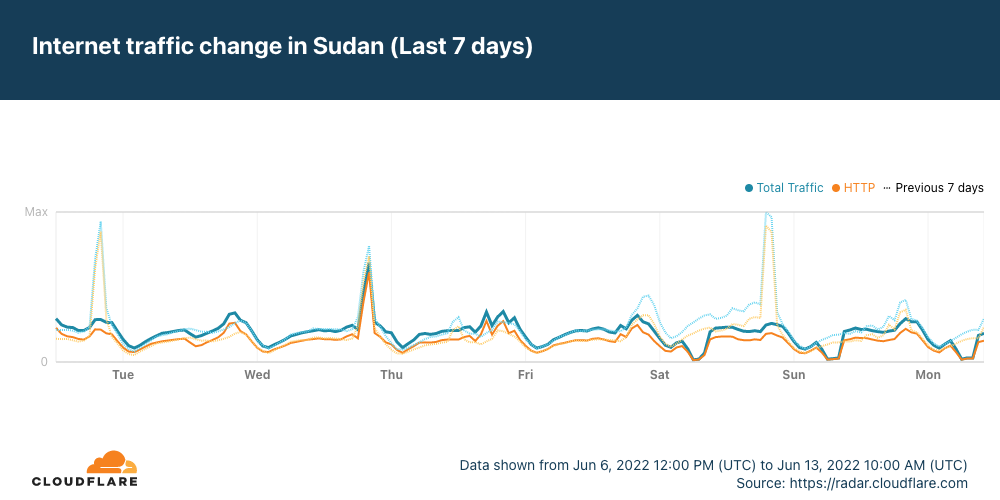
In Sudan, daily shutdowns were implemented 0530-0830 UTC (0730–1030 local time) between June 11 and June 22, except for June 17. (It isn’t clear why that date was skipped.) The graph below shows that these shutdowns were nationwide, but not complete, as traffic from the country did not drop to zero.
In Algeria, exams took place June 12 through June 16. In the past, the country has implemented nationwide shutdowns, but after recognizing the enormous cost to the economy, the government has apparently chosen an alternate tactic this year. The graph below shows nominal drops in country-level traffic during the two times each day that the exams took place—0730–1000 UTC (0830–1100 am local time) and 1330–1600 UTC (1430–1700 local time). These drops in traffic are likely more indicative of a content-blocking approach, instead of a broad Internet shutdown.
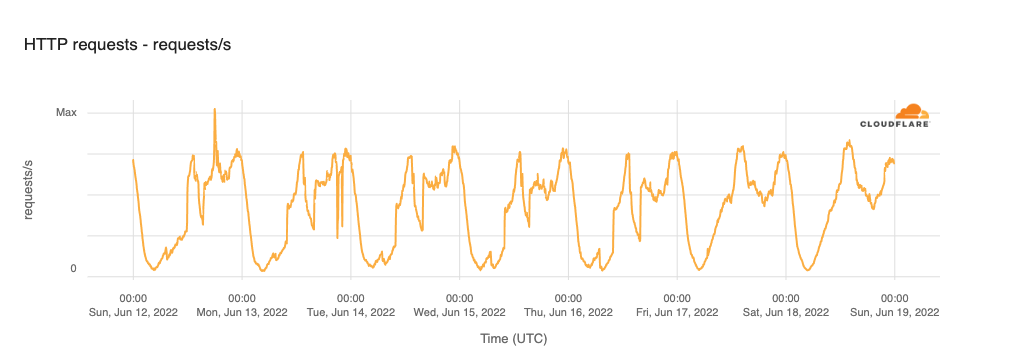
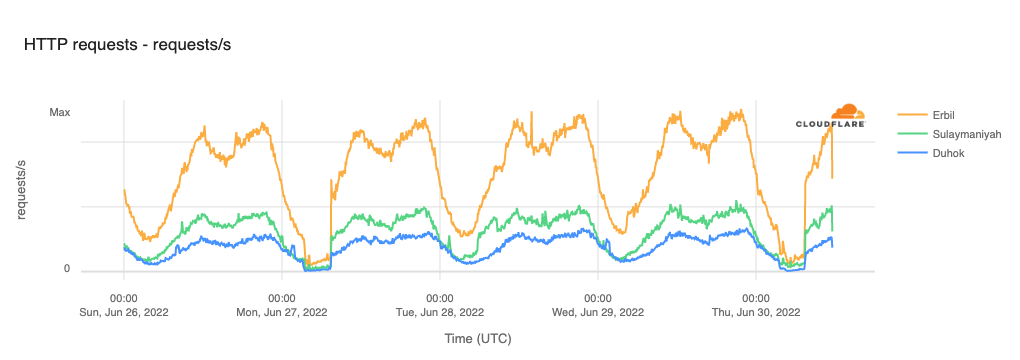
On June 27, the Kurdistan Regional Government in Iraq began to implement twice-weekly (Mondays and Thursday) multi-hour regional Internet shutdowns, expected to last for a four-week period. The shutdowns are intended to prevent cheating on high school final exams, according to a published report, and are scheduled for 0630–1030 am local time (0330–0730 UTC). The graph below shows the impact to traffic from three governorates in Kurdistan, with traffic dropping to near zero in all three areas during the duration of the shutdowns.
Government-guided
In addition to shutting down the Internet to prevent cheating on exams, governments have also been known to use shutdowns as a tool to limit or control communication around elections, rallies, protests, etc. During the second quarter, we observed several such shutdowns of note.
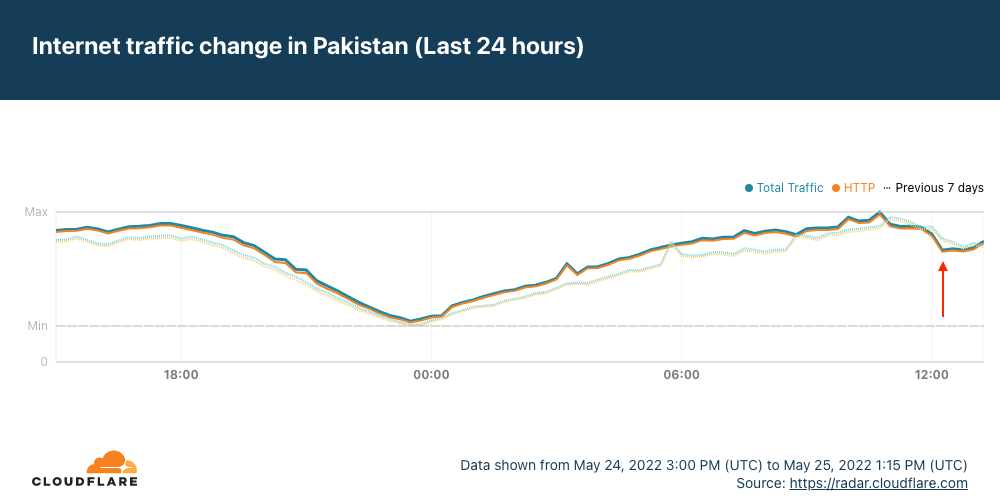
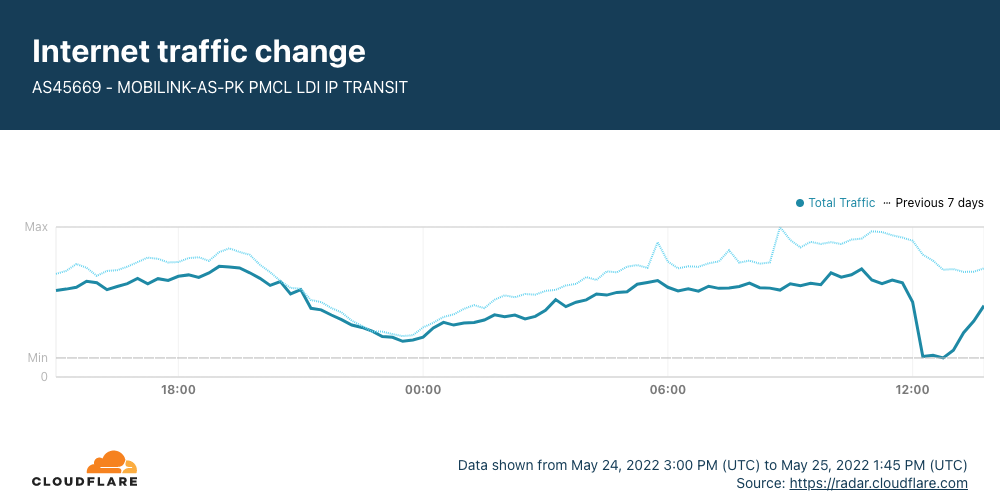
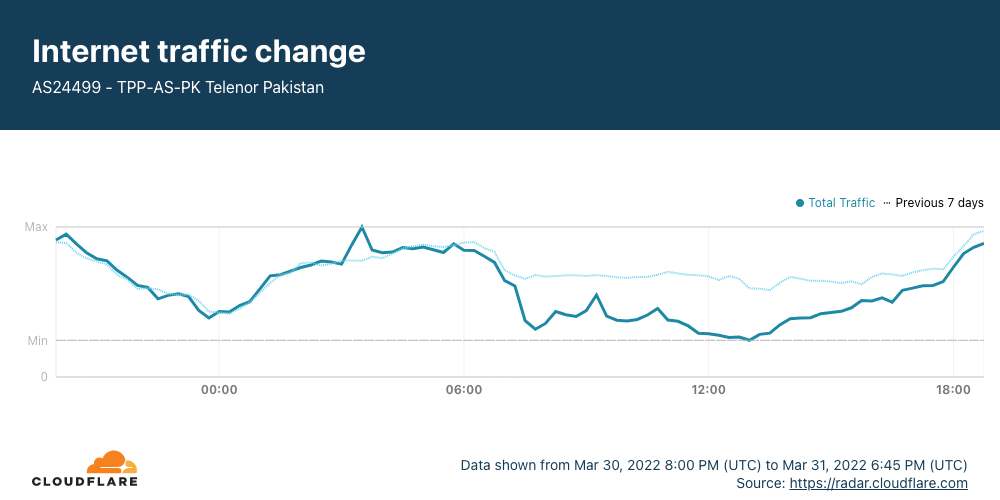
A month and a half later, on May 25, an Internet disruption was observed in Pakistan amid protests led by the country’s former Prime Minister. The disruption lasted only two hours, and was limited in scope — it was not a nationwide shutdown. (Telecom providers claimed that it was due to problems with a web filtering system.) At a national level, the impact of the disruption is visible as a slight drop in traffic.
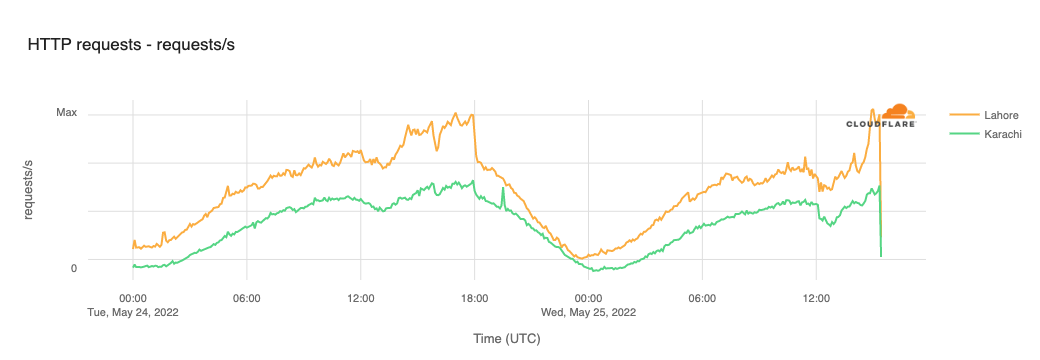
In the cities of Lahore and Karachi, the disruption is visible a little more clearly, as is the rapid recovery in traffic.
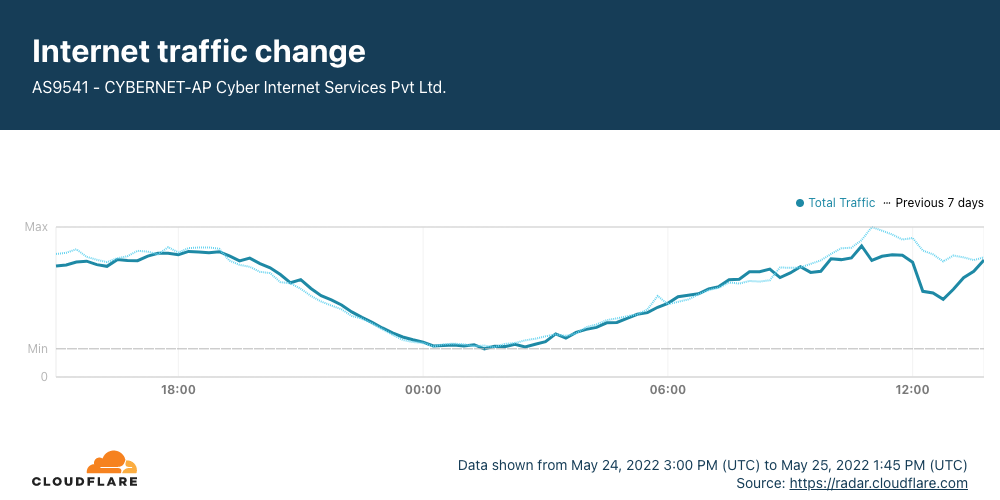
The impact of the disruption is most evident at a network level, as seen in the graphs below. Cyber Internet Services (AS9541) saw a modest drop in traffic, while Mobilink (AS45669) experienced a near complete outage.
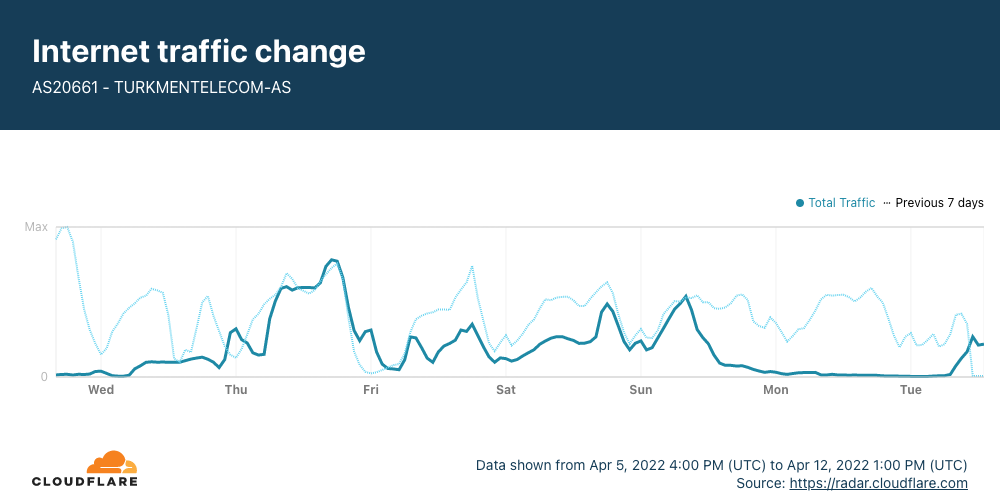
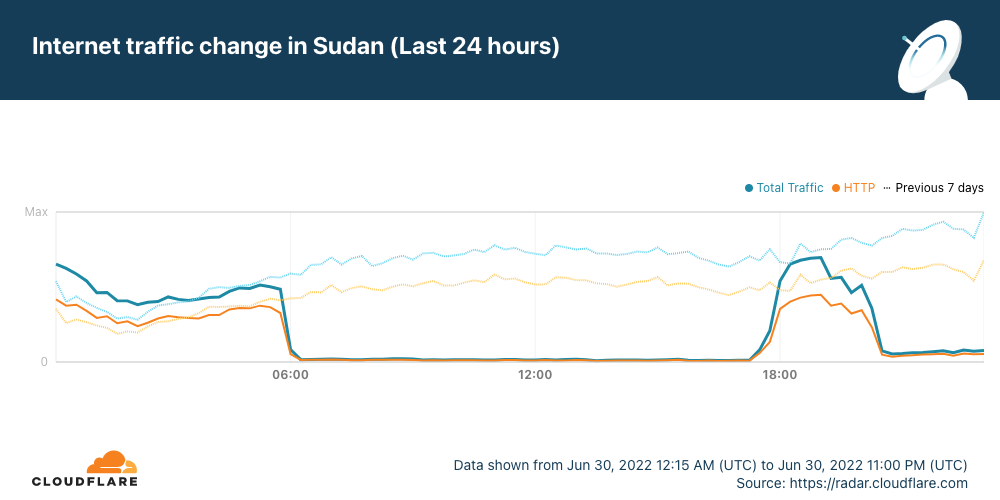
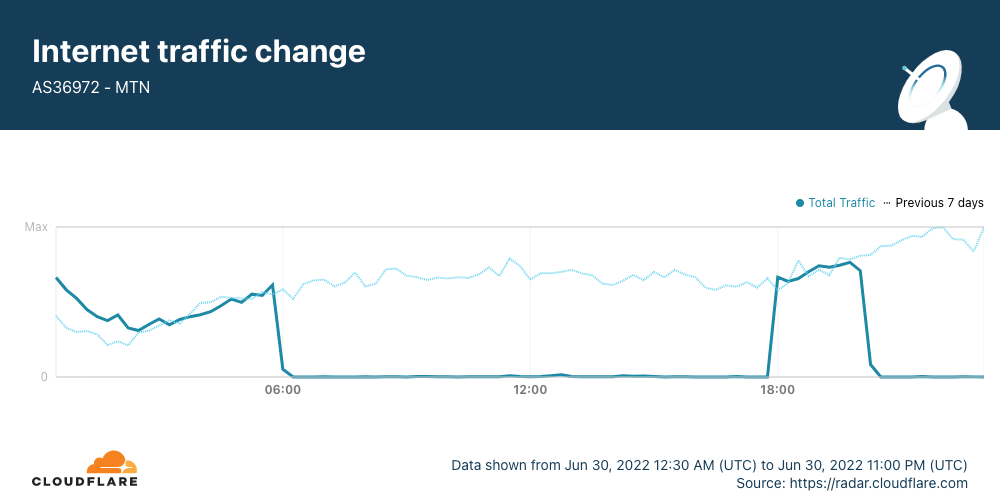
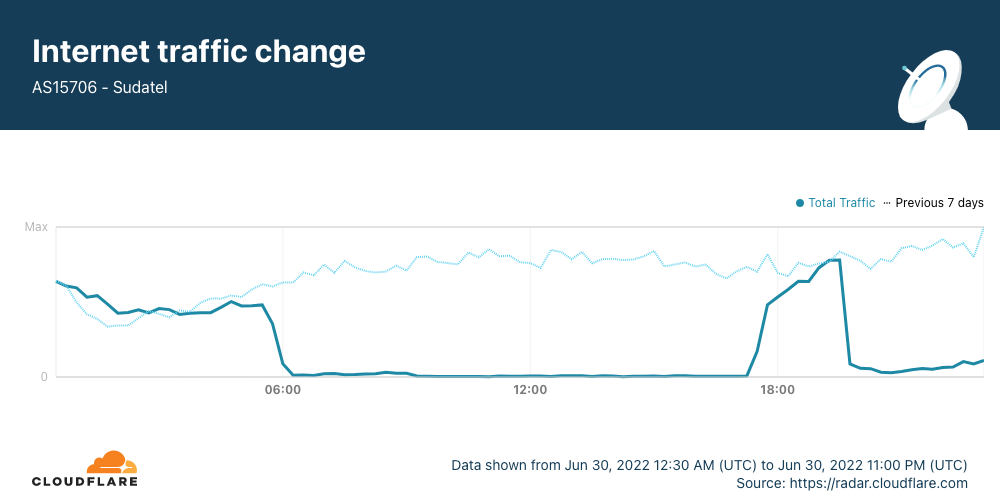
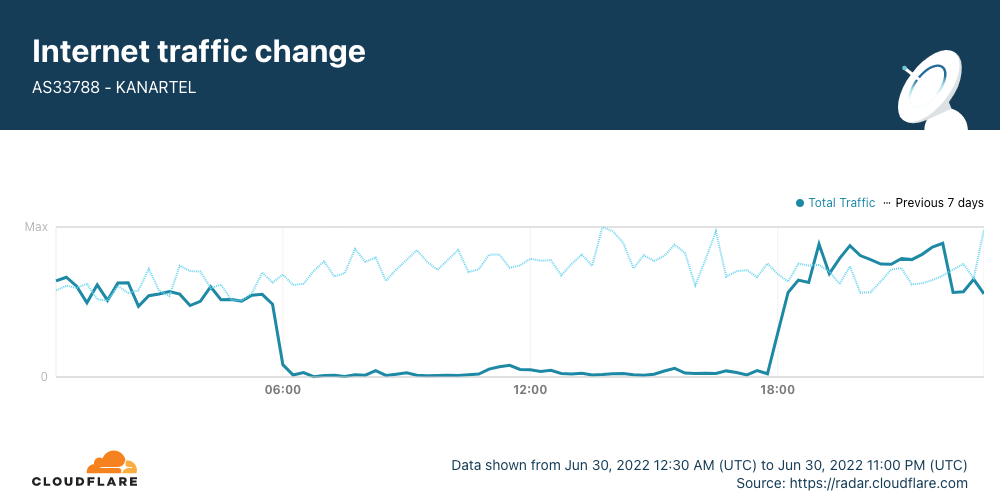
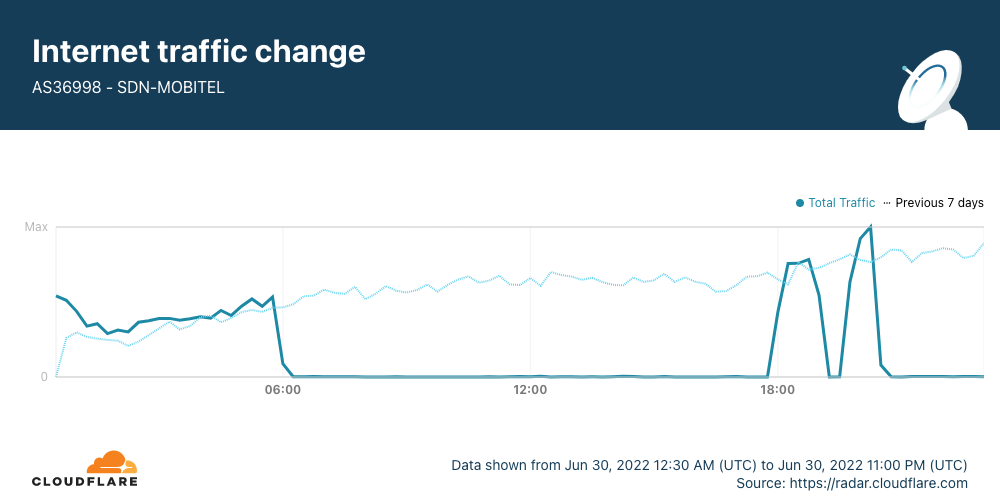
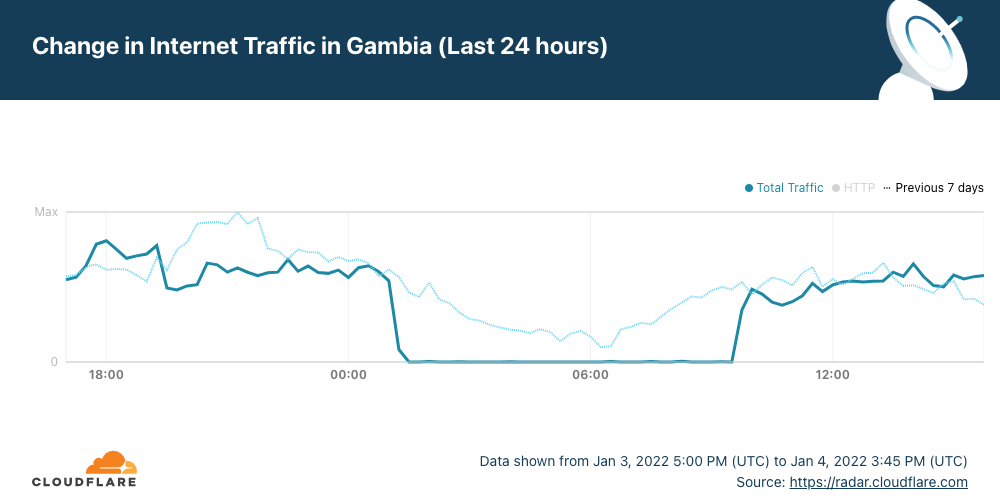
Closing out the quarter, a communications blackout, including an Internet shutdown, was imposed in Sudan on June 30 as protestors staged rallies against the country’s military leadership. This shutdown follows similar disruptions seen in October 2021 after the military toppled the transitional government and attempted to limit protests, as well the shutdowns seen earlier in June as the government attempted to prevent cheating on exams. The graphs below show that the shutdown started at 0600 UTC (0800 local time) and initially ended almost 12 hours later at 1740 UTC (1940 local time). Connectivity returned for approximately three hours, with traffic again dropping to near-zero levels again around 2040 UTC (2240 local time). This second outage remained active at the end of the day.
In addition to fiber/cable cuts, as discussed above, problems with other infrastructure, whether due to fires, electrical issues, or maintenance, can also disrupt Internet services.
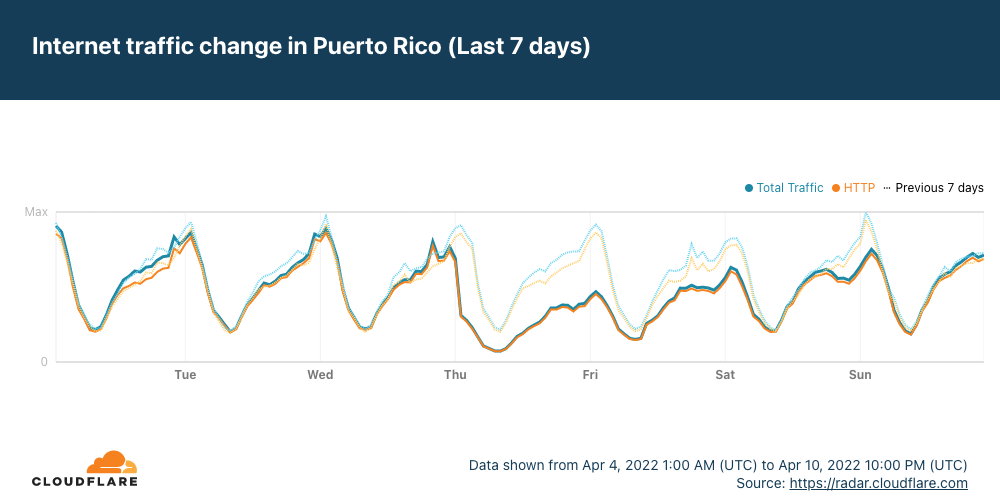
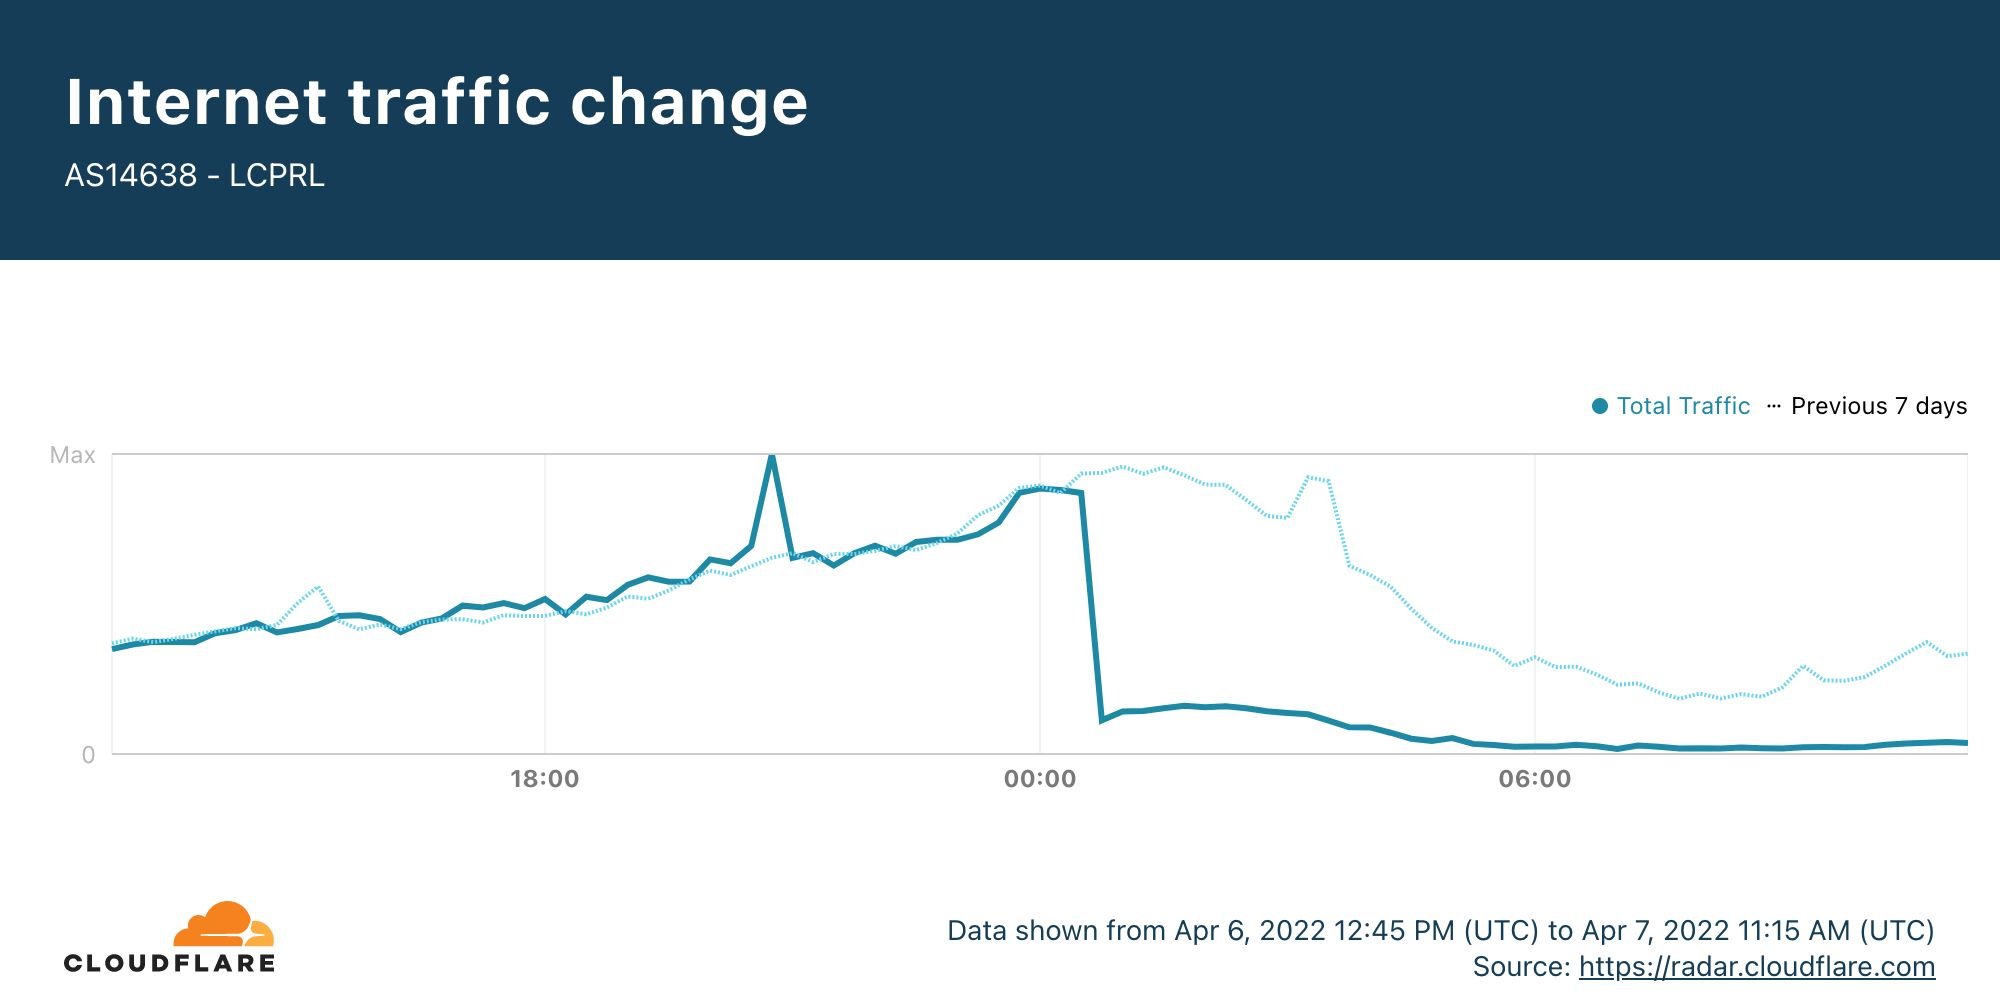
Around 2030 local time on April 6 (0030 UTC on April 7), a fire erupted at the Costa Sur generation plant, one of the largest power plants in Puerto Rico, resulting in a widespread power outage across the island territory. This island-wide outage caused a significant interruption to Internet services, clearly visible in Cloudflare traffic data. The graph below shows that as the power failed, traffic from Puerto Rico immediately fell by more than half. The regular diurnal pattern remained in place, albeit at lower levels, over the next three days, with traffic returning to “normal levels” three days later. By April 10, Luma Energy reported that it had restored electrical power to 99.7% of its 1.5M customers.
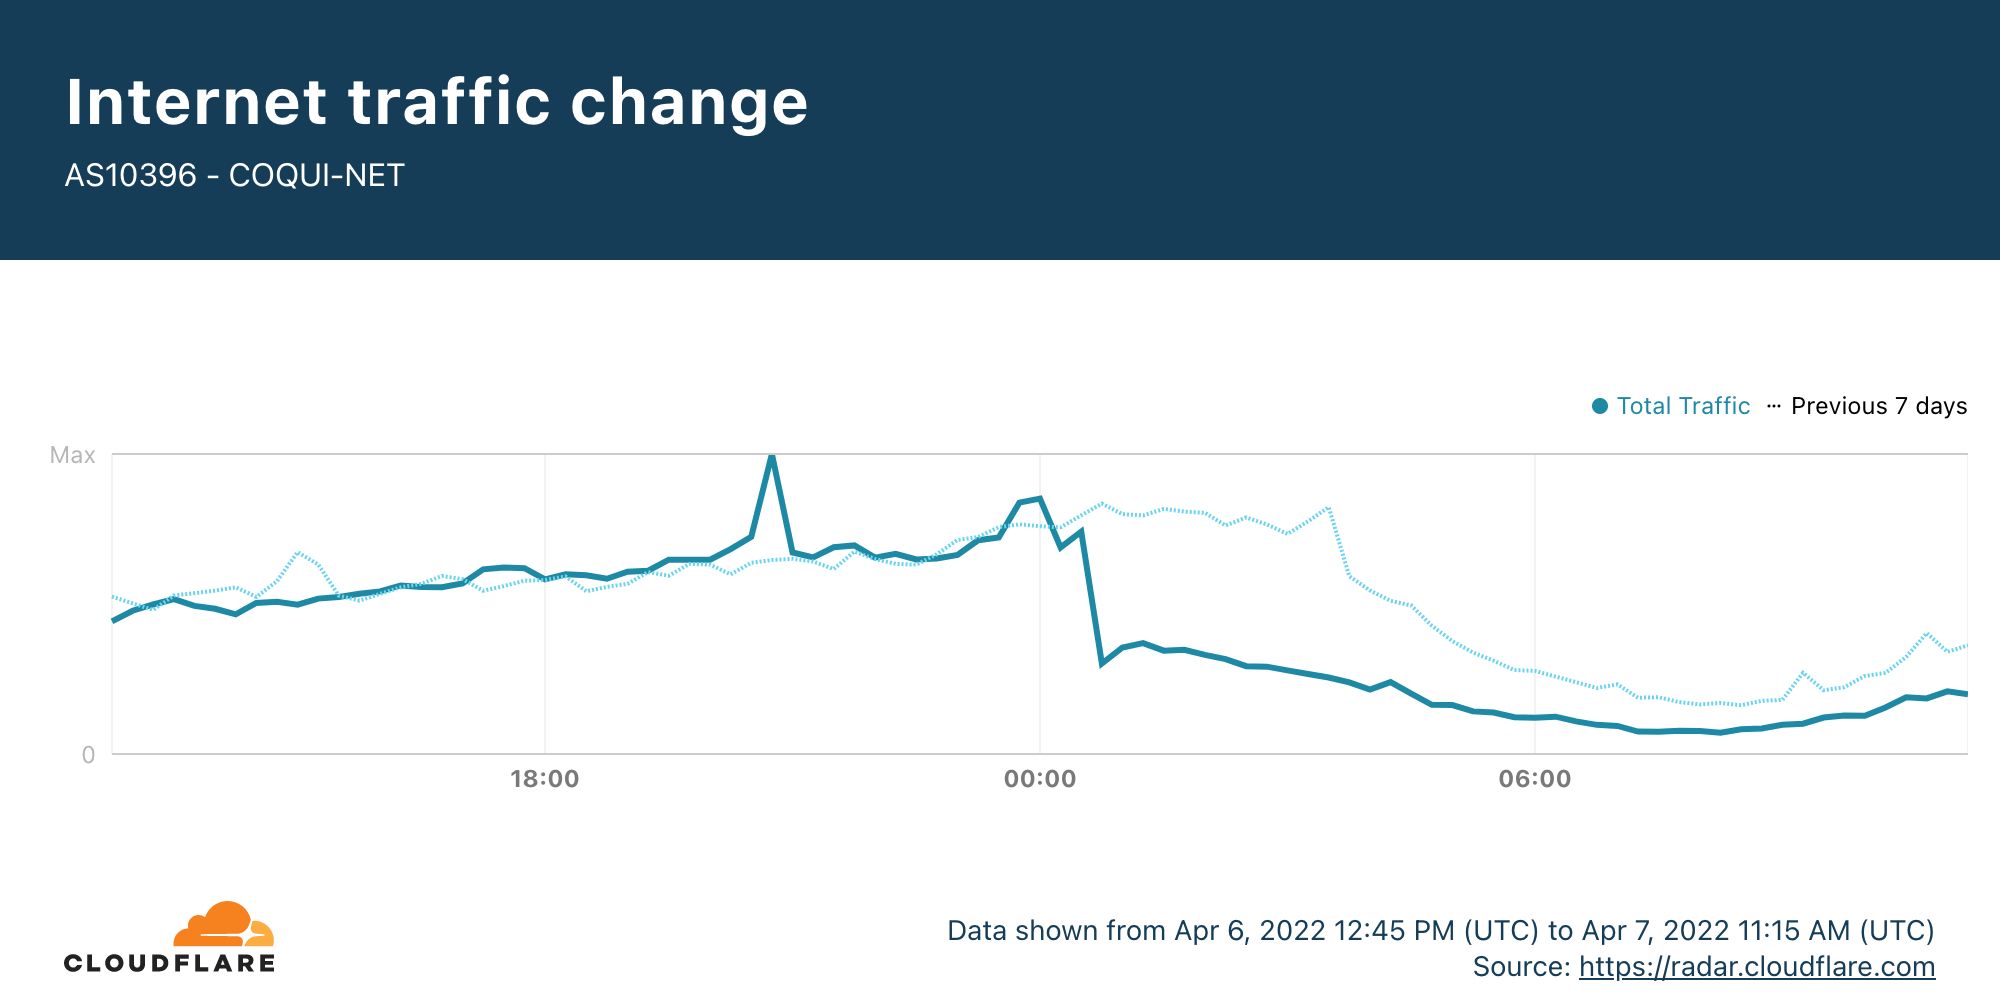
The impact of the Internet service disruption is also fairly significant when viewed at a network level. The graphs below show traffic for Datacom Caribe/Claro (AS10396) and Liberty Cablevision of Puerto Rico (AS14638). At Datacom Caribe/Claro, traffic immediately fell by more than half, while Liberty Cablevision traffic declined approximately 85%.
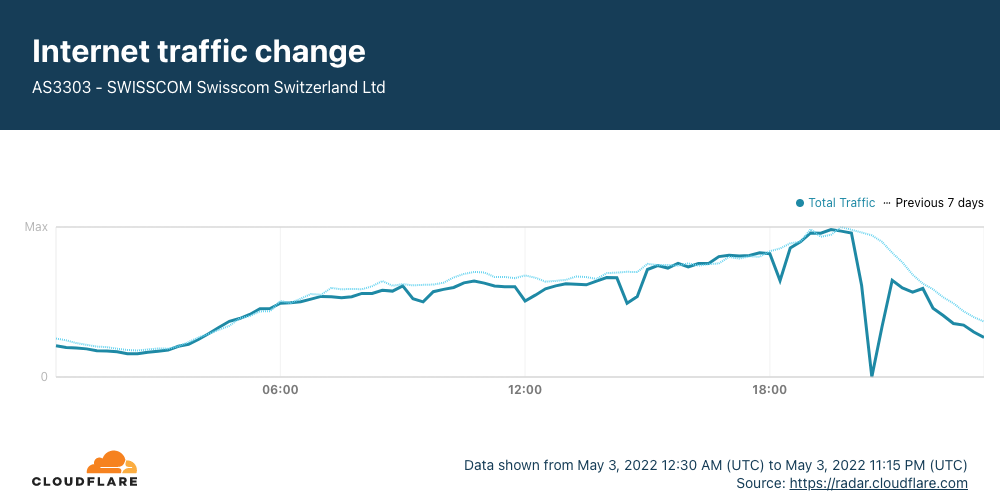
On the evening of May 3, Swiss telecom provider Swisscom tweeted that there had been an interruption to Internet service following maintenance work. A published report noted that the interruption occurred between 2223–2253 local time (2023–2053 UTC), and the graph below shows a complete loss of traffic, but quick recovery, during that 30-minute window. Beyond citing maintenance work, Swisscom did not provide any additional details about the Internet disruption.
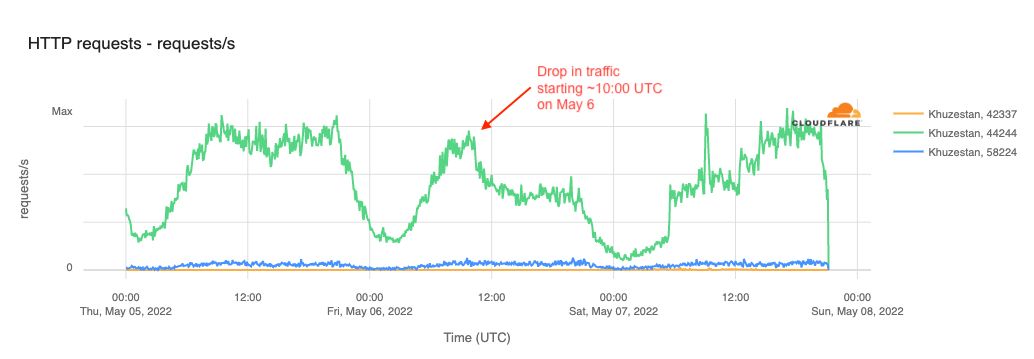
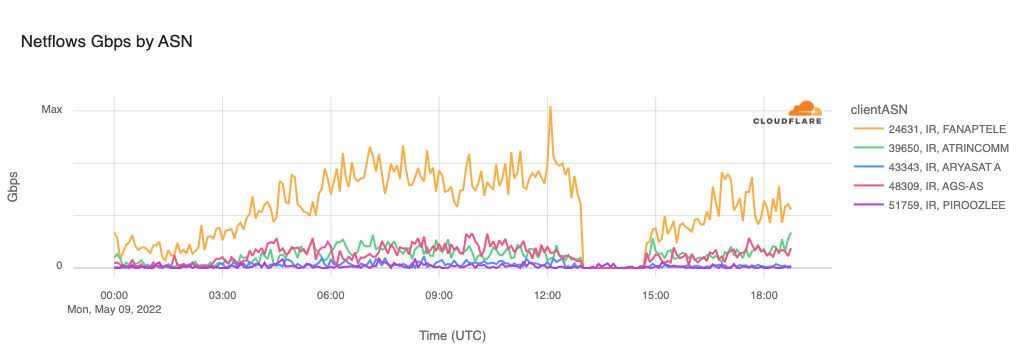
On May 6, the government disrupted Internet connectivity in Khuzestan province, reportedly in response to mass protests around shortages of bread and water. It was reported that mobile data had been cut off locally, and that fixed connectivity speeds were significantly reduced. To this end, we observed a drop in traffic for Irancell (AS44244) (a mobile network provider) in Khuzestan starting around 1000 UTC as seen in the graph below.
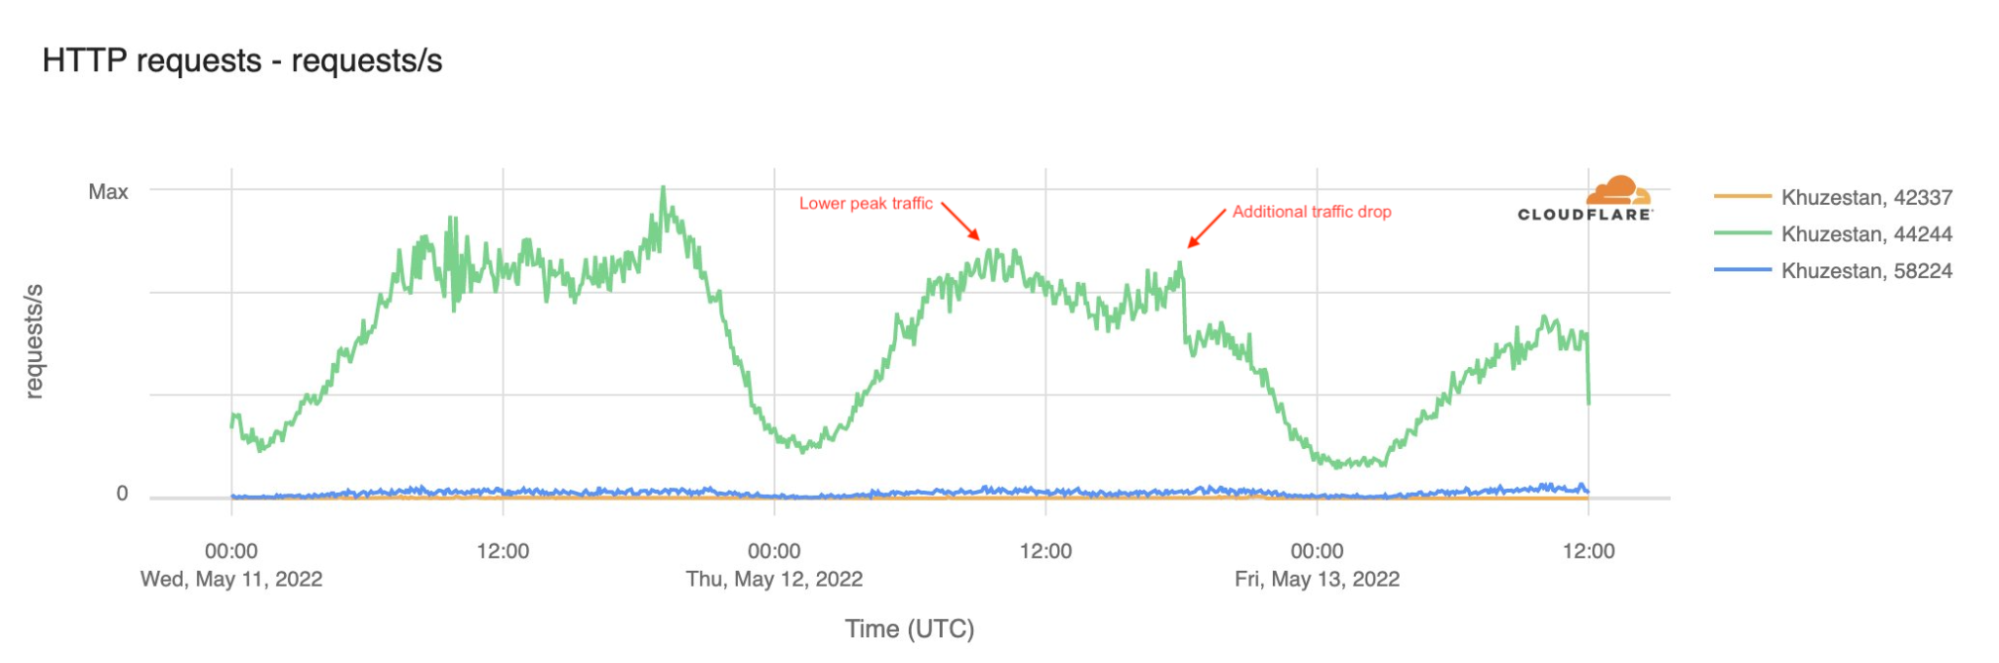
A similar disruption affecting Irancell, occurring amid reports of ongoing protests in the country, was observed on May 12, with lower peak traffic during the day, and a further drop around 1800 UTC.
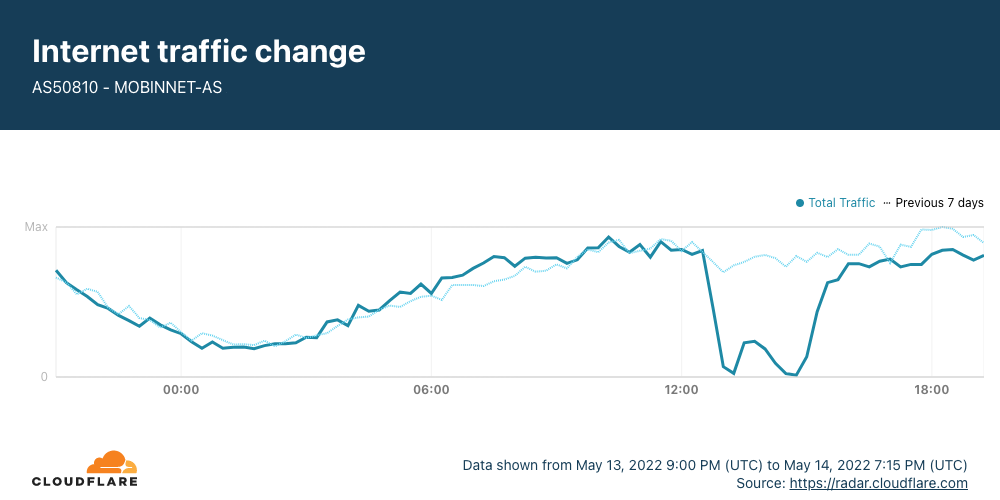
Mobile provider Mobinnet (AS50810) experienced a multi-hour Internet disruption on May 14, lasting from 1230–1530 UTC (1700–2000 local time). According to a tweet from Mobinnet, the disruption was due to a “widespread cyber attack of foreign origin”.
Ukraine
Now more than four months into the war in Ukraine, the Internet continues to be an active battlefield, with ongoing Internet outages in multiple cities and across multiple networks. However, we want to highlight here two similar events observed during the second quarter.
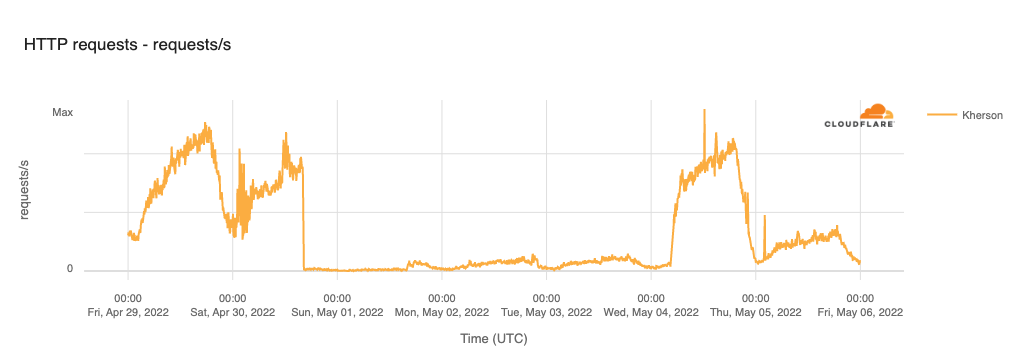
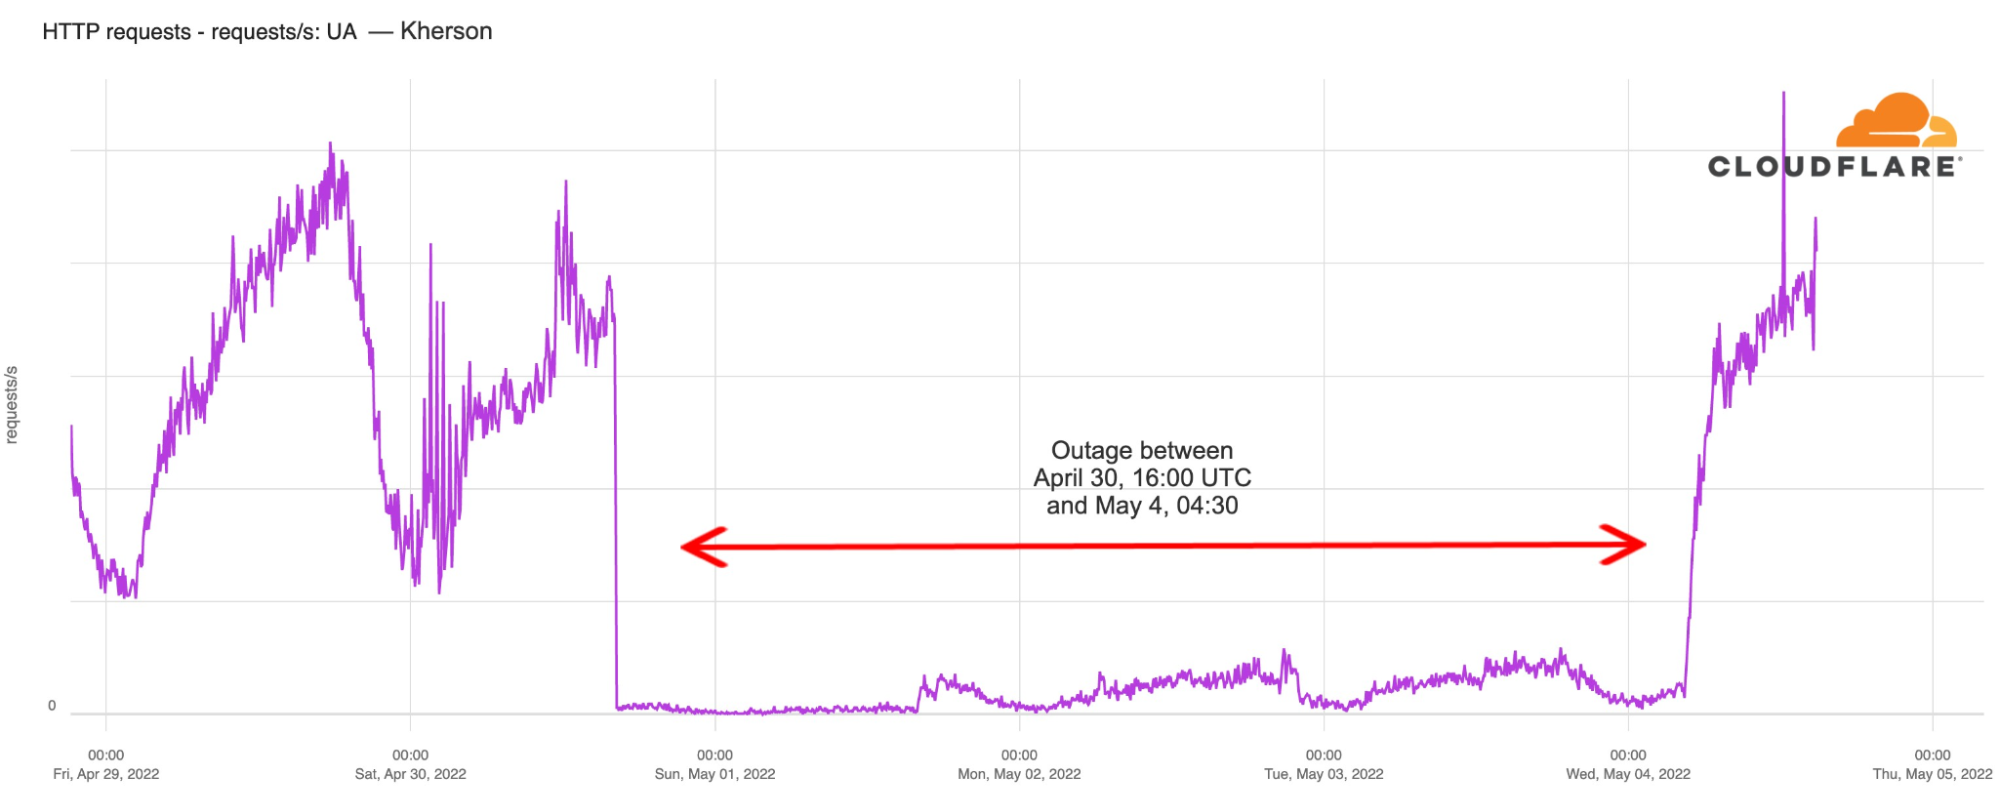
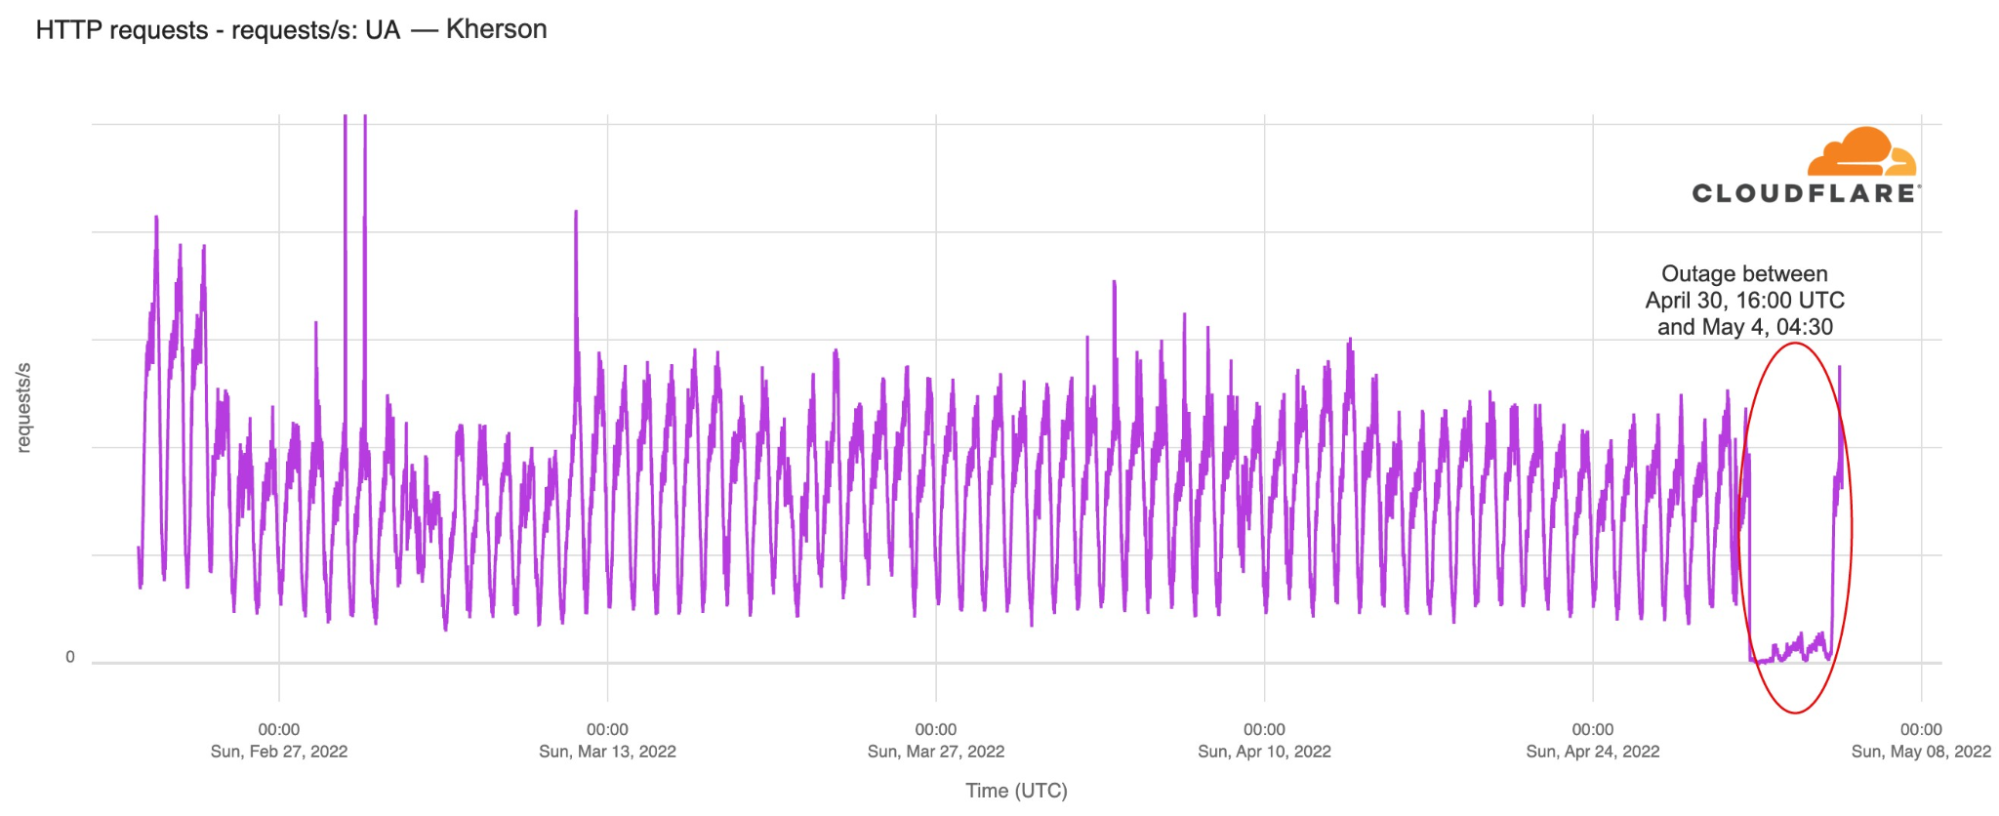
The Russian-occupied city of Kherson experienced a near-complete Internet outage between 1600 UTC (1900 local time) on April 30 and 0430 UTC (0730 local time) on May 4. According to social media posts from Ukraine’s vice Prime-Minister Mykhailo Fedorov and the State Service of Special Communications and Information Protection, the outage was caused by “interruptions of fiber-optic trunk lines and disconnection from the power supply of equipment of operators in the region”. The graph below shows effectively no traffic for Kherson for approximately 24 hours after the disruption began, followed by a nominal amount of traffic for the next several days.
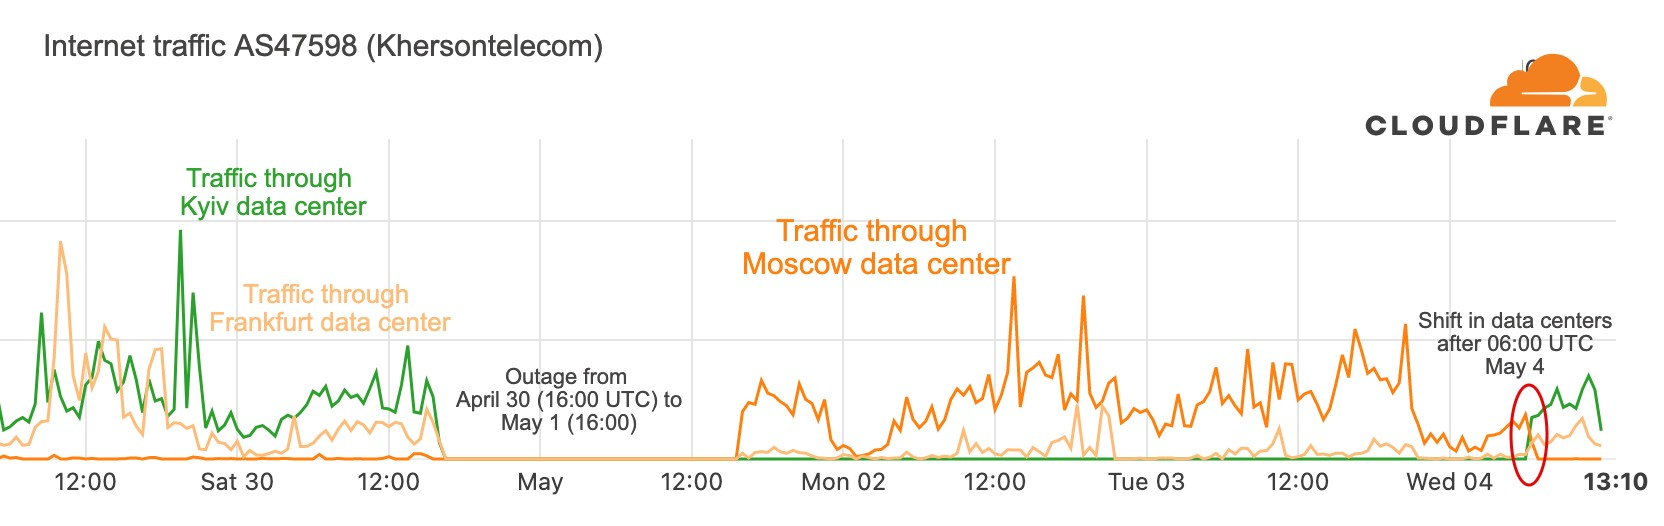
Around the time that the nominal amount of traffic returned, we also observed a shift in routing for an IPv4 prefix announced by AS47598 (Khersontelecom). As shown in the table below, prior to the outage, it reached the Internet through several other Ukrainian network providers, including AS12883, AS3326, and AS35213. However, as traffic returned, its routing path now showed a Russian network, AS201776 (Miranda) as the upstream provider. The path through Miranda also includes AS12389 (Rostelecom), which bills itself as “the largest digital services provider in Russia”.
Peer AS
Last Update
AS Path
AS1299 (TWELVE99 Arelion, fka Telia Carrier)
5/1/2022 16:02:26
1299 12389 201776 47598
AS6777 (AMS-IX-RS)
4/28/2022 11:23:33
12883 47598
As the disruption ended on May 4, we observed updates to Khersontelecom’s routing path that enabled it to return to reaching the global Internet through non-Russian upstream providers.
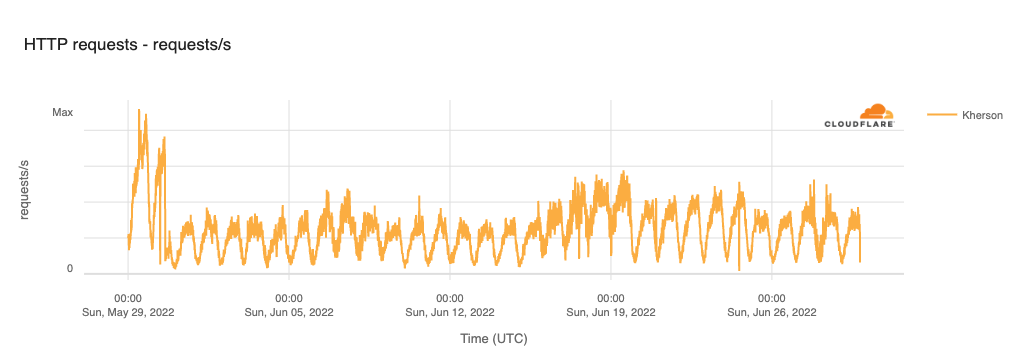
A month later, on May 30, we again observed a significant Internet disruption in Kherson starting at 1435 UTC (1735 local time). And once again, we observed updated routing for Khersontelecom, as it shifted from Ukrainian upstream providers to Russian ones. As of the end of June, the Internet disruption in Kherson and the routing through Russian upstream providers both remain firmly in place, although the loss of traffic has not been nearly as significant as the April/May disruption.
Peer AS
Last Update
AS Path
AS4775 (Globe Telecoms)
5/30/2022 13:56:22
4775 1273 12389 201776 47598
AS9002 (RETN-AS)
5/30/2022 09:58:16
9002 3326 47598
Conclusion
This post is by no means an exhaustive review of the Internet outages, shutdowns, and disruptions that have occurred throughout the second quarter. Some were extremely brief or limited in scope, while others were observed but had no known or publicly conjectured underlying cause. Having said that, it is important to bring increased visibility to these events so that the community can share information on what is happening, why it happened, and what the impact was — human, financial, or otherwise.
Follow @CloudflareRadar on Twitter for updates on Internet disruptions as they occur, and find up-to-date information on Internet trends using Cloudflare Radar.
Here’s a short list of recent technical blog posts to give you something to read today.
Internet Explorer, we hardly knew ye
Microsoft has announced the end-of-life for the venerable Internet Explorer browser. Here we take a look at the demise of IE and the rise of the Edge browser. And we investigate how many bots on the Internet continue to impersonate Internet Explorer versions that have long since been replaced.
Live-patching security vulnerabilities inside the Linux kernel with eBPF Linux Security Module
Looking for something with a lot of technical detail? Look no further than this blog about live-patching the Linux kernel using eBPF. Code, Makefiles and more within!
Hertzbleed explained
Feeling mathematical? Or just need a dose of CPU-level antics? Look no further than this deep explainer about how CPU frequency scaling leads to a nasty side channel affecting cryptographic algorithms.
Early Hints update: How Cloudflare, Google, and Shopify are working together to build a faster Internet for everyone
The HTTP standard for Early Hints shows a lot of promise. How much? In this blog post, we dig into data about Early Hints in the real world and show how much faster the web is with it.
Private Access Tokens: eliminating CAPTCHAs on iPhones and Macs with open standards
Dislike CAPTCHAs? Yes, us too. As part of our program to eliminate captures there’s a new standard: Private Access Tokens. This blog shows how they work and how they can be used to prove you’re human without saying who you are.
Optimizing TCP for high WAN throughput while preserving low latency
Network nerd? Yeah, me too. Here’s a very in depth look at how we tune TCP parameters for low latency and high throughput.
It is once again exam time in Syria, Sudan, and Algeria, and with it, we find these countries disrupting Internet connectivity in an effort to prevent cheating on these exams. As they have done over the past several years, Syria and Sudan are implementing multi-hour nationwide Internet shutdowns. Algeria has also taken a similar approach in the past, but this year appears to be implementing more targeted website/application blocking.
Syria
Syria has been implementing Internet shutdowns across the country since 2011, but exam-related shutdowns have only been in place since 2016. In 2021, exams took place between May 31 and June 22, with multi-hour shutdowns observed on each of the exam days.
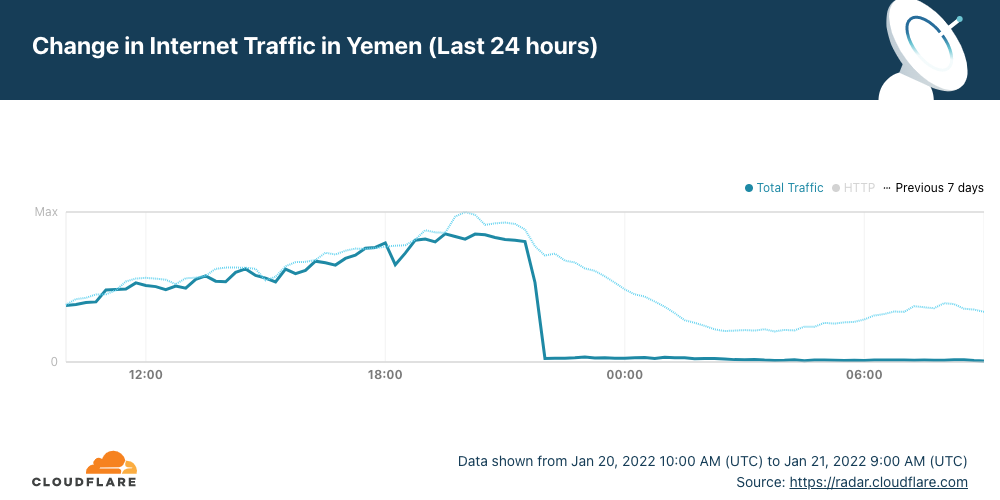
This year, the first shutdown was observed on May 30, with subsequent shutdowns (to date) seen on June 2, 6, and 12. In the Cloudflare Radar graph below, traffic for Syria drops to zero while the shutdowns are active. According to Internet Society Pulse, several additional shutdowns are expected through June 21. Each takes place between 02000530 UTC (0500–0830 local time). According to a published report, the current exam cycle covers more than 500,000 students for basic and general secondary education certificates.
Consistent with shutdowns observed in prior years, Syria is once again implementing them in an asymmetric fashion – that is, inbound traffic is disabled, but egress traffic remains. This is clearly visible in request traffic from Syria to Cloudflare’s 1.1.1.1 DNS resolver. As the graph below shows, queries from clients in Syria are able to exit the country and reach Cloudflare, but responses can’t return, leading to retry floods, visible as spikes in the graph.
Last year, the Syrian Minister of Education noted that, for the first time, encryption and surveillance technologies would be used in an effort to curtail cheating, with an apparent promise to suspend Internet shutdowns in the future if these technologies proved successful.
Sudan
Sudan is also no stranger to nationwide Internet shutdowns, with some last lasting for multiple weeks. Over the last several years, Sudan has also implemented Internet shutdowns during secondary school exams in an effort to limit cheating or leaking of exam questions. (We covered the 2021 round of shutdowns in a blog post.)
According to a schedule published by digital rights organization AccessNow, this year’s Secondary Certificate Exams will be taking place in Sudan daily between June 11–22, except June 17. As of this writing, near-complete shutdowns have been observed on June 11, 12, and 13 between 0530-0830 UTC (0730-1030 local time), as seen in the graph below. The timing of these shutdowns aligns with a communication reportedly sent to subscribers of telecommunications services in the country, which stated “In implementation of the decision of the Attorney General, the Internet service will be suspended during the Sudanese certificate exam sessions from 8 in the morning until 11 in the morning.”
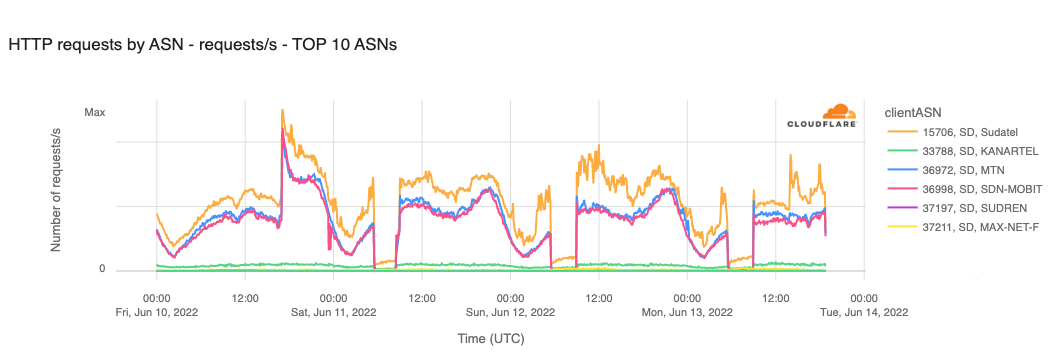
It is interesting to note that the shutdown, while nationwide, does not appear to be complete. The graph below shows that Cloudflare continues to see a small volume of HTTP requests from Sudatel during the shutdown periods. This is not completely unusual, as Sudatel may have public sector, financial services, or other types of customers that remain online.
Algeria
Since 2018, Algeria has been shutting down the Internet nationwide during baccalaureate exams, following widespread cheating in 2016 that saw questions leaked online both before and during tests. These shutdowns reportedly cost businesses across the country an estimated 500 million Algerian Dinars (approximately $3.4 million USD) for every hour the Internet was unavailable. In 2021, there were two Internet shutdowns each day that exams took place—the first between 0700–1100 UTC (0800–1200 local time), and the second between 1330–1600 UTC (1430–1700 local time).
Perhaps recognizing the economic damage caused by these Internet shutdowns, this year the Algerian Minister of National Education announced that there would be no Internet shutdowns on exam days.
Thus far, it appears that this has been the case. However, it appears that the Algerian government has shifted to a content blocking-based approach, instead of a wide-scale Internet shutdown. The Cloudflare Radar graph below shows two nominal drops in country-level traffic during the two times on June 13 that the exams took place—0730–1000 UTC (0830–1100 local time) and 1330–1600 UTC (1430–1700 local time), similar to last year’s timing.
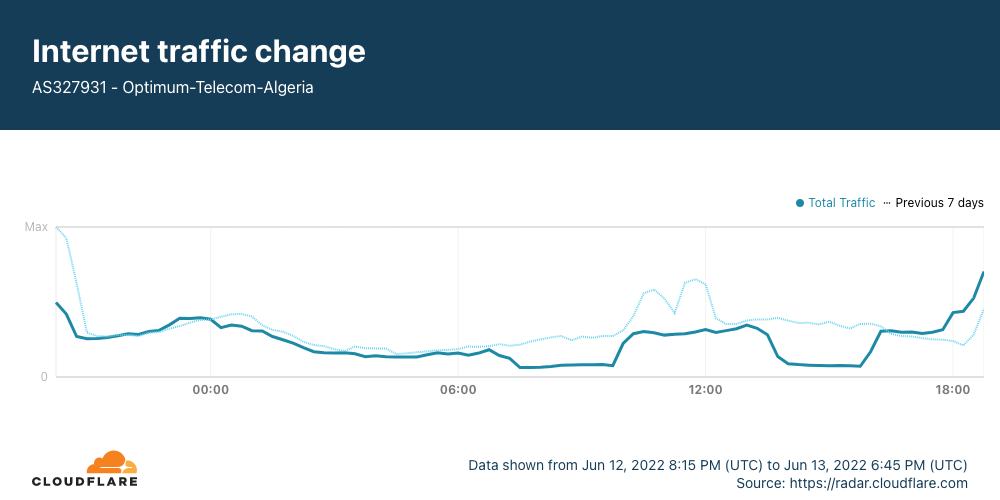
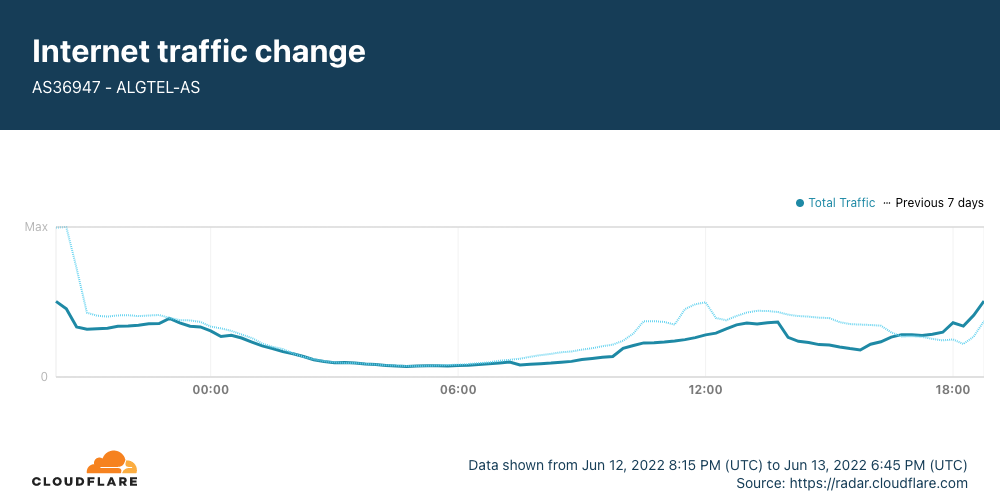
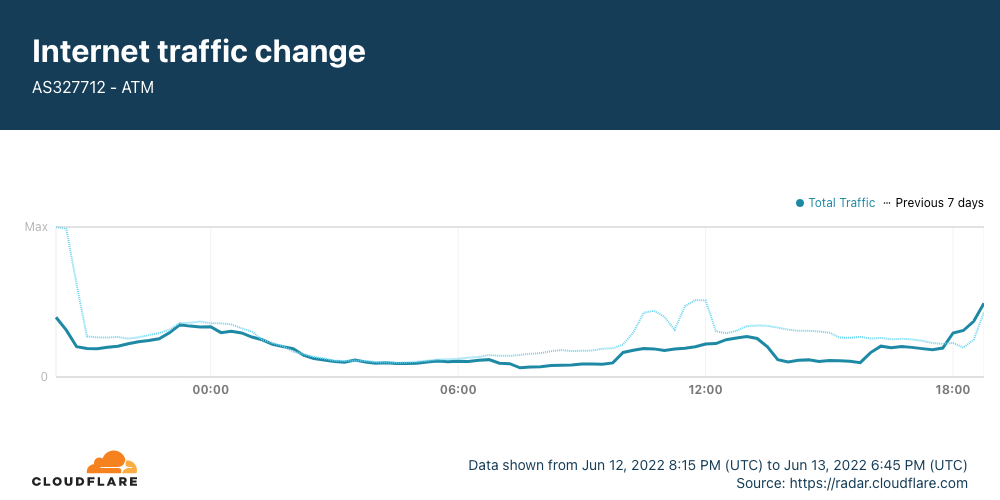
The disruptions are also visible in traffic graphs for several major Algerian network providers, as shown below.
Analysis of additional Cloudflare data further supports the hypothesis that Algeria is blocking access to specific websites and applications, rather than shutting down the Internet completely.
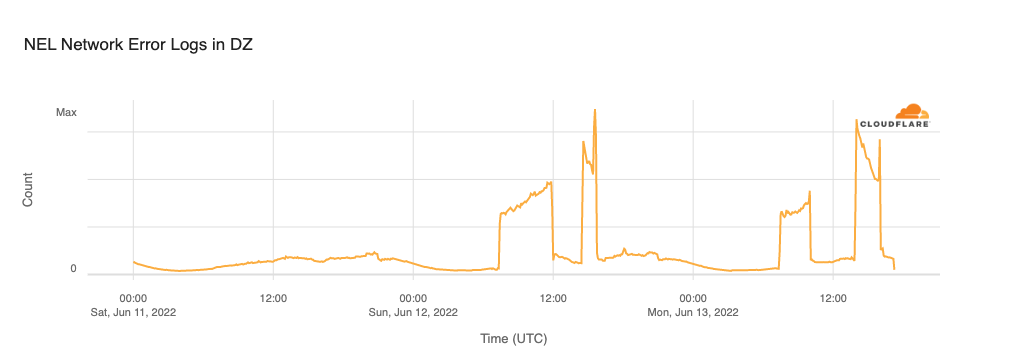
As described in a previous blog post, Network Error Logging (NEL) is a browser-based reporting system that allows users’ browsers to report connection failures to an endpoint specified by the webpage that failed to load. Below, a graph of NEL reports from browsers in Algeria shows clear spikes during the times (thus far) that the exams have taken place, with report levels significantly lower and more consistent during other times of the day.
Conclusion
In addition to Syria, Sudan, and Algeria, countries including India, Jordan, Iraq, Uzbekistan, and Ethiopia have shut down or limited access to the Internet as exams took place. It is unclear whether these brute-force methods are truly effective at preventing cheating on these exams. However, it is clear that the impact of these shutdowns goes beyond students, as they impose a significant financial cost on businesses within the affected countries as they lose Internet access for multiple hours a day over the course of several weeks.
If you want to follow the remaining scheduled disruptions for these countries, you can see live data on the Cloudflare Radar pages for Syria, Sudan, and Algeria.
Just after 1200 UTC on Tuesday, June 7, the Africa-Asia-Europe-1 (AAE-1) and SEA-ME-WE-5 (SMW-5) submarine cables suffered cable cuts. The damage reportedly occurred in Egypt, and impacted Internet connectivity for millions of Internet users across multiple countries in the Middle East and Africa, as well as thousands of miles away in Asia. In addition, Google Cloud Platform and OVHcloud reported connectivity issues due to these cable cuts.
The impact
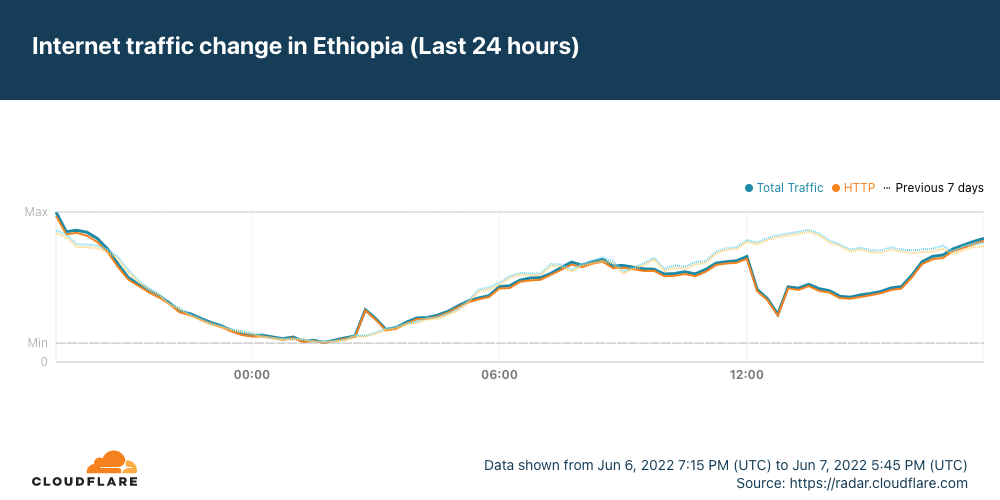
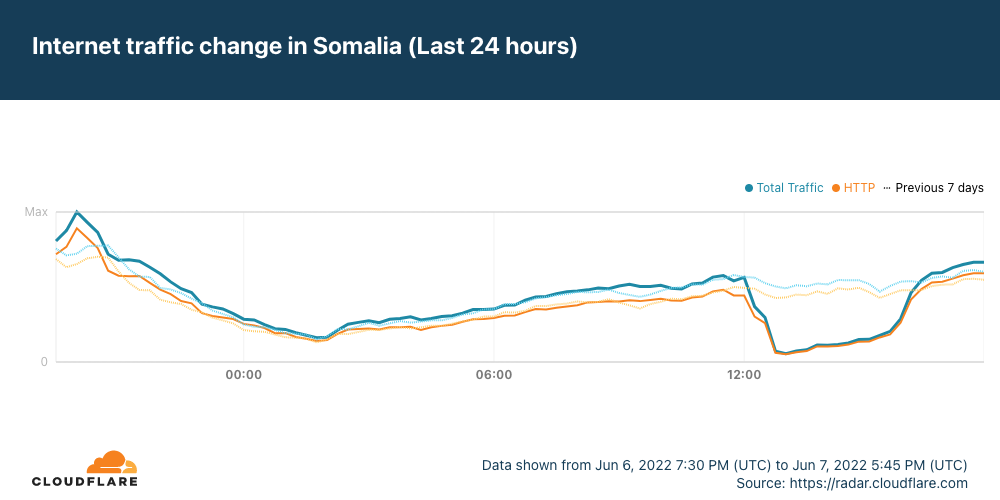
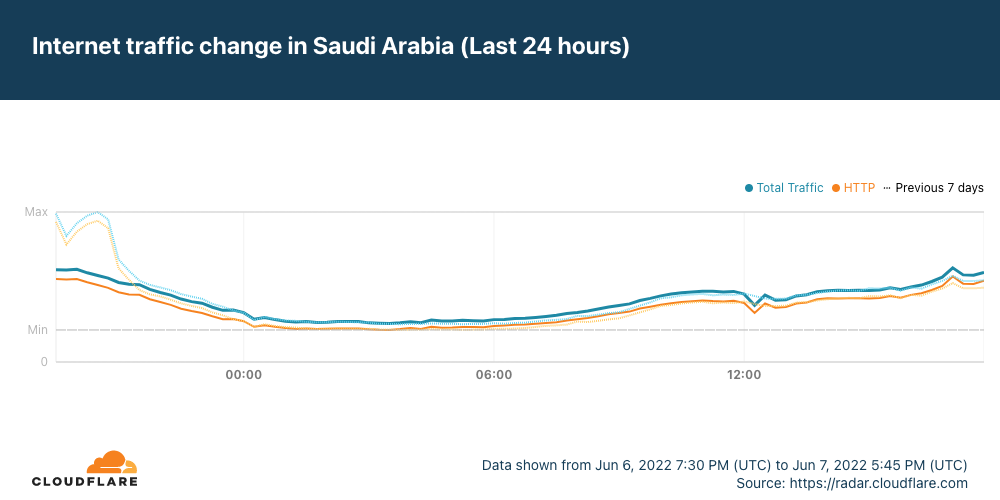
Data from Cloudflare Radar showed significant drops in traffic across the impacted countries as the cable damage occurred, recovering approximately four hours later as the cables were repaired.
It appears that Saudi Arabia may have also been affected by the cable cut(s), but the impact was much less significant, and traffic recovered almost immediately.
In the graphs above, we show that Ethiopia was one of the impacted countries. However, as it is landlocked, there are obviously no submarine cable landing points within the country. The Afterfibre map from the Network Startup Resource Center (NSRC) shows that that fiber in Ethiopia connects to fiber in Somalia, which experienced an impact. In addition, Ethio Telecom also routes traffic through network providers in Kenya and Djibouti. Djibouti Telecom, one of these providers, in turn peers with larger global providers like Telecom Italia (TI) Sparkle, which is one of the owners of SMW5.
In addition to impacting end-user connectivity in the impacted countries, the cable cuts also reportedly impacted cloud providers including Google Cloud Platform and OVHcloud. In their incident report, Google Cloud noted“Google Cloud Networking experienced increased packet loss for egress traffic from Google to the Middle East, and elevated latency between our Europe and Asia Regions as a result, for 3 hours and 12 minutes, affecting several related products including Cloud NAT, Hybrid Connectivity and Virtual Private Cloud (VPC). From preliminary analysis, the root cause of the issue was a capacity shortage following two simultaneous fiber-cuts.” OVHcloud noted that “Backbone links between Marseille and Singapore are currently down” and that “Upon further investigation, our Network OPERATION teams advised that the fault was related to our partner fiber cuts.”
When concurrent disruptions like those highlighted above are observed across multiple countries in one or more geographic areas, the culprit is often a submarine cable that connects the impacted countries to the global Internet. The impact of such cable cuts will vary across countries, largely due to the levels of redundancy that they may have in place. That is, are these countries solely dependent on an impacted cable for global Internet connectivity, or do they have redundant connectivity across other submarine or terrestrial cables? Additionally, the location of the country relative to the cable cut will also impact how connectivity in a given country may be affected. Due to these factors, we didn’t see a similar impact across all of the countries connected to the AAE-1 and SMW5 cables.
What happened?
Specific details are sparse, but as noted above, the cable damage reportedly occurred in Egypt – both of the impacted cables land in Abu Talat and Zafarana, which also serve as landing points for a number of other submarine cables. According to a 2021 article in Middle East Eye, “There are 10 cable landing stations on Egypt’s Mediterranean and Red Sea coastlines, and some 15 terrestrial crossing routes across the country.” Alan Mauldin, research director at telecommunications research firm TeleGeography, notes that routing cables between Europe and the Middle East to India is done via Egypt, because there is the least amount of land to cross. This places the country in a unique position as a choke point for international Internet connectivity, with damage to infrastructure locally impacting the ability of millions of people thousands of miles away to access websites and applications, as well as impacting connectivity for leading cloud platform providers.
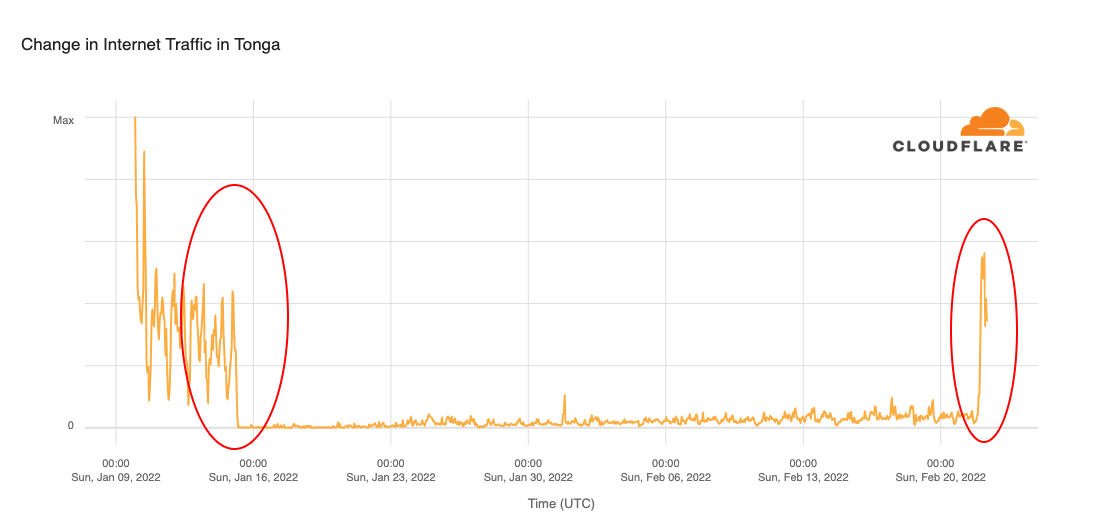
As the graphs above show, traffic returned to normal levels within a matter of hours, with tweets from telecommunications authorities in Pakistan and Oman also noting that Internet services had returned to their countries. Such rapid repairs to submarine cable infrastructure are unusual, as repair timeframes are often measured in days or weeks, as we saw with the cables damaged by the volcanic eruption in Tonga earlier this year. This is due to the need to locate the fault, send repair ships to the appropriate location, and then retrieve the cable and repair it. Given this, the damage to these cables likely occurred on land, after they came ashore.
Keeping content available
By deploying in data centers close to end users, Cloudflare helps to keep traffic local, which can mitigate the impact of catastrophic events like cable cuts, while improving performance, availability, and security. Being able to deliver content from our network generally requires first retrieving it from an origin, and with end users around the world, Cloudflare needs to be able to reach origins from multiple points around the world at the same time. However, a customer origin may be reachable from some networks but not from others, due to a cable cut or some other network disruption.
In September 2021, Cloudflare announced Orpheus, which provides reachability benefits for customers by finding unreachable paths on the Internet in real time, and guiding traffic away from those paths, ensuring that Cloudflare will always be able to reach an origin no matter what is happening on the Internet.
Conclusion
Because the Internet is an interconnected network of networks, an event such as a cable cut can have a ripple effect across the whole Internet, impacting connectivity for users thousands of miles away from where the incident occurred. Users may be unable to access content or applications, or the content/applications may suffer from reduced performance. Additionally, the providers of those applications may experience problems within their own network infrastructure due to such an event.
For network providers, the impact of such events can be mitigated through the use of multiple upstream providers/peers, and diverse physical paths for critical infrastructure like submarine cables. Cloudflare’s globally deployed network can help content and application providers ensure that their content and applications remain available and performant in the face of network disruptions.
“I declare before you all that my whole life, whether it be long or short, shall be devoted to your service and the service of our great imperial family to which we all belong.” — Queen Elizabeth II birthday speech, April 21, 1947
When Elizabeth II’s reign started, on February 6, 1952 (the coronation was on June 2, 1953), the Turing machine had already been proposed (1936), and with that the basis for computer science. ARPANET, which became the technical foundation of the Internet, was still a dream that came to fruition in the late 60s — the World Wide Web is from 1989 and in 2014 we celebrated its Silver Jubilee. So, with that in mind, let’s answer the question: did the 2022 celebrations of the first British monarch with a 70th anniversary on the throne have an impact on the UK’s Internet traffic?
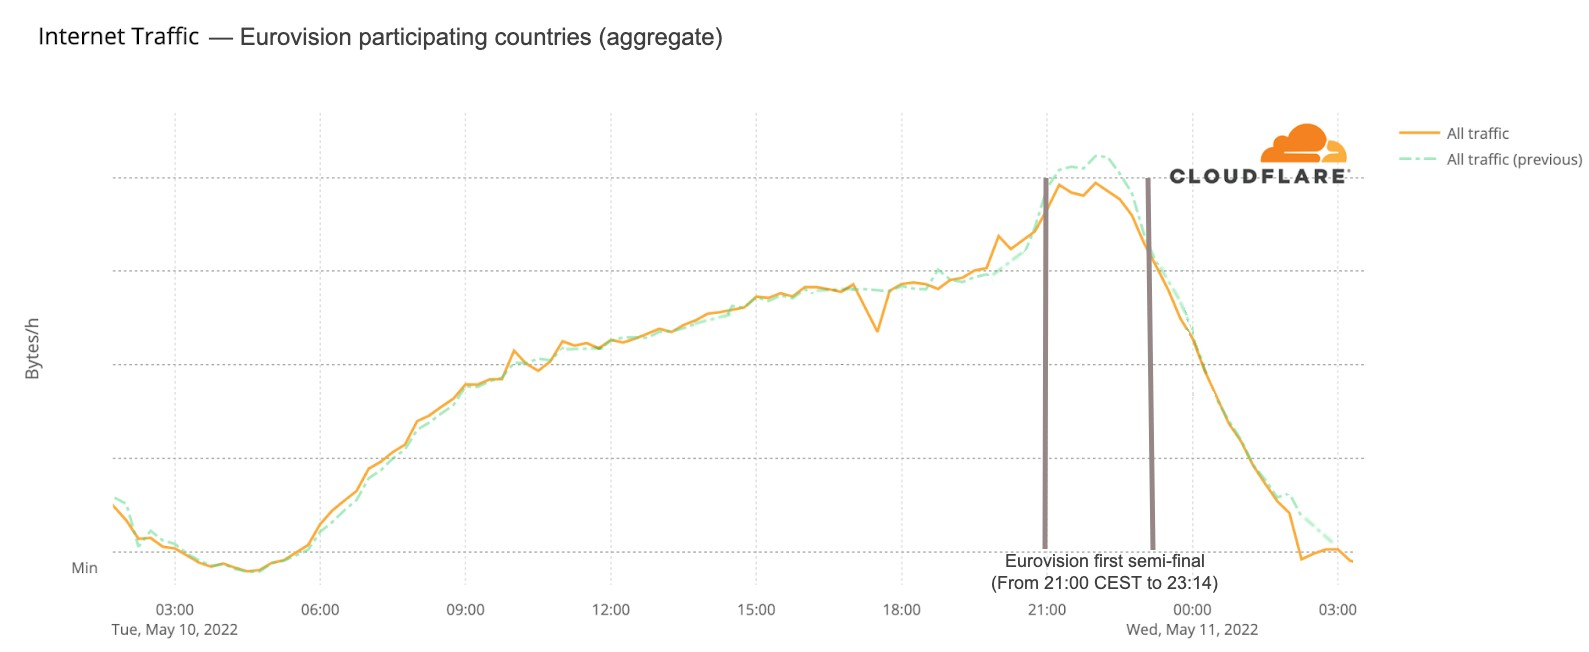
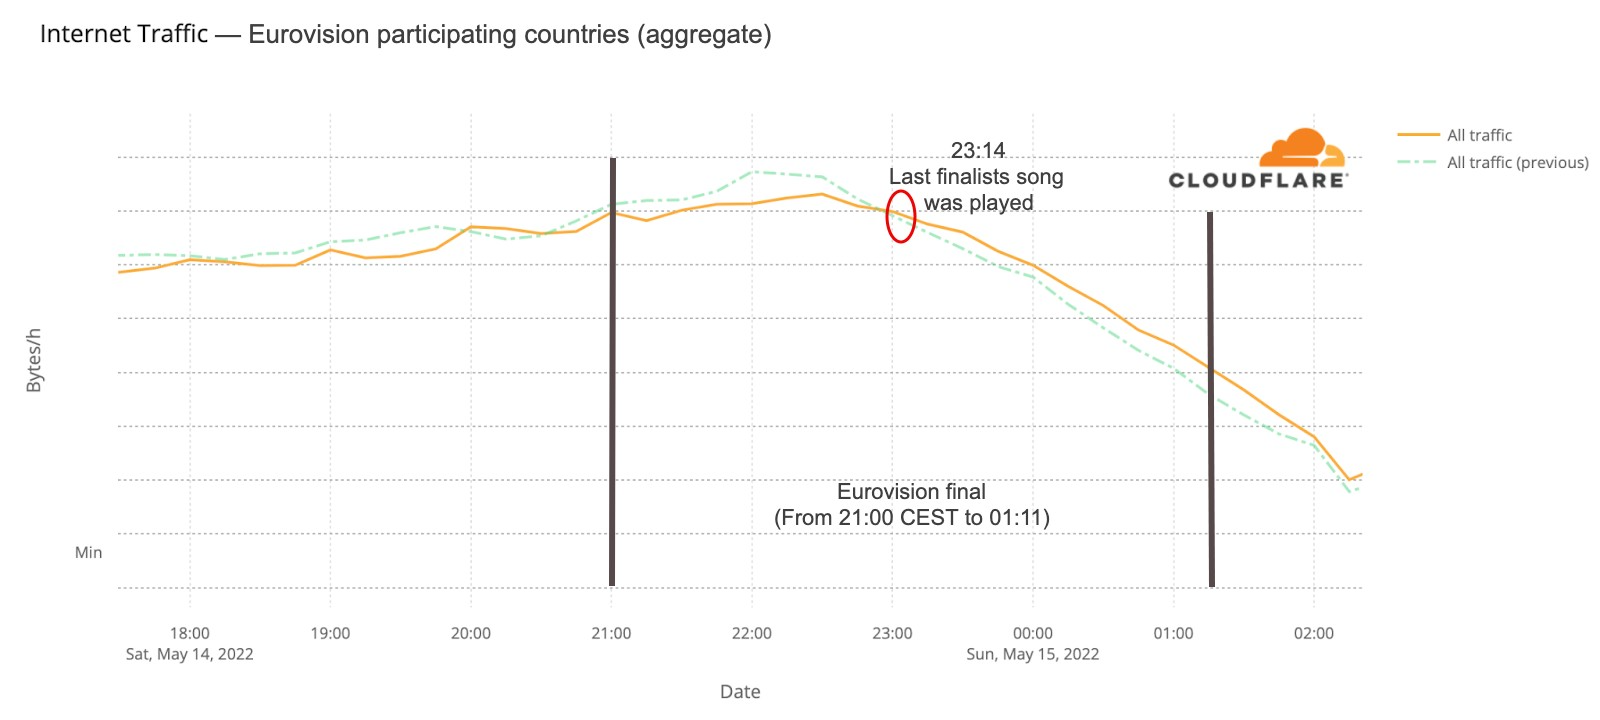
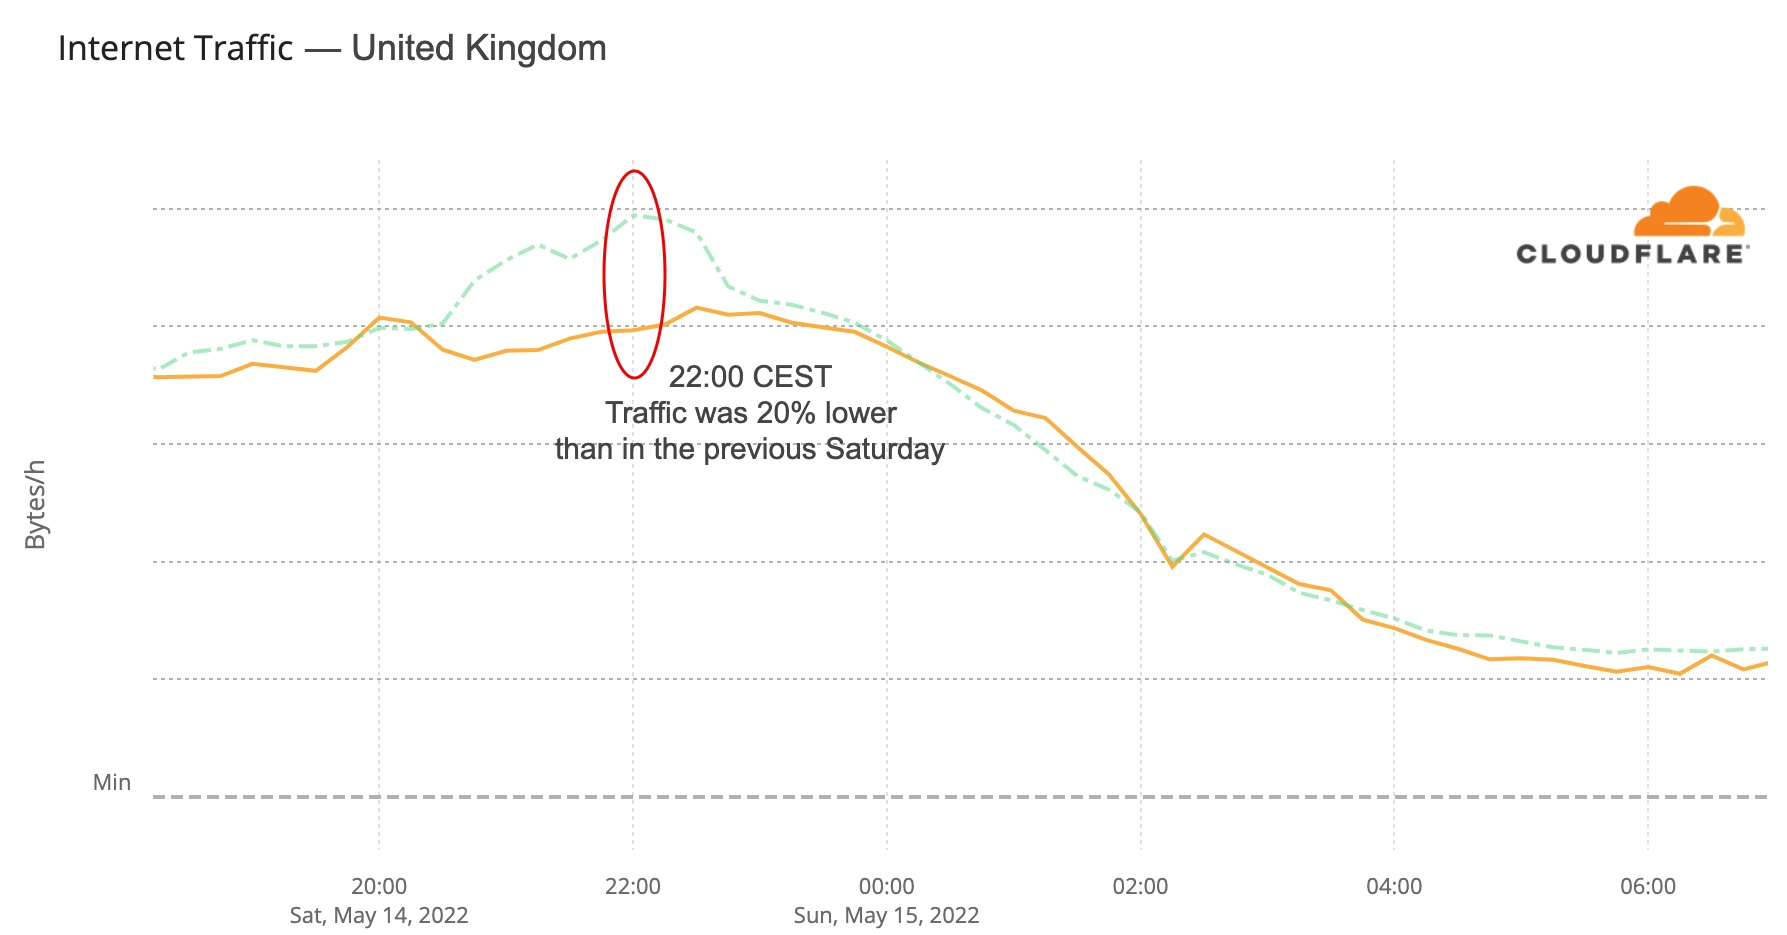
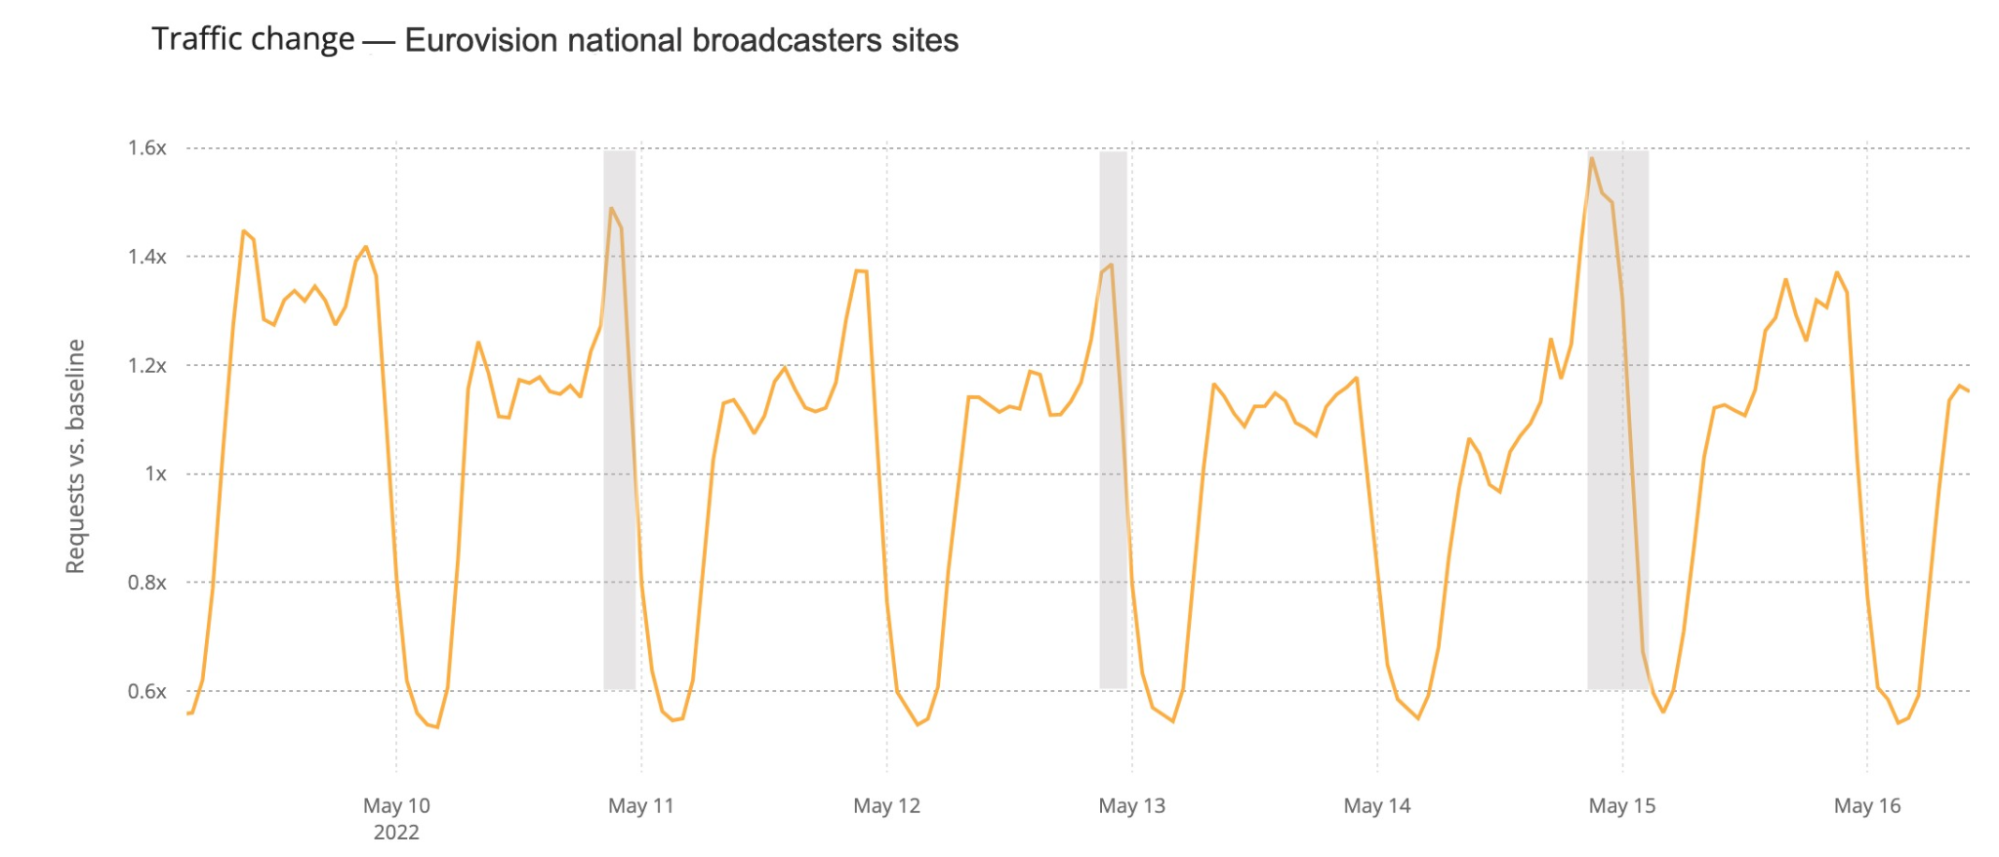
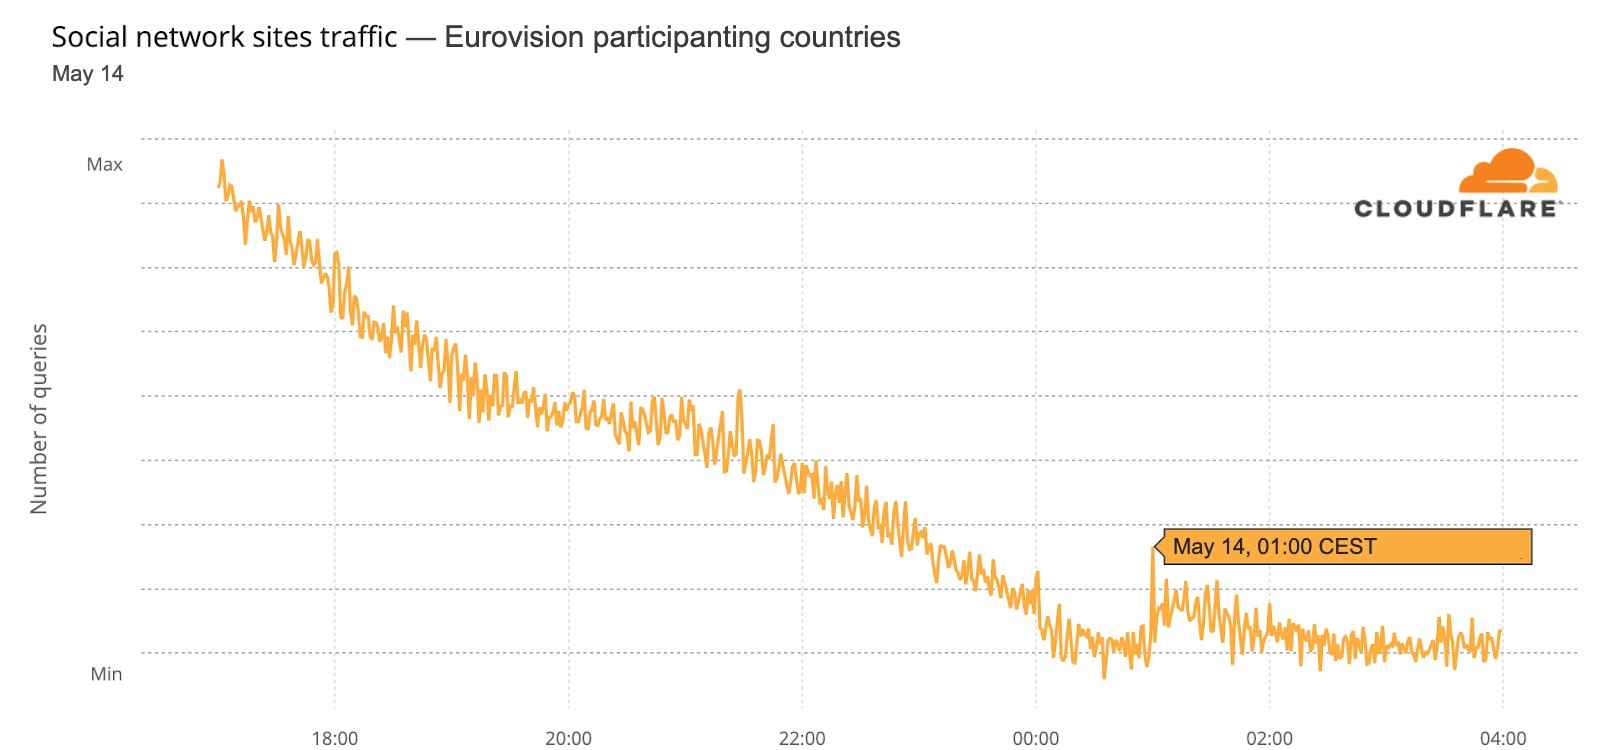
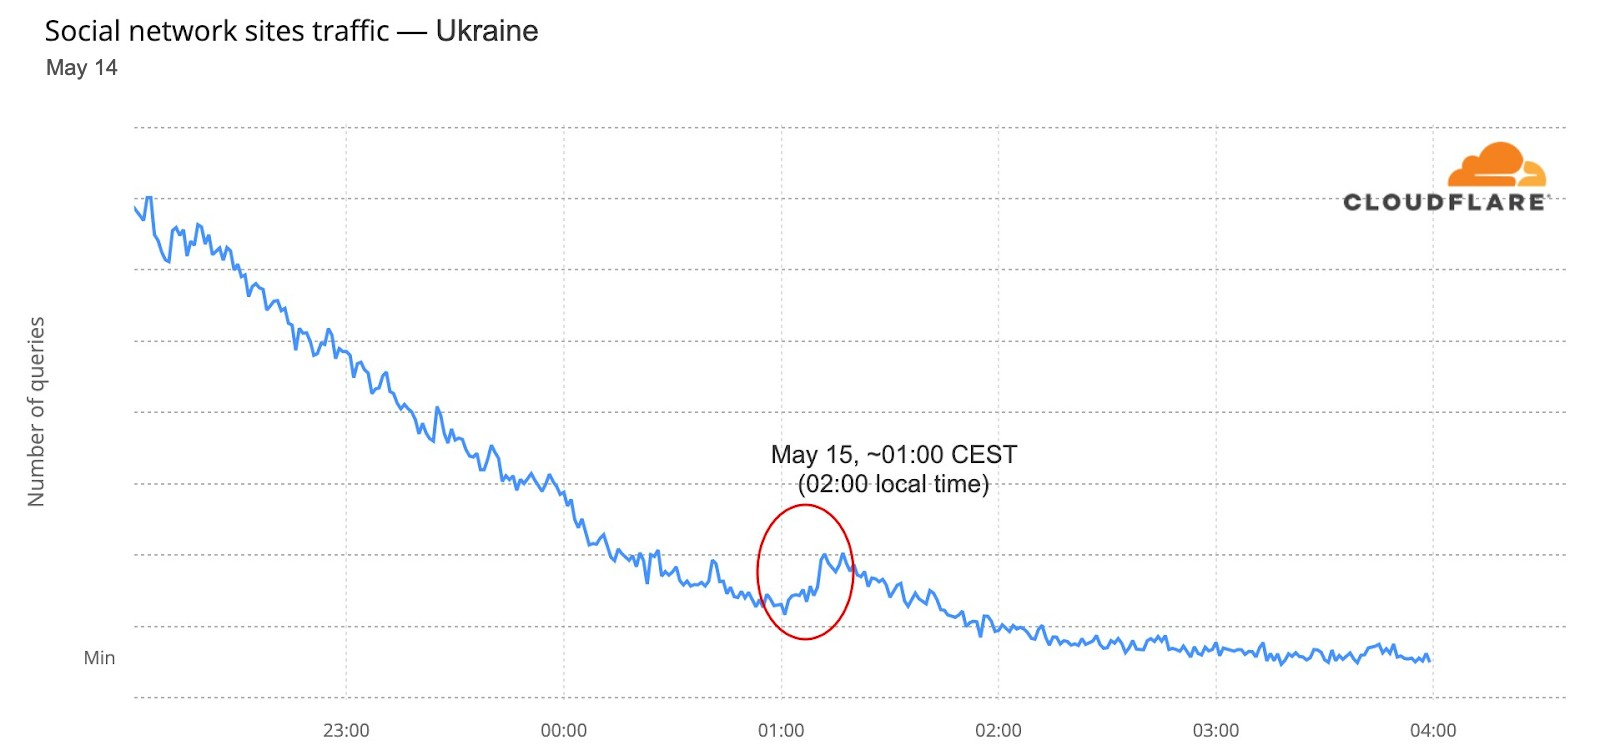
First, some details about the Platinum Jubilee. There was a four-day bank holiday (June 2-5) in the UK for the celebration that included parades and pageants, and several ceremonies. There was a Big Jubilee Lunch in many communities on Sunday, June 5, and more than 16,000 street parties (pubs and bars were also allowed to stay open for extra two hours). In events like these, not only there’s a lot to do outside, but also to see on the television and that impacts the Internet — we saw it during the Eurovision 2022 final.
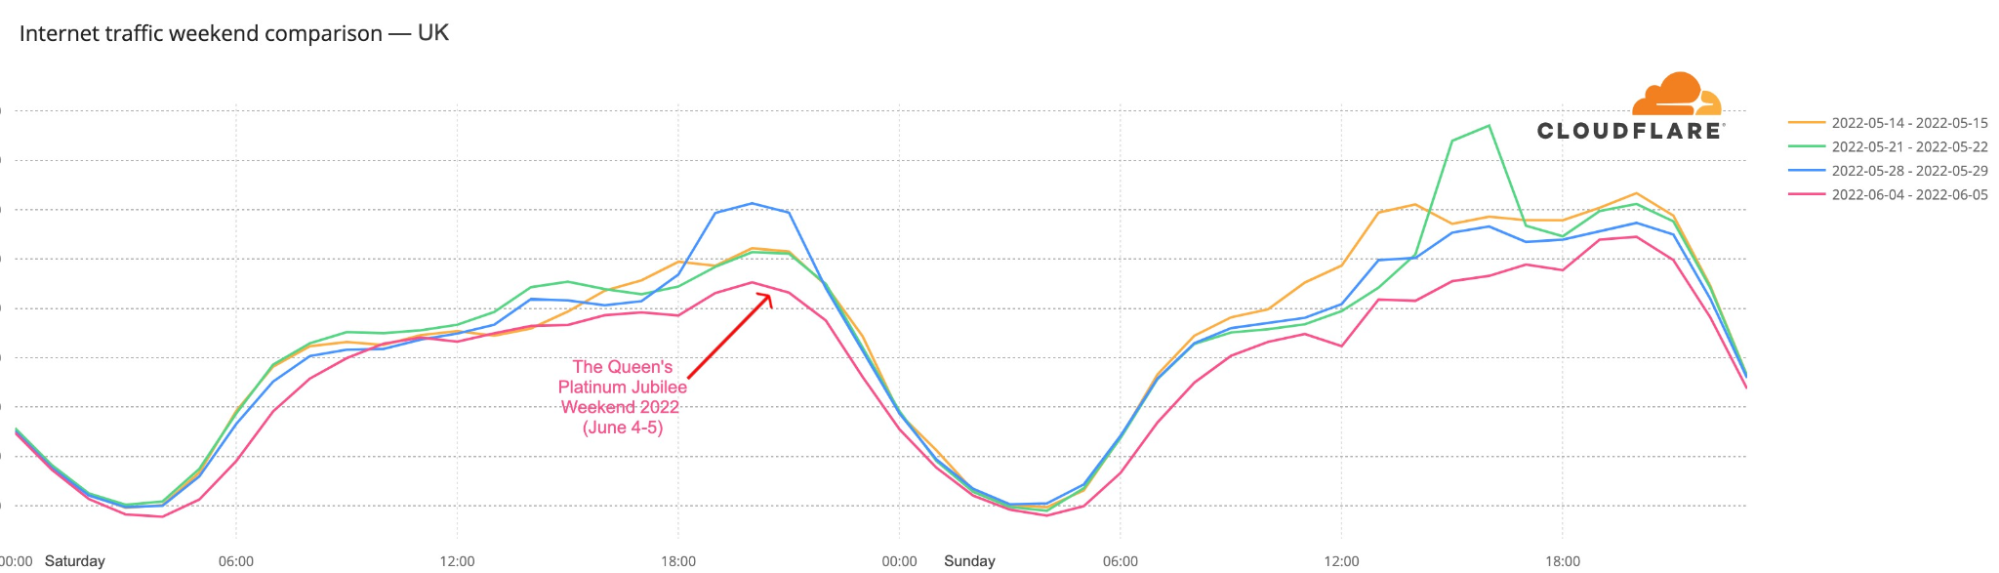
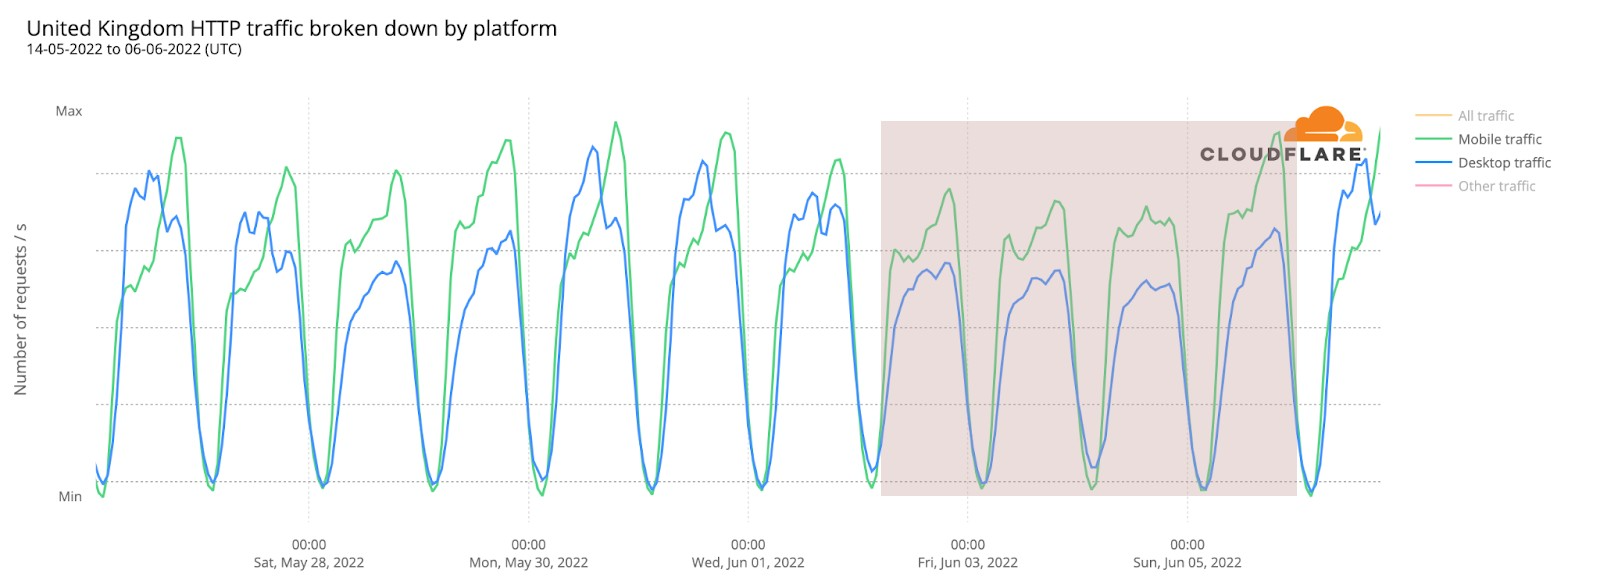
Looking at Cloudflare Radar’s data from the UK, we can see that this past weekend clearly had less Internet traffic compared to recent weekends, so people were less online during the daytime, when the Jubilee was being celebrated. Here’s the chart with the previous four weekends of the UK’s Internet traffic:
That lower traffic trend is most clear on Saturday, June 4, at 20:00 local time, when traffic was 23% lower than on the previous Saturday, and on Sunday, June 5, at 15:00, when traffic was 25% lower than on the previous Sunday. The weather was actually sunnier on the previous weekend, May 28-29, but people did seem to have many reasons (related to the Jubilee) to go outside or at least be less online.
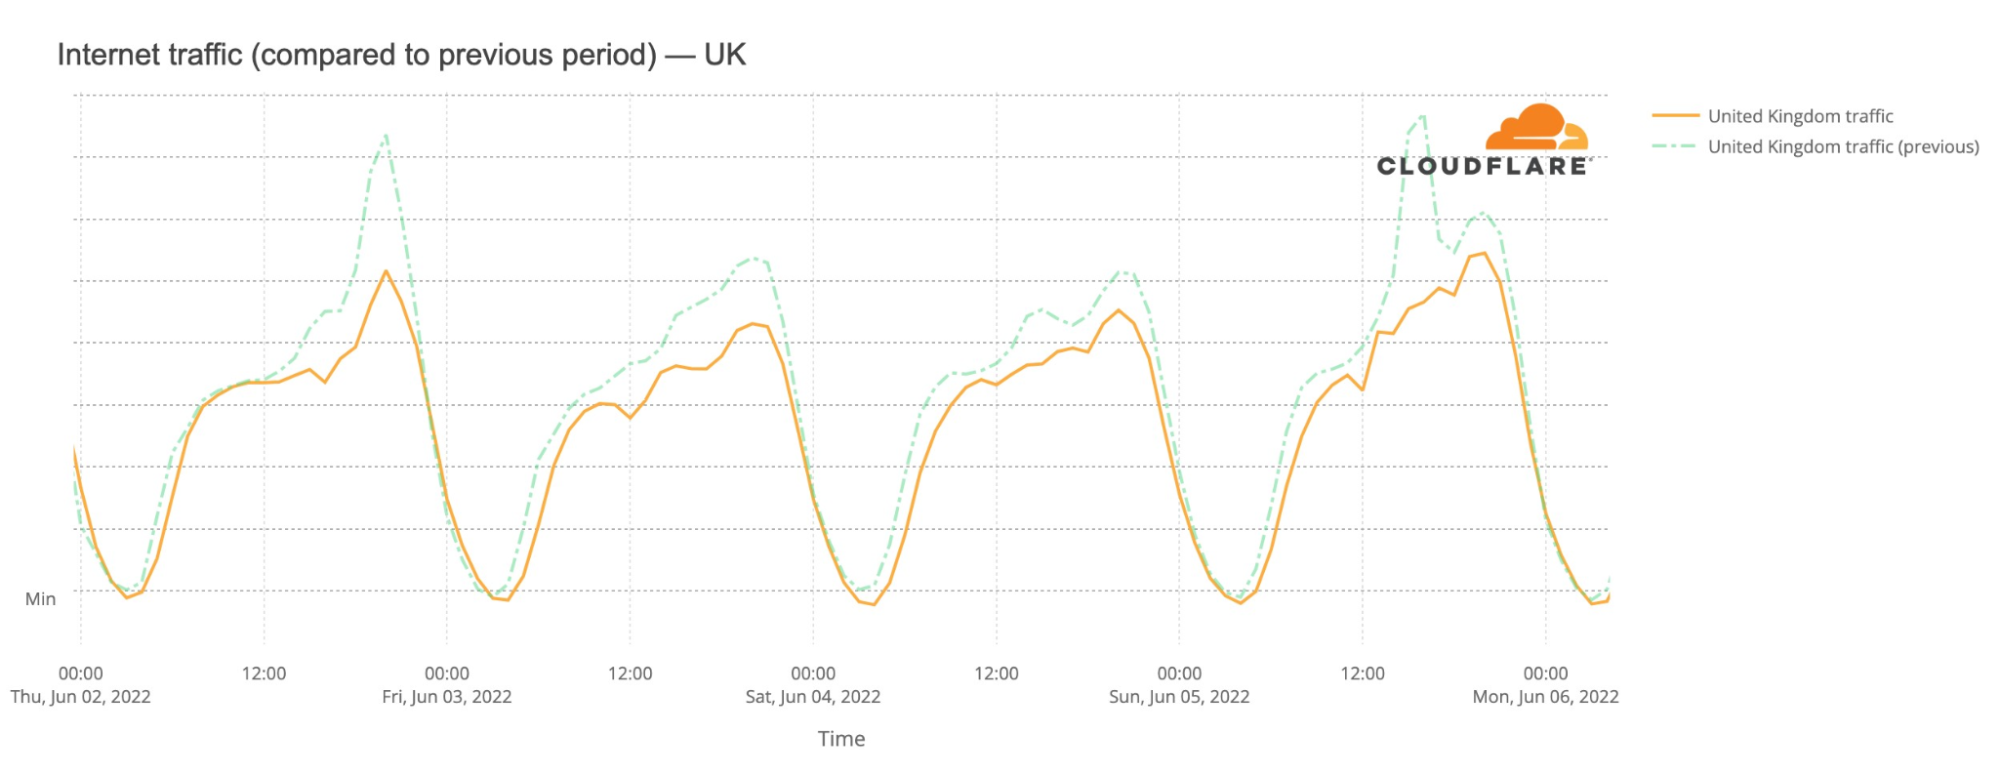
Looking at the full picture of when the four-day bank holiday started, Thursday, June 2, 2022, until Sunday, June 5, there’s a clear trend of less traffic through all of those days, which is not unusual, at least for Thursday and Friday, considering that holidays usually have traffic more similar to weekends than weekdays.
No surprise, when there’s a holiday, or it’s the weekend people tend to use their mobile devices more to access the Internet, and that was clearly what we saw in the UK since Thursday, June 2, mobile traffic (green line) was always prevalent compared to desktop traffic (blue line) since then.
On the weekdays before June 2, we can see that Internet traffic by mobile devices only stands out after 18:00 (before that, with people working, desktop took the lead).
From Canada to New Zealand
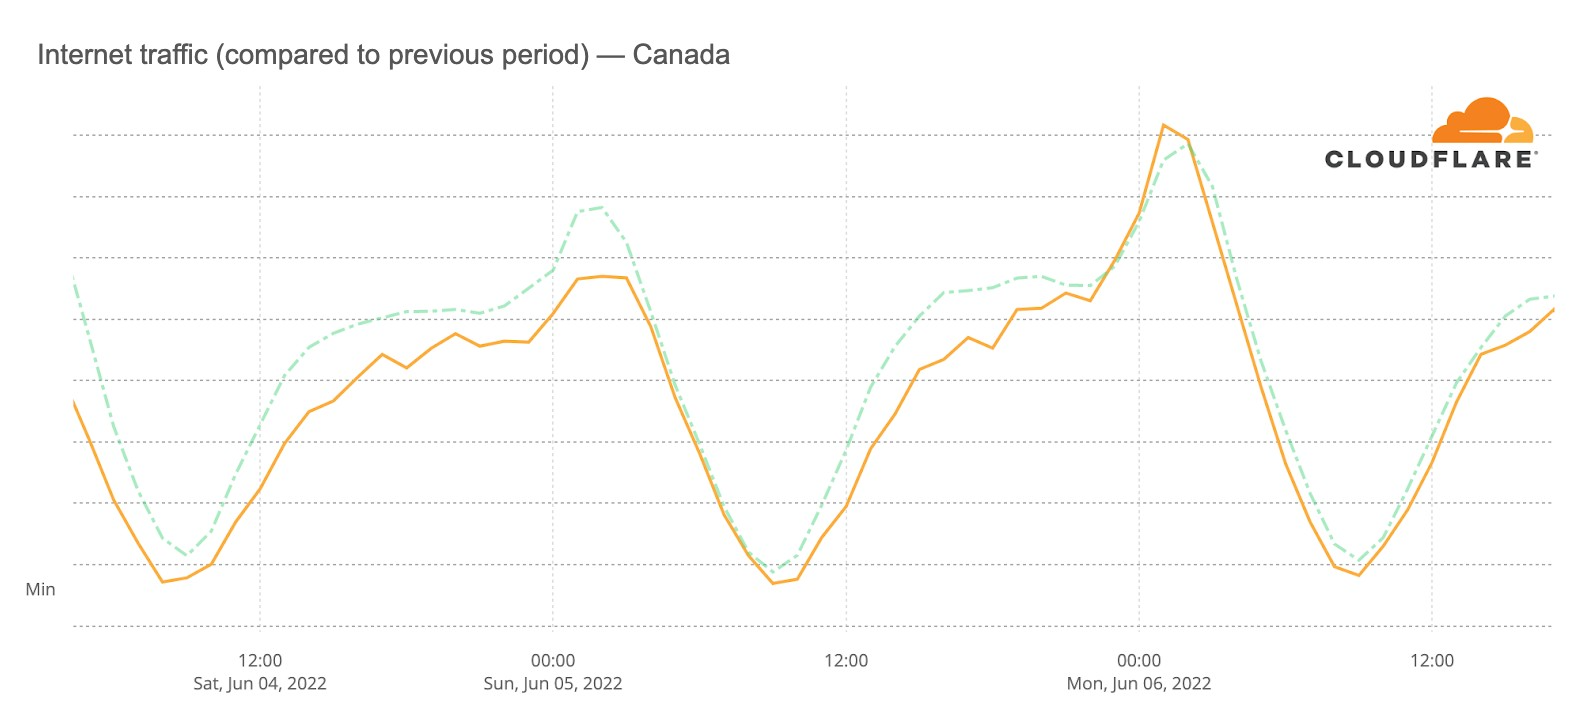
There are several other commonwealth countries that also had relevant events to celebrate since June 2 and through the past weekend for the Queen’s Platinum Jubilee. Canada is one with several activities throughout the country, including free admission to museums and historic sites, park parties and concerts.
Related to the Jubilee celebrations or not, Internet traffic in Canada was lower this past weekend than in the previous one. Saturday, June 4, at 22:00 in Toronto traffic was 13% lower than in the previous period, and throughout the day that was also the case. On Sunday, traffic was only lower during daytime, especially around 12:00 in Toronto, when it was 15% lower than in the previous Sunday. That was the time of the Jubilee Pageant, in central London (in the next charts, times are in UTC).
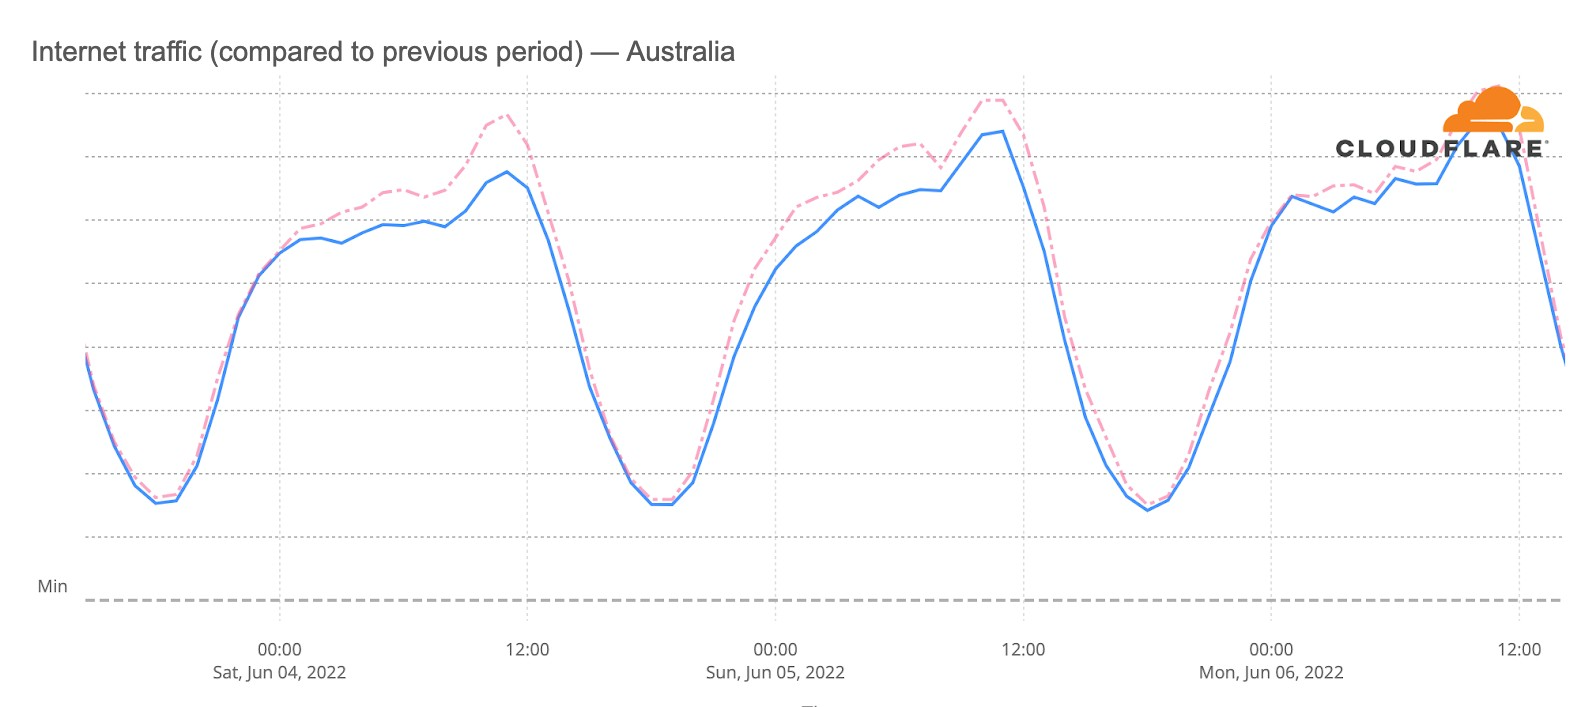
Something similar can be seen in terms of lower traffic this weekend in Australia:
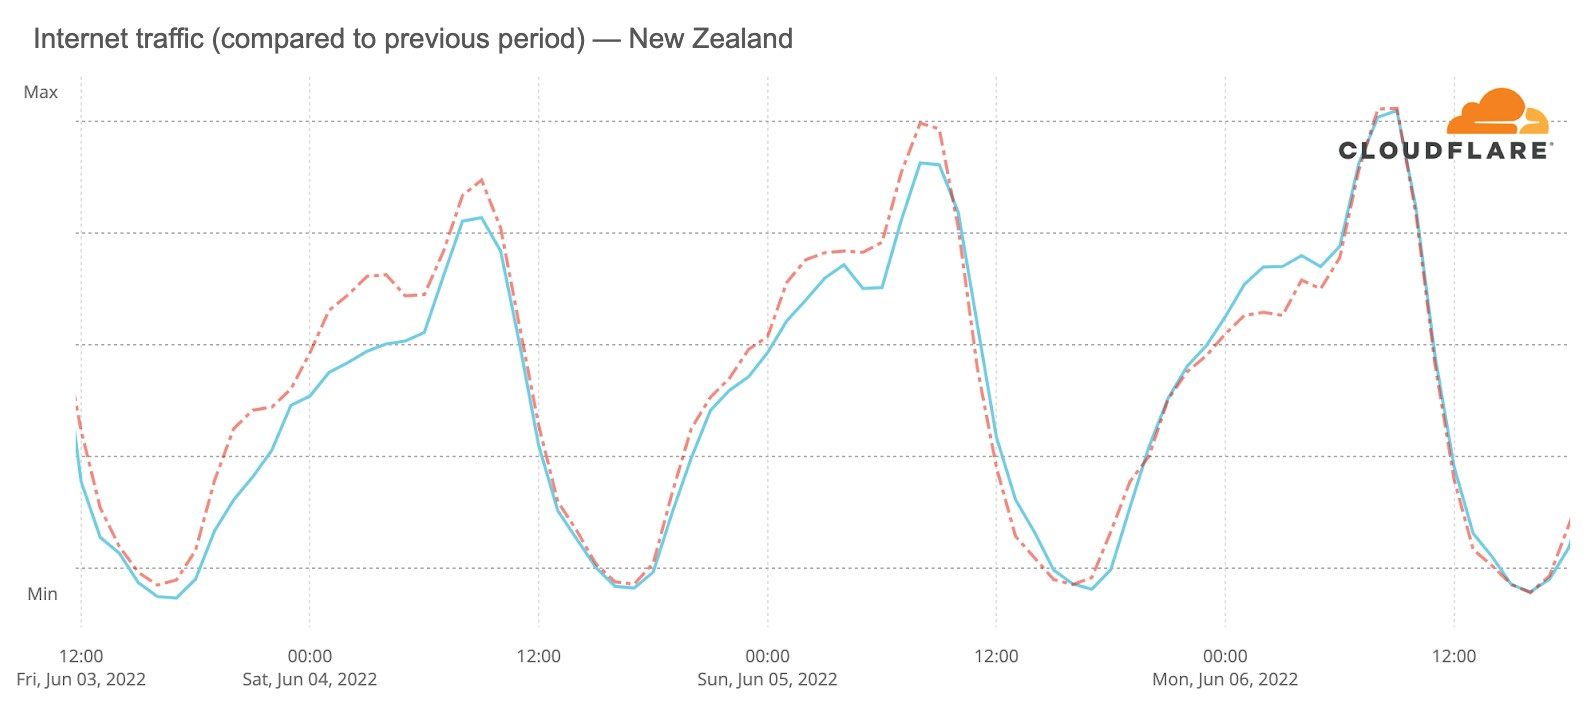
And also New Zealand:
Royal family and news websites (Boris Johnson’s no confidence vote included)
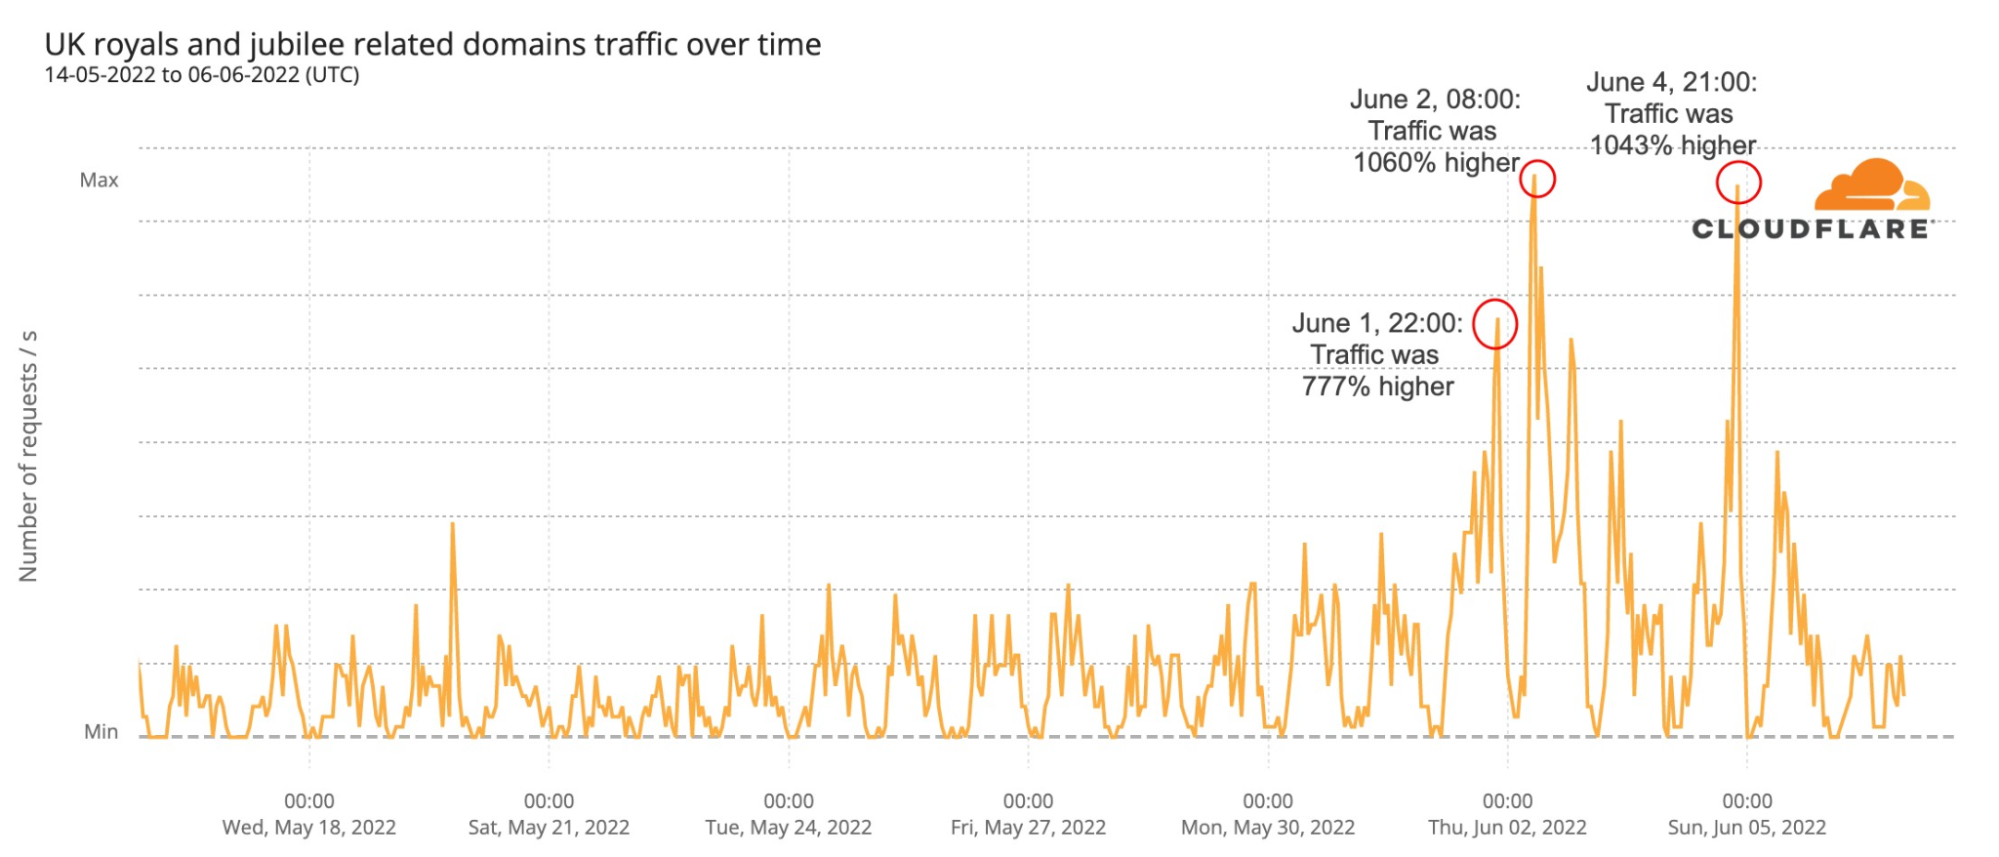
Here we’re looking at DNS request trends to get a sense of traffic to Internet properties. First, we can see that websites concerning the UK Royal family and the Jubilee were clearly seeing more traffic after Wednesday, June 1 (the day before the four-day bank holiday). The three biggest spikes were: Wednesday evening, when traffic was 777% higher at 22:00 (compared to the previous week); the next morning (08:00), when it rose 1060%; and on Saturday evening (21:00) it got 1043% more traffic.
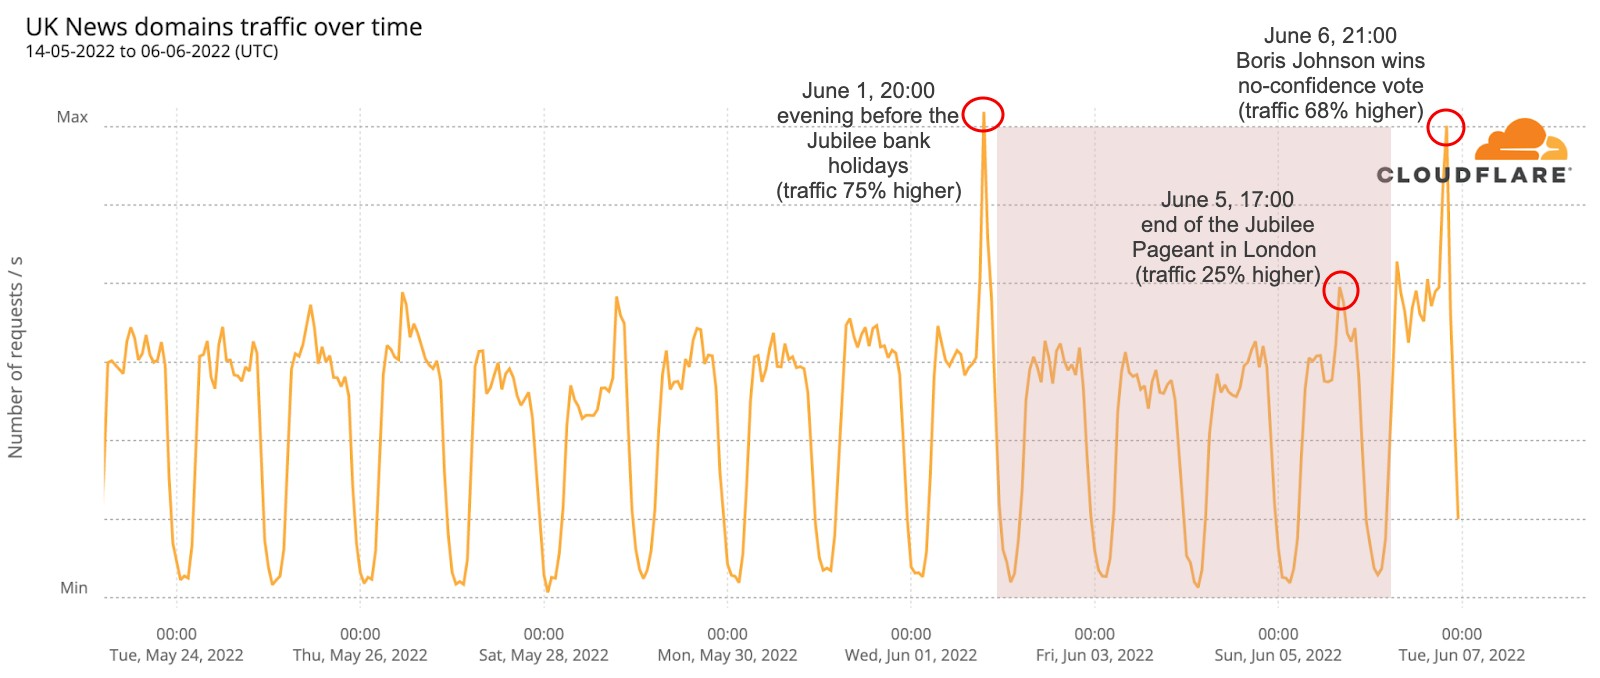
UK-based news websites (TV broadcasters and newspapers) also covered Queen Elizabeth II’s Platinum Jubilee extensively over the extended weekend. And there are three big highlights/spikes from the past few days regarding media outlets’ websites, but only two seem to be related to the Jubilee or the bank holidays.
We can see that the biggest spike in traffic (75% more than the previous period) was the night before the Jubilee four-day bank holiday started. Then, Sunday afternoon when the London Jubilee Pageant was ending, there was another spike (25% higher).
But the day with more sustained traffic from the last 14 days was actually Monday, June 6. That was the day that Boris Johnson, the British prime minister, won a no confidence vote in the UK’s Parliament. There was a clear first spike at around 08:00, when the news that a vote of no confidence would take place on that day broke, and a much bigger one at 21:00 (68% higher), when the final result of the vote was announced.
Social media and messaging trends
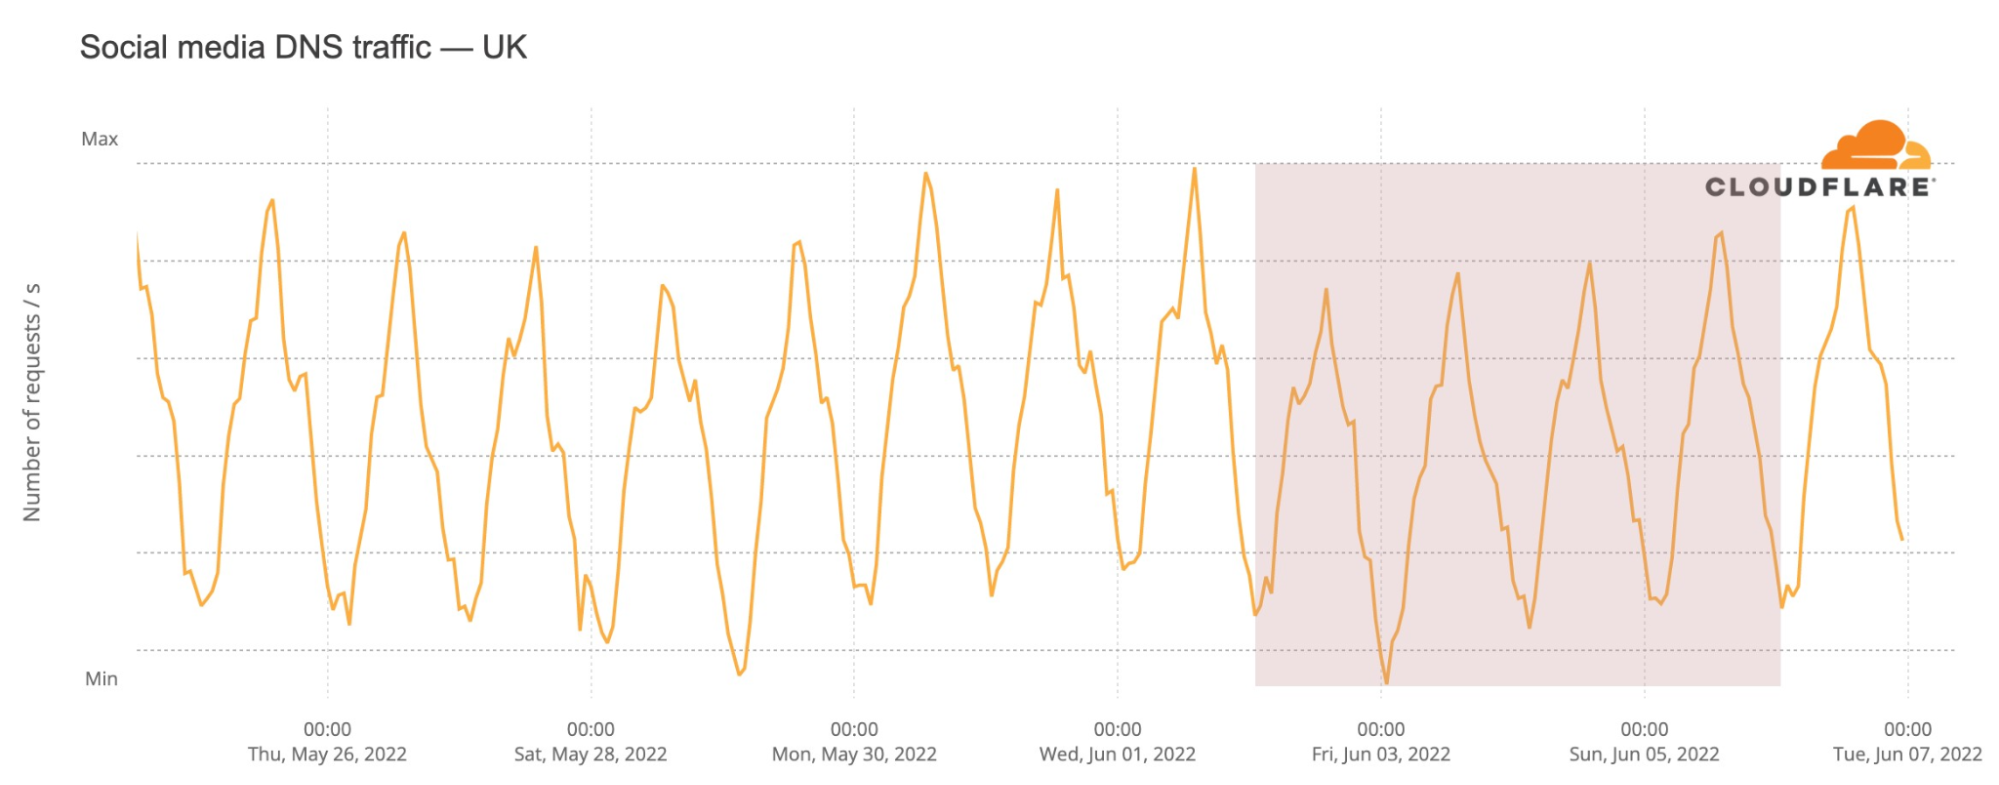
Social media trends show a similar pattern to Internet traffic in general, but it’s interesting to see that Thursday, June 2, the first day of the extended weekend, was the one of the full 14 days we’re looking at with less DNS traffic to those platforms.
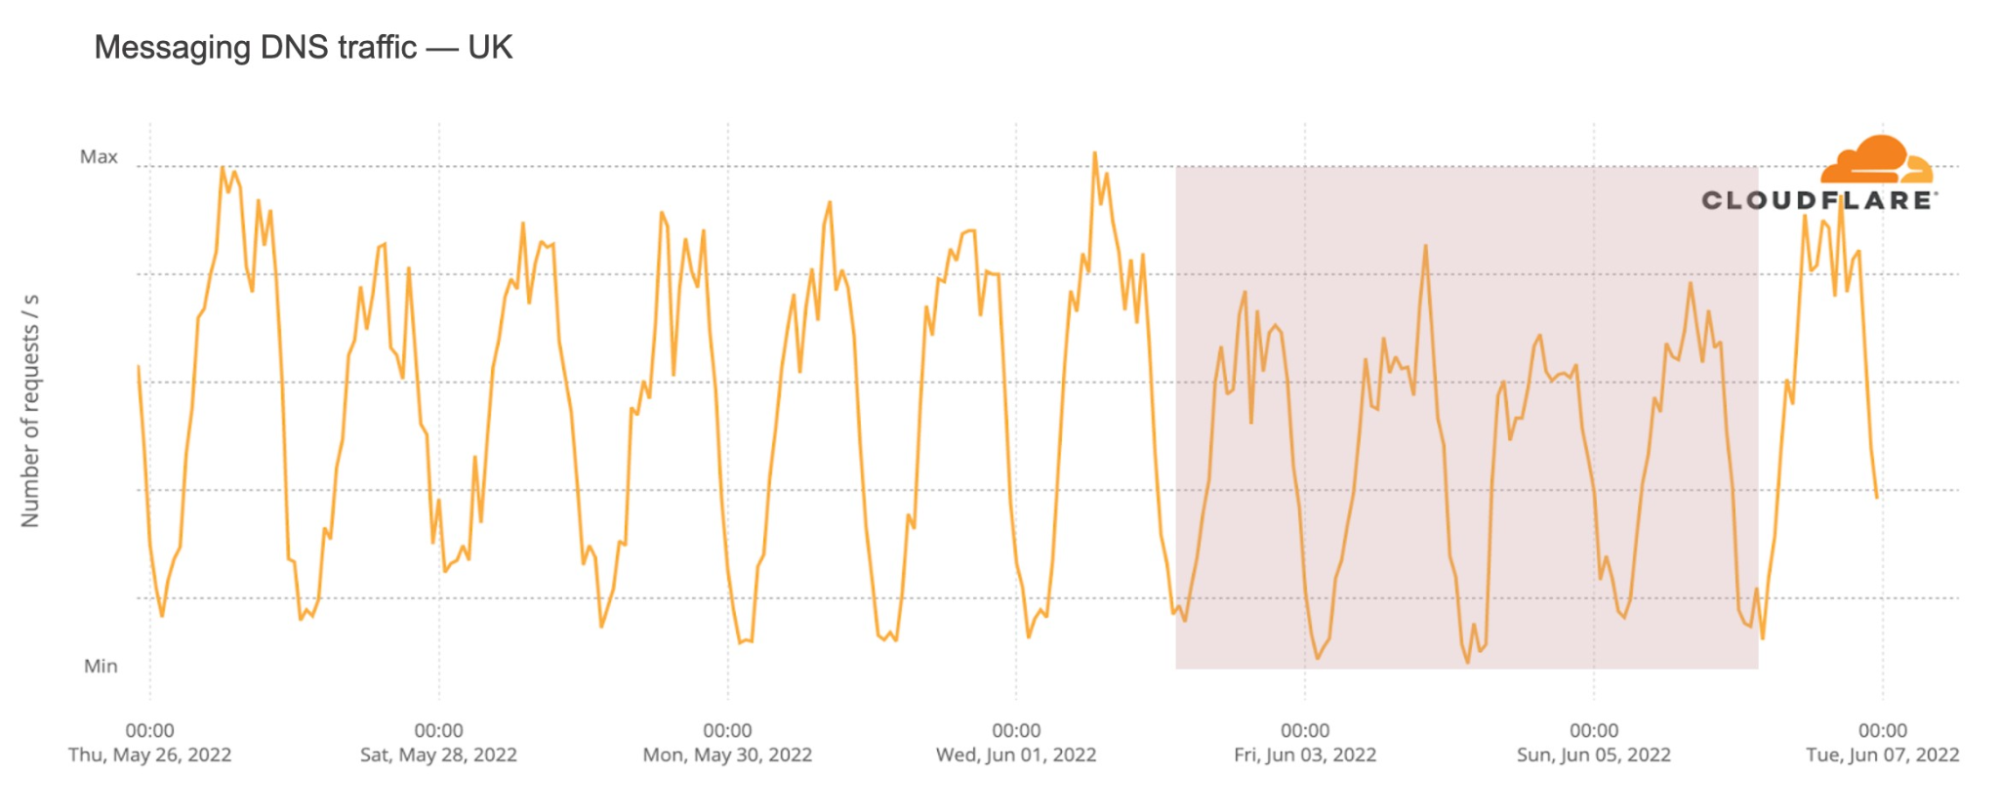
Messaging, on the other hand, had consistently much lower traffic during the four-day bank holiday, even compared to the previous weekend. Saturday, June 4, was the day with less messaging DNS traffic, at least of the two weeks period we’re observing. At 11:00 Saturday, traffic was 18% lower than in the previous period, the same level of lower DNS requests at 15:00 and through most of the day.
Conclusion: celebrations and events ‘move’ the Internet
When there’s a big country-wide celebration going on, especially one that has a lot of outdoor events and activities, Internet patterns do change. That happens, in this case, for a monarch whose reign began in 1952, when there wasn’t any Internet (it took more than 40 years for the network of networks that can connect us all on Earth to reach its more popular global form).
As we celebrate the eighth anniversary of Project Galileo, we want to provide a view into the type of cyber attacks experienced by organizations protected under the project. In a year full of new challenges for so many, we hope that analysis of attacks against these vulnerable groups provides researchers, civil society, and targeted organizations with insight into how to better protect those working in these spaces.
For this blog, we want to focus on attacks we have seen against organizations in Ukraine, including significant growth in DDoS attack activity after the start of the conflict. Within the related Radar dashboard, we do a deep dive into attack trends against Project Galileo participants in a range of areas including human rights, journalism, and community led non-profits.
For this dashboard, we analyzed data from July 1, 2021 to May 5, 2022 from 1,900 organizations from around the world that are protected under the project.
For DDoS attacks, we classify this as traffic that we have determined is part of a Layer 7 (application layer) DDoS attack. Such attacks are often malicious floods of requests designed to overwhelm a site with the intention of knocking it offline. We block the requests associated with the attack, ensuring that legitimate requests reach the site, and that it stays online.
For traffic mitigated by the web application firewall, this is traffic that was determined to be malicious and was blocked by Cloudflare’s firewall. We provide free Business level services under Project Galileo, and our WAF is one of the valuable tools used to mitigate attempts to exploit vulnerabilities intended to gain unauthorized access to an organization’s online application.
For graphs that represent changes in traffic or domains under Project Galileo, we are using the average daily traffic (number of requests) of the first two weeks of July 2021 as the baseline.
Highlights of past year
We continue to see cyberattack activity increase, with nearly 18 billion attacks between July 2021 and May 2022. This is an average of nearly 57.9 million cyberattacks per day over the last nine months, an increase of nearly 10% over last year.
Mitigated DDoS traffic targeting organizations in Ukraine reached as much as 90% of total traffic during one significant attack in April.
After the war in Ukraine started, applications to the project increased by 177% in March 2022.
Journalism and media organizations in Europe and the Americas saw traffic grow ~150% over the last year.
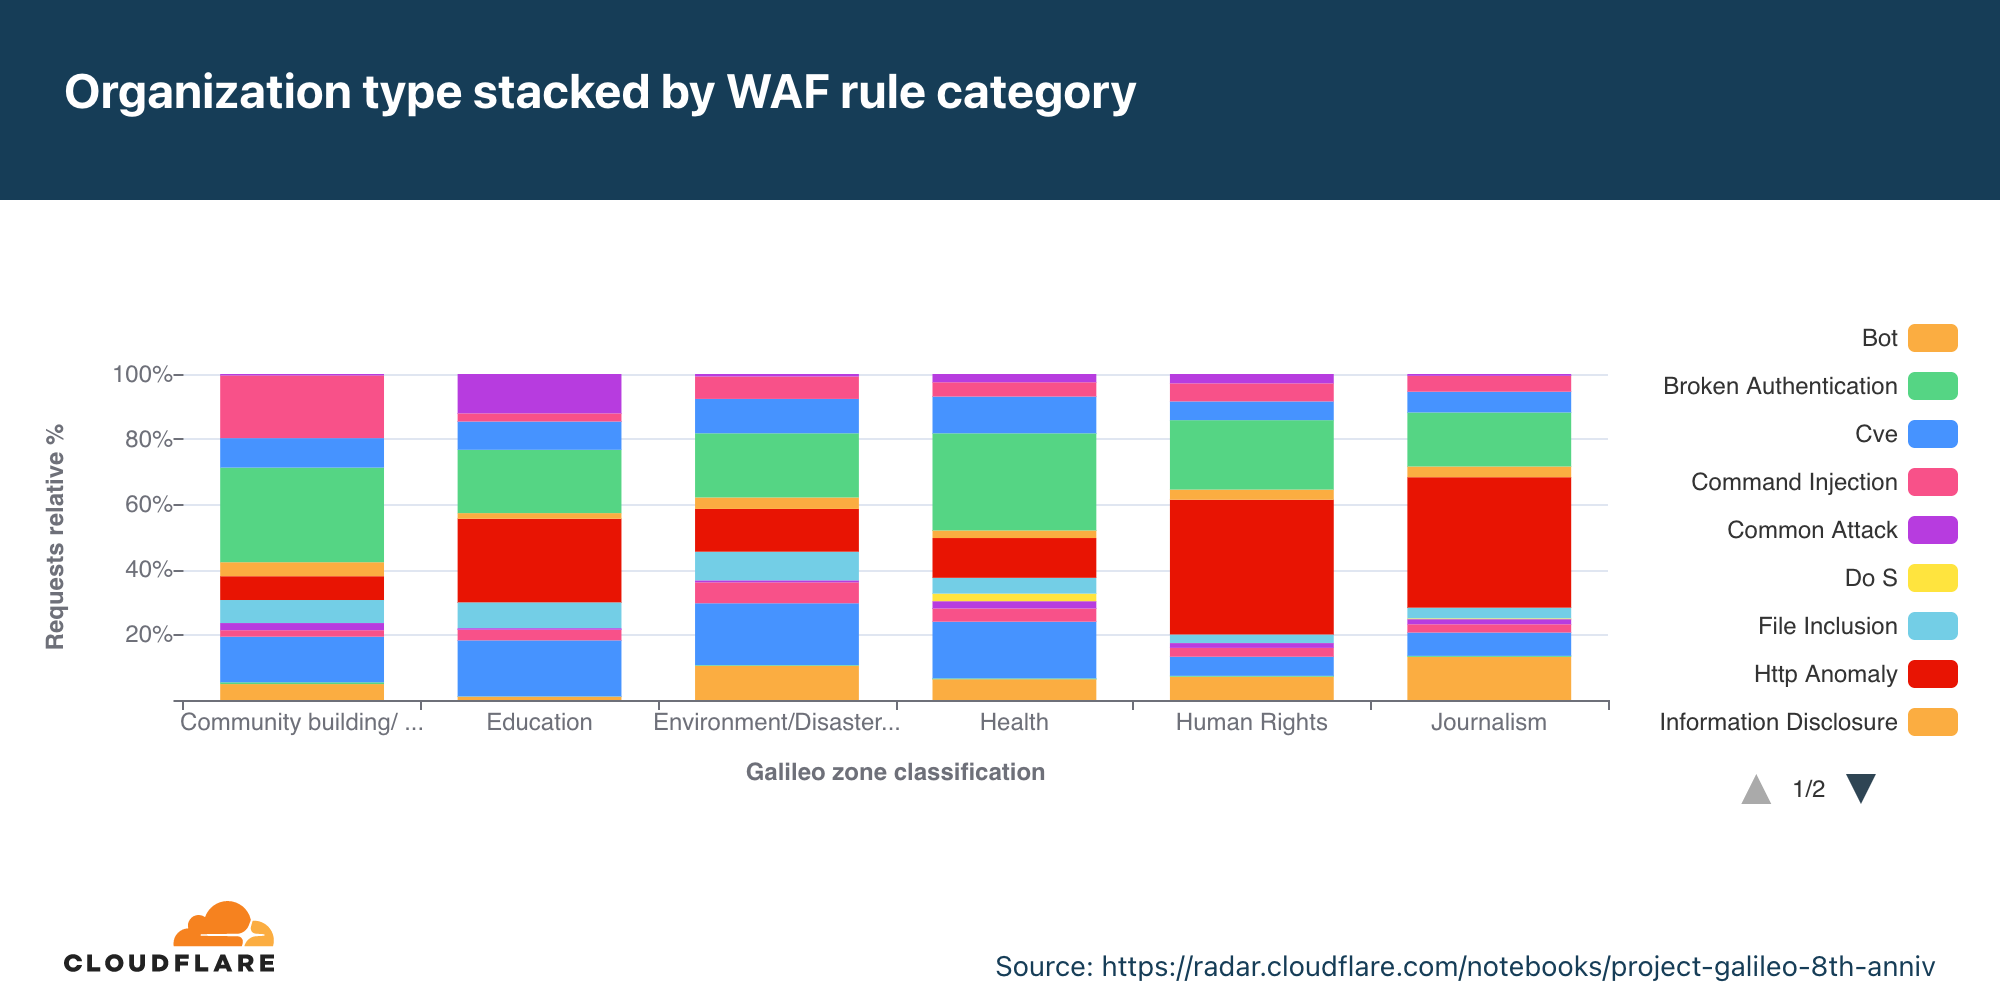
We see a range of unsophisticated cyberattacks against organizations that work in human rights and journalism. Up to 40% of WAF mitigated requests were classified as HTTP Anomalies, the largest of any WAF rule type, a type of attack that can be damaging to unprotected organizations but is automatically blocked by Cloudflare.
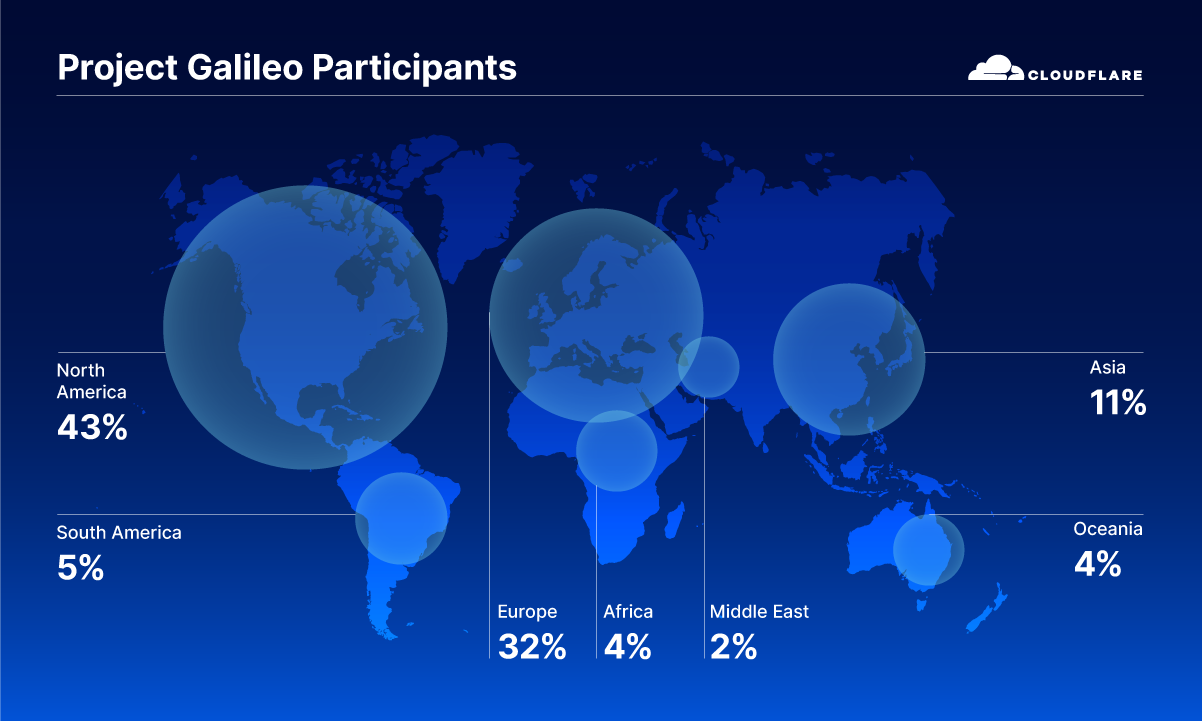
From July 2021 to May 2022, organizations based in Europe consistently accounted for half to two-thirds of request traffic out of all the regions covered under the project.
Global Coverage of Project Galileo
Protecting organizations in Ukraine
As the war started in Ukraine, we saw an increase in applications for participation in Project Galileo from organizations looking for our assistance. Many came in while under DDoS attack, but we also saw sites subject to large influxes of traffic from people on the ground in Ukraine attempting to access information due to the ongoing Russian invasion. While traffic from organizations in Ukraine was largely flat before the start of the war, since that time, traffic increases primarily have been driven by organizations that work in journalism and media.
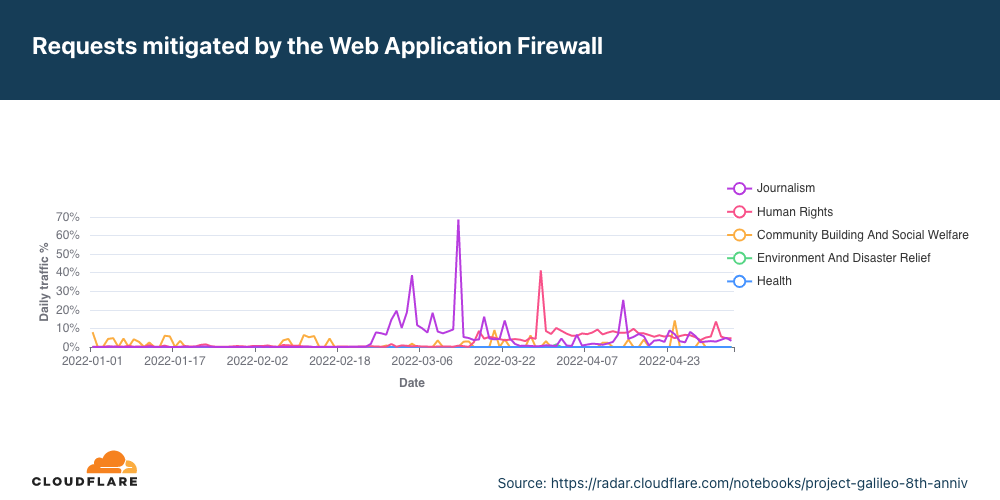
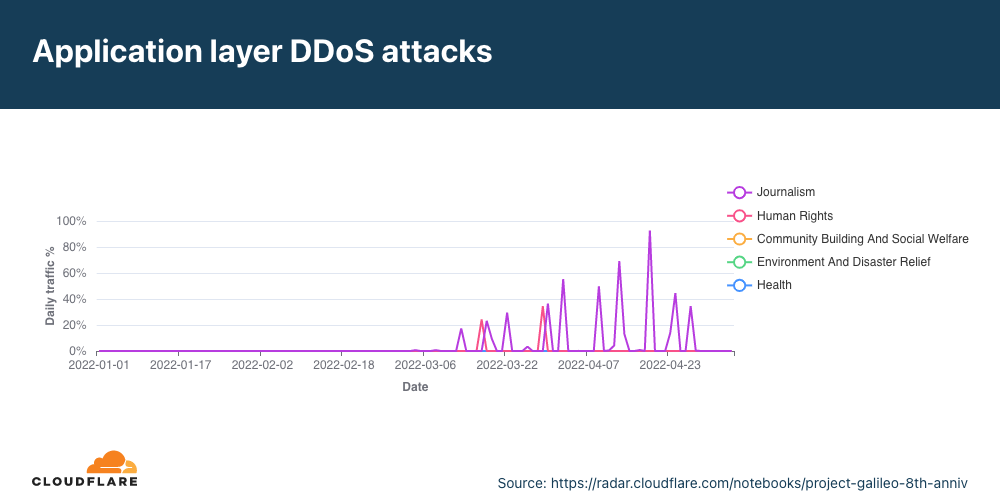
Ahead of the war, organizations that work in community building/social welfare, such as those who provide direct assistance to refugees, or provide donation platforms to support those in Ukraine were responsible for what little traffic that was mitigated by the web application firewall (WAF). However, after the war began, journalism organizations saw the most WAF-mitigated traffic, with frequent spikes, including one on March 13 representing 69% of traffic. During this period of increased WAF-mitigated requests that started in late February, the majority of the attacks were classified as SQLi. WAF mitigated traffic for human rights organizations increased in mid-March, growing to between 5-10% of traffic.
Mitigated DDoS traffic for organizations in Ukraine was concentrated in the mid-March to May timeframe, with rapid growth in the percentage of traffic it represents. The first spikes were in the 20% range, but rapidly grew before receding, including an attack on April 19 that accounted for over 90% of traffic that day.
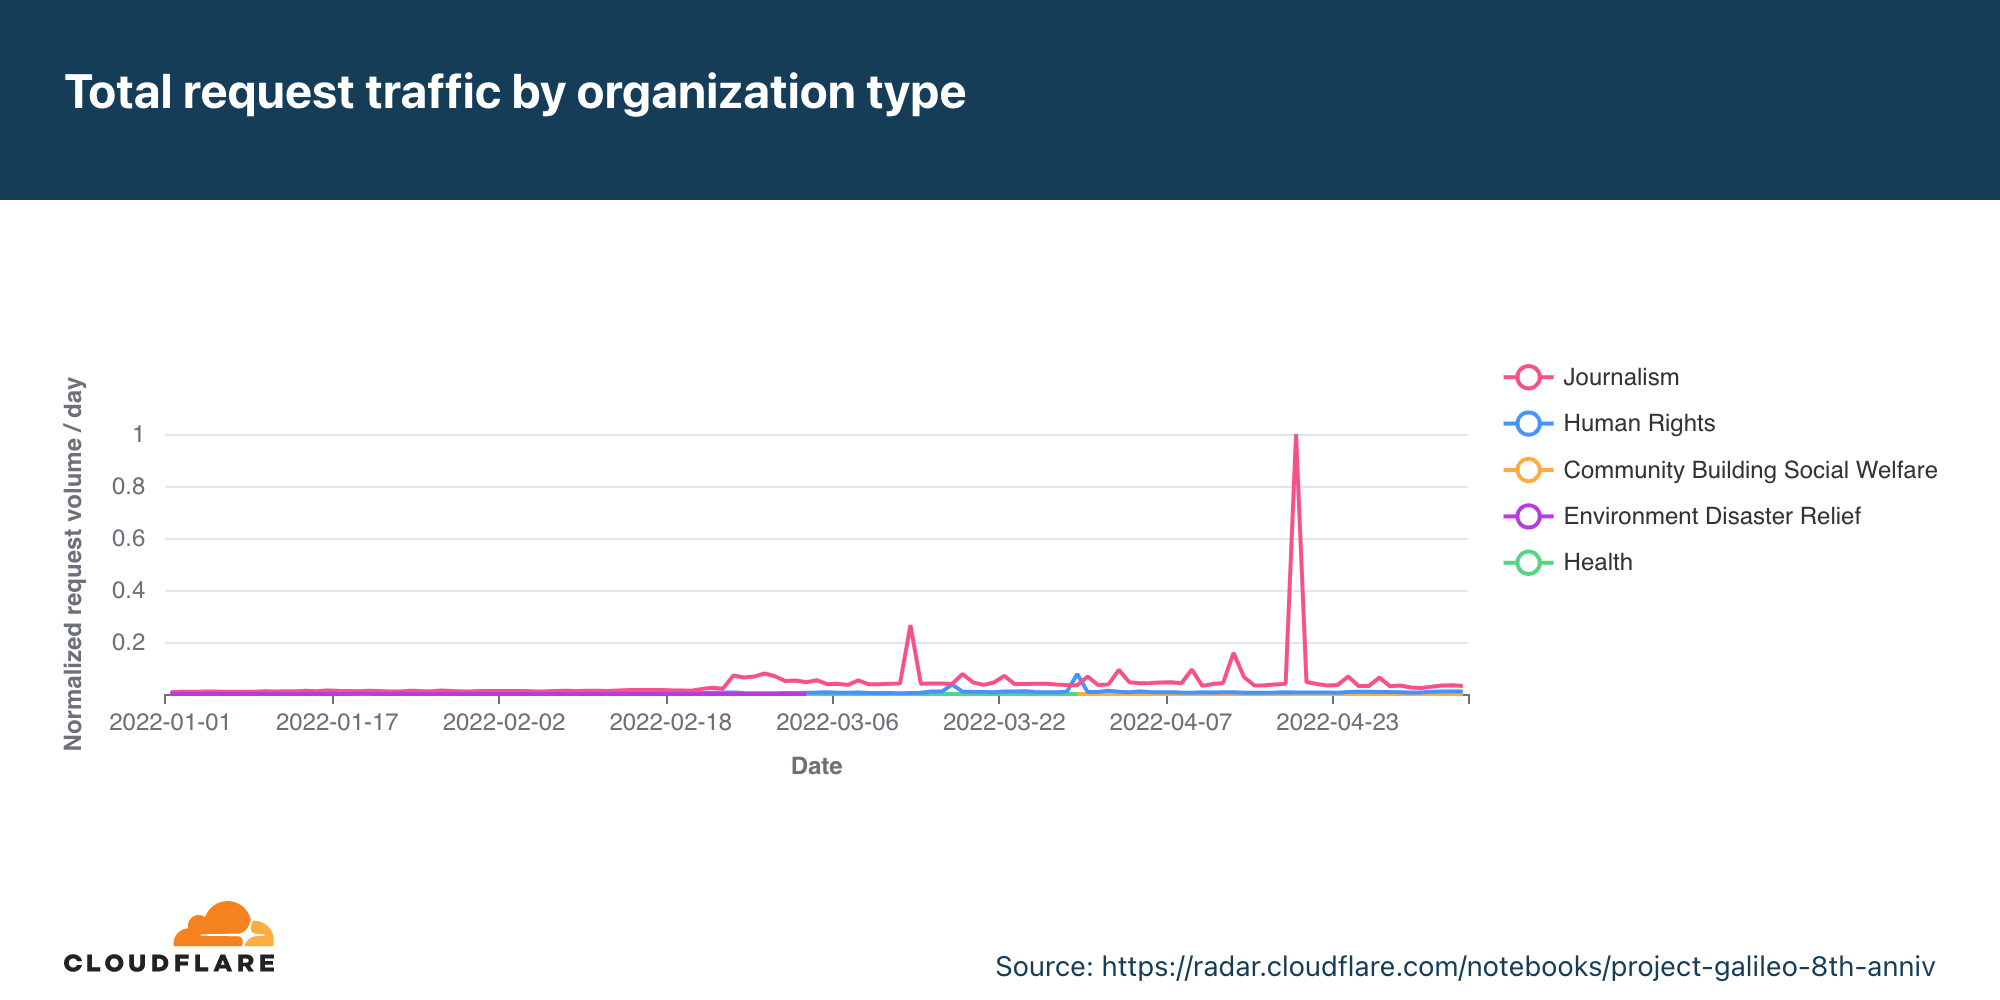
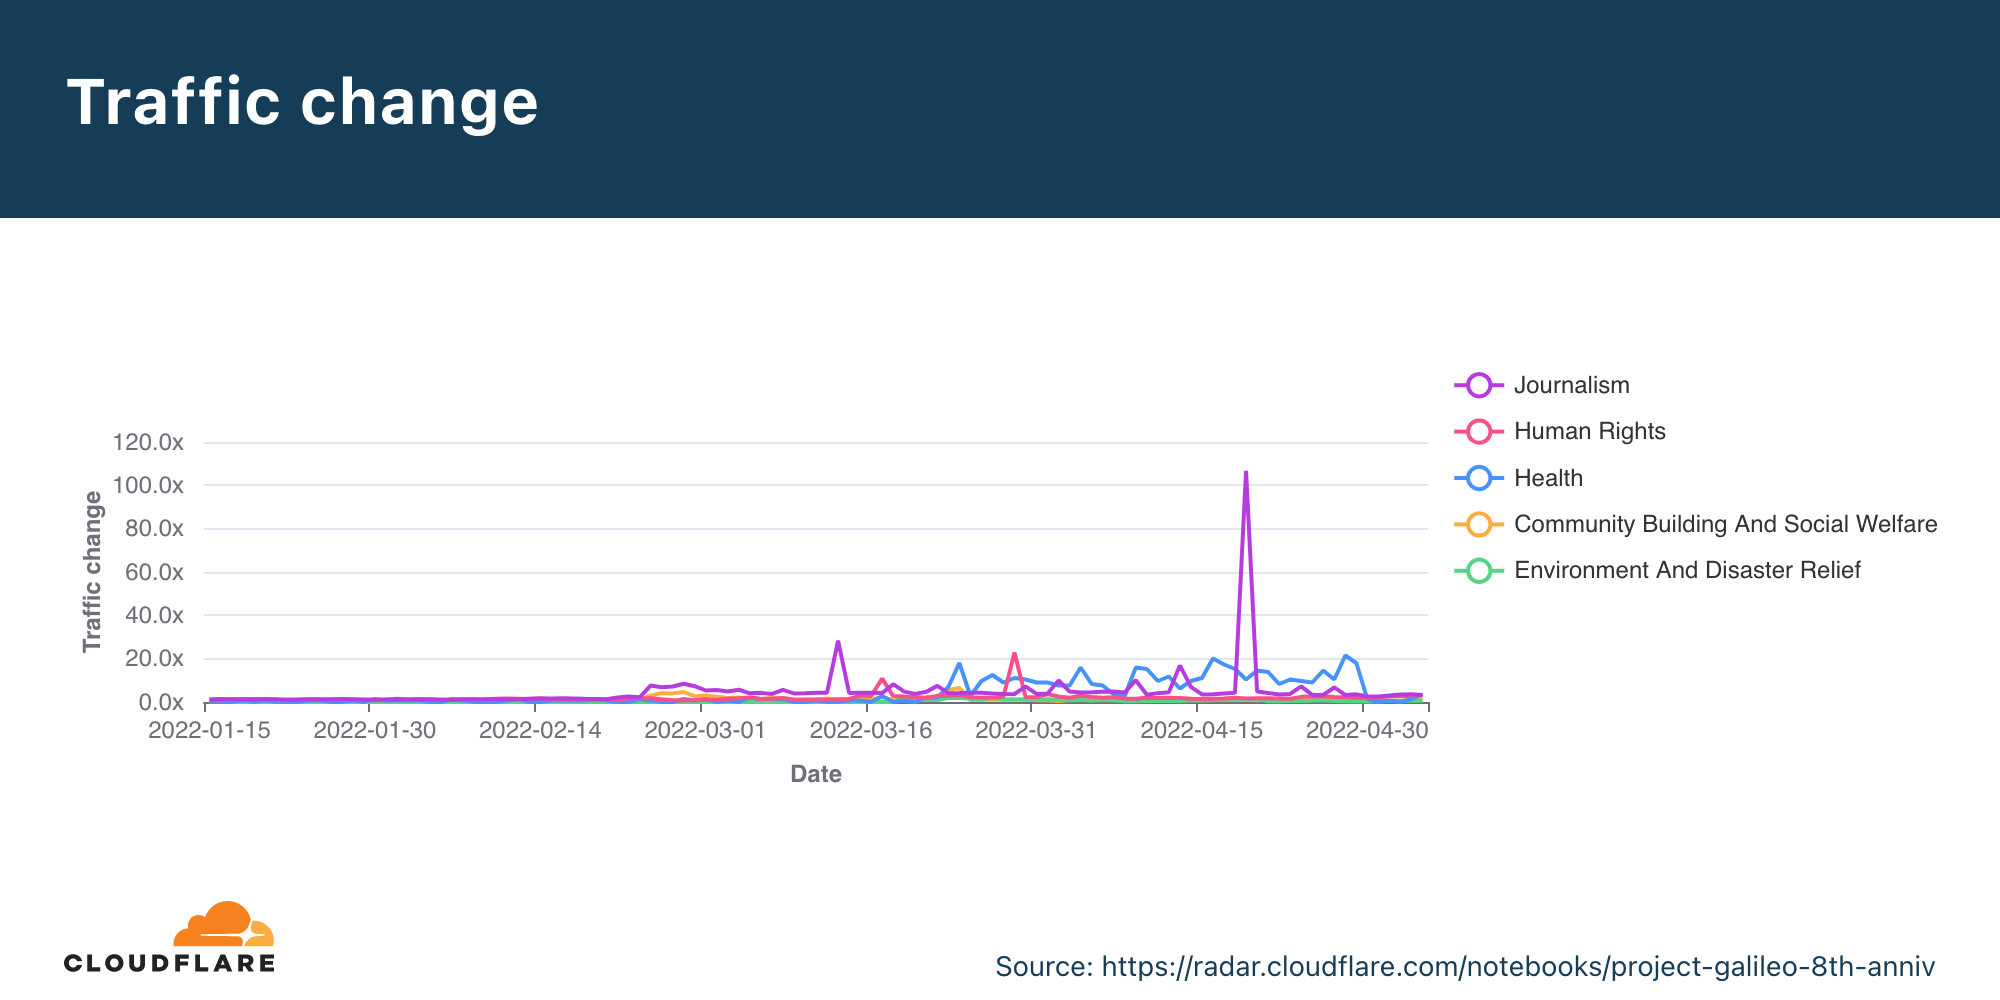
Since the start of the war, growth in traffic from protected organizations has varied across the categories. Traffic among Health organizations increased by 20-30x over baseline between late March and later April. Setting aside attack spikes, traffic from Journalism organizations was generally up 3-4x over baseline. Growth in the other categories was generally below 3x.
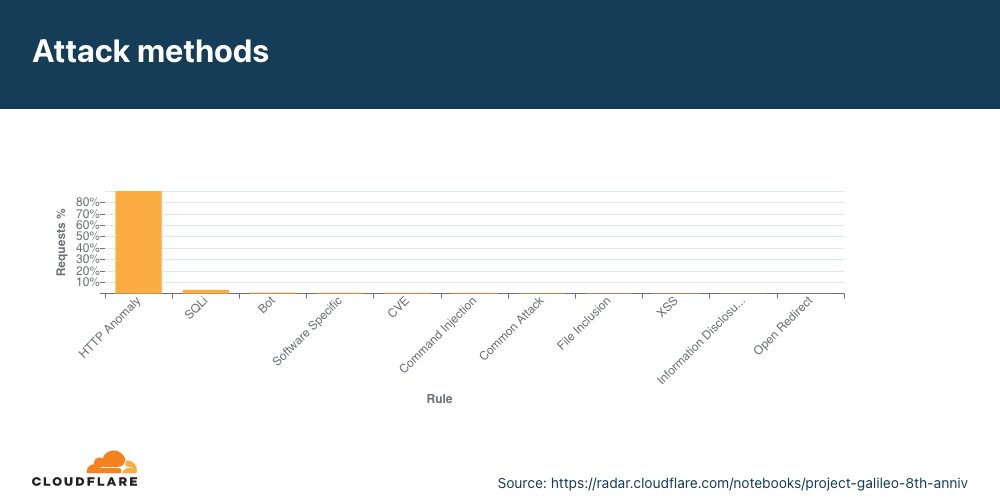
For traffic mitigated by the web application firewall (WAF), the most frequently applied rule was HTTP Anomaly, associated with 92% of requests. Requests for Web content (HTTP requests) have an expected structure, set of headers, and related values. Some attackers will send malformed requests, including anomalies like missing headers, unsupported request methods, using non-standard ports, or invalid character encoding. These requests are classified as “HTTP anomalies”. These anomalous requests are frequently associated with unsophisticated attacks, and are automatically blocked by Cloudflare’s WAF.
With the ongoing war, we continue to onboard and provide protection to organizations in Ukraine and neighboring countries to ensure they have access to information. Any Ukrainian organizations that are facing attack can apply for free protection under Project Galileo by visiting www.cloudflare.com/galileo, and we will expedite their review and approval.
Attack methods based on region
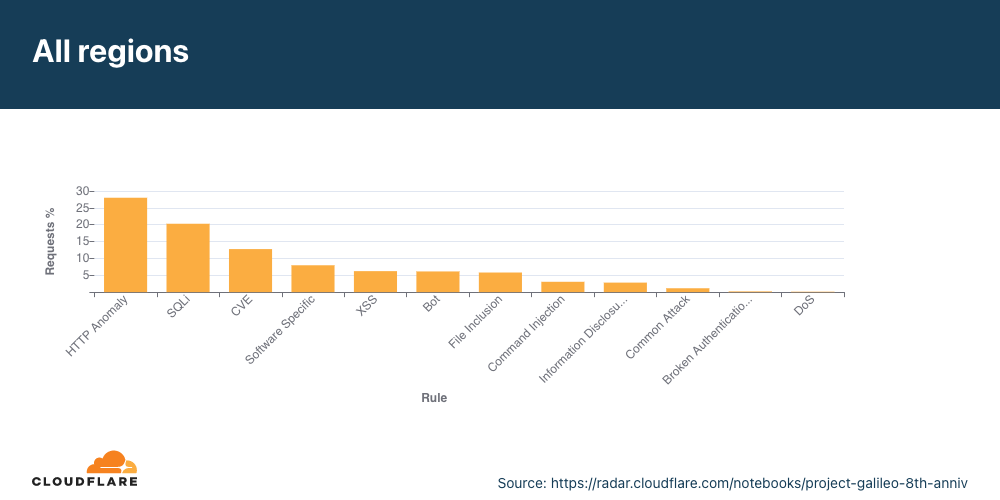
Across the Americas, Asia Pacific, Europe, and Africa/Middle East regions, the largest fraction (28%) of mitigated requests were classified as “HTTP Anomaly”, with 20% of mitigated requests tagged as SQL injection attempts and nearly 13% as attempts to exploit specific CVEs. CVEs are publicly disclosed cybersecurity vulnerabilities. Cloudflare monitors new vulnerabilities and quickly determines which require additional rulesets to protect our users. Depending on the vulnerability, they can be sophisticated attacks but depend on the severity, identification and response by security professionals.
In our previous report, we identified similar attack trends with SQLi injection and HTTP anomalies, classified as User agent anomalies, making up a large part of mitigated requests.
Attacks methods by on organization type
We protect a range of organizations under Project Galileo. For this dashboard, we categorized them in 6 groups: community building/social welfare, education, environmental/disaster relief, human rights and journalism. To help understand threats against these groups, we broke down the types of attacks we saw that were mitigated by the web application firewall. A majority of the mitigated traffic is from HTTP anomalies and SQLi (SQL injection).
SQLi is an attack technique designed to modify or retrieve data from SQL databases. By inserting specialized SQL statements into a form field, attackers attempt to execute commands that allow for the retrieval of data from the database, modification of data within the database, the destruction of sensitive data, or other manipulative behaviors.
Learn more on the 8th Anniversary Radar DashboardSee the full report on attack trends we observed against a wide range of organizations protected under Project Galileo.
There’s only one song contest that is more than six decades old and not only presents many new songs (ABBA, Celine Dion, Julio Iglesias and Domenico Modugno shined there), but also has a global stage that involves 40 countries — performers represent those countries and the public votes. The 66th edition of the Eurovision Song Contest, in Turin, Italy, had two semi-finals (May 10 and 12) and a final (May 14), all of them with highlights, including Ukraine’s victory. The Internet was impacted in more than one way, from whole countries to the fan and official broadcasters sites, but also video platforms.
On our Eurovision dedicated page, it was possible to see the level of Internet traffic in the 40 participant countries, and we tweeted some highlights during the final.
— Cloudflare Radar (@CloudflareRadar) May 14, 2022
First, some technicalities. The baseline for the values we use in the following charts is the average of the preceding week, except for the more granular minute by minute view that uses the traffic average of May 9 and 10 as baseline. To estimate the traffic to the several types of websites from the 40 participating countries, we use DNS name resolution data. In this blog post, we’re using CEST, Central European Summer Time.
It’s not often that an entertainment event has an impact on a country’s Internet. So, was there an impact on Eurovision nights?
Let’s start with aggregate Internet traffic to the 40 participant countries (Australia included). In the first May 10 semi-final, there seems to be a slight decrease in traffic during the contest — it makes sense if we think that most people were probably watching the broadcast on national TV (and not on YouTube, that was also transmitting live the event). Traffic was lower than in the previous period between 21:00 and 23:00 (the event was between 21:00 to 23:14), but it was back to normal at 23:00.
For the second semi-finalthat trend is less clear. But the May 14 final (that lasted from 21:00 CEST to 01:10) told a different story. Traffic was 6% lower than on the previous Saturday after 21:00, mostly around 22:00, and after 23:15 it was actually higher (between 4% and 6%) than before and continued that way until 02:00.
What happened at that 23:15 time in Eurovision? The last of the 25 songs at the contest was Estonia’s “Hope”, by Stefan, and it ended at 23:14 (also in this blog post we will also see how 23:16 was the highest spike in terms of DNS traffic to fan websites during the final). This is the Internet traffic in the participating countries on May 14 chart:
There were several countries that showed similar impact in terms of traffic change during at least the final. France, UK, Germany, Iceland, Greece and Switzerland are examples.
Eurovision & the UK
The UK was one of the countries where there seems to be more impact during the time of the grand final — last year, according to the ratings, eight million were watching the BBC transmission with the commentator Graham Norton. Traffic started to drop to lower levels than usual at 20:30 (a few minutes before the final) and was 20% lower at 22:00, starting to go closer to normal levels after 23:00, when the set of 25 finalists’ songs came to an end.
Here’s the UK’s Internet traffic trend during the Eurovision May 14 final:
Fan sites: what a difference a winner makes
The most obvious thing to check in terms of impact are the fan websites. Eurovision has many, some general (there’s the OGAE, General Organisation of Eurovision Fans), others more local. And DNS traffic to them was clearly impacted.
The first semi-final, on May 10, had 33x more traffic than in the average of the previous week, with a clear 22:00 CEST spike. But the second semi-final, May 12, topped that, with 42x more traffic at the same time. The final, with the 25 finalists, clearly surpassed that and at 22:00 traffic was already 70x. But because the final was much longer (in the semi-finals it was around 23:00 that the finalists were announced), the peak was reached at 23:00, with 86x more traffic than usual.
“We have a winner. The winner of the Eurovision Song Contest 2022 is… Ukraine!”. — Alessandro Cattelan, Laura Pausini and Mika at 01:01 CEST, May 15, 2022.
Saturday’s final was more than four hours long (the semi-finals took little over two hours), and it finished a few minutes after 01:00 CEST. DNS traffic to fan websites dropped from 86x to 45x at midnight, but it went up again to 49x more traffic when it was already 01:00 CEST in most of Europe and Ukraine was announced the winner of Eurovision 2022. This next chart shows Saturday’s May 14 final traffic change to fan sites:
We can also clearly see that on Sunday morning, at 09:00, there was a 20x peak to fan sites, and also at 11:00 (17%).
Now, let’s go deeper by looking at a minute by minute view (the previous charts show hourly data) of DNS traffic to fan sites. In the two semi-finals it’s easy to see that the moment the finalists were announced, and the event was ending, around 23:12, was when traffic was higher. Here’s what the May 10 (yellow) and May 12 (green) two semi-finals fan sites growth looked like:
We can also spot some highlights in fan sites during the semi-final besides the finalists’ announcement, which we saw were definitely the most popular moments of the two nights. First, on May 10 there was more traffic before the event (21:00) than on May 12, so people seem to have greater expectations of the first Eurovision 2022 event of the week. In terms of spikes (before the winners’ announcements), we created a list of moments in time with more interest to the fan websites and connected them to the events that were taking place at that time in Eurovision (ordered by impact):
First semi-final, May 10 #1. 22:47 Sum up of all the songs. #2. 22:25 Norway’s song (Subwoolfer, “Give That Wolf a Banana”). #3. 21:42 Bulgaria’s song (Intelligent Music Project, “Intention”). #4. 21:51 Moldova’s song (Zdob și Zdub and Advahov Brothers, “Trenulețul”). #5. 22:20 Greece’s song (Amanda Georgiadi Tenfjord, “Die Together”).
Second semi-final, May 12 #1. 21:22 Between Serbia (Konstrakta, “In corpore sano”) and Azerbaijan (Nadir Rustamli, “Fade to Black”). #2. 22:48 Voting period starts. #3. 22:30 Czech Republic’s song (We Are Domi, “Lights Off”). #4. 22:38 Laura Pausini & Mika performing (“Fragile” Sting cover song). #5. 22:21 Belgium’s song (Jérémie Makiese, “Miss You”).
How about the May 14 final? This chart (followed by a ranking list) shows DNS traffic spikes in fan sites on Saturday’s final:
Final, May 14 #1. 23:11 Between Serbia (Konstrakta, “In corpore sano”) and Estonia (Stefan, “Hope”). #2. 23:33 Sum up of all the songs. #3. 23:57 Voting ended. #4. 23:19 Sum up of all the songs. #5. 23:01 Ending of the United Kingdom’s song (Sam Ryder, “Space Man”).
— BBC Eurovision🇬🇧 | 👩🚀#teamSPACEMAN (@bbceurovision) May 15, 2022
(UK’s performer and representative Sam Ryder with Graham Norton, the BBC commentator of Eurovision since 2009 — the BBC broadcasts the event since 1956.)
The broadcasters show
How about official national broadcaster websites? Around 23:00 CEST traffic to the aggregate of 40 broadcasters was generally higher on the semi-finals and final nights (represented in grey on the next chart). That’s more clear on the final at 23:00, when DNS traffic was 18% higher than in the previous Saturday (and 50% compared to the previous day). During the semi-finals the difference is more subtle, but at 23:00 traffic in both May 10 and 12 traffic was ~6% higher than in previous days.
When we focus on the minute by minute view also on the broadcaster sites but on the three Eurovision evenings, the highest growth in traffic is also during the final (like we saw in the fan sites), mainly after 23:00, which seems normal, considering that the final was much longer in time than the semi-finals that ended around that time.
During the final (represented in pink in the previous chart), there were some clear spikes. We’ve added them to a ranking that also shows what was happening in the event at that time.
Broadcaster site spikes. Final, May 14 #1. 21:52 Best moments clip of the two semi-finals #2. 21:00 Contest starts #3. 00:24 Sam Ryder, the UK representative (with the song “Space Man”) being interviewed after reaching the #1 in the voting process. #4. 01:09 Ukraine’s (Kalush Orchestra, “Stefania”) performance as the winner #5. 01:02 Ukraine was announced as the Eurovision 2022 winner.
Video platforms: the post-final growth
Eurovision uses video platforms like YouTube and TikTok to share all the songs, clips of the events and performers and there was also a live transmission on YouTube of the three nights. Given that, we looked at DNS traffic to the video platforms in an aggregate for the 40 participating countries. So, was there an impact to this well known and high performing social and video platforms? The short answer is: yes.
The final was also the most evident example, especially after 23:15, when all the 25 finalists songs already performed and the event had two more hours of non-participant performances, video clips that summarize the songs and the voting process — the famous moment in Europe to find out who will get from each of the 40 participant countries the maximum of 12 points.
In this comparison between the semi-finals and final day, we can see how on May 10, the day of the first semi-final, video platform traffic had more growth before the contest started, which is not that surprising given that it was the first Eurovision 2022 event and there was perhaps curiosity to check who were the other contestants (by then Eurovision had videos of them all on YouTube).
But the May 14 final shows more DNS traffic growth than the other Eurovision days after 23:16 (as we saw before, that was the time when all the finalists’ songs had already been performed). The difference in traffic compared to the semi-finals was higher at 1:11 CEST. That was the moment that the final came to an end on Saturday night, and at that time it reached 31% more traffic to video platforms than on May 10, and 38% than on May 12.
Australia’s impact (with an eight hours difference)
Australia was one of the 40 participants, and it had a major time difference (there’s an eight-hour difference to CEST). Continuing to look at video platforms, DNS traffic in Australia was 22% higher at 23:00 CEST (07:00 local time) than it was in the previous Saturday and continued high around 17% of increase a few hours after. Before the 23:00 peak, traffic was 20% higher at 22:00 and 17% at 21:00, when the event was beginning.
The winners & social media
Social media in general in the 40 participating countries wasn’t as impacted, but there was a 01:00 CEST spike during the final at around the time the decision to choose the winner was between Ukraine and the UK — at 01:01 Ukraine was announced the winner of Eurovision 2022.
We can also see an impact on social media in Ukraine, when Kalush Orchestra’s “Stefania” song was announced the winner at Saturday’s, May 14, final (it was already after midnight, May 15). The usual traffic slowing down night trend that is seen in other days was clearly interrupted after 01:02 CEST (02:02 local time in Ukraine).
Conclusion: the Eurovision effect
When an event like Eurovision happens, there are different patterns on the Internet in the participating countries, usually all in Europe (although this year Australia was also there). Fan and broadcaster websites have specific impact because of the event, but in such a multimedia event, there are also some changes in video platforms’ DNS traffic.
And that trend goes as far as the Internet traffic of the participating countries at a more general level, something that seems to indicate that people, at least for some parts of Eurovision and in some countries, were more focused on their national TV broadcast.
What happens to the Internet traffic in countries where many observe Ramadan? Depending on the country, there are clear shifts and changing patterns in Internet use, particularly before dawn and after sunset.
This year, Ramadan started on April 2, and it continued until May 1, 2022, (dates vary and are dependent on the appearance of the crescent moon). For Muslims, it is a period of introspection, communal prayer and also of fasting every day from dawn to sunset. That means that people only eat at night (Iftar is the first meal after sunset that breaks the fast and often also a family or community event), and also before sunrise (Suhur).
In some countries, the impact is so big that we can see in our Internet traffic charts when the sun sets. Sunrise is more difficult to check in the charts, but in the countries more impacted, people wake up much earlier than usual and were using the Internet in the early morning because of that.
Cloudflare Radar data shows that Internet traffic was impacted in several countries by Ramadan, with a clear increase in traffic before sunrise, and a bigger than usual decrease after sunset. All times in this blog post are local. The data in the charts is bucketed into hours. So, for example, when we show an increase in traffic at 0400 we are showing that an increase occurred between 0400 and 0459 local time.
Indonesia is a clear example of that, showing trends that continued until the end of Ramadan:
In the next table, we show a country ranking by order of impact. Here, we include traffic changes before dawn and after sunset. In the last column, you can also see the change in traffic after Ramadan ended, right after sunset. In this case, we’re looking at Wednesday, May 4, right after the Eid al-fitr — the May 2-3, 2022 holiday of breaking the fast, in a comparison with the previous Wednesday at the same time (when Ramadan was ongoing):
Internet traffic: Ramadan’s impact
Before sunrise
After sunset
Post-Ramadan, May 4 (after sunset)
Afghanistan
+203%
-28%
+20%
Pakistan
+119%
-39%
+13%
Indonesia
+98%
-13%
–
Morocco
+90%
-36%
+44%
Libya
+81%
-27%
+48%
Turkey
+78%
-19%
+22%
Bangladesh
+62%
-40%
+12%
Saudi Arabia
+55%
-45%
-5%
United Arab Emirates
+52%
-13%
+4%
Bahrain
+44%
-31%
+21%
Malaysia
+41%
-8%
-9%
Qatar
+35%
-23%
+5%
Egypt
+31%
-32%
+56%
Tunisia
+25%
-43%
+101%
Iran
+24%
+10%
-12%
Singapore
+8%
-5%
+4%
India
–
-15%
–
Afghanistan, Pakistan, Indonesia, Morocco, Libya and Turkey had the biggest impact in an increase in traffic before sunrise. After sunset, it was (by order of impact) Saudi Arabia, Tunisia, Bangladesh, Pakistan that showed a more clear decrease in traffic after sunset.
Here’s the impact of the start of Ramadan on Bangladesh, with more highlights inside the next chart:
Waking up earlier
There’s a clear pattern in most of the countries, Internet traffic was much higher than usual between 04:00 to 04:59 local time (where usually it’s the time with the lowest traffic).
The same early spike is seen in Turkey and the United Arab Emirates. In the case of the United Arab Emirates, the time before sunrise for the Suhur meal had more mobile usage than usual (so people were using their mobile devices to access the Internet more than usual at that time).
That’s also the case for Pakistan, where traffic is 119% higher on the 04:00 to 04:59 hour on April 3, than on the previous Sunday, but also in Qatar (sunrise at 05:25 and a spike of 35%) or Afghanistan. In the latter, the spike is 203% higher:
We also saw the same trend in Indonesia, sunrise was at 05:55 local time at the beginning of April, and there’s a clear spike in traffic in the 04:00 to 04:59 hour with a 98% growth in requests.
Northern African countries like Egypt, Tunisia, Morocco or Libya (sunrise at 06:54), show the same 04:00 to 04:59 hour spike. In Libya, traffic was 81% higher on Sunday, April 3, than it was the previous Sunday at the same time. Usually, the 04:00 to 04:59 hour is the lowest point in traffic in the country, but on April 3 and the following days it was at 08:00.
Saudi Arabia shows a similar pattern in terms of Internet traffic on Sunday, April 3, 2022, sunrise was at 05:44, and there was 55% more Internet use than at the same time on the previous Sunday, before Ramadan.
Does daily total Internet traffic go up or down?
The short answer is: depends on the country, given that there are examples of a general increase and decrease in traffic in the most impacted countries. We see similar trends for the sunset and sunrise times of day, but it’s a different story throughout the 30 days of Ramadan.
Iran, in general, shows an increase in traffic after Ramadan started on April 2, and a decrease after it ended on May 3 (of around 15%).
Something similar is seen in Pakistan, that had a general decrease in traffic the week after Ramadan ended, but during the 18:00 to 18:59 hour, May 4, had 13% more traffic than at the same time on the previous Wednesday, when Ramadan was being observed and the iftar meal would have happened during the 18:00 to 18:59 hour.
The opposite happens in Libya, where traffic, generally speaking, declined during Ramadan and picked up after — comparing Wednesday, May 4, 2022, with the previous one during the 19:00 to 19:59 hour, traffic grew around 48%. The same trend is seen in another North African country: Morocco (growth of 44% after Ramadan ended).
After Ramadan, sunsets ‘bring’ more Internet traffic
Another pattern, unsurprisingly, that our chart at the beginning of this blog post shows is how the sunset period changes when Ramadan (and the holiday that follows) ends, in most cases clearly increasing traffic at around 18:00 or 19:00.
Of the 16 countries with a bigger Ramadan impact, only four had a decrease in traffic after sunset on May 4: Iran, Indonesia, Saudi Arabia and Malaysia. All of these countries had an increase (or sustained traffic) in daily traffic during Ramadan and lost daily Internet usage after it ended (in May).
Here’s the example of Indonesia through the Ramadan period that includes April and May:
And a zoomed-in Indonesia chart after Ramadan ended (May 1, but bear in mind that May 2-3 is the holiday Eid al-fitr) that shows not only the general decrease in traffic, but also how the sunset period doesn’t have a clear drop in requests as seen in the Ramadan period:
Conclusion: a human impact
Ramadan has a clear impact on Internet traffic patterns as humans change their habits.
The Internet may be the network of networks, where there are many bots (friendly and less friendly), but it continues to be a human-powered network, made by humans for humans.
The Eurovision Song Contest has a history that goes back to 1956, so it’s even older than the European Union and one of its highlights over the years was being the first global stage for the Swedish group ABBA — Waterloo won the 1974 edition). This year, for the 66th edition, we have a dedicated page for Eurovision fans, journalists or anyone interested in following Internet trends related to the event taking place in Turin, Italy.
The contest consists of two semi-finals and a final. The first semi-final is today, May 10, at 21:00 CEST, the second is Thursday, May 12, at 21:00 CEST. And the final is on Saturday, May 14, at 21:00 CEST. We are using Central European Summer Time and not our usual (on Radar) UTC because that’s the timezone of most of the 40 countries that will take part in the contest. There will be 17 countries in the first semi-final, 18 in the second, and 25 in the final (the full list is here).
From countries to fan sites.
First, you can see the Internet traffic aggregate in all the 40 countries that are participating in Eurovision 2022. There’s also a toggle to choose each of the 40 countries regarding Internet traffic. If you pass the mouse over the traffic line, the traffic level hour by hour is also highlighted.
Then, we use DNS name resolution data to estimate traffic from the 40 participating countries to several types of websites. We have a video platforms chart as Eurovision has content on major video platforms. The baseline for the values we use is the average of the previous week, represented in the charts.
We also show social media trends in the participating countries, by hour, to see if the Eurovision semi-finals and final cause a change.
The contest has a large base of fan websites (there’s even the OGAE, General Organisation of Eurovision Fans), and we also have a chart for Eurovision fan sites. In this chart, yesterday at 20:00 CEST, traffic was already at its highest since May 1, with 6.22x more than the average of the previous week (that’s the baseline here).
Last, but not least, we also show the impact on national official broadcasters’ websites from the participating countries. For all the charts, there’s a download button to save the image file like this:
For this evening’s first semi-final, Portugal is participating and since we’re writing this blog post from our Lisbon office, I asked everyone’s favorite songs for the 2022 Eurovision edition. Norway’s song from Subwoolfer, Give That Wolf A Banana, was one of the favorites, followed by Portugal’s song from MARO, Saudade, Saudade.
The UK’s song from Sam Ryder, SPACE MAN, is automatically in Saturday’s final and was also praised at the Lisbon office, the same with France’s song from Alvan & Ahez, called Fulenn, where the group sings in their native language, Breton (from the French region of Brittany).
The Internet is not only a human right according to the United Nations, and a way to get information, but it has also become an important element in geopolitical conflicts, like the war going on in Ukraine. We have previously written about Ukrainians moving westward to escape the war and Internet outages in the country, but also about the importance of the open Internet in Russia.
Over this past week, we observed an outage in the occupied city of Kherson, south Ukraine, coupled with an apparent shift in who controls the Internet within the region. First, let’s give some context and show what we saw.
The Russian-occupied Kherson (a city of 280,000 people) experienced an Internet outage on Saturday, April 30, 2022, that began just after 16:00 UTC. The outage lasted until Wednesday, May 4, with traffic starting to return around 04:30 UTC traffic.
In the chart below, we can see that there was a 43% decrease in traffic from Kherson from February 23 to 24, after the war started. However, this weekend’s outage is the most significant disruption to Internet traffic in Kherson since the start of the war.
According to Ukraine’s vice Prime-Minister, Mykhailo Fedorov, and also the State Service of Special Communications and Information Protection, on Wednesday morning, May 4, “the communication cut off by the occupiers in Kherson and Kherson region was restored” using “backup power channels”. The reasons presented for the lack of communication “were interruptions of fiber-optic trunk lines and disconnection from the power supply of equipment of operators in the region”.
Yuriy Shchyhol, head of the organization, also said during a briefing that the occupiers had connected Ukrainian Internet users to the Russian network by switching fiber-optic lines and communication stations. “This is a gross violation of international law. We have already appealed to the International Telecommunication Union to impose sanctions on the Russian Federation”, he explained.
Shift in routing
Around the time that the outage referenced above began, we also observed a shift in routing for the IPv4 prefix announced by AS47598 (Khersontelecom). As shown in the table below, prior to the outage, it reached the Internet through several other Ukrainian network providers, including AS12883, AS3326, and AS35213. However, a day later, its routing path now showed a Russian network, AS201776 (Miranda) as the upstream provider. The path through Miranda also includes AS12389 (Rostelecom), which bills itself as “the largest digital services provider in Russia”. This aligns with the claims noted above about connecting Ukrainian Internet users to the Russian network.
Peer AS
Last Update
AS Path
AS1299 (TWELVE99 Arelion, fka Telia Carrier)
5/1/2022 16:02:26
1299 12389 201776 47598
AS6777 (AMS-IX-RS)
4/28/2022 11:23:33
12883 47598
Because Cloudflare uses Anycast to route content requests to data centers on our network, routing changes such as this one can impact data center selection. This is clearly evident in the graph below. Prior to the outage, when Khersontelecom reached the Internet through other Ukrainian providers, requests from the network were handled by Cloudflare data centers in Kyiv, Ukraine and Frankfurt, Germany. On May 1, after the Russian network began to route traffic for Khersontelecom, requests were sent to our Moscow data center.
These requests continued to be handled by our Moscow data center for approximately three days. However, the graph also shows that traffic started being handled again by the Kyiv and Frankfurt data centers, with the Moscow data center no longer in the mix, around 06:00 UTC on May 4. This aligns with the observed update to the routing path for AS47598 shown in the table below – it no longer had Russian networks as upstream providers, but instead returned to reaching the Internet through other Ukrainian networks.
Peer AS
Last Update
AS Path
AS174 (COGENT-174)
5/4/2022 05:56:27
174 3326 3326 3326 47598
AS1273 (CW Vodafone Group PLC)
5/4/2022 03:11:25
1273 12389 201776 47598
Conclusion
As we saw, not only was there an Internet outage in the Kherson region, but there was also a shift in routing at least in one Kherson network that, for a few days, left traffic passing through Russian networks (along with all the restrictions and limitations, such as content blocking, such an arrangement could potentially have).
Availability of and control over physical resources have always been a key focus of war, but it is now clear that Internet resources now hold similar importance during times of conflict. This is also demonstrated by what happened to the Internet in Crimea after the annexation of 2014, as explained in-depth in this 2020 study.
“Our new Constitution is now established, and has an appearance that promises permanency; but in this world nothing can be said to be certain, except death and taxes.” — Benjamin Franklin, in a letter to Jean-Baptiste Le Roy, 1789
The famous expression highlighting that only “death and taxes” seem certain in life (something that goes back to the beginning of civilization and to Ancient Egypt) is on people’s minds during the month of April in the United States. This past Monday, April 18, 2022, was Tax Day. So, were US citizens procrastinators, leaving their federal (and state) tax returns to the last day? Traffic to tax-related official federal and state websites seems to show it: there was a spike of more than 470% on April 18.
Just for reference, we can see on Cloudflare Radar that Internet traffic in the US, from our perspective, wasn’t significantly impacted on Monday, April 18, although there was a clear peak, higher than in the previous 14 days, that night at 22:00 EST (that’s 02:00 UTC on April 19). So, traffic (that includes DNS and HTTP requests from our standpoint) was 18% higher compared to the same time on the previous Monday.
For the following charts, Cloudflare Radar uses a variety of sources to provide aggregate information about Internet traffic and attack trends. In this blog post, we will use DNS name resolution data as a proxy for traffic to Internet services, as we did for Super Bowl LVI or for the Oscars 2022.
In this case, the baseline value for the charts (that we use to get the percent growth) was calculated by taking the mean DNS traffic level for the associated Internet services on March 31 — a typical day before from the April 18 deadline. On these charts, we are using the EST timezone.
Let’s start with an aggregate of all the federal and state level official tax-related sites. This Monday, DNS requests jumped at 13:00 EST to 472% more than usual (the average on March 31 for all the 51 sites we’re checking is the baseline here). That’s 203% more than the previous highest growth day in April.
Here are the top five days in April ranked by traffic increase:
US federal and state official tax sites peaks in requests
Monday, April 18 (Tax Day 2022), 13:00 — 472% growth.
Thursday, April 14, 15:00 — 269%.
Friday, April 15, 15:00 — 264%.
Monday, April 11, 13:00 — 252%.
Wednesday, April 13, 14:00 — 251%.
Taxes on weekdays
Another trend in the previous chart is that people seem to use more weekdays in April than the weekends to submit their taxes (or to visit official tax-related sites). That’s a trend we see not only for federal sites, but also for the state ones (even more in the latter).
State official tax sites also have a bigger growth in requests in April, from our perspective, than federal, but the general growth is very clear right from the beginning of April, with a relevant peak going up to 221% of increase in traffic at 13:00 EST on April 4.
Another more specific trend regarding Tax Day 2022 was that traffic was higher than before any other day in April right around 09:00 (with 293% increase) and it continued that way until 20:00.
Tax services with a growth up to 680%
In the taxes filling realm there are also many services, some smaller and local, others national and well known, that help people to do the inevitable business of dealing with sales, income, property, license or other taxes.
The peak was reached on Monday, April 18, at 19:00 EST with a growth in requests of 680%. It was a busy afternoon and evening across the US for tax services.
And here’s the top five ranking of traffic growth for tax services sites in April:
US tax services sites peaks in requests
Monday, April 18 (Tax Day 2022), 19:00 — 680% growth
Sunday, April 17, 20:00 — 439%
Friday, April 15, 12:00 — 328%
Saturday, April 16, 14:00 — 326%
Sunday, April 10, 15:00 — 311%
For these types of sites, there are more spikes of traffic on the weekends than on weekdays and that started right at the beginning of April, with Sunday, April 3, reaching 295% in growth, not that far from the peaks on the days prior to Tax Day 2022.
We can also see in a more detailed view in the next chart that at 10:00 on Tax Day 2022 requests growth were already at an all month high with more than 478% of increase. The sustained growth was maintained throughout the day and only after 22:00 (474%) did it drop lower than in previous days.
Conclusion
No surprise, people are aware of the deadlines for their tax returns, and many do leave it to the last day and that is very clear looking at the trends related to tax sites.
If you’re curious about these types of trends, check Cloudflare Radar for up-to-date insights about all the countries on Earth.
Welcome to our first DDoS report of 2022, and the ninth in total so far. This report includes new data points and insights both in the application-layer and network-layer sections — as observed across the global Cloudflare network between January and March 2022.
The first quarter of 2022 saw a massive spike in application-layer DDoS attacks, but a decrease in the total number of network-layer DDoS attacks. Despite the decrease, we’ve seen volumetric DDoS attacks surge by up to 645% QoQ, and we mitigated a new zero-day reflection attack with an amplification factor of 220 billion percent.
In the Russian and Ukrainian cyberspace, the most targeted industries were Online Media and Broadcast Media. In our Azerbaijan and Palestinian Cloudflare data centers, we’ve seen enormous spikes in DDoS activity — indicating the presence of botnets operating from within.
The Highlights
The Russian and Ukrainian cyberspace
Russian Online Media companies were the most targeted industries within Russia in Q1. The next most targeted was the Internet industry, then Cryptocurrency, and then Retail. While many attacks that targeted Russian Cryptocurrency companies originated in Ukraine or the US, another major source of attacks was from within Russia itself.
The majority of HTTP DDoS attacks that targeted Russian companies originated from Germany, the US, Singapore, Finland, India, the Netherlands, and Ukraine. It’s important to note that being able to identify where cyber attack traffic originates is not the same as being able to attribute where the attacker is located.
Attacks on Ukraine targeted Broadcast Media and Publishing websites and seem to have been more distributed, originating from more countries — which may indicate the use of global botnets. Still, most of the attack traffic originated from the US, Russia, Germany, China, the UK, and Thailand.
In January 2022, over 17% of under-attack respondents reported being targeted by ransom DDoS attacks or receiving a threat in advance.
That figure drastically dropped to 6% in February, and then to 3% in March.
When compared to previous quarters, we can see that in total, in Q1, only 10% of respondents reported a ransom DDoS attack; a 28% decrease YoY and 52% decrease QoQ.
Application-layer DDoS attacks
2022 Q1 was the busiest quarter in the past 12 months for application-layer attacks. HTTP-layer DDoS attacks increased by 164% YoY and 135% QoQ.
Diving deeper into the quarter, in March 2022 there were more HTTP DDoS attacks than in all of Q4 combined (and Q3, and Q1).
After four consecutive quarters in a row with China as the top source of HTTP DDoS attacks, the US stepped into the lead this quarter. HTTP DDoS attacks originating from the US increased by a staggering 6,777% QoQ and 2,225% YoY.
Network-layer DDoS attacks
Network-layer attacks in Q1 increased by 71% YoY but decreased 58% QoQ.
The Telecommunications industry was the most targeted by network-layer DDoS attacks, followed by Gaming and Gambling companies, and the Information Technology and Services industry.
Volumetric attacks increased in Q1. Attacks above 10 Mpps (million packets per second) grew by over 300% QoQ, and attacks over 100 Gbps grew by 645% QoQ.
This report is based on DDoS attacks that were automatically detected and mitigated by Cloudflare’s DDoS Protection systems. To learn more about how it works, check out this deep-dive blog post.
A note on how we measure DDoS attacks observed over our network To analyze attack trends, we calculate the “DDoS activity” rate, which is either the percentage of attack traffic out of the total traffic (attack + clean) observed over our global network, or in a specific location, or in a specific category (e.g., industry or billing country). Measuring the percentages allows us to normalize data points and avoid biases reflected in absolute numbers towards, for example, a Cloudflare data center that receives more total traffic and likely, also more attacks.
To view an interactive version of this report view it on Cloudflare Radar.
Ransom Attacks
Our systems constantly analyze traffic and automatically apply mitigation when DDoS attacks are detected. Each DDoS’d customer is prompted with an automated survey to help us better understand the nature of the attack and the success of the mitigation.
For over two years now, Cloudflare has been surveying attacked customers — one question on the survey being if they received a threat or a ransom note demanding payment in exchange to stop the DDoS attack. In the last quarter, 2021 Q4, we observed a record-breaking level of reported ransom DDoS attacks (one out of every five customers). This quarter, we’ve witnessed a drop in ransom DDoS attacks with only one out of 10 respondents reporting a ransom DDoS attack; a 28% decrease YoY and 52% decrease QoQ.
When we break it down by month, we can see that January 2022 saw the largest number of respondents reporting receiving a ransom letter in Q1. Almost one out of every five customers (17%).
Application-layer DDoS attacks
Application-layer DDoS attacks, specifically HTTP DDoS attacks, are attacks that usually aim to disrupt a web server by making it unable to process legitimate user requests. If a server is bombarded with more requests than it can process, the server will drop legitimate requests and — in some cases — crash, resulting in degraded performance or an outage for legitimate users.
Application-layer DDoS attacks by month
In Q1, application-layer DDoS attacks soared by 164% YoY and 135% QoQ – the busiest quarter within the past year.
Application-layer DDoS attacks increased to new heights in the first quarter of 2022. In March alone, there were more HTTP DDoS attacks than in all of 2021 Q4 combined (and Q3, and Q1).
Application-layer DDoS attacks by industry
Consumer Electronics was the most targeted industry in Q1.
Globally, the Consumer Electronics industry was the most attacked with an increase of 5,086% QoQ. Second was the Online Media industry with a 2,131% increase in attacks QoQ. Third were Computer Software companies, with an increase of 76% QoQ and 1,472 YoY.
To understand the origin of the HTTP attacks, we look at the geolocation of the source IP address belonging to the client that generated the attack HTTP requests. Unlike network-layer attacks, source IP addresses cannot be spoofed in HTTP attacks. A high percentage of DDoS activity in a given country usually indicates the presence of botnets operating from within the country’s borders.
After four consecutive quarters in a row with China as the top source of HTTP DDoS attacks, the US stepped into the lead this quarter. HTTP DDoS attacks originating from the US increased by a staggering 6,777% QoQ and 2,225% YoY. Following China in second place are India, Germany, Brazil, and Ukraine.
Application-layer DDoS attacks by target country
In order to identify which countries are targeted by the most HTTP DDoS attacks, we bucket the DDoS attacks by our customers’ billing countries and represent it as a percentage out of all DDoS attacks.
The US drops to second place, after being first for three consecutive quarters. Organizations in China were targeted the most by HTTP DDoS attacks, followed by the US, Russia, and Cyprus.
Network-layer DDoS attacks
While application-layer attacks target the application (Layer 7 of the OSI model) running the service that end users are trying to access (HTTP/S in our case), network-layer attacks aim to overwhelm network infrastructure (such as in-line routers and servers) and the Internet link itself.
Network-layer DDoS attacks by month
While HTTP DDoS attacks soared in Q1, network-layer DDoS attacks actually decreased by 58% QoQ, but still increased by 71% YoY.
Diving deeper into Q1, we can see that the amount of network-layer DDoS attacks remained mostly consistent throughout the quarter with about a third of attacks occurring every month.
Amongst these network-layer DDoS attacks are also zero-day DDoS attacks that Cloudflare automatically detected and mitigated.
In the beginning of March, Cloudflare researchers helped investigate and expose a zero-day vulnerability in Mitel business phone systems that amongst other possible exploitations, also enables attackers to launch an amplification DDoS attack. This type of attack reflects traffic off vulnerable Mitel servers to victims, amplifying the amount of traffic sent in the process by an amplification factor of 220 billion percent in this specific case. You can read more about it in our recent blog post.
We observed several of these attacks across our network. One of them targeted a North American cloud provider using the Cloudflare Magic Transit service. The attack originated from 100 source IPs mainly from the US, UK, Canada, Netherlands, Australia, and approximately 20 other countries. It peaked above 50 Mpps (~22 Gbps) and was automatically detected and mitigated by Cloudflare systems.
In this report, for the first time, we’ve begun classifying network-layer DDoS attacks according to the industries of our customers using the Spectrum and Magic products. This classification allows us to understand which industries are targeted the most by network-layer DDoS attacks.
When we look at Q1 statistics, we can see that in terms of attack packets and attack bytes launched towards Cloudflare customers, the Telecommunications industry was targeted the most. More than 8% of all attack bytes and 10% of all attack packets that Cloudflare mitigated targeted Telecommunications companies.
Following not too far behind, in second and third place were the Gaming / Gambling and Information Technology and Services industries.
Network-layer DDoS attacks by target country
Similarly to the classification by our customers’ industry, we can also bucket attacks by our customers’ billing country as we do for application-layer DDoS attacks, to identify the top attacked countries.
Looking at Q1 numbers, we can see that the US was targeted by the highest percentage of DDoS attacks traffic — over 10% of all attack packets and almost 8% of all attack bytes. Following the US is China, Canada, and Singapore.
Network-layer DDoS attacks by ingress country
When trying to understand where network-layer DDoS attacks originate, we cannot use the same method as we use for the application-layer attack analysis. To launch an application-layer DDoS attack, successful handshakes must occur between the client and the server in order to establish an HTTP/S connection. For a successful handshake to occur, the attacker cannot spoof their source IP address. While the attacker may use botnets, proxies, and other methods to obfuscate their identity, the attacking client’s source IP location does sufficiently represent the attack source of application-layer DDoS attacks.
On the other hand, to launch network-layer DDoS attacks, in most cases, no handshake is needed. Attackers can spoof the source IP address in order to obfuscate the attack source and introduce randomness into the attack properties, which can make it harder for simple DDoS protection systems to block the attack. So if we were to derive the source country based on a spoofed source IP, we would get a ‘spoofed country’.
For this reason, when analyzing network-layer DDoS attack sources, we bucket the traffic by the Cloudflare edge data center locations where the traffic was ingested, and not by the (potentially) spoofed source IP to get an understanding of where the attacks originate from. We are able to achieve geographical accuracy in our report because we have data centers in over 270 cities around the world. However, even this method is not 100% accurate, as traffic may be back hauled and routed via various Internet Service Providers and countries for reasons that vary from cost reduction to congestion and failure management.
In Q1, the percentage of attacks detected in Cloudflare’s data centers in Azerbaijan increased by 16,624% QoQ and 96,900% YoY, making it the country with the highest percentage of network-layer DDoS activity (48.5%).
Following our Azerbaijanian data center is our Palestinian data center where a staggering 41.9% of all traffic was DDoS traffic. This represents a 10,120% increase QoQ and 46,456% YoY.
To view all regions and countries, check out the interactive map.
Attack vectors
SYN Floods remain the most popular DDoS attack vector, while use of generic UDP floods drops significantly in Q1.
An attack vector is a term used to describe the method that the attacker uses to launch their DDoS attack, i.e., the IP protocol, packet attributes such as TCP flags, flooding method, and other criteria.
In Q1, SYN floods accounted for 57% of all network-layer DDoS attacks, representing a 69% increase QoQ and a 13% increase YoY. In second place, attacks over SSDP surged by over 1,100% QoQ. Following were RST floods and attacks over UDP. Last quarter, generic UDP floods took the second place, but this time, generic UDP DDoS attacks plummeted by 87% QoQ from 32% to a mere 3.9%.
Emerging threats
Identifying the top attack vectors helps organizations understand the threat landscape. In turn, this may help them improve their security posture to protect against those threats. Similarly, learning about new emerging threats that may not yet account for a significant portion of attacks, can help mitigate them before they become a significant force.
When we look at new emerging attack vectors in Q1, we can see increases in DDoS attacks reflecting off of Lantronix services (+971% QoQ) and SSDP reflection attacks (+724% QoQ). Additionally, SYN-ACK attacks increased by 437% and attacks by Mirai botnets by 321% QoQ.
Attacker reflecting traffic off of Lantronix Discovery Service
Lantronix is a US-based software and hardware company that provides solutions for Internet of Things (IoT) management amongst their vast offering. One of the tools that they provide to manage their IoT components is the Lantronix Discovery Protocol. It is a command-line tool that helps to search and find Lantronix devices. The discovery tool is UDP-based, meaning that no handshake is required. The source IP can be spoofed. So an attacker can use the tool to search for publicly exposed Lantronix devices using a 4 byte request, which will then in turn respond with a 30 byte response from port 30718. By spoofing the source IP of the victim, all Lantronix devices will target their responses to the victim — resulting in a reflection/amplification attack.
Simple Service Discovery Protocol used for reflection DDoS attacks
The Simple Service Discovery Protocol (SSDP) protocol works similarly to the Lantronix Discovery protocol, but for Universal Plug and Play (UPnP) devices such as network-connected printers. By abusing the SSDP protocol, attackers can generate a reflection-based DDoS attack overwhelming the target’s infrastructure and taking their Internet properties offline. You can read more about SSDP-based DDoS attacks here.
Network-layer DDoS attacks by attack rate
In Q1, we observed a massive uptick in volumetric DDoS attacks — both from the packet rate and bitrate perspective. Attacks over 10 Mpps grew by over 300% QoQ, and attacks over 100 Gbps grew by 645% QoQ.
There are different ways of measuring the size of an L3/4 DDoS attack. One is the volume of traffic it delivers, measured as the bit rate (specifically, terabits per second or gigabits per second). Another is the number of packets it delivers, measured as the packet rate (specifically, millions of packets per second).
Attacks with high bit rates attempt to cause a denial-of-service event by clogging the Internet link, while attacks with high packet rates attempt to overwhelm the servers, routers, or other in-line hardware appliances. These devices dedicate a certain amount of memory and computation power to process each packet. Therefore, by bombarding it with many packets, the appliance can be left with no further processing resources. In such a case, packets are “dropped,” i.e., the appliance is unable to process them. For users, this results in service disruptions and denial of service.
Distribution by packet rate
The majority of network-layer DDoS attacks remain below 50,000 packets per second. While 50 kpps is on the lower side of the spectrum at Cloudflare scale, it can still easily take down unprotected Internet properties and congest even a standard Gigabit Ethernet connection.
When we look at the changes in the attack sizes, we can see that attacks of over 10 Mpps grew by over 300% QoQ. Similarly, attacks of 1-10 Mpps grew by almost 40% QoQ.
Distribution by bitrate
In Q1, most of the network-layer DDoS attacks remain below 500 Mbps. This too is a tiny drop in the water at Cloudflare scale, but can very quickly shut down unprotected Internet properties with less capacity or at the very least congest, even a standard Gigabit Ethernet connection.
Graph of the distribution of network-layer DDoS attacks by bit rate in 2022 Q1
Similarly to the trends observed in the packet-per-second realm, here we can also see large increases. The amount of DDoS attacks that peaked over 100 Gbps increased by 645% QoQ; attacks peaking between 10 Gbps to 100 Gbps increased by 407%; attacks peaking between 1 Gbps to 10 Gbps increased by 88%; and even attacks peaking between 500 Mbps to 1 Gbps increased by almost 20% QoQ.
Network-layer DDoS attacks by duration
Most attacks remain under one hour in duration, reiterating the need for automated always-on DDoS mitigation solutions.
We measure the duration of an attack by recording the difference between when it is first detected by our systems as an attack and the last packet we see with that attack signature towards that specific target.
In previous reports, we provided a breakdown of ‘attacks under an hour’, and larger time ranges. However, in most cases over 90 percent of attacks last less than an hour. So starting from this report, we broke down the short attacks and grouped them by shorter time ranges to provide better granularity.
One important thing to keep in mind is that even if an attack lasts only a few minutes, if it is successful, the repercussions could last well beyond the initial attack duration. IT personnel responding to a successful attack may spend hours and even days restoring their services.
In the first quarter of 2022, more than half of the attacks lasted 10-20 minutes, approximately 40% ended within 10 minutes, another ~5% lasted 20-40 minutes, and the remaining lasted longer than 40 minutes.
Short attacks can easily go undetected, especially burst attacks that, within seconds, bombard a target with a significant number of packets, bytes, or requests. In this case, DDoS protection services that rely on manual mitigation by security analysis have no chance in mitigating the attack in time. They can only learn from it in their post-attack analysis, then deploy a new rule that filters the attack fingerprint and hope to catch it next time. Similarly, using an “on-demand” service, where the security team will redirect traffic to a DDoS provider during the attack, is also inefficient because the attack will already be over before the traffic routes to the on-demand DDoS provider.
It’s recommended that companies use automated, always-on DDoS protection services that analyze traffic and apply real-time fingerprinting fast enough to block short-lived attacks.
Summary
Cloudflare’s mission is to help build a better Internet. A better Internet is one that is more secure, faster, and reliable for everyone — even in the face of DDoS attacks. As part of our mission, since 2017, we’ve been providing unmetered and unlimited DDoS protection for free to all of our customers. Over the years, it has become increasingly easier for attackers to launch DDoS attacks. But as easy as it has become, we want to make sure that it is even easier — and free — for organizations of all sizes to protect themselves against DDoS attacks of all types.
Not using Cloudflare yet? Start now with our Free and Pro plans to protect your websites, or contact us for comprehensive DDoS protection for your entire network using Magic Transit.
The first round of the 2022 French presidential elections were held this past Sunday, April 10, 2022, and a run-off will be held on April 24 between the top two candidates, Emmanuel Macron and Marine Le Pen. Looking at Internet trends in France for Sunday, it appears that when people were voting Internet traffic went down, and, no surprise, it went back up when results are coming in — that includes major spikes to news and election-related websites.
Cloudflare Radar data shows that Sundays are usually high-traffic days in France. But this Sunday looked a little different.
The seven-day Radar chart shows that there was a decrease in traffic compared to the previous Sunday between 08:00 and 16:00 UTC, that’s 10:00 and 18:00 in local time — bear in mind that polling stations in France were open between 08:00 and 19:00 (or 20:00 in big cities) local time. So, the decrease in traffic was ‘inside’ the period when French citizens were allowed to vote.
That’s a similar trend we have seen in other elections, like the Portuguese one back in January 2022.
The time of the French election day with the largest difference compared to the previous Sunday was 14:00 UTC (16:00 in local time), when traffic decreased as much as 16% (as the previous 7-day chart shows). That’s clear in this chart:
That doesn’t show us precisely how people use the Internet differently on an election day — note that we already saw in the past how the weather, times of the year or even events affect human behaviour and subsequently Internet trends.
Let’s look deeper into those trends. We know that weekdays, weekends and even Sundays have, in many countries, specific patterns so, when we compare the previous four Sundays in France since March 20, we can see some trends highlighted in the next chart:
April 10, Election Day, was the Sunday with the most traffic of the previous month at 06:30 UTC (08:30 local time) and in several periods between 16:30 and 20:45 UTC (18:30 and 22:45 local time).
April 10, Election Day, was the Sunday with the least traffic of the previous month in several periods between 09:45 and 11:15 (11:45 and 13:15 local time) and it was the #3 out of #4 with less traffic between 12:15 and 16:15 (14:15 and 18:15 local time).
This seems to show patterns such as: before going to vote more people than usual were online on Sunday, Election Day (08:30 local time), but traffic went down considerably in the late morning period between (11:30-13:15) and again after lunch (14:15 and 18:15) shortly before the polling stations were closed.
The first exit polls started to be published around 18:40 local time (seen in the second and biggest green circle in the previous chart), but the main exit poll was at 20:00 local time, when all the polling stations were already closed, at that time Internet traffic in France was at its highest compared to Sundays during the past 30 days (seen in the third green circle in the previous chart, 18:00 UTC).
How about mobile devices’ usage trends? People in France were definitely using their mobile devices more on Election Day, and that is also evident when compared to the previous Sunday, April 3.
On Election Day, April 10, 2022, at around 09:00 local time mobile usage represented 60% of Internet traffic and had another spike at 21:00 local time with 58% (the seven-day average for mobile usage in France is 48%).
When results arrive, people go online
Official websites usually aren’t the most popular sites in a given country, their popularity is mostly connected to when citizens have to fill in their tax forms online or want to see something like election results — although news media outlets are also important there. Here we’re looking at DNS request trends to get a sense of traffic to Internet properties.
Official French election-related websites like elections.interieur.gouv.fr (where the results are published) had an increase in traffic throughout the week mainly after Monday, April 4, but on election day there were two major spikes.
The first spike in traffic was around 20:00 local time (370% more than the previous Sunday at the same time), when all the polling stations were already closed and the first major polls were revealed. But the main spike was later, at midnight (local time), when 84% of the votes were already counted and published — Macron was leading (27%) followed closely by Le Pen (25%). That spike represented 925% more requests than in the previous Sunday.
The news Internet traffic spike ‘knocks’ at 20:00
When there are elections in a country, people tend to see the analysis and results using media outlets from radio to TV, but also the Internet — media websites and social media. Let’s focus on French media outlets. The biggest spike of the week in our aggregate DNS chart, that shows trends from 12 news websites, was definitely on Election Day, around 20:00 local time, when those domains had 116% more traffic than at the same time on the previous Sunday.
Nonetheless, after 16:00 local time, traffic started to increase to those news outlets and by 18:00 local time it had its largest spike of the week with sustained growth until 20:00. At 23:00 local time there was another increase in traffic and after that it started to decrease. But, this Monday morning, traffic at 08:00 was already higher again than during the previous week (Election Day excluded). So, no surprise, Sunday night was when people were looking more into the news.
The same trend is seen on the major French TV station websites, with an even more isolated spike at 20:00 local time and a 472% increase in traffic compared to the previous Sunday, when the main exit polls were announced.
This was also similar to the broadcast radio website trends. Besides the 20:00 local time spike (272% increase compared to the previous Sunday), there was also a big one at 23:00 local time (300%) and a Monday morning spike with higher than before traffic (82% increase):
How about social media?
Regarding social media in France (looking at the aggregate DNS of the several sites), there’s no clear trend regarding the elections, but there were slightly fewer requests than on the previous Sunday. So social media doesn’t appear to have been as impacted by the elections as news websites.
Conclusion
Although there aren’t big changes in Internet traffic, like those seen in countries that shut down the Internet during election periods, Election Day seems to influence human and Internet patterns, in this case when results started to pour in on election night people went to news or official election websites.
Cloudflare operates in more than 250 cities in over 100 countries, where we interconnect with over 10,000 network providers in order to provide a broad range of services to millions of customers. The breadth of both our network and our customer base provides us with a unique perspective on Internet resilience, enabling us to observe the impact of Internet disruptions. In many cases, these disruptions can be attributed to a physical event, while in other cases, they are due to an intentional government-directed shutdown. In this post, we review selected Internet disruptions observed by Cloudflare during the first quarter of 2022, supported by traffic graphs from Cloudflare Radar and other internal Cloudflare tools, and grouped by associated cause.
Plate tectonics
Internet outages caused by “earth movers” are more frequently caused by errant backhoes. However, two Internet disruptions in the first quarter were caused by more significant earth movement — a volcanic eruption and an earthquake.
The first impacted connectivity on the island nation of Tonga, when the Hunga Tonga–Hunga Ha’apai volcanic eruption damaged the submarine cable connecting Tonga to Fiji, resulting in a 38 day Internet outage. After the January 14 eruption, only minimal Internet traffic (via satellite services) was seen from Tonga. On February 22, Digicel announced that the main island was back online after initial submarine cable repairs were completed – the immediate return of traffic is clearly visible in the figure below. However, it was estimated that repairs to the domestic cable, connecting outlying islands, could take an additional six to nine months.
The second disruption, caused by a 7.3 magnitude earthquake off the coast of central Japan on March 16, was significantly shorter, and had a significantly smaller impact. The earthquake occurred around 1436 UTC, causing power outages that resulted in a loss of Internet connectivity in cities including Tokyo for several hours, as seen in the figure below. Almost exactly 11 years prior, a magnitude 8.9 earthquake also had a nominal impact on Internet connectivity in Japan, that time apparently due to damage to subsea cable systems.
Infrastructure damage
Internet resilience is, of course, heavily dependent on the resilience of the underlying physical infrastructure, including data centers, terrestrial fiber, and submarine cables. Damage to this infrastructure often disrupts Internet connectivity.
Early in the morning of January 5, the Gambia was completely isolated from the global Internet. As evident in the figure below, the incident lasted over eight hours, between 0117 and 0945 UTC. According to a press release from GAMTEL, after the failure of the primary link (damage to the ACE submarine cable), traffic was routed onto two backup links through Senegal. However, these backup links also failed because they converged in a location that was ultimately identified as a single point of failure.
Around 2130 UTC on January 20, Internet traffic to Yemen dropped to near zero, as shown in the figure below, after ongoing airstrikes reportedly hit a telecommunications building in Al-Hudaydah where the FALCON undersea cable lands. The outage lasted four days, finally recovering around 2100 on January 24. The outage primarily affected YemenNet (Public Telecommunication Corporation), the state-owned telecommunications provider.
According to a published report, one of the cuts was on the Victorian (mainland) end, and the other on the Tasmanian side, with both cuts caused by “third parties”. A significant reduction in traffic between 0130 – 0800 UTC is visible in the figure below.
On March 15, ETECSA, the Cuban state telecommunications company, reported that a fiber optic cable had been cut on a public road in the capital that morning. The impact of this fiber cut on Internet traffic to Cuba and ETECSA is visible in the figures below, starting just after 1200 UTC, lasting for over six hours.
Although initially believed to be the result of a power outage (all too common in Venezuela), a March 24 Internet disruption in the country was ultimately due to a fiber cut. Internet traffic to CANTV customers in multiple Venezuelan states dropped significantly between 1140 and 1740 UTC, as seen in the figure below. In addition to this disruption, VE sin Filtro reported a number of additional multi-hour, multi-state Internet disruptions in Venezuela during the first quarter.
On March 31, Internet traffic to Telenor Pakistan dropped 60% between 0600-0745 UTC, as shown in the figure below. According to Telenor Pakistan responses to hundreds of customer complaints lodged via Twitter, the disruption was due to multiple fiber-optic cable cuts in several locations. Just after 1800 UTC, Telenor Pakistan Tweeted that services had been fully restored.
Power outages
In addition to the physical infrastructure, reliable electrical power is also critical for resilient Internet connectivity. At a provider level, loss of power can take key data centers and routers offline, impacting connectivity for customers and other connected networks. Consumer power outages can take home/business routers and connected devices offline, forcing users onto mobile connectivity, assuming that is/remains available.
The interconnected electrical grids of Kazakhstan, Uzbekistan, and Kyrgyzstan all suffered outages on January 24 after Kazakhstan’s North-South power line was disconnected due to “emergency imbalances”. These power outages caused multi-hour Internet disruptions across all three countries starting around 0600 UTC, as the figures below show. The impact to traffic in Kazakhstan appeared to be fairly minor, while traffic declined significantly in Uzbekistan and Kyrgyzstan and took longer to recover.
A power outage across multiple counties and cities in Taiwan starting around 0100 UTC on March 3 caused a brief #Internet disruption. The figure below shows a nominal initial drop in traffic, though traffic remained lower throughout the next several hours. The power outage was reportedly caused by human negligence during annual repairs of a generator at the Hsinta power plant.
In addition to the fiber cut discussed above, Cuba’s Internet suffered a second disruption on March 24. A Tweet from ETECSA stated that a power failure had caused a disruption to voice service, SMS, and mobile data. Analysis of Internet traffic for both Cuba and ETECSA finds that the disruption started around 1230 UTC, and lasted for approximately 90 minutes, as shown in the figures below.
DDoS attack
Although distributed denial of service (DDoS) attacks often target web or application servers in an attempt to knock a given website or application offline, such attacks that target network infrastructure can have more widespread impact, not only restricting access to sites and applications hosted within that network, but also disrupting connectivity for users attached to the network.
Such a DDoS attack targeted AS8867 (E-Gov – Tehila Project) in Israel on March 14. The figure below shows that Internet traffic to that ASN began to decline just before 1530 UTC. A published report notes that the websites of the interior, health, justice and welfare ministries, as well as that of the Prime Minister’s office, were all taken offline as a result of the attack.
Unspecified technical causes
As discussed above, the underlying technical or physical causes of Internet disruptions are often easily identified, frequently thanks to social media or other communications from the impacted network providers. However, sometimes disruptions are observed that are correlated with a real-world (often political) event with no specified technical or physical cause, while other times disruptions are observed but are both uncorrelated and unattributed.
In Kazakhstan, an Internet disruption began on January 5 amid mass protests against sudden increases in energy prices. Starting around 1030 UTC, traffic from Kazakhstan dropped to near zero. The figure below shows that traffic returned to a regular diurnal pattern on January 11, but several apparent restorations of connectivity are also visible during the six-day disruption. These brief periods of connectivity appeared to align with televised speeches or announcements from the Zazakh president.
In Burkina Faso, heavy gunfire related to an army mutiny was reported early in the morning of January 23. A significant drop in traffic from the country was observed in Cloudflare Radar starting around 0915 UTC, with Orange, FasoNet, and Telecel Faso all seeing lower traffic volumes. As the figure below shows, the disruption lasted for nearly a day and a half, recovering around 2000 UTC on January 24.
Just after 2200 UTC on March 15, Yemen experienced a significant, albeit brief, Internet disruption, lasting just 30 minutes. As the figures below show, the disruption was primarily due to an issue at YemenNet. A published report claims that the disruption was due to a deliberate act by the Houthi coup militia.
Russian invasion of Ukraine
The Russian invasion of Ukraine has now been going on for over a month. In some cases, Internet connectivity has been collateral damage from the kinetic military action, while in other cases, targeted attacks on network providers and power outages have disrupted connectivity. Technicians from Ukrainian service providers have been risking their lives to keep the country online, and have been largely successful – Cloudflare Radar traffic data for Ukraine shows that as of the end of March, peak traffic levels are at 85-90% of pre-invasion peaks. An earlier blog post provides additional details about Internet traffic patterns observed in Ukraine during the first week after the conflict began.
Below we highlight just a few significant disruptions observed on major Ukrainian network providers in March.
Two brief outages were observed at Ukrtelecom during the second week of March, shown in the figure below. The first, on March 8, lasted for just over two hours, while the second one, on March 10, lasted for approximately 40 minutes. No root cause has been reported for these disruptions.
Later in the month, on March 28, Ukrtelecom experienced a ~15 hour outage, lasting from 0800 UTC to approximately 0100 on March 29, as seen in the figure below. A Twitter thread from the State Service of Special Communications and Information Protection of Ukraine explained that the outage was caused by “a powerful cyberattack” against Ukrtelecom’s infrastructure, and that “In order to preserve its network infrastructure and to continue providing services to Ukraine’s Armed Forces and other military formations as well as to the customers, Ukrtelecom has temporarily limited providing its services to the majority of private users and business-clients.” A LinkedIn post from Ukrtelecom also highlights the non-stop work that the company has been doing to re-establish telecommunications services in impacted regions across the country.
The figure below shows that around 2100 UTC on March 9, Ukrainian Internet service provider Triolan suffered a significant disruption, reportedly resulting from a cyber attack. Traffic began to gradually return after approximately 10 hours.
Conclusion
Despite occasional connectivity disruptions, the Internet remains remarkably resilient. This resiliency is increasingly critical as the Internet finds its way into more and more areas of everyday life around the world. In addition to providing a suite of solutions that support that resiliency, we use the data exhaust from these solutions to monitor Internet reliability, availability, security, and performance.
Follow @CloudflareRadar on Twitter for updates on Internet disruptions as they occur, and find up-to-date information on Internet trends using Cloudflare Radar.
The 94th Academy Awards happened this past Sunday, March 27, 2022. In the global event we got to see several Oscars attributed to winners like CODA, Jane Campion (the director of The Power of the Dog) and also Dune (which won six Oscars), but also moments that had a clear impact in the Internet traffic, like the altercation on stage between Will Smith and Chris Rock.
Cloudflare Radar uses a variety of sources to provide aggregate information about Internet traffic and attack trends. In this blog post, we will use DNS name resolution data as a proxy for traffic to Internet services, as we did for the Super Bowl LVI.
The baseline value for the charts (that are only focused on the US) was calculated by taking the mean DNS traffic level for the associated Internet services between 08:00 – 12:00 PST on Sunday (March 27, 2022) — usually we use UTC, but we chose to use Los Angeles time as that’s where the event took place.
The event started with Beyoncé singing at 17:00 PST and ended at around 20:30. In terms of growth in traffic, the start of the show didn’t show much for social media, although TikTok and Twitter started to decrease in DNS requests after that time.
Will Smith makes Twitter and TikTok rise in requests
Twitter and TikTok were the social networks that seemed most impacted by the moment Will Smith went on stage and started an altercation with Chris Rock after a joke.
For Twitter, the major change in DNS requests was exactly after that incident (at 19:25); before that, at 18:00, the moment Sebastián Yatra performed Encanto’s Dos Oruguitas song also had a small spike.
There were 32% more DNS requests for Twitter a few minutes after the altercation, and that growth peaked at 20:15 with 51% more requests than there were at 19:20 — that was after Will Smith (20:05) gave his acceptance and apology speech, when he was awarded the Best Actor Oscar. The ceremony ended at 20:30, and after that traffic went down.
TikTok also seemed to be used during the ceremony and the breaks, and after a spike during one of the commercial breaks, around 18:40, after Troy Kotsur won the Best Supporting Actor Oscar for his role in CODA.
The Will Smith incident seems to be associated with an increase of 20% in requests from 19:20 to 19:30. The trend continued with a 25% increase (19:40) and a peak of 40% more traffic at 20:15, right after Will Smith’s speech. After the ceremony ended (20:30), traffic went down.
Facebook (yellow line) and Instagram (green) weren’t particularly impacted, although there’s a decrease in traffic after the ceremony started and requests start to decrease after 19:00, especially Facebook.
Actresses made IMDb.com tick
One of the main sources of information about the movie industry is IMDb.com, the Internet Movie Database, and traffic to the site was impacted by the Oscars in a way not related to the Will Smith incident. Requests almost doubled (93% increase) in the minutes before the Oscars started (between 16:50 and 17:00).
And there was another clear spike right after Ariana DeBose won (at 17:23) the Best Supporting Actress Oscar for West Side Story, with almost 90% growth in traffic compared to the previous 10 minutes.
There is also an increase at 19:00, when Kenneth Branagh won the Best Original Screenplay Oscar for writing Belfast. The other major spike in traffic, with 55% increase compared to the previous minutes, was right around the time Jessica Chastain got the Oscar for Best Actress for her role in the movie The Eyes of Tammy Faye.
ABC and Oscars.com trends
ABC was the official broadcaster for the 2022 Oscars, and throughout the event had good numbers: two hours before the ceremony, ABC.com and also their dedicated page Oscars.com (that redirects to abc.com/shows/oscars) had between 200 to 600% more traffic than in our baseline (the morning period, 08:00 – 12:00 PST).
The biggest spike was around 19:45, a few minutes after the Will Smith incident. This was around the time Questlove received the Best Documentary Oscar for Summer of Soul (…Or, When the Revolution Could Not Be Televised), and there was a reunion for The Godfather, with Francis Ford Coppola and actors Al Pacino and Robert DeNiro, on stage.
Oscars official website
The official Oscars.org website also had some trends worth mentioning. Requests to the site increased 400% in the hour before the ceremony started, from 16:00 to 17:00, and remained high after that.
But at 19:45 there was a clearer spike in traffic of around 1,300% increase compared to the previous 10 minutes — that was 20 minutes after the Will Smith incident, right after Questlove’s Oscar and at the time of The Godfather reunion. There was another spike right after the Best Actress award and before the event ended. The full list of winners was published on Oscars.org right after 20:30.
Movie news sites trends
So, how about the trends for movie news sites like Variety, Hollywood Reporter, Vulture or E Online? For this we went on to look at the whole Oscars week (the baseline is a mean of the previous Sunday, March 20, 2022). The Oscars Sunday, March 27, was definitely the main day of the week, with DNS requests for those websites growing 833% more than the best days of the week.
That growth was even higher the next day, Monday, March 28, 2022, when traffic rose to 1,200% more than the best days of the previous week.
Conclusion
As we saw with the Super Bowl LVI, an out of the ordinary moment in a popular event, even when it’s broadcasted via television, causes changes in social media and Internet traffic. In the case of the Super Bowl LVI it was the Coinbase ad; here it was an unexpected incident on stage.
To provide the best experiences, we use technologies like cookies to store and/or access device information. Consenting to these technologies will allow us to process data such as browsing behavior or unique IDs on this site. Not consenting or withdrawing consent, may adversely affect certain features and functions.
Functional
Always active
The technical storage or access is strictly necessary for the legitimate purpose of enabling the use of a specific service explicitly requested by the subscriber or user, or for the sole purpose of carrying out the transmission of a communication over an electronic communications network.
Preferences
The technical storage or access is necessary for the legitimate purpose of storing preferences that are not requested by the subscriber or user.
Statistics
The technical storage or access that is used exclusively for statistical purposes.The technical storage or access that is used exclusively for anonymous statistical purposes. Without a subpoena, voluntary compliance on the part of your Internet Service Provider, or additional records from a third party, information stored or retrieved for this purpose alone cannot usually be used to identify you.
Marketing
The technical storage or access is required to create user profiles to send advertising, or to track the user on a website or across several websites for similar marketing purposes.