Tag Archives: data platform

How we built Cloudflare’s data platform and an AI agent on top of it

Post Syndicated from Brian Brunner original https://blog.cloudflare.com/our-unified-data-platform/

Cloudflare processes more than a billion events every second. Our network spans 330+ cities in 120+ countries. Behind every HTTP request, every Worker invocation, every R2 read operation, there is data, and a lot of it.

For years, that data was not very easy to access. It lived in dozens of production databases, ClickHouse clusters, Kafka streams, Google Cloud buckets, BigQuery datasets, and a long tail of pipelines. To answer a simple question like “How many domains that signed up today are in the Top 100 by traffic?”, an analyst at Cloudflare had to know which system to ask, what credentials to use, what query language to write, and whether the data they were looking at was sampled, fresh, or seven-days stale. As a result, it was difficult to glean informed insights from the data.

To solve this problem, we built two in-house tools: Town Lake, Cloudflare’s unified data analytics platform, and Skipper, an AI data agent that runs on top of it. Town Lake is a single SQL interface to everything Cloudflare knows, and Skipper is how anyone at Cloudflare can ask questions in plain English and get correct, auditable answers back in seconds.

This is the story of how we built both.

The shape of the problem

If you have ever worked at a company that went through a hyper-growth period, you know what data sprawl looks like. Ours had a few specific symptoms:

  1. Too many disparate systems. A product engineer who wanted to investigate a customer issue might need to query Postgres for account metadata, ClickHouse for analytics events, BigQuery for usage rollups, R2 for raw logs, and Kafka topics for real-time signals. Each system had its own credentials, its own language, and its own retention policy.

  2. Sampled data. This is fine for dashboards, but doesn’t work for domains like billing. Our analytics pipeline downsamples to handle 700M+ events per second. That is the right behavior when you want an analytics dashboard to load, but it’s exactly the wrong behavior when you are trying to compute someone’s usage required to issue an invoice.

  3. External dependencies for internal data. Parts of our previous internal reporting stack were powered by external vendors. Beyond the cost, we had a hard external dependency on another cloud for some of our critical data.

  4. No one could find the data. Even if you had all the right credentials, you needed to know that the right table for “Billable Workers requests by account” lived in a specific ClickHouse cluster, in a specific schema, joined to a specific Postgres dimension table, and that the join required an obscure customer ID translation. There was too much tribal knowledge.

We had a cultural challenge too: data infrastructure had historically been treated as a back-office function that was in service of the business, rather than critical infrastructure in its own right.

What we wanted

We wanted to create one place where anyone at the company with appropriate permissions and a need to know could get answers to questions about Cloudflare: “Show me the top 100 customers by revenue in the last quarter”, “List all Bot Management ML scoring events with score > 0.9 in the last 48 hours coming from a specific ASN”, “Find the Top 100 billing support tickets from customers who have spent >$100”, etc.

We wanted that place to give fresh, accurate, unsampled data for the queries that need it (like billing or security investigations) and fast, downsampled data for the queries that don’t (like dashboards or exploration).

We wanted security and governance baked in, with personally identifiable information (PII) detected automatically, and sensitive tables locked down by default. All access should be auditable, and have time-bounded permission grants so that users could only access data when they were actively working on tasks that required it.

We wanted it to be built on Cloudflare’s own platform: R2 for storage, Workers for compute, Cloudflare Access for authentication, Workflows for orchestration. If we were going to make a major investment in our data infrastructure, it was going to be built on the same products we sell to customers.

And we wanted, eventually, an interface that did not require knowing any SQL. The goal was to empower anyone at the company with appropriate permissions and a need to know to look at the stream of data flowing through our network, not just analysts.

That last requirement is what became Skipper.

Town Lake, the platform

At its core, our data platform’s architecture is a data lakehouse: a query engine that reads from object storage, with a metadata layer that makes the storage behave like a database. We call it Town Lake, after its namesake in Austin, Texas.

Its most important components are:

Query engine. We chose Apache Trino for that: a single SQL query can join a Postgres table, a ClickHouse table, and an Iceberg table on R2 without a need to materialize the intermediate results into a different system. A query that asks “what are the top 100 paying customers by Workers requests this week” compiles into a plan that pushes filters into ClickHouse, joins against an account dimension in Postgres, and ranks against billing rollups in R2, all in one go.

R2 Data Catalog, our managed Apache Iceberg service, is where the cold and warm data lives. Iceberg gives us schema evolution, time travel, partition evolution, and the ability to compact data as it ages. Per-minute usage from last week becomes hourly, hourly from last quarter becomes daily, etc. The storage cost decreases as recency does, while the data stays queryable. Parquet files in R2 are much cheaper compared to keeping the same data in an OLAP database.

DataHub is our metadata catalog. Every table, column, owner, lineage edge, and glossary term lives there. When a user asks “what’s in townlake.dim.accounts,” DataHub provides an answer, including the table description, the column descriptions, the owning team, the upstream tables that feed it, and the downstream tables that consume it.

Lifeguard is our access control service: it stores access rules in D1, dynamically pulls user and group membership from our internal access management system, and renders a combined JSON policy that Trino reads over HTTP. Lifeguard also feeds basic access information to Skipper and the Gateway, so users get blocked at the front door rather than at query time.

Skimmer is a PII detection scanner. It runs continuously, samples rows from every column in every table, and uses Workers AI to classify whether each column contains PII. It does this in two passes: first, a fast per-column classifier; then, if anything is flagged, an agentic second pass that gets full table context and can query Trino directly to verify. Findings flow into DataHub and into Lifeguard’s allowlist to allow human-in-the-loop review.

Transformer is our ELT (extract, load, transform) engine built on Workflows. Users define a Directed Acyclic Graph (DAG) of SQL transformations with YAML frontmatter (target table, materialization mode, dependencies, schedule). Transformer compiles the graph and runs it on Trino, with state managed by Durable Objects, definitions stored in R2, and run history in D1.

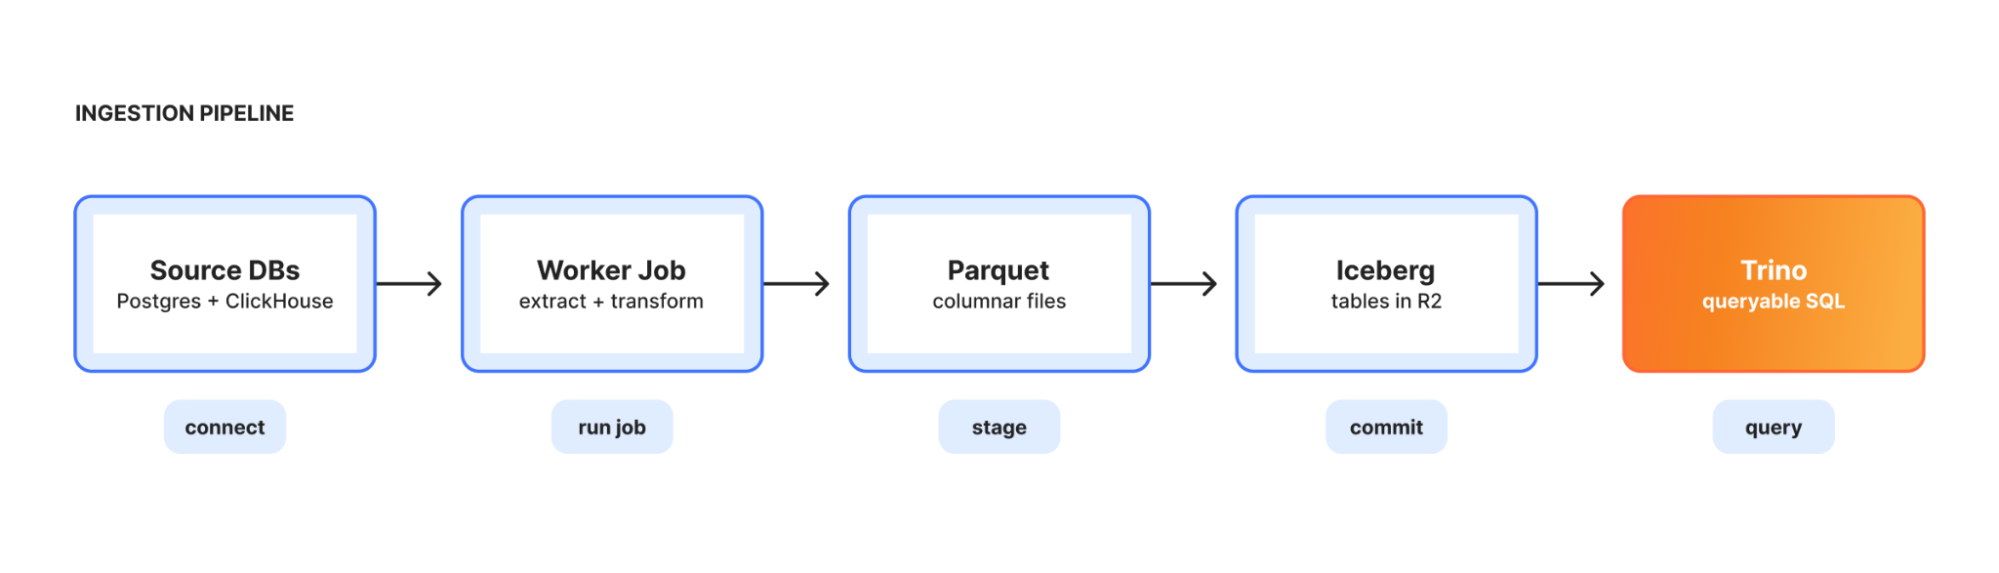
Ingestion is the bridge from operational systems into the lake. An orchestrator runs as a long-lived Kubernetes deployment, reads pipeline configs, and spawns short-lived worker jobs to extract from Postgres or ClickHouse, transform to Parquet, and load into R2 as Iceberg tables. Each pipeline runs as either full-replace or incremental-append.


Default-closed: governance by construction

A real concern when you build a unified data platform is that you have just built a large sensitive-data surface. The traditional answer to this is: open by default, restrict by exception. Allow access to everything, then audit and lock down sensitive tables when someone notices.

Town Lake takes the opposite approach. Tables are inaccessible for querying until they have been reviewed. When a new database is connected to Trino or a new table is created, Skimmer scans it, classifies its columns, and registers it in the central allowlist as pending. Until a reviewer approves the table, and the specific columns within it, users can’t query it. This sounds painful, and it would be, except for two things.

First, it’s automated. Skimmer’s classifier is reasonably good: it catches obvious PII (emails, IPs, names, phone numbers) and the long tail of non-obvious sensitive data (API tokens that match certain prefixes, opaque IDs that can be traced back to users). Reviewers see what was detected and either approve, override, or deny. Most reviews take seconds.

Second, the workflow is self-serve. If you query a table you don’t have access to, the error message is not “permission denied.” It’s “this table needs review, click here to request one.” Skipper, the AI agent, will even suggest the right RBAC group to request and link you straight to it.

We separate schema discovery from data access. Users can see what tables exist, but unreviewed columns are hidden from DESCRIBE and SHOW COLUMNS and from SELECT *. That subtle distinction matters: it means a new unreviewed column doesn’t break existing dashboards built on the rest of an approved table.

PII is opt-in per session. By default, Trino redacts sensitive columns before they ever hit your screen. If you have a legitimate need for raw PII (e.g., fraud investigation), you flip the bit on the session, your permissions are checked, and the redaction is lifted. The flip and every query is logged.

Skipper: the AI data agent

A query engine alone isn’t enough these days. SQL is still a barrier, as is knowing which of tens of thousands of tables to query — you need to know the canonical schema.

Skipper is our take on a conversational AI agent that goes from natural-language question to validated answer, grounded in the company’s actual data, code, and institutional knowledge. We built it on top of Town Lake and on top of our developer platform: Workers, Workers AI, Durable Objects, D1, R2, Workflows, KV.

The interface is a chat box. Ask a question:

Show me the top 10 customers by R2 storage cost in the last 30 days, and the change versus the previous 30 days.

Skipper finds the right tables (DataHub search), pulls their schemas and lineage, writes the SQL, submits it to Trino, polls for results, and shows you a table or a chart. Follow up:

Now break it down by region, and ignore internal Cloudflare accounts.

It carries the context, refines the query, and reruns it. If something looks wrong, e.g., a join produced zero rows or a filter excluded what you expected, then Skipper investigates, adjusts, and tries again, in the closed-loop reasoning. The hard part was having the right context.

Skipper can also package charts into dashboards that can be shared internally and embedded into other internal applications. It also has tools for building transformation graphs via Transformer and for checking access and permissions via Lifeguard.

Skipper meets its users wherever they are. All of these tools are available via a Worker backed by a built-in agentic harness powered by Workers AI. On the flip side, many of our internal users work via local agentic flows, and Skipper’s tools are additionally available via an MCP server.

Layers of context

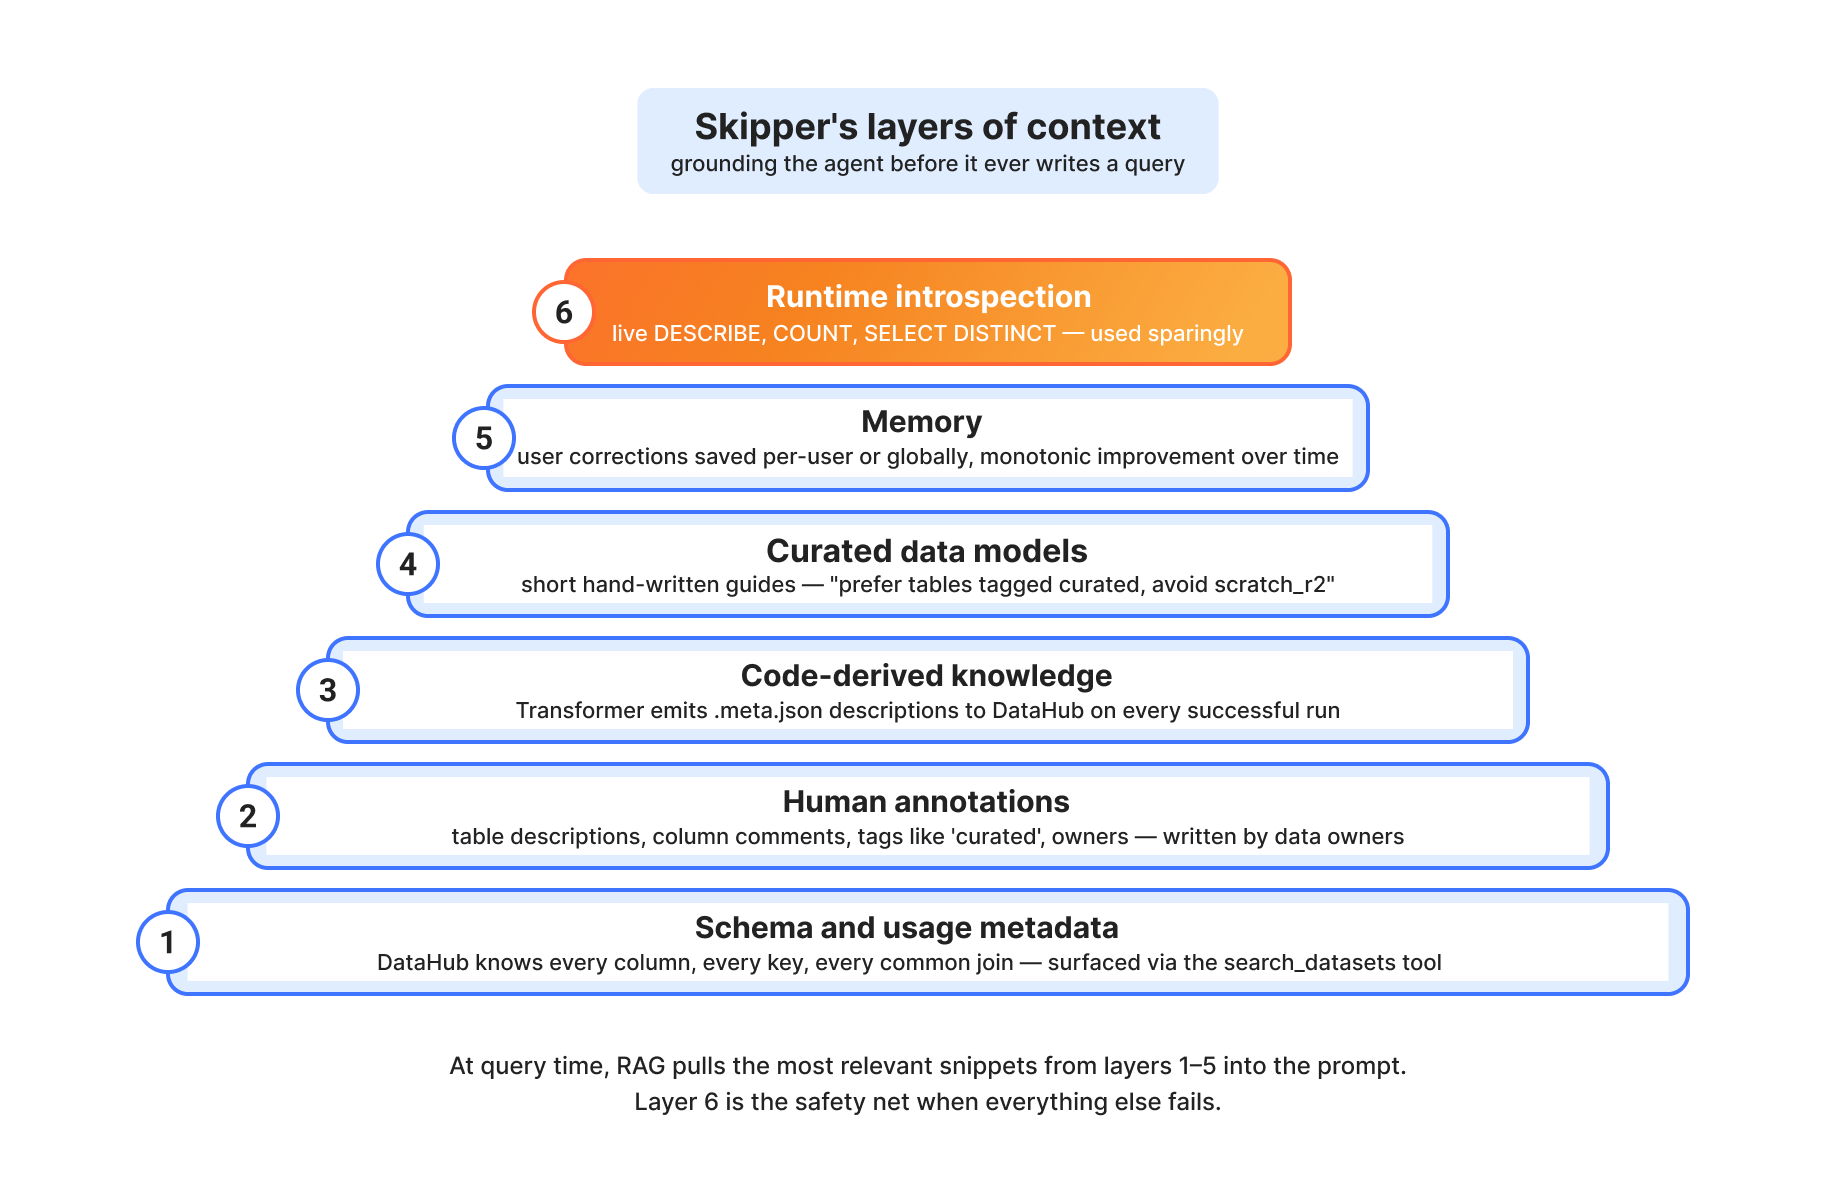
An LLM, given a SQL prompt and a list of table names, can hallucinate joins, misuse columns, and confidently produce a number that is completely wrong. We learned this the hard way during early experiments. The fix is multiple layers of grounded context that the model can pull from at retrieval time.


Layer 1: Schema and usage metadata. DataHub knows every column, every type, every primary key, every foreign key for every table. It also knows which tables are commonly joined together based on historical query patterns. Skipper’s search_datasets and get_entity_details tools surface this directly.

Layer 2: Human annotations. When the team that owns dim.accounts writes a description like “Account-level entity. One row per account_id. Every account belongs to exactly one customer (via customer_id FK),” that description lives in DataHub and ends up in Skipper’s context. Tags like curated mark validated tables that Skipper should prefer over scratch space.

Layer 3: Code-derived knowledge. Some of the most valuable context is not in any catalog: it’s in the SQL that produces the table. The Transformer pipeline emits per-node .meta.json documentation to DataHub on every successful run. So when Skipper looks at fct.billings_allocated, it doesn’t just see the schema; it sees that this is a pre-joined fact table built from dim.accounts, dim.customers, and seed.product_classification, with its alloc_amount column computed as billed_amount / 12 for annual; billed_amount for monthly. That’s the kind of nuance that separates a correct answer from a confidently wrong one.

Layer 4: Curated data models. We maintain a small set of “data model” pages: short, human-written documents that describe how to think about billing, customers, accounts, and zones. “Prefer tables tagged ‘curated’. Avoid scratch_r2 and tables tagged ‘internal’. Search with data model terms (e.g., ‘billing product revenue’) not natural language.” These are surfaced as MCP resources that the agent can pull when the question matches.

Layer 5: Runtime introspection. When everything else fails, Skipper can issue live queries to Trino: DESCRIBE table, SELECT DISTINCT col LIMIT 20, SELECT COUNT(*). It uses these sparingly as runtime context is expensive, but it’s the safety net that makes the rest of the system robust.

Skipper as MCP: Code Mode

One specific implementation detail is worth pulling out, because it is uniquely a Cloudflare-shaped solution.

When you build an AI agent with tools, the standard pattern is to define the tools in your prompt, let the model call them one at a time, parse the response, execute, and return results. This is fine, but it is chatty: a five-tool workflow is five model round-trips, each of which has to re-establish context.

For our MCP server, we use Code Mode. Instead of defining 30 individual tools, we expose two: search and execute. The model writes a JavaScript snippet that calls our entire toolset programmatically:

const datasets = await skipper.search_datasets({ query: "billing product revenue" })
const queryId = await skipper.start_query({ sql: "SELECT ..." })
const results = await skipper.fetch_results({ queryId, mode: "inject" })
return skipper.create_chart({ chartType: "bar", data: results.rows, ... })

That JavaScript runs in a sandboxed Dynamic Worker isolate via WorkerLoader. The model gets to express complex multi-step workflows in a single round-trip, in a language it already knows extremely well. It’s faster, it’s cheaper, and the workflows it produces are auditable as code.

The security model is the data model

Everything Skipper does runs as the calling user. If you don’t have access to a table, Skipper can’t query it for you. If you ask for PII, your permissions are checked. If a query you save is shared with a teammate, their access is checked at view time, not at save time, because group membership changes.

Shared dashboards have their own twist. They can be embedded in any internal Cloudflare tool with a single placeholder div and a script tag:

<div data-skipper-dashboard="dash-123"></div>
<script src="https://skipper.cloudflare.com/embed.js" async></script>

The iframe auto-resizes to fit content. Content Security Policy (CSP) frame-ancestors blocks embedding from anywhere outside the corporate domain. Cloudflare Access still gates the iframe contents, so an unauthenticated viewer hits the Access login page in the iframe rather than seeing the data. Non-owner viewers are checked against the underlying tables: if they don’t have access, they get pointed at the right group to request.


What it powers: really fast answers

Billing. This was the original use case. Our Billable Usage Dashboard, the customer-facing dashboard that shows pay-as-you-go users exactly what they owe, is powered by a metering pipeline whose source of truth is a set of Iceberg tables in R2, queried via Trino. The dashboard’s API pulls the same compact (date, account_id, metric_name, usage) rows that the invoicing system uses, so the number on the dashboard matches the number on the bill.

Billing-related queries account for 53% of all queries Town Lake serves: 91,760 queries from 324 distinct Cloudflare employees in a recent measurement period. The 200–300 line legacy SQL queries that used to compute revenue rollups by customer are now five lines.

Business intelligence. The “top 100 customers by revenue” question takes about three seconds in Skipper now. So does “how many domains that signed up today are in the top 100.” So do most of the data-related questions we used to file Jira tickets for.

Security analytics. Our Bot Management team uses Town Lake to query ML scoring events with score > 0.9 in the last 48 hours filtered by ASN and geography. Threat researchers have built their own query toolkit on top of it. Trust & Safety pulls signals to help police abuse.

Customer support. “Find the top 100 billing support tickets from customers who have spent >$100” used to be a multi-day project. Now it’s a Skipper query.

What we have learned

A few things have surprised us.

Less prompting is more. Early versions of Skipper had elaborate, prescriptive system prompts: “First, use search_datasets. Then, use get_entity_details. Then, use list_schema_fields if needed…” Quality went down. The model is good at reasoning about analytical workflows; it doesn’t need to be micromanaged. We replaced the prescriptive prompts with high-level guidance and let the model pick its own path. Results got better.

Tool overlap is poison. We initially exposed every variant of every tool: three different “fetch results” tools, two “search” tools, several “list” tools. The model got confused and called the wrong one. We consolidated. Now fetch_results has a mode parameter (inject / display / both) instead of three separate tools. Every tool has a single reason to exist.

Code, not metadata, captures meaning. The biggest accuracy wins came when we started ingesting the actual SQL that produces a table, not just its schema. A customer_type column with values contract, paygo, free looks identical in either context, but the SQL tells you that customer_type defaults to paygo when Salesforce data is missing. That kind of context never lives in column descriptions.

Memory matters more than we expected. There is a long tail of corrections that look like “you have to filter for X like this” or “ignore tables tagged Y.” Without a memory layer, the agent rediscovers and re-learns these every conversation. With one, it gets monotonically better at the recurring questions a team actually asks.

The boring infrastructure is the hard part. Trino + Iceberg is not new technology. The hard work is in the boring stuff: per-row access control, default-closed table allowlisting, query auditing, time-bound credentials, PII detection, idempotent ingestion, schema evolution. Those are the things that make a data platform safe to actually use.

What’s next

We’re expanding the agent surface. Skipper already integrates as an MCP server into any IDE that supports it. The next step is deeper integration with our own internal chat and ticketing systems, so that “ask the data” becomes the natural first move for anyone debugging an incident, scoping a project, or sanity-checking a hypothesis.

We’re investing heavily in the Transformer pipeline. The goal is for any team at Cloudflare to be able to build a curated dataset with a few SQL files and a .meta.json description, deploy it as a Workflow, get it scheduled and monitored automatically, and have it surface in DataHub and Skipper without any additional work. The idea is self-serve data engineering, with the same shape as self-serve software engineering.

R2 SQL, Cloudflare’s serverless, distributed, analytics query engine, is getting more and more robust by the day. As its feature set expands, we plan to move many parts of Town Lake’s workflow over to it.

The bet we made — that the next breakthrough product comes from someone looking at the data and seeing something nobody else sees — is one we’re still betting on. Town Lake is how we make sure they can find it.

How Epos Now modernized their data platform by building an end-to-end data lake with the AWS Data Lab

Post Syndicated from Debadatta Mohapatra original https://aws.amazon.com/blogs/big-data/how-epos-now-modernized-their-data-platform-by-building-an-end-to-end-data-lake-with-the-aws-data-lab/

Epos Now provides point of sale and payment solutions to over 40,000 hospitality and retailers across 71 countries. Their mission is to help businesses of all sizes reach their full potential through the power of cloud technology, with solutions that are affordable, efficient, and accessible. Their solutions allow businesses to leverage actionable insights, manage their business from anywhere, and reach customers both in-store and online.

Epos Now currently provides real-time and near-real-time reports and dashboards to their merchants on top of their operational database (Microsoft SQL Server). With a growing customer base and new data needs, the team started to see some issues in the current platform.

First, they observed performance degradation for serving the reporting requirements from the same OLTP database with the current data model. A few metrics that needed to be delivered in real time (seconds after a transaction was complete) and a few metrics that needed to be reflected in the dashboard in near-real-time (minutes) took several attempts to load in the dashboard.

This started to cause operational issues for their merchants. The end consumers of reports couldn’t access the dashboard in a timely manner.

Cost and scalability also became a major problem because one single database instance was trying to serve many different use cases.

Epos Now needed a strategic solution to address these issues. Additionally, they didn’t have a dedicated data platform for doing machine learning and advanced analytics use cases, so they decided on two parallel strategies to resolve their data problems and better serve merchants:

  • The first was to rearchitect the near-real-time reporting feature by moving it to a dedicated Amazon Aurora PostgreSQL-Compatible Edition database, with a specific reporting data model to serve to end consumers. This will improve performance, uptime, and cost.
  • The second was to build out a new data platform for reporting, dashboards, and advanced analytics. This will enable use cases for internal data analysts and data scientists to experiment and create multiple data products, ultimately exposing these insights to end customers.

In this post, we discuss how Epos Now designed the overall solution with support from the AWS Data Lab. Having developed a strong strategic relationship with AWS over the last 3 years, Epos Now opted to take advantage of the AWS Data lab program to speed up the process of building a reliable, performant, and cost-effective data platform. The AWS Data Lab program offers accelerated, joint-engineering engagements between customers and AWS technical resources to create tangible deliverables that accelerate data and analytics modernization initiatives.

Working with an AWS Data Lab Architect, Epos Now commenced weekly cadence calls to come up with a high-level architecture. After the objective, success criteria, and stretch goals were clearly defined, the final step was to draft a detailed task list for the upcoming 3-day build phase.

Overview of solution

As part of the 3-day build exercise, Epos Now built the following solution with the ongoing support of their AWS Data Lab Architect.

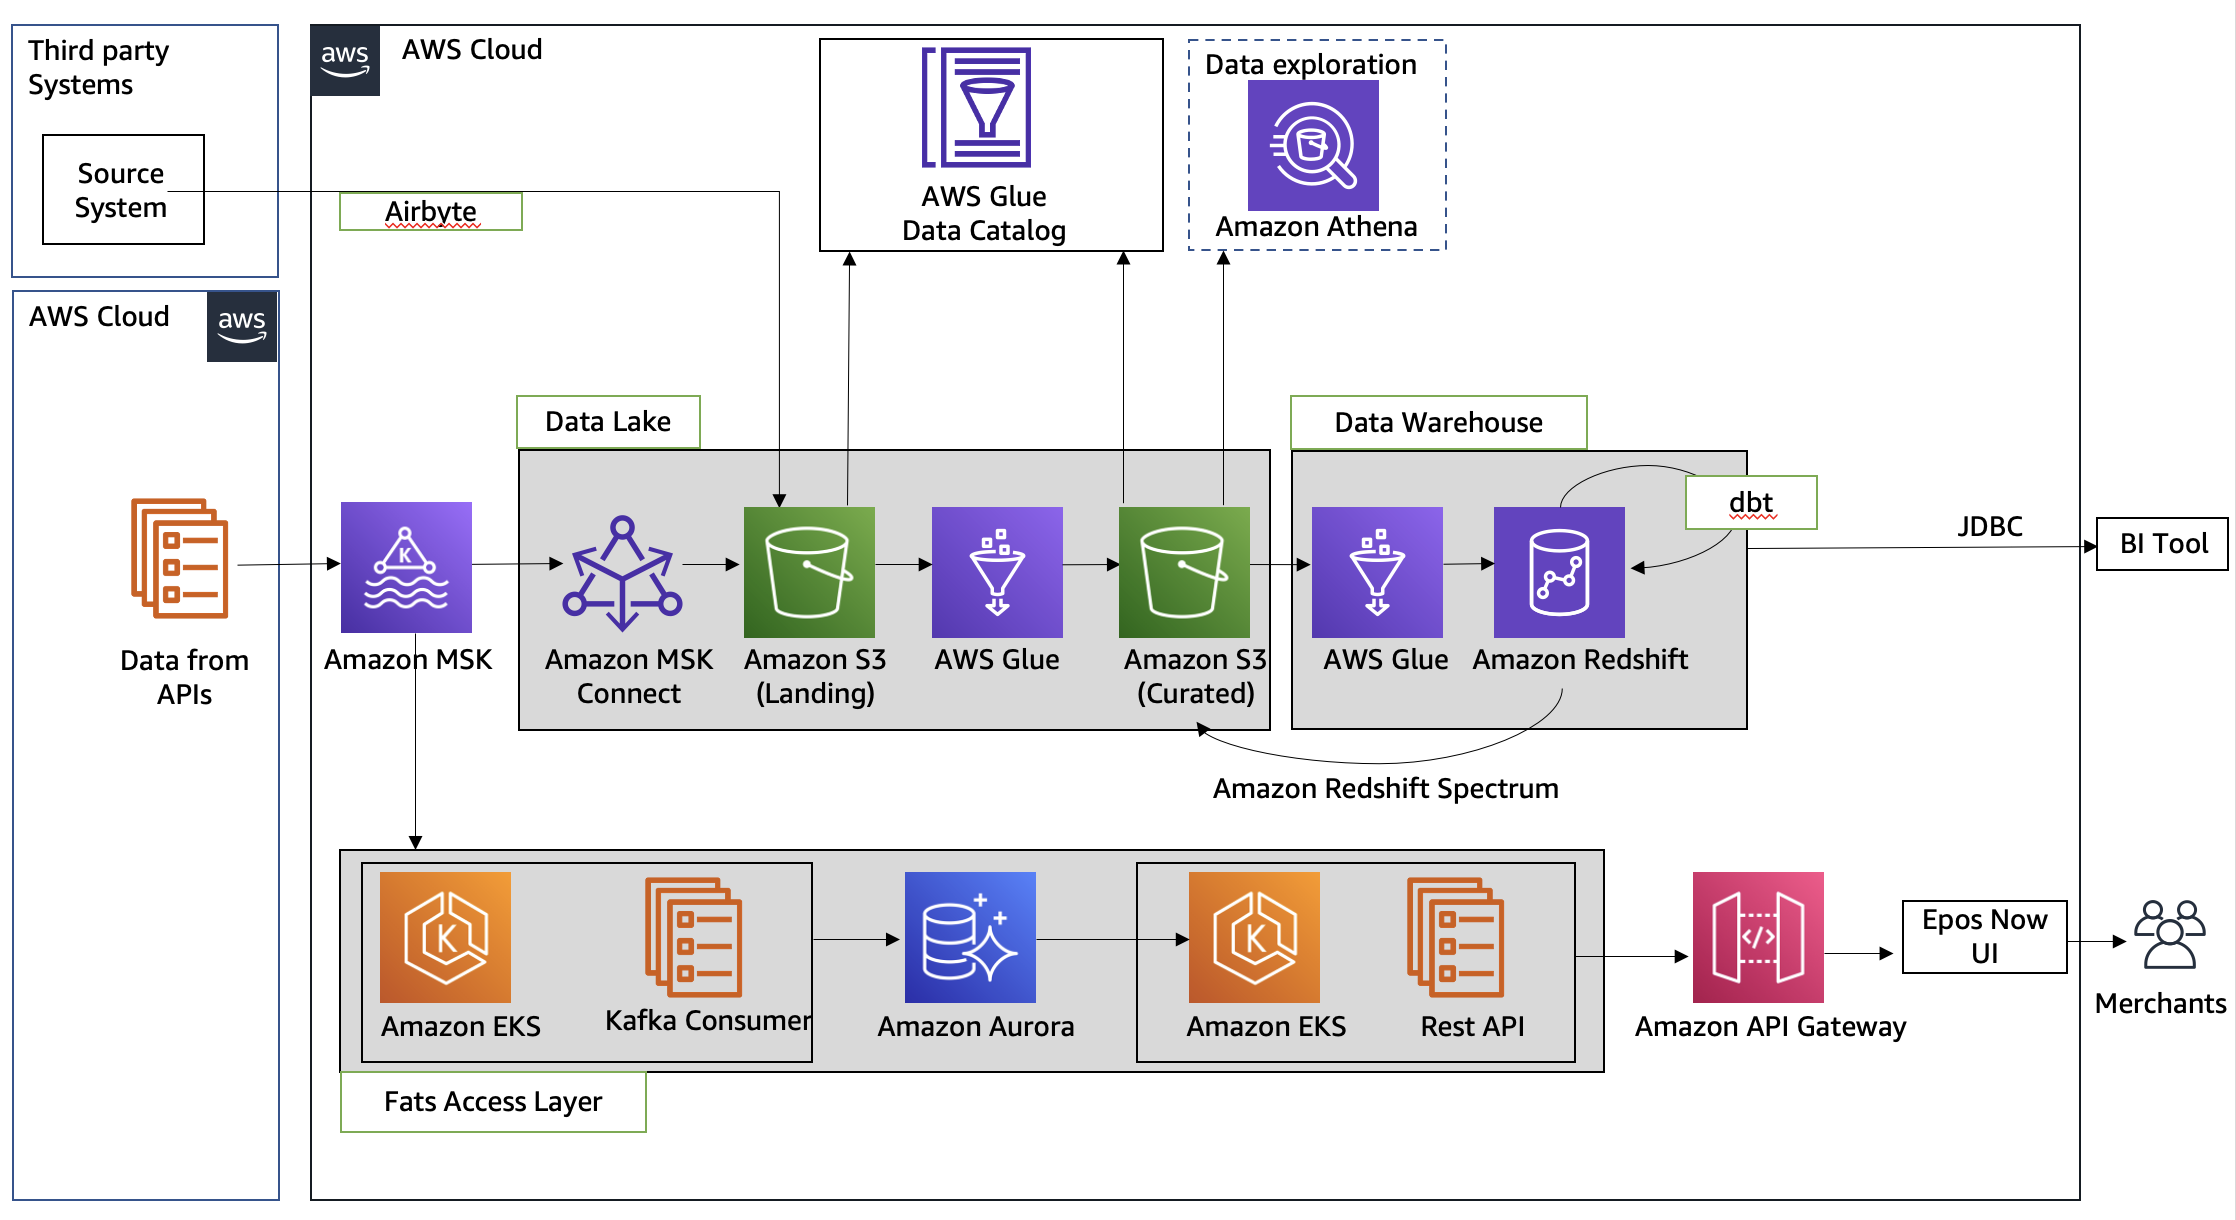
Epos Now Arch Image

The platform consists of an end-to-end data pipeline with three main components:

  • Data lake – As a central source of truth
  • Data warehouse – For analytics and reporting needs
  • Fast access layer – To serve near-real-time reports to merchants

We chose three different storage solutions:

  • Amazon Simple Storage Service (Amazon S3) for raw data landing and a curated data layer to build the foundation of the data lake
  • Amazon Redshift to create a federated data warehouse with conformed dimensions and star schemas for consumption by Microsoft Power BI, running on AWS
  • Aurora PostgreSQL to store all the data for near-real-time reporting as a fast access layer

In the following sections, we go into each component and supporting services in more detail.

Data lake

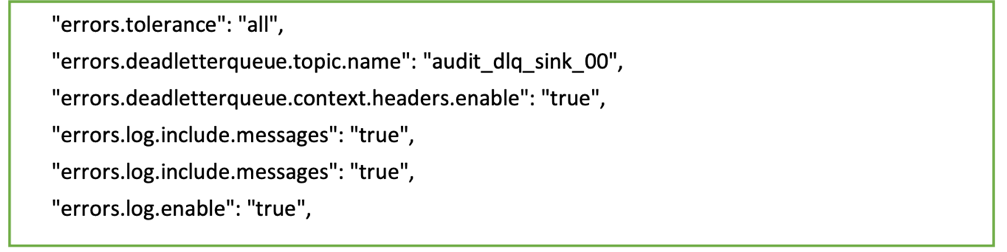
The first component of the data pipeline involved ingesting the data from an Amazon Managed Streaming for Apache Kafka (Amazon MSK) topic using Amazon MSK Connect to land the data into an S3 bucket (landing zone). The Epos Now team used the Confluent Amazon S3 sink connector to sink the data to Amazon S3. To make the sink process more resilient, Epos Now added the required configuration for dead-letter queues to redirect the bad messages to another topic. The following code is a sample configuration for a dead-letter queue in Amazon MSK Connect:

Because Epos Now was ingesting from multiple data sources, they used Airbyte to transfer the data to a landing zone in batches. A subsequent AWS Glue job reads the data from the landing bucket , performs data transformation, and moves the data to a curated zone of Amazon S3 in optimal format and layout. This curated layer then became the source of truth for all other use cases. Then Epos Now used an AWS Glue crawler to update the AWS Glue Data Catalog. This was augmented by the use of Amazon Athena for doing data analysis. To optimize for cost, Epos Now defined an optimal data retention policy on different layers of the data lake to save money as well as keep the dataset relevant.

Data warehouse

After the data lake foundation was established, Epos Now used a subsequent AWS Glue job to load the data from the S3 curated layer to Amazon Redshift. We used Amazon Redshift to make the data queryable in both Amazon Redshift (internal tables) and Amazon Redshift Spectrum. The team then used dbt as an extract, load, and transform (ELT) engine to create the target data model and store it in target tables and views for internal business intelligence reporting. The Epos Now team wanted to use their SQL knowledge to do all ELT operations in Amazon Redshift, so they chose dbt to perform all the joins, aggregations, and other transformations after the data was loaded into the staging tables in Amazon Redshift. Epos Now is currently using Power BI for reporting, which was migrated to the AWS Cloud and connected to Amazon Redshift clusters running inside Epos Now’s VPC.

Fast access layer

To build the fast access layer to deliver the metrics to Epos Now’s retail and hospitality merchants in near-real time, we decided to create a separate pipeline. This required developing a microservice running a Kafka consumer job to subscribe to the same Kafka topic in an Amazon Elastic Kubernetes Service (Amazon EKS) cluster. The microservice received the messages, conducted the transformations, and wrote the data to a target data model hosted on Aurora PostgreSQL. This data was delivered to the UI layer through an API also hosted on Amazon EKS, exposed through Amazon API Gateway.

Outcome

The Epos Now team is currently building both the fast access layer and a centralized lakehouse architecture-based data platform on Amazon S3 and Amazon Redshift for advanced analytics use cases. The new data platform is best positioned to address scalability issues and support new use cases. The Epos Now team has also started offloading some of the real-time reporting requirements to the new target data model hosted in Aurora. The team has a clear strategy around the choice of different storage solutions for the right access patterns: Amazon S3 stores all the raw data, and Aurora hosts all the metrics to serve real-time and near-real-time reporting requirements. The Epos Now team will also enhance the overall solution by applying data retention policies in different layers of the data platform. This will address the platform cost without losing any historical datasets. The data model and structure (data partitioning, columnar file format) we designed greatly improved query performance and overall platform stability.

Conclusion

Epos Now revolutionized their data analytics capabilities, taking advantage of the breadth and depth of the AWS Cloud. They’re now able to serve insights to internal business users, and scale their data platform in a reliable, performant, and cost-effective manner.

The AWS Data Lab engagement enabled Epos Now to move from idea to proof of concept in 3 days using several previously unfamiliar AWS analytics services, including AWS Glue, Amazon MSK, Amazon Redshift, and Amazon API Gateway.

Epos Now is currently in the process of implementing the full data lake architecture, with a rollout to customers planned for late 2022. Once live, they will deliver on their strategic goal to provide real-time transactional data and put insights directly in the hands of their merchants.


About the Authors

Jason Downing is VP of Data and Insights at Epos Now. He is responsible for the Epos Now data platform and product direction. He specializes in product management across a range of industries, including POS systems, mobile money, payments, and eWallets.

Debadatta Mohapatra is an AWS Data Lab Architect. He has extensive experience across big data, data science, and IoT, across consulting and industrials. He is an advocate of cloud-native data platforms and the value they can drive for customers across industries.