Tag Archives: EMR

Detect and resolve HBase inconsistencies faster with AI on Amazon EMR

Post Syndicated from Yu-Ting Su original https://aws.amazon.com/blogs/big-data/detect-and-resolve-hbase-inconsistencies-faster-with-ai-on-amazon-emr/

HBase operations teams spend hours manually correlating logs, metadata, and consistency reports to identify root causes. Traditional approaches require deep expertise and extensive investigation across scattered data sources, directly impacting MTTR and operational efficiency. As HBase deployments scale and expertise becomes increasingly scarce, organizations face mounting pressure to maintain service reliability while managing growing operational complexity. The manual nature of troubleshooting creates bottlenecks that delay incident resolution, increase operational costs, and risk service degradation during critical business periods.

In this post, we show you how to build an AI-powered troubleshooting solution using Amazon OpenSearch Service vector search and intelligent analysis. This solution reduces HBase inconsistency resolution from hours to minutes and root cause identification from days to hours through natural language queries over operational data. This democratizes HBase troubleshooting capabilities across teams and reducing dependency on specialized expertise.

Solution overview

The solution addresses HBase troubleshooting challenges through data processing, vector search, and AI-powered analysis. It processes operational data from Amazon EMR clusters, generates semantic vector embeddings, and enables natural language queries for intelligent troubleshooting.
Key components include:

  • Amazon EMR HBase: Runs HBase workloads with Amazon S3 as the HBase rootdir for durable, scalable storage
  • Data Processing: Extracts and processes HBase logs, HBCK reports, and metadata with vector embeddings
  • Amazon OpenSearch Service: Provides vector search capabilities with k-NN algorithms for semantic analysis
  • AI Analysis Interface: Enables natural language queries with context-aware recommendations
  • Custom Knowledge Base: Supports organization-specific runbooks and troubleshooting procedures by ingesting Git repositories via Kiro CLI‘s /knowledge add command, enabling the AI assistant to reference custom operational guides alongside HBase source code and operational tools

AWS cloud architecture diagram showing an HBase log analysis system with EMR cluster, VPC networking, IAM roles, Lambda functions, OpenSearch domain, and supporting services for scalable log processing and analytics.

The preceding diagram illustrates how the HBase log analysis system troubleshoots inconsistencies through automated workflows across AWS services.

When an operations team needs to investigate HBase issues, the engineer connects over SSH to the Amazon EMR primary node and runs the error collection script, which gathers logs from HBase master and RegionServer nodes and uploads them to Amazon S3. Next, the engineer connects to the Analytics Amazon Elastic Compute Cloud (Amazon EC2) instance and executes the automated processing script, which downloads logs from Amazon S3, generates semantic vector embeddings, and injects them into Amazon OpenSearch Service for k-NN-based semantic search. The engineer then queries the Kiro CLI AI Assistant using natural language to investigate. Kiro searches Amazon OpenSearch Service for relevant log entries and uses Amazon Bedrock to analyze patterns, correlate errors across components, and provide actionable recommendations. This reduces troubleshooting time from hours to minutes. The system operates within an Amazon Virtual Private Cloud (Amazon VPC) with private subnets for Amazon EMR and Analytics Amazon EC2, AWS Identity and Access Management (AWS IAM) roles for access control, Parameter Store for configuration, and Amazon CloudWatch for monitoring.

Prerequisites

For this walkthrough, you need the following prerequisites:

AWS account setup

  • An AWS account with administrative access for initial deployment
  • AWS Command Line Interface (AWS CLI) configured with administrative credentials

Required AWS IAM permissions

For infrastructure deployment

Your deployment user or role needs the following permissions:

  • Your deployment user or role requires sufficient access to AWS CloudFormation, Amazon S3, AWS IAM, and AWS System Manager.
  • The user or role must have the ability to create AWS CloudFormation stacks.

Infrastructure deployment:

  • For infrastructure deployment, you need AWS CloudFormation stack management permissions.
  • You also require sufficient access to create and manage the following resources:
    • Amazon OpenSearch Service domains
    • Amazon EC2 instances, Amazon VPCs, security groups, and networking components
    • AWS IAM roles and policies
    • AWS Systems Manager Parameter Store entries
    • Amazon CloudWatch Logs groups
    • Amazon S3 bucket for access logs and session logs

Runtime service roles

The AWS CloudFormation stack automatically creates two specialized AWS IAM roles designed with least-privilege access principles.

The first role is the Amazon OpenSearch Service Role, which manages Amazon VPC networking and Amazon CloudWatch logging for the Amazon OpenSearch Service domain.

The second role is the Application Role, which provides minimal Amazon OpenSearch Service and Amazon S3 access specifically for log processing applications and secure log ingestion operations.

Network requirements

  • Amazon VPC with private subnets for secure Amazon OpenSearch Service deployment
  • NAT Gateway for outbound internet access from private subnets
  • Security groups configured for HTTPS-only communication

Running Kiro CLI on Amazon EC2

Kiro platform requirements:

Kiro subscription

  • Active Kiro License: Valid subscription to Kiro platform
  • User Account: Registered Kiro user account with appropriate permissions
  • API Access: Kiro API keys or authentication tokens for CLI access

AWS Identity Center integration

  • AWS IAM Identity Center Setup: AWS IAM Identity Center enabled in your AWS organization
  • Permission Sets: Configured permission sets for Kiro users with appropriate AWS access
  • User Assignment: Users assigned to relevant AWS accounts and permission sets
  • SAML/OIDC Configuration: Identity provider integration if using external identity systems

Additional prerequisites

  • Python 3.7+ and Node.js installed locally
  • Python 3.11+ for AWS Lambda runtime environment (required for OpenSearch MCP server compatibility)
  • Sufficient service quotas for Amazon OpenSearch Service instances and Amazon EC2 resources
  • Recommended access to the analysis instance via AWS Systems Manager Session Manager (recommended). Amazon EMR clusters running HBase workloads
  • EMR_EC2_Default_Role of Amazon EMR EC2 instance profile can execute describe-stacks on AWS CloudFormation stacks in us-east-1
  • Basic familiarity with HBase operations

The deployment follows AWS security best practices with resource-specific permissions, regional restrictions, and encrypted data storage. All AWS IAM policies implement least-privilege access patterns to help secure operation of the log analysis pipeline.

Walkthrough

This walkthrough demonstrates deploying and configuring the AI-powered HBase troubleshooting solution in five key steps:

  1. Deploy AWS infrastructure using AWS CloudFormation
  2. Configure Amazon EMR analysis log collection
  3. Process and index HBase data
  4. Enable AI-powered analysis
  5. Add custom knowledge base (optional)

The complete solution is available in our GitHub repository.

Step 1: Deploy the infrastructure

Deploy the required AWS infrastructure including Amazon OpenSearch Service domain, Amazon EC2 instances, and AWS IAM roles.

To deploy the infrastructure

  1. Deploy AWS CloudFormation stack. Please update [email protected] to an email address for security alerts and Advanced Intrusion Detection Environment (AIDE) reports:
# Deploy to development environment
aws cloudformation create-stack \
  --stack-name dev-hbase-log-analysis \
  --template-body file://cloudformation/hbase-log-analysis-simple.yaml \
  --parameters \
    ParameterKey=EnvironmentName,ParameterValue=dev \
    ParameterKey=EC2InstanceType,ParameterValue=m7g.xlarge \
    ParameterKey=SecurityAlertEmail,[email protected] \
  --capabilities CAPABILITY_IAM \
  --region us-east-1
# Wait for deployment to complete (~15-20 minutes)
aws cloudformation wait stack-create-complete \
  --stack-name dev-hbase-log-analysis \
  --region us-east-1
  1. Note the deployment outputs including Amazon OpenSearch Service endpoint and Amazon EC2 instance details in the AWS CloudFormation console.

AWS CloudFormation stack outputs table displaying infrastructure resource identifiers including IAM roles, EC2 instances, security groups, S3 buckets, OpenSearch domain configuration, and VPC details for an HBase log analysis application in the development environment.

The deployment creates:

  • Amazon OpenSearch Service domain with vector search capabilities
  • Amazon EC2 instance for data processing and AI analysis
  • AWS IAM roles with appropriate permissions
  • Security groups and Amazon VPC configuration

Step 2: Connect to Amazon EC2 instance and set up system

Connect to the Amazon EC2 instance using AWS Systems Manager (SSM) and set up the required components.

To connect and set up the system

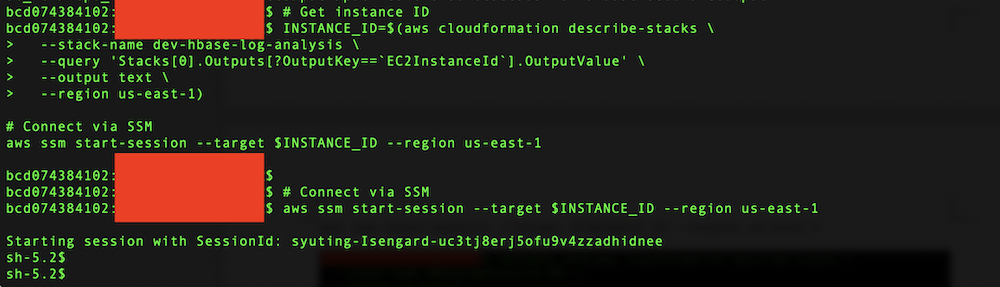
  1. Run the following commands to get the instance ID from AWS CloudFormation outputs and connect via AWS Systems Manager (SSM):
# Get instance ID
INSTANCE_ID=$(aws cloudformation describe-stacks \
  --stack-name dev-hbase-log-analysis \
  --query 'Stacks[0].Outputs[?OutputKey==`EC2InstanceId`].OutputValue' \
  --output text \
  --region us-east-1)
# Connect via SSM
aws ssm start-session --target $INSTANCE_ID --region us-east-1

Terminal screenshot showing AWS CLI commands to retrieve an EC2 instance ID from CloudFormation stack outputs and establish an AWS Systems Manager Session Manager connection to the instance in the us-east-1 region.

  1. Clone the repository and run automated setup:
# On EC2 instance
sudo su - ec2-user

# Re-install aws cli
sudo dnf remove awscli -y

# For ARM64 (Graviton instances - default)
curl "https://awscli.amazonaws.com/awscli-exe-linux-aarch64.zip" -o "awscliv2.zip"

# For x86_64 (if using non-Graviton instances)
# curl "https://awscli.amazonaws.com/awscli-exe-linux-x86_64.zip" -o "awscliv2.zip"

unzip awscliv2.zip
sudo ./aws/install

# update $PATH in ~/.bashrc
echo 'export PATH=$PATH:/usr/local/bin/' >> ~/.bashrc

# Reload ~/.bashrc
source ~/.bashrc

# Fork and clone the source code repository on GitHub: sample-emr-hbase-inconsistencies-detection-recovery-mcp-kiro
git clone https://github.com/YOUR_USERNAME/sample-emr-hbase-inconsistencies-detection-recovery-mcp-kiro.git hbase-analysis
cd hbase-analysis

# Run automated setup
chmod +x ./scripts/setup/automated-system-setup.sh
./scripts/setup/automated-system-setup.sh \
  --emr-version emr-7.12.0 \
  --stack-name dev-hbase-log-analysis \
  --region us-east-1

The automated setup script installs:

  • System dependencies (awscli, git, unzip)
  • uv package manager and OpenSearch MCP Server
  • Kiro CLI and configuration with AWS IAM Identity Center authentication. The script will automatically add Apache HBase open source repo and Apache HBase open source operational tools to knowledge bases
  • HBase source repositories for your Amazon EMR version
  • Python dependencies and MCP server configuration
  1. Add your own knowledge base to Kiro CLI

To enhance Kiro CLI’s analysis capabilities with Apache HBase open-source repositories, your organization’s HBase runbooks and troubleshooting guides, you can add your own knowledge base repositories. Here are the commands. Please periodically validate and maintain your runbook contents so that they remain accurate and up-to-date, reflecting any changes in your HBase environment, configurations, or operational procedures.:

# Navigate to the HBase repositories directory
cd /opt/hbase-repositories
# Clone your organization's HBase runbook repository
git clone <runbook-repository-url> <your-own-runbook-repo>
# Example:
# git clone https://github.com/your-org/hbase-runbooks.git hbase-runbooks
# git clone https://gitlab.company.com/ops/hbase-troubleshooting.git hbase-troubleshooting
# Add your custom repositories to Kiro CLI knowledge base manually (run these commands inside kiro-cli):
echo "/knowledge add --name \"Your custom HBase knowledge base\" --path /opt/hbase-repositories/<your-own-runbook-repo>" | kiro-cli
# Example:
# echo "/knowledge add --name \"Company HBase runbooks\" --path /opt/hbase-repositories/hbase-runbooks" | kiro-cli
# echo "/knowledge add --name \"HBase troubleshooting guides\" --path /opt/hbase-repositories/hbase-troubleshooting" | kiro-cli

Step 3: Configure Amazon EMR log analysis collection

Set up data collection from your Amazon EMR clusters to gather HBase logs, metadata, and consistency reports using the recommended direct collection method.
To configure Amazon EMR log analysis collection

  1. On your Amazon EMR cluster primary node, run the following commands to download the collection scripts:
# On EMR primary node
sudo su - hadoop

# Fork and clone the source code repository on GitHub: sample-emr-hbase-inconsistencies-detection-recovery-mcp-kiro
git clone https://github.com/YOUR_USERNAME/sample-emr-hbase-inconsistencies-detection-recovery-mcp-kiro.git hbase-analysis
cd hbase-analysis
  1. Run the interactive collection wizard:
# Run collection wizard
python3 scripts/utilities/emr_log_collection/emr_cluster_wizard_v2.py

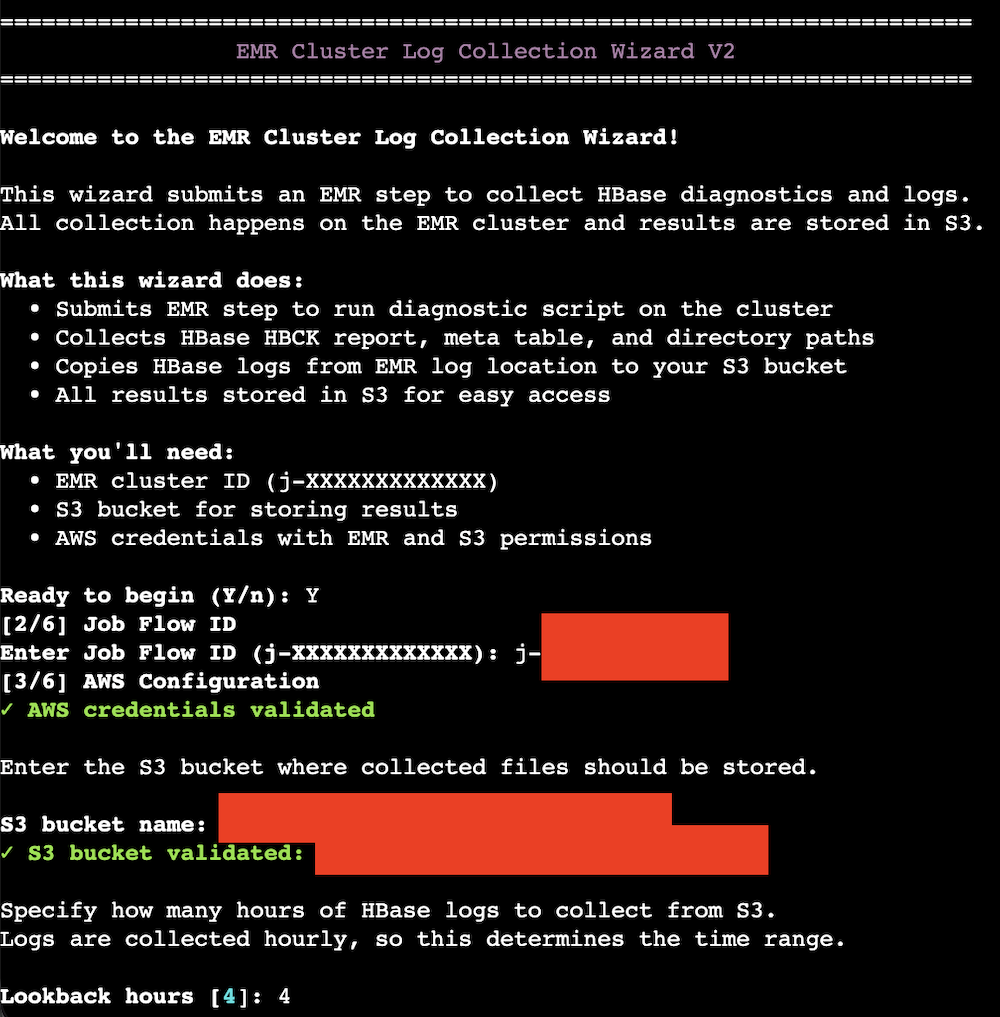
Input the parameters like the EMR cluster’s jobflow ID, the log analysis Amazon S3 bucket name, and the lookback hours. The default value of the lookback hours is 4 hours.

Terminal screenshot of EMR Cluster Log Collection Wizard V2 showing an interactive command-line interface for configuring HBase diagnostic log collection from Amazon EMR clusters, with step indicators, input fields for job flow ID and S3 bucket, validation confirmations, and lookback hour configuration.

  1. The collection wizard performs these actions:
  • Collects HBase logs from local filesystem. Please reference to prerequisites for the access permission.
  • Runs sudo -u hbase hbase hbck -details (or hbck2 for HBase 2.x)
  • Runs hdfs dfs -ls -R /hbase or aws s3 ls <hbase-root-dir> –recursive
  • Runs hbase shell <<< 'scan "hbase:meta"'
  • Creates properly named files matching analysis system requirements
  • Uploads to Amazon S3 with correct naming conventions

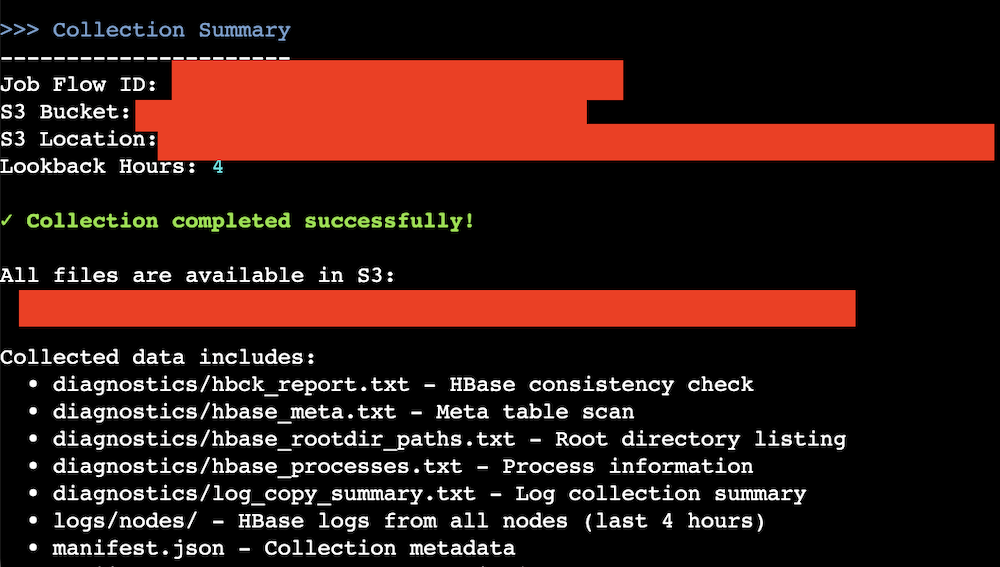
Here’s the data collection summary:

Terminal screenshot showing EMR Cluster Log Collection Wizard V2 completion summary with job flow ID, S3 bucket location, 4-hour lookback period, green success confirmation message, S3 file path, and detailed listing of seven collected diagnostic files including HBCK reports, HBase meta table scans, root directory paths, process information, log collection summary, node logs from all servers, and collection metadata in JSON format.

You can check the uploaded contents through AWS CLI.

aws s3 ls s3://<log-path> --recursive

Here’s a screenshot of the outputs.

Terminal screenshot showing AWS CLI command output listing HBase diagnostic files and logs collected from an EMR cluster and stored in Amazon S3, displaying timestamps, file sizes, and complete S3 object paths including diagnostics directory with HBCK reports, meta table scans, root directory listings, process information, and logs directory with compressed application logs from HBase master and regionserver nodes.

  1. On the Analysis Amazon EC2 instance, download collected files to the Analysis Amazon EC2 instance.
# On analytics EC2 instance
sudo su - ec2-user

# Download logs from S3
mkdir -p /tmp/hbase-log-analysis
cd /tmp/hbase-log-analysis
aws s3 sync s3://<S3-BUCKET-NAME>/emr-logs/<EMR-JOBFLOW-ID>/ .

You can get your jobflow ID from Amazon EMR console:

Amazon EMR clusters management dashboard displaying a table with clusters, showing one cluster entry named "test" in waiting status with green indicator, creation time, elapsed time, normalized instances, along with filter controls, search functionality, pagination showing page 1, and action buttons for View details, Terminate, Clone, and Create cluster operations.

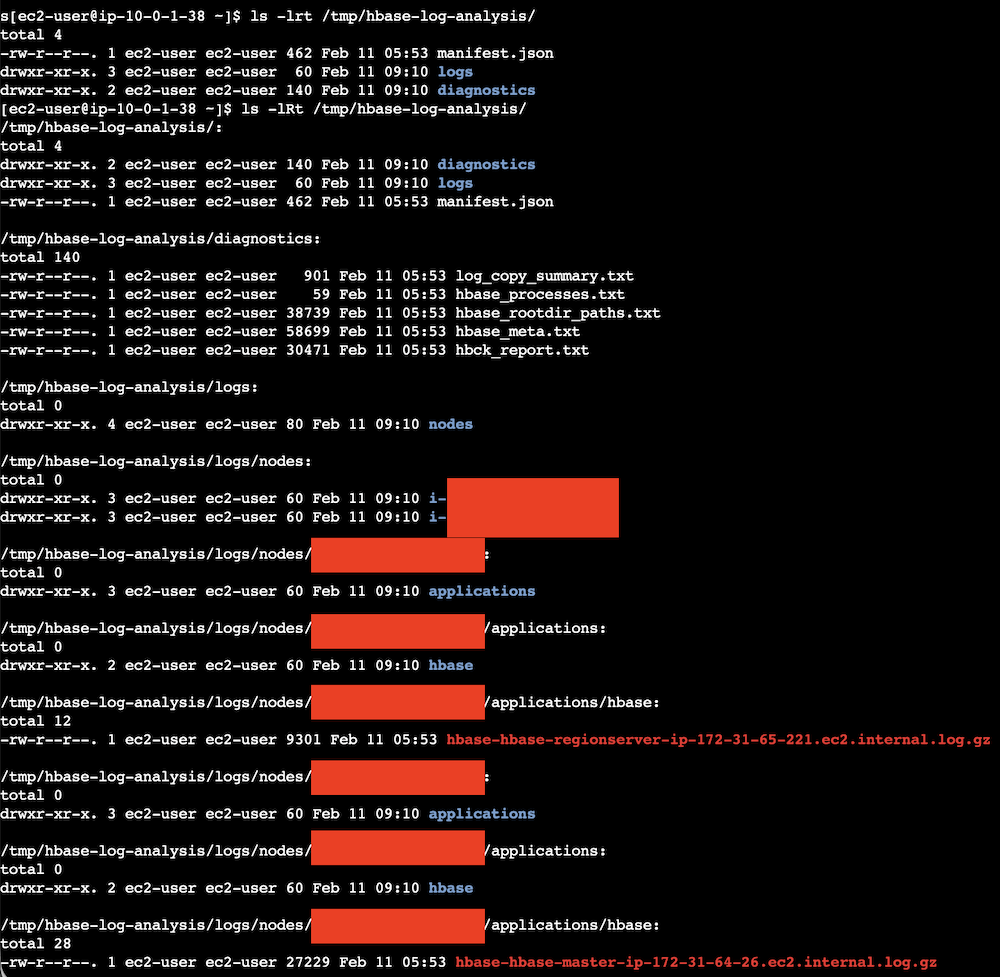
The generated files (hbase-hbase-master-ip-xxx-xxx-xxx-xxx.ec2.internal.log.gz, hbase-hbase-regionserver-ip-xxx-xxx-xxx-xxx.ec2.internal.log.gz, hbck_report.txt, hbase_rootdir_paths.txt, hbase_meta.txt, hbase_processes.txt, log_copy_summary.txt) should be aligned with the automated processing script requirements as following.

Terminal screenshot showing recursive ls -lRt command output listing HBase diagnostic files and logs in /tmp/hbase-log-analysis/ directory, displaying file permissions, ownership by ec2-user, file sizes, timestamps, and complete directory structure including diagnostics directory with text files (manifest.json, HBCK report, meta table scan, process information, root directory paths, log copy summary), logs directory with nested nodes subdirectory containing redacted instance IDs, and applications/hbase subdirectories with compressed RegionServer and Master log files.

Step 4: Process and index data

Process the collected HBase data and create vector embeddings for intelligent search capabilities.To process and index the data, please navigate to the project directory on the Analysis EC2 instance, and run automated-log-processing.sh:

sudo su – ec2-user
cd ~/hbase-analysis
chmod +x ./scripts/processing/automated-log-processing.sh
./scripts/processing/automated-log-processing.sh \
  --job-flow-id j-YOUR-JOB-FLOW-ID \
  --stack-name dev-hbase-log-analysis

The processing scripts extract and parse HBase logs and generate dimensional vector embeddings from HBase log messages using sentence transformer models to enable semantic search beyond keyword matching. The system uses the all-MiniLM-L6-v2 model by default (producing 384-dimensional embeddings), but supports configurable models with different embedding dimensions, automatically adapting the OpenSearch vector index to match the chosen model’s output. The system processes comprehensive HBase operational data including region operations, compaction activities, Write-Ahead Log events, memstore operations, and cluster management information from HMaster and RegionServer logs. Vector embeddings capture error messages, exception stack traces, performance warnings, and multi-line log entries through intelligent text preprocessing. This semantic representation enables advanced troubleshooting where users can query conceptually for “region server performance issues” or “memory pressure” and receive contextually relevant results across different log files and time periods. The vector search capabilities support error correlation by grouping similar exceptions, performance analysis by identifying related bottlenecks, and operational pattern recognition. Each log entry is stored in Amazon OpenSearch Service with original metadata (timestamp, log level, source file, job flow ID) alongside the embedding vector, enabling both structured queries and AI-powered semantic analysis. This approach transforms raw HBase logs into a searchable knowledge base supporting anomaly detection, trend analysis, and predictive insights for proactive cluster management and troubleshooting.

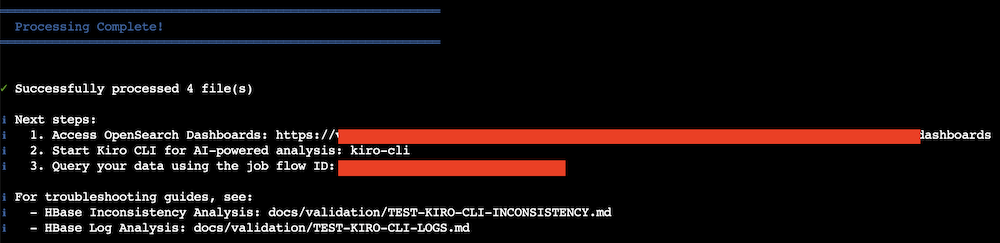
All scripts use AWS IAM authentication automatically. Here’s a screenshot of the data processing outputs.

Terminal screenshot showing successful completion of HBase log analysis processing, green checkmark, confirmation message "Successfully processed 4 file(s)", and next steps section displaying three numbered instructions with redacted URLs for accessing OpenSearch Dashboards, starting Kiro CLI for AI-powered analysis, and querying data using job flow ID, followed by troubleshooting documentation references for HBase inconsistency analysis and log analysis guides.

Step 5: Enable AI-powered analysis

Configure the AI analysis interface to enable natural language queries against your HBase operational data.

To set up AI-powered analysis

  1. Launch Kiro CLI (already configured by automated setup):

kiro-cliCheck mcp and knowledge bases. /mcp list

Terminal screenshot showing MCP list command output displaying one configured MCP server named "opensearch-mcp-server" with command "uvx" in green and white text on dark background with pink shell prompt, featuring a purple "Configured MCP Servers" header with checkbox icon and green horizontal separator line.

/knowledge show

Terminal screenshot showing "/knowledge show" command output displaying Agent kiro_default's knowledge base with repositories: Apache HBase source code, and HBase operational tools

If you cannot see these 2 knowledge bases, you can manually add them through the following commands:

# Note: Large repositories (~500MB) may take a while to index. Check progress with: /knowledge show
/knowledge add --name "HBase operational tools" --path /opt/hbase-repositories/hbase-operator-tools"
/knowledge add --name "Apache HBase source code" --path /opt/hbase-repositories/hbase"
  1. Use natural language queries to analyze your HBase data. The AI analysis uses both the OpenSearch MCP Server for querying indexed data and the Filesystem knowledge bases for accessing HBase source code. You can add your custom runbooks for Kiro’s reference as well.

For HBase inconsistency analysis:

# HBase Inconsistency Detection and Remediation Guidelines
## Search Strategy
- Use fuzzy search for case variations/typos, term query for exact region IDs, match_phrase for paths, query_string for logs
- Always use .keyword subfields for exact text matching
- Cross-reference filesystem (wildcard: {"wildcard": {"path": "*<region_id>*"}}) with hbase:meta (match: {"match": {"row_key": "<region_id>"}})
- The total region count in hbase meta must match the total matched document count of wildcard path like "*/.regioninfo" in hbase rootdir path.  
- All terms of region_name.keyword for a region encoded name must match a wildcard path like "*/.regioninfo"
- All terms of table_name.keyword for a table must match a wildcard path like "*/.tabledesc*"
- 1595e783b53d99cd5eef43b6debb2682 is the master store region that will locate in <hbase-root-dir>/MasterData/data/master/store/1595e783b53d99cd5eef43b6debb2682/
- May cross check with the raw logs in /tmp/hbase-log-analysis/
## Issue Types
Orphan regions, missing .regioninfo, missing/extra regions in hbase:meta, rowkey holes, stuck RIT, master initialization failures
## Analysis Steps
### 1. Cross-Reference Meta vs Filesystem
- Filesystem regions NOT in hbase:meta → ORPHAN REGION
- Meta regions NOT in filesystem → MISSING REGION
### 2. Validate Region Chain Continuity
- Sort regions by STARTKEY, verify region[i].ENDKEY == region[i+1].STARTKEY
- First STARTKEY must be '', last ENDKEY must be ''
- Gaps → ROWKEY HOLE
### 3. Check Region States
- state != 'OPEN' → Check RIT
- Missing server assignment → UNASSIGNED
- Multiple servers → SPLIT BRAIN
- "deployed_servers" field must have only one region server address like "ip-xxx-xxx-xxx-xxx.ec2.internal,16020,1770781485397" . The value should not be null or have multiple values. 
### 4. Validate .regioninfo Files
- Missing .regioninfo in region directory → CORRUPT REGION
### 5. Cross-Check HBCK Report
- Compare orphan counts, RIT regions, filesystem vs meta region counts
### 6. Analyze Logs
- Search: "updating hbase:meta row=<region>", "STUCK", "RIT", "Failed" + "<region>", "Split"/"Merge" + "<region>"
## Remediation
- Reference knowledge bases: "Apache HBase source code", "HBase operational tools"
- Use hbck2: /usr/lib/hbase-operator-tools/hbase-hbck2.jar
- Prefix commands with sudo -u hbase
- Use aws s3 for S3-based rootdir
- Wait 300s after creating holes before hbck fixMeta (catalog janitor cycle)
- Use unassign instead of deprecated close_region
- If the region does not have .regioninfo in  <hbase-root-dir>/data/<namespace>/<table-name>/<region-encoded-name>/ but hbase:meta has that region's information and that region has been deployed on a healthy region server, you can use hbase shell to unassign and assign the region to re-generate .regioninfo
- Always add "sudo -u hbase hbase" before "hbase shell" and "hbase hbck" commands
## Job flow
Target: <your-job-flow-id>
Inconsistency to detect: All kinds of inconsistencies

You can trust or input “y” or “t” to grant Kiro to search through mcp and knowledge bases.

Terminal screenshot showing MCP tool execution authorization prompt.

You may get some outputs like this: Kiro checked for any HBase issue.

Terminal screenshot showing HBase database query results for user table entries with server configuration details and an HBase Inconsistency Detection Framework analysis report

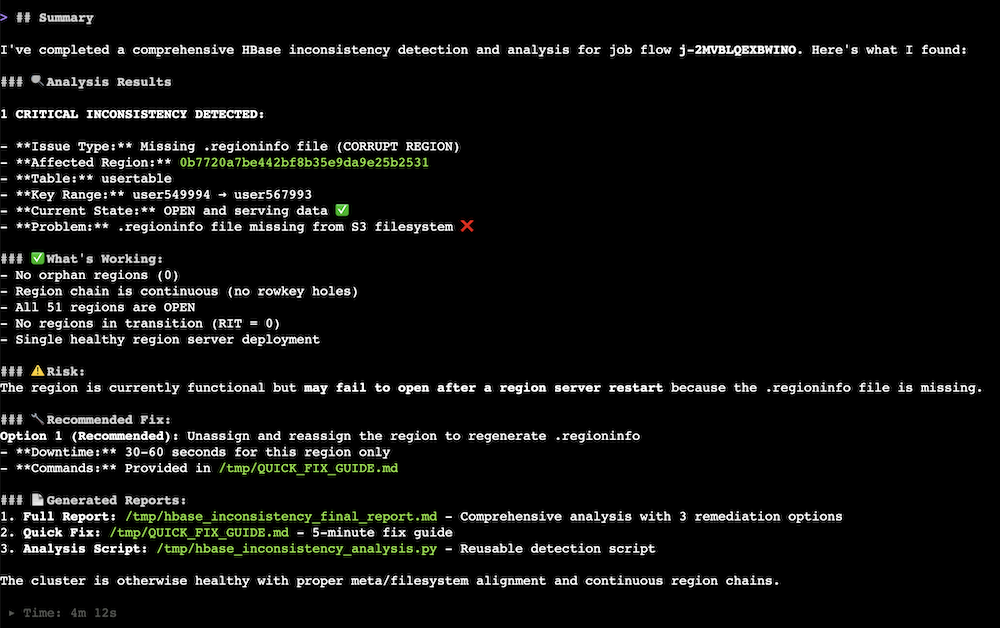
Kiro summarized the examination results.

Terminal screenshot displaying HBase inconsistency detection analysis results for job flow, showing one critical missing .regioninfo file issue for HBase region in a HBase table, with cluster health metrics, risk assessment, recommended fixes, and generated diagnostic reports.

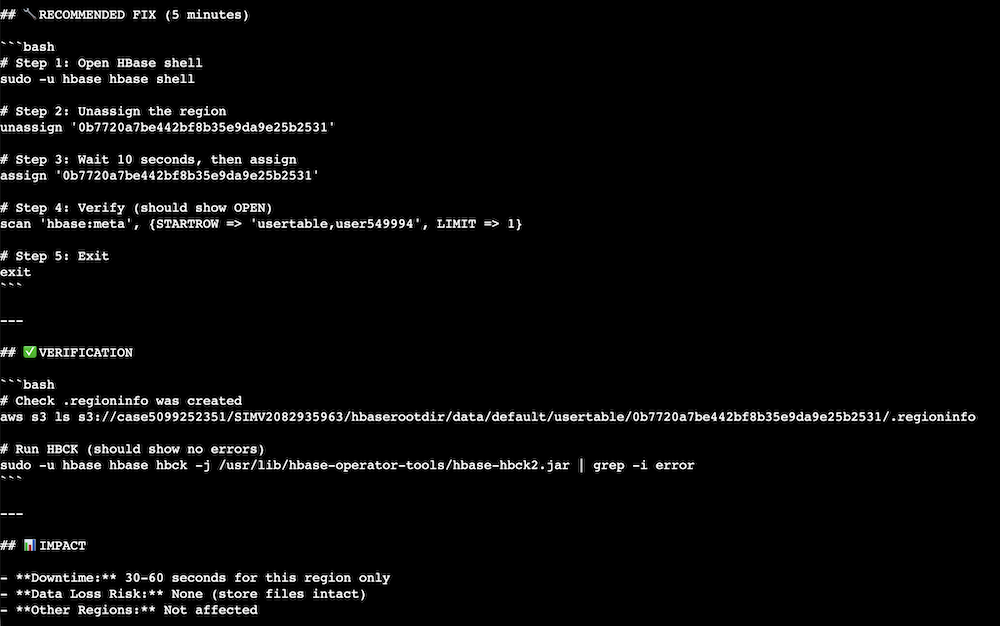
Kiro provided mitigation commands after Kiro summarized the issue.

Terminal screenshot displaying a structured HBase quick fix guide with three sections: recommended fix procedure with sequential steps for region reassignment, verification steps using AWS S3 and HBCK2 tools, and impact assessment showing 30-60 second downtime, zero data loss risk, and isolated region scope for fixing missing .regioninfo file in HBase region.

Cleaning up

To avoid incurring future charges, delete the resources created during this walkthrough.

To clean up the resources

  1. Delete the AWS CloudFormation stack from AWS Management Console:

AWS CloudFormation Stacks management console displaying a list view with stacks, showing the "dev-hbase-log-analysis" stack with CREATE_COMPLETE status, along with action buttons for Delete, Update stack, Stack actions, and Create stack.

  1. Clean up Amazon EMR cluster resources (if created only for this walkthrough):
AWS EMR Clusters management console showing page clusters with a cluster in "Waiting" status
  1. Verify resource cleanup in the AWS Console to verify that all resources are deleted and review your AWS bill to confirm no unexpected charges.

Important considerations:

  • Amazon OpenSearch Service domains take several minutes to fully delete
  • Amazon S3 buckets with versioning retain object versions
  • Use smaller instance types for development to optimize costs
  • Monitor usage with AWS Cost Explorer

Conclusion

In this post, we showed you how to build an AI-powered HBase troubleshooting solution that transforms manual log analysis into an automated workflow. By combining Amazon OpenSearch Service vector search with Amazon Bedrock-powered analysis through the Kiro CLI, operations teams can resolve complex HBase inconsistencies faster and gain deeper operational insights. The solution demonstrates how AI augments human expertise to improve operational efficiency, reducing HBase inconsistency resolution from hours to minutes and root cause identification from days to hours. Ready to transform your HBase operations? Get started with the GitHub repository and explore the Amazon OpenSearch Service documentation for additional guidance on vector search capabilities.

Acknowledgments

The author would like to thank Xi Yang, Anirudh Chawla, and Sasidhar Puthambakkam for their contributions to developing the technical solution. Xi Yang is a Senior Hadoop System Engineer and Amazon EMR subject matter expert at AWS. Anirudh Chawla is an AWS Analytics Specialist Solution Architect who helps organizations empower businesses to harness their data effectively through AWS’s analytics platform. Sasidhar Puthambakkam is a Senior Hadoop Systems Engineer and Amazon EMR Subject Matter Expert who provides architectural guidance for complex BigData workloads.


About the authors

Yu-Ting Su

Yu-ting Su, Sr. Hadoop System Engineer, AWS Support Engineering. Yu-Ting is a Sr. Hadoop Systems Engineer at Amazon Web Services (AWS). Her expertise is in Amazon EMR and Amazon OpenSearch Service. She’s passionate about distributing computation and helping people to bring their ideas to life.

A guide to Airflow worker pool optimization in Amazon MWAA

Post Syndicated from Boyko Radulov original https://aws.amazon.com/blogs/big-data/a-guide-to-airflow-worker-pool-optimization-in-amazon-mwaa/

Optimizing the Airflow worker pool configuration in Amazon Managed Workflows for Apache Airflow (Amazon MWAA), the AWS fully managed Apache Airflow service, is an important yet often overlooked strategy for scaling workflow operations. Tasks queued for longer periods can create the illusion that additional workers are the solution, when in reality the root cause might lie elsewhere. The decision to scale isn’t always straightforward. DevOps engineers and system administrators frequently face the challenge of determining whether adding more workers will solve their performance issues or only increase operational cost without addressing the root cause.

This post explores different patterns for worker scaling decisions in Amazon MWAA, focusing on the task pool mechanism and its relationship to worker allocation. By examining specific scenarios and providing a practical decision framework, this post helps you determine whether adding workers is the right solution for your performance challenges, and if so, how to implement this scaling effectively.

Main patterns

This section discusses the most frequently seen problems that raise the question if adding additional workers would improve the health of your environment.

High CPU

Airflow serves as a workflow management platform that coordinates and schedules tasks to be run on external processing services. It acts as a central orchestrator that can trigger and monitor tasks across various data processing systems like AWS Glue, AWS Batch, Amazon EMR, and other specialized data processing tools. Rather than processing data itself, Airflow’s strength lies in managing complex workflows and coordinating jobs between different systems and services.

In Analytics and Big Data environments, there is a prevalent misconception that saturated resources automatically warrant adding more capacity. However, for Amazon MWAA, understanding your workflow characteristics and optimization opportunities should precede scaling decisions.

As you scale up your workflows, resource utilization of the Airflow clusters naturally increases. When workers consistently operate at full capacity, it may seem intuitive to add additional compute resources. However, this approach often masks underlying inefficiencies rather than resolving them.

For example, in Amazon MWAA if you are running a single task that is consuming 100% of the available CPU on your Amazon MWAA worker, adding additional workers will not resolve the problem as the task is not optimized nor split into smaller parts. As such, increasing the number of minimum workers will not bring the expected effect but will only increase the operating costs.

When your Amazon MWAA workers are consistently running above 90% CPU or Memory utilization, you’ve reached a critical decision point. Before taking actions, it is essential to understand the root cause. You have three primary options:

  1. Scale horizontally by adding additional workers to distribute the load.
  2. Scale vertically by upgrading to a larger environment class for more resources per worker.
  3. Optimize your DAGs and scheduling patterns to be more efficient and consume fewer resources.

Each approach addresses different underlying issues, and choosing the right path depends on identifying whether you are facing a capacity constraint, resource-intensive task design, or workflow inefficiency. For guidance on optimization strategies, please refer to Performance tuning for Apache Airflow on Amazon MWAA.

To monitor the CPUUtilization and MemoryUtilization on the workers, refer to the Accessing metrics in the Amazon CloudWatch console and choose the corresponding metrics.

  1. Select a time window long enough to show usage patterns.
  2. Set period to 1 Minute.
  3. Set statistics to Maximum.

Long queue time

Sometimes Airflow tasks are stuck in a queued state for a long time, which prevents DAGs from completing on time.

In Amazon MWAA, each environment class comes with configured minimum and maximum worker nodes. Each worker provides a pre-configured concurrency, which is the number of tasks that can run simultaneously on each worker at any given time. The behavior is controlled through celery.worker_autoscale=(max,min).

For example, if you have minimum 4 mw1.small workers, with default Airflow configuration, you will be able to run 20 concurrent tasks (4 workers x 5 max_tasks_per_worker). If your system suddenly requires more than 20 tasks to execute concurrently, this will result in an autoscaling event. Amazon MWAA will decide how to scale your workers efficiently, and trigger the process. The autoscaling process, however, requires additional time to provision new workers resulting in additional tasks in queued status. To mitigate this queuing issue, consider the following:

  1. If the CPU utilization on the workers is low, increasing the max value in celery.worker_autoscale=(max,min) can reduce the time tasks stay in queued state as each worker will be able to process more tasks concurrently. Airflow worker can take tasks up to the defined task concurrency regardless of the availability of its own system resources. As a result, the base worker may reach 100% CPU/Memory utilization before Autoscaling takes effect.
  2. If you do not want to increase the task concurrency on the workers, increasing the minimum worker count can also be beneficial because having more available workers allows a higher number of tasks to run concurrently.

Scheduling delays

Adding new DAGs can not only affect your system resources, but it can also create uneven scheduling patterns. Some DAGs may experience delayed execution because of resource competition, even when the overall environment metrics appear healthy. This scheduling skew often manifests as inconsistent task pickup times, where certain workflows consistently wait longer in the queue while others execute promptly.

When Amazon CloudWatch metrics show increasing variance in task scheduling times, particularly during periods of high DAG activity, it signals the need for environment optimization. This scenario requires careful analysis of execution patterns and resource utilization to determine if:

  1. While adding workers can help distribute the workload, this solution is most effective when the high utilization is primarily because of task execution load rather than DAG parsing or scheduling overhead. Adding more minimum workers will allow you to execute more tasks in parallel. For example, if you observe the value of AWS/MWAA/ApproximateAgeOfOldestTask to be steadily increasing, it means that the workers are not able to consume the messages from the queue fast enough. Additionally, you can also monitor the AWS/MWAA/QueuedTasks to identify similar patterns.
  2. Upgrading the environment class would provide better scheduling capacity. If the Scheduler is showing signs of strain or if you’re seeing high resource utilization across all components, upgrading to a larger environment class might be the most appropriate solution. This provides more resources to both the Scheduler and Workers, allowing for better handling of increased DAG complexity and volume. To validate the same, use AWS/MWAA/CPUUtilization and AWS/MWAA/MemoryUtilization in the Cluster metrics and choose Scheduler, BaseWorker and AdditionalWorker metrics.
  3. Restructuring DAG schedules would reduce resource contention.

The key is to understand your workflow patterns and identify whether the scheduling delays are because of insufficient worker capacity or other environmental constraints.

Anti patterns

This section showcases the most common anti patterns which make MWAA users think that adding more workers will improve performance.

Underutilized workers

When evaluating Amazon MWAA performance bottlenecks, it’s important to distinguish resource constraints and DAG design inefficiencies before scaling the environment.

Sometimes the Amazon MWAA environment has the capacity to run 100 tasks concurrently but your queue metrics (AWS/MWAA/RunningTasks) show only 20 tasks active most of the time with no tasks remaining in queued state. In such scenarios, you are advised to check Amazon CloudWatch for consistently low CPU and memory usage on existing workers during peak workload times. If this is confirmed, it is usually an indication of inefficiencies in DAG design, scheduling patterns, or Airflow configuration.

You have two primary options to address this:

1. Downsize: If you do not expect your workload to increase, it is safe to assume you have over-provisioned your cluster. Start by removing any extra workers first and finally resolve to downsizing your environment class.

2. Optimize: Fine tune your DAG scheduling and airflow configuration through Pools and Airflow configuration for concurrency to increase the throughput of your system.

Misconfigured Airflow configurations that create artificial bottlenecks

In Apache Airflow, performance bottlenecks often occur because of configuration settings, not actual resource constraints. At such times, DAG executions get delayed not because of insufficient compute, but because of incorrect concurrency configuration.

Efficient use of Amazon MWAA requires reviewing not only resource utilization for Workers and Schedulers but also concurrency configurations for artificially created bottlenecks. Sometimes one restrictive configuration prevents the scaling benefits of larger environment or additional workers. Always audit Airflow configurations if performance seems limited even when system metrics suggest spare capacity.

Important consideration: Amazon Managed Workflows for Apache Airflow (Amazon MWAA) does not automatically update the worker concurrency configuration when you change the environment class. This behavior is important to understand when scaling your environment. If you initially create an mw1.small environment, where each worker can handle up to 5 concurrent tasks by default. When you upgrade to a medium environment class (which supports 10 concurrent tasks per worker by default), the concurrency setting remains at 5 for in-place updated environments. You must manually update the concurrency configuration to take full advantage of the increased capacity available in the medium environment class.

Because of this you need to also update the Airflow configurations that control concurrency whenever you update the environment class. To update the concurrency setting after upgrading your environment class, modify the celery.worker_autoscale configuration in your Apache Airflow configuration options. This makes sure your workers can process the maximum number of concurrent tasks supported by your new environment class.

Other times, an Amazon MWAA environment can be constrained by max_active_runs or DAG concurrency controls instead of actual resource limits. These configuration-based throttles prevent tasks from running, even when the worker instances have available compute to handle the workload.

There is an important distinction between the two. Configuration limits act as artificial caps on parallelism, while true resource limits indicate that workers are fully utilizing their CPU or memory capacity. Understanding which type of constraint affects your environment helps you determine whether to adjust configuration settings or scale your infrastructure.

Adjusting Airflow configurations such as Pools, concurrency, max_active_runs solves performance problems without scaling workers. Some of the configurations you can use to control this behavior:

  1. max_active_runs_per_dag (DAG level): Controls how many DAG runs for a given DAG are allowed at the same time. If set to 2, only 2 DAG runs can run concurrently, even if there is plenty of worker capacity left. Extra runs queue, making the DAG executions slow even though workers are idle.
  2. max_active_tasks:Controls the concurrency field in a DAG definition (or setting at environment level) limits the number of tasks from the DAG running at any moment, regardless of overall system capacity or number of workers.
  3. Pools:Pools restrict how many tasks of a certain type (often resource heavy) can run at once. A pool with only 3 slots will throttle any tasks above 3 assigned to that pool, leaving workers idle.
  4. Execution timeouts and retries: If not tuned, failed tasks might fill up slots unnecessarily, stuck tasks can block worker slots and slow queue processing.
  5. Scheduling intervals and dependencies: Overlapping or inefficient scheduling may cause idle periods or excess contention for resources, affecting real throughput.

How Airflow configurations can override each other

Airflow has multiple layers of concurrency and scheduling controls. Some at the environment level, some at the DAG/task level, and others for pools. Sometimes more restrictive settings override more permissive ones, resulting in unexpected queue buildup.

DAG level vs Environment level: If “max_active_runs_per_dag” (DAG level) is lower than the environment-level “max_active_runs_per_dag” or system wide concurrency, the DAG setting is used, throttling tasks even if the environment could do more.

Task level overrides: Individual task definitions can have their own parameters like “max_active_tis_per_dag” which can cap runs per task and create a bottleneck if set lower than global settings.

Order of precedence: The most restrictive relevant configuration at any level (Environment, DAG, Task) effectively sets the upper bound for parallel task execution.

Setting Location Setting Effect on task throughput
Environment Level parallelism Max total tasks running on Scheduler
DAG Level max_active_runs Max simultaneous DAG runs
Task Level concurrency Max concurrent task for that DAG

Performance issues often resemble resource exhaustion, but actually derive from overly restrictive configurations. Audit all the preceding parameters carefully. You can loosen restrictive values step by step and monitor their effect before deciding to scale your cluster further. This approach ensures optimal and cost-efficient usage of your cloud resources without paying for idle capacity.

Slow resource depletion from memory leaks

A common scenario for memory leak or slow resource depletion in Amazon MWAA is when DAGs and tasks begin to fail or slow down over time. Scaling workers or increasing environment size does not resolve the underlying issue. This happens because the root cause is not a lack of capacity but rather an application-level leak that causes persistent exhaustion.

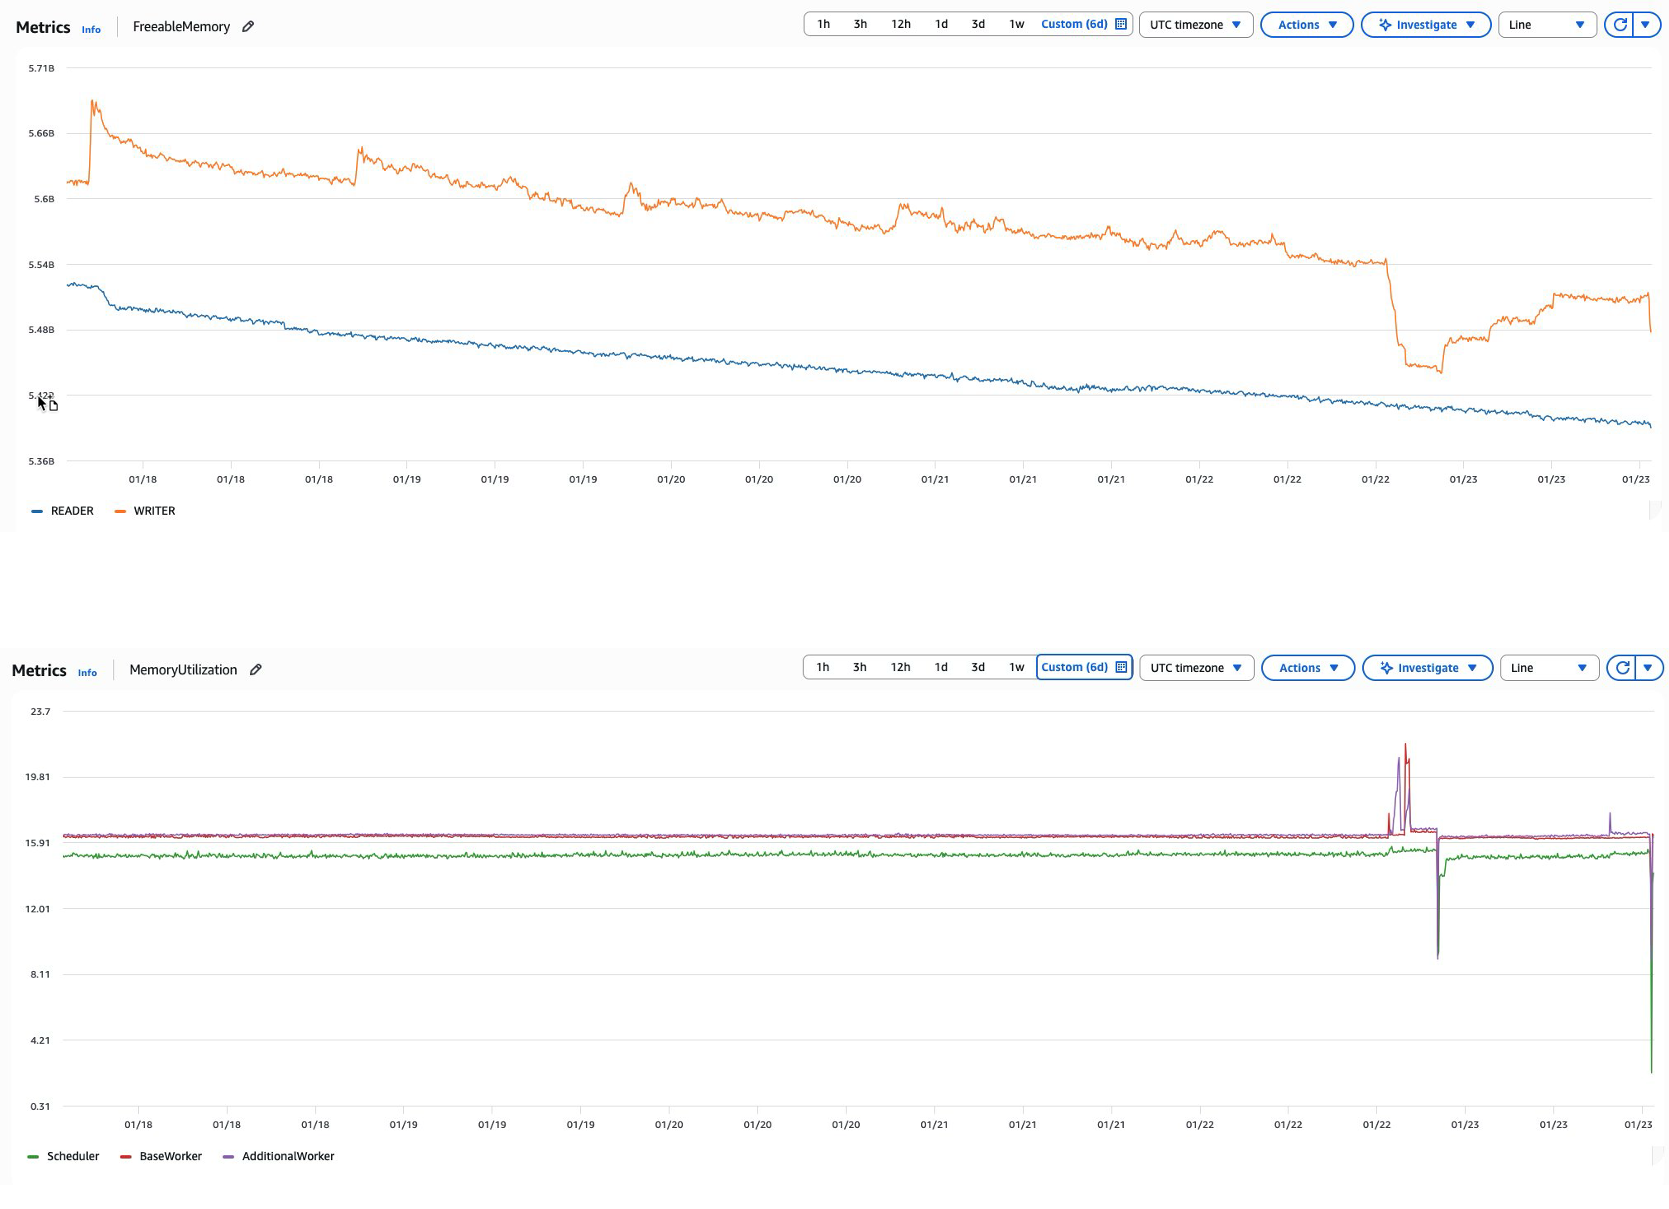
For example, as Airflow continuously runs tasks and parses DAGs over time, memory consumption can steadily increase across the environment. This might manifest as an Amazon MWAA metadata database experiencing declining FreeableMemory metrics despite consistent or even reduced workloads. When this occurs, database query performance gradually declines as memory resources become constrained for scheduler/worker & metadata database, ultimately affecting overall environment responsiveness since Airflow depends heavily on its metadata database for critical operations. This scenario is similar to how an application might create database connections without properly closing them, leading to resource exhaustion over time.

Graph: Declining FreeableMemory and MemoryUtilization

Common causes:

  1. Connection pool exhaustion: DAGs that fail to properly close database connections can lead to connection pool exhaustion and memory leaks in the database.
  2. Resource-intensive operations: Complex, long-running queries or XCOM operations against the metadata database can consume excessive memory.
  3. Inefficient DAG design: DAGs with numerous top-level Python calls can trigger database queries during DAG parsing. For instance, using variable.get() calls at the DAG level rather than at the task level creates unnecessary database load.

Recommended solutions:

  1. Implement Amazon CloudWatch monitoring: Establish Amazon CloudWatch alarms for FreeableMemory with appropriate thresholds to detect issues early.
  2. Regular database maintenance: Perform scheduled database clean-up operations to purge historical data that is no longer needed.
  3. Optimize DAG code: Refactor DAGs to move database operations like variable.get() from the DAG level to the task level to reduce parsing overhead.
  4. Connection management: Make sure all database connections are properly closed after use to prevent connection pool exhaustion.

By following the preceding recommendations you can maintain healthy memory utilization for the metadata database and maintain optimal performance of your Amazon MWAA environment without needing to scale workers.

Conclusion

The decision to add workers in Amazon MWAA environments requires careful consideration of multiple factors beyond simple task queue metrics. In this post, we showed that while adding workers can address certain performance challenges, it’s often not the optimal first response to system bottlenecks.

Key considerations before scaling workers include:

  1. Root cause analysis
    • Verify whether high CPU/memory usage stems from task optimization issues.
    • Examine if queuing problems result from configuration constraints rather than resource limitations.
    • Investigate potential memory leaks or resource depletion patterns.
  2. Configuration optimization
    • Review and adjust Airflow parameters (concurrency settings, pools, timeouts).
    • Understand the interaction between different configuration layers.
    • Optimize DAG design and scheduling patterns.

The most successful Amazon MWAA implementations follow a systematic approach: first optimizing existing resources and configurations, then scaling workers only when justified by data-driven capacity planning. This approach ensures cost-effective operations while maintaining reliable workflow performance.

Remember that worker scaling is only one tool in the Amazon MWAA optimization toolkit. Long-term success depends on building a comprehensive performance management strategy that combines proper monitoring, proactive capacity planning, and continuous optimization of your Airflow workflows.

In the next post, we discuss capacity planning and the steps you need to perform before adding additional DAGs in your environment so that you can plan for the additional load and make sure you have enough headroom.

To get started, visit the Amazon MWAA product page and the Performance tuning for Apache Airflow on Amazon MWAA page.

If you have questions or want to share your MWAA scaling experiences, leave a comment below.

About the authors

Boyko Radulov

Boyko Radulov

Boyko is a Senior Cloud Support Engineer at Amazon Web Services (AWS), Amazon MWAA and AWS Glue Subject Matter Expert. He works closely with customers to build and optimize their workloads on AWS while reducing the overall cost. Beyond work, he is passionate about sports and travelling.

Kamen Sharlandjiev

Kamen Sharlandjiev

Kamen is a Principal Big Data and ETL Solutions Architect, Amazon MWAA and AWS Glue ETL expert. He’s on a mission to make life easier for customers who are facing complex data integration and orchestration challenges. His secret weapon? Fully managed AWS services that can get the job done with minimal effort. Follow Kamen on LinkedIn to keep up to date with the latest Amazon MWAA and AWS Glue features and news.

Venu Thangalapally

Venu Thangalapally

Venu is a Senior Solutions Architect at AWS, based in Chicago, with deep expertise in cloud architecture, data and analytics, containers, and application modernization. He partners with financial service industry customers to translate business goals into secure, scalable, and compliant cloud solutions that deliver measurable value. Venu is passionate about using technology to drive innovation and operational excellence.

Harshawardhan Kulkarni

Harshawardhan Kulkarni

Harshawardhan is a Partner Technical Account Manager at AWS, Amazon MWAA Subject Matter Expert. Based in Dublin Ireland, he partners with Enterprise Customers across EMEA to help navigate complex workflows and orchestration challenges while ensuring best practice implementation. Outside of work, he enjoys traveling and spending time with his family.

Andrew McKenzie

Andrew McKenzie

Andrew is a Data Engineer and Educator who uses deep technical expertise from his time at AWS. As a former Amazon MWAA Subject Matter Expert, he now focuses on building data solutions and teaching data engineering best practices.

Build incremental data pipelines to load transactional data changes using AWS DMS, Delta 2.0, and Amazon EMR Serverless

Post Syndicated from Sankar Sundaram original https://aws.amazon.com/blogs/big-data/build-incremental-data-pipelines-to-load-transactional-data-changes-using-aws-dms-delta-2-0-and-amazon-emr-serverless/

Building data lakes from continuously changing transactional data of databases and keeping data lakes up to date is a complex task and can be an operational challenge. A solution to this problem is to use AWS Database Migration Service (AWS DMS) for migrating historical and real-time transactional data into the data lake. You can then apply transformations and store data in Delta format for managing inserts, updates, and deletes.

Amazon EMR Serverless is a serverless option in Amazon EMR that makes it easy for data analysts and engineers to run open-source big data analytics frameworks without configuring, managing, and scaling clusters or servers. EMR Serverless automatically provisions and scales the compute and memory resources required by your applications, and you only pay for the resources that the applications use. EMR Serverless also provides you with more flexibility on overriding default Spark configurations, customizing EMR Serverless images, and customizing Spark driver and executor sizes to better suit specific workloads.

This post demonstrates how to implement a solution that uses AWS DMS to stream ongoing replication or change data capture (CDC) from an Amazon Aurora PostgreSQL-Compatible Edition database into Amazon Simple Storage Service (Amazon S3). We then apply transformations using Spark jobs on an EMR Serverless application and write transformed output into open-source Delta tables in Amazon S3. The Delta tables created by the EMR Serverless application are exposed through the AWS Glue Data Catalog and can be queried through Amazon Athena. Although this post uses an Aurora PostgreSQL database hosted on AWS as the data source, the solution can be extended to ingest data from any of the AWS DMS supported databases hosted on your data centers.

Solution overview

The following diagram shows the overall architecture of the solution that we implement in this post.

Architecture diagram

The solution consists of the following steps for implementing a full and incremental (CDC) data ingestion from a relational database:

  • Data storage and data generation – We create an Aurora PostgreSQL database and generate fictional trip data by running a stored procedure. The data will have attributes like trip ID (primary key), timestamp, source location, and destination location. Incremental data is generated in the PostgreSQL table by running custom SQL scripts.
  • Data ingestion – Steps 1 and 2 use AWS DMS, which connects to the source database and moves full and incremental data (CDC) to Amazon S3 in Parquet format. Let’s refer to this S3 bucket as the raw layer.
  • Data transformation – Steps 3 and 4 represent an EMR Serverless Spark application (Amazon EMR 6.9 with Apache Spark version 3.3.0) created using Amazon EMR Studio. The script reads input data from the S3 raw bucket, and then invokes Delta Lake’s MERGE statements to merge the data with the target S3 bucket (curated layer). The script also creates and updates a manifest file on Amazon S3 every time the job is run to enable data access from Athena and Amazon Redshift Spectrum.
  • Data access – The EMR Serverless job has code snippets that create a Delta table in the AWS Glue Data Catalog in Step 5. Steps 6 and 7 describe using Athena and Redshift Spectrum to query data from the Delta tables using standard SQL through the AWS Glue Data Catalog.
  • Data pipeline – Step 8 describes the process for triggering the data pipeline in a periodic manner through Airflow operators using Amazon Managed Workflows for Apache Airflow (Amazon MWAA). Refer to Submitting EMR Serverless jobs from Airflow for additional details. In this post, AWS DMS has been configured to replicate data from Amazon Aurora PostgreSQL-Compatible Edition into an S3 bucket with hourly partitions. The Airflow DAG can be configured to call an EMR Serverless job to process the past X hours of data based on specific project requirements. Implementation of the Airflow setup is not explored within the scope of this post.

The architecture has the following major features:

  • Reliability – The end-to-end architecture is made resilient with the Multi-AZ feature of EMR Serverless and using Multi-AZ deployments for AWS DMS and Amazon Aurora PostgreSQL-Compatible Edition. When you submit jobs to an EMR Serverless application, those jobs are automatically distributed to different Availability Zones in the Region. A job is run in a single Availability Zone to avoid performance implications of network traffic across Availability Zones. In case an Availability Zone is impaired, a job submitted to your EMR Serverless application is automatically run in a different (healthy) Availability Zone. When using resources in a private VPC, EMR Serverless recommends that you specify the private VPC configuration for multiple Availability Zones so that EMR Serverless can automatically select a healthy Availability Zone.
  • Cost optimization – When you run Spark or Hive applications using EMR Serverless, you pay for the amount of vCPU, memory, and storage resources consumed by your applications, leading to optimal utilization of resources. There is no separate charge for Amazon Elastic Compute Cloud (Amazon EC2) instances or Amazon Elastic Block Store (Amazon EBS) volumes. For additional details on cost, refer to Amazon EMR Serverless cost estimator.
  • Performance efficiency – You can run analytics workloads at any scale with automatic on-demand scaling that resizes resources in seconds to meet changing data volumes and processing requirements. EMR Serverless includes the Amazon EMR performance-optimized runtime for Apache Spark and Hive. The Amazon EMR runtime for Spark is 100% API-compatible with OSS Spark and is over 3.5 times as fast as the standard open-source, so your jobs run faster and incur less compute costs. With fast and fine-grained scaling in EMR Serverless, if a pipeline runs daily and needs to process 1 GB of data one day and 100 GB of data another day, EMR Serverless automatically scales to handle that load.
  • Monitoring – EMR Serverless sends metrics to Amazon CloudWatch at the application and job level every 1 minute. You can set up a single-view dashboard in CloudWatch to visualize application-level and job-level metrics using an AWS CloudFormation template provided on the EMR Serverless CloudWatch Dashboard GitHub repository. Also, EMR Serverless can store application logs in a managed storage, Amazon S3, or both based on your configuration settings. After you submit a job to an EMR Serverless application, you can view the real-time Spark UI or the Hive Tez UI for the running job from the EMR Studio console or request a secure URL using the GetDashboardForJobRun API. For completed jobs, you can view the Spark History Server or the Persistent Hive Tez UI from the EMR Studio console.

The following steps are performed to implement this solution:

  1. Connect to the Aurora PostgreSQL instance and generate a sample dataset.
    • Set up a data pipeline for loading data from Amazon Aurora PostgreSQL-Compatible Edition into Delta Lake on Amazon S3 and query using Athena:
    • Start the AWS DMS task to perform full table load and capture ongoing replication to the S3 raw layer.
    • Run the EMR Serverless Spark application to load data into Delta Lake.
    • Query the Delta tables (native tables) through Athena.
  2. Run the data pipeline to capture incremental data changes into Delta Lake:
    • Generate an incremental (CDC) dataset and insert it into the Aurora PostgreSQL database.
    • Run the EMR Serverless Spark application to merge CDC data in the S3 curated layer (incremental load).
    • Query the Delta Lake tables through Athena to validate the merged data.

Prerequisites

We use a CloudFormation template to provision the AWS resources required for the solution. The CloudFormation template requires you to select an EC2 key pair. This key is configured on an EC2 instance that lives in the public subnet. We use this EC2 instance to connect to the Aurora PostgreSQL instance that lives in the private subnet. Make sure you have a key in the Region where you deploy the template. If you don’t have one, you can create a new key pair.

To walk through this post, we use Delta Lake version > 2.0.0, which is supported in Apache Spark 3.2.x. Choose the Delta Lake version compatible with your Spark version by visiting the Delta Lake releases page. We use an EMR Serverless application with version emr-6.9.0, which supports Spark version 3.3.0.

Deploy your resources

To provision the resources needed for the solution, complete the following steps:

  1. Choose Launch Stack:

  1. For Stack name, enter emr-serverless-deltalake-blog.
  2. For DatabaseUserName, enter the user name for logging in to Amazon Aurora PostgreSQL-Compatible Edition. Keep the default value if you don’t want to change it.
  3. For DatabasePassword, enter the password for logging in to Amazon Aurora PostgreSQL-Compatible Edition.
  4. For ClientIPCIDR, enter the IP address of your SQL client that will be used to connect to the EC2 instance. We use this EC2 instance to connect to the Aurora PostgreSQL database.
  5. For KeyName, enter the key pair to be used in your EC2 instance. This EC2 instance will be used as a proxy to connect from your SQL client to the Aurora PostgreSQL source database.
  6. For EC2ImageId, PrivateSubnet1CIDR, PrivateSubnet2CIDR, PublicSubnetCIDR, and VpcCIDR, keep the default values or choose appropriate values for the VPC and EC2 image for your specific environment.
  7. Choose Next.
  8. Choose Next again.
  9. On the review page, select I acknowledge that AWS CloudFormation might create IAM resources with custom names.
  10. Choose Create stack.

After the CloudFormation template is complete and the resources are created, the Outputs tab shows the information shown in the following screenshot.

The CloudFormation template creates all the resources needed for the solution workflow:

  • S3 raw and curated buckets
  • Aurora PostgreSQL database
  • AWS DMS migration task, replication instance, and other resources
  • EC2 instance for running data ingestion scripts
  • AWS Identity and Access Management (IAM) roles and policies needed to perform the necessary activities as part of this solution
  • VPC, subnets, security groups, and relevant network components
  • AWS Lambda functions that perform setup activities required for this workflow
  • Additional components needed for running the EMR Serverless workflow

You can find the PySpark script in the raw S3 bucket on the Amazon S3 console as shown in the following screenshot. The bucket will have the naming structure <CloudFormation template name>-rawS3bucket-<random string>. Make a note of the S3 path to the emr_delta_cdc.py script; you need this information while submitting the Spark job via the EMR Serverless application.

The preceding task for creating the resources via CloudFormation assumes that AWS Lake Formation is not enabled in the Region (which we enable later in this post). If you already have Lake Formation enabled in the Region, make sure the IAM user or role used in the CloudFormation template has the necessary permissions to create a database in the AWS Glue Data Catalog.

Connect to the Aurora PostgreSQL instance and generate a sample dataset

Connect to the Aurora PostgreSQL endpoint using your preferred client. For this post, we use the PSQL command line tool. Note that the IP address of the client machine from which you’re connecting to the database must be updated in the Aurora PostgreSQL security group. This is done by the CloudFormation template based on the input parameter value for ClientIPCIDR. If you’re accessing the database from another machine, update the security group accordingly.

  1. Connect to your EC2 instance from the command line using the public DNS of the EC2 instance from the CloudFormation template output.
  2. Log in to the EC2 instance and connect to the Aurora PostgreSQL instance using the following commands (the Aurora PostgreSQL endpoint is available on the Outputs tab of the CloudFormation stack):
    psql -h << Aurora PostgreSQL endpoint >> -p 5432 -U <<username>> -d emrdelta_source_db

  1. Run the following commands to create a schema and table for the fictional trip dataset:
    create schema delta_emr_source;
    
    create table delta_emr_source.travel_details (trip_id int PRIMARY KEY,tstamp timestamp, route_id varchar(2),destination varchar(50),source_location varchar(50));

  1. Create the following stored procedure to generate the records for the trip dataset and insert the records into the table.
    create or replace procedure delta_emr_source.insert_records(records int)
    language plpgsql
    as $$
    declare
    max_trip_id integer;
    begin
    --get max trip_id
    select coalesce(max(trip_id),1) into max_trip_id from delta_emr_source.travel_details;
    
    --insert records
    for i in max_trip_id+1..max_trip_id+records loop
    INSERT INTO delta_emr_source.travel_details (trip_id, tstamp, route_id,destination,source_location) values (i, current_timestamp, chr(65 + (i % 10)),(array['Seattle', 'New York', 'New Jersey', 'Los Angeles', 'Las Vegas',
    'Tucson', 'Washington DC', 'Philadelphia', 'Miami', 'San Francisco'])[(floor(random() * 10))+1],(array['Seattle', 'New York', 'New Jersey', 'Los Angeles', 'Las Vegas',
    'Tucson', 'Washington DC', 'Philadelphia', 'Miami', 'San Francisco'])[(floor(random() * 10))+1]);
    end loop;
    
    commit;
    
    raise notice 'Inserted record count - %', records;
    end; $$;

  2. Call the preceding stored procedure to insert 20,000 records into the Aurora PostgreSQL database:
    call delta_emr_source.insert_records(20000);

  3. After the stored procedure is complete, verify that the records have been inserted successfully:
    select count(*) from delta_emr_source.travel_details;
    

Set up a data pipeline for loading data into Delta tables on Amazon S3 and query using Athena

In this section, we walk through the steps to set up a data pipeline that loads data from Amazon Aurora PostgreSQL-Compatible Edition into Delta tables on Amazon S3 and then query the data using Athena.

Start the AWS DMS task to perform full table load to the S3 raw layer

To perform the full table load, complete the following steps:

  1. On the AWS DMS console, choose Database migration tasks in the navigation pane.
  2. Select the task that was created by the CloudFormation template (emrdelta-postgres-s3-migration).
  3. On the Actions menu, choose Restart/Resume.

The task starts the full load and ongoing replication of data from the source database to Amazon S3.

  1. Wait for the job to complete.

You can validate that the data has been migrated successfully checking the Load state column for the AWS DMS task.

  1. Navigate to the S3 bucket created from the CloudFormation template to store raw data from AWS DMS.The bucket will have the naming structure <CloudFormation template name>-rawS3bucket-<random string>.
  2. Navigate to the folder delta_emr_source/travel_details in the raw S3 bucket. You can verify the S3 folder has Parquet data populated from the AWS DMS task.

Run the EMR Serverless Spark application to load data into Delta tables

We use EMR Studio to manage and submit jobs in an EMR Serverless application.

  1. Launch EMR Studio and create an EMR Serverless application.
  2. For Name, enter emr-delta-blog.
  3. For Type, choose Spark.
  4. For Release version, choose your release version.
  5. For Architecture, select x86_64.
  6. For Application setup options, select Choose default settings.

  1. Choose Create application and verify that the EMR application has been created successfully on the Amazon EMR console.

  1. Choose emr_delta_blog and then choose Start application. You can verify that the EMR application has started successfully on the Amazon EMR console, as shown in the following screenshot.


The application will move to Stopped status after a period of inactivity. When you submit the job to the application, it will start again and start the job. This provides cost savings because the jobs are run on demand as opposed to maintaining a running EMR cluster.

  1. While the application is in Started status, choose Submit job to submit the job to the application.

Create a new job in the Job details page

  1. For Name, enter emr-delta-load-job.
  2. For Runtime role, choose emrserverless-execution-role.
  3. For S3 URI, enter the S3 (raw bucket) path where the script emr_delta_cdc.py is uploaded.
  4. For Script arguments, enter ["I","delta_emr_source","9999-12-31-01","travel_details","route_id"].

The script arguments provide the following details to the EMR Serverless application:

  • I – The first argument represents the data load type. The allowed values are I for full load and U for incremental data load.
  • delta_emr_source – The second argument represents the source database schema from which data is being migrated through the AWS DMS task.
  • 9999-12-31-01 – The third argument represents the partition from which data needs to be loaded in an incremental fashion. This argument is used only during CDC data load; for full load, we have provided a default value (9999-12-31-01).
  • travel_details – The fourth argument represents the source database table from which data is being migrated through the AWS DMS task. Use a semicolon as a delimiter when entering multiple tables.
  • route_id – The fifth argument represents the partition keys on which the table data should be partitioned when stored in the S3 curated bucket. Use a semicolon as a delimiter when entering comma-separated partition keys for multiple tables.

With arguments, you can group a set of tables and submit the job to an EMR Serverless application. You can provide multiple table names separated by semicolons and enter the partition keys for those tables also separated by semicolon. If a particular table doesn’t have a partition key, simply enter a semicolon alone. The number of semicolon-separated values should match the table and partition key arguments for the script to run successfully.

Also, if you want to capture additional tables as part of an existing EMR Serverless job, you need to create a new EMR Serverless job to capture full load separately (set the first argument as I along with the new table names) and then change the argument list of the existing EMR Serverless job to add those new tables to capture incremental data load going forward.

EMR Serverless version 6.9.0 comes pre-installed with Delta version 2.1.0. Refer to About Amazon EMR Releases for more details about pre-installed libraries and applications for a specific Amazon EMR release. Before this, we have to upload the Delta JAR files to an S3 bucket in your account and provide the JAR file path in the application configurations using the spark.jars option. In this walkthrough, we create an EMR Serverless 6.9.0 application and use the pre-installed Delta jars from Amazon EMR.

  1. Under Spark properties, choose Edit in text and enter the following configurations:
--conf spark.jars=/usr/share/aws/delta/lib/delta-core.jar,/usr/share/aws/delta/lib/delta-storage.jar --conf spark.sql.extensions=io.delta.sql.DeltaSparkSessionExtension --conf spark.sql.catalog.spark_catalog=org.apache.spark.sql.delta.catalog.DeltaCatalog --conf spark.submit.pyFiles=/usr/share/aws/delta/lib/delta-core.jar --conf spark.hadoop.hive.metastore.client.factory.class=com.amazonaws.glue.catalog.metastore.AWSGlueDataCatalogHiveClientFactory

If you want to use a different version of Delta JAR files, you can replace the S3 path of the JAR files in these configuration options.

  1. Leave the rest of the configurations at their default and choose Submit job.
  2. Wait for the job to complete successfully. You can verify this on the EMR Serverless console.

  1. Additionally, go to the S3 location (the curated bucket created by AWS CloudFormation) and verify that the Delta files are created along with the manifest file.

  1. Select a job run and then choose Spark History Server (Completed jobs) on the View Application UIs menu.


You can now use the Spark History Server UI to navigate to various tabs and analyze the job run in a detailed manner. For Spark error and output logs, you can navigate to the Executors tab and explore the driver or executor logs as required. This can help you to debug the job in case of failures by looking at the Spark logs.You can also choose Spark UI (Running jobs) to track the progress of the EMR Serverless Spark jobs while they are running.

The data load script is the same for initial and incremental data load because it can handle both the workflows through script arguments:

from pyspark.sql import SparkSession
from datetime import datetime
from pyspark.sql.functions import *
from pyspark.sql.window import Window
import boto3
import sys
from delta import *

# S3 bucket location, auto-populated for this post. Replace for other jobs
raw_bucket="<<raw_bucket_name>>"
curated_bucket= "<<curated_bucket_name>>"

spark = (
SparkSession.builder.appName("SparkSQL")
.config("spark.sql.extensions", "io.delta.sql.DeltaSparkSessionExtension")
.config("spark.sql.catalog.spark_catalog", "org.apache.spark.sql.delta.catalog.DeltaCatalog")
.enableHiveSupport()
.getOrCreate()
)

#Check for argument list and if it doesn't match the expected argument count, exit the program
if len(sys.argv) != 6:
print("This script requires 5 arguments for successful execution - Load_type,database_schema,CDC_path,source_table,Partition_keys")
print(sys.argv)
sys.exit(0)

s3 = boto3.client('s3')

# Split table names into a list if there are more than one table seperated by semicolon
tables = sys.argv[4].split(";")

schema = sys.argv[2]
load_type = sys.argv[1]
cdc_partition = sys.argv[3]
deltaHivePath = "s3://" + curated_bucket + "/" + schema + "/"
columns_to_drop = ["Op","schema_name", "table_name", "update_ts_dms", "tstamp"]
db_name = "emrserverless_delta"

# Split table partition keys into a list if there are more than one table separated by semicolon
partition_keys = sys.argv[5].split(";")
# Exit if length of table names and partition keys are different to ensure data is provided for all tables.
if len(tables)!=len(partition_keys):
print("Please enter partition keys for all tables. if partition key is not present enter empty semicolon - T1_PK;;T3PK")
sys.exit(0)


i = 0
while i < len(tables):
table = tables[i]
partition_key = partition_keys[i].split(",")
print(partition_key)
if load_type == 'I':
print("Moving to Full-load logic for the table", table)

# Read the data from the raw bucket
source_df1 = spark.read.format("parquet").load(
"s3://" + raw_bucket + "/" + schema + "/" + table + "/")

# There is no target table in Delta format. Loading for the first time
# The following code segment populates Delta table in S3 and also
# updated the Glue catalog for querying with Athena.
additional_options = {"path": deltaHivePath + table + "/"}
if columns_to_drop is not None and columns_to_drop != '':
source_df1 = source_df1.drop(*columns_to_drop)

#Check for presence of partition key and before writing data to Curated bucket
if partition_key[0]:
source_df1.write.mode("append")\
.format("delta")\
.partitionBy(*partition_key)\
.options(**additional_options)\
.saveAsTable(db_name + ".spark_" + table)
else:
source_df1.write.mode("append")\
.format("delta")\
.options(**additional_options)\
.saveAsTable(db_name + ".spark_" + table)

# Generate symlink for Amazon Redshift Spectrum to read data
deltaTable = DeltaTable.forPath(spark, deltaHivePath + table + "/")
deltaTable.generate("symlink_format_manifest")

else:
print("Moving to upsert logic, Reading data from partition - ",cdc_partition)
# The below logic will verify if the CDC path has data before proceeding with
# incremental load. if CDC path is not available for a specific table the load
# process is skipped to avoid spark read error.
resp = s3.list_objects_v2(
Bucket=raw_bucket,
Prefix=schema +"/" +table +"/" +cdc_partition,
Delimiter='/',
MaxKeys=1)
if 'CommonPrefixes' in resp:
update_df = spark.read.format("parquet").load(
"s3://" + raw_bucket + "/" + schema + "/" + table + "/" + cdc_partition + "/")

# Get recent record for each primary key to update the recent transaction to the Delta table
# This step is needed to de-dup transactions like inserts and deletes within the same batch
sort_order = Window.partitionBy(
col('trip_id')).orderBy(
col('update_ts_dms').desc())
update_df = update_df.withColumn("rec_val", row_number().over(
sort_order)).filter("rec_val=1").drop("rec_val")

# upsert script using Merge operation. The below script updates/inserts data
# on all columns. In case you need to insert/update specific columns
# use whenNotMatchedInsert/whenMatchedUpdate functions and parameterize the input for each table
deltaTable = DeltaTable.forPath(spark, deltaHivePath + table + "/")
deltaTable.alias('trg') \
.merge(update_df.alias('src'),'trg.trip_id = src.trip_id')\
.whenNotMatchedInsertAll(condition="src.Op = 'I'") \
.whenMatchedUpdateAll(condition="src.Op='U'") \
.whenMatchedDelete(condition="src.Op = 'D'") \
.execute()

# Generate symlink for Amazon Redshift Spectrum to read data
deltaTable.generate("symlink_format_manifest")
else:
print("The path is empty for table -", table)
i = i + 1
print("The Job has completed execution...")

Monitor EMR Serverless application using CloudWatch dashboards

We can optionally monitor the EMR Serverless application using CloudWatch dashboards by installing the CloudFormation template from the EMR Serverless CloudWatch Dashboard GitHub repository.Follow the instructions on the Getting started section on the GitHub repository and deploy the CloudFormation template in your account.

You need to provide the EMR Serverless application ID as a parameter while deploying the CloudFormation stack, which can be obtained on the EMR Studio Applications page as shown in the following screenshot.

After the CloudFormation template is successfully deployed, navigate to the CloudWatch console to see a custom dashboard created for the EMR Serverless application ID that was provided to the CloudFormation template.

Choose the dashboard to see the different metrics for the EMR Serverless application in a single dashboard view.

You can see the available workers (one driver and two executors that were pre-initialized in the default configuration) and also the spike under successful job count that indicates the initial data load job that was completed successfully.

You could also monitor the CPU, memory, and storage allocated for the application, driver, and executor nodes separately.

The following image shows application metrics for three workers with 12 vCPUs (both driver and executor initialized with 4 vCPUs) and also the memory and storage usage. You can monitor the metrics from this dashboard and pre-initialize your application capacity that suits your specific workloads.

We can see the number of executors that were utilized for this job execution from the executor metrics section within the CloudWatch dashboard. We have used two executors and a driver for running this job.

Query the Delta tables through Athena

Previously, Delta tables were accessed through Athena by generating the manifest files (which maintain the list of data files to read for querying a Delta table). With the newly launched support in Athena for reading native Delta tables, it’s no longer required to generate and update manifest files. The Athena SQL engine version 3 can directly query native Delta tables. If you’re using an older engine version, change the engine version.

Navigate to the Athena console and start querying the data. Run a SELECT query and fetch the first 10 records to verify the data:

SELECT * FROM "AwsDataCatalog"."emrserverless_delta"."spark_travel_details" limit 10;

The table (native Delta table) has been created and updated to the AWS Glue Data Catalog from the EMR Serverless application code. You can successfully query and explore the data through Athena or Spark applications, but the schema definitions for individual columns aren’t updated in Data Catalog with this approach.

The following screenshot shows the Delta table created through code has a single array column. Athena supports reading native Delta tables and therefore we can read the data successfully even though the Data Catalog shows only a single array column.

If you need the individual column-level metadata to be available in the Data Catalog, run an AWS Glue crawler periodically to keep the AWS Glue metadata updated. For more information, refer to Introducing native Delta Lake table support with AWS Glue crawlers.

Run the data pipeline to load incremental data changes into the Delta tables

In this section, we walk through the steps to run the data pipeline.

Generate an incremental (CDC) dataset and insert it into the Aurora PostgreSQL database

  1. Log in to the EC2 instance via SSH and using the PSQL CLI, run the following SQL commands to generate CDC data on the source database:

update delta_emr_source.travel_details set destination='Tucson' where destination='Miami';
call delta_emr_source.insert_records(200);
delete from delta_emr_source.travel_details where destination='Los Angeles';

  1. Navigate to the AWS DMS console and verify whether the incremental records are populated to the S3 raw bucket by the replication task.

You can also verify in the S3 raw bucket location that the files are created under hourly partitioned folders.

Run the EMR Serverless Spark application to merge CDC data in the S3 curated layer (incremental load)

After the AWS DMS task has successfully loaded the incremental data, submit the Spark job on the EMR Serverless application to load the incremental data (CDC) with the following script arguments:

["U", "delta_emr_source", "2022-10-25-21", "travel_details","route_id"]

The partition path given here as 2022-10-25-21 should be changed as applicable in your use case. We use an example use case where the EMR Serverless job runs every hour, and the input data folder is partitioned on an hourly basis from AWS DMS. You can choose an appropriate partitioning strategy on the S3 raw bucket for your use case.

  1. Under Spark properties, choose Edit in text and enter the following configurations:
--conf spark.jars=/usr/share/aws/delta/lib/delta-core.jar,/usr/share/aws/delta/lib/delta-storage.jar --conf spark.sql.extensions=io.delta.sql.DeltaSparkSessionExtension --conf spark.sql.catalog.spark_catalog=org.apache.spark.sql.delta.catalog.DeltaCatalog --conf spark.submit.pyFiles=/usr/share/aws/delta/lib/delta-core.jar --conf spark.hadoop.hive.metastore.client.factory.class=com.amazonaws.glue.catalog.metastore.AWSGlueDataCatalogHiveClientFactory

  1. When the job is successful, verify in Amazon S3 that more files are created in the _delta_log folder, capturing the changes from the current run.

Query the Delta tables through Athena to validate the merged data

Go to the Athena console to query the data and validate count to ensure that the table contains the most recent data:

SELECT destination, count(*) FROM "AwsDataCatalog"."emrserverless_delta"."spark_travel_details" group by destination;

If you also want to query this data from Amazon Redshift, you can create external tables in Redshift Spectrum for Delta tables. For more information, refer to Creating external tables for data managed in Delta Lake. Redshift Spectrum currently supports querying Delta tables through the manifest file option. A Delta table manifest contains a list of files that make up a consistent snapshot of the Delta table. The code snippet given in this post updates the manifest files every time new data is loaded in the Delta tables to ensure only the latest data is read from the Delta tables.

Clean up

To avoid incurring ongoing charges, clean up your infrastructure by deleting the stack from the AWS CloudFormation console. Delete the EMR Serverless application and any other resources you created during this exercise.

Conclusion

In this post, we demonstrated how to create a transactional data lake with Delta table format using EMR Serverless and AWS DMS. With the flexibility provided by EMR Serverless, you can use the latest version of open-source Delta framework on EMR Serverless (with the latest version of Spark) in order to support a wider range of transactional data lake needs based on various use cases.

Now you can build a transactional data lake for your organization with Delta table format and access data using Athena and Redshift Spectrum for various analytical workloads. You could use this high-level architecture for any other use cases where you need to use the latest version of Spark on EMR Serverless.


About the Authors

Sankar Sundaram is a Data Lab Architect at AWS, where he helps customers build and modernize data architectures and help them build secure, scalable, and performant data lake, database, and data warehouse solutions.

Monjumi Sarma is a Data Lab Solutions Architect at AWS. She helps customers architect data analytics solutions, which gives them an accelerated path towards modernization initiatives.
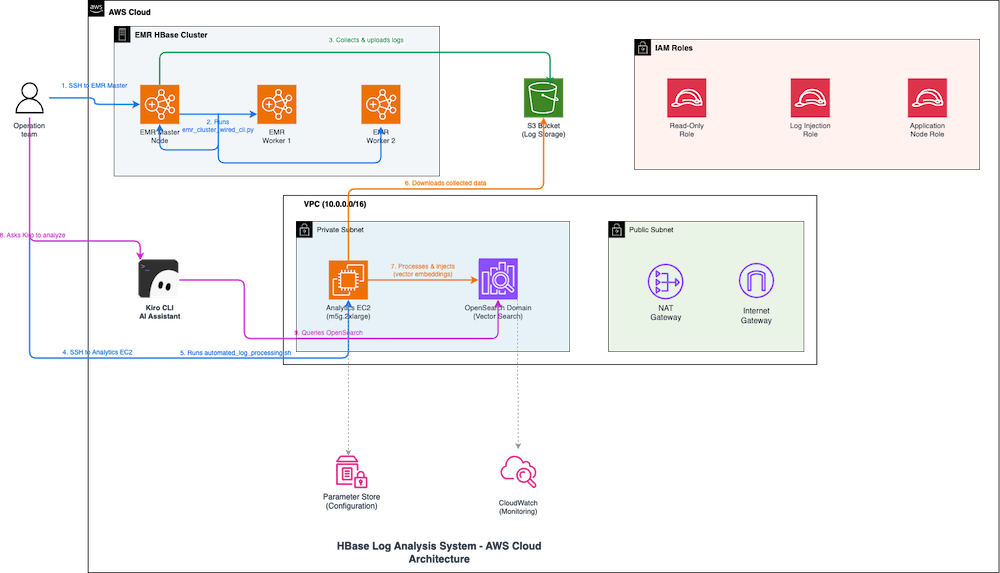
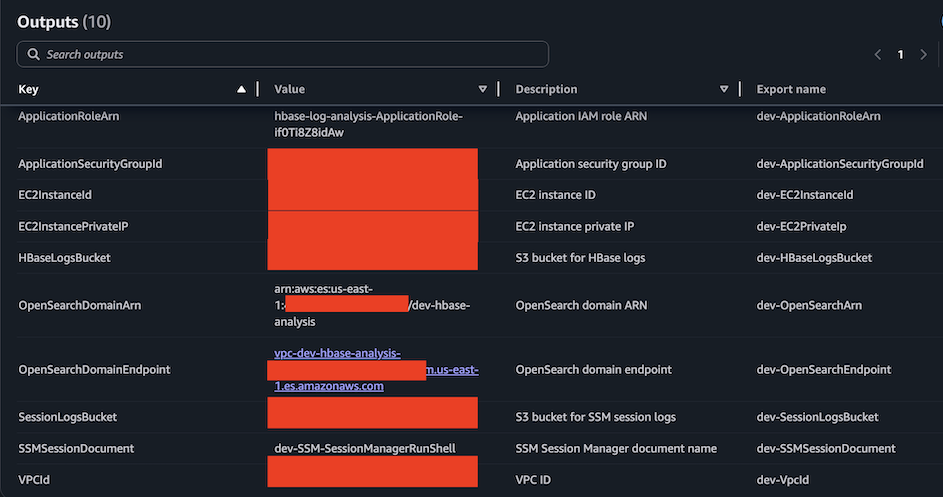
A new Spark plugin for CPU and memory profiling

Post Syndicated from Bo Xiong original https://aws.amazon.com/blogs/devops/a-new-spark-plugin-for-cpu-and-memory-profiling/

Introduction

Have you ever wondered if there are low-hanging optimization opportunities to improve the performance of a Spark app? Profiling can help you gain visibility regarding the runtime characteristics of the Spark app to identify its bottlenecks and inefficiencies. We’re excited to announce the release of a new Spark plugin that enables profiling for JVM based Spark apps via Amazon CodeGuru. The plugin is open sourced on GitHub and published to Maven.

Walkthrough

This post shows how you can onboard this plugin with two steps in under 10 minutes.

  • Step 1: Create a profiling group in Amazon CodeGuru Profiler and grant permission to your Amazon EMR on EC2 role, so that profiler agents can emit metrics to CodeGuru. Detailed instructions can be found here.
  • Step 2: Reference codeguru-profiler-for-spark when submitting your Spark job, along with PROFILING_CONTEXT and ENABLE_AMAZON_PROFILER defined.

Prerequisites

Your app is built against Spark 3 and run on Amazon EMR release 6.x or newer. It doesn’t matter if you’re using Amazon EMR on Amazon Elastic Compute Cloud (Amazon EC2) or on Amazon Elastic Kubernetes Service (Amazon EKS).

Illustrative Example

For the purposes of illustration, consider the following example where profiling results are collected by the plugin and emitted to the “CodeGuru-Spark-Demo” profiling group.

spark-submit \
--master yarn \
--deploy-mode cluster \
--class \
--packages software.amazon.profiler:codeguru-profiler-for-spark:1.0 \
--conf spark.plugins=software.amazon.profiler.AmazonProfilerPlugin \
--conf spark.executorEnv.PROFILING_CONTEXT="{\\\"profilingGroupName\\\":\\\"CodeGuru-Spark-Demo\\\"}" \
--conf spark.executorEnv.ENABLE_AMAZON_PROFILER=true \
--conf spark.dynamicAllocation.enabled=false \t

An alternative way to specify PROFILING_CONTEXT and ENABLE_AMAZON_PROFILER is under the yarn-env.export classification for instance groups in the Amazon EMR web console. Note that PROFILING_CONTEXT, if configured in the web console, must escape all of the commas on top of what’s for the above spark-submit command.

[
  {
    "classification": "yarn-env",
    "properties": {},
    "configurations": [
      {
        "classification": "export",
        "properties": {
          "ENABLE_AMAZON_PROFILER": "true",
          "PROFILING_CONTEXT": "{\\\"profilingGroupName\\\":\\\"CodeGuru-Spark-Demo\\\"\\,\\\"driverEnabled\\\":\\\"true\\\"}"
        },
        "configurations": []
      }
    ]
  }
]

Once the job above is launched on Amazon EMR, profiling results should show up in your CodeGuru web console in about 10 minutes, similar to the following screenshot. Internally, it has helped us identify issues, such as thread contentions (revealed by the BLOCKED state in the latency flame graph), and unnecessarily create AWS Java clients (revealed by the CPU Hotspots view).

Go to your profiling group under the Amazon CodeGuru web console. Click the “Visualize CPU” button to render a flame graph displaying CPU usage. Switch to the latency view to identify latency bottlenecks, and switch to the heap summary view to identify objects consuming most memory.

Troubleshooting

To help with troubleshooting, use a sample Spark app provided in the plugin to check if everything is set up correctly. Note that the profilingGroupName value specified in PROFILING_CONTEXT should match what’s created in CodeGuru.

spark-submit \
--master yarn \
--deploy-mode cluster \
--class software.amazon.profiler.SampleSparkApp \
--packages software.amazon.profiler:codeguru-profiler-for-spark:1.0 \
--conf spark.plugins=software.amazon.profiler.AmazonProfilerPlugin \
--conf spark.executorEnv.PROFILING_CONTEXT="{\\\"profilingGroupName\\\":\\\"CodeGuru-Spark-Demo\\\"}" \
--conf spark.executorEnv.ENABLE_AMAZON_PROFILER=true \
--conf spark.yarn.appMasterEnv.PROFILING_CONTEXT="{\\\"profilingGroupName\\\":\\\"CodeGuru-Spark-Demo\\\",\\\"driverEnabled\\\":\\\"true\\\"}" \
--conf spark.yarn.appMasterEnv.ENABLE_AMAZON_PROFILER=true \
--conf spark.dynamicAllocation.enabled=false \
/usr/lib/hadoop-yarn/hadoop-yarn-server-tests.jar

Running the command above from the master node of your EMR cluster should produce logs similar to the following:

21/11/21 21:27:21 INFO Profiler: Starting the profiler : ProfilerParameters{profilingGroupName='CodeGuru-Spark-Demo', threadSupport=BasicThreadSupport (default), excludedThreads=[Signal Dispatcher, Attach Listener], shouldProfile=true, integrationMode='', memoryUsageLimit=104857600, heapSummaryEnabled=true, stackDepthLimit=1000, samplingInterval=PT1S, reportingInterval=PT5M, addProfilerOverheadAsSamples=true, minimumTimeForReporting=PT1M, dontReportIfSampledLessThanTimes=1}
21/11/21 21:27:21 INFO ProfilingCommandExecutor: Profiling scheduled, sampling rate is PT1S
...
21/11/21 21:27:23 INFO ProfilingCommand: New agent configuration received : AgentConfiguration(AgentParameters={MaxStackDepth=1000, MinimumTimeForReportingInMilliseconds=60000, SamplingIntervalInMilliseconds=1000, MemoryUsageLimitPercent=10, ReportingIntervalInMilliseconds=300000}, PeriodInSeconds=300, ShouldProfile=true)
21/11/21 21:32:23 INFO ProfilingCommand: Attempting to report profile data: start=2021-11-21T21:27:23.227Z end=2021-11-21T21:32:22.765Z force=false memoryRefresh=false numberOfTimesSampled=300
21/11/21 21:32:23 INFO javaClass: [HeapSummary] Processed 20 events.
21/11/21 21:32:24 INFO ProfilingCommand: Successfully reported profile

Note that the CodeGuru Profiler agent uses a reporting interval of five minutes. Therefore, any executor process shorter than five minutes won’t be reflected by the profiling result. If the right profiling group is not specified, or it’s associated with a wrong EC2 role in CodeGuru, then the log will show a message similar to “CodeGuruProfilerSDKClient: Exception while calling agent orchestration” along with a stack trace including a 403 status code. To rule out any network issues (e.g., your EMR job running in a VPC without an outbound gateway or a misconfigured outbound security group), then you can remote into an EMR host and ping the CodeGuru endpoint in your Region (e.g., ping codeguru-profiler.us-east-1.amazonaws.com).

Cleaning up

To avoid incurring future charges, you can delete the profiling group configured in CodeGuru and/or set the ENABLE_AMAZON_PROFILER environment variable to false.

Conclusion

In this post, we describe how to onboard this plugin with two steps. Consider to give it a try for your Spark app? You can find the Maven artifacts here. If you have feature requests, bug reports, feedback of any kind, or would like to contribute, please head over to the GitHub repository.

Author:

Bo Xiong

Bo Xiong is a software engineer with Amazon Ads, leveraging big data technologies to process petabytes of data for billing and reporting. His main interests include performance tuning and optimization for Spark on Amazon EMR, and data mining for actionable business insights.