Tag Archives: Spark

Run fault tolerant and cost-optimized Spark clusters using Amazon EMR on EKS and Amazon EC2 Spot Instances

Post Syndicated from Kinnar Kumar Sen original https://aws.amazon.com/blogs/big-data/run-fault-tolerant-and-cost-optimized-spark-clusters-using-amazon-emr-on-eks-and-amazon-ec2-spot-instances/

Amazon EMR on EKS is a deployment option in Amazon EMR that allows you to run Spark jobs on Amazon Elastic Kubernetes Service (Amazon EKS). Amazon Elastic Compute Cloud (Amazon EC2) Spot Instances save you up to 90% over On-Demand Instances, and is a great way to cost optimize the Spark workloads running on Amazon EMR on EKS. Because Spot is an interruptible service, if we can move or reuse the intermediate shuffle files, it improves the overall stability and SLA of the job. The latest versions of Amazon EMR on EKS have integrated Spark features to enable this capability.

In this post, we discuss these features—Node Decommissioning and Persistent Volume Claim (PVC) reuse—and their impact on increasing the fault tolerance of Spark jobs on Amazon EMR on EKS when cost optimizing using EC2 Spot Instances.

Amazon EMR on EKS and Spot

EC2 Spot Instances are spare EC2 capacity provided at a steep discount of up to 90% over On-Demand prices. Spot Instances are a great choice for stateless and flexible workloads. The caveat with this discount and spare capacity is that Amazon EC2 can interrupt an instance with a proactive or reactive (2-minute) warning when it needs the capacity back. You can provision compute capacity in an EKS cluster using Spot Instances using a managed or self-managed node group and provide cost optimization for your workloads.

Amazon EMR on EKS uses Amazon EKS to run jobs with the EMR runtime for Apache Spark, which can be cost optimized by running the Spark executors on Spot. It provides up to 61% lower costs and up to 68% performance improvement for Spark workloads on Amazon EKS. The Spark application launches a driver and executors to run the computation. Spark is a semi-fault tolerant framework that is resilient to executor loss due to an interruption and therefore can run on EC2 Spot. On the other hand, when the driver is interrupted, the job fails. Hence, we recommend running drivers on on-demand instances. Some of the best practices for running Spark on Amazon EKS are applicable with Amazon EMR on EKS.

EC2 Spot instances also helps in cost optimization by improving the overall throughput of the job. This can be achieved by auto-scaling the cluster using Cluster Autoscaler (for managed nodegroups) or Karpenter.

Though Spark executors are resilient to Spot interruptions, the shuffle files and RDD data is lost when the executor gets killed. The lost shuffle files need to be recomputed, which increases the overall runtime of the job. Apache Spark has released two features (in versions 3.1 and 3.2) that addresses this issue. Amazon EMR on EKS released features such as node decommissioning (version 6.3) and PVC reuse (version 6.8) to simplify recovery and reuse shuffle files, which increases the overall resiliency of your application.

Node decommissioning

The node decommissioning feature works by preventing scheduling of new jobs on the nodes that are to be decommissioned. It also moves any shuffle files or cache present in those nodes to other executors (peers). If there are no other available executors, the shuffle files and cache are moved to a remote fallback storage.

Node Decommissioning

Fig 1 : Node Decommissioning

Let’s look at the decommission steps in more detail.

If one of the nodes that is running executors is interrupted, the executor starts the process of decommissioning and sends the message to the driver:

21/05/05 17:41:41 WARN KubernetesClusterSchedulerBackend$KubernetesDriverEndpoint: Received executor 7 decommissioned message
21/05/05 17:41:41 DEBUG TaskSetManager: Valid locality levels for TaskSet 2.0: NO_PREF, ANY
21/05/05 17:41:41 INFO KubernetesClusterSchedulerBackend: Decommission executors: 7
21/05/05 17:41:41 DEBUG TaskSchedulerImpl: parentName: , name: TaskSet_2.0, runningTasks: 10
21/05/05 17:41:41 INFO BlockManagerMasterEndpoint: Mark BlockManagers (BlockManagerId(7, 192.168.82.107, 39007, None)) as being decommissioning.
21/05/05 20:22:17 INFO CoarseGrainedExecutorBackend: Decommission executor 1.
21/05/05 20:22:17 INFO CoarseGrainedExecutorBackend: Will exit when finished decommissioning
21/05/05 20:22:17 INFO BlockManager: Starting block manager decommissioning process...
21/05/05 20:22:17 DEBUG FileSystem: Looking for FS supporting s3a

The executor looks for RDD or shuffle files and tries to replicate or migrate those files. It first tries to find a peer executor. If successful, it will move the files to the peer executor:

22/06/07 20:41:38 INFO ShuffleStatus: Updating map output for 46 to BlockManagerId(4, 192.168.13.235, 34737, None)
22/06/07 20:41:38 DEBUG BlockManagerMasterEndpoint: Received shuffle data block update for 0 46, ignore.
22/06/07 20:41:38 DEBUG BlockManagerMasterEndpoint: Received shuffle index block update for 0 46, updating.

However, if It is not able to find a peer executor, it will try to move the files to a fallback storage if available.

Fallback Storage

Fig 2: Fallback Storage

The executor is then decommissioned. When a new executor comes up, the shuffle files are reused:

22/06/07 20:42:50 INFO BasicExecutorFeatureStep: Adding decommission script to lifecycle
22/06/07 20:42:50 DEBUG ExecutorPodsAllocator: Requested executor with id 19 from Kubernetes.
22/06/07 20:42:50 DEBUG ExecutorPodsWatchSnapshotSource: Received executor pod update for pod named amazon-reviews-word-count-bfd0a5813fd1b80f-exec-19, action ADDED
22/06/07 20:42:50 DEBUG BlockManagerMasterEndpoint: Received shuffle index block update for 0 52, updating.
22/06/07 20:42:50 INFO ShuffleStatus: Recover 52 BlockManagerId(fallback, remote, 7337, None)

The key advantage of this process is that it enables migrates blocks and shuffle data, thereby reducing recomputation, which adds to the overall resiliency of the system and reduces runtime. This process can be triggered by a Spot interruption signal (Sigterm) and node draining. Node draining  may happen due to high-priority task scheduling or independently.

When you use Amazon EMR on EKS with managed node groups/Karpenter, the Spot interruption handling is automated, wherein Amazon EKS gracefully drains and rebalances the Spot nodes to minimize application disruption when a Spot node is at elevated risk of interruption. If you’re using managed node groups/Karpenter, the decommission gets triggered when the nodes are getting drained and because it’s proactive, it gives you more time (at least 2 minutes) to move the files. In the case of self-managed node groups, we recommend installing the AWS Node Termination Handler to handle the interruption, and the decommission is triggered when the reactive (2-minute) notification is received. We recommend to use Karpenter with Spot Instances as it has faster node scheduling with early pod binding and binpacking to optimize the resource utilization.

The following code enables this configuration; more details are available on GitHub:

"spark.decommission.enabled": "true"
"spark.storage.decommission.rddBlocks.enabled": "true"
"spark.storage.decommission.shuffleBlocks.enabled" : "true"
"spark.storage.decommission.enabled": "true"
"spark.storage.decommission.fallbackStorage.path": "s3://<<bucket>>"

PVC reuse

Apache Spark enabled dynamic PVC in version 3.1, which is useful with dynamic allocation because we don’t have to pre-create the claims or volumes for the executors and delete them after completion. PVC enables true decoupling of data and processing when we’re running Spark jobs on Kubernetes, because we can use it as a local storage to spill in-process files too. The latest version of Amazon EMR 6.8 has integrated the PVC reuse feature of Spark, wherein if an executor is terminated due to EC2 Spot interruption or any other reason (JVM), then the PVC is not deleted but persisted and reattached to another executor. If there are shuffle files in that volume, then they are reused.

As with node decommission, this reduces the overall runtime because we don’t have to recompute the shuffle files. We also save the time required to request a new volume for an executor, and shuffle files can be reused without moving the files round.

The following diagram illustrates this workflow.

PVC Reuse

Fig 3: PVC Reuse

Let’s look at the steps in more detail.

If one or more of the nodes that are running executors is interrupted, the underlying pods get terminated and the driver gets the update. Note that the driver is the owner of the PVC of the executors, and they are not terminated. See the following code:

22/06/15 23:25:07 DEBUG ExecutorPodsWatchSnapshotSource: Received executor pod update for pod named amazon-reviews-word-count-9ee82b8169a75183-exec-3, action DELETED
22/06/15 23:25:07 DEBUG ExecutorPodsWatchSnapshotSource: Received executor pod update for pod named amazon-reviews-word-count-9ee82b8169a75183-exec-6, action MODIFIED
22/06/15 23:25:07 DEBUG ExecutorPodsWatchSnapshotSource: Received executor pod update for pod named amazon-reviews-word-count-9ee82b8169a75183-exec-6, action DELETED
22/06/15 23:25:07 DEBUG ExecutorPodsWatchSnapshotSource: Received executor pod update for pod named amazon-reviews-word-count-9ee82b8169a75183-exec-3, action MODIFIED

The ExecutorPodsAllocator tries to allocate new executor pods to replace the ones terminated due to interruption. During the allocation, it figures out how many of the existing PVCs have files and can be reused:

22/06/15 23:25:23 INFO ExecutorPodsAllocator: Found 2 reusable PVCs from 10 PVCs

The ExecutorPodsAllocator requests for a pod and when it launches it, the PVC is reused. In the following example, the PVC from executor 6 is reused for new executor pod 11:

22/06/15 23:25:23 DEBUG ExecutorPodsAllocator: Requested executor with id 11 from Kubernetes.
22/06/15 23:25:24 DEBUG ExecutorPodsWatchSnapshotSource: Received executor pod update for pod named amazon-reviews-word-count-9ee82b8169a75183-exec-11, action ADDED
22/06/15 23:25:24 INFO KubernetesClientUtils: Spark configuration files loaded from Some(/usr/lib/spark/conf) : log4j.properties,spark-env.sh,hive-site.xml,metrics.properties
22/06/15 23:25:24 INFO BasicExecutorFeatureStep: Decommissioning not enabled, skipping shutdown script
22/06/15 23:25:24 DEBUG ExecutorPodsWatchSnapshotSource: Received executor pod update for pod named amazon-reviews-word-count-9ee82b8169a75183-exec-11, action MODIFIED
22/06/15 23:25:24 INFO ExecutorPodsAllocator: Reuse PersistentVolumeClaim amazon-reviews-word-count-9ee82b8169a75183-exec-6-pvc-0

The shuffle files, if present in the PVC are reused.

The key advantage of this technique is that it allows us to reuse pre-computed shuffle files in their original location, thereby reducing the time of the overall job run.

This works for both static and dynamic PVCs. Amazon EKS offers three different storage offerings, which can be encrypted too: Amazon Elastic Block Store (Amazon EBS), Amazon Elastic File System (Amazon EFS), and Amazon FSx for Lustre. We recommend using dynamic PVCs with Amazon EBS because with static PVCs, you would need to create multiple PVCs.

The following code enables this configuration; more details are available on GitHub:

"spark.kubernetes.driver.ownPersistentVolumeClaim": "true"
"spark.kubernetes.driver.reusePersistentVolumeClaim": "true"

For this to work, we need to enable PVC with Amazon EKS and mention the details in the Spark runtime configuration. For instructions, refer to How do I use persistent storage in Amazon EKS? The following code contains the Spark configuration details for using PVC as local storage; other details are available on GitHub:

"spark.kubernetes.executor.volumes.persistentVolumeClaim.spark-local-dir-1.mount.readOnly": "false"
"spark.kubernetes.executor.volumes.persistentVolumeClaim.spark-local-dir-1.options.claimName": "OnDemand"
"spark.kubernetes.executor.volumes.persistentVolumeClaim.spark-local-dir-1.options.storageClass": "spark-sc"
"spark.kubernetes.executor.volumes.persistentVolumeClaim.spark-local-dir-1.options.sizeLimit": "10Gi"
"spark.kubernetes.executor.volumes.persistentVolumeClaim.spark-local-dir-1.mount.path": "/var/data/spill"

Conclusion

With Amazon EMR on EKS (6.9) and the features discussed in this post, you can further reduce the overall runtime for Spark jobs when running with Spot Instances. This also improves the overall resiliency and flexibility of the job while cost optimizing the workload on EC2 Spot.

Try out the EMR on EKS workshop for improved performance when running Spark workloads on Kubernetes and cost optimize using EC2 Spot Instances.


About the Author

Kinnar Kumar Sen is a Sr. Solutions Architect at Amazon Web Services (AWS) focusing on Flexible Compute. As a part of the EC2 Flexible Compute team, he works with customers to guide them to the most elastic and efficient compute options that are suitable for their workload running on AWS. Kinnar has more than 15 years of industry experience working in research, consultancy, engineering, and architecture.

Design considerations for Amazon EMR on EKS in a multi-tenant Amazon EKS environment

Post Syndicated from Lotfi Mouhib original https://aws.amazon.com/blogs/big-data/design-considerations-for-amazon-emr-on-eks-in-a-multi-tenant-amazon-eks-environment/

Many AWS customers use Amazon Elastic Kubernetes Service (Amazon EKS) in order to take advantage of Kubernetes without the burden of managing the Kubernetes control plane. With Kubernetes, you can centrally manage your workloads and offer administrators a multi-tenant environment where they can create, update, scale, and secure workloads using a single API. Kubernetes also allows you to improve resource utilization, reduce cost, and simplify infrastructure management to support different application deployments. This model is beneficial for those running Apache Spark workloads, for several reasons. For example, it allows you to have multiple Spark environments running concurrently with different configurations and dependencies that are segregated from each other through Kubernetes multi-tenancy features. In addition, the same cluster can be used for various workloads like machine learning (ML), host applications, data streaming and thereby reducing operational overhead of managing multiple clusters.

AWS offers Amazon EMR on EKS, a managed service that enables you to run your Apache Spark workloads on Amazon EKS. This service uses the Amazon EMR runtime for Apache Spark, which increases the performance of your Spark jobs so that they run faster and cost less. When you run Spark jobs on EMR on EKS and not on self-managed Apache Spark on Kubernetes, you can take advantage of automated provisioning, scaling, faster runtimes, and the development and debugging tools that Amazon EMR provides

In this post, we show how to configure and run EMR on EKS in a multi-tenant EKS cluster that can used by your various teams. We tackle multi-tenancy through four topics: network, resource management, cost management, and security.

Concepts

Throughout this post, we use terminology that is either specific to EMR on EKS, Spark, or Kubernetes:

  • Multi-tenancy – Multi-tenancy in Kubernetes can come in three forms: hard multi-tenancy, soft multi-tenancy and sole multi-tenancy. Hard multi-tenancy means each business unit or group of applications gets a dedicated Kubernetes; there is no sharing of the control plane. This model is out of scope for this post. Soft multi-tenancy is where pods might share the same underlying compute resource (node) and are logically separated using Kubernetes constructs through namespaces, resource quotas, or network policies. A second way to achieve multi-tenancy in Kubernetes is to assign pods to specific nodes that are pre-provisioned and allocated to a specific team. In this case, we talk about sole multi-tenancy. Unless your security posture requires you to use hard or sole multi-tenancy, you would want to consider using soft multi-tenancy for the following reasons:
    • Soft multi-tenancy avoids underutilization of resources and waste of compute resources.
    • There is a limited number of managed node groups that can be used by Amazon EKS, so for large deployments, this limit can quickly become a limiting factor.
    • In sole multi-tenancy there is high chance of ghost nodes with no pods scheduled on them due to misconfiguration as we force pods into dedicated nodes with label, taints and tolerance and anti-affinity rules.
  • Namespace – Namespaces are core in Kubernetes and a pillar to implement soft multi-tenancy. With namespaces, you can divide the cluster into logical partitions. These partitions are then referenced in quotas, network policies, service accounts, and other constructs that help isolate environments in Kubernetes.
  • Virtual cluster – An EMR virtual cluster is mapped to a Kubernetes namespace that Amazon EMR is registered with. Amazon EMR uses virtual clusters to run jobs and host endpoints. Multiple virtual clusters can be backed by the same physical cluster. However, each virtual cluster maps to one namespace on an EKS cluster. Virtual clusters don’t create any active resources that contribute to your bill or require lifecycle management outside the service.
  • Pod template – In EMR on EKS, you can provide a pod template to control pod placement, or define a sidecar container. This pod template can be defined for executor pods and driver pods, and stored in an Amazon Simple Storage Service (Amazon S3) bucket. The S3 locations are then submitted as part of the applicationConfiguration object that is part of configurationOverrides, as defined in the EMR on EKS job submission API.

Security considerations

In this section, we address security from different angles. We first discuss how to protect IAM role that is used for running the job. Then address how to protect secrets use in jobs and finally we discuss how you can protect data while it is processed by Spark.

IAM role protection

A job submitted to EMR on EKS needs an AWS Identity and Access Management (IAM) execution role to interact with AWS resources, for example with Amazon S3 to get data, with Amazon CloudWatch Logs to publish logs, or use an encryption key in AWS Key Management Service (AWS KMS). It’s a best practice in AWS to apply least privilege for IAM roles. In Amazon EKS, this is achieved through IRSA (IAM Role for Service Accounts). This mechanism allows a pod to assume an IAM role at the pod level and not at the node level, while using short-term credentials that are provided through the EKS OIDC.

IRSA creates a trust relationship between the EKS OIDC provider and the IAM role. This method allows only pods with a service account (annotated with an IAM role ARN) to assume a role that has a trust policy with the EKS OIDC provider. However, this isn’t enough, because it would allow any pod with a service account within the EKS cluster that is annotated with a role ARN to assume the execution role. This must be further scoped down using conditions on the role trust policy. This condition allows the assume role to happen only if the calling service account is the one used for running a job associated with the virtual cluster. The following code shows the structure of the condition to add to the trust policy:

{
    "Version": "2012-10-17",
    "Statement": [
        {
            "Effect": "Allow",
            "Principal": {
                "Federated": <OIDC provider ARN >
            },
            "Action": "sts:AssumeRoleWithWebIdentity"
            "Condition": { "StringLike": { “<OIDC_PROVIDER>:sub": "system:serviceaccount:<NAMESPACE>:emr-containers-sa-*-*-<AWS_ACCOUNT_ID>-<BASE36_ENCODED_ROLE_NAME>”} }
        }
    ]
}

To scope down the trust policy using the service account condition, you need to run the following the command with AWS CLI:

aws emr-containers update-role-trust-policy \
–cluster-name cluster \
–namespace namespace \
–role-name iam_role_name_for_job_execution

The command will the add the service account that will be used by the spark client, Jupyter Enterprise Gateway, Spark kernel, driver or executor. The service accounts name have the following structure emr-containers-sa-*-*-<AWS_ACCOUNT_ID>-<BASE36_ENCODED_ROLE_NAME>.

In addition to the role segregation offered by IRSA, we recommend blocking access to instance metadata because a pod can still inherit the rights of the instance profile assigned to the worker node. For more information about how you can block access to metadata, refer to Restrict access to the instance profile assigned to the worker node.

Secret protection

Sometime a Spark job needs to consume data stored in a database or from APIs. Most of the time, these are protected with a password or access key. The most common way to pass these secrets is through environment variables. However, in a multi-tenant environment, this means any user with access to the Kubernetes API can potentially access the secrets in the environment variables if this access isn’t scoped well to the namespaces the user has access to.

To overcome this challenge, we recommend using a Secrets store like AWS Secrets Manager that can be mounted through the Secret Store CSI Driver. The benefit of using Secrets Manager is the ability to use IRSA and allow only the role assumed by the pod access to the given secret, thereby improving your security posture. You can refer to the best practices guide for sample code showing the use of Secrets Manager with EMR on EKS.

Spark data encryption

When a Spark application is running, the driver and executors produce intermediate data. This data is written to the node local storage. Anyone who is able to exec into the pods would be able to read this data. Spark supports encryption of this data, and it can be enabled by passing --conf spark.io.encryption.enabled=true. Because this configuration adds performance penalty, we recommend enabling data encryption only for workloads that store and access highly sensitive data and in untrusted environments.

Network considerations

In this section we discuss how to manage networking within the cluster as well as outside the cluster. We first address how Spark handle cross executors and driver communication and how to secure it. Then we discuss how to restrict network traffic between pods in the EKS cluster and allow only traffic destined to EMR on EKS. Last, we discuss how to restrict traffic of executors and driver pods to external AWS service traffic using security groups.

Network encryption

The communication between the driver and executor uses RPC protocol and is not encrypted. Starting with Spark 3 in the Kubernetes backed cluster, Spark offers a mechanism to encrypt communication using AES encryption.

The driver generates a key and shares it with executors through the environment variable. Because the key is shared through the environment variable, potentially any user with access to the Kubernetes API (kubectl) can read the key. We recommend securing access so that only authorized users can have access to the EMR virtual cluster. In addition, you should set up Kubernetes role-based access control in such a way that the pod spec in the namespace where the EMR virtual cluster runs is granted to only a few selected service accounts. This method of passing secrets through the environment variable would change in the future with a proposal to use Kubernetes secrets.

To enable encryption, RPC authentication must also be enabled in your Spark configuration. To enable encryption in-transit in Spark, you should use the following parameters in your Spark config:

--conf spark.authenticate=true

--conf spark.network.crypto.enabled=true

Note that these are the minimal parameters to set; refer to Encryption from the complete list of parameters.

Additionally, applying encryption in Spark has a negative impact on processing speed. You should only apply it when there is a compliance or regulation need.

Securing Network traffic within the cluster

In Kubernetes, by default pods can communicate over the network across different namespaces in the same cluster. This behavior is not always desirable in a multi-tenant environment. In some instances, for example in regulated industries, to be compliant you want to enforce strict control over the network and send and receive traffic only from the namespace that you’re interacting with. For EMR on EKS, it would be the namespace associated to the EMR virtual cluster. Kubernetes offers constructs that allow you to implement network policies and define fine-grained control over the pod-to-pod communication. These policies are implemented by the CNI plugin; in Amazon EKS, the default plugin would be the VPC CNI. A policy is defined as follows and is applied with kubectl:

Kind: NetworkPolicy
metadata:
  name: default-np-ns1
  namespace: <EMR-VC-NAMESPACE>
spec:
  podSelector: {}
  policyTypes:
  - Ingress
  - Egress
  ingress:
  - from:
    - namespaceSelector:
        matchLabels:
          nsname: <EMR-VC-NAMESPACE>

Network traffic outside the cluster

In Amazon EKS, when you deploy pods on Amazon Elastic Compute Cloud (Amazon EC2) instances, all the pods use the security group associated with the node. This can be an issue if your pods (executor pods) are accessing a data source (namely a database) that allows traffic based on the source security group. Database servers often restrict network access only from where they are expecting it. In the case of a multi-tenant EKS cluster, this means pods from other teams that shouldn’t have access to the database servers, would be able to send traffic to it.

To overcome this challenge, you can use security groups for pods. This feature allows you to assign a specific security group to your pods, thereby controlling the network traffic to your database server or data source. You can also refer to the best practices guide for a reference implementation.

Cost management and chargeback

In a multi-tenant environment, cost management is a critical subject. You have multiple users from various business units, and you need to be able to precisely chargeback the cost of the compute resource they have used. At the beginning of the post, we introduced three models of multi-tenancy in Amazon EKS: hard multi-tenancy, soft multi-tenancy, and sole multi-tenancy. Hard multi-tenancy is out of scope because the cost tracking is trivial; all the resources are dedicated to the team using the cluster, which is not the case for sole multi-tenancy and soft multi-tenancy. In the next sections, we discuss these two methods to track the cost for each of model.

Soft multi-tenancy

In a soft multi-tenant environment, you can perform chargeback to your data engineering teams based on the resources they consumed and not the nodes allocated. In this method, you use the namespaces associated with the EMR virtual cluster to track how much resources were used for processing jobs. The following diagram illustrates an example.

Diagram to illustrate soft multi-tenancy

Diagram -1 Soft multi-tenancy

Tracking resources based on the namespace isn’t an easy task because jobs are transient in nature and fluctuate in their duration. However, there are partner tools available that allow you to keep track of the resources used, such as Kubecost, CloudZero, Vantage, and many others. For instructions on using Kubecost on Amazon EKS, refer to this blog post on cost monitoring for EKS customers.

Sole multi-tenancy

For sole multi-tenancy, the chargeback is done at the instance (node) level. Each member on your team uses a specific set of nodes that are dedicated to it. These nodes aren’t always running, and are spun up using the Kubernetes auto scaling mechanism. The following diagram illustrates an example.

Diagram to illustrate Sole tenancy

Diagram -2 Sole tenancy

With sole multi-tenancy, you use a cost allocation tag, which is an AWS mechanism that allows you to track how much each resource has consumed. Although the method of sole multi-tenancy isn’t efficient in terms of resource utilization, it provides a simplified strategy for chargebacks. With the cost allocation tag, you can chargeback a team based on all the resources they used, like Amazon S3, Amazon DynamoDB, and other AWS resources. The chargeback mechanism based on the cost allocation tag can be augmented using the recently launched AWS Billing Conductor, which allows you to issue bills internally for your team.

Resource management

In this section, we discuss considerations regarding resource management in multi-tenant clusters. We briefly discuss topics like sharing resources graciously, setting guard rails on resource consumption, techniques for ensuring resources for time sensitive and/or critical jobs, meeting quick resource scaling requirements and finally cost optimization practices with node selectors.

Sharing resources

In a multi-tenant environment, the goal is to share resources like compute and memory for better resource utilization. However, this requires careful capacity management and resource allocation to make sure each tenant gets their fair share. In Kubernetes, resource allocation is controlled and enforced by using ResourceQuota and LimitRange. ResourceQuota limits resources on the namespace level, and LimitRange allows you to make sure that all the containers are submitted with a resource requirement and a limit. In this section, we demonstrate how a data engineer or Kubernetes administrator can set up ResourceQuota as a LimitRange configuration.

The administrator creates one ResourceQuota per namespace that provides constraints for aggregate resource consumption:

apiVersion: v1
kind: ResourceQuota
metadata:
  name: compute-resources
  namespace: teamA
spec:
  hard:
    requests.cpu: "1000"
    requests.memory: 4000Gi
    limits.cpu: "2000"
    limits.memory: 6000Gi

For LimitRange, the administrator can review the following sample configuration. We recommend using default and defaultRequest to enforce the limit and request field on containers. Lastly, from a data engineer perspective while submitting the EMR on EKS jobs, you need to make sure the Spark parameters of resource requirements are within the range of the defined LimitRange. For example, in the following configuration, the request for spark.executor.cores=7 will fail because the max limit for CPU is 6 per container:

apiVersion: v1
kind: LimitRange
metadata:
  name: cpu-min-max
  namespace: teamA
spec:
  limits:
  - max:
      cpu: "6"
    min:
      cpu: "100m"
    default:
      cpu: "500m"
    defaultRequest:
      cpu: "100m"
    type: Container

Priority-based resource allocation

Diagram Illustrates an example of resource allocation with priority

Diagram – 3 Illustrates an example of resource allocation with priority.

As all the EMR virtual clusters share the same EKS computing platform with limited resources, there will be scenarios in which you need to prioritize jobs in a sensitive timeline. In this case, high-priority jobs can utilize the resources and finish the job, whereas low-priority jobs that are running gets stopped and any new pods must wait in the queue. EMR on EKS can achieve this with the help of pod templates, where you specify a priority class for the given job.

When a pod priority is enabled, the Kubernetes scheduler orders pending pods by their priority and places them in the scheduling queue. As a result, the higher-priority pod may be scheduled sooner than pods with lower priority if its scheduling requirements are met. If this pod can’t be scheduled, the scheduler continues and tries to schedule other lower-priority pods.

The preemptionPolicy field on the PriorityClass defaults to PreemptLowerPriority, and the pods of that PriorityClass can preempt lower-priority pods. If preemptionPolicy is set to Never, pods of that PriorityClass are non-preempting. In other words, they can’t preempt any other pods. When lower-priority pods are preempted, the victim pods get a grace period to finish their work and exit. If the pod doesn’t exit within that grace period, that pod is stopped by the Kubernetes scheduler. Therefore, there is usually a time gap between the point when the scheduler preempts victim pods and the time that a higher-priority pod is scheduled. If you want to minimize this gap, you can set a deletion grace period of lower-priority pods to zero or a small number. You can do this by setting the terminationGracePeriodSeconds option in the victim Pod YAML.

See the following code samples for priority class:

apiVersion: scheduling.k8s.io/v1
kind: PriorityClass
metadata:
  name: high-priority
value: 100
globalDefault: false
description: " High-priority Pods and for Driver Pods."

apiVersion: scheduling.k8s.io/v1
kind: PriorityClass
metadata:
  name: low-priority
value: 50
globalDefault: false
description: " Low-priority Pods."

One of the key considerations while templatizing the driver pods, especially for low-priority jobs, is to avoid the same low-priority class for both driver and executor. This will save the driver pods from getting evicted and lose the progress of all its executors in a resource congestion scenario. In this low-priority job example, we have used a high-priority class for driver pod templates and low-priority classes only for executor templates. This way, we can ensure the driver pods are safe during the eviction process of low-priority jobs. In this case, only executors will be evicted, and the driver can bring back the evicted executor pods as the resource becomes freed. See the following code:

apiVersion: v1
kind: Pod
spec:
  priorityClassName: "high-priority"
  nodeSelector:
    eks.amazonaws.com/capacityType: ON_DEMAND
  containers:
  - name: spark-kubernetes-driver # This will be interpreted as Spark driver container

apiVersion: v1
kind: Pod
spec:
  priorityClassName: "low-priority"
  nodeSelector:
    eks.amazonaws.com/capacityType: SPOT
  containers:
  - name: spark-kubernetes-executors # This will be interpreted as Spark executor container

Overprovisioning with priority

Diagram Illustrates an example of overprovisioning with priority

Diagram – 4 Illustrates an example of overprovisioning with priority.

As pods wait in a pending state due to resource availability, additional capacity can be added to the cluster with Amazon EKS auto scaling. The time it takes to scale the cluster by adding new nodes for deployment has to be considered for time-sensitive jobs. Overprovisioning is an option to mitigate the auto scaling delay using temporary pods with negative priority. These pods occupy space in the cluster. When pods with high priority are unschedulable, the temporary pods are preempted to make the room. This causes the auto scaler to scale out new nodes due to overprovisioning. Be aware that this is a trade-off because it adds higher cost while minimizing scheduling latency. For more information about overprovisioning best practices, refer to Overprovisioning.

Node selectors

EKS clusters can span multiple Availability Zones in a VPC. A Spark application whose driver and executor pods are distributed across multiple Availability Zones can incur inter- Availability Zone data transfer costs. To minimize or eliminate the data transfer cost, you should configure the job to run on a specific Availability Zone or even specific node type with the help of node labels. Amazon EKS places a set of default labels to identify capacity type (On-Demand or Spot Instance), Availability Zone, instance type, and more. In addition, we can use custom labels to meet workload-specific node affinity.

EMR on EKS allows you to choose specific nodes in two ways:

  • At the job level. Refer to EKS Node Placement for more details.
  • In the driver and executor level using pod templates.

When using pod templates, we recommend using on demand instances for driver pods. You can also consider including spot instances for executor pods for workloads that are tolerant of occasional periods when the target capacity is not completely available. Leveraging spot instances allow you to save cost for jobs that are not critical and can be terminated. Please refer Define a NodeSelector in PodTemplates.

Conclusion

In this post, we provided guidance on how to design and deploy EMR on EKS in a multi-tenant EKS environment through different lenses: network, security, cost management, and resource management. For any deployment, we recommend the following:

  • Use IRSA with a condition scoped on the EMR on EKS service account
  • Use a secret manager to store credentials and the Secret Store CSI Driver to access them in your Spark application
  • Use ResourceQuota and LimitRange to specify the resources that each of your data engineering teams can use and avoid compute resource abuse and starvation
  • Implement a network policy to segregate network traffic between pods

Lastly, if you are considering migrating your spark workload to EMR on EKS you can further learn about design patterns to manage Apache Spark workload in EMR on EKS in this blog and about migrating your EMR transient cluster to EMR on EKS in this blog.


About the Authors

author - lotfiLotfi Mouhib is a Senior Solutions Architect working for the Public Sector team with Amazon Web Services. He helps public sector customers across EMEA realize their ideas, build new services, and innovate for citizens. In his spare time, Lotfi enjoys cycling and running.

author - peter ajeebAjeeb Peter is a Senior Solutions Architect with Amazon Web Services based in Charlotte, North Carolina, where he guides global financial services customers to build highly secure, scalable, reliable, and cost-efficient applications on the cloud. He brings over 20 years of technology experience on Software Development, Architecture and Analytics from industries like finance and telecom.

Disaster recovery considerations with Amazon EMR on Amazon EC2 for Spark workloads

Post Syndicated from Bharat Gamini original https://aws.amazon.com/blogs/big-data/disaster-recovery-considerations-with-amazon-emr-on-amazon-ec2-for-spark-workloads/

Amazon EMR is a cloud big data platform for running large-scale distributed data processing jobs, interactive SQL queries, and machine learning (ML) applications using open-source analytics frameworks such as Apache Spark, Apache Hive, and Presto. Amazon EMR launches all nodes for a given cluster in the same Amazon Elastic Compute Cloud (Amazon EC2) Availability Zone to improve performance. During an Availability Zone failure or due to any unexpected interruption, Amazon EMR may not be accessible, and we need a disaster recovery (DR) strategy to mitigate this problem.

Part of architecting a resilient, highly available Amazon EMR solution is the consideration that failures do occur. These unexpected interruptions can be caused by natural disasters, technical failures, and human interactions resulting in an Availability Zone outage. The EMR cluster could also become unreachable due to failure of critical services running on the EMR master node, network issues, or other issues.

In this post, we show you how to architect your Amazon EMR environment for disaster recovery to maintain business continuity with minimum Recovery Time Objective (RTO) during Availability Zone failure or when your EMR cluster is inoperable.

Although various disaster recovery strategies are available in the cloud, we discuss active-active and active-passive DR strategies for Amazon EMR in this post. We focus on a use case for Spark batch workloads where persistent storage is decoupled from Amazon EMR and the EMR cluster is running with a single master node. If the EMR cluster is used for persistent storage, it requires an additional strategy to replicate data from the EMR cluster, which we will cover in subsequent posts.

Prerequisites

To follow along with this post, you should have a knowledge of Amazon Managed Workflows for Apache Airflow (Amazon MWAA) and an understanding of Network Load Balancers.

Solution overview

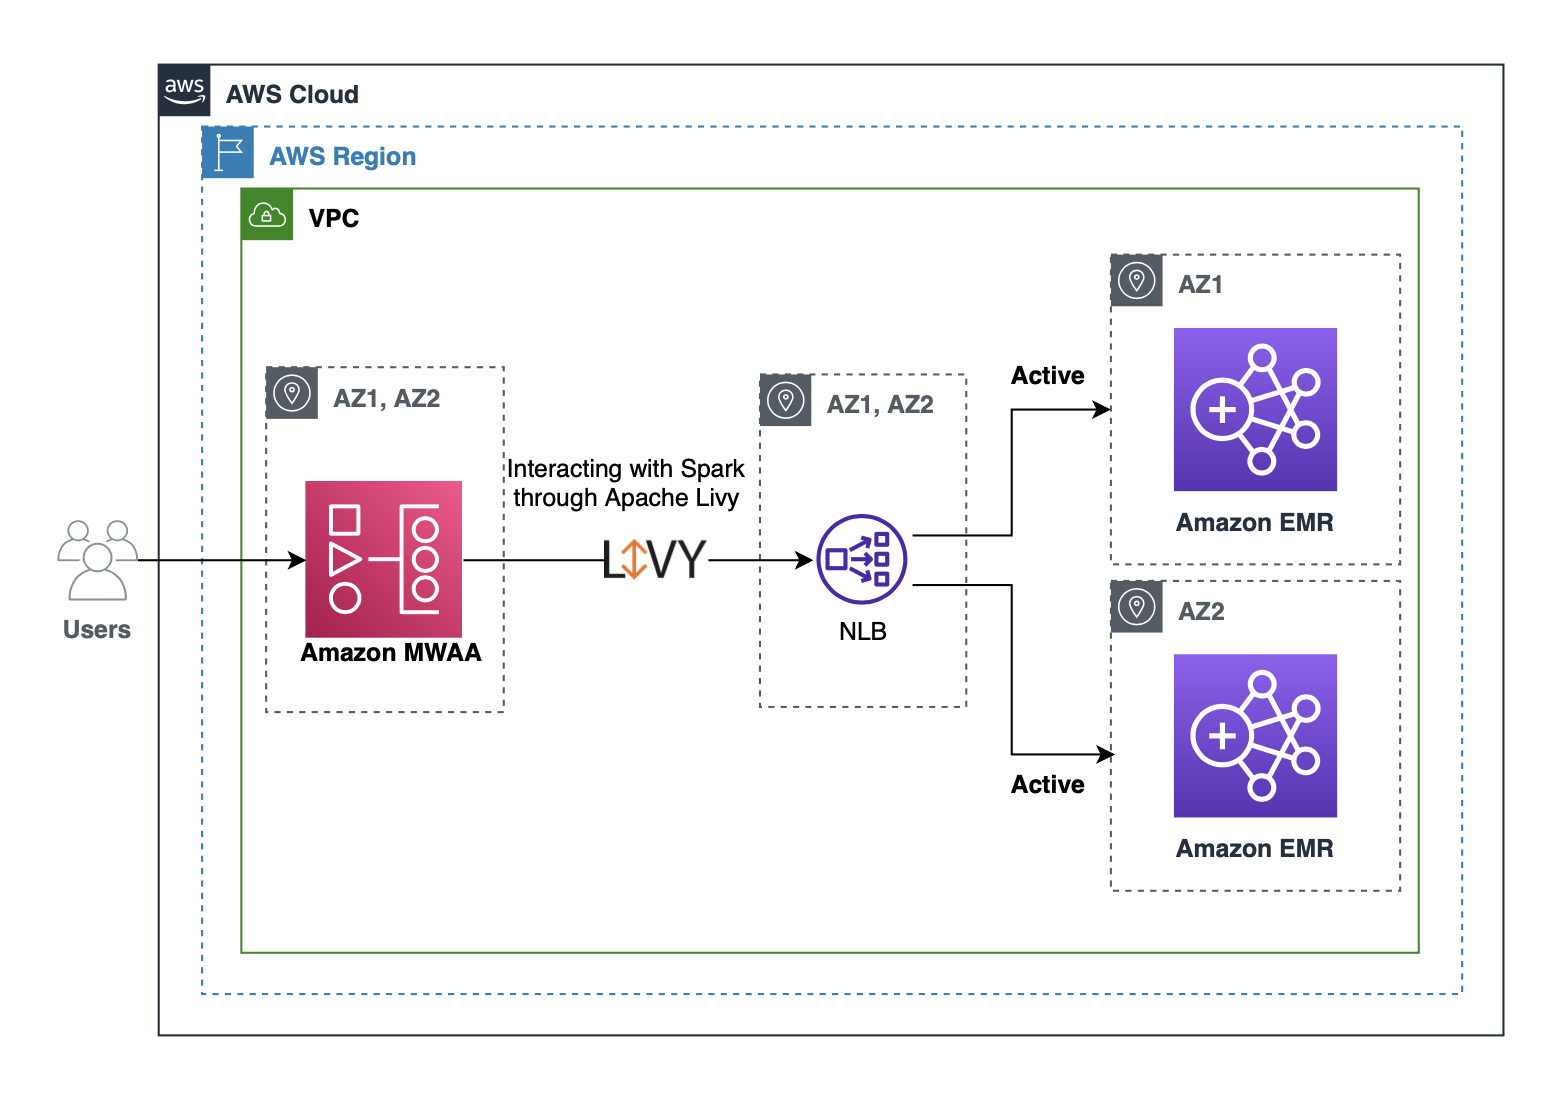
The following diagram illustrates the solution architecture.

Customers often use Amazon MWAA to submit Spark jobs to an EMR cluster using an Apache Livy REST interface. We can configure Apache Livy to use a Network Load Balancer hostname instead of an Amazon EMR master hostname, so that we don’t need to update Livy connections from Amazon MWAA whenever a new cluster is created or stopped. You can register Network Load Balancer target groups with multiple EMR cluster master nodes for an active-active setup. In the case of an active-passive setup, we can create a new EMR cluster when a failure is detected and register the new EMR master with the Network Load Balancer target group. The Network Load Balancer automatically performs health checks and distributes requests to healthy targets. With this solution, we can maintain business continuity when an EMR cluster isn’t reachable due to Availability Zone failure or when the cluster is unhealthy due to any other reason.

Active-active DR strategy

An active-active DR setup focuses on running two EMR clusters with identical configuration in two different Availability Zones. To reduce the running costs of two active EMR clusters, we can launch both clusters with minimum capacity, and managed scaling automatically scales the cluster based on the workload. EMR managed scaling only launches instances when there is demand for resources and stops the unneeded instances when the work is finished. With this strategy, we can reduce our recovery time to near zero with optimal cost. This active-active DR strategy is suitable when businesses want to have near-zero downtime with automatic failover for your analytics workloads.

In the following section, we walk through the steps to implement the solution and provide references to related resources that provide more detailed guidance.

Create EMR clusters

We create two EMR clusters in different Availability Zones within the same Region of your choice. Use the following AWS Command Line Interface (AWS CLI) command and modify or add required configurations as per your needs:

aws emr create-cluster \
  --name "<emr-cluster-az-a>" \
  --release-label emr-6.4.0 \
  --log-uri "s3://<your-log-bucket>" \
  --applications Name=Spark Name=Livy \
  --ec2-attributes "KeyName=<your-key-name>,SubnetId=<private-subnet-in-az-a>" \
  --instance-groups InstanceGroupType=MASTER,InstanceCount=1,InstanceType=m4.large InstanceGroupType=CORE,InstanceCount=1,InstanceType=m4.large \
  --use-default-roles

We can create the cluster with EMR managed scaling, which lets you automatically increase or decrease the number of instances or units in your cluster based on workload. Amazon EMR continuously evaluates cluster metrics to make scaling decisions that optimize your clusters for cost and speed.

Create and configure a Network Load Balancer

You can create a Network Load Balancer using the AWS CLI (see Create a Network Load Balancer using the AWS CLI) or the AWS Management Console (see Create a Network Load Balancer). For this post, we do so on the console.

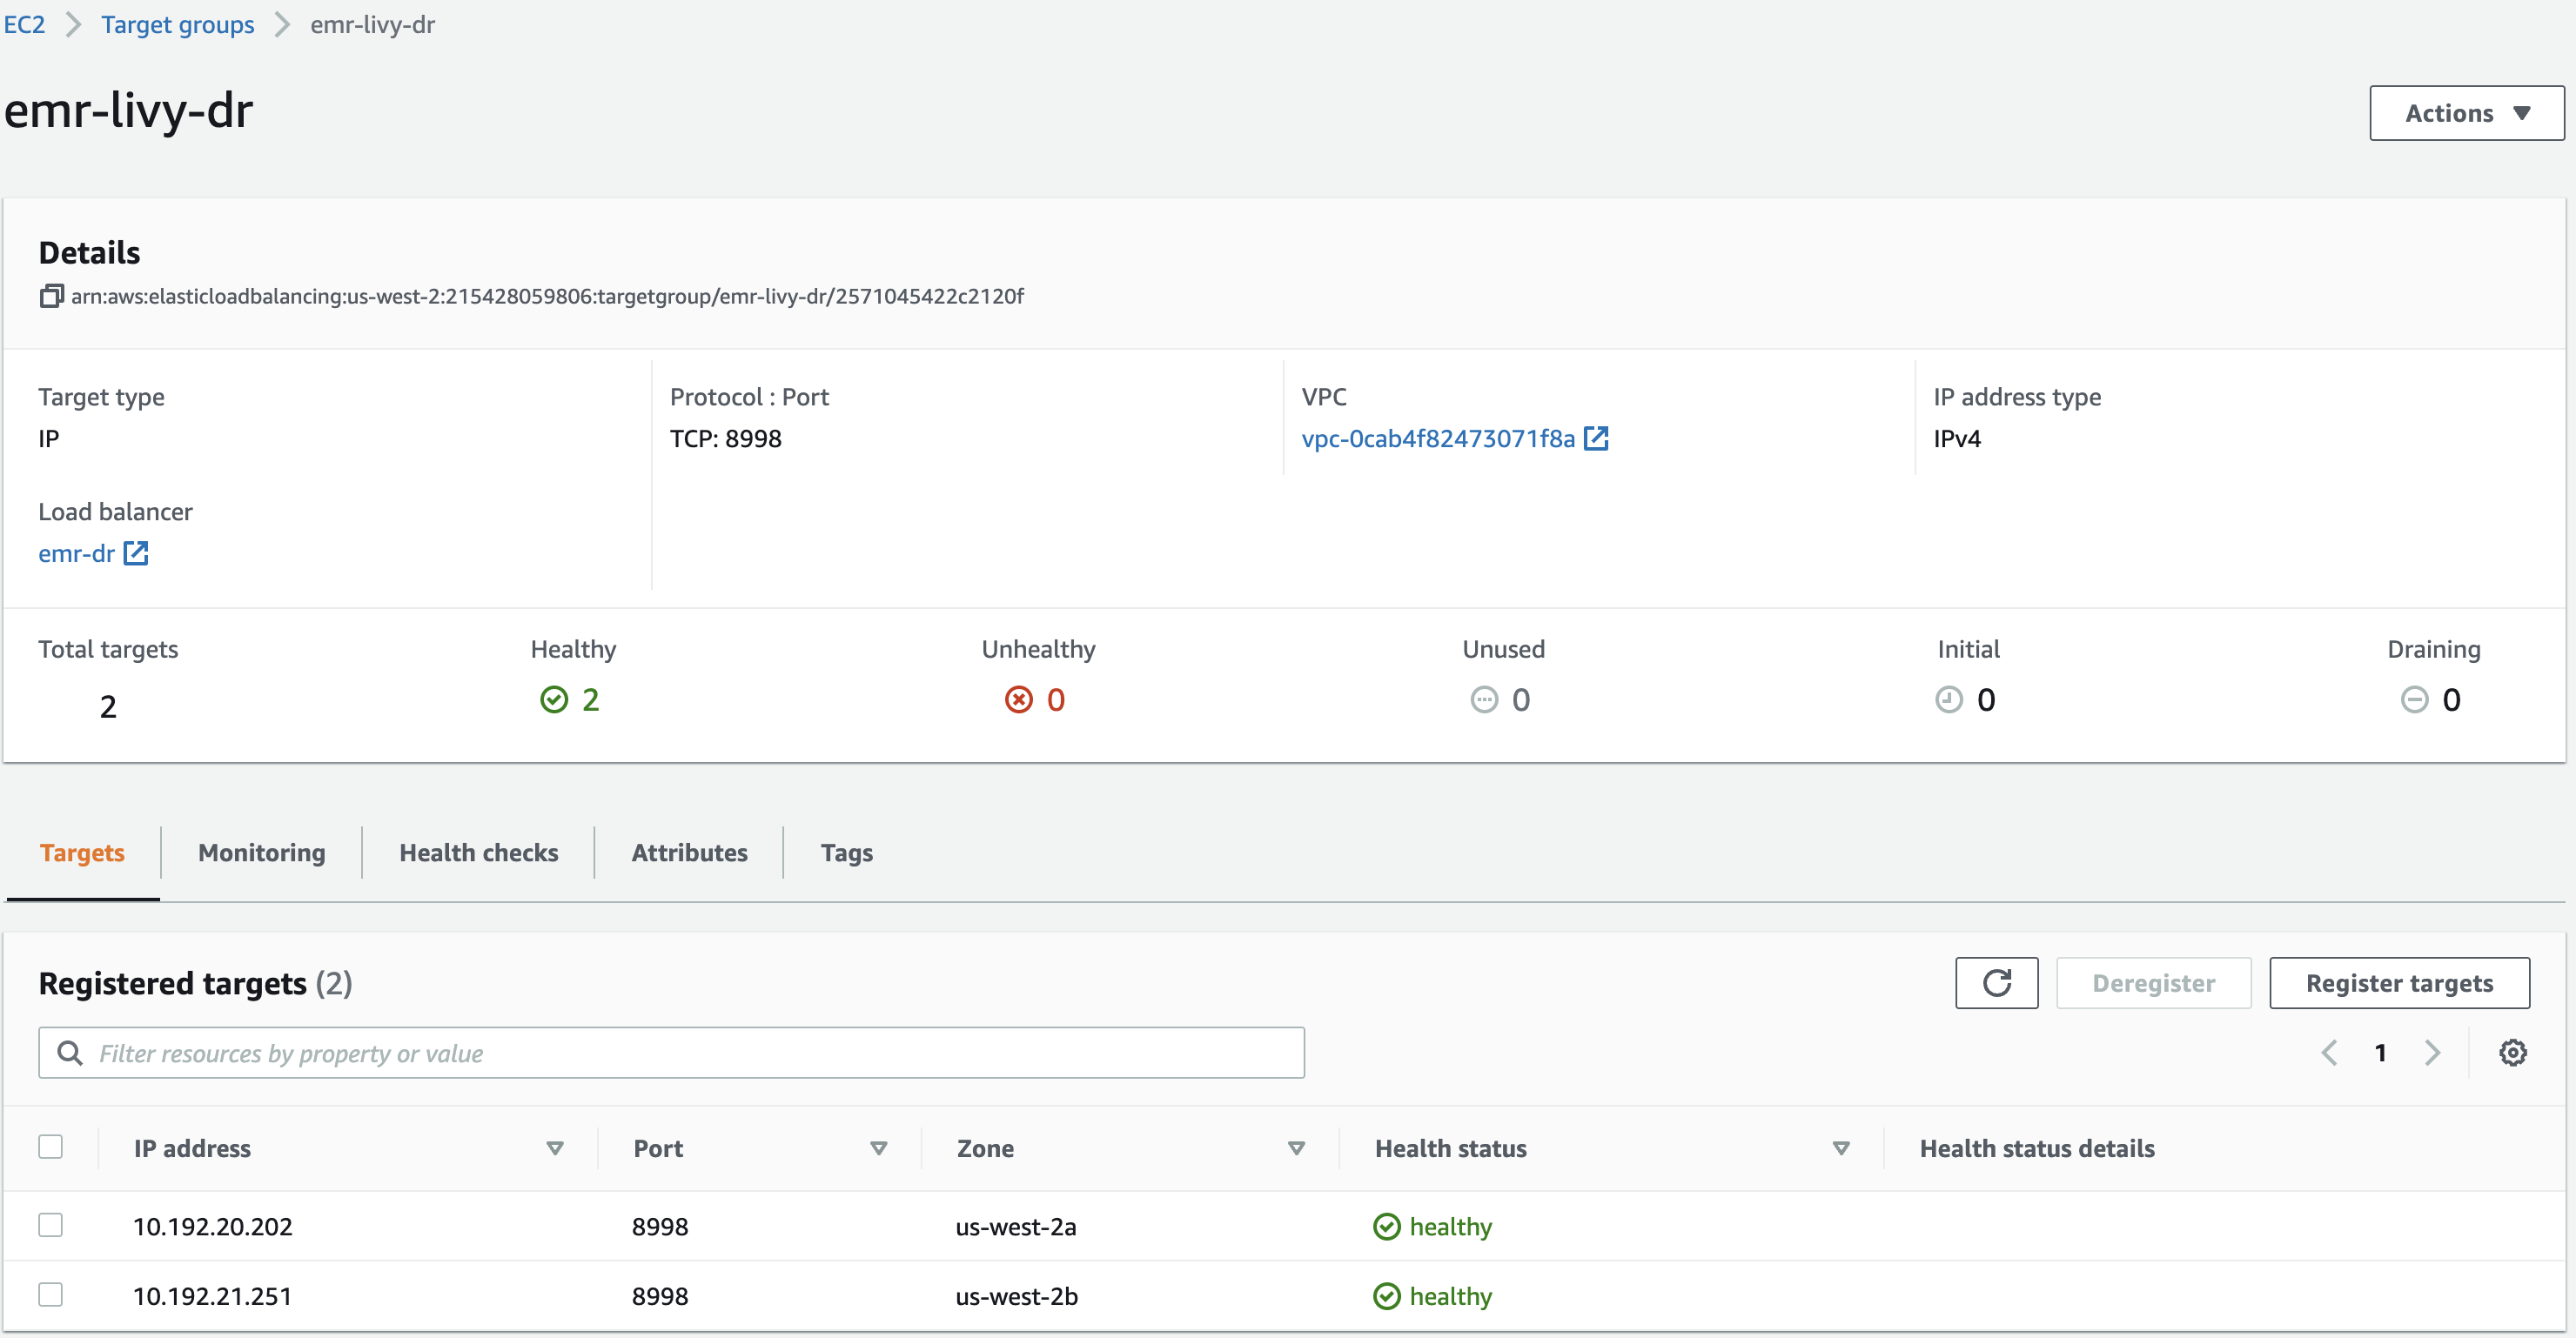
  • Create a target group (emr-livy-dr) and register both EMR clusters’ master IP addresses in the target group.

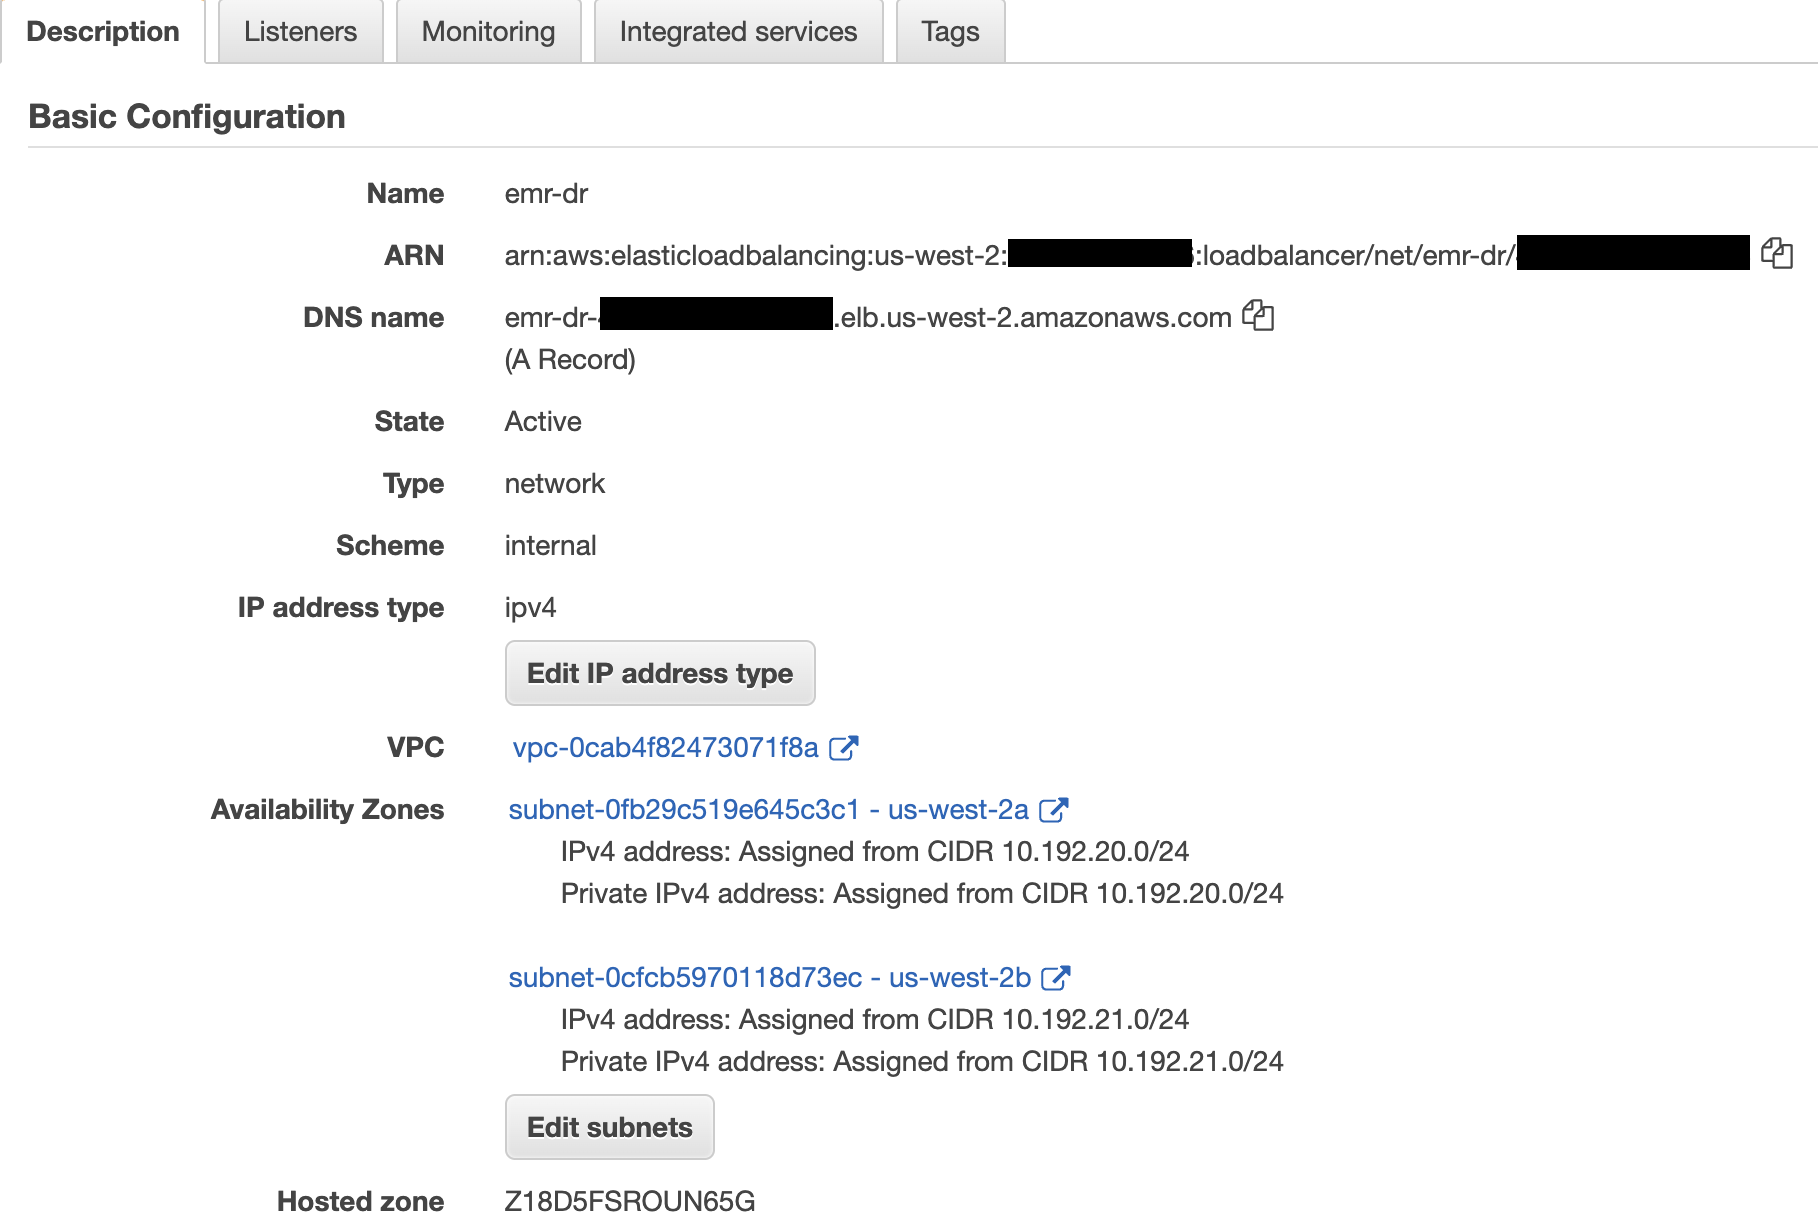
  • Create an internal Network Load Balancer in the same VPC or Region as your EMR clusters, and choose two different Availability Zones and select the private subnets.
    These subnets don’t need to be in the same subnets as the EMR clusters, but the clusters must allow the traffic from the Network Load Balancer, which is discussed in next steps.

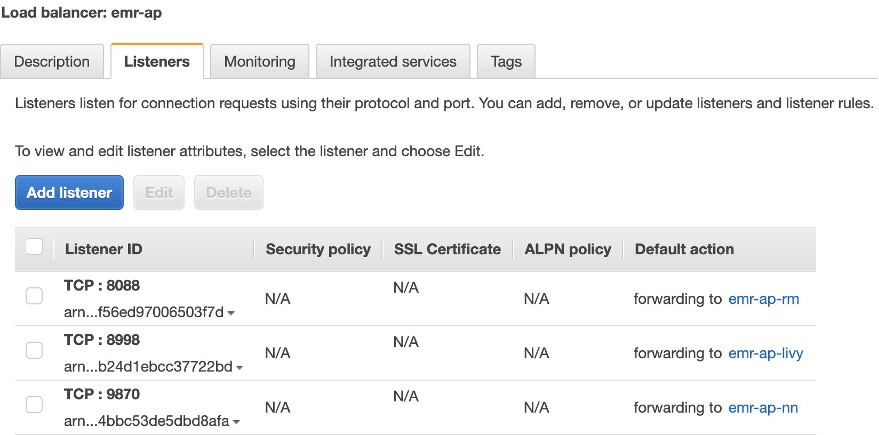
  • Create a TCP listener on port 8998 (the default EMR cluster Livy port) to forward requests to the target group you created.

  • Modify the EMR clusters’ master security groups to allow the Network Load Balancer’s private IP addresses to access port 8998.

You can find the Network Load Balancer’s private IP address by searching the elastic network interfaces for the Network Load Balancer’s name. For access control instructions, refer to How do I attach a security group to my Elastic Load Balancer.

When the target groups become healthy, the Network Load Balancer forwards requests to registered targets when it receives requests on Livy port 8998.

  • Get the DNS name of the Network Load Balancer.

We can also use an Amazon Route 53 alias record to use our own domain name to route traffic to the Network Load Balancer DNS name. We use this DNS name in our Amazon MWAA Livy connection.

Create and configure Amazon MWAA

Complete the following steps:

  • Make sure the execution role you’re using with Amazon MWAA has proper access to EMR clusters and other required services.
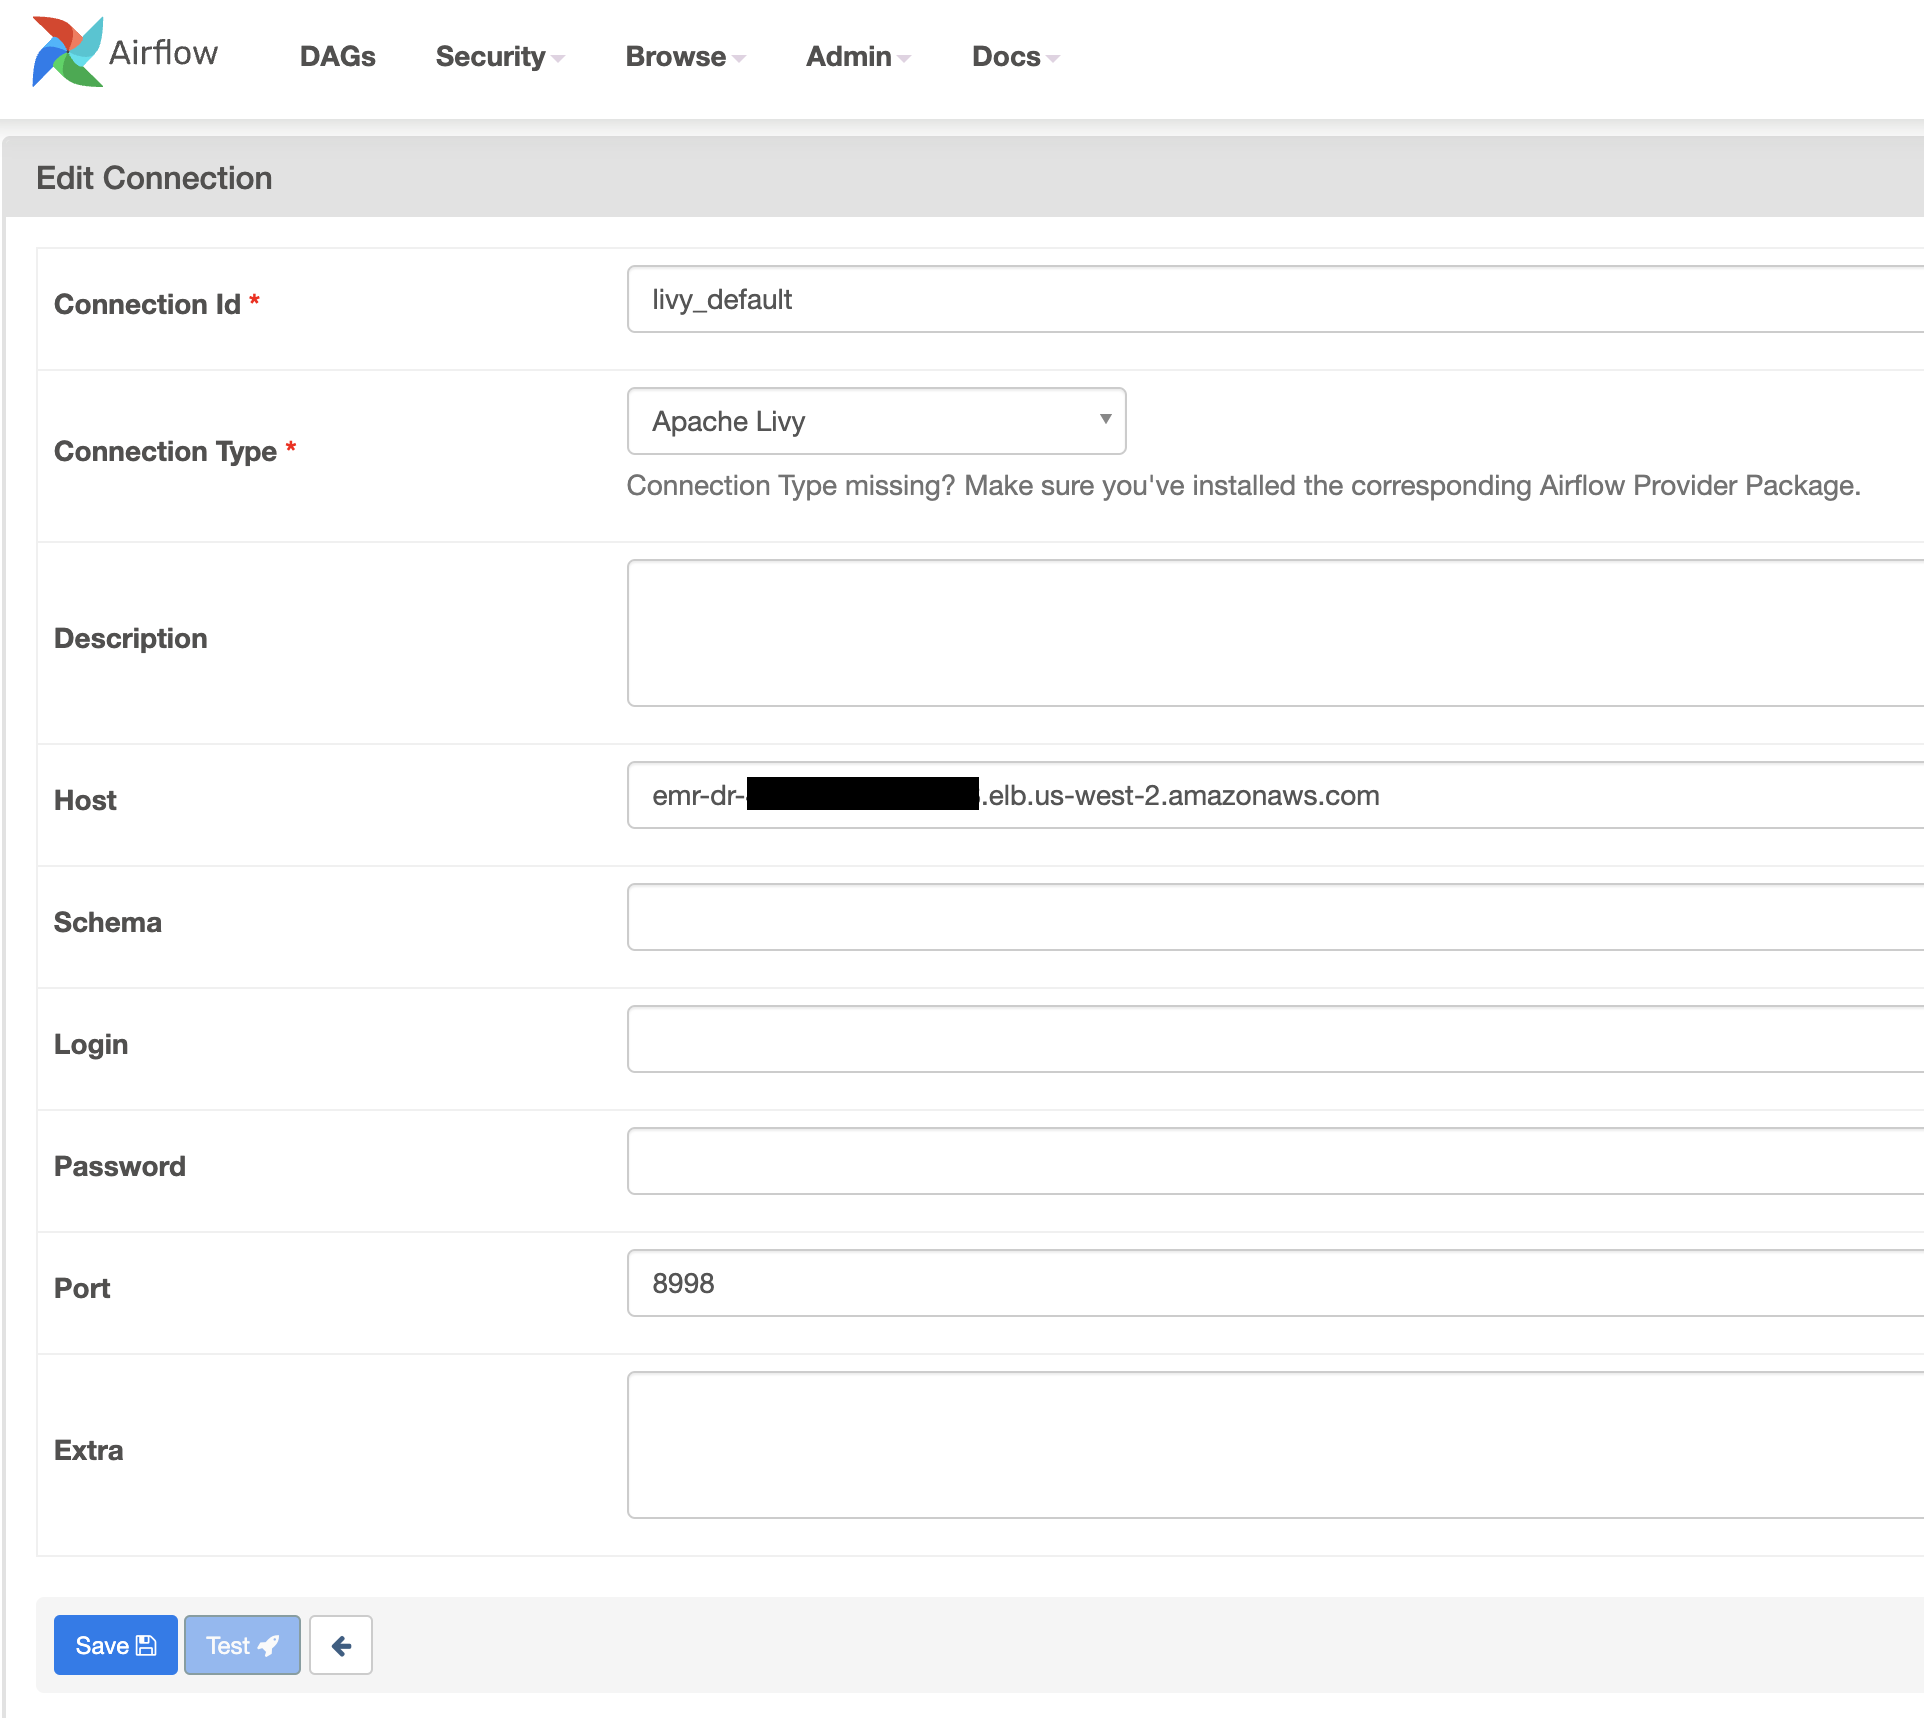
  • Update the Amazon MWAA Livy connection (livy_default) host with the Network Load Balancer hostname you created.
  • Create a new Livy connection ID if it’s not already available.

  • Use the following sample DAG to submit a sample Spark application using LivyOperator. We assign the livy_default connection to the livy_conn_id in the DAG code.
  • Enable the DAG and verify if the Spark application is successful on one of the EMR clusters.
from datetime import timedelta, datetime
from airflow.utils.dates import days_ago
from airflow import DAG
from airflow.providers.apache.livy.operators.livy import LivyOperator

default_args = {
    'owner': 'airflow',
    "retries": 1,
    "retry_delay": timedelta(minutes=5),
}

dag_name = "livy_spark_dag"
# Replace S3 bucket name
# You can use sample spark jar from EMR cluster master node
# /usr/lib/spark/examples/jars/spark-examples.jar
s3_bucket = "artifacts-bucket"
jar_location = "s3://{}/spark-examples.jar".format(s3_bucket)

dag = DAG(
    dag_id = dag_name,
    default_args=default_args,
    schedule_interval='@once',
    start_date = days_ago(1),
    catchup=False,
    tags=['emr', 'spark', 'livy']
)

livy_spark = LivyOperator(
    file=jar_location,
    class_name="org.apache.spark.examples.SparkPi",
    driver_memory="1g",
    driver_cores=1,
    executor_memory="1g",
    executor_cores=2,
    num_executors=1,
    task_id="livy_spark",
    conf={
    "spark.submit.deployMode": "cluster",
    "spark.app.name": dag_name
    },
    livy_conn_id="livy_default",
    dag=dag,
)

livy_spark

Test the DR plan

We can test our DR plan by creating scenarios that could be caused by real disasters. Perform the following steps to validate if our DR strategy works automatically during a disaster:

  1. Run the sample DAG multiple times and verify if Spark applications are randomly submitted to the registered EMR clusters.
  2. Stop one of the clusters and verify if jobs are automatically submitted to the other cluster in a different Availability Zone without any issues.

Active-passive DR strategy

Although the active-active DR strategy has benefits of maintaining near-zero recovery time, it’s complex to maintain two environments because both environments require patching and constant monitoring. In cases where Recovery Time Objective (RTO) and Recovery Point Objective (RPO) aren’t critical for your workloads, we can adopt an active-passive strategy. This approach offers a more economical and operationally less complex approach.

In this approach, we use a single EMR cluster as an active cluster and in case of disaster (due to Availability Zone failures or any other reason the EMR cluster is unhealthy), we launch a second EMR cluster in a different Availability Zone and redirect all our workloads to the newly launched cluster. End-users may notice some delay because launching a second EMR cluster takes time.

The high-level architecture of the active-passive DR solution is shown in the following diagram.

Complete the following steps to implement this solution:

  • Create an EMR cluster in a single Availability Zone.
  • Create target groups and register the EMR cluster master node IP address. Create target group for Resource Manager(8088), Name Node(9870) and Livy(8998) services. Change the port numbers if services are running on different ports.

  • Create a Network Load Balancer and add TCP listeners and forward requests to the respective target groups.

  • Create an Amazon MWAA environment with proper access to the EMR cluster in the same Region.
  • Edit the Amazon MWAA Livy connection to use the Network Load Balancer DNS name.
  • Use the updated Livy connection in Amazon MWAA DAGs to submit Spark applications.
  • Validate if we can successfully submit Spark applications via Livy to the EMR cluster.
  • Set up a DAG on Amazon MWAA or similar scheduling tool that continuously monitors the existing EMR cluster health.
  • Monitor the following key services running on the Amazon EMR master host using REST APIs or commands provided by each service. Add more health checks as required.
  • If the health check process detects a failure of the first EMR cluster, create a new EMR cluster in a different Availability Zone.
  • Automatically register the newly created EMR cluster master IP address to the Network Load Balancer target groups.
  • When the Network Load Balancer health checks are successful with the new EMR cluster master IP, delete the unhealthy EMR cluster master IP address from the target group and stop the old EMR cluster.
  • Validate the DR plan.

Follow the steps mentioned in the active-active DR strategy to create the following resources:

  • Amazon EMR
  • Amazon MWAA
  • Network Load Balancer

The following sample script provides the functionality described in this section. Use this as reference and modify it accordingly to fit your use case.

#!/bin/bash

usage() {
	cat <<EOF
   Usage: ./dr_health_check.sh j-2NPQWXK1U4E6G

   This script takes current EMR cluster id as argument and monitors the cluster health and
   creates new EMR cluster in different AZ if existing cluster is unhealthy/unreachable

EOF
	exit 1
}

[[ $# -lt 1 ]] && {
	echo Specify cluster id as argument to the script
	usage
}

#Set NLB DNS name and region
hostname="emr-ap-ae4ffe5g23fd9245.elb.us-west-2.amazonaws.com"
region="us-west-2"
cluster_id=$1
cluster_status=""

export AWS_DEFAULT_REGION=$region

#Depending on the use case perform below health checks for more than one time in a loop and if cluster state is still unhealthy then only perform remaining steps
#Ports and SSL properties for curl command may differ depending on how services are set up
rm_state=$(curl -s --connect-timeout 5 --max-time 10 http://$hostname:8088/ws/v1/cluster | jq -r .clusterInfo.state)
if [[ $? -ne 0 || "$rm_state" != "STARTED" ]]; then
	echo "ResourceManager port not reachable or service not running"
	cluster_status="unhealthy"
fi

nn_state=$(curl -s --connect-timeout 5 --max-time 10 http://$hostname:9870/jmx?qry=Hadoop:service=NameNode,name=NameNodeStatus | jq -r .beans[0].State)
if [[ $? -ne 0 || "$nn_state" != "active" ]]; then
	echo "NameNode port not reachable or service not running"
	cluster_status="unhealthy"
fi

livy_state=$(curl -s --connect-timeout 5 --max-time 10 http://$hostname:8998/sessions)
if [[ $? -ne 0 ]]; then
	echo "Livy port not reachable"
	cluster_status="unhealthy"
fi

cluster_name=$(aws emr describe-cluster --cluster-id $cluster_id | jq -r ".Cluster.Name")

update_target_groups() {
	new_master_ip=$1
	current_master_ip=$2
	current_az=$3

	nlb_arn=$(aws elbv2 describe-load-balancers --query "LoadBalancers[?DNSName==\`$hostname\`].[LoadBalancerArn]" --output text)
	target_groups=$(aws elbv2 describe-target-groups --load-balancer-arn $nlb_arn --query "TargetGroups[*].TargetGroupArn" --output text)
	IFS=" " read -a tg_array <<<$target_groups
	for tg in "${tg_array[@]}"; do
		echo "Registering new EMR master IP with target group $tg"
		aws elbv2 register-targets --target-group-arn $tg --targets Id=$new_master_ip,AvailabilityZone=all

		echo "De-registering old/unhealthy EMR master IP from target group $tg"
		aws elbv2 deregister-targets --target-group-arn $tg --targets Id=$current_master_ip,AvailabilityZone=all
	done
}

if [[ $cluster_status == "unhealthy" ]]; then
	echo "Cluster status is $cluster_status, creating new EMR cluster"
	current_az=$(aws emr describe-cluster --cluster-id $cluster_id | jq -r ".Cluster.Ec2InstanceAttributes.Ec2AvailabilityZone")
	new_az=$(aws ec2 describe-availability-zones --output json --filters "Name=region-name,Values=$region" --query "AvailabilityZones[?ZoneName!=\`$current_az\`].ZoneName|[0]" --output=text)
	current_master_ip=$(aws emr list-instances --cluster-id $cluster_id --instance-group-types MASTER --query "Instances[*].PrivateIpAddress" --output text)
	echo "Current/unhealthy cluster id $cluster_id, cluster name $cluster_name,AZ $current_az, Master private ip $current_master_ip"

	echo "Creating new EMR cluster in $new_az"
	emr_op=$(aws emr create-cluster \
		--name "$cluster_name-$new_az" \
		--release-label emr-6.4.0 \
		--applications Name=Spark Name=Livy \
		--ec2-attributes "AvailabilityZone=$new_az" \
		--instance-groups InstanceGroupType=MASTER,InstanceCount=1,InstanceType=m4.large InstanceGroupType=CORE,InstanceCount=1,InstanceType=m4.large \
		--use-default-role \
		--region $region)

	new_cluster_id=$(echo $emr_op | jq -r ".ClusterId")

	#wait for cluster provisioning to get master ip address
	sleep 2m

	new_master_ip=$(aws emr list-instances --cluster-id $new_cluster_id --instance-group-types MASTER --query "Instances[*].PrivateIpAddress" --output text)
	echo "New EMR cluster id $new_cluster_id and Master node IP $new_master_ip"

	echo "Terminating unhealthy cluster $cluster_id/$cluster_name in $current_az"
	aws emr modify-cluster-attributes --cluster-id $cluster_id --no-termination-protected
	aws emr terminate-clusters --cluster-ids $cluster_id

	echo "Register new EMR master IP address with NLB target groups and de-register unhealthy EMR master"
	update_target_groups $new_master_ip $current_master_ip $current_az
else
	echo "Current cluster $cluster_id/$cluster_name is healthy"
fi

Summary

In this post, we shared some solutions and considerations to improve DR implementation using Amazon EMR on Amazon EC2, Network Load Balancer, and Amazon MWAA. Based on your use case, you can determine the type of DR strategy you want to deploy. We have provided the steps required to create the necessary environments and set up a successful DR strategy.

For more details about the systems and processes described in this post, refer to the following:


About the Author

Bharat Gamini is a Data Architect focused on Big Data & Analytics at Amazon Web Services. He helps customers architect and build highly scalable, robust and secure cloud-based analytical solutions on AWS.
Simplify and optimize Python package management for AWS Glue PySpark jobs with AWS CodeArtifact

Post Syndicated from Ashok Padmanabhan original https://aws.amazon.com/blogs/big-data/simplify-and-optimize-python-package-management-for-aws-glue-pyspark-jobs-with-aws-codeartifact/

Data engineers use various Python packages to meet their data processing requirements while building data pipelines with AWS Glue PySpark Jobs. Languages like Python and Scala are commonly used in data pipeline development. Developers can take advantage of their open-source packages or even customize their own to make it easier and faster to perform use cases, such as data manipulation and analysis. However, managing standardized packages can be cumbersome with multiple teams using different versions of packages, installing non-approved packages, and causing duplicate development effort due to the lack of visibility of what is available at the enterprise level. This can be especially challenging in large enterprises with multiple data engineering teams.

ETL Developers have requirements to use additional packages for their AWS Glue ETL jobs. With security being job zero for customers, many will restrict egress traffic from their VPC to the public internet, and they need a way to manage the packages used by applications including their data processing pipelines.

Our proposed solution will enable you with network egress restrictions to manage packages centrally with AWS CodeArtifact and use their favorite libraries in their AWS Glue ETL PySpark code. In this post, we’ll describe how CodeArtifact can be used for managing packages and modules for AWS Glue ETL jobs, and we’ll demo a solution using Glue PySpark jobs that run within VPC Subnets that have no internet access.

Solution overview

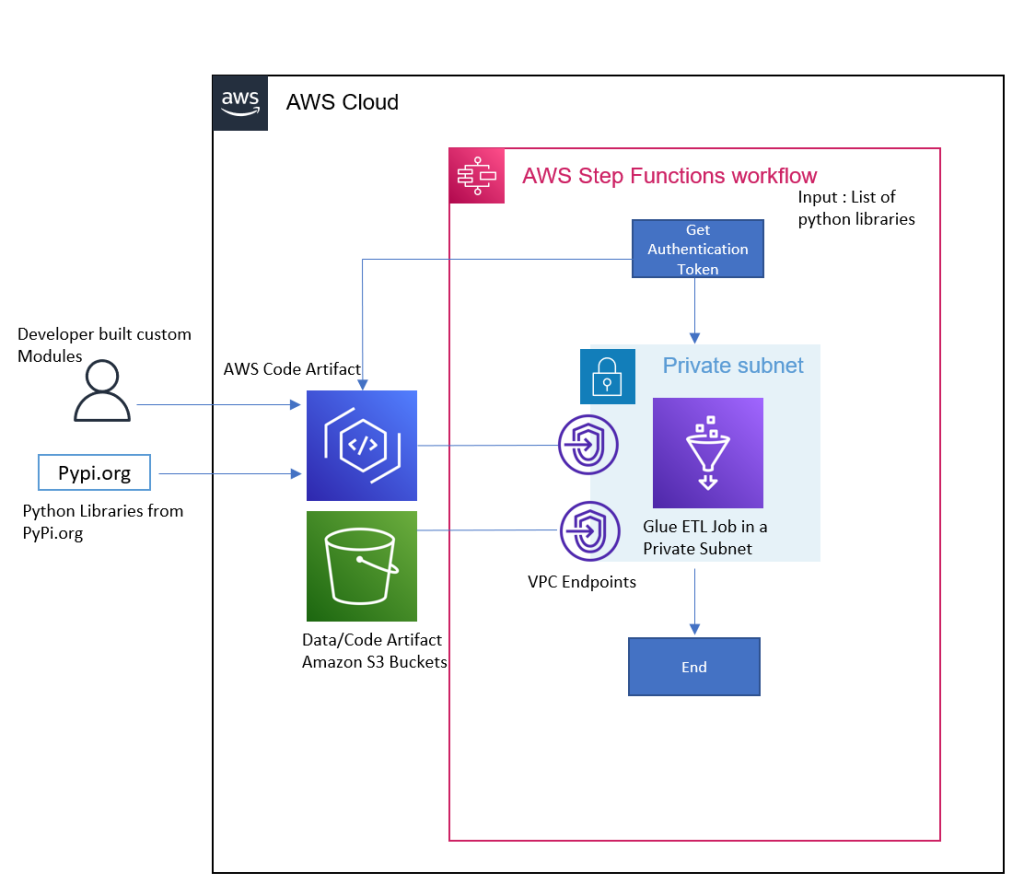
The solution uses CodeArtifact as a tool to make it easier for organizations of any size to securely store, publish, and share software packages used in their ETL with AWS Glue. VPC Endpoints will be enabled for CodeArtifact and Glue to enable private link connections. AWS Step Functions makes it easy to coordinate the orchestration of components used in the data processing pipeline. Native integrations with both CodeArtifact and AWS Glue enable the workflow to both authenticate the request to CodeArtifact and start the AWS Glue ETL job.

The following architecture shows an implementation of a solution using AWS Glue, CodeArtifact, and Step Functions to use additional Python modules without egress internet access. The solution is deployed using AWS Cloud Development Kit (AWS CDK), an open-source software development framework to define your cloud application resources using familiar programming languages.

Solution Architecture for the blog post

Fig 1: Architecture Diagram for the Solution

To illustrate how to set up this architecture, we’ll walk you through the following steps:

  1. Deploying an AWS CDK stack to provision the following AWS Resources
    1. CodeArtifact
    2. An AWS Glue job
    3. Step Functions workflow
    4. Amazon Simple Storage Service (Amazon S3) bucket
    5. A VPC with a private Subnet and VPC Endpoints to Amazon S3 and CodeArtifact
  2. Validate the Deployment.
  3. Run a Sample Workflow – This workflow will run an AWS Glue PySpark job that uses a custom Python library, and an upgraded version of boto3.
  4. Cleaning up your resources.

Prerequisites

Make sure that you complete the following steps as prerequisites:

The solution

Launching your AWS CDK Stack

Step 1: Using your device’s command line, check out our Git repository to a local directory on your device:

git clone https://github.com/aws-samples/python-lib-management-without-internet-for-aws-glue-in-private-subnets.git

Step 2: Change directories to the new directory Amazon S3 script location:

cd python-lib-management-without-internet-for-aws-glue-in-private-subnets/scripts/s3

Step 3: Download the following CSV, which contains New York City Taxi and Limousine Commission (TLC) Trip weekly trips. This will serve as the input source for the AWS Glue Job:

aws s3 cp s3://nyc-tlc/misc/FOIL_weekly_trips_apps.csv .

Step 4: Change the directories to the path where the app.py file is located (in reference to the previous step, execute the following step):

cd ../..

Step 5: Create a virtual environment:

macOS/Linux:
python3 -m venv .env

Windows:
python -m venv .env

Step 6: Activate the virtual environment after the init process completes and the virtual environment is created:

macOS/Linux:
source .env/bin/activate

Windows:
.env\Scripts\activate.bat

Step 7: Install the required dependencies:

pip3 install -r requirements.txt

Step 8: Make sure that your AWS profile is setup along with the region that you want to deploy as mentioned in the prerequisite. Synthesize the templates. AWS CDK apps use code to define the infrastructure, and when run they produce or “synthesize” a CloudFormation template for each stack defined in the application:

cdk synthesize

Step 9: BootStrap the cdk app using the following command:

cdk bootstrap aws://<AWS_ACCOUNTID>/<AWS_REGION>

Replace the place holder AWS_ACCOUNTID and AWS_REGION with your AWS account ID and the region to be deployed.

This step provisions the initial resources, including an Amazon S3 bucket for storing files and IAM roles that grant permissions needed to perform deployments.

Step 10: Deploy the solution. By default, some actions that could potentially make security changes require approval. In this deployment, you’re creating an IAM role. The following command overrides the approval prompts, but if you would like to manually accept the prompts, then omit the --require-approval never flag:

cdk deploy "*" --require-approval never

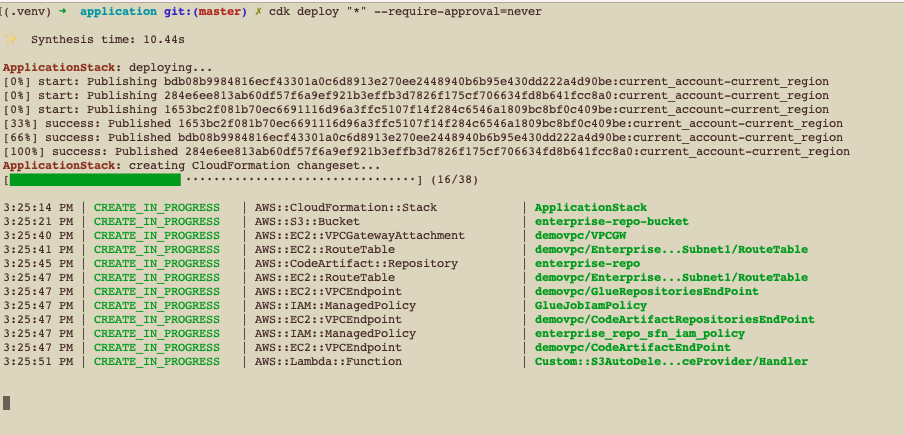
While the AWS CDK deploys the CloudFormation stacks, you can follow the deployment progress in your terminal:

AWS CDK Deployment progress in terminal

Fig 2: AWS CDK Deployment progress in terminal

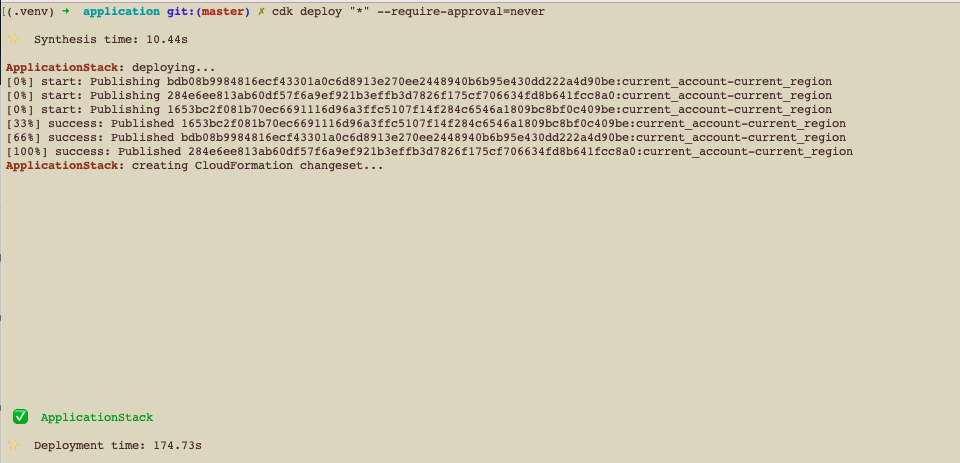
Once the deployment is successful, you’ll see the successful status as follows:

AWS CDK Deployment completion success

Fig 3: AWS CDK Deployment completion success

Step 11: Log in to the AWS Console, go to CloudFormation, and see the output of the ApplicationStack stack:

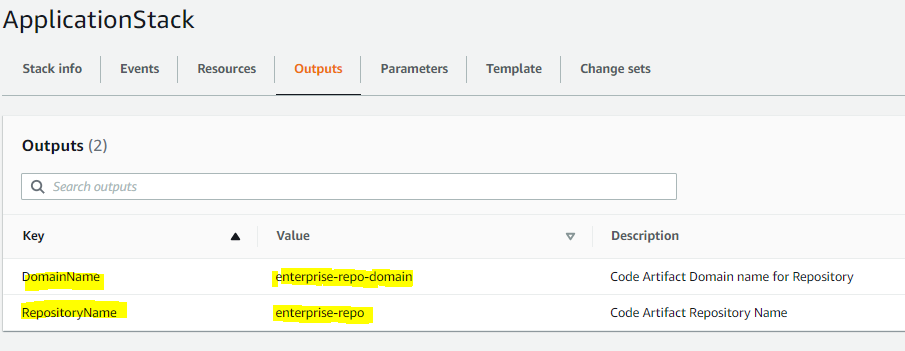
AWS CloudFormation stack output

Fig 4: AWS CloudFormation stack output

Note the values of the DomainName and RepositoryName variables. We’ll use them in the next step to upload our artifacts

Step 12: We will upload a custom library into the repo that we created. This will be used by our Glue ETL job.

  • Install twine using pip:
python3 -m pip install twine

The custom python package glueutils-0.2.0.tar.gz can be found under this folder of the cloned repo:

cd scripts/custom_glue_library
  • Configure twine with the login command (additional details here ). Refer to step 11 for the DomainName and RepositoryName from the CloudFormation output:
aws codeartifact login --tool twine --domain <DomainName> --domain-owner <AWS_ACCOUNTID> --repository <RepositoryName>
  • Publish Python package assets:
twine upload --repository codeartifact glueutils-0.2.0.tar.gz
Python package publishing using twine

Fig 5: Python package publishing using twine

Validate the Deployment

The AWS CDK stack will deploy the following AWS resources:

  1. Amazon Virtual Private Cloud (Amazon VPC)
    1. One Private Subnet
  2. AWS CodeArtifact
    1. CodeArtifact Repository
    2. CodeArtifact Domain
    3. CodeArtifact Upstream Repository
  3. AWS Glue
    1. AWS Glue Job
    2. AWS Glue Database
    3. AWS Glue Connection
  4. AWS Step Function
  5. Amazon S3 Bucket for AWS CDK and also for storing scripts and CSV file
  6. IAM Roles and Policies
  7. Amazon Elastic Compute Cloud (Amazon EC2) Security Group

Step 1: Browse to the AWS account and region via the AWS Console to which the resources are deployed.

Step 2: Browse the Subnet page (https://<region> .console.aws.amazon.com/vpc/home?region=<region> #subnets:) (*Replace region with actual AWS Region to which your resources are deployed)

Step 3: Select the Subnet with name as ApplicationStack/enterprise-repo-vpc/Enterprise-Repo-Private-Subnet1

Step 4: Select the Route Table and validate that there are no Internet Gateway or NAT Gateway for routes to Internet, and that it’s similar to the following image:

Route table validation

Fig 6: Route table validation

Step 5: Navigate to the CodeArtifact console and review the repositories created. The enterprise-repo is your local repository, and pypi-store is the upstream repository connected to the PyPI, providing artifacts from pypi.org.

AWS CodeArifact repositories created

Fig 7: AWS CodeArifact repositories created

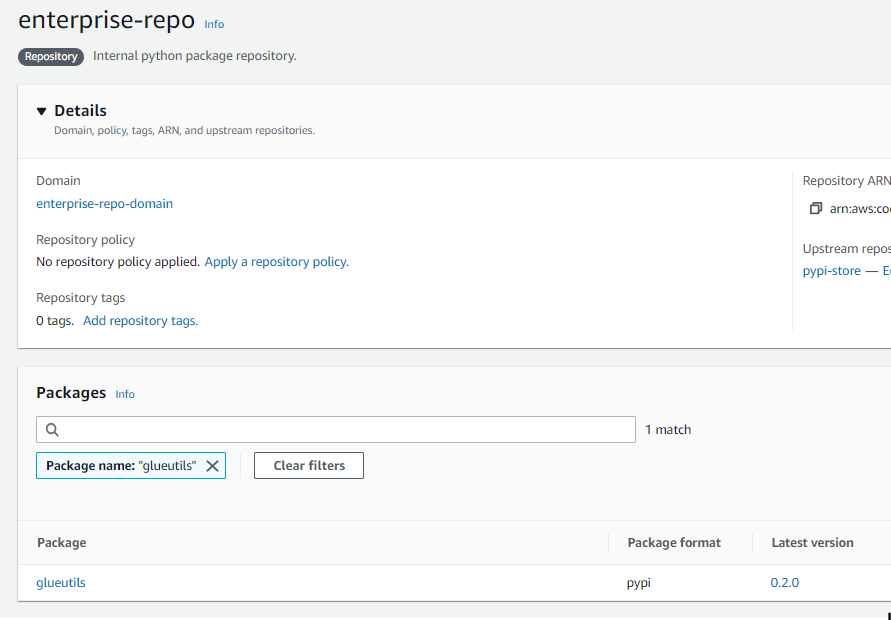
Step 6: Navigate to enterprise-repo and search for glueutils. This is the custom python package that we published.

AWS CodeArifact custom python package published

Fig 8: AWS CodeArifact custom python package published

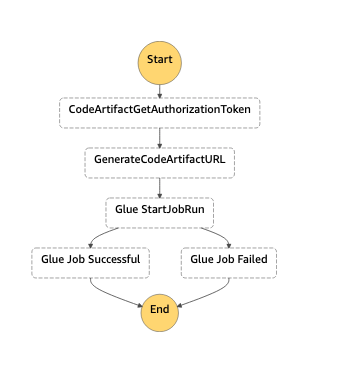
Step 7: Navigate to Step Functions Console and review the enterprise-repo-step-function as follows:

AWS Step Functions workflow

Fig 9: AWS Step Functions workflow

The diagram shows how the Step Functions workflow will orchestrate the pattern.

  1. The first step CodeArtifactGetAuthorizationToken calls the getAuthorizationToken API to generate a temporary authorization token for accessing repositories in the domain (this token is valid for 15 mins.).
  2. The next step GenerateCodeArtifactURL takes the authorization token from the response and generates the CodeArtifact URL.
  3. Then, this will move into the GlueStartJobRun state, which makes a synchronous API call to run the AWS Glue job.

Step 8: Navigate to the AWS Glue Console and select the Jobs tab, then select enterprise-repo-glue-job.

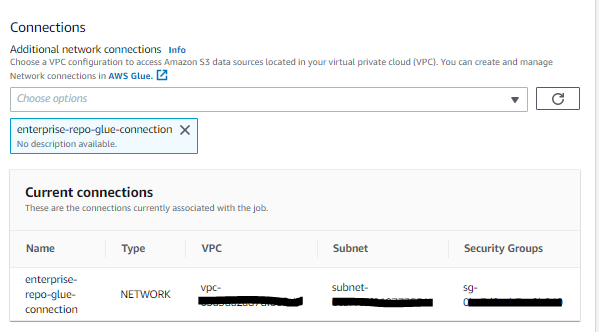
The AWS Glue job is created with the following script and AWS Glue Connection enterprise-repo-glue-connection. The AWS Glue connection is a Data Catalog object that enables the job to connect to sources and APIs from within the VPC. The network type connection runs the job from within the private subnet to make requests to Amazon S3 and CodeArtifact over the VPC endpoint connection. This enables the job to run without any traffic through the internet.

Note the connections section in the AWS Glue PySpark Job, which makes the Glue job run on the private subnet in the VPC provisioned.

AWS Glue network connections

Fig 10: AWS Glue network connections

The job takes an Amazon S3 bucket, Glue Database, Python Job Installer Option, and Additional Python Modules as job parameters. The parameters --additional-python-modules and --python-modules-installer-option are passed to install the selected Python module from a PyPI repository hosted in AWS CodeArtifact.

The script itself first reads the Amazon S3 input path of the taxi data in the CSV format. A light transformation to sum the total trips by year, week, and app is performed. Then the output is written to an Amazon S3 path as parquet . A partitioned table in the AWS Glue Data Catalog will either be created or updated if it already exists .

You can find the Glue PySpark script here.

Run a sample workflow

The following steps will demonstrate how to run a sample workflow:

Step 1: Navigate to the Step Functions Console and select the enterprise-repo-step-function.

Step 2: Select Start execution and input the following: We’re including the glueutils and latest boto3 libraries as part of the job run. It is always recommended to pin your python dependencies to avoid any breaking change due to a future version of dependency . In the below example, the latest available version of boto3, and the 0.2.0 version of glueutils will be installed. To pin it to a specific release you may add  boto3==1.24.2   (Current latest release at the time of publishing this post).

{"pythonmodules": "boto3,glueutils==0.2.0"}

Step 3: Select Start execution and wait until Execution Status is Succeeded. This may take a few minutes.

Step 4: Navigate to the CodeArtifact Console to review the enterprise-repo repository. You’ll see the cached PyPi packages and all of their dependencies pulled down from PyPi.

Step 5: In the Glue Console under the Runs section of the enterprise-glue-job, you’ll see the parameters passed:

Fig 11 : AWS Glue job execution history

Fig 11 : AWS Glue job execution history

Note the --index-url which was passed as a parameter to the glue ETL job. The token is valid only for 15 minutes.

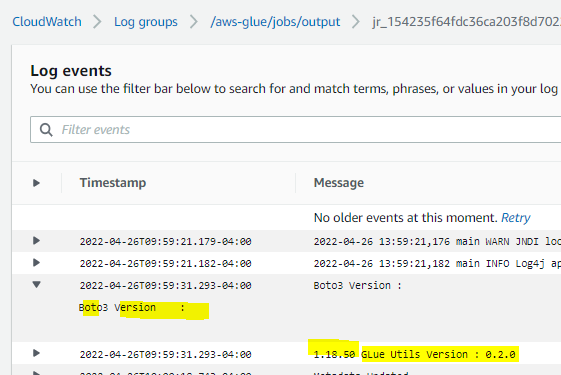
Step 6: Navigate to the Amazon CloudWatch Console and go to the /aws/glue-jobs log group to verify that the packages were installed from the local repo.

You will see that the 2 package names passed as parameters are installed with the corresponding versions.

Fig 12 : Amazon CloudWatch logs details for the Glue job

Fig 12 : Amazon CloudWatch logs details for the Glue job

Step 7: Navigate to the Amazon Athena console and select Query Editor.

Step 8: Run the following query to validate the output of the AWS Glue job:

SELECT year, app, SUM(total_trips) as sum_of_total_trips 
FROM 
"codeartifactblog_glue_db"."taxidataparquet" 
GROUP BY year, app;

Clean up

Make sure that you clean up all of the other AWS resources that you created in the AWS CDK Stack deployment. You can delete these resources via the AWS CDK Destroy command as follows or the CloudFormation console.

To destroy the resources using AWS CDK, follow these steps:

  1. Follow Steps 1-6 from the ‘Launching your CDK Stack’ section.
  2. Destroy the app by executing the following command:
    cdk destroy

Conclusion

In this post, we demonstrated how CodeArtifact can be used for managing Python packages and modules for AWS Glue jobs that run within VPC Subnets that have no internet access. We also demonstrated how the versions of existing packages can be updated (i.e., boto3) and a custom Python library (glueutils) that is developed locally is also managed through CodeArtifact.

This post enables you to use your favorite Python packages with AWS Glue ETL PySpark jobs by modifying the input to the AWS StepFunctions workflow (Step 2 in the Run a Sample workflow section).


About the Authors

Bret Pontillo is a Data & ML Engineer with AWS Professional Services. He works closely with enterprise customers building data lakes and analytical applications on the AWS platform. In his free time, Bret enjoys traveling, watching sports, and trying new restaurants.

Gaurav Gundal is a DevOps consultant with AWS Professional Services, helping customers build solutions on the customer platform. When not building, designing, or developing solutions, Gaurav spends time with his family, plays guitar, and enjoys traveling to different places.

Ashok Padmanabhan is a Sr. IOT Data Architect with AWS Professional Services, helping customers build data and analytics platform and solutions. When not helping customers build and design data lakes, Ashok enjoys spending time at the beach near his home in Florida.

A new Spark plugin for CPU and memory profiling

Post Syndicated from Bo Xiong original https://aws.amazon.com/blogs/devops/a-new-spark-plugin-for-cpu-and-memory-profiling/

Introduction

Have you ever wondered if there are low-hanging optimization opportunities to improve the performance of a Spark app? Profiling can help you gain visibility regarding the runtime characteristics of the Spark app to identify its bottlenecks and inefficiencies. We’re excited to announce the release of a new Spark plugin that enables profiling for JVM based Spark apps via Amazon CodeGuru. The plugin is open sourced on GitHub and published to Maven.

Walkthrough

This post shows how you can onboard this plugin with two steps in under 10 minutes.

  • Step 1: Create a profiling group in Amazon CodeGuru Profiler and grant permission to your Amazon EMR on EC2 role, so that profiler agents can emit metrics to CodeGuru. Detailed instructions can be found here.
  • Step 2: Reference codeguru-profiler-for-spark when submitting your Spark job, along with PROFILING_CONTEXT and ENABLE_AMAZON_PROFILER defined.

Prerequisites

Your app is built against Spark 3 and run on Amazon EMR release 6.x or newer. It doesn’t matter if you’re using Amazon EMR on Amazon Elastic Compute Cloud (Amazon EC2) or on Amazon Elastic Kubernetes Service (Amazon EKS).

Illustrative Example

For the purposes of illustration, consider the following example where profiling results are collected by the plugin and emitted to the “CodeGuru-Spark-Demo” profiling group.

spark-submit \
--master yarn \
--deploy-mode cluster \
--class \
--packages software.amazon.profiler:codeguru-profiler-for-spark:1.0 \
--conf spark.plugins=software.amazon.profiler.AmazonProfilerPlugin \
--conf spark.executorEnv.PROFILING_CONTEXT="{\\\"profilingGroupName\\\":\\\"CodeGuru-Spark-Demo\\\"}" \
--conf spark.executorEnv.ENABLE_AMAZON_PROFILER=true \
--conf spark.dynamicAllocation.enabled=false \t

An alternative way to specify PROFILING_CONTEXT and ENABLE_AMAZON_PROFILER is under the yarn-env.export classification for instance groups in the Amazon EMR web console. Note that PROFILING_CONTEXT, if configured in the web console, must escape all of the commas on top of what’s for the above spark-submit command.

[
  {
    "classification": "yarn-env",
    "properties": {},
    "configurations": [
      {
        "classification": "export",
        "properties": {
          "ENABLE_AMAZON_PROFILER": "true",
          "PROFILING_CONTEXT": "{\\\"profilingGroupName\\\":\\\"CodeGuru-Spark-Demo\\\"\\,\\\"driverEnabled\\\":\\\"true\\\"}"
        },
        "configurations": []
      }
    ]
  }
]

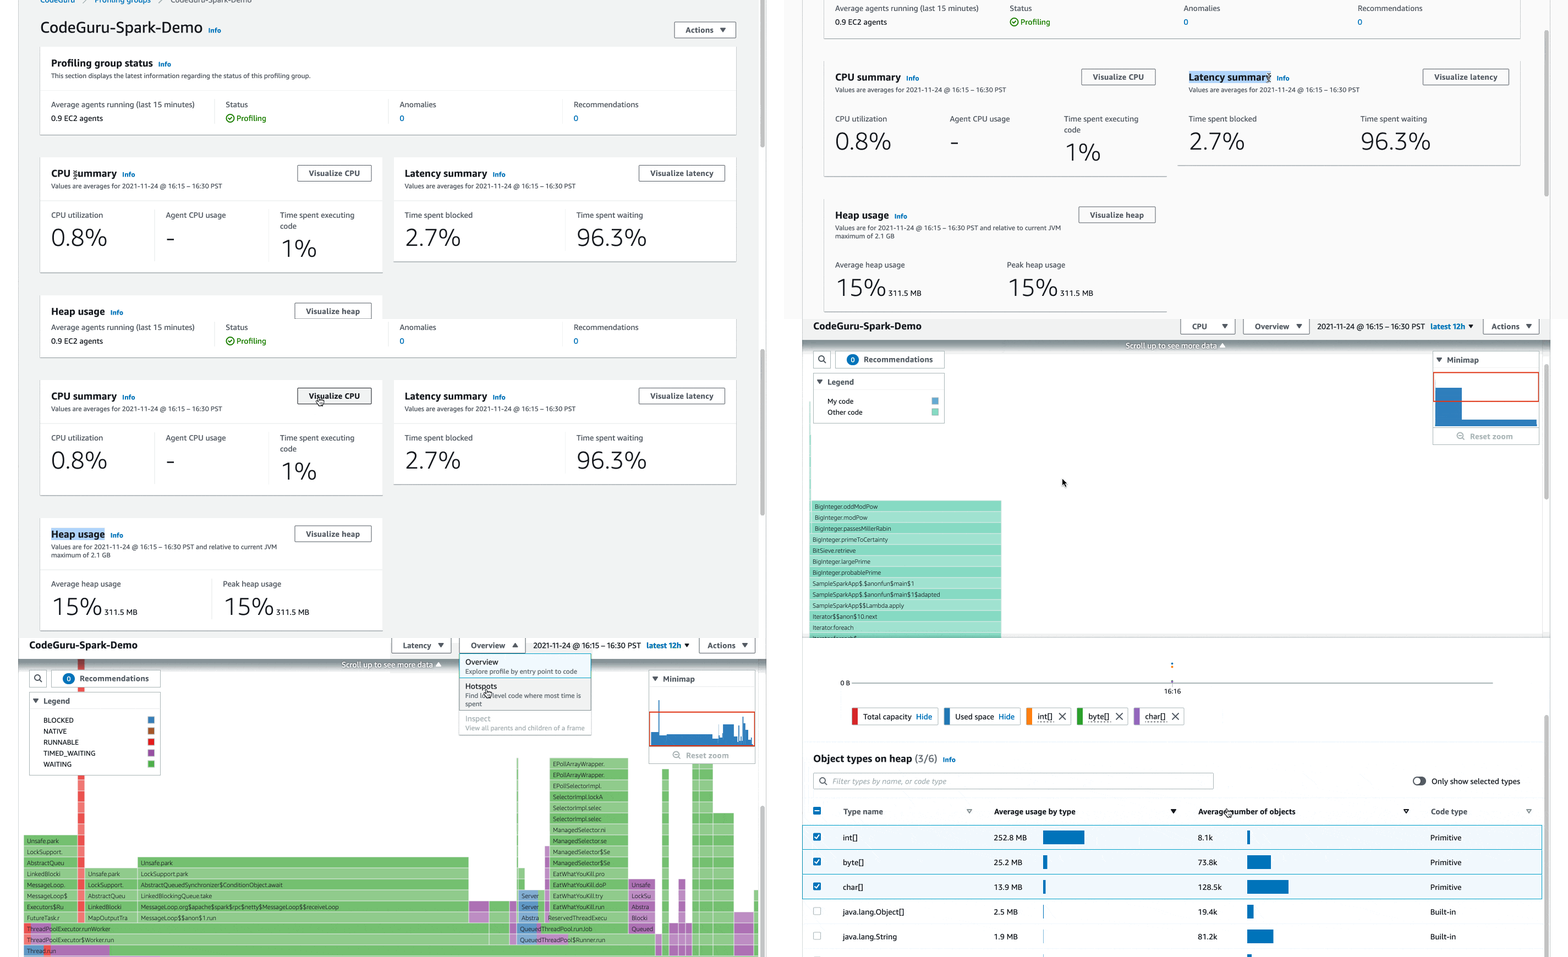
Once the job above is launched on Amazon EMR, profiling results should show up in your CodeGuru web console in about 10 minutes, similar to the following screenshot. Internally, it has helped us identify issues, such as thread contentions (revealed by the BLOCKED state in the latency flame graph), and unnecessarily create AWS Java clients (revealed by the CPU Hotspots view).

Go to your profiling group under the Amazon CodeGuru web console. Click the “Visualize CPU” button to render a flame graph displaying CPU usage. Switch to the latency view to identify latency bottlenecks, and switch to the heap summary view to identify objects consuming most memory.

Troubleshooting

To help with troubleshooting, use a sample Spark app provided in the plugin to check if everything is set up correctly. Note that the profilingGroupName value specified in PROFILING_CONTEXT should match what’s created in CodeGuru.

spark-submit \
--master yarn \
--deploy-mode cluster \
--class software.amazon.profiler.SampleSparkApp \
--packages software.amazon.profiler:codeguru-profiler-for-spark:1.0 \
--conf spark.plugins=software.amazon.profiler.AmazonProfilerPlugin \
--conf spark.executorEnv.PROFILING_CONTEXT="{\\\"profilingGroupName\\\":\\\"CodeGuru-Spark-Demo\\\"}" \
--conf spark.executorEnv.ENABLE_AMAZON_PROFILER=true \
--conf spark.yarn.appMasterEnv.PROFILING_CONTEXT="{\\\"profilingGroupName\\\":\\\"CodeGuru-Spark-Demo\\\",\\\"driverEnabled\\\":\\\"true\\\"}" \
--conf spark.yarn.appMasterEnv.ENABLE_AMAZON_PROFILER=true \
--conf spark.dynamicAllocation.enabled=false \
/usr/lib/hadoop-yarn/hadoop-yarn-server-tests.jar

Running the command above from the master node of your EMR cluster should produce logs similar to the following:

21/11/21 21:27:21 INFO Profiler: Starting the profiler : ProfilerParameters{profilingGroupName='CodeGuru-Spark-Demo', threadSupport=BasicThreadSupport (default), excludedThreads=[Signal Dispatcher, Attach Listener], shouldProfile=true, integrationMode='', memoryUsageLimit=104857600, heapSummaryEnabled=true, stackDepthLimit=1000, samplingInterval=PT1S, reportingInterval=PT5M, addProfilerOverheadAsSamples=true, minimumTimeForReporting=PT1M, dontReportIfSampledLessThanTimes=1}
21/11/21 21:27:21 INFO ProfilingCommandExecutor: Profiling scheduled, sampling rate is PT1S
...
21/11/21 21:27:23 INFO ProfilingCommand: New agent configuration received : AgentConfiguration(AgentParameters={MaxStackDepth=1000, MinimumTimeForReportingInMilliseconds=60000, SamplingIntervalInMilliseconds=1000, MemoryUsageLimitPercent=10, ReportingIntervalInMilliseconds=300000}, PeriodInSeconds=300, ShouldProfile=true)
21/11/21 21:32:23 INFO ProfilingCommand: Attempting to report profile data: start=2021-11-21T21:27:23.227Z end=2021-11-21T21:32:22.765Z force=false memoryRefresh=false numberOfTimesSampled=300
21/11/21 21:32:23 INFO javaClass: [HeapSummary] Processed 20 events.
21/11/21 21:32:24 INFO ProfilingCommand: Successfully reported profile

Note that the CodeGuru Profiler agent uses a reporting interval of five minutes. Therefore, any executor process shorter than five minutes won’t be reflected by the profiling result. If the right profiling group is not specified, or it’s associated with a wrong EC2 role in CodeGuru, then the log will show a message similar to “CodeGuruProfilerSDKClient: Exception while calling agent orchestration” along with a stack trace including a 403 status code. To rule out any network issues (e.g., your EMR job running in a VPC without an outbound gateway or a misconfigured outbound security group), then you can remote into an EMR host and ping the CodeGuru endpoint in your Region (e.g., ping codeguru-profiler.us-east-1.amazonaws.com).

Cleaning up

To avoid incurring future charges, you can delete the profiling group configured in CodeGuru and/or set the ENABLE_AMAZON_PROFILER environment variable to false.

Conclusion

In this post, we describe how to onboard this plugin with two steps. Consider to give it a try for your Spark app? You can find the Maven artifacts here. If you have feature requests, bug reports, feedback of any kind, or would like to contribute, please head over to the GitHub repository.

Author:

Bo Xiong

Bo Xiong is a software engineer with Amazon Ads, leveraging big data technologies to process petabytes of data for billing and reporting. His main interests include performance tuning and optimization for Spark on Amazon EMR, and data mining for actionable business insights.