Post Syndicated from Andy Klein original https://www.backblaze.com/blog/backblaze-drive-stats-for-2024/
As of December 31, 2024, we had 305,180 drives under management. Of that number, there were 4,060 boot drives and 301,120 data drives. This report will focus on those data drives as we review the Q4 2024 annualized failure rates (AFR), the 2024 failure rates, and the lifetime failure rates for the drive models in service as of the end of 2024. Along the way, we’ll share our observations and insights on the data presented, and, as always, we look forward to you doing the same in the comments section at the end of the post.
Sign up for the Drive Stats webinar
Tune in to ask those questions you’ve had spinning ‘round your head like so many drives, and meet the new Drive Stats team—Stephanie Doyle and David Johnson of Backblaze Blog fame. Yes, you heard that right: It’s my last Drive Stats before I head off to retirement (but more on that later in the report). Read on, and sign up, for analysis and insights from the 2024 report.

Q4 2024 hard drive failure rates
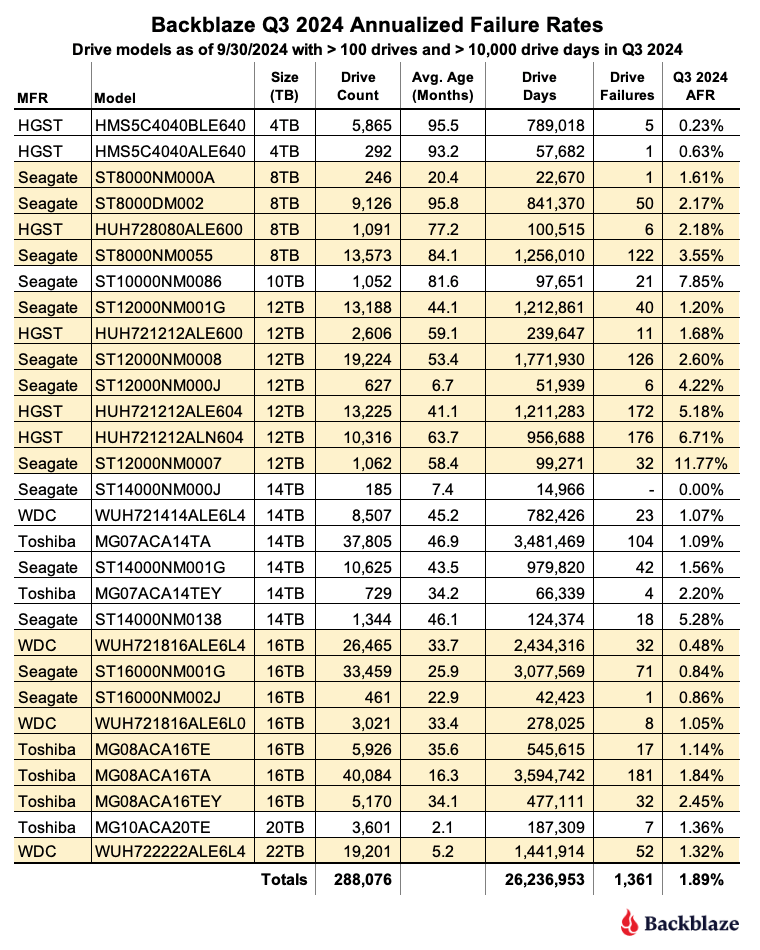
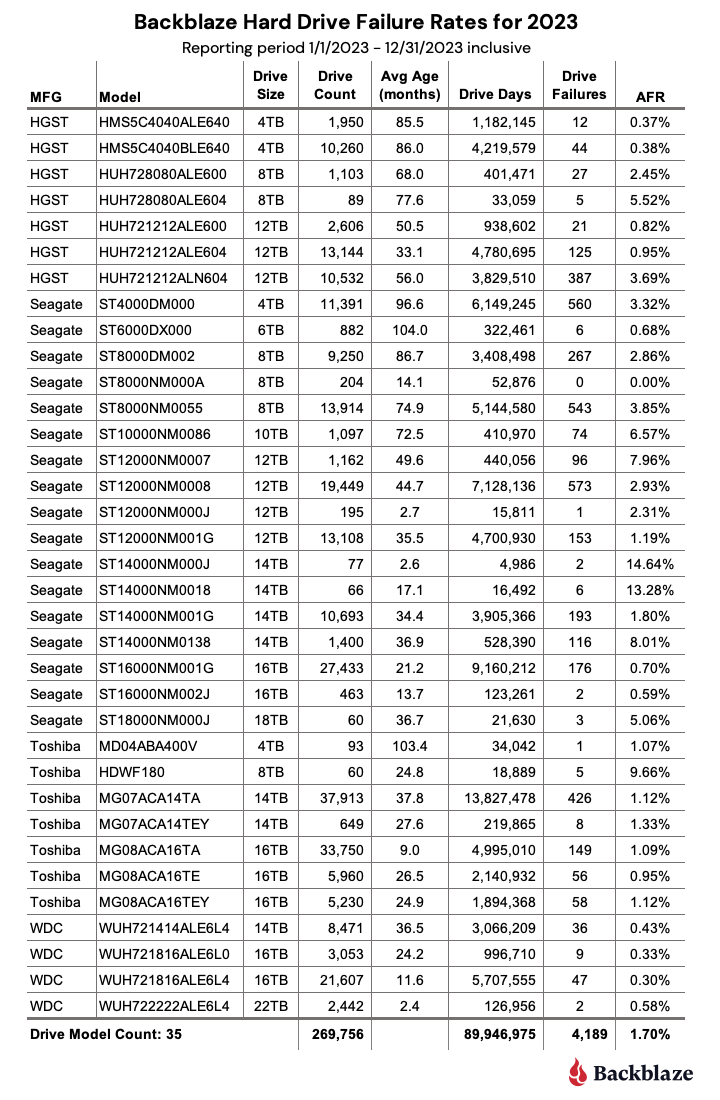
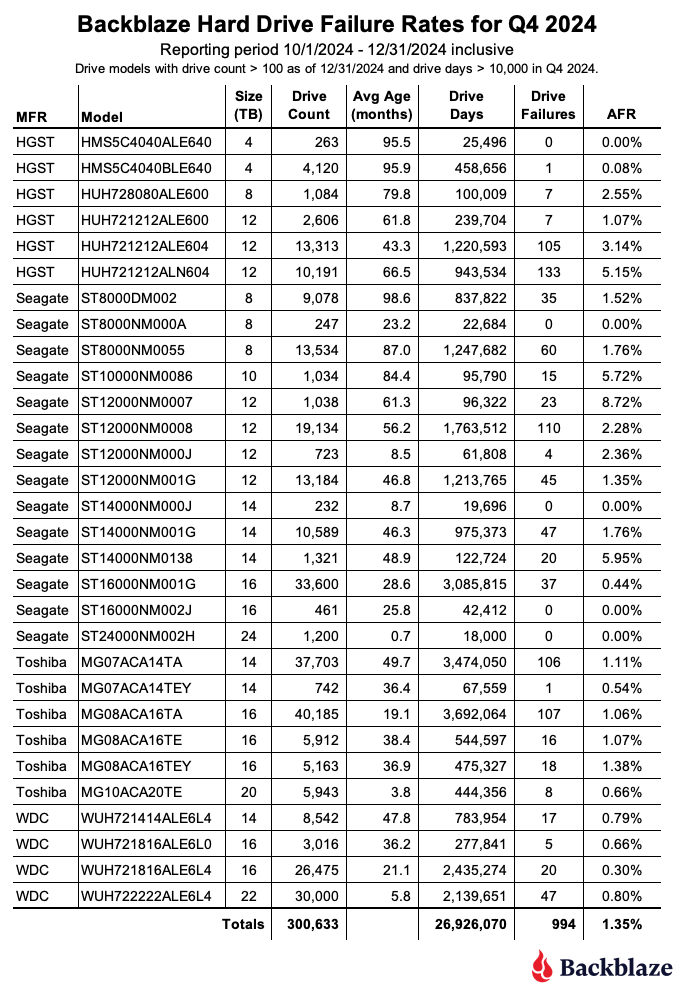
As of the end of 2024, Backblaze was monitoring 301,120 hard drives used to store data. For our evaluation, we removed from consideration 487 drives, as they did not meet the criteria to be included. We’ll discuss the criteria we used in the next section of this report. Removing these drives leaves us with 300,633 hard drives to analyze. The table below shows the annualized failure rates for Q4 2024 for this collection of drives.
Notes and observations
- 24TB drives are here. Seagate 24TB drives (model: ST24000NM002H) arrived in early December. The 1,200 drives filled one Backblaze Vault with no failed drives through the end of Q4. The 24TB Seagate drives join the 20TB Toshiba and 22TB WDC drive models in the 20-plus capacity club as we continue to dramatically increase storage capacity while optimizing existing storage server space.
- Zero failures for the quarter. Five drive models had zero failures for the quarter starting with the 24TB Seagate drive model noted above. The others are the 4TB HGST (model: HMS5C4040ALE640), the 8TB Seagate (model: ST8000NM000A), the 14TB Seagate (model: ST14000NM000J), and the 16TB Seagate (model: ST16000NM002J). All of the zeroes come with the caveat of having a relatively small number of drives and drive days, but zero failures in a quarter is always a good thing.
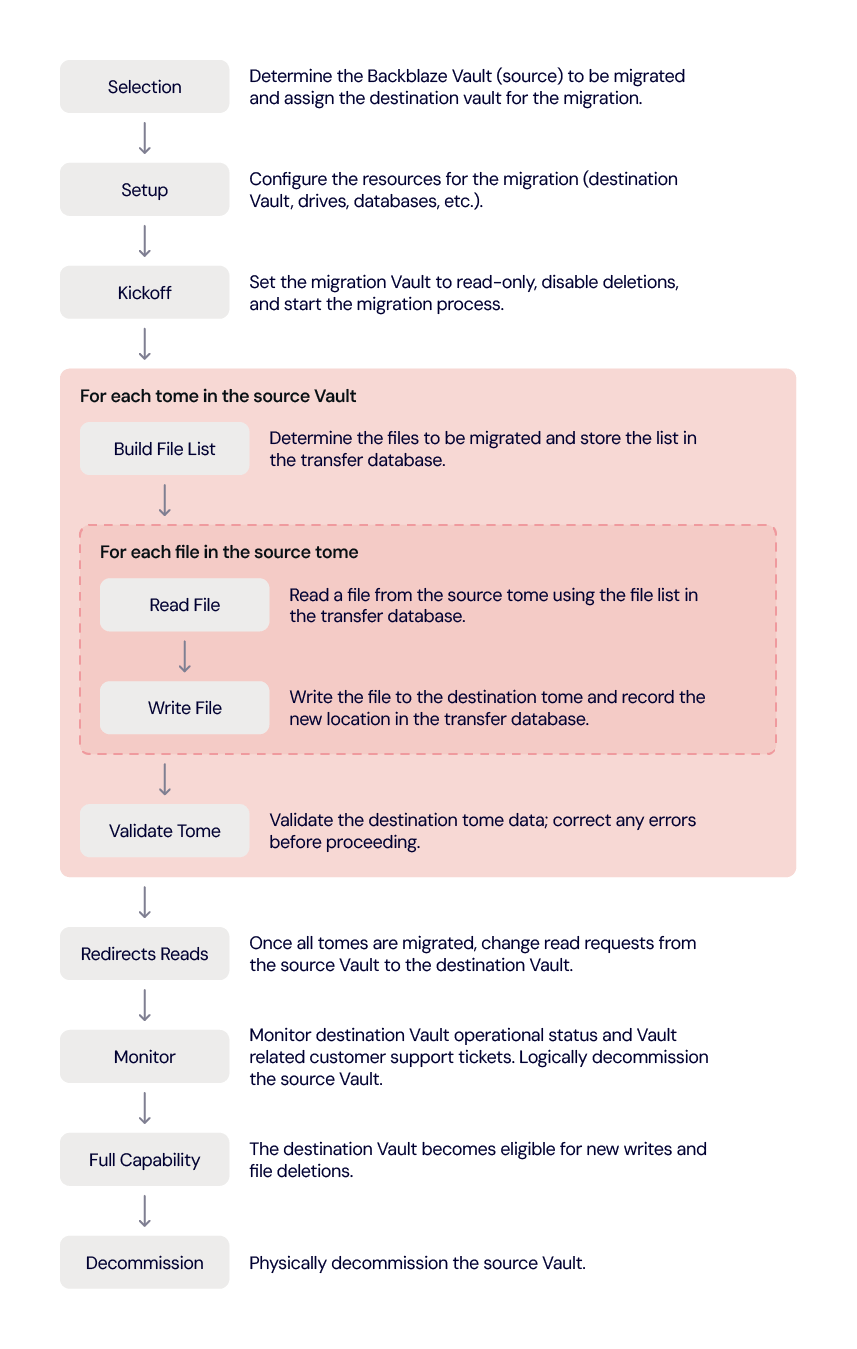
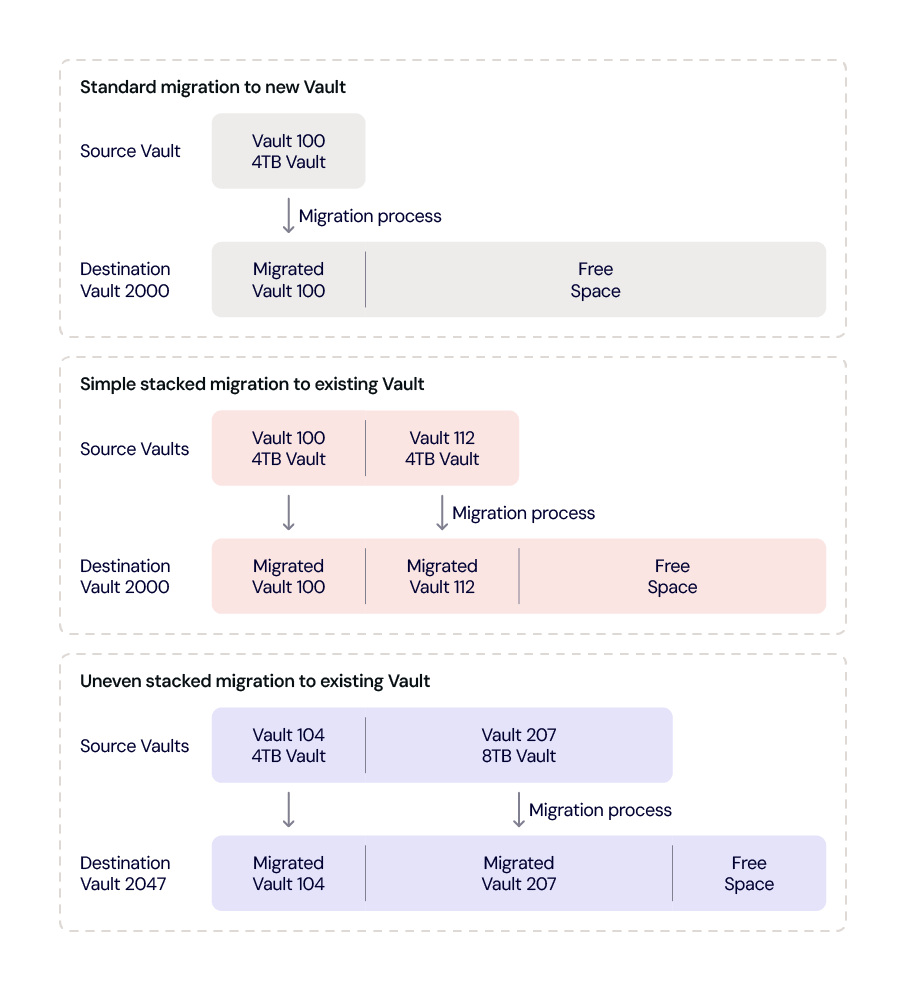
- The 4TB drives are nearly extinct. The 4TB drive count decreased by another 1,774 drives in Q4. (I discussed exactly how we migrate them in more detail if you want to dig in.) The remaining ~4,000 drives should be gone by the end of Q1 2025. They will be replaced by the incoming 20TB, 22TB, and 24TB drives. It should be noted that out of the 4TB drives in operation in Q4, only one failed, so those 20-plus TB drives have a lot to live up to from a failure perspective.
- The quarterly failure rate is down. The AFR for Q4 dropped from 1.89% in Q3 to 1.35% in Q4. While all drive sizes delivered some improvement from Q3 to Q4, one of the primary drivers is the addition of over 14,000 new 20-plus TB drives. As a group, these drives delivered an AFR of 0.77% for the quarter.
Drive model criteria
We noted earlier we removed 487 drives from consideration when we produced the table above covering Q4 2024. There are two primary reasons we did not consider these drive models.
- Testing. These are drives of a given model that we monitor and collect Drive Stats data on, but are not considered production drives at this time. For example, drives undergoing certification testing to determine if they are performant enough for our environment are not included in our Drive Stats calculations.
- Insufficient data points. When we calculate the annualized failure rate for a drive model for a given period of time (quarterly, annual, or lifetime), we want to ensure we have enough data to reliably do so. Therefore we have defined criteria for a drive model to be included in the tables and charts for the specified period of time. Models that do not meet these criteria are not included in the tables and charts for the period in question.
| Period | Drive Count | Drive Days |
|---|---|---|
| Quarterly | > 100 | > 10,000 |
| Annual | > 250 | > 50,000 |
| Lifetime | > 500 | >100,000 |
Regardless of whether or not a given drive model is included in the charts and tables, all of the data for all of the drives we use is included in our Drive Stats dataset which you can download by visiting our Drive Stats page.
As with the Q4 quarterly results, we will apply these criteria to the annual and lifetime charts that follow in this report.
2024 annual hard drive failure rates
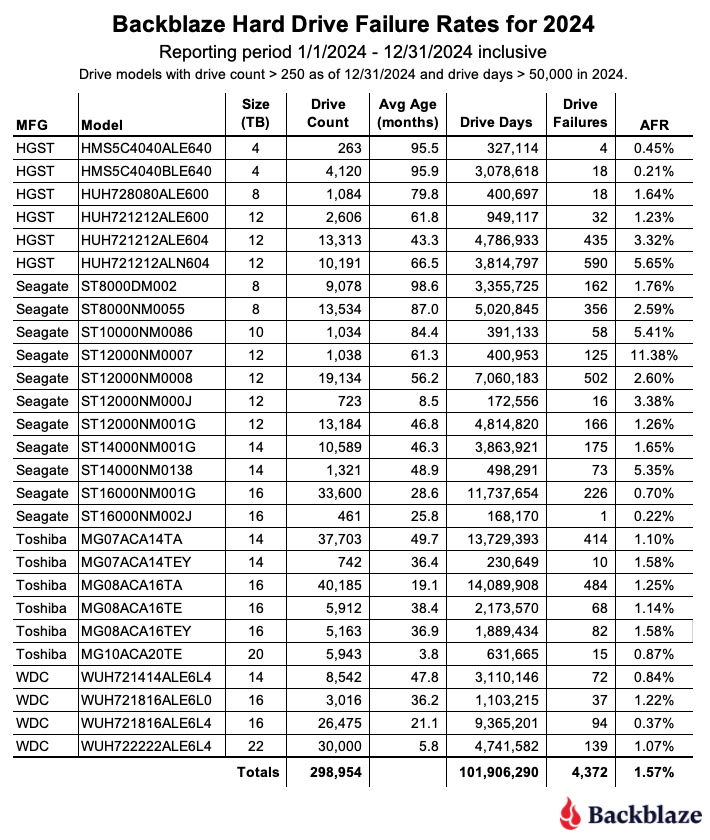
As of the end of 2024, Backblaze was monitoring 301,120 hard drives used to store data. We removed nine drive models consisting of 2,012 drives from consideration as they did not meet the annual criteria we have defined. This leaves us with 298,954 drives divided across 27 different drive models. The table below shows the AFRs for 2024 for this collection of drives.
Notes and observations
- No zeros for the year. There were no qualifying drive models with zero failures in 2024. That said, the 16TB Seagate (model: ST16000NM002J) got close by recording just one drive failure back in Q3, giving the drive an AFR of 0.22% for 2024.
- Busy data center techs. During 2024, our data center techs installed 53,337 drives. If we assume there are 2,080 work hours a year (52 weeks times 40 hours), that math is
53,337/2,080, and that means our intrepid DC techs installed 26 drives per hour. Busy, busy, busy! - The 24TB Seagate drives? While there were 1,200 new 24TB Seagate drives added in 2024, they were installed in early December and did not accumulate enough drive days to make the cut for the annual, or lifetime, tables. Including the 24TB Seagate drive, there were three models that missed out on being included in the 2024 annual tables, these drive models are listed below.
| MFG | Model | Drive Count | Drive Days | 2024 AFR |
|---|---|---|---|---|
| Seagate | ST8000NM000A | 247 | 22,684 | 0.84% |
| Seagate | ST14000NM000J | 232 | 19,696 | 1.32% |
| Seagate | ST24000NM002H | 1,200 | 18,000 | 0.00% |
As a reminder, a drive model needs to have over 250 drives by the end of Q4 and accumulate at least 50,000 drive days during 2024 to be included in the annual tables.
Comparing Drive Stats for 2022, 2023, and 2024
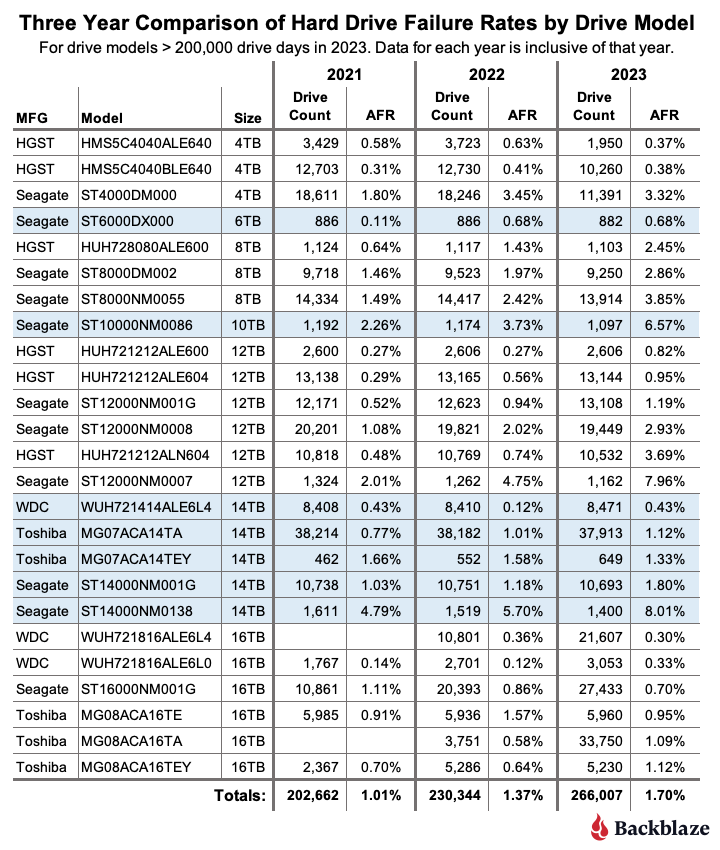
The table below compares the annual failure rates by drive model for each of the last three years. The table includes just those drive models which met the annual criteria as of the end of 2024. The data for each year is inclusive of that year only for the operational drive models present at the end of each year. The table is sorted by drive size and then AFR.
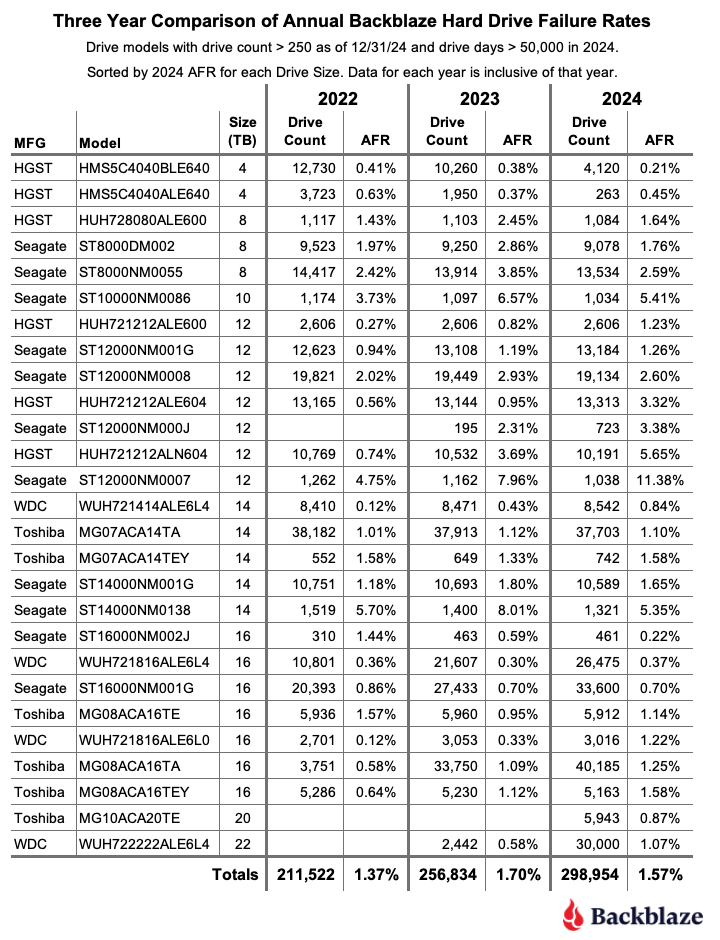
Notes and observations
- The annual AFR is down. The 2024 AFR for all drives listed was 1.57%, this is down from 1.70% in 2023. We expect the overall failure rates to continue to fall in 2025, but we will be watching the following for indicators.
- The failure rates of the 8TB and 12TB drive models. All of the models will exceed their five years of service. In general, the failure rate will noticeably increase as the drives exceed five years of service. And, while there are outliers like the current HGST 4TB drives, you can’t assume that will happen.
- The failure rates of the 14TB and 16TB drive models. These models are approaching middle age—three to five years in operation. This is where, according to the bathtub curve, their failure rates could gradually increase—but not as severely as when they exceed five years.
- The failure rates for the 20TB, 22TB, and 24TB drives models. These drives will enter the flat portion of the bathtub curve, that is where their failure rate should be the lowest.
Annualized failure rates vs. drive size
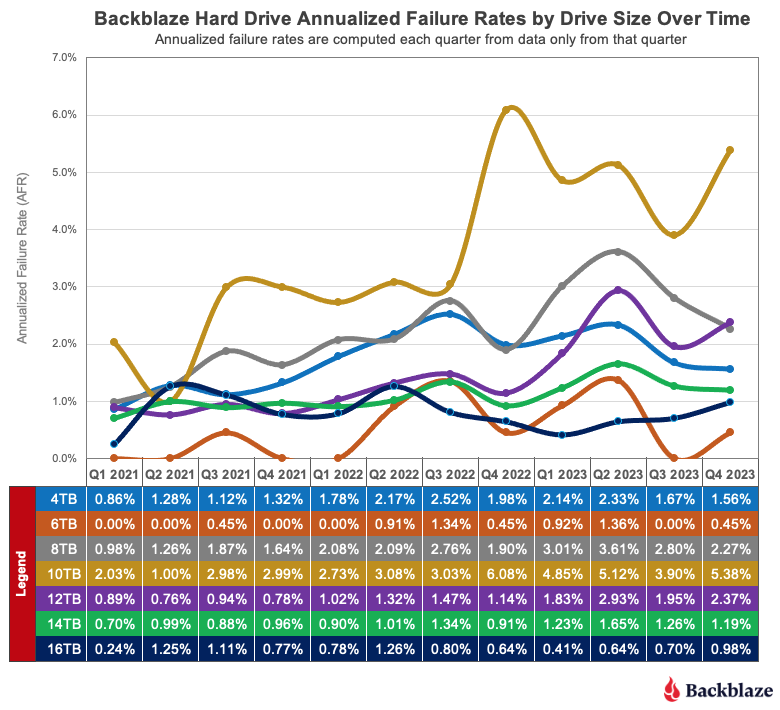
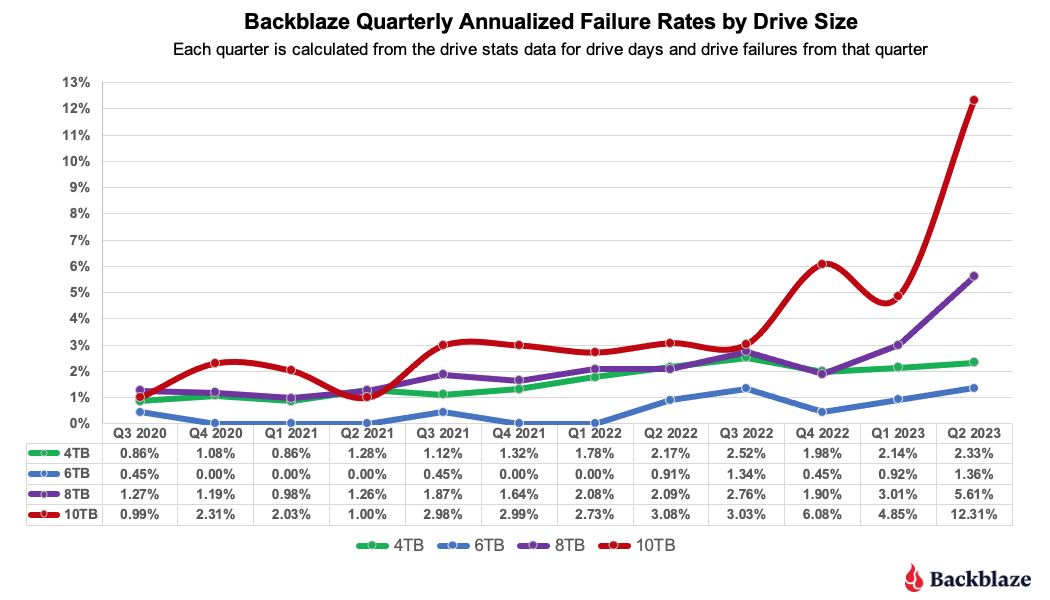
Now, we can dig into the numbers to see what else we can learn. We’ll start by looking at the quarterly annualized failure rate by drive size over the last three years.
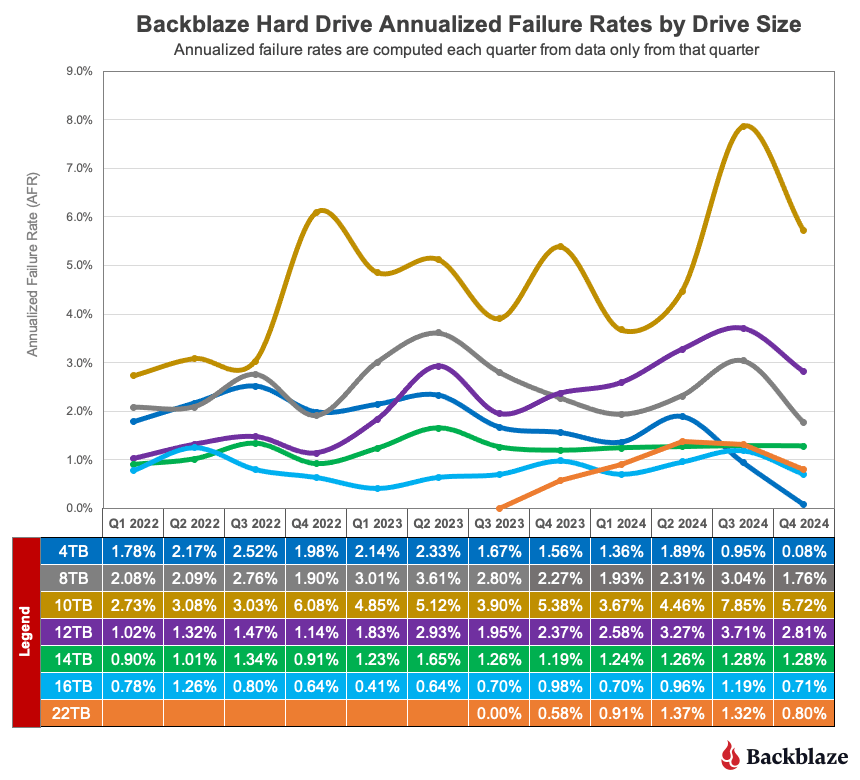
Let’s take a look at the different drive sizes and how they affect the overall annualized failure rate over time.
Minimal impact. The 4TB (blue line) drives and 10TB (gold line) drives have had little impact over the last year on the overall failure rate as each finished the year with a relatively small number of drives. Still, the wild ride delivered by the 10TB drives keeps our DC techs on their toes.
Older drives. The 8TB (gray line) drives and 12TB (purple line) drives range in age from five to eight years and as such their overall failure rates should be increasing over time. The 12TB drives are following that pattern moving up from about 1% AFR back in 2021 to just about 3% in 2024. The failure rates of the 8TB drives, while erratic from quarter-to-quarter, have a nearly flat trendline over the same period.
Workhorse drives. The 14TB (green line) and 16TB (azure* line) drives comprise 57% of the drives in service and on average they range in age from two to four years. They are in the prime of their working lives. As such, they should have low and stable failure rates, and as you can see, they do.
* Maybe azure isn’t quite right, but robin’s egg blue seemed a bit pretentious.
New drives on the block. The 22TB (orange line) drives are in their early days as we continue to add more drives on a regular basis. Once the drive population settles down, we’ll have a better sense of the AFR direction. Still, the early results are solid with a lifetime AFR of 1.06%.
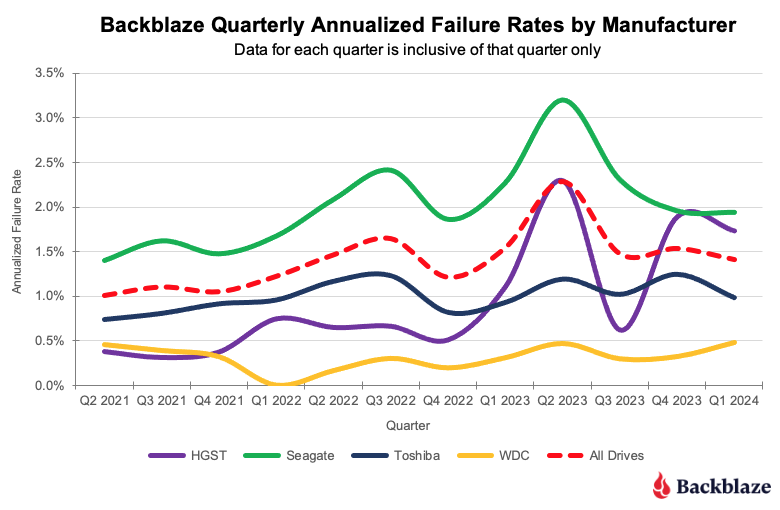
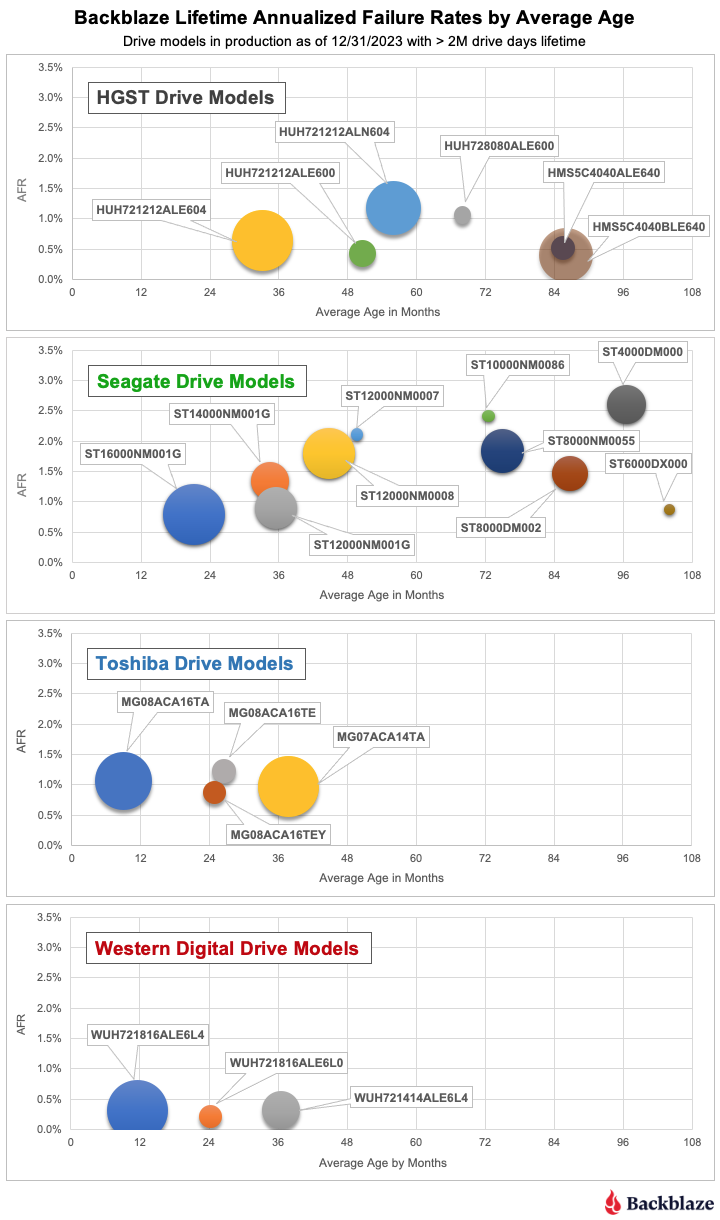
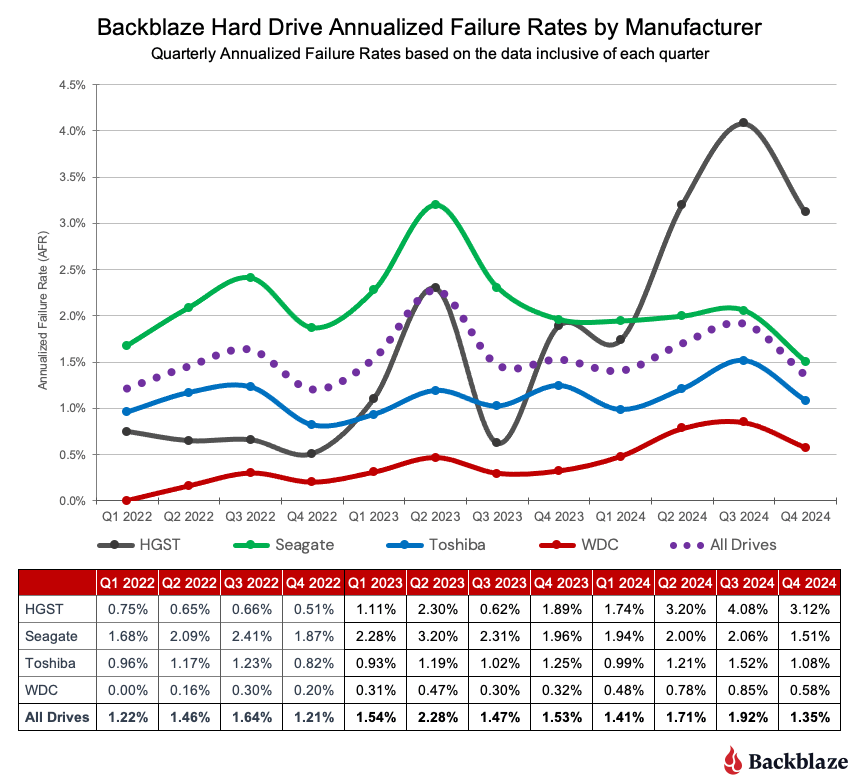
Annualized failure rates vs. manufacturer
One of the more popular ways we can look at this data is by the drive manufacturer as we’ve done below.
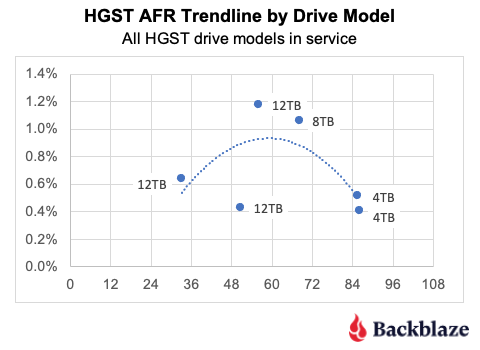
To complete the picture, the chart below uses the same data, but displays just the linear trendlines for each of the manufacturers over the same three-year period.
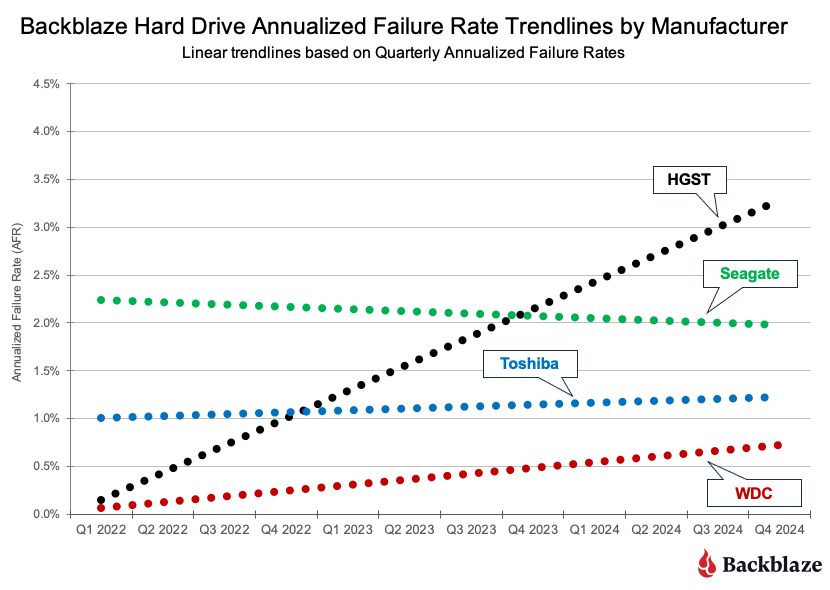
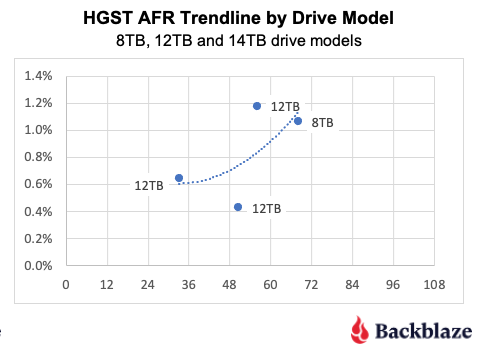
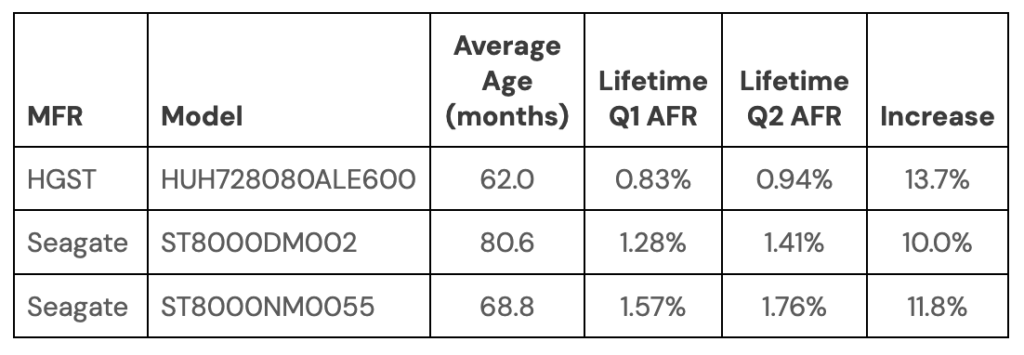
HGST. While the HGST trendline is not pretty, it doesn’t tell the entire story. Looking at the first chart, until Q4 2023, the HGST drives were at or below the average for all of the drives, that is all manufacturers. At that point, HGST has exceeded the average, and then some. The table below contains results for just the HGST drives for 2024. We’ve sorted them, high to low, by the 2024 AFR.
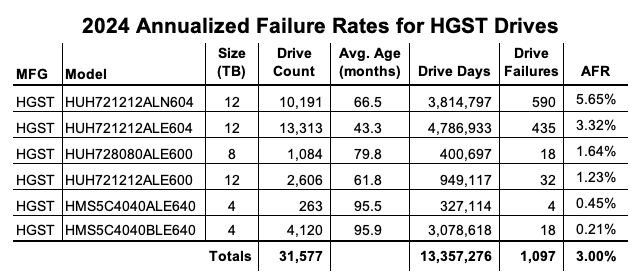
As you can see, there are two 12TB drive models driving the high AFR for the HGST drives. The HUH721212ALN604 model began showing signs of an increased quarterly AFR in Q1 2023 and the HUH721212ALE604 model followed suit in Q3 2024. Without these drive models, the 2024 AFR for HGST drive would be 0.55%.
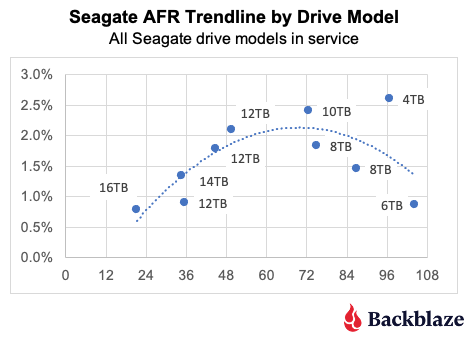
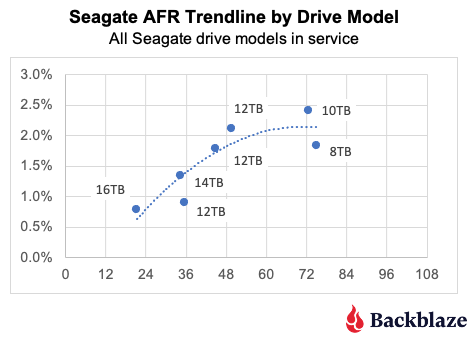
Seagate. The quarterly AFR trendline decreased for the Seagate drives from 2022 through 2024. While the decrease was slight, from 2.25% to 2.0%, Seagate was the only manufacturer to do so. The decrease appears, at least in part, to be due to the removal of the Seagate 4TB drives during that period.
Toshiba. Over the 2022 to 2024 period, the quarterly AFR for the Toshiba drive models varied within a fairly narrow range between 0.80% and 1.52%, with most quarters hovering slightly around 1.2%. Most importantly, none of the individual drive models were outliers, as the highest quarterly AFR for any Toshiba drive model was 1.58%. We like consistency.
WDC. While WDC drive models delivered a similar level of consistency as the Toshiba models, they did so with a lower AFR each quarter. From 2022 through 2024, the range of quarterly AFR values for the WDC models was 0.0% to 0.85%. The 0.0% AFR was in Q1 2022 when none of the 12,207 WDC drives in operation failed during that quarter.
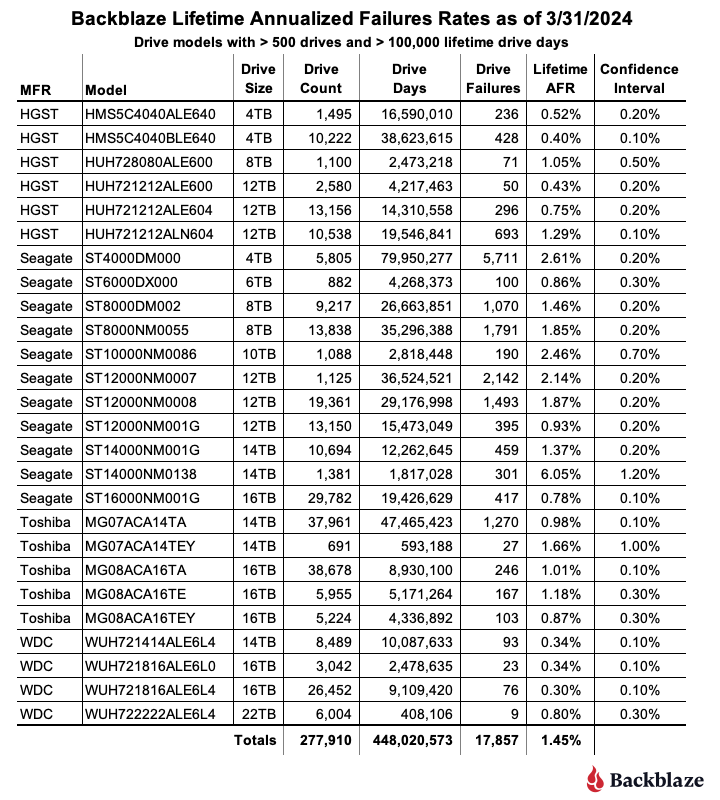
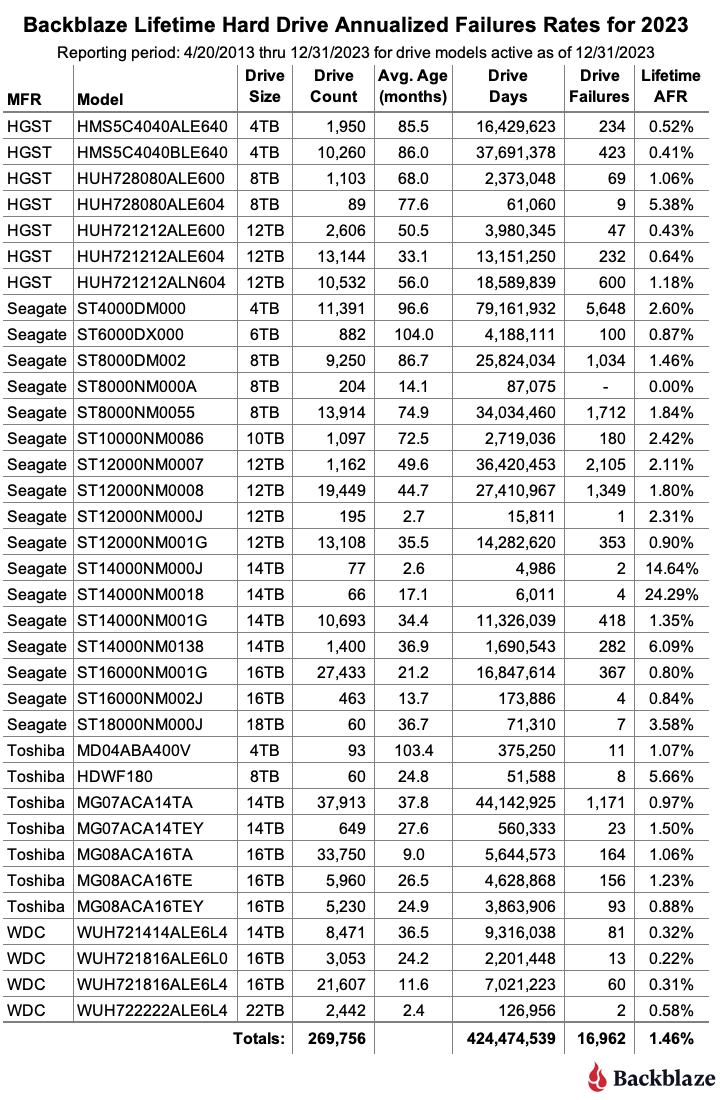
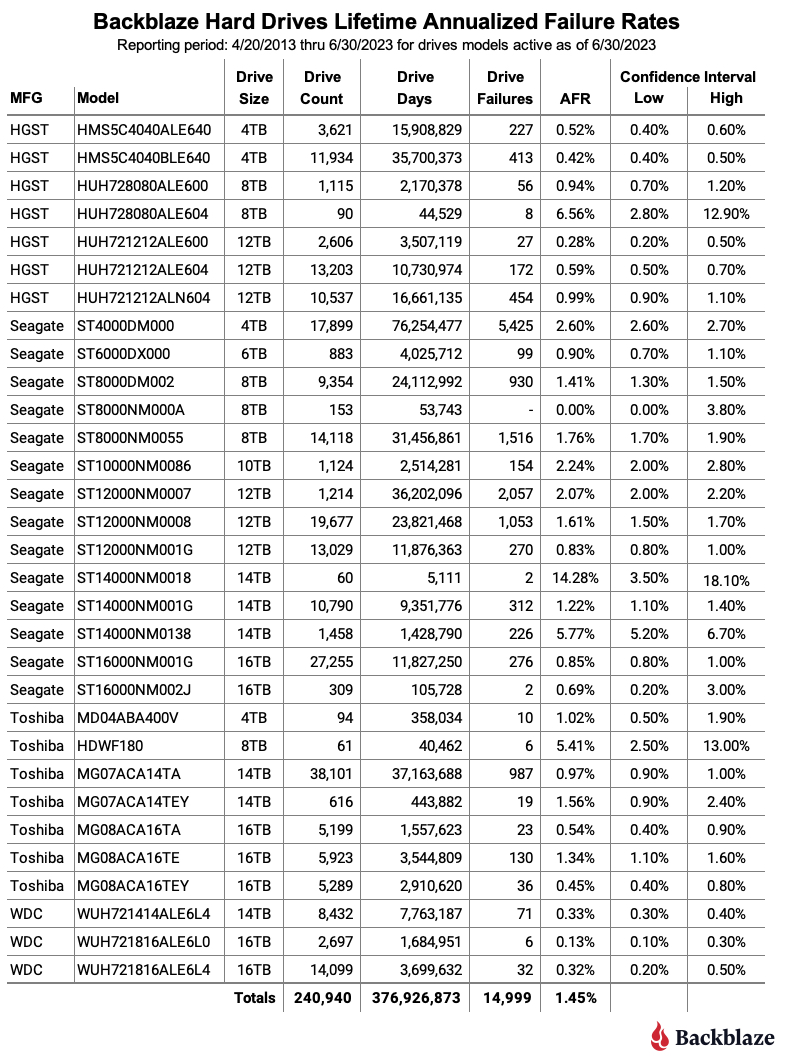
Lifetime hard drive stats
As of the end of 2024, Backblaze was monitoring 301,120 hard drives used to store data. Applying our drive criteria noted above for the lifetime period, we removed 11 drive models consisting of 2,736 drives from consideration as they did not meet the lifetime criteria we defined. This leaves us with 298,230 drives divided across 25 different drive models. The table below shows the lifetime AFRs for this collection of drives.
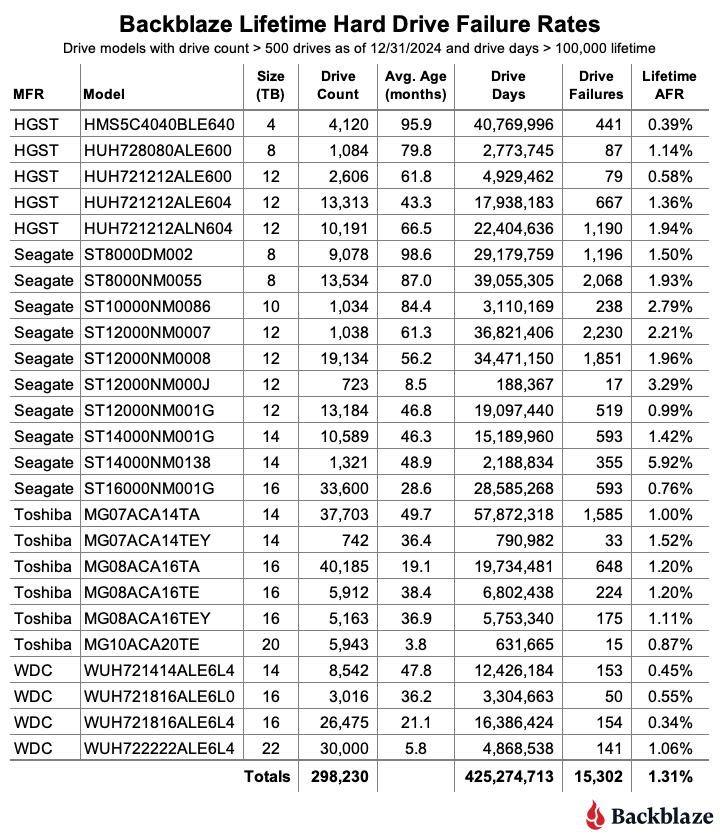
The current lifetime AFR for all of the drives is 1.31%. This is down from 1.46% in 2023. The drop is primarily due to the completion of the migration of the 4TB Seagate drives in 2024, which left us with only two of these drives still in operation as of the end of 2024. As a consequence, the 79 million drive days and over 5,600 drive failures racked up by the 4TB Seagate drives by the end of 2023 are not included in the data presented in the 2024 lifetime table above.
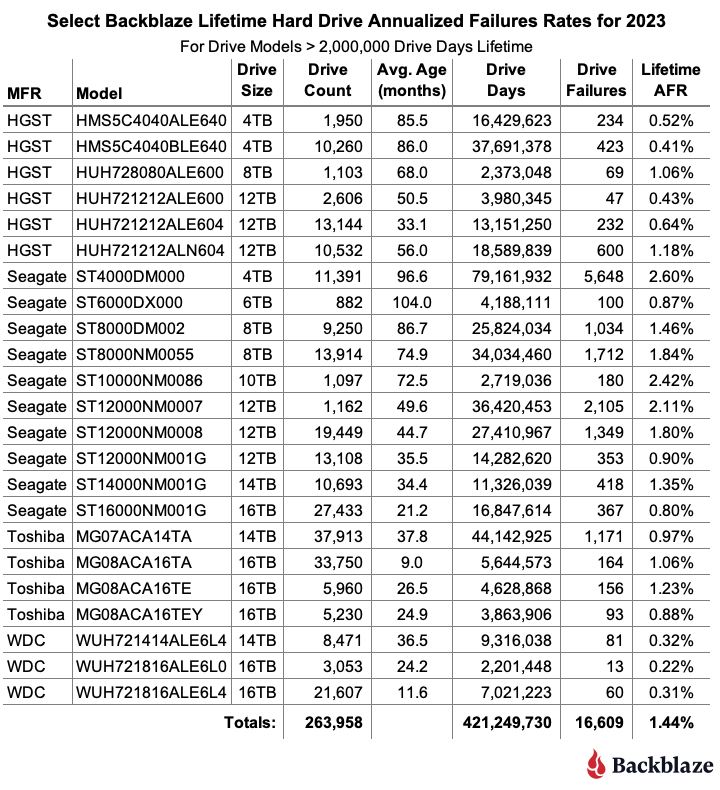
In the final table below, we’ve taken the lifetime table and sorted out the drive models that have a lifetime AFR of 1.50% or less by drive size.
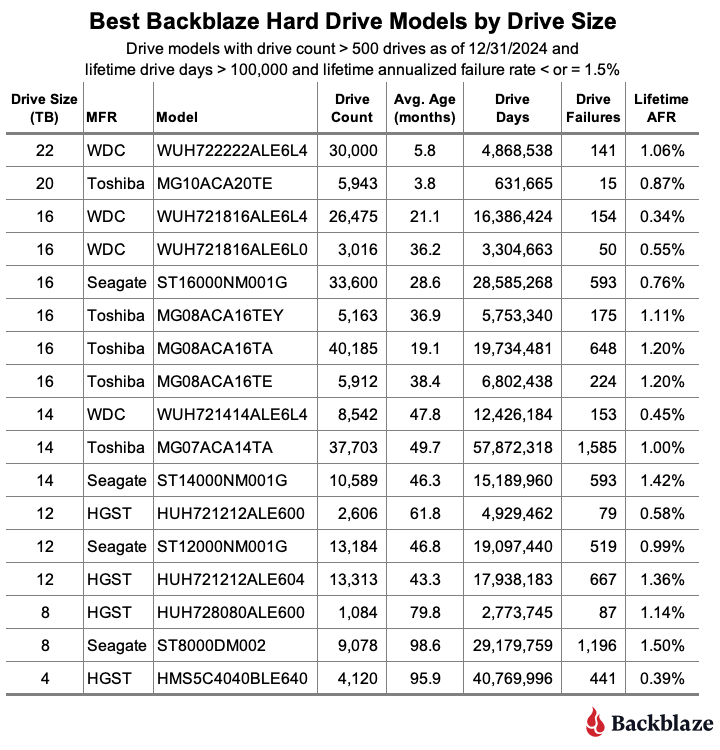
A couple of caveats as you review the table.
- There is enough data for each model to say the AFR values are solid. That said, everything could change tomorrow. In general, the hard drive failure rate follows the bathtub curve as the drives age—unless it doesn’t. Some drives refuse to fail as they age, like the 4TB HGST drives. Other drives are great, and then “hit the wall” and bend the failure curve upward, fast.
- A drive model with a 1% annualized failure rate means that you can expect one drive out of 100 to fail in a year. If you’re a personal drive user, that one drive could be yours. If you have exactly one drive, your personal annualized failure rate is 100%. In other words, always have a backup, and don’t forget to test it.
Migration time
I have been authoring the various Drive Stats reports for the past ten years and this will be my last one. I am retiring, or perhaps in Drive Stats vernacular, it would be “migrating.” Either way, after 10 years in the U.S. Air Force and 30+ years in Silicon Valley Tech, it is time. Drive Stats will continue with Stephanie Doyle and David Johnson as the replacement drive models beginning with the Q1 2025 report. I wish them well.
I want to say thank you to each of you who have taken your time to peruse and engage with the Drive Stats reports and data over the last 10 years. And, thank you as well for the comments, questions, and discussions that raced and raged across the various communities that care about something as mundane and awesome as a hard drive. It has been quite the ride—thanks again.
The Hard Drive Stats data
The complete data set used to create the tables and charts in this report is available on our Hard Drive Test Data page. You can download and use this data for free for your own purpose. All we ask are three things: 1) you cite Backblaze as the source if you use the data, 2) you accept that you are solely responsible for how you use the data, and 3) you do not sell this data itself to anyone; it is free.
Good luck, and let us know if you find anything interesting.
The post Backblaze Drive Stats for 2024 appeared first on Backblaze Blog | Cloud Storage & Cloud Backup