Post Syndicated from Moumita Saha original https://aws.amazon.com/blogs/security/how-to-visualize-multi-account-amazon-inspector-findings-with-amazon-elasticsearch-service/
Amazon Inspector helps to improve the security and compliance of your applications that are deployed on Amazon Web Services (AWS). It automatically assesses Amazon Elastic Compute Cloud (Amazon EC2) instances and applications on those instances. From that assessment, it generates findings related to exposure, potential vulnerabilities, and deviations from best practices.
You can use the findings from Amazon Inspector as part of a vulnerability management program for your Amazon EC2 fleet across multiple AWS Regions in multiple accounts. The ability to rank and efficiently respond to potential security issues reduces the time that potential vulnerabilities remain unresolved. This can be accelerated within a single pane of glass for all the accounts in your AWS environment.
Following AWS best practices, in a secure multi-account AWS environment, you can provision (using AWS Control Tower) a group of accounts—known as core accounts, for governing other accounts within the environment. One of the core accounts may be used as a central security account, which you can designate for governing the security and compliance posture across all accounts in your environment. Another core account is a centralized logging account, which you can provision and designate for central storage of log data.
In this blog post, I show you how to:
- Use Amazon Inspector, a fully managed security assessment service, to generate security findings.
- Gather findings from multiple Regions across multiple accounts using Amazon Simple Notification Service (Amazon SNS) and Amazon Simple Queue Service (Amazon SQS).
- Use AWS Lambda to send the findings to a central security account for deeper analysis and reporting.
In this solution, we send the findings to two services inside the central security account:
- Amazon Elasticsearch Service (Amazon ES) – A search and analytics engine used for log analytics, real-time application monitoring, and clickstream analytics.
- Amazon Simple Storage Service (Amazon S3) – A highly scalable, reliable, fast, and inexpensive data storage service of AWS.
Solution overview
Overall architecture
The flow of events to implement the solution is shown in Figure 1 and described in the following process flow.
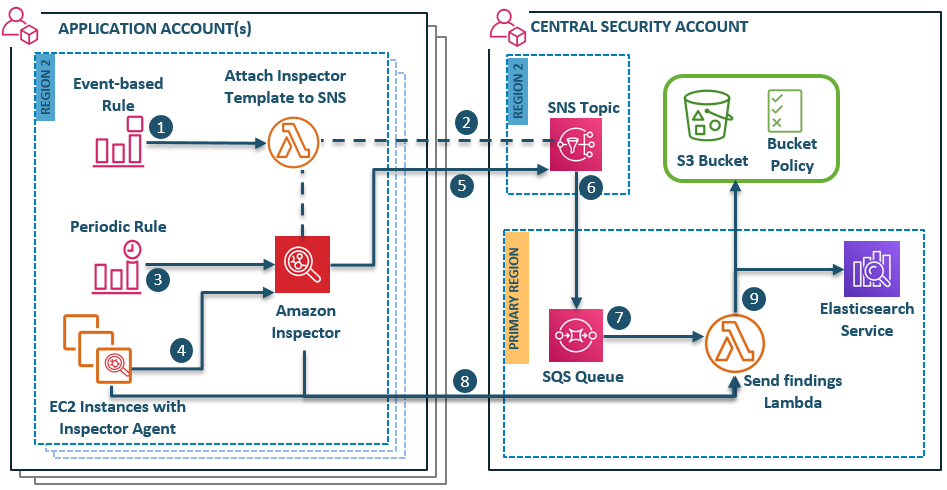
Figure 1: Solution overview architecture
Process flow
The flow of this architecture is divided into two types of processes—a one-time process and a scheduled process. The AWS resources that are part of the one-time process are triggered the first time an Amazon Inspector assessment template is created in each Region of each application account. The AWS resources of the scheduled process are triggered at a designated interval of Amazon Inspector scan in each Region of each application account.
One-time process
- An event-based Amazon CloudWatch rule in each Region of every application account triggers a regional AWS Lambda function when an Amazon Inspector assessment template is created for the first time in that Region.
Note: In order to restrict this event to trigger the Lambda function only the first time an assessment template is created, you must use a specific user-defined tag to trigger the Attach Inspector template to SNS Lambda function for only one Amazon Inspector template per Region. For more information on tags, see the Tagging AWS resources documentation.
- The Lambda function attaches the Amazon Inspector assessment template (created in application accounts) to the cross-account Amazon SNS topic (created in the security account). The function, the template, and the topic are all in the same AWS Region.
Note: This step is needed because Amazon Inspector templates can only be attached to SNS topics in the same account via the AWS Management Console or AWS Command Line Interface (AWS CLI).
Scheduled process
- A scheduled Amazon CloudWatch Event in every Region of the application accounts starts the Amazon Inspector scan at a scheduled time interval, which you can configure.
- An Amazon Inspector agent conducts the scan on the EC2 instances of the Region where the assessment template is created and sends any findings to Amazon Inspector.
- Once the findings are generated, Amazon Inspector notifies the Amazon SNS topic of the security account in the same Region.
- The Amazon SNS topics from each Region of the central security account receive notifications of Amazon Inspector findings from all application accounts. The SNS topics then send the notifications to a central Amazon SQS queue in the primary Region of the security account.
- The Amazon SQS queue triggers the Send findings Lambda function (as shown in Figure 1) of the security account.
Note: Each Amazon SQS message represents one Amazon Inspector finding.
- The Send findings Lambda function assumes a cross-account role to fetch the following information from all application accounts:
- Finding details from the Amazon Inspector API.
- Additional Amazon EC2 attributes—VPC, subnet, security group, and IP address—from EC2 instances with potential vulnerabilities.
- The Lambda function then sends all the gathered data to a central S3 bucket and a domain in Amazon ES—both in the central security account.
These Amazon Inspector findings, along with additional attributes on the scanned instances, can be used for further analysis and visualization via Kibana—a data visualization dashboard for Amazon ES. Storing a copy of these findings in an S3 bucket gives you the opportunity to forward the findings data to outside monitoring tools that don’t support direct data ingestion from AWS Lambda.
Prerequisites
The following resources must be set up before you can implement this solution:
- A multi-account structure. To learn how to set up a multi-account structure, see Setting up AWS Control Tower and AWS Landing zone.
- Amazon Inspector agents must be installed on all EC2 instances. See Installing Amazon Inspector agents to learn how to set up Amazon Inspector agents on EC2 instances. Additionally, keep note of all the Regions where you install the Amazon Inspector agent.
- An Amazon ES domain with Kibana authentication. See Getting started with Amazon Elasticsearch Service and Use Amazon Cognito for Kibana access control.
- An S3 bucket for centralized storage of Amazon Inspector findings.
- An S3 bucket for storage of the Lambda source code for the solution.
Set up Amazon Inspector with Amazon ES and S3
Follow these steps to set up centralized Amazon Inspector findings with Amazon ES and Amazon S3:
- Upload the solution ZIP file to the S3 bucket used for Lambda code storage.
- Collect the input parameters for AWS CloudFormation deployment.
- Deploy the base template into the central security account.
- Deploy the second template in the primary Region of all application accounts to create global resources.
- Deploy the third template in all Regions of all application accounts.
Step 1: Upload the solution ZIP file to the S3 bucket used for Lambda code storage
- From GitHub, download the file Inspector-to-S3ES-crossAcnt.zip.
- Upload the ZIP file to the S3 bucket you created in the central security account for Lambda code storage. This code is used to create the Lambda function in the first CloudFormation stack set of the solution.
Step 2: Collect input parameters for AWS CloudFormation deployment
In this solution, you deploy three AWS CloudFormation stack sets in succession. Each stack set should be created in the primary Region of the central security account. Underlying stacks are deployed across the central security account and in all the application accounts where the Amazon Inspector scan is performed. You can learn more in Working with AWS CloudFormation StackSets.
Before you proceed to the stack set deployment, you must collect the input parameters for the first stack set: Central-SecurityAcnt-BaseTemplate.yaml.
To collect input parameters for AWS CloudFormation deployment
- Fetch the account ID (CentralSecurityAccountID) of the AWS account where the stack set will be created and deployed. You can use the steps in Finding your AWS account ID to help you find the account ID.
- Values for the ES domain parameters can be fetched from the Amazon ES console.
- Open the Amazon ES Management Console and select the Region where the Amazon ES domain exists.
- Select the domain name to view the domain details.
- The value for ElasticsearchDomainName is displayed on the top left corner of the domain details.
- On the Overview tab in the domain details window, select and copy the URL value of the Endpoint to use as the ElasticsearchEndpoint parameter of the template. Make sure to exclude the https:// at the beginning of the URL.

Figure 2: Details of the Amazon ES domain for fetching parameter values
- Get the values for the S3 bucket parameters from the Amazon S3 console.
- Open the Amazon S3 Management Console.
- Copy the name of the S3 bucket that you created for centralized storage of Amazon Inspector findings. Save this bucket name for the LoggingS3Bucket parameter value of the Central-SecurityAcnt-BaseTemplate.yaml template.
- Select the S3 bucket used for source code storage. Select the bucket name and copy the name of this bucket for the LambdaSourceCodeS3Bucket parameter of the template.

Figure 3: The S3 bucket where Lambda code is uploaded
- On the bucket details page, select the source code ZIP file name that you previously uploaded to the bucket. In the detail page of the ZIP file, choose the Overview tab, and then copy the value in the Key field to use as the value for the LambdaCodeS3Key parameter of the template.

Figure 4: Details of the Lambda code ZIP file uploaded in Amazon S3 showing the key prefix value


Note: All of the other input parameter values of the template are entered automatically, but you can change them during stack set creation if necessary.
Step 3: Deploy the base template into the central security account
Now that you’ve collected the input parameters, you’re ready to deploy the base template that will create the necessary resources for this solution implementation in the central security account.
Prerequisites for CloudFormation stack set deployment
There are two permission modes that you can choose from for deploying a stack set in AWS CloudFormation. If you’re using AWS Organizations and have all features enabled, you can use the service-managed permissions; otherwise, self-managed permissions mode is recommended. To deploy this solution, you’ll use self-managed permissions mode. To run stack sets in self-managed permissions mode, your administrator account and the target accounts must have two IAM roles—AWSCloudFormationStackSetAdministrationRole and AWSCloudFormationStackSetExecutionRole—as prerequisites. In this solution, the administrator account is the central security account and the target accounts are application accounts. You can use the following CloudFormation templates to create the necessary IAM roles:
- AWSCloudFormationStackSetAdministrationRole – Creates the IAM role only in the central security account.
- AWSCloudFormationStackSetExecutionRole – Creates the IAM role in all accounts.
To deploy the base template
- Download the base template (Central-SecurityAcnt-BaseTemplate.yaml) from GitHub.
- Open the AWS CloudFormation Management Console and select the Region where all the stack sets will be created for deployment. This should be the primary Region of your environment.
- Select Create StackSet.
- In the Create StackSet window, select Template is ready and then select Upload a template file.
- Under Upload a template file, select Choose file and select the Central-SecurityAcnt-BaseTemplate.yaml template that you downloaded earlier.
- Choose Next.
- Add stack set details.
- Enter a name for the stack set in StackSet name.
- Under Parameters, most of the values are pre-populated except the values you collected in the previous procedure for CentralSecurityAccountID, ElasticsearchDomainName, ElasticsearchEndpoint, LoggingS3Bucket, LambdaSourceCodeS3Bucket, and LambdaCodeS3Key.
- After all the values are populated, choose Next.
- Configure StackSet options.
- (Optional) Add tags as described in the prerequisites to apply to the resources in the stack set that these rules will be deployed to. Tagging is a recommended best practice, because it enables you to add metadata information to resources during their creation.
- Under Permissions, choose the Self service permissions mode to be used for deploying the stack set, and then select the AWSCloudFormationStackSetAdministrationRole from the dropdown list.

Figure 5: Permission mode to be selected for stack set deployment
- Choose Next.
- Add the account and Region details where the template will be deployed.
- Under Deployment locations, select Deploy stacks in accounts. Under Account numbers, enter the account ID of the security account that you collected earlier.

Figure 6: Values to be provided during the deployment of the first stack set
- Under Specify regions, select all the Regions where the stacks will be created. This should be the list of Regions where you installed the Amazon Inspector agent. Keep note of this list of Regions to use in the deployment of the third template in an upcoming step.
- Though an Amazon Inspector scan is performed in all the application accounts, the regional Amazon SNS topics that send scan finding notifications are created in the central security account. Therefore, this template is created in all the Regions where Amazon Inspector will notify SNS. The template has the logic needed to handle the creation of specific AWS resources only in the primary Region, even though the template executes in many Regions.
- The order in which Regions are selected under Specify regions defines the order in which the stack is deployed in the Regions. So you must make sure that the primary Region of your deployment is the first one specified under Specify regions, followed by the other Regions of stack set deployment. This is required because global resources are created using one Region—ideally the primary Region—and so stack deployment in that Region should be done before deployment to other Regions in order to avoid any build dependencies.

Figure 7: Showing the order of specifying the Regions of stack set deployment
- Under Deployment locations, select Deploy stacks in accounts. Under Account numbers, enter the account ID of the security account that you collected earlier.
- Review the template settings and select the check box to acknowledge the Capabilities section. This is required if your deployment template creates IAM resources. You can learn more at Controlling access with AWS Identity and Access Management.

Figure 8: Acknowledge IAM resources creation by AWS CloudFormation
- Choose Submit to deploy the stack set.


Step 4: Deploy the second template in the primary Region of all application accounts to create global resources
This template creates the global resources required for sending Amazon Inspector findings to Amazon ES and Amazon S3.
To deploy the second template
- Download the template (ApplicationAcnts-RolesTemplate.yaml) from GitHub and use it to create the second CloudFormation stack set in the primary Region of the central security account.
- To deploy the template, follow the steps used to deploy the base template (described in the previous section) through Configure StackSet options.
- In Set deployment options, do the following:
- Under Account numbers, enter the account IDs of your application accounts as comma-separated values. You can use the steps in Finding your AWS account ID to help you gather the account IDs.
- Under Specify regions, select only your primary Region.

Figure 9: Select account numbers and specify Regions
- The remaining steps are the same as for the base template deployment.

Step 5: Deploy the third template in all Regions of all application accounts
This template creates the resources in each Region of all application accounts needed for scheduled scanning of EC2 instances using Amazon Inspector. Notifications are sent to the SNS topics of each Region of the central security account.
To deploy the third template
- Download the template InspectorRun-SetupTemplate.yaml from GitHub and create the final AWS CloudFormation stack set. Similar to the previous stack sets, this one should also be created in the central security account.
- For deployment, follow the same steps you used to deploy the base template through Configure StackSet options.
- In Set deployment options:
- Under Account numbers, enter the same account IDs of your application accounts (comma-separated values) as you did for the second template deployment.
- Under Specify regions, select all the Regions where you installed the Amazon Inspector agent.
Note: This list of Regions should be the same as the Regions where you deployed the base template.
- The remaining steps are the same as for the second template deployment.
Test the solution and delivery of the findings
After successful deployment of the architecture, to test the solution you can wait until the next scheduled Amazon Inspector scan or you can use the following steps to run the Amazon Inspector scan manually.
To run the Amazon Inspector scan manually for testing the solution
- In any one of the application accounts, go to any Region where the Amazon Inspector scan was performed.
- Open the Amazon Inspector console.
- In the left navigation menu, select Assessment templates to see the available assessments.
- Choose the assessment template that was created by the third template.
- Choose Run to start the assessment immediately.
- When the run is complete, Last run status changes from Collecting data to Analysis Complete.

Figure 10: Amazon Inspector assessment run
- You can see the recent scan findings in the Amazon Inspector console by selecting Assessment runs from the left navigation menu.

Figure 11: The assessment run indicates total findings from the last Amazon Inspector run in this Region
- In the left navigation menu, select Findings to see details of each finding, or use the steps in the following section to verify the delivery of findings to the central security account.


Test the delivery of the Amazon Inspector findings
This solution delivers the Amazon Inspector findings to two AWS services—Amazon ES and Amazon S3—in the primary Region of the central security account. You can either use Kibana to view the findings sent to Amazon ES or you can use the findings sent to Amazon S3 and forward them to the security monitoring software of your preference for further analysis.
To check whether the findings are delivered to Amazon ES
- Open the Amazon ES Management Console and select the Region where the Amazon ES domain is located.
- Select the domain name to view the domain details.
- On the domain details page, select the Kibana URL.

Figure 12: Amazon ES domain details page
- Log in to Kibana using your preferred authentication method as set up in the prerequisites.
- In the left panel, select Discover.
- In the Discover window, select a Region to view the total number of findings in that Region.

Figure 13: The total findings in Kibana for the chosen Region of an application account


To check whether the findings are delivered to Amazon S3
- Open the Amazon S3 Management Console.
- Select the S3 bucket that you created for storing Amazon Inspector findings.
- Select the bucket name to view the bucket details. The total number of findings for the chosen Region is at the top right corner of the Overview tab.

Figure 14: The total security findings as stored in an S3 bucket for us-east-1 Region

Visualization in Kibana
The data sent to the Amazon ES index can be used to create visualizations in Kibana that make it easier to identify potential security gaps and plan the remediation accordingly.
You can use Kibana to create a dashboard that gives an overview of the potential vulnerabilities identified in different instances of different AWS accounts. Figure 15 shows an example of such a dashboard. The dashboard can help you rank the need for remediation based on criteria such as:
- The category of vulnerability
- The most impacted AWS accounts
- EC2 instances that need immediate attention
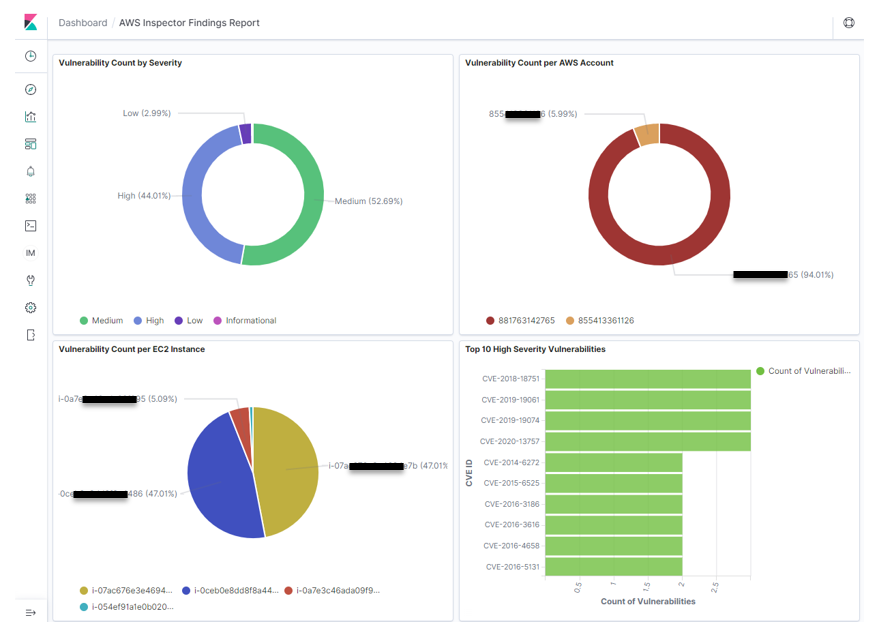
Figure 15: A sample Kibana dashboard showing findings from Amazon Inspector
You can build additional panels to visualize details of the vulnerability findings identified by Amazon Inspector, such as the CVE ID of the security vulnerability, its description, and recommendations on how to remove the vulnerabilities.
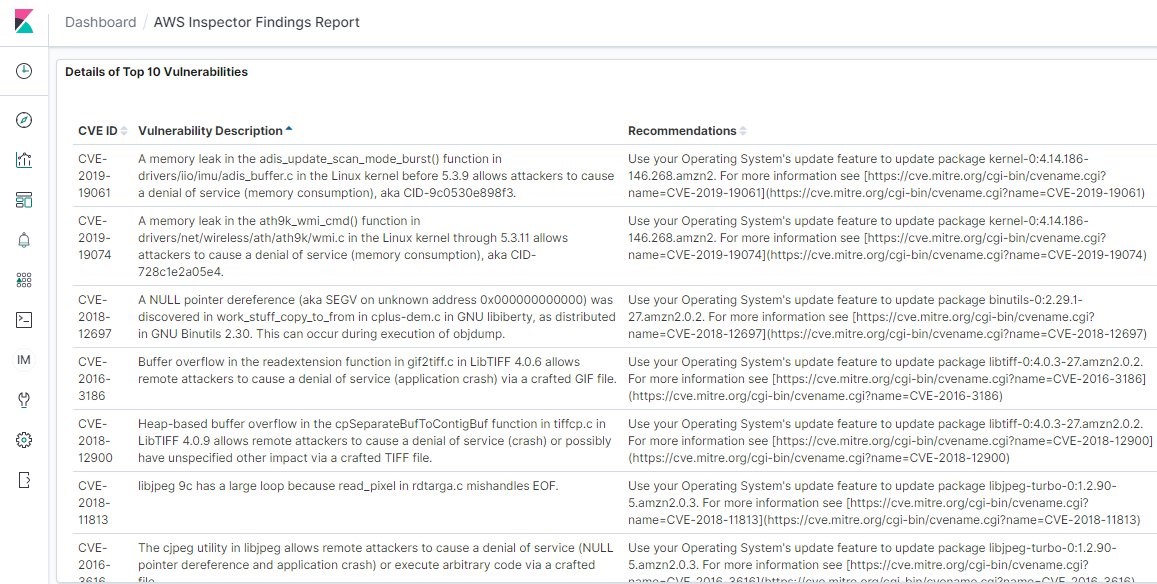
Figure 16: A sample Kibana dashboard panel listing the top identified vulnerabilities and their details
Conclusion
By using this solution to combine Amazon Inspector, Amazon SNS topics, Amazon SQS queues, Lambda functions, an Amazon ES domain, and S3 buckets, you can centrally analyze and monitor the vulnerability posture of EC2 instances across your AWS environment, including multiple Regions across multiple AWS accounts. This solution is built following least privilege access through AWS IAM roles and policies to help secure the cross-account architecture.
In this blog post, you learned how to send the findings directly to Amazon ES for visualization in Kibana. These visualizations can be used to build dashboards that security analysts can use for centralized monitoring. Better monitoring capability helps analysts to identify potentially vulnerable assets and perform remediation activities to improve security of your applications in AWS and their underlying assets. This solution also demonstrates how to store the findings from Amazon Inspector in an S3 bucket, which makes it easier for you to use those findings to create visualizations in your preferred security monitoring software.
If you have feedback about this post, submit comments in the Comments section below. If you have questions about this post, contact AWS Support.
Want more AWS Security how-to content, news, and feature announcements? Follow us on Twitter.