Tag Archives: security automation

AWS Security Hub launches a new capability for automating actions to update findings

Post Syndicated from Stuart Gregg original https://aws.amazon.com/blogs/security/aws-security-hub-launches-a-new-capability-for-automating-actions-to-update-findings/

If you’ve had discussions with a security organization recently, there’s a high probability that the word automation has come up. As organizations scale and consume the benefits the cloud has to offer, it’s important to factor in and understand how the additional cloud footprint will affect operations. Automation is a key enabler for efficient operations and can help drive down the number of repetitive tasks that the operational teams have to perform.

Alert fatigue is caused when humans work on the same repetitive tasks day in and day out and also have a large volume of alerts that need to be addressed. The repetitive nature of these tasks can cause analysts to become numb to the importance of the task or make errors due to manual processing. This can lead to misclassification of security alerts or higher-severity alerts being overlooked due to investigation times. Automation is key here to reduce the number of repetitive tasks and give analysts time to focus on other areas of importance.

In this blog post, we’ll walk you through new capabilities within AWS Security Hub that you can use to take automated actions to update findings. We’ll show you some example scenarios that use this capability and set you up with the knowledge you need to get started with creating automation rules.

Automation rules in Security Hub

AWS Security Hub is available globally and is designed to give you a comprehensive view of your security posture across your AWS accounts. With Security Hub, you have a single place that aggregates, organizes, and prioritizes your security alerts, or findings, from multiple AWS services, including Amazon GuardDuty, Amazon Inspector, Amazon Macie, AWS Firewall Manager, AWS Systems Manager Patch Manager, AWS Config, AWS Health, and AWS Identity and Access Management (IAM) Access Analyzer, as well as from over 65 AWS Partner Network (APN) solutions.

Previously, Security Hub could take automated actions on findings, but this involved going to the Amazon EventBridge console or API, creating an EventBridge rule, and then building an AWS Lambda function, an AWS Systems Manager Automation runbook, or an AWS Step Functions step as the target of that rule. If you wanted to set up these automated actions in the administrator account and home AWS Region and run them in member accounts and in linked Regions, you would also need to deploy the correct IAM permissions to enable the actions to run across accounts and Regions. After setting up the automation flow, you would need to maintain the EventBridge rule, Lambda function, and IAM roles. Such maintenance could include upgrading the Lambda versions, verifying operational efficiency, and checking that everything is running as expected.

With Security Hub, you can now use rules to automatically update various fields in findings that match defined criteria. This allows you to automatically suppress findings, update findings’ severities according to organizational policies, change findings’ workflow status, and add notes. As findings are ingested, automation rules look for findings that meet defined criteria and update the specified fields in findings that meet the criteria. For example, a user can create a rule that automatically sets the finding’s severity to “Critical” if the finding account ID is of a known business-critical account. A user could also automatically suppress findings for a specific control in an account where the finding represents an accepted risk.

With automation rules, Security Hub provides you a simplified way to build automations directly from the Security Hub console and API. This reduces repetitive work for cloud security and DevOps engineers and can reduce the mean time to response.

Use cases

In this section, we’ve put together some examples of how Security Hub automation rules can help you. There’s a lot of flexibility in how you can use the rules, and we expect there will be many variations that your organization will use when contextual information about security risk has been added.

Scenario 1: Elevate finding severity for specific controls based on account IDs

Security Hub offers protection by using hundreds of security controls that create findings that have a severity associated with them. Sometimes, you might want to elevate that severity according to your organizational policies or according to the context of the finding, such as the account it relates to. With automation rules, you can now automatically elevate the severity for specific controls when they are in a specific account.

For example, the AWS Foundational Security Best Practices control GuardDuty.1 has a “High” severity by default. But you might consider such a finding to have “Critical” severity if it occurs in one of your top production accounts. To change the severity automatically, you can choose GeneratorId as a criteria and check that it’s equal to aws-foundational-security-best-practices/v/1.0.0/GuardDuty.1, and also add AwsAccountId as a criteria and check that it’s equal to YOUR_ACCOUNT_IDs. Then, add an action to update the severity to “Critical,” and add a note to the person who will look at the finding that reads “Urgent — look into these production accounts.”

You can set up this automation rule through the AWS CLI, the console, the Security Hub API, or the AWS SDK for Python (Boto3), as follows.

To set up the automation rule for Scenario 1 (AWS CLI)

  • In the AWS CLI, run the following command to create a new automation rule with a specific Amazon Resource Name (ARN). Note the different modifiable parameters:
    • Rule-name — The name of the rule that will be created.
    • Rule-status — An optional parameter. Specify whether you want Security Hub to activate and start applying the rule to findings after creation. If no value is specified, the default value is ENABLED. A value of DISABLED means that the rule will be paused after creation.
    • Rule-order — Provide the processing order for the rule. Security Hub applies rules with a lower numerical value for this parameter first.
    • Criteria — Provide the criteria that you want Security Hub to use to filter your findings. The rule action will be applied to findings that match the criteria. For a list of supported criteria, see Criteria and actions for automation rules. In this example, the criteria are placeholders and should be replaced.
    • Actions — Provide the actions that you want Security Hub to take when there’s a match between a finding and your defined criteria. For a list of supported actions, see Criteria and actions for automation rules. In this example, the actions are placeholders and should be replaced.
    aws securityhub create-automation-rule \—rule-name "Elevate severity for findings in production accounts - GuardDuty.1" \—rule-status "ENABLED"" \—rule-order 1 \—description "Elevate severity for findings in production accounts - GuardDuty.1" \—criteria '{"GeneratorId": [{"Value": "aws-foundational-security-best-practices/v/1.0.0/GuardDuty.1","Comparison": "EQUALS"}, "AwsAccountId": [{"Value": "<111122223333>","Comparison": "EQUALS"},]}' \—actions '[{"Type": "FINDING_FIELDS_UPDATE","FindingFieldsUpdate": {"Severity": {"Label": "CRITICAL"},"Note": {"Text": "Urgent – look into these production accounts","UpdatedBy": "sechub-automation"}}}]' \—region us-east-1

To set up the automation rule for Scenario 1 (console)

  1. Open the Security Hub console, and in the left navigation pane, choose Automations.
    Figure 1: Automation rules in the Security Hub console

    Figure 1: Automation rules in the Security Hub console

  2. Choose Create rule, and then choose Create a custom rule to get started with creating a rule of your choice. Add a rule name and description.
    Figure 2: Create a new custom rule

    Figure 2: Create a new custom rule

  3. Under Criteria, add the following information.
    • Key 1
      • Key = GeneratorID
      • Operator = EQUALS
      • Value = aws-foundational-security-best-practices/v/1.0.0/GuardDuty.1
    • Key 2
      • Key = AwsAccountId
      • Operator = EQUALS
      • Value = Your AWS account ID
    Figure 3: Information added for the rule criteria

    Figure 3: Information added for the rule criteria

  4. You can preview which findings will match the criteria by looking in the preview section.
    Figure 4: Preview section

    Figure 4: Preview section

  5. Next, under Automated action, specify which finding value to update automatically when findings match your criteria.
    Figure 5: Automated action to be taken against the findings that match the criteria

    Figure 5: Automated action to be taken against the findings that match the criteria

  6. For Rule status, choose Enabled, and then choose Create rule.
    Figure 6: Set the rule status to Enabled

    Figure 6: Set the rule status to Enabled

  7. After you choose Create rule, you will see the newly created rule within the Automations portal.
    Figure 7: Newly created rule within the Security Hub Automations page

    Figure 7: Newly created rule within the Security Hub Automations page

    Note: In figure 7, you can see multiple automation rules. When you create automation rules, you assign each rule an order number. This determines the order in which Security Hub applies your automation rules. This becomes important when multiple rules apply to the same finding or finding field. When multiple rule actions apply to the same finding field, the rule with the highest numerical value for rule order is applied last and has the ultimate effect on that field.

Additionally, if your preferred deployment method is to use the API or AWS SDK for Python (Boto3), we have information on how you can use these means of deployment in our public documentation.

Scenario 2: Change the finding severity to high if a resource is important, based on resource tags

Imagine a situation where you have findings associated to a wide range of resources. Typically, organizations will attempt to prioritize which findings to remediate first. You can achieve this prioritization through Security Hub and the contextual fields that are available for you to use — for example, by using the severity of the finding or the account ID the resource is sitting in. You might also have your own prioritization based on other factors. You could add this additional context to findings by using a tagging strategy. With automation rules, you can now automatically elevate the severity for specific findings based on the tag value associated to the resource.

For example, if a finding comes into Security Hub with the severity rating “Medium,” but the resource in question is critical to the business and has the tag production associated to it, you could automatically raise the severity rating to “High.”

Note: This will work only for findings where there is a resource tag associated with the finding.

Scenario 3: Suppress GuardDuty findings with a severity of “Informational”

GuardDuty provides an overarching view of the state of threats to deployed resources in your organization’s cloud environment. After evaluation, GuardDuty produces findings related to these threats. The findings produced by GuardDuty have different severities, to help organizations with prioritization. Some of these findings will be given an “Informational” severity. “Informational” indicates that no issue was found and the content of the finding is purely to give information. After you have evaluated the context of the finding, you might want to suppress any additional findings that match the same criteria.

For example, you might want to set up a rule so that new findings with the generator ID that produced “Informational” findings are suppressed, keeping only the findings that need action.

Templates

When you create a new rule, you can also choose to create a rule from a template. These templates are regularly updated with use cases that are applicable for many customers.

To set up an automation rule by using a template from the console

  1. In the Security Hub console, choose Automations, and then choose Create rule.
  2. Choose Create a rule from a template to get started with creating a rule of your choice.
  3. Select a rule template from the drop-down menu.
    Figure 8: Select an automation rule template

    Figure 8: Select an automation rule template

  4. (Optional) If necessary, modify the Rule, Criteria, and Automated action sections.
  5. For Rule status, choose whether you want the rule to be enabled or disabled after it’s created.
  6. (Optional) Expand the Additional settings section. Choose Ignore subsequent rules for findings that match these criteria if you want this rule to be the last rule applied to findings that match the rule criteria.
  7. (Optional) For Tags, add tags as key-value pairs to help you identify the rule.
  8. Choose Create rule.

Multi-Region deployment

For organizations that operate in multiple AWS Regions, we’ve provided a solution that you can use to replicate rules created in your central Security Hub admin account into these additional Regions. You can find the sample code for this solution in our GitHub repo.

Conclusion

In this blog post, we’ve discussed the importance of automation and its ability to help organizations scale operations within the cloud. We’ve introduced a new capability in AWS Security Hub, automation rules, that can help reduce the repetitive tasks your operational teams may be facing, and we’ve showcased some example use cases to get you started. Start using automation rules in your environment today. We’re excited to see what use cases you will solve with this feature and as always, are happy to receive any feedback.

If you have feedback about this post, submit comments in the Comments section below. If you have questions about this post, start a new thread on the AWS Security, Identity, & Compliance re:Post or contact AWS Support.

Stuart Gregg

Stuart Gregg

Stuart enjoys providing thought leadership and being a trusted advisor to customers. In his spare time Stuart can be seen either training for an Ironman or snacking.

Shachar Hirshberg

Shachar Hirshberg

Shachar is a Senior Product Manager at AWS Security Hub with over a decade of experience in building, designing, launching, and scaling enterprise software. He is passionate about further improving how customers harness AWS services to enable innovation and enhance the security of their cloud environments. Outside of work, Shachar is an avid traveler and a skiing enthusiast.

Forensic investigation environment strategies in the AWS Cloud

Post Syndicated from Sol Kavanagh original https://aws.amazon.com/blogs/security/forensic-investigation-environment-strategies-in-the-aws-cloud/

When a deviation from your secure baseline occurs, it’s crucial to respond and resolve the issue quickly and follow up with a forensic investigation and root cause analysis. Having a preconfigured infrastructure and a practiced plan for using it when there’s a deviation from your baseline will help you to extract and analyze the information needed to determine the impact, scope, and root cause of an incident and return to operations confidently.

Time is of the essence in understanding the what, how, who, where, and when of a security incident. You often hear of automated incident response, which has repeatable and auditable processes to standardize the resolution of incidents and accelerate evidence artifact gathering.

Similarly, having a standard, pristine, pre-configured, and repeatable forensic clean-room environment that can be automatically deployed through a template allows your organization to minimize human interaction, keep the larger organization separate from contamination, hasten evidence gathering and root cause analysis, and protect forensic data integrity. The forensic analysis process assists in data preservation, acquisition, and analysis to identify the root cause of an incident. This approach can also facilitate the presentation or transfer of evidence to outside legal entities or auditors. AWS CloudFormation templates—or other infrastructure as code (IaC) provisioning tools—help you to achieve these goals, providing your business with consistent, well-structured, and auditable results that allow for a better overall security posture. Having these environments as a permanent part of your infrastructure allows them to be well documented and tested, and gives you opportunities to train your teams in their use.

This post provides strategies that you can use to prepare your organization to respond to secure baseline deviations. These strategies take the form of best practices around Amazon Web Services (AWS) account structure, AWS Organizations organizational units (OUs) and service control policies (SCPs), forensic Amazon Virtual Private Cloud (Amazon VPC) and network infrastructure, evidence artifacts to be collected, AWS services to be used, forensic analysis tool infrastructure, and user access and authorization to the above. The specific focus is to provide an environment where Amazon Elastic Compute Cloud (Amazon EC2) instances with forensic tooling can be used to examine evidence artifacts.

This post presumes that you already have an evidence artifact collection procedure or that you are implementing one and that the evidence can be transferred to the accounts described here. If you are looking for advice on how to automate artifact collection, see How to automate forensic disk collection for guidance.

Infrastructure overview

A well-architected multi-account AWS environment is based on the structure provided by Organizations. As companies grow and need to scale their infrastructure with multiple accounts, often in multiple AWS Regions, Organizations offers programmatic creation of new AWS accounts combined with central management and governance that helps them to do so in a controlled and standardized manner. This programmatic, centralized approach should be used to create the forensic investigation environments described in the strategy in this blog post.

The example in this blog post uses a simplified structure with separate dedicated OUs and accounts for security and forensics, shown in Figure 1. Your organization’s architecture might differ, but the strategy remains the same.

Note: There might be reasons for forensic analysis to be performed live within the compromised account itself, such as to avoid shutting down or accessing the compromised instance or resource; however, that approach isn’t covered here.

Figure 1: AWS Organizations forensics OU example

Figure 1: AWS Organizations forensics OU example

The most important components in Figure 1 are:

  • A security OU, which is used for hosting security-related access and services. The security OU and the associated AWS accounts should be owned and managed by your security organization.
  • A forensics OU, which should be a separate entity, although it can have some similarities and crossover responsibilities with the security OU. There are several reasons for having it within a separate OU and account. Some of the more important reasons are that the forensics team might be a different team than the security team (or a subset of it), certain investigations might be under legal hold with additional access restrictions, or a member of the security team could be the focus of an investigation.

When speaking about Organizations, accounts, and the permissions required for various actions, you must first look at SCPs, a core functionality of Organizations. SCPs offer control over the maximum available permissions for all accounts in your organization. In the example in this blog post, you can use SCPs to provide similar or identical permission policies to all the accounts under the forensics OU, which is being used as a resource container. This policy overrides all other policies, and is a crucial mechanism to ensure that you can explicitly deny or allow any API calls desired. Some use cases of SCPs are to restrict the ability to disable AWS CloudTrail, restrict root user access, and ensure that all actions taken in the forensic investigation account are logged. This provides a centralized way to avoid changing individual policies for users, groups, or roles. Accessing the forensic environment should be done using a least-privilege model, with nobody capable of modifying or compromising the initially collected evidence. For an investigation environment, denying all actions except those you want to list as exceptions is the most straightforward approach. Start with the default of denying all, and work your way towards the least authorizations needed to perform the forensic processes established by your organization. AWS Config can be a valuable tool to track the changes made to the account and provide evidence of these changes.

Keep in mind that once the restrictive SCP is applied, even the root account or those with administrator access won’t have access beyond those permissions; therefore, frequent, proactive testing as your environment changes is a best practice. Also, be sure to validate which principals can remove the protective policy, if required, to transfer the account to an outside entity. Finally, create the environment before the restrictive permissions are applied, and then move the account under the forensic OU.

Having a separate AWS account dedicated to forensic investigations is best to keep your larger organization separate from the possible threat of contamination from the incident itself, ensure the isolation and protection of the integrity of the artifacts being analyzed, and keeping the investigation confidential. Separate accounts also avoid situations where the threat actors might have used all the resources immediately available to your compromised AWS account by hitting service quotas and so preventing you from instantiating an Amazon EC2 instance to perform investigations.

Having a forensic investigation account per Region is also a good practice, as it keeps the investigative capabilities close to the data being analyzed, reduces latency, and avoids issues of the data changing regulatory jurisdictions. For example, data residing in the EU might need to be examined by an investigative team in North America, but the data itself cannot be moved because its North American architecture doesn’t align with GDPR compliance. For global customers, forensics teams might be situated in different locations worldwide and have different processes. It’s better to have a forensic account in the Region where an incident arose. The account as a whole could also then be provided to local legal institutions or third-party auditors if required. That said, if your AWS infrastructure is contained within Regions only in one jurisdiction or country, then a single re-creatable account in one Region with evidence artifacts shared from and kept in their respective Regions could be an easier architecture to manage over time.

An account created in an automated fashion using a CloudFormation template—or other IaC methods—allows you to minimize human interaction before use by recreating an entirely new and untouched forensic analysis instance for each separate investigation, ensuring its integrity. Individual people will only be given access as part of a security incident response plan, and even then, permissions to change the environment should be minimal or none at all. The post-investigation environment would then be either preserved in a locked state or removed, and a fresh, blank one created in its place for the subsequent investigation with no trace of the previous artifacts. Templating your environment also facilitates testing to ensure your investigative strategy, permissions, and tooling will function as intended.

Accessing your forensics infrastructure

Once you’ve defined where your investigative environment should reside, you must think about who will be accessing it, how they will do so, and what permissions they will need.

The forensic investigation team can be a separate team from the security incident response team, the same team, or a subset. You should provide precise access rights to the group of individuals performing the investigation as part of maintaining least privilege.

You should create specific roles for the various needs of the forensic procedures, each with only the permissions required. As with SCPs and other situations described here, start with no permissions and add authorizations only as required while establishing and testing your templated environments. As an example, you might create the following roles within the forensic account:

Responder – acquire evidence

Investigator – analyze evidence

Data custodian – manage (copy, move, delete, and expire) evidence

Analyst – access forensics reports for analytics, trends, and forecasting (threat intelligence)

You should establish an access procedure for each role, and include it in the response plan playbook. This will help you ensure least privilege access as well as environment integrity. For example, establish a process for an owner of the Security Incident Response Plan to verify and approve the request for access to the environment. Another alternative is the two-person rule. Alert on log-in is an additional security measure that you can add to help increase confidence in the environment’s integrity, and to monitor for unauthorized access.

You want the investigative role to have read-only access to the original evidence artifacts collected, generally consisting of Amazon Elastic Block Store (Amazon EBS) snapshots, memory dumps, logs, or other artifacts in an Amazon Simple Storage Service (Amazon S3) bucket. The original sources of evidence should be protected; MFA delete and S3 versioning are two methods for doing so. Work should be performed on copies of copies if rendering the original immutable isn’t possible, especially if any modification of the artifact will happen. This is discussed in further detail below.

Evidence should only be accessible from the roles that absolutely require access—that is, investigator and data custodian. To help prevent potential insider threat actors from being aware of the investigation, you should deny even read access from any roles not intended to access and analyze evidence.

Protecting the integrity of your forensic infrastructures

Once you’ve built the organization, account structure, and roles, you must decide on the best strategy inside the account itself. Analysis of the collected artifacts can be done through forensic analysis tools hosted on an EC2 instance, ideally residing within a dedicated Amazon VPC in the forensics account. This Amazon VPC should be configured with the same restrictive approach you’ve taken so far, being fully isolated and auditable, with the only resources being dedicated to the forensic tasks at hand.

This might mean that the Amazon VPC’s subnets will have no internet gateways, and therefore all S3 access must be done through an S3 VPC endpoint. VPC flow logging should be enabled at the Amazon VPC level so that there are records of all network traffic. Security groups should be highly restrictive, and deny all ports that aren’t related to the requirements of the forensic tools. SSH and RDP access should be restricted and governed by auditable mechanisms such as a bastion host configured to log all connections and activity, AWS Systems Manager Session Manager, or similar.

If using Systems Manager Session Manager with a graphical interface is required, RDP or other methods can still be accessed. Commands and responses performed using Session Manager can be logged to Amazon CloudWatch and an S3 bucket, this allows auditing of all commands executed on the forensic tooling Amazon EC2 instances. Administrative privileges can also be restricted if required. You can also arrange to receive an Amazon Simple Notification Service (Amazon SNS) notification when a new session is started.

Given that the Amazon EC2 forensic tooling instances might not have direct access to the internet, you might need to create a process to preconfigure and deploy standardized Amazon Machine Images (AMIs) with the appropriate installed and updated set of tooling for analysis. Several best practices apply around this process. The OS of the AMI should be hardened to reduce its vulnerable surface. We do this by starting with an approved OS image, such as an AWS-provided AMI or one you have created and managed yourself. Then proceed to remove unwanted programs, packages, libraries, and other components. Ensure that all updates and patches—security and otherwise—have been applied. Configuring a host-based firewall is also a good precaution, as well as host-based intrusion detection tools. In addition, always ensure the attached disks are encrypted.

If your operating system is supported, we recommend creating golden images using EC2 Image Builder. Your golden image should be rebuilt and updated at least monthly, as you want to ensure it’s kept up to date with security patches and functionality.

EC2 Image Builder—combined with other tools—facilitates the hardening process; for example, allowing the creation of automated pipelines that produce Center for Internet Security (CIS) benchmark hardened AMIs. If you don’t want to maintain your own hardened images, you can find CIS benchmark hardened AMIs on the AWS Marketplace.

Keep in mind the infrastructure requirements for your forensic tools—such as minimum CPU, memory, storage, and networking requirements—before choosing an appropriate EC2 instance type. Though a variety of instance types are available, you’ll want to ensure that you’re keeping the right balance between cost and performance based on your minimum requirements and expected workloads.

The goal of this environment is to provide an efficient means to collect evidence, perform a comprehensive investigation, and effectively return to safe operations. Evidence is best acquired through the automated strategies discussed in How to automate incident response in the AWS Cloud for EC2 instances. Hashing evidence artifacts immediately upon acquisition is highly recommended in your evidence collection process. Hashes, and in turn the evidence itself, can then be validated after subsequent transfers and accesses, ensuring the integrity of the evidence is maintained. Preserving the original evidence is crucial if legal action is taken.

Evidence and artifacts can consist of, but aren’t limited to:

Access to the control plane logs mentioned above—such as the CloudTrail logs—can be accessed in one of two ways. Ideally, the logs should reside in a central location with read-only access for investigations as needed. However, if not centralized, read access can be given to the original logs within the source account as needed. Read access to certain service logs found within the security account, such as AWS Config, Amazon GuardDuty, Security Hub, and Amazon Detective, might be necessary to correlate indicators of compromise with evidence discovered during the analysis.

As previously mentioned, it’s imperative to have immutable versions of all evidence. This can be achieved in many ways, including but not limited to the following examples:

  • Amazon EBS snapshots, including hibernation generated memory dumps:
    • Original Amazon EBS disks are snapshotted, shared to the forensics account, used to create a volume, and then mounted as read-only for offline analysis.
  • Amazon EBS volumes manually captured:
    • Linux tools such as dc3dd can be used to stream a volume to an S3 bucket, as well as provide a hash, and then made immutable using an S3 method from the next bullet point.
  • Artifacts stored in an S3 bucket, such as memory dumps and other artifacts:
    • S3 Object Lock prevents objects from being deleted or overwritten for a fixed amount of time or indefinitely.
    • Using MFA delete requires the requestor to use multi-factor authentication to permanently delete an object.
    • Amazon S3 Glacier provides a Vault Lock function if you want to retain immutable evidence long term.
  • Disk volumes:
    • Linux: Mount in read-only mode.
    • Windows: Use one of the many commercial or open-source write-blocker applications available, some of which are specifically made for forensic use.
  • CloudTrail:
  • AWS Systems Manager inventory:
  • AWS Config data:
    • By default, AWS Config stores data in an S3 bucket, and can be protected using the above methods.

Note: AWS services such as KMS can help enable encryption. KMS is integrated with AWS services to simplify using your keys to encrypt data across your AWS workloads.

An example use case of Amazon EBS disks being shared as evidence to the forensics account, the following figure—Figure 2—is a simplified S3 bucket folder structure you could use to store and work with evidence.

Figure 2 shows an S3 bucket structure for a forensic account. An S3 bucket and folder is created to hold incoming data—for example, from Amazon EBS disks—which is streamed to Incoming Data > Evidence Artifacts using dc3dd. The data is then copied from there to a folder in another bucket—Active Investigation > Root Directory > Extracted Artifacts—to be analyzed by the tooling installed on your forensic Amazon EC2 instance. Also, there are folders under Active Investigation for any investigation notes you make during analysis, as well as the final reports, which are discussed at the end of this blog post. Finally, a bucket and folders for legal holds, where an object lock will be placed to hold evidence artifacts at a specific version.

Figure 2: Forensic account S3 bucket structure

Figure 2: Forensic account S3 bucket structure

Considerations

Finally, depending on the severity of the incident, your on-premises network and infrastructure might also be compromised. Having an alternative environment for your security responders to use in case of such an event reduces the chance of not being able to respond in an emergency. Amazon services such as Amazon Workspaces—a fully managed persistent desktop virtualization service—can be used to provide your responders a ready-to-use, independent environment that they can use to access the digital forensics and incident response tools needed to perform incident-related tasks.

Aside from the investigative tools, communications services are among the most critical for coordination of response. You can use Amazon WorkMail and Amazon Chime to provide that capability independent of normal channels.

Conclusion

The goal of a forensic investigation is to provide a final report that’s supported by the evidence. This includes what was accessed, who might have accessed it, how it was accessed, whether any data was exfiltrated, and so on. This report might be necessary for legal circumstances, such as criminal or civil investigations or situations requiring breach notifications. What output each circumstance requires should be determined in advance in order to develop an appropriate response and reporting process for each. A root cause analysis is vital in providing the information required to prepare your resources and environment to help prevent a similar incident in the future. Reports should not only include a root cause analysis, but also provide the methods, steps, and tools used to arrive at the conclusions.

This article has shown you how you can get started creating and maintaining forensic environments, as well as enable your teams to perform advanced incident resolution investigations using AWS services. Implementing the groundwork for your forensics environment, as described above, allows you to use automated disk collection to begin iterating on your forensic data collection capabilities and be better prepared when security events occur.

If you have feedback about this post, submit comments in the Comments section below. If you have questions about this post, start a new thread on one of the AWS Security, Identity, and Compliance forums or contact AWS Support.
Want more AWS Security how-to content, news, and feature announcements? Follow us on Twitter.

Author

Sol Kavanagh

Sol is a senior solutions architect and CISSP with 20+ years of experience in the enterprise space. He is passionate about security and helping customers build solutions in the AWS Cloud. In his spare time he enjoys distance cycling, adventure travelling, Buddhist philosophy, and Muay Thai.

How to automate forensic disk collection in AWS

Post Syndicated from Matt Duda original https://aws.amazon.com/blogs/security/how-to-automate-forensic-disk-collection-in-aws/

In this blog post you’ll learn about a hands-on solution you can use for automated disk collection across multiple AWS accounts. This solution will help your incident response team set up an automation workflow to capture the disk evidence they need to analyze to determine scope and impact of potential security incidents. This post includes AWS CloudFormation templates and all of the required AWS Lambda functions, so you can deploy this solution in your own environment. This post focuses primarily on two sources as the origination of the evidence collection workflow: AWS Security Hub and Amazon GuardDuty.

Why is automating forensic disk collection important?

AWS offers unique scaling capabilities in our compute environments. As you begin to increase your number of compute instances across multiple AWS accounts or organizations, you will find operational aspects of your business that must also scale. One of these critical operational tasks is the ability to quickly gather forensically sound disk and memory evidence during a security event.

During a security event, your incident response (IR) team must be able to collect and analyze evidence quickly while maintaining accuracy for the time period surrounding the event. It is both challenging and time consuming for the IR team to manually collect all of the relevant evidence in a cloud environment, across a large number of instances and accounts. Additionally, manual collection requires time that could otherwise be spent analyzing and responding to an event. Every role assumption, every console click, and every manual trigger required by the IR team, adds time for an attacker to continue to work through systems to meet their objectives.

Indicators of compromise (IoCs) are pieces of data that IR teams often use to identify potential suspicious activity within networks that might need further investigation. These IoCs can include file hashes, domains, IP addresses, or user agent strings. IoCs are used by services such as GuardDuty to help you discover potentially malicious activity in your accounts. For example, when you are alerted that an Amazon Elastic Compute Cloud (Amazon EC2) instance contains one or more IoCs, your IR team must gather a point-in-time copy of relevant forensic data to determine the root cause, and evaluate the likelihood that the finding requires action. This process involves gathering snapshots of any and all attached volumes, a live dump of the system’s memory, a capture of the instance metadata, and any logs that relate to the instance. These sources help your IR team to identify next steps and work towards a root cause.

It is important to take a point-in-time snapshot of an instance as close in time to the incident as possible. If there is a delay in capturing the snapshot, it can alter or make evidence unusable because the data has changed or been deleted. To take this snapshot quickly, you need a way to automate the collection and delivery of potentially hundreds of disk images while ensuring each snapshot is collected in the same way and without creating a bottleneck in the pipeline that could reduce the integrity of the evidence. In this blog post, I explain the details of the automated disk collection workflow, and explain why you might make different design decisions. You can download the solutions in CloudFormation, so that you can deploy this solution and get started on your own forensic automation workflows.

AWS Security Hub provides an aggregated view of security findings across AWS accounts, including findings produced by GuardDuty, when enabled. Security Hub also provides you with the ability to ingest custom or third-party findings, which makes it an excellent starting place for automation. This blog post uses EC2 GuardDuty findings collected into Security Hub as the example, but you can also use the same process to include custom detection events, or alerts from partner solutions such as CrowdStrike, McAfee, Sophos, Symantec, or others.

Infrastructure overview

The workflow described in this post automates the tasks that an IR team commonly takes during the course of an investigation.

Overview of disk collection workflow

The high-level disk collection workflow steps are as follows:

  1. Create a snapshot of each Amazon Elastic Block Store (Amazon EBS) volume attached to suspected instances.
  2. Create a folder in the Amazon Simple Storage Service (Amazon S3) evidence bucket with the original event data.
  3. Launch one Amazon EC2 instance per EBS volume, to be used in streaming a bit-for-bit copy of the EBS snapshot volume. These EC2 instances are launched without SSH key pairs, to help prevent any unintentional evidence corruption and to ensure consistent processing without user interaction. The EC2 instances use third-party tools dc3dd and incrond to trigger and process volumes.
  4. Write all logs from the workflow and instances to Amazon CloudWatch Logs log groups, for audit purposes.
  5. Include all EBS volumes in the S3 evidence bucket as raw image files (.dd), with the metadata from the automated capture process, as well as hashes for validation and verification.

Overview of AWS services used in the workflow

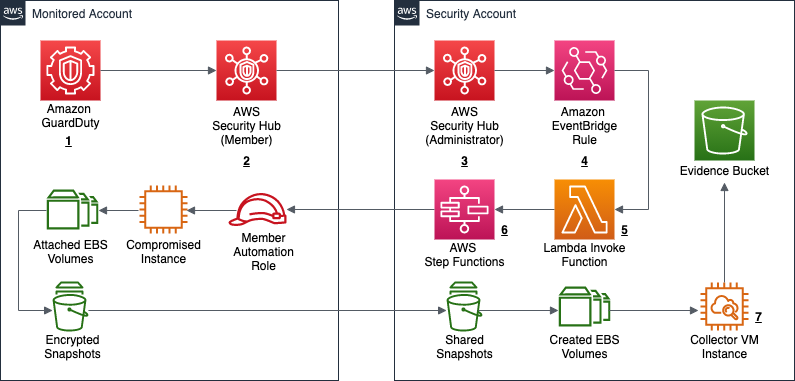
Another way of looking at this high-level workflow is from the service perspective, as shown in Figure 1.

Figure 1: Service workflow for forensic disk collection

Figure 1: Service workflow for forensic disk collection

The workflow in Figure 1 shows the following steps:

  1. A GuardDuty finding is triggered for an instance in a monitored account. This example focuses on a GuardDuty finding, but the initial detection source can also be a custom event, or an event from a third party.
  2. The Security Hub service in the monitored account receives the GuardDuty finding, and forwards it to the Security Hub service in the security account.
  3. The Security Hub service in the security account receives the monitored account’s finding.
  4. The Security Hub service creates an event over Amazon EventBridge for the GuardDuty findings, which is then caught by an EventBridge rule to forward to the DiskForensicsInvoke Lambda function. The following is the example event rule, which is included in the deployment. This example can be expanded or reduced to fit your use-case. By default, the example is set to disabled in CloudFormation. When you are ready to use the automation, you will need to enable it.
    {
      "detail-type": [
        "Security Hub Findings - Imported"
      ],
      "source": [
        "aws.securityhub"
      ],
      "detail": {
        "findings": {
          "ProductFields": {
            "aws/securityhub/SeverityLabel": [
              "CRITICAL",
              "HIGH",
              "MEDIUM"
            ],
            "aws/securityhub/ProductName": [
              "GuardDuty"
            ]
          }
        }
      }
    }
    

  5. The DiskForensicsInvoke Lambda function receives the event from EventBridge, formats the event, and provides the formatted event as input to AWS Step Functions workflow.
  6. The DiskForensicStepFunction workflow includes ten Lambda functions, from initial snapshot to streaming the evidence to the S3 bucket. After the Step Functions workflow enters the CopySnapshot state, it converts to a map state. This allows the workflow to have one thread per volume submitted, and ensures that each volume will be placed in the evidence bucket as quickly as possible without needing to wait for other steps to complete.
    Figure 2: Forensic disk collection Step Function workflow

    Figure 2: Forensic disk collection Step Function workflow

    As shown in Figure 2, the following are the embedded Lambda functions in the DiskForensicStepFunction workflow:

    1. CreateSnapshot – This function creates the initial snapshots for each EBS volume attached to the instance in question. It also records instance metadata that is included with the snapshot data for each EBS volume.
      Required Environmental Variables: ROLE_NAME, EVIDENCE_BUCKET, LOG_GROUP
    2. CheckSnapshot – This function checks to see if the snapshots from the previous step are completed. If not, the function retries with an exponential backoff.
      Required Environmental Variable: ROLE_NAME
    3. CopySnapshot – This function copies the initial snapshot and ensures that it is using the forensics AWS Key Management Service (AWS KMS) key. This key is stored in the security account and will be used throughout the remainder of the process.
      Required Environmental Variables: ROLE_NAME, KMS_KEY
    4. CheckCopySnapshot – This function checks to see if the snapshot from the previous step is completed. If not, the function retries with exponential backoff.
      Required Environmental Variable: ROLE_NAME
    5. ShareSnapshot – This function takes the copied snapshot using the forensics KMS key, and shares it with the security account.
      Required Environmental Variables: ROLE_NAME, SECURITY_ACCOUNT
    6. FinalCopySnapshot – This function copies the shared snapshot into the security account, as the original shared snapshot is still owned by the monitored account. This ensures that a copy is available, in case it has to be referenced for additional processing later.
      Required Environmental Variable: KMS_KEY
    7. FinalCheckSnapshot – This function checks to see if the snapshot from the previous step is completed. If not, the function fails and it retries with an exponential backoff.
    8. CreateVolume – This function creates an EBS Magnetic volume from the snapshot in the previous step. These volumes created use magnetic disks, because they are required for consistent hash results from the dc3dd process. This volume cannot use a solid state drive (SSD), because the hash would be different each time. If the EBS Magnetic volume size is greater than or equal to 500GB, then Amazon EBS switches from using standard EBS Magnetic volumes to Throughput Optimized HDD (st1) volumes.
      Required Environmental Variables: KMS_KEY, SUPPORTED_AZS
    9. RunInstance – This function launches one EC2 instance per volume, to be used in streaming the volume to the S3 bucket. The AMI passed by the environmental variable needs to be created using the provided Amazon EC2 Image Builder pipeline before deploying the environment. This function also passes some user data to the instance, artifact bucket, source volume name, and the incidentID. This information is used by the instance when placing the evidence into the S3 bucket.
      Required Environmental Variables: AMI_ID, INSTANCE_PROFILE_NAME, VPC_ID, SECURITY_GROUP
    10. CreateInstanceWait – This function creates a 30-second wait, to allow the instance some additional time to spin up.
    11. MountForensicVolume – This function checks the CloudWatch log group ForensicDiskReadiness, to see that the incrond service is running on the instance. If the incrond service is running, the function attaches the volume to the instance and then writes the final logs to the S3 bucket and CloudWatch Logs.
      Required Environmental Variable: LOG_GROUP
  7. The instance that is created has pre-built tools and scripts on it from the template below using Image Builder. This instance uses the incrond tool to monitor /dev/disk/by-label for new devices being attached to the instance. After the MountForensicVolume Lambda function attaches the volume to the instance, a file is created in the /dev/disk/by-label directory for the attached volume. The incrond daemon starts the orchestrator script, which calls the collector script. The collector script uses the dc3dd tool to stream the bit-for-bit copy of the volume to S3. After the copy has completed, the image shuts down and is terminated. All logs from the process are sent to the S3 bucket and CloudWatch Logs.

The solution provided in the post includes the CloudFormation templates you need to get started, except for creation the initial EventBridge rule (which is provided in step 4 of the previous section). The solution includes an isolated VPC, subnets, security groups, roles, and more. The VPC provided does not provide any egress through an internet gateway or NAT gateway, and that is the recommended solution. The only connectivity provided is through the S3 gateway VPC endpoint and the CloudWatch Logs interface VPC endpoint (also deployed in the template).

Deploy the CloudFormation templates

To implement the solution outlined in this post, you need to deploy three separate AWS CloudFormation templates in the order described in this section.

diskForensicImageBuilder (security account)

First, you deploy diskForensicImageBuilder in the security account. This template contains the resources and AMIs needed to create and run the Image Builder pipeline that is required to build the collector VM. This pipeline installs the required binaries, and scripts, and updates the system.

Note: diskForensicImageBuilder is configured to use the default VPC and security group. If you have added restrictions or deleted your default VPC, you will need to modify the template.

To deploy the diskForensicImageBuilder template

  1. To open the AWS CloudFormation console pre-loaded with the template, choose the following Launch Stack button.
    Select the Launch Stack button to launch the template
  2. In the AWS CloudFormation console, on the Specify Details page, enter a name for the stack.
  3. Leave all default settings in place, and choose Next to configure the stack options.
  4. Choose Next to review and scroll to the bottom of the page. Select the check box under the Capabilities section, next to of the acknowledgement:
    • I acknowledge that AWS CloudFormation might create IAM resources with custom names.
  5. Choose Create Stack.
  6. After the Image Builder pipeline has been created, on the Image pipelines page, choose Actions and select Run pipeline to manually run the pipeline to create the base AMI.

    Figure 3: Run the new Image Builder pipeline

    Figure 3: Run the new Image Builder pipeline

diskForensics (security account)

Second, you deploy diskForensics in the security account. This is a nested CloudFormation stack containing four CloudFormation templates. The four CloudFormation templates are as follows:

  1. forensicResources – This stack holds all of the foundation for the solution, including the VPC and networking components, the S3 evidence bucket, CloudWatch log groups, and collectorVM instance profile.

    Figure 4: Forensics VPC

    Figure 4: Forensics VPC

  2. forensicFunctions – This stack contains all of the Lambda functions referenced in the Step Functions workflow as well as the role used by the Lambda functions.
  3. forensicStepFunction – This stack contains the Step Functions code, the role used by the Step Functions service, and the CloudWatch log group used by the service. It also contains an Amazon Simple Notification Service (SNS) topic used to alert on pipeline failure.
  4. forensicStepFunctionInvoke – This stack contains the DiskForensicsInvoke Lambda function and the role used by that Lambda function that allows it to call the Step Function workflow.

Note: You need to have the following required variables to continue:

  • ArtifactBucketName
  • ORGID
  • ForensicsAMI

If your accounts are not using AWS Organizations, you can use a dummy string for now. It adds a condition statement to the forensics KMS key that you can update or remove later.

To deploy the diskForensics stack

  1. To open the AWS CloudFormation console pre-loaded with the template, choose the following Launch Stack button.
    Select the Launch Stack button to launch the template
  2. In the AWS CloudFormation console, on the Specify Details page, enter a name for the stack.
  3. For the ORGID field, enter the AWS Organizations ID.

    Note: If you are not using AWS organizations, leave the default string. If you are deploying as multi-account without AWS Organizations, you will need to update the KMS key policy to remove the principalOrgID condition statements, and add the correct principals.

  4. For the ArtifactBucketName field, enter the S3 bucket name you would like to use for your forensic artifacts.

    Important: The ArtifactBucketName must be a globally unique name.

  5. For the ForensicsAMI field, enter the AMI ID for the image that was created by Image Builder.
  6. For the example in this post, leave the default values for all other fields. Customizing these fields allows you to customize this code example for your own purposes.
  7. Choose Next to configure the stack options and leave all default settings in place.
  8. Choose Next to review and scroll to the bottom of the page. Select the two check boxes under the Capabilities section, next to each of the acknowledgements:
    • I acknowledge that AWS CloudFormation might create IAM resources with custom names.
    • I acknowledge that AWS CloudFormation might require the following capability: CAPABILITY_AUTO_EXPAND.
  9. Choose Create Stack.
  10. After the stack has completed provisioning, subscribe to the Amazon SNS topic to receive pipeline alerts.

diskMember (each monitored account)

Third, you deploy diskMember in each monitored account. This stack contains the role and policy that the automation workflow needs to assume, so that it can create the initial snapshots and share the snapshot with the security account. If you are deploying this solution in a single account, you deploy diskMember in the security account.

Important: Ensure that all KMS keys that could be used to encrypt EBS volumes in each monitored account grant this role the ability to CreateGrant, Encrypt, Decrypt, ReEncrypt*, GenerateDataKey*, and Describe key. The default policy grants the permissions in AWS Identity and Access Management (IAM), but any restrictive resource policies could block the ability to create the initial snapshot and decrypt the snapshot when making the copy.

To deploy the diskMember stack

  1. To open the AWS CloudFormation console pre-loaded with the template, choose the following Launch Stack button.
    Select the Launch Stack button to launch the template
    If deploying across multiple accounts, consider using AWS CloudFormation StackSets for simplified multi-account deployment.
  2. In the AWS CloudFormation console, on the Specify Details page, enter a name for the stack.
  3. For the MasterAccountNum field, enter the account number for your security administrator account.
  4. Choose Next to configure the stack options and leave all default settings in place.
  5. Choose Next to review and scroll to the bottom of the page. Select the check box under the Capabilities section, next to the acknowledgement:
    • I acknowledge that AWS CloudFormation might create IAM resources with custom names.
  6. Choose Create Stack.

Test the solution

Next, you can try this solution with an event sample to start the workflow.

To initiate a test run

  1. Copy the following example GuardDuty event. The example uses the AWS Region us-east-1, but you can update the example to use another Region. Be sure to replace the account ID 0123456789012 with the account number of your monitored account, and replace the instance ID i-99999999 with the instance ID you would like to capture.
    {
      “SchemaVersion”: “2018-10-08”,
      “Id”: “arn:aws:guardduty:us-east-1:0123456789012:detector/f2b82a2b2d8d8541b8c6d2c7d9148e14/finding/b0baa737c3bf7309db2a396651fdb500”,
      “ProductArn”: “arn:aws:securityhub:us-east-1::product/aws/guardduty”,
      “GeneratorId”: “arn:aws:guardduty:us-east-1:0123456789012:detector/f2b82a2b2d8d8541b8c6d2c7d9148e14”,
      “AwsAccountId”: “0123456789012”,
      “Types”: [
        “Effects/Resource Consumption/UnauthorizedAccess:EC2-TorClient”
      ],
      “FirstObservedAt”: “2020-10-22T03:52:13.438Z”,
      “LastObservedAt”: “2020-10-22T03:52:13.438Z”,
      “CreatedAt”: “2020-10-22T03:52:13.438Z”,
      “UpdatedAt”: “2020-10-22T03:52:13.438Z”,
      “Severity”: {
        “Product”: 8,
        “Label”: “HIGH”,
        “Normalized”: 60
      },
      “Title”: “EC2 instance i-99999999 is communicating with Tor Entry node.”,
      “Description”: “EC2 instance i-99999999 is communicating with IP address 198.51.100.0 on the Tor Anonymizing Proxy network marked as an Entry node.”,
      “SourceUrl”: “https://us-east-1.console.aws.amazon.com/guardduty/home?region=us-east-1#/findings?macros=current&fId=b0baa737c3bf7309db2a396651fdb500”,
      “ProductFields”: {
        “aws/guardduty/service/action/networkConnectionAction/remotePortDetails/portName”: “HTTP”,
        “aws/guardduty/service/archived”: “false”,
        “aws/guardduty/service/action/networkConnectionAction/remoteIpDetails/organization/asnOrg”: “GeneratedFindingASNOrg”,
        “aws/guardduty/service/action/networkConnectionAction/remoteIpDetails/Geolocation/lat”: “0”,
        “aws/guardduty/service/action/networkConnectionAction/remoteIpDetails/ipAddressV4”: “198.51.100.0”,
        “aws/guardduty/service/action/networkConnectionAction/remoteIpDetails/Geolocation/lon”: “0”,
        “aws/guardduty/service/action/networkConnectionAction/blocked”: “false”,
        “aws/guardduty/service/action/networkConnectionAction/remotePortDetails/port”: “80”,
        “aws/guardduty/service/action/networkConnectionAction/remoteIpDetails/country/countryName”: “GeneratedFindingCountryName”,
        “aws/guardduty/service/serviceName”: “guardduty”,
        “aws/guardduty/service/action/networkConnectionAction/localIpDetails/ipAddressV4”: “10.0.0.23”,
        “aws/guardduty/service/detectorId”: “f2b82a2b2d8d8541b8c6d2c7d9148e14”,
        “aws/guardduty/service/action/networkConnectionAction/remoteIpDetails/organization/org”: “GeneratedFindingORG”,
        “aws/guardduty/service/action/networkConnectionAction/connectionDirection”: “OUTBOUND”,
        “aws/guardduty/service/eventFirstSeen”: “2020-10-22T03:52:13.438Z”,
        “aws/guardduty/service/eventLastSeen”: “2020-10-22T03:52:13.438Z”,
        “aws/guardduty/service/evidence/threatIntelligenceDetails.0_/threatListName”: “GeneratedFindingThreatListName”,
        “aws/guardduty/service/action/networkConnectionAction/localPortDetails/portName”: “Unknown”,
        “aws/guardduty/service/action/actionType”: “NETWORK_CONNECTION”,
        “aws/guardduty/service/action/networkConnectionAction/remoteIpDetails/city/cityName”: “GeneratedFindingCityName”,
        “aws/guardduty/service/resourceRole”: “TARGET”,
        “aws/guardduty/service/action/networkConnectionAction/localPortDetails/port”: “39677”,
        “aws/guardduty/service/action/networkConnectionAction/protocol”: “TCP”,
        “aws/guardduty/service/count”: “1”,
        “aws/guardduty/service/additionalInfo/sample”: “true”,
        “aws/guardduty/service/action/networkConnectionAction/remoteIpDetails/organization/asn”: “-1”,
        “aws/guardduty/service/action/networkConnectionAction/remoteIpDetails/organization/isp”: “GeneratedFindingISP”,
        “aws/guardduty/service/evidence/threatIntelligenceDetails.0_/threatNames.0_”: “GeneratedFindingThreatName”,
        “aws/securityhub/FindingId”: “arn:aws:securityhub:us-east-1::product/aws/guardduty/arn:aws:guardduty:us-east-1:0123456789012:detector/f2b82a2b2d8d8541b8c6d2c7d9148e14/finding/b0baa737c3bf7309db2a396651fdb500”,
        “aws/securityhub/ProductName”: “GuardDuty”,
        “aws/securityhub/CompanyName”: “Amazon”
      },
      “Resources”: [
        {
          “Type”: “AwsEc2Instance”,
          “Id”: “arn:aws:ec2:us-east-1:0123456789012:instance/i-99999999”,
          “Partition”: “aws”,
          “Region”: “us-east-1”,
          “Tags”: {
            “GeneratedFindingInstaceTag7”: “GeneratedFindingInstaceTagValue7”,
            “GeneratedFindingInstaceTag8”: “GeneratedFindingInstaceTagValue8”,
            “GeneratedFindingInstaceTag9”: “GeneratedFindingInstaceTagValue9”,
            “GeneratedFindingInstaceTag1”: “GeneratedFindingInstaceValue1”,
            “GeneratedFindingInstaceTag2”: “GeneratedFindingInstaceTagValue2”,
            “GeneratedFindingInstaceTag3”: “GeneratedFindingInstaceTagValue3”,
            “GeneratedFindingInstaceTag4”: “GeneratedFindingInstaceTagValue4”,
            “GeneratedFindingInstaceTag5”: “GeneratedFindingInstaceTagValue5”,
            “GeneratedFindingInstaceTag6”: “GeneratedFindingInstaceTagValue6”
          },
          “Details”: {
            “AwsEc2Instance”: {
              “Type”: “m3.xlarge”,
              “ImageId”: “ami-99999999”,
              “IpV4Addresses”: [
                “10.0.0.1”,
                “198.51.100.0”
              ],
              “IamInstanceProfileArn”: “arn:aws:iam::0123456789012:example/instance/profile”,
              “VpcId”: “GeneratedFindingVPCId”,
              “SubnetId”: “GeneratedFindingSubnetId”,
              “LaunchedAt”: “2016-08-02T02:05:06Z”
            }
          }
        }
      ],
      “WorkflowState”: “NEW”,
      “Workflow”: {
        “Status”: “NEW”
      },
      “RecordState”: “ACTIVE”
    }
    

  2. Navigate to the DiskForensicsInvoke Lambda function and add the GuardDuty event as a test event.
  3. Choose Test. You should see a success for the invocation.
  4. Navigate to the Step Functions workflow to monitor its progress. When the instances have terminated, all of the artifacts should be in the S3 bucket with additional logs in CloudWatch Logs.

Expected outputs

The forensic disk collection pipeline maintains logs of the actions throughout the process, and uploads the final artifacts to the S3 artifact bucket and CloudWatch Logs. This enables security teams to send forensic collection logs to log aggregation tools or service management tools for additional integrations. The expected outputs of the solution are detailed in the following sections, organized by destination.

S3 artifact outputs

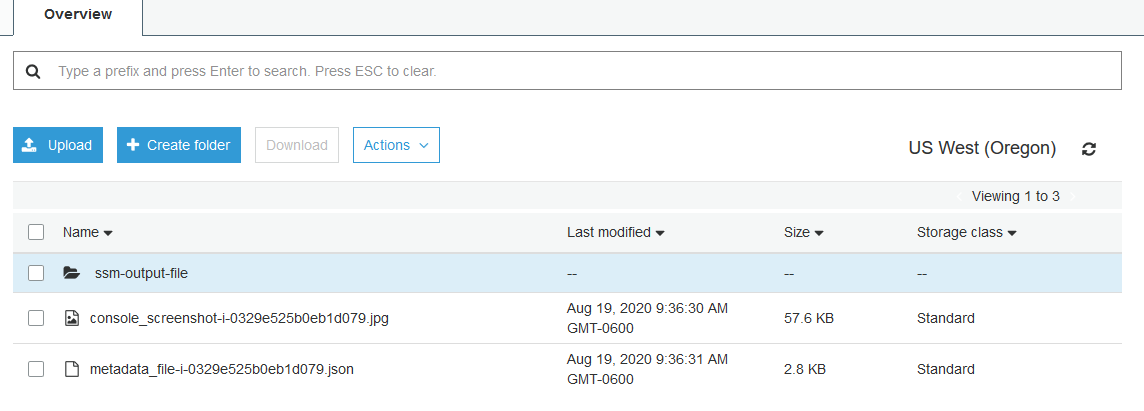
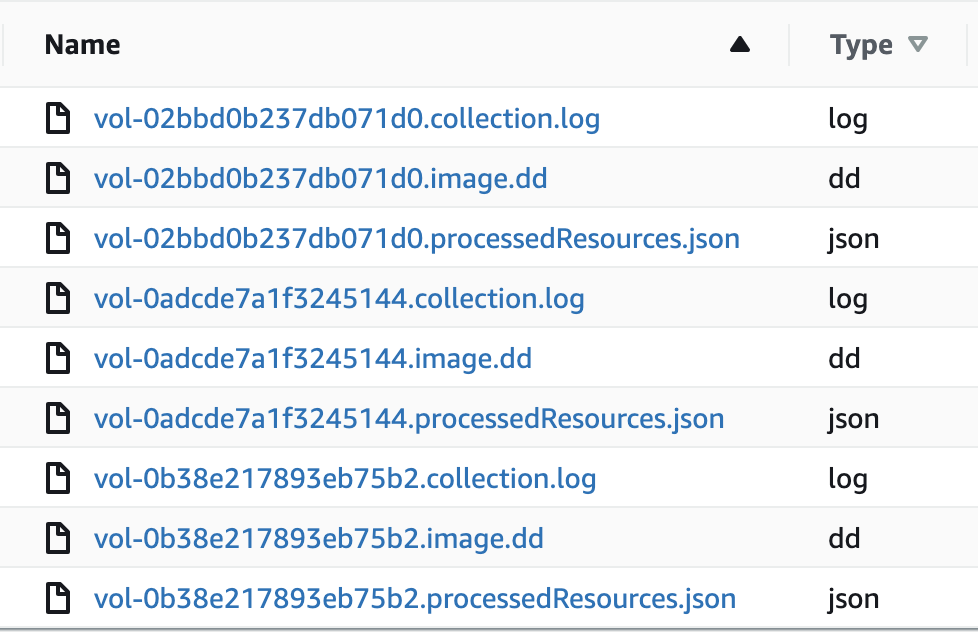
The S3 artifact bucket is the final destination for all logs and the raw disk images. For each security incident that triggers the Step Functions workflow, a new folder will be created with the name of the IncidentID. Included in this folder will be the JSON file that triggered the capture operation, the image (dd) files for the volumes, the capture log, and the resources associated with the capture operation, as shown in Figure 5.

Figure 5: Forensic artifacts in the S3 bucket

Figure 5: Forensic artifacts in the S3 bucket

Forensic Disk Audit log group

The Forensic Disk Audit CloudWatch log group contains a log of where the Step Functions workflow was after creating the initial snapshots in the CreateSnapshot Lambda function. This includes the high-level finding information, as well as the metadata for each snapshot. Also included in this log group is the completed data around each completed disk collection operation, including all associated resources and the location of the forensic evidence in the S3 bucket. The following event is an example log demonstrating a completed capture. Notice all of the metadata provided under captured snapshots. Be sure to update the example to use the correct AWS Region. Replace the account ID 0123456789012 with the account number of your monitored account, and replace the instance ID i-99999999 with the instance ID you would like to capture.

{
  "AwsAccountId": "0123456789012",
  "Types": [
    "Effects/Resource Consumption/UnauthorizedAccess:EC2-TorClient"
  ],
  "FirstObservedAt": "2020-10-22T03:52:13.438Z",
  "LastObservedAt": "2020-10-22T03:52:13.438Z",
  "CreatedAt": "2020-10-22T03:52:13.438Z",
  "UpdatedAt": "2020-10-22T03:52:13.438Z",
  "Severity": {
    "Product": 8,
    "Label": "HIGH",
    "Normalized": 60
  },
  "Title": "EC2 instance i-99999999 is communicating with Tor Entry node.",
  "Description": "EC2 instance i-99999999 is communicating with IP address 198.51.100.0 on the Tor Anonymizing Proxy network marked as an Entry node.",
  "FindingId": "arn:aws:securityhub:us-east-1::product/aws/guardduty/arn:aws:guardduty:us-east-1:0123456789012:detector/f2b82a2b2d8d8541b8c6d2c7d9148e14/finding/b0baa737c3bf7309db2a396651fdb500",
  "Resource": {
    "Type": "AwsEc2Instance",
    "Arn": "arn:aws:ec2:us-east-1:0123456789012:instance/i-99999999",
    "Id": "i-99999999",
    "Partition": "aws",
    "Region": "us-east-1",
    "Details": {
      "AwsEc2Instance": {
        "Type": "m3.xlarge",
        "ImageId": "ami-99999999",
        "IpV4Addresses": [
          "10.0.0.1",
          "198.51.100.0"
        ],
        "IamInstanceProfileArn": "arn:aws:iam::0123456789012:example/instance/profile",
        "VpcId": "GeneratedFindingVPCId",
        "SubnetId": "GeneratedFindingSubnetId",
        "LaunchedAt": "2016-08-02T02:05:06Z"
      }
    }
  },
  "EvidenceBucket": "forensic-artifact-bucket",
  "IncidentID": "b0baa737c3bf7309db2a396651fdb500",
  "CapturedSnapshots": [
    {
      "SourceSnapshotID": "snap-99999999",
      "SourceVolumeID": "vol-99999999",
      "SourceDeviceName": "/dev/xvda",
      "VolumeSize": 100,
      "InstanceID": "i-99999999",
      "FindingID": "arn:aws:securityhub:us-east-1::product/aws/guardduty/arn:aws:guardduty:us-east-1:0123456789012:detector/f2b82a2b2d8d8541b8c6d2c7d9148e14/finding/b0baa737c3bf7309db2a396651fdb500",
      "IncidentID": "b0baa737c3bf7309db2a396651fdb500",
      "AccountID": "0123456789012",
      "Region": "us-east-1",
      "EvidenceBucket": "forensic-artifact-bucket"
    }
  ]
}
{
  "SourceSnapshotID": "snap-99999999",
  "SourceVolumeID": "vol-99999999",
  "SourceDeviceName": "/dev/sdd",
  "VolumeSize": 100,
  "InstanceID": "i-99999999",
  "FindingID": "arn:aws:securityhub:us-east-1::product/aws/guardduty/arn:aws:guardduty:us-east-1:0123456789012:detector/f2b82a2b2d8d8541b8c6d2c7d9148e14/finding/b0baa737c3bf7309db2a396651fdb500",
  "IncidentID": "b0baa737c3bf7309db2a396651fdb500",
  "AccountID": "0123456789012",
  "Region": "us-east-1",
  "EvidenceBucket": "forensic-artifact-bucket",
  "CopiedSnapshotID": "snap-99999998",
  "EncryptionKey": "arn:aws:kms:us-east-1:0123456789012:key/e793cbd3-ce6a-4b17-a48f-7e78984346f2",
  "FinalCopiedSnapshotID": "snap-99999997",
  "ForensicVolumeID": "vol-99999998",
  "VolumeAZ": "us-east-1a",
  "ForensicInstances": [
    "i-99999998"
  ],
  "DiskImageLocation": "s3://forensic-artifact-bucket/b0baa737c3bf7309db2a396651fdb500/disk_evidence/vol-99999999.image.dd"
}

Forensic Disk Capture log group

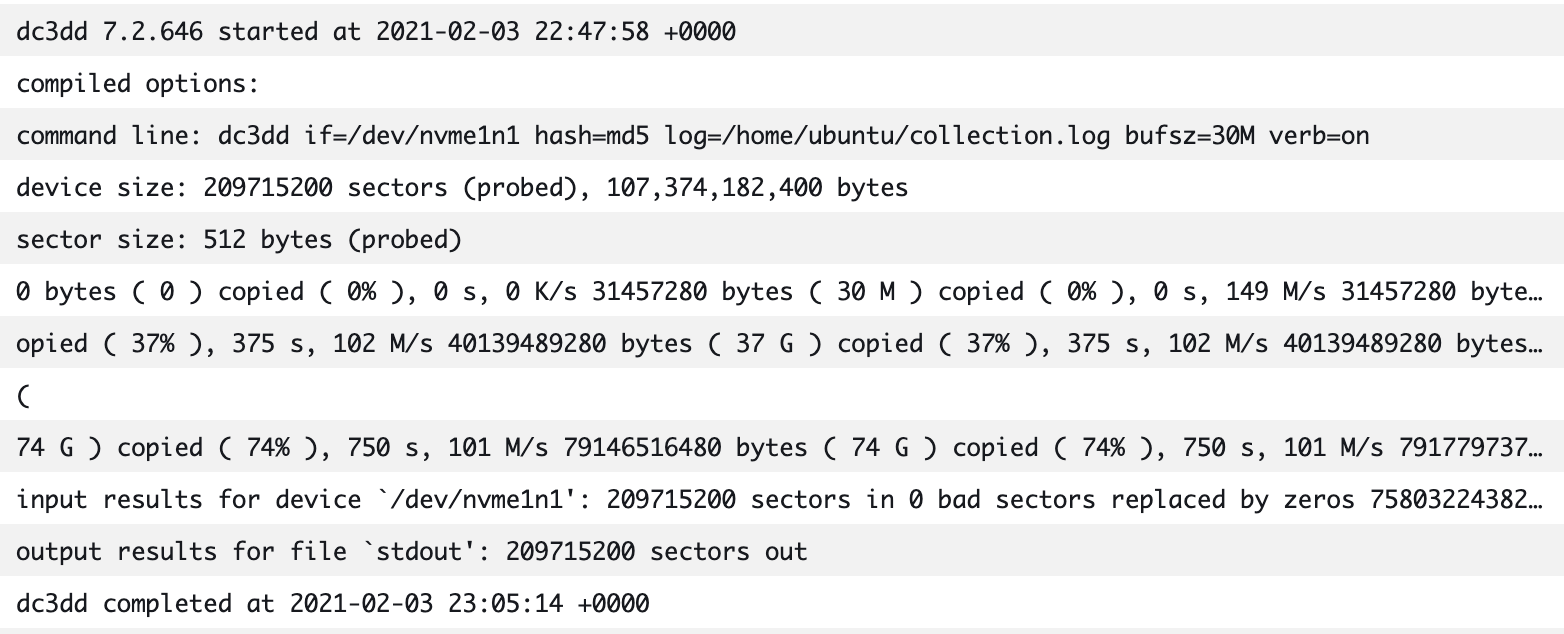
The Forensic Disk Capture CloudWatch log group contains the logs from the EC2Collector VM. These logs detail the operations taken by the instance, which include when the dc3dd command was executed, what the transfer speed was to the S3 bucket, what the hash of the volume was, and how long the total operation took to complete. The log example in Figure 6 shows the output of the disk capture on the collector instance.

Figure 6: Forensic Disk Capture logs

Figure 6: Forensic Disk Capture logs

Cost and capture times

This solution may save you money over a traditional system that requires bastion hosts (jump boxes) and forensic instances to be readily available. With AWS, you pay only for the individual services you need, for as long as you use them. The cost of this solution is minimal, because charges are only incurred based on the logs or artifacts that you store in CloudWatch or Amazon S3, and the invocation of the Step Functions workflow. Additionally, resources such as the collectorVM are only created and used when needed.

This solution can also save you time. If an analyst was manually working through this workflow, it could take significantly more time than the automated solution. The following are some examples of collection times. You can see that even when the manual workflow time increases, the automated workflow time stays the same, because of how the solution scales.

Scenario 1: EC2 instance with one 8GB volume

  • Automated workflow: 11 minutes
  • Manual workflow: 15 minutes

Scenario 2: EC2 instance with four 8GB volumes

  • Automated workflow: 11 minutes
  • Manual workflow: 1 hour 10 minutes

Scenario 3: Four EC2 instances with one 8GB volume each

  • Automated workflow: 11 minutes
  • Manual workflow: 1 hour 20 minutes

Clean up and delete artifacts

To clean up the artifacts from the solution in this post, first delete all information in your artifact S3 bucket. Then delete the diskForensics stack, followed by the diskForensicImageBuilder stack, and finally the diskMember stack. You must also manually delete any EBS volumes or EBS snapshots created by the pipeline, these are not deleted automatically. You must also manually delete the AMI and images that are created and published by Image Builder.

Considerations

This solution covers EBS volume storage as the target for forensic disk capture. If your instances use Amazon EC2 Instance Stores in your environment, then you cannot snapshot and copy those volumes, because that data is not included in an EC2 snapshot operation. Instead, you should consider running the commands that are included in collector.sh script with AWS Systems Manager. The collector.sh script is included in the Image Builder recipe and uses dc3dd to stream a copy of the volume to Amazon S3.

Conclusion

Having this solution in place across your AWS accounts will enable fast response times to security events, as it helps ensure that forensic artifacts are collected and stored as quickly as possible. Download the .zip file for the solutions in CloudFormation, so that you can deploy this solution and get started on your own forensic automation workflows. For the talks describing this solution, see the video of SEC306 from Re:Invent 2020 and the AWS Online Tech Talk AWS Digital Forensics Automation at Goldman Sachs.

If you have feedback about this post, submit comments in the Comments section below. If you have questions about this post, start a new thread on the Amazon GuardDuty forum or contact AWS Support.
Want more AWS Security how-to content, news, and feature announcements? Follow us on Twitter.

Author

Matt Duda

Matt is a Senior Cloud Security Architect with AWS Professional Services. He has an extensive background in Cyber Security in the Financial Services Sector. He is obsessed with helping customers improve their ability to prevent, prepare, and respond to potential security events in AWS and utilizing automation wherever possible.

Contributor

Special thanks to Logan Bair who made significant contributions to this post.

How to visualize multi-account Amazon Inspector findings with Amazon Elasticsearch Service

Post Syndicated from Moumita Saha original https://aws.amazon.com/blogs/security/how-to-visualize-multi-account-amazon-inspector-findings-with-amazon-elasticsearch-service/

Amazon Inspector helps to improve the security and compliance of your applications that are deployed on Amazon Web Services (AWS). It automatically assesses Amazon Elastic Compute Cloud (Amazon EC2) instances and applications on those instances. From that assessment, it generates findings related to exposure, potential vulnerabilities, and deviations from best practices.

You can use the findings from Amazon Inspector as part of a vulnerability management program for your Amazon EC2 fleet across multiple AWS Regions in multiple accounts. The ability to rank and efficiently respond to potential security issues reduces the time that potential vulnerabilities remain unresolved. This can be accelerated within a single pane of glass for all the accounts in your AWS environment.

Following AWS best practices, in a secure multi-account AWS environment, you can provision (using AWS Control Tower) a group of accounts—known as core accounts, for governing other accounts within the environment. One of the core accounts may be used as a central security account, which you can designate for governing the security and compliance posture across all accounts in your environment. Another core account is a centralized logging account, which you can provision and designate for central storage of log data.

In this blog post, I show you how to:

  1. Use Amazon Inspector, a fully managed security assessment service, to generate security findings.
  2. Gather findings from multiple Regions across multiple accounts using Amazon Simple Notification Service (Amazon SNS) and Amazon Simple Queue Service (Amazon SQS).
  3. Use AWS Lambda to send the findings to a central security account for deeper analysis and reporting.

In this solution, we send the findings to two services inside the central security account:

Solution overview

Overall architecture

The flow of events to implement the solution is shown in Figure 1 and described in the following process flow.

Figure 1: Solution overview architecture

Figure 1: Solution overview architecture

Process flow

The flow of this architecture is divided into two types of processes—a one-time process and a scheduled process. The AWS resources that are part of the one-time process are triggered the first time an Amazon Inspector assessment template is created in each Region of each application account. The AWS resources of the scheduled process are triggered at a designated interval of Amazon Inspector scan in each Region of each application account.

One-time process

  1. An event-based Amazon CloudWatch rule in each Region of every application account triggers a regional AWS Lambda function when an Amazon Inspector assessment template is created for the first time in that Region.

    Note: In order to restrict this event to trigger the Lambda function only the first time an assessment template is created, you must use a specific user-defined tag to trigger the Attach Inspector template to SNS Lambda function for only one Amazon Inspector template per Region. For more information on tags, see the Tagging AWS resources documentation.

  2. The Lambda function attaches the Amazon Inspector assessment template (created in application accounts) to the cross-account Amazon SNS topic (created in the security account). The function, the template, and the topic are all in the same AWS Region.

    Note: This step is needed because Amazon Inspector templates can only be attached to SNS topics in the same account via the AWS Management Console or AWS Command Line Interface (AWS CLI).

Scheduled process

  1. A scheduled Amazon CloudWatch Event in every Region of the application accounts starts the Amazon Inspector scan at a scheduled time interval, which you can configure.
  2. An Amazon Inspector agent conducts the scan on the EC2 instances of the Region where the assessment template is created and sends any findings to Amazon Inspector.
  3. Once the findings are generated, Amazon Inspector notifies the Amazon SNS topic of the security account in the same Region.
  4. The Amazon SNS topics from each Region of the central security account receive notifications of Amazon Inspector findings from all application accounts. The SNS topics then send the notifications to a central Amazon SQS queue in the primary Region of the security account.
  5. The Amazon SQS queue triggers the Send findings Lambda function (as shown in Figure 1) of the security account.

    Note: Each Amazon SQS message represents one Amazon Inspector finding.

  6. The Send findings Lambda function assumes a cross-account role to fetch the following information from all application accounts:
    1. Finding details from the Amazon Inspector API.
    2. Additional Amazon EC2 attributes—VPC, subnet, security group, and IP address—from EC2 instances with potential vulnerabilities.
  7. The Lambda function then sends all the gathered data to a central S3 bucket and a domain in Amazon ES—both in the central security account.

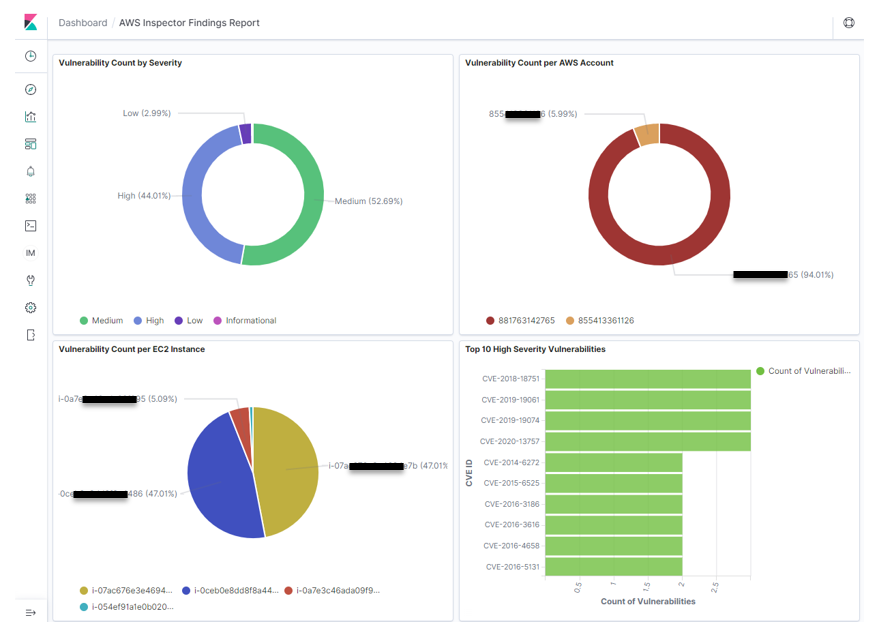
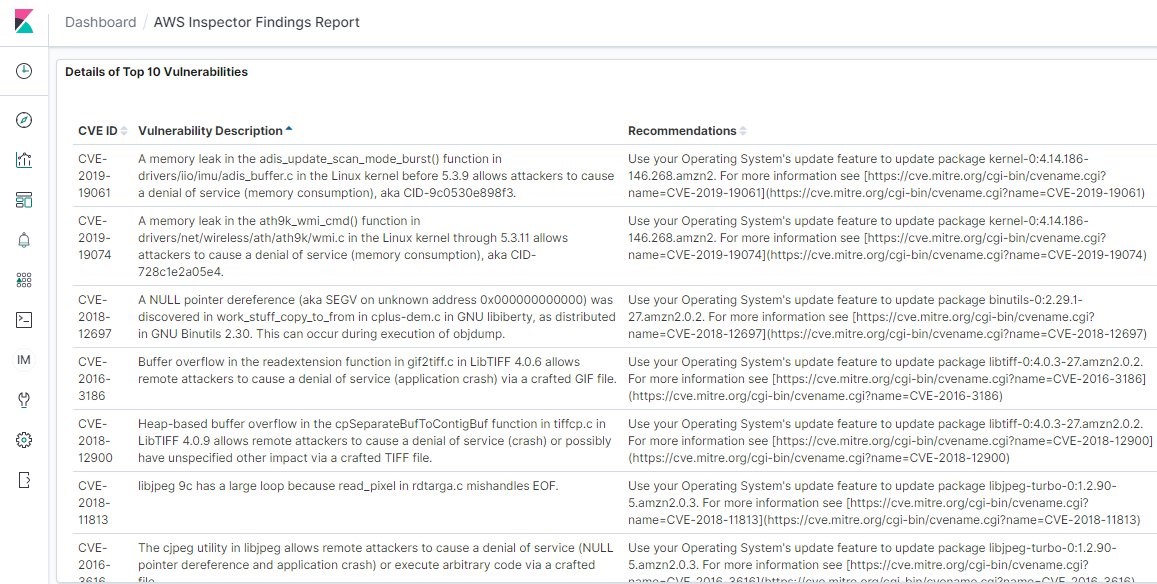
These Amazon Inspector findings, along with additional attributes on the scanned instances, can be used for further analysis and visualization via Kibana—a data visualization dashboard for Amazon ES. Storing a copy of these findings in an S3 bucket gives you the opportunity to forward the findings data to outside monitoring tools that don’t support direct data ingestion from AWS Lambda.

Prerequisites

The following resources must be set up before you can implement this solution:

  1. A multi-account structure. To learn how to set up a multi-account structure, see Setting up AWS Control Tower and AWS Landing zone.
  2. Amazon Inspector agents must be installed on all EC2 instances. See Installing Amazon Inspector agents to learn how to set up Amazon Inspector agents on EC2 instances. Additionally, keep note of all the Regions where you install the Amazon Inspector agent.
  3. An Amazon ES domain with Kibana authentication. See Getting started with Amazon Elasticsearch Service and Use Amazon Cognito for Kibana access control.
  4. An S3 bucket for centralized storage of Amazon Inspector findings.
  5. An S3 bucket for storage of the Lambda source code for the solution.

Set up Amazon Inspector with Amazon ES and S3

Follow these steps to set up centralized Amazon Inspector findings with Amazon ES and Amazon S3:

  1. Upload the solution ZIP file to the S3 bucket used for Lambda code storage.
  2. Collect the input parameters for AWS CloudFormation deployment.
  3. Deploy the base template into the central security account.
  4. Deploy the second template in the primary Region of all application accounts to create global resources.
  5. Deploy the third template in all Regions of all application accounts.

Step 1: Upload the solution ZIP file to the S3 bucket used for Lambda code storage

  1. From GitHub, download the file Inspector-to-S3ES-crossAcnt.zip.
  2. Upload the ZIP file to the S3 bucket you created in the central security account for Lambda code storage. This code is used to create the Lambda function in the first CloudFormation stack set of the solution.

Step 2: Collect input parameters for AWS CloudFormation deployment

In this solution, you deploy three AWS CloudFormation stack sets in succession. Each stack set should be created in the primary Region of the central security account. Underlying stacks are deployed across the central security account and in all the application accounts where the Amazon Inspector scan is performed. You can learn more in Working with AWS CloudFormation StackSets.

Before you proceed to the stack set deployment, you must collect the input parameters for the first stack set: Central-SecurityAcnt-BaseTemplate.yaml.

To collect input parameters for AWS CloudFormation deployment

  1. Fetch the account ID (CentralSecurityAccountID) of the AWS account where the stack set will be created and deployed. You can use the steps in Finding your AWS account ID to help you find the account ID.
  2. Values for the ES domain parameters can be fetched from the Amazon ES console.
    1. Open the Amazon ES Management Console and select the Region where the Amazon ES domain exists.
    2. Select the domain name to view the domain details.
    3. The value for ElasticsearchDomainName is displayed on the top left corner of the domain details.
    4. On the Overview tab in the domain details window, select and copy the URL value of the Endpoint to use as the ElasticsearchEndpoint parameter of the template. Make sure to exclude the https:// at the beginning of the URL.

      Figure 2: Details of the Amazon ES domain for fetching parameter values

      Figure 2: Details of the Amazon ES domain for fetching parameter values

  3. Get the values for the S3 bucket parameters from the Amazon S3 console.
    1. Open the Amazon S3 Management Console.
    2. Copy the name of the S3 bucket that you created for centralized storage of Amazon Inspector findings. Save this bucket name for the LoggingS3Bucket parameter value of the Central-SecurityAcnt-BaseTemplate.yaml template.
    3. Select the S3 bucket used for source code storage. Select the bucket name and copy the name of this bucket for the LambdaSourceCodeS3Bucket parameter of the template.

      Figure 3: The S3 bucket where Lambda code is uploaded

      Figure 3: The S3 bucket where Lambda code is uploaded

  4. On the bucket details page, select the source code ZIP file name that you previously uploaded to the bucket. In the detail page of the ZIP file, choose the Overview tab, and then copy the value in the Key field to use as the value for the LambdaCodeS3Key parameter of the template.

    Figure 4: Details of the Lambda code ZIP file uploaded in Amazon S3 showing the key prefix value

    Figure 4: Details of the Lambda code ZIP file uploaded in Amazon S3 showing the key prefix value

Note: All of the other input parameter values of the template are entered automatically, but you can change them during stack set creation if necessary.

Step 3: Deploy the base template into the central security account

Now that you’ve collected the input parameters, you’re ready to deploy the base template that will create the necessary resources for this solution implementation in the central security account.

Prerequisites for CloudFormation stack set deployment

There are two permission modes that you can choose from for deploying a stack set in AWS CloudFormation. If you’re using AWS Organizations and have all features enabled, you can use the service-managed permissions; otherwise, self-managed permissions mode is recommended. To deploy this solution, you’ll use self-managed permissions mode. To run stack sets in self-managed permissions mode, your administrator account and the target accounts must have two IAM roles—AWSCloudFormationStackSetAdministrationRole and AWSCloudFormationStackSetExecutionRole—as prerequisites. In this solution, the administrator account is the central security account and the target accounts are application accounts. You can use the following CloudFormation templates to create the necessary IAM roles:

To deploy the base template

  1. Download the base template (Central-SecurityAcnt-BaseTemplate.yaml) from GitHub.
  2. Open the AWS CloudFormation Management Console and select the Region where all the stack sets will be created for deployment. This should be the primary Region of your environment.
  3. Select Create StackSet.
    1. In the Create StackSet window, select Template is ready and then select Upload a template file.
    2. Under Upload a template file, select Choose file and select the Central-SecurityAcnt-BaseTemplate.yaml template that you downloaded earlier.
    3. Choose Next.
  4. Add stack set details.
    1. Enter a name for the stack set in StackSet name.
    2. Under Parameters, most of the values are pre-populated except the values you collected in the previous procedure for CentralSecurityAccountID, ElasticsearchDomainName, ElasticsearchEndpoint, LoggingS3Bucket, LambdaSourceCodeS3Bucket, and LambdaCodeS3Key.
    3. After all the values are populated, choose Next.
  5. Configure StackSet options.
    1. (Optional) Add tags as described in the prerequisites to apply to the resources in the stack set that these rules will be deployed to. Tagging is a recommended best practice, because it enables you to add metadata information to resources during their creation.
    2. Under Permissions, choose the Self service permissions mode to be used for deploying the stack set, and then select the AWSCloudFormationStackSetAdministrationRole from the dropdown list.

      Figure 5: Permission mode to be selected for stack set deployment

      Figure 5: Permission mode to be selected for stack set deployment

    3. Choose Next.
  6. Add the account and Region details where the template will be deployed.
    1. Under Deployment locations, select Deploy stacks in accounts. Under Account numbers, enter the account ID of the security account that you collected earlier.

      Figure 6: Values to be provided during the deployment of the first stack set

      Figure 6: Values to be provided during the deployment of the first stack set

    2. Under Specify regions, select all the Regions where the stacks will be created. This should be the list of Regions where you installed the Amazon Inspector agent. Keep note of this list of Regions to use in the deployment of the third template in an upcoming step.
      • Though an Amazon Inspector scan is performed in all the application accounts, the regional Amazon SNS topics that send scan finding notifications are created in the central security account. Therefore, this template is created in all the Regions where Amazon Inspector will notify SNS. The template has the logic needed to handle the creation of specific AWS resources only in the primary Region, even though the template executes in many Regions.
      • The order in which Regions are selected under Specify regions defines the order in which the stack is deployed in the Regions. So you must make sure that the primary Region of your deployment is the first one specified under Specify regions, followed by the other Regions of stack set deployment. This is required because global resources are created using one Region—ideally the primary Region—and so stack deployment in that Region should be done before deployment to other Regions in order to avoid any build dependencies.

        Figure 7: Showing the order of specifying the Regions of stack set deployment

        Figure 7: Showing the order of specifying the Regions of stack set deployment

  7. Review the template settings and select the check box to acknowledge the Capabilities section. This is required if your deployment template creates IAM resources. You can learn more at Controlling access with AWS Identity and Access Management.

    Figure 8: Acknowledge IAM resources creation by AWS CloudFormation

    Figure 8: Acknowledge IAM resources creation by AWS CloudFormation

  8. Choose Submit to deploy the stack set.

Step 4: Deploy the second template in the primary Region of all application accounts to create global resources

This template creates the global resources required for sending Amazon Inspector findings to Amazon ES and Amazon S3.

To deploy the second template

  1. Download the template (ApplicationAcnts-RolesTemplate.yaml) from GitHub and use it to create the second CloudFormation stack set in the primary Region of the central security account.
  2. To deploy the template, follow the steps used to deploy the base template (described in the previous section) through Configure StackSet options.
  3. In Set deployment options, do the following:
    1. Under Account numbers, enter the account IDs of your application accounts as comma-separated values. You can use the steps in Finding your AWS account ID to help you gather the account IDs.
    2. Under Specify regions, select only your primary Region.

      Figure 9: Select account numbers and specify Regions

      Figure 9: Select account numbers and specify Regions

  4. The remaining steps are the same as for the base template deployment.

Step 5: Deploy the third template in all Regions of all application accounts

This template creates the resources in each Region of all application accounts needed for scheduled scanning of EC2 instances using Amazon Inspector. Notifications are sent to the SNS topics of each Region of the central security account.

To deploy the third template

  1. Download the template InspectorRun-SetupTemplate.yaml from GitHub and create the final AWS CloudFormation stack set. Similar to the previous stack sets, this one should also be created in the central security account.
  2. For deployment, follow the same steps you used to deploy the base template through Configure StackSet options.
  3. In Set deployment options:
    1. Under Account numbers, enter the same account IDs of your application accounts (comma-separated values) as you did for the second template deployment.
    2. Under Specify regions, select all the Regions where you installed the Amazon Inspector agent.

      Note: This list of Regions should be the same as the Regions where you deployed the base template.

  4. The remaining steps are the same as for the second template deployment.

Test the solution and delivery of the findings

After successful deployment of the architecture, to test the solution you can wait until the next scheduled Amazon Inspector scan or you can use the following steps to run the Amazon Inspector scan manually.

To run the Amazon Inspector scan manually for testing the solution

  1. In any one of the application accounts, go to any Region where the Amazon Inspector scan was performed.
  2. Open the Amazon Inspector console.
  3. In the left navigation menu, select Assessment templates to see the available assessments.
  4. Choose the assessment template that was created by the third template.
  5. Choose Run to start the assessment immediately.
  6. When the run is complete, Last run status changes from Collecting data to Analysis Complete.

    Figure 10: Amazon Inspector assessment run

    Figure 10: Amazon Inspector assessment run

  7. You can see the recent scan findings in the Amazon Inspector console by selecting Assessment runs from the left navigation menu.

    Figure 11: The assessment run indicates total findings from the last Amazon Inspector run in this Region

    Figure 11: The assessment run indicates total findings from the last Amazon Inspector run in this Region

  8. In the left navigation menu, select Findings to see details of each finding, or use the steps in the following section to verify the delivery of findings to the central security account.

Test the delivery of the Amazon Inspector findings

This solution delivers the Amazon Inspector findings to two AWS services—Amazon ES and Amazon S3—in the primary Region of the central security account. You can either use Kibana to view the findings sent to Amazon ES or you can use the findings sent to Amazon S3 and forward them to the security monitoring software of your preference for further analysis.

To check whether the findings are delivered to Amazon ES

  1. Open the Amazon ES Management Console and select the Region where the Amazon ES domain is located.
  2. Select the domain name to view the domain details.
  3. On the domain details page, select the Kibana URL.

    Figure 12: Amazon ES domain details page

    Figure 12: Amazon ES domain details page

  4. Log in to Kibana using your preferred authentication method as set up in the prerequisites.
    1. In the left panel, select Discover.
    2. In the Discover window, select a Region to view the total number of findings in that Region.

      Figure 13: The total findings in Kibana for the chosen Region of an application account

      Figure 13: The total findings in Kibana for the chosen Region of an application account

To check whether the findings are delivered to Amazon S3

  1. Open the Amazon S3 Management Console.
  2. Select the S3 bucket that you created for storing Amazon Inspector findings.
  3. Select the bucket name to view the bucket details. The total number of findings for the chosen Region is at the top right corner of the Overview tab.

    Figure 14: The total security findings as stored in an S3 bucket for us-east-1 Region

    Figure 14: The total security findings as stored in an S3 bucket for us-east-1 Region

Visualization in Kibana

The data sent to the Amazon ES index can be used to create visualizations in Kibana that make it easier to identify potential security gaps and plan the remediation accordingly.

You can use Kibana to create a dashboard that gives an overview of the potential vulnerabilities identified in different instances of different AWS accounts. Figure 15 shows an example of such a dashboard. The dashboard can help you rank the need for remediation based on criteria such as:

  • The category of vulnerability
  • The most impacted AWS accounts
  • EC2 instances that need immediate attention
Figure 15: A sample Kibana dashboard showing findings from Amazon Inspector

Figure 15: A sample Kibana dashboard showing findings from Amazon Inspector

You can build additional panels to visualize details of the vulnerability findings identified by Amazon Inspector, such as the CVE ID of the security vulnerability, its description, and recommendations on how to remove the vulnerabilities.

Figure 16: A sample Kibana dashboard panel listing the top identified vulnerabilities and their details

Figure 16: A sample Kibana dashboard panel listing the top identified vulnerabilities and their details

Conclusion

By using this solution to combine Amazon Inspector, Amazon SNS topics, Amazon SQS queues, Lambda functions, an Amazon ES domain, and S3 buckets, you can centrally analyze and monitor the vulnerability posture of EC2 instances across your AWS environment, including multiple Regions across multiple AWS accounts. This solution is built following least privilege access through AWS IAM roles and policies to help secure the cross-account architecture.

In this blog post, you learned how to send the findings directly to Amazon ES for visualization in Kibana. These visualizations can be used to build dashboards that security analysts can use for centralized monitoring. Better monitoring capability helps analysts to identify potentially vulnerable assets and perform remediation activities to improve security of your applications in AWS and their underlying assets. This solution also demonstrates how to store the findings from Amazon Inspector in an S3 bucket, which makes it easier for you to use those findings to create visualizations in your preferred security monitoring software.

If you have feedback about this post, submit comments in the Comments section below. If you have questions about this post, contact AWS Support.

Want more AWS Security how-to content, news, and feature announcements? Follow us on Twitter.

Author

Moumita Saha

Moumita is a Security Consultant with AWS Professional Services working to help enterprise customers secure their workloads in the cloud. She assists customers in secure cloud migration, designing automated solutions to protect against cyber threats in the cloud. She is passionate about cyber security, data privacy, and new, emerging cloud-security technologies.

How to automate incident response in the AWS Cloud for EC2 instances

Post Syndicated from Ben Eichorst original https://aws.amazon.com/blogs/security/how-to-automate-incident-response-in-aws-cloud-for-ec2-instances/

One of the security epics core to the AWS Cloud Adoption Framework (AWS CAF) is a focus on incident response and preparedness to address unauthorized activity. Multiple methods exist in Amazon Web Services (AWS) for automating classic incident response techniques, and the AWS Security Incident Response Guide outlines many of these methods. This post demonstrates one specific method for instantaneous response and acquisition of infrastructure data from Amazon Elastic Compute Cloud (Amazon EC2) instances.

Incident response starts with detection, progresses to investigation, and then follows with remediation. This process is no different in AWS. AWS services such as Amazon GuardDuty, Amazon Macie, and Amazon Inspector provide detection capabilities. Amazon Detective assists with investigation, including tracking and gathering information. Then, after your security organization decides to take action, pre-planned and pre-provisioned runbooks enable faster action towards a resolution. One principle outlined in the incident response whitepaper and the AWS Well-Architected Framework is the notion of pre-provisioning systems and policies to allow you to react quickly to an incident response event. The solution I present here provides a pre-provisioned architecture for an incident response system that you can use to respond to a suspect EC2 instance.

Infrastructure overview

The architecture that I outline in this blog post automates these standard actions on a suspect compute instance:

  1. Capture all the persistent disks.
  2. Capture the instance state at the time the incident response mechanism is started.
  3. Isolate the instance and protect against accidental instance termination.
  4. Perform operating system–level information gathering, such as memory captures and other parameters.
  5. Notify the administrator of these actions.

The solution in this blog post accomplishes these tasks through the following logical flow of AWS services, illustrated in Figure 1.
 

Figure 1: Infrastructure deployed by the accompanying AWS CloudFormation template and associated task flow when invoking the main API

Figure 1: Infrastructure deployed by the accompanying AWS CloudFormation template and associated task flow when invoking the main API

  1. A user or application calls an API with an EC2 instance ID to start data collection.
  2. Amazon API Gateway initiates the core logic of the process by instantiating an AWS Lambda function.
  3. The Lambda function performs the following data gathering steps before making any changes to the infrastructure:
    1. Save instance metadata to the SecResponse Amazon Simple Storage Service (Amazon S3) bucket.
    2. Save a snapshot of the instance console to the SecResponse S3 bucket.
    3. Initiate an Amazon Elastic Block Store (Amazon EBS) snapshot of all persistent block storage volumes.
  4. The Lambda function then modifies the infrastructure to continue gathering information, by doing the following steps:
    1. Set the Amazon EC2 termination protection flag on the instance.
    2. Remove any existing EC2 instance profile from the instance.
    3. If the instance is managed by AWS Systems Manager:
      1. Attach an EC2 instance profile with minimal privileges for operating system–level information gathering.
      2. Perform operating system–level information gathering actions through Systems Manager on the EC2 instance.
      3. Remove the instance profile after Systems Manager has completed its actions.
    4. Create a quarantine security group that lacks both ingress and egress rules.
    5. Move the instance into the created quarantine security group for isolation.
  5. Send an administrative notification through the configured Amazon Simple Notification Service (Amazon SNS) topic.

Solution features

By using the mechanisms outlined in this post to codify your incident response runbooks, you can see the following benefits to your incident response plan.

Preparation for incident response before an incident occurs

Both the AWS CAF and Well-Architected Framework recommend that customers formulate known procedures for incident response, and test those runbooks before an incident. Testing these processes before an event occurs decreases the time it takes you to respond in a production environment. The sample infrastructure shown in this post demonstrates how you can standardize those procedures.

Consistent incident response artifact gathering

Codifying your processes into set code and infrastructure prepares you for the need to collect data, but also standardizes the collection process into a repeatable and auditable sequence of What information was collected when and how. This reduces the likelihood of missing data for future investigations.

Walkthrough: Deploying infrastructure and starting the process

To implement the solution outlined in this post, you first need to deploy the infrastructure, and then start the data collection process by issuing an API call.

The code example in this blog post requires that you provision an AWS CloudFormation stack, which creates an S3 bucket for storing your event artifacts and a serverless API that uses API Gateway and Lambda. You then execute a query against this API to take action on a target EC2 instance.

The infrastructure deployed by the AWS CloudFormation stack is a set of AWS components as depicted previously in Figure 1. The stack includes all the services and configurations to deploy the demo. It doesn’t include a target EC2 instance that you can use to test the mechanism used in this post.

Cost

The cost for this demo is minimal because the base infrastructure is completely serverless. With AWS, you only pay for the infrastructure that you use, so the single API call issued in this demo costs fractions of a cent. Artifact storage costs will incur S3 storage prices, and Amazon EC2 snapshots will be stored at their respective prices.

Deploy the AWS CloudFormation stack

In future posts and updates, we will show how to set up this security response mechanism inside a separate account designated for security, but for the purposes of this post, your demo stack must reside in the same AWS account as the target instance that you set up in the next section.

First, start by deploying the AWS CloudFormation template to provision the infrastructure.

To deploy this template in the us-east-1 region

  1. Choose the Launch Stack button to open the AWS CloudFormation console pre-loaded with the template:
     
    Select the Launch Stack button to launch the template
  2. (Optional) In the AWS CloudFormation console, on the Specify Details page, customize the stack name.
  3. For the LambdaS3BucketLocation and LambdaZipFileName fields, leave the default values for the purposes of this blog. Customizing this field allows you to customize this code example for your own purposes and store it in an S3 bucket of your choosing.
  4. Customize the S3BucketName field. This needs to be a globally unique S3 bucket name. This bucket is where gathered artifacts are stored for the demo in this blog. You must customize it beyond the default value for the template to instantiate properly.
  5. (Optional) Customize the SNSTopicName field. This name provides a meaningful label for the SNS topic that notifies the administrator of the actions that were performed.
  6. Choose Next to configure the stack options and leave all default settings in place.
  7. Choose Next to review and scroll to the bottom of the page. Select all three check boxes under the Capabilities and Transforms section, next to each of the three acknowledgements:
    • I acknowledge that AWS CloudFormation might create IAM resources.
    • I acknowledge that AWS CloudFormation might create IAM resources with custom names.
    • I acknowledge that AWS CloudFormation might require the following capability: CAPABILITY_AUTO_EXPAND.
  8. Choose Create Stack.

Set up a target EC2 instance

In order to demonstrate the functionality of this mechanism, you need a target host. Provision any EC2 instance in your account to act as a target for the security response mechanism to act upon for information collection and quarantine. To optimize affordability and demonstrate full functionality, I recommend choosing a small instance size (for example, t2.nano) and optionally joining the instance into Systems Manager for the ability to later execute Run Command API queries. For more details on configuring Systems Manager, refer to the AWS Systems Manager User Guide.

Retrieve required information for system initiation

The entire security response mechanism triggers through an API call. To successfully initiate this call, you first need to gather the API URI and key information.

To find the API URI and key information

  1. Navigate to the AWS CloudFormation console and choose the stack that you’ve instantiated.
  2. Choose the Outputs tab and save the value for the key APIBaseURI. This is the base URI for the API Gateway. It will resemble https://abcdefgh12.execute-api.us-east-1.amazonaws.com.
  3. Next, navigate to the API Gateway console and choose the API with the name SecurityResponse.
  4. Choose API Keys, and then choose the only key present.
  5. Next to the API key field, choose Show to reveal the key, and then save this value to a notepad for later use.

(Optional) Configure administrative notification through the created SNS topic

One aspect of this mechanism is that it sends notifications through SNS topics. You can optionally subscribe your email or another notification pipeline mechanism to the created SNS topic in order to receive notifications on actions taken by the system.

Initiate the security response mechanism

Note that, in this demo code, you’re using a simple API key for limiting access to API Gateway. In production applications, you would use an authentication mechanism such as Amazon Cognito to control access to your API.

To kick off the security response mechanism, initiate a REST API query against the API that was created in the AWS CloudFormation template. You first create this API call by using a curl command to be run from a Linux system.

To create the API initiation curl command

  1. Copy the following example curl command.
    curl -v -X POST -i -H "x-api-key: 012345ABCDefGHIjkLMS20tGRJ7othuyag" https://abcdefghi.execute-api.us-east-1.amazonaws.com/DEMO/secresponse -d '{
      "instance_id":"i-123457890"
    }'
    

  2. Replace the placeholder API key specified in the x-api-key HTTP header with your API key.
  3. Replace the example URI path with your API’s specific URI. To create the full URI, concatenate the base URI listed in the AWS CloudFormation output you gathered previously with the API call path, which is /DEMO/secresponse. This full URI for your specific API call should closely resemble this sample URI path: https://abcdefghi.execute-api.us-east-1.amazonaws.com/DEMO/secresponse
  4. Replace the value associated with the key instance_id with the instance ID of the target EC2 instance you created.

Because this mechanism initiates through a simple API call, you can easily integrate it with existing workflow management systems. This allows for complex data collection and forensic procedures to be integrated with existing incident response workflows.

Review the gathered data

Note that the following items were uploaded as objects in the security response S3 bucket:

  1. A console screenshot, as shown in Figure 2.
  2. (If Systems Manager is configured) stdout information from the commands that were run on the host operating system.
  3. Instance metadata in JSON form.


Figure 2: Example outputs from a successful completion of this blog post's mechanism

Figure 2: Example outputs from a successful completion of this blog post’s mechanism

Additionally, if you load the Amazon EC2 console and scroll down to Elastic Block Store, you can see that EBS snapshots are present for all persistent disks as shown in Figure 3.
 

Figure 3: Evidence of an EBS snapshot from a successful run

Figure 3: Evidence of an EBS snapshot from a successful run

You can also verify that the previously outlined security controls are in place by viewing the instance in the Amazon EC2 console. You should see the removal of AWS Identity and Access Management (IAM) roles from the target EC2 instances and that the instance has been placed into network isolation through a newly created quarantine security group.

Note that for the purposes of this demo, all information that you gathered is stored in the same AWS account as the workload. As a best practice, many AWS customers choose instead to store this information in an AWS account that’s specifically designated for incident response and analysis. A dedicated account provides clear isolation of function and restriction of access. Using AWS Organizations service control policies (SCPs) and IAM permissions, your security team can limit access to adhere to security policy, legal guidance, and compliance regulations.

Clean up and delete artifacts

To clean up the artifacts from the solution in this post, first delete all information in your security response S3 bucket. Then delete the CloudFormation stack that was provisioned at the start of this process in order to clean up all remaining infrastructure.

Conclusion

Placing workloads in the AWS Cloud allows for pre-provisioned and explicitly defined incident response runbooks to be codified and quickly executed on suspect EC2 instances. This enables you to gather data in minutes that previously took hours or even days using manual processes.

If you have feedback about this post, submit comments in the Comments section below. If you have questions about this post, start a new thread on the Amazon EC2 forum or contact AWS Support.
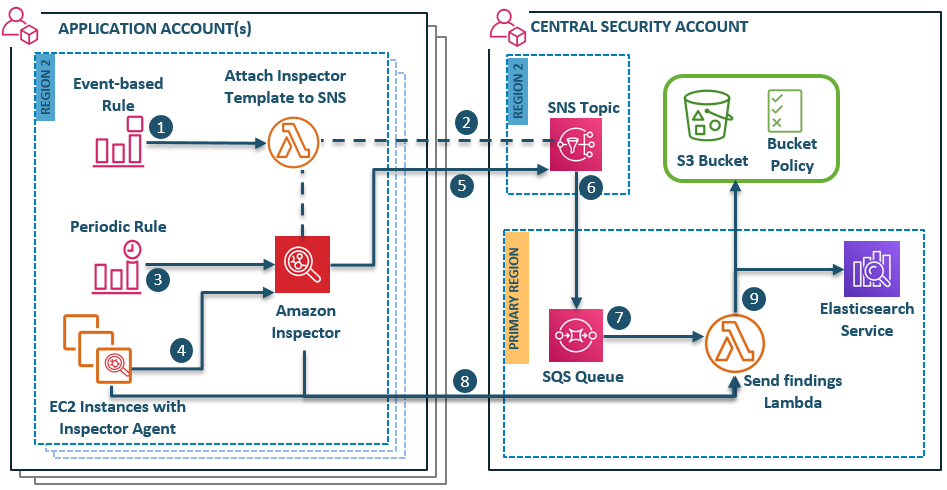
Want more AWS Security how-to content, news, and feature announcements? Follow us on Twitter.

Author

Ben Eichorst

Ben is a Senior Solutions Architect, Security, Cryptography, and Identity Specialist for AWS. He works with AWS customers to efficiently implement globally scalable security programs while empowering development teams and reducing risk. He holds a BA from Northwestern University and an MBA from University of Colorado.