Tag Archives: Vulnerability Assessment

Perform continuous vulnerability scanning of AWS Lambda functions with Amazon Inspector

Post Syndicated from Manjunath Arakere original https://aws.amazon.com/blogs/security/perform-continuous-vulnerability-scanning-of-aws-lambda-functions-with-amazon-inspector/

This blog post demonstrates how you can activate Amazon Inspector within one or more AWS accounts and be notified when a vulnerability is detected in an AWS Lambda function.

Amazon Inspector is an automated vulnerability management service that continually scans workloads for software vulnerabilities and unintended network exposure. Amazon Inspector scans mixed workloads like Amazon Elastic Compute Cloud (Amazon EC2) instances and container images located in Amazon Elastic Container Registry (Amazon ECR). At re:Invent 2022, we announced Amazon Inspector support for Lambda functions and Lambda layers to provide a consolidated solution for compute types.

Only scanning your functions for vulnerabilities before deployment might not be enough since vulnerabilities can appear at any time, like the widespread Apache Log4j vulnerability. So it’s essential that workloads are continuously monitored and rescanned in near real time as new vulnerabilities are published or workloads are changed.

Amazon Inspector scans are intelligently initiated based on the updates to Lambda functions or when new Common Vulnerabilities and Exposures (CVEs) are published that are relevant to your function. No agents are needed for Amazon Inspector to work, which means you don’t need to install a library or agent in your Lambda functions or layers. When Amazon Inspector discovers a software vulnerability or network configuration issue, it creates a finding which describes the vulnerability, identifies the affected resource, rates the severity of the vulnerability, and provides remediation guidance.

In addition, Amazon Inspector integrates with several AWS services, such as Amazon EventBridge and AWS Security Hub. You can use EventBridge to build automation workflows like getting notified for a specific vulnerability finding or performing an automatic remediation with the help of Lambda or AWS Systems Manager.

In this blog post, you will learn how to do the following:

  1. Activate Amazon Inspector in a single AWS account and AWS Region.
  2. See how Amazon Inspector automated discovery and continuous vulnerability scanning works by deploying a new Lambda function with a vulnerable package dependency.
  3. Receive a near real-time notification when a vulnerability with a specific severity is detected in a Lambda function with the help of EventBridge and Amazon Simple Notification Service (Amazon SNS).
  4. Remediate the vulnerability by using the recommendation provided in the Amazon Inspector dashboard.
  5. Activate Amazon Inspector in multiple accounts or Regions through AWS Organizations.

Solution architecture

Figure 1 shows the AWS services used in the solution and how they are integrated.
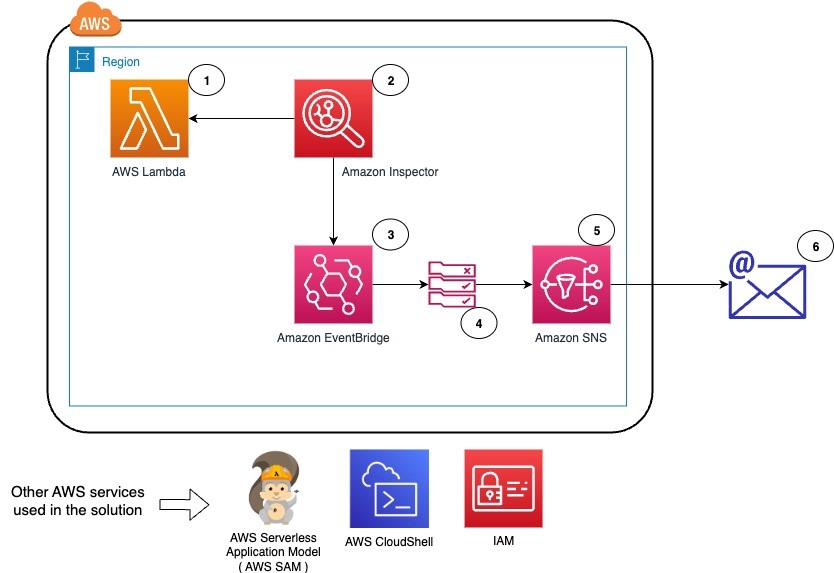
Figure 1: Solution architecture overview

Figure 1: Solution architecture overview

The workflow for the solution is as follows:

  1. Deploy a new Lambda function by using the AWS Serverless Application Model (AWS SAM).
  2. Amazon Inspector scans when a new vulnerability is published or when an update to an existing Lambda function or a new Lambda function is deployed. Vulnerabilities are identified in the deployed Lambda function.
  3. Amazon EventBridge receives the events from Amazon Inspector and checks against the rules for specific events or filter conditions.
  4. In this case, an EventBridge rule exists for the Amazon Inspector findings, and the target is defined as an SNS topic to send an email to the system operations team.
  5. The EventBridge rule invokes the target SNS topic with the event data, and an email is sent to the confirmed subscribers in the SNS topic.
  6. The system operations team receives an email with detailed information on the vulnerability, the fixed package versions, the Amazon Inspector score to prioritize, and the impacted Lambda functions. By using the remediation information from Amazon Inspector, the team can now prioritize actions and remediate.

Prerequisites

To follow along with this demo, we recommend that you have the following in place:

  • An AWS account.
  • A command line interface: AWS CloudShell or AWS CLI. In this post, we recommend the use of CloudShell because it already has Python and AWS SAM. However, you can also use your CLI with AWS CLI, SAM, and Python.
  • An AWS Region where Amazon Inspector Lambda code scanning is available.
  • An IAM role in that account with administrator privileges.

The solution in this post includes the following AWS services: Amazon Inspector, AWS Lambda, Amazon EventBridge, AWS Identity and Access Management (IAM), Amazon SNS, AWS CloudShell and AWS Organizations for activating Amazon Inspector at scale (multi-accounts).

Step 1: Activate Amazon Inspector in a single account in the Region

The first step is to activate Amazon Inspector in your account in the Region you are using.

To activate Amazon Inspector

  1. Sign in to the AWS Management Console.
  2. Open AWS CloudShell. CloudShell inherits the credentials and permissions of the IAM principal who is signed in to the AWS Management Console. CloudShell comes with the CLIs and runtimes that are needed for this demo (AWS CLI, AWS SAM, and Python).
  3. Use the following command in CloudShell to get the status of the Amazon Inspector activation.
    aws inspector2 batch-get-account-status

  4. Use the following command to activate Inspector in the default Region for resource type LAMBDA. Other allowed values for resource types are EC2, ECR and LAMDA_CODE.
    aws inspector2 enable --resource-types '["LAMBDA"]'

  5. Use the following command to verify the status of the Amazon Inspector activation.
    aws inspector2 batch-get-account-status

You should see a response that shows that Amazon Inspector is enabled for Lambda resources, as shown in Figure 2.
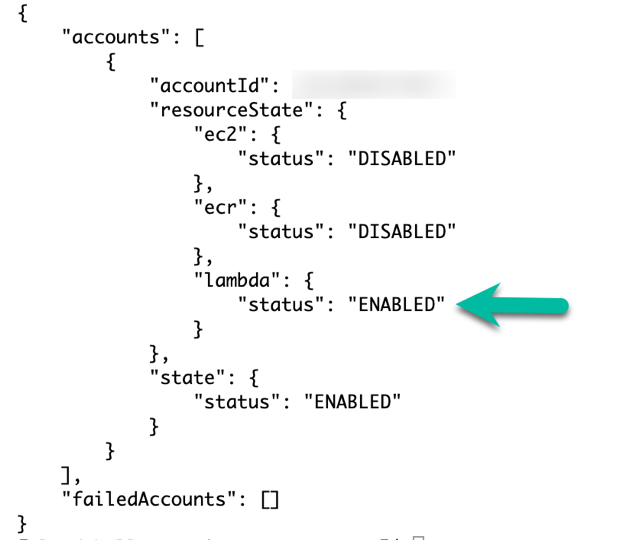
Figure 2: Amazon Inspector status after you enable Lambda scanning

Figure 2: Amazon Inspector status after you enable Lambda scanning

Step 2: Create an SNS topic and subscription for notification

Next, create the SNS topic and the subscription so that you will be notified of each new Amazon Inspector finding.

To create the SNS topic and subscription

  1. Use the following command in CloudShell to create the SNS topic and its subscription and replace <REGION_NAME>, <AWS_ACCOUNTID> and <[email protected]> by the relevant values.
    aws sns create-topic --name amazon-inspector-findings-notifier; 
    
    aws sns subscribe \
    --topic-arn arn:aws:sns:<REGION_NAME>:<AWS_ACCOUNTID>:amazon-inspector-findings-notifier \
    --protocol email --notification-endpoint <[email protected]>

  2. Check the email inbox you entered for <[email protected]>, and in the email from Amazon SNS, choose Confirm subscription.
  3. In the CloudShell console, use the following command to list the subscriptions, to verify the topic and email subscription.
    aws sns list-subscriptions

    You should see a response that shows subscription details like the email address and ARN, as shown in Figure 3.

    Figure 3: Subscribed email address and SNS topic

    Figure 3: Subscribed email address and SNS topic

  4. Use the following command to send a test message to your subscribed email and verify that you receive the message by replacing <REGION_NAME> and <AWS_ACCOUNTID>.
    aws sns publish \
        --topic-arn "arn:aws:sns:<REGION_NAME>:<AWS_ACCOUNTID>:amazon-inspector-findings-notifier" \
        --message "Hello from Amazon Inspector2"

Step 3: Set up Amazon EventBridge with a custom rule and the SNS topic as target

Create an EventBridge rule that will invoke your previously created SNS topic whenever Amazon Inspector finds a new vulnerability with a critical severity.

To set up the EventBridge custom rule

  1. In the CloudShell console, use the following command to create an EventBridge rule named amazon-inspector-findings with filters InspectorScore greater than 8 and severity state set to CRITICAL.
    aws events put-rule \
        --name "amazon-inspector-findings" \
        --event-pattern "{\"source\": [\"aws.inspector2\"],\"detail-type\": [\"Inspector2 Finding\"],\"detail\": {\"inspectorScore\": [ { \"numeric\": [ \">\", 8] } ],\"severity\": [\"CRITICAL\"]}}"

    Refer to the topic Amazon EventBridge event schema for Amazon Inspector events to customize the event pattern for your application needs.

  2. To verify the rule creation, go to the EventBridge console and in the left navigation bar, choose Rules.
  3. Choose the rule with the name amazon-inspector-findings. You should see the event pattern as shown in Figure 4.
    Figure 4: Event pattern for the EventBridge rule to filter on CRITICAL vulnerabilities.

    Figure 4: Event pattern for the EventBridge rule to filter on CRITICAL vulnerabilities.

  4. Add the SNS topic you previously created as the target to the EventBridge rule. Replace <REGION_NAME>, <AWS_ACCOUNTID>, and <RANDOM-UNIQUE-IDENTIFIER-VALUE> with the relevant values. For RANDOM-UNIQUE-IDENTIFIER-VALUE, create a memorable and unique string.
    aws events put-targets \
        --rule amazon-inspector-findings \
        --targets "Id"="<RANDOM-UNIQUE-IDENTIFIER-VALUE>","Arn"="arn:aws:sns:<REGION_NAME>:<AWS_ACCOUNTID>:amazon-inspector-findings-notifier"

    Important: Save the target ID. You will need this in order to delete the target in the last step.

  5. Provide permission to enable Amazon EventBridge to publish to SNS topic amazon-inspector-findings-notifier
    aws sns set-topic-attributes --topic-arn "arn:aws:sns:<REGION_NAME>:<AWS_ACCOUNTID>:amazon-inspector-findings-notifier" \
    --attribute-name Policy \
    --attribute-value "{\"Version\":\"2012-10-17\",\"Id\":\"__default_policy_ID\",\"Statement\":[{\"Sid\":\"PublishEventsToMyTopic\",\"Effect\":\"Allow\",\"Principal\":{\"Service\":\"events.amazonaws.com\"},\"Action\":\"sns:Publish\",\"Resource\":\"arn:aws:sns:<REGION_NAME>:<AWS_ACCOUNTID>:amazon-inspector-findings-notifier\"}]}"

Step 4: Deploy the Lambda function to the AWS account by using AWS SAM

In this step, you will use Serverless Application Manager (SAM) quick state templates to build and deploy a Lambda function with a vulnerable library, in order to generate findings. Learn more about AWS SAM.

To deploy the Lambda function with a vulnerable library

  1. In the CloudShell console, use a prebuilt “hello-world” AWS SAM template to deploy the Lambda function.
    sam init --runtime python3.7 --dependency-manager pip --app-template hello-world --name sam-app

  2. Use the following command to add the vulnerable package python-jwt==3.3.3 to the Lambda function.
    cd sam-app;
    echo -e 'requests\npython-jwt==3.3.3' > hello_world/requirements.txt

  3. Use the following command to build the application.
    sam build

  4. Use the following command to deploy the application with the guided option.
    sam deploy --guided

    This command packages and deploys the application to your AWS account. It provides a series of prompts. You may respond to the prompts with the:

    1. Stack name you want
    2. Set the default options, except for the
      1. HelloWorldFunction may not have authorization defined, Is this okay? [y/N]: prompt. Here, input y and press Enter and
      2. Deploy this changeset? [y/N]: prompt. Here, input y and press Enter.

Step 5: View Amazon Inspector findings

Amazon Inspector will automatically generate findings when scanning the Lambda function previously deployed. To view those findings, follow the steps below.

To view Amazon Inspector findings for the vulnerability

  1. Navigate to the Amazon Inspector console.
  2. In the left navigation menu, choose All findings to see all of the Active findings, as shown in Figure 5.

    Due to the custom event pattern rule in Amazon EventBridge, even though there are multiple findings for the vulnerable package python-jwt==3.3.3, you will be notified only for the finding that has InspectorScore greater than 8 and severity CRITICAL.

  3. Choose the title of each finding to see detailed information about the vulnerability.
    Figure 5: Example of findings from the Amazon Inspector console

    Figure 5: Example of findings from the Amazon Inspector console

Step 6: Remediate the vulnerability by applying the fixed package version

Now you can remediate the vulnerability by updating the package version as suggested by Amazon Inspector.

To remediate the vulnerability

  1. In the Amazon Inspector console, in the left navigation menu, choose All Findings.
  2. Choose the title of the vulnerability to see the finding details and the remediation recommendations.
    Figure 6: Amazon Inspector finding for python-jwt, with the associated remediation

    Figure 6: Amazon Inspector finding for python-jwt, with the associated remediation

  3. To remediate, use the following command to update the package version to the fixed version as suggested by Amazon Inspector.
    cd /home/cloudshell-user/sam-app;
    echo -e "requests\npython-jwt==3.3.4" > hello_world/requirements.txt

  4. Use the following command to build the application.
    sam build

  5. Use the following command to deploy the application with the guided option.
    sam deploy --guided

    This command packages and deploys the application to your AWS account. It provides a series of prompts. You may respond to the prompts with the

    1. Stack name you want
    2. Set the default options, except for the
      1. HelloWorldFunction may not have authorization defined, Is this okay? [y/N]: prompt. Here, input y and press Enter and
      2. Deploy this changeset? [y/N]: prompt. Here, input y and press Enter.
  6. Amazon Inspector automatically rescans the function after its deployment and reevaluates the findings. At this point, you can navigate back to the Amazon Inspector console, and in the left navigation menu, choose All findings. In the Findings area, you can see that the vulnerabilities are moved from Active to Closed status.

    Due to the custom event pattern rule in Amazon EventBridge, you will be notified by email with finding status as CLOSED.

    Figure 7: Inspector rescan results, showing no open findings after remediation

    Figure 7: Inspector rescan results, showing no open findings after remediation

(Optional) Step 7: Activate Amazon Inspector in multiple accounts and Regions

To benefit from Amazon Inspector scanning capabilities across the accounts that you have in AWS Organizations and in your selected Regions, use the following steps:

To activate Amazon Inspector in multiple accounts and Regions

  1. In the CloudShell console, use the following command to clone the code from the aws-samples inspector2-enablement-with-cli GitHub repo.
    cd /home/cloudshell-user;
    git clone https://github.com/aws-samples/inspector2-enablement-with-cli.git;
    cd inspector2-enablement-with-cli

  2. Follow the instructions from the README.md file.
  3. Configure the file param_inspector2.json with the relevant values, as follows:
    • inspector2_da: The delegated administrator account ID for Amazon Inspector to manage member accounts.
    • scanning_type: The resource types (EC2, ECR, LAMBDA) to be enabled by Amazon Inspector.
    • auto_enable: The resource types to be enabled on every account that is newly attached to the delegated administrator.
    • regions: Because Amazon Inspector is a regional service, provide the list of AWS Regions to enable.
  4. Select the AWS account that would be used as the delegated administrator account (<DA_ACCOUNT_ID>).
  5. Delegate an account as the admin for Amazon Inspector by using the following command.
    ./inspector2_enablement_with_awscli.sh -a delegate_admin -da <DA_ACCOUNT_ID>

  6. Activate the delegated admin by using the following command:
    ./inspector2_enablement_with_awscli.sh -a activate -t <DA_ACCOUNT_ID> -s all

  7. Associate the member accounts by using the following command:
    ./inspector2_enablement_with_awscli.sh -a associate -t members

  8. Wait five minutes.
  9. Enable the resource types (EC2, ECR, LAMBDA) on your member accounts by using the following command:
    ./inspector2_enablement_with_awscli.sh -a activate -t members

  10. Enable Amazon Inspector on the new member accounts that are associated with the organization by using the following command:
    ./inspector2_enablement_with_awscli.sh -auto_enable

  11. Check the Amazon Inspector status in your accounts and in multiple selected Regions by using the following command:
    ./inspector2_enablement_with_awscli.sh -a get_status

There are other options you can use to enable Amazon Inspector in multiple accounts, like AWS Control Tower and Terraform. For the reference architecture for Control Tower, see the AWS Security Reference Architecture Examples on GitHub. For more information on the Terraform option, see the Terraform aws_inspector2_enabler resource page.

Step 8: Delete the resources created in the previous steps

AWS offers a 15-day free trial for Amazon Inspector so that you can evaluate the service and estimate its cost.

To avoid potential charges, delete the AWS resources that you created in the previous steps of this solution (Lambda function, EventBridge target, EventBridge rule, and SNS topic), and deactivate Amazon Inspector.

To delete resources

  1. In the CloudShell console, enter the sam-app folder.
    cd /home/cloudshell-user/sam-app

  2. Delete the Lambda function and confirm by typing “y” when prompted for confirmation.
    sam delete

  3. Remove the SNS target from the Amazon EventBridge rule.
    aws events remove-targets --rule "amazon-inspector-findings" --ids <RANDOM-UNIQUE-IDENTIFIER-VALUE>

    Note: If you don’t remember the target ID, navigate to the Amazon EventBridge console, and in the left navigation menu, choose Rules. Select the rule that you want to delete. Choose CloudFormation, and copy the ID.

  4. Delete the EventBridge rule.
    aws events delete-rule --name amazon-inspector-findings

  5. Delete the SNS topic.
    aws sns delete-topic --topic-arn arn:aws:sns:<REGION_NAME>:<AWS_ACCOUNTID>:amazon-inspector-findings-notifier

  6. Disable Amazon Inspector.
    aws inspector2 disable --resource-types '["LAMBDA"]'

    Follow the new few steps to roll back changes only if you have performed the activities listed in Step 7: Activate Amazon Inspector in multiple accounts and Regions.

  7. In the CloudShell console, enter the folder inspector2-enablement-with-cli.
    cd /home/cloudshell-user/inspector2-enablement-with-cli

  8. Deactivate the resource types (EC2, ECR, LAMBDA) on your member accounts.
    ./inspector2_enablement_with_awscli.sh -a deactivate -t members -s all

  9. Disassociate the member accounts.
    ./inspector2_enablement_with_awscli.sh -a disassociate -t members

  10. Deactivate the delegated admin account.
    ./inspector2_enablement_with_awscli.sh -a deactivate -t <DA_ACCOUNT_ID> -s all

  11. Remove the delegated account as the admin for Amazon Inspector.
    ./inspector2_enablement_with_awscli.sh -a remove_admin -da <DA_ACCOUNT_ID>

Conclusion

In this blog post, we discussed how you can use Amazon Inspector to continuously scan your Lambda functions, and how to configure an Amazon EventBridge rule and SNS to send out notification of Lambda function vulnerabilities in near real time. You can then perform remediation activities by using AWS Lambda or AWS Systems Manager. We also showed how to enable Amazon Inspector at scale, activating in both single and multiple accounts, in default and multiple Regions.

As of the writing this post, a new feature to perform code scans for Lambda functions is available. Amazon Inspector can now also scan the custom application code within a Lambda function for code security vulnerabilities such as injection flaws, data leaks, weak cryptography, or missing encryption, based on AWS security best practices. You can use this additional scanning functionality to further protect your workloads.

If you have feedback about this blog post, submit comments in the Comments section below. If you have question about this blog post, start a new thread on the Amazon Inspector forum or contact AWS Support.

 
Want more AWS Security news? Follow us on Twitter.

Manjunath Arakere

Manjunath Arakere

Manjunath is a Senior Solutions Architect in the Worldwide Public Sector team at AWS. He works with Public Sector partners to design and scale well-architected solutions, and he supports their cloud migrations and application modernization initiatives. Manjunath specializes in migration, modernization and serverless technology.

Stéphanie Mbappe

Stéphanie Mbappe

Stéphanie is a Security Consultant with Amazon Web Services. She delights in assisting her customers at every step of their security journey. Stéphanie enjoys learning, designing new solutions, and sharing her knowledge with others.

Find Public IPs of Resources – Use AWS Config for Vulnerability Assessment

Post Syndicated from Gurkamal Deep Singh Rakhra original https://aws.amazon.com/blogs/architecture/find-public-ips-of-resources-use-aws-config-for-vulnerability-assessment/

Systems vulnerability management is a key component of your enterprise security program. Its goal is to remediate OS, software, and applications vulnerabilities. Scanning tools can help identify and classify these vulnerabilities to keep the environment secure and compliant.

Typically, vulnerability scanning tools operate from internal or external networks to discover and report vulnerabilities. For internal scanning, the tools use private IPs of target systems in scope. For external scans, the public target system’s IP addresses are used. It is important that security teams always maintain an accurate inventory of all deployed resource’s IP addresses. This ensures a comprehensive, consistent, and effective vulnerability assessment.

This blog discusses a scalable, serverless, and automated approach to discover public IP addresses assigned to resources in a single or multi-account environment in AWS, using AWS Config.

Single account is when you have all your resources in a single AWS account. A multi-account environment refers to many accounts under the same AWS Organization.

Understanding scope of solution

You may have good visibility into the private IPs assigned to your resources: Amazon Elastic Compute Cloud (Amazon EC2), Amazon Elastic Kubernetes Service (EKS) clusters, Elastic Load Balancing (ELB), and Amazon Elastic Container Service (Amazon ECS). But it may require some effort to establish a complete view of the existing public IPs. And these IPs can change over time, as new systems join and exit the environment.

An elastic network interface is a logical networking component in a Virtual Private Cloud (VPC) that represents a virtual network card. The elastic network interface routes traffic to other destinations/resources. Usually, you have to make Describe* API calls for the specific resource with an elastic network interface to get information about its configuration and IP address. This may throttle the resource-specific API calls, and result in higher costs. Additionally, if there are tens or hundreds of accounts, it becomes exponentially more difficult to get the information into a single inventory.

AWS Config enables you to assess, audit, and evaluate the configurations of your AWS resources. The advanced query feature provides a single query endpoint and language to get current resource state metadata for a single account and Region, or multiple accounts and Regions. You can use configuration aggregators to run the same queries from a central account across multiple accounts and AWS Regions.

AWS Config supports a subset of structured query language (SQL) SELECT syntax, which enables you to perform property-based queries and aggregations on the current configuration item (CI) data. Advanced query is available at no additional cost to AWS Config customers in all AWS Regions (except China Regions) and AWS GovCloud (US).

AWS Organizations helps you centrally govern your environment. Its integration with other AWS services lets you define central configurations, security mechanisms, audit requirements, and resource sharing across accounts in your organization.

Choosing scope of advanced queries in AWS Config

When running advanced queries in AWS Config, you must choose the scope of the query. The scope defines the accounts you want to run the query against and is configured when you create an aggregator.

Following are the three possible scopes when running advanced queries:

  1. Single account and single Region
  2. Multiple accounts and multiple Regions
  3. AWS Organization accounts

Single account and single Region

Figure 1. AWS Config workflow for single account and single Region

Figure 1. AWS Config workflow for single account and single Region

The use case shown in Figure 1 addresses the need of customers operating within a single account and single Region. With AWS Config enabled for the individual account, you will use AWS Config advanced query feature to run SQL queries. These will give you resource metadata about associated public IPs. You do not require an aggregator for single-account and single Region.

In Figure 1.1, the advanced query returned results from a single account and all Availability Zones within the Region in which the query was run.

Figure 1.1 Advanced query returning results for a single account and single Region

Figure 1.1 Advanced query returning results for a single account and single Region

Query for reference

SELECT

  resouceId,

  resourceName,

  resourceType,

  configuration.association.publicIp,

  availabilityZone,

  awsRegion

WHERE

  resourceType='AWS::EC2::NetworkInterface'

  AND configuration.association.publicIp>'0.0.0.0'

This query is fetching the properties of all elastic network interfaces. The WHERE condition is used to list the elastic network interfaces using the resourceType property and find all public IPs greater than 0.0.0.0. This is because elastic network interfaces can exist with a private IP, in which case there will be no public IP assigned to it. For a list of supported resourceType, refer to supported resource types for AWS Config.

Multiple accounts and multiple Regions

Figure 2. AWS Config monitoring workflow for multiple account and multiple Regions. The figure shows EC2, EKS, and Amazon ECS, but it can be any AWS resource having a public elastic network interface.

Figure 2. AWS Config monitoring workflow for multiple account and multiple Regions. The figure shows EC2, EKS, and Amazon ECS, but it can be any AWS resource having a public elastic network interface.

AWS Config enables you to monitor configuration changes against multiple accounts and multiple Regions via an aggregator, see Figure 2. An aggregator is an AWS Config resource type that collects AWS Config data from multiple accounts and Regions. You can choose the aggregator scope when running advanced queries in AWS Config. Remember to authorize the aggregator accounts to collect AWS Config configuration and compliance data.

Figure 2.1 Advanced query returning results from multiple Regions (awsRegion column) as highlighted in the diagram

Figure 2.1 Advanced query returning results from multiple Regions (awsRegion column) as highlighted in the diagram

This use case applies when you have AWS resources in multiple accounts (or span multiple organizations) and multiple Regions. Figure 2.1 shows the query results being returned from multiple AWS Regions.

Accounts in AWS Organization

Figure 3. The workflow of accounts in an AWS Organization being monitored by AWS Config. This figure shows EC2, EKS, and Amazon ECS but it can be any AWS resource having a public elastic network interface.

Figure 3. The workflow of accounts in an AWS Organization being monitored by AWS Config. This figure shows EC2, EKS, and Amazon ECS but it can be any AWS resource having a public elastic network interface.

An aggregator also enables you to monitor all the accounts in your AWS Organization, see Figure 3. When this option is chosen, AWS Config enables you to run advanced queries against the configuration history in all the accounts in your AWS Organization. Remember that an aggregator will only aggregate data from the accounts and Regions that are specified when the aggregator is created.

Figure 3.1 Advanced query returning results from all accounts (accountId column) under an AWS Organization

Figure 3.1 Advanced query returning results from all accounts (accountId column) under an AWS Organization

In Figure 3.1, the query is run against all accounts in an AWS Organization. This scope of AWS Organization is accomplished by the aggregator and it automatically accumulates data from all accounts under a specific AWS Organization.

Common architecture workflow for discovering public IPs

Figure 4. High-level architecture pattern for discovering public IPs

Figure 4. High-level architecture pattern for discovering public IPs

The workflow shown in Figure 4 starts with Amazon EventBridge triggering an AWS Lambda function. You can configure an Amazon EventBridge schedule via rate or cron expressions, which define the frequency. This AWS Lambda function will host the code to make an API call to AWS Config that will run an advanced query. The advanced query will check for all elastic network interfaces in your account(s). This is because any public resource launched in your account will be assigned an elastic network interface.

When the results are returned, they can be stored on Amazon S3. These result files can be timestamped (via naming or S3 versioning) in order to keep a history of public IPs used in your account. The result set can then be fed into or accessed by the vulnerability scanning tool of your choice.

Note: AWS Config advanced queries can also be used to query IPv6 addresses. You can use the “configuration.ipv6Addresses” AWS Config property to get IPv6 addresses. When querying IPv6 addresses, remove “configuration.association.publicIp > ‘0.0.0.0’” condition from the preceding sample queries. For more information on available AWS Config properties and data types, refer to GitHub.

Conclusion

In this blog, we demonstrated how to extract public IP information from resources deployed in your account(s) using AWS Config and AWS Config advanced query. We discussed how you can support your vulnerability scanning process by identifying public IPs in your account(s) that can be fed into your scanning tool. This solution is serverless, automated, and scalable, which removes the undifferentiated heavy lifting required to manage your resources.

Learn more about AWS Config best practices:

How to visualize multi-account Amazon Inspector findings with Amazon Elasticsearch Service

Post Syndicated from Moumita Saha original https://aws.amazon.com/blogs/security/how-to-visualize-multi-account-amazon-inspector-findings-with-amazon-elasticsearch-service/

Amazon Inspector helps to improve the security and compliance of your applications that are deployed on Amazon Web Services (AWS). It automatically assesses Amazon Elastic Compute Cloud (Amazon EC2) instances and applications on those instances. From that assessment, it generates findings related to exposure, potential vulnerabilities, and deviations from best practices.

You can use the findings from Amazon Inspector as part of a vulnerability management program for your Amazon EC2 fleet across multiple AWS Regions in multiple accounts. The ability to rank and efficiently respond to potential security issues reduces the time that potential vulnerabilities remain unresolved. This can be accelerated within a single pane of glass for all the accounts in your AWS environment.

Following AWS best practices, in a secure multi-account AWS environment, you can provision (using AWS Control Tower) a group of accounts—known as core accounts, for governing other accounts within the environment. One of the core accounts may be used as a central security account, which you can designate for governing the security and compliance posture across all accounts in your environment. Another core account is a centralized logging account, which you can provision and designate for central storage of log data.

In this blog post, I show you how to:

  1. Use Amazon Inspector, a fully managed security assessment service, to generate security findings.
  2. Gather findings from multiple Regions across multiple accounts using Amazon Simple Notification Service (Amazon SNS) and Amazon Simple Queue Service (Amazon SQS).
  3. Use AWS Lambda to send the findings to a central security account for deeper analysis and reporting.

In this solution, we send the findings to two services inside the central security account:

Solution overview

Overall architecture

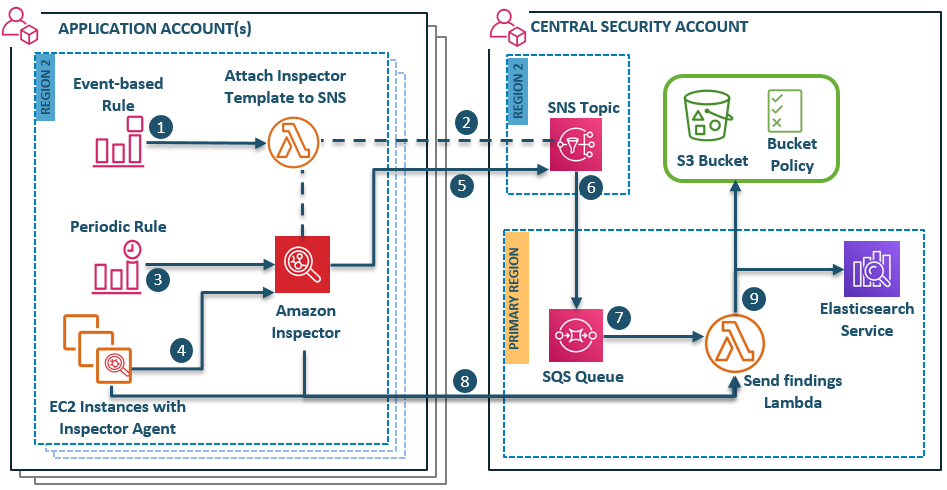
The flow of events to implement the solution is shown in Figure 1 and described in the following process flow.

Figure 1: Solution overview architecture

Figure 1: Solution overview architecture

Process flow

The flow of this architecture is divided into two types of processes—a one-time process and a scheduled process. The AWS resources that are part of the one-time process are triggered the first time an Amazon Inspector assessment template is created in each Region of each application account. The AWS resources of the scheduled process are triggered at a designated interval of Amazon Inspector scan in each Region of each application account.

One-time process

  1. An event-based Amazon CloudWatch rule in each Region of every application account triggers a regional AWS Lambda function when an Amazon Inspector assessment template is created for the first time in that Region.

    Note: In order to restrict this event to trigger the Lambda function only the first time an assessment template is created, you must use a specific user-defined tag to trigger the Attach Inspector template to SNS Lambda function for only one Amazon Inspector template per Region. For more information on tags, see the Tagging AWS resources documentation.

  2. The Lambda function attaches the Amazon Inspector assessment template (created in application accounts) to the cross-account Amazon SNS topic (created in the security account). The function, the template, and the topic are all in the same AWS Region.

    Note: This step is needed because Amazon Inspector templates can only be attached to SNS topics in the same account via the AWS Management Console or AWS Command Line Interface (AWS CLI).

Scheduled process

  1. A scheduled Amazon CloudWatch Event in every Region of the application accounts starts the Amazon Inspector scan at a scheduled time interval, which you can configure.
  2. An Amazon Inspector agent conducts the scan on the EC2 instances of the Region where the assessment template is created and sends any findings to Amazon Inspector.
  3. Once the findings are generated, Amazon Inspector notifies the Amazon SNS topic of the security account in the same Region.
  4. The Amazon SNS topics from each Region of the central security account receive notifications of Amazon Inspector findings from all application accounts. The SNS topics then send the notifications to a central Amazon SQS queue in the primary Region of the security account.
  5. The Amazon SQS queue triggers the Send findings Lambda function (as shown in Figure 1) of the security account.

    Note: Each Amazon SQS message represents one Amazon Inspector finding.

  6. The Send findings Lambda function assumes a cross-account role to fetch the following information from all application accounts:
    1. Finding details from the Amazon Inspector API.
    2. Additional Amazon EC2 attributes—VPC, subnet, security group, and IP address—from EC2 instances with potential vulnerabilities.
  7. The Lambda function then sends all the gathered data to a central S3 bucket and a domain in Amazon ES—both in the central security account.

These Amazon Inspector findings, along with additional attributes on the scanned instances, can be used for further analysis and visualization via Kibana—a data visualization dashboard for Amazon ES. Storing a copy of these findings in an S3 bucket gives you the opportunity to forward the findings data to outside monitoring tools that don’t support direct data ingestion from AWS Lambda.

Prerequisites

The following resources must be set up before you can implement this solution:

  1. A multi-account structure. To learn how to set up a multi-account structure, see Setting up AWS Control Tower and AWS Landing zone.
  2. Amazon Inspector agents must be installed on all EC2 instances. See Installing Amazon Inspector agents to learn how to set up Amazon Inspector agents on EC2 instances. Additionally, keep note of all the Regions where you install the Amazon Inspector agent.
  3. An Amazon ES domain with Kibana authentication. See Getting started with Amazon Elasticsearch Service and Use Amazon Cognito for Kibana access control.
  4. An S3 bucket for centralized storage of Amazon Inspector findings.
  5. An S3 bucket for storage of the Lambda source code for the solution.

Set up Amazon Inspector with Amazon ES and S3

Follow these steps to set up centralized Amazon Inspector findings with Amazon ES and Amazon S3:

  1. Upload the solution ZIP file to the S3 bucket used for Lambda code storage.
  2. Collect the input parameters for AWS CloudFormation deployment.
  3. Deploy the base template into the central security account.
  4. Deploy the second template in the primary Region of all application accounts to create global resources.
  5. Deploy the third template in all Regions of all application accounts.

Step 1: Upload the solution ZIP file to the S3 bucket used for Lambda code storage

  1. From GitHub, download the file Inspector-to-S3ES-crossAcnt.zip.
  2. Upload the ZIP file to the S3 bucket you created in the central security account for Lambda code storage. This code is used to create the Lambda function in the first CloudFormation stack set of the solution.

Step 2: Collect input parameters for AWS CloudFormation deployment

In this solution, you deploy three AWS CloudFormation stack sets in succession. Each stack set should be created in the primary Region of the central security account. Underlying stacks are deployed across the central security account and in all the application accounts where the Amazon Inspector scan is performed. You can learn more in Working with AWS CloudFormation StackSets.

Before you proceed to the stack set deployment, you must collect the input parameters for the first stack set: Central-SecurityAcnt-BaseTemplate.yaml.

To collect input parameters for AWS CloudFormation deployment

  1. Fetch the account ID (CentralSecurityAccountID) of the AWS account where the stack set will be created and deployed. You can use the steps in Finding your AWS account ID to help you find the account ID.
  2. Values for the ES domain parameters can be fetched from the Amazon ES console.
    1. Open the Amazon ES Management Console and select the Region where the Amazon ES domain exists.
    2. Select the domain name to view the domain details.
    3. The value for ElasticsearchDomainName is displayed on the top left corner of the domain details.
    4. On the Overview tab in the domain details window, select and copy the URL value of the Endpoint to use as the ElasticsearchEndpoint parameter of the template. Make sure to exclude the https:// at the beginning of the URL.

      Figure 2: Details of the Amazon ES domain for fetching parameter values

      Figure 2: Details of the Amazon ES domain for fetching parameter values

  3. Get the values for the S3 bucket parameters from the Amazon S3 console.
    1. Open the Amazon S3 Management Console.
    2. Copy the name of the S3 bucket that you created for centralized storage of Amazon Inspector findings. Save this bucket name for the LoggingS3Bucket parameter value of the Central-SecurityAcnt-BaseTemplate.yaml template.
    3. Select the S3 bucket used for source code storage. Select the bucket name and copy the name of this bucket for the LambdaSourceCodeS3Bucket parameter of the template.

      Figure 3: The S3 bucket where Lambda code is uploaded

      Figure 3: The S3 bucket where Lambda code is uploaded

  4. On the bucket details page, select the source code ZIP file name that you previously uploaded to the bucket. In the detail page of the ZIP file, choose the Overview tab, and then copy the value in the Key field to use as the value for the LambdaCodeS3Key parameter of the template.

    Figure 4: Details of the Lambda code ZIP file uploaded in Amazon S3 showing the key prefix value

    Figure 4: Details of the Lambda code ZIP file uploaded in Amazon S3 showing the key prefix value

Note: All of the other input parameter values of the template are entered automatically, but you can change them during stack set creation if necessary.

Step 3: Deploy the base template into the central security account

Now that you’ve collected the input parameters, you’re ready to deploy the base template that will create the necessary resources for this solution implementation in the central security account.

Prerequisites for CloudFormation stack set deployment

There are two permission modes that you can choose from for deploying a stack set in AWS CloudFormation. If you’re using AWS Organizations and have all features enabled, you can use the service-managed permissions; otherwise, self-managed permissions mode is recommended. To deploy this solution, you’ll use self-managed permissions mode. To run stack sets in self-managed permissions mode, your administrator account and the target accounts must have two IAM roles—AWSCloudFormationStackSetAdministrationRole and AWSCloudFormationStackSetExecutionRole—as prerequisites. In this solution, the administrator account is the central security account and the target accounts are application accounts. You can use the following CloudFormation templates to create the necessary IAM roles:

To deploy the base template

  1. Download the base template (Central-SecurityAcnt-BaseTemplate.yaml) from GitHub.
  2. Open the AWS CloudFormation Management Console and select the Region where all the stack sets will be created for deployment. This should be the primary Region of your environment.
  3. Select Create StackSet.
    1. In the Create StackSet window, select Template is ready and then select Upload a template file.
    2. Under Upload a template file, select Choose file and select the Central-SecurityAcnt-BaseTemplate.yaml template that you downloaded earlier.
    3. Choose Next.
  4. Add stack set details.
    1. Enter a name for the stack set in StackSet name.
    2. Under Parameters, most of the values are pre-populated except the values you collected in the previous procedure for CentralSecurityAccountID, ElasticsearchDomainName, ElasticsearchEndpoint, LoggingS3Bucket, LambdaSourceCodeS3Bucket, and LambdaCodeS3Key.
    3. After all the values are populated, choose Next.
  5. Configure StackSet options.
    1. (Optional) Add tags as described in the prerequisites to apply to the resources in the stack set that these rules will be deployed to. Tagging is a recommended best practice, because it enables you to add metadata information to resources during their creation.
    2. Under Permissions, choose the Self service permissions mode to be used for deploying the stack set, and then select the AWSCloudFormationStackSetAdministrationRole from the dropdown list.

      Figure 5: Permission mode to be selected for stack set deployment

      Figure 5: Permission mode to be selected for stack set deployment

    3. Choose Next.
  6. Add the account and Region details where the template will be deployed.
    1. Under Deployment locations, select Deploy stacks in accounts. Under Account numbers, enter the account ID of the security account that you collected earlier.

      Figure 6: Values to be provided during the deployment of the first stack set

      Figure 6: Values to be provided during the deployment of the first stack set

    2. Under Specify regions, select all the Regions where the stacks will be created. This should be the list of Regions where you installed the Amazon Inspector agent. Keep note of this list of Regions to use in the deployment of the third template in an upcoming step.
      • Though an Amazon Inspector scan is performed in all the application accounts, the regional Amazon SNS topics that send scan finding notifications are created in the central security account. Therefore, this template is created in all the Regions where Amazon Inspector will notify SNS. The template has the logic needed to handle the creation of specific AWS resources only in the primary Region, even though the template executes in many Regions.
      • The order in which Regions are selected under Specify regions defines the order in which the stack is deployed in the Regions. So you must make sure that the primary Region of your deployment is the first one specified under Specify regions, followed by the other Regions of stack set deployment. This is required because global resources are created using one Region—ideally the primary Region—and so stack deployment in that Region should be done before deployment to other Regions in order to avoid any build dependencies.

        Figure 7: Showing the order of specifying the Regions of stack set deployment

        Figure 7: Showing the order of specifying the Regions of stack set deployment

  7. Review the template settings and select the check box to acknowledge the Capabilities section. This is required if your deployment template creates IAM resources. You can learn more at Controlling access with AWS Identity and Access Management.

    Figure 8: Acknowledge IAM resources creation by AWS CloudFormation

    Figure 8: Acknowledge IAM resources creation by AWS CloudFormation

  8. Choose Submit to deploy the stack set.

Step 4: Deploy the second template in the primary Region of all application accounts to create global resources

This template creates the global resources required for sending Amazon Inspector findings to Amazon ES and Amazon S3.

To deploy the second template

  1. Download the template (ApplicationAcnts-RolesTemplate.yaml) from GitHub and use it to create the second CloudFormation stack set in the primary Region of the central security account.
  2. To deploy the template, follow the steps used to deploy the base template (described in the previous section) through Configure StackSet options.
  3. In Set deployment options, do the following:
    1. Under Account numbers, enter the account IDs of your application accounts as comma-separated values. You can use the steps in Finding your AWS account ID to help you gather the account IDs.
    2. Under Specify regions, select only your primary Region.

      Figure 9: Select account numbers and specify Regions

      Figure 9: Select account numbers and specify Regions

  4. The remaining steps are the same as for the base template deployment.

Step 5: Deploy the third template in all Regions of all application accounts

This template creates the resources in each Region of all application accounts needed for scheduled scanning of EC2 instances using Amazon Inspector. Notifications are sent to the SNS topics of each Region of the central security account.

To deploy the third template

  1. Download the template InspectorRun-SetupTemplate.yaml from GitHub and create the final AWS CloudFormation stack set. Similar to the previous stack sets, this one should also be created in the central security account.
  2. For deployment, follow the same steps you used to deploy the base template through Configure StackSet options.
  3. In Set deployment options:
    1. Under Account numbers, enter the same account IDs of your application accounts (comma-separated values) as you did for the second template deployment.
    2. Under Specify regions, select all the Regions where you installed the Amazon Inspector agent.

      Note: This list of Regions should be the same as the Regions where you deployed the base template.

  4. The remaining steps are the same as for the second template deployment.

Test the solution and delivery of the findings

After successful deployment of the architecture, to test the solution you can wait until the next scheduled Amazon Inspector scan or you can use the following steps to run the Amazon Inspector scan manually.

To run the Amazon Inspector scan manually for testing the solution

  1. In any one of the application accounts, go to any Region where the Amazon Inspector scan was performed.
  2. Open the Amazon Inspector console.
  3. In the left navigation menu, select Assessment templates to see the available assessments.
  4. Choose the assessment template that was created by the third template.
  5. Choose Run to start the assessment immediately.
  6. When the run is complete, Last run status changes from Collecting data to Analysis Complete.

    Figure 10: Amazon Inspector assessment run

    Figure 10: Amazon Inspector assessment run

  7. You can see the recent scan findings in the Amazon Inspector console by selecting Assessment runs from the left navigation menu.

    Figure 11: The assessment run indicates total findings from the last Amazon Inspector run in this Region

    Figure 11: The assessment run indicates total findings from the last Amazon Inspector run in this Region

  8. In the left navigation menu, select Findings to see details of each finding, or use the steps in the following section to verify the delivery of findings to the central security account.

Test the delivery of the Amazon Inspector findings

This solution delivers the Amazon Inspector findings to two AWS services—Amazon ES and Amazon S3—in the primary Region of the central security account. You can either use Kibana to view the findings sent to Amazon ES or you can use the findings sent to Amazon S3 and forward them to the security monitoring software of your preference for further analysis.

To check whether the findings are delivered to Amazon ES

  1. Open the Amazon ES Management Console and select the Region where the Amazon ES domain is located.
  2. Select the domain name to view the domain details.
  3. On the domain details page, select the Kibana URL.

    Figure 12: Amazon ES domain details page

    Figure 12: Amazon ES domain details page

  4. Log in to Kibana using your preferred authentication method as set up in the prerequisites.
    1. In the left panel, select Discover.
    2. In the Discover window, select a Region to view the total number of findings in that Region.

      Figure 13: The total findings in Kibana for the chosen Region of an application account

      Figure 13: The total findings in Kibana for the chosen Region of an application account

To check whether the findings are delivered to Amazon S3

  1. Open the Amazon S3 Management Console.
  2. Select the S3 bucket that you created for storing Amazon Inspector findings.
  3. Select the bucket name to view the bucket details. The total number of findings for the chosen Region is at the top right corner of the Overview tab.

    Figure 14: The total security findings as stored in an S3 bucket for us-east-1 Region

    Figure 14: The total security findings as stored in an S3 bucket for us-east-1 Region

Visualization in Kibana

The data sent to the Amazon ES index can be used to create visualizations in Kibana that make it easier to identify potential security gaps and plan the remediation accordingly.

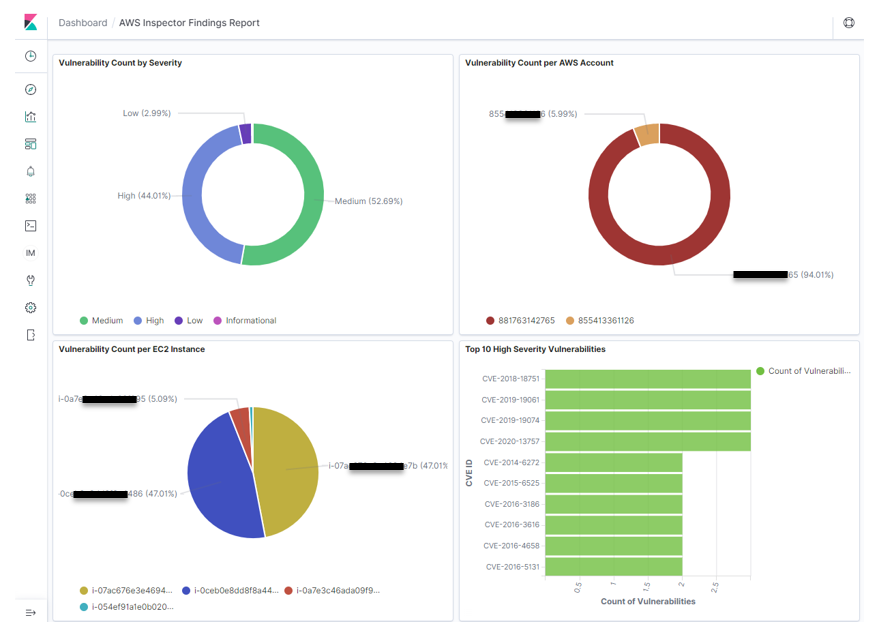
You can use Kibana to create a dashboard that gives an overview of the potential vulnerabilities identified in different instances of different AWS accounts. Figure 15 shows an example of such a dashboard. The dashboard can help you rank the need for remediation based on criteria such as:

  • The category of vulnerability
  • The most impacted AWS accounts
  • EC2 instances that need immediate attention
Figure 15: A sample Kibana dashboard showing findings from Amazon Inspector

Figure 15: A sample Kibana dashboard showing findings from Amazon Inspector

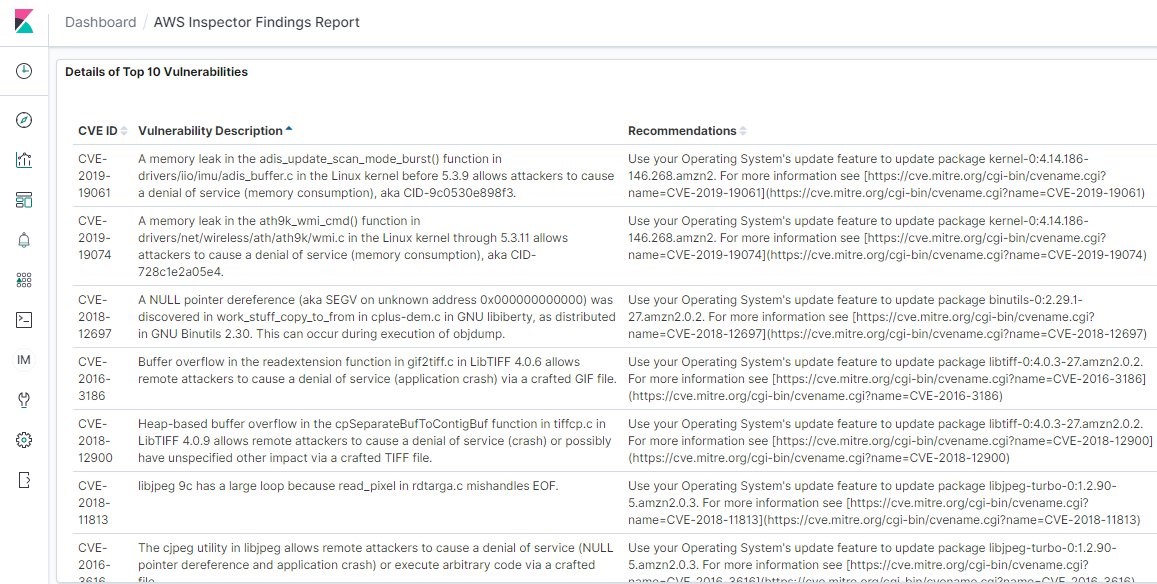
You can build additional panels to visualize details of the vulnerability findings identified by Amazon Inspector, such as the CVE ID of the security vulnerability, its description, and recommendations on how to remove the vulnerabilities.

Figure 16: A sample Kibana dashboard panel listing the top identified vulnerabilities and their details

Figure 16: A sample Kibana dashboard panel listing the top identified vulnerabilities and their details

Conclusion

By using this solution to combine Amazon Inspector, Amazon SNS topics, Amazon SQS queues, Lambda functions, an Amazon ES domain, and S3 buckets, you can centrally analyze and monitor the vulnerability posture of EC2 instances across your AWS environment, including multiple Regions across multiple AWS accounts. This solution is built following least privilege access through AWS IAM roles and policies to help secure the cross-account architecture.

In this blog post, you learned how to send the findings directly to Amazon ES for visualization in Kibana. These visualizations can be used to build dashboards that security analysts can use for centralized monitoring. Better monitoring capability helps analysts to identify potentially vulnerable assets and perform remediation activities to improve security of your applications in AWS and their underlying assets. This solution also demonstrates how to store the findings from Amazon Inspector in an S3 bucket, which makes it easier for you to use those findings to create visualizations in your preferred security monitoring software.

If you have feedback about this post, submit comments in the Comments section below. If you have questions about this post, contact AWS Support.

Want more AWS Security how-to content, news, and feature announcements? Follow us on Twitter.

Author

Moumita Saha

Moumita is a Security Consultant with AWS Professional Services working to help enterprise customers secure their workloads in the cloud. She assists customers in secure cloud migration, designing automated solutions to protect against cyber threats in the cloud. She is passionate about cyber security, data privacy, and new, emerging cloud-security technologies.