Cloudflare operates in more than 250 cities worldwide where we connect our equipment to the Internet to provide our broad range of services. We have data centers in Ukraine, Belarus and Russia and across the world. To operate our service we monitor traffic trends, performance and errors seen at each data center, aggregate data about DNS, and congestion and packet loss on Internet links.
Internet Traffic
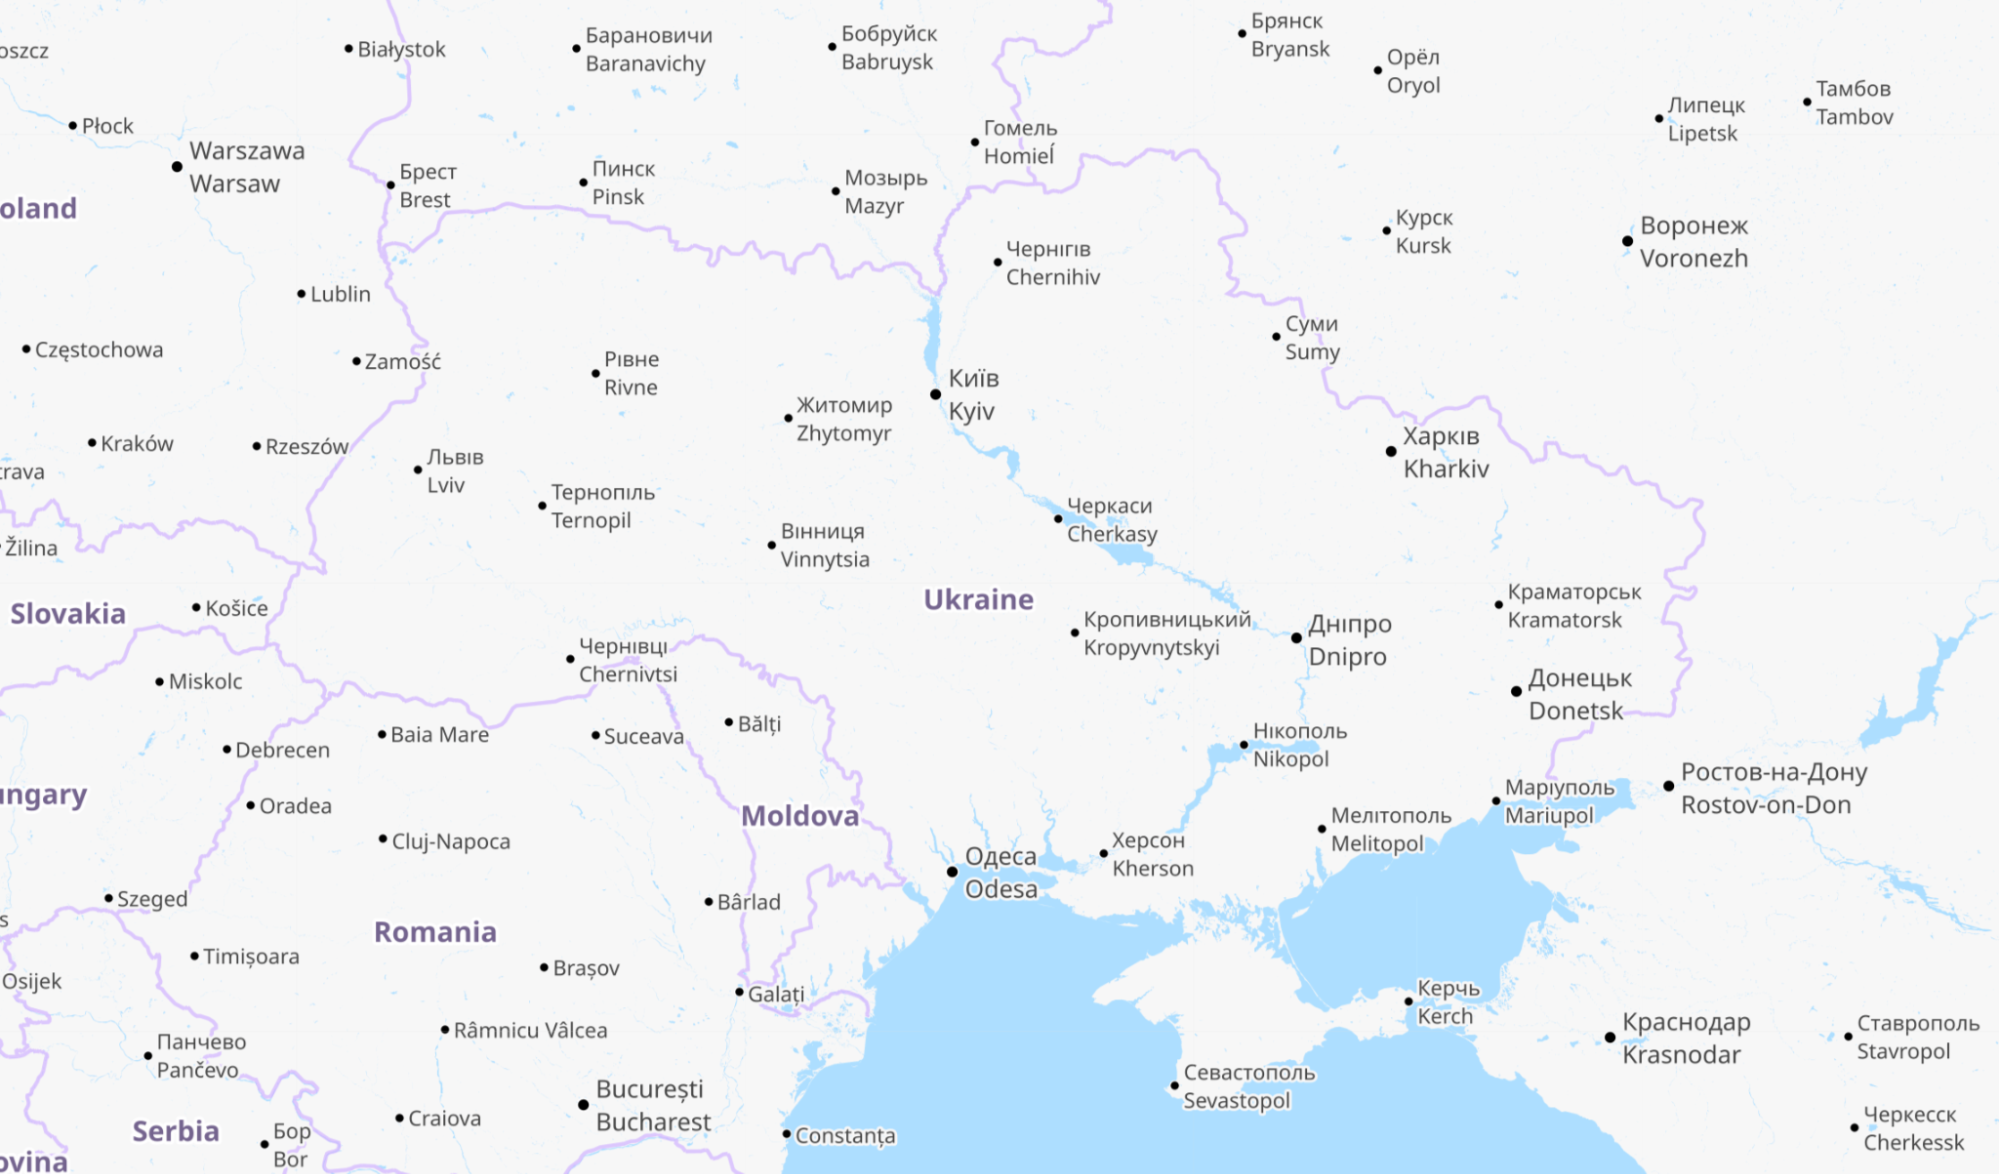
For reference, here is a map of Ukraine showing its major cities. Note that whenever we talk about dates and times in this post, we are using UTC. Ukraine’s current time zone is UTC+2.
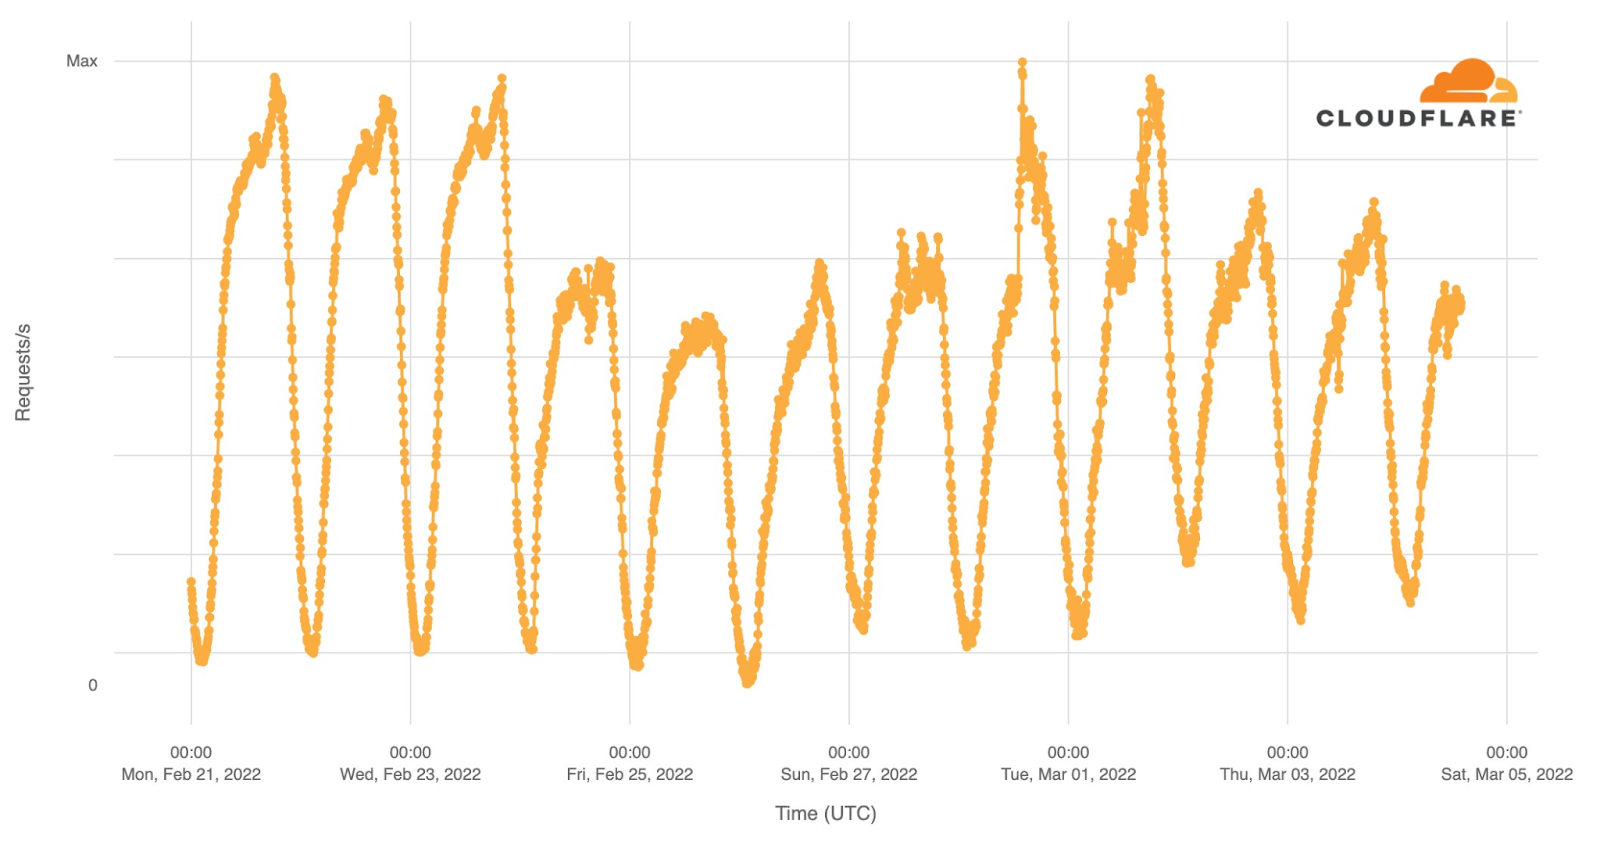
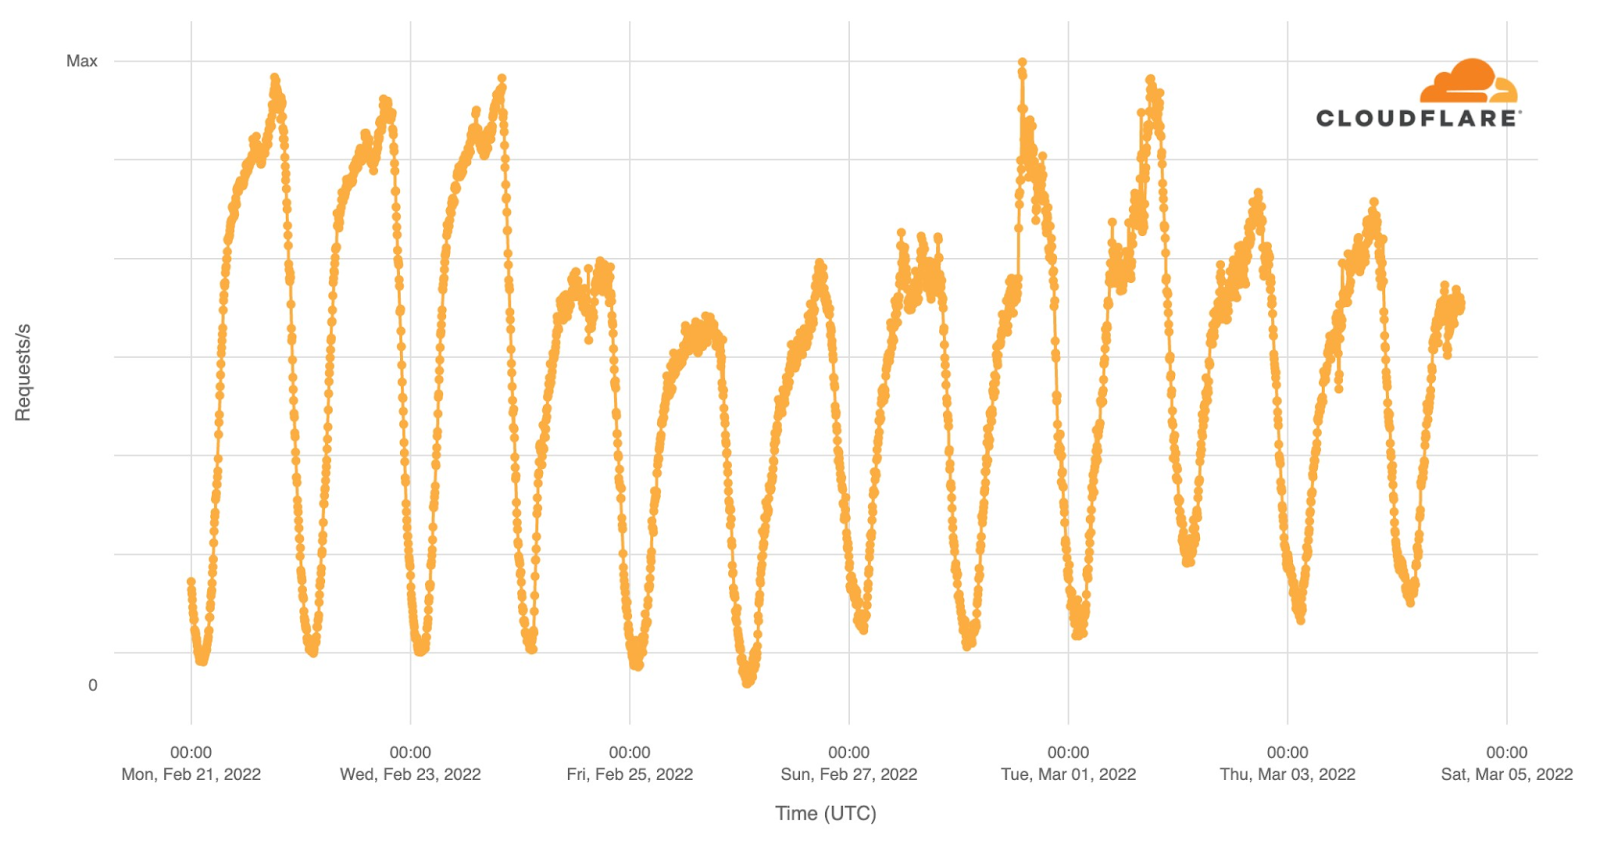
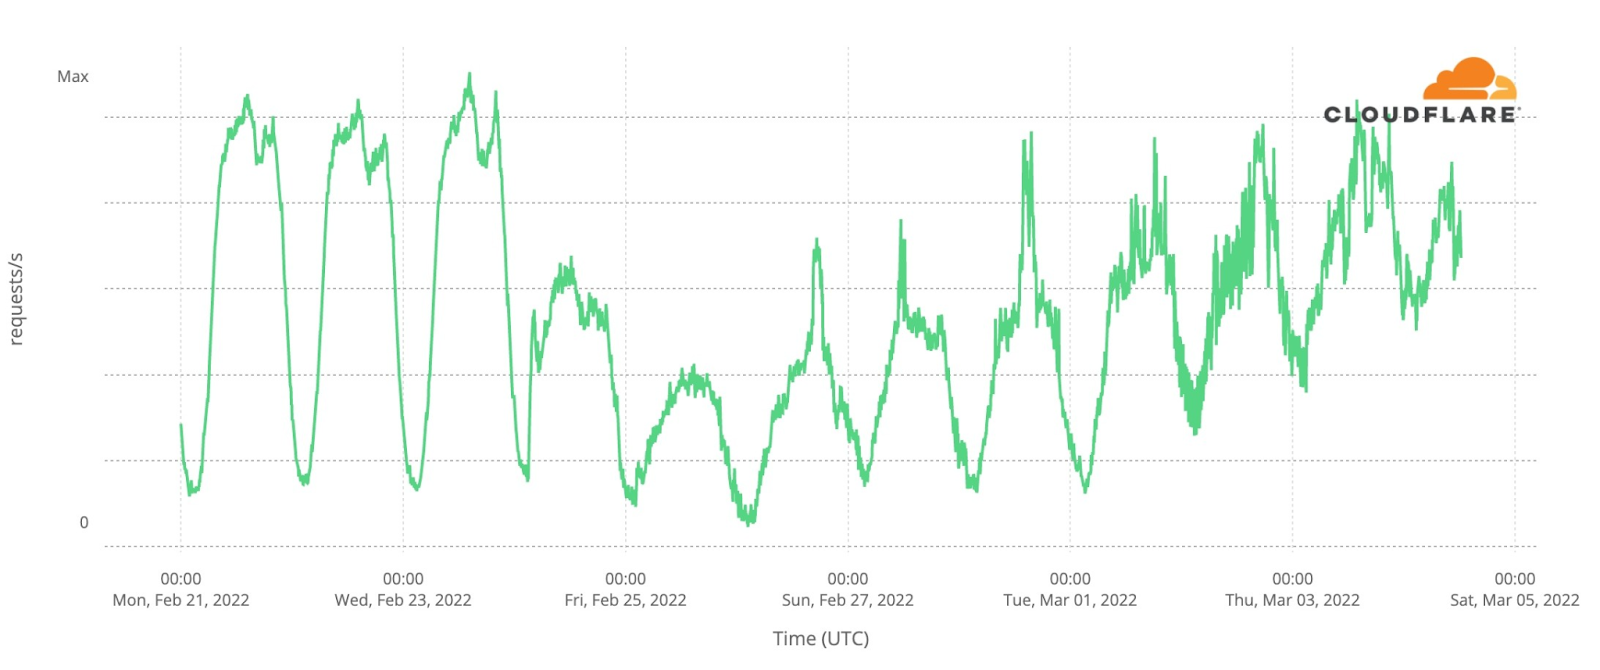
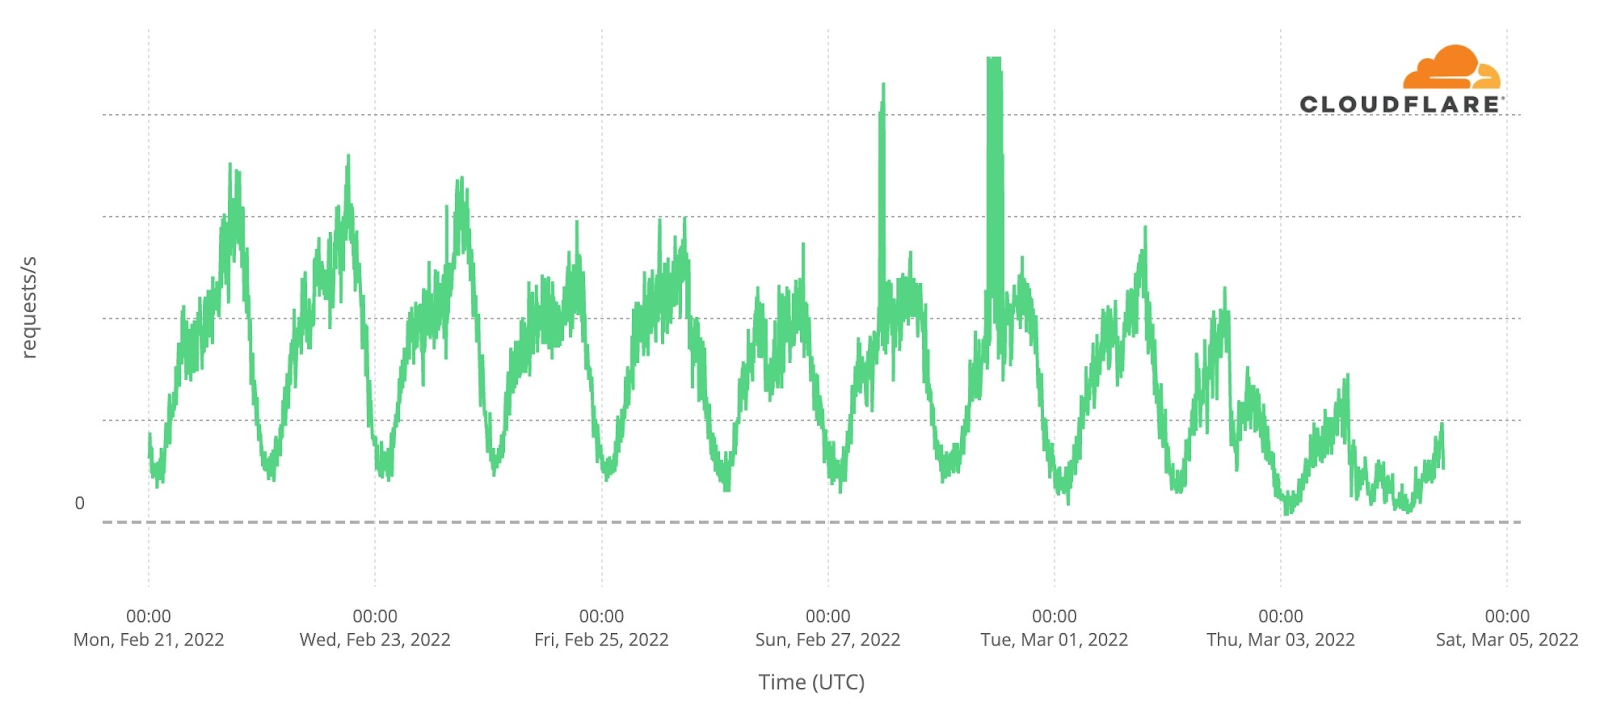
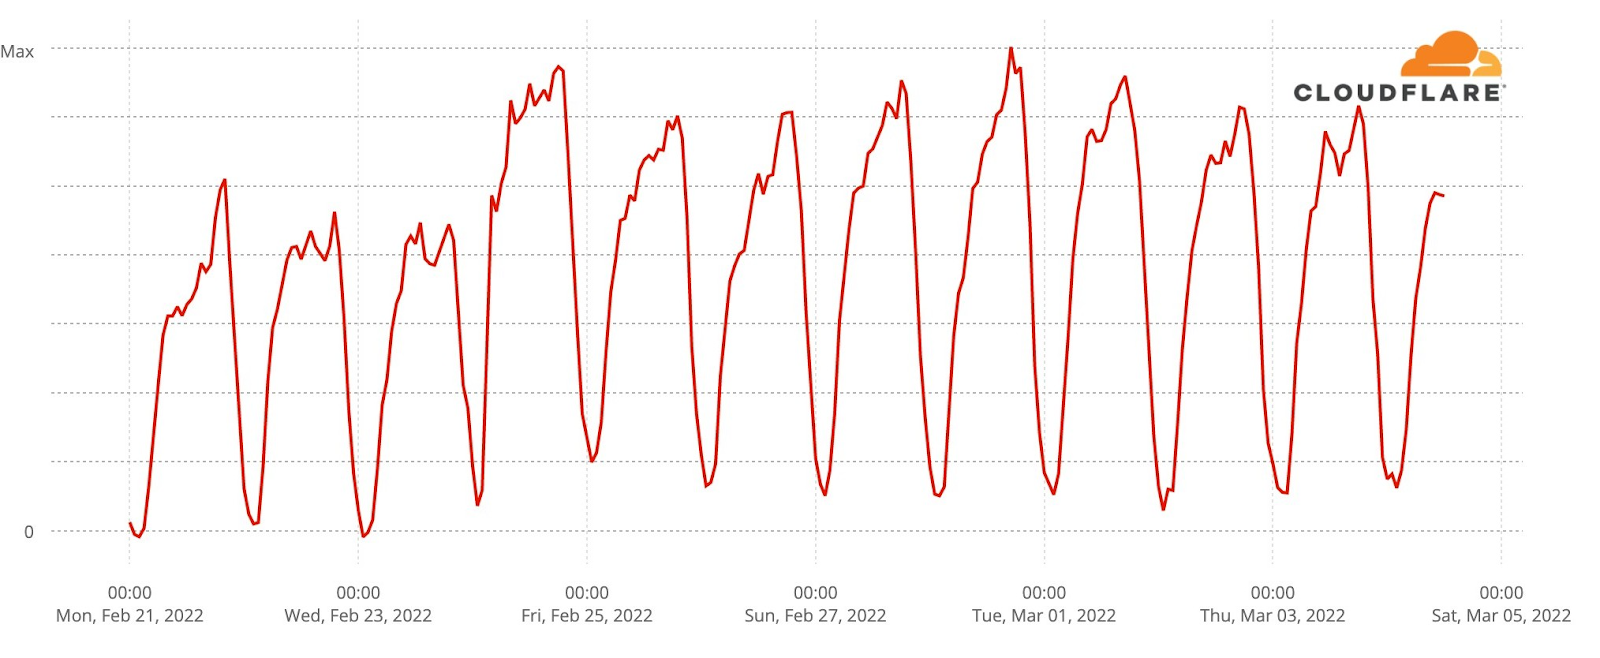
Internet traffic in Ukraine generally follows a pretty predictable pattern based on day and night. Lowest in the hours after local midnight and picking up as people wake up. It’s not uncommon to see a dip around lunchtime and a peak when people go home in the evening. That pattern is clearly visible in this chart of overall Internet traffic seen by Cloudflare for Ukrainian networks on Monday, Tuesday, and Wednesday prior to the invasion.
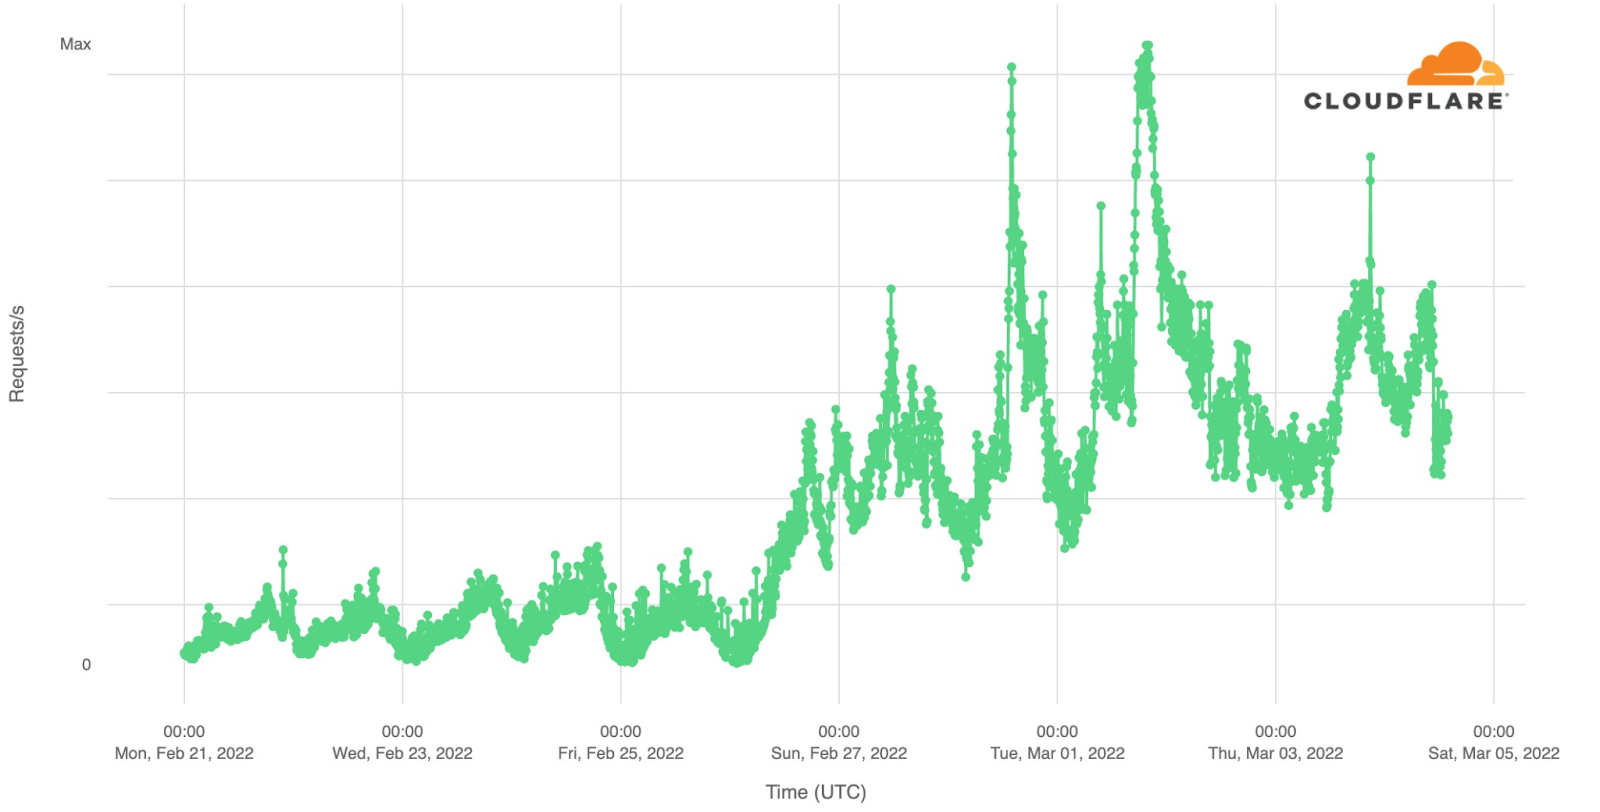
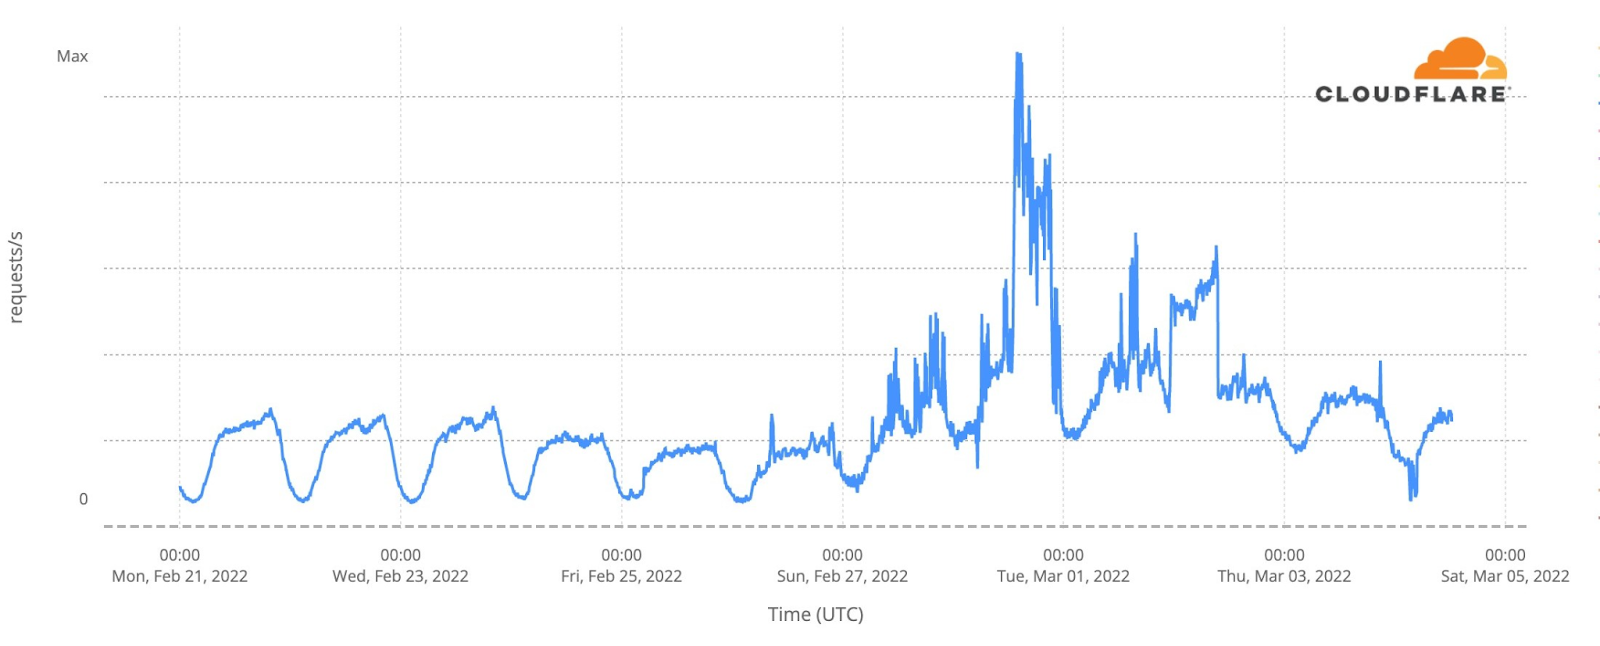
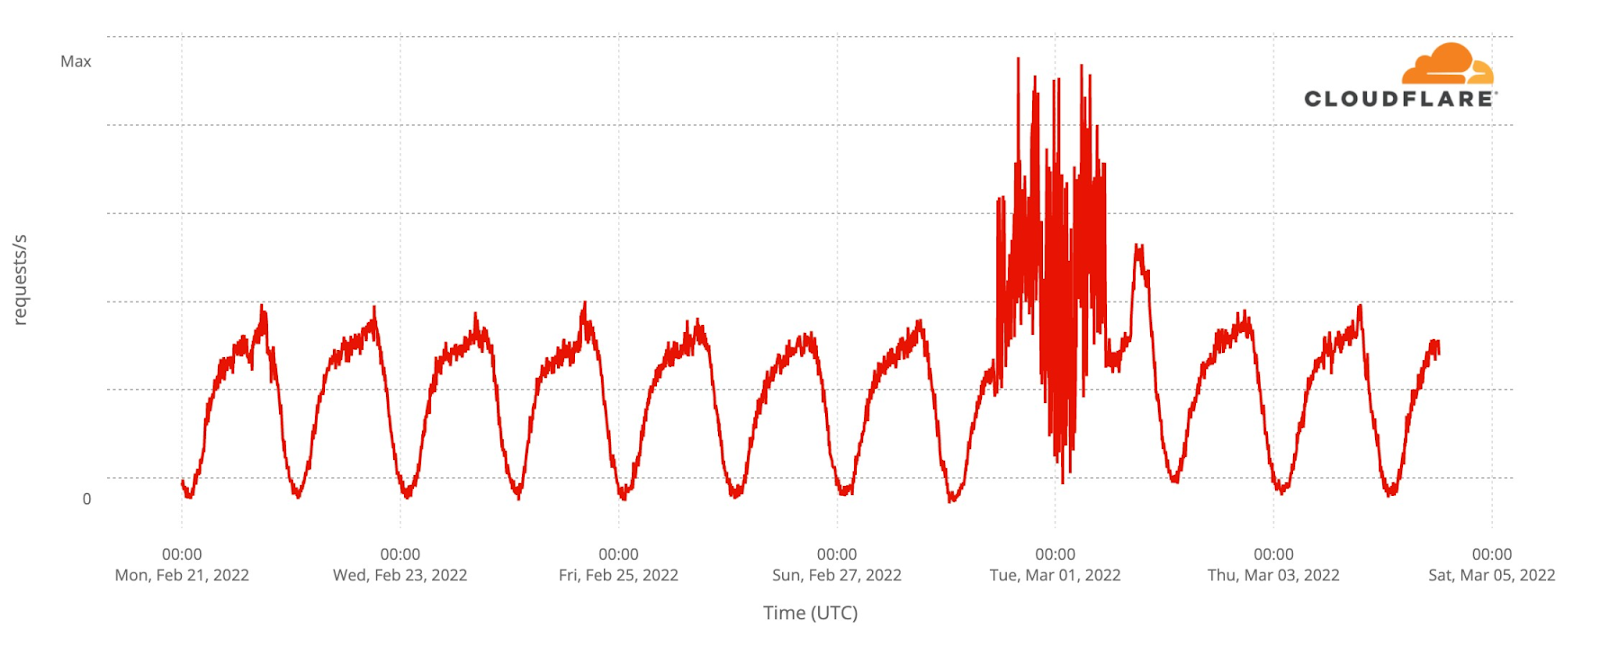
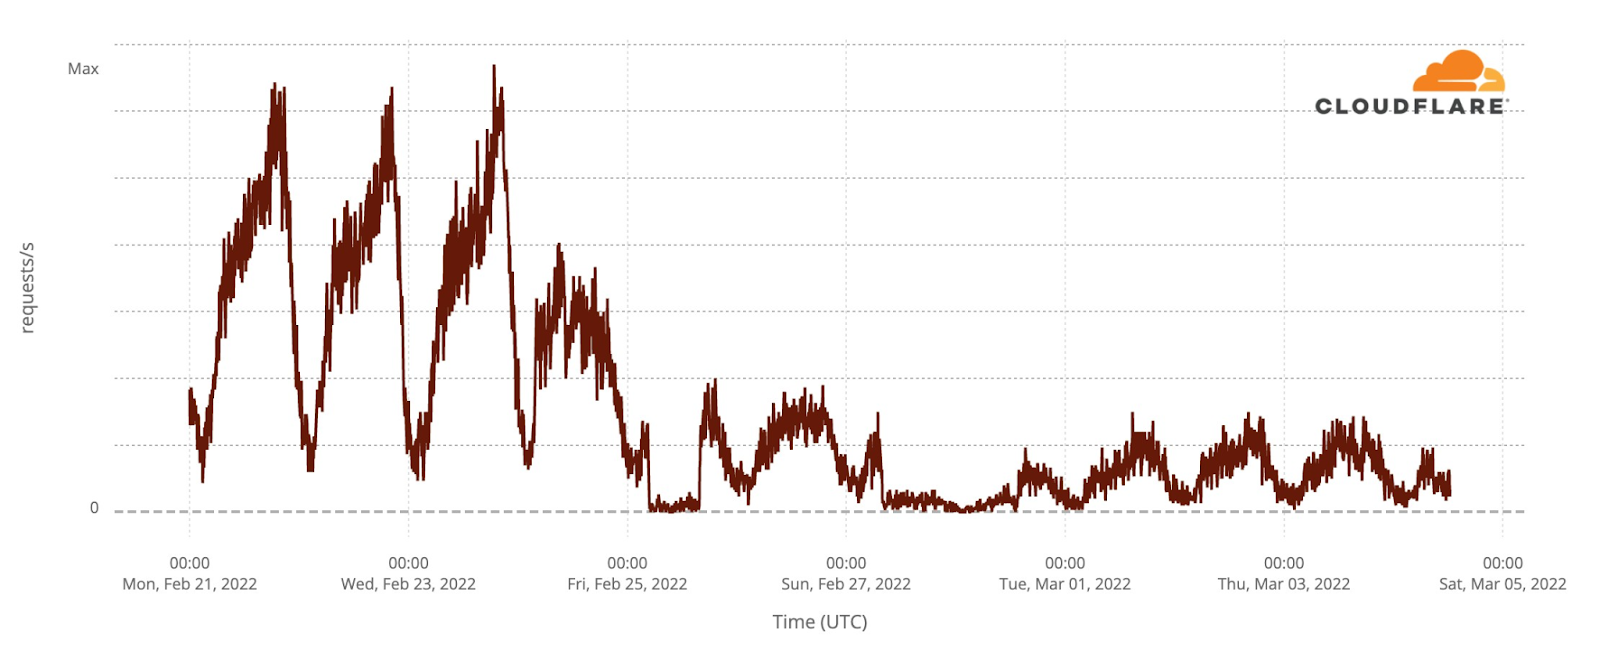
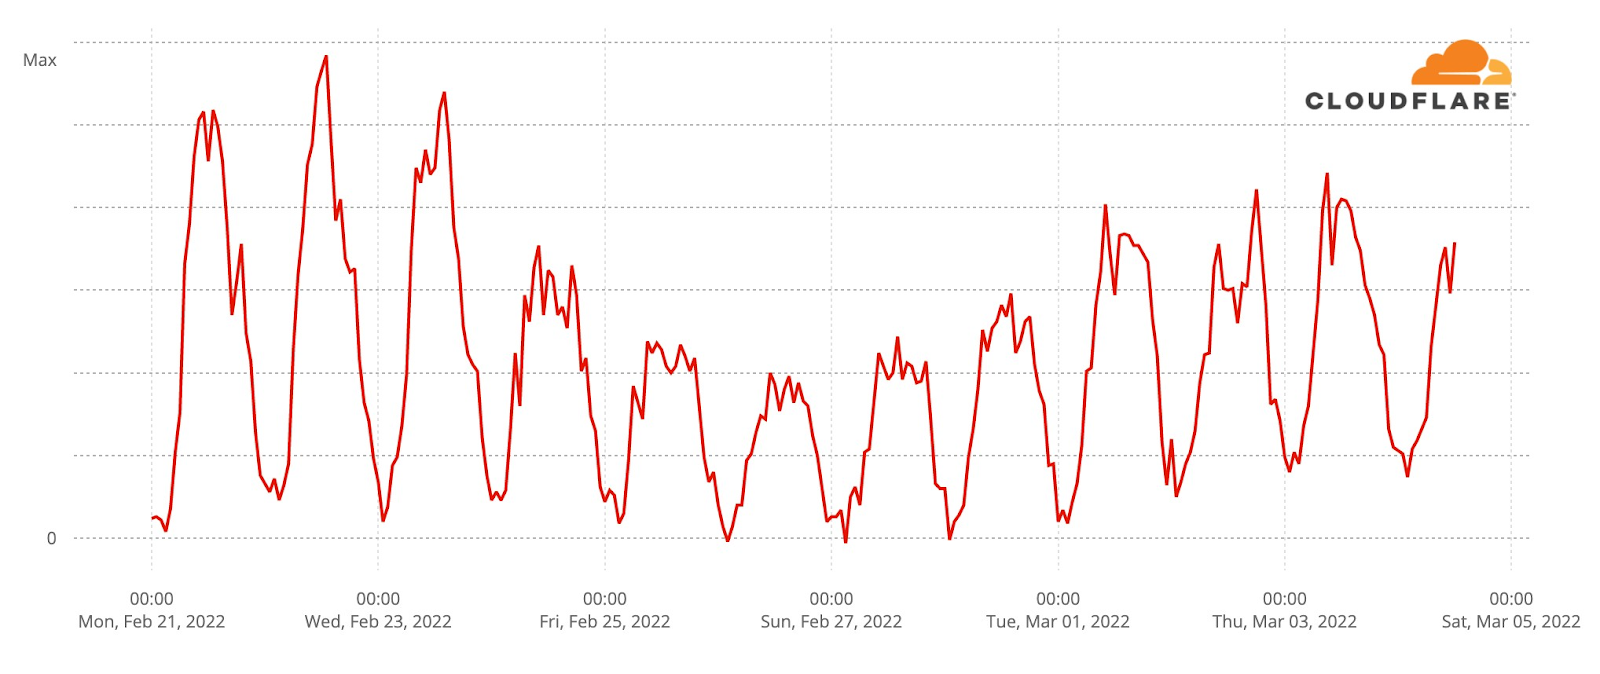
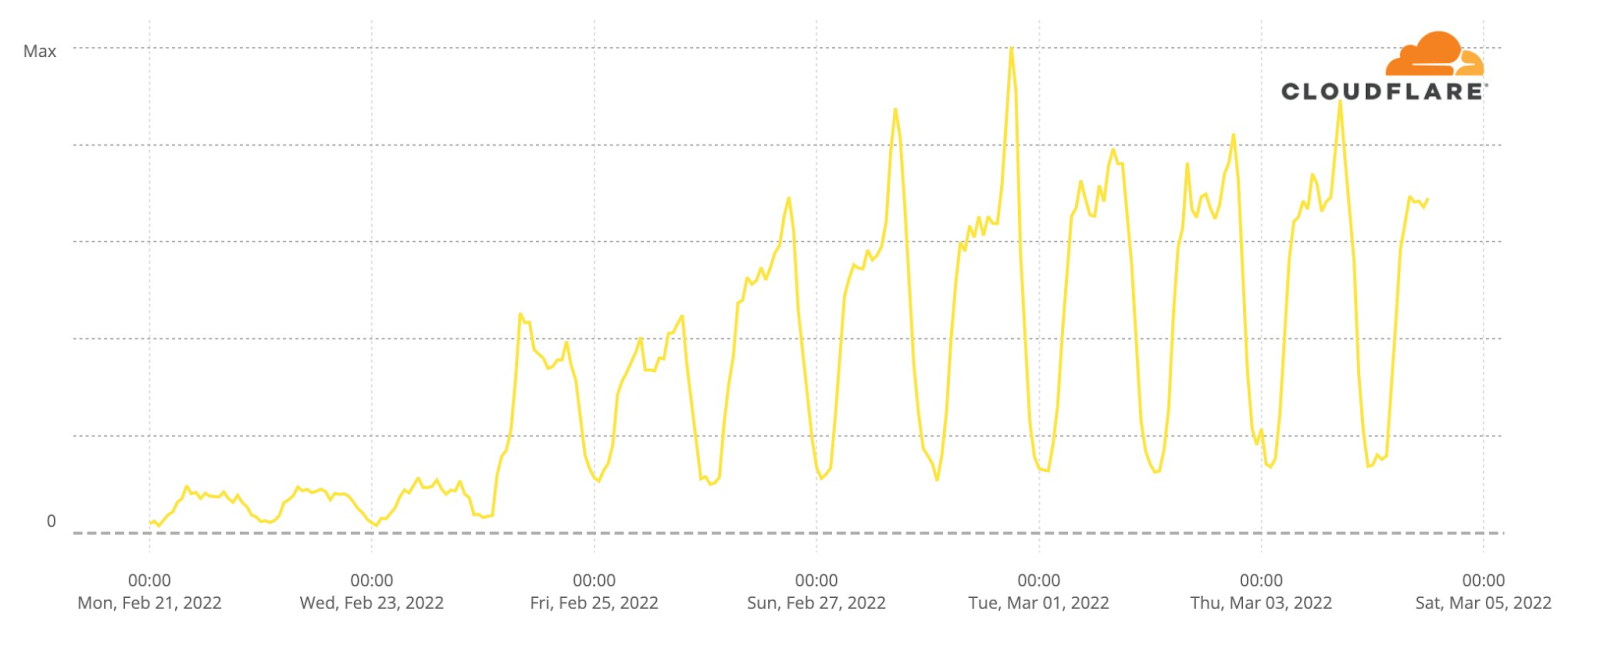
Starting Thursday, traffic was significantly lower. On Thursday, we saw about 70% of our normal request volume and about 60% on Friday. Request volumes recovered to 70% of pre-invasion volume on Saturday and Sunday before peaking on Monday and Tuesday because of attacks that we mitigated coming from networks in Ukraine.
This chart shows attack traffic blocked by Cloudflare that originated on networks in Ukraine. Note that this is quite different from attacks against .ua domains, which can originate anywhere in the world and are discussed below.
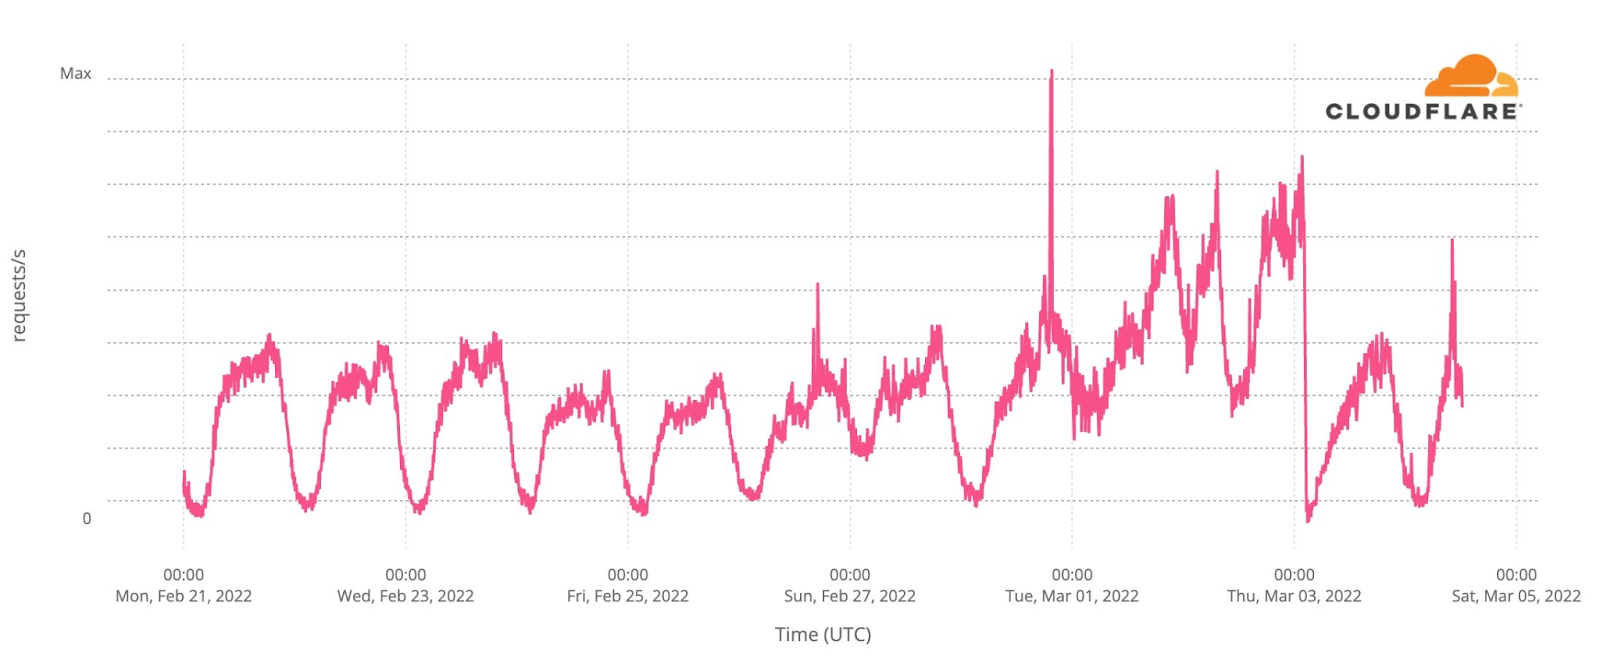
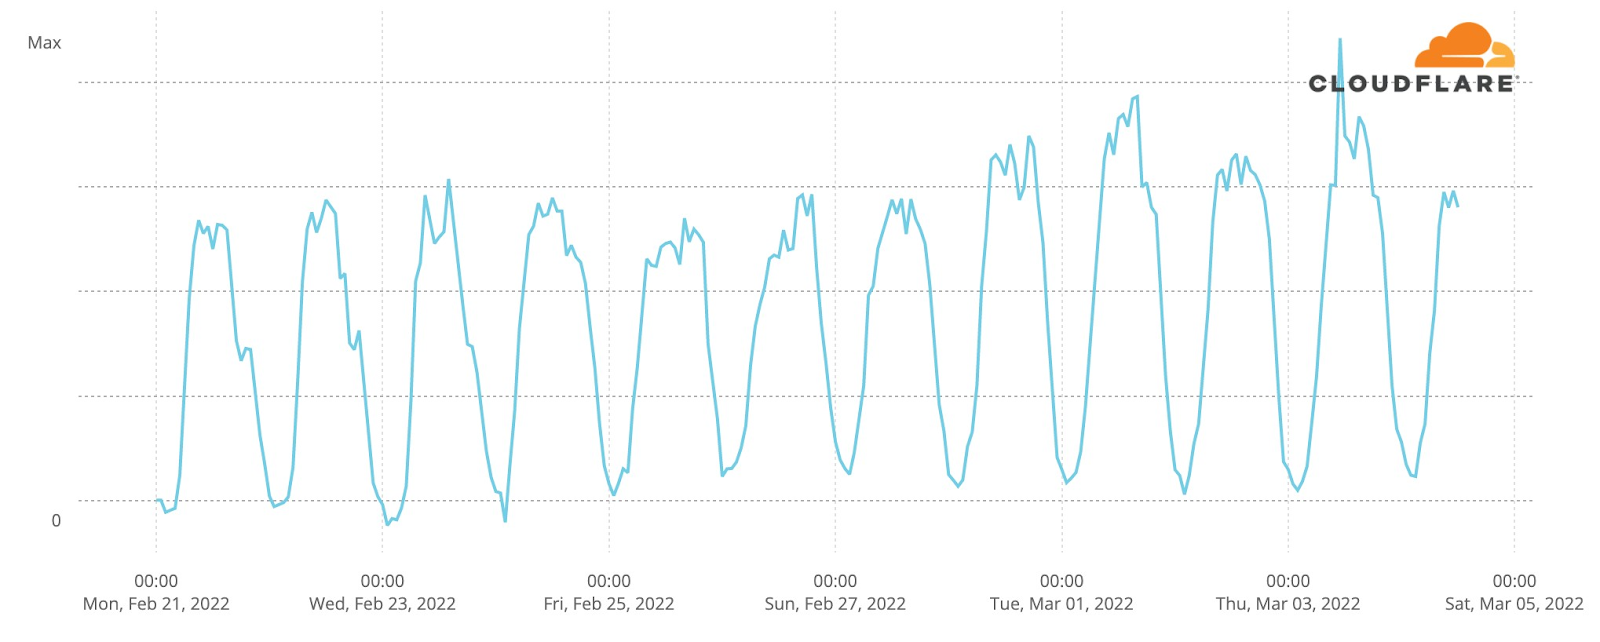
Analysis of network traffic from different cities in Ukraine gives us some insight into people’s use of the Internet and availability of Internet access. Here’s Internet traffic from the capital, Kyiv:
Once again the “normal” ebb and flow of Internet traffic is seen on Monday, Tuesday, and Wednesday. Early on Thursday morning, Internet traffic picks up after Vladimir Putin’s announcement of the attack but never reaches normal levels that day. Friday is even lower, but traffic in Kyiv has gradually increased since then.
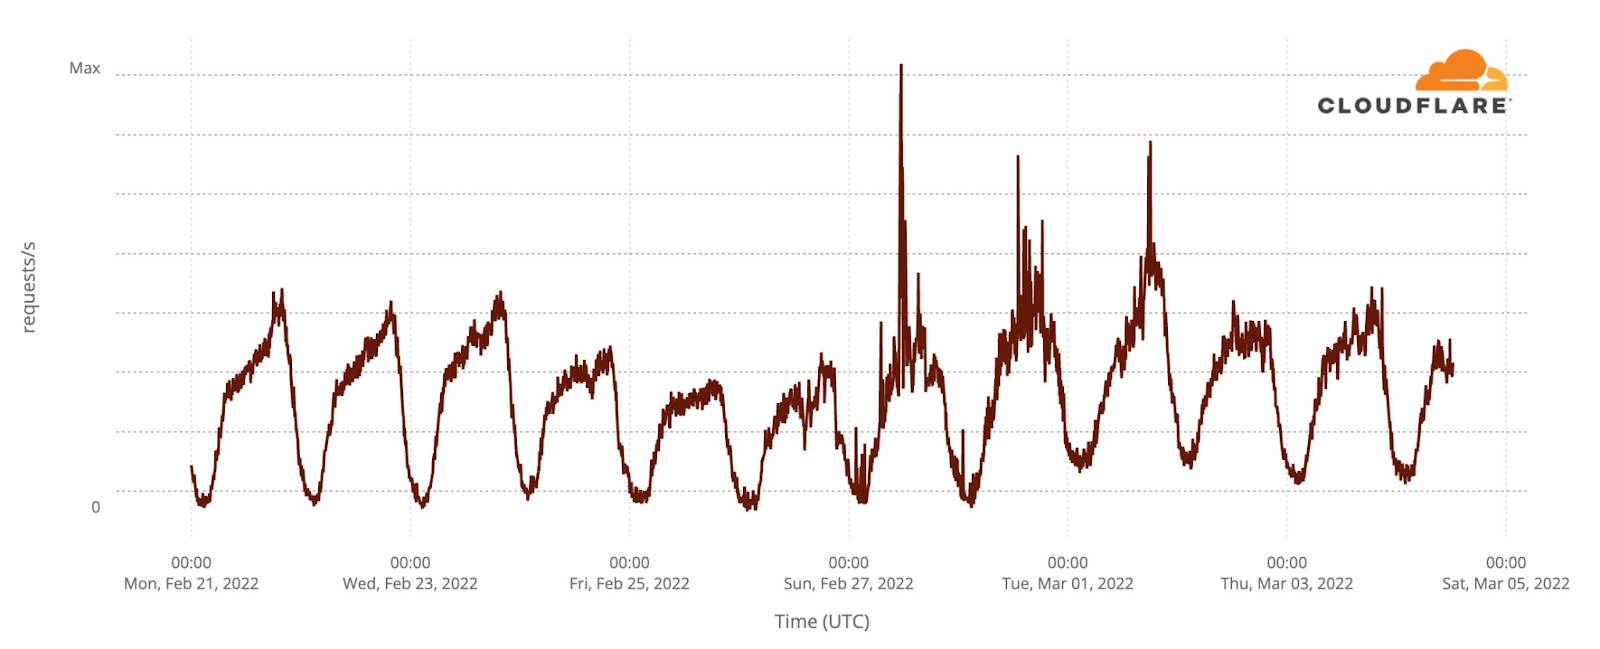
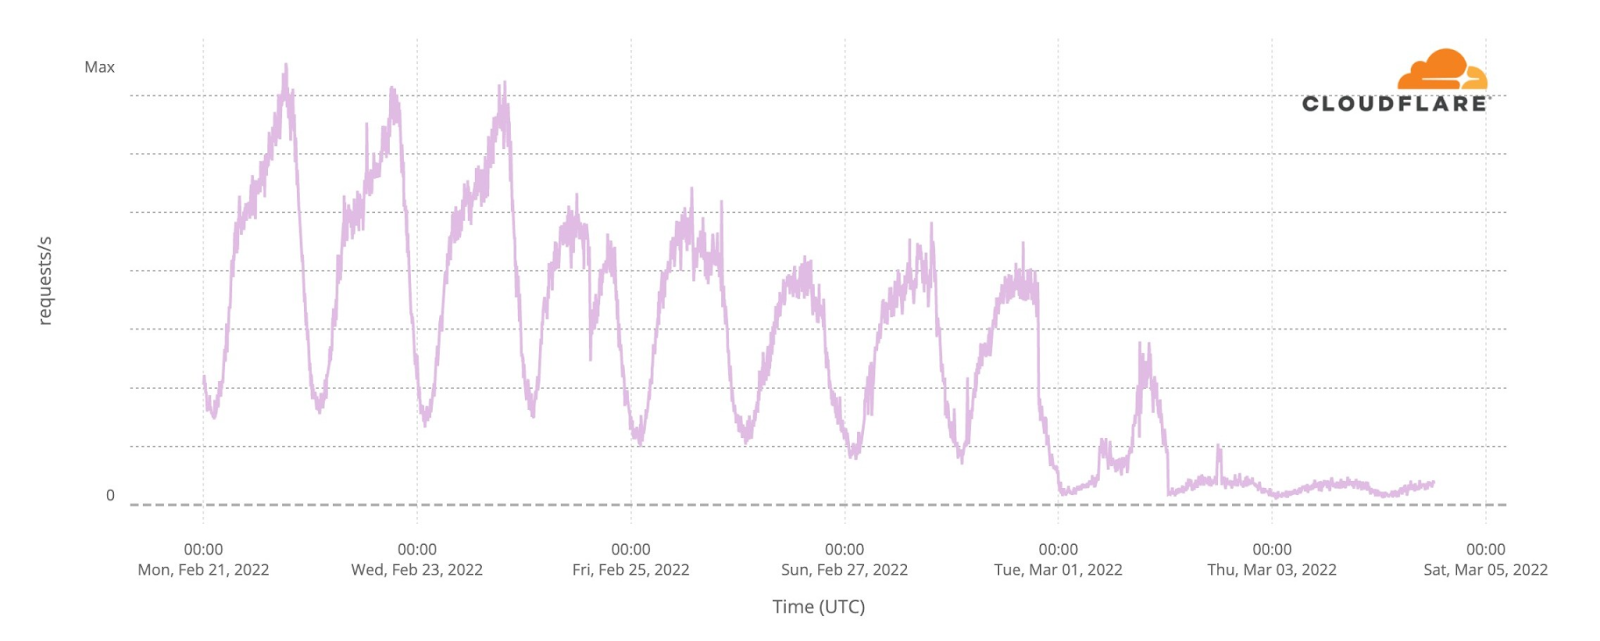
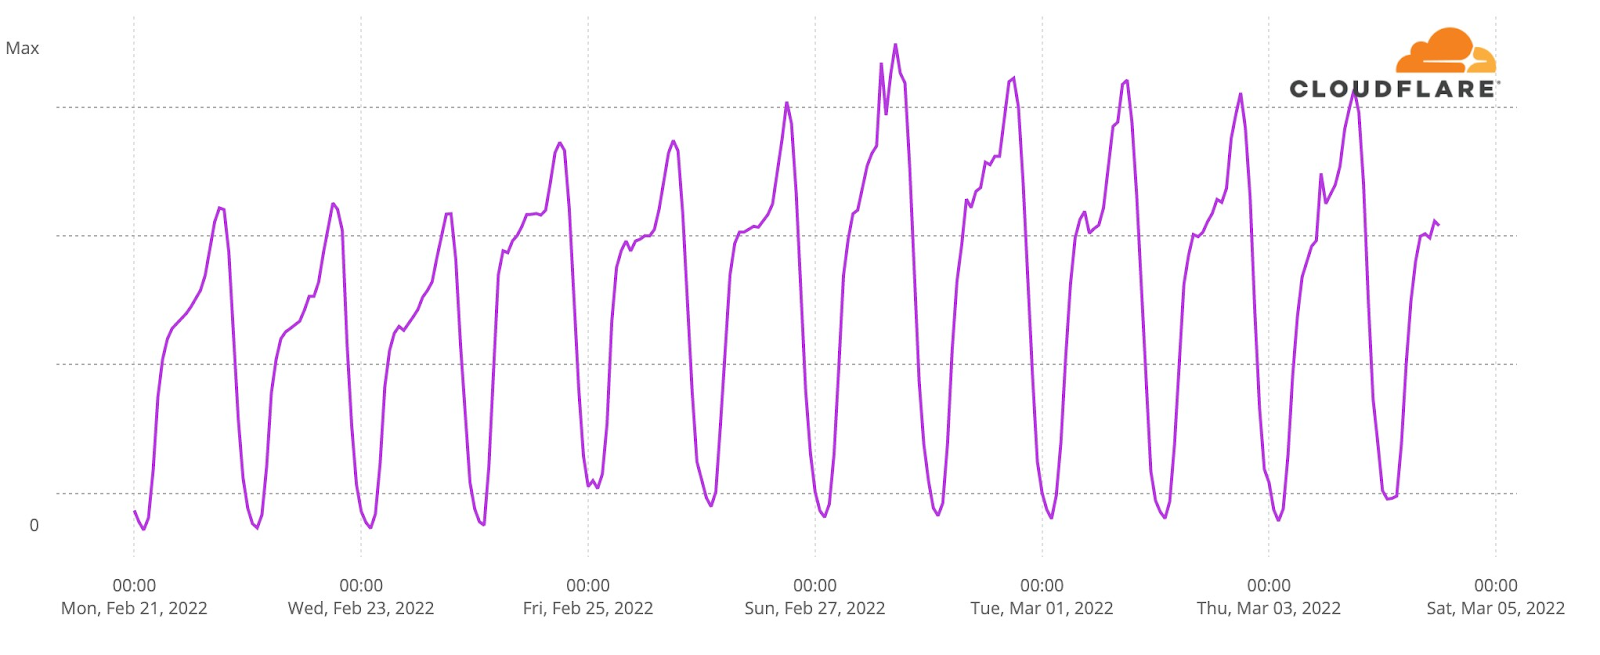
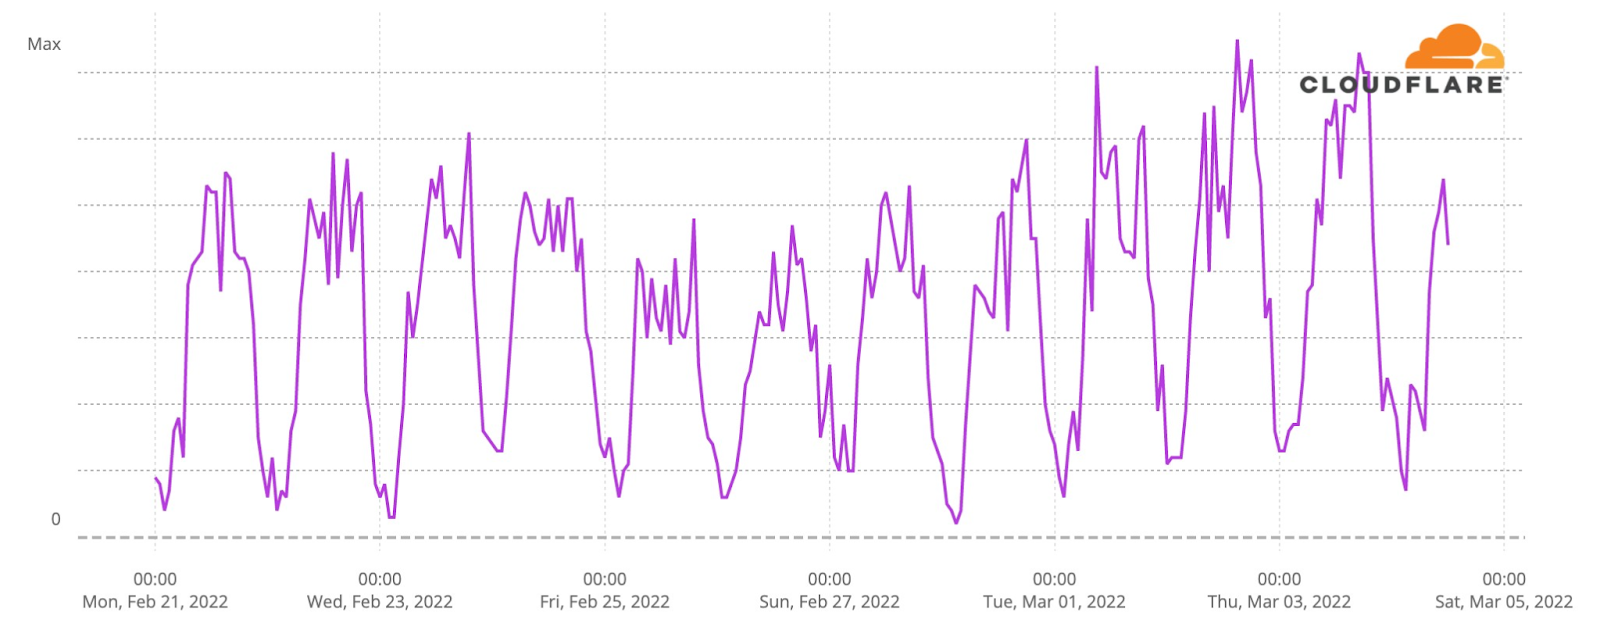
Moving westward to Lviv, we see a very different pattern of use.
The same normal flows on Monday to Wednesday are visible, followed by a smaller drop for three days and then a dramatic increase in traffic. As many Ukrainians have moved westward towards Poland, Slovakia and Romania, away from the fighting, it appears that Internet traffic has grown with their arrival in Lviv.
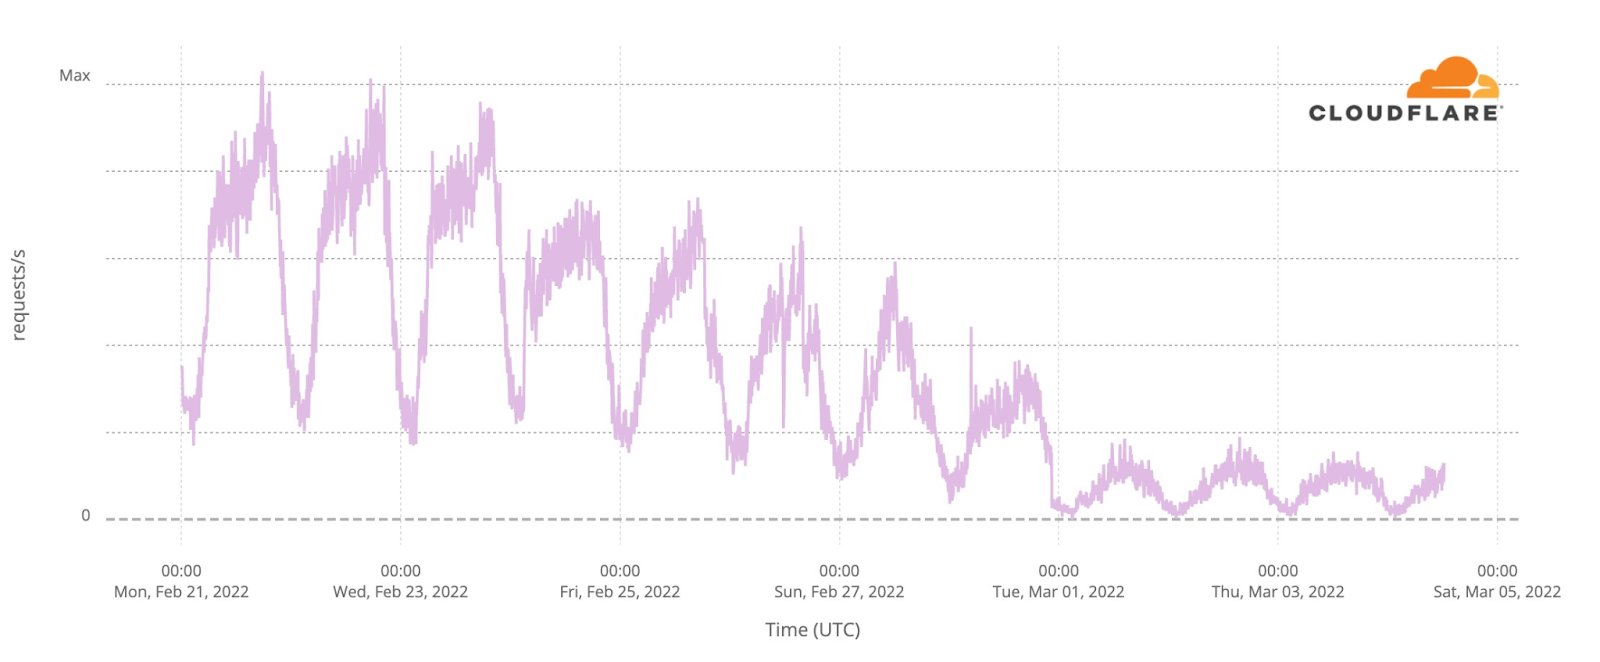
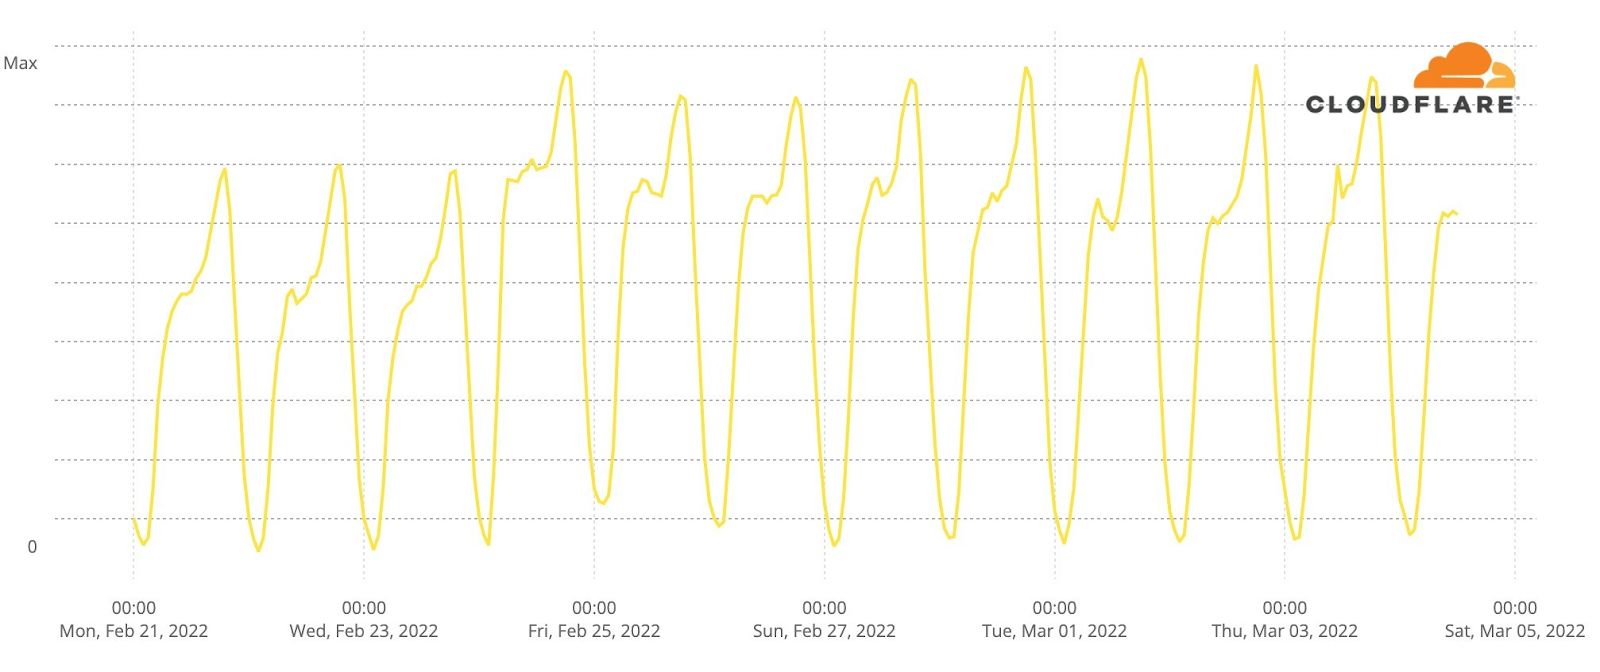
The city of Uzhhorod on the Slovakian border shows a similar pattern.
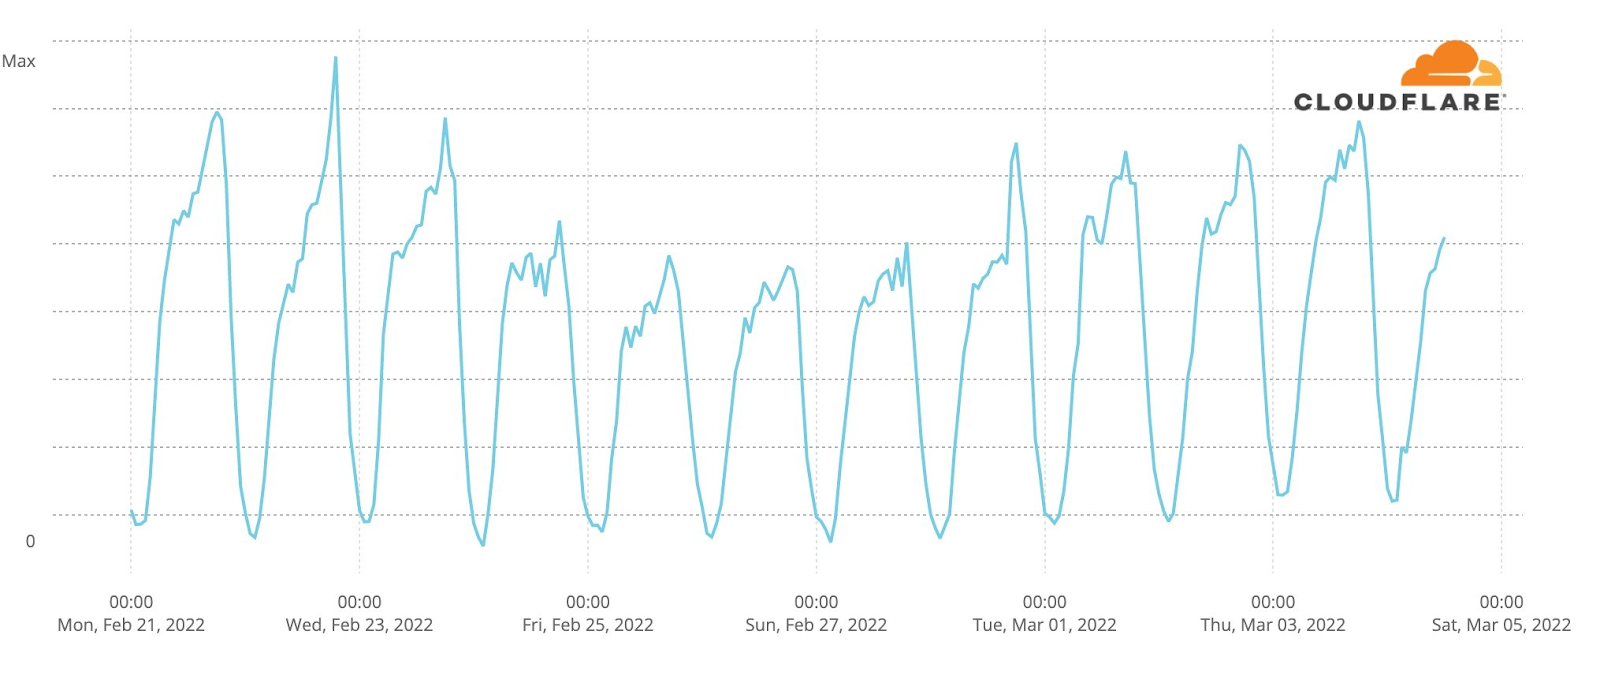
To the east of Lviv, the city of Ternopil has also seen an increase in Internet traffic.
As has Rivne.
Looking at Rivne, Ternopil, Uzhhorod, and Lviv, it’s possible that the peaks in Internet traffic on different days show the movement of people westward as they try to escape fighting around the capital and in the east and south.
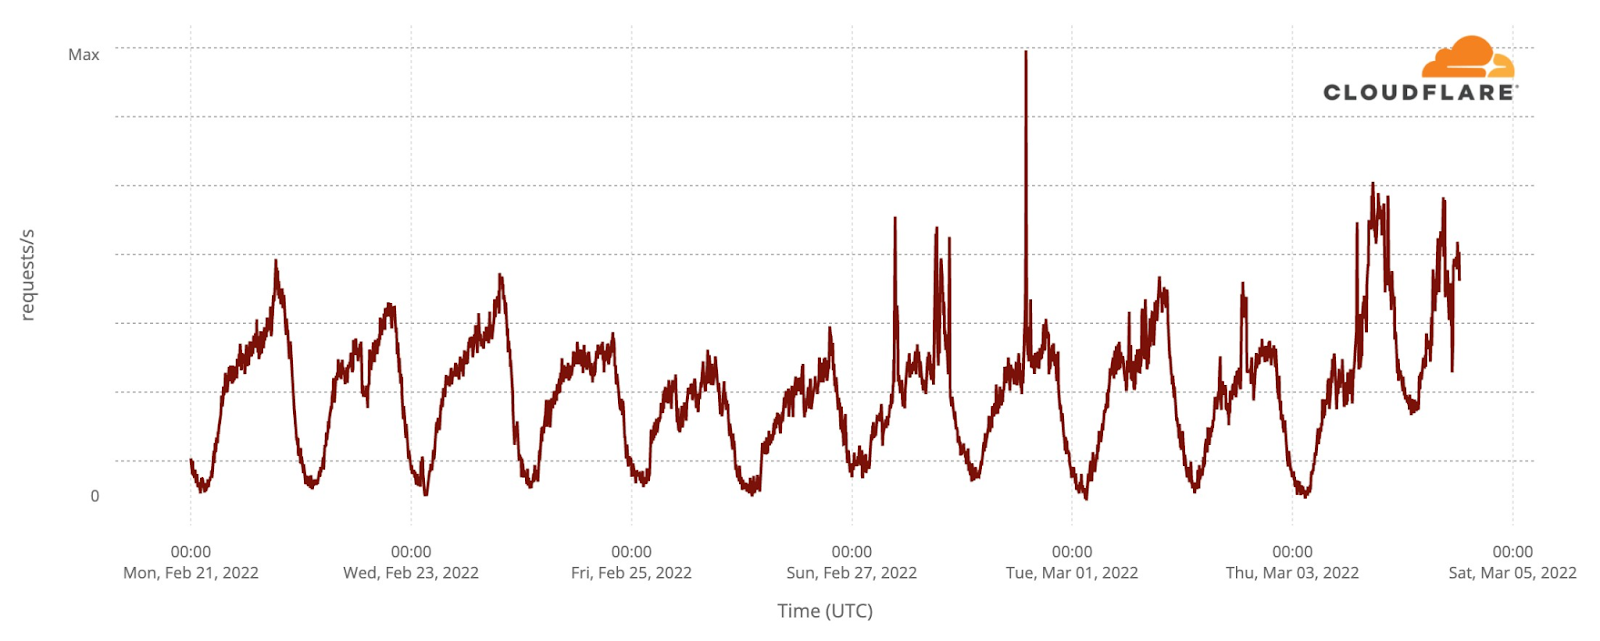
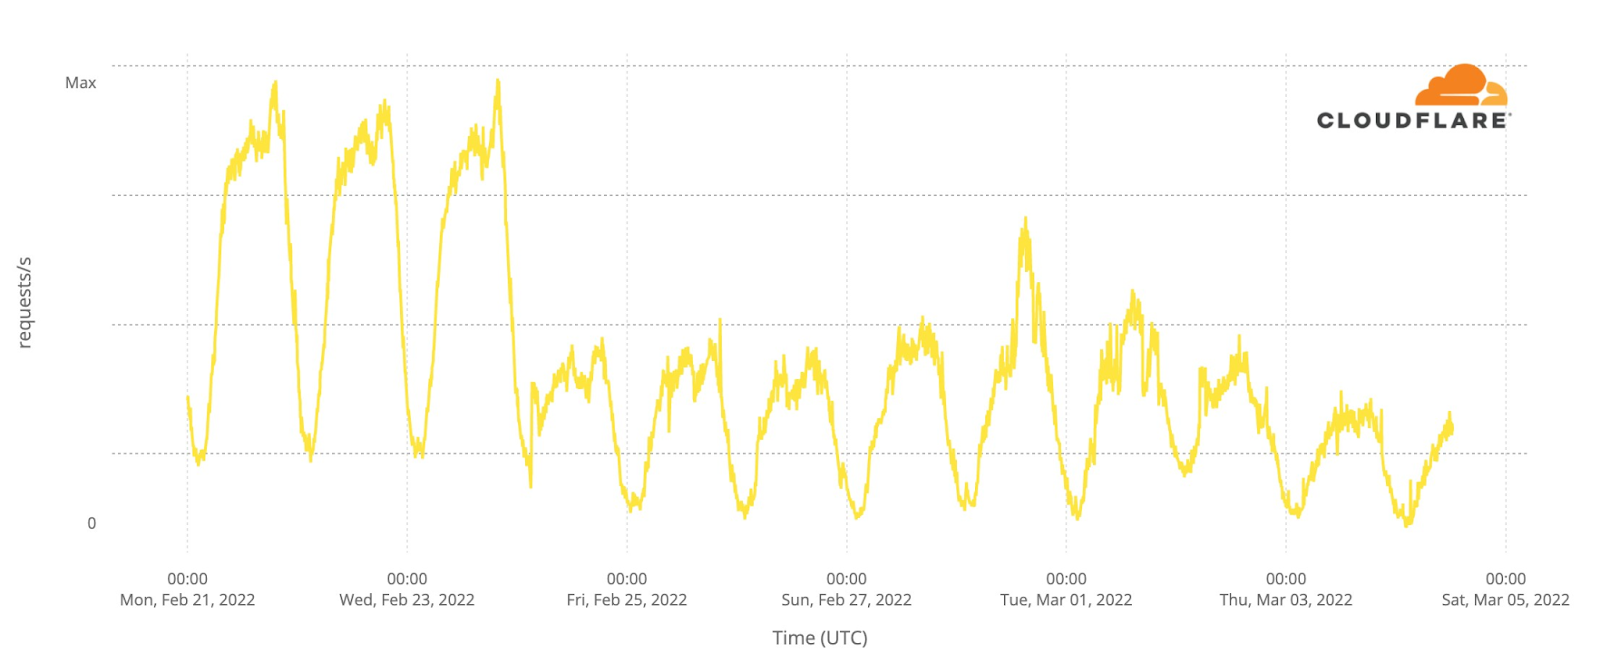
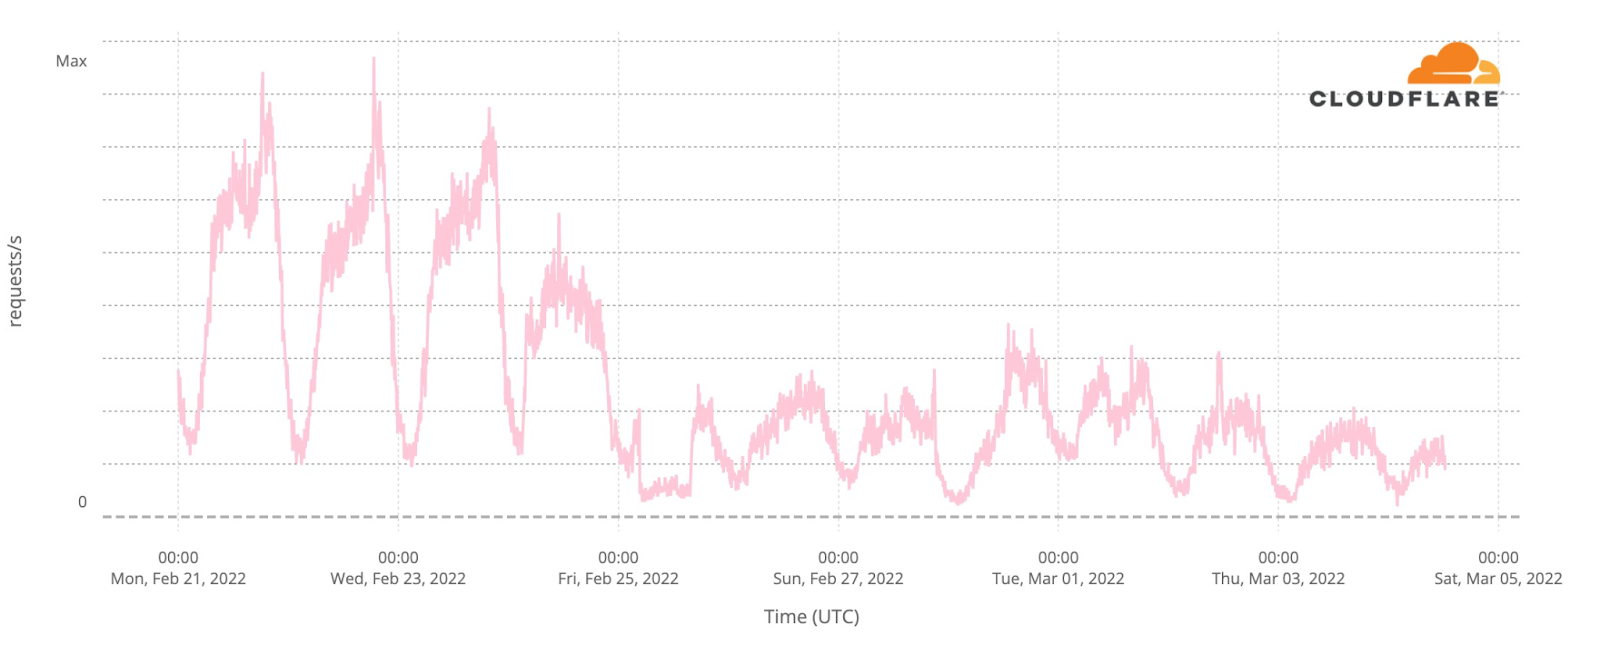
On the opposite side of Ukraine, the situation is quite different. Here’s the traffic pattern for the city of Kharkiv. It has stayed at roughly between 50% and 60% (March 3) of the usual rate since the beginning of the invasion.
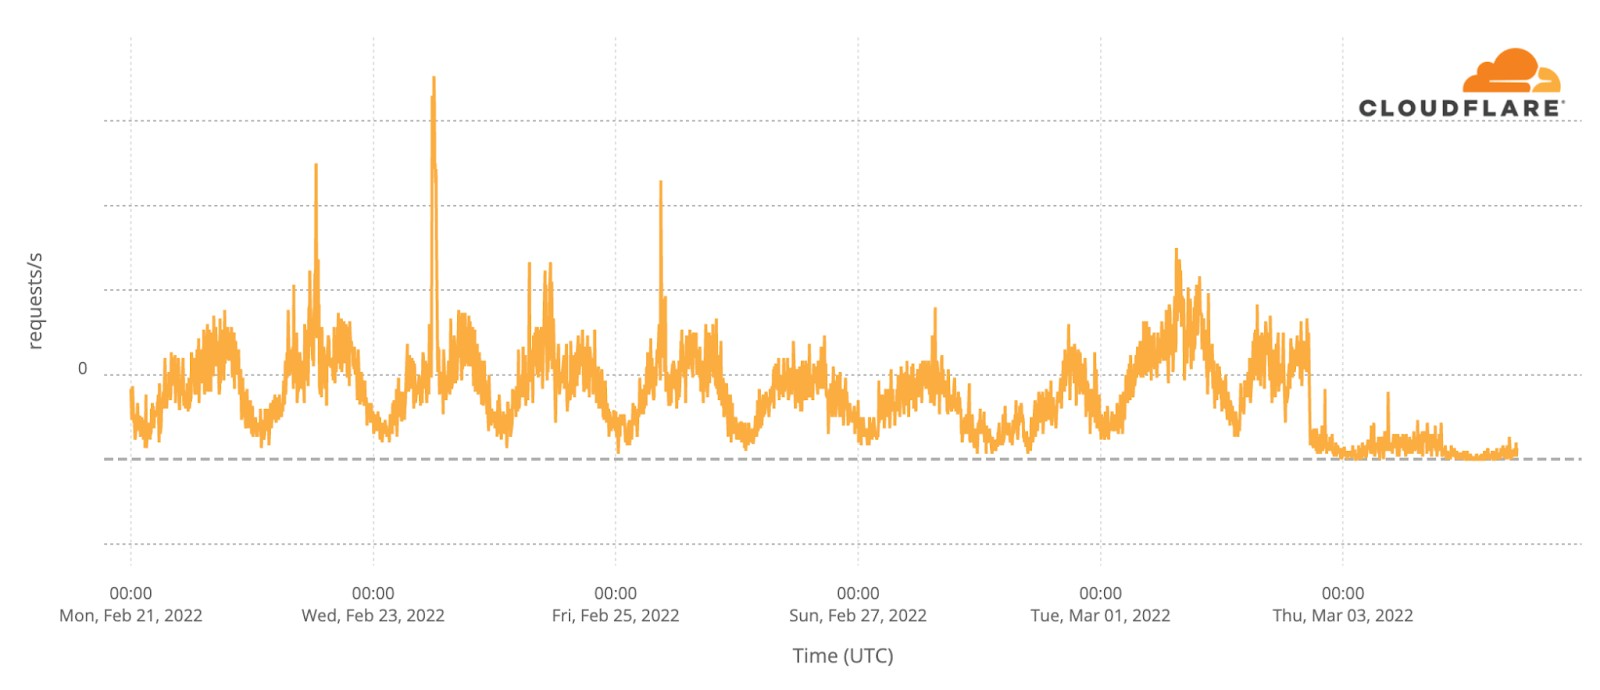
North of Kharkiv, the city of Sumy (north-eastern Ukraine, near the Russian border), traffic levels are very low since yesterday, March 3, 2022.
A similar trend can be seen in the city Izyum, south of Kharkiv (east of Ukraine), where traffic is very low since March 2.
Traffic in Donetsk has remained fairly consistent throughout the invasion, except for March 1 when there was a dramatic change in traffic. This was most likely caused by an attack against a single .ua domain name, with the attack traffic coming, at least in part, from Donetsk.
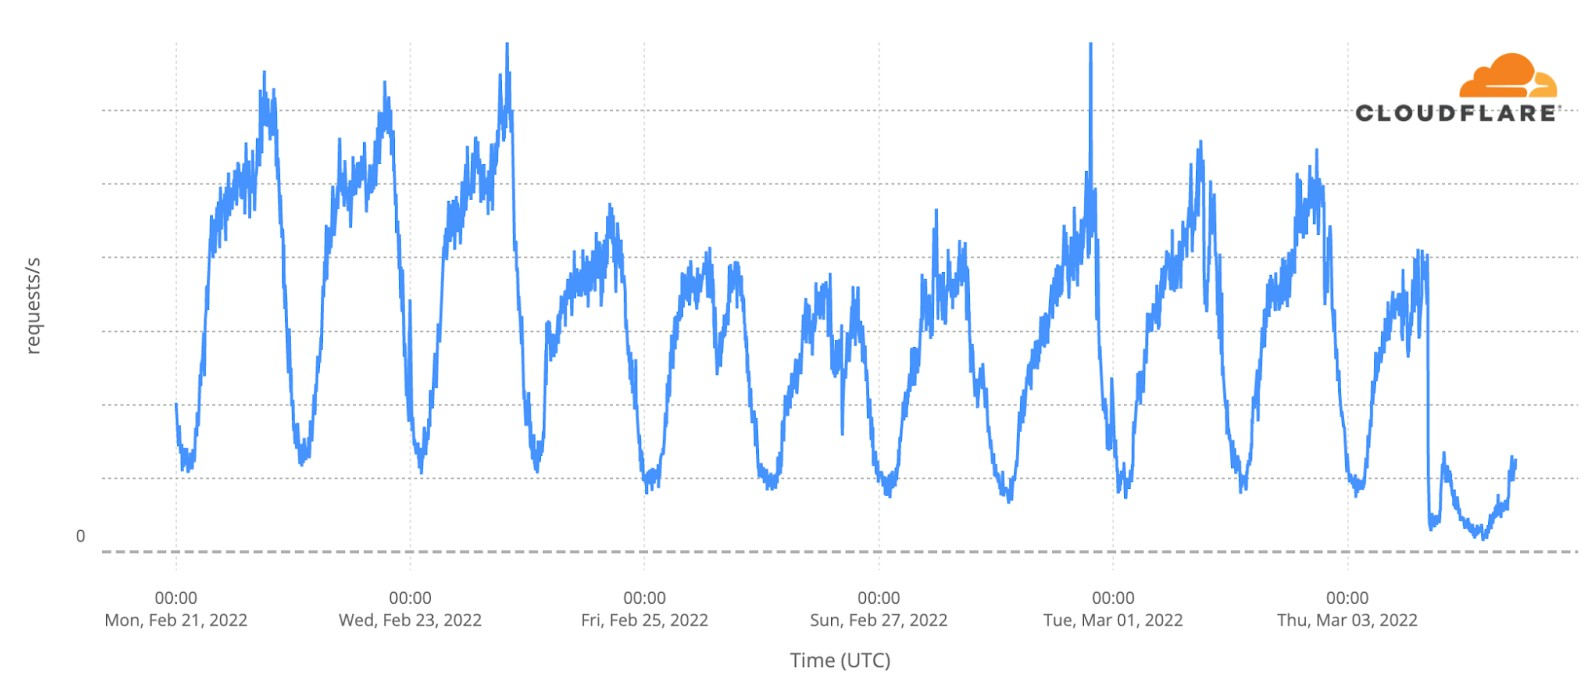
Some other areas with fighting have experienced the largest drops and partial Internet outages. Moving to the south, traffic in Mariupol declined after the invasion and has dropped dramatically in the last three days with outages on local networks.
Here’s a view of traffic from AS43554 in Mariupol showing what seems to be a total outage on March 1 that continued through March 4.
To the west of Mariupol, Osypenko shows a gradual decline in traffic followed by three days of minimal Internet use.
Similar large drops are seen in Irpin (just outside Kyiv to the northwest).
And in Bucha, which is next to Irpin; both Bucha and Irpin are close to Hostomel airport.
There has also been minimal traffic (or possible outage) from Severodonetsk (north of Luhansk) for the past four of days.
We have started to see traffic from Starlink terminals in Ukraine, although traffic levels remain very low.
Cyberattacks
The physical world invasion has been accompanied by an increase in cyberattacks against Ukrainian domain names and networks.
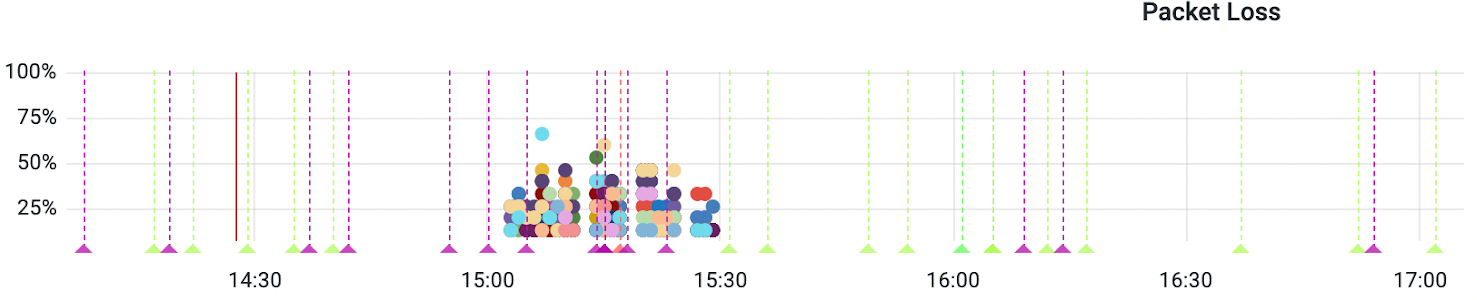
Just prior to the invasion, on February 23, Cloudflare’s automated systems detected a large amount of packet loss on a major Internet connection to our Kyiv data center and automatically mitigated the problem by routing traffic onto other networks. This packet loss was caused by congestion on the transit provider’s network, which in turn was caused by a large DDoS attack. It appeared in our dashboards as packet loss over a 30-minute period between 1500-1530 (the different colors are different parts of our network infrastructure in Kyiv).
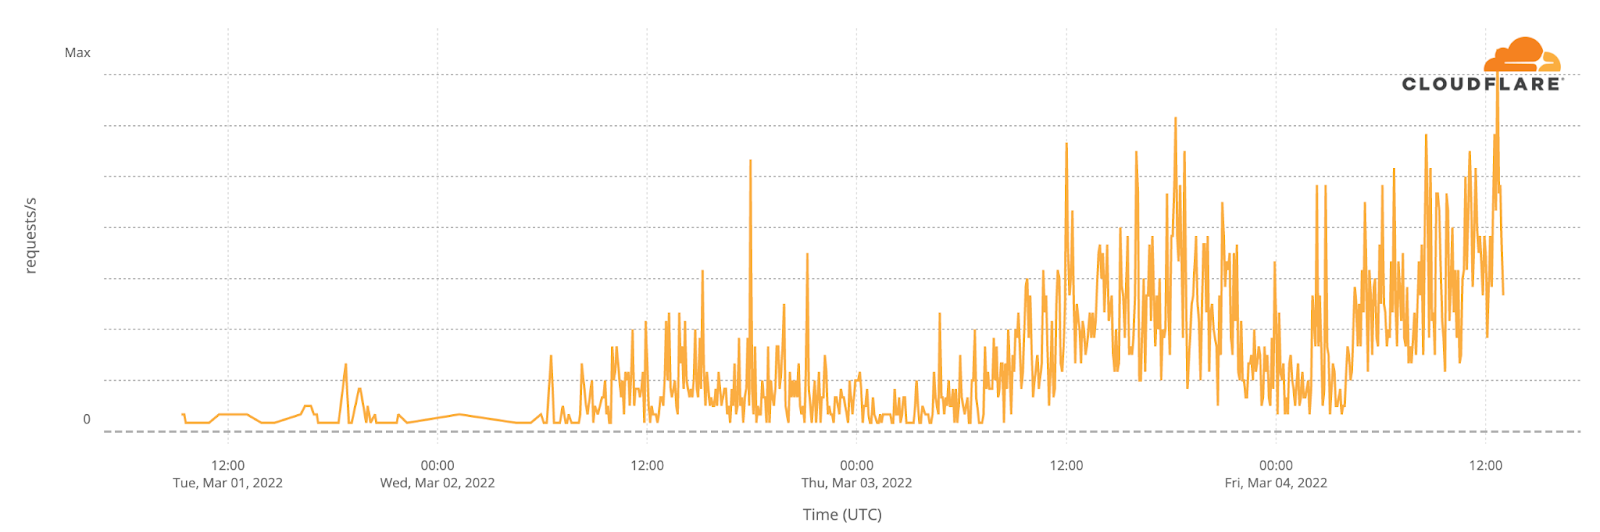
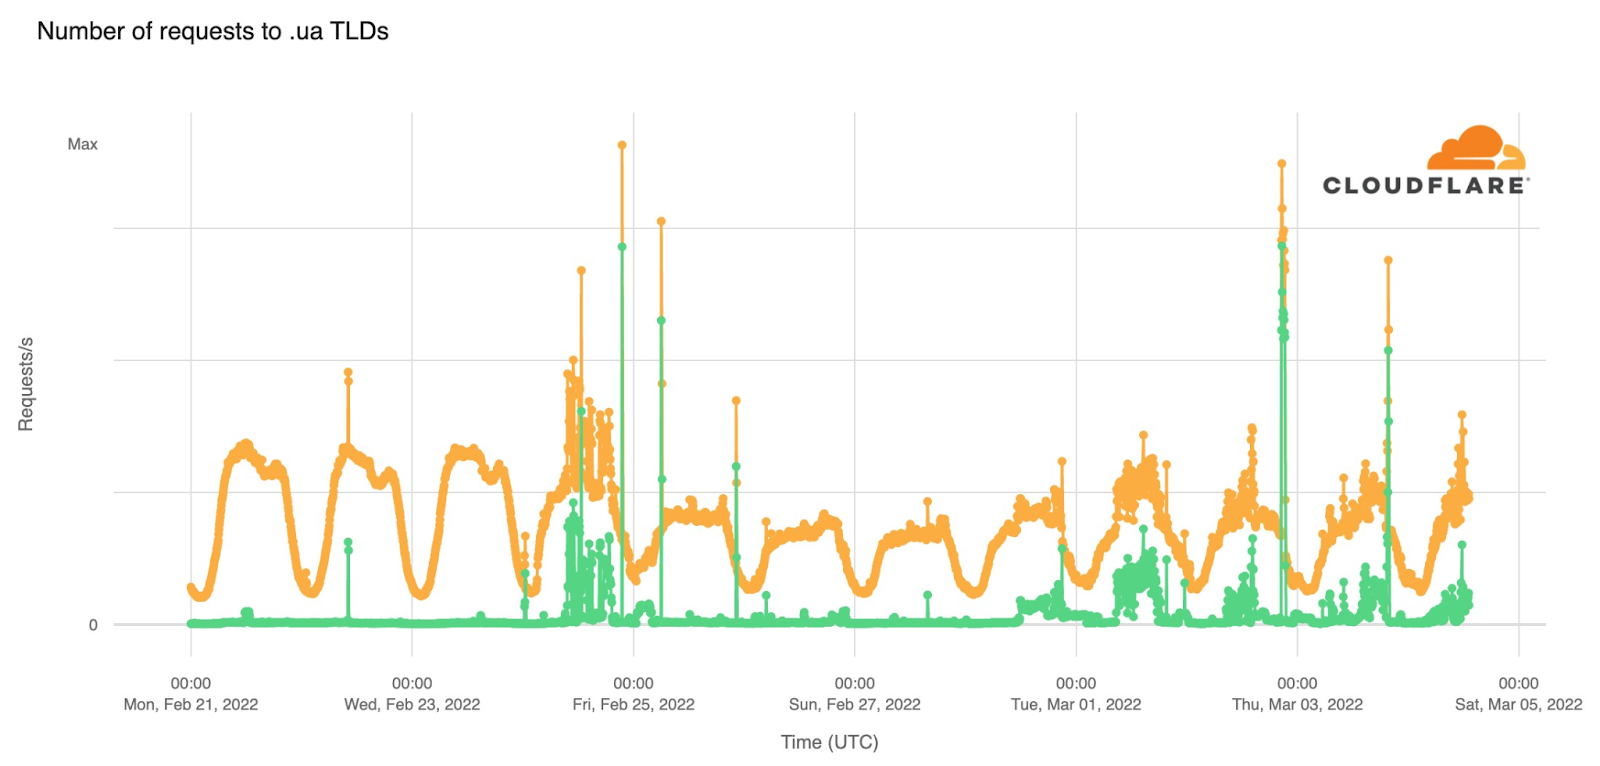
This next chart gives an overview of traffic to .ua domains protected by Cloudflare and requests that are “mitigated” (i.e. blocked by our firewall products). The chart shows only layer 7 traffic and does not give information about layer 3/4 DDoS, which is covered separately below.
On the first day of the invasion attacks against .ua domains were prevalent and at times responsible for almost 50% of the requests being sent to those domains. From Friday, February 25 attacks returned to levels seen prior to the invasion and started picking up again on Tuesday, March 1.
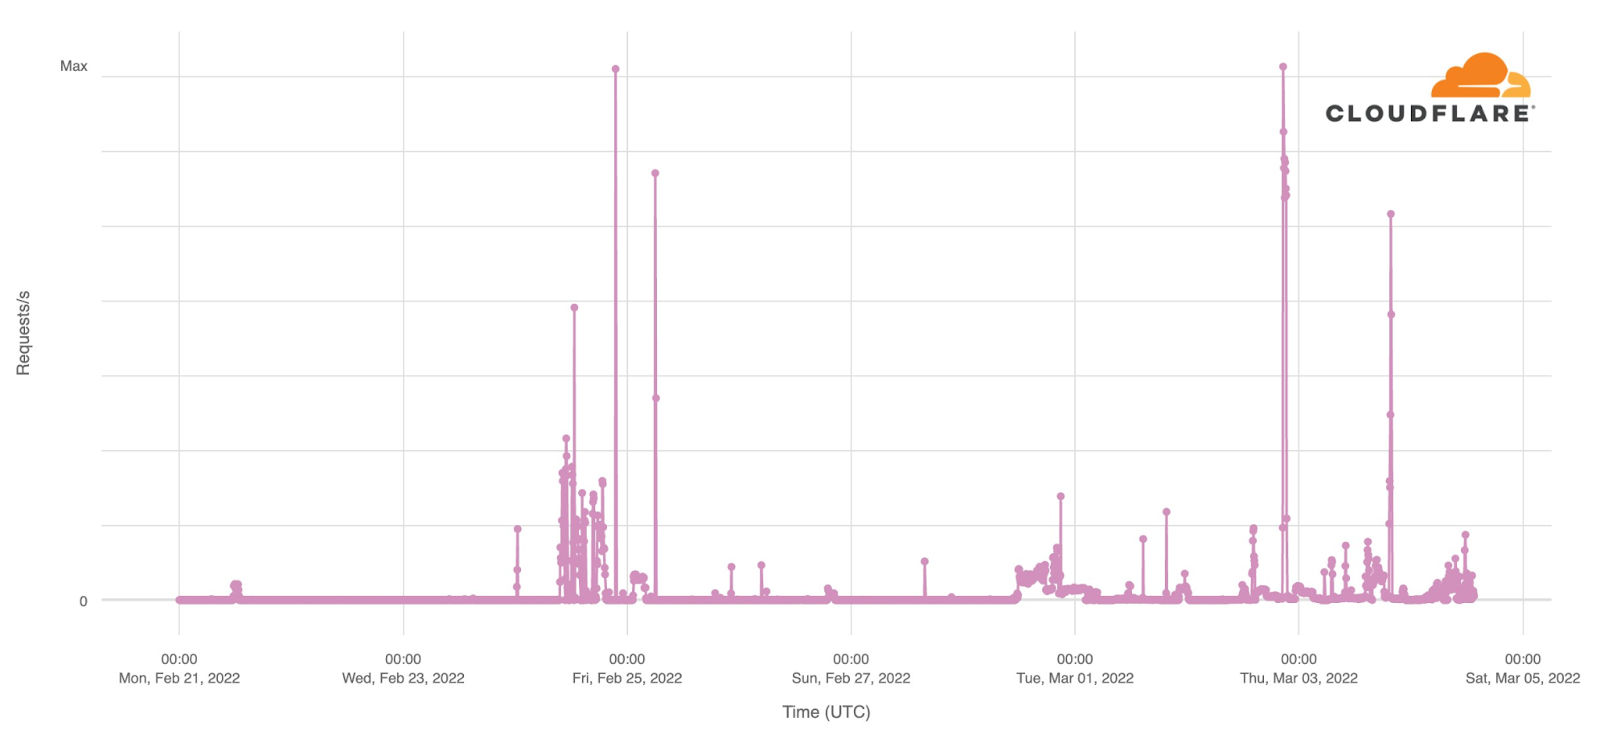
Digging into the layer 7 mitigations we can see that the biggest attacks over all are layer 7 DDoS attacks.
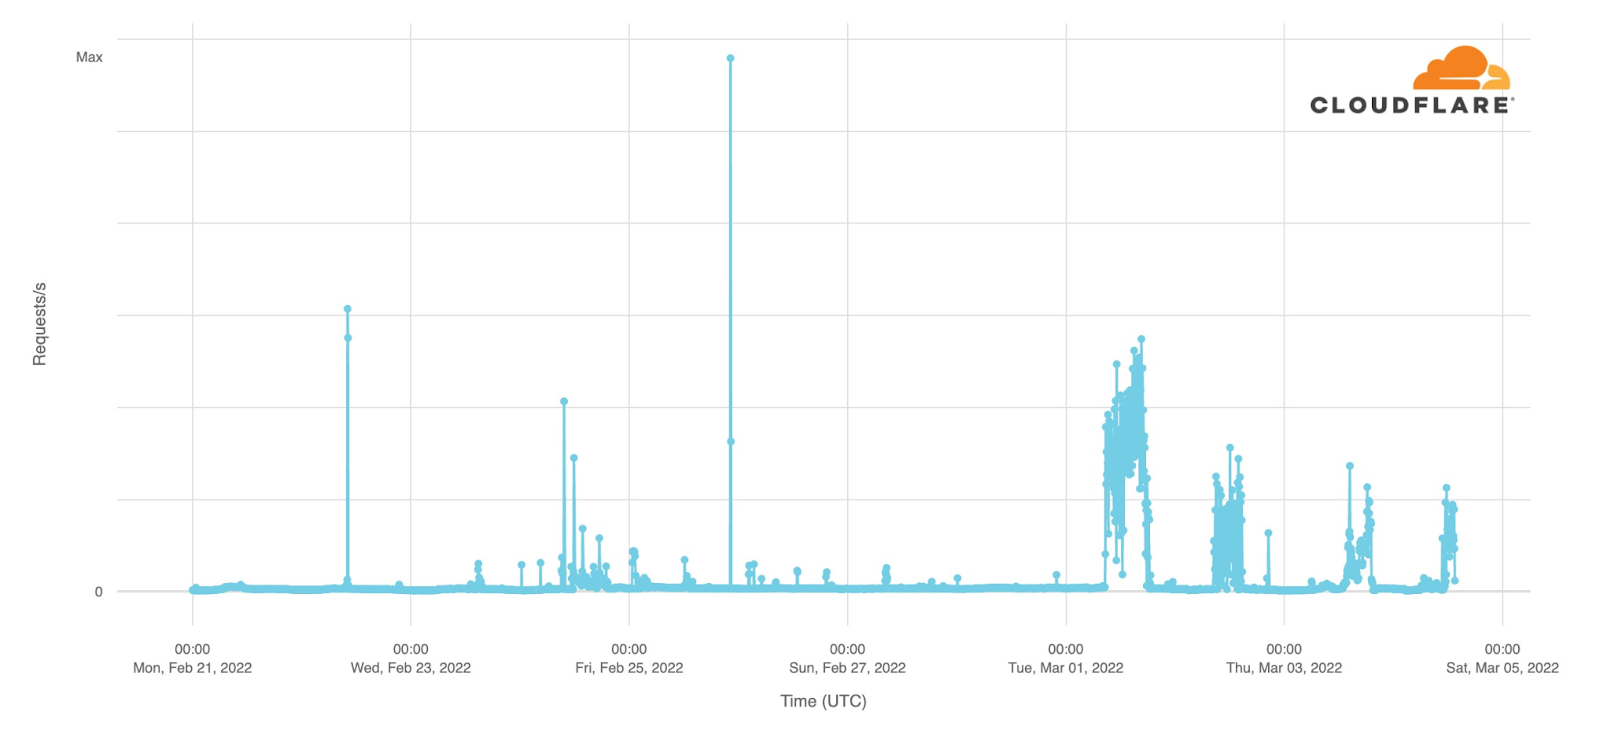
The next largest attacks are being mitigated by firewall rules put in place by customers.
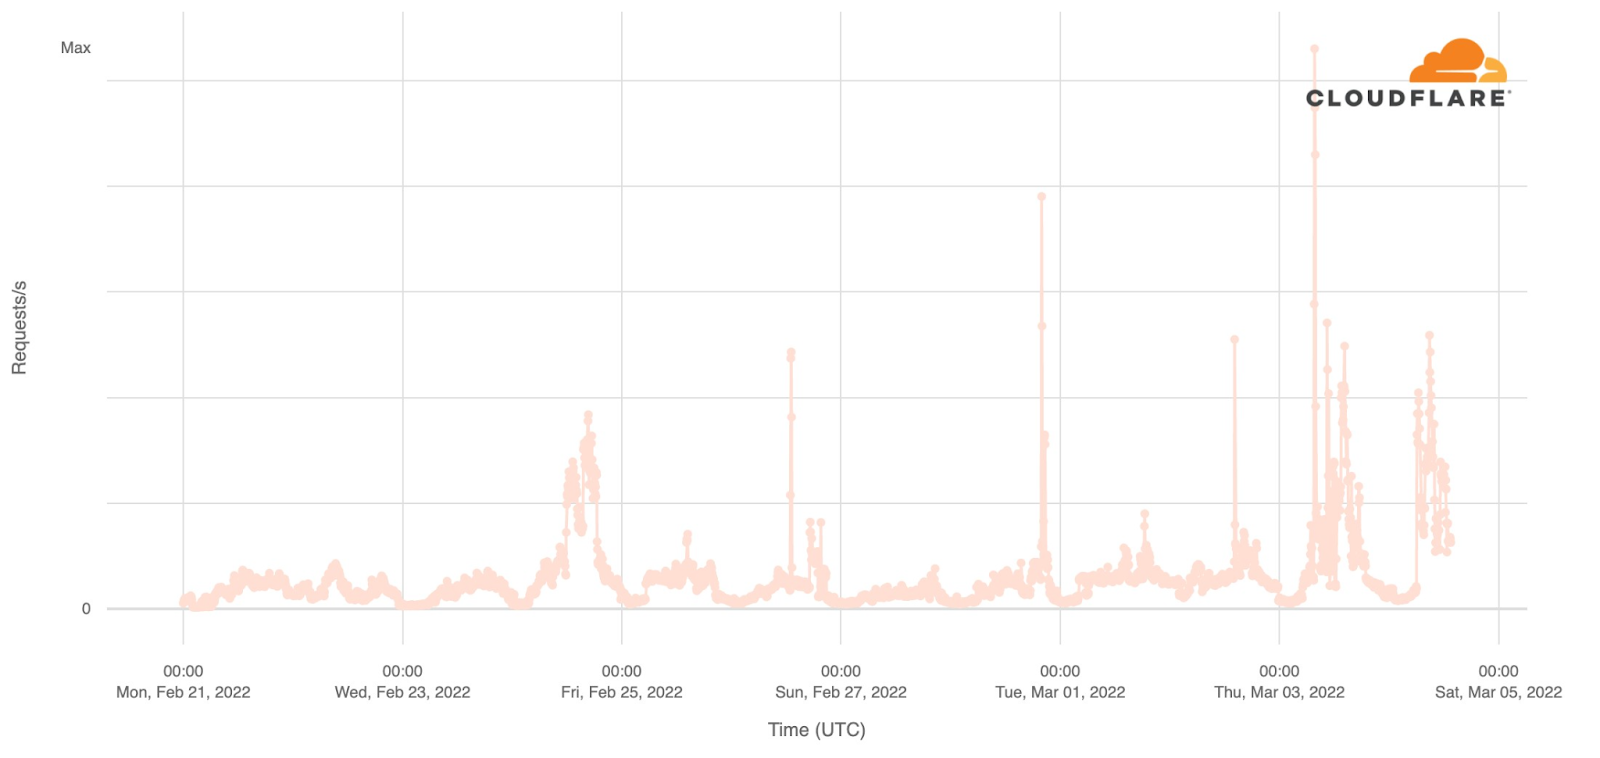
Followed by blocking requests based on our IP threat reputation database.
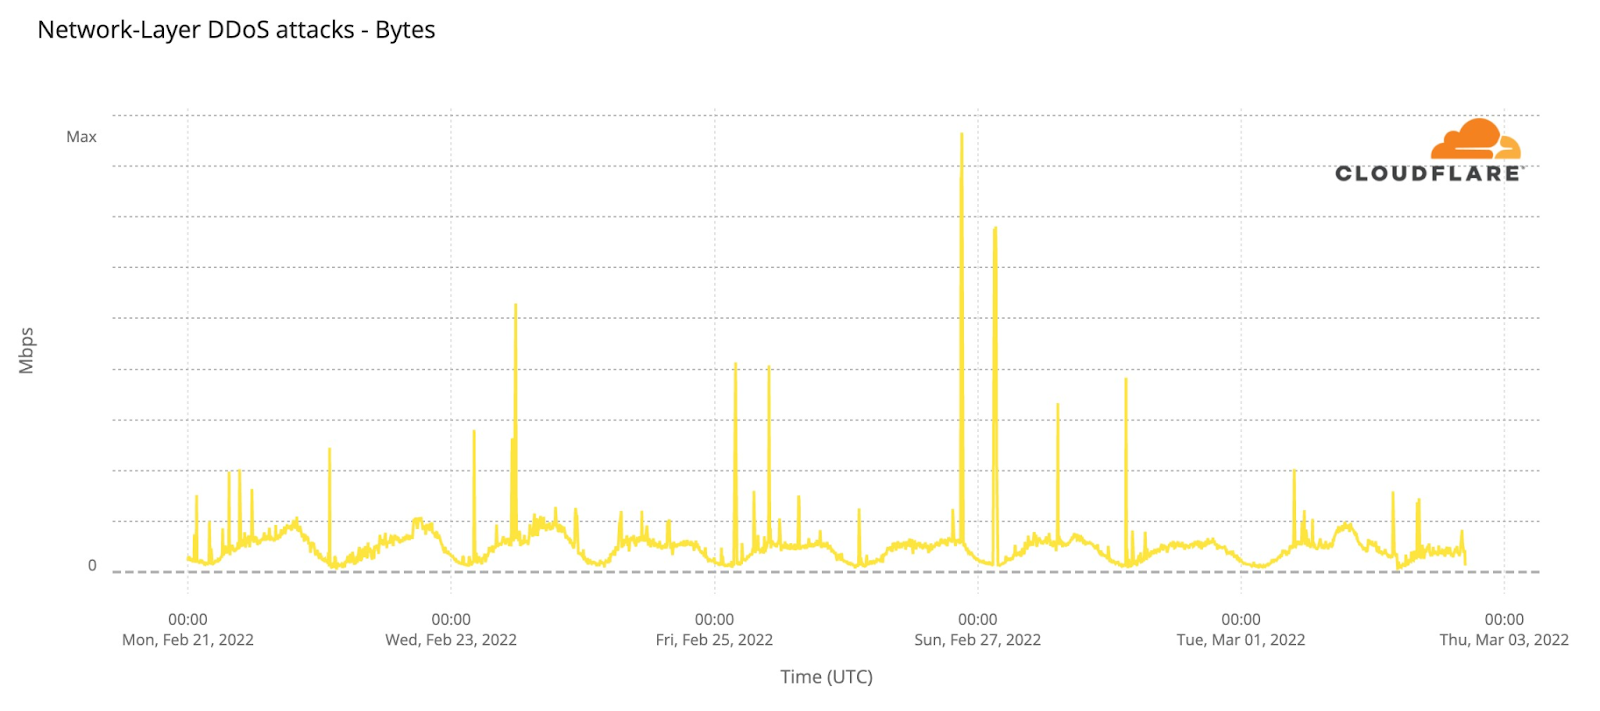
Layer 3/4 traffic is harder to attribute to a specific domain or target as IP addresses are shared across different customers. Looking at network-level DDoS traffic hitting our Kyiv data center, we see occasional peaks of DDoS traffic reaching a high of nearly 1.8 Gbps.
Note that although the layer 3/4 and layer 7 attacks we are mitigating have been relatively small, that does not mean they are not devastating or problematic. A small website or service can be taken down by relatively small attacks, and the layer 7 attack traffic often includes vulnerability scanning, credential stuffing, SQL injection, and the usual panoply of techniques carried out to either deface or penetrate an Internet service.
Unprotected Internet properties are vulnerable to even small attacks and need protection.
Social media and communications
Much of the imagery and information coming out of Ukraine is being shared on social networks. Looking at social networks in Ukraine via DNS data shows that Facebook use has increased.
As has Instagram.
However, TikTok seems to have lost traffic initially, but it has started to return (although not to its pre-conflict levels) in the last two days.
Twitter usage increased and has remained higher than levels seen before the invasion.
Turning to messaging apps, we can compare Messenger, Signal, Telegram and WhatsApp. WhatsApp traffic appears to have declined inline with the broad change in Internet traffic across Ukraine.
Telegram stayed largely unchanged until early this week, when we observed a small increase in use.
Messenger shows a similar pattern.
But the largest change has been traffic to the end-to-end encrypted messaging app Signal, which has seen dramatic growth since the invasion began. We are seeing 8x to 10x the DNS volume for Signal as compared to the days before the start of the conflict.
This is not what I imagined my first blog article would look like, but here we go.
On February 1, 2022, a configuration error on one of our routers caused a route leak of up to 2,000 Internet prefixes to one of our Internet transit providers. This leak lasted for 32 seconds and at a later time 7 seconds. We did not see any traffic spikes or drops in our network and did not see any customer impact because of this error, but this may have caused an impact to external parties, and we are sorry for the mistake.
Timeline
All timestamps are UTC.
As part of our efforts to build the best network, we regularly update our Internet transit and peering links throughout our network. On February 1, 2022, we had a “hot-cut” scheduled with one of our Internet transit providers to simultaneously update router configurations on Cloudflare and ISP routers to migrate one of our existing Internet transit links in Newark to a link with more capacity. Doing a “hot-cut” means that both parties will change cabling and configuration at the same time, usually while being on a conference call, to reduce downtime and impact on the network. The migration started off-peak at 10:45 (05:45 local time) with our network engineer entering the bridge call with our data center engineers and remote hands on site as well as operators from the ISP.
At 11:17, we connected the new fiber link and established the BGP sessions to the ISP successfully. We had BGP filters in place on our end to not accept and send any prefixes, so we could evaluate the connection and settings without any impact on our network and services.
As the connection between our router and the ISP — like most Internet connections — was realized over a fiber link, the first item to check are the “light levels” of that link. This shows the strength of the optical signal received by our router from the ISP router and can indicate a bad connection when it’s too low. Low light levels are likely caused by unclean fiber ends or not fully seated connectors, but may also indicate a defective optical transceiver which connects the fiber link to the router – all of which can degrade service quality.
The next item on the checklist is interface errors, which will occur when a network device receives incorrect or malformed network packets, which would also indicate a bad connection and would likely lead to a degradation in service quality, too.
As light levels were good, and we observed no errors on the link, we deemed it ready for production and removed the BGP reject filters at 11:22.
This immediately triggered the maximum prefix-limit protection the ISP had configured on the BGP session and shut down the session, preventing further impact. The maximum prefix-limit is a safeguard in BGP to prevent the spread of route leaks and to protect the Internet. The limit is usually set just a little higher than the expected number of Internet prefixes from a peer to leave some headroom for growth but also catch configuration errors fast. The configured value was just 40 prefixes short of the number of prefixes we were advertising at that site, so this was considered the reason for the session to be shut down. After checking back internally, we asked the ISP to raise the prefix-limit, which they did.
The BGP session was reestablished at 12:08 and immediately shut down again. The problem was identified and fixed at 12:14.
10:45: Start of scheduled maintenance
11:17: New link was connected and BGP sessions went up (filters still in place)
11:22: Link was deemed ready for production and filters removed
11:23: BGP sessions were torn down by ISP router due to configured prefix-limit
12:08: ISP configures higher prefix-limits, BGP sessions briefly come up again and are shut down
12:14: Issue identified and configuration updated
What happened and what we’re doing about it
The outage occurred while migrating one of our Internet transits to a link with more capacity. Once the new link and a BGP session had been established, and the link deemed error-free, our network engineering team followed the peer-reviewed deployment plan. The team removed the filters from the BGP sessions, which prevented the Cloudflare router from accepting and sending prefixes via BGP.
Due to an oversight in the deployment plan, which had been peer-reviewed before without noticing this issue, no BGP filters to only export prefixes of Cloudflare and our customers were added. A peer review on the internal chat did not notice this either, so the network engineer performing this change went ahead.
ewr02# show |compare
[edit protocols bgp group 4-ORANGE-TRANSIT]
-  import REJECT-ALL;
-  export REJECT-ALL;
[edit protocols bgp group 6-ORANGE-TRANSIT]
-  import REJECT-ALL;
-  export REJECT-ALL;
The change resulted in our router sending all known prefixes to the ISP router, which shut down the session as the number of prefixes received exceeded the maximum prefix-limit configured.
As the configured values for the maximum prefix-limits turned out to be rather low for the number of prefixes on our network, this didn’t come as a surprise to our network engineering team and no investigation into why the BGP session went down was started. The prefix-limit being too low seemed to be a perfectly valid reason.
We asked the ISP to increase the prefix-limit, which they did after they received approval on their side. Once the prefix-limit had been increased and the previously shutdown BGP sessions reset, the sessions were reestablished but were shut down immediately as the maximum prefix-limit was triggered again. This is when our network engineer started questioning whether there was another issue at fault and found and corrected the configuration error previously overlooked.
We made the following change in response to this event: we introduced an implicit reject policy for BGP sessions which will take effect if no import/export policy is configured for a specific BGP neighbor or neighbor group. This change has been deployed.
BGP security & preventing route-leaks — what’s in the cards?
Route leaks aren’t new, and they keep happening. The industry has come up with many approaches to limit the impact or even prevent route-leaks. Policies and filters are used to control which prefixes should be exported to or imported from a given peer. RPKI can help to make sure only allowed prefixes are accepted from a peer and a maximum prefix-limit can act as a last line of defense when everything else fails.
BGP policies and filters are commonly used to ensure only explicitly allowed prefixes are sent out to BGP peers, usually only allowing prefixes owned by the entity operating the network and its customers. They can also be used to tweak some knobs (BGP local-pref, MED, AS path prepend, etc.) to influence routing decisions and balance traffic across links. This is what the policies we have in place for our peers and transits do. As explained above, the maximum prefix-limit is intended to tear down BGP sessions if more prefixes are being sent or received than to be expected. We have talked about RPKI before, it’s the required cryptographic upgrade to BGP routing, and we still are on our path to securing Internet Routing.
To improve the overall stability of the Internet even more, in 2017, a new Internet standard was proposed, which adds another layer of protection into the mix: RFC8212 defines Default External BGP (EBGP) Route Propagation Behavior without Policies which pretty much tackles the exact issues we were facing.
This RFC updates the BGP-4 standard (RFC4271) which defines how BGP works and what vendors are expected to implement. On the Juniper operating system, JunOS, this can be activated by setting defaults ebgp no-policy reject-always on the protocols bgp hierarchy level starting with Junos OS Release 20.3R1.
If you are running an older version of JunOS, a similar effect can be achieved by defining a REJECT-ALL policy and setting this as import/export policy on the protocols bgp hierarchy level. Note that this will also affect iBGP sessions, which the solution above will have no impact on.
We are sorry for leaking routes of prefixes which did not belong to Cloudflare or our customers and to network engineers who got paged as a result of this.
We have processes in place to make sure that changes to our infrastructure are reviewed before being executed, so potential issues can be spotted before they reach production. In this case, the review process failed to catch this configuration error. In response, we will increase our efforts to further our network automation, to fully derive the device configuration from an intended state.
While this configuration error was caused by human error, it could have been detected and mitigated significantly faster if the confirmation bias did not kick in, making the operator think the observed behavior was to be expected. This error underlines the importance of our existing efforts on training our people to be aware of biases we have in our life. This also serves as a great example on how confirmation bias can influence and impact our work and that we should question our conclusions (early).
It also shows how important protocols like RPKI are. Route leaks are something even experienced network operators can cause accidentally, and technical solutions are needed to reduce the impact of leaks whether they are intentional or the result of an error.
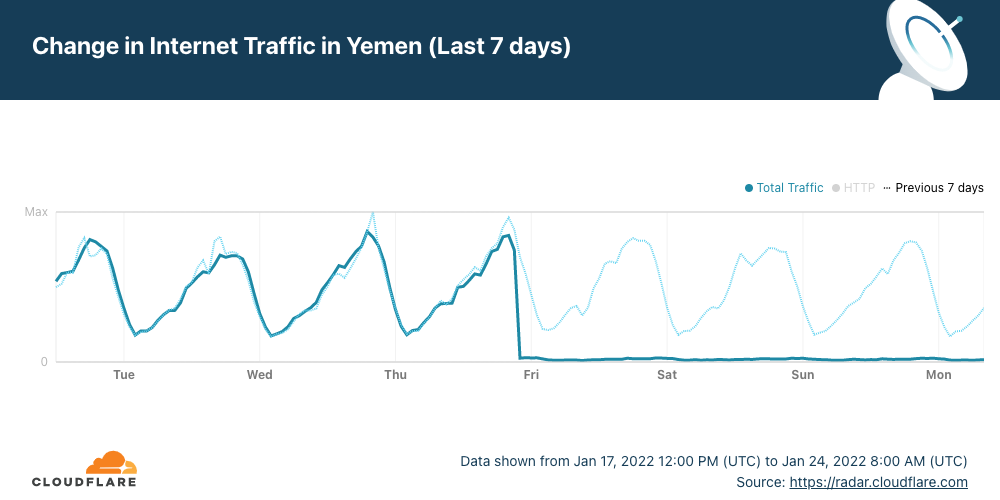
The early hours of Sunday, January 23, 2022, started in Burkina Faso with an Internet outage or shutdown. Heavy gunfire in an army mutiny could be related to the outage according to the New York Times (“mobile Internet services were shut down”). As of today, there are three countries affected by major Internet disruptions — Tonga and Yemen are the others.
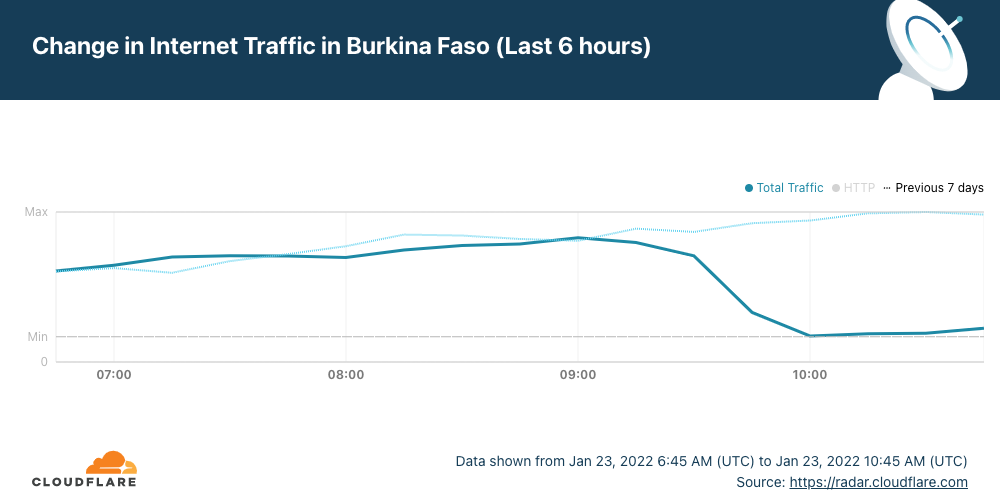
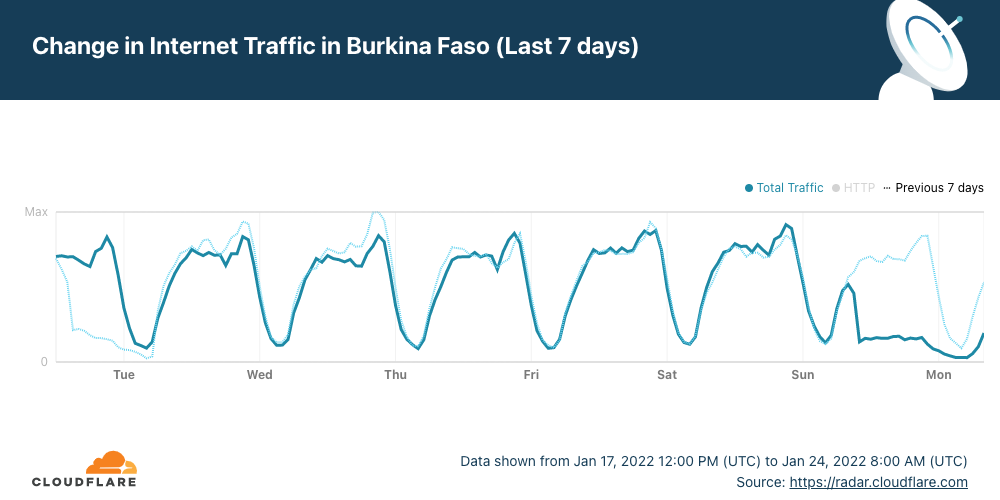
Cloudflare Radar shows that Internet traffic dropped significantly in the West African country after ~09:15 UTC (the same in local time) and remains low more than 24 hours later. Burkina Faso also had a mobile Internet shutdown on January 10, 2022, and another we reported in late November 2021.
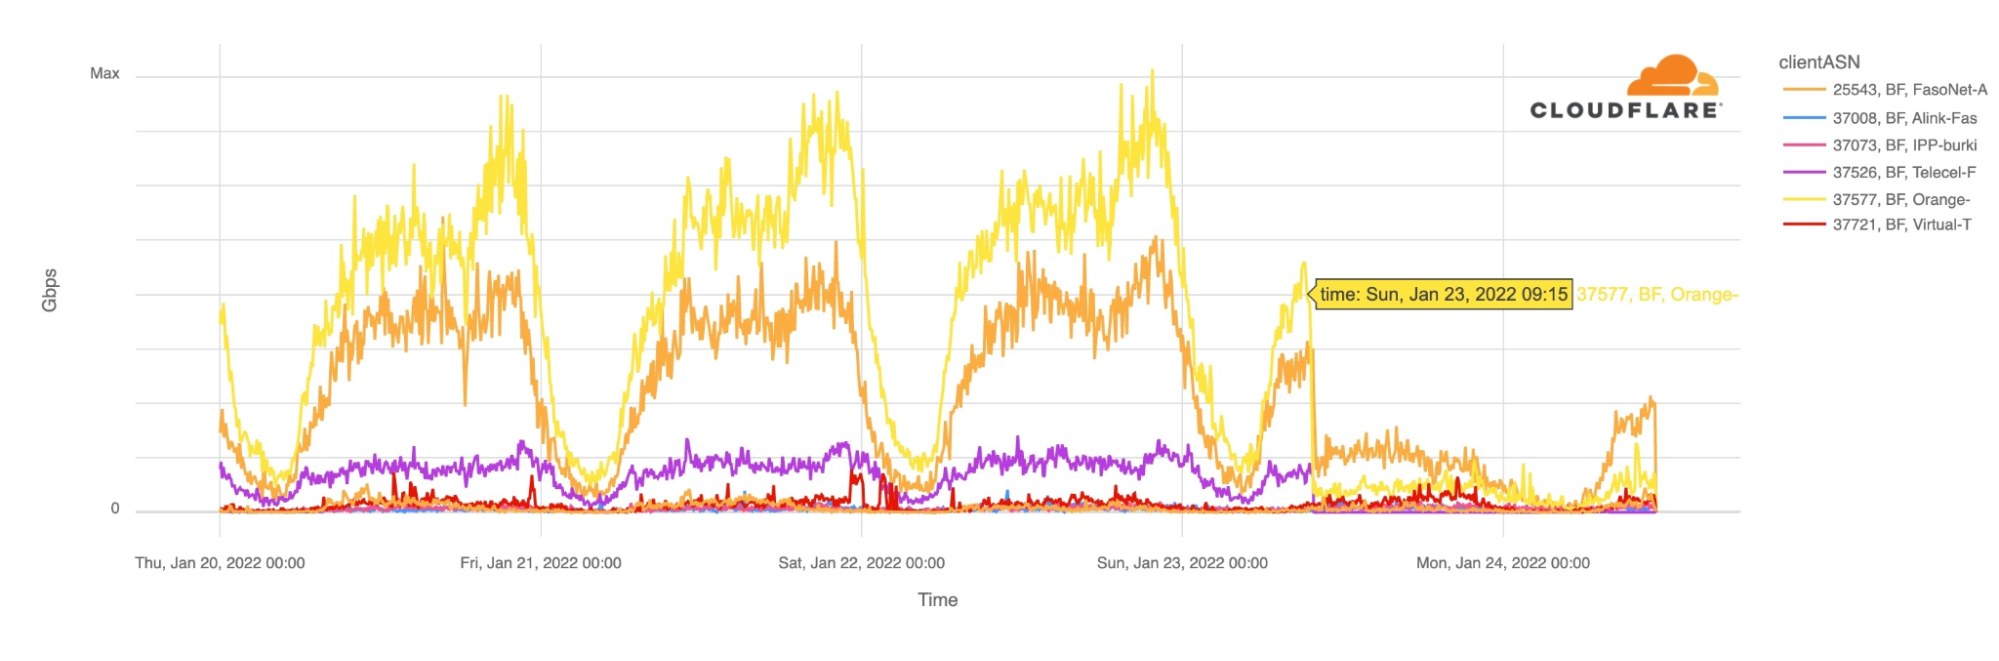
The main ISPs from Burkina Faso were affected. The two leading Internet Service Providers Orange and FasoNet lost Internet traffic after 09:15 UTC, but also Telecel Faso, as the next chart shows. This morning, at around 10:00 UTC there was some traffic from FasoNet but less than half of what we saw at the same time in preceding days.
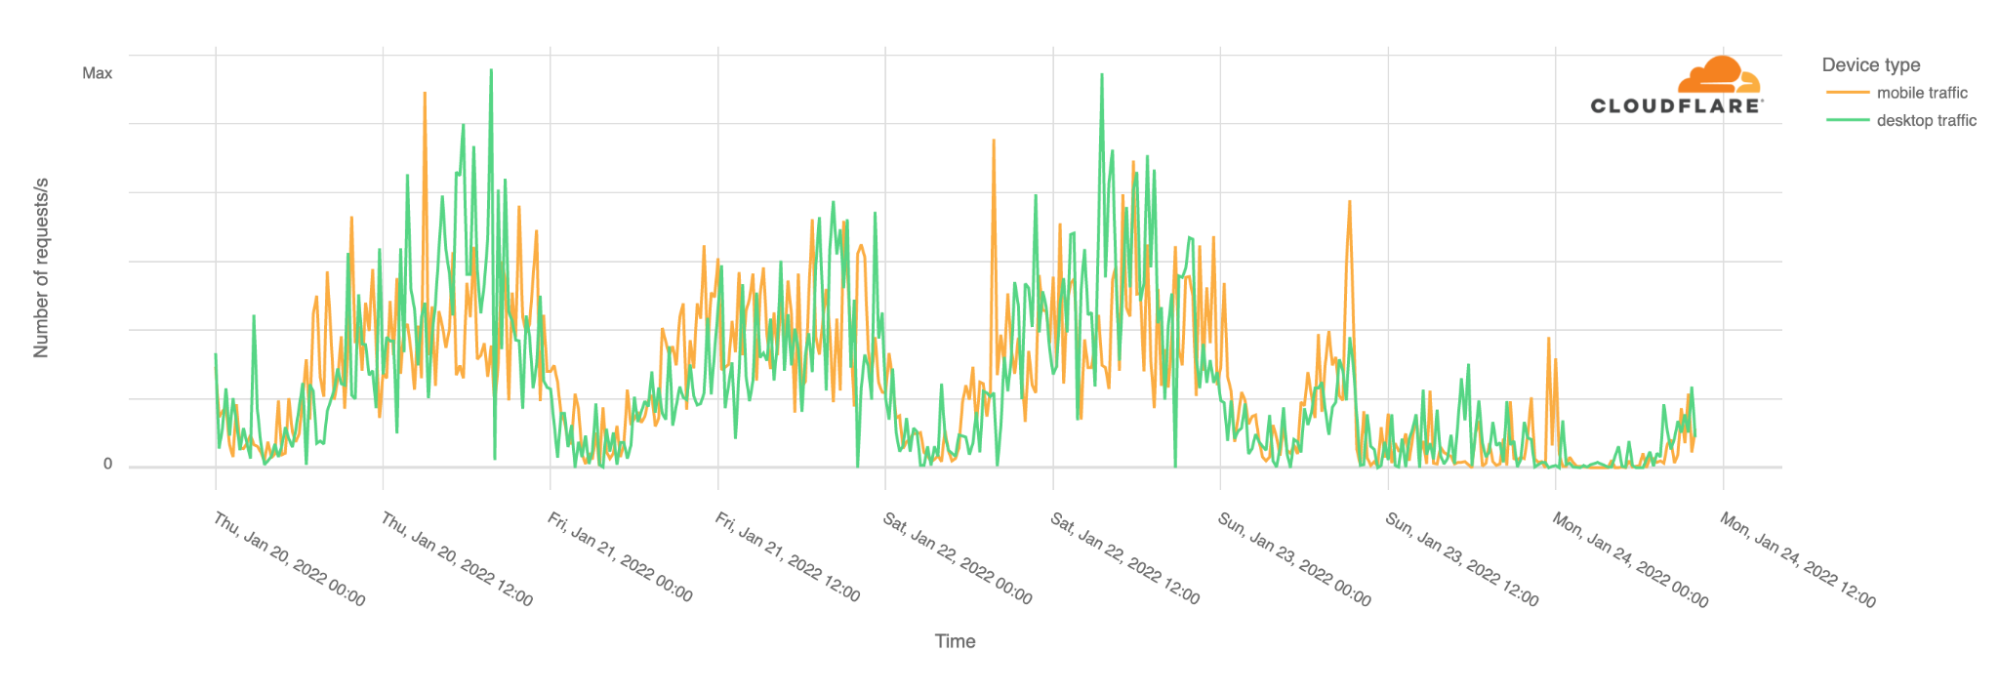
It’s not only mobile traffic that is affected. Desktop traffic is also impacted. In Burkina Faso, our data shows that mobile devices normally represent 70% of Internet traffic.
With the Burkina Faso disruption, three countries are currently mostly without access to the Internet for different reasons.
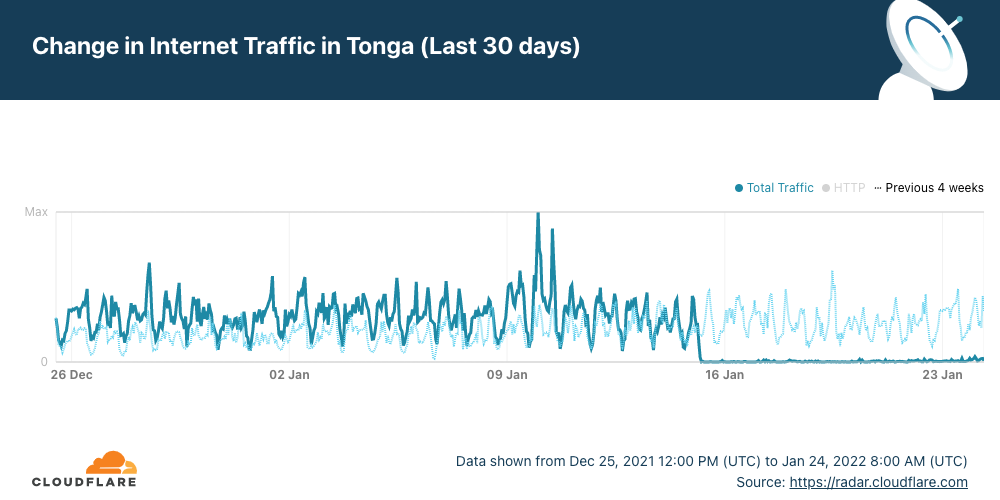
In Tonga, the nine day-long outage that we also explained is related to problems in the undersea cable caused by the large volcanic eruption in the South Pacific archipelago.
Several significant Internet disruptions have already occurred in 2022 for different reasons:
1. An Internet outage that lasted a few hours in The Gambia because of a cable problem (on January 4). 2. A six days Internet shutdown in Kazakhstan because of unrest (from January 5 to January 11). 3. A mobile Internet shutdown in Burkina Faso because of a coup plot (on January 10). 4. An Internet outage in Tonga because of a volcanic eruption (ongoing since January 15). 5. An Internet outage in Yemen because of airstrikes that affected a telecommunications building (ongoing since January 20,). 6. This second Internet disruption in Burkina Faso is related to military unrest (ongoing since January 23).
2022 only has 19 days of existence but so far this January, there have already been four significant Internet disruptions:
1. An Internet outage in The Gambia because of a cable problem. 2. An Internet shutdown in Kazakhstan because of unrest. 3. A mobile Internet shutdown in Burkina Faso because of a coup plot. 4. An Internet outage in Tonga because of a volcanic eruption.
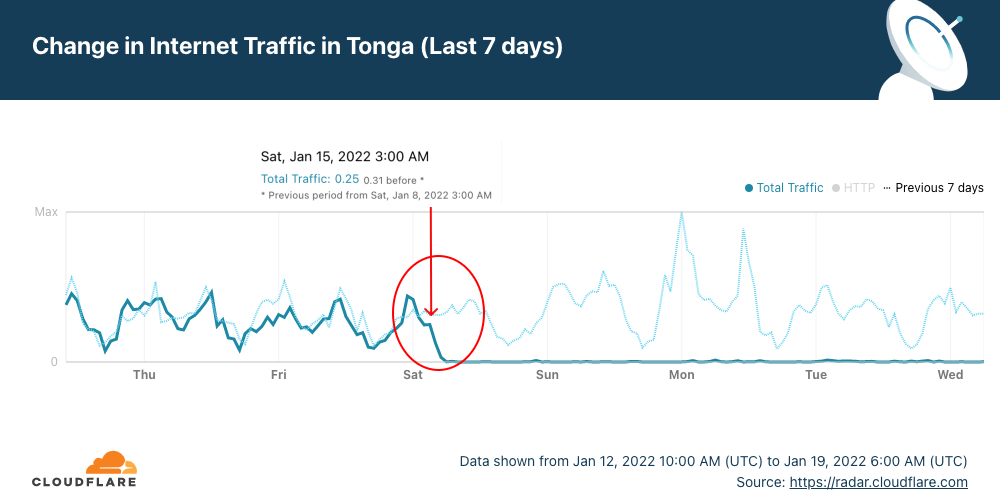
The latest Internet outage, in the South Pacific country of Tonga (with 169 islands), is still ongoing. It started with the large eruption of Hunga Tonga–Hunga Haʻapai, an uninhabited volcanic island of the Tongan archipelago on Friday, January 14, 2022. The next day, Cloudflare Radar shows that the Internet outage started at around 03:00 UTC (16:00 local time) — Saturday, January 15, 2022 — and is ongoing for more than four days. Tonga’s 105,000 residents are almost entirely unreachable, according to the BBC.
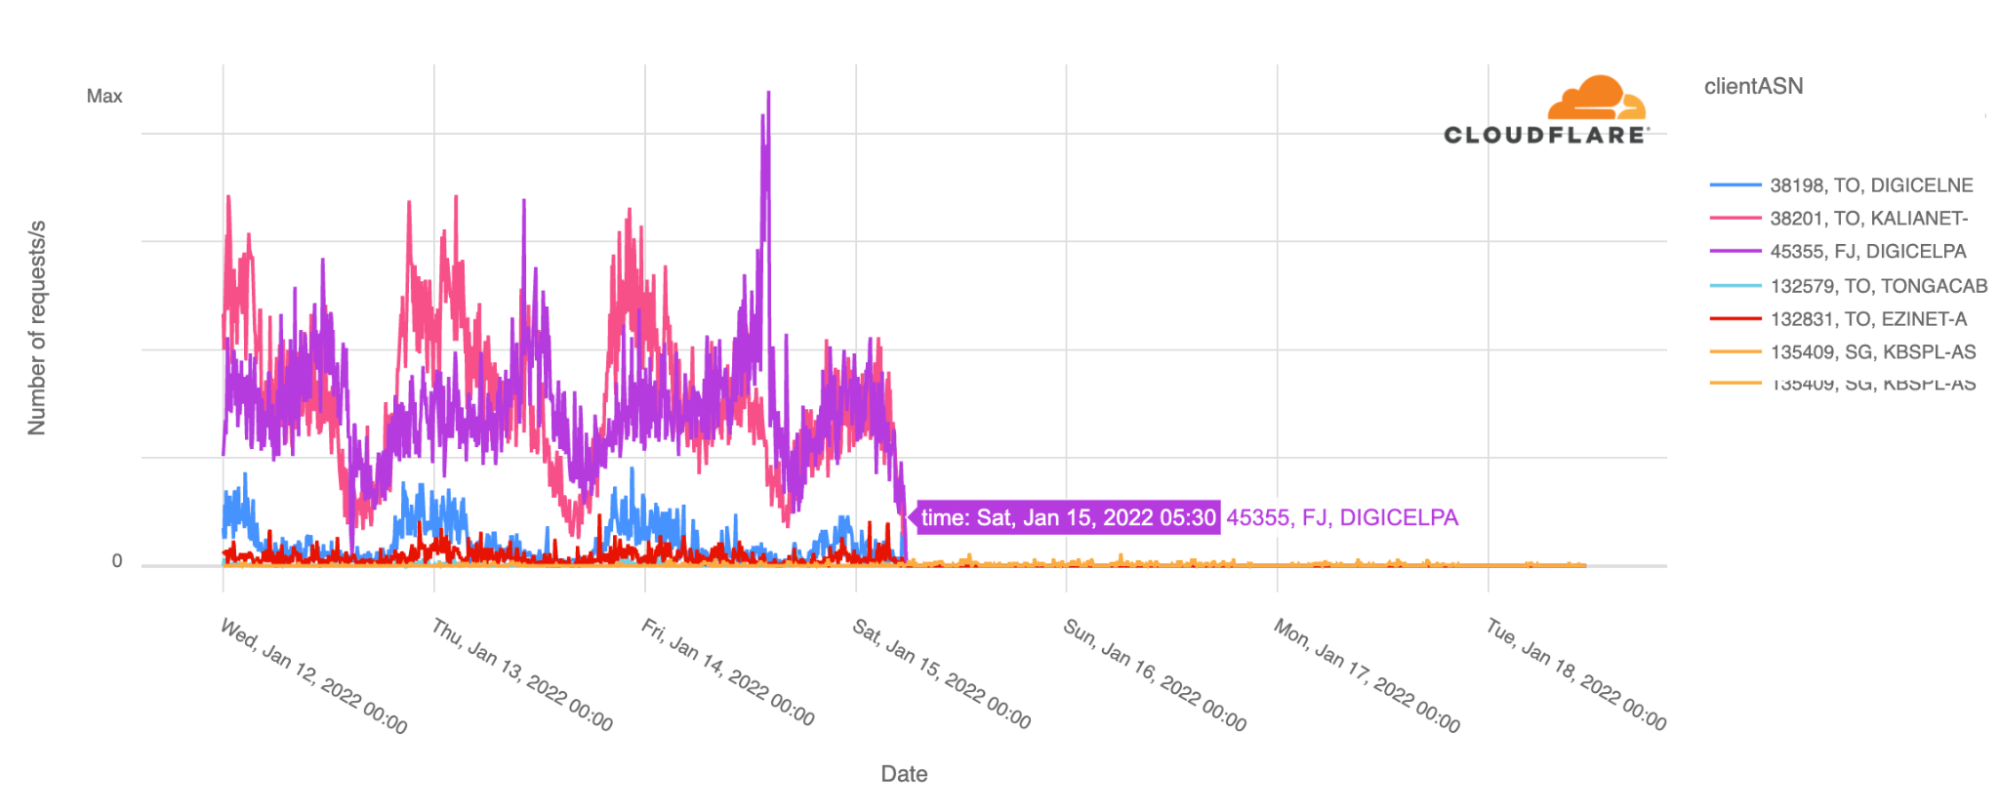
When we focus on the number of requests by ASN, the country’s main ISPs Digicel and Kalianet started to lose traffic after 03:00 UTC and by 05:30 UTC January 15, 2022, Cloudflare saw close to no traffic at all from them, as shown in the graph below.
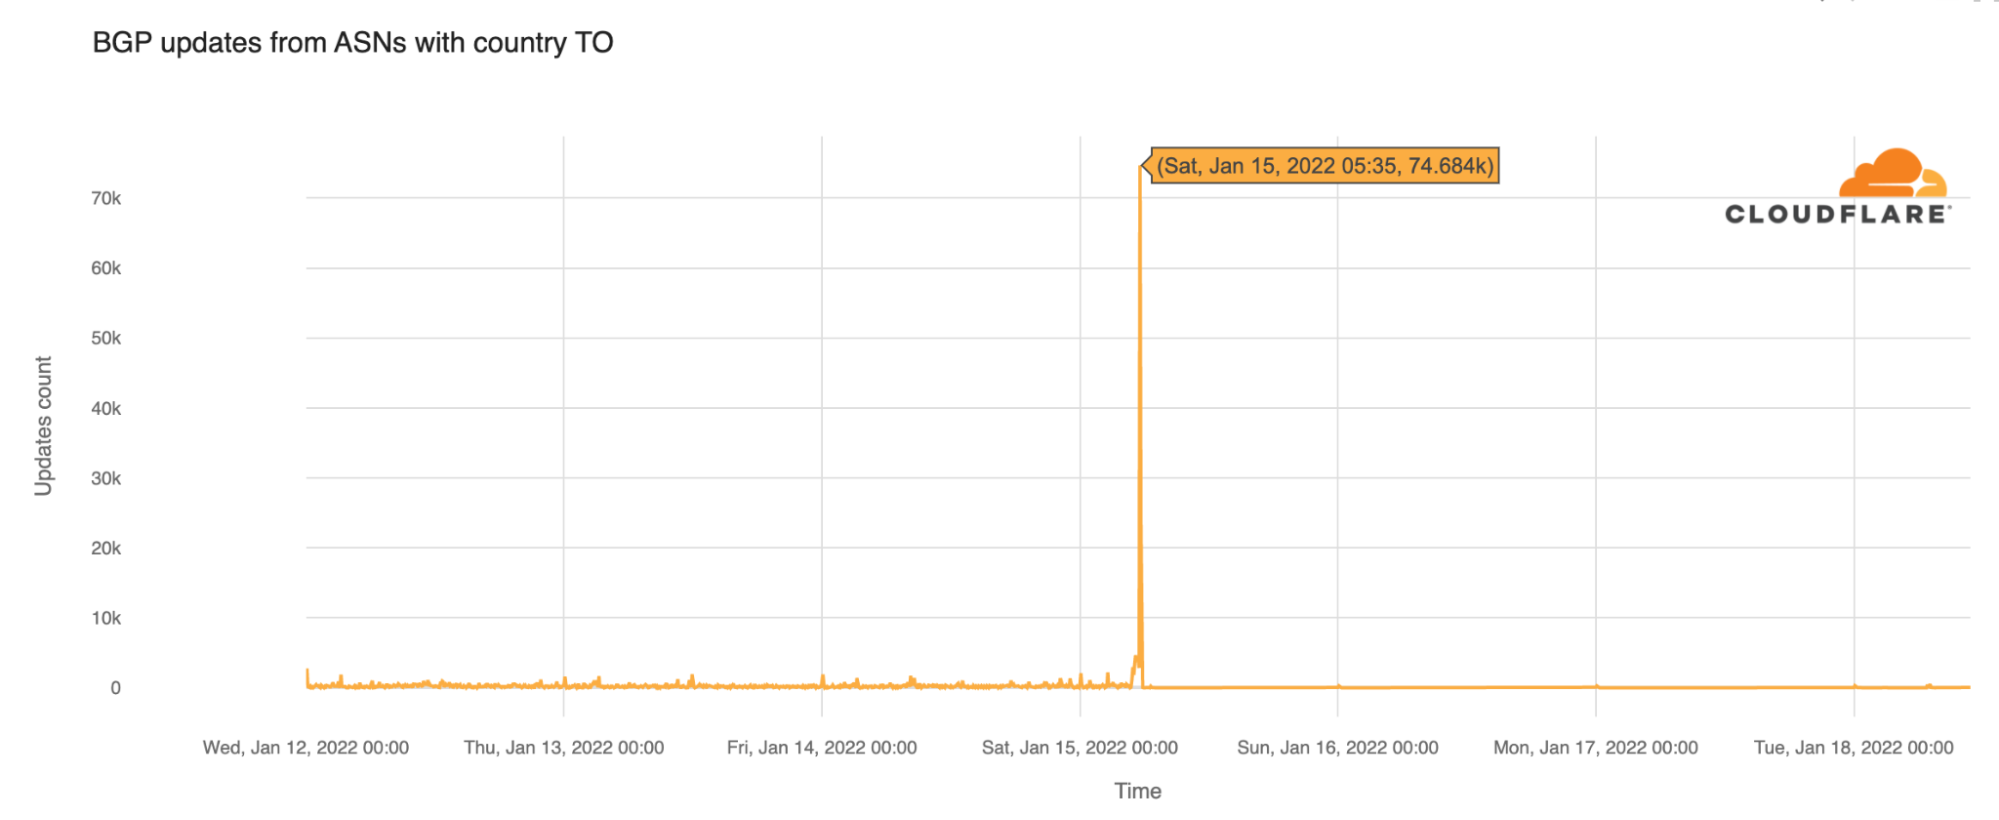
Looking at the BGP (Border Gateway Protocol) updates from Tonga’s ASNs around the time of the outage, we see a clear spike at 05:35 UTC (18:35 local time). These update messages are BGP signalling that the Tongan ASNs are no longer routable. We saw the same trend in The Gambia outage of January 4, 2022 — there you can read about the importance of BGP as a mechanism to exchange routing information between autonomous systems on the Internet, something that was also seen in the 2021 Facebook outage.
BGP updates from Tongan ASNs around the time of the outage.
Cloudflare Radar data doesn’t show any significant disruptions for Internet traffic in Tonga’s neighbours American Samoa (although there was a small decrease in traffic on Friday and Saturday, January 14 and 15, 2022 in comparison with the previous week) and Fiji. In American Samoa, all schools were closed on Friday, January 14, because of severe weather, and on the same day, after the volcanic eruption, there were tsunami warnings and evacuation to higher ground was advised (that continued through the weekend).
Tonga, as a geographically remote Polynesian country more than 800 km from the Fiji archipelago, is highly dependent on the Internet for communications. That is something that was improved five years ago with an infrastructure connectivity program from the World Bank. Prior to that, the country was dependent on satellite links for Internet that included a very small percentage of the population.
Repairs could take a few weeks
Southern Cross Cable Network confirmed that the 827 km fiber-optic undersea communications cable connecting Tonga to the outside world may have been broken. The company is assisting Tonga Cable Limited (TCL), which owns the single cable that provides Internet access and almost all communications to and from the archipelago.
The eruption resulted in a fault in the international cable 37 kilometres from Nukuʻalofa (Tonga’s capital), and a further fault in a domestic cable 47 km from the capital.
TCL announced that it has already met with the US cable company SubCom to start preparations for SubCom’s cable repair ship Reliance to be dispatched from Papua New Guinea to Tonga, possibly via Samoa (more than 4,000 km away).
The repairs could take “at least” four weeks, given that a repair to a fiber-optic cable that has been cut on the seabed is considered more complicated than misconfigurations, power outages or other types of infrastructure damage. “The site conditions in Tonga have to be assessed thoroughly because of volcanic activities,” according to TCL chairman Samiuela Fonua.
Fonua also mentioned that the last cable cut (back in 2019) took nearly two weeks to repair, but this time the site conditions will determine the time it will take — the two cables are not far away from the eruption site (the volcano is still active). According to ZDNet, in 2019 Tonga signed a 15-year deal with Kacific for satellite connectivity, but since then the satellite provider says it is waiting on the Tongan government to activate its contract.
Svalbard Undersea Cable System also disrupted in January
Also in January, Space Norway, the operator of the world’s most northern submarine cable — the Svalbard Undersea Cable System — announced that on January 7 it located a disruption in one of the two twin submarine fiber optic communication cables connecting Longyearbyen with Andøya north of Harstad in northern Norway (in the area where the seabed goes from 300 meters down to 2,700 meters in the Greenland Sea). A repair mission is being planned.
A world of undersea cables for the world’s communications
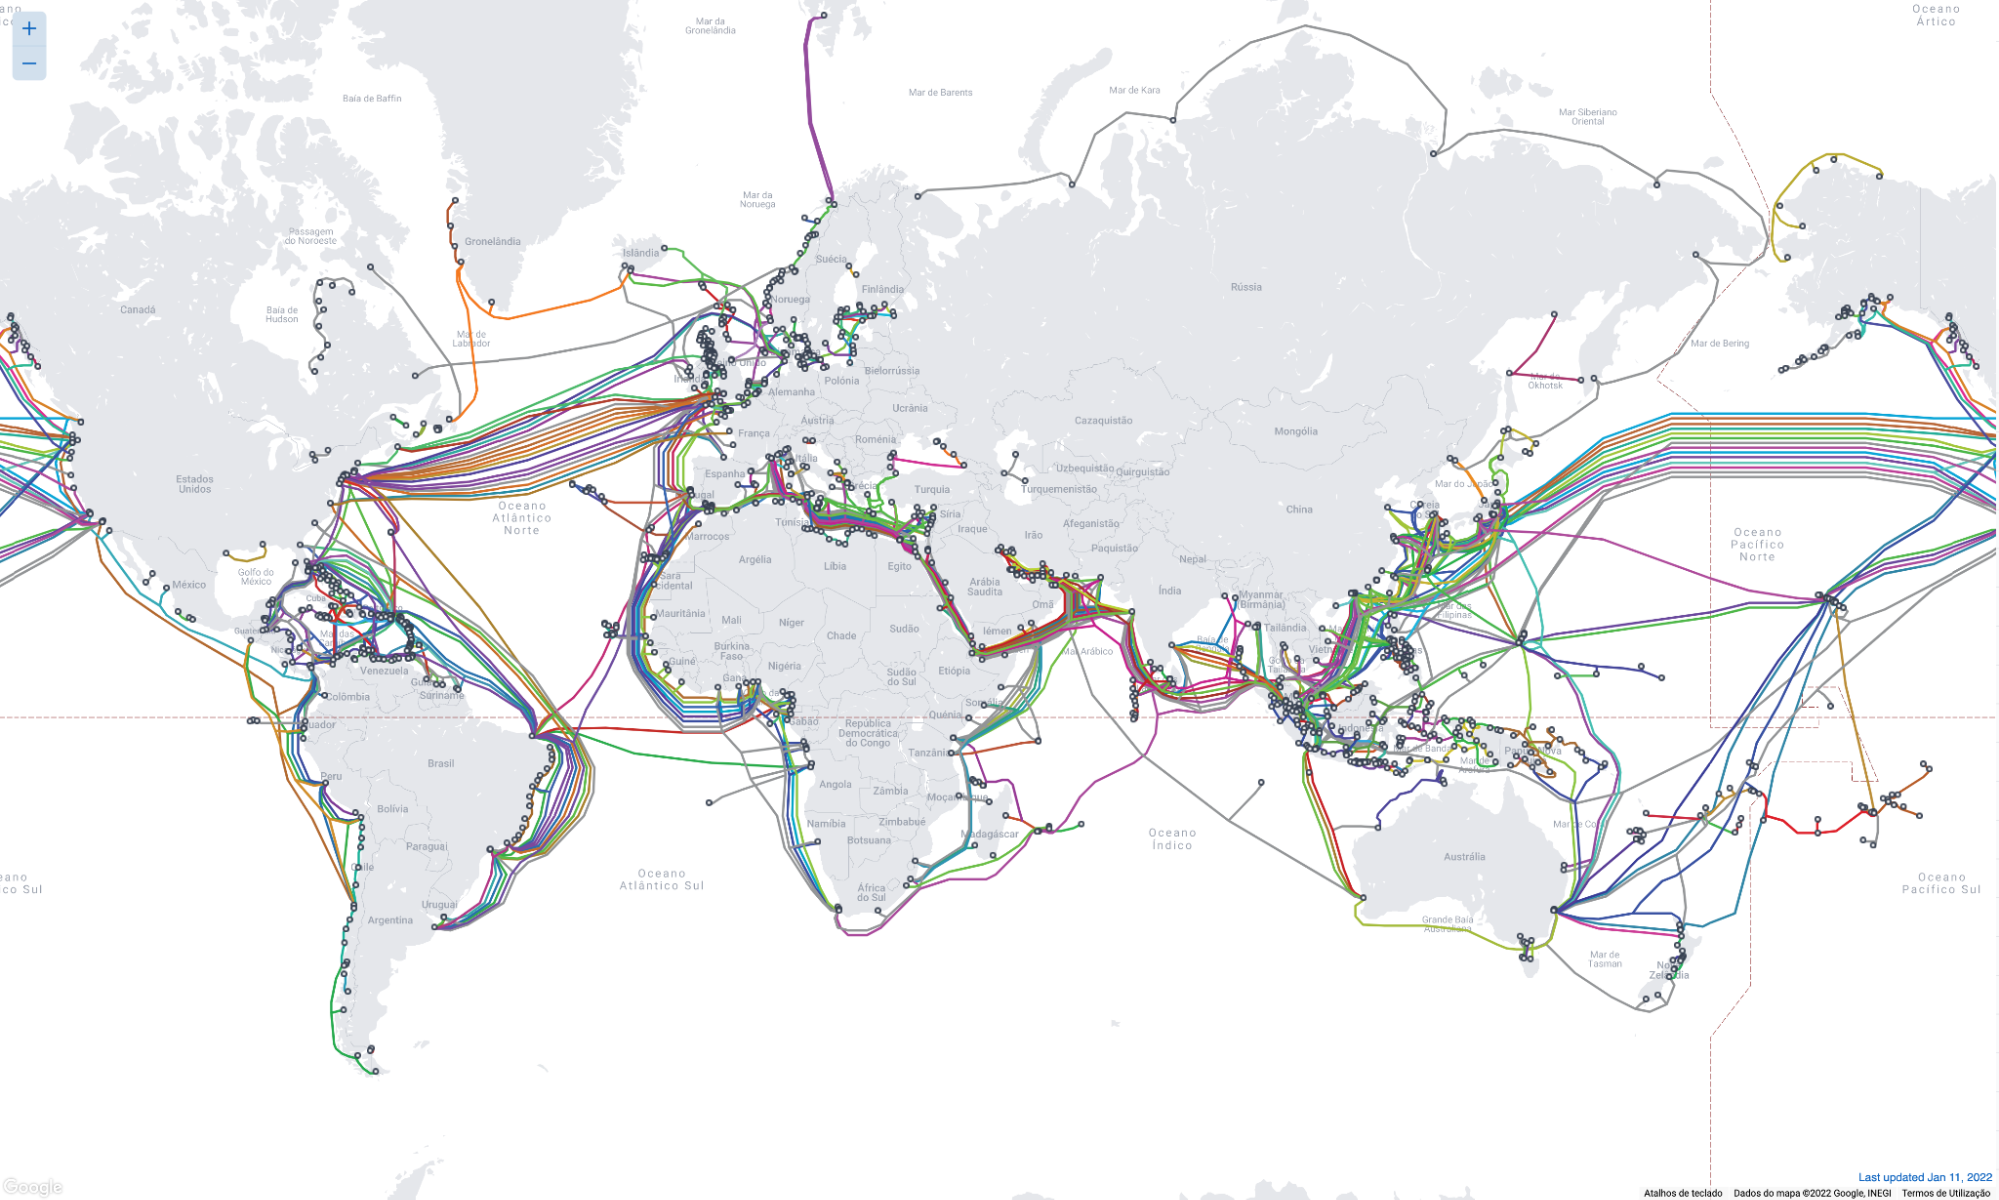
A significant amount of Internet traffic is carried by a complex network of undersea fiber-optic cables that connect countries and continents. The full submarine cable system (the first communications cables laid were from the 1850s and carried telegraphy traffic) is what makes most of the world’s Internet function between countries and continents. There are 428 active submarine cables (36 are planned), running in an estimate of 1.3 million km around the globe.
World map of submarine cables. Antarctica is the only continent not yet reached by a submarine telecommunications cable. Source: TeleGeography (www.submarinecablemap.com)
This gives a sense that the Internet is literally a network of networks in a world where estimates indicate that around 99% of the data traffic that is crossing oceans is carried by these undersea cables (satellite Internet, so far, is still residual — SpaceX has around 145,000 users).
The reliability of submarine cables is high, especially when multiple paths are available in the event of a cable break. That’s not the case for the Tonga outage, given that the 827 km submarine cable only connects Fiji to the Tonga archipelago — Fiji is connected to the main Southern Cross Cable, as the next image illustrates.
Submarine Cable Map shows the undersea cables that connect Australia to Fiji and the following connections to other archipelagos like Tonga. Source: TeleGeography (www.submarinecablemap.com)
🇹🇴Volcano Tonga-Hunga erupted Sat 15JAN22, causing extensive damage to the region, cutting off communications over both the TDCE domestic cable and the 🇹🇴-🇫🇯 international cable
The total carrying capacity of submarine cables is enormous (EllaLink, the optical submarine cable linking the European and South American continents, for example, has 100 Tbps capacity) and grows year after year as the world gets more and more connected. For example, Google has recently finished a new cable with 350 Tbps of capacity. But, a transoceanic submarine cable system costs several hundred million dollars to construct. One of the latest, between Portugal and Egypt, with a total of 8,700 kilometers, is budgeted at 326 million euros.
The Tonga outage was not the only one of 2022 (so far) that happened because of cable problems. The Gambia outage that affected the country’s main ISP, Gamtel, was because of “a primary link failure at ACE”, the cable system that serves 24 countries, from Europe to Africa, namely in the points of cable connections from Senegal to The Gambia.
In spite of these two fiber cable problems being separated by a few days at the start of 2022, Internet outages are more common because of situations like misconfigurations, power outages, extreme weather or the frequent state-imposed shutdowns to deal with unrest, elections or exams — recently this was the case of Sudan or Kazakhstan.
In 2021, we continued to live with the effects of the COVID pandemic and Internet traffic was also impacted by it. Although learning and exercising may have started to get back to something close to normal (depending on the country), the effects of what started almost two years ago on the way people work and communicate seems to be here to stay, and the lockdowns or restrictions continue to have an impact on where and how people go online.
So, Cloudflare Radar’s 2021 Year In Review is out with interactive maps and charts you can use to explore what changed on the Internet throughout this past year. Year In Review is part of Cloudflare Radar. We launched Radar in September 2020 to give anyone access to Internet use and abuse trends.
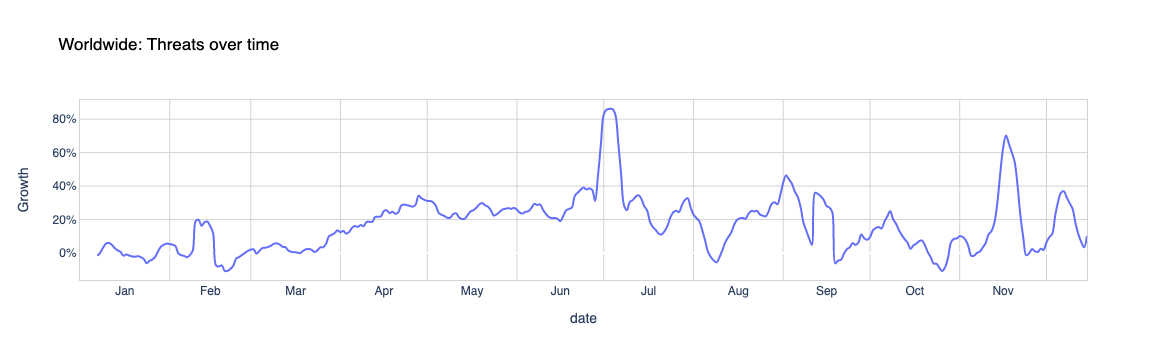
This year we’ve added a mobile vs desktop traffic chart, but also the attack distribution that shows the evolution throughout the year — the beginning of July 2021, more than a month after the famous Colonial Pipeline cyberattack, was the time of the year when attacks worldwide peaked.
There are also interesting pandemic-related trends like the (lack) of Internet activity in Tokyo with the Summer Olympics in town and how Thanksgiving week in the US in late November affected mobile traffic in the United States.
In 2020 by late April we saw that the Internet had seen incredible, sudden growth in traffic because of lockdowns and that was sustained throughout the year as we showed in our 2020 Year In Review. 2021 told a slightly different story, depending on the country.
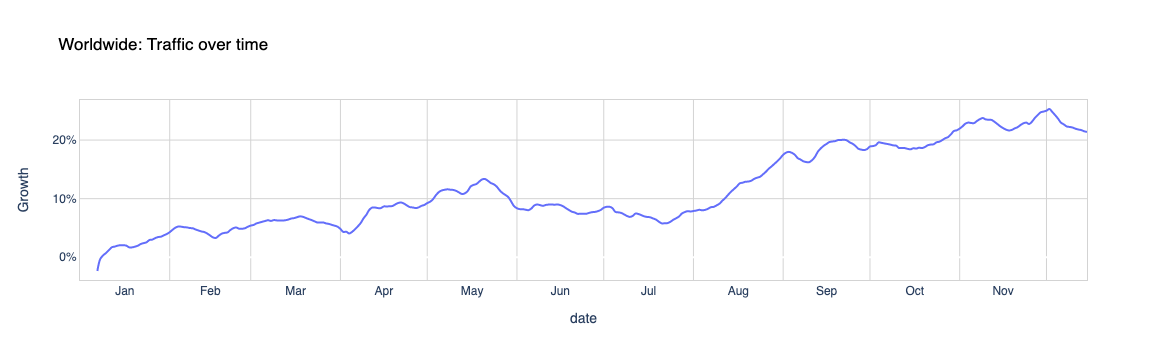
The big April-March and May Internet traffic peak from 2020 related to the pandemic wasn’t there, in the same way, this year — it was more distributed depending on the local restrictions. In 2021, Internet traffic, globally, continued to grow throughout the year, and it was at the end of the year that was higher (a normal trend, given there’s a growth in categories like online shopping and the colder season in the Northern Hemisphere, where most Internet traffic occurs, affects human behaviour).
The day of the year with the highest growth in traffic worldwide, from our standpoint, was December 2, 2021, with 20% more than the first week of the year — the Y-axis shows the percentage change in Internet traffic using a cohort of top domains from each country. But in May there was also a bump (highlighted in red as a possible pandemic-related occurrence), although not as high as we saw in the March-May period of last year.
Spikes in Internet traffic — Worldwide 2021
#1 November-December1 (+23%) #2 September (+20%) #3 October (+19%) #4 August (+16%) #5 May (+13%) 1Beginning of December
When we focus on specific countries using our Year In Review 2021 page you can see that new restrictions or lockdowns affected (again) Internet traffic and, in some countries, that is more evident than others.
In the following table, we show the months with the highest traffic growth (the percentage shown focus on the spikes). From our standpoint the last four months of the year usually have the highest growth in traffic after September, but Canada, the UK, Germany, France, Portugal, South Korea and Brazil seemed to show (in red) an impact of restrictions in their Internet traffic — with higher increases in the first five months of the year.
Months with the largest traffic growth — 2021
United States
#1 November-Dec (+30%) #2 October (+26%) #3 September (+25%) #4 August (+15%) #5 May (+13%)
Canada
#1 November-Dec (+21%) #2 October (+10%) #3 April (+9%) #4 May (+8%) #5 March (+7%)
UK
#1 November-Dec (+23%) #2 March (+13%) #3 October (+12%) #4 February (+7%) #5 September (+5%)
Germany
#1 November-Dec (+25%) #2 October (+15%) #3 May (+7%) #4 February (+6%) #5 September (+5%)
France
#1 November-Dec (+24%) #2 May (+14%) #3 April (+13%) #4 January (+8%) #5 February (+7%)
Japan
#1 November-Dec (+32%) #2 October (+28%) #3 September (+28%) #4 August (+24%) #5 July (+18%)
Australia
#1 November-Dec (+42%) #2 September (+38%) #3 October (+37%) #4 August (+32%) #5 July (+27%)
Singapore
#1 November-Dec (+62%) #2 October (+58%) #3 September (+58%) #4 August (+41%) #5 July (+31%)
Portugal
#1February (+38%) #2 March (+23%) #3 January (+22%) #4 November-Dec (+18%) #5 April (+17%)
South Korea
#1 April (+21%) #2 May (+16%) #3 February (+10%) #4 August (+7%) #5 September (+7%)
Brazil
#1 May (+25%) #2 June (+23%) #3 November-Dec (+22%) #4 April (+21%) #5 July (+21%)
India
#1 November-Dec (+24%) #2 September (+22%) #3 October (+21%) #4 August (+19%) #5 July (+10%)
When we look at those countries’ trends we can see that Canada had lockdowns at the beginning of February that went through March and May, depending on the area of the country. That is in line with what we’ve seen in 2020: when restrictions/lockdowns are up, people tend to use the Internet more to communicate, work, exercise and learn.
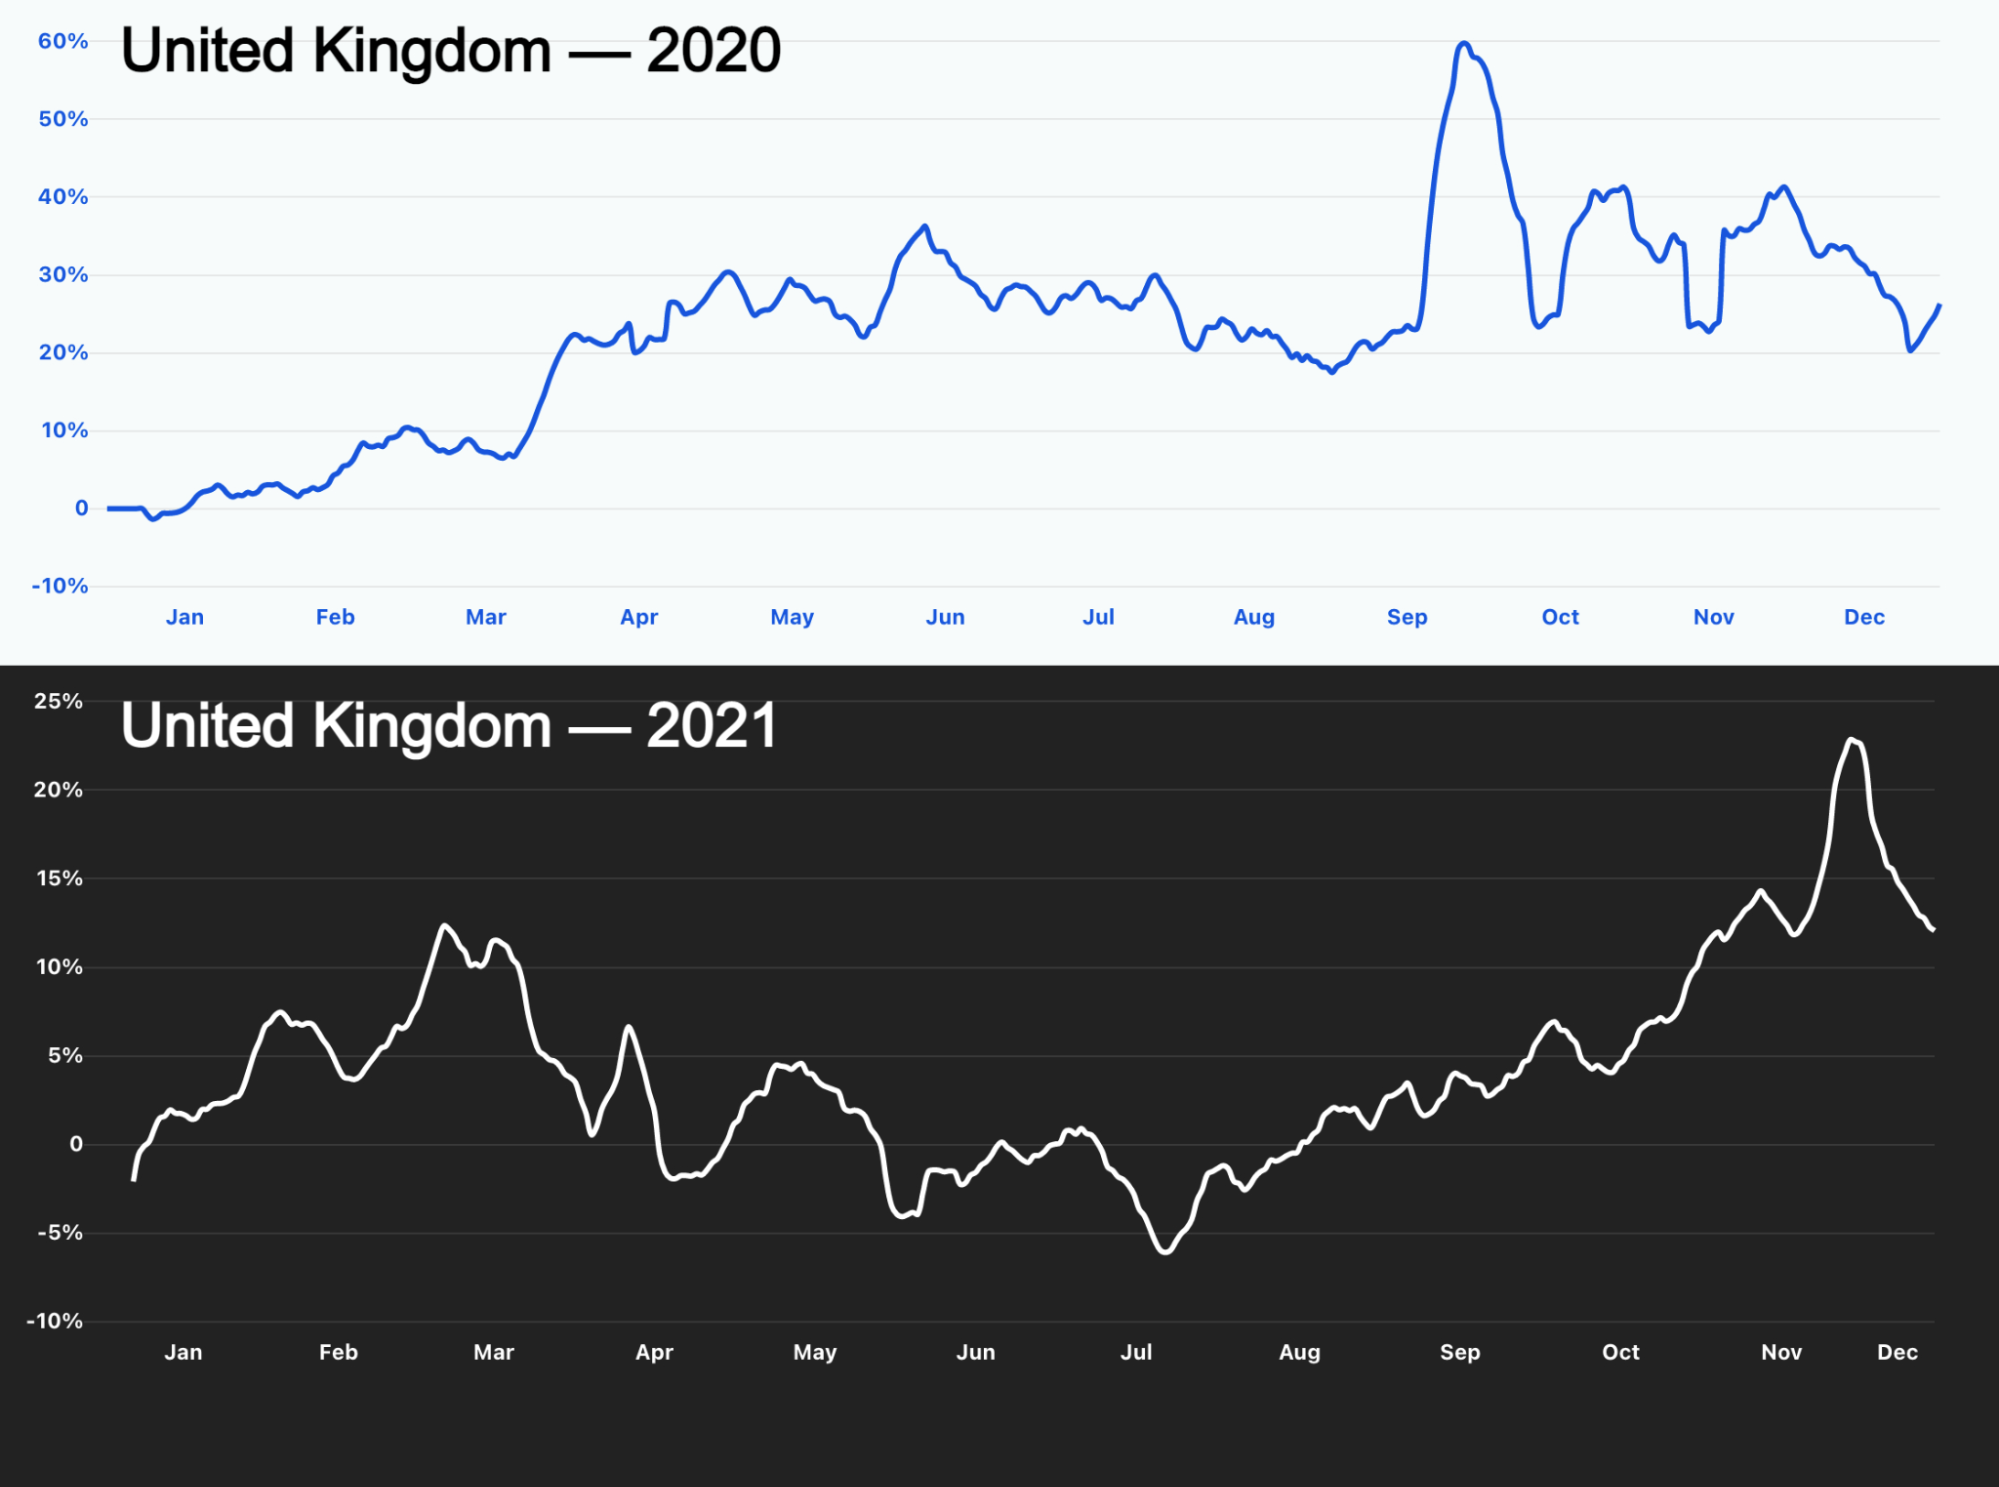
Most of Europe also started 2021 with lockdowns and restrictions that included schools — so online learning was back on. That’s clear in the UK. From January to March showed a high increase in traffic percentage that went down when restrictions were relaxed.
The lines here show Internet traffic growth from our standpoint throughout 2020 and 2021 in the UK
The same happens in Portugal, where new measures on January 21, 2021, put the three first months of the year in the top 3 of the year in terms of growth of traffic, and April was #5.
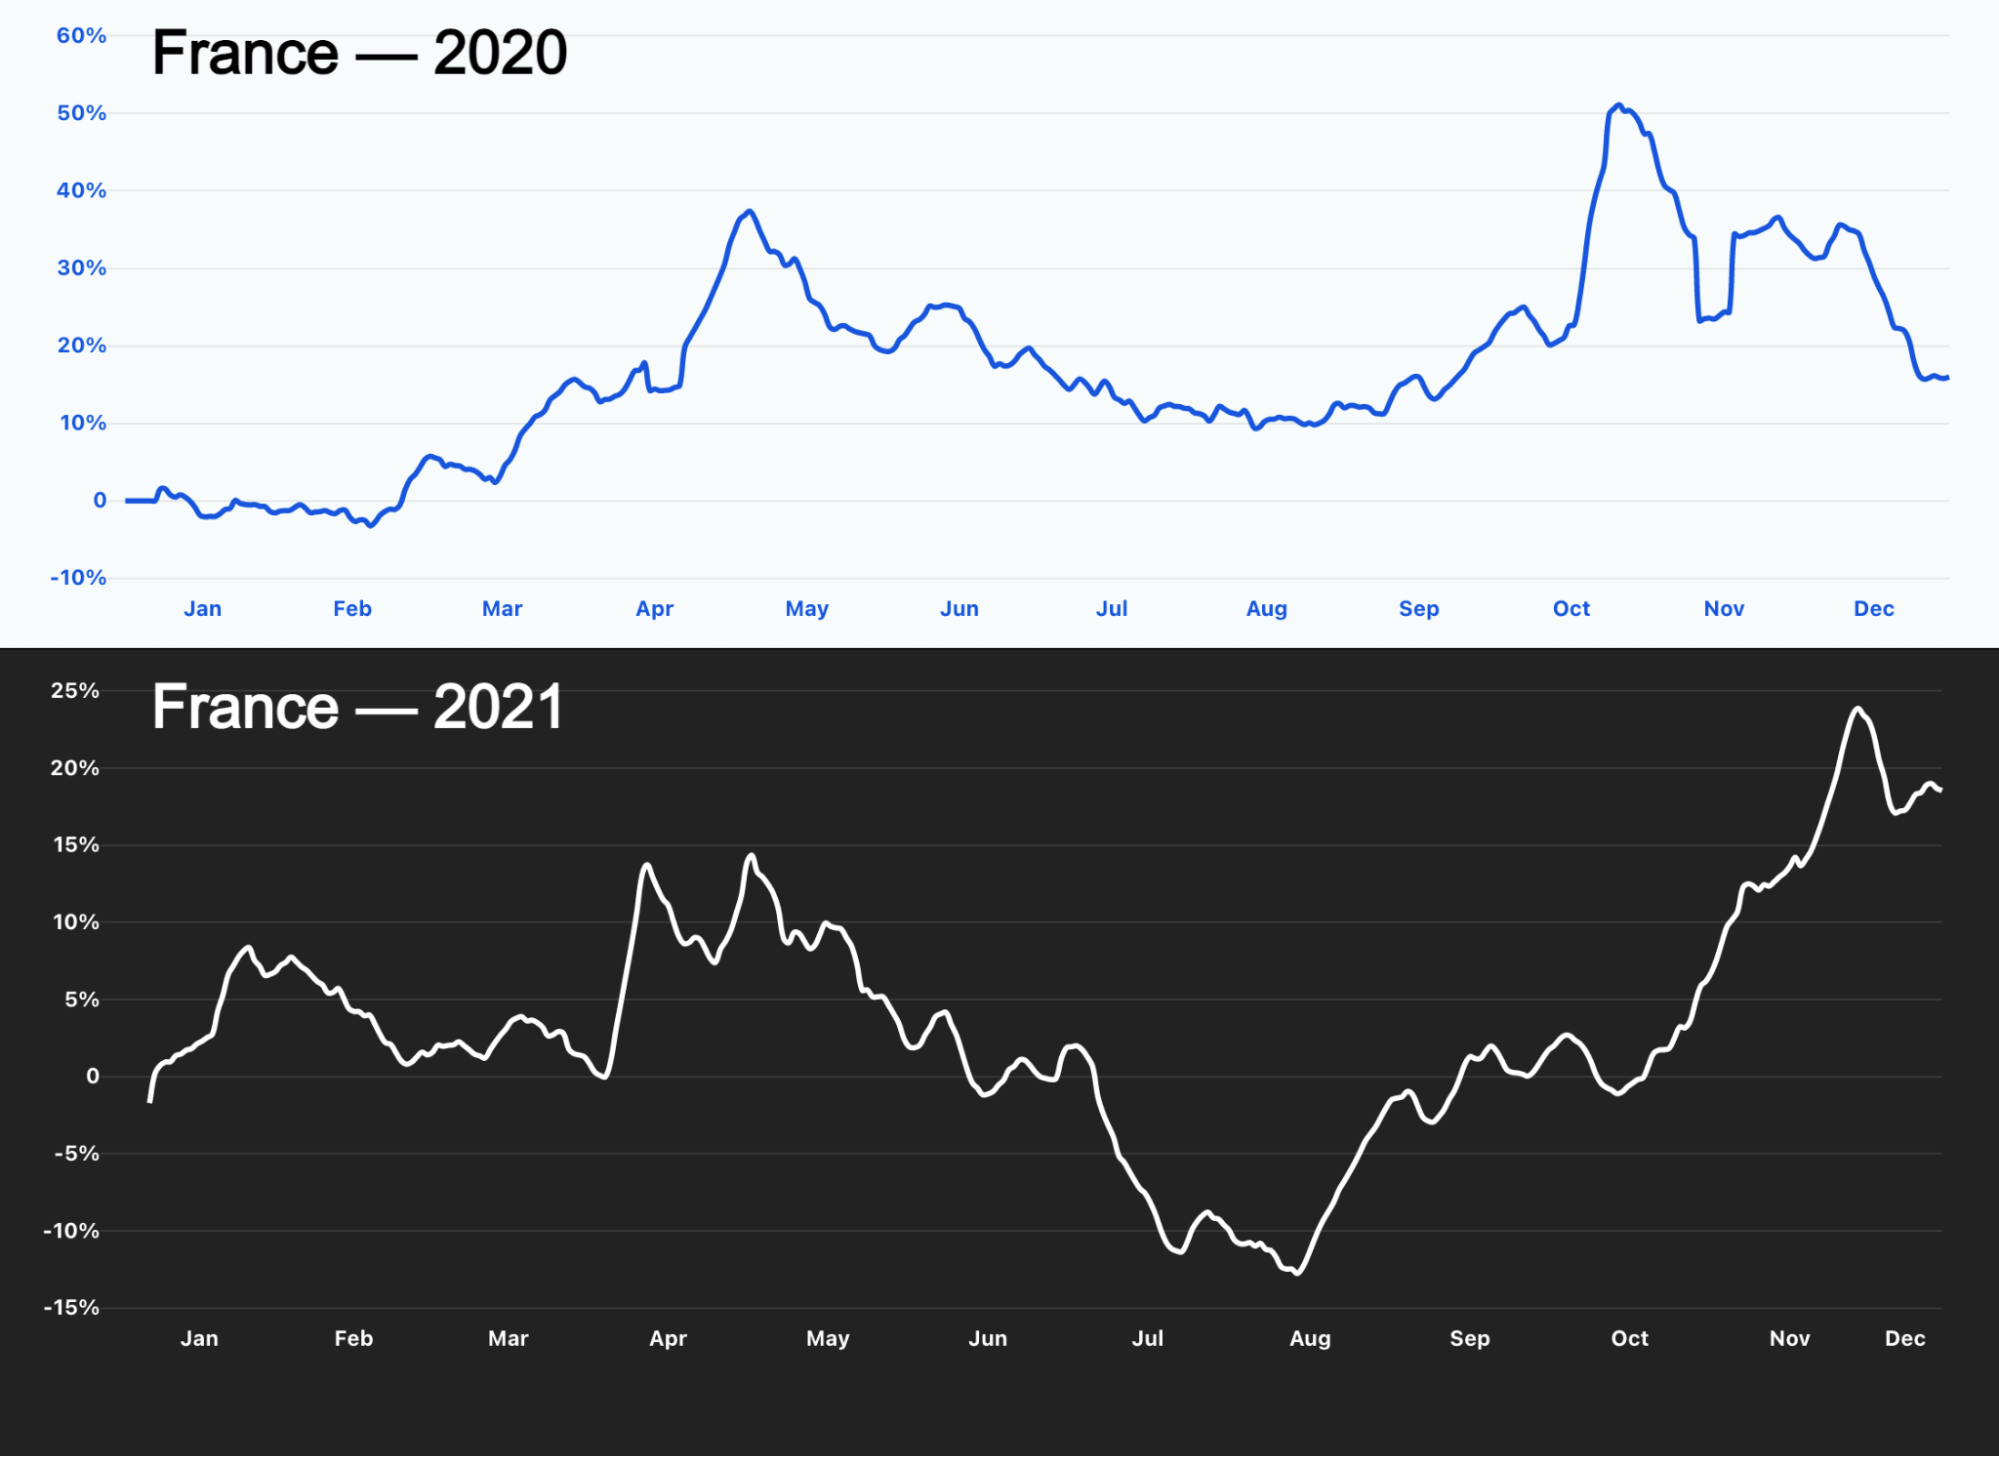
We can also check the example of France. Lockdowns were imposed again especially during April and May 2021, and we can see the growth in Internet traffic during those months, slightly more timid than the first lockdown of 2020, but nonetheless evident in the 2021 chart.
Germany had the same situation in May (in April work from home was again the rule and the relaxation of measures for vaccinated people only began in mid-May), but in February the lockdown that started at the end of 2020 (and included schools) was also having an impact on Internet traffic.
In South Korea there was also an impact of the beginning of the year lockdown seen in spikes through February, April and May 2021.
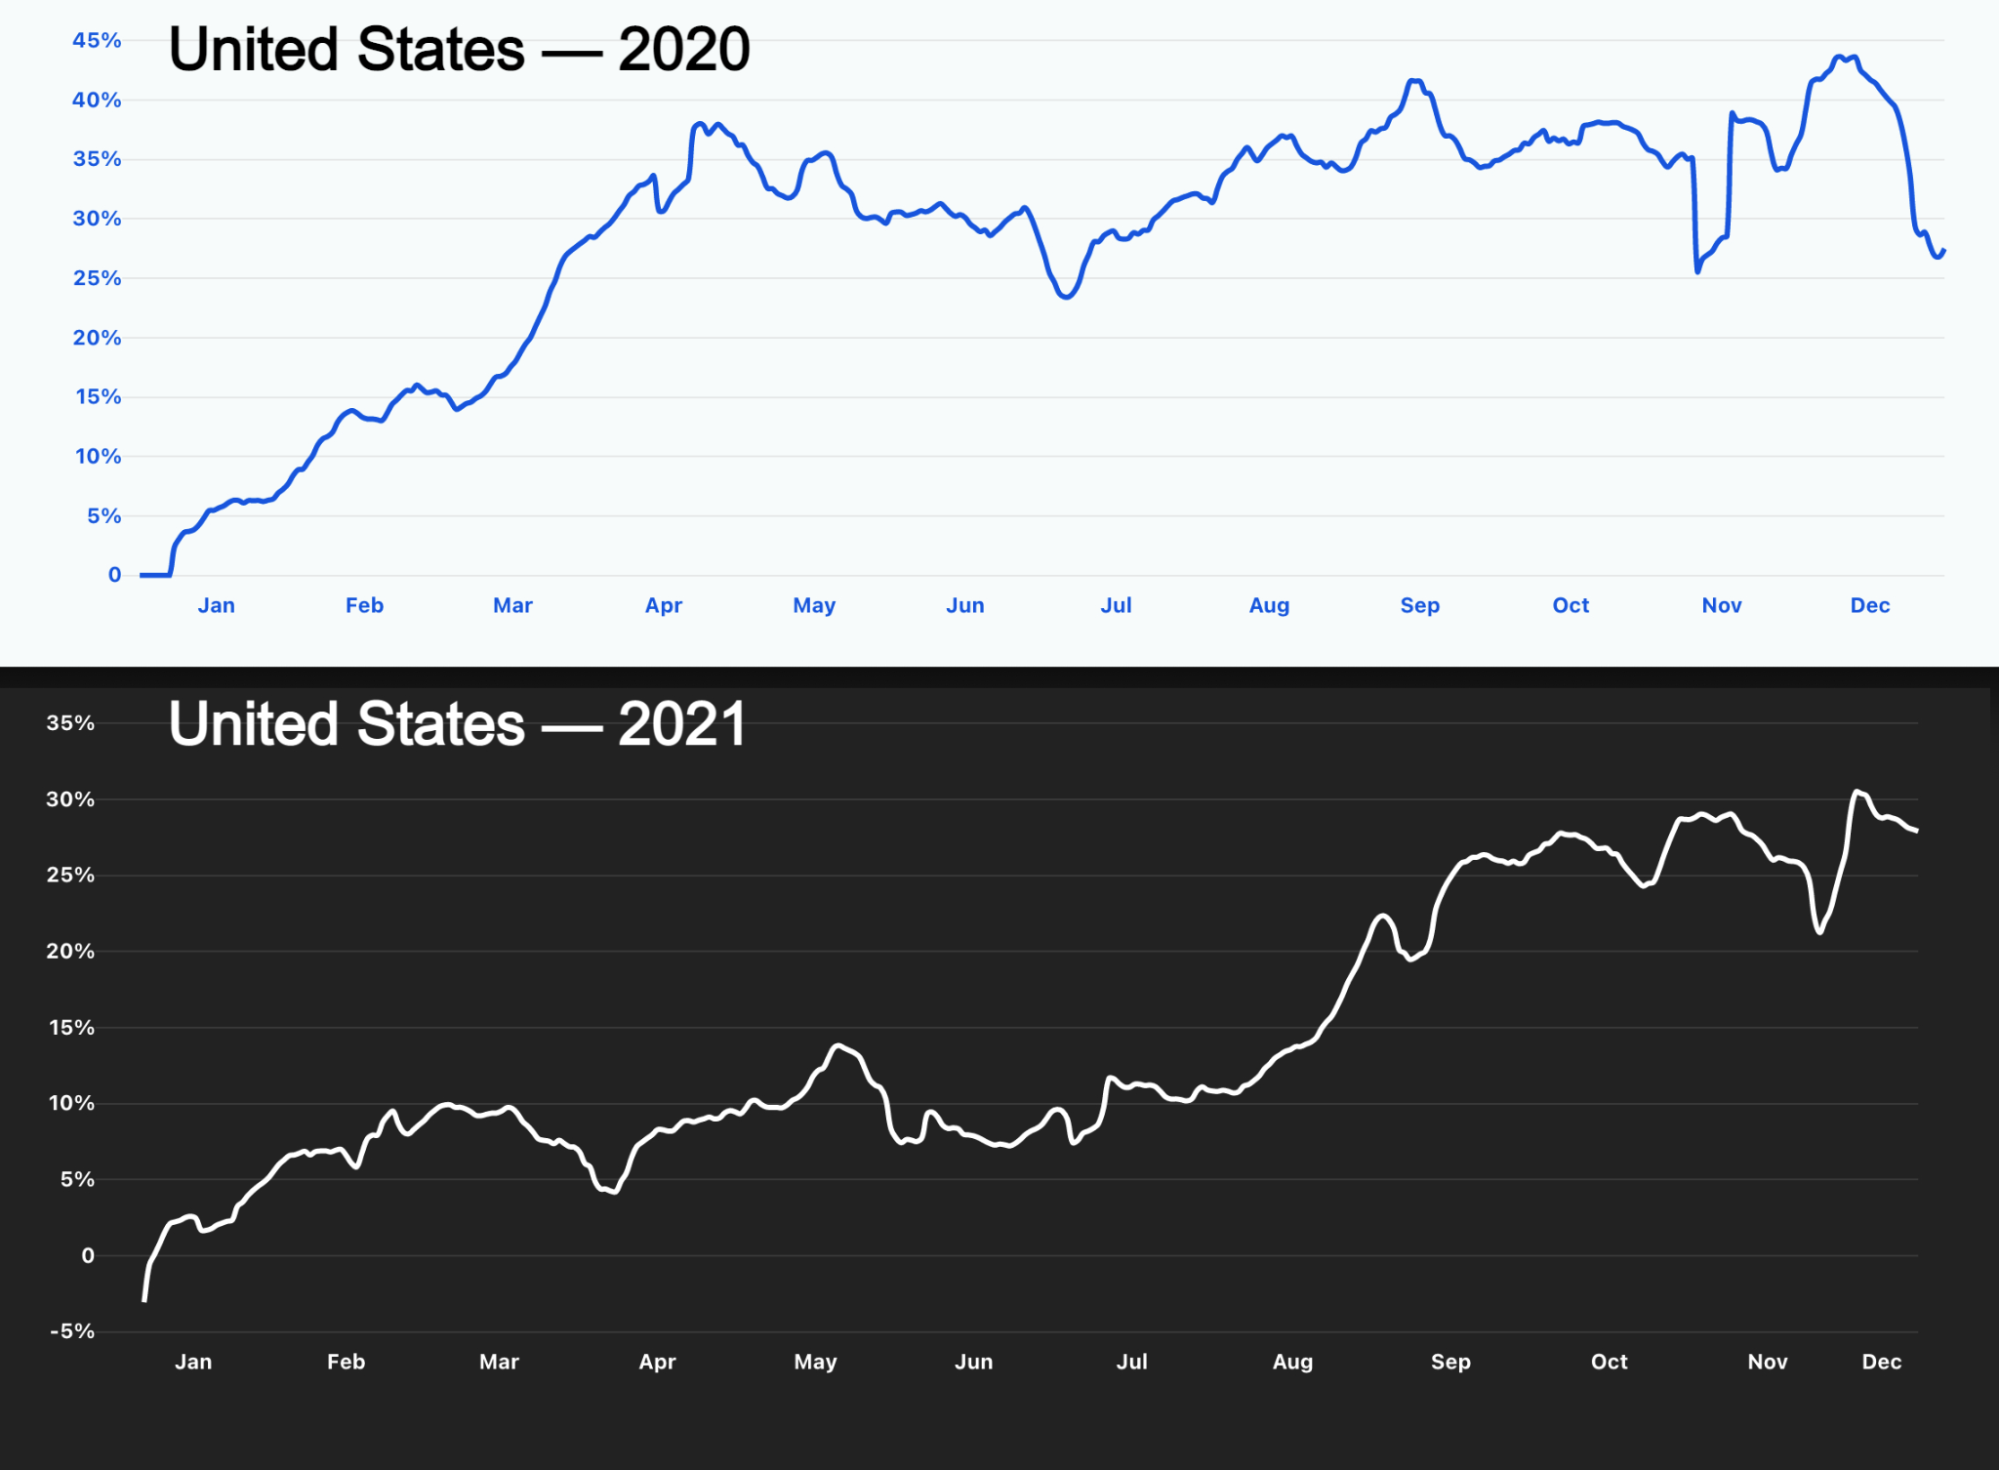
Internet traffic growth in the United States had a very different year in 2021 than it had the year before, when the first lockdown had a major effect on Internet growth, but still, May was a month of high growth — it was in mid-May that there were new guidelines from the CDC about masks.
Mobile traffic: The Thanksgiving effect
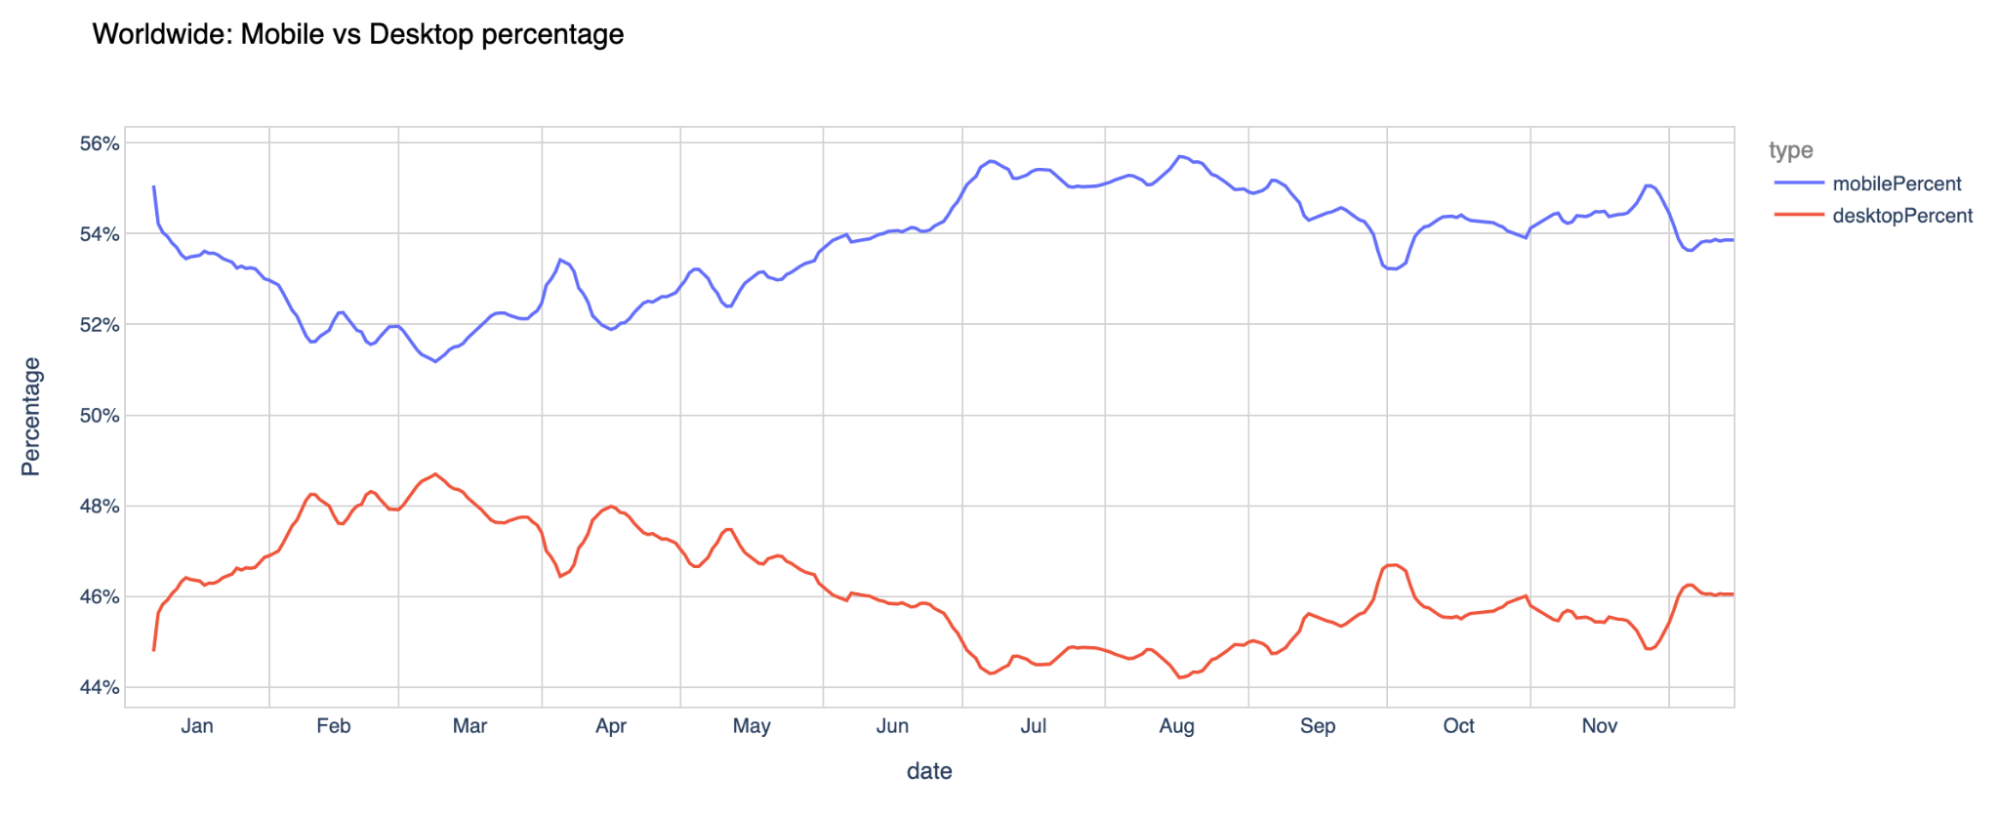
Another trend worldwide from 2021 is the mobile traffic percentage evolution. Worldwide, from our standpoint, the more mobile-friendly months of the year — where mobile devices were more prevalent to go online — were July and August (typical vacations months in most of the Northern Hemisphere), but January and November were also very strong.
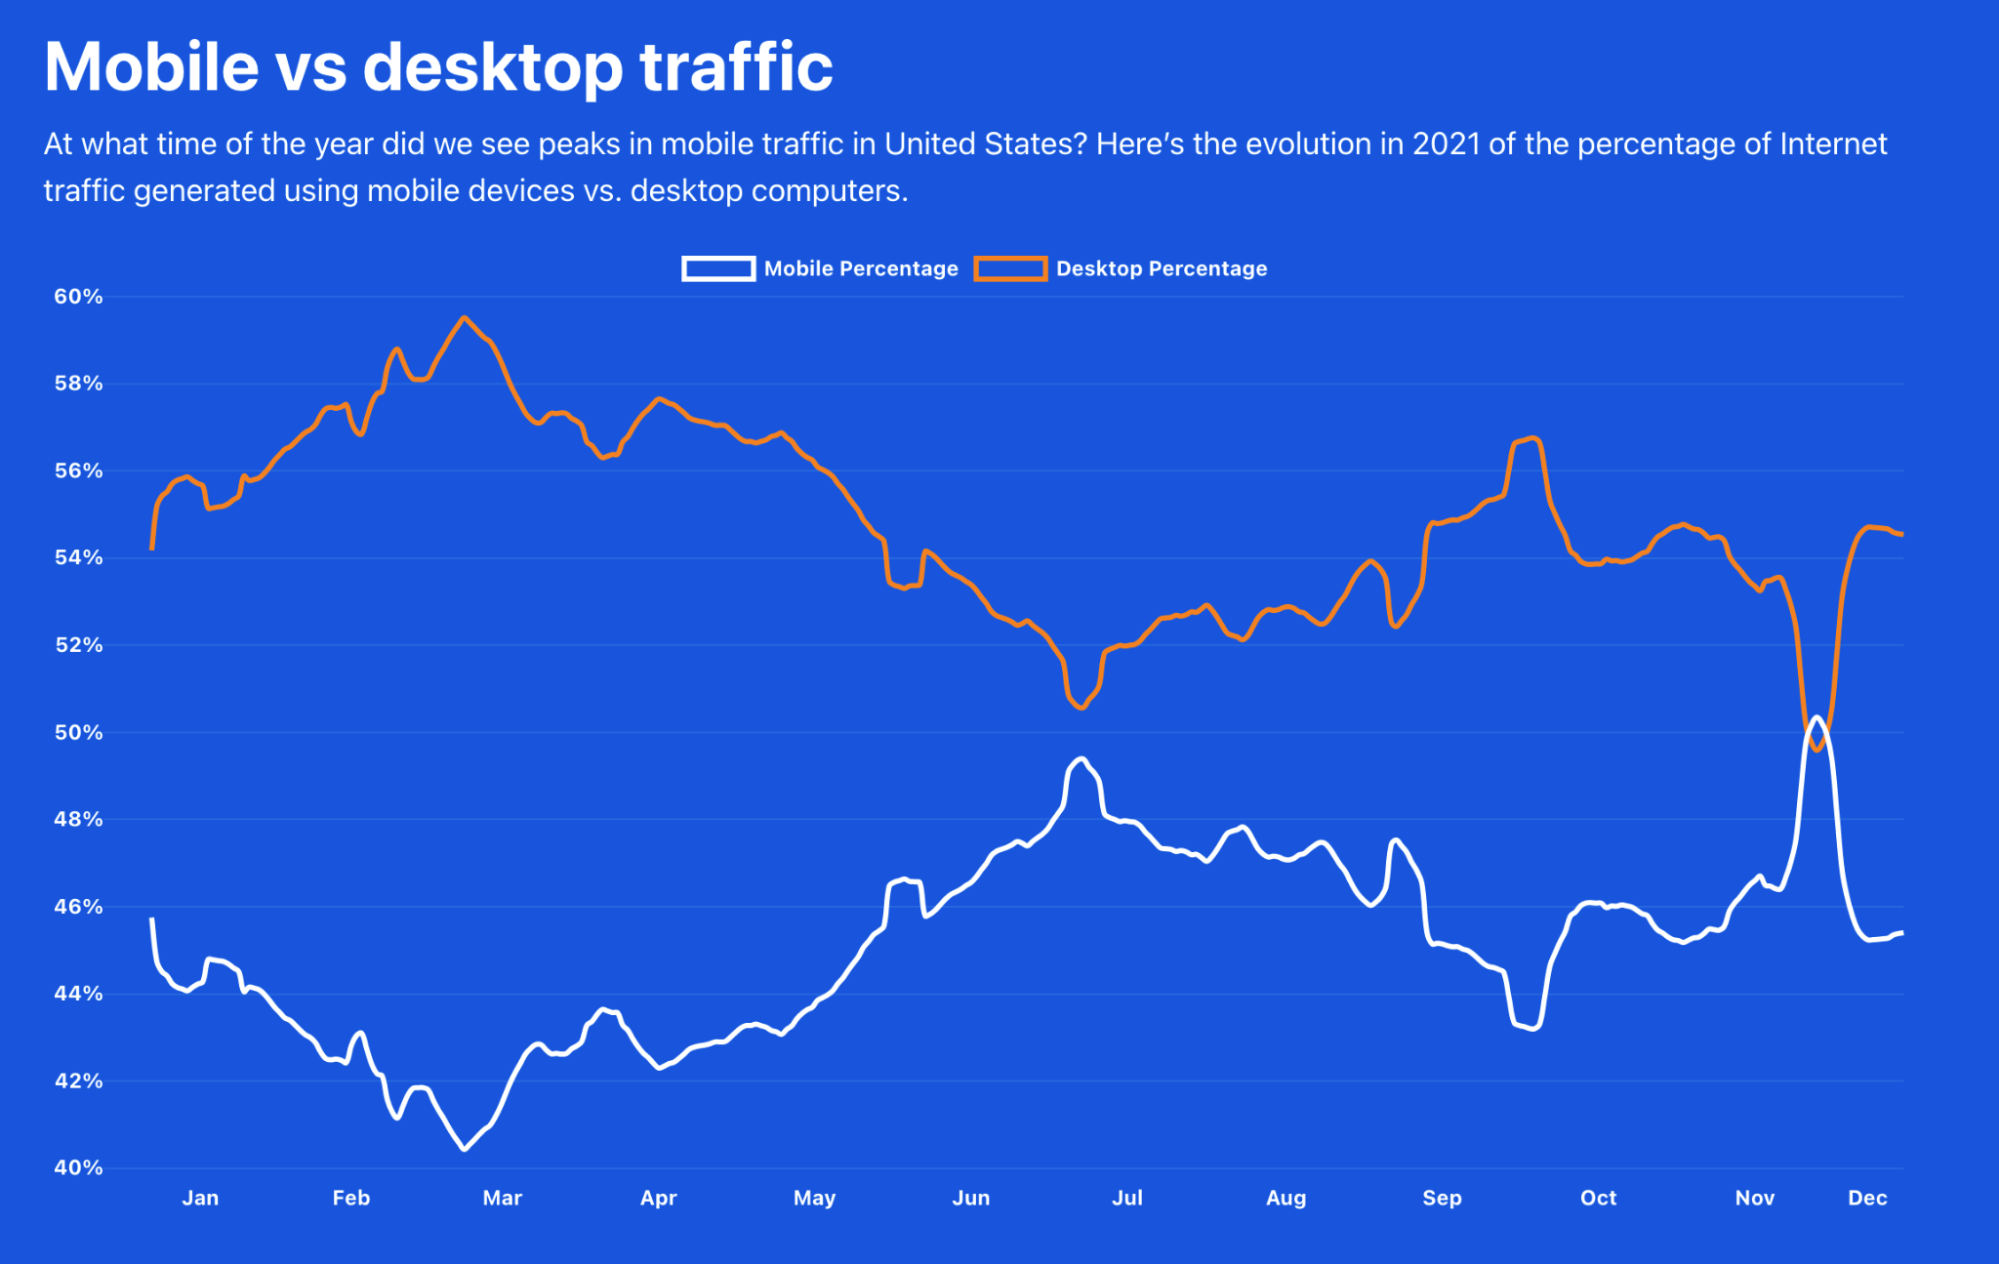
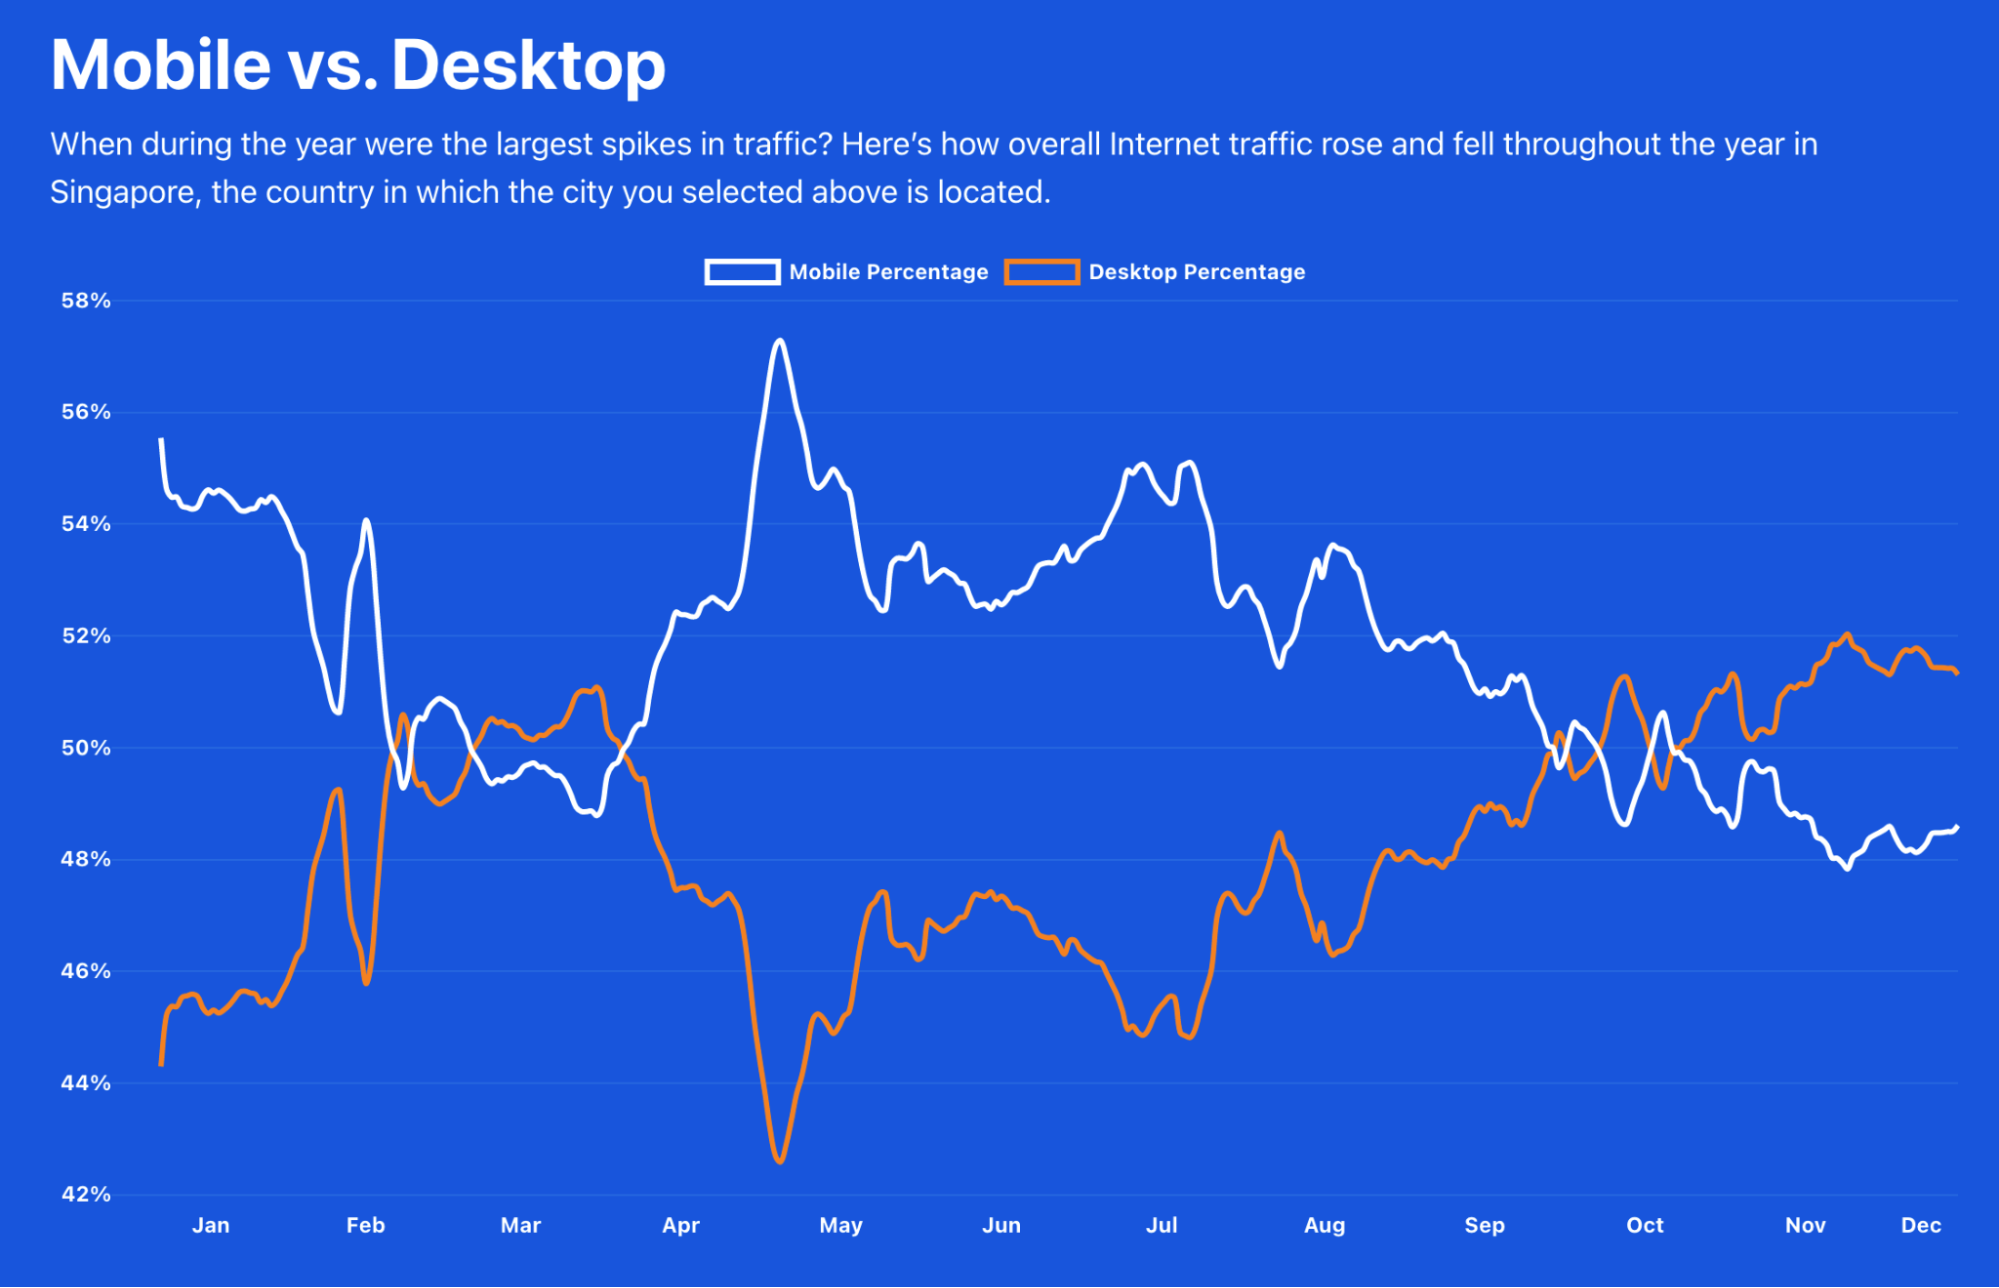
On our Year in Review page, you can also see the new mobile vs desktop traffic chart. The evolution of the importance of mobile traffic is different depending on the country.
For example, the United States has more desktop traffic throughout the year, but in 2021, during the Thanksgiving (November 25) week, mobile traffic took the lead for the first and only time in the whole year. We can also see that in July mobile traffic was also high in terms of relevance.
The UK has a similar trend, with June, July and August being the only months of the year when mobile traffic is prevalent compared to desktop.
If we go to the other side of the planet, to Singapore, there the mobile percentage is usually higher than desktop, and we see a completely different trend than in the US. Mobile traffic was higher in May, and desktop only went above mobile in some days of February, some in March, and especially after the end of October.
Where people accessed the Internet
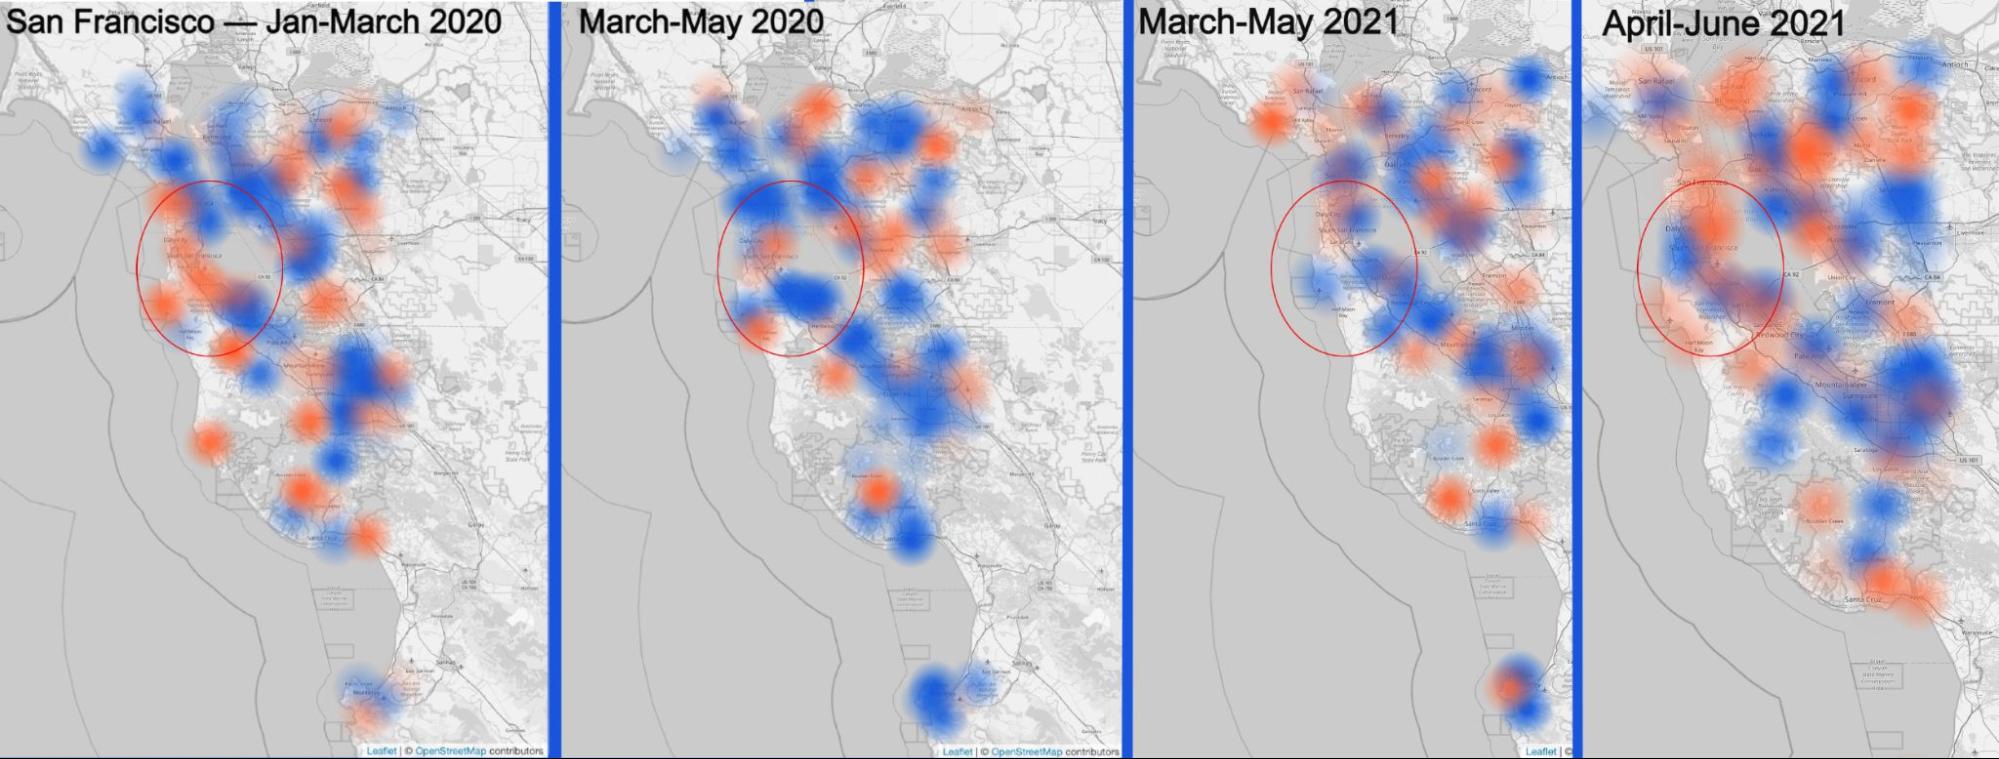
We also have, again, available the possibility of selecting a city from the map of our Year in Review to zoom into a city to see the change in Internet use throughout the year. Let’s zoom in on San Francisco.
The following agglomeration of maps highlights (all available in our Year in Review site) the change in Internet use comparing the start of 2020, mid-January to mid-March — you can see that there’s still some increase in traffic, in orange —, to the total lockdown situation of April and May, with more blue areas (decrease in traffic).
The red circles shows San Francisco and its surroundings (home of a lot of companies) in a map that compares working hours Internet use on a weekday between two months.
The same trend is seen already in May 2021 in a time when remote work continued to be strong — especially in tech companies (employees moved from the Bay Area). Only in June of this year, there was some increase in traffic (more orange areas), especially further away from San Francisco (in residential areas).
London: From lockdown to a Euro Championship final
London tells us a different story. Looking through the evolution since the start of 2020 we can see that in March (compared to January) we have an increase in traffic (in orange) outside London (where blue is dominant).
The Internet activity only starts to get heavier in June, in time for the kick-off of the 2020 UEFA European Championship. The tournament played in several cities in Europe had a lot of restrictions and a number of games were played in London at Wembley Stadium — where Italy won the final by beating England on penalties. But at the time of the final, July, and especially August, blue was already dominant again — so people seemed to leave the London area. Only in September and October did the traffic start to pick up again, but mostly outside the city centre.
The Summer Olympics impact? Tokyo with low activity
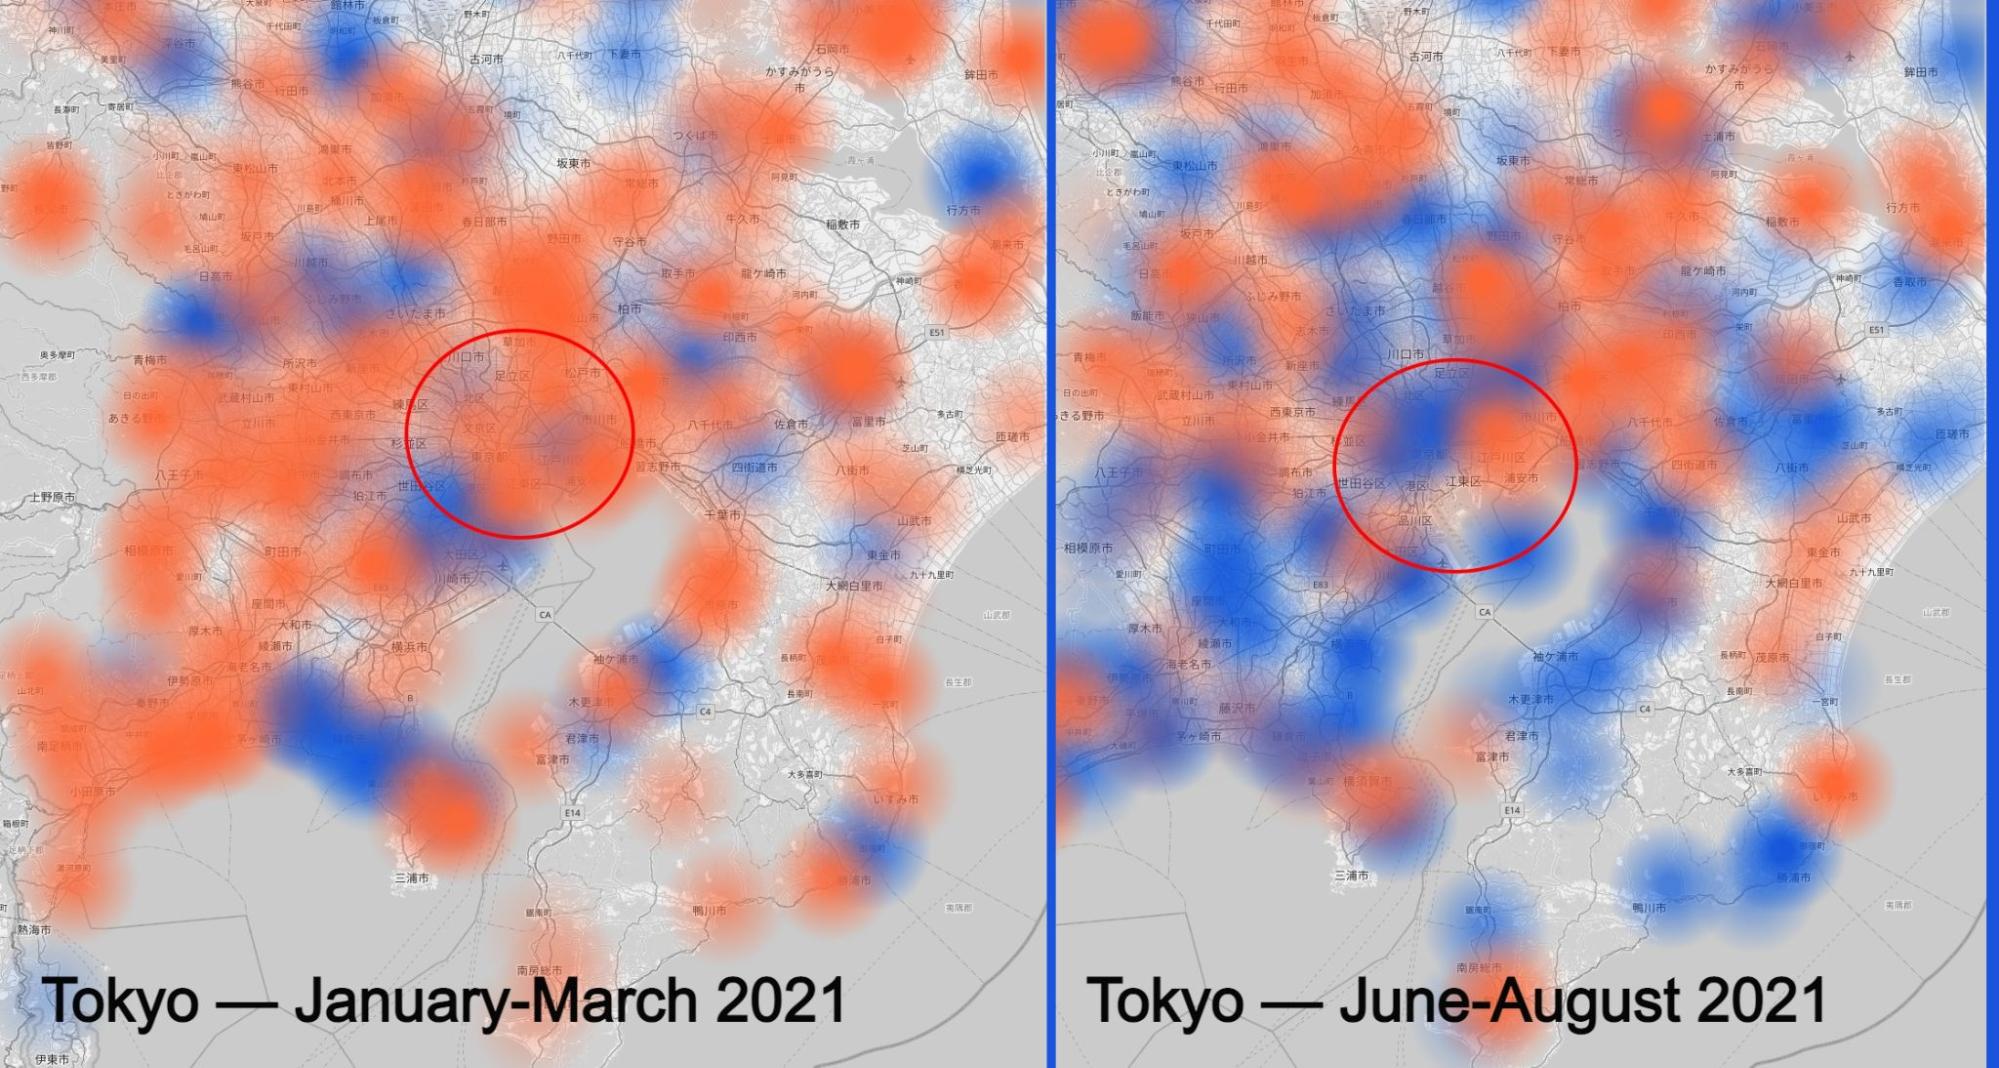
After the UEFA European Championship, came the other big event postponed back in 2020, the Tokyo Summer Olympics. Our map seems to show the troubled months before the event with the pandemic numbers and the restrictions rising before the dates of the major event — late July and the first days of August.
There were athletes, but not fans from around the world and even locals weren’t attending — it was largely an event held behind closed doors with no public spectators permitted due to the declaration of a state of emergency in the Greater Tokyo Area. We can see that in our charts, especially when looking at the increase in activity in March (compared to January) and the decrease in August (compared to June), even with a global event in town (Tokyo is in the red circle).
There’s also another interesting trend pandemic-related in Lisbon, Portugal. With the lockdowns put in place since mid-January, the comparison with March shows the centre of the city losing Internet traffic and the residential areas outside Lisbon gaining it (in orange in the animation). But in April the activity decreased even around Lisbon and only started to get heavier in May when restrictions were more a lot more relaxed.
Lockdowns bring more traffic to Berlin
A different trend can be seen in Berlin, Germany. Internet activity in the city and its surroundings was very high in March and in April (compared to the previous two months) at a time when lockdowns were in place — nonetheless, in 2020 the activity decreased in April with the first major lockdown.
But in May and June, with the relaxation in restrictions, Internet activity decreased (blue) giving the idea that people left the city or, at least, weren’t using the Internet so much. Only in August did Internet activity begin to pick up again, but decreased once more in the colder months of November and December.
Cyberattacks: Threats that came in July
In terms of worldwide attacks, July and November (the month of Black Friday, when it reached a 78% in increase) were definitely the months with the highest peak of the year. The biggest peak was at the beginning of July 2021, when it reached 82%. That was more than a month after the Colonial Pipeline ransomware cyberattack — May was also the month of an attack on part of Toshiba and, in the same week, the Irish health system and of the meat processing company JBS.
The week of December 6 (the same when the Log4j vulnerability was disclosed) also had an increase in attacks — 42% more, and there was also a clear increase (42%) in the beginning of October, around the time of the Facebook outage.
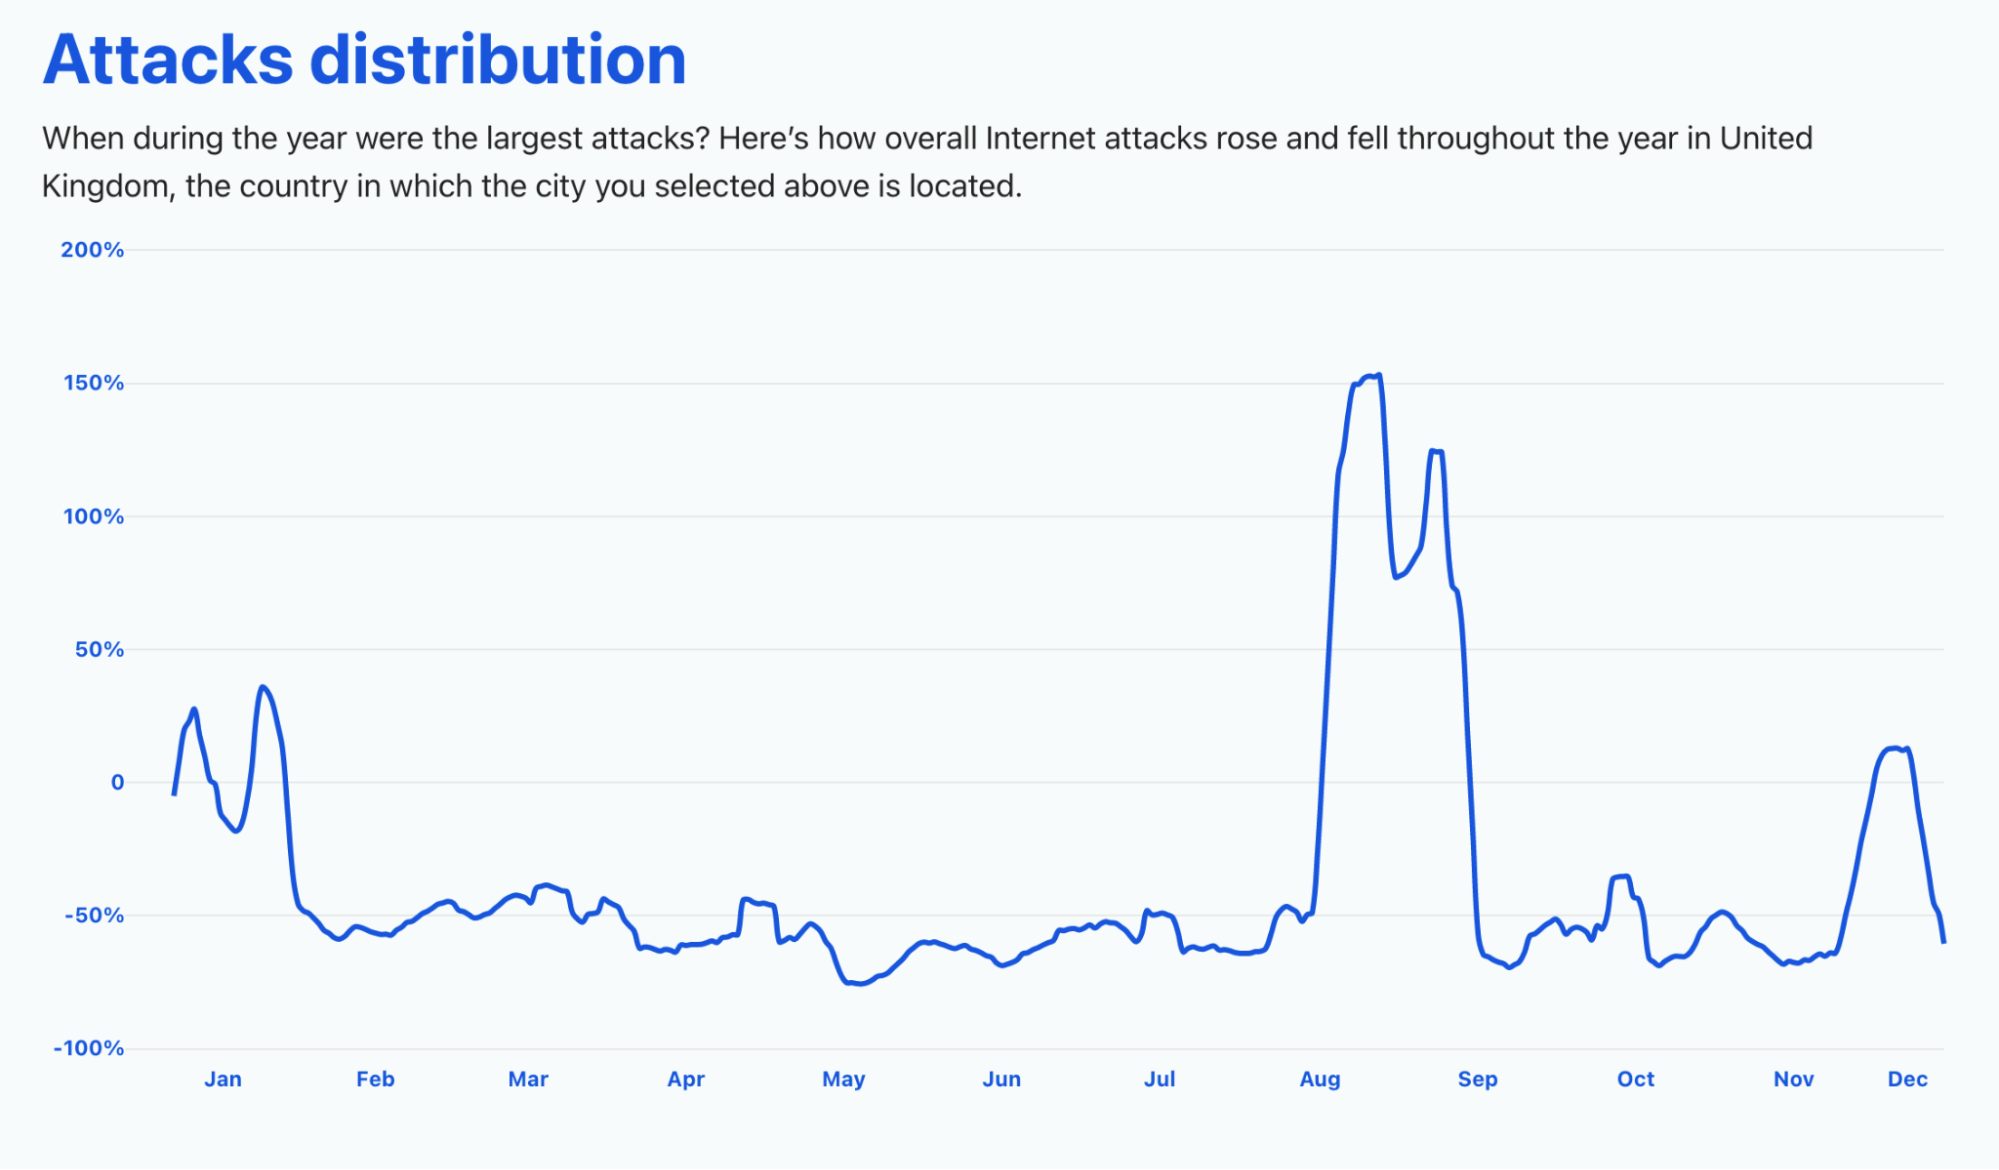
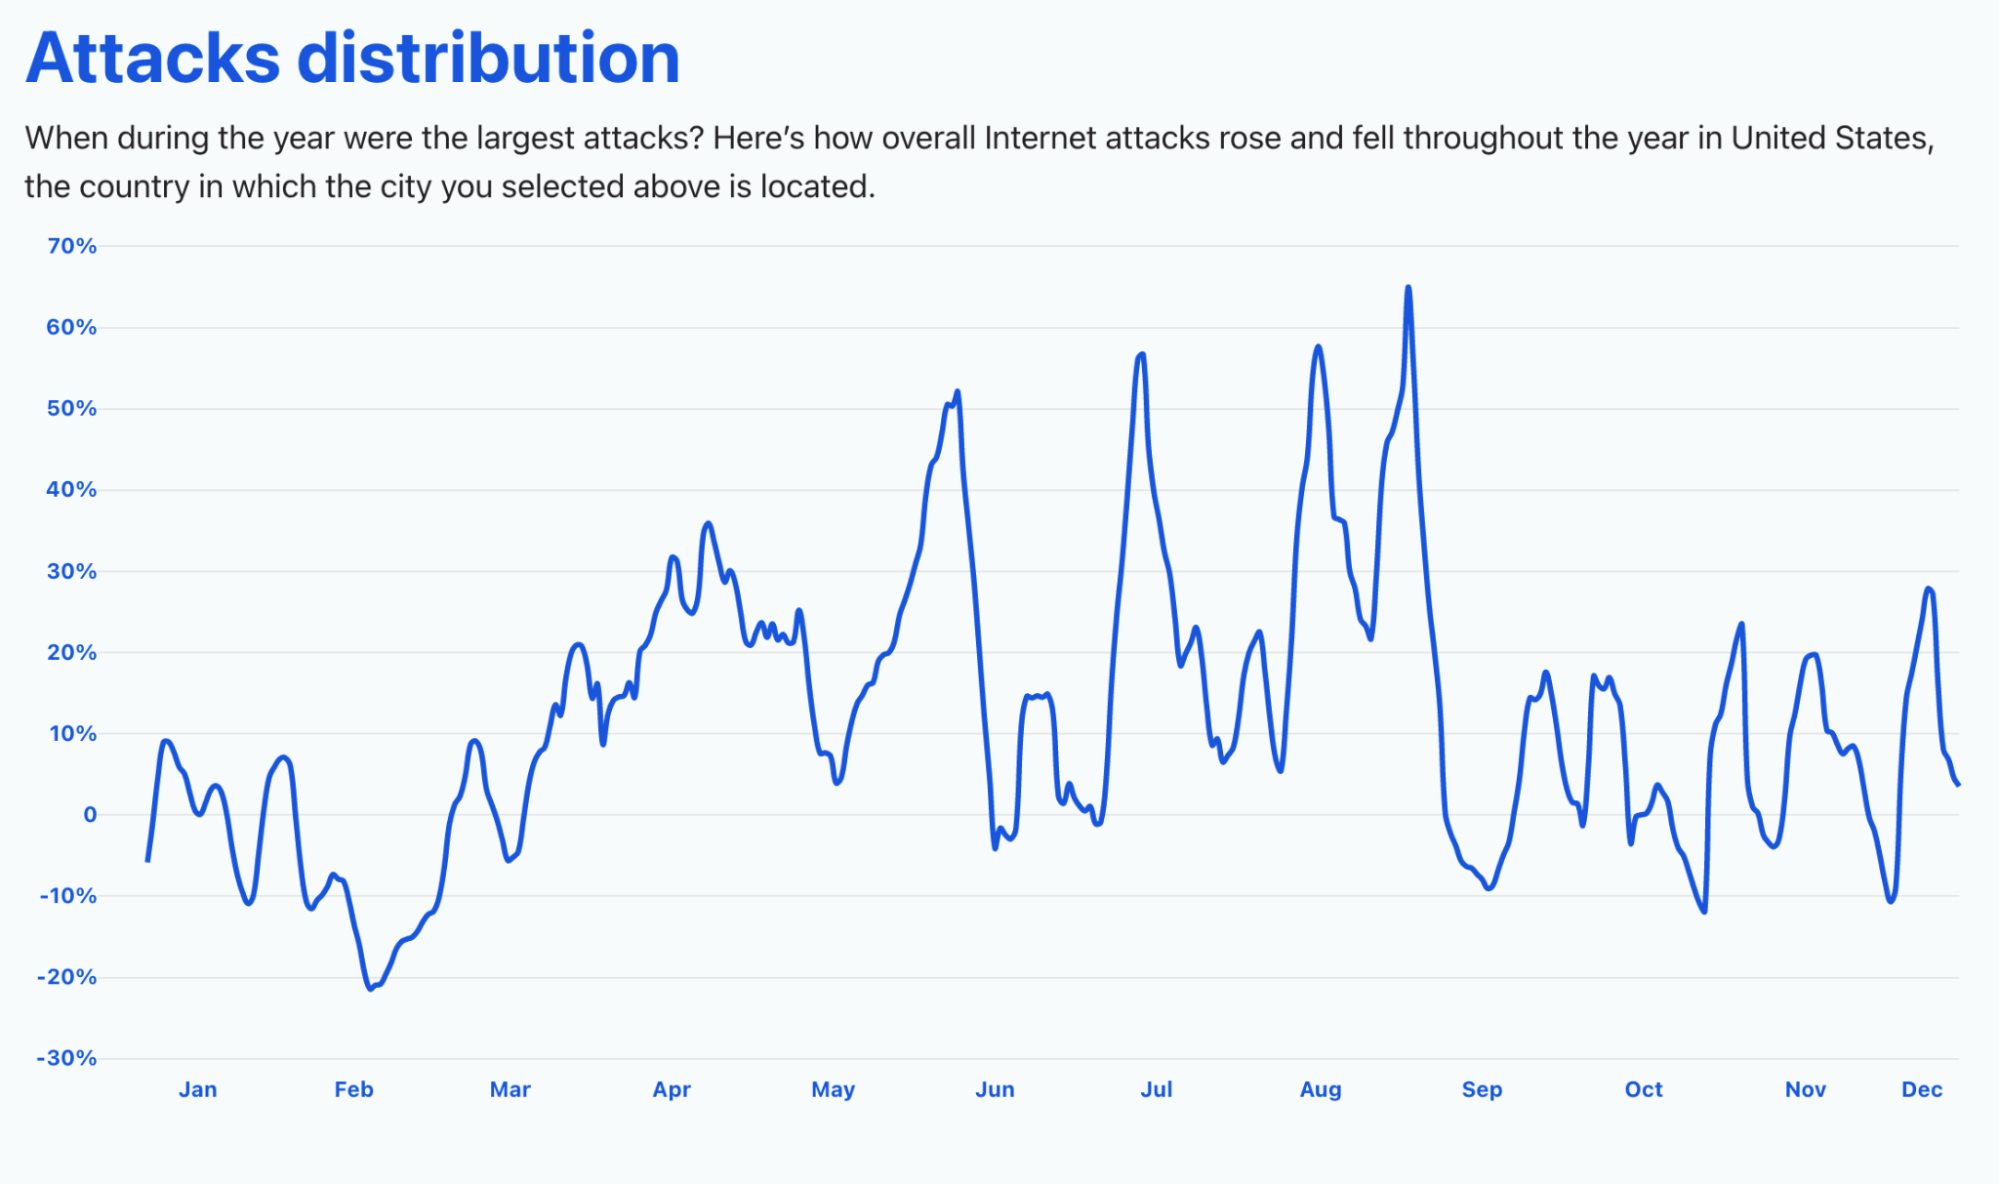
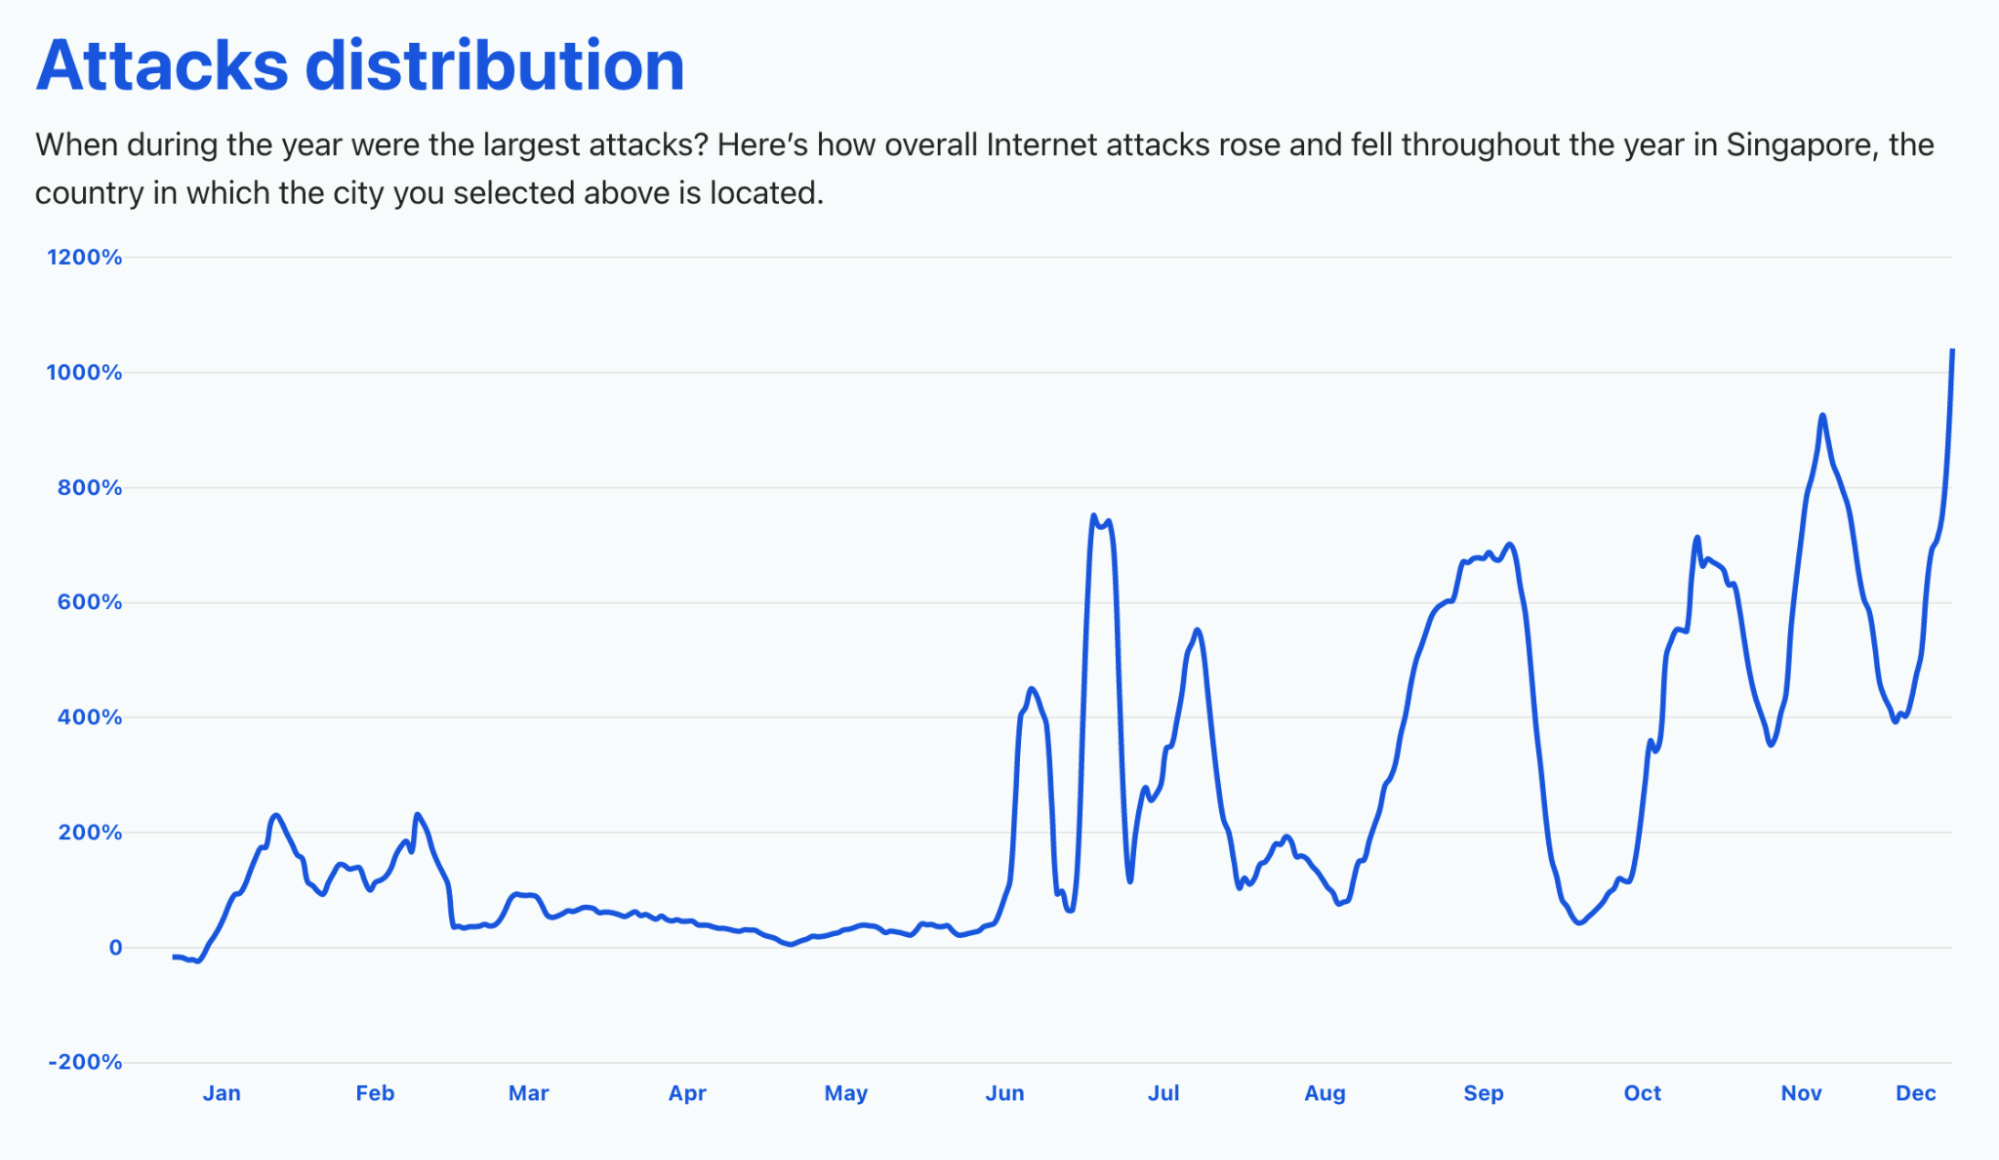
In our dedicated page you can check — for the first time this year — the attack distribution in a selection of countries.
The UK had a very noticeable peak in overall Internet attacks (a growth of 150%) in August and that continued through September. We already saw that the beginning of the year, because of lockdowns, also had an increase in Internet traffic, and we can also see an increase in attacks in January 2021, but also in late November — around the time of the Black Friday week.
The United States, on the other hand, saw a growth in threats that was more uniform throughout the year. The biggest spike was between August and September (a time when students, depending on the state, were going back to school), with 65% of growth. July also had a big spike in threats (58%), but also late May (48%) — that was the month of the Colonial Pipeline ransomware cyberattack. Late November also had a spike (29%).
Countries like France had their peak in attacks (420% more) in late September and Germany it was in June (425%), but also in October (380%) and in November (350%).
The same trend can be seen in Singapore, but with an even higher growth. It reached 1,000% more threats in late November and 900% in the same month, around the time of the famous Singles’ Day (11.11, on November 11), the main e-commerce event in the region.
Also in the region, Australia, for example, also saw a big increase (more than 100%) in attacks in the beginning of September. In Japan, it was more in late May (over 40% of growth in threats).
What people did online in 2021
Last year we saw how the e-commerce category jumped in several countries after the first major lockdown — late March.
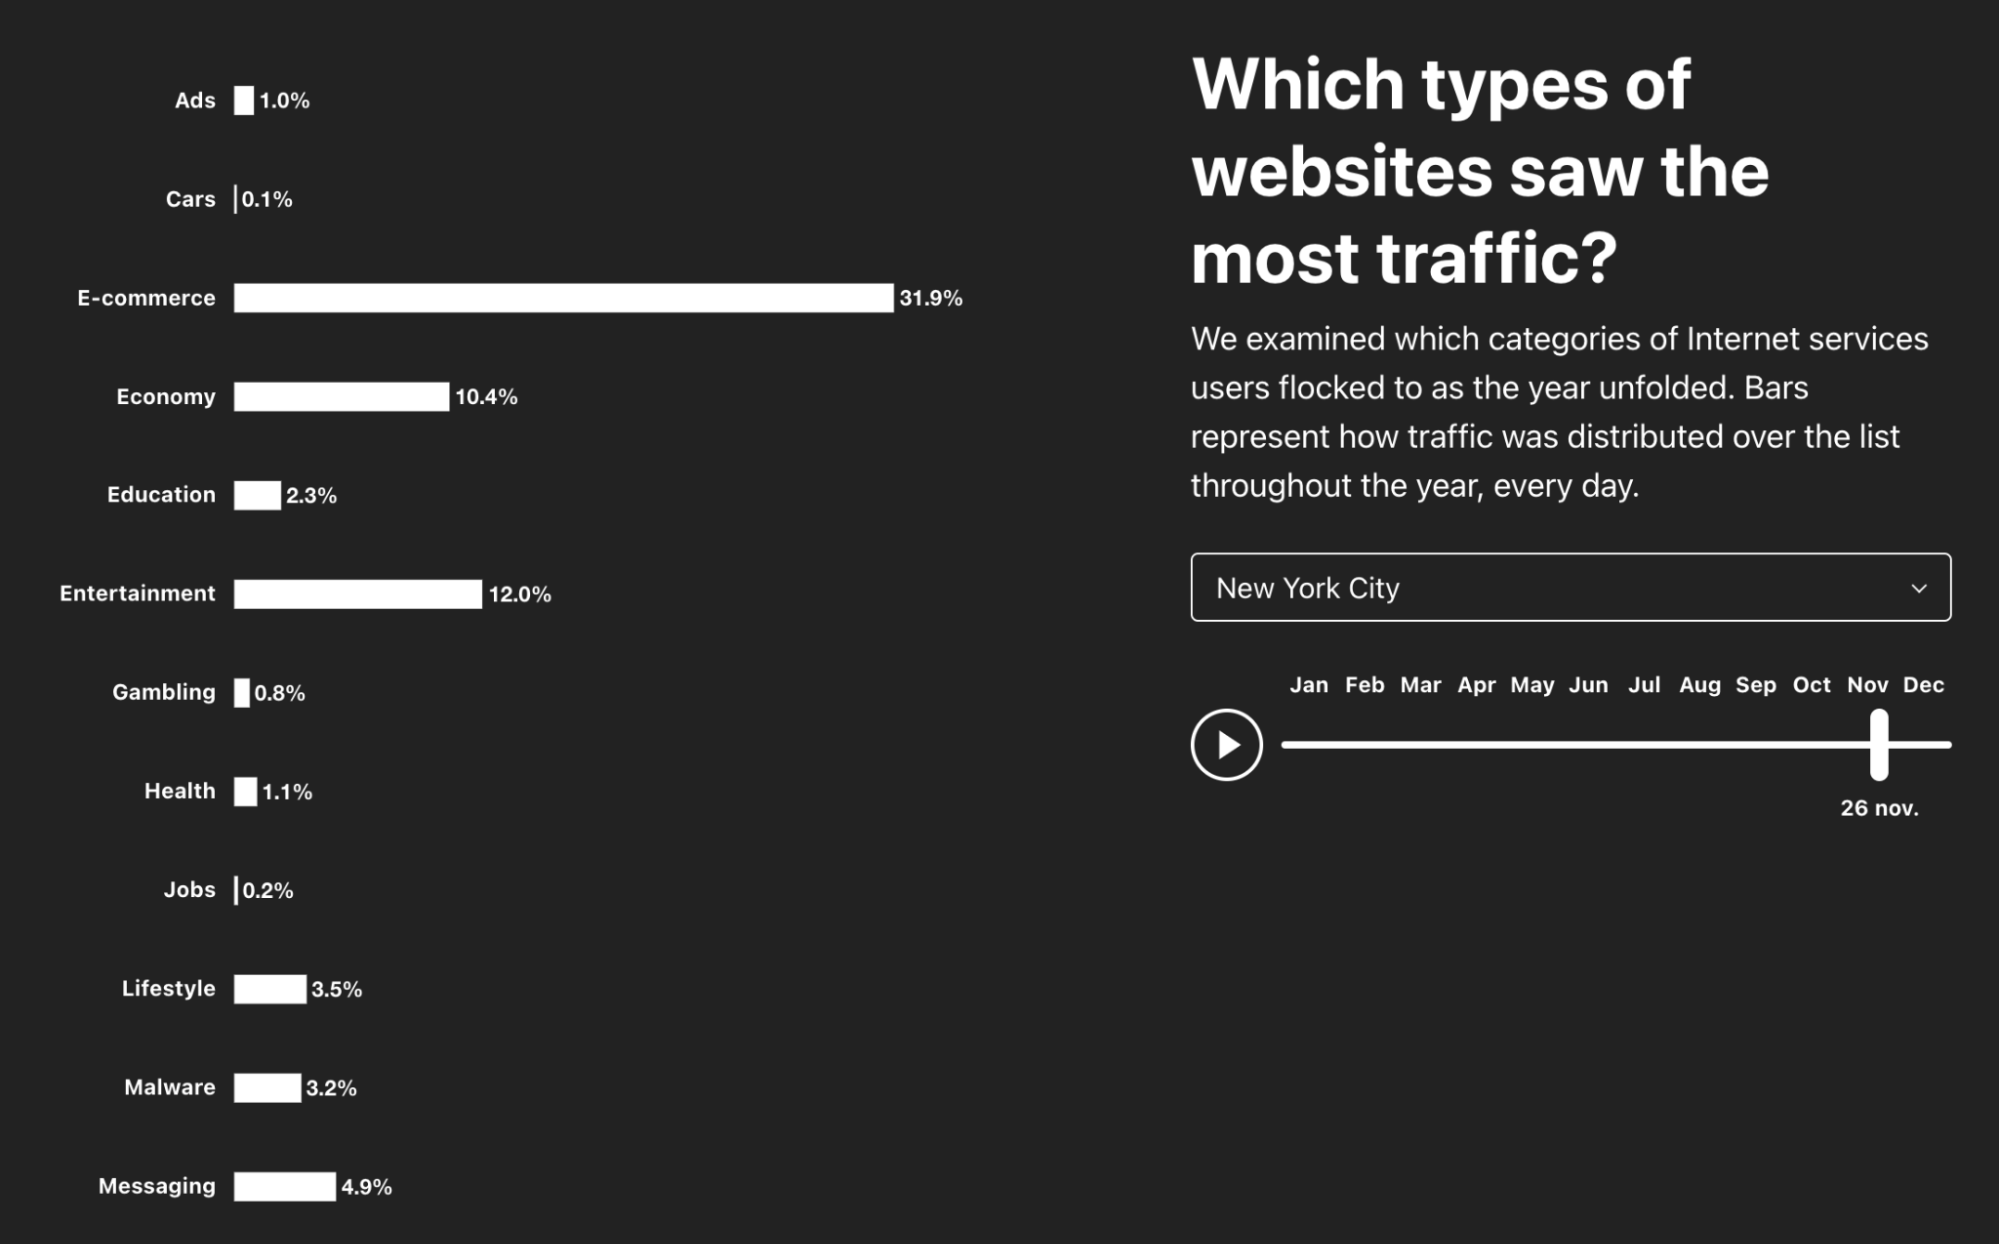
In New York, Black Friday, November 26, 2021, was the day of the whole year that e-commerce traffic peaked — it represented 31.9% of traffic, followed by Cyber Monday, November 29, with 26.6% (San Francisco has the same trend). It’s also interesting to see that in 2020 the same category peaked Black Friday, November 27, 2020 (24.3%) but April 22, during the first lockdowns, was a close second at 23.1% (this year the category only had ~14% in April).
Also with no surprise, messaging traffic peaked (20.6%) in the city that never sleeps on the first day of the year, January 1, 2021, to celebrate the New Year.
London calling (pre-Valentine messages)
But countries, cities and the people who live there have different patterns and in London messaging traffic actually peaks at 21.5% of traffic on Friday, February 12, 2021 (two days before Valentine’s Day). While in London, let’s check if Black Friday was also big outside the US. And the answer is: yes! E-commerce traffic peaked at 20.7% of traffic precisely on Black Friday, November 26.
The pandemic also has an influence in the types of websites people use and in London, travel websites had the biggest percentage in traffic on August 8, with only 1.4% — in Munich it was 1.1% on August 11. On the other hand, in New York and San Francisco, travel websites always had less than 1% of traffic.
Going back to Europe, Paris, France, saw a different trend. Travel websites had 1.9% of traffic on June 7, 2021, precisely the week that the pandemic restrictions were lifted — France opened to international travelers on June 9, 2021. The “City of Light” (and love) had its biggest day of the year for messaging websites (24.4%) on Sunday, January 31 — a time when there were new restrictions announced to try to avoid a total lockdown.
The hacker attack: 2021 methods
Our Year in Review site also lets you dig into which attack methods gained the most traction in 2021. It is a given that hackers continued to run their tools to attack websites, overwhelm APIs, and try to exfiltrate data — recently the Log4j vulnerability exposed the Internet to new possible exploitation.
Just to give some examples, in Paris “faking search engine bots” represented 48.3% of the attacks selected for the chart on January 14, 2021, but “SQL Injection” got to 59% on April 29.
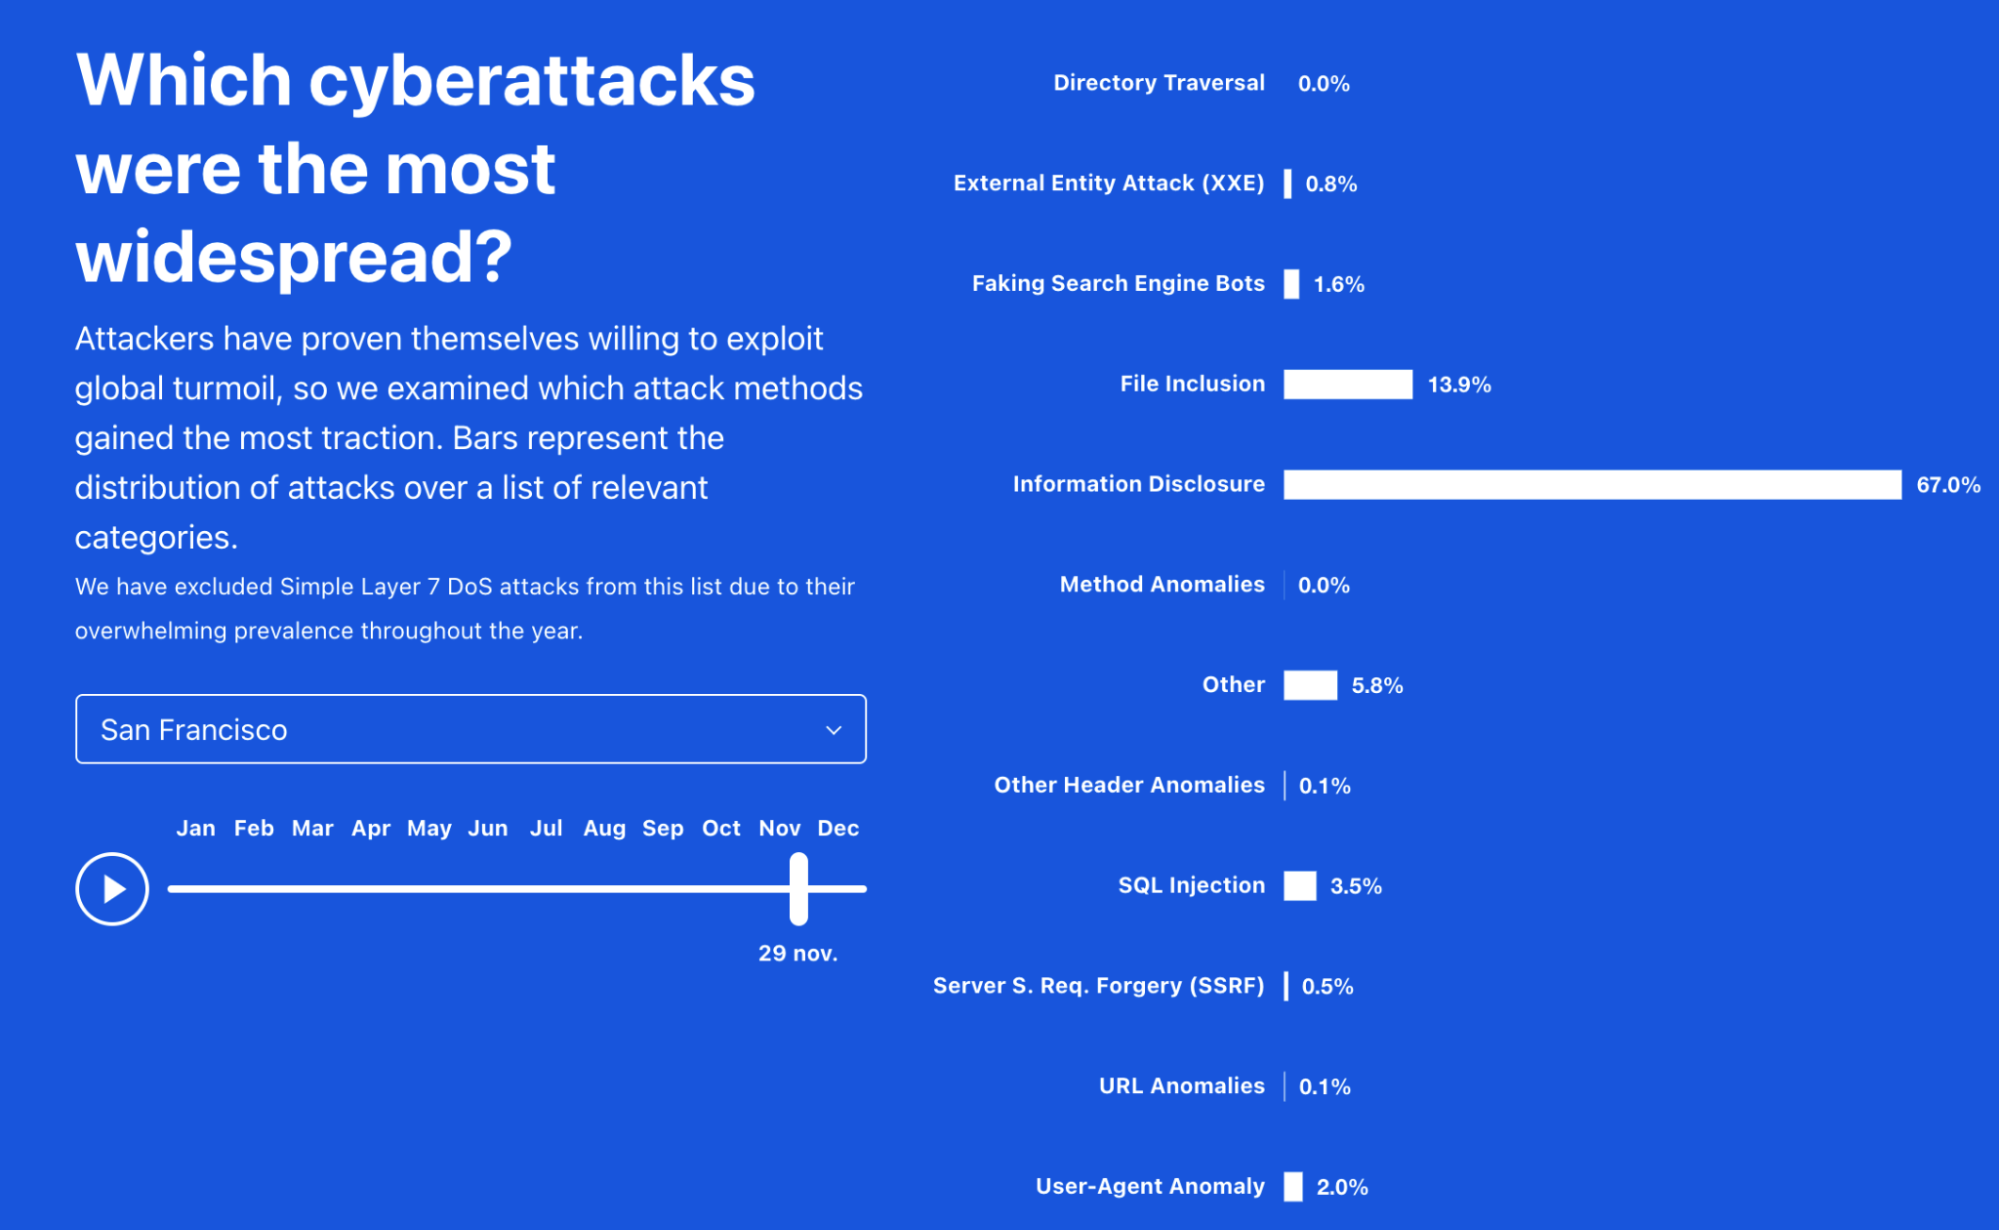
Cyberattacks distribution throughout the year in San Francisco
In London “User-Agent Anomaly” was also relevant in some parts of the year, but in San Francisco it was mostly “information disclosure” that was more prevalent, especially in late November, at a time when online shopping was booming — in December “file inclusion” vulnerability had a bigger percentage.
Now it’s your turn: explore more
To explore data for 2021 (but also 2020), you can check out Cloudflare Radar’s Year In Review page. To go deep into any specific country with up-to-date data about current trends, start at Cloudflare Radar’s homepage.
So, if you like to keep up with the tradition in the United States you and your family yesterday (November 25, 2021) celebrated Thanksgiving. So on a special day, with family gatherings for many and with a lot of cooking if you’re into the tradition (roast turkey, stuffing and pumpkin pie), it makes sense that different Internet patterns show up on Cloudflare Radar.
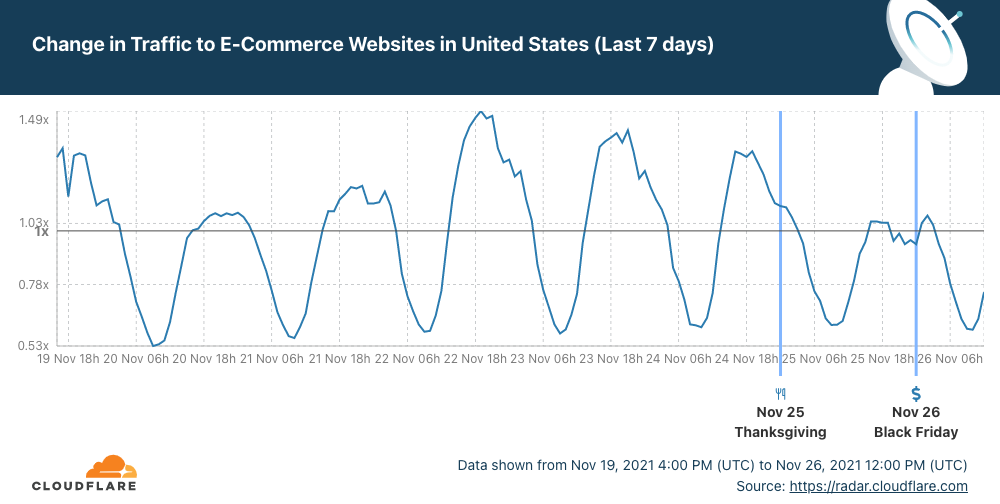
First, let’s look at shopping habits. After a busy Monday, Tuesday and Wednesday, online shopping paused for Thanksgiving Day and dipped at lunchtime. So in a very good week for e-Commerce, Thanksgiving was an exception, especially at the extended lunchtime.
Now, let’s focus on Internet traffic at the time of the Thanksgiving Dinner. First, what time is that? Every family is different, but a 2018 survey of US consumers showed that for 42% early afternoon (between 13:00 and 15:00 is the preferred time to sit at the table and start to dig in). But 16:00 seems to be the “correct time” — The Atlantic explains why.
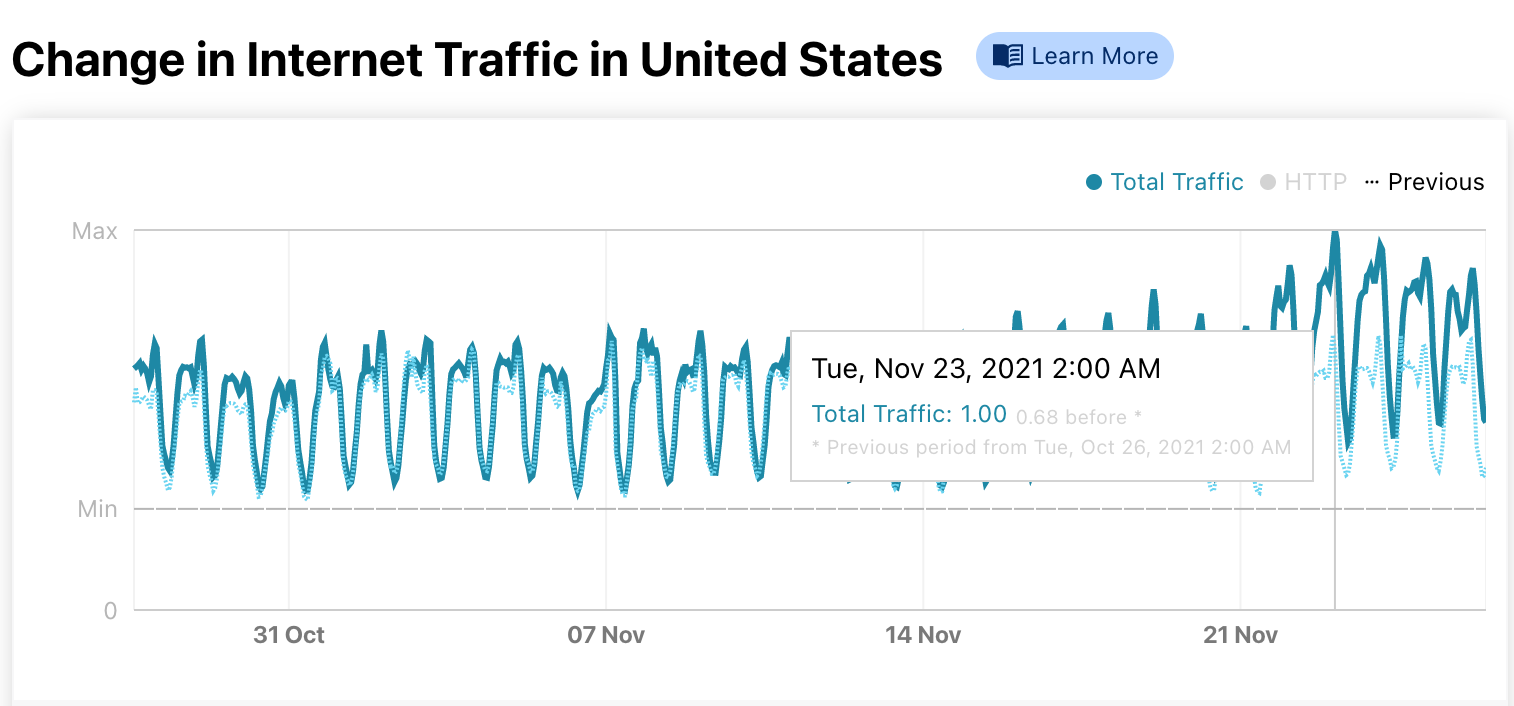
Cloudflare Radar shows that Internet traffic in the US increased this past seven days, compared with the previous period, and that makes sense given that it’s traditionally a good week for online shopping. But we can also see in the next chart that the time of Thanksgiving dinner in the continental US was a clear exception.
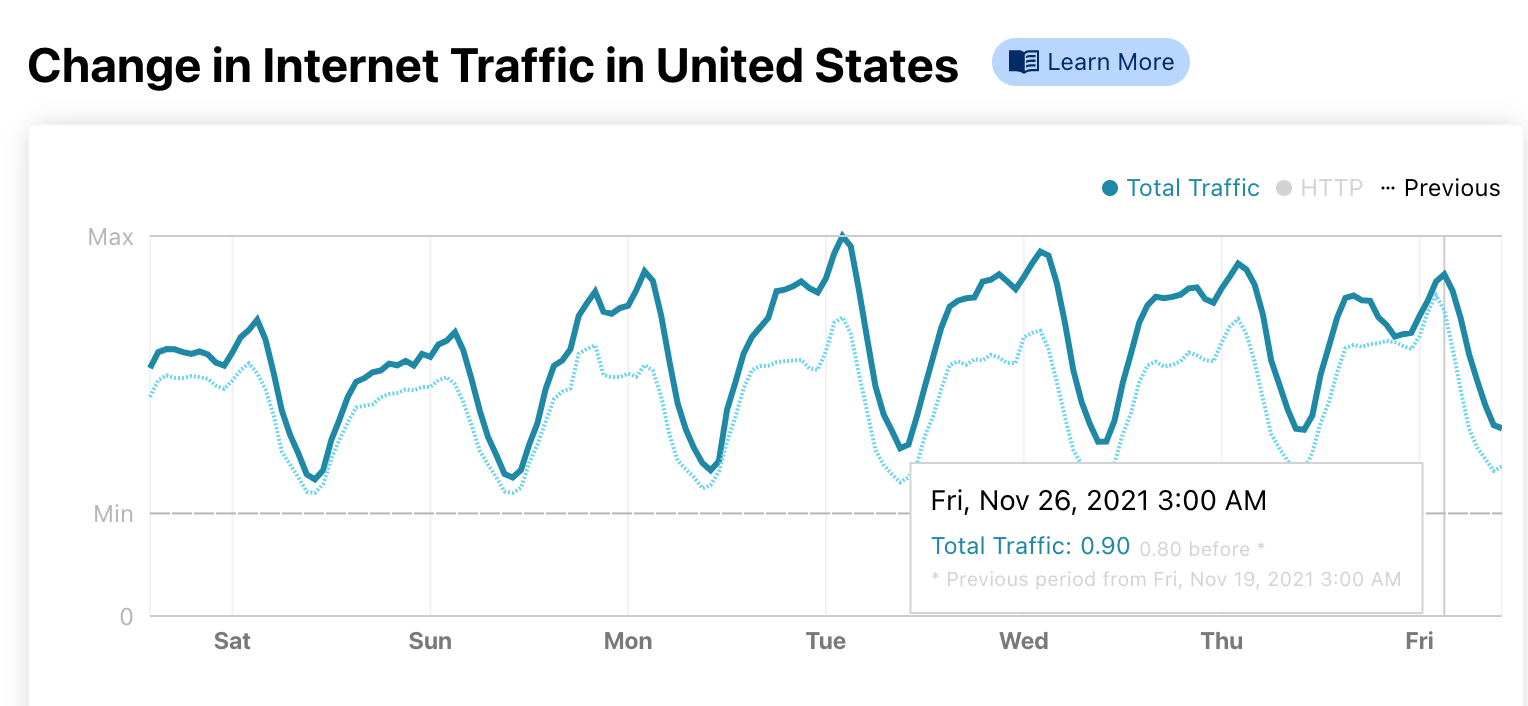
The circle in red in the chart clearly shows us that yesterday afternoon in the US the Internet traffic was a lot slower than the previous days at the same time and that’s more evident between 21:00 and 01:00 UTC (we use that as a standard timezone in Radar). That time period is “translated” for the East Coast between 16:00 and 20:00 EST and for the West Coast the time between 13:00 to 17:00 PST.
Internet traffic is going up
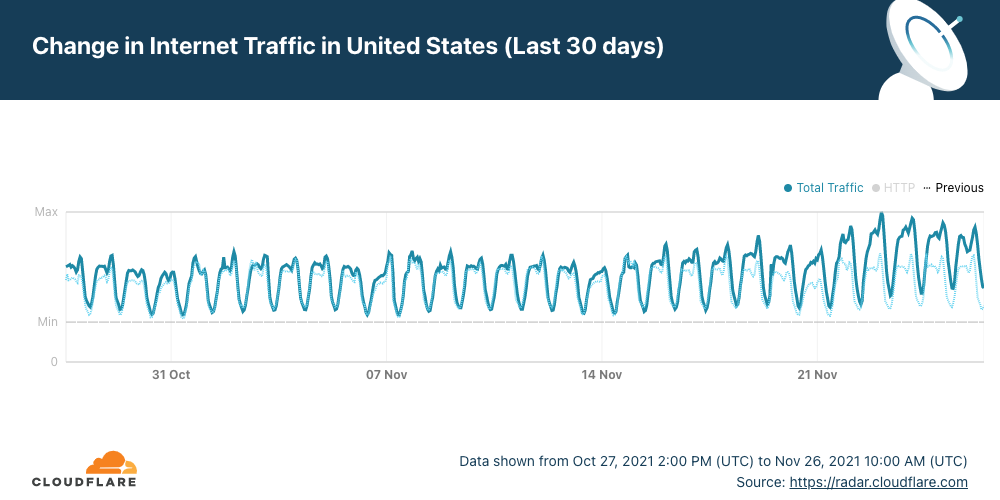
We can also use Cloudflare Radar to see that in the last two weeks Internet traffic in the US has been increasing (compared with the same period of the previous month). In a time of the year when temperatures go down, Internet traffic was definitely going up. That’s more evident this week after Sunday, November 21.
The biggest spike of the last 30 days, so far (maybe today, Black Friday, November 26, will change that — you can see the live trends using Radar), was definitely in the evening of Monday, November 22 (~02:00 UTC, November 23). This past Tuesday night, November 23, was the second day of the month with the highest traffic in the US, and the third day was actually the next day (Wednesday, November 24).
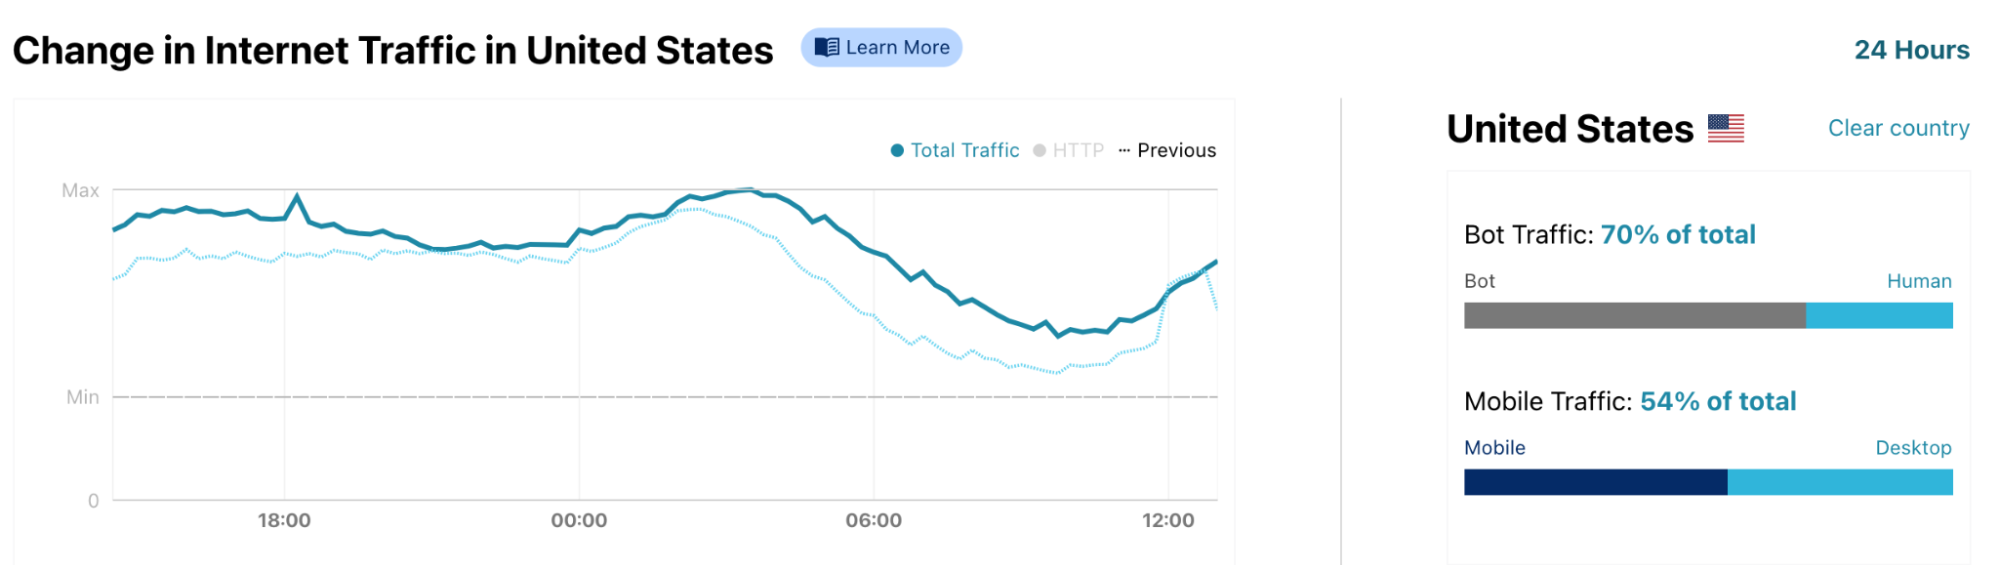
We can also see on Radar (represented in the next chart) that after several days of the Internet traffic peaks being reached at around 02:00 UTC (which “translates” to 21:00 EST and 18:00 PST), this Thanksgiving Day it was reached later, at about 03:00 UTC (22:00 EST and 19:00 PST).
Mobile traffic goes up in the busiest online week of the month
Another interesting trend regarding Thanksgiving week in the US is how there are more people this week using mobile devices to access the Internet than in the previous weeks.
Yesterday, November 25, mobile traffic represented 54% of the Internet traffic in the US. That’s 8% more than the usual 46% of mobile traffic percentage in the US that we registered in the last 30 days — in the last seven days that number goes up to 49%.
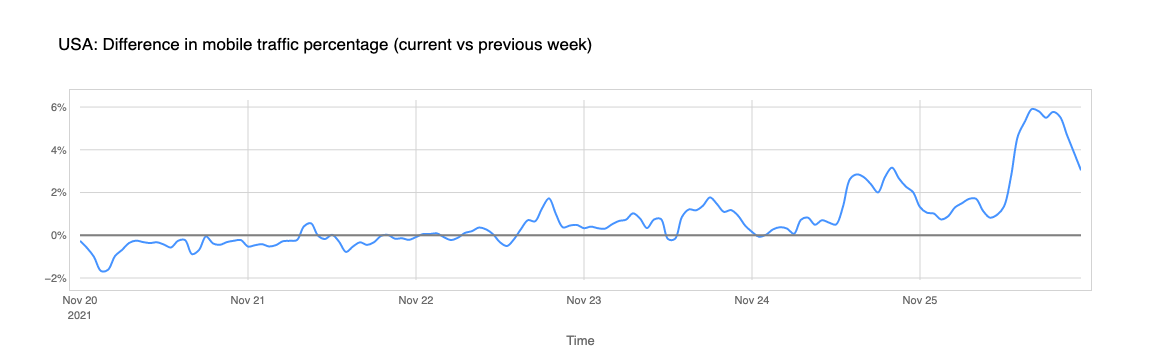
We can actually see this more clearly when we only focus on mobile traffic. This past Thursday, Thanksgiving Day, the mobile traffic percentage in the US increased by about 6% compared to the previous week:
Conclusion
When we announced Cloudflare Radar, back in September 2020, we explained how Internet use follows patterns that humans create. Throughout the pandemic we saw different trends caused by people being more at home than usual, but Internet patterns also change at specific times of the year (like when students go back to school or when it’s colder outside) or on some holidays like Thanksgiving.
Like we saw in the US yesterday, a holiday can affect Internet traffic as a whole, but also the time of the day we are online most, the devices we use to access the Internet and the types of websites we visit (e-commerce websites are getting an increase in traffic this week).
And remember: you can keep an eye on Cloudflare Radar to monitor how we see Internet traffic globally and in every country.
For many (especially in the Northern Hemisphere, where about 87% of humans live), September is the “get back to school” (or work) month after a summer break and that also reflects changes in the Internet traffic, particularly in mobile usage.
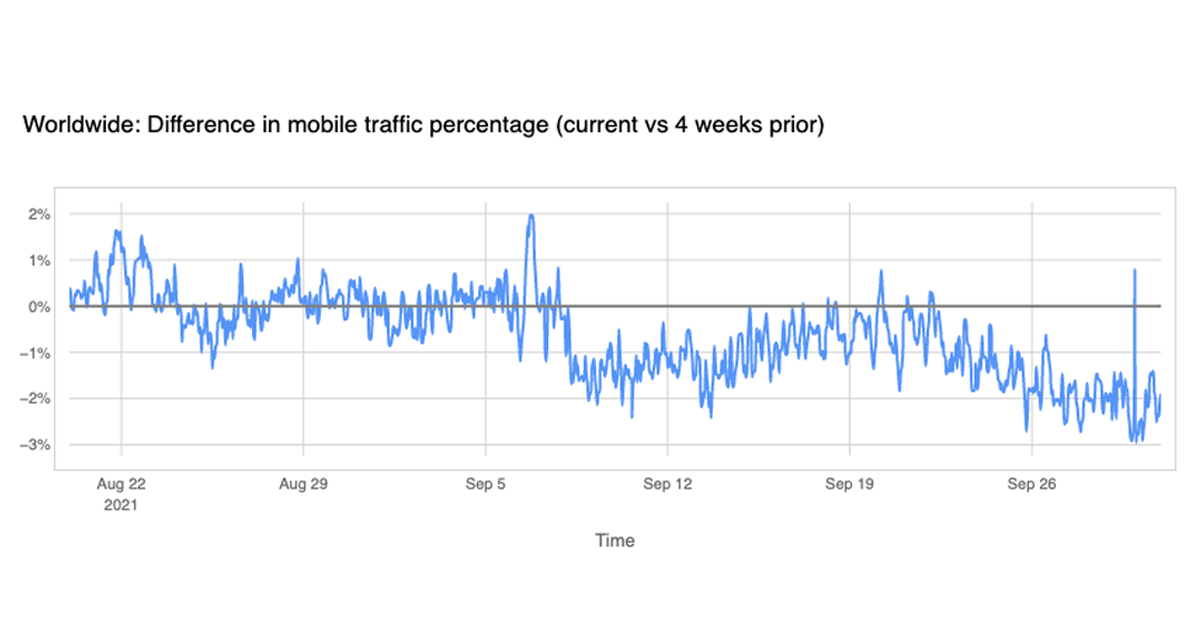
Looking at our data (you can see many of these insights in Cloudflare Radar) there’s a global trend: mobile traffic lost importance (compared with desktop traffic) in September. The next chart shows there was less percentage of Internet traffic from mobile devices after Monday, September 6, 2021, with a difference of -2% in some days, compared with the previous four weeks (August), and in late September it’s more than -3%.
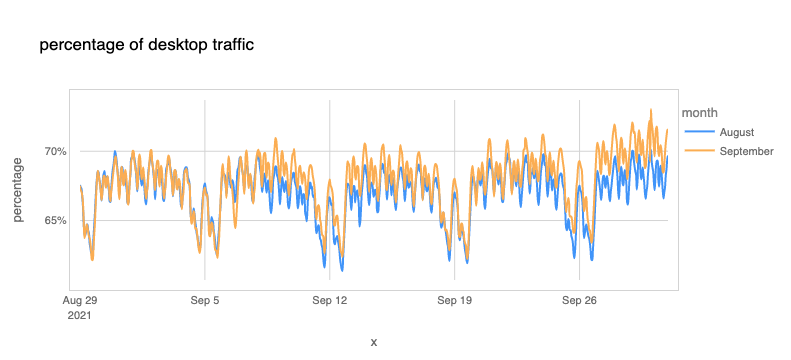
We can also see that the percentage of desktop traffic increased in September compared to August (we compare here to complete weeks between both months because there are significant differences between weekdays and weekends).
A few of weeks ago, we saw there are considerable differences between countries regarding the importance of mobile usage. Getting back to work (or office hours) usually means an increase in desktop traffic. In that blog we highlighted the advantages that mobile devices brought to developing countries — many had their first contact with the Internet via a smartphone.
Different calendars to consider
Looking at September 2021, those shifts in Internet trends are more dependent on countries that start their school period at this time of the year and also there are the COVID lockdowns effects (more limited this year) to consider.
In the Northern Hemisphere, many countries start school in September after a break during the summer.
Europe: Back to school brings less time to be mobile
Europe is mostly coherent, and it is easier to check for mobile traffic patterns there. Most countries start school in the first 14 days of September, although Finland, Norway, Sweden and Denmark start in late August (like some states in the US, for example).
There are some countries in Europe where the mobile traffic went down in September more clearly (the overall picture in the continent is similar to the worldwide situation we described). Poland, Malta, Portugal, Italy, Spain registered a drop in specific periods of a few days in September of more than 5% in the mobile traffic percentage of the total Internet traffic.
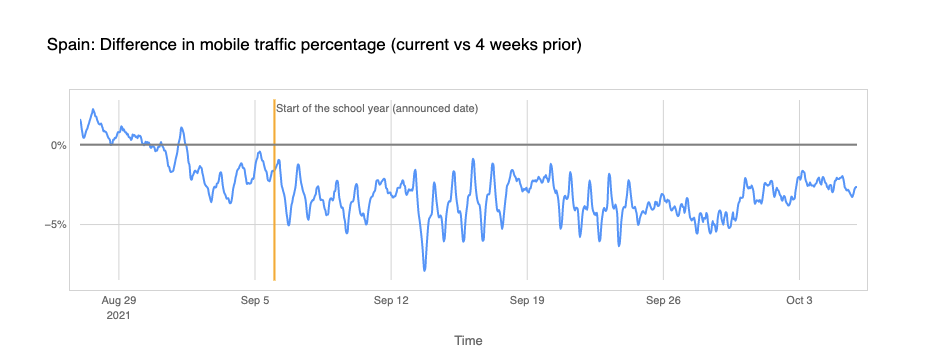
Let’s ‘travel’ to Spain, a country where mobile traffic usually represents 45% of Internet traffic (in August this number was higher). Spanish schools officially opened for the new school year on Monday, September 6, and mobile traffic percentage lost more than 5% of its importance in some days of that week, a trend that grew the following week.
Portugal: A public holiday makes mobile usage go up
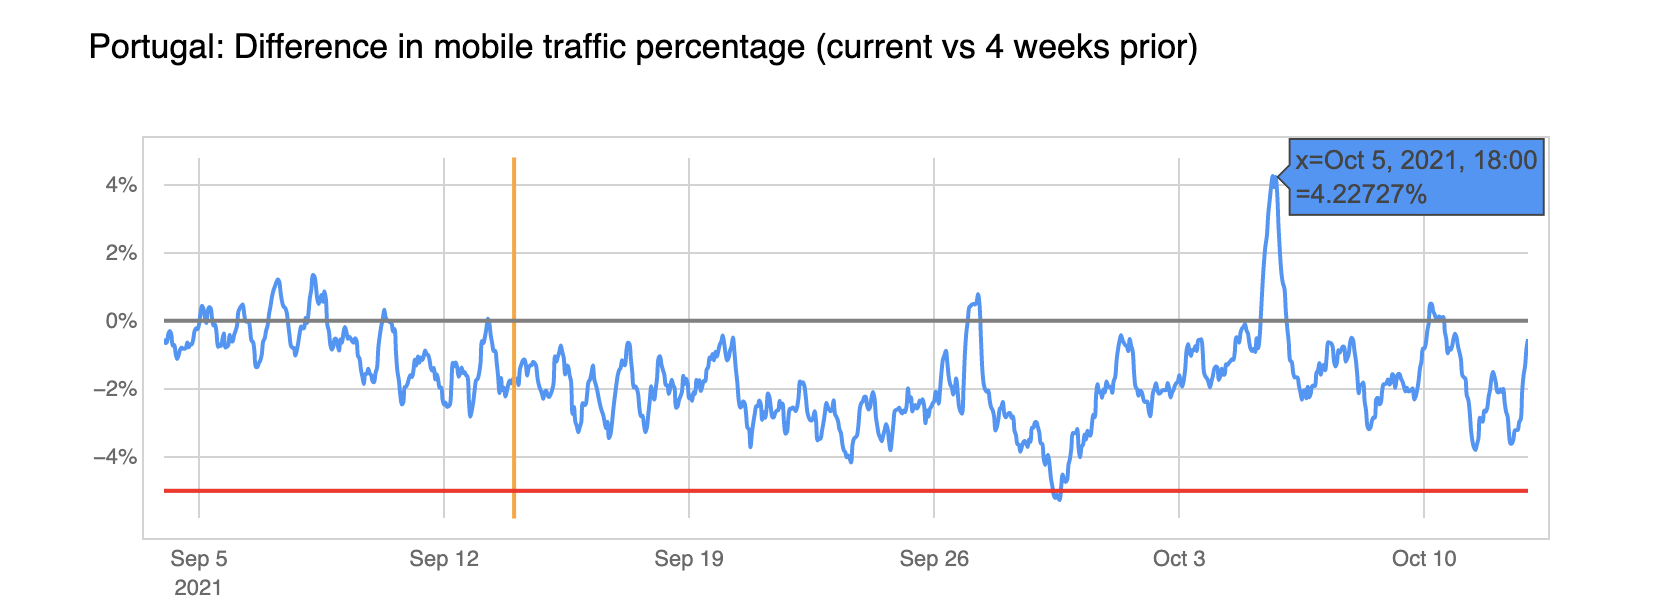
Portugal shows the same trend as other European countries but as shown in the following chart there was an apparent increase in mobile traffic percentage on October 5, 2021.
That Tuesday, Cloudflare’s Lisbon office was closed; the same happened across the country because it happens to be a public holiday, Republic Day. With most people not having to work in the middle of the week, the percentage of mobile traffic has risen (most visible at 19:00 local time).
Downs and ups
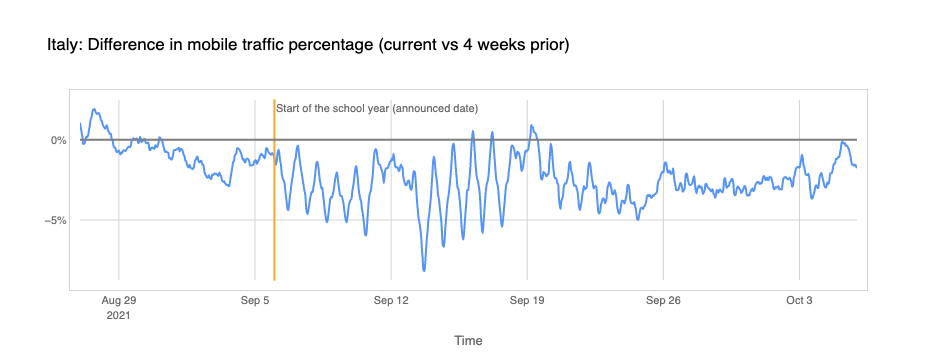
In Italy, we can see the same pattern, and it was also in the second week of school that mobile traffic percentage went down up to 8%. But by the end of September, it began to normalise to the values of the end of August.
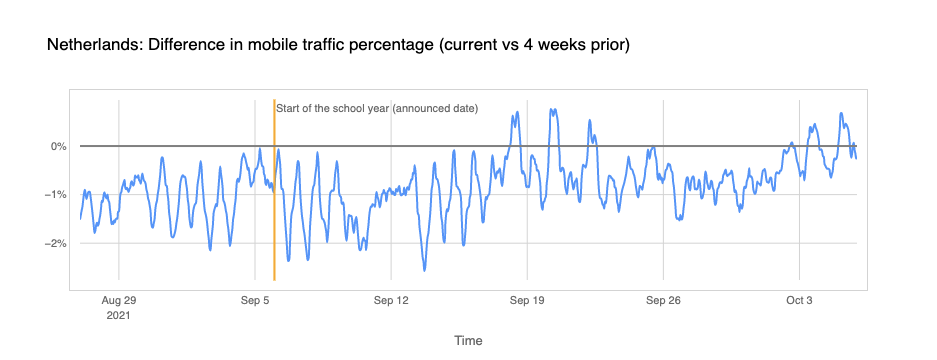
The trend of mobile traffic going back to having the same level as late August is more clear in the Netherlands.
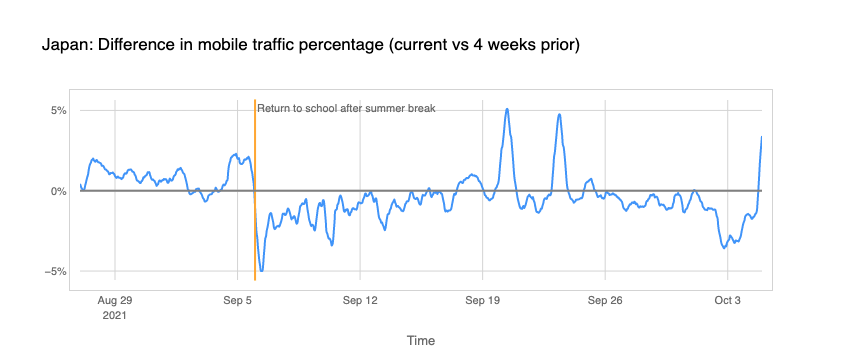
Japan, where the school year starts in April, but there’s a summer break through July and August (this year there were changes related to COVID), also shows the same trend of a decrease in mobile traffic that we saw in the Netherlands after school returned on September 6, 2021.
US: Start of the school year influenced by COVID
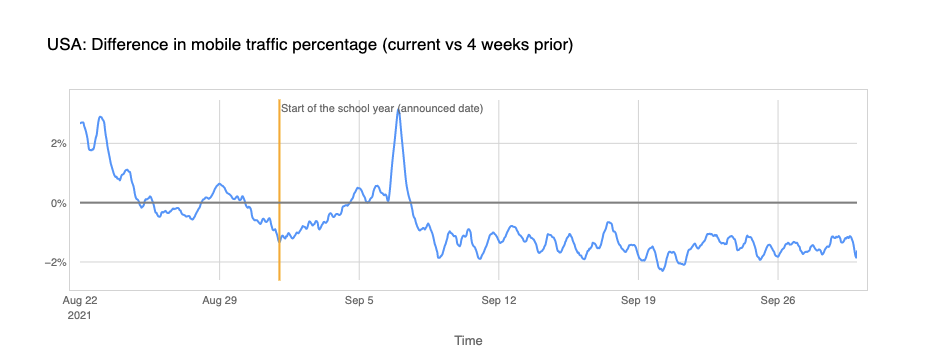
The United States had an atypical start of the school year because of COVID. Many states pushed the return to school from August to September (New York City started on September 13), and there were several schools with online classes because of the pandemic, but there’s also a drop in mobile traffic percentage, especially after Monday, September 6.
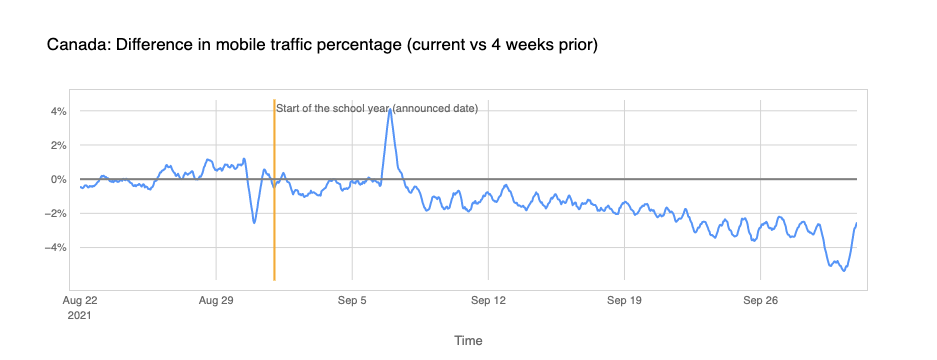
Further north of the continent, Canada (the school year officially started on September 1) saw mobile traffic lose more of its importance after September 6, a trend that grew by the end of the month.
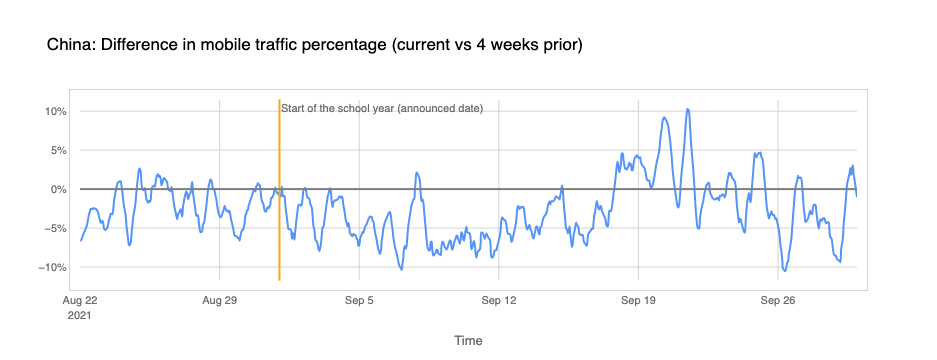
China saw a decrease in mobile traffic percentage right away in the beginning of September (when the school year started), but mobile recovered in the last week of the month.
Russia with different patterns
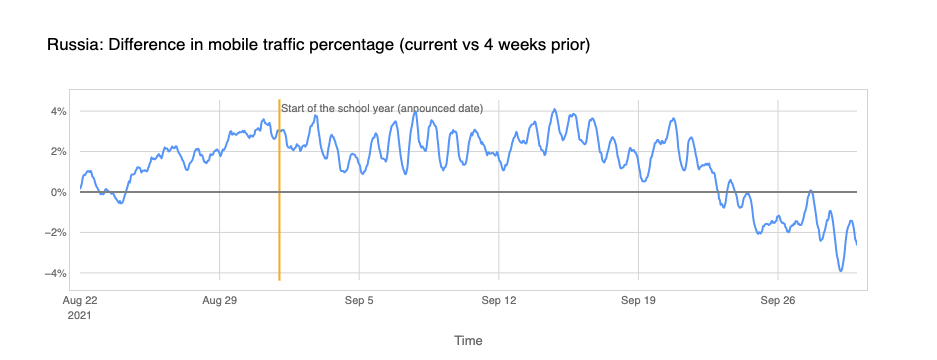
Then there are countries with trends that go the other way around. Russia saw an increase (and not a decrease like in most countries of the Northern Hemisphere) in mobile traffic percentage a few days before the school year. But news reports show that many schools were closed because of COVID and only started to open by September 20 (the next chart shows precisely a decrease of mobile traffic percentage in that week.
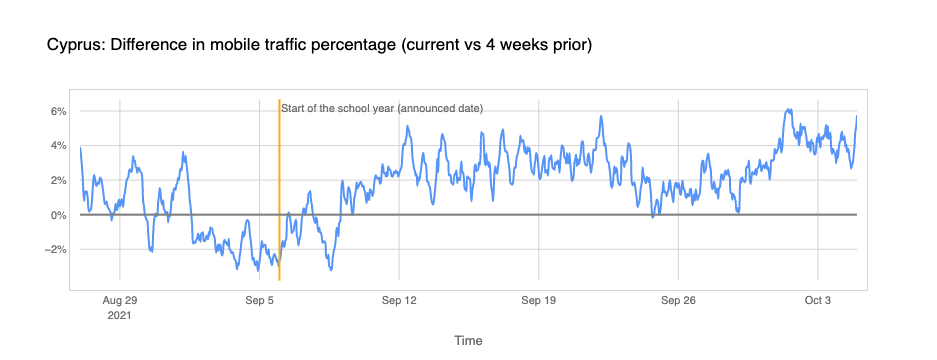
The same trend is observed in Cyprus — the only EU country where mobile traffic percentage increases after the first week of school. That could be related with some school closures in the past few weeks COVID related.
Nigeria: COVID impact
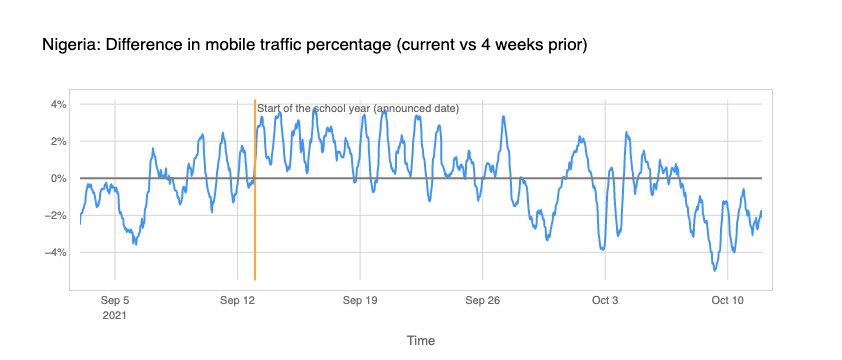
When we go to Africa, Nigeria is just above the Earth’s equator line and is the most populous country on the continent (population: 206 million), and the school year was officially scheduled to start on September 13. But reports from UNICEF show that school reopening was postponed a few weeks because of the pandemic situation in Nigeria.
This seems to go along the same lines as our data shows: mobile traffic percentage grew on the week of September 13 and only started to come down by the end of September and the beginning of October.
Conclusion: September, September, the back to school/work centre
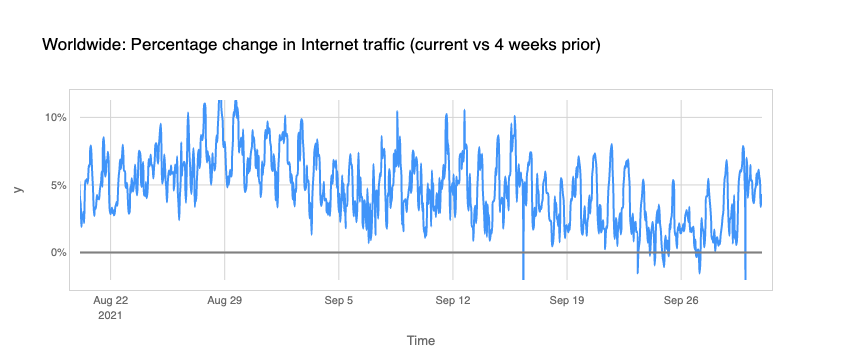
September brings shifts in the Internet traffic trends that seem to have an impact on the way people access the Internet and that goes beyond mobile usage, we can also see that worldwide: the Internet traffic percentage grew significantly — some days more than 10% — in September compared to August (like the graph shows).
It’s not that surprising when you realise that most people on Earth live in the Northern Hemisphere, where August is a summer and vacation month for many – although countries like India have the rainy monsoon season in August and Mid-September before autumn, for example. So September is not only the month wherein some countries students go back to school, but also when many go back to work.
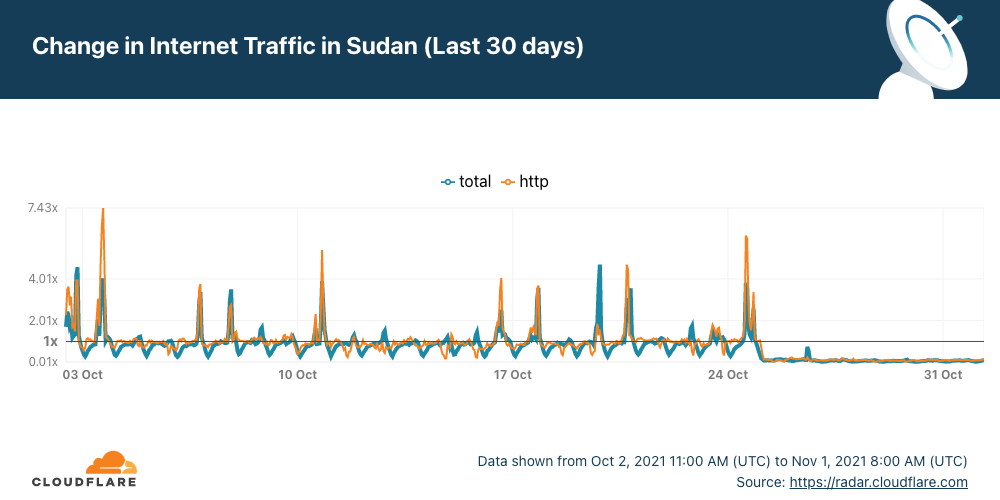
It’s not every day that there is no Internet access in an entire country. In the case of Sudan, it has been five days without Internet after political turmoil that started last Monday, October 25, 2021 (as we described).
The outage continues with almost a flat line and just a trickle of Internet traffic from Sudan. Cloudflare Radar shows that the Internet in Sudan is still almost completely cut off.
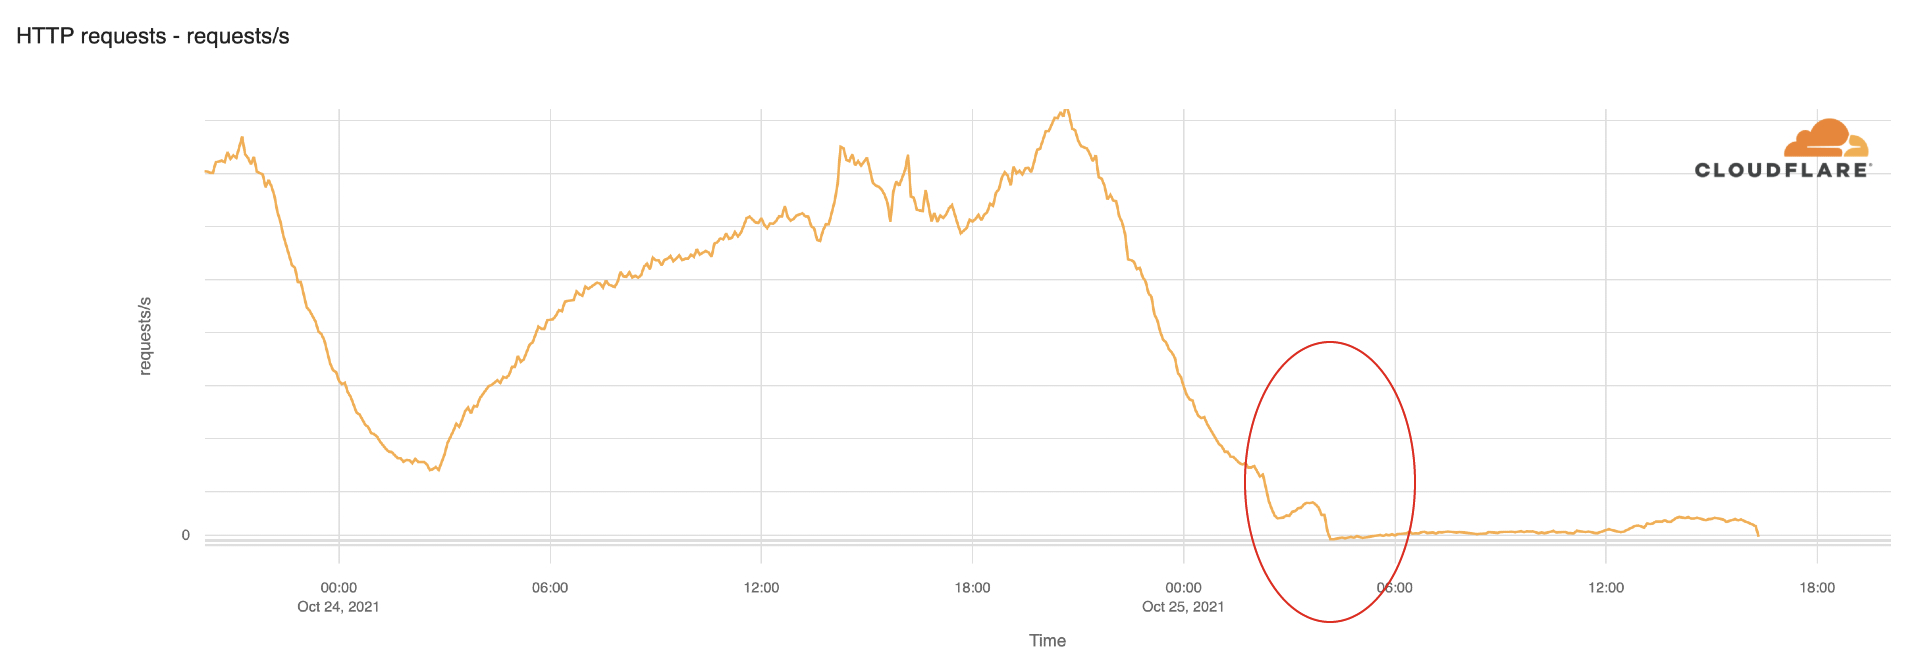
There was a blip of traffic on Tuesday at ~14:00 UTC, for about one hour, but it flattened out again, and it continues like that — anyone can track the evolution on the Sudan page of Cloudflare Radar.
Internet shutdowns are not that rare
Internet disruptions, including shutdowns and social media restrictions, are common occurrences in some countries and Sudan is one where this happens more frequently than most countries according to Human Rights Watch. In our June blog, we talked about Sudan when the country decided to shut down the Internet to prevent cheating in exams, but there were situations in the past more similar to this days-long shutdown — something that usually happens when there’s political unrest.
The country’s longest recorded network disruption was back in 2018, when Sudanese authorities cut off access to social media (and messaging apps like WhatsApp) for 68 consecutive days from December 21, 2018 to February 26, 2019. There was a full mobile Internet shutdown reported from June 3 to July 9, 2019 that lasted 36 days.
You can keep an eye on Cloudflare Radar to monitor how we see the Internet traffic globally and in every country.
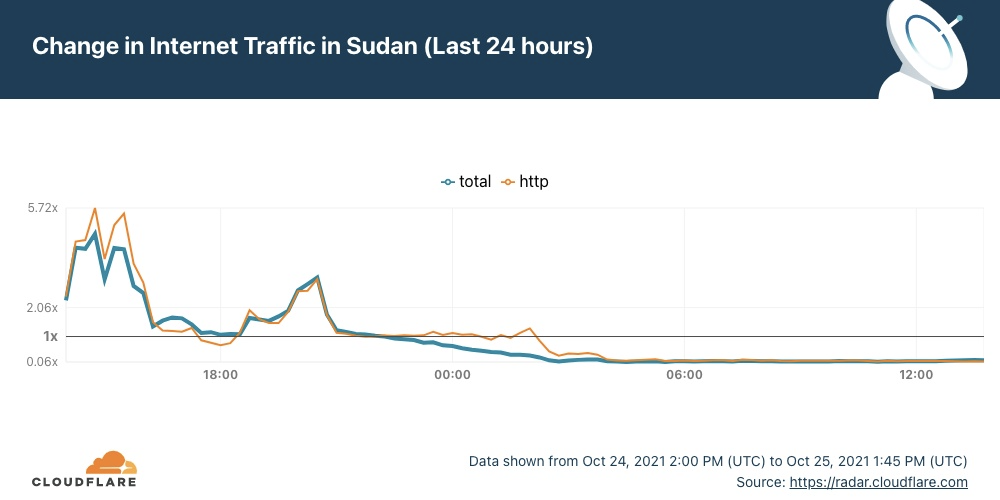
Today, October 25, following political turmoil, Sudan woke up without Internet access.
In our June blog, we talked about Sudan when the country decided to shut down the Internet to prevent cheating in exams.
Now, the disruption seems to be for other reasons. AP is reporting that “military forces … detained at least five senior Sudanese government figures.”. This afternoon (UTC) several media outlets confirmed that Sudan’s military dissolved the transitional government in a coup that shut down mobile phone networks and Internet access.
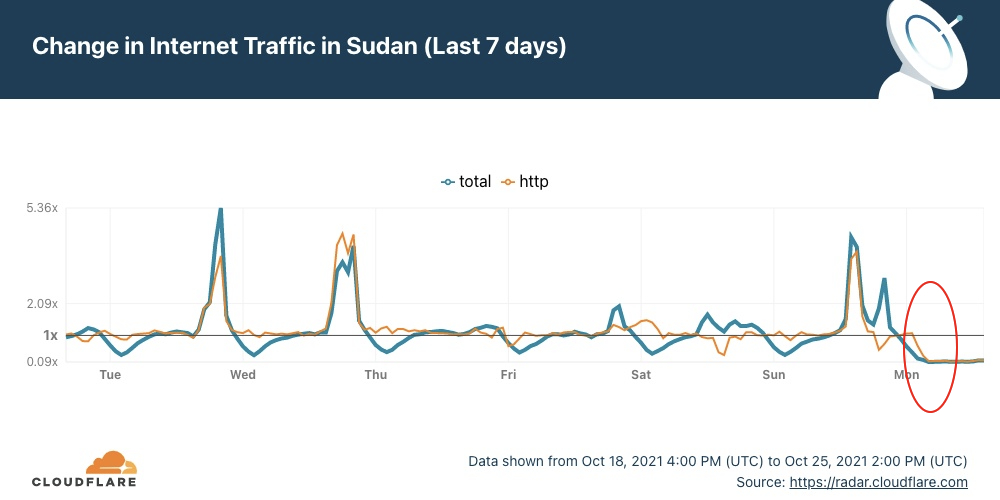
Cloudflare Radar allows anyone to track Internet traffic patterns around the world. The dedicated page for Sudan clearly shows that this Monday, when the country was waking up, the Internet traffic went down and continued that trend through the afternoon (16:00 local time, 14:00 UTC).
We dug in a little more on the HTTP traffic data. It usually starts increasing after 06:00 local time (04:00 UTC). But this Monday morning, traffic was flat, and the trend continued in the afternoon (there were no signs of the Internet coming back at 18:00 local time).
When comparing today with the last seven days’ pattern, we see that today’s drop is abrupt and unusual.
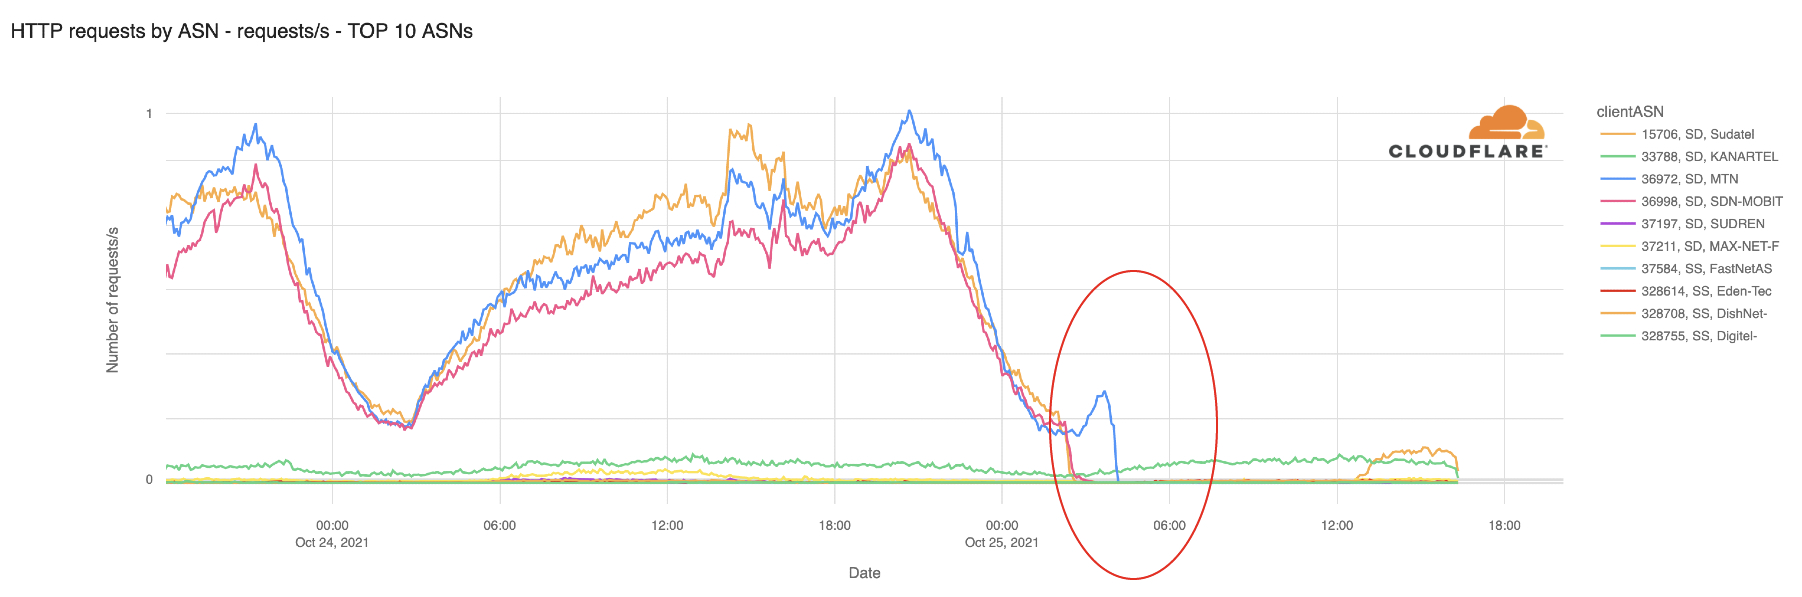
We can see the same pattern when looking at HTTP traffic by ASN (Autonomous Systems Number). The shutdown affects all the major ISPs from Sudan.
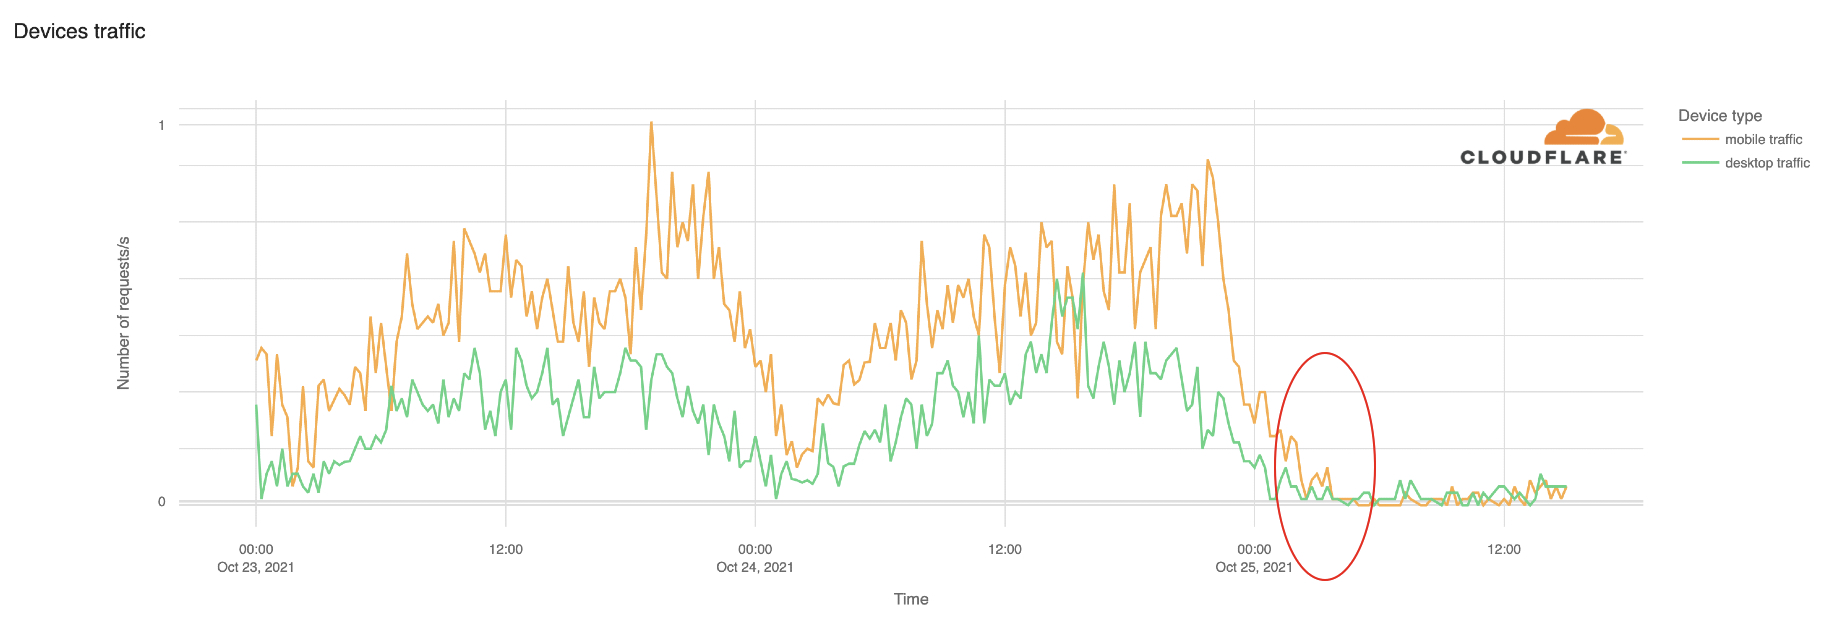
Two weeks ago, we compared mobile traffic worldwide using Cloudflare Radar, and Sudan was one of the most mobile-friendly countries on the planet, with 83% of Internet traffic coming from mobile devices. Today, both mobile and desktop traffic was disrupted.
Using Cloudflare Radar, we can also see a change in Layer 3&4 DDoS attacks because of the lack of data.
You can keep an eye on Cloudflare Radar to monitor how we see the Internet traffic globally and in every country.
You’re having dinner, you look at the table next to and everyone is checking their phone, scrolling and browsing and interacting with that little (is getting bigger) piece of hardware that puts you in contact with friends, family, work and the giant public square of sorts that social media has become. That could happen in the car (hopefully with the passengers, never the driver), at home when you’re on the sofa, in bed or even when you’re commuting or just bored in line for the groceries.
Or perhaps you use your mobile phone as your only connection to the Internet. It might be your one means of communication and doing business. For many, the mobile Internet opened up access and opportunity that simply was not possible before.
Around the world the use of mobile Internet differs widely. In some countries mobile traffic dominates, in others desktop still reigns supreme.
Mobile Internet traffic has changed the way we relate to the online world — work (once, for some, done on desktop/laptop computers) is just one part of it — and Cloudflare Radar can help us get a better understanding of global Internet traffic but also access regional trends, and monitor emerging security threats. So let’s dig into the mobile traffic trends, starting with a kind of contest (the data reflected here is from the 30 days before October 4).
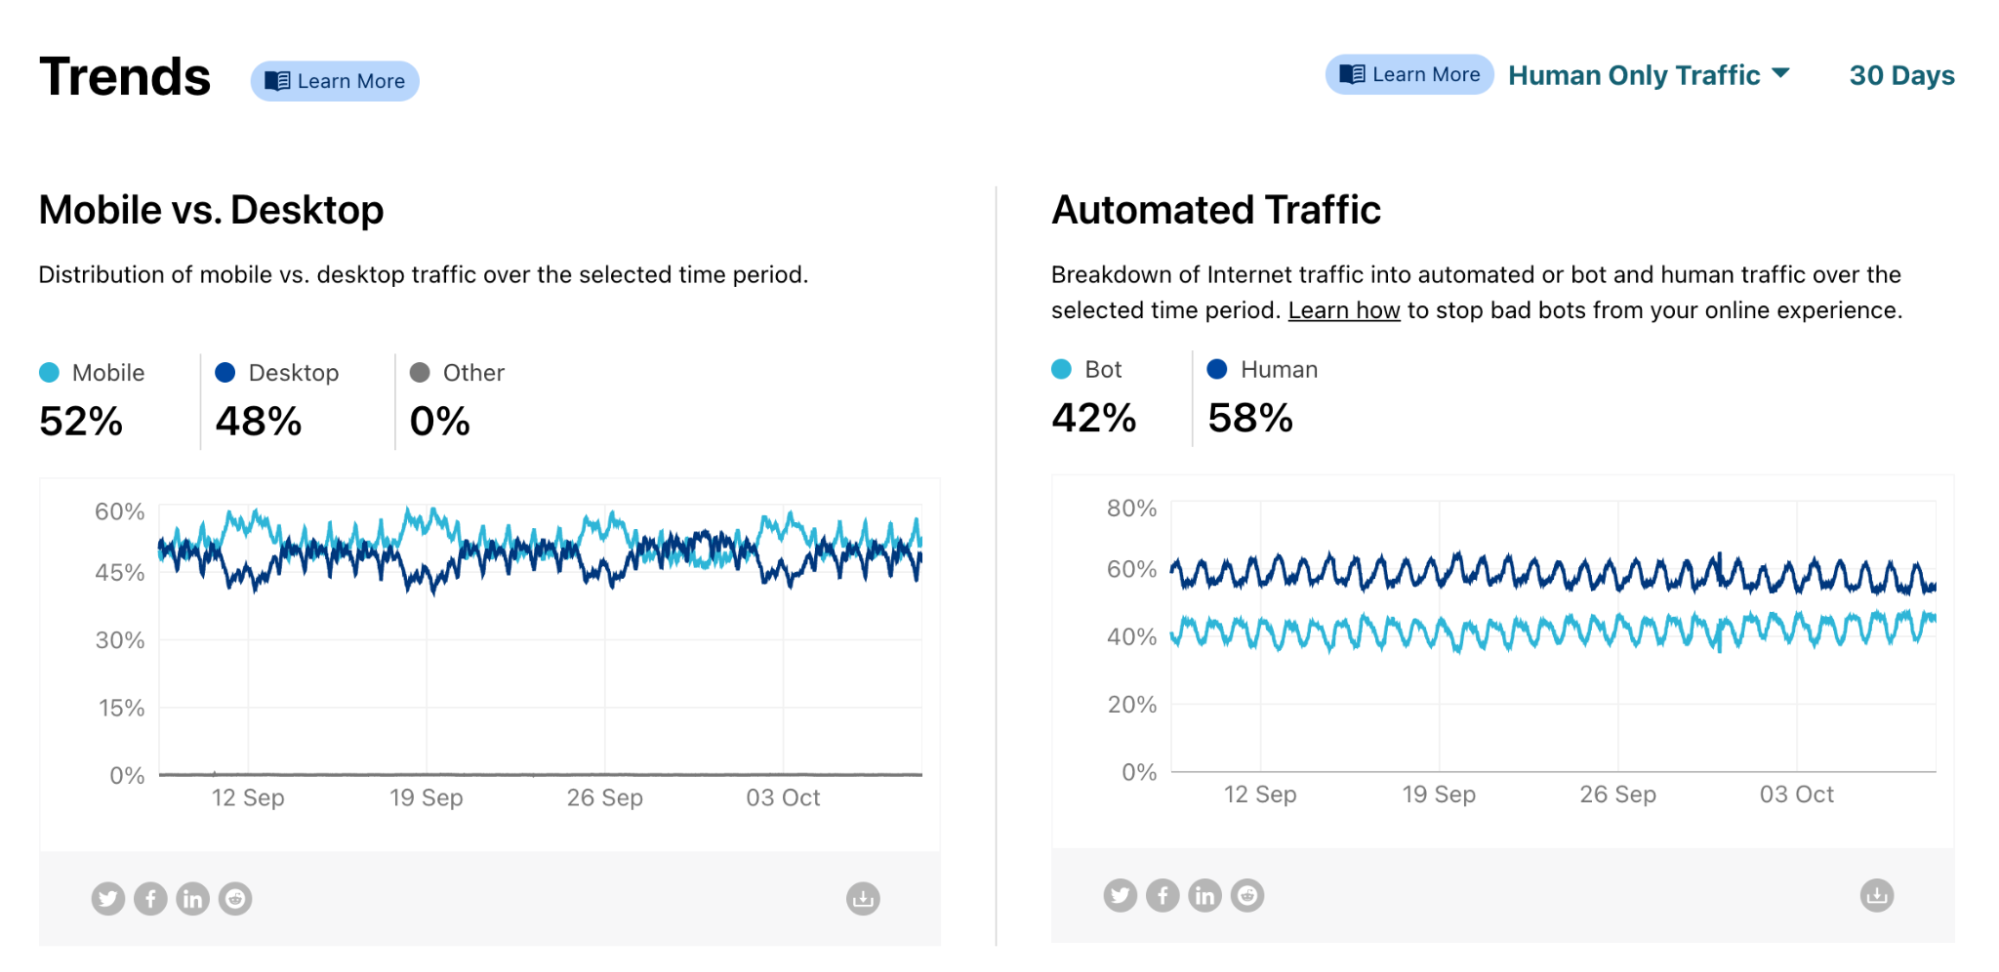
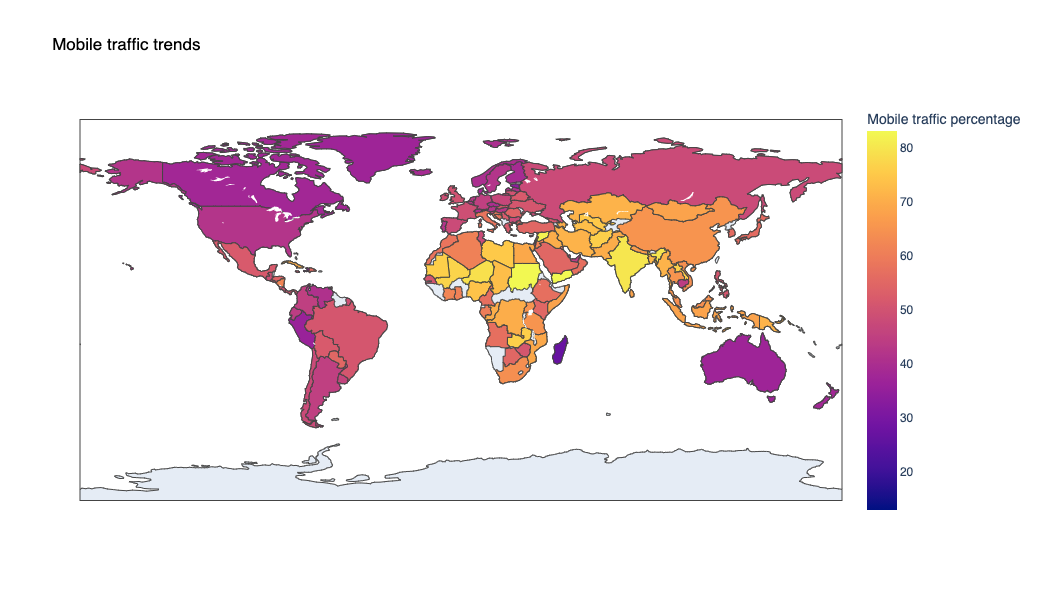
In this area of Cloudflare Radar users can check the mobile traffic trends by country or worldwide (the case shown here) in the past 7 or 30 days. Worldwide we can see that mobile wins over desktop traffic with 52%
The country that has the greatest proportion of mobile Internet traffic is…
Cloudflare Radar has information on countries across the world, so we looked for, in the past month, the country with the highest proportion of mobile Internet traffic. And the answer is… Sudan, with 83% of Internet traffic is done using mobile devices — actually it’s a tie with Yemen, which we talk about a little further below.
In many emerging economies (Sudan is one), a large percent of the population had its first contact with the Internet through a smartphone. In these countries it is normal not to have a computer and some even got their first bank account thanks to the mobile device.
How about Sudan’s neighbours? South Sudan follows that pattern and mobile traffic represents 74% of Internet use. The same in Chad (74%), Libya (75%), Egypt (68%), Eritrea (67%) and Ethiopia (58%). It’s a clear trend throughout Africa, especially in the central and eastern part of the continent, where mobile traffic wins in every country (for the past 30 days).
World map that shows (in yellow) the areas of the planet where most of the Internet traffic is done via mobile devices. Africa, the Middle East and Asia have the highest percentage of mobile traffic.
The Vatican goes for the desktop experience (but Italy loves mobile)
On the other hand, the country we found with the least mobile traffic in the past 30 days is… Vatican City, with only 13% (since the Vatican is literally inside Rome this might be an anomaly caused by mobile devices inside the Vatican connecting to Italian networks). Small countries like Seychelles (29%), Andorra (29%), Estonia (34%) and San Marino (36%) have the same pattern — also with a low mobile traffic percentage there’s Madagascar (27%), Haiti (34%) and Greenland (37%).
We can also see that the pattern inside Vatican City differs greatly from the pattern in Italy. Italy is one of the most mobile-friendly European countries — Italians seem to prefer mobile to desktop. About 57% of Internet traffic is via mobile devices. Italy is only matched, in Europe, by its neighbour Croatia — on the other side of the Adriatic Sea — that in the past month has had 58% mobile traffic.
European countries have differing mobile preferences
While we’re talking about Italy and Croatia, let’s dig a bit more into Europe. Only six countries have more mobile than desktop (laptops included) traffic. Besides Italy and Croatia, there’s Romania (54%), Slovakia (52%) and Greece (51%) — all more to the east of Europe.
At the end of this mobile ranking we have one of the most digitally advanced countries in the world: Estonia (a truly digital society, according to Wired). The small country only has 34% of mobile traffic. Other countries in the north of Europe like Denmark (38%) and Finland (39%) follow the same trend.
Spain (47%), France (48%) and Ireland (49%) are getting close to being mobile-first countries. The UK (50%) has the same trend as its neighbours — Russia is actually in the same ‘neighbourhood’ (with 49%). On the other hand, Portugal (42%), Netherlands (43%) or Germany (44%) are still a little far.
How about the American continent?
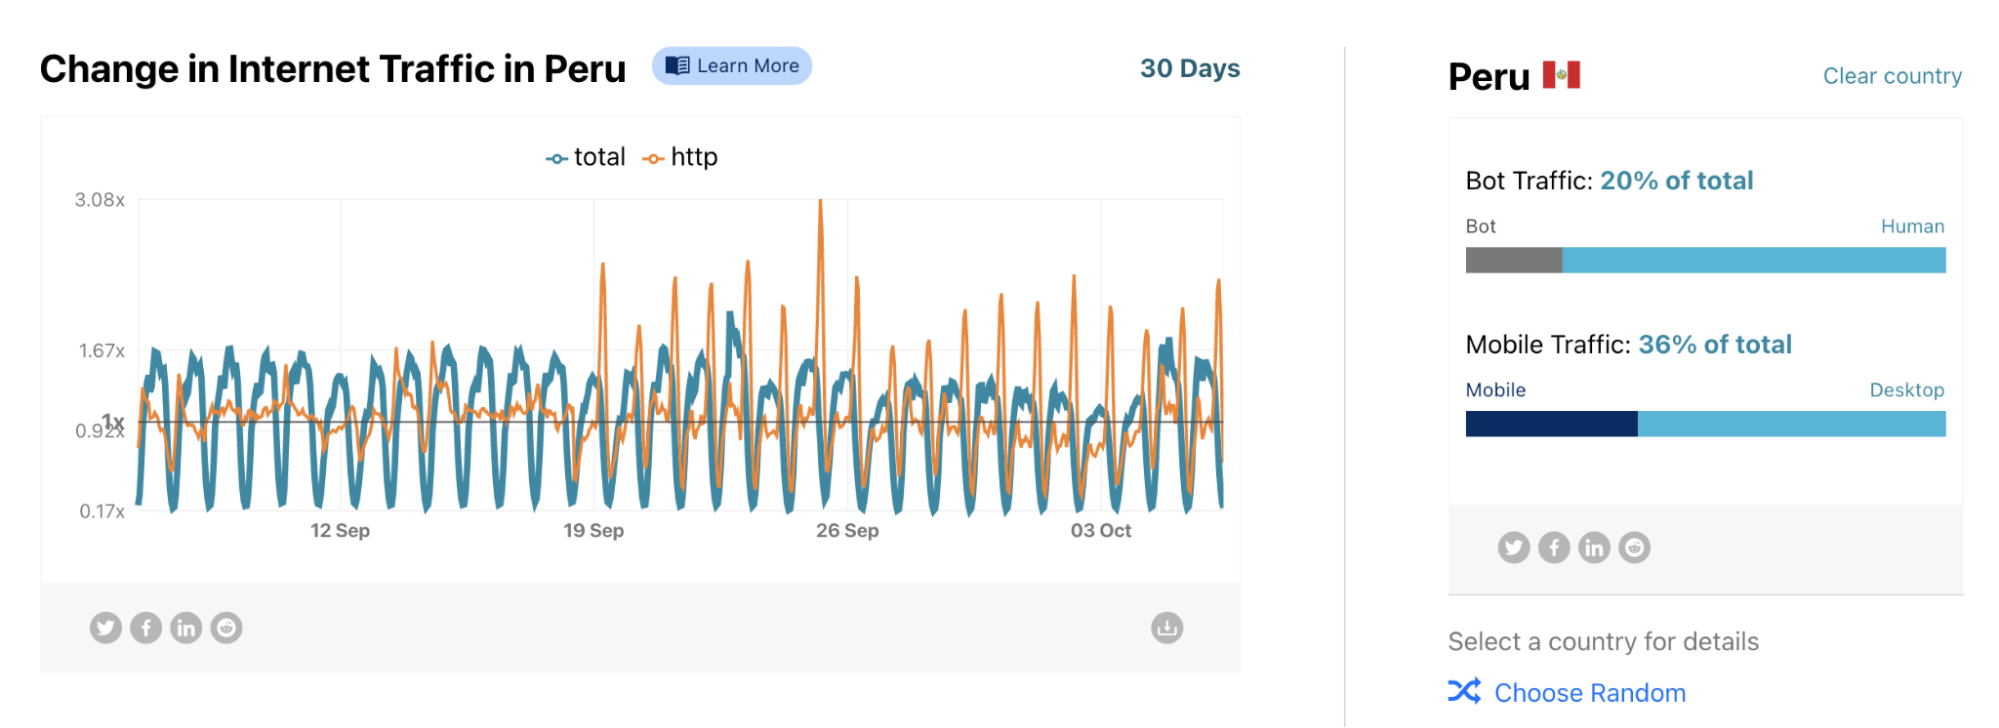
Peru seems to be the country in the American continent that has less mobile use (36%), only compared with Canada (38%). Cuba is the country with more mobile use (70%)
Peru (36%) and Canada (38%) have in common that both are the countries in the American continent with the least mobile use in the past 30 days.
Then there’s Brazil (50%), Mexico (52%) — Chile is not far, with 48% of mobile use. Cuba takes the crown, with 70%, followed by the Dominican Republic (56%), Puerto Rico (51%) and Jamaica (51%), all Caribbean countries. The exception is Haiti, the least mobile of the continent, with 34% of mobile use.
Let’s go to the Middle East: the champion of mobile traffic
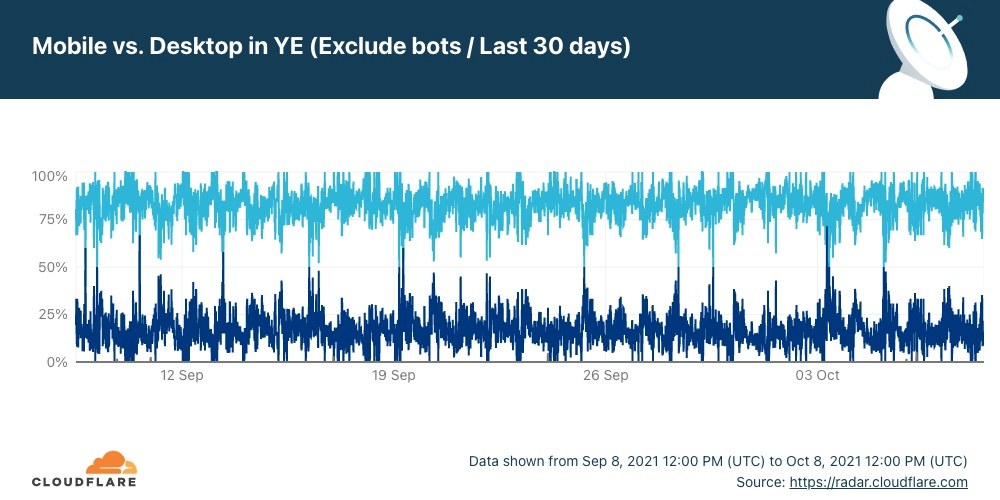
Most Internet traffic in Yemen is done with mobile devices like this chart from Radar of the previous 30 days shows
In this part of our planet there are no doubts whatsoever: mobile traffic rules completely. On the top of the list is Yemen, with the same 83% of mobile traffic as Sudan (that we talked about before). But Syria is actually a close second, with 82%.
Iran (71%), Iraq (70%), Pakistan (70%) and Egypt (69%) show the same trend. The exception, here, is the United Arab Emirates, with 44% of mobile traffic, and also Israel (45%). Nearby, Saudi Arabia (the country with the highest GDP in the region) is at 55%.
A (mobile) giant called India
Of the top 10 most populated countries, the clear winner of our mobile ranking is, without any doubt, India, with 80% mobile use. The country of 1.3 billion people surpasses the biggest country on the planet, China (1.4 billion live there), with 65% mobile.
Also in Asia, the fourth-biggest country in the world (after the US), Indonesia, has 68% of traffic by mobile devices. The same trend of mobile-first is followed by Thailand (65%), Vietnam (64%), Malaysia (64%), South Korea (56%), Japan (56%) and the Philippines (51%). Singapore is in the middle and down under, Australia is desktop first (37% mobile traffic), just like its neighbour New Zealand (38%).
Just as a curiosity, Vanuatu, the South Pacific Ocean nation (population of 307,150), ranked some years as the happiest nation on the planet (by the Happy Planet Index) has 52% of mobile traffic. The current number one in that same index, Costa Rica, is at 50%.
Conclusion
Mobile devices are here to stay and have become already a bridge to help bring more humans to the vast opportunities that the Internet brings. Of the top 15 countries with more mobile Internet traffic, there’s just one that is in the top 15 in terms of GDP, India.
As we already showed, there is a world of trends and even human habits (differing from country to country) to discover on our Cloudflare Radar platform. It’s all a matter of asking a question that could be reflected in our data and searching for the answers.
The collective thoughts of the interwebz
Manage Consent
To provide the best experiences, we use technologies like cookies to store and/or access device information. Consenting to these technologies will allow us to process data such as browsing behavior or unique IDs on this site. Not consenting or withdrawing consent, may adversely affect certain features and functions.
Functional
Always active
The technical storage or access is strictly necessary for the legitimate purpose of enabling the use of a specific service explicitly requested by the subscriber or user, or for the sole purpose of carrying out the transmission of a communication over an electronic communications network.
Preferences
The technical storage or access is necessary for the legitimate purpose of storing preferences that are not requested by the subscriber or user.
Statistics
The technical storage or access that is used exclusively for statistical purposes.The technical storage or access that is used exclusively for anonymous statistical purposes. Without a subpoena, voluntary compliance on the part of your Internet Service Provider, or additional records from a third party, information stored or retrieved for this purpose alone cannot usually be used to identify you.
Marketing
The technical storage or access is required to create user profiles to send advertising, or to track the user on a website or across several websites for similar marketing purposes.