Cloudflare operates in more than 285 cities in over 100 countries, where we interconnect with over 11,500 network providers in order to provide a broad range of services to millions of customers. The breadth of both our network and our customer base provides us with a unique perspective on Internet resilience, enabling us to observe the impact of Internet disruptions.
We entered 2023 with Internet disruptions due to causes that ran the gamut, including several government-directed Internet shutdowns, cyclones, a massive earthquake, power outages, cable cuts, cyberattacks, technical problems, and military action. As we have noted in the past, this post is intended as a summary overview of observed disruptions, and is not an exhaustive or complete list of issues that have occurred during the quarter.
Government directed
Iran
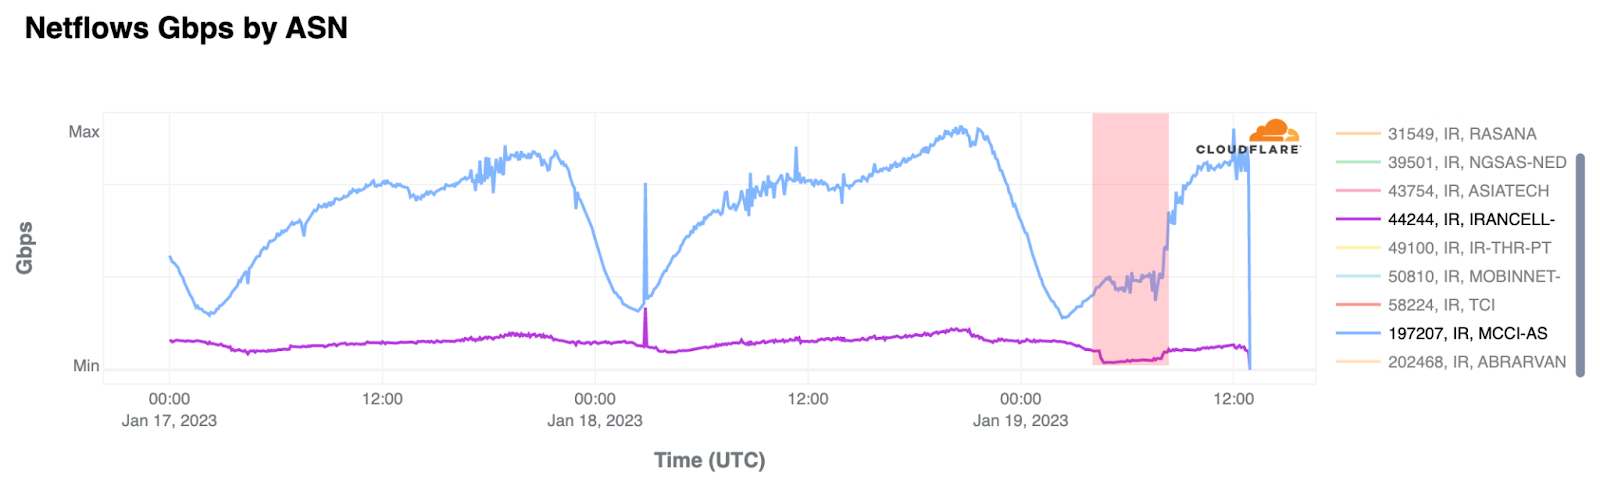
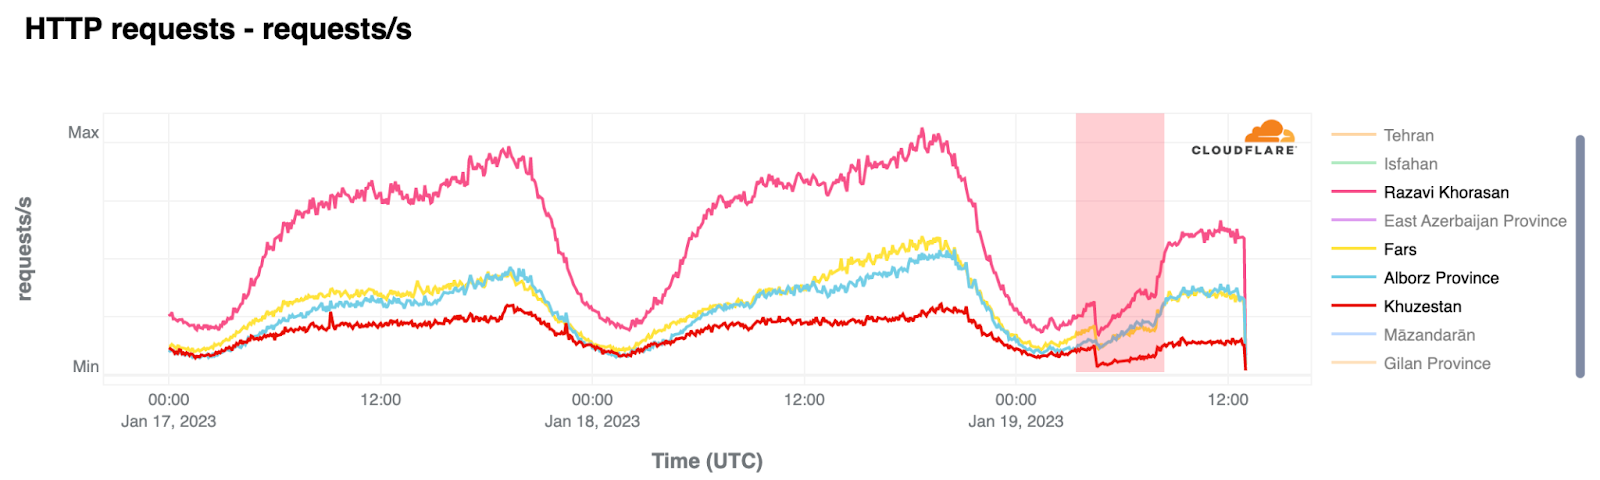
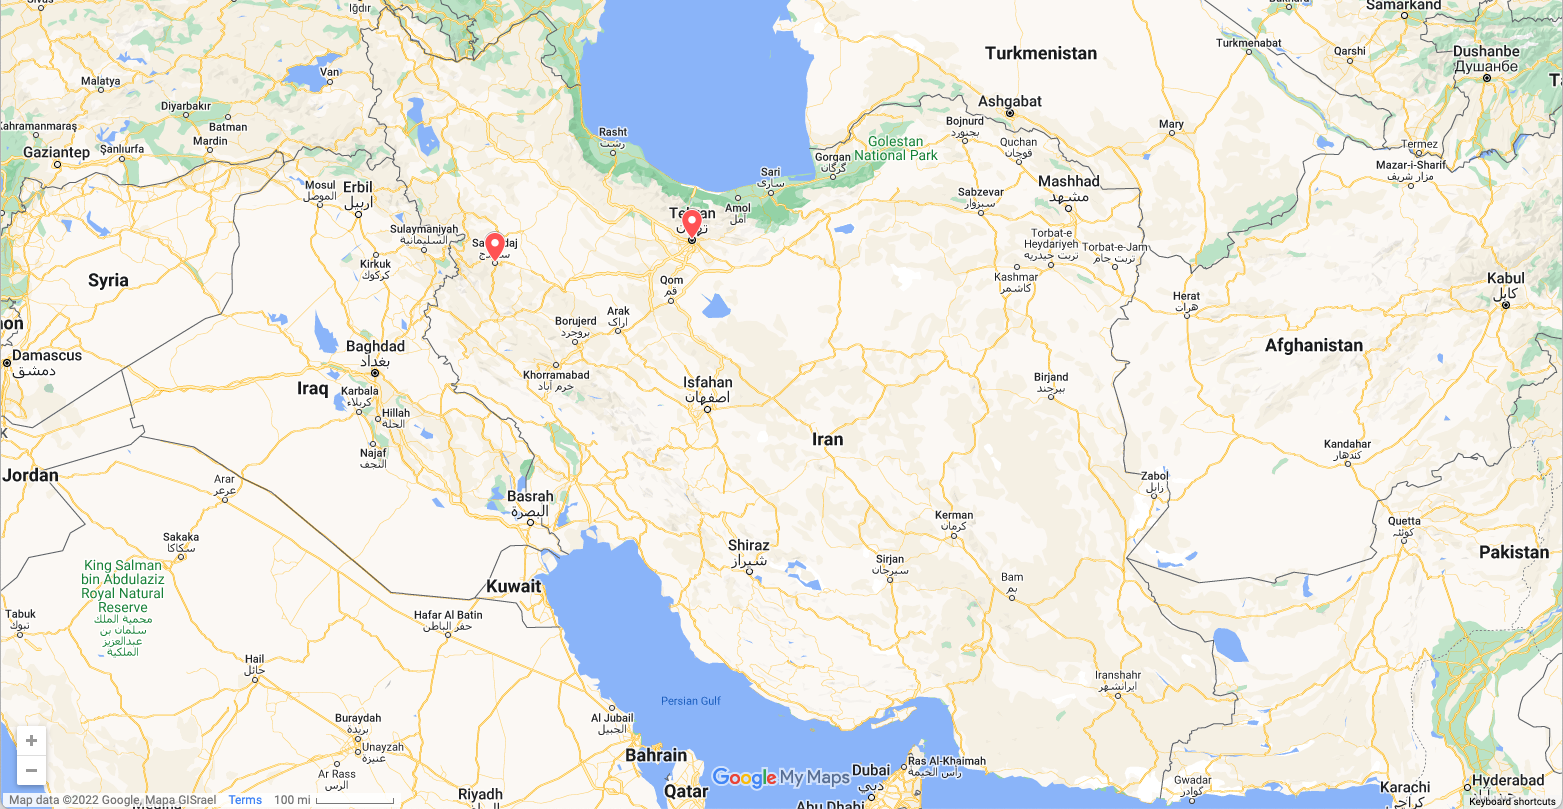
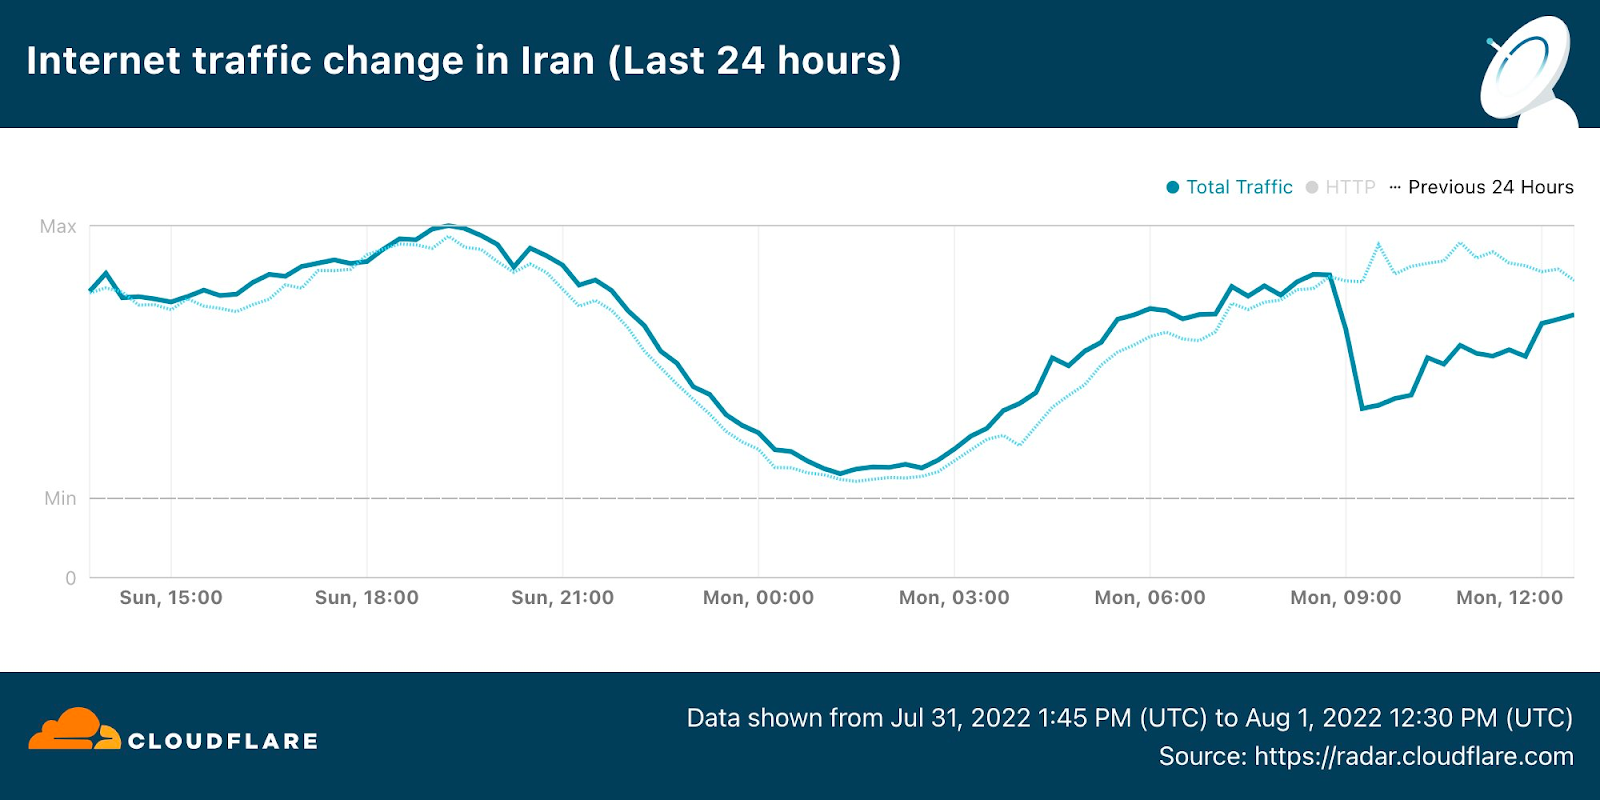
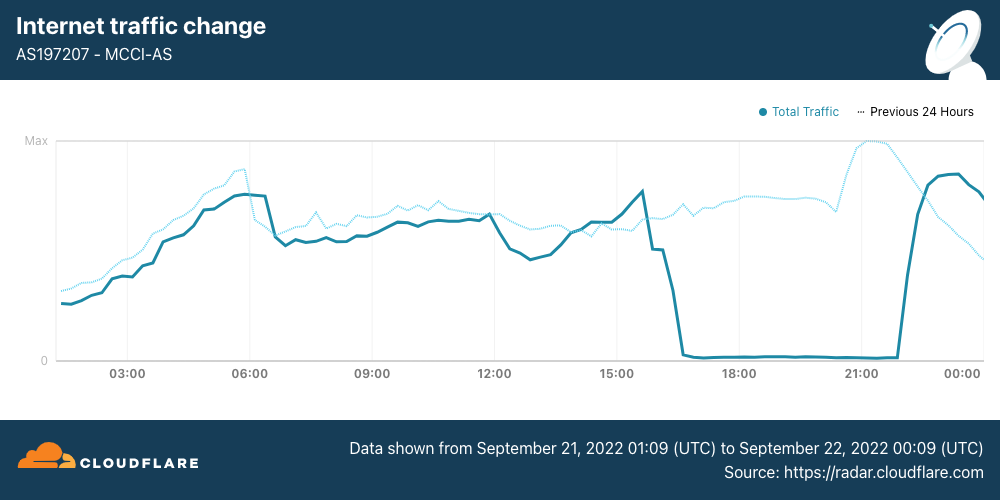
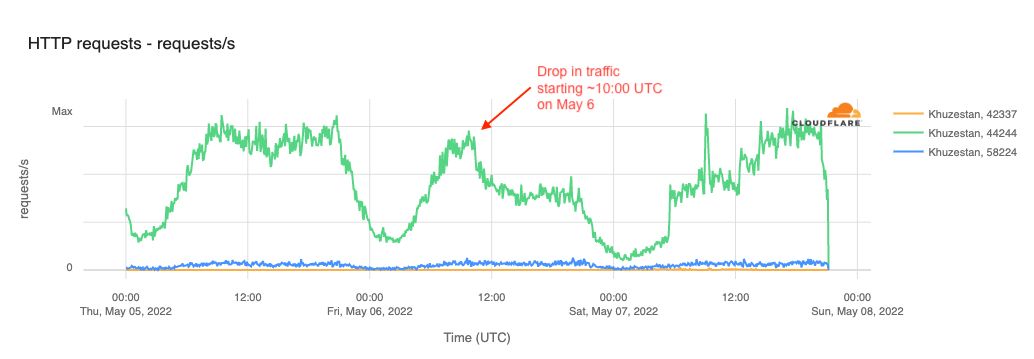
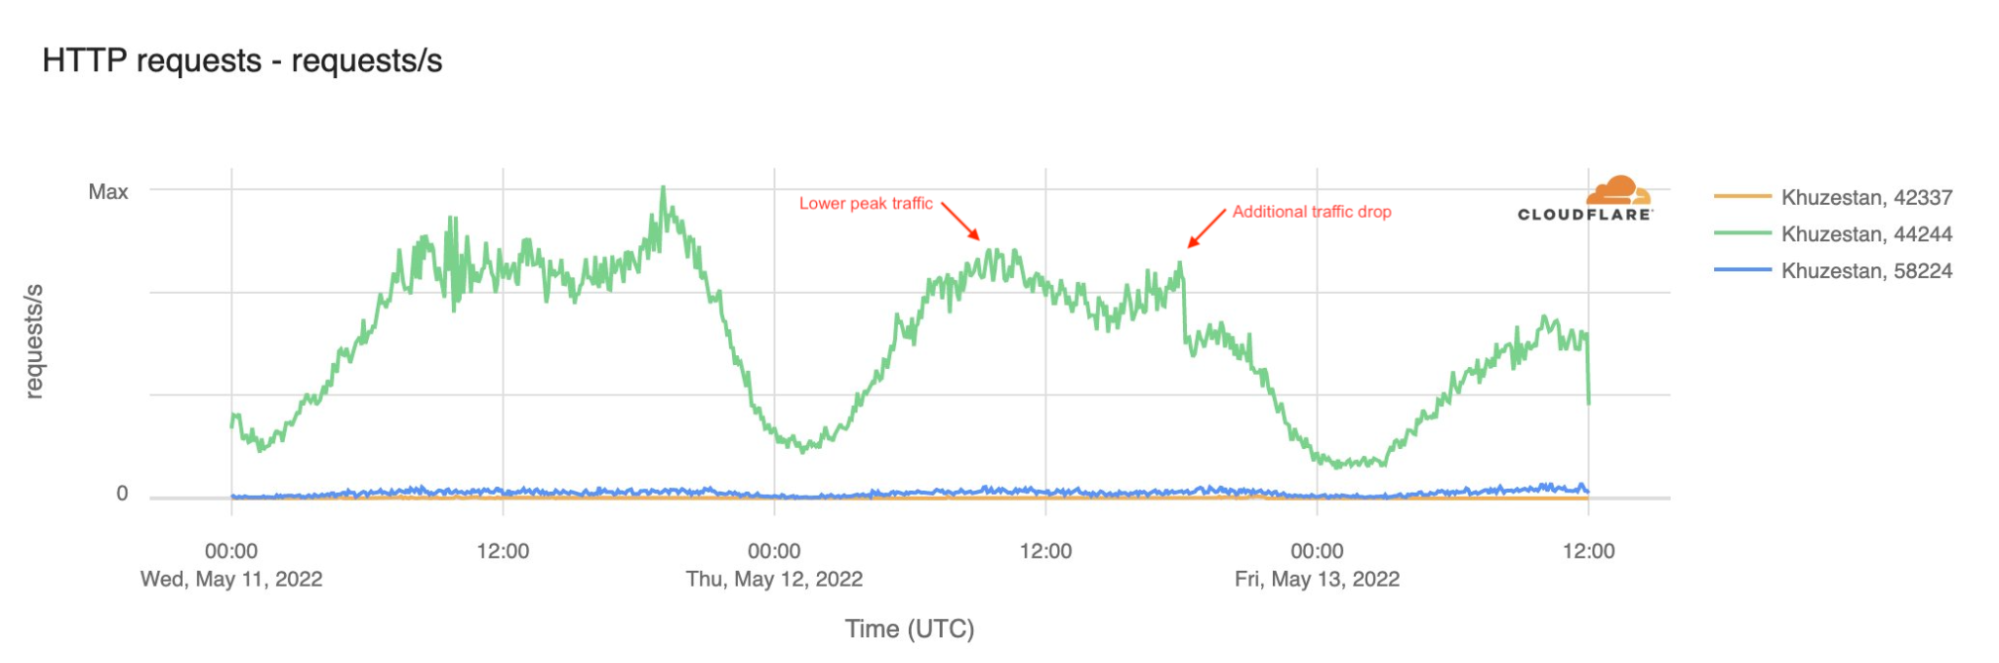
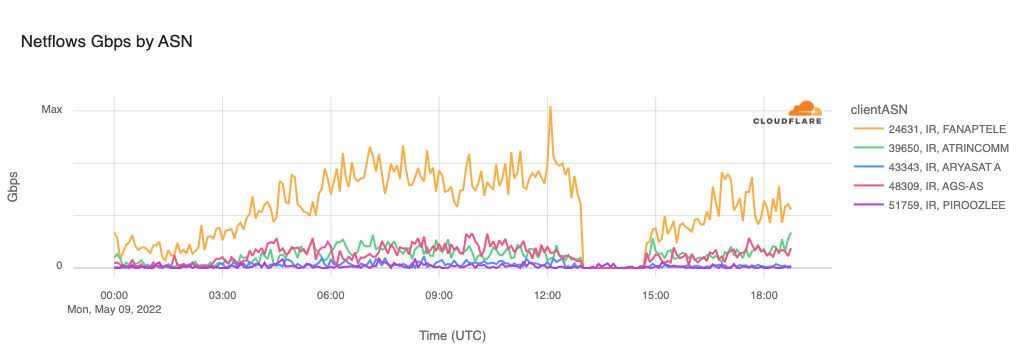
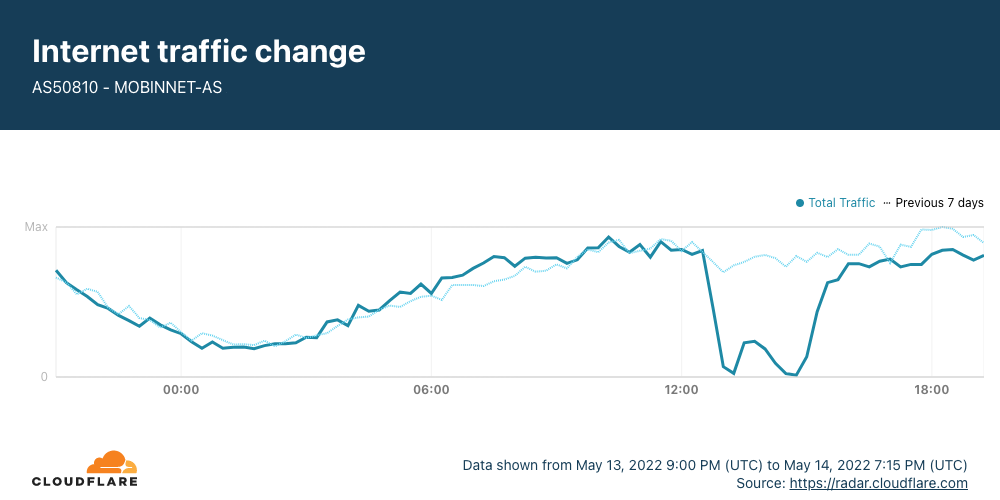
Over the last six-plus months, government-directed Internet shutdowns in Iran have largely been in response to protests over the death of Mahsa Amini while in police custody. While these shutdowns are still occurring in a limited fashion, a notable shutdown observed in January was intended to prevent cheating on academic exams. Internet shutdowns with a similar purpose have been observed across a number of other countries, and have also occurred in Iran in the past. Access was restricted across AS44244 (Irancell) and AS197207 (MCCI), with lower traffic levels observed in Alborz Province, Fars, Khuzestan, and Razavi Khorasan between 08:00 to 11:30 local time (04:30 to 08:00 UTC) on January 19.
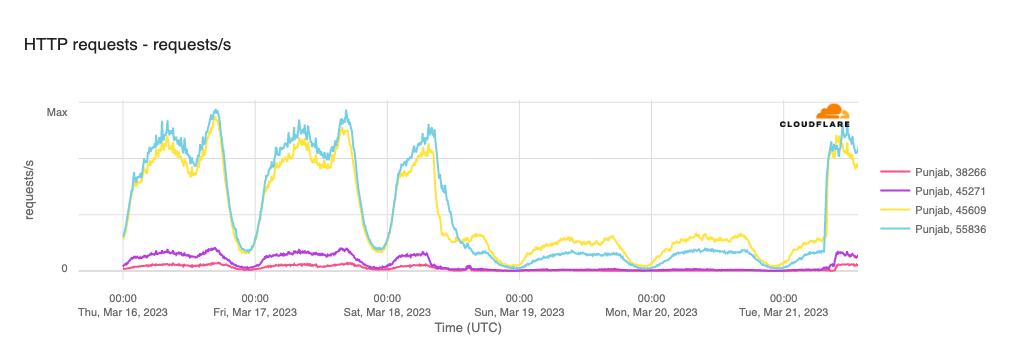
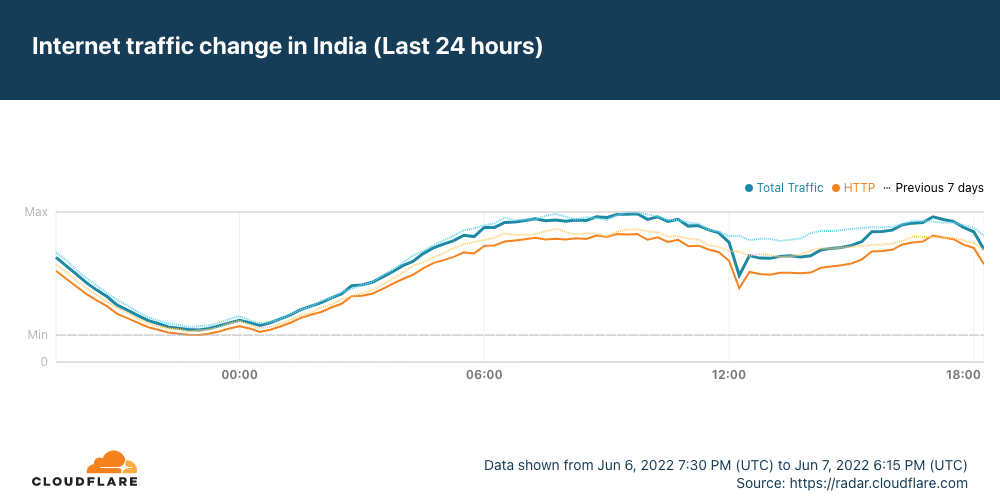
A shutdown of mobile Internet connectivity in Punjab, India began on March 19, ordered by the local government amid concerns of protest-related violence. Although the initial shutdown was ordered to take place between March 18, 12:00 local time and March 19, 12:00 local time, it was extended several times, ultimately lasting for three days. Traffic for AS38266 (Vodafone India), AS45271 (Idea Cellular Limited), AS45609 (Bharti Mobility), and AS55836 (Reliance Jio Infocomm) began to fall around 12:30 local time (07:00 UTC) on March 18, recovering around 12:30 local time (07:00 UTC) on March 21. However, it was subsequently reported that connectivity remained shut down in some districts until March 23 or 24.
Cable cuts
Bolivia
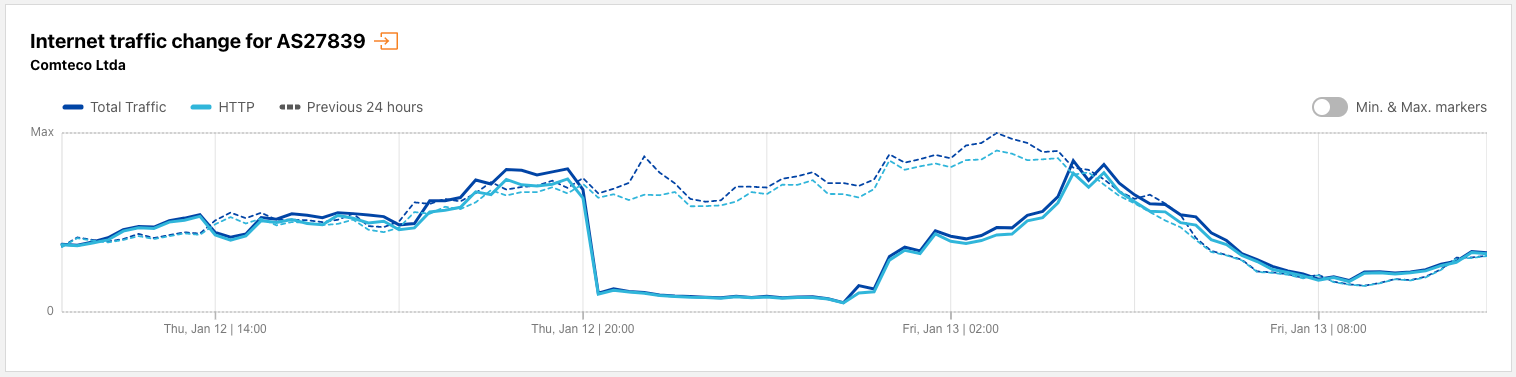
Bolivian ISP Cometco (AS27839)reported on January 12 that problems with international fiber links were causing degradation of Internet service. Traffic from the network dropped by approximately 80% starting around 16:00 local time (20:00 UTC) before returning to normal approximately eight hours later. It isn’t clear whether the referenced international fiber links were terrestrial connections to neighboring countries, or issues with submarine cables several network hops upstream. As a landlocked country, Bolivia is not directly connected to any submarine cables.
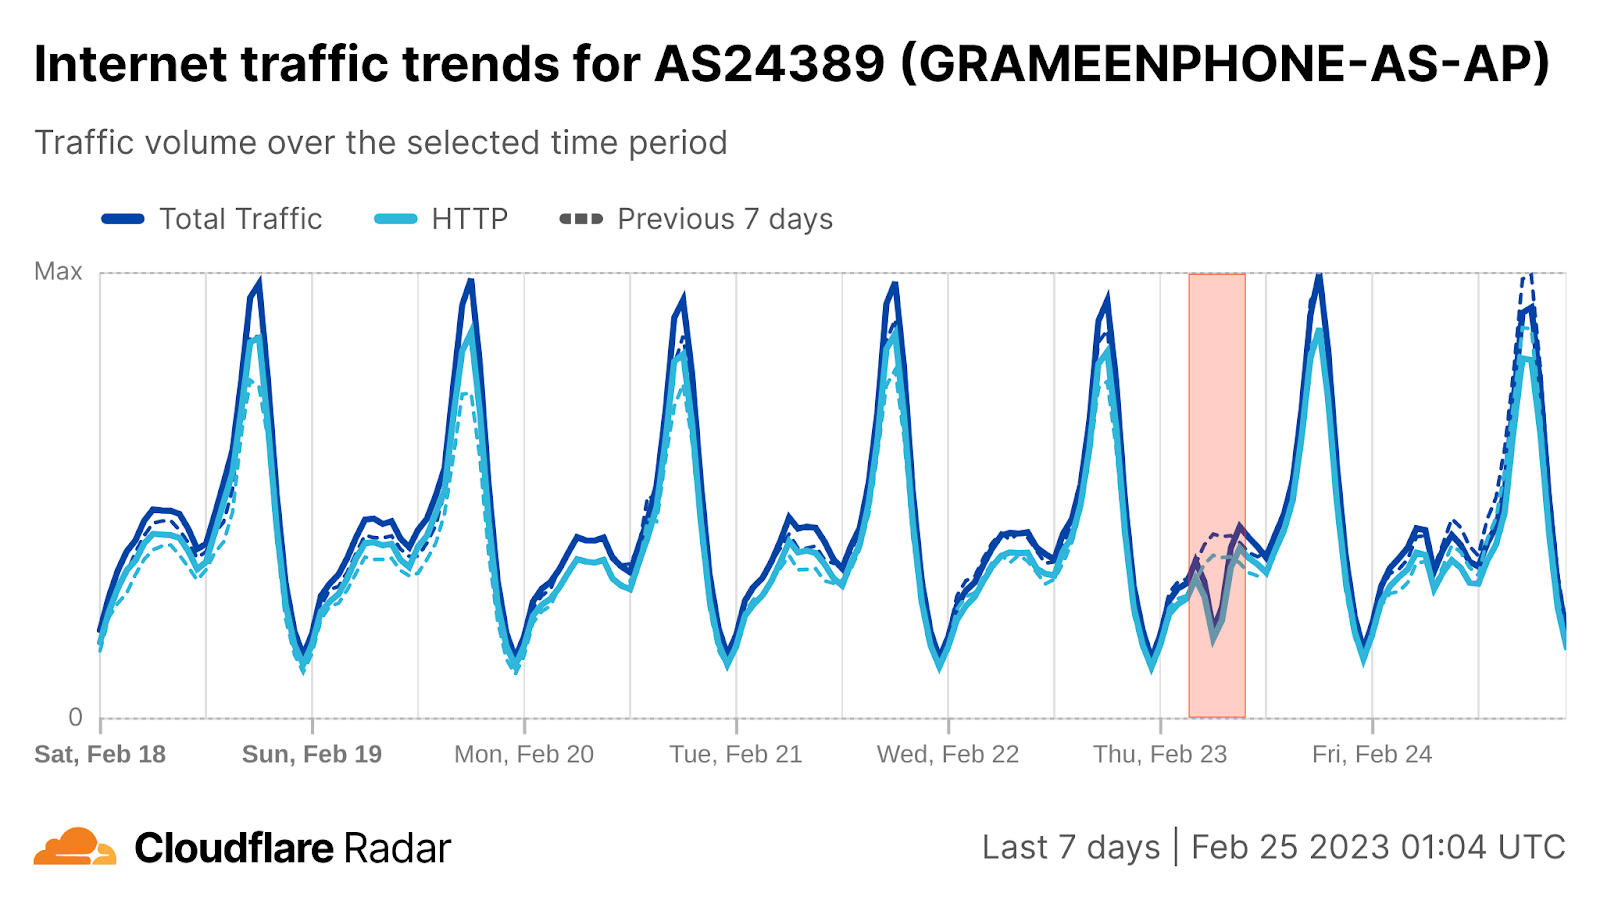
A brief connectivity disruption was observed on Bangladeshi provider Grameenphone on February 23, between 11:45-14:00 local time (05:45-08:00 UTC). According to a Facebook post from Grameenphone, the outage was caused by fiber cuts due to road maintenance.
Venezuela
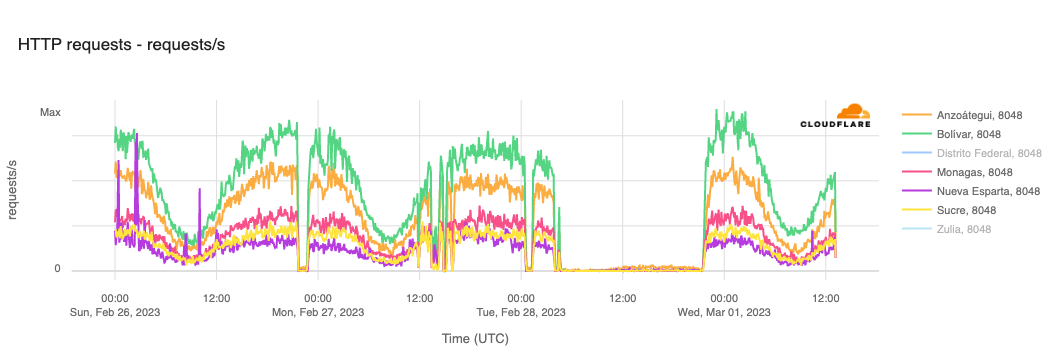
Venezuela, and more specifically, AS8048 (CANTV), are no stranger to Internet disruptions, seeing several (Q1, Q2) during 2022, as well as others in previous years. During the last couple of days in February, a few small outages were observed on CANTV’s network in several Venezuelan states. However, a more significant near-complete outage occurred on February 28, starting around midnight local time (04:00 UTC), and lasting for the better part of the day, with traffic recovering at 17:30 local time (21:30 UTC). A Tweet posted the morning of February 28 by CANTV referenced an outage in their fiber optic network, which was presumably the cause.
Power outages
Pakistan
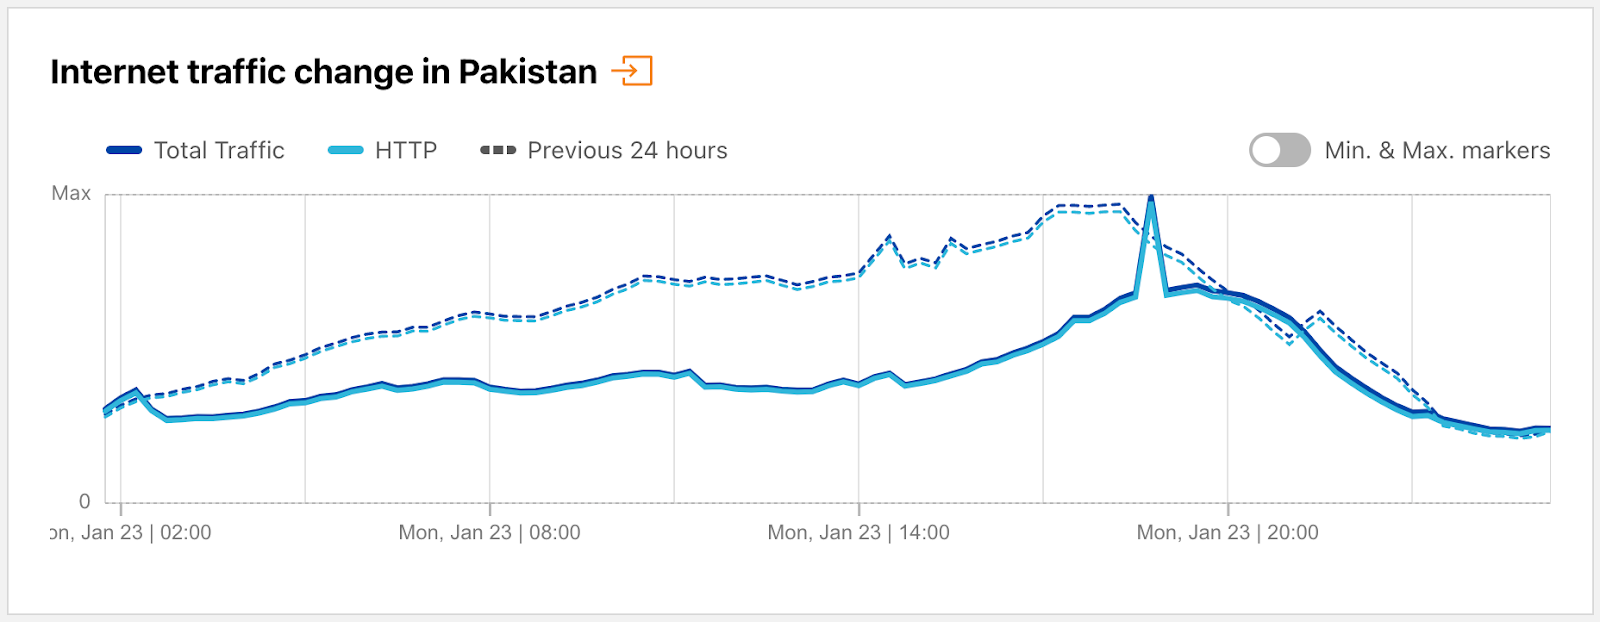
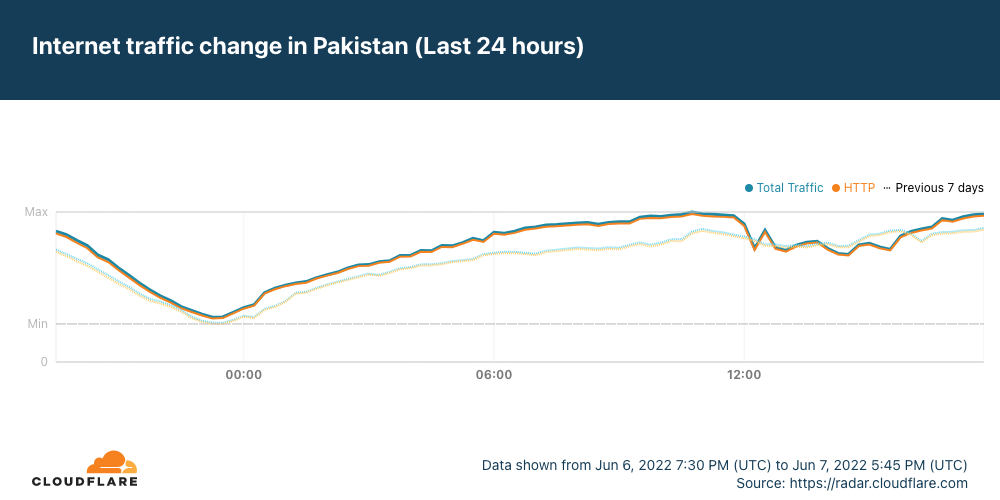
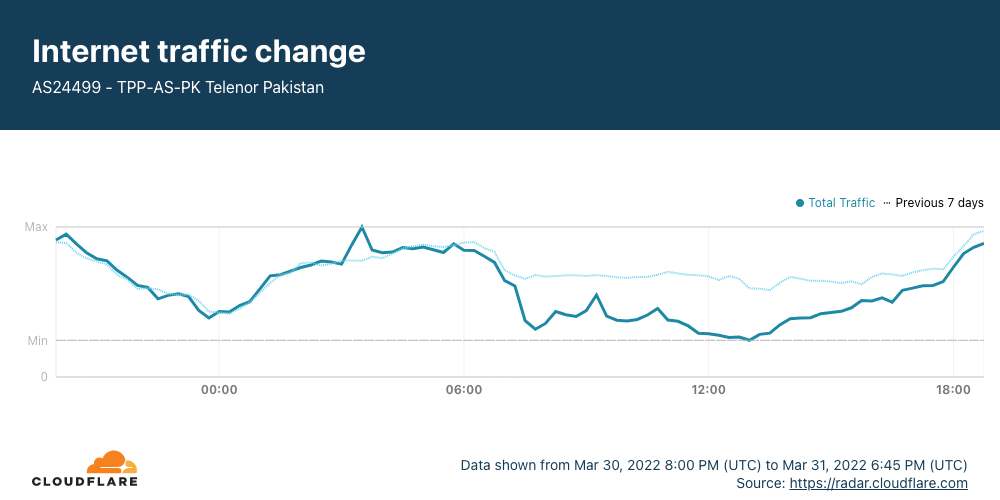
A country-wide power outage in Pakistan on January 23 impacted more than 220 million people, and resulted in a significant drop in Internet traffic being observed in the country. The power outage began at 07:34 local time (02:34 UTC), with Internet traffic starting to drop almost immediately. The figure below shows that traffic volumes dropped as much as 50% from normal levels before recovering around 04:15 local time on January 24 (23:15 UTC on January 23). This power outage was reportedly due to a “sudden drop in the frequency of the power transmission system”, which led to a “widespread breakdown”. Nationwide power outages have also occurred in Pakistan in January 2021, May 2018, and January 2015.
Bermuda
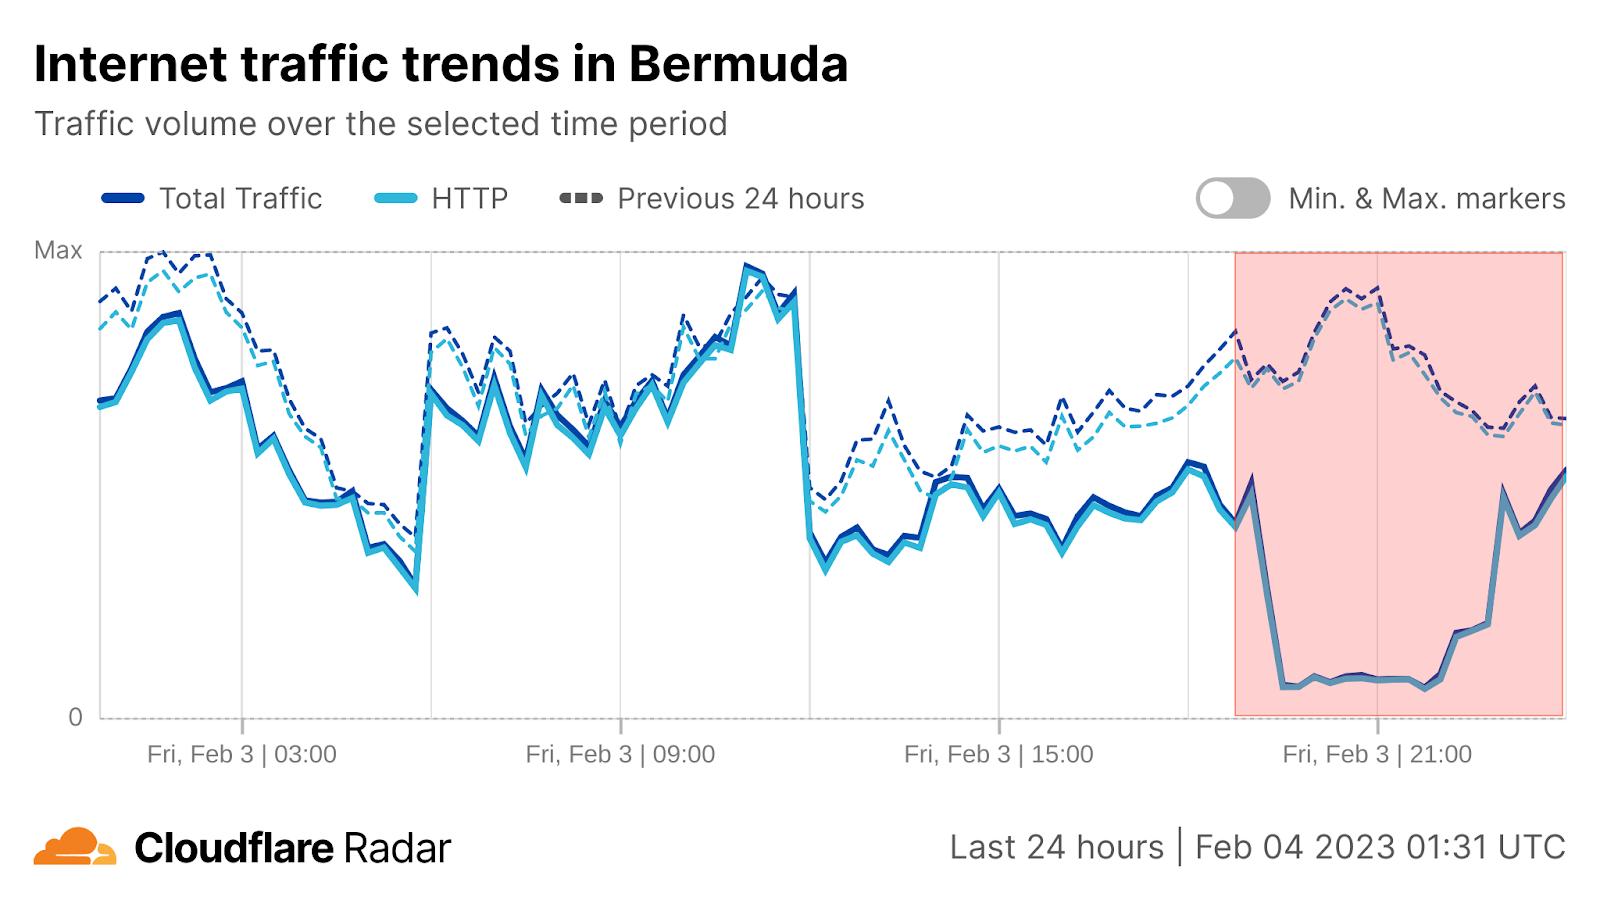
BELCO, the power company servicing the island of Bermuda, tweeted about a mass power outage affecting the island on February 3, and linked to their outage map so that customers could track restoration efforts. BELCO’s tweet was posted at 16:10 local time (20:10 UTC), approximately one hour after a significant drop was observed in Bermuda’s Internet traffic. The power outage, and subsequent Internet disruption, lasted over five hours, as BELCO later tweeted that “As of 9.45 pm [00:45 UTC, February 4], all circuits have been restored.”
Argentina
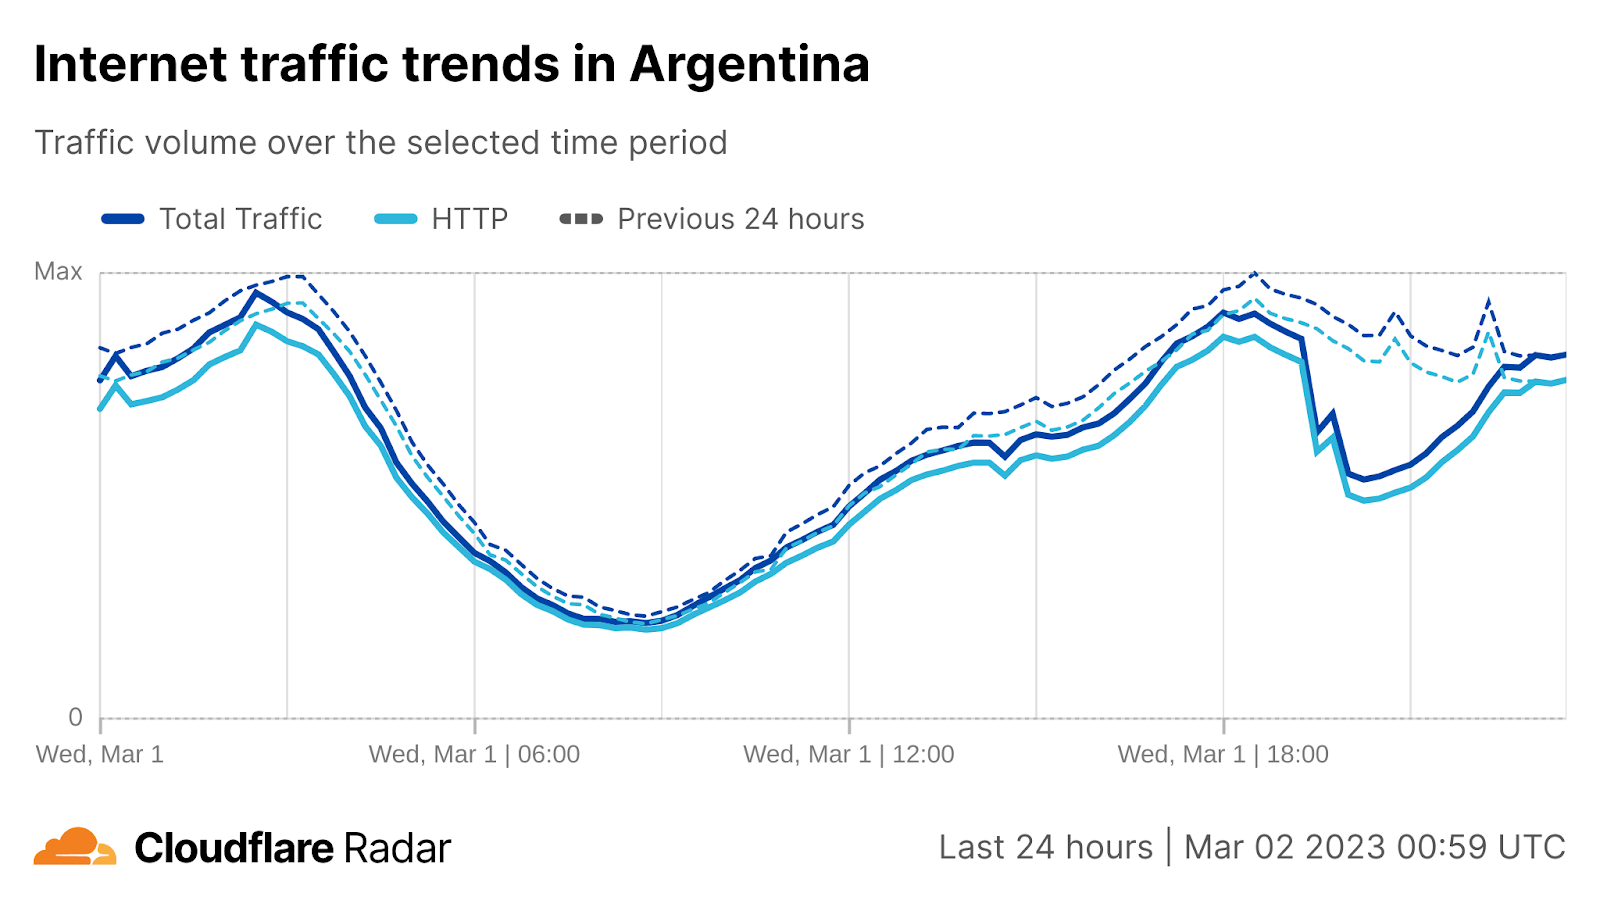
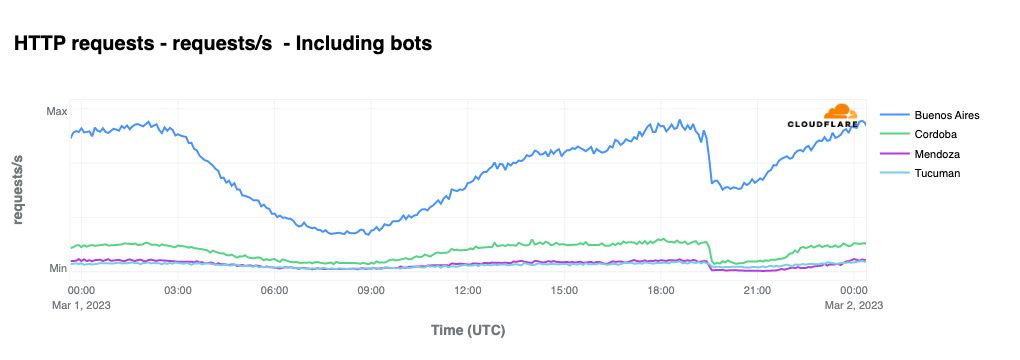
Soaring temperatures in Argentina triggered a large-scale power outage across the country that resulted in multi-hour Internet disruption on March 1. Internet traffic dropped by approximately one-third during the disruption, which lasted from 16:30 to 19:30 local time (19:30 to 22:30 UTC). Cities that experienced visible impacts to Internet traffic during the power outage included Buenos Aires, Cordoba, Mendoza, and Tucuman.
Kenya
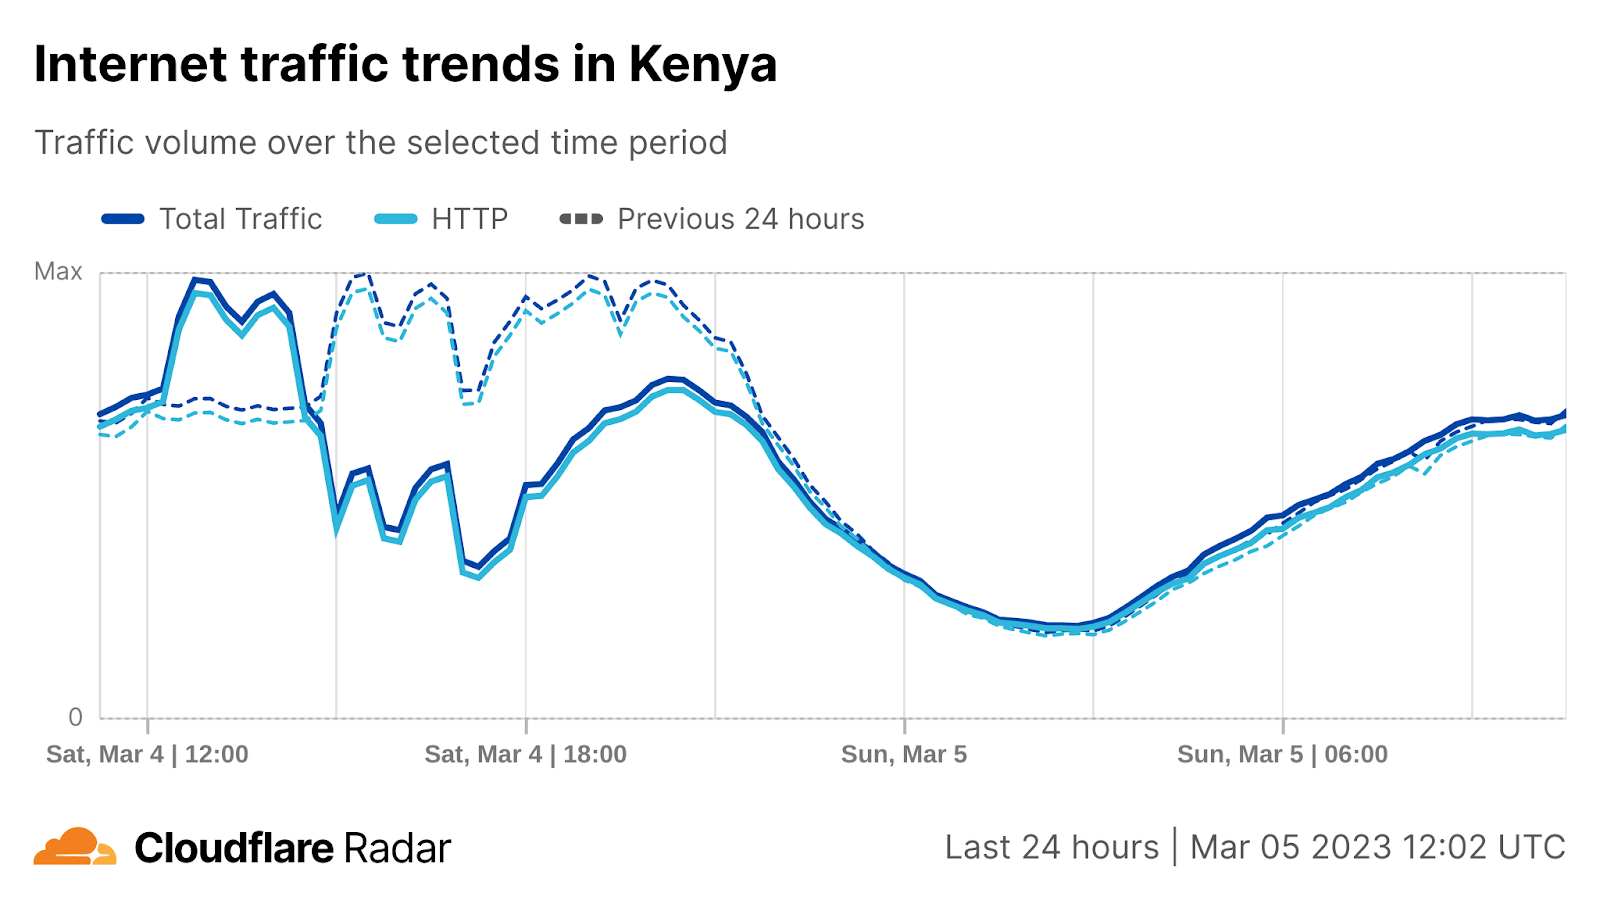
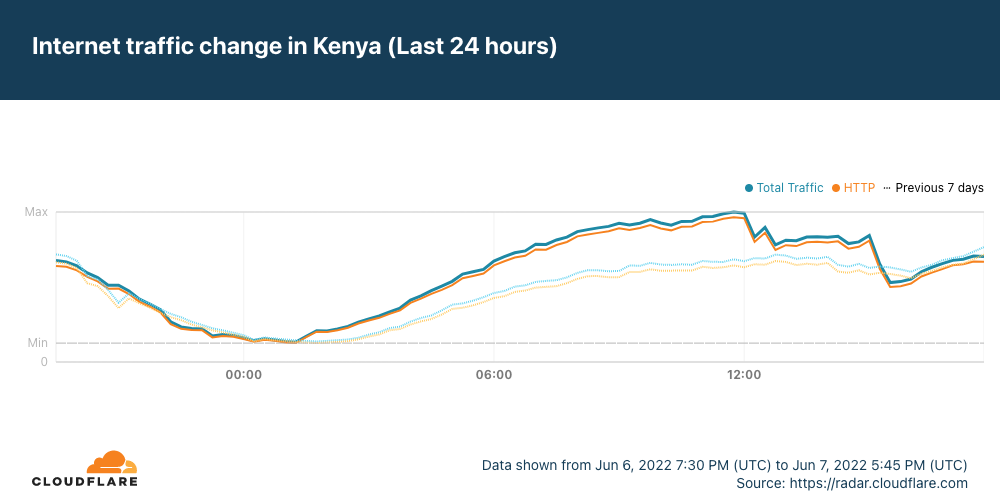
Just a few days later on March 4, Kenya Power issued a Customer Alert at 18:25 local time (15:25 UTC) regarding a nationwide power outage, noting that it had “lost bulk power supply to various parts of the country due to a system disturbance.” The alert came approximately an hour after the country’s Internet traffic dropped significantly. A subsequent tweet dated midnight local time (21:00 UTC) claimed that “electricity supply has been restored to all areas countrywide” and the figure below shows that traffic levels returned to normal levels shortly thereafter.
Earthquake
Turkey
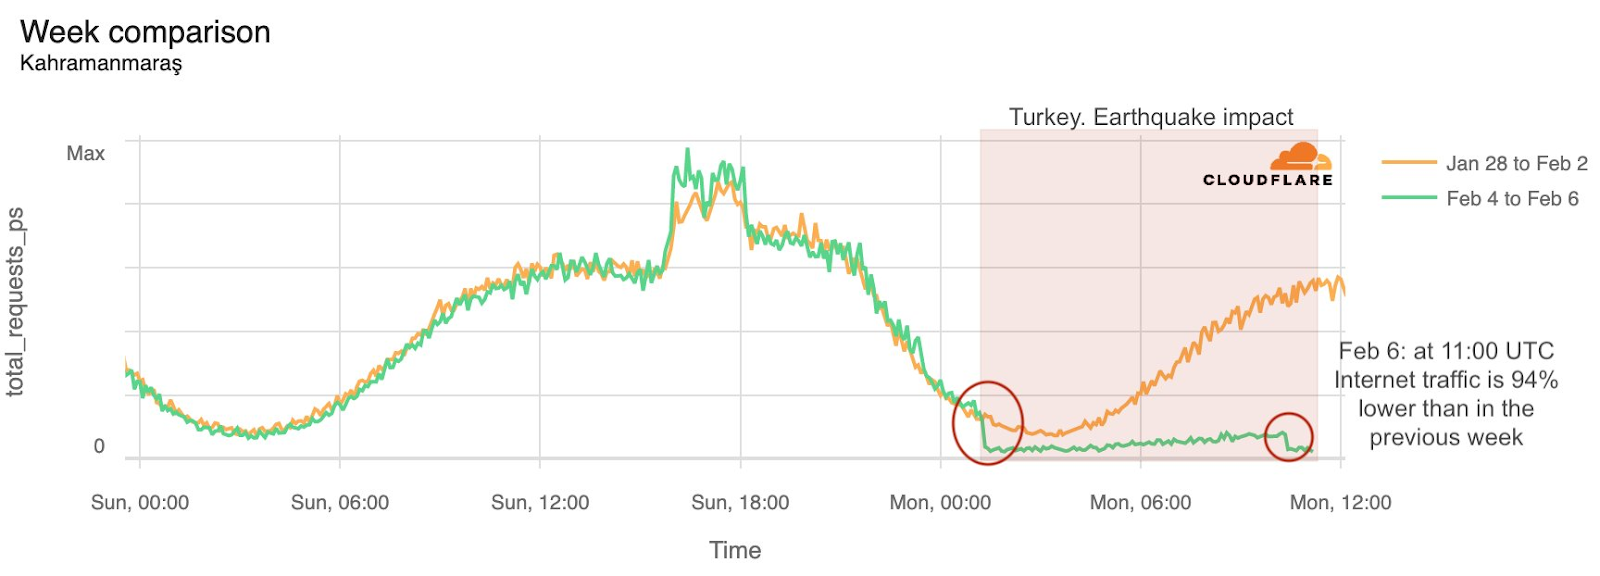
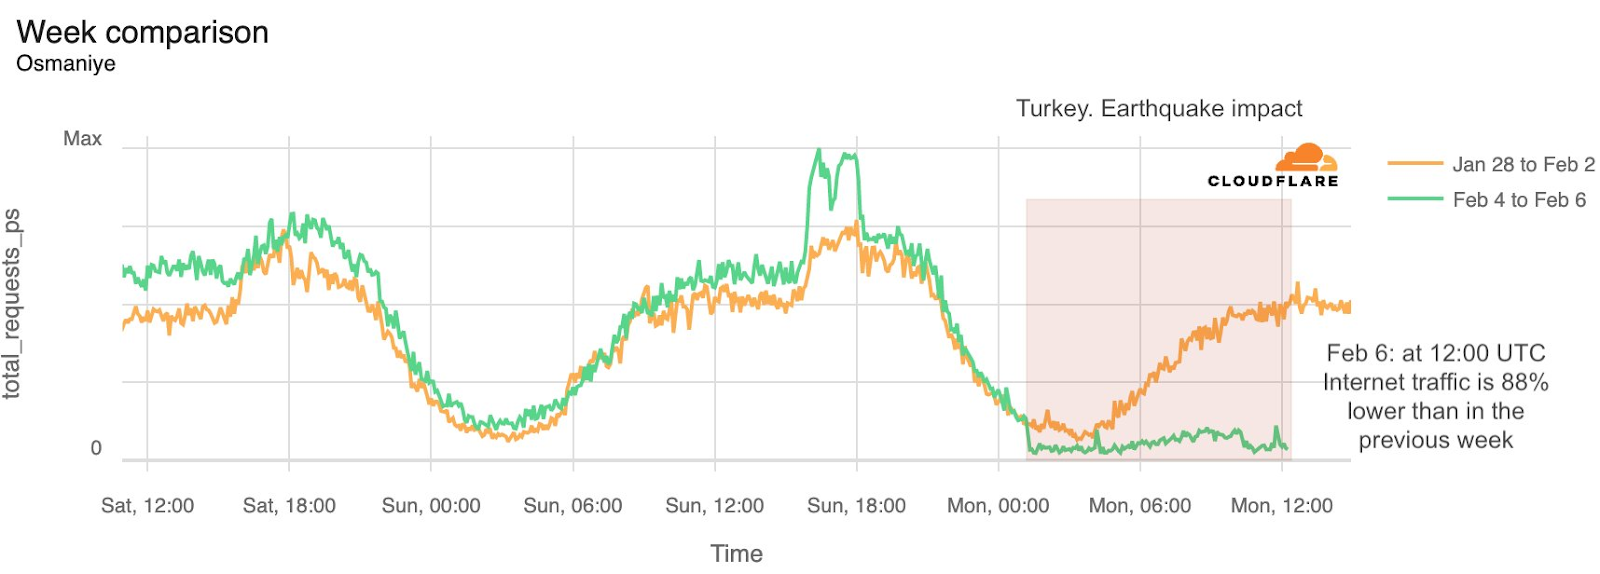
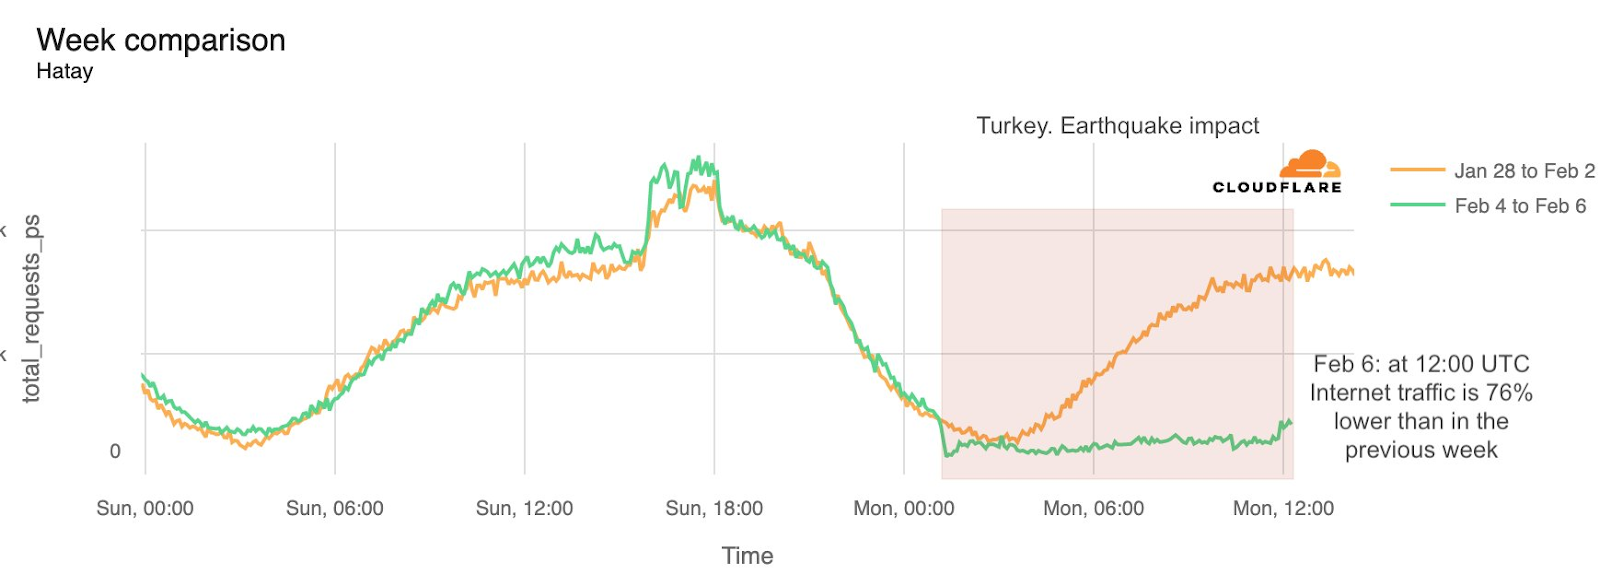
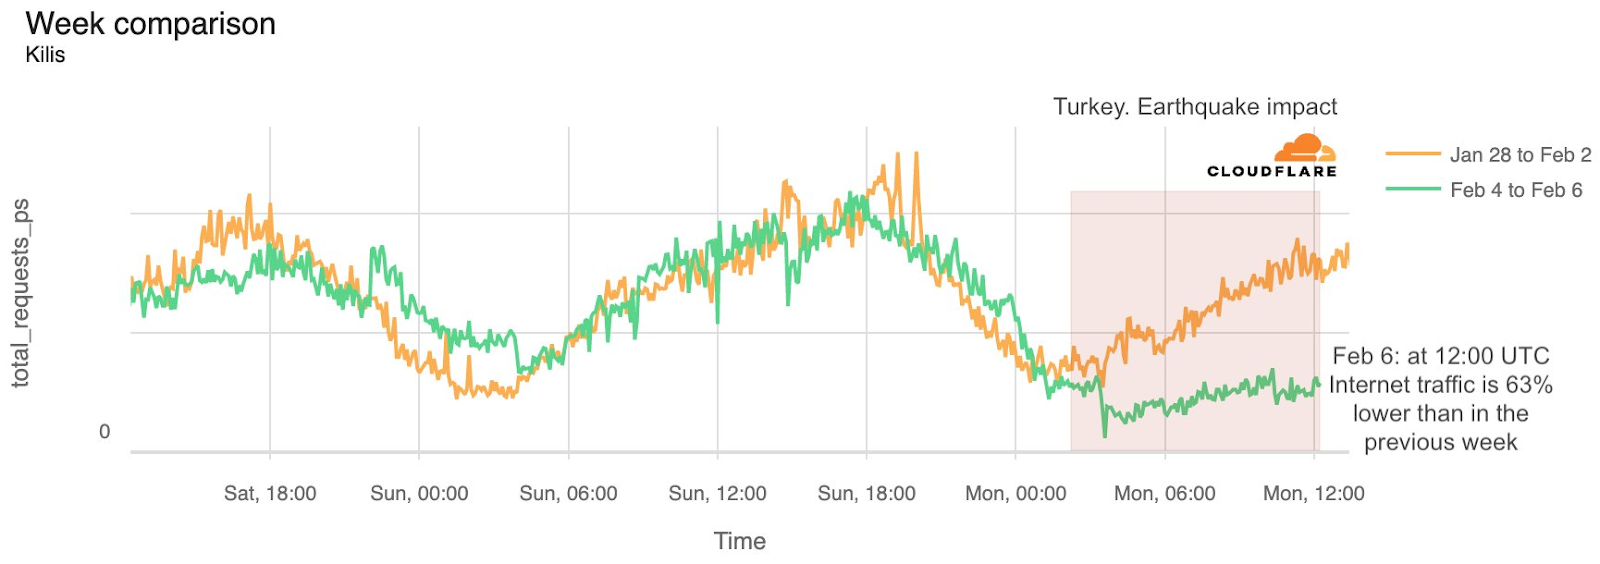
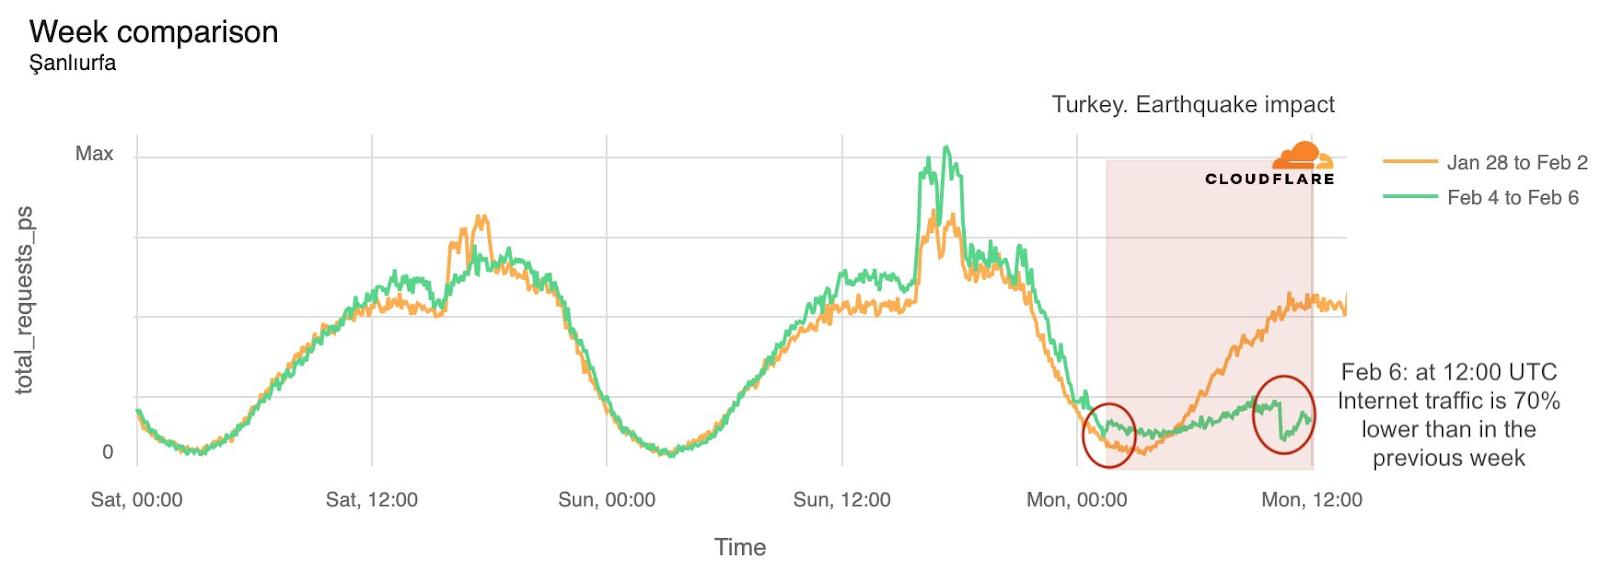
On February 5, a magnitude 7.8 earthquake occurred 23 km east of Nurdağı, Turkey, leaving many thousands dead and injured. The quake, which occurred at 04:17 local time (01:17 UTC), was believed to be the strongest to hit Turkey since 1939. The widespread damage and destruction resulted in significant disruptions to Internet connectivity in multiple areas of the country, as shown in the figures below. Although Internet traffic volumes were relatively low because it was so early in the morning, the graphs show it dropping even further at or around the time of the earthquake. Nearly half a day later, traffic volumes in selected locations were between 63-94% lower than at the same time the previous week. A month later, after several aftershocks, traffic volumes had mostly recovered, although some regions were still struggling to recover.
Weather
New Zealand
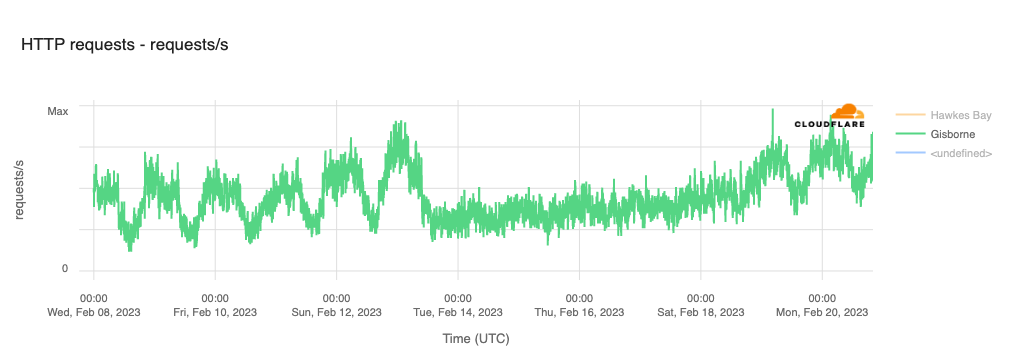
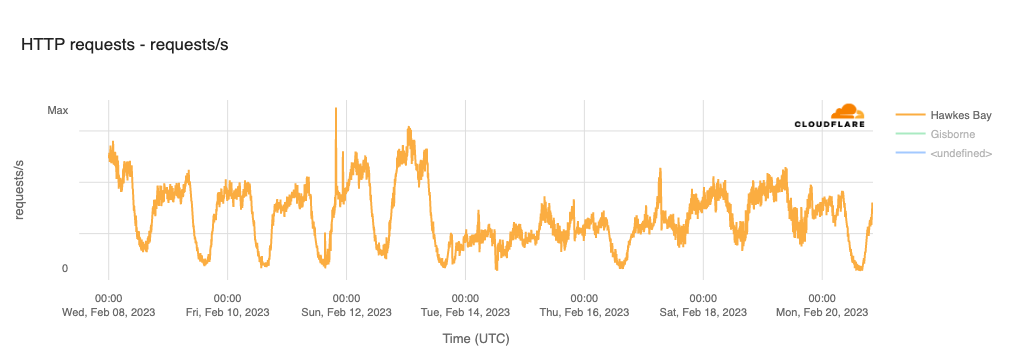
Called the “country’s biggest weather event in a century”, Cyclone Gabrielle wreaked havoc on northern New Zealand, including infrastructure damage and power outages impacting tens of thousands of homes. As a result, regions including Gisborne and Hawkes Bay experienced Internet disruptions that lasted several days, starting at 00:00 local time on February 14 (11:00 UTC on February 13). The figures below show that in both regions, peak traffic volume returned to pre-cyclone levels around February 19.
Vanuatu
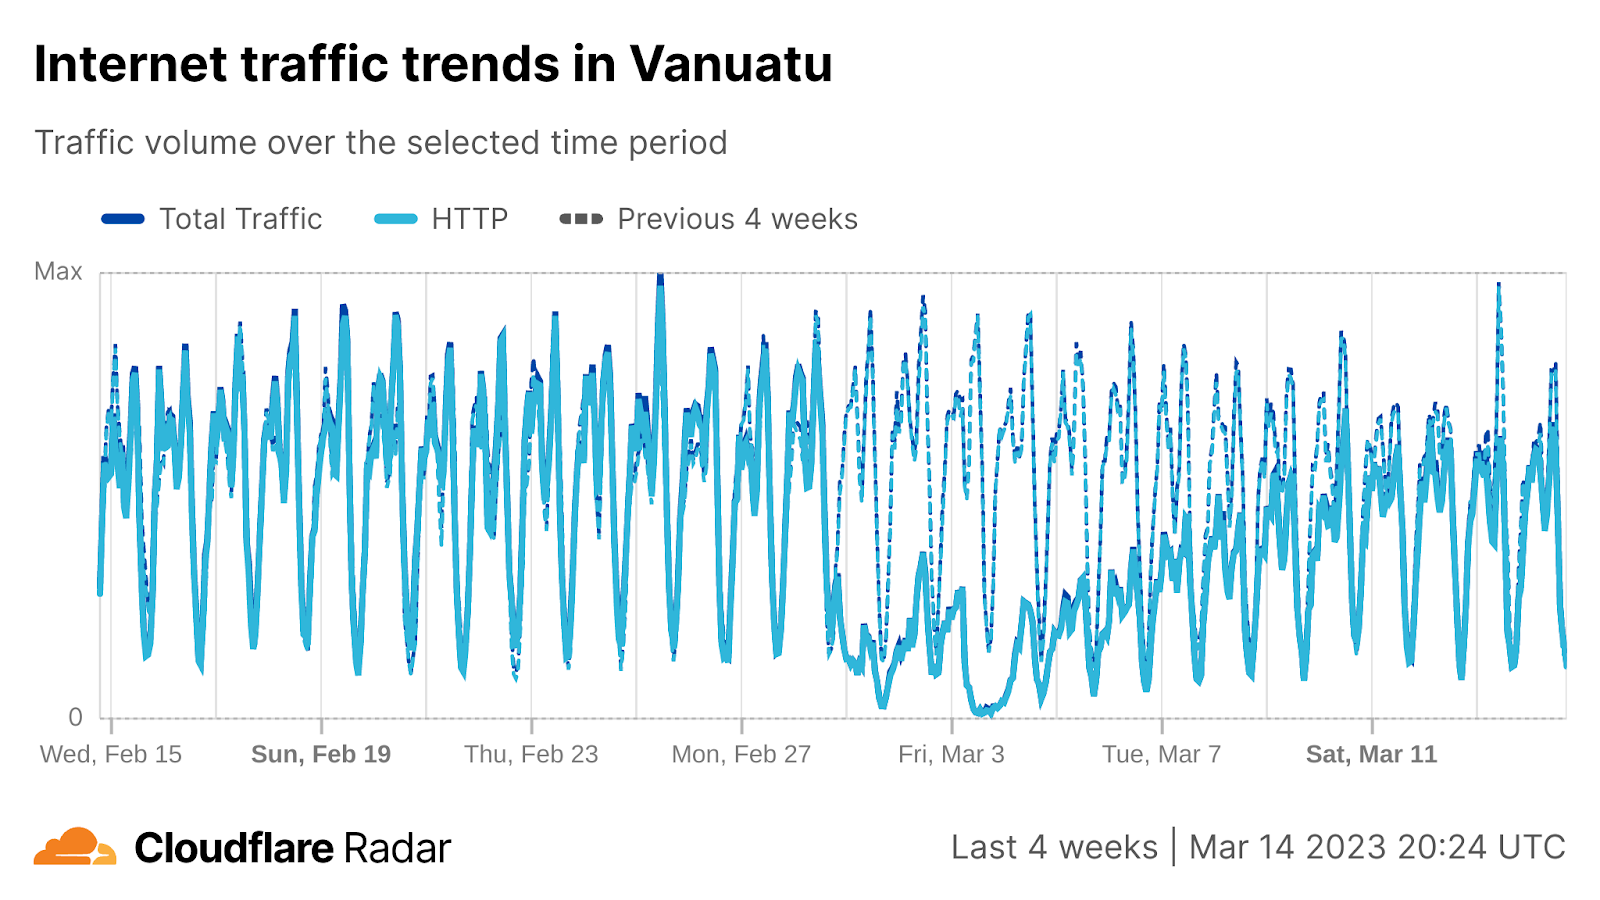
Later in February, Cyclone Judy hit the South Pacific Ocean nation of Vanuatu, the South Pacific Ocean nation made up of roughly 80 islands that stretch 1,300 kilometers. The Category 4 cyclone damaged homes and caused power outages, resulting in a significant drop in the country’s Internet traffic. On February 28, Vanuatu’s traffic dropped by nearly 80% as the cyclone struck, and as seen in the figure below, it took nearly two weeks for traffic to recover to the levels seen earlier in February.
Malawi
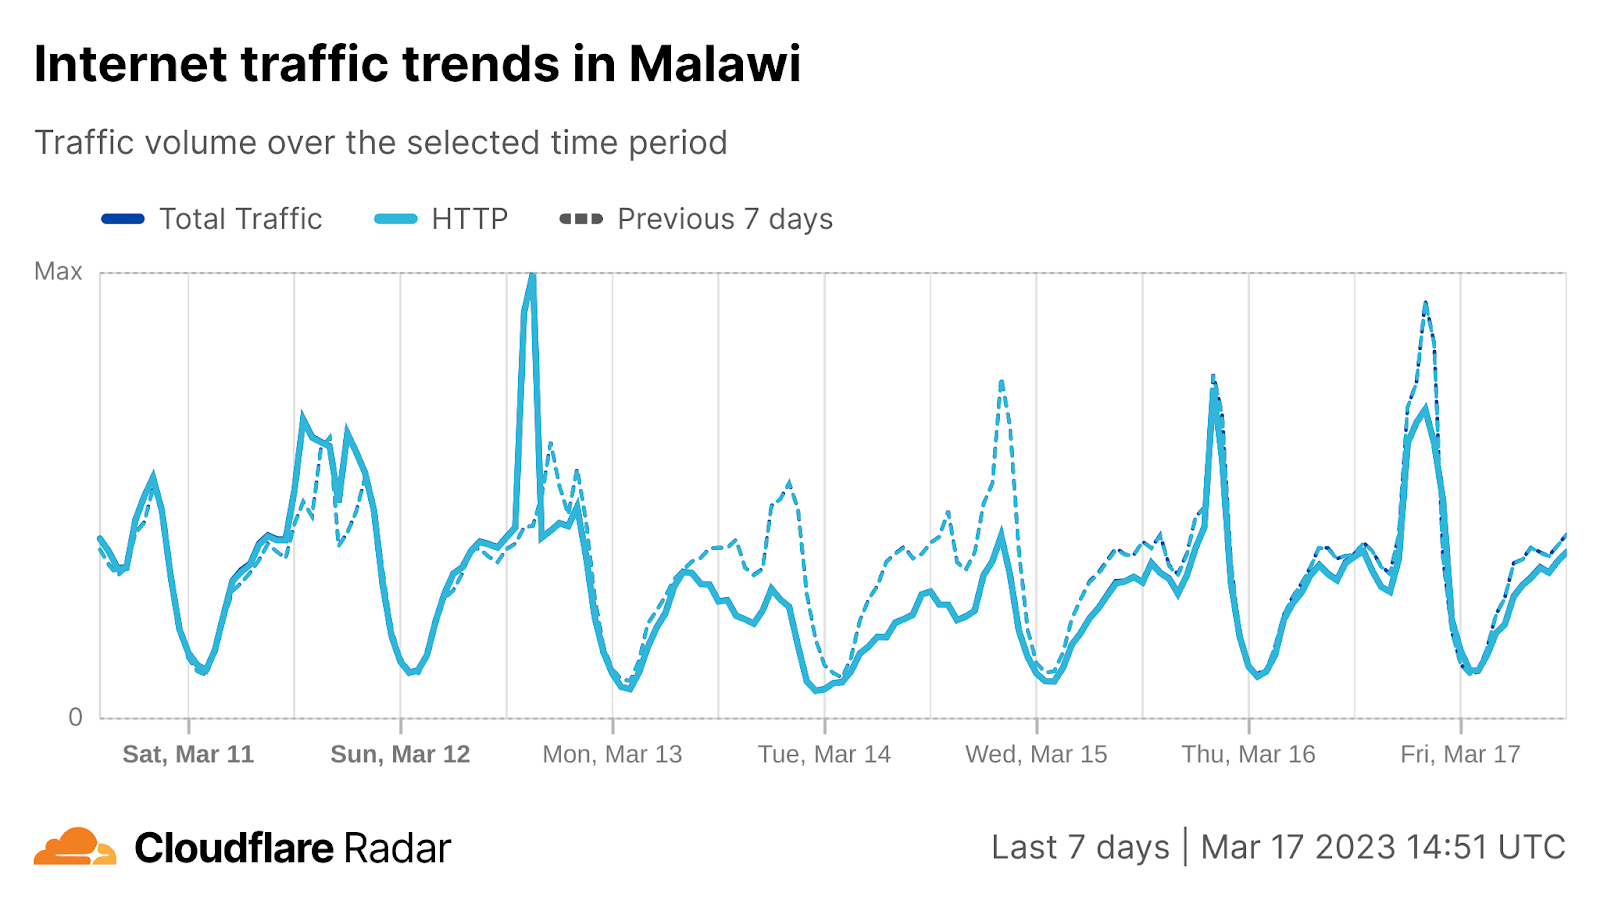
Cyclone Freddy, said to be the longest-lasting, most powerful cyclone on record, hit Malawi during the weekend of March 11-12, and into Monday, March 13. The resulting damage disrupted Internet connectivity in the east African country, with traffic dropping around 11:00 local time (09:00 UTC) on March 13. The disruption lasted for over two days, with traffic levels recovering around 21:00 local time (19:00 UTC) on March 15.
Technical problems
South Africa
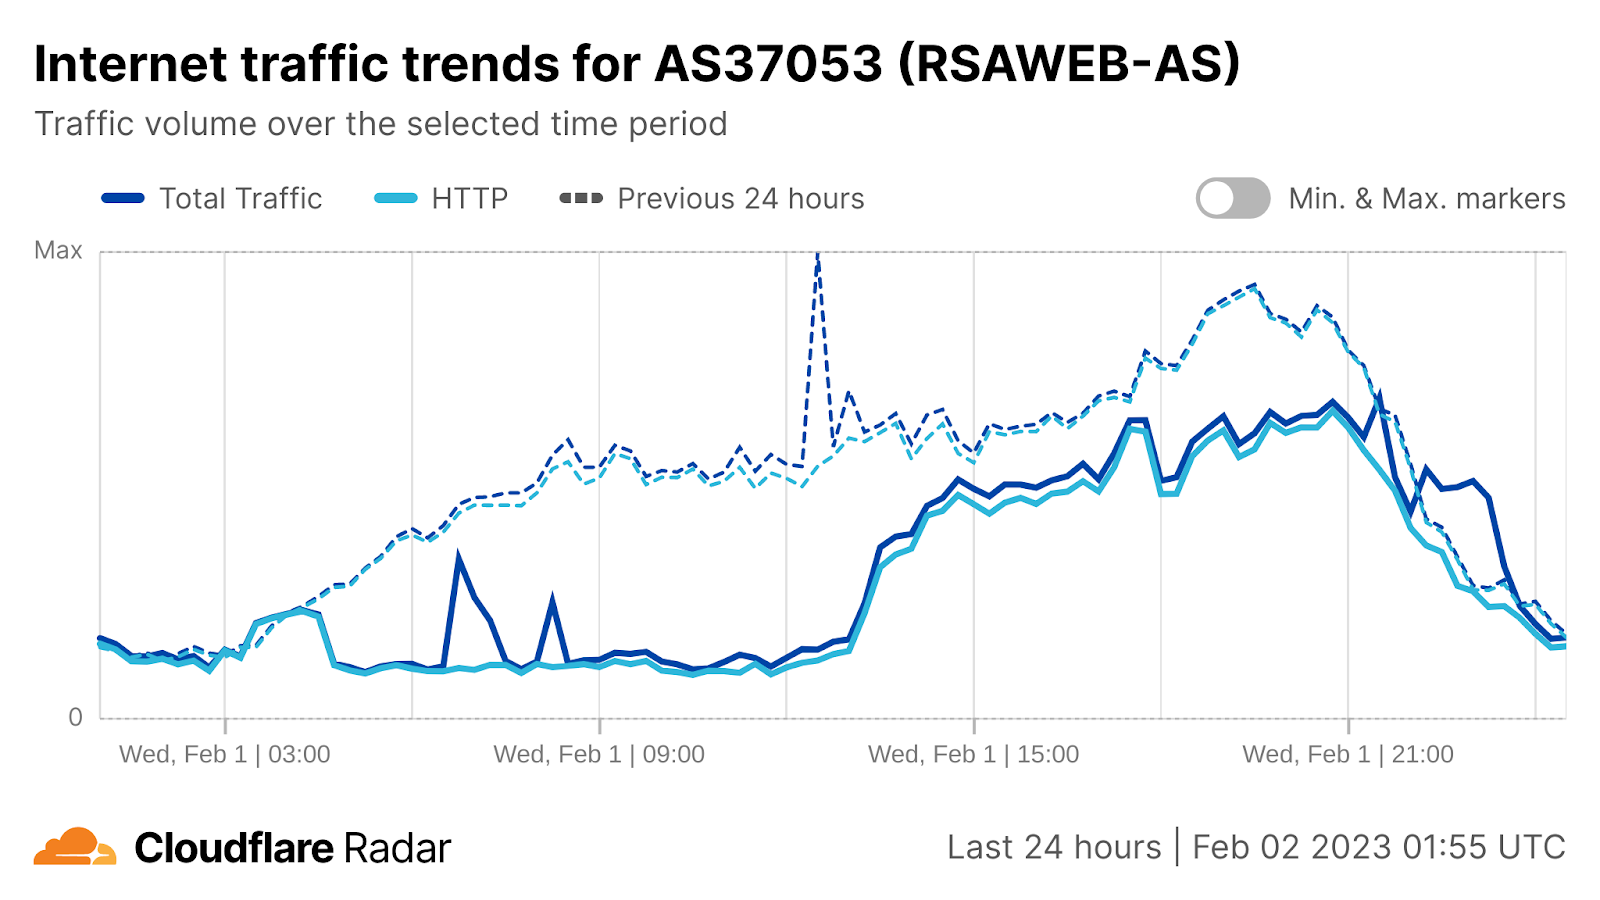
Just before 07:00 local time (05:00 UTC) on February 1, South African service provider RSAWEB initially tweeted about a problem that they said was impacting their cloud and VOIP platforms. However, in several subsequent tweets, they noted that the problem was also impacting internal systems, as well as fiber and mobile connectivity. The figure below shows traffic for RSAWEB dropping at 06:30 local time (04:30 UTC), a point at which it would normally be starting to increase for the day. Just before 16:00 local time (14:00 UTC), RSAWEB tweeted“…engineers are actively working on restoring services post the major incident. Customers who experienced no connectivity may see some services restoring.” The figure below shows a sharp increase in traffic around that time with gradual growth through the evening. However, full restoration of services across all of RSAWEB’s impacted platforms took a full week, according to a February 8 tweet.
Italy
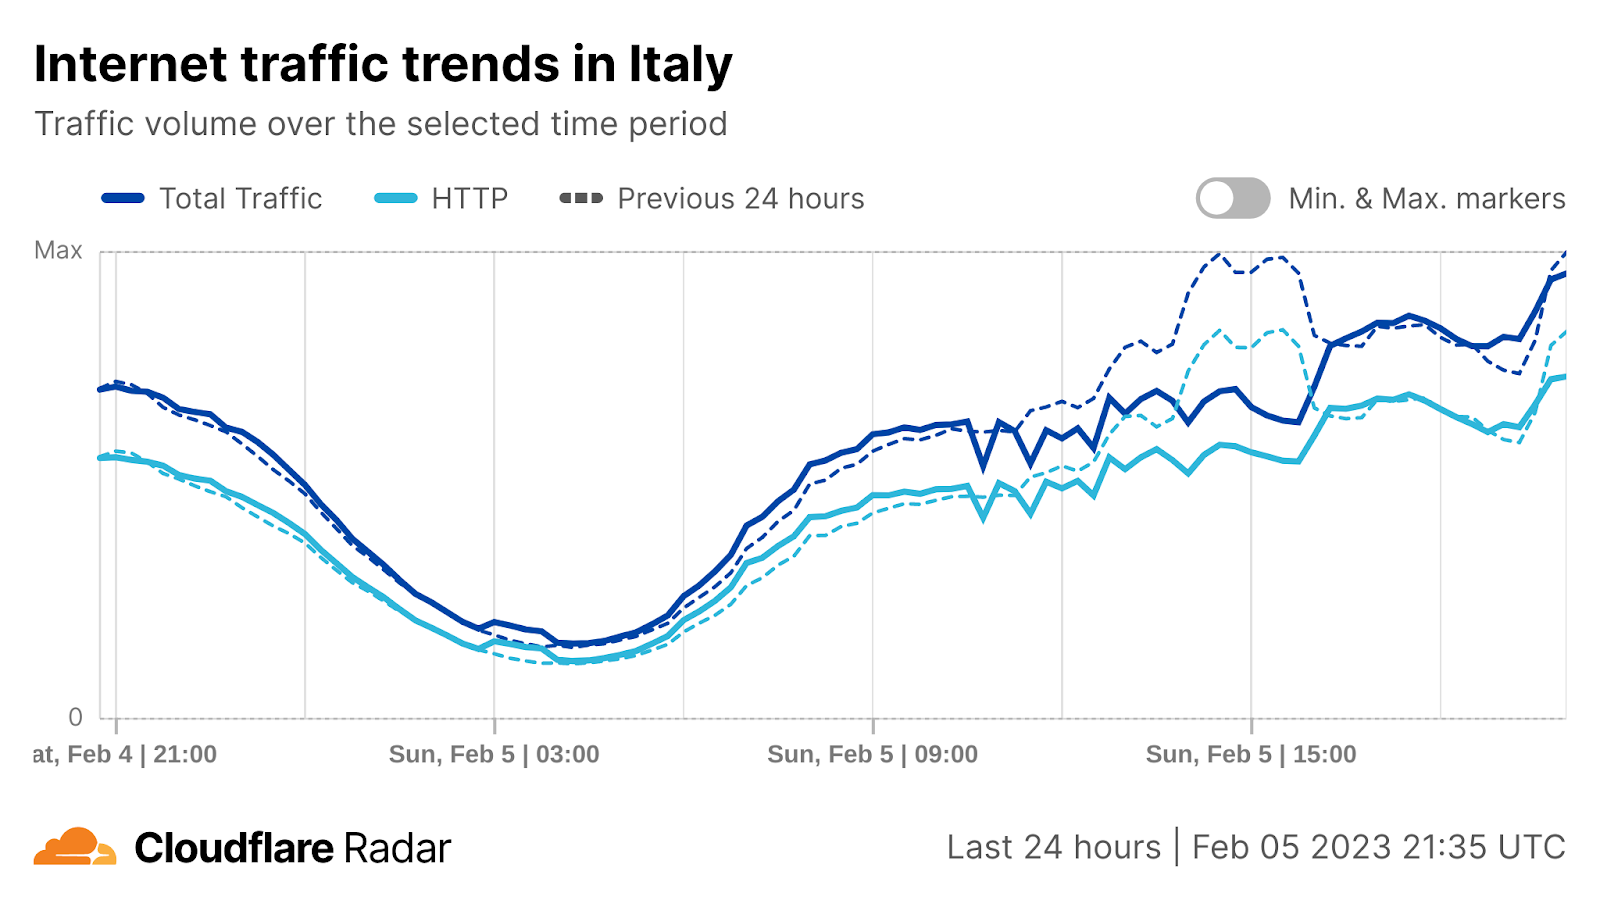
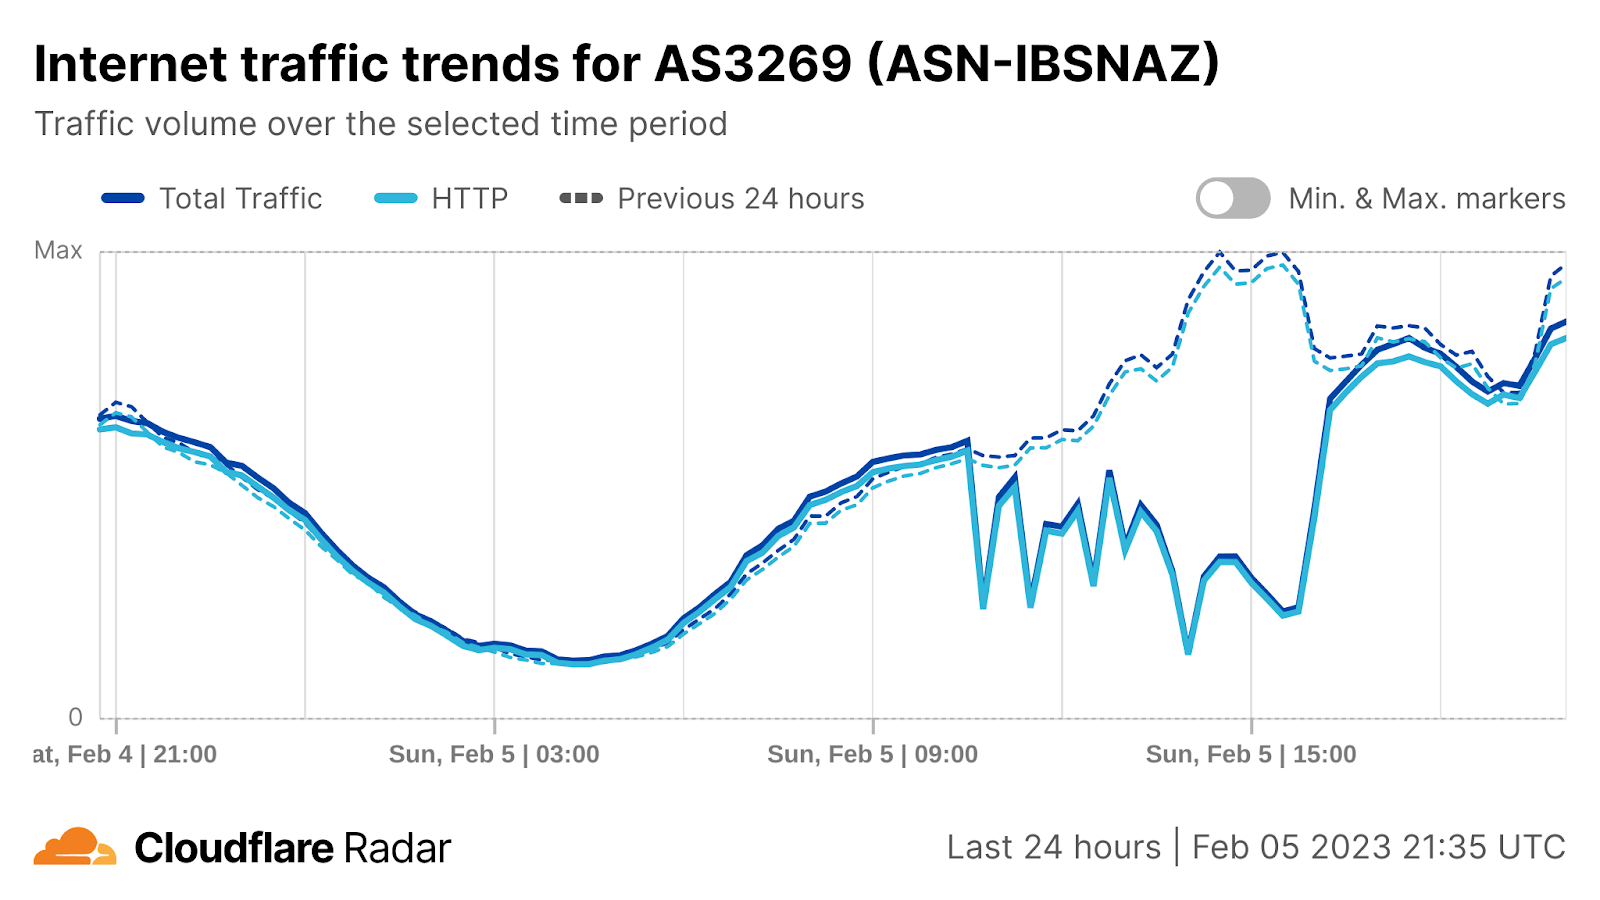
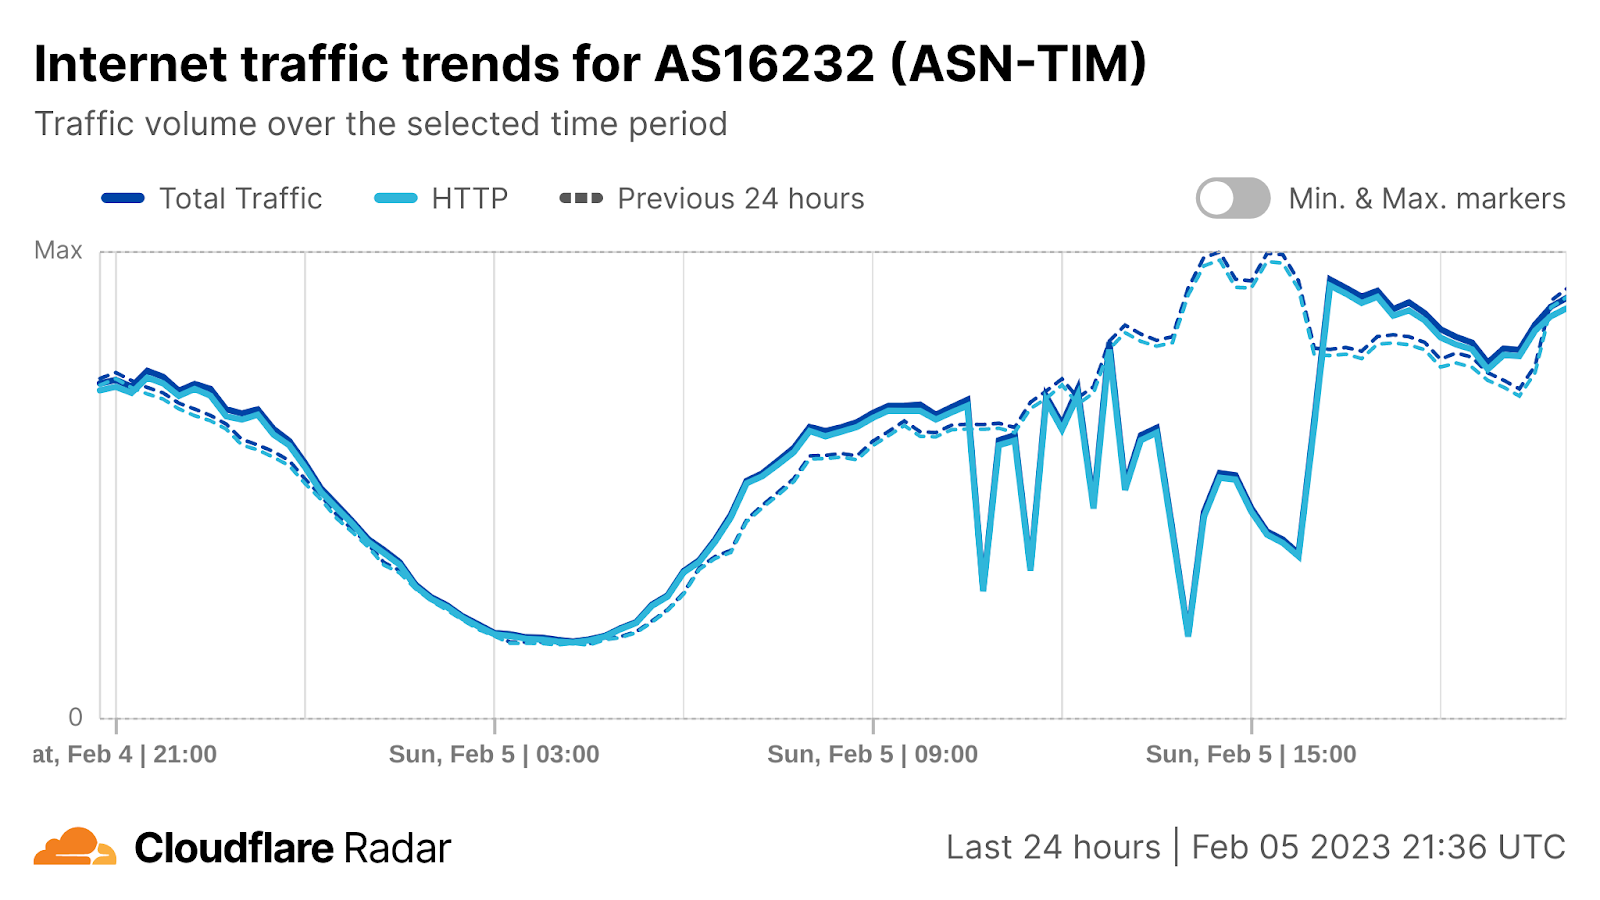
An unspecified “international interconnectivity problem” impacting Telecom Italia caused a multi-hour Internet disruption in Italy on February 5. At a country level, a nominal drop in traffic is visible in the figure below starting around 11:45 local time (10:45 UTC) with some volatility visible in the lower traffic through 17:15 local time (16:15 UTC). However, the impact of the problem is more obvious in the traffic graphs for AS3269 and AS16232, both owned by Telecom Italia. Both graphs show a more significant loss of traffic, as well as greater volatility through the five-plus hour disruption.
Myanmar
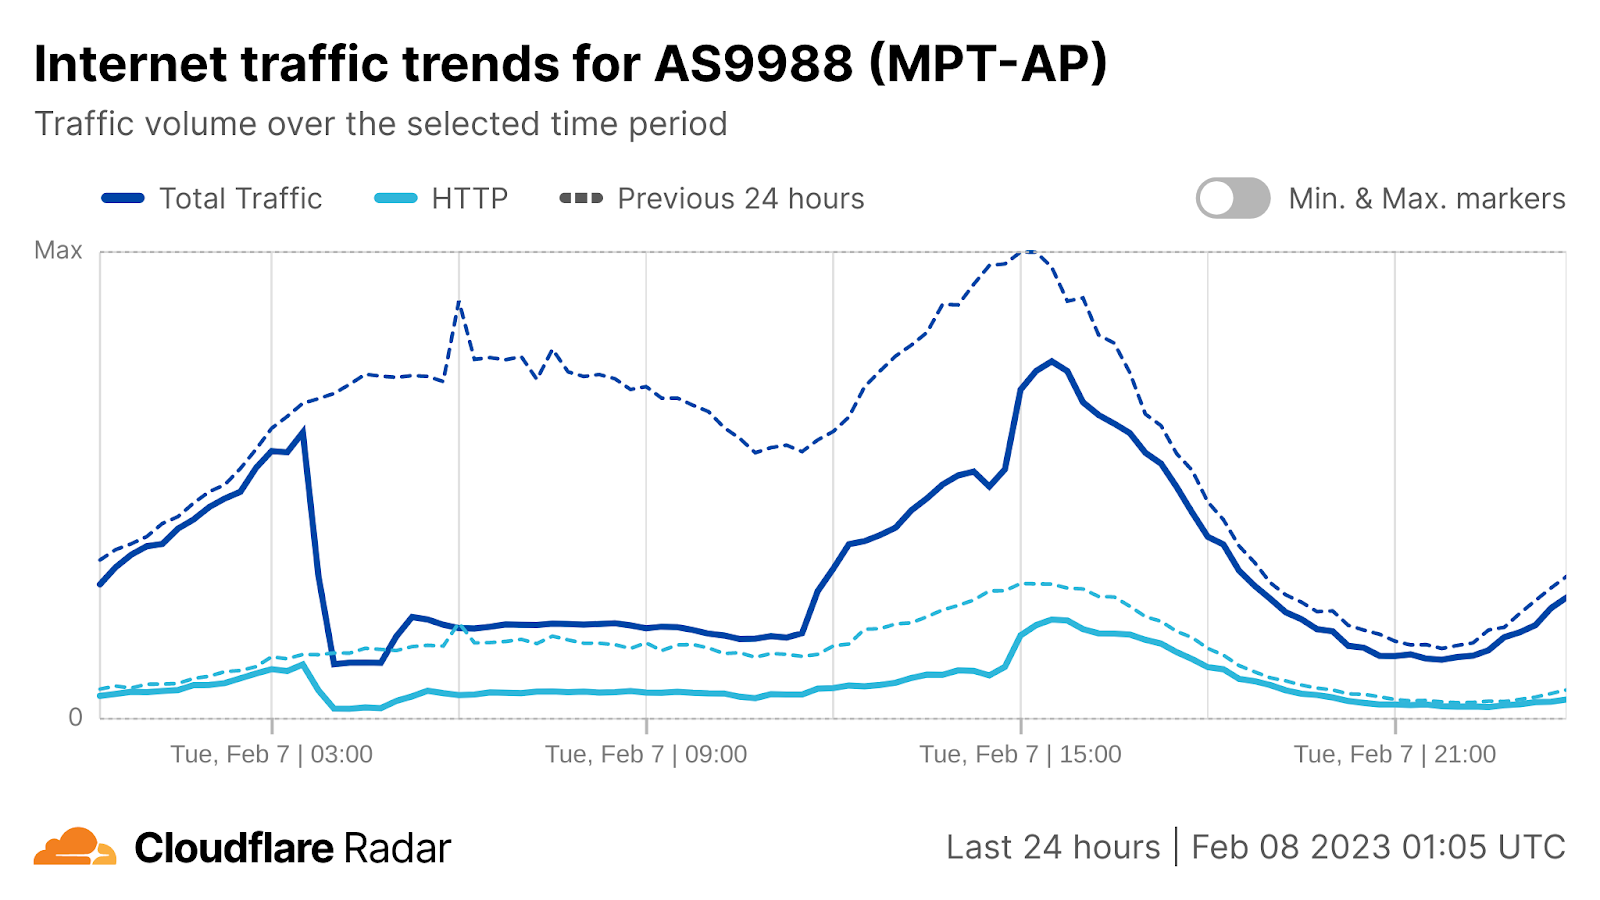
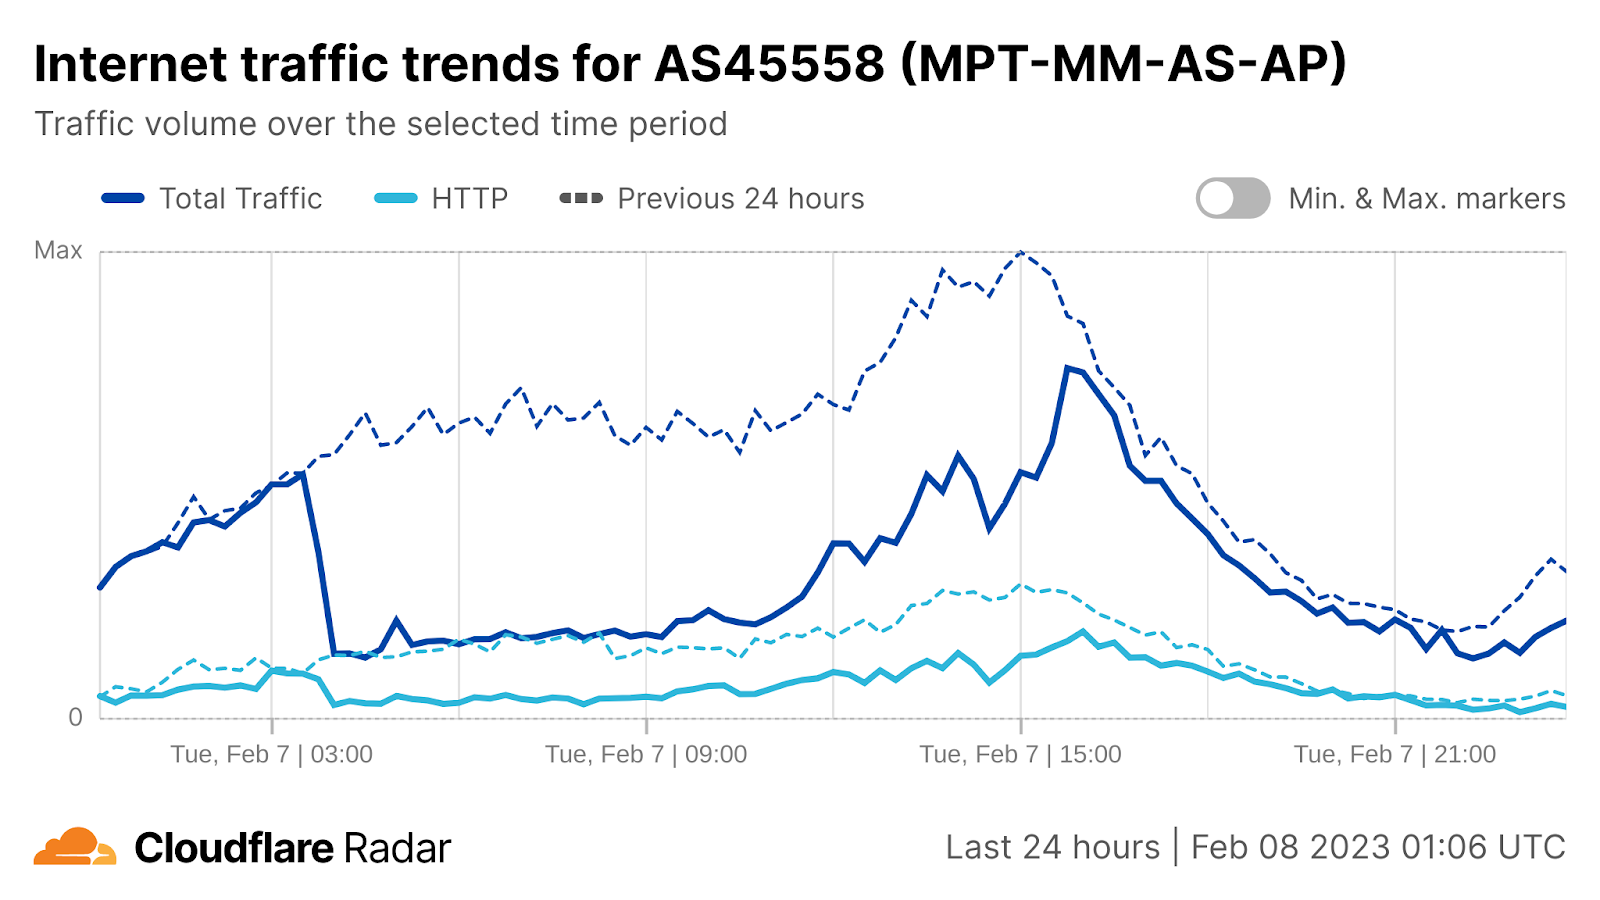
A fire at an exchange office of MPT (Myanma Posts and Telecommunications) on February 7 disrupted Internet connectivity for customers of the Myanmar service provider. A Facebook post from MPT informed customers that “We are currently experiencing disruptions to our MPT’s services including MPT’s call centre, fiber internet, mobile internet and mobile and telephone communications.” The figure below shows the impact of this disruption on MPT-owned AS9988 and AS45558, with traffic dropping significantly at 10:00 local time (03:30 UTC). Significant recovery was seen by 22:00 local time (15:30 local time).
Republic of the Congo (Brazzaville)
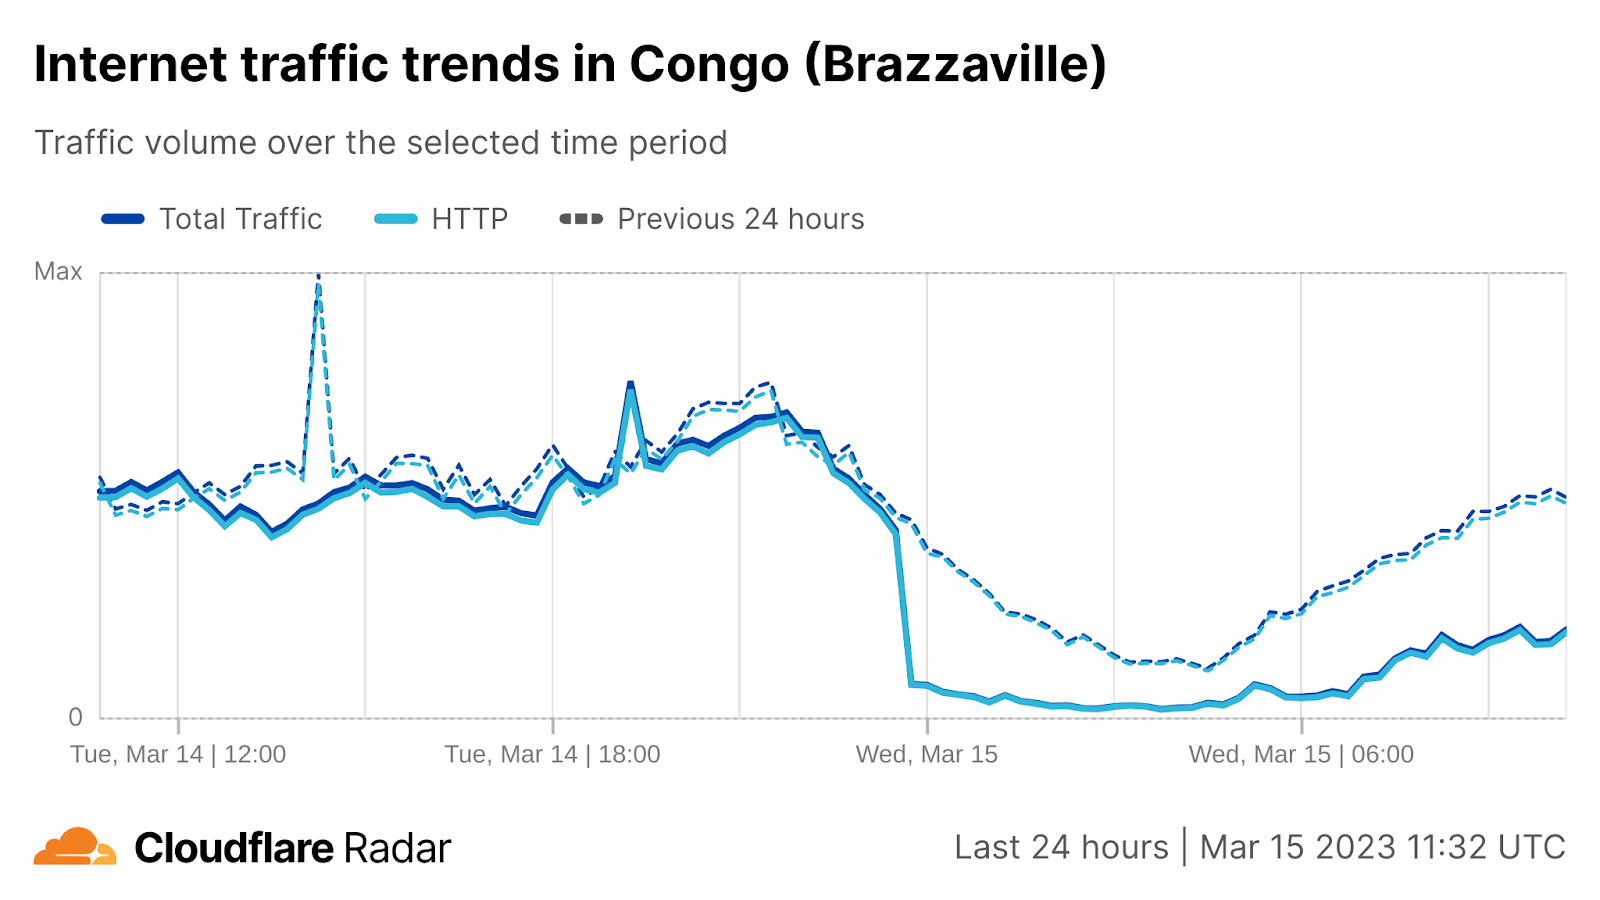
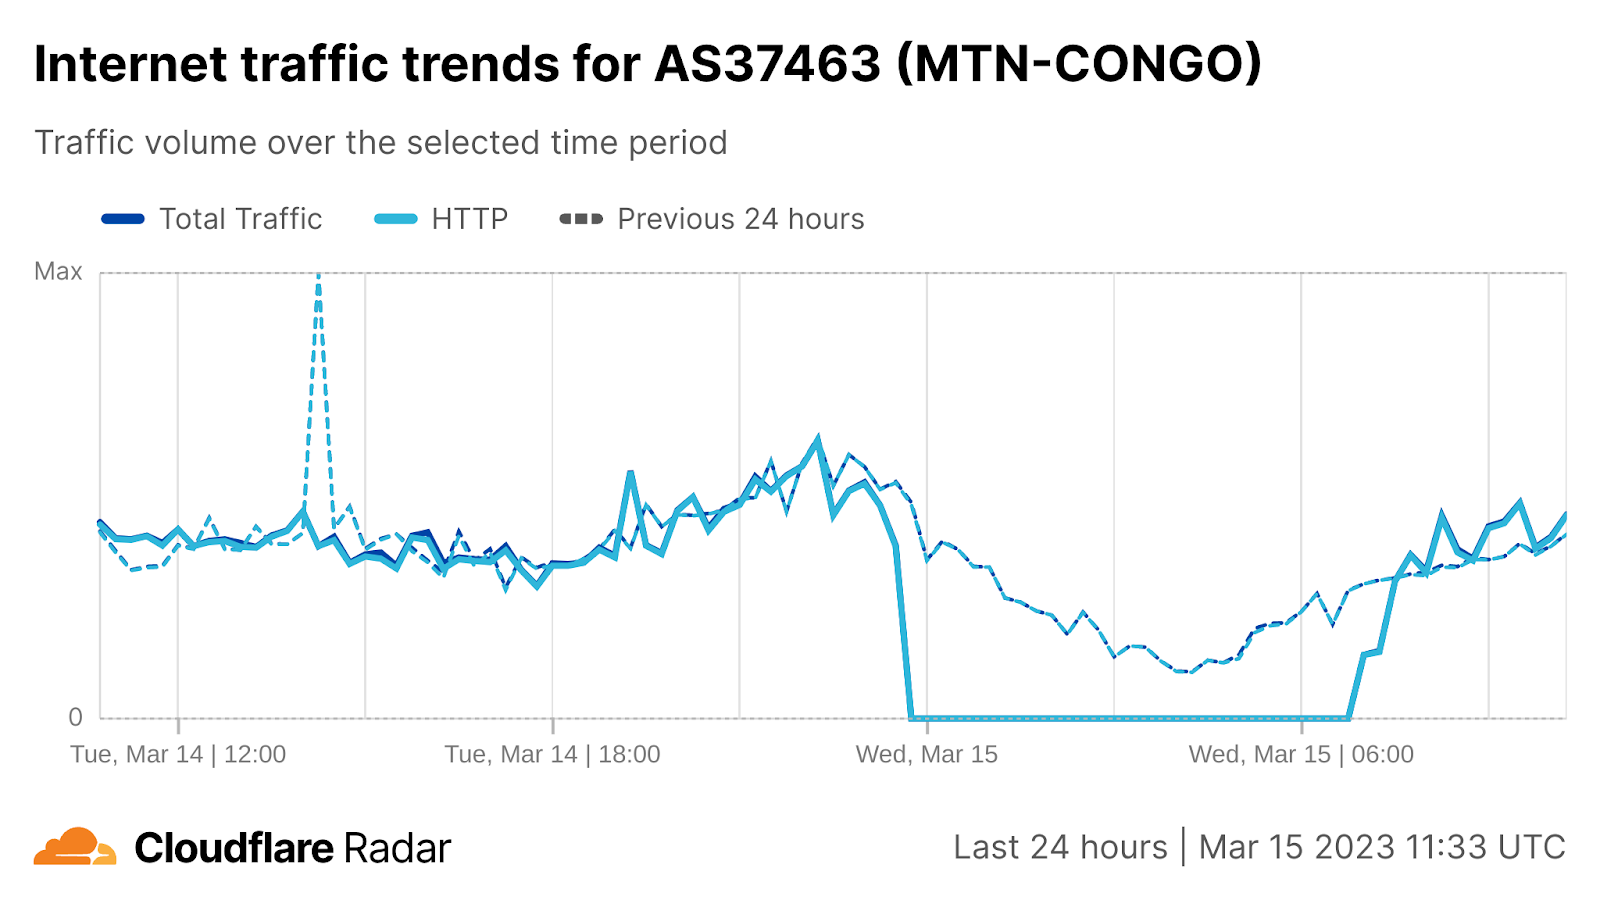
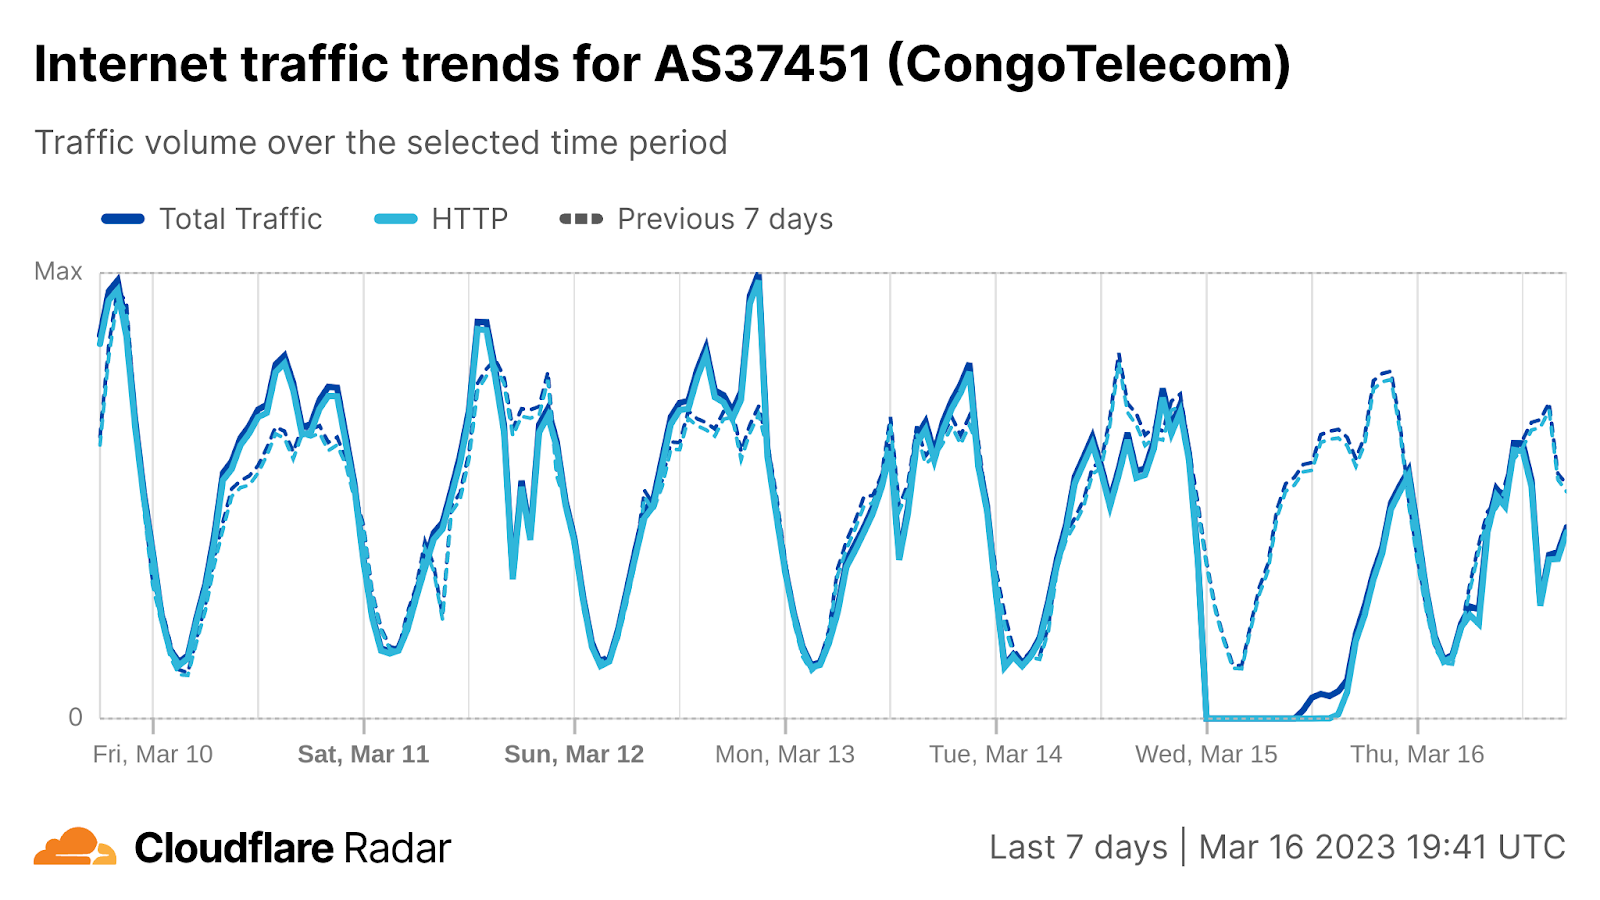
Congo Telecomtweeted a “COMMUNIQUÉ” on March 15, alerting users to a service disruption due to a “network incident”. The impact of this disruption is clearly visible at a country level, with traffic dropping sharply at 00:45 local time (23:45 on March 14 UTC), driven by complete outages at MTN Congo and Congo Telecom, as seen in the graphs below. While traffic at MTN Congo began to recover around 08:00 local time (07:00 UTC), Congo Telecom’s recovery took longer, with traffic beginning to increase around 17:00 local time (16:00 UTC). Congo Telecom tweeted on March 16 that the nationwide Internet outage had been resolved. MTN Congo did not acknowledge the disruption on social media, and neither company provided more specific information about the reported “network incident”.
Lebanon
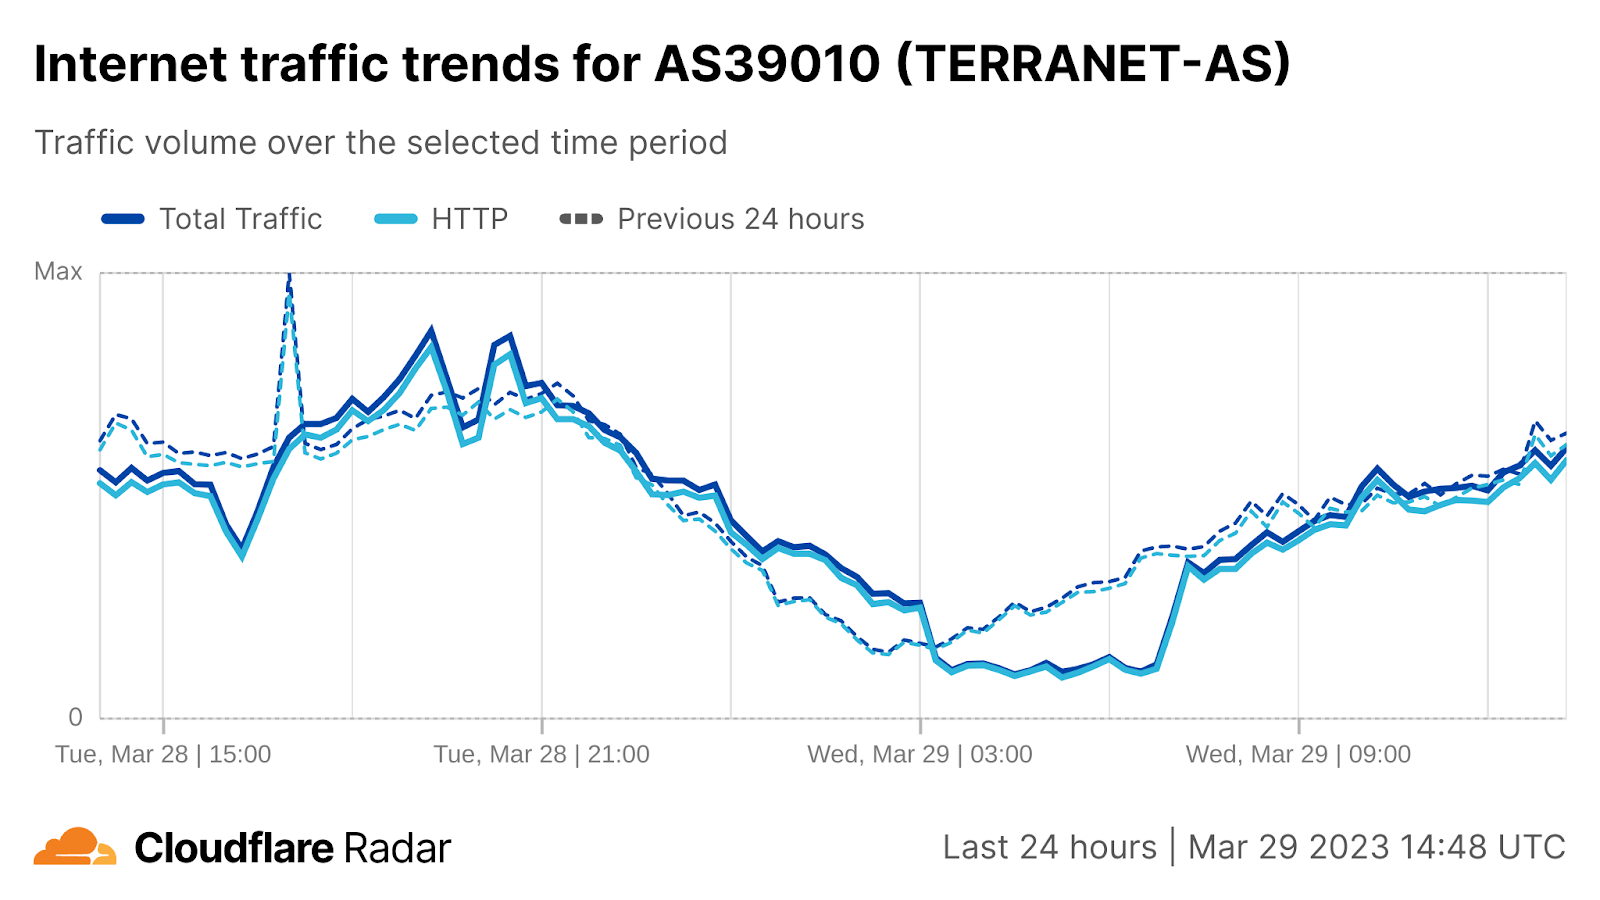
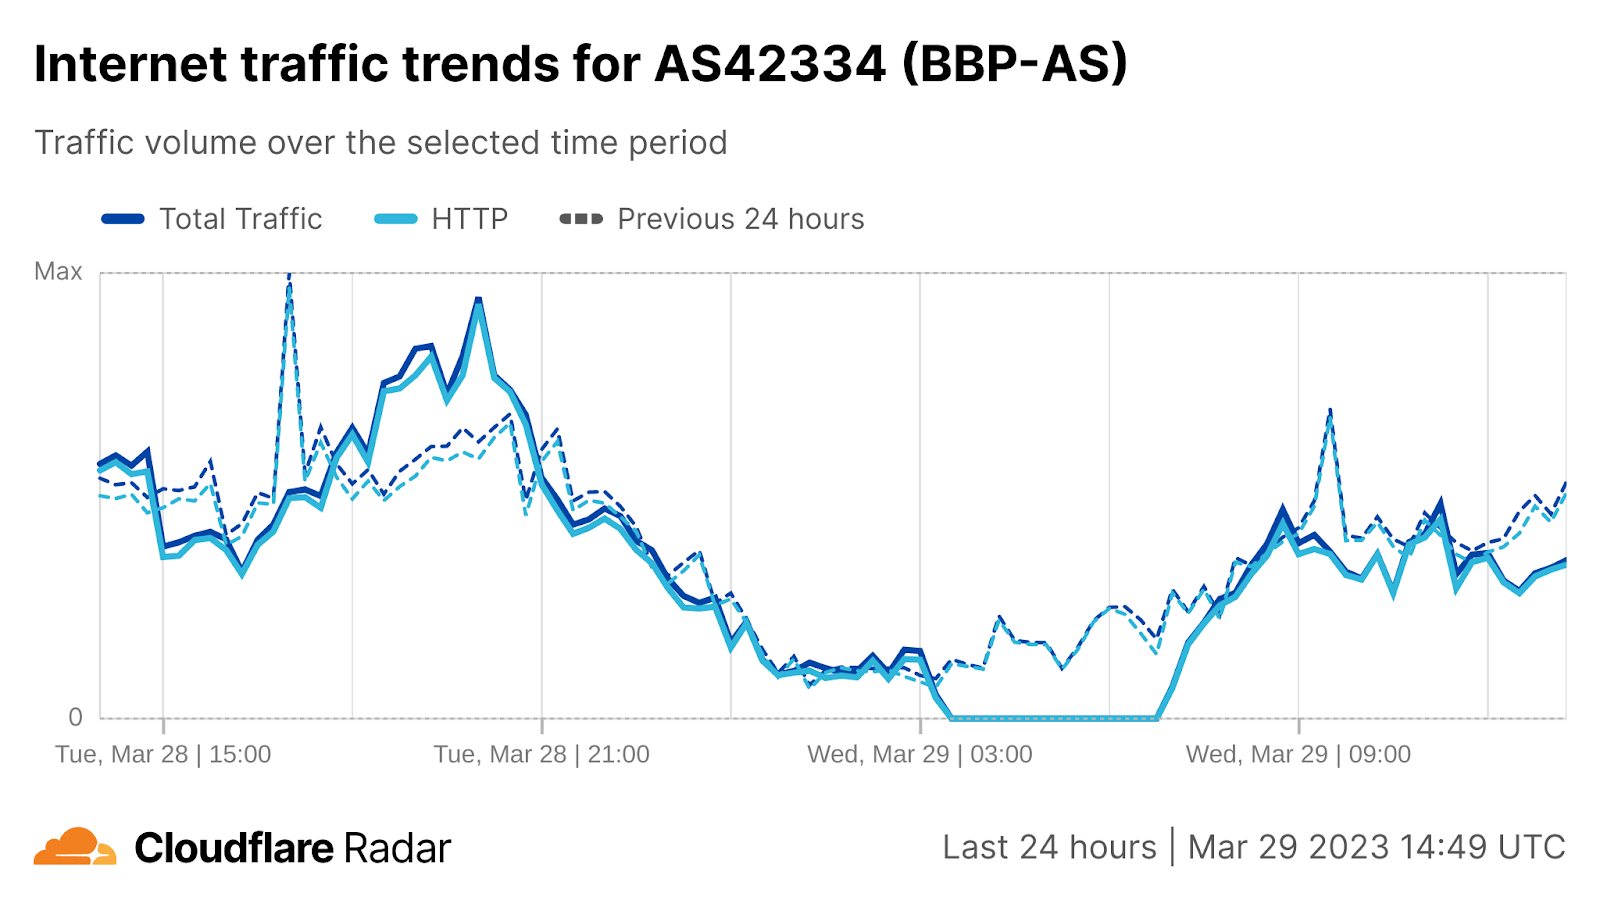
Closing out March, disruptions observed at AS39010 (Terranet) and AS42334 (Mobi) in Lebanon may have been related to a strike at upstream provider Ogero Telecom, common to both networks. A published report quoted the Chairman of Ogero commenting on the strike, “We are heading to a catastrophe if a deal is not found with the government: the network will completely stop working as our generators will gradually run out of fuel. Lebanon completely relies on Ogero for its bandwidth, leaving no one exempt from a blackout.” Traffic at both Terranet and Mobi dropped around 05:00 local time (03:00 UTC) on March 29, with the disruption lasting approximately 4.5 hours, as traffic recovered at 09:30 local time (07:30 UTC).
Cyberattacks
South Korea
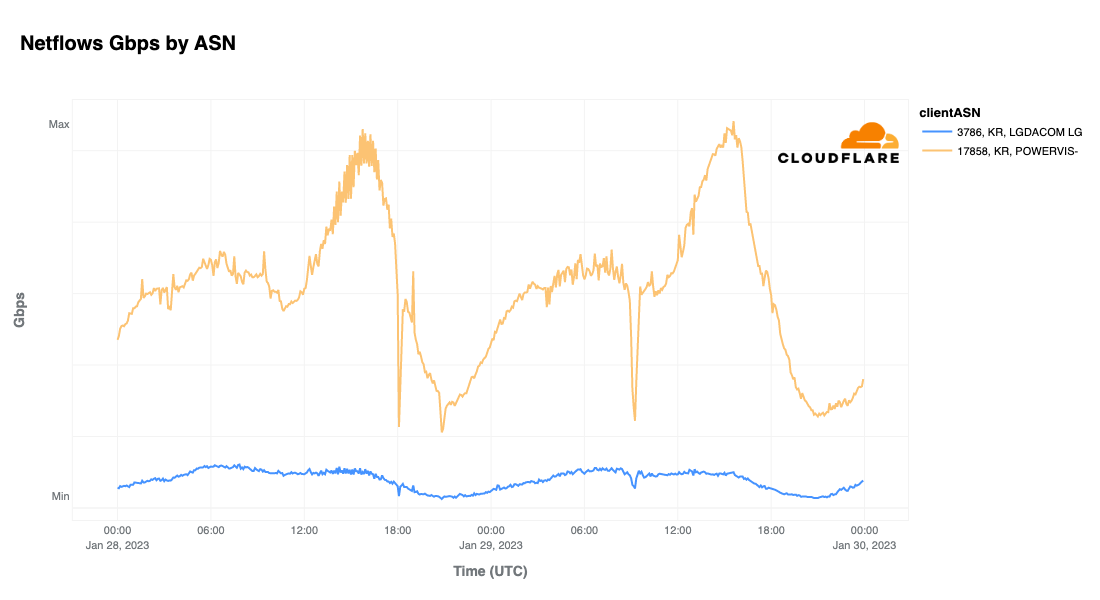
On January 29, South Korean Internet provider LG Uplus suffered two brief Internet disruptions which were reportedly caused by possible DDoS attacks. The first disruption occurred at 03:00 local time (18:00 UTC on January 28), and the second occurred at 18:15 local time (09:15 UTC). The disruptions impacted traffic on AS17858 and AS3786, both owned by LG. The company was reportedly hit by a second pair of DDoS attacks on February 4.
Guam
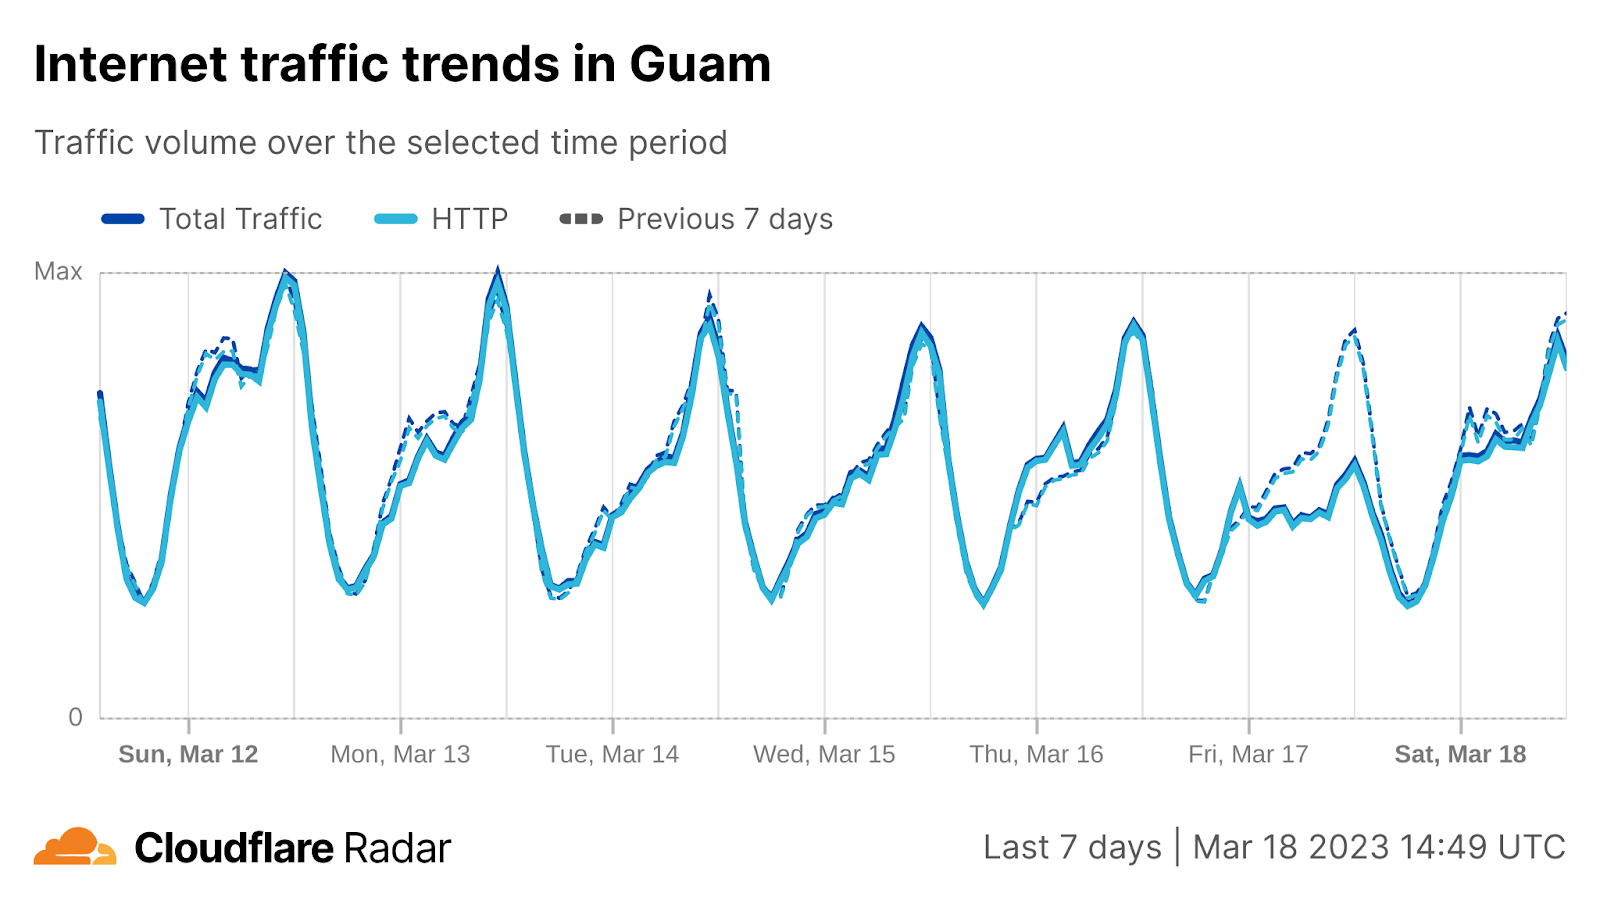
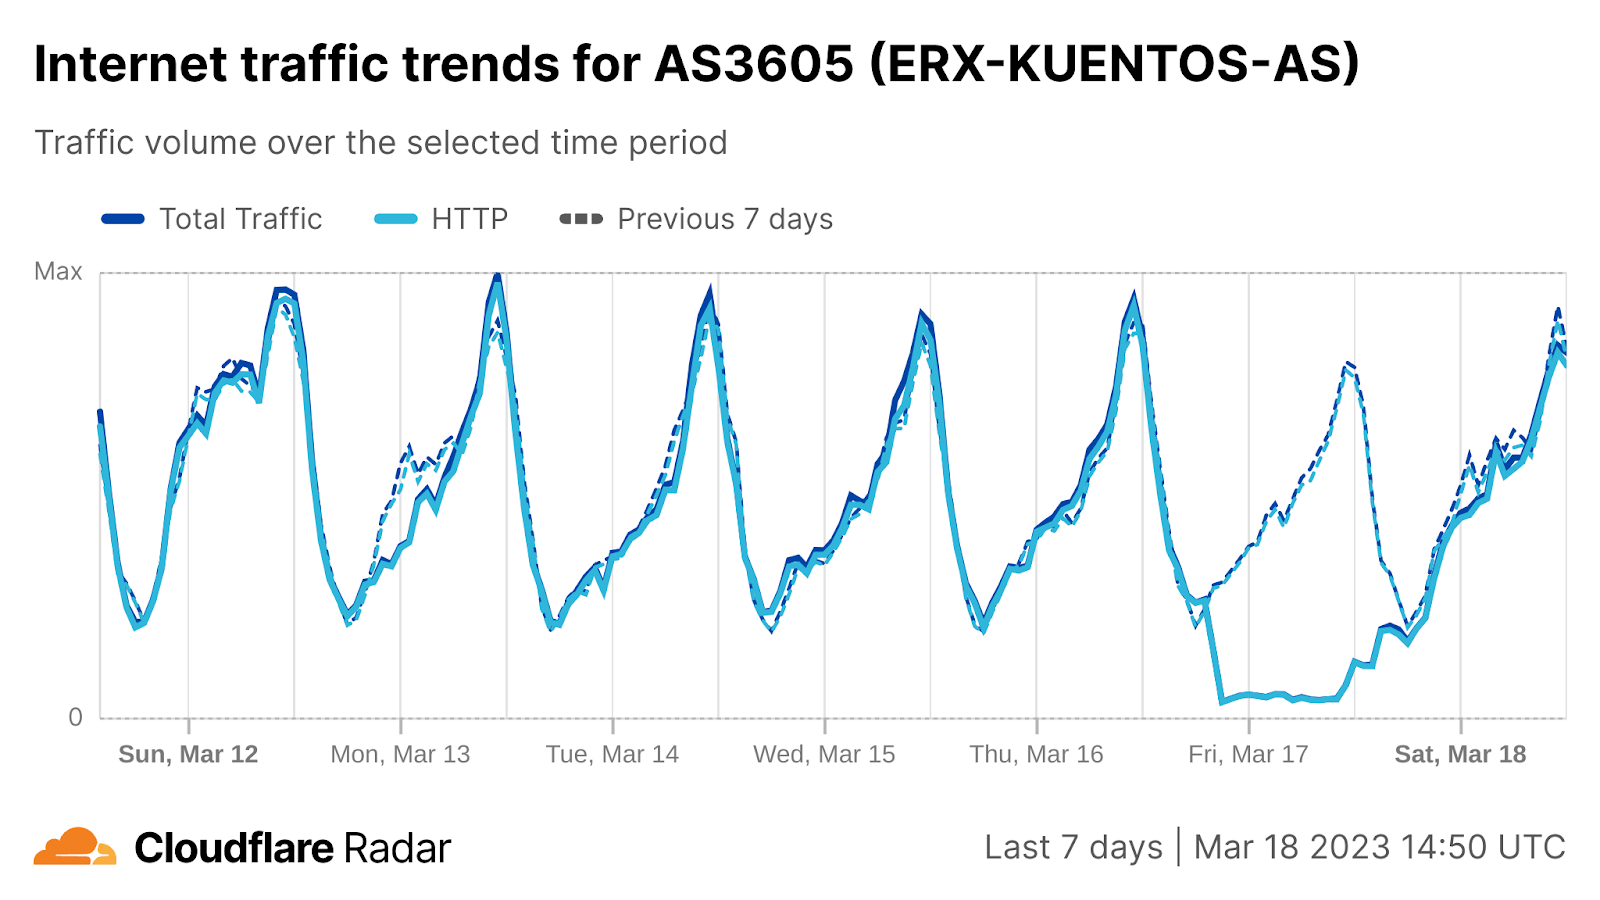
In a March 17 tweet posted at 11:30 local time (01:30 UTC), Docomo Pacific reported an outage affecting multiple services, with a subsequent tweet noting that “Early this morning, a cyber security incident occurred and some of our servers were attacked”. This outage is visible at a country level in Guam, seen as a significant drop in traffic starting around 10:00 local time (00:00 UTC) in the figure below. However, in the graph below for AS3605 (ERX-KUENTOS/Guam Cablevision/Docomo Pacific), the cited outage results in a near-complete loss of traffic starting around 05:00 local time (19:00 on March 16 UTC). Traffic returned to normal levels by 18:00 local time on March 18 (08:00 UTC).
Ukraine/Military Action
In February, the conflict in Ukraine entered its second year, and over this past year, we have tracked its impact on the Internet, highlighting traffic shifts, attacks, routing changes, and connectivity disruptions. In the fourth quarter of 2022, a number of disruptions were related to attacks on electrical infrastructure, and this pattern continued into the first quarter of 2023.
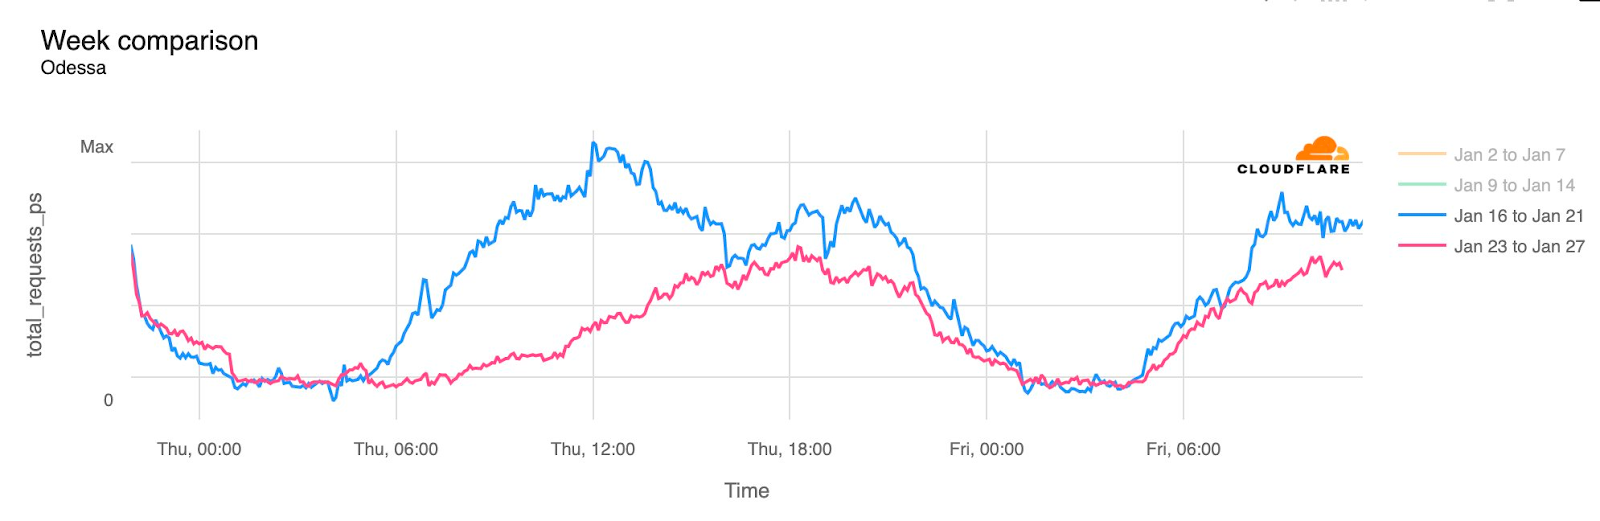
One such disruption occurred in Odessa on January 27, amid news of Russian airstrikes on local energy infrastructure. As seen in the figure below, Internet traffic in Odessa usually begins to climb just before 08:00 local time (06:00 UTC), but failed to do so that morning after several energy infrastructure facilities near Odessa were hit and damaged. Traffic remained lower than levels seen the previous week for approximately 18 hours.
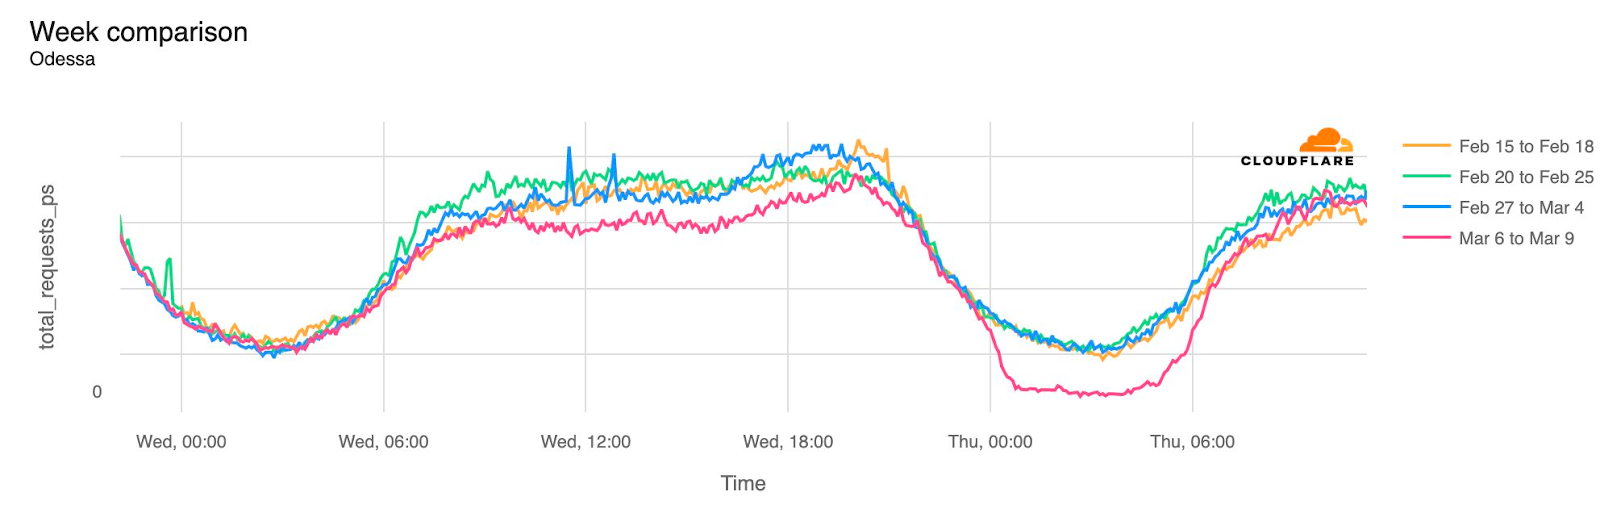
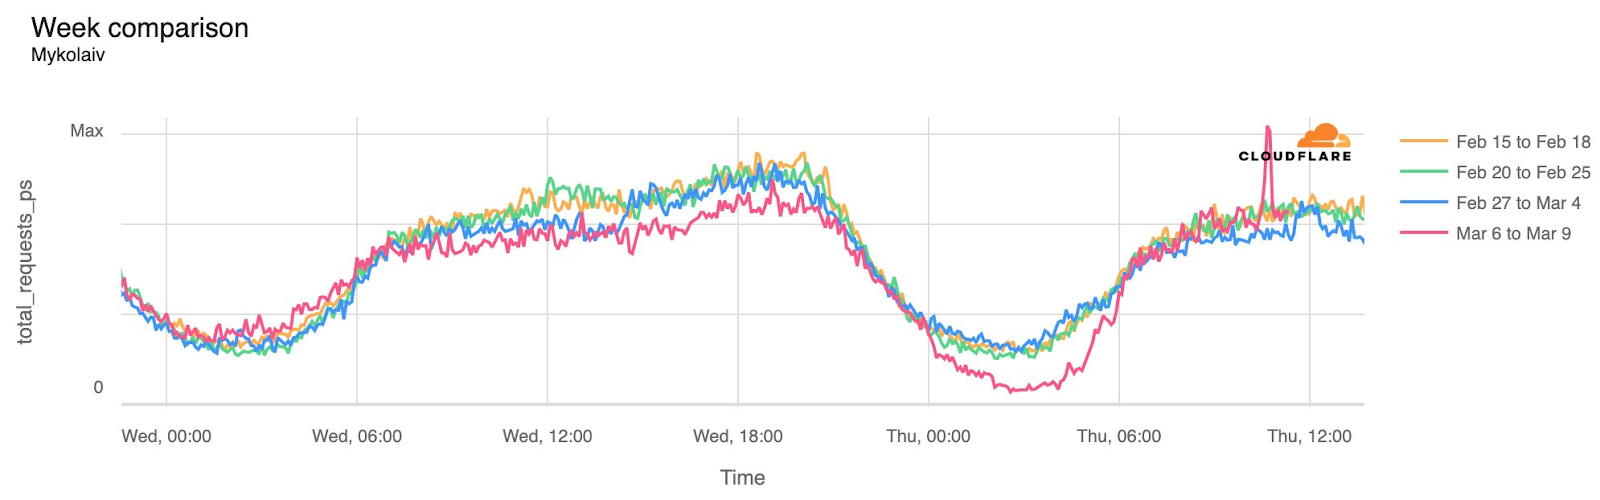
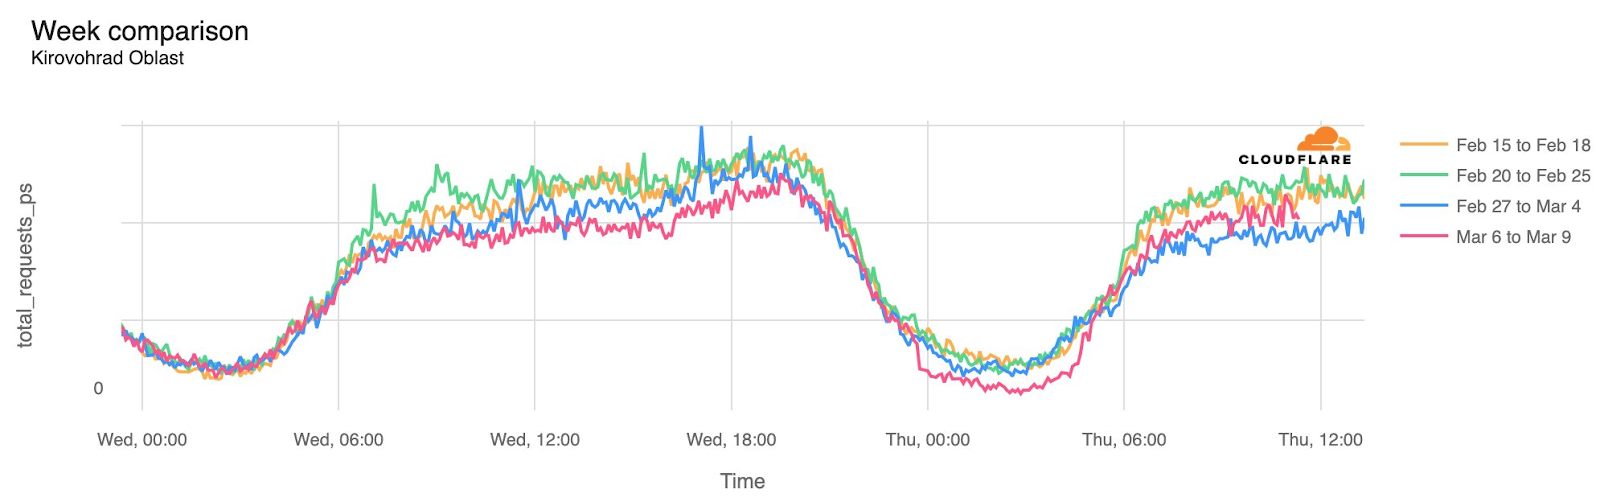
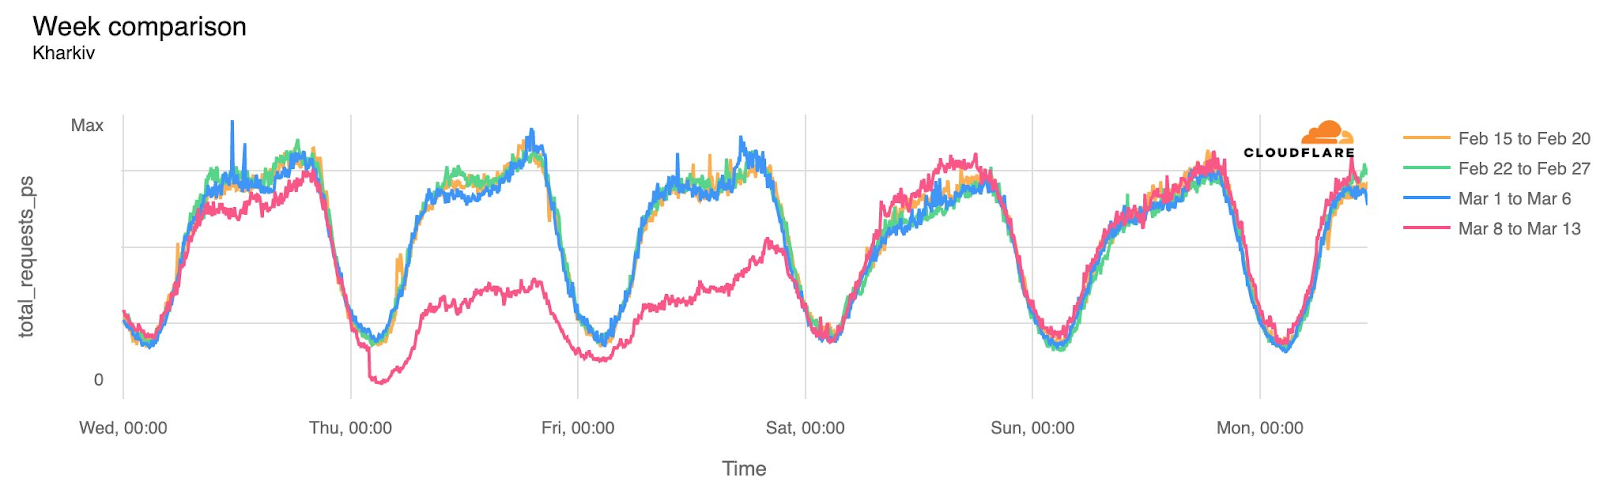
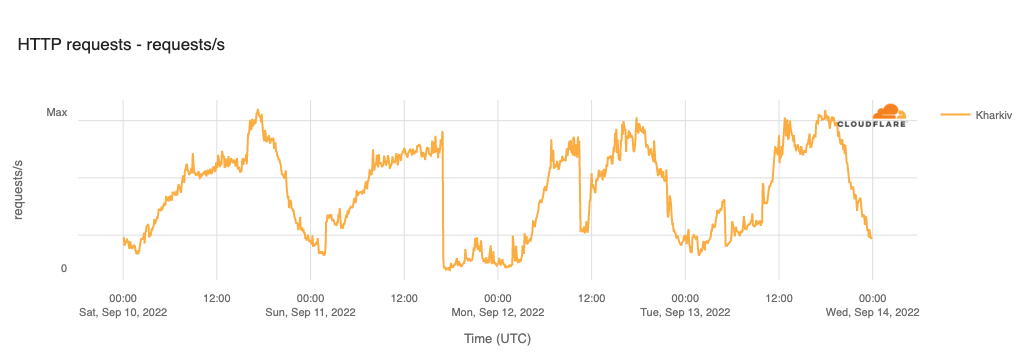
Power outages resulting from Russian attacks on energy generation and distribution facilities on March 9 resulted in disruptions to Internet connectivity in multiple locations around Ukraine. As seen in the figures below, traffic dropped below normal levels after 02:00 local time (00:00 UTC) on March 9. Traffic in Kharkiv fell over 50% as compared to previous week, while in Odessa, traffic fell as much as 60%. In Odessa, Mykolaiv, and Kirovohrad Oblast, traffic recovered by around 08:00 local time (06:00 UTC), while in Kharkiv, the disruption lasted nearly two days, returning to normal levels around 23:45 local time (21:45 UTC) on Friday, March 10.
Conclusion
The first quarter of 2023 seemed to be particularly active from an Internet disruption perspective, but hopefully it is not a harbinger of things to come through the rest of the year. This is especially true of government-directed shutdowns, which occurred fairly regularly through 2022. To that end, civil society organization Access Now recently published their Internet shutdowns in 2022 report, finding that In 2022, governments and other actors disrupted the internet at least 187 times across 35 countries. Cloudflare Radar is proud to support Access Now’s #KeepItOn initiative, using our data to help illustrate the impact of Internet shutdowns and other disruptions.
The Super Bowl has been happening since the end of the 1966 season, the same year that the ARPANET project, which gave birth to the Internet, was initiated. Around 20 years ago, 50% of the US population were Internet users, and that number is now around 92%. So, it’s no surprise that interest in an event like Super Bowl LVII resulted in a noticeable dip in Internet traffic in the United States at the time of the game’s kickoff, dropping to around 5% lower than the previous Sunday. During the game, Rihanna’s halftime show also caused a significant drop in Internet traffic across most states, with Pennsylvania and New York feeling the biggest impact, but messaging and video platforms saw a surge of traffic right after her show ended.
In this blog post, we will dive into who the biggest winners were among Super Bowl advertisers, as well as examine how traffic to food delivery services, social media and sports and betting websites changed during the game. In addition, we look at traffic trends seen at city and state levels during the game, as well as email threat volume across related categories in the weeks ahead of the game.
Cloudflare Radar uses a variety of sources to provide aggregate information about Internet traffic and attack trends. In this blog post, as we did last year and the year before, we use DNS name resolution data from our 1.1.1.1 resolver to estimate traffic to websites. We can’t see who visited the websites mentioned, or what anyone did on the websites, but DNS can give us an estimate of the interest generated by the ads or across a set of sites in the categories listed above.
Ads: are URLs no longer cool?
In contrast to Super Bowl commercials of the past 25 years, many of this year’s advertisements didn’t include a URL, possibly suggesting strong confidence by brands in their search engine results placement, or an assumption that the viewer would engage with the brand through an app on their phone, rather than a website. To that end, several ads did include an app store-related call to action, encouraging the viewer to download the associated mobile app. And possibly in an effort to capitalize on the success of Coinbase’s QR code commercial during Super Bowl LVI, a number of brands, including Toyota, Michelob Ultra, and Mr. Peanut included QR codes as a way for viewers to get additional information or see more.
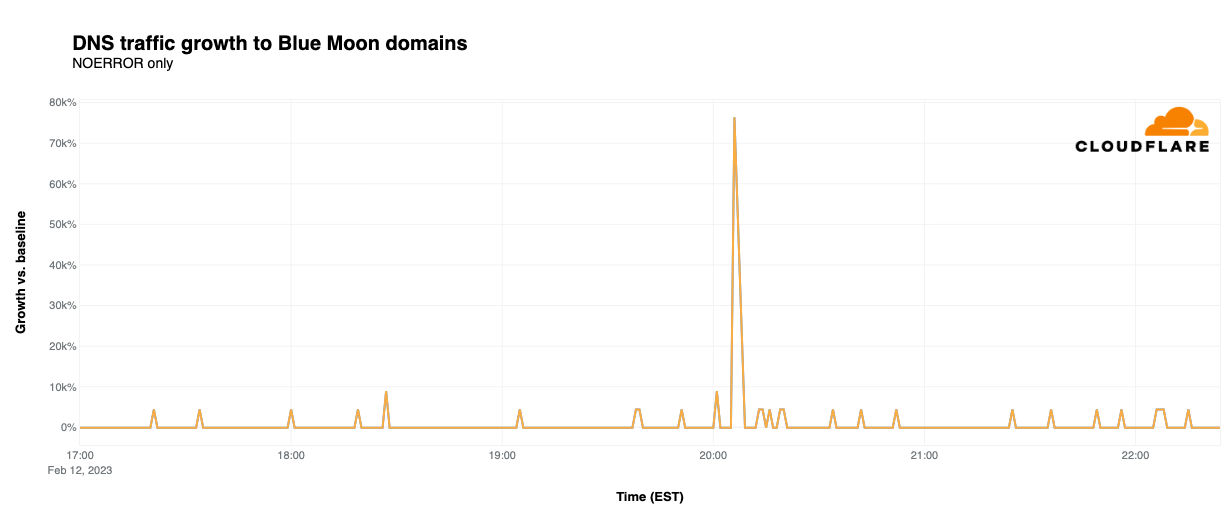
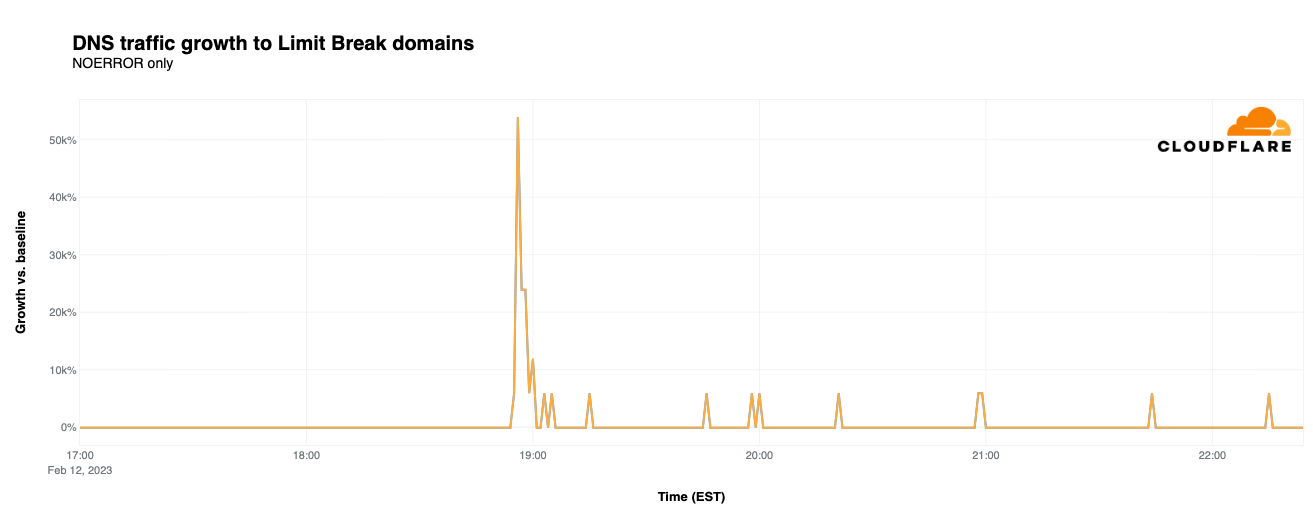
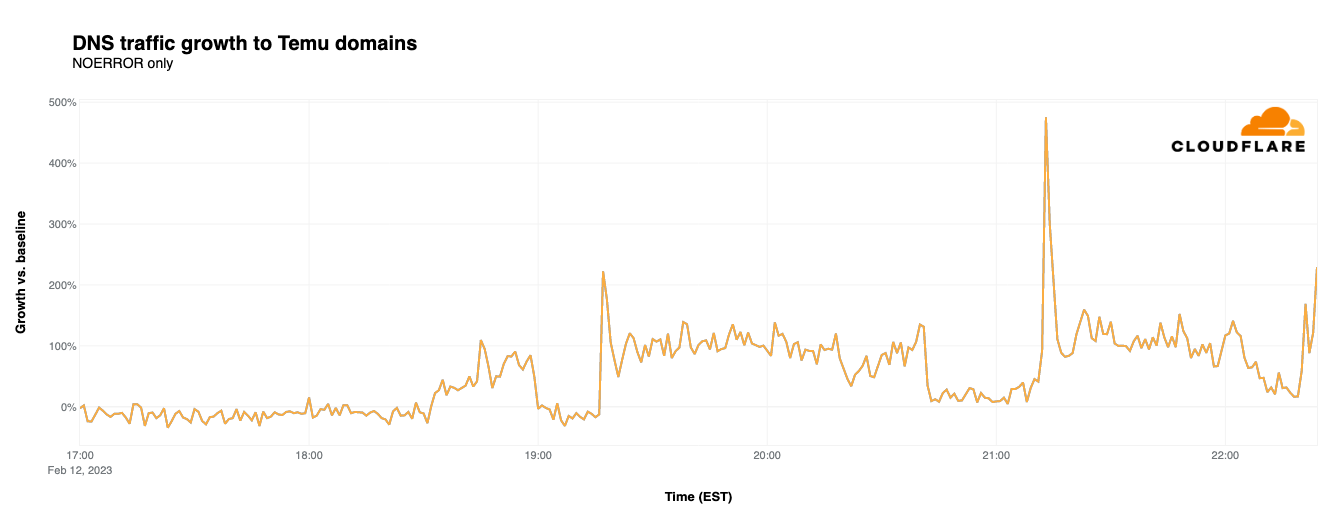
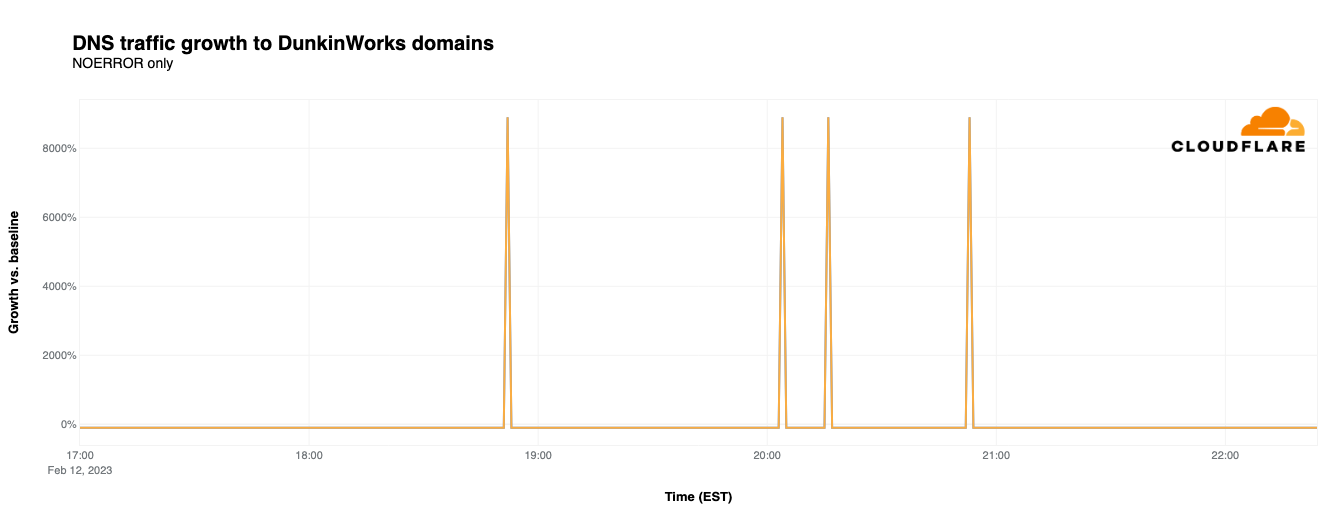
As we did last year, we again tracked DNS request traffic to our 1.1.1.1 resolver in United States data centers for domains associated with the advertised products or brands. Traffic growth is plotted against a baseline calculated as the mean request volume for the associated domains between 1200-1500 EST on Sunday, February 12 (Super Bowl Sunday.) Although over 50 brands advertised during the game, the brands highlighted below were chosen because their advertisements drove some of the largest percentage traffic spikes, as well as one interesting tale.
BlueMoon
Although the commercial initially seemed to be for sibling beer brands Coors Light and Miller Lite, there was a twist at the end, This twist was only fitting, as the ad was actually for Blue Moon, which is often served with a twist of orange on the rim of the glass. Although beer ads don’t usually drive significant traffic spikes, this one did, reaching 76,400% above baseline for Blue Moon’s site. Coors Light saw a 275% bump in DNS traffic coincident with the ad, while Miller Lite grew 120%. However, traffic for Coors and Miller was fairly volatile at other times during the game.
LimitBreak
Although last year’s advertisements included a number of cryptocurrency-related brands, they were all but absent from this year’s slate of ads. The closest we got during this year’s game was a commercial from LimitBreak, which describes itself as “bringing the free-to-play gaming experience to Web3 and beyond”, in which it promoted a giveaway of thousands of its Dragon series NFTs. This ad featured a QR code and a URL, and given the nearly 54,000% increase in DNS traffic observed, both were effective means of driving traffic to the LimitBreak website.
Temu
Upstart mobile shopping app Temu purchased multiple Super Bowl ad slots to promote its “shop like a billionaire” campaign, urging viewers to download its mobile app. As seen in the graph below, these advertisements drove spikes in traffic, and continued engagement, each time they ran. The first airing at 19:16 EST drove a 222% spike over baseline in DNS traffic. However, the second airing at 21:12 EST apparently resulted in significantly more interest, driving a 475% traffic increase. A third airing at 22:20 EST reached 169% over baseline, with another one just after that reaching over 200%.
Dunkin’
In early January, Boston-area media blew up with the news that local celebrity Ben Affleck was spotted working the drive-through window at one of the coffee chain’s Medford locations, raising some speculation that he was filming a Super Bowl commercial. That speculation turned out to be true, as the commercial aired at 18:53 EST. But the commercial had a side effect: DNS traffic for dunkin.com, associated with DunkinWorks (a small personal coaching and training business), spiked 8,000% when the commercial aired, as shown in the graph below. (It isn’t clear what drove the later three spikes for dunkin.com, as the advertisement didn’t air again nationally during the remainder of the game.) We can only hope that the dunkin.com system administrators were fueled with plenty of coffee and donuts as they dealt with the rapid growth in traffic.
Site categories: touchdowns bring attention
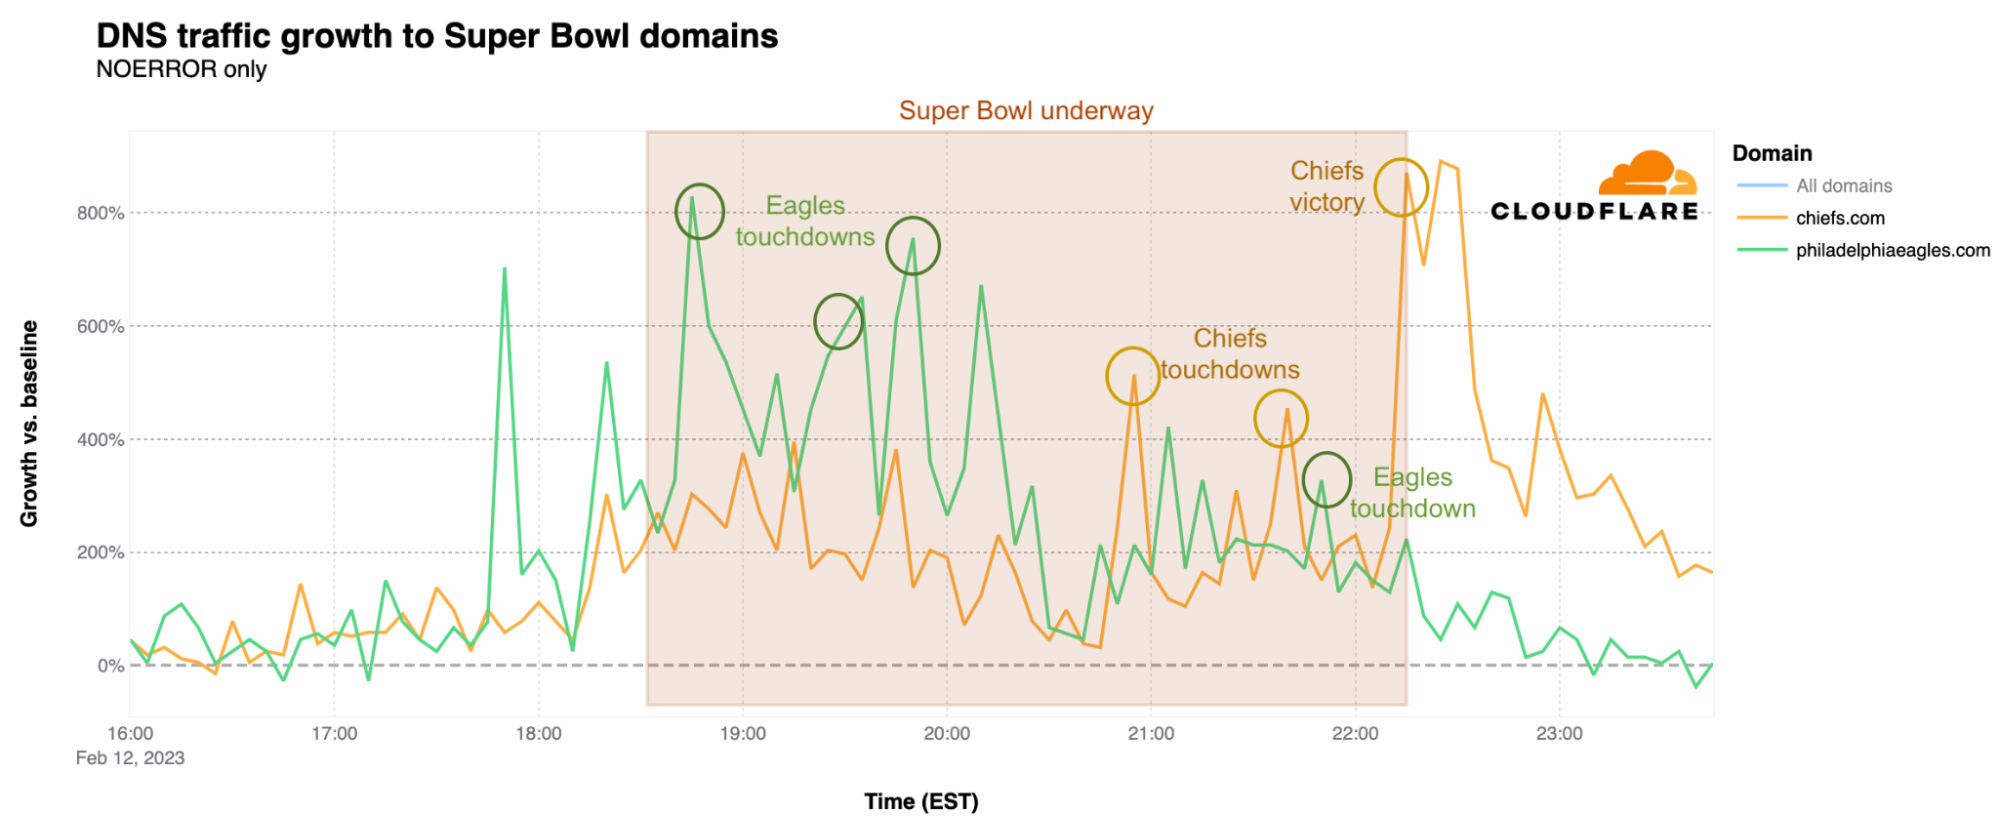
As we saw last year, there are two factors that bring a surge of traffic to the websites of Super Bowl participants: touchdowns and winning. However, nothing is more impactful than the sweet taste of victory. Both the Kansas City Chiefs’ and Philadelphia Eagles’ websites experienced a surge in DNS traffic just before the game started, as compared to a baseline calculated as the mean request volume for the associated domains between 12:00-15:00 EST on Sunday, February 12 (Super Bowl Sunday.). The Eagles website had its peak just around the time of the kickoff, with 828% growth over baseline, and continued to grow more rapidly than traffic to the Chiefs’ website until 20:55 EST, when traffic to chiefs.com began to pull ahead.
What happened at that time? That was the moment of the Chiefs’ third touchdown of the game, when DNS traffic to the team’s website had its first peak of the evening, at 514% above baseline. There was a clear spike during another Chiefs touchdown at 21:42 EST, at 454% above baseline, but that was nothing compared to the end of the game, when the Kansas City Chiefs were once again, after their 2019 victory, the winners. At 22:15 EST, when the game ended, DNS traffic to the Chiefs’ website was 871% higher, and peaked 10 minutes later at 890%, as compared to the baseline. At this same time, DNS traffic for the Eagles’ website dropped significantly. As we saw last year as well, winning the Super Bowl clearly drives increased traffic to the victor’s website.
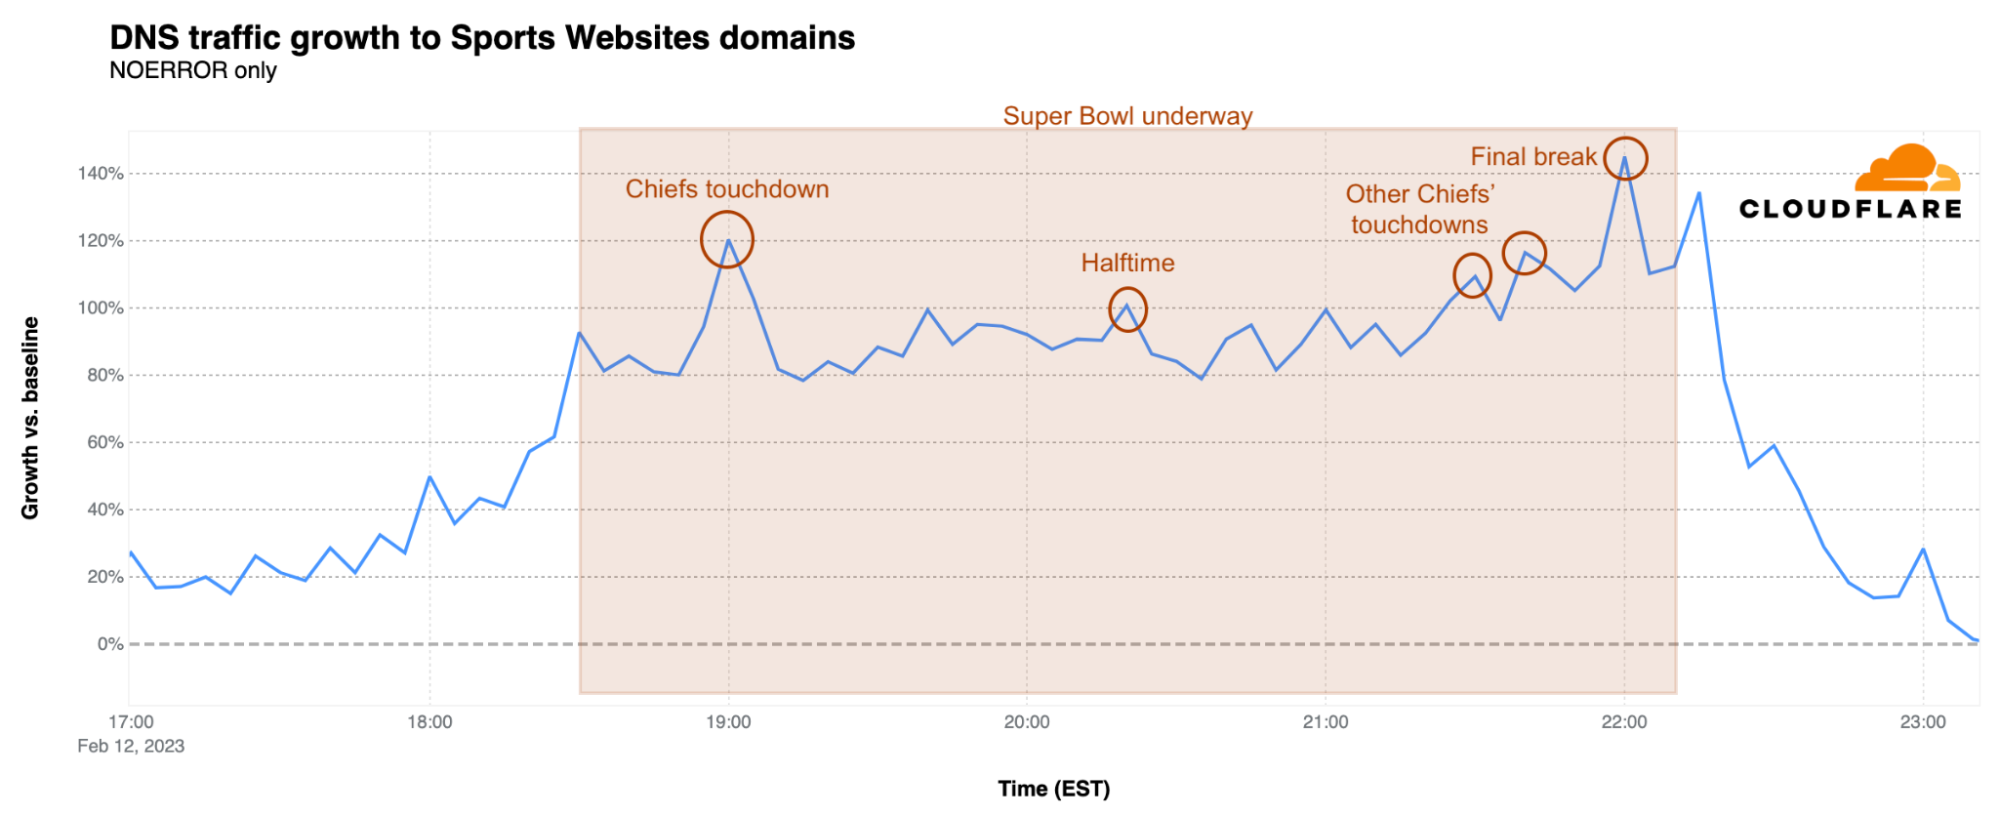
Sports websites trends also followed the in-game events. There was a clear spike to approximately 90% above baseline when the game started at 18:30 EST, with further growth to 120% over baseline at 19:00 EST during the Kansas City Chiefs’ first touchdown. There were also clear spikes at 21:30 and 21:40 EST coinciding with the two more Chiefs touchdowns. The Super Bowl peak for these websites was reached during the final break at 22:00 EST, reaching 145% above baseline, just before the Chiefs’ game-winning field goal. After a brief drop as the game ended, there was an additional spike to 134%.
Rihanna’s impact on messaging and social media sites
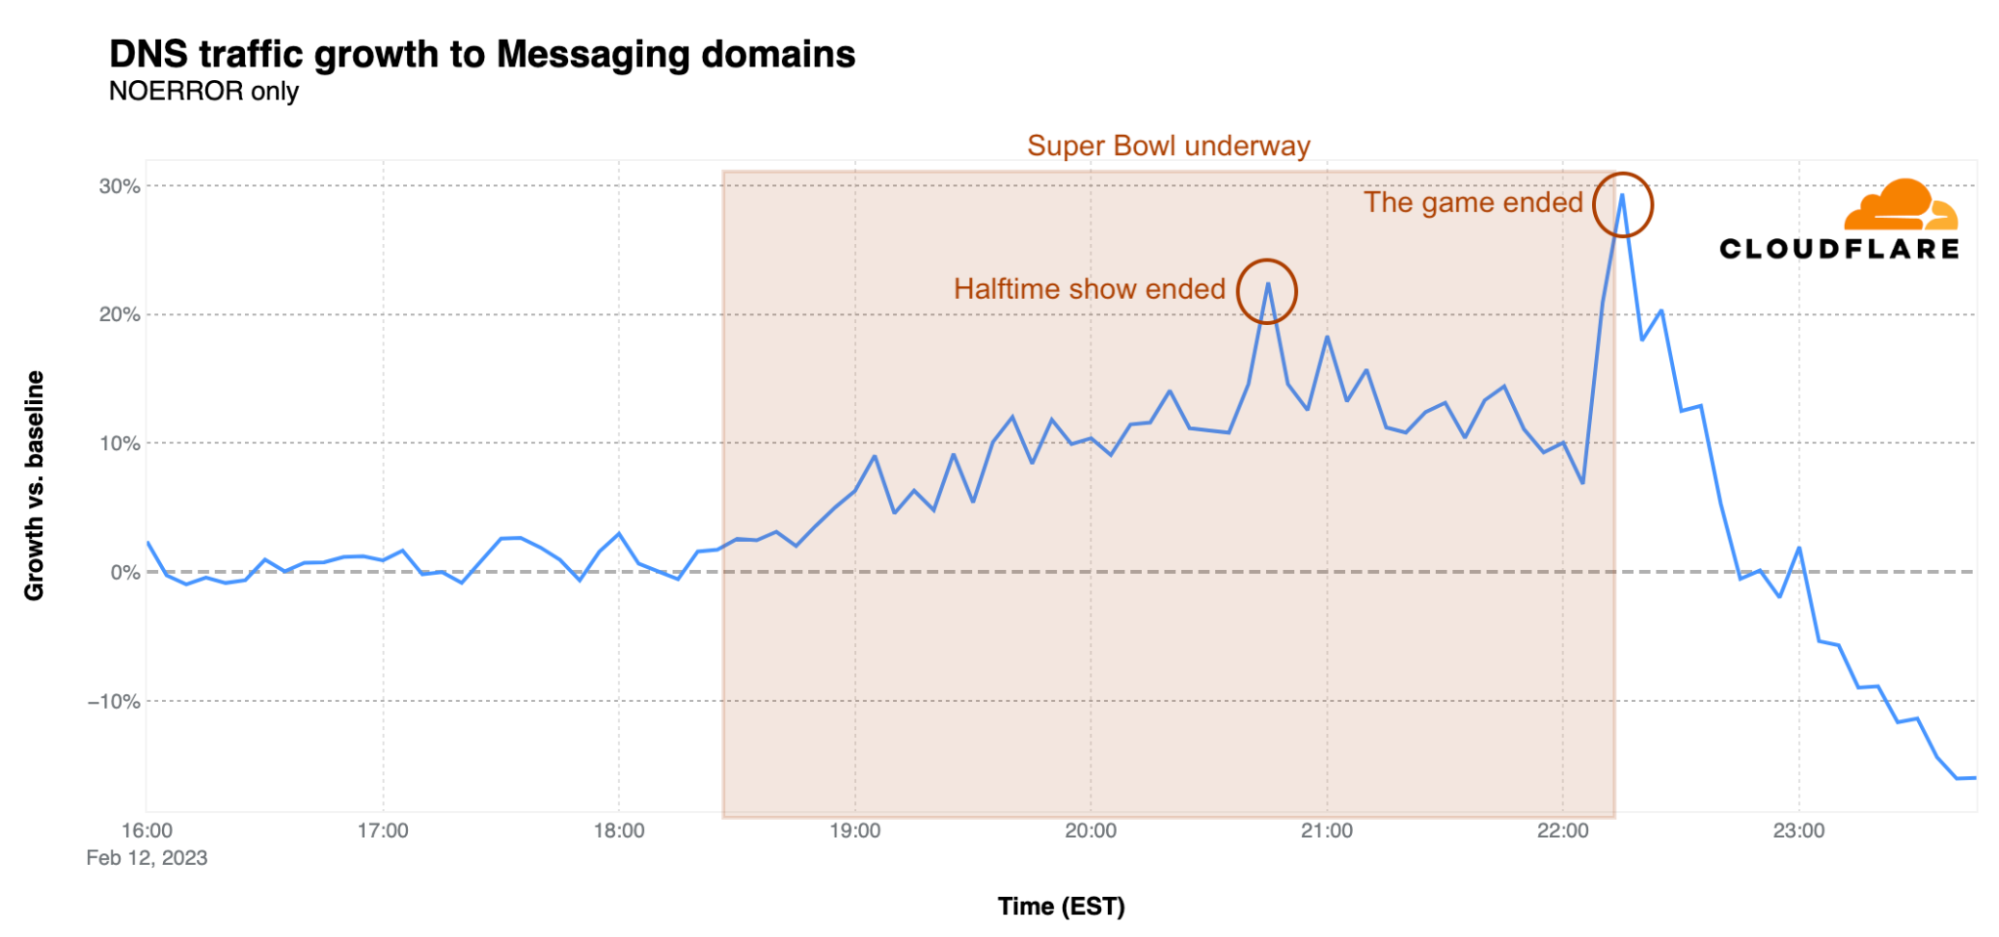
What happened following Rihanna’s performance during the Super Bowl halftime show? As the game resumed, we saw a clear increase in traffic for messaging websites, with a first peak right after the end of the show at around 20:45 EST, 22% over baseline. The biggest peak, however, was when the game ended. At 22:15 EST, DNS traffic for messaging sites was 30% higher than the earlier baseline.
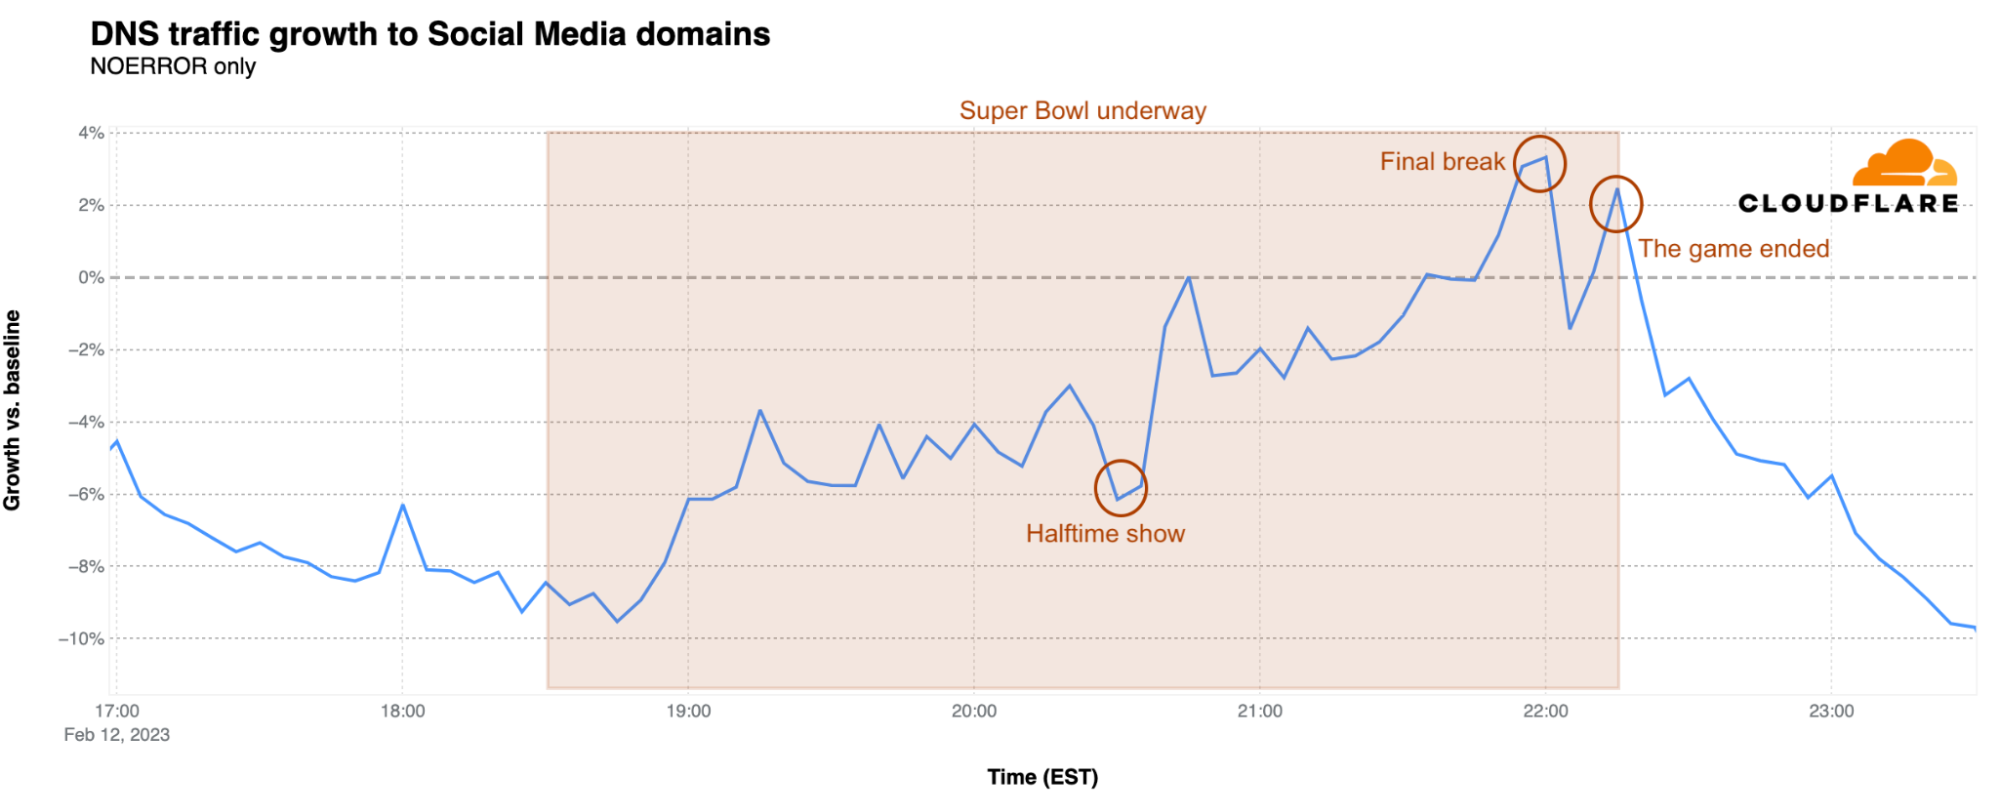
Rihanna’s announcement of her second pregnancy, which made news after her performance, also impacted traffic to social media platforms. After a small increase when halftime started, there was a clear drop during Rihanna’s show, followed by a jump from 6% below baseline back to 0% right after the show. An additional 3% of traffic growth was reached during the final break at 22:00 EST, just before the Kansas City Chiefs’ winning field goal. After a brief drop, traffic reached 2% above baseline as the game ended.
Is halftime also a time for rewatching ads?
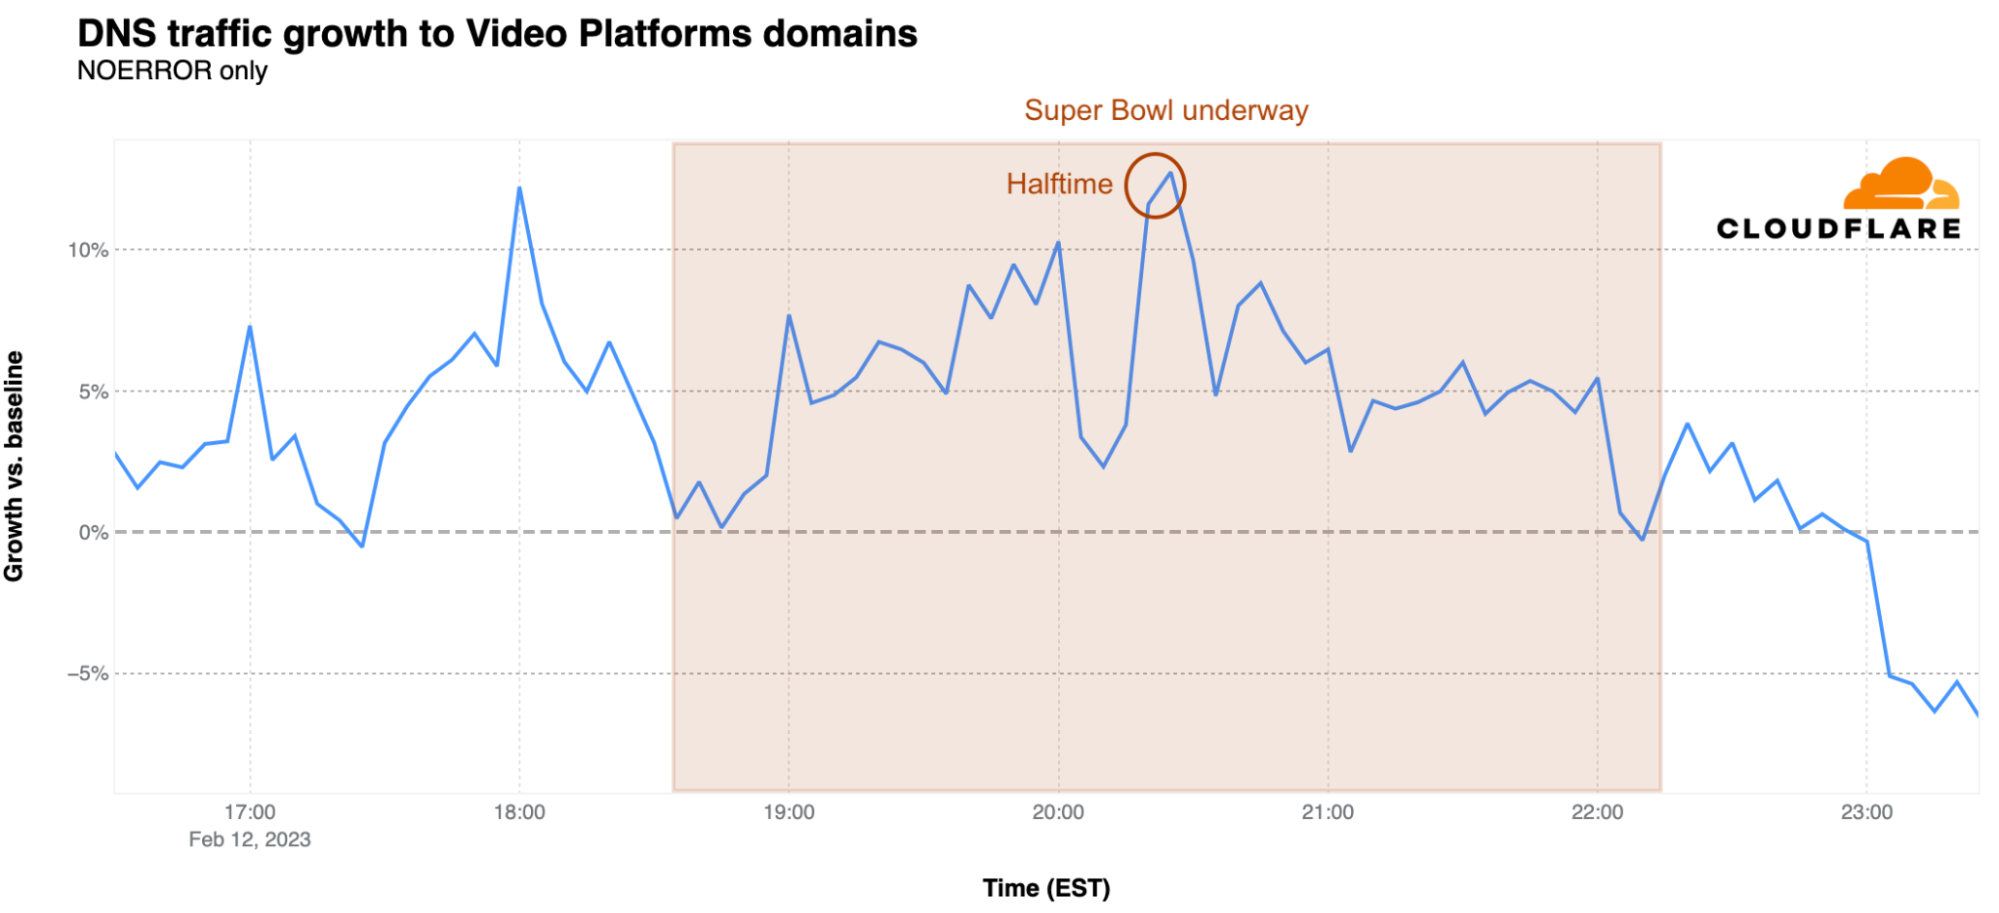
The arrival of halftime at 20:21 EST also brought a surge in DNS traffic for video platforms. The first peak was reached at 18:00 EST, before the game started, at 12% above baseline. The peak during halftime was reached at 20:25 EST with 13% growth above baseline, suggesting that viewers may have been looking at that time to Super Bowl related videos or just using the time to browse those platforms.
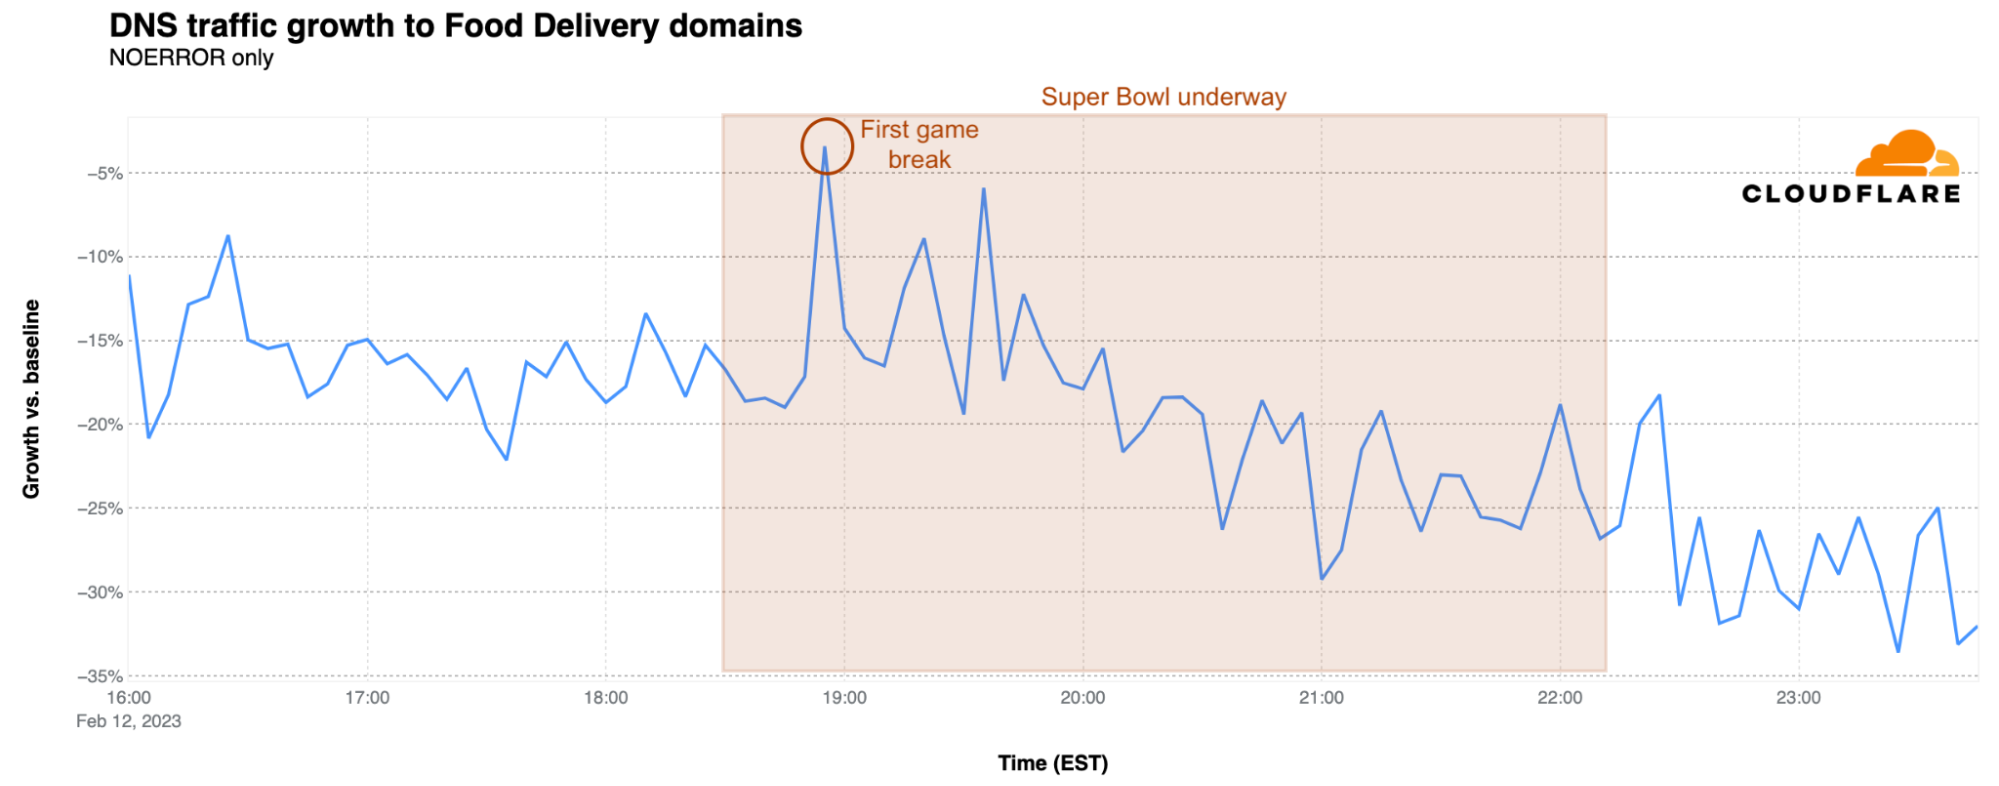
Food delivery websites saw flat to lower DNS traffic just before the game as compared to the earlier baseline, suggesting that food orders were placed/scheduled earlier in the afternoon, hours before the game. At kickoff, traffic was 19% below baseline, but there was a clear spike at the time of the first break and right after the first Kansas City touchdown at 18:55 EST. After falling again during the game, there was a small increase in traffic observed just after the game ended.
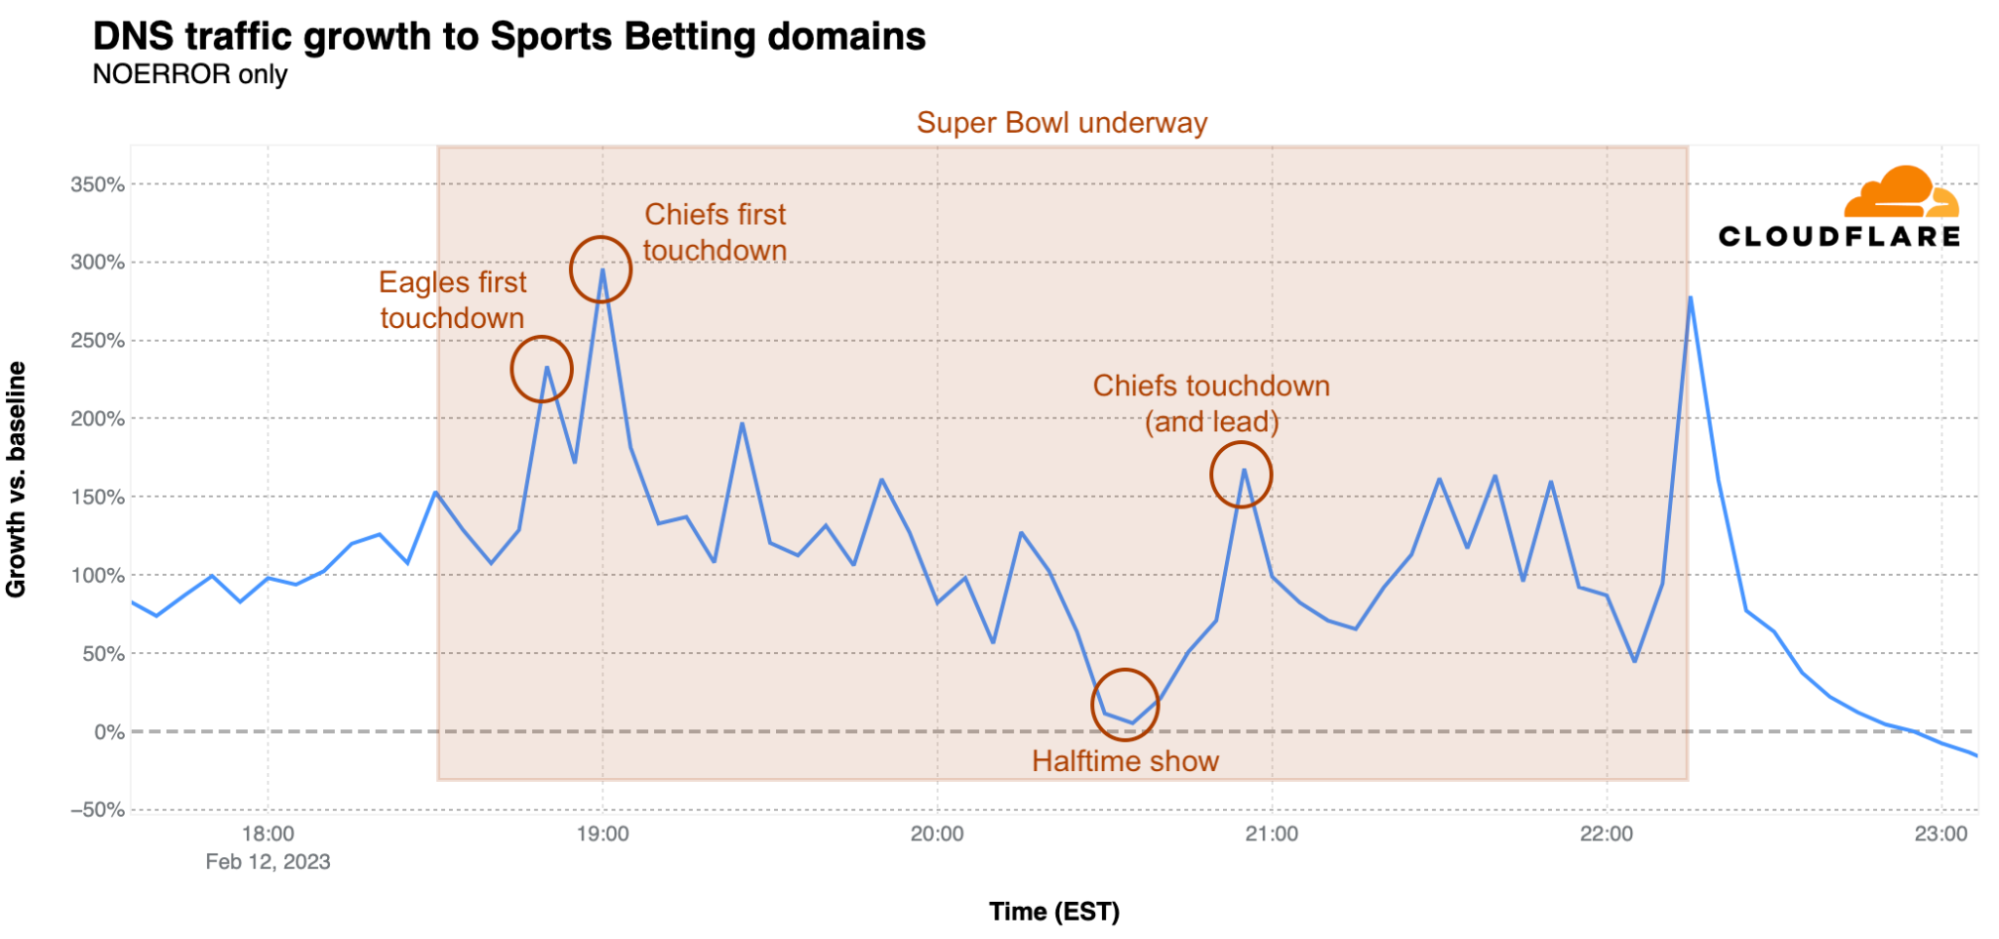
What about betting sites? They expected a big day during the Super Bowl, given that more states have recently legalized gambling on sports. The peak was reached at 19:00 EST, as DNS traffic reached 295% over baseline, when the Chiefs had their first touchdown, The first Eagles touchdown, minutes before, resulted in a 233% spike. The lowest traffic for betting sites during the Super Bowl was during the halftime show. In the second half of the game, two other clear spikes in traffic are visible. The first was at 20:55 EST at 167% above baseline when the Chiefs pulled ahead with a touchdown, and then a jump to 278% over baseline when the game ended.
Rihanna runs this town city
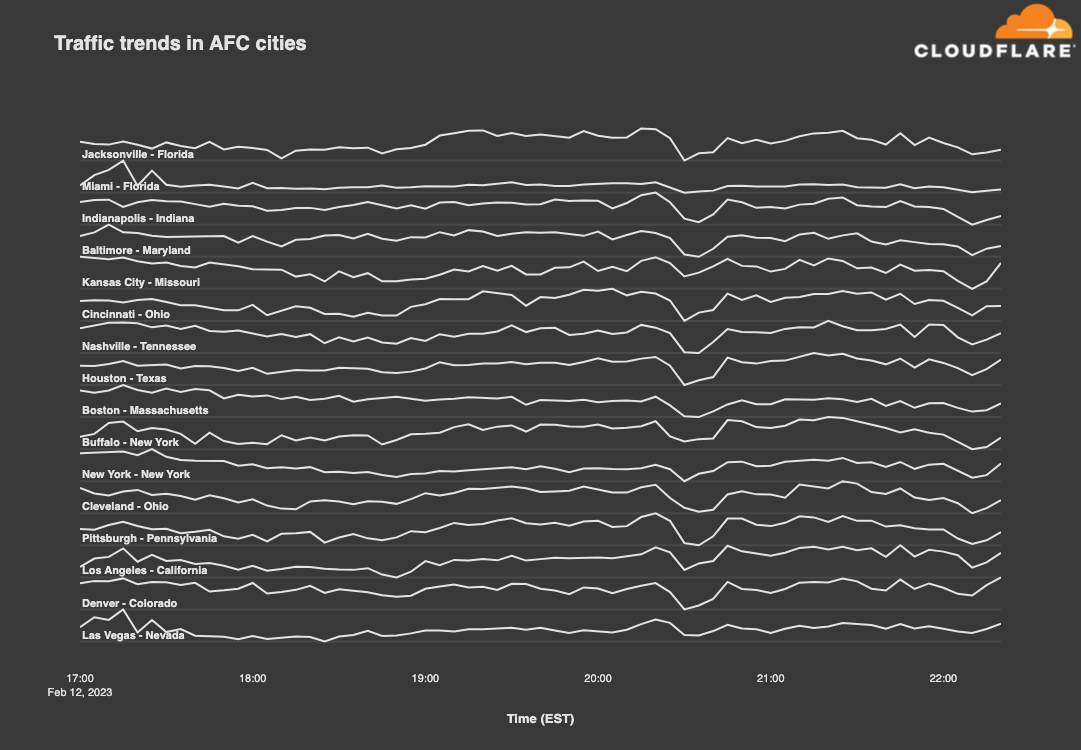
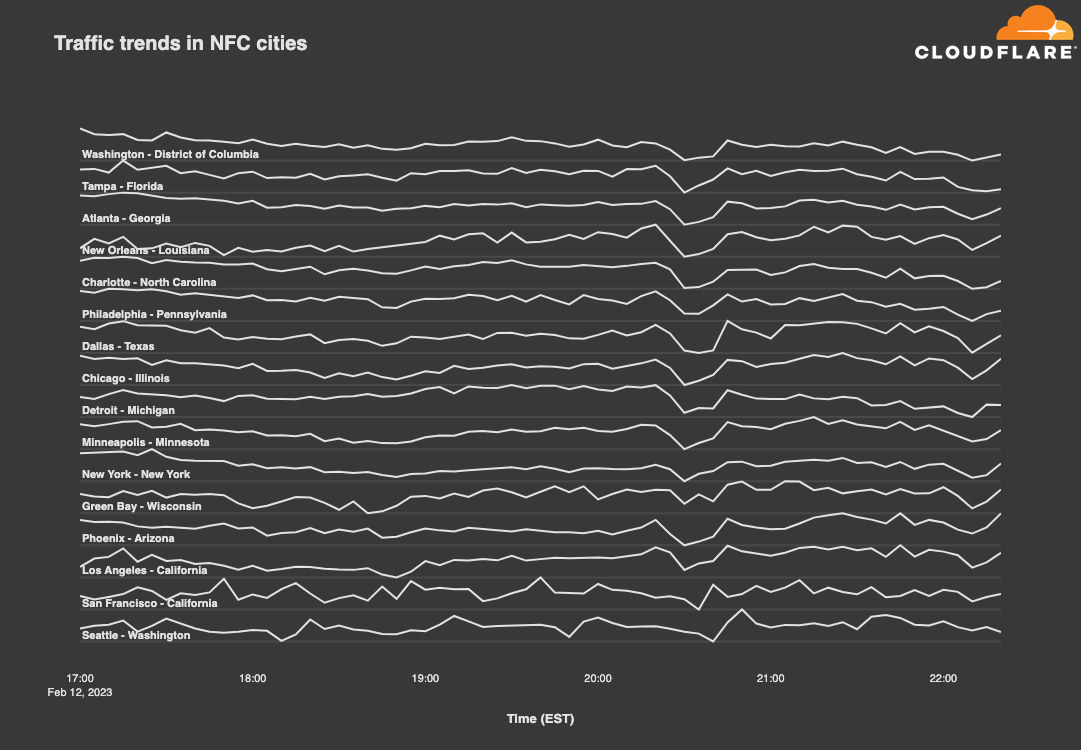
While the so-called NFL cities across the country are loyal to their local teams, looking at traffic trends across cities from both conferences makes it clear that fans everywhere find joy, not division, in the unknown pleasures of a good halftime show. The drop visible in both graphs below between 20:30-20:50 EST coincides with Rihanna’s return to live performance, as she last performed live in January 2018. Based on the observed drop in traffic, viewers apparently turned away from their computers and devices, giving their attention to Rihanna, or at least stopped their general Internet surfing during the halftime show. As the graphs show, traffic recovered as soon as halftime was over.
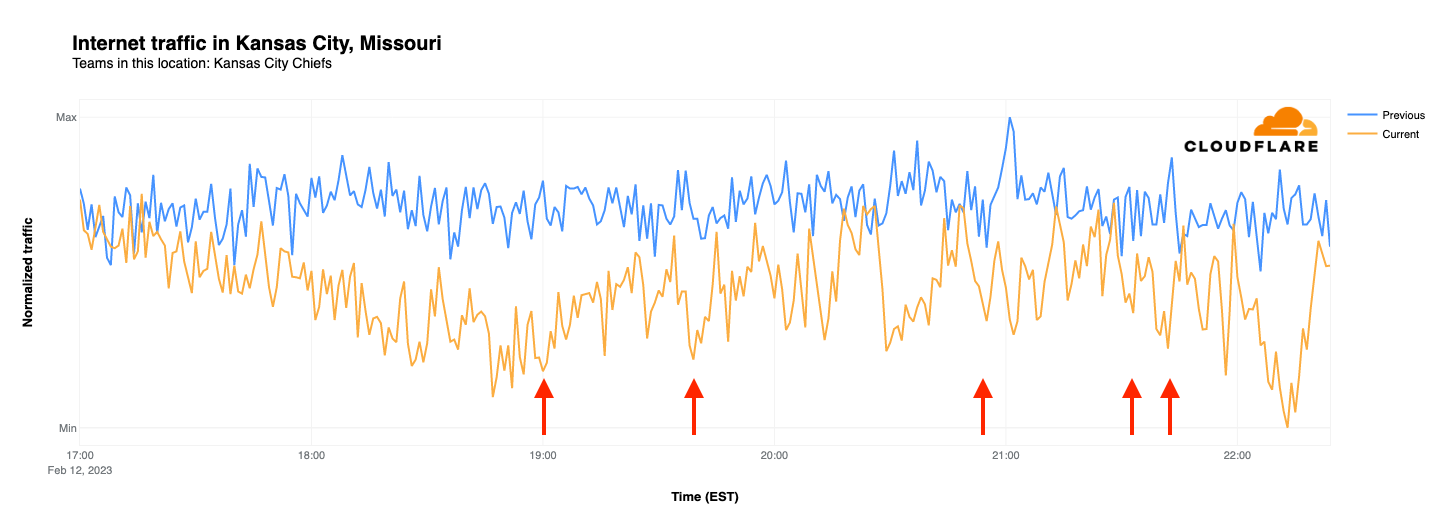
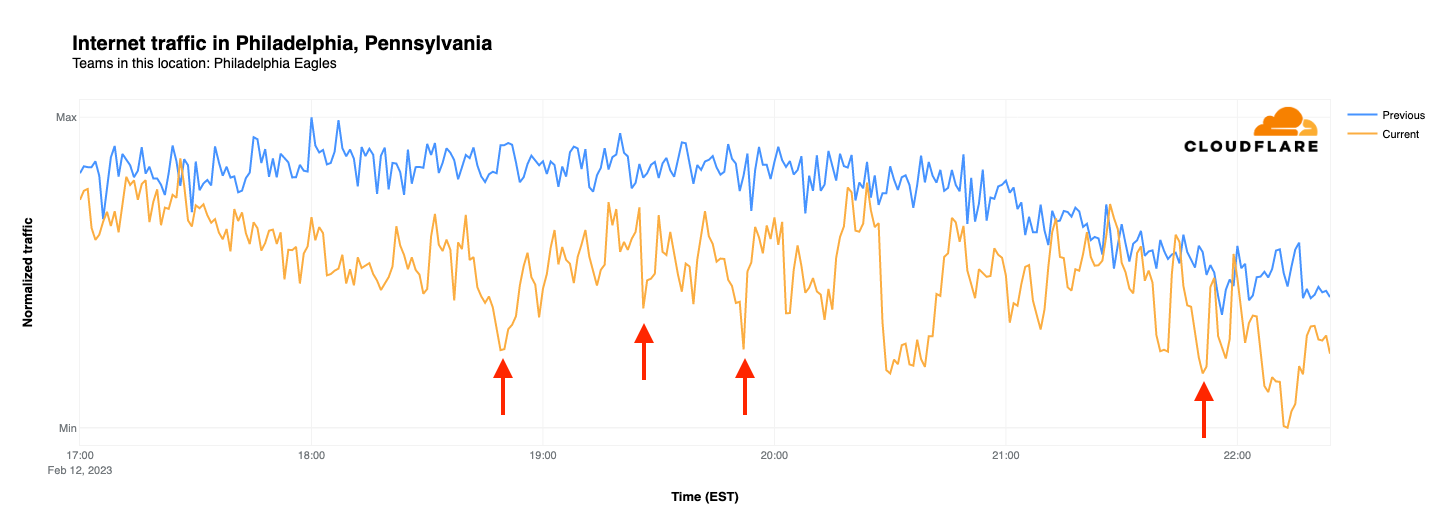
Zooming in to individual cities, we examined the traffic patterns observed in both Philadelphia and Kansas City. While both teams have fans across the country, we can use their home cities as a proxy. In this case, we compared normalized Internet traffic levels between 17:00-22:30 EST on Super Bowl Sunday (February 12) with the same time frame on the prior Sunday (February 5).
In Kansas City last Sunday, traffic volumes remained fairly consistent across the surveyed time period. However, on Super Bowl Sunday, traffic levels were initially similar, but by the start of the game were 84% lower than the same time the previous week. Slight drops in traffic are visible coincident with Chiefs touchdowns, but don’t stand out from the overall noisiness of the graph. The graph reached its nadir at 22:13 EST when the Chiefs broke the tie and kicked the game-winning field goal, with the significant drop in traffic likely due to an increased shift in focus towards the outcome of the game, even by those that hadn’t previously been paying close attention.
As the graph below shows, last Sunday saw Internet traffic in Philadelphia gradually decline as the evening wore on. On Super Bowl Sunday, traffic started out slightly lower than the week prior, and also diverged as game time approached, reaching nearly 50% lower at kickoff. As the Eagles took an early lead, their first touchdown resulted in a noticeable drop in traffic from Philadelphia, seen at 18:52 EST, less than 10 minutes after the start of the game. Visible drops in traffic are also coincident with the Eagles’ other three touchdowns, although they don’t stand out against the volatility of the graph. Traffic began to drop towards the end of the game, as the tie score added tension, and reached its lowest point when it became clear that the Eagles were not going to emerge victorious in Super Bowl LVII.
State-level traffic trends: the winning impact
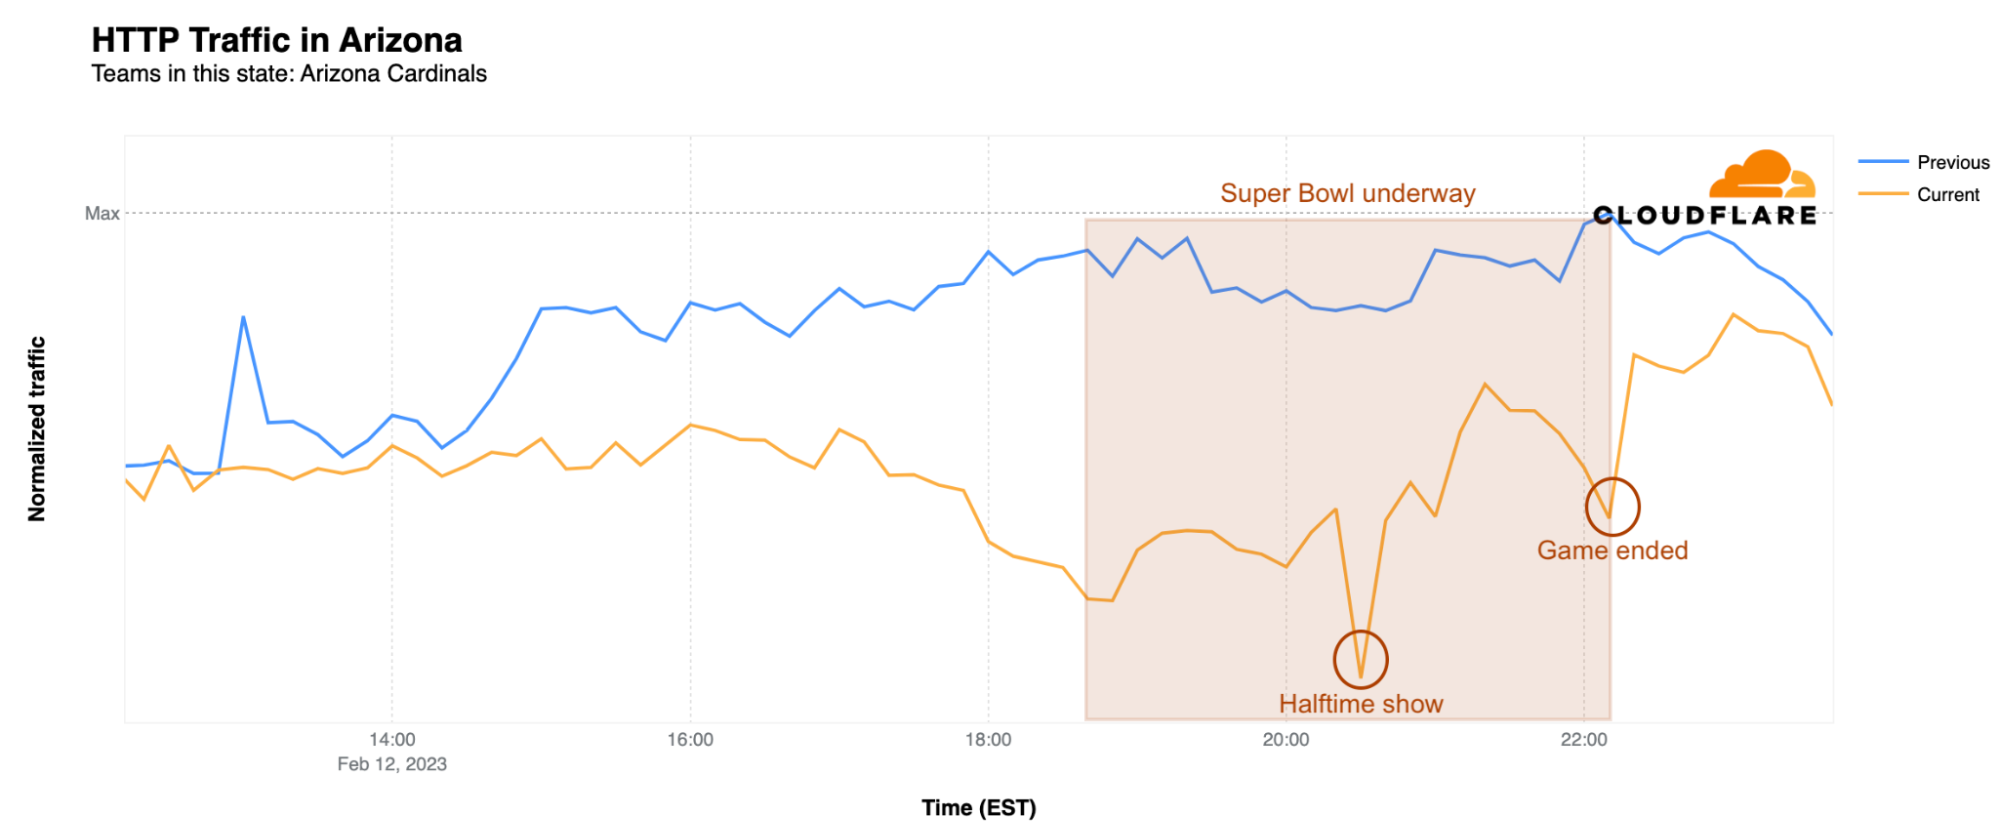
In addition to looking at traffic impacts at a city level, we can also zoom out to examine Internet traffic trends in the Super Bowl states. Arizona, which hosted the big game at State Farm Stadium in Glendale, saw a drop in state-level traffic starting around 13:00 EST. At the time of the kickoff, traffic was 25% lower than the previous Sunday, but the biggest impact was during the wildly popular halftime show by Rihanna. At 20:30 EST, traffic was 29% lower than the same time on the previous Sunday. After the game ended, traffic levels returned to normal around 23:30 EST.
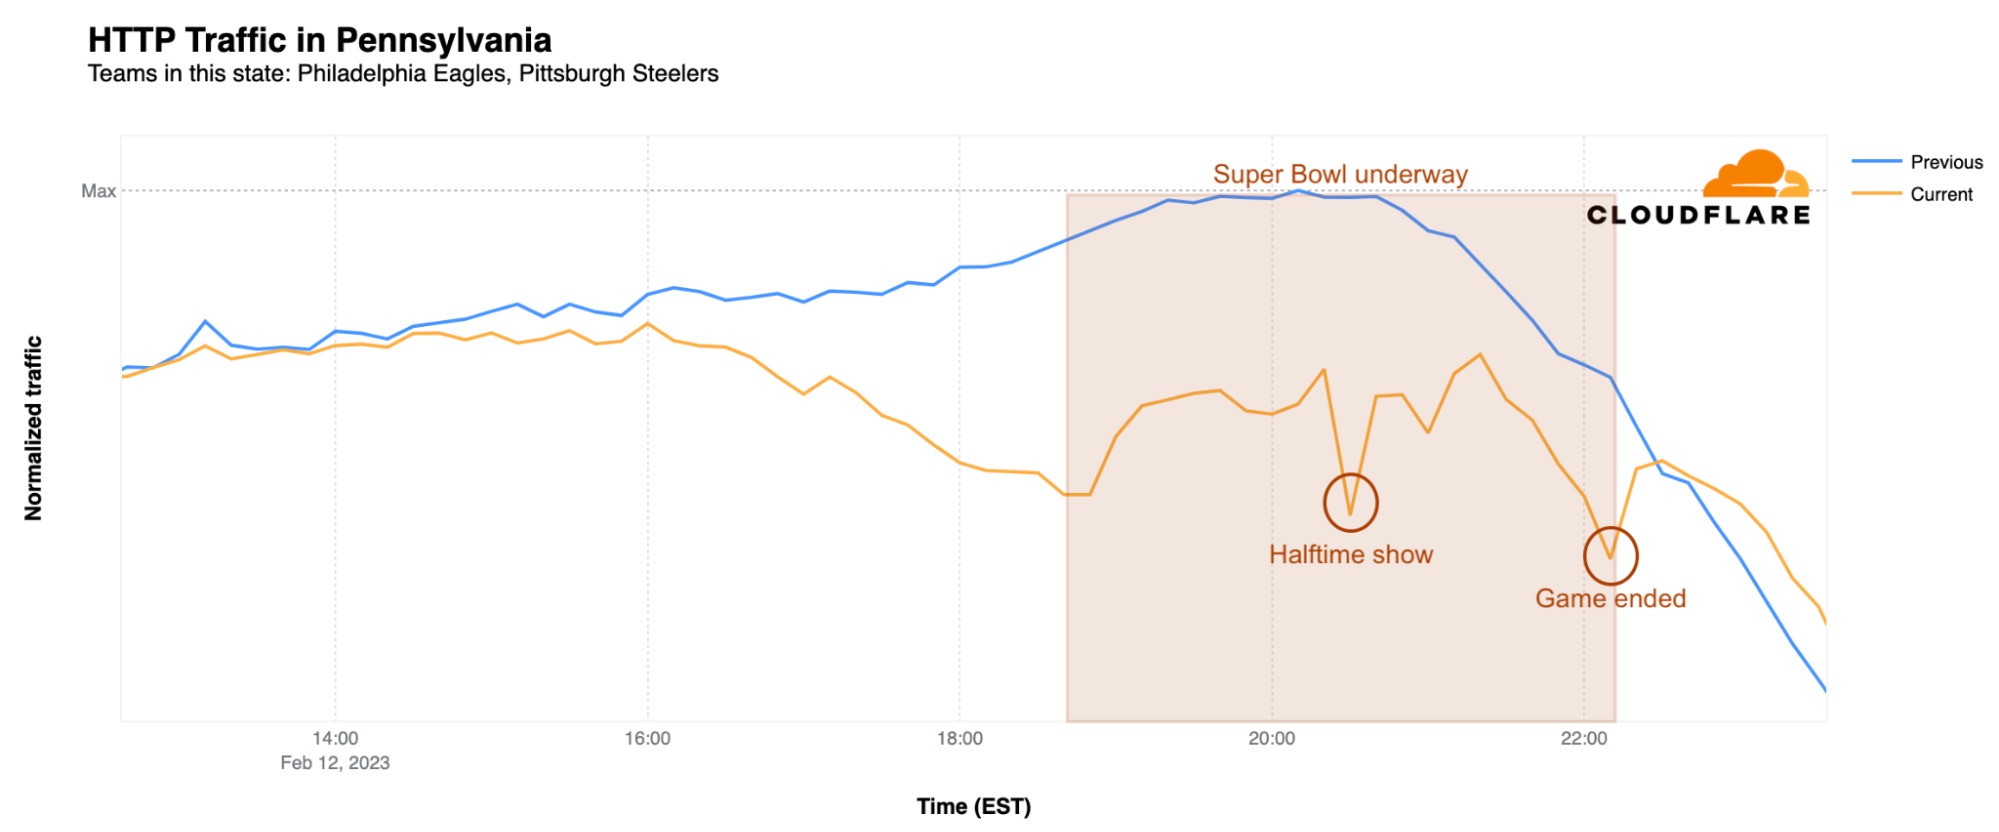
In Pennsylvania, home of the Philadelphia Eagles, traffic began to dip after 15:00 EST and reached its first low point around kickoff, when it was 28% lower than the previous Sunday. Just like in Arizona, the biggest difference was during Rihanna’s halftime show, when it was a whopping 33% lower than usual. However, just a few minutes after the game ended at 22:30 EST, traffic returned to normal.
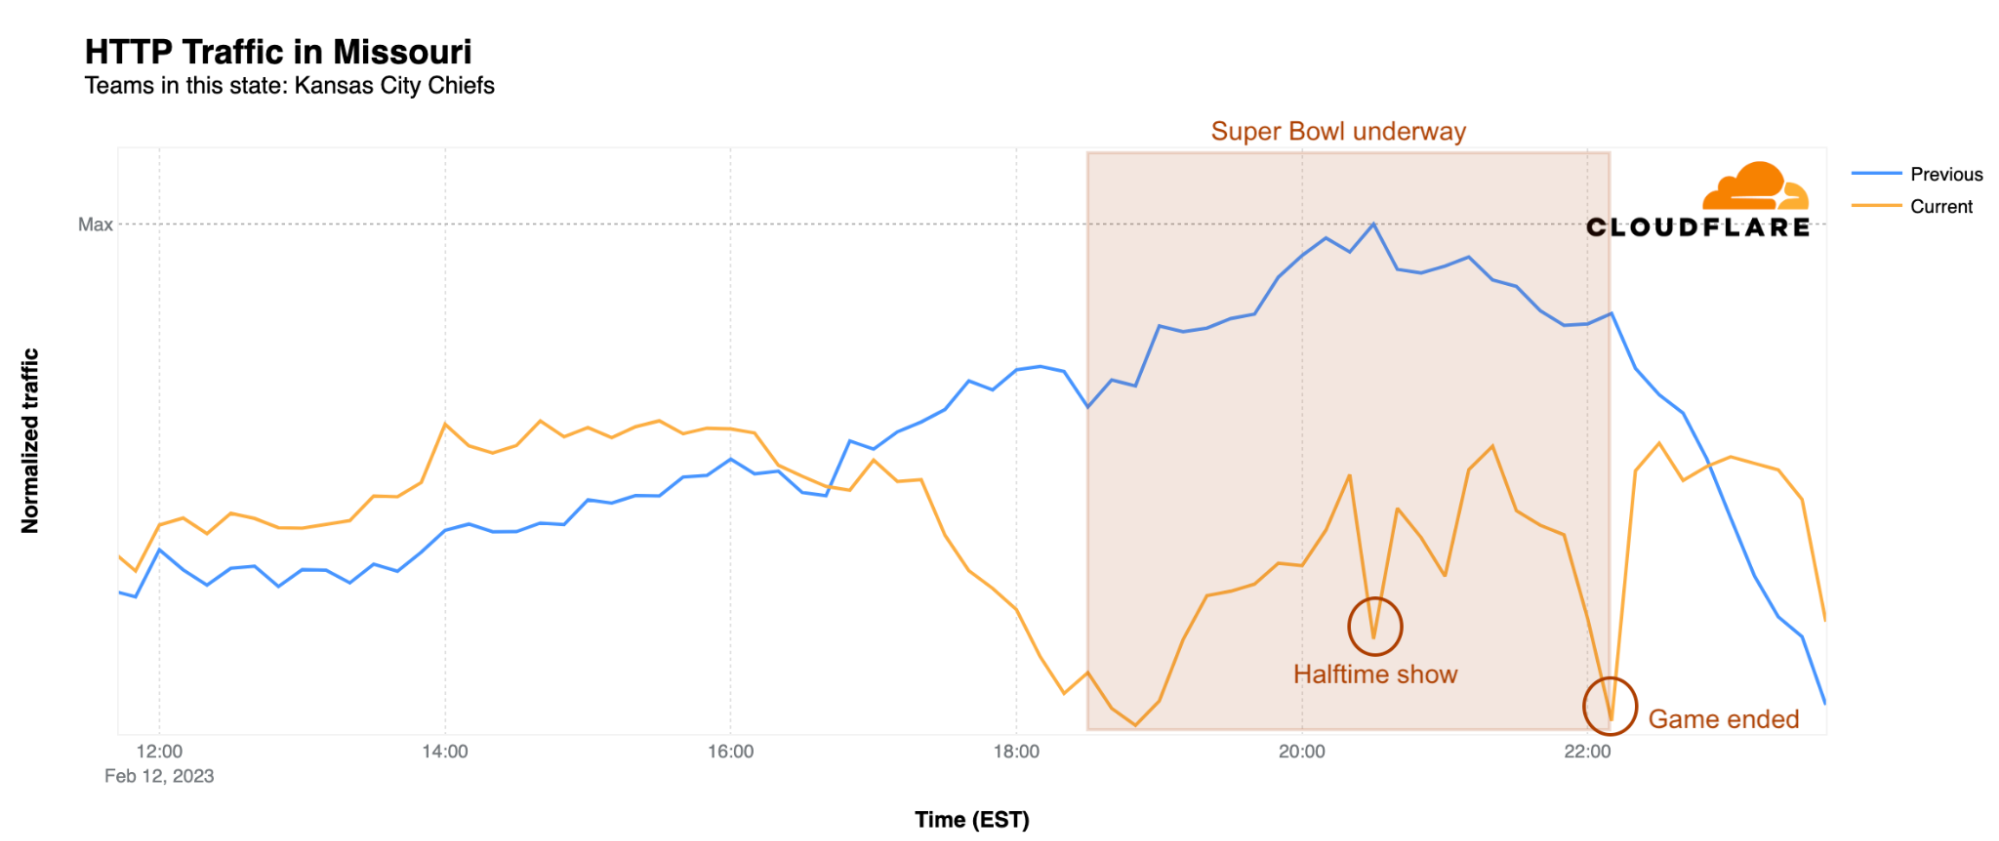
What about the winning team’s state of Missouri? There, traffic started to decrease only after 17:00 EST and was actually higher than the previous Sunday before that point. With the kickoff came a clear drop, resulting in 28% less traffic than the previous Sunday at the same time. Traffic increased a bit heading towards halftime, but dropped again during Rihanna’s show, when it was 30% lower than usual. The biggest drop in traffic, not surprisingly, was during the exciting moment of the Kansas City Chiefs’ winning field goal. At 22:15 EST, traffic was 33% lower than the previous Sunday. However, after 22:50 EST, Internet traffic in Missouri was back on the fast track, with traffic increasing to levels higher than the previous Sunday.
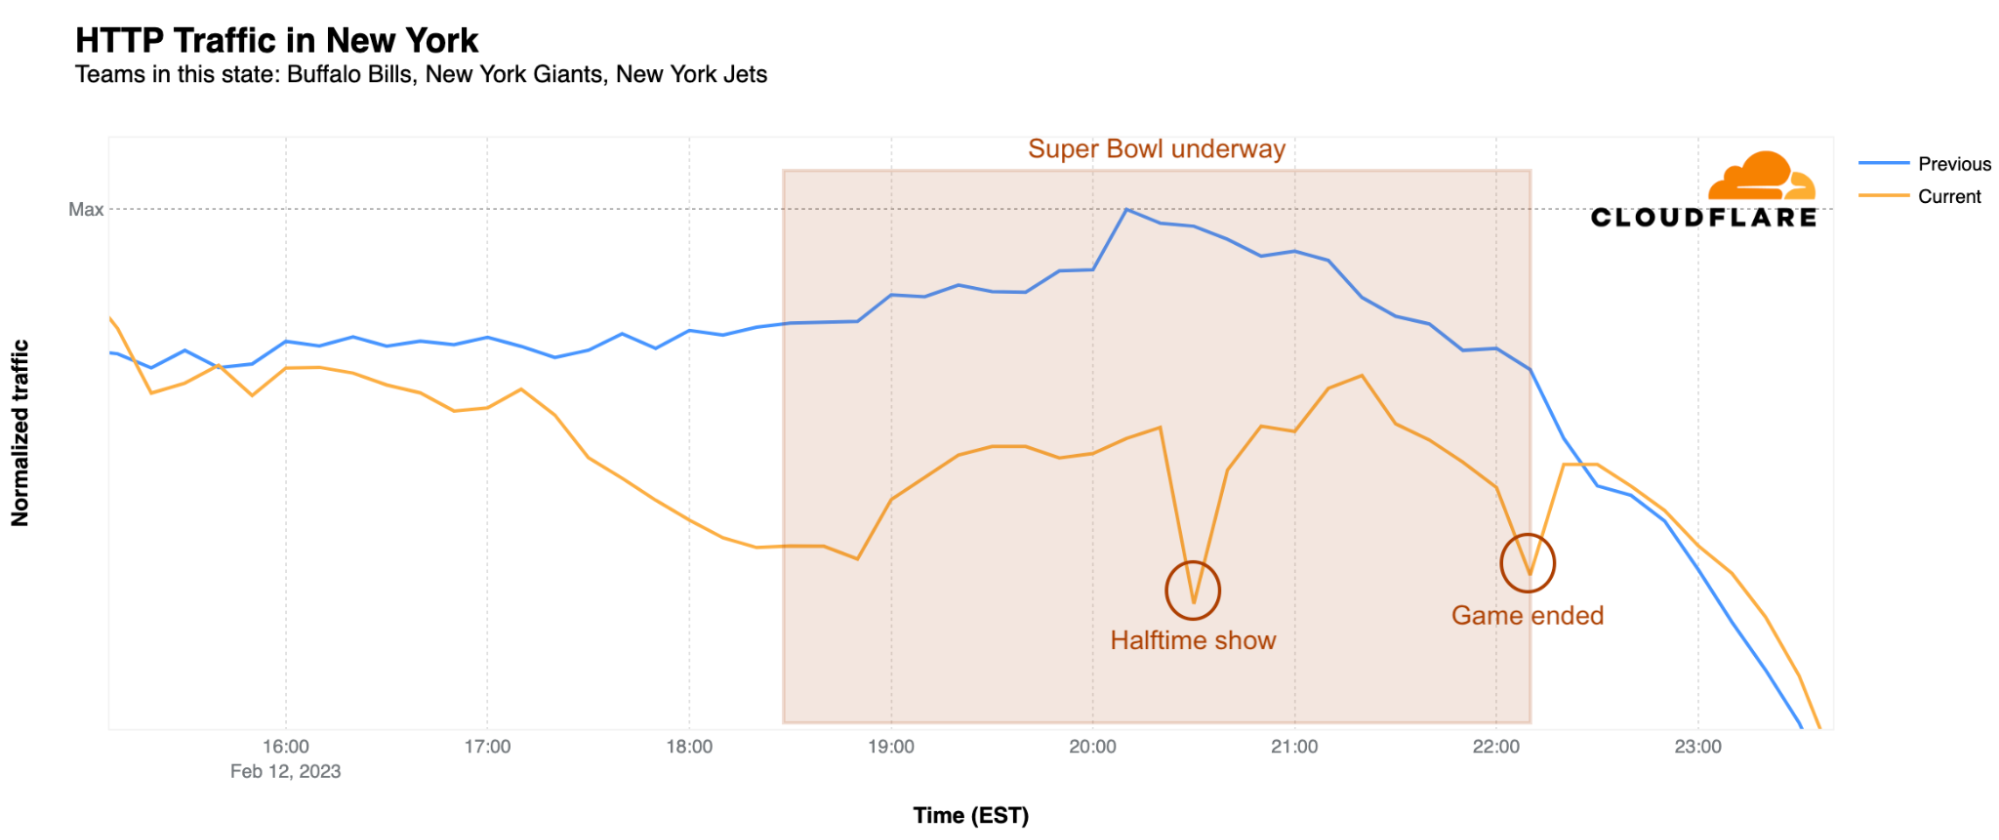
Rihanna’s halftime performance had a clear impact on Internet traffic at a state level, which dropped across all states with NFL teams at the time of her show. Below we take a closer look at the most populous states, among which Pennsylvania, New York and Arizona were winners, with the largest traffic declines. The impacts in Pennsylvania and Arizona are shown above, and the graph below shows the traffic trends seen in New York.
California, Texas, Florida, and New York all had their fair share of Internet traffic dropping before and throughout the game, but it was during the halftime show when things really got interesting. At the time of Rihanna’s performance, Internet traffic in California was 24% lower than the previous Sunday, while in Texas it was 21% below a week earlier, and Florida also saw a 21% drop. Meanwhile, New York had a clear 30% decrease in traffic during the show and, as shown above, Pennsylvania took the cake with a 33% drop. Illinois, Ohio, Georgia, North Carolina, and Michigan were close behind with 23%, 27%, 22%, 25%, and 22% drops respectively.
This seems to be a clear indication that the Super Bowl in general, but also the much-anticipated halftime shows, and the winning celebrations, all have a massive impact on the Internet, causing a noticeable dip in Internet traffic, especially in the state of the winning team.
Do email spammers and scammers take advantage of “The Big Game”?
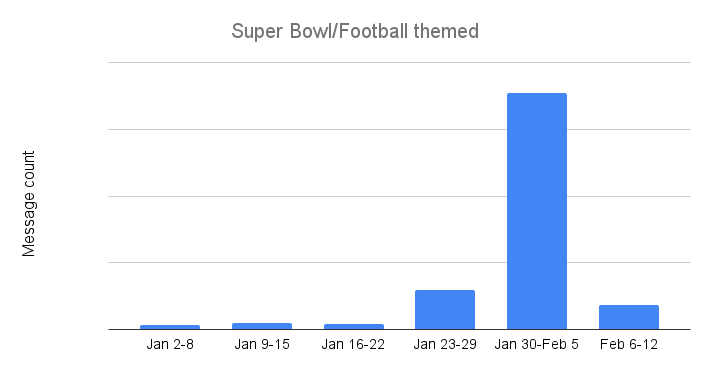
Spammers and scammers will frequently try to take advantage of the popularity of major events when running their campaigns, hoping the tie-in will entice the user to open the message and click on a malicious link, or visit a malicious website where they give up a password or credit card number. Cloudflare Area 1 Email Security analyzed the subject lines of email messages processed by the service in the weeks leading up to the Super Bowl to identify malicious, suspicious, and spam messages across four topic areas: Super Bowl/football, sports gambling, sports media/websites, and food delivery.
As the “regular” season NFL games wrapped up, Super Bowl and football themed email threat volume remained relatively low. However, campaigns clearly picked up between January 23-29 as the message count grew sevenfold. However, campaigns kicked into high gear once the Chiefs and Eagles were headed to the Super Bowl, as the number of identified messages between January 30 and February 5 was nearly six times higher than the previous week. These campaigns quickly ended in the week before the big game, though, as Super Bowl and football themed suspicious, malicious, and spam email volume dropped by nearly 90%.
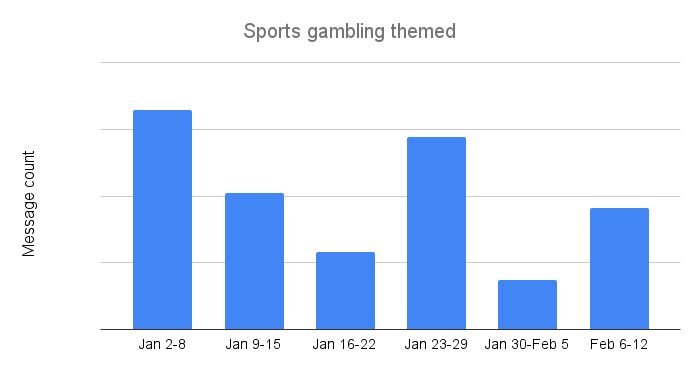
Overall, the number of sports gambling themed subject lines remained fairly low over the survey period. This is somewhat surprising, given that an increasing number of US states have recently legalized betting on sporting events. Interestingly, the trend was highest at the beginning of the year, although that first week was too late to capture potential interest in college football “bowl” games. However, the weeks ahead of the NFL conference championship games (January 23-29) and the Super Bowl (February 6-12) saw message volume increase to levels nearly 2.5x higher than previous weeks.
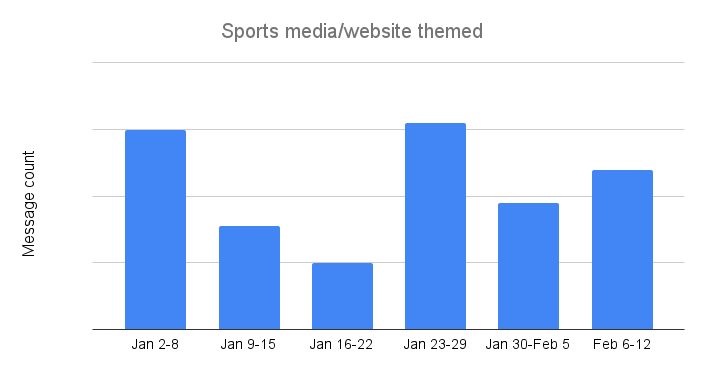
Sports media and website themed suspicious, malicious, and spam email messages apparently don’t draw the clicks, because the volume of such messages seen by Cloudflare Area 1 has remained extremely low since the start of the year, but peaked during the week of January 23-29. And although lower in volume, the observed trends were similar to those seen for sports gambling, with peaks during the same weeks.
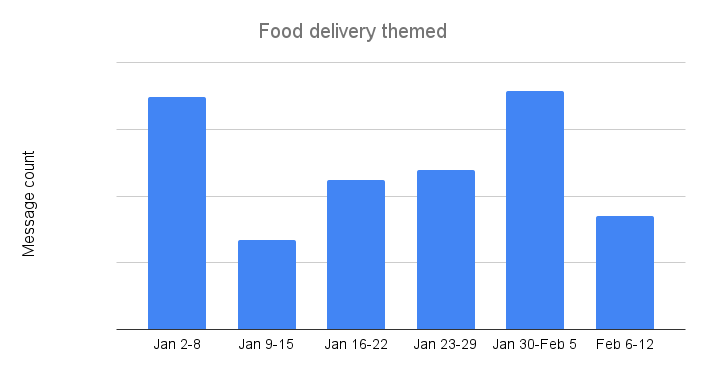
For many people, the Super Bowl is less about the football game than it is about the commercials and the food, and the growth of food delivery services over the last few years have made it easier to ensure that the snacks and libations never run out during the game. Scammers and spammers have apparently learned to take advantage of this hunger, as food delivery themed email messages saw the highest counts across the four categories reviewed here. Peak message counts were seen the weeks of January 2-8 and January 30-February 5. Message volume the weeks following these peaks fell by over 50% in both cases.
Conclusion
As we have seen time and again, advertising during the Super Bowl can drive significant traffic spikes, and apparently this holds true even if a URL isn’t included as a call to action within the commercial. In addition, the trends observed during the game remain a clear reminder that human behavior drives Internet traffic, especially when the halftime show features a popular singer that last performed live five years ago.
Visit Cloudflare Radar for up to date Internet traffic and attack trends, and follow the Cloudflare Radar Twitter and Mastodon accounts for regular insights on Internet events.
Cloudflare operates in more than 250 cities in over 100 countries, where we interconnect with over 10,000 network providers in order to provide a broad range of services to millions of customers. The breadth of both our network and our customer base provides us with a unique perspective on Internet resilience, enabling us to observe the impact of Internet disruptions.
While Internet disruptions are never convenient, online interest in the 2022 World Cup in mid-November and the growth in online holiday shopping in many areas during November and December meant that connectivity issues could be particularly disruptive. Having said that, the fourth quarter appeared to be a bit quieter from an Internet disruptions perspective, although Iran and Ukraine continued to be hotspots, as we discuss below.
Government directed
Multi-hour Internet shutdowns are frequently used by authoritarian governments in response to widespread protests as a means of limiting communications among protestors, as well preventing protestors from sharing information and video with the outside world. During the fourth quarter Cuba and Sudan again implemented such shutdowns, while Iran continued the series of “Internet curfews” across mobile networks it started in mid-September, in addition to implementing several other regional Internet shutdowns.
Cuba
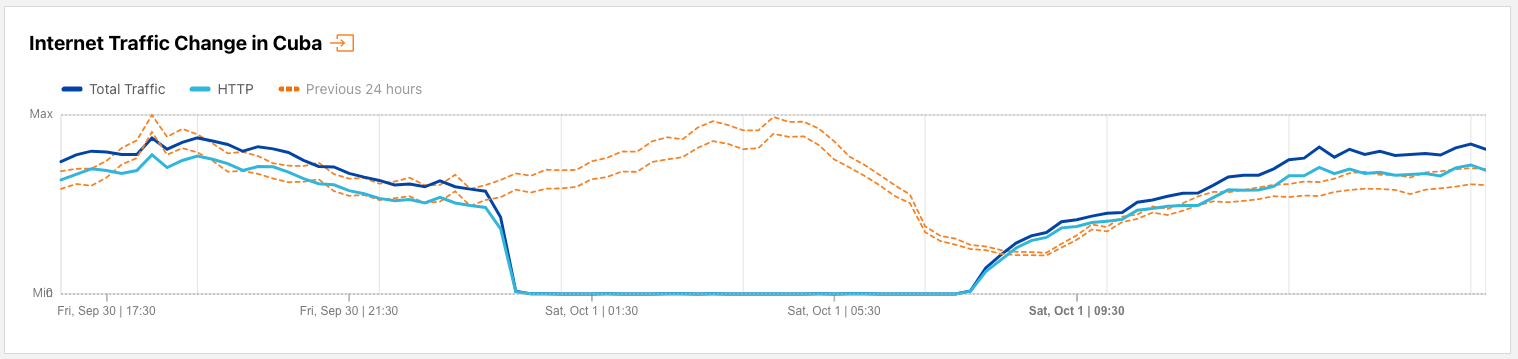
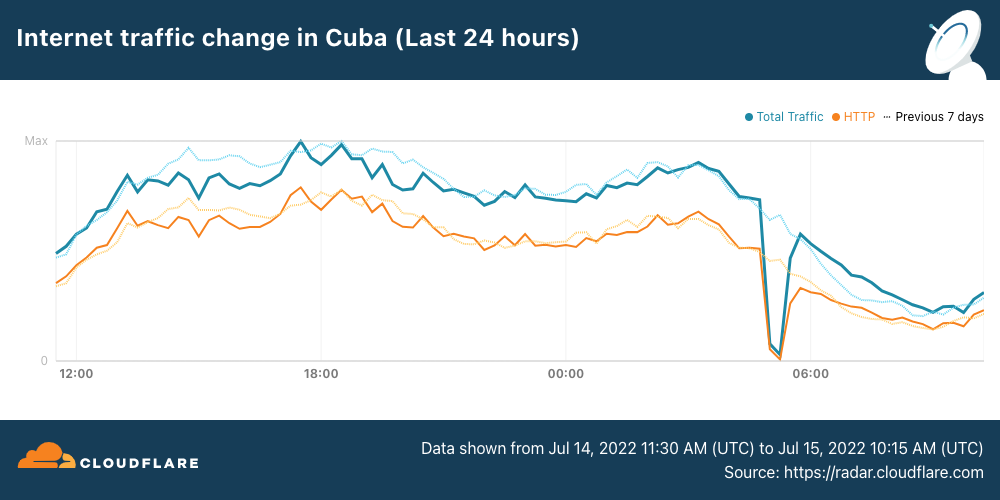
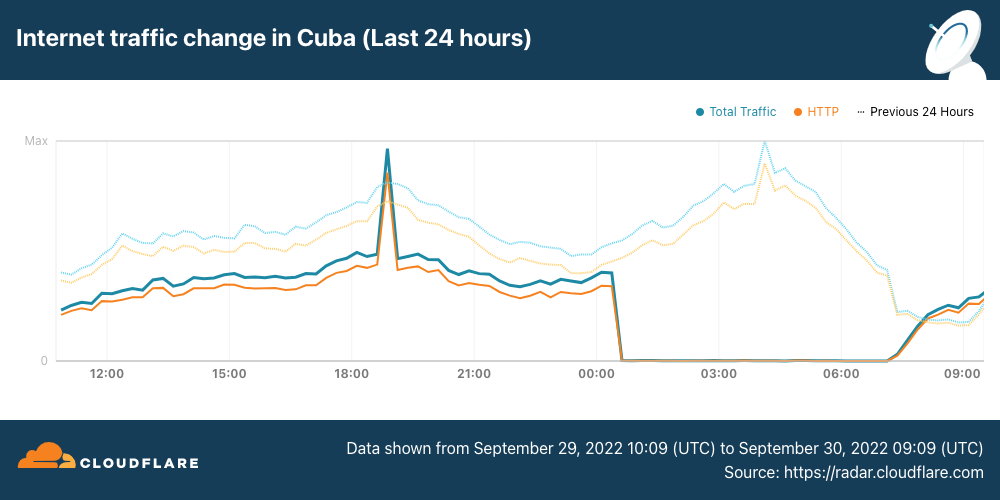
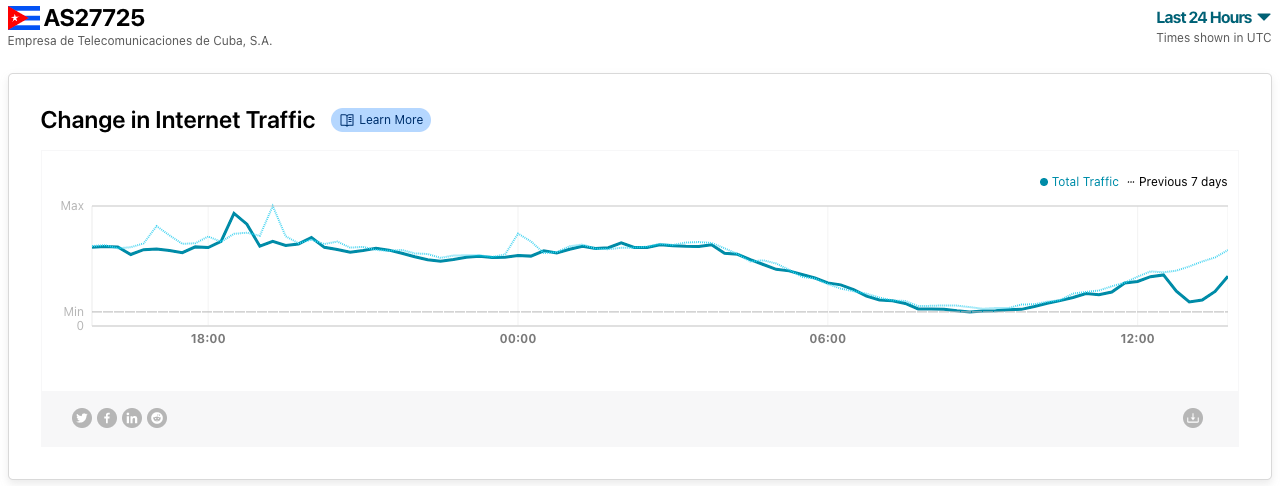
In late September, Hurricane Ian knocked out power across Cuba. While officials worked to restore service as quickly as possible, some citizens responded to perceived delays with protests that were reportedly the largest since anti-government demonstrations over a year earlier. In response to these protests, the Cuban government reportedly cut off Internet access several times. A shutdown on September 29-30 was covered in the Internet disruptions overview for Q3 2022, and the impact of the shutdown that occurred on October 1 (UTC) is shown in the figure below. The timing of this one was similar to the previous one, taking place between 1900 on September 30 and 0245 on October 1 (0000-0745 UTC on October 1).
Sudan
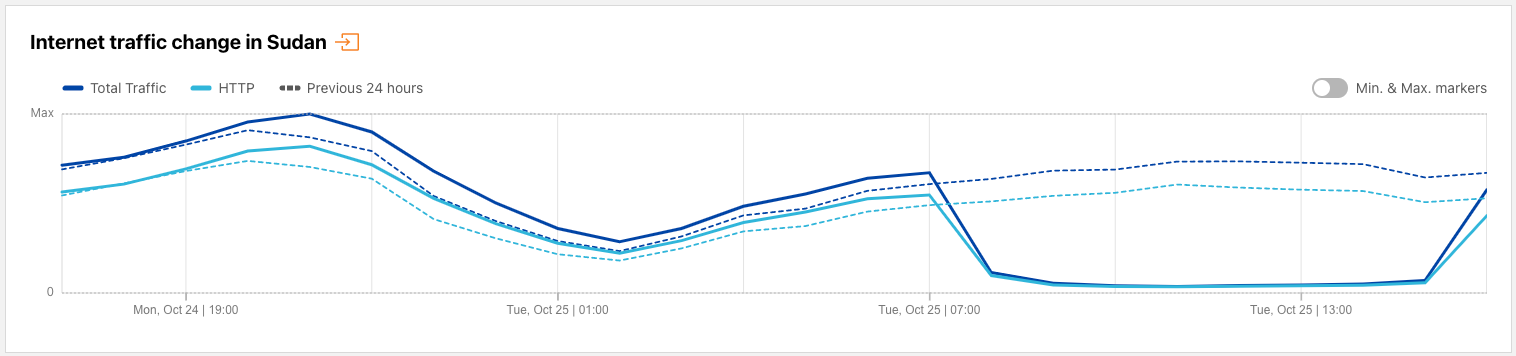
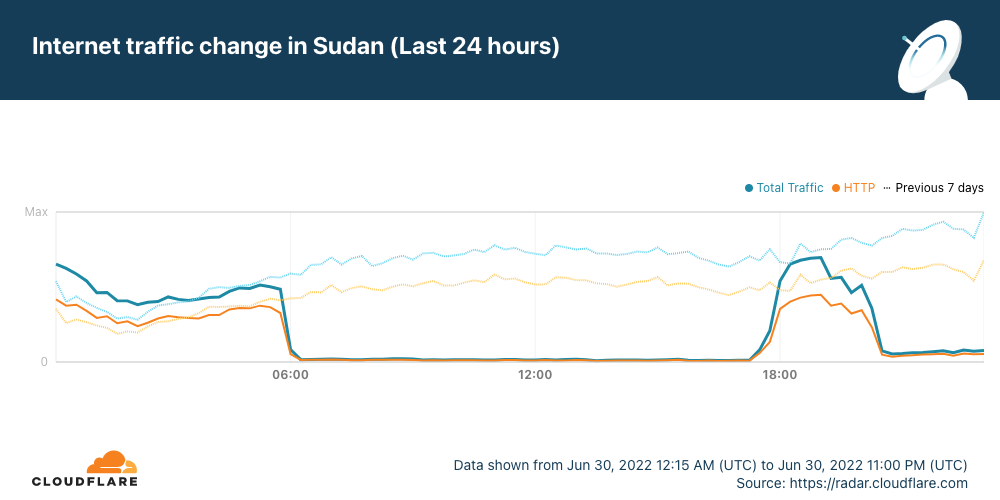
October 25 marked the first anniversary of a coup in Sudan that derailed the country’s transition to civilian rule, and thousands of Sudanese citizens marked the anniversary by taking to the streets in protest. Sudan’s government has a multi-year history of shutting down Internet access during times of civil unrest, and once again implemented an Internet shutdown in response to these protests. The figure below shows a near complete loss of Internet traffic from Sudan on October 25 between 0945-1740 local time (0745 – 1540 UTC).
Iran
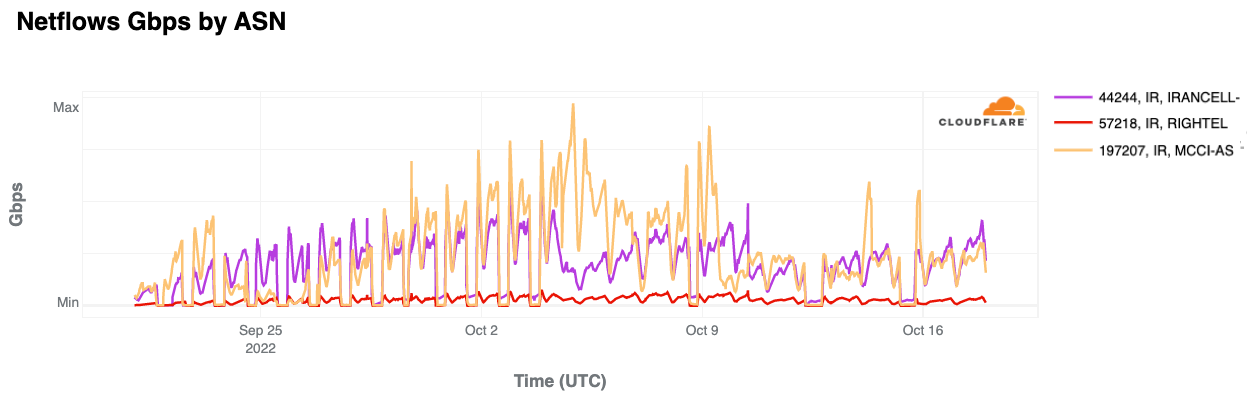
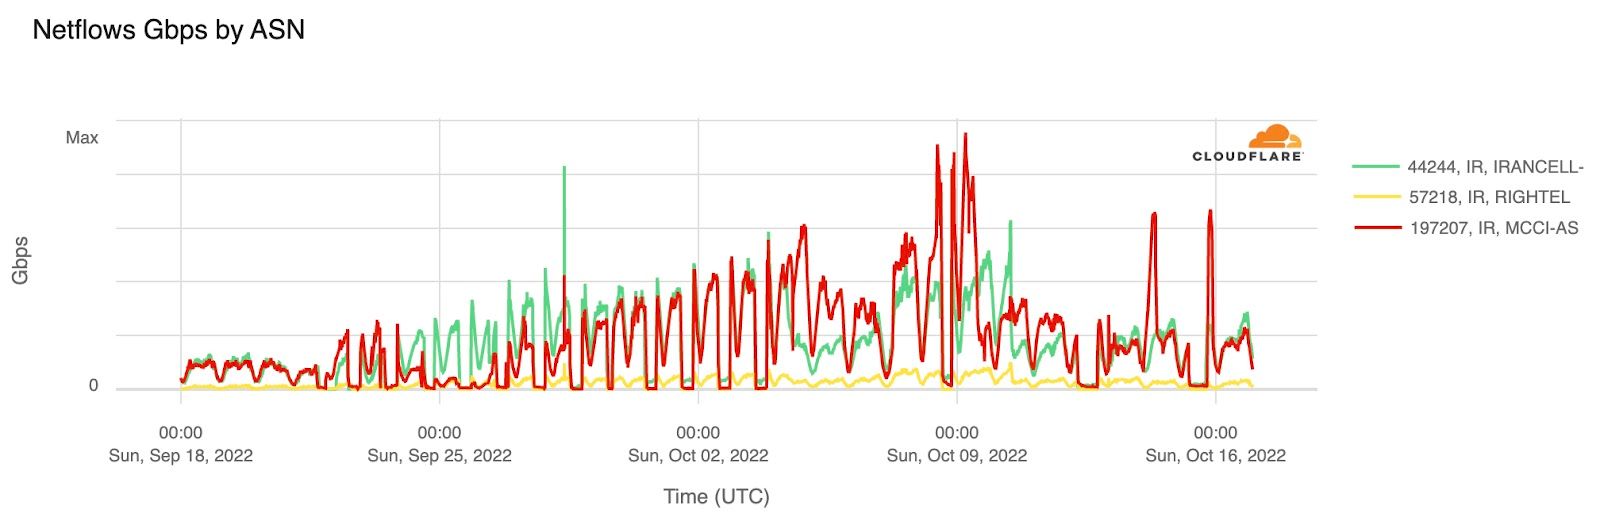
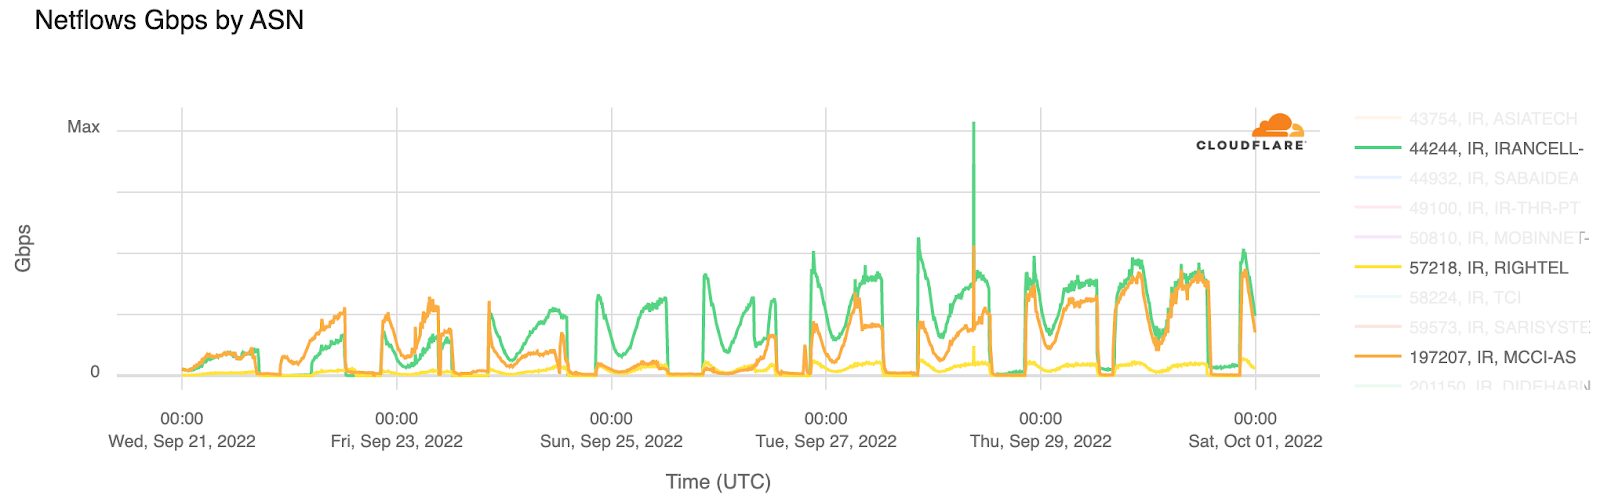
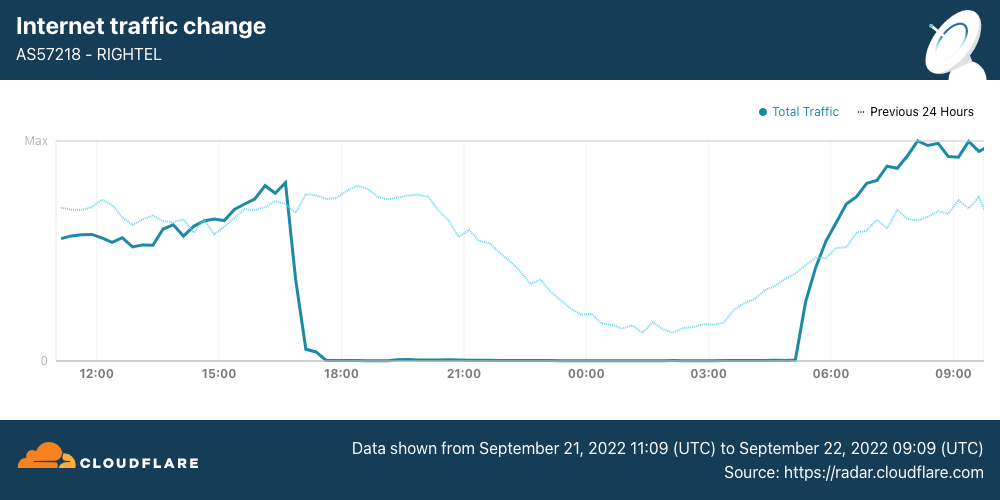
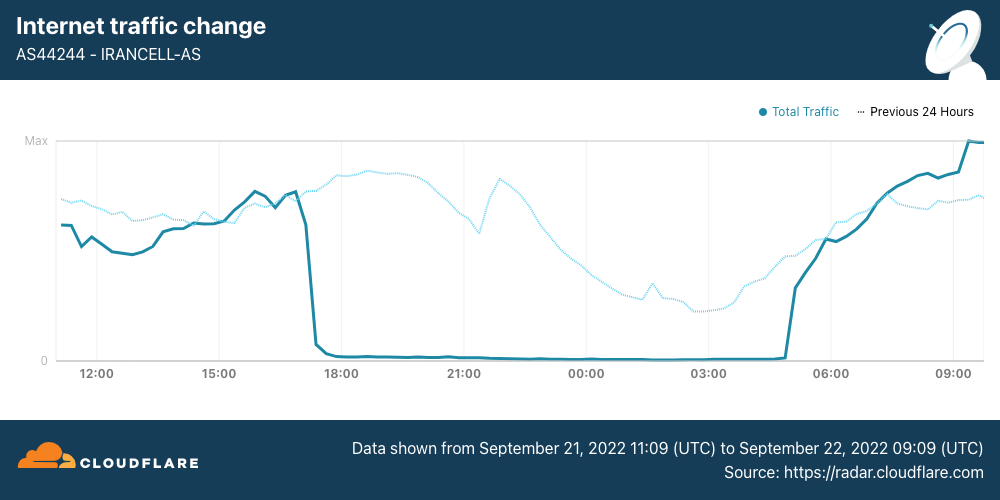
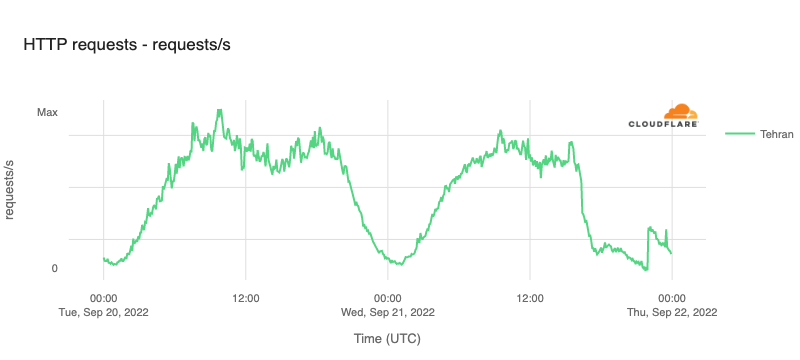
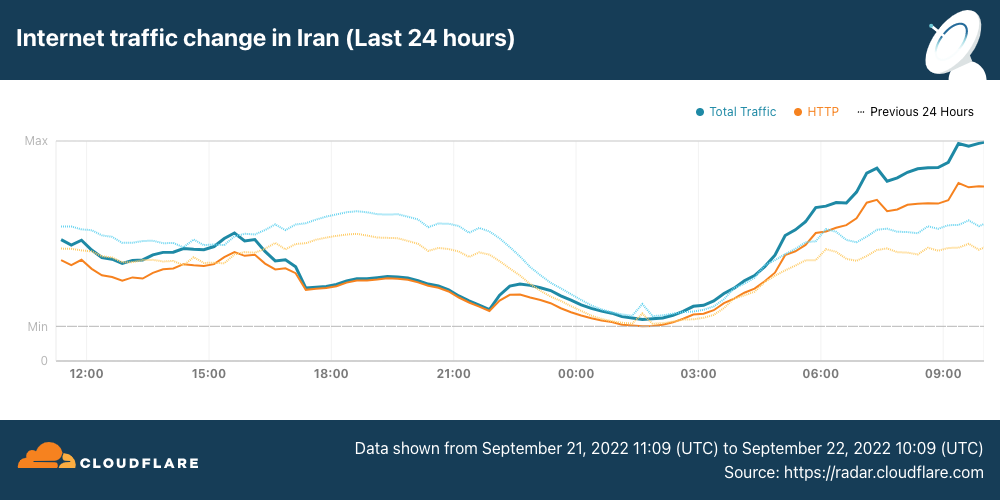
As we covered in last quarter’s blog post, the Iranian government implemented daily Internet “curfews”, generally taking place between 1600 and midnight local time (1230-2030 UTC) across three mobile network providers — AS44244 (Irancell), AS57218 (RighTel), and AS197207 (MCCI) — in response to protests surrounding the death of Mahsa Amini. These multi-hour Internet curfew shutdowns continued into early October, with additional similar outages also observed on October 8, 12 and 15 as seen in the figure below. (The graph’s line for AS57218 (Rightel), the smallest of the three mobile providers, suggests that the shutdowns on this network were not implemented after the end of September.)
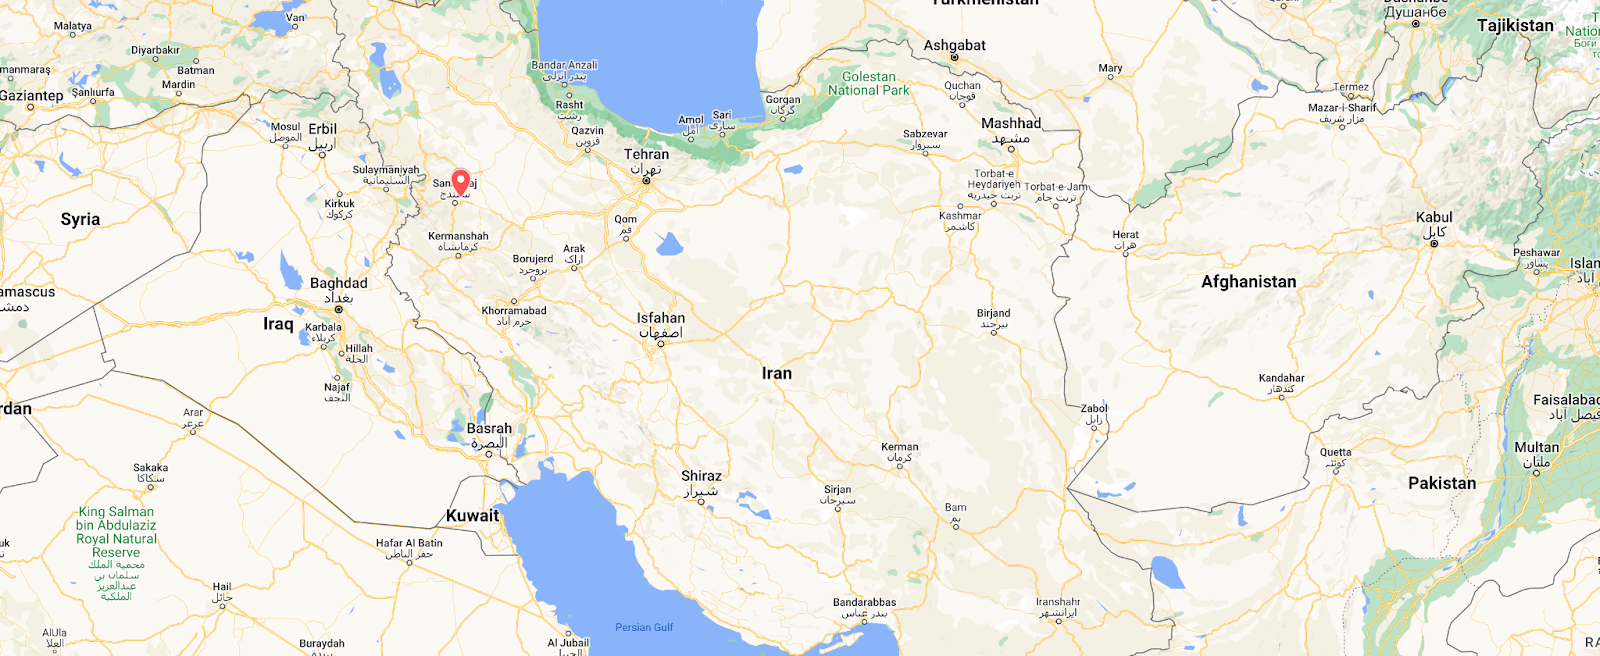
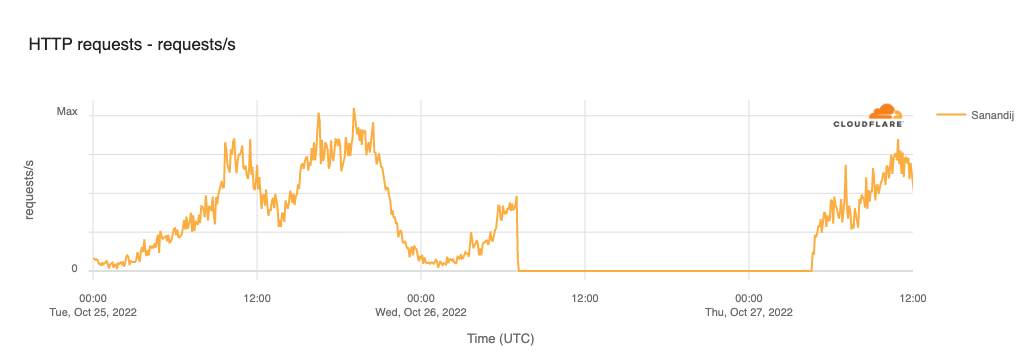
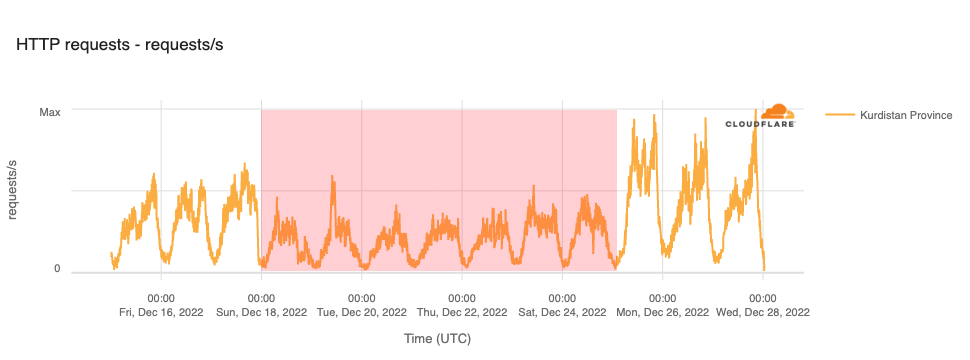
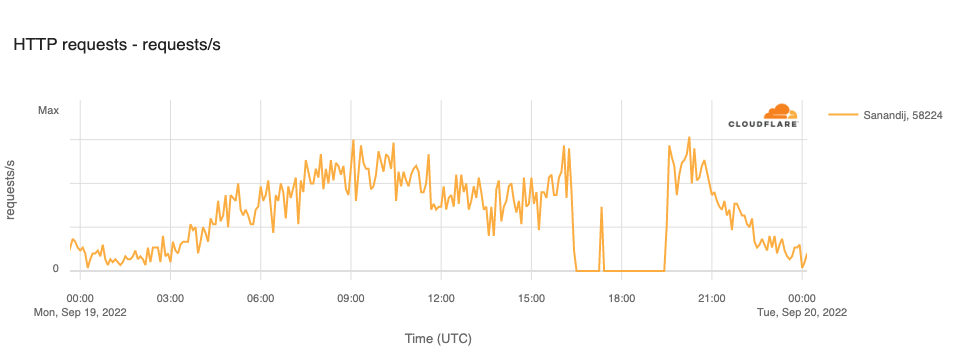
In addition to the mobile network shutdowns, several regional Internet disruptions were also observed in Iran during the fourth quarter, two of which we review below. The first was in Sanandaj, Kurdistan Province on October 26, where a complete Internet shutdown was implemented in response to demonstrations marking the 40th day since the death of Mahsa Amini. The figure below shows a complete loss of traffic starting at 1030 local time (0700 UTC), with the outage lasting until 0805 local time on October 27 (0435 UTC). In December, a province-level Internet disruption was observed starting on December 18, lasting through December 25.
The Internet disruptions that have taken place in Iran over the last several months have had a significant economic impact on the country. A December post from Filterwatch shared concerns stated in a letter from mobile operator Rightel:
The letter, signed by the network’s Managing Director Yasser Rezakhah, states that “during the past few weeks, the company’s resources and income have significantly decreased during Internet shutdowns and other restrictions, such as limiting Internet bandwidth from 21 September. They have also caused a decrease in data use from subscribers, decreasing data traffic by around 50%.” The letter also states that the “continued lack of compensation for losses could lead to bankruptcy.”
The post also highlighted economic concerns shared by Iranian officials:
Some Iranian officials have expressed concern about the cost of Internet shutdowns, including Valiollah Bayati, MP for Tafresh and Ashtian in Markazi province. In a public session in Majles (parliament), he stated that continued Internet shutdowns have led to the closure of many jobs and people are worried, the government and the President must provide necessary measures.
Since the 30th of Shahrivar month and with the beginning of the government disruption in the Internet, the country’s businesses have been damaged daily at least 50 million tomans and at most 500 million tomans. More than 41% of companies have lost 25-50% of their income during this period, and about 47% have had more than 50% reduction in sales. A review of the data of the research assistant of the country’s tax affairs organization shows that the Internet outage in Iran has caused 3000 billion tomans of damage per day. That is, the cost of 3 months of Internet outage in Iran is equal to 43% of one year’s oil revenue of the country ($25 billion).
Power outages
Bangladesh, October 4
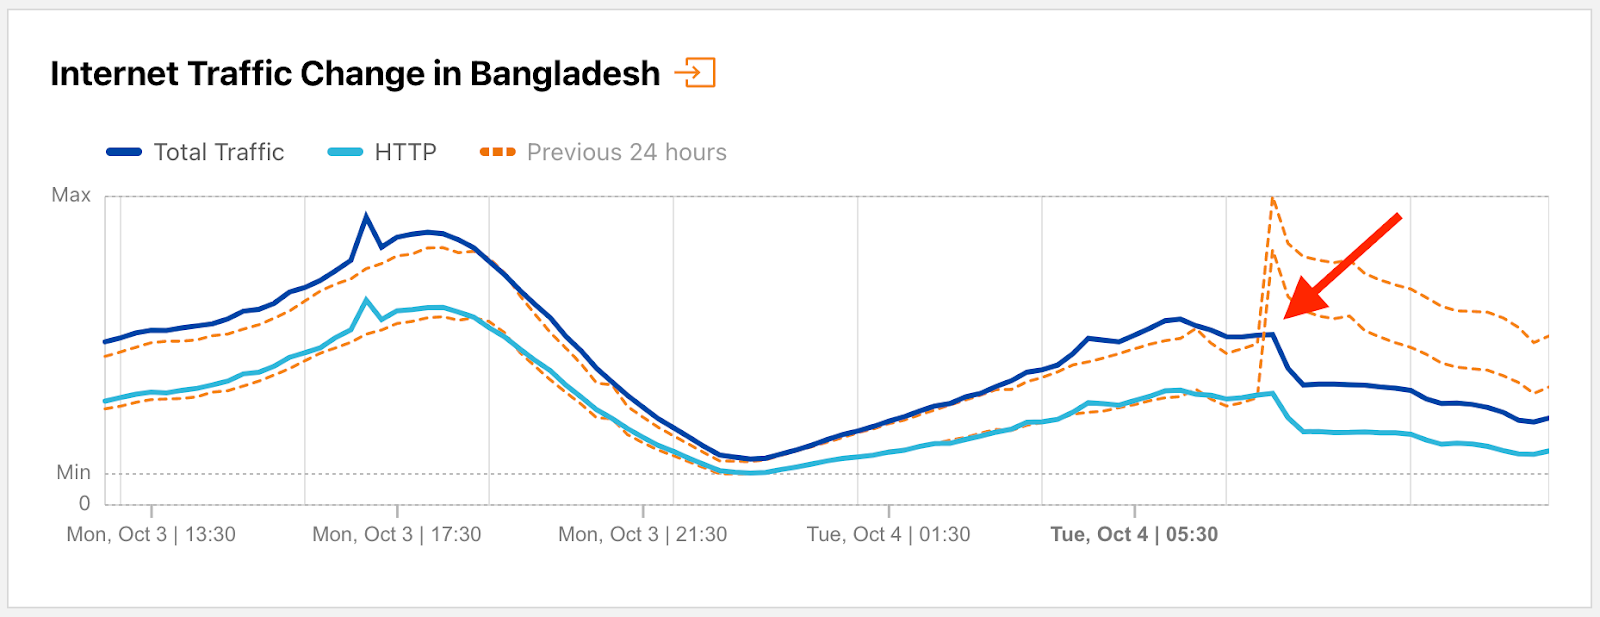
Over 140 million people in Bangladesh were left without electricity on October 4 as the result of a reported grid failure caused by a failure by power distribution companies to follow instructions from the National Load Dispatch Centre to shed load. The resultant power outage resulted in an observed drop in Internet traffic from the country, starting at 1405 local time (0805 UTC), as shown in the figure below. The disruption lasted approximately seven hours, with traffic returning to expected levels around 1900 local time (1500 UTC).
Pakistan
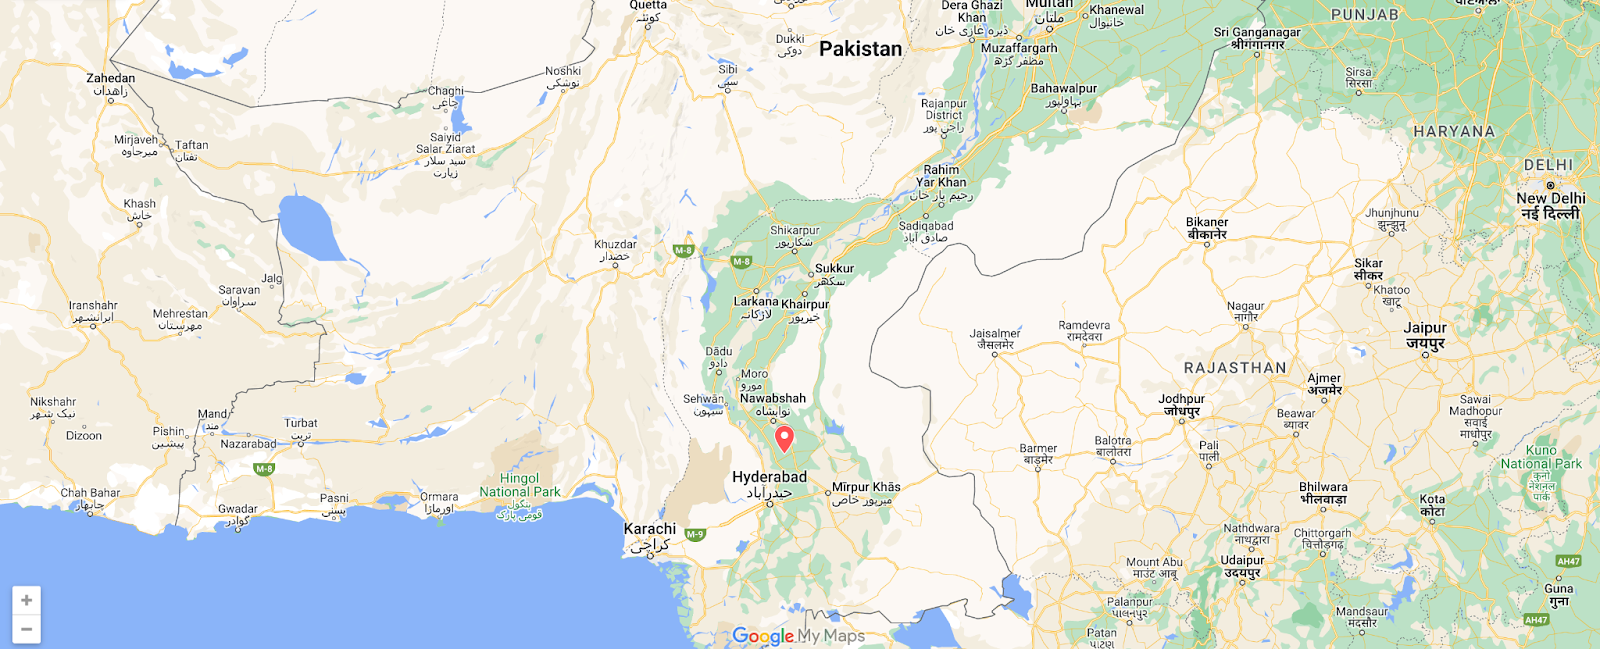
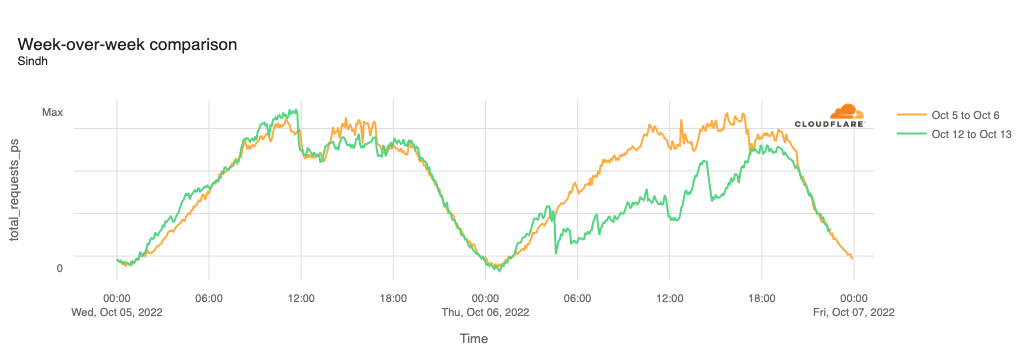
Over a week later, a similar issue in Pakistan caused power outages across the southern part of the country, including Sindh, Punjab, and Balochistan. The power outages were caused by a fault in the national grid’s southern transmission system, reportedly due to faulty equipment and sub-standard maintenance. As expected, the power outages resulted in disruptions to Internet connectivity, and the figure below illustrates the impact observed in Sindh, where traffic dropped nearly 30% as compared to the previous week starting at 0935 local time (0435 UTC) on October 6. The disruption lasted over 15 hours, with traffic returning to expected levels at 0100 on October 7 (2000 UTC on October 6).
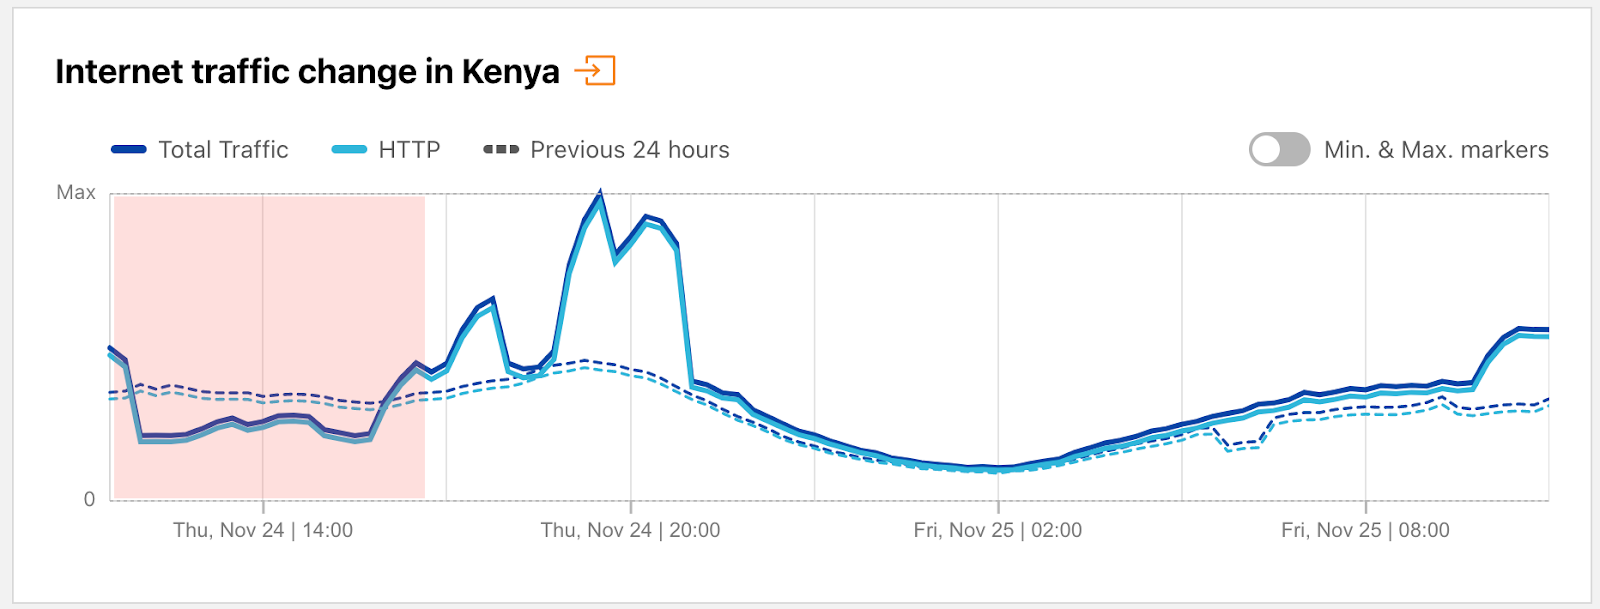
On November 24, a Tweet from Kenya Power at 1525 local time noted that they had “lost bulk power supply to various parts of the country due to a system disturbance”. A subsequent Tweet published just over six hours later at 2150 local time stated that “normal power supply has been restored to all parts of the country.” The time stamps on these notifications align with the loss of Internet traffic visible in the figure below, which lasted between 1500-2050 local time (1200-1750 UTC).
United States (Moore County, North Carolina)
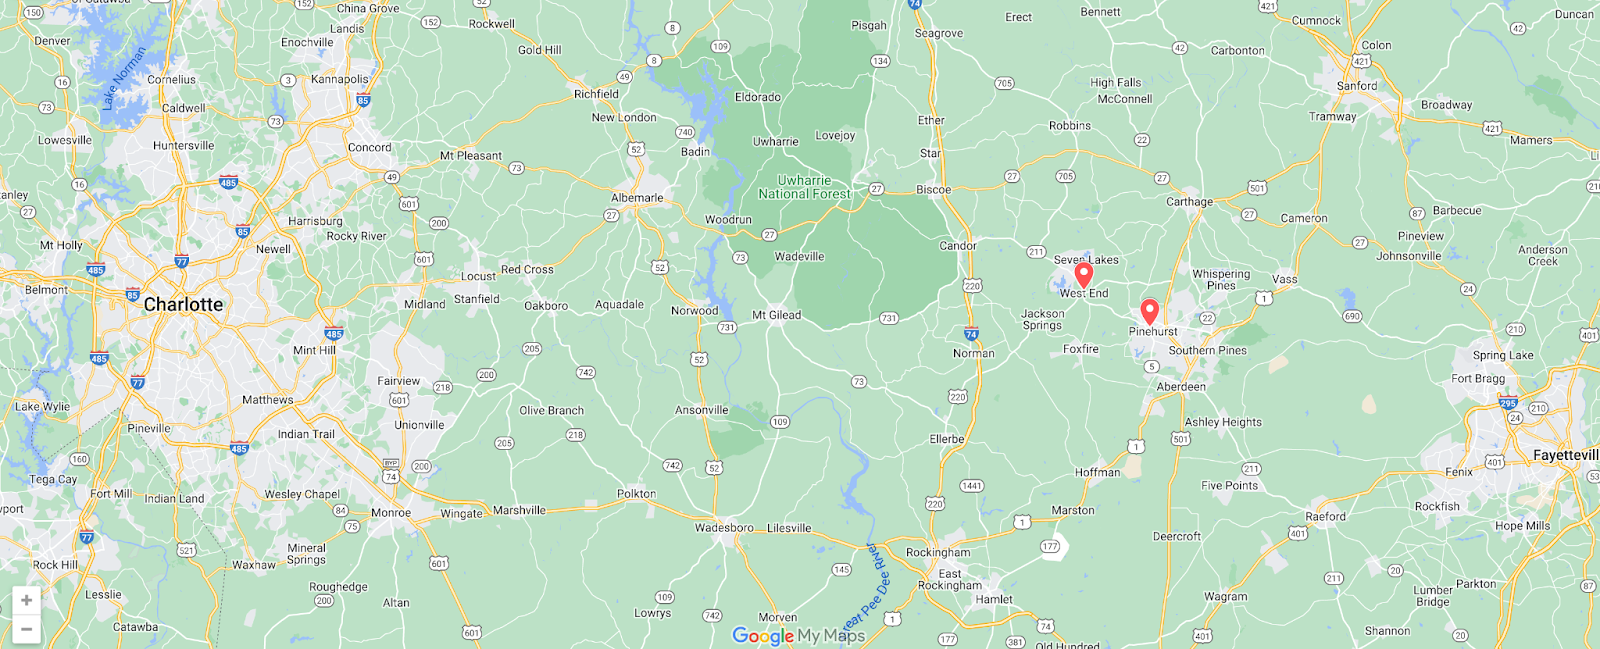
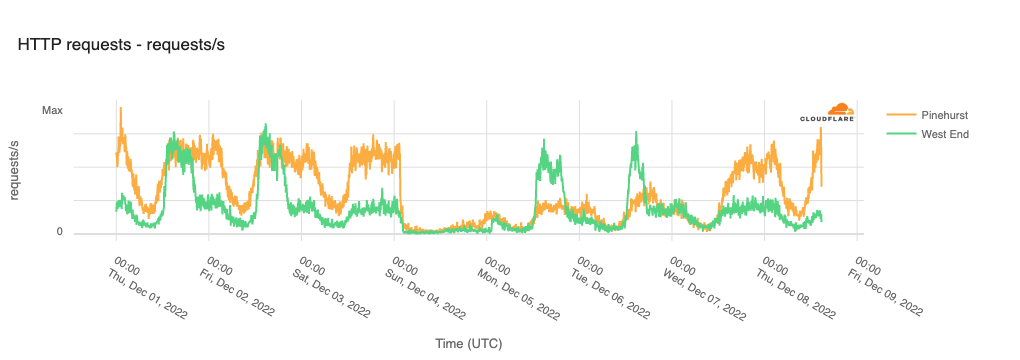
On December 3, two electrical substations in Moore County, North Carolina were targeted by gunfire, with the resultant damage causing localized power outages that took multiple days to resolve. The power outages reportedly began just after 1900 local time (0000 UTC on December 4), resulting in the concurrent loss of Internet traffic from communities within Moore County, as seen in the figure below.
Internet traffic within the community of West End appeared to return midday (UTC) on December 5, but that recovery was apparently short-lived, as it fell again during the afternoon of December 6. In Pinehurst, traffic began to slowly recover after about a day, but returned to more normal levels around 0800 local time (1300 UTC) on December 7.
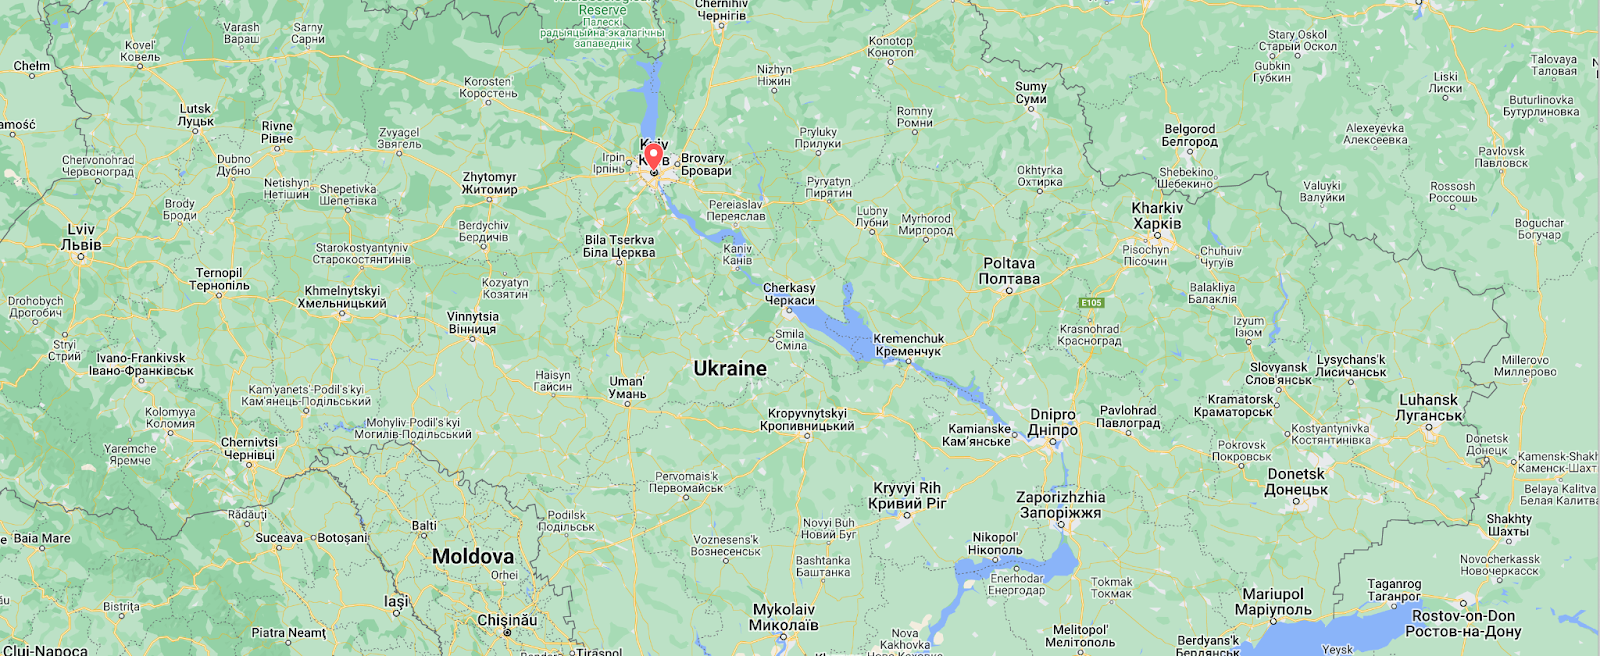
The war in Ukraine has been going on since February 24, and Cloudflare has covered the impact of the war on the country’s Internet connectivity in a number of blog posts across the year (March, March, April, May, June, July, October, December). Throughout the fourth quarter of 2022, Russian missile strikes causedwidespreaddamage to electrical infrastructure, resulting in power outages and disruptions to Internet connectivity. Below, we highlight several examples of the Internet disruptions observed in Ukraine during the fourth quarter, but they are just a few of the many disruptions that occurred.
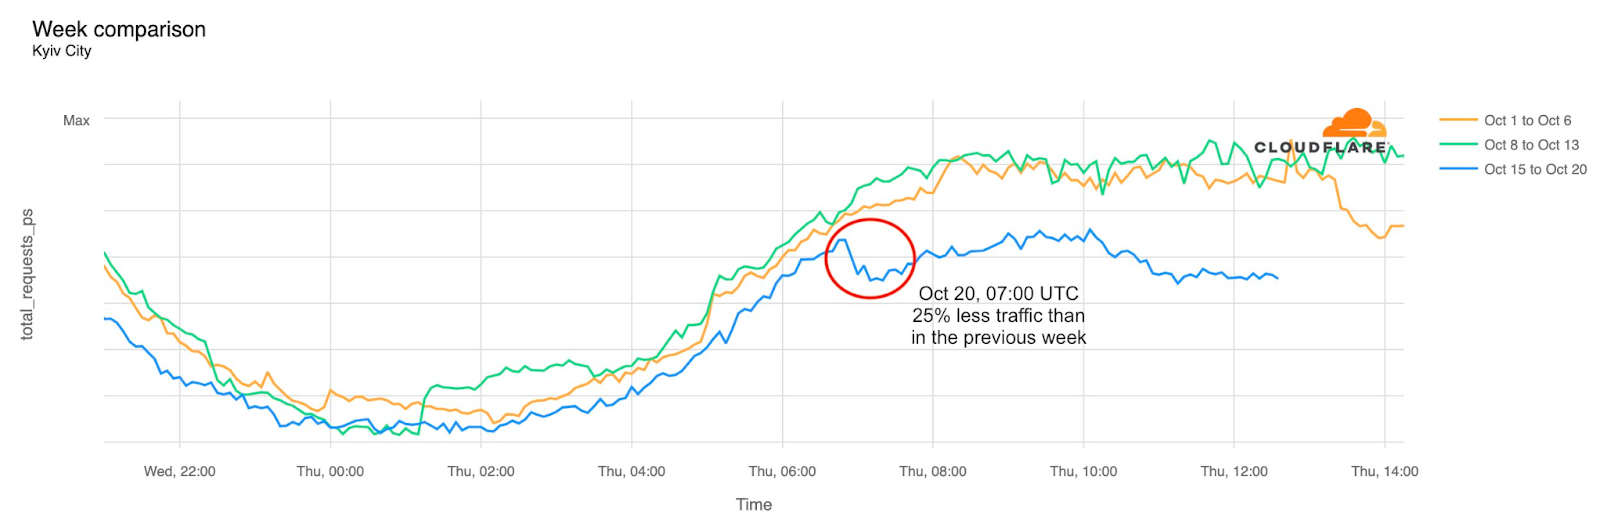
On October 20, the destruction of several power stations in Kyiv resulted in a 25% drop in Internet traffic from Kyiv City as compared to the two previous weeks. The disruption began around 0900 local time (0700 UTC).
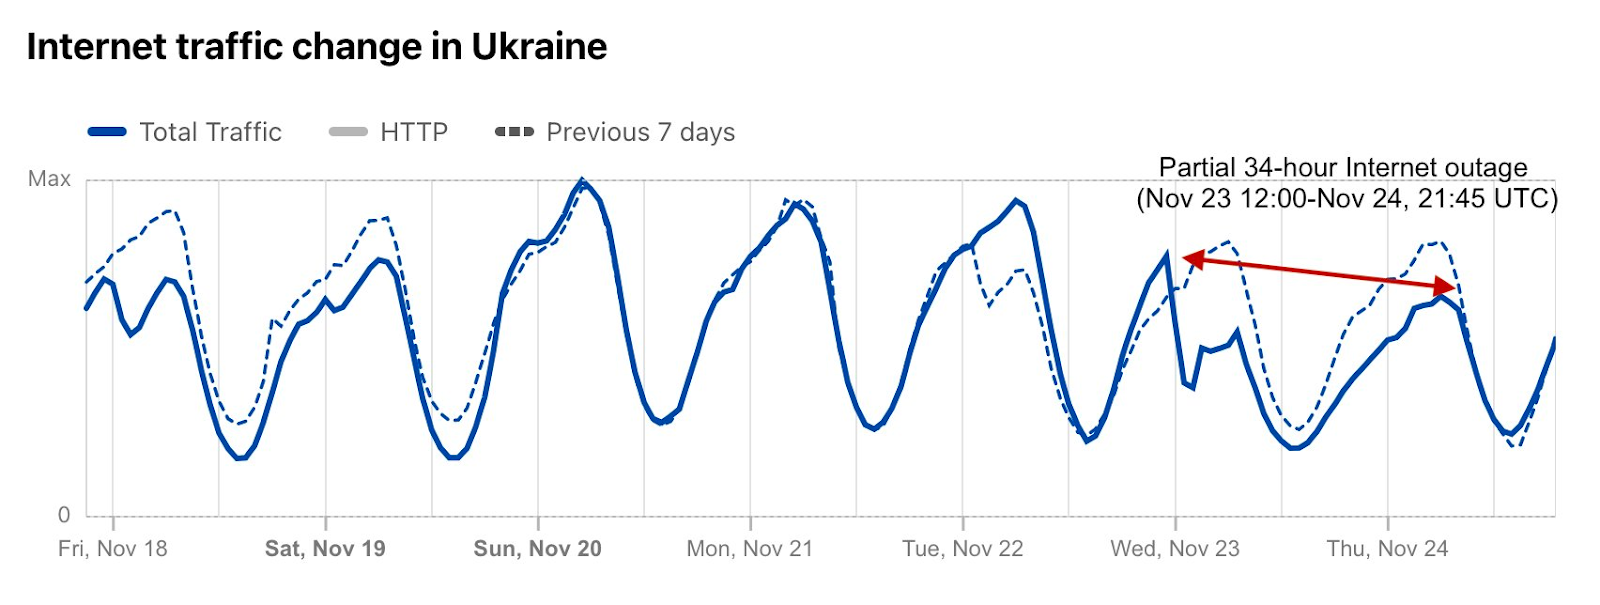
On November 23, widespread power outages after Russian strikes caused a nearly 50% decrease in Internet traffic in Ukraine, starting just after 1400 local time (1200 UTC). This disruption lasted for nearly a day and a half, with traffic returning to expected levels around 2345 local time on November 24 (2145 UTC).
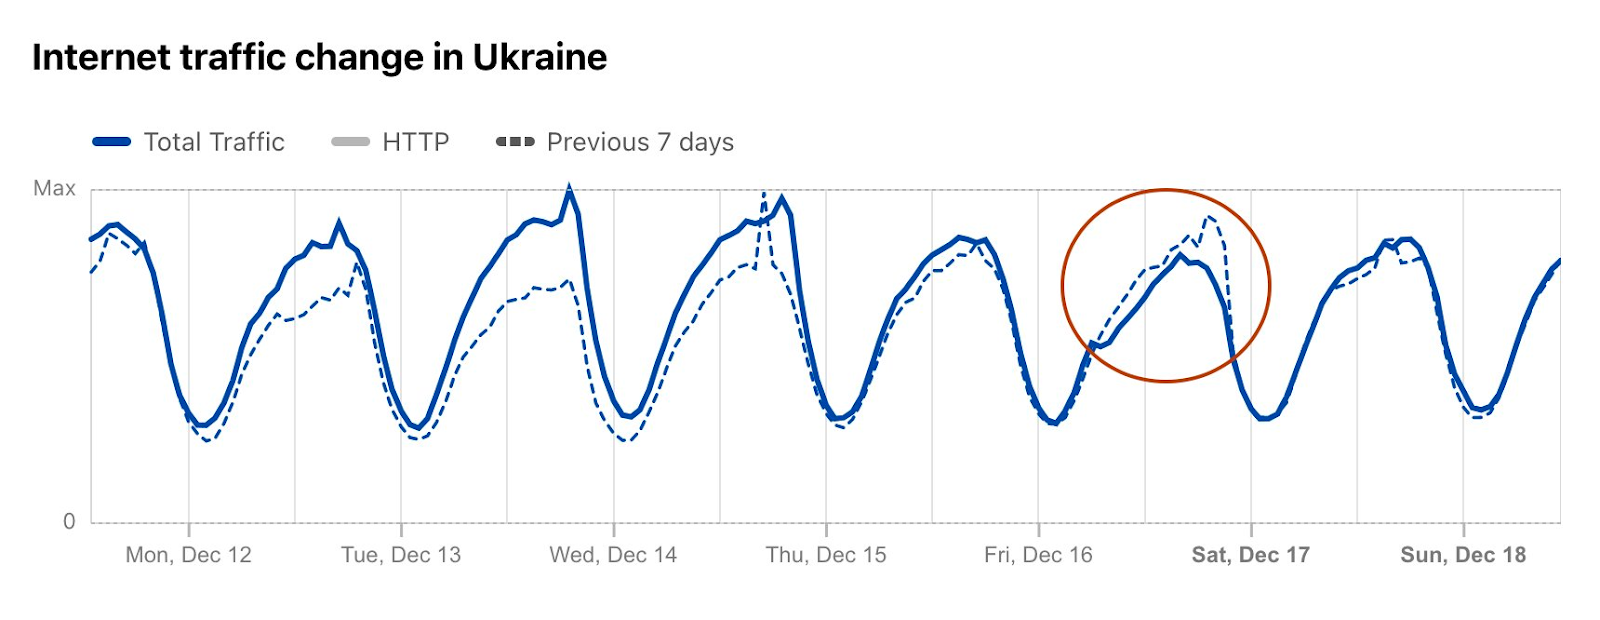
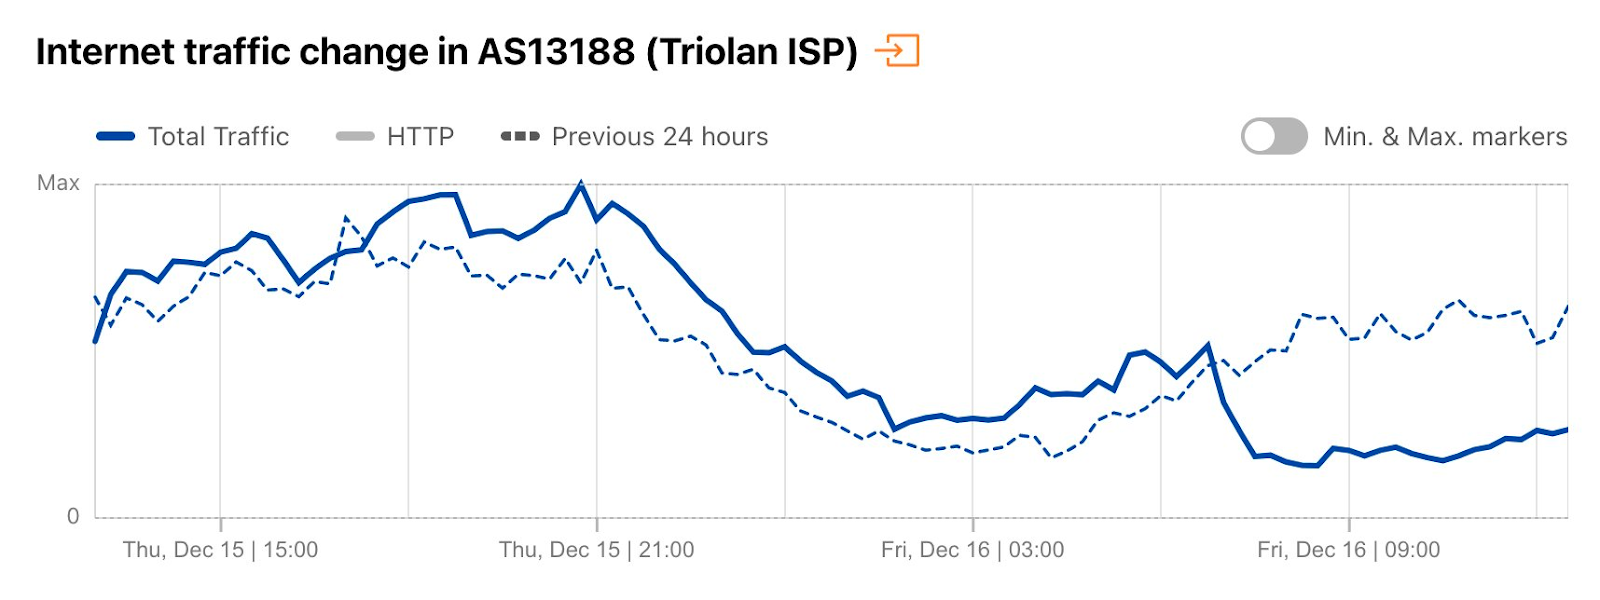
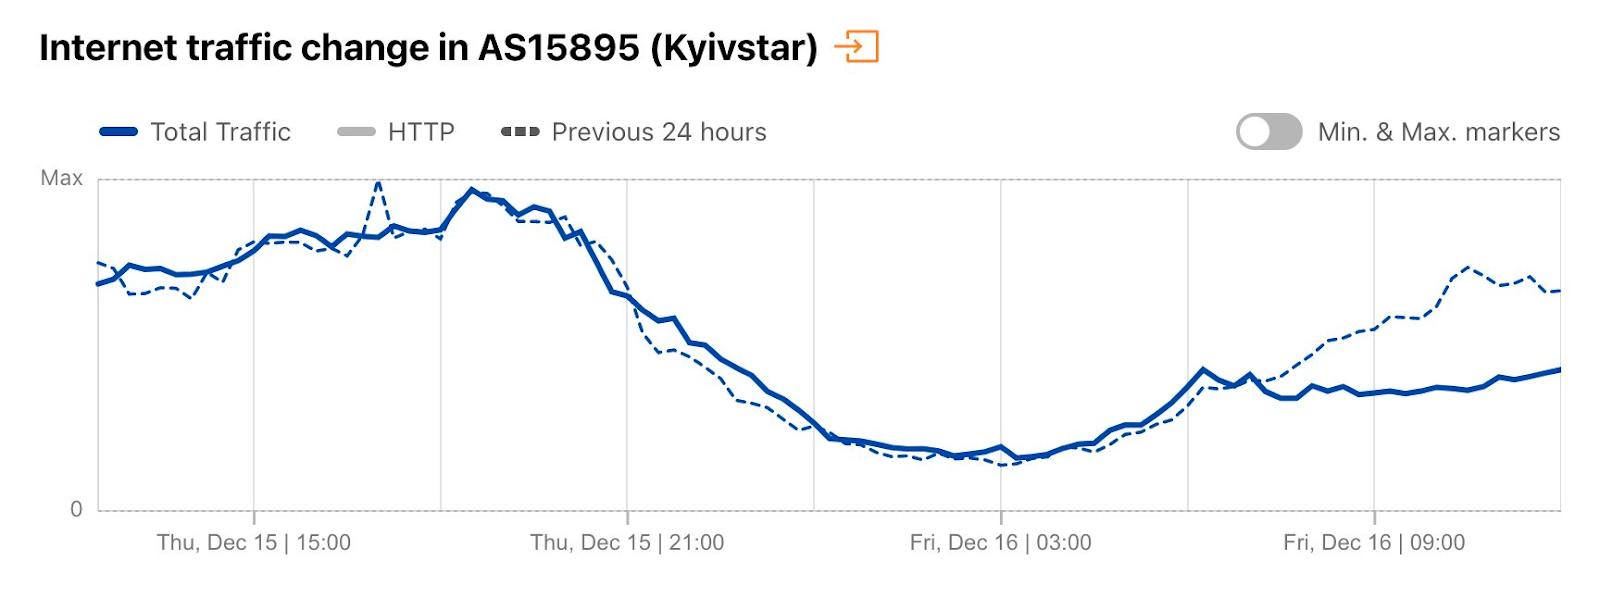
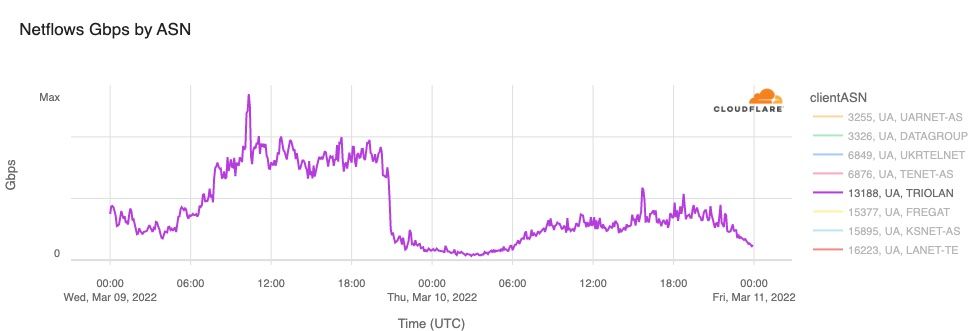
On December 16, power outages resulting from Russian air strikes targeting power infrastructure caused country-level Internet traffic to drop around 13% at 0915 local time (0715 UTC), with the disruption lasting until midnight local time (2200 UTC). However, at a network level, the impact was more significant, with AS13188 (Triolan) seeing a 70% drop in traffic, and AS15895 (Kyivstar) a 40% drop, both shown in the figures below.
Cable cuts
Shetland Islands, United Kingdom
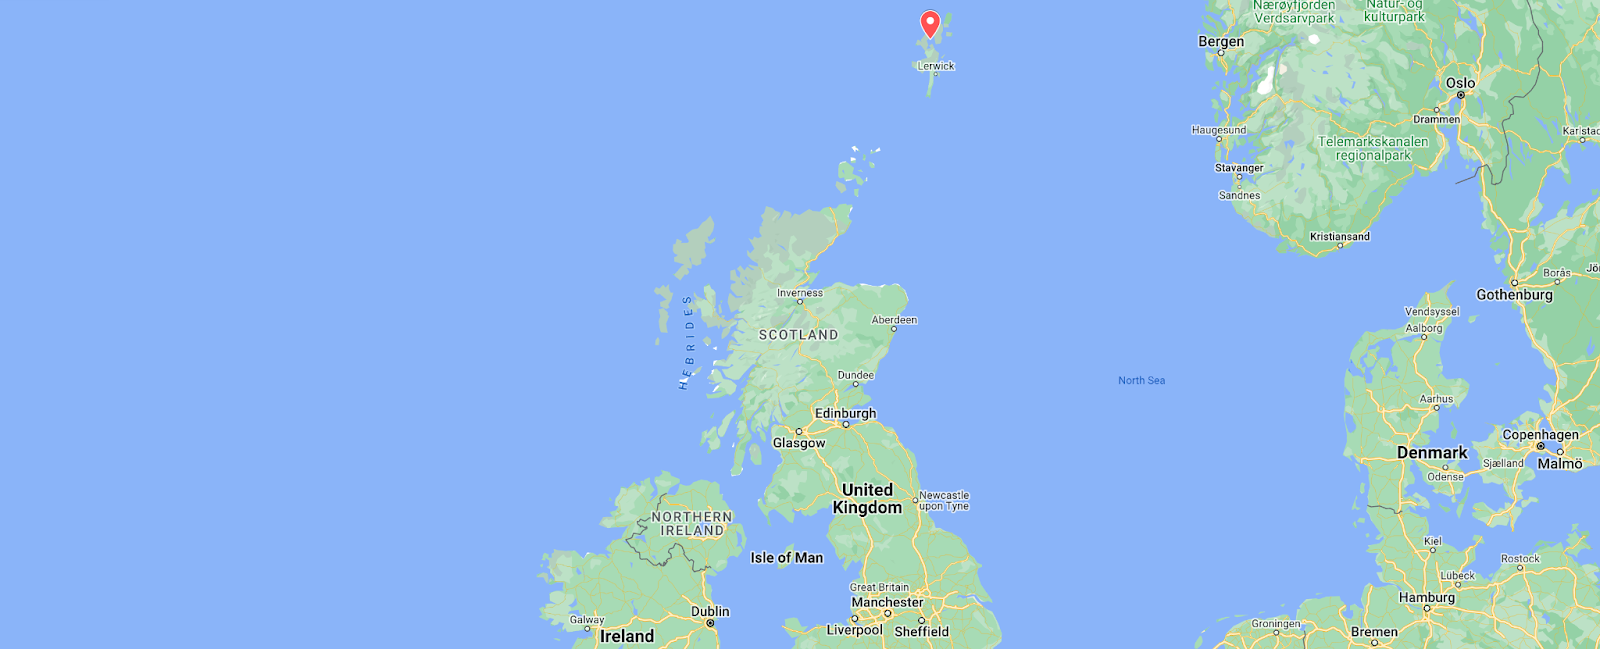
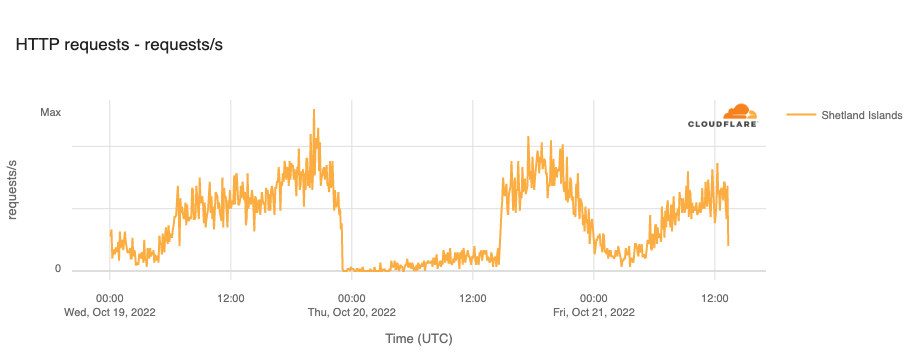
The Shetland Islands are primarily dependent on the SHEFA-2 submarine cable system for Internet connectivity, connecting through the Scottish mainland. Late in the evening of October 19, damage to this cable knocked the Shetland Islands almost completely offline. At the time, there was heightened concern about the potential sabotage of submarine cables due to the reported sabotage of the Nord Stream natural gas pipelines in late September, but authorities believed that this cable damage was due to errant fishing vessels, and not sabotage.
The figure below shows that the impact of the damage to the cable was relatively short-lived, compared to the multi-day Internet disruptions often associated with submarine cable cuts. Traffic dropped just after 2300 local time (2200 UTC) on October 19, and recovered 14.5 hours later, just after 1430 local time (1330 UTC) on October 20.
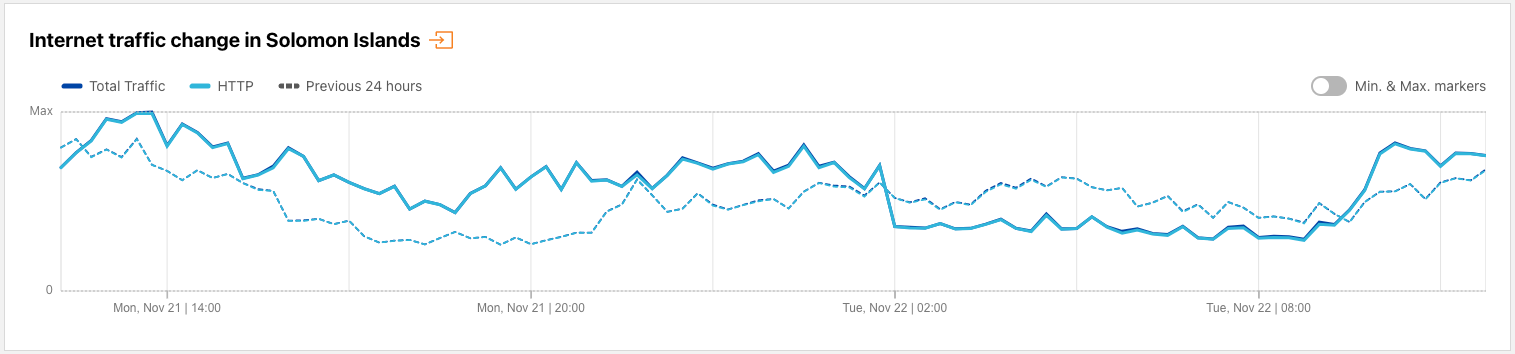
Earthquakes frequently cause infrastructure damage and power outages in affected areas, resulting in disruptions to Internet connectivity. We observed such a disruption in the Solomon Islands after a magnitude 7.0 earthquake occurred near there on November 22. The figure below shows Internet traffic from the country dropping significantly at 1300 local time (0200 UTC), and recovering 11 hours later at around 2000 local time (0900 UTC).
Technical problems
Kyrgyzstan
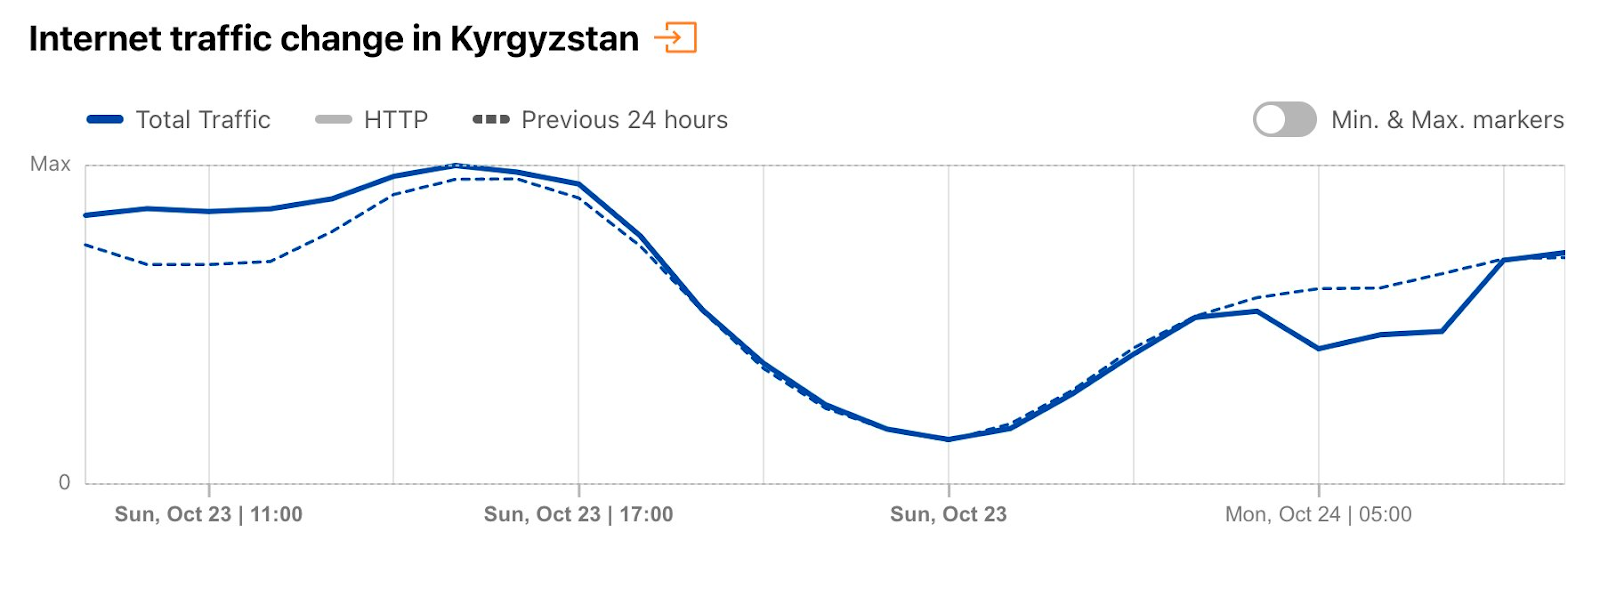
On October 24, a three-hour Internet disruption was observed in Kyrgyzstan lasting between 1100-1400 local time (0500-0800 UTC), as seen in the figure below. According to the country’s Ministry of Digital Development, the issue was caused by “an accident on one of the main lines that supply the Internet”, but no additional details were provided regarding the type of accident or where it had occurred.
Australia (Aussie Broadband)
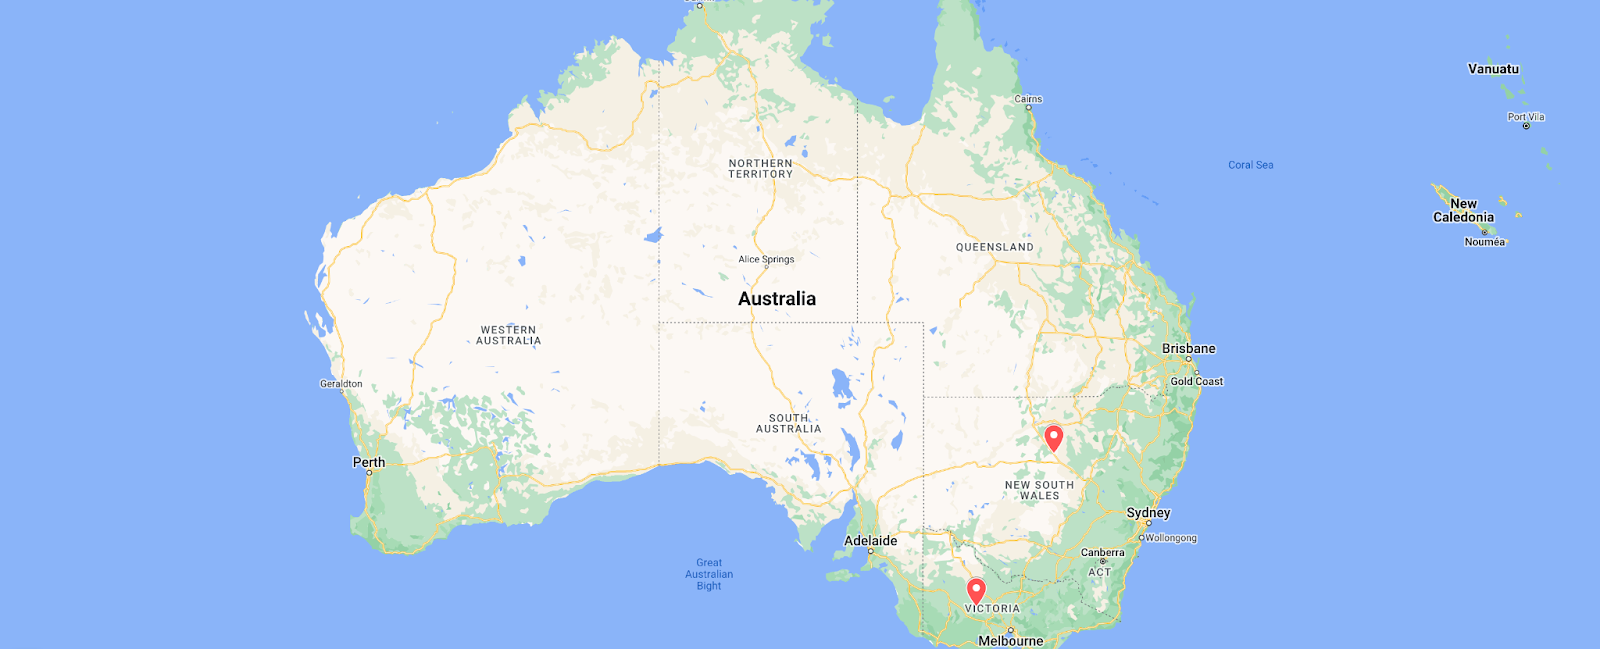
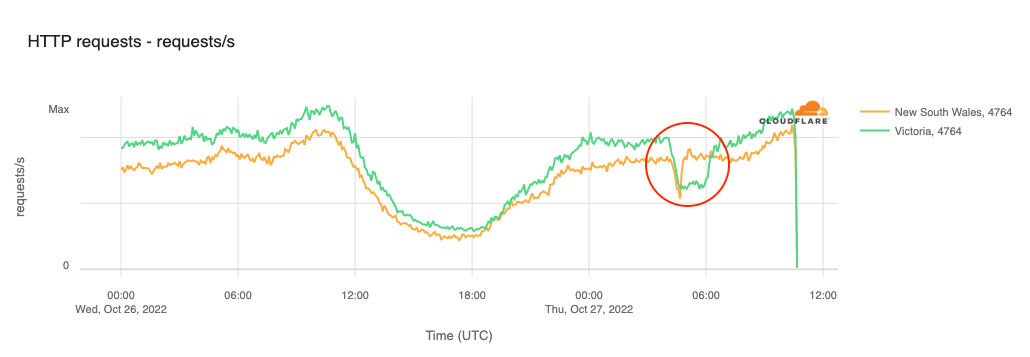
Customers of Australian broadband Internet provider Aussie Broadband in Victoria and New South Wales suffered brief Internet disruptions on October 27. As shown in the figure below, AS4764 (Aussie Broadband) traffic from Victoria dropped by approximately 40% between 1505-1745 local time (0405-0645 UTC). A similar, but briefer, loss of traffic from New South Wales was also observed, lasting between 1515-1550 local time (0415-0450 UTC). A representative of Aussie Broadband provided insight into the underlying cause of the disruption, stating “A config change was made which was pushed out through automation to the DHCP servers in those states. … The change has been rolled back but getting the sessions back online is taking time for VIC, and we are now manually bringing areas up one at a time.”
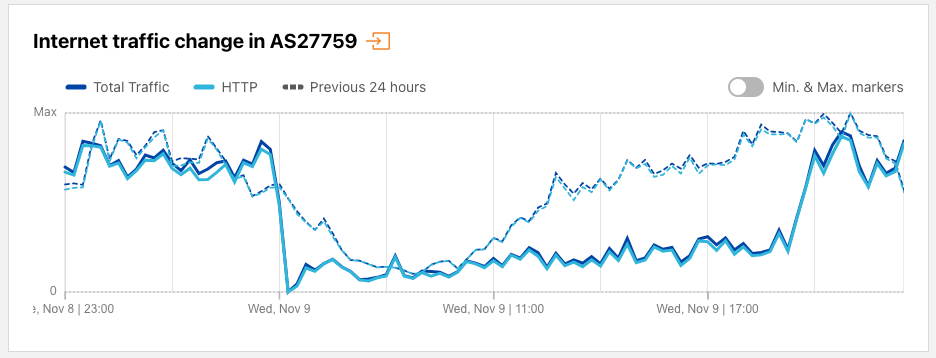
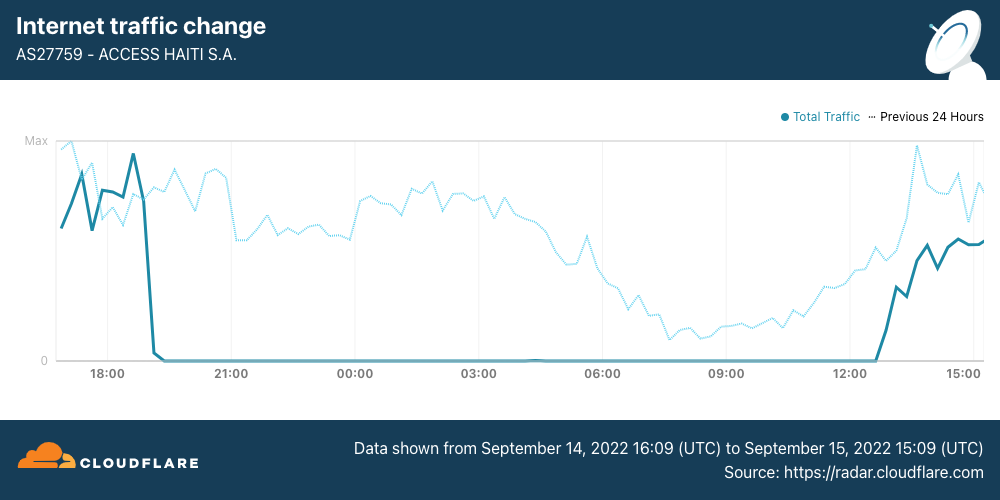
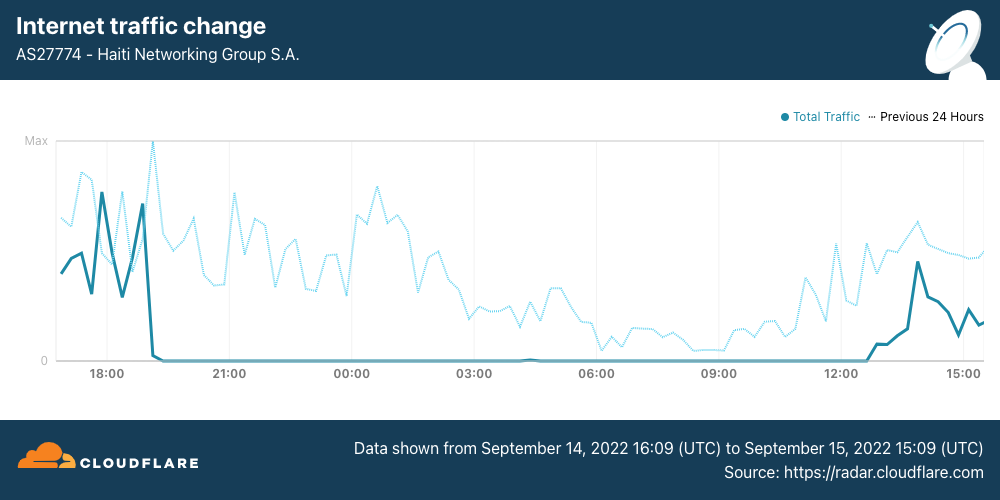
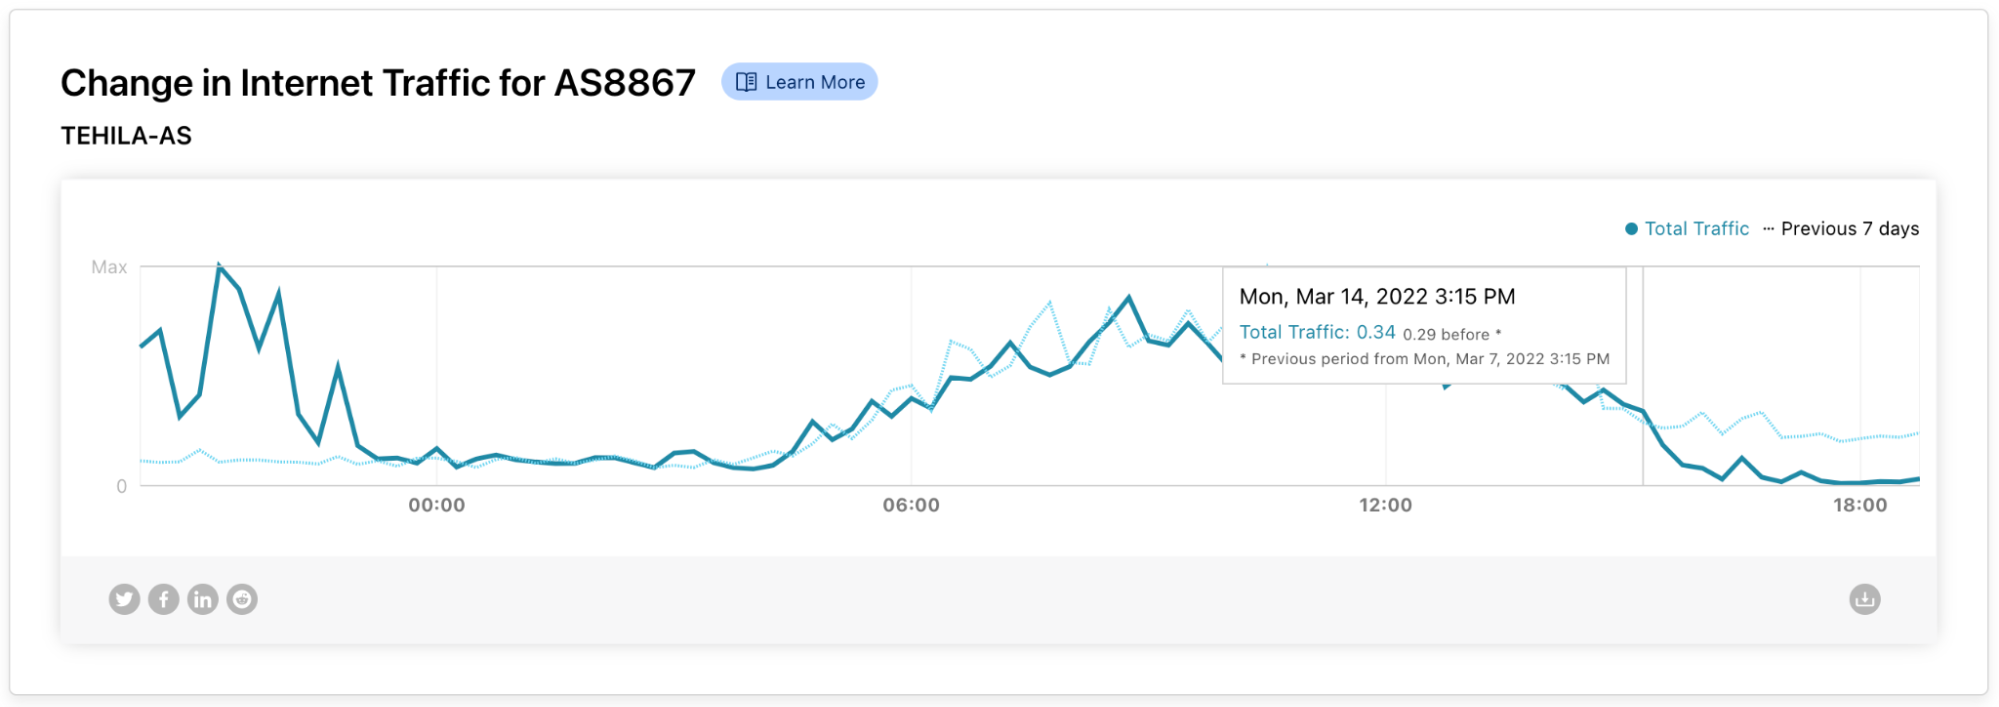
In Haiti, customers of Internet service provider Access Haiti experienced disrupted service for more than half a day on November 9. The figure below shows that Internet traffic for AS27759 (Access Haiti) fell precipitously around midnight local time (0500 UTC), remaining depressed until 1430 local time (1930 UTC), at which time it recovered quickly. A Facebook post from Access Haiti explained to customers that “Due to an intermittent outage on one of our international circuits, our network is experiencing difficulties that cause your Internet service to slow down.” While Access Haiti didn’t provide additional details on which international circuit was experiencing an outage, submarinecablemap.com shows that two submarine cables provide international Internet connectivity to Haiti — the Bahamas Domestic Submarine Network (BDSNi), which connects Haiti to the Bahamas, and Fibralink, which connects Haiti to the Dominican Republic and Jamaica.
Unknown
Many Internet disruptions can be easily tied to an underlying cause, whether through coverage in the press, a concurrent weather or natural disaster event, or communication from an impacted provider. However, the causes of other observed disruptions remain unknown as the impacted providers remain silent about what caused the problem.
United States (Wide Open West)
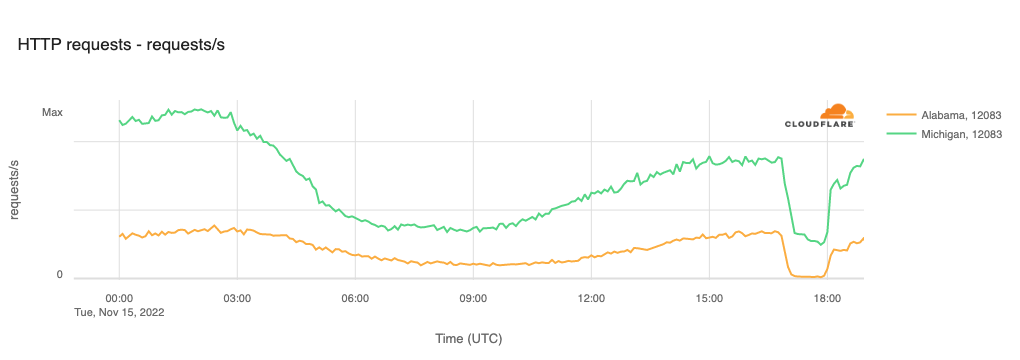
On November 15, customers of Wide Open West, an Internet service provider with a multi-state footprint in the United States, experienced an Internet service disruption that lasted a little over an hour. The figure below illustrates the impact of the disruption in Alabama and Michigan on AS12083 (Wide Open West), with traffic dropping at 1150 local time (1650 UTC) and recovering just after 1300 local time (1800 UTC).
Cuba
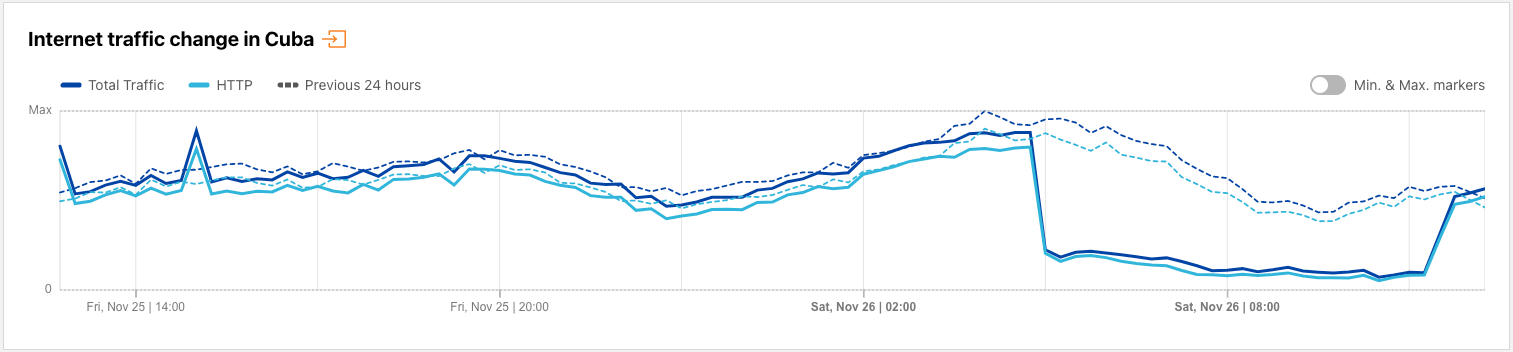
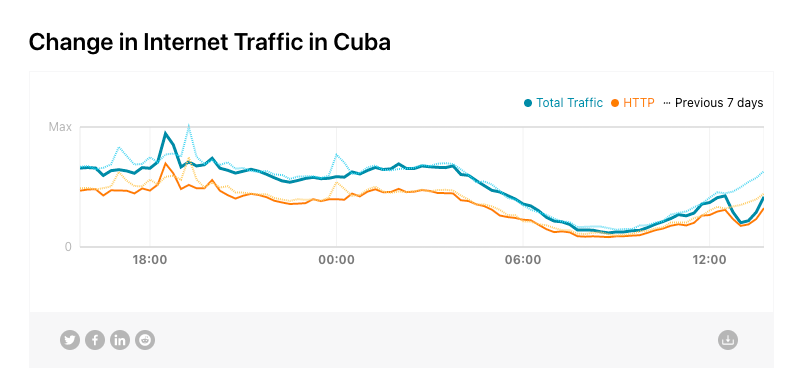
Cuba is no stranger to Internet disruptions, whether due to government-directed shutdowns (such as the one discussed above), fiber cuts, or power outages. However, no underlying cause was ever shared for the seven-hour disruption in the country’s Internet traffic observed between 2345 on November 25 and 0645 on November 26 local time (0445-1145 UTC on November 26). Traffic was down as much as 75% from previous levels during the disruption.
SpaceX Starlink
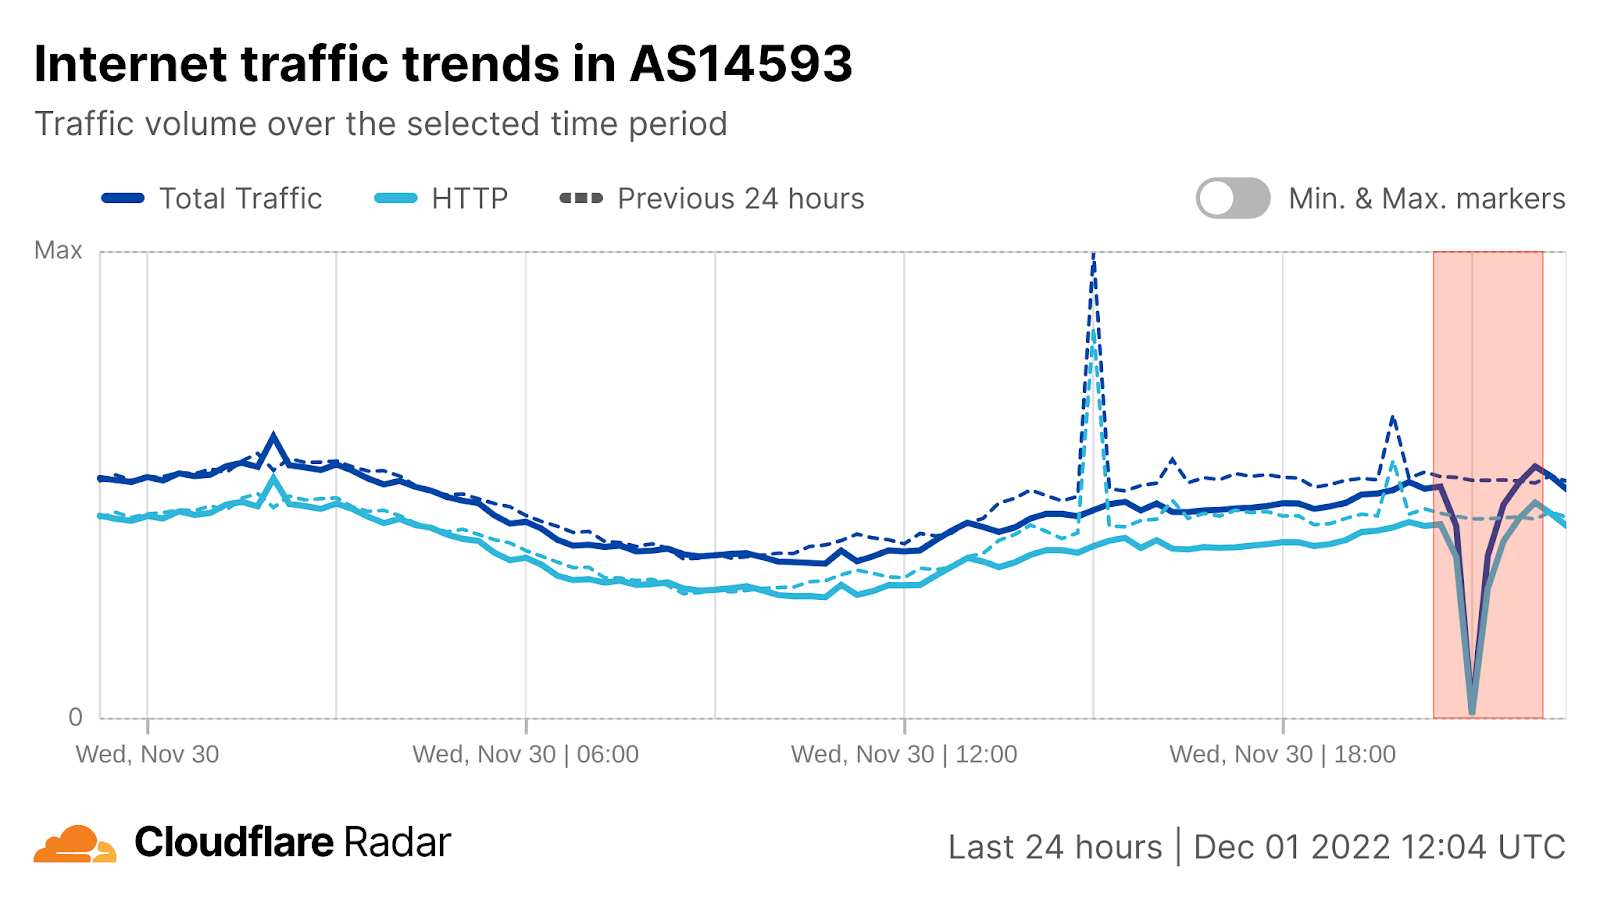
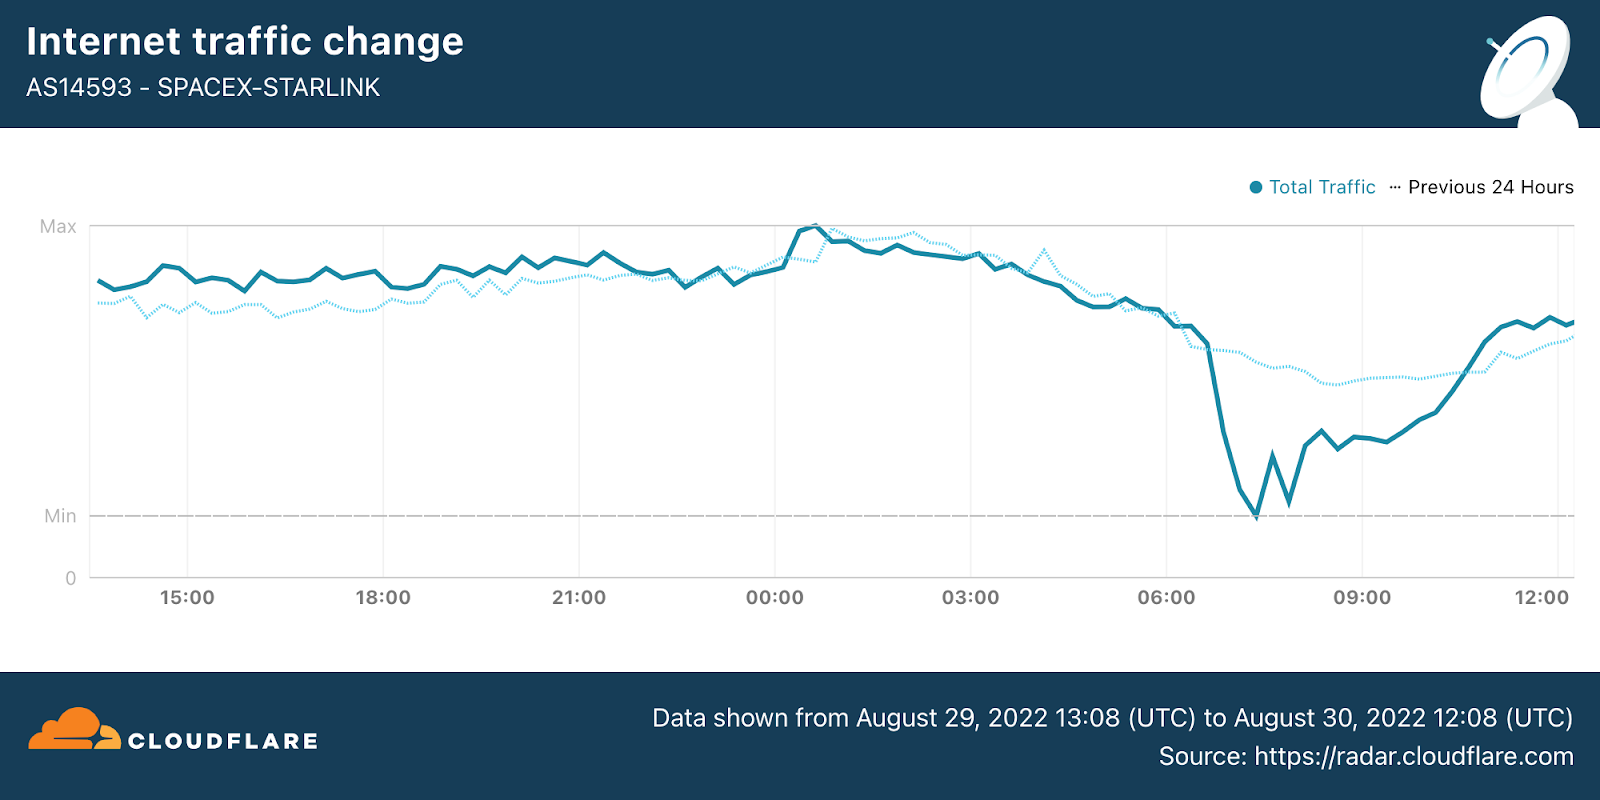
As a provider of low earth orbit (LEO) satellite Internet connectivity services, disruptions to SpaceX Starlink’s service can have a global impact. On November 30, a disruption was observed on AS14593 (SPACEX-STARLINK) between 2050-2130 UTC, with traffic volume briefly dropping to near zero. Unfortunately, Starlink did not acknowledge the incident, nor did they provide any reason for the disruption.
Conclusion
Looking back at the Internet disruptions observed during 2022, a number of common themes can be found. In countries with more authoritarian governments, the Internet is often weaponized as a means of limiting communication within the country and with the outside world through network-level, regional, or national Internet shutdowns. As noted above, this approach was used aggressively in Iran during the last few months of the year.
Internet connectivity quickly became a casualty of war in Ukraine. Early in the conflict, network-level outages were common, and some Ukrainian networks ultimately saw traffic re-routed through upstream Russian Internet service providers. Later in the year, as electrical power infrastructure was increasingly targeted by Russian attacks, widespread power outages resulted in multi-hour disruptions of Internet traffic across the country.
While the volcanic eruption in Tonga took the country offline for over a month due to its reliance on a single submarine cable for Internet connectivity, the damage caused by earthquakes in other countries throughout the year resulted in much shorter and more limited disruptions.
And while submarine cable issues can impact multiple countries along its route, the advent of services with an increasingly global footprint like SpaceX Starlink mean that service disruptions will ultimately have a much broader impact. (Starlink’s subscriber base is comparatively small at the moment, but it currently has a service footprint in over 30 countries around the world.)
In 2022, with nearly five billion people around the world (as well as an untold number of “bots”) using the Internet, analyzing aggregate data about this usage can uncover some very interesting trends. To that end, we’re excited to present the Cloudflare Radar 2022 Year In Review, featuring interactive charts, graphs, and maps you can use to explore notable Internet trends observed throughout this past year. The Year In Review website is part of Cloudflare Radar, which celebrated its second birthday in September with the launch of Radar 2.0.
We have organized the trends we observed around three different topic areas: Traffic, Adoption, and Security. The content covered within each of these areas is described in more detail in their respective sections below. Building on the 2021 Year In Review, we have incorporated several additional metrics this year, and have also improved the underlying methodology. (As such, the charts are not directly comparable to develop insights into year-over-year changes.)
Website visualizations shown at a weekly granularity cover the period from January 2 through November 26, 2022 (the start of the first full week of the year through the end of the last full week of November). We plan to update the underlying data sets through the end of the year in early 2023. Trends for nearly 200 locations are available on the website, with some smaller or less populated locations excluded due to insufficient data.
Before we jump in, we urge anyone who prefers to see the headline stats up front and to explore the data themselves to go ahead and visit the website. Anyone who wants a more lengthy, but curated set of observations should continue reading below. Regardless, we encourage you to consider how the trends presented within this post and the website’s various sections impact your business or organization, and to think about how these insights can inform actions that you can take to improve user experience or enhance your security posture.
Traffic
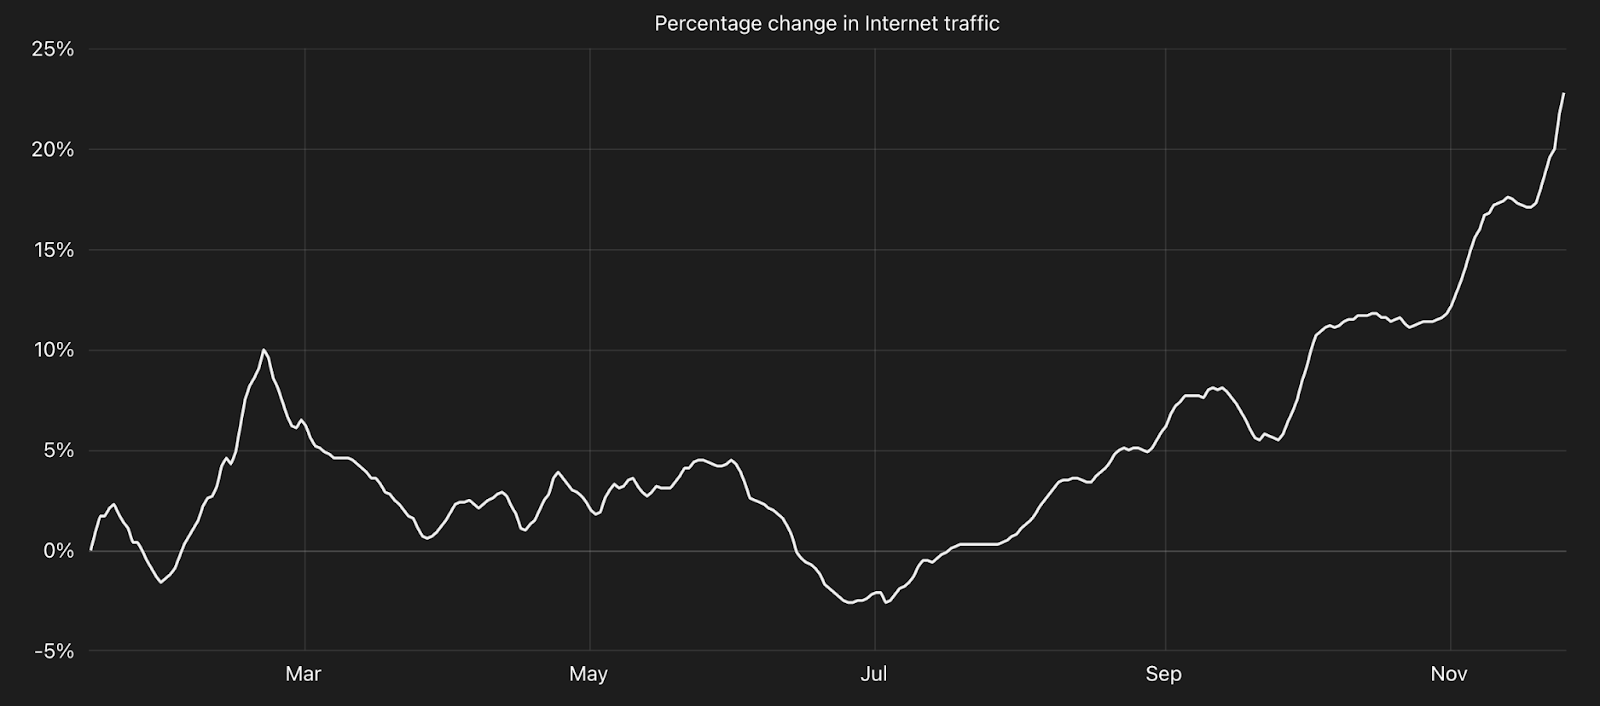
Anyone following recent technology headlines might assume that the Internet’s decades-long trend of incredible growth would have finally begun to falter. In times like these, data is key. Our data indicates that global Internet traffic, which grew at 23% this year, is as robust as ever.
To determine the traffic trends over time, we first established a baseline, calculated as the average daily traffic volume (excluding bot traffic) over the second full calendar week (January 9-15) of 2022. We chose the second calendar week to allow time for people to get back into their “normal” routines (school, work, etc.) after the winter holidays and New Year’s Day. The percent change shown on the trend lines in our charts are calculated relative to the baseline value, and represents a seven-day trailing average — it does not represent absolute traffic volume for a location. The seven-day averaging is done to smooth the sharp changes seen with a daily granularity.
In addition to calculating traffic growth, our 1.1.1.1 public DNS resolver and broad global customer base enables us to have a unique view into online activity. This includes insights into the most popular types of Internet content and the most popular Internet services in general and across specific categories, as well as the impact of bots. Of course, none of this matters if connectivity is unavailable, so we also drill down into major Internet disruptions observed in 2022.
Traffic trends
After an initial dip, worldwide Internet traffic saw nominal growth coinciding with the 2022 Olympic Winter Games in Beijing, but slipped again in the weeks after their conclusion. After a couple of months of slight growth, traffic again dipped below baseline heading into July. However, after reaching that nadir, Internet traffic experienced a fairly consistent rate of growth through the back part of the year. An upwards inflection at the end of November is visible in the worldwide traffic graph as well as the traffic graphs of a number of locations. Traffic analysis showed that this increase resulted from the convergence of early holiday shopping traffic (to e-commerce sites) with the run-up to and early days of FIFA World Cup Qatar 2022.
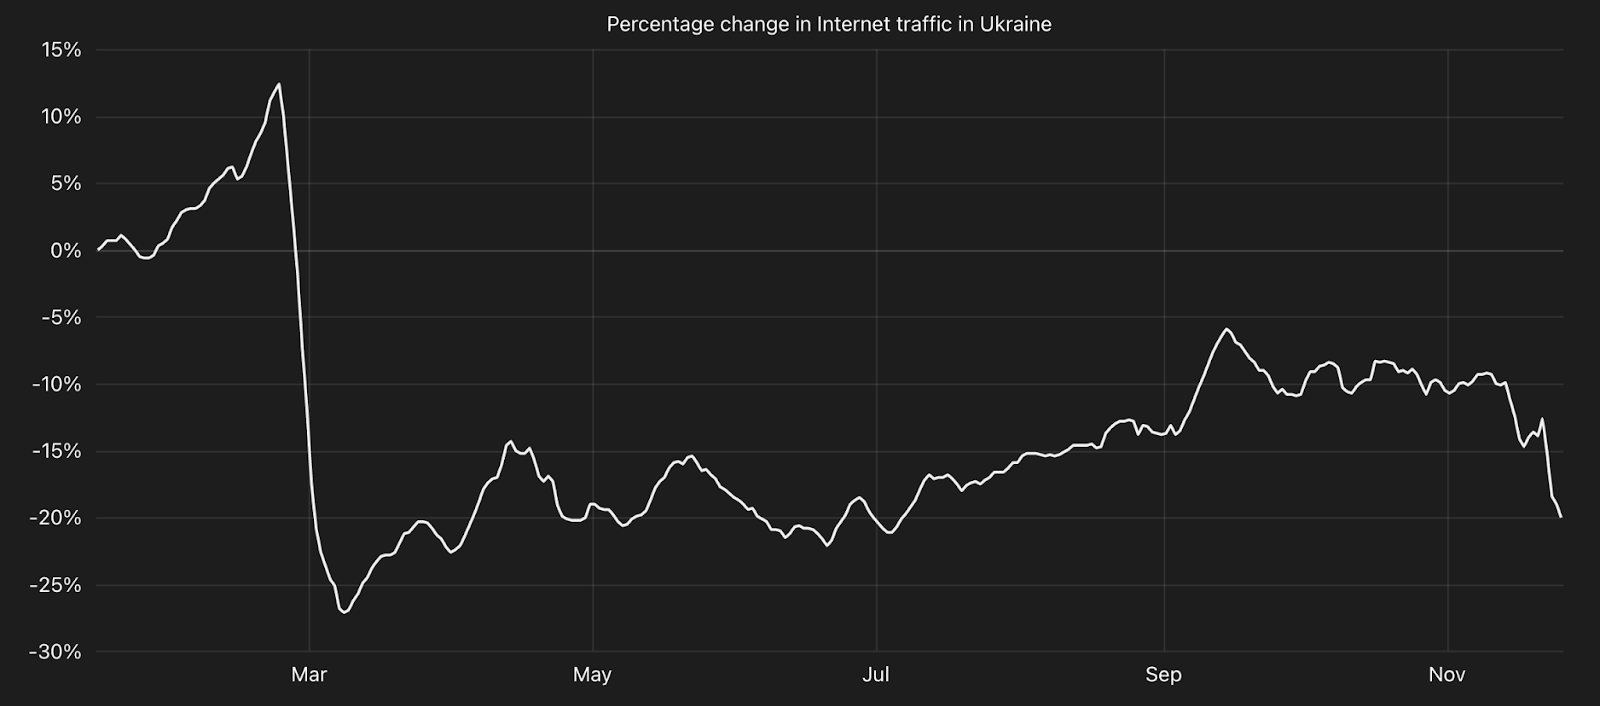
The An Update on Cloudflare’s assistance to Ukraine blog post published during Impact Week looked at the conflict from an attack perspective. Viewing Ukraine through an Internet traffic lens provides unique insights into the impacts of the war’s damage and destruction to Internet connectivity within the country. After starting the year with some nominal traffic growth, that trend was quickly reversed once the Russian invasion began on February 24, with traffic quickly falling as infrastructure was damaged and the populace focused on finding safety and shelter. Although traffic started to grow again after that initial steep decline, drops in May and June appear to be correlated with significant outages observed by Cloudflare. After returning to growth during August, several additional disruptions were visible in September, October, and November coincident with widespread power outages across the country resulting from Russian attacks.
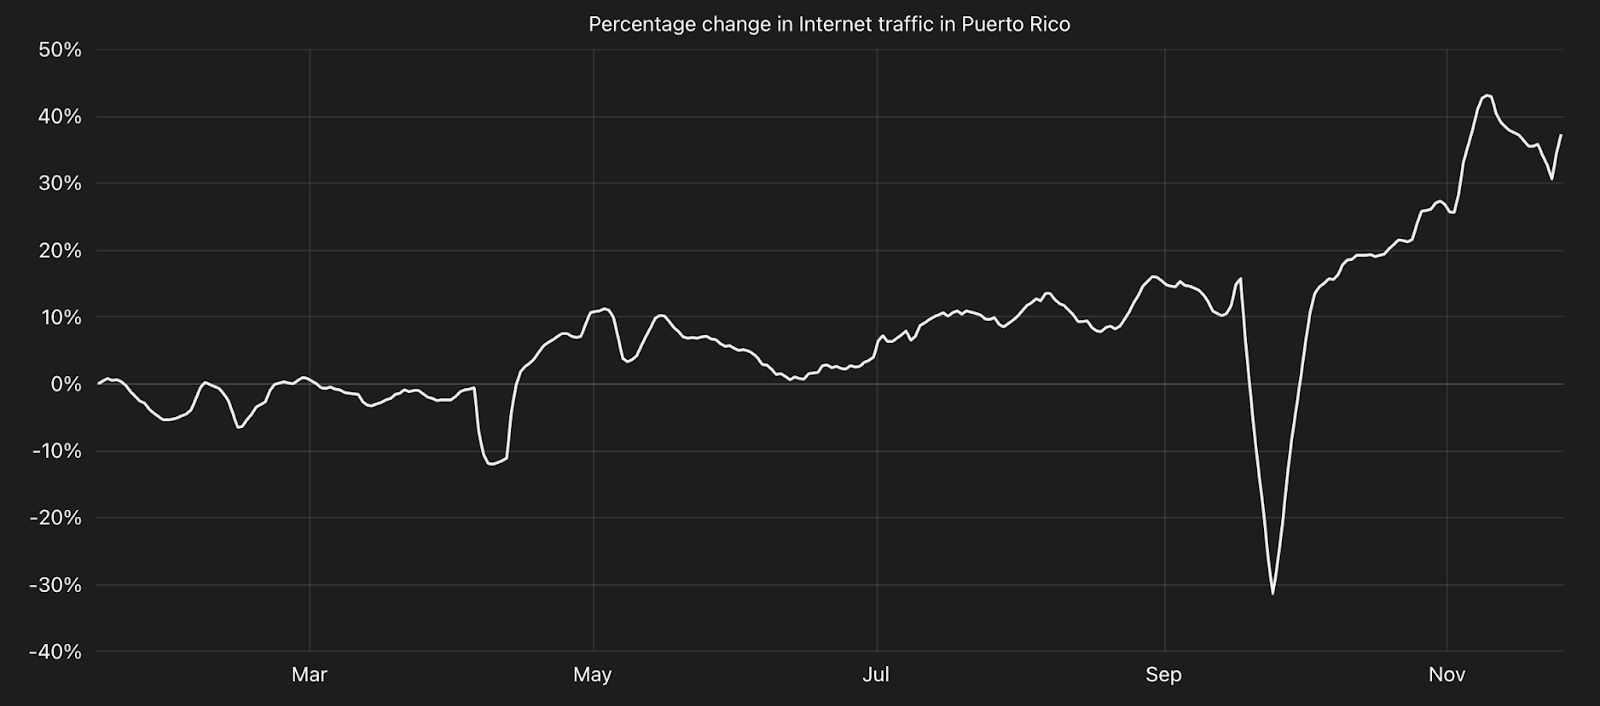
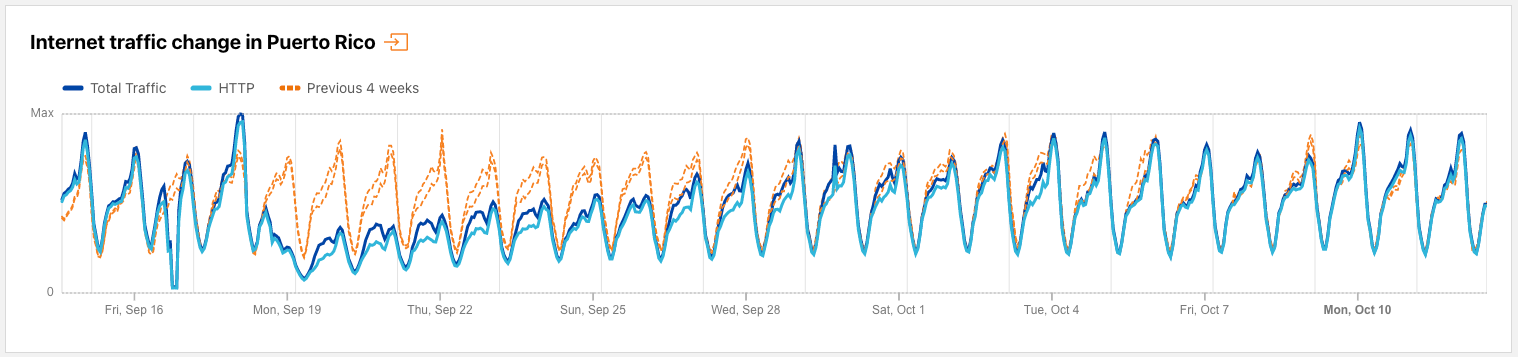
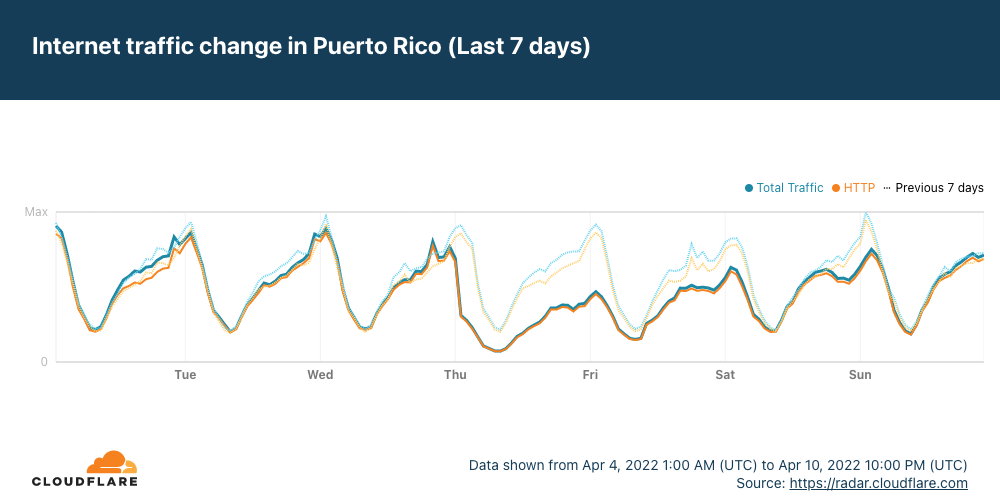
Reliable electric power is critical for reliable Internet connectivity, both for the core network infrastructure in data centers, as well as for last-mile infrastructure like cell towers and Wi-Fi routers, as well as laptops, cellphones, and other devices used to access the Internet. For several years, the residents of Puerto Rico have struggled to contend with an unreliable electric grid, resulting in frequent power outages and slow restoration times. In 2022, the island suffered two multi-day power outages that clearly impacted otherwise strong traffic growth. In April, a fire at a power plant caused an outage that lasted three days, disrupting Internet connectivity during that period. In September, widespread power outages resulting from damage from Hurricane Fiona resulted in a rapid drop in Internet traffic with the disruption lasting over a week until power restoration work and infrastructure repair was completed.
Top categories
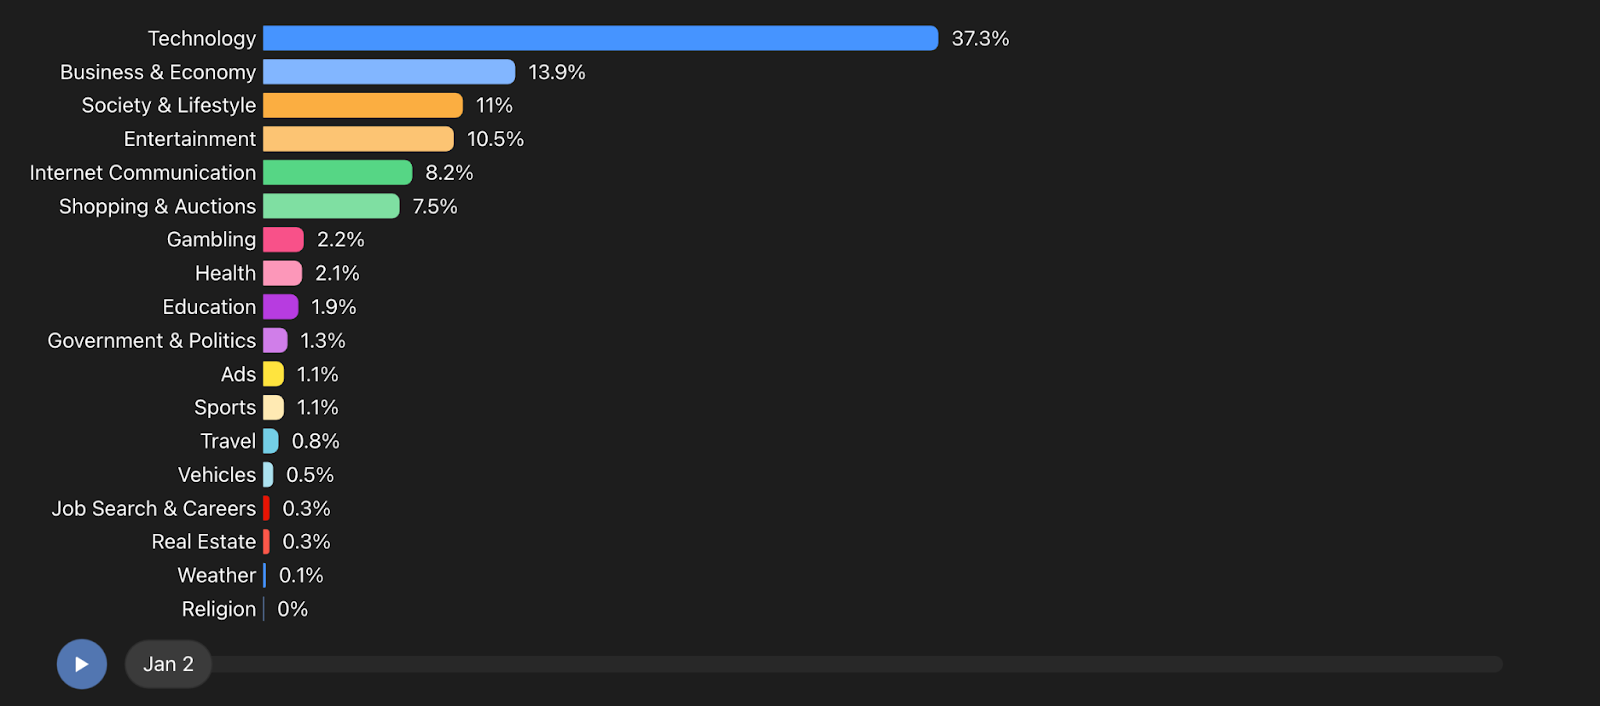
Cloudflare’s global customer base spans a range of industry categories, including technology, e-commerce, and entertainment, among others. Analysis of the traffic to our customers’ websites and applications reveals which categories of content were most popular throughout the year, and can be broken out by user location. The domains associated with each customer zone have one or more associated categories — these can be viewed on Cloudflare Radar. To calculate the distribution of traffic across the set of categories for each location, we divided the number of requests for domains associated with a given category seen over the course of a week by the total number of requests mapped to a category seen over that week, filtering out bot traffic. If a domain is associated with multiple categories, then the associated request was included in the aggregate count for each category. The chart shows how the distribution of requests across the selected categories changes over the course of the year.
Globally, sites in the Technology category were the most popular, accounting for approximately one-third of traffic throughout the year. The next most popular category was Business & Economy, which drove approximately 15% of traffic. Shopping & Auctions also saw a bump in traffic in November, as consumers began their holiday shopping.
In sharp contrast to other Asian countries, in South Korea, Internet Communication was consistently the second most popular category during the year. Elsewhere, Internet Communication was occasionally among the top five, but usually within the top 10. Internet Communication was followed closely by Entertainment and Business & Economy. The former saw multiple periods of increased traffic through the year, in contrast to other categories, which saw traffic share remain fairly consistent over time.
Traffic distribution in Turkey represented a rare departure from most other locations around the world. Although Technology started the year as the most popular category, its popularity waned during the back half of the year, ending below Shopping & Auctions and Society & Lifestyle. These latter two saw gradual growth starting in September, and posted larger increases in November. Business & Economy and Entertainment sites were comparatively less popular here, in contrast to many other locations.
Armenia’s traffic distribution also ran counter to that seen in most other locations. Entertainment was the most popular category for nearly the entire year, except for the final week of November. Technology was generally the second most popular category, although it was surpassed by Gambling several times throughout the year. However, Gambling saw its popularity fall significantly in November, as it was surpassed by the Shopping & Auctions and Business & Economy categories.
Most popular Internet services
The luxury of being a popular Internet service is that the service’s brand becomes very recognizable, so it will be no surprise that Google was #1 in our General ranking.
Top 10 — General, late 2022 ranking 1. Google 2. Facebook 3. Apple, TikTok (tie) 5. YouTube 6. Microsoft 7. Amazon Web Services 8. Instagram 9. Amazon 10. iCloud, Netflix, Twitter, Yahoo (tie)
Last year TikTok was at the top of our ranking. However, the results between the two years aren’t comparable. As part of our launch of Radar 2.0, we introduced improvements to our domain ranking algorithms, and this year’s rankings are based on those new algorithms. In addition, this year we have grouped domains that all belong to a single Internet service. For example, Google operates google.com, google.pt, and mail.google.com among others, so we aggregated the popularity of each domain under a single “Google” Internet service for simplicity. However, while Meta operates both Facebook and Instagram, consumers typically perceive those brands as distinct, so we decided to group domains associated with those services separately.
Zooming out from our General top 10, the anonymized DNS query data from our 1.1.1.1 public DNS resolver reflects traffic from millions of users around the world, enabling us to offer category specific rankings as well. While you can view them all in the “Most popular Internet services” section of our Year in Review website, we’ve decided to highlight a few of our favorite observations below.
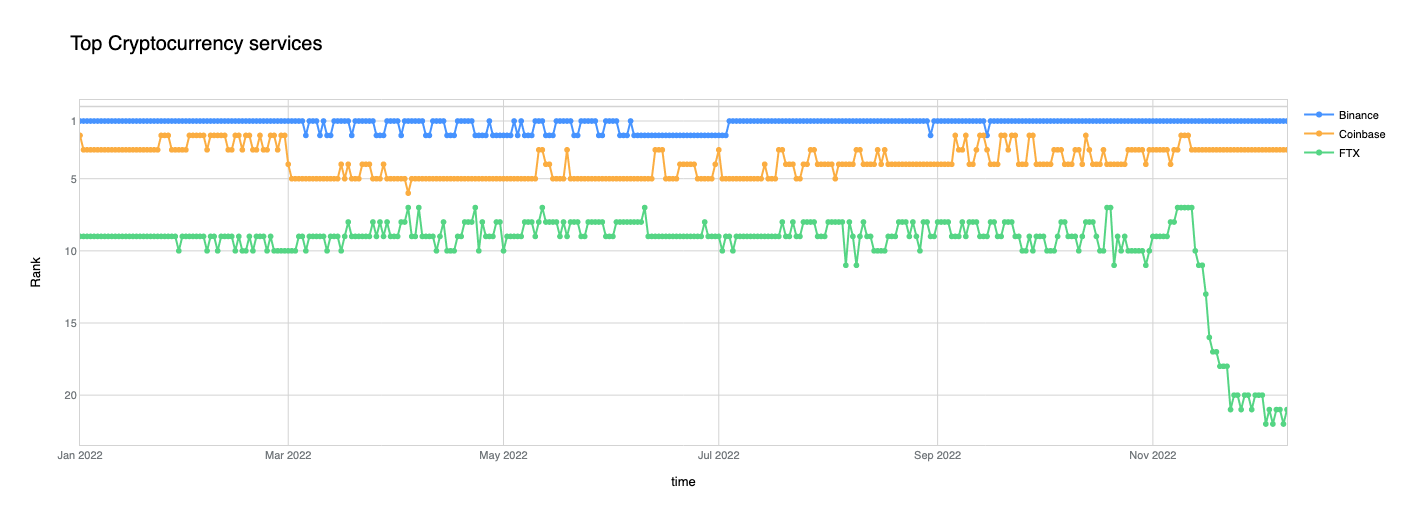
Cryptocurrencies always seem to have as much promise as they have controversy. We couldn’t help but be curious about which cryptocurrency services were the most popular. But before jumping into the Top 10, let’s double-click on one that fell out of the running: FTX. Known as the third largest cryptocurrency exchange in the world, our popularity ranking shows it hovered around 9th place for most of the year. That is, until it filed for bankruptcy in November. At that point, there is a precipitous drop, which also appears to coincide with reports that FTX disabled its users’ ability to make cryptocurrency withdrawals. Moving back to the Top 10, the two other major cryptocurrency exchanges, Binance and Coinbase, ranked #1 and #3 respectively and don’t appear to have been adversely impacted by FTX in our rankings.
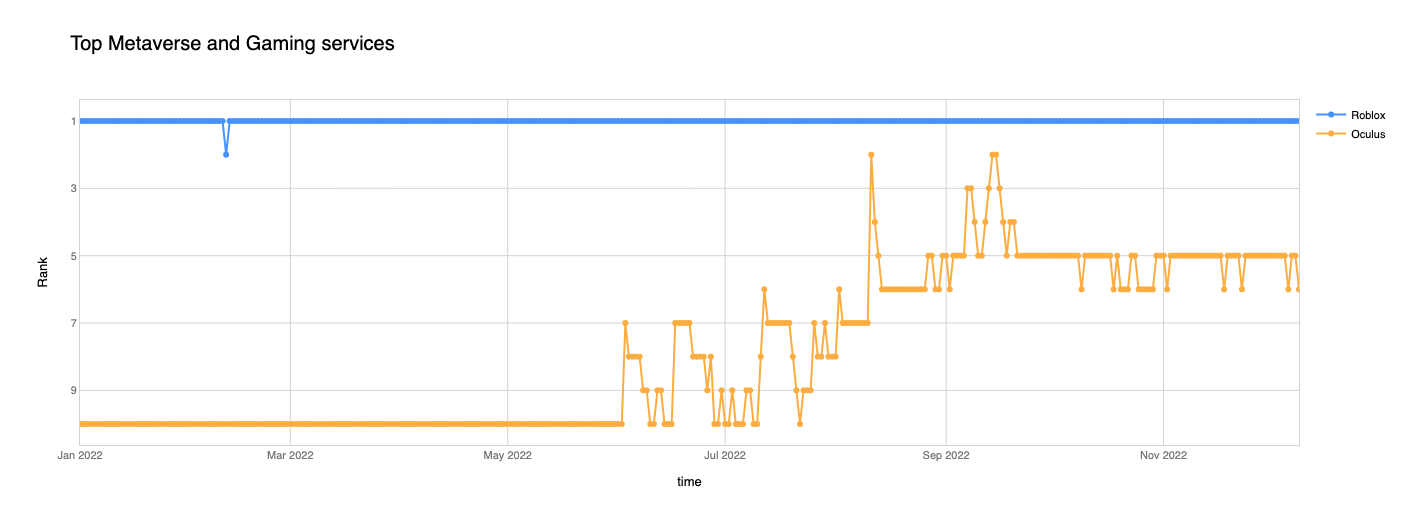
The universe has been the hottest place to be since the beginning of time, but some suggest that we’ll all soon be in the metaverse. If that’s true, then the question becomes “Whose metaverse?”. Last year, Facebook changed its name to Meta as it poured billions of dollars into the space, so we were curious about the impact of their efforts on the metaverse landscape one year later. With Meta’s Oculus offering their initial foray into the metaverse, our data indicates that while its popularity saw tangible improvements, rising from 10th to 5th in the back half of the year, Roblox is clearly the champion of the metaverse arena. It is fascinating to see this smaller challenger dominating Oculus, which is operated by Meta, a company ~18x larger in market capitalization. We are excited to check back at the end of 2023 to see whether Oculus’ ascent of the rankings topples Roblox, or if the smaller player retains the crown.
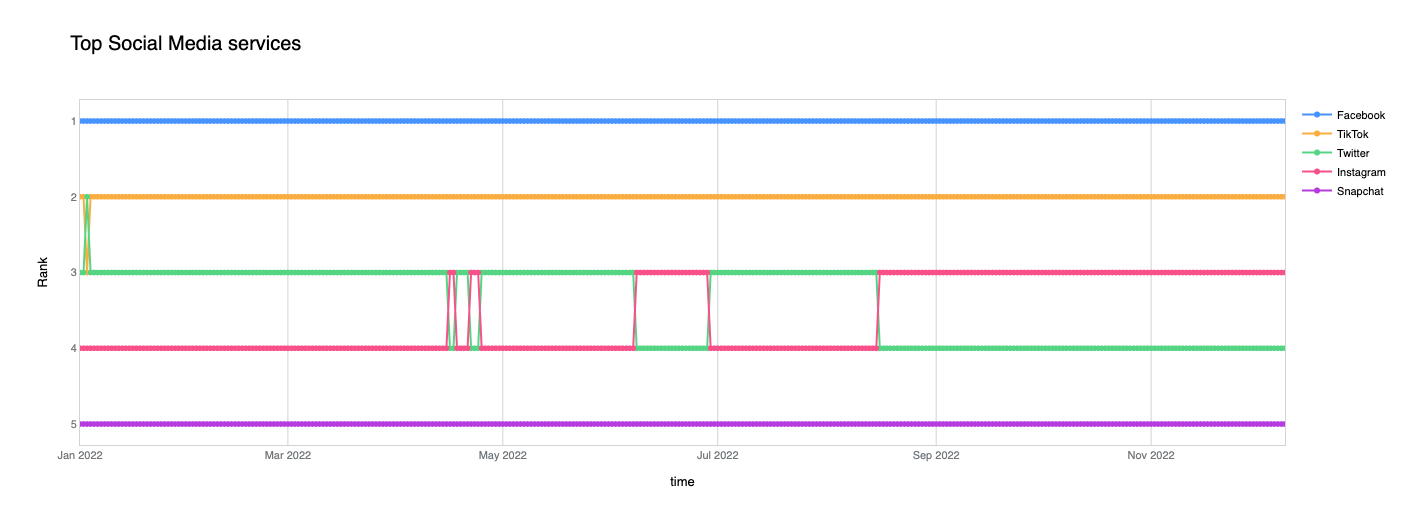
Facebook’s transition to Meta, however, does not appear to have impacted its popularity as a social media platform. Within our ranking of the top social media platforms, Facebook held the top position throughout the year. TikTok and Snapchat also held steady in their places among the top five. Instagram and Twitter traded places several times mid-year, but the photo and video sharing app ultimately knocked Twitter from 3rd place in August. More active volatility was seen in the bottom half of the top 10, as LinkedIn, Discord, and Reddit frequently shifted between sixth, seventh, and eighth position in the rankings.
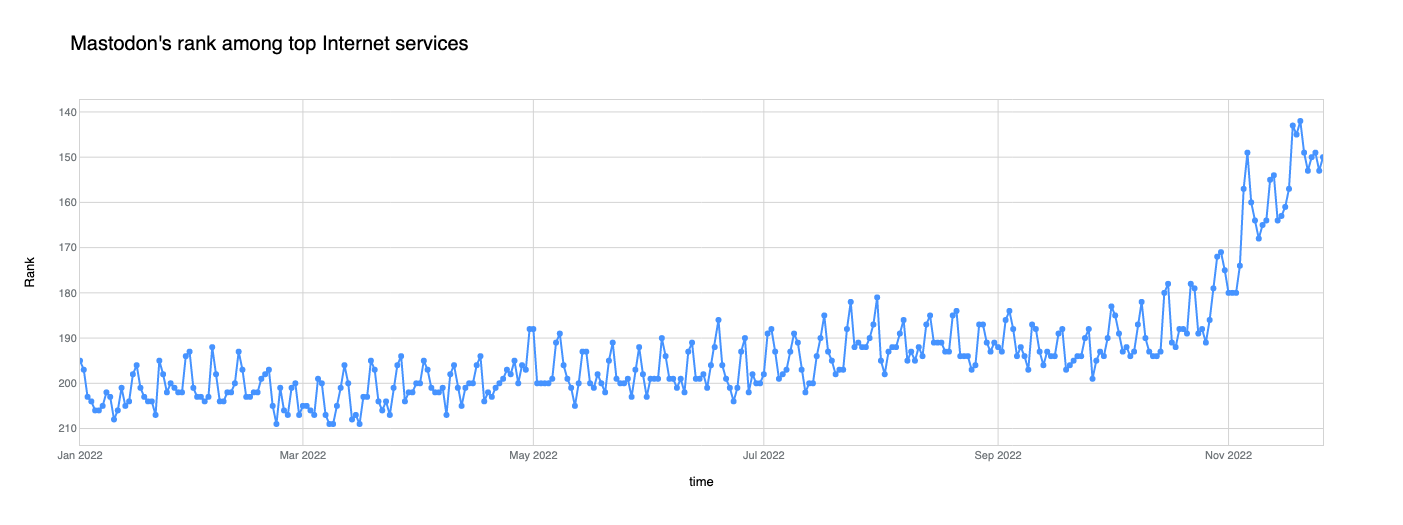
While those are the most popular sites today, over the last 20+ years, the landscape of social media platforms has been quite dynamic, with new players regularly emerging. Some gained a foothold and became successful, while others became a footnote of Internet history. Although it has actually been around since 2016, Mastodon emerged as the latest potential disruptor in the space. In a landscape where the top social media platforms operate closed-source, centralized platforms, Mastodon offers free, open source software to allow anyone to start their own social networking platform, built around a decentralized architecture, and easily federated with others.
Aggregating the domain names used by 400 top Mastodon instances, this cohort started the year hovering around the #200 rank of most popular services overall. Its position in the overall rankings steadily improved throughout the year, hitting an inflection point in November, moving up about 60 positions. This trend appears to be driven by a spike in interest and usage of Mastodon, which we elaborate on in the Adoption section below.
Bot traffic
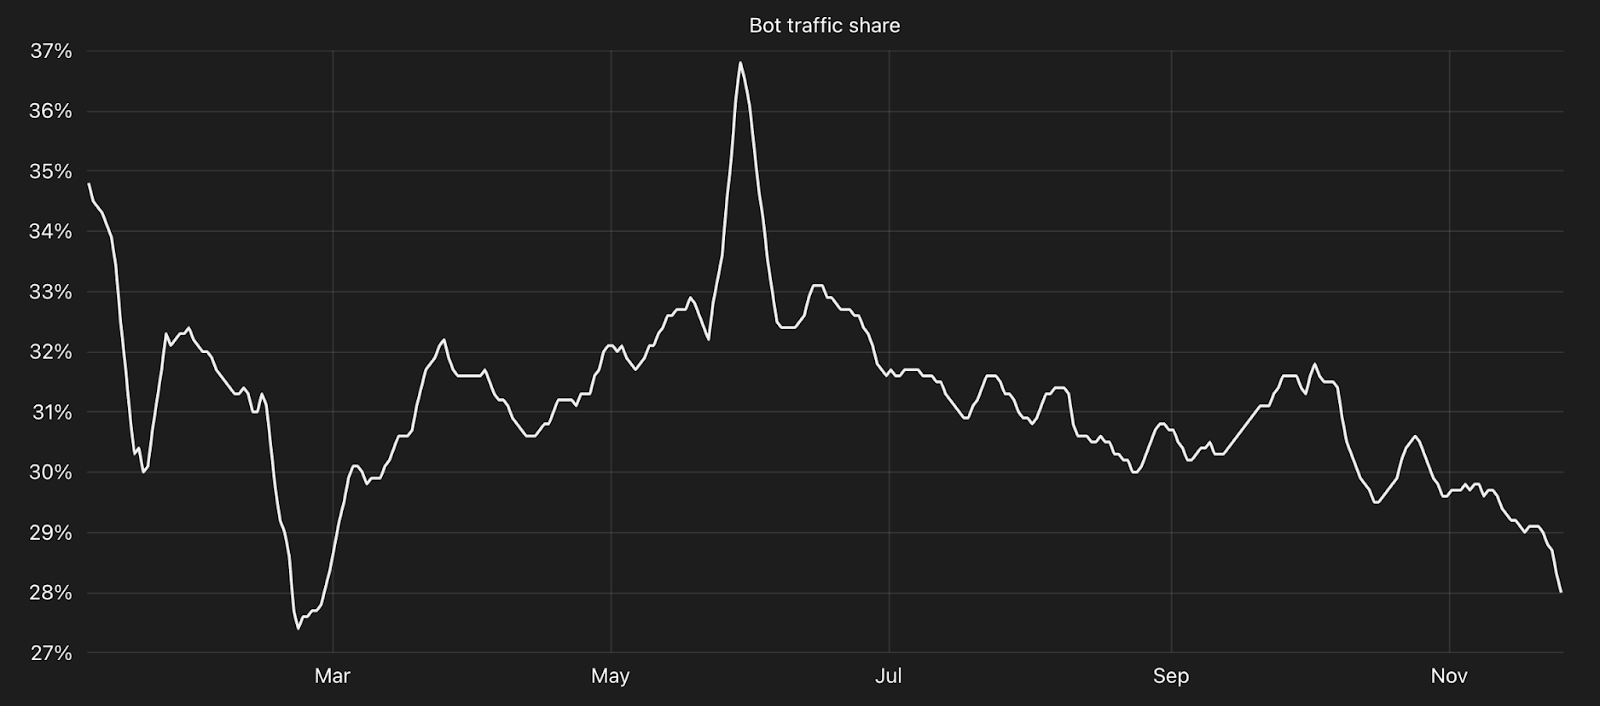
Bot traffic describes any non-human traffic to a website or an app. Some bots are useful, such as those that monitor site and application availability or search engine bots that index content for search, and Cloudflare maintains a list of verified bots known to perform such services. However, visibility into other non-verified bot activity is just as, if not more, important as they may be used to perform malicious activities, such as breaking into user accounts or scanning the web for exposed vulnerabilities to exploit. To calculate bot traffic percentages, we used the bot score assigned to each request to identify those made by bots, and then divided the total number of daily requests from these bots by the total number of daily requests. These calculations were done both globally and on a per-location basis. The line shown in the trends graph represents a seven-day trailing average. For the top 10 chart, we calculated the average bot percentage on a monthly basis per location, and then ranked the locations by percentage. The chart illustrates the ranking by month, and how those rankings change across the year.
Globally, bots generally accounted for between 30-35% of traffic over the course of the year. Starting January at around 35%, the percentage of bot traffic dropped by nearly a quarter through the end of February, but then reclaimed some of that loss, staying just above 30% through October. A slight downward trend is evident at the start of November, due to human traffic increasing while bot traffic remained fairly consistent. Despite a couple of nominal spikes/drops, the global trend exhibited fairly low volatility overall throughout the year.
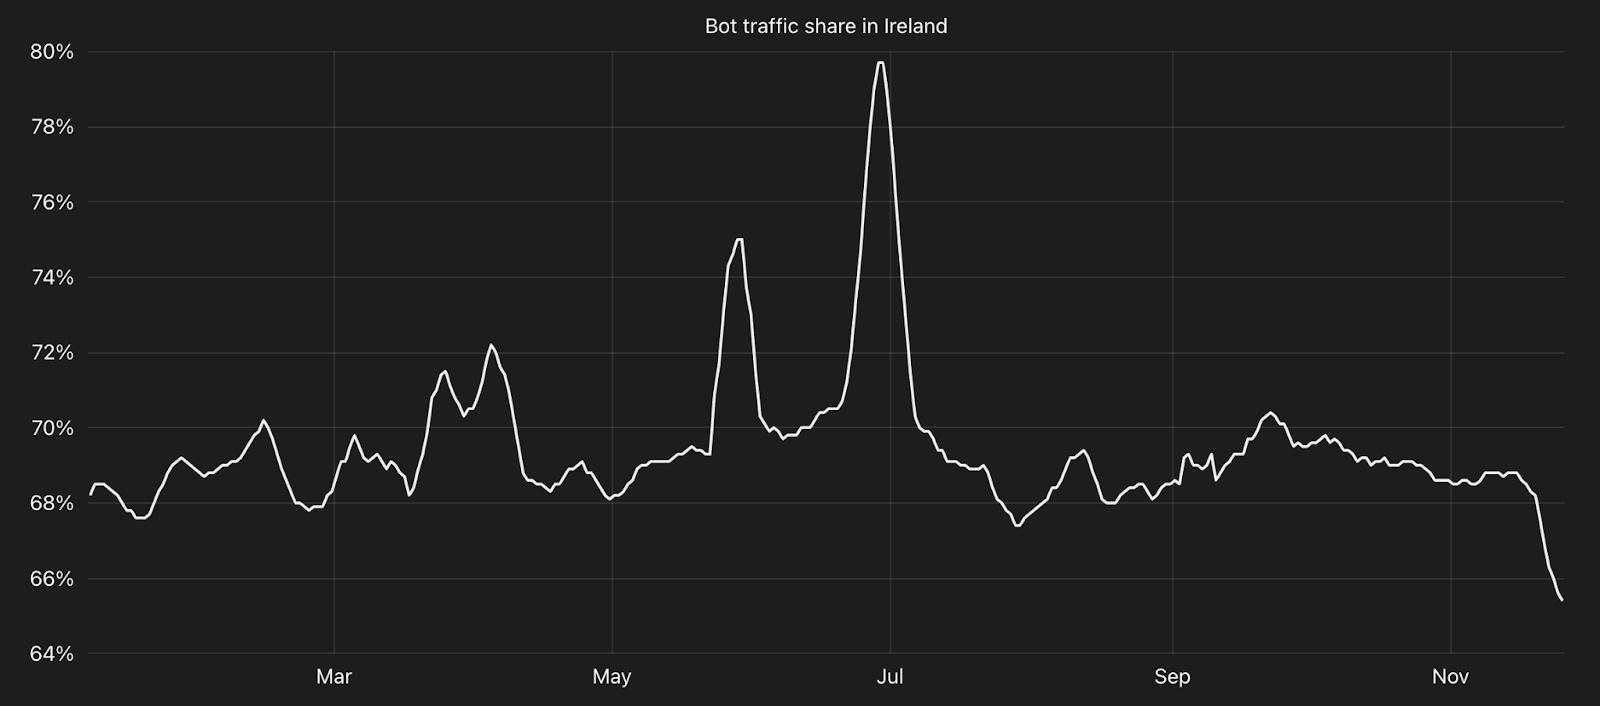
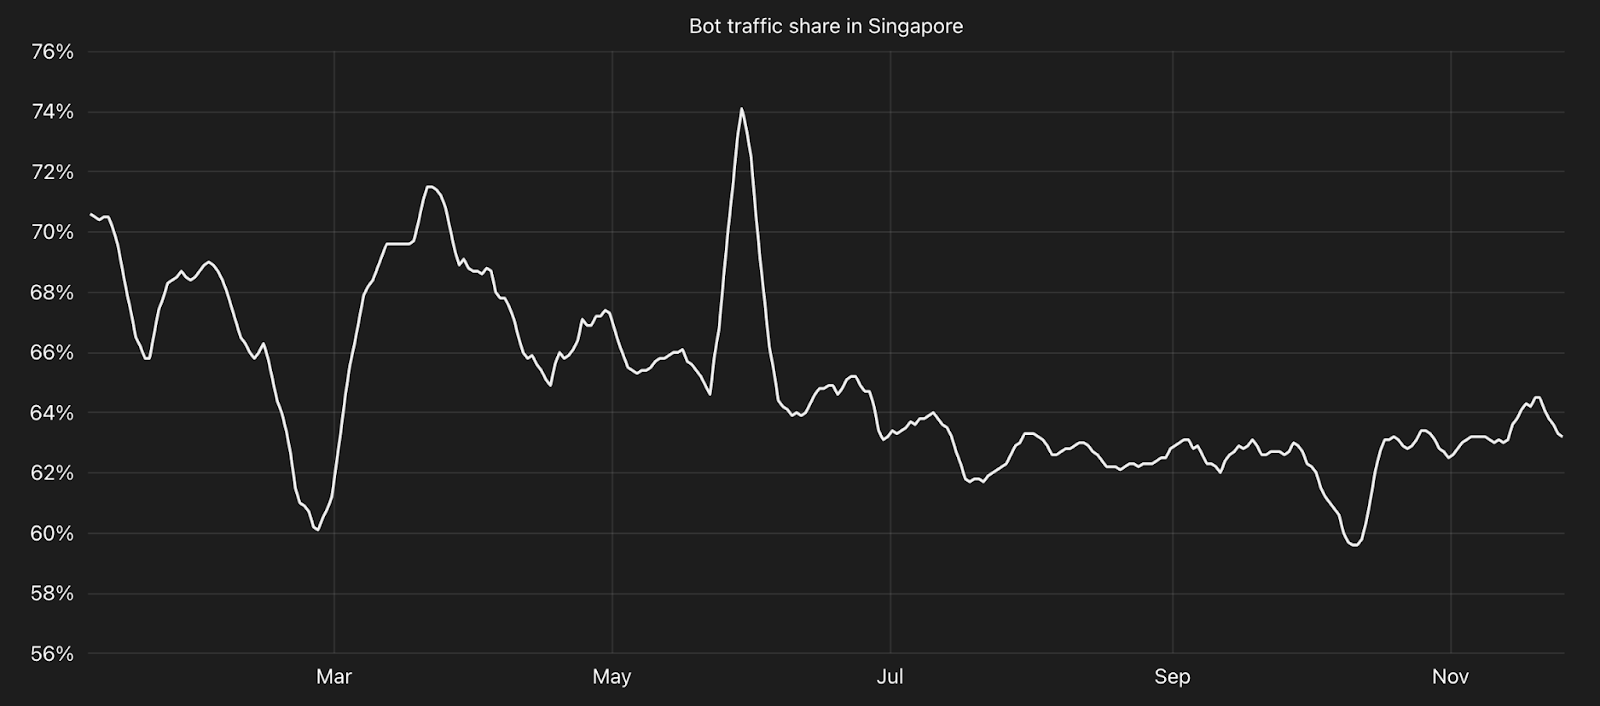
While around one-third of global traffic was from bots, two locations stood out with bot traffic percentages double the global level. Except for two brief mid-year spikes, just under 70% of traffic from Ireland was classified as bot-driven. Similarly, in Singapore, bot traffic consistently ranged between 60-70% across the year. Bots account for the majority share of traffic from these locations due to the presence of local “regions” from multiple cloud platform providers in each. Because doing so is easily automated and free/inexpensive, attackers will frequently spin up ephemeral instances in these clouds in order to launch high volume attacks, such as we saw with the “Mantis” attack in June. (Internal traffic analysis indicates that a significant portion of traffic for these two geographies is from cloud provider networks and that the vast majority of traffic we see from these networks is classified as bot traffic.)
The top 10 list of locations with the highest percentage of bot traffic saw a fair amount of movement throughout the year, with four different locations holding the top slot at some point during the year, although Turkmenistan spent the most time at the top of the list. Overall, 17 locations held a spot among the top 10 at some point during 2022, with greater concentrations in Europe and Asia.
Internet outages
Although the metrics included in the 2022 Year In Review were ultimately driven by Internet traffic to Cloudflare from networks and locations around the world, there are, unfortunately, times when traffic is disrupted. These disruptions can have a number of potential causes, including natural disasters and extreme weather, fiber optic cable cuts, or power outages. However, they can also happen when authoritarian governments order Internet connectivity to be shutdown at a network, regional, or national level.
We saw examples of all of these types of Internet disruptions, and more, during 2022, and aggregated coverage of them in quarterly overview blog posts. With the launch of Radar 2.0 in September, we also began to catalog them on the Cloudflare Radar Outage Center. These disruptions are most often visible as drops in Cloudflare traffic from a given network, region, or country. The 2022 Year In Review website illustrates where these disruptions occurred throughout the year. Some notable outages observed during 2022 are highlighted below.
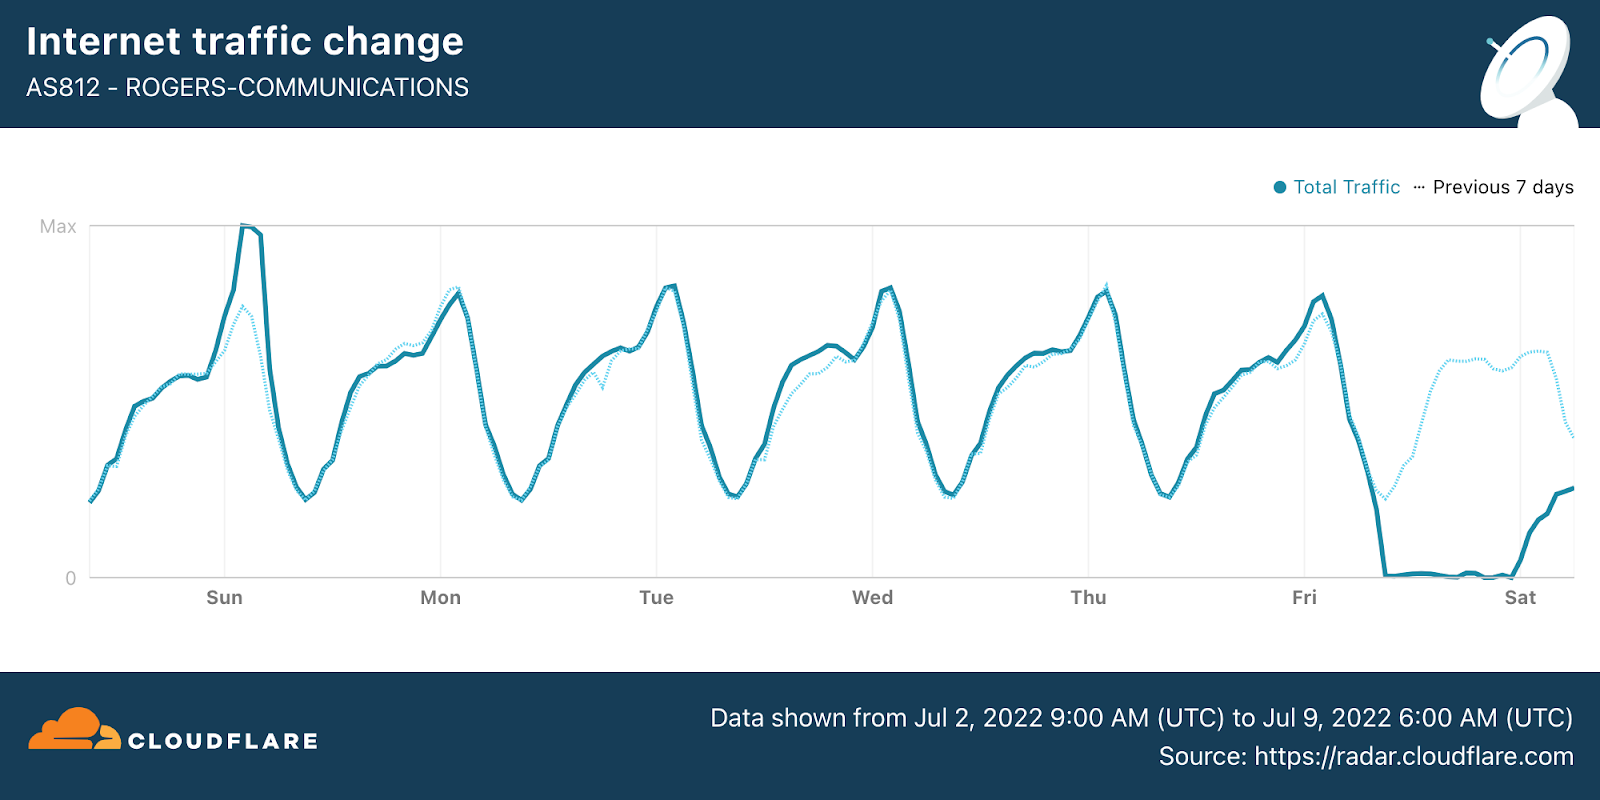
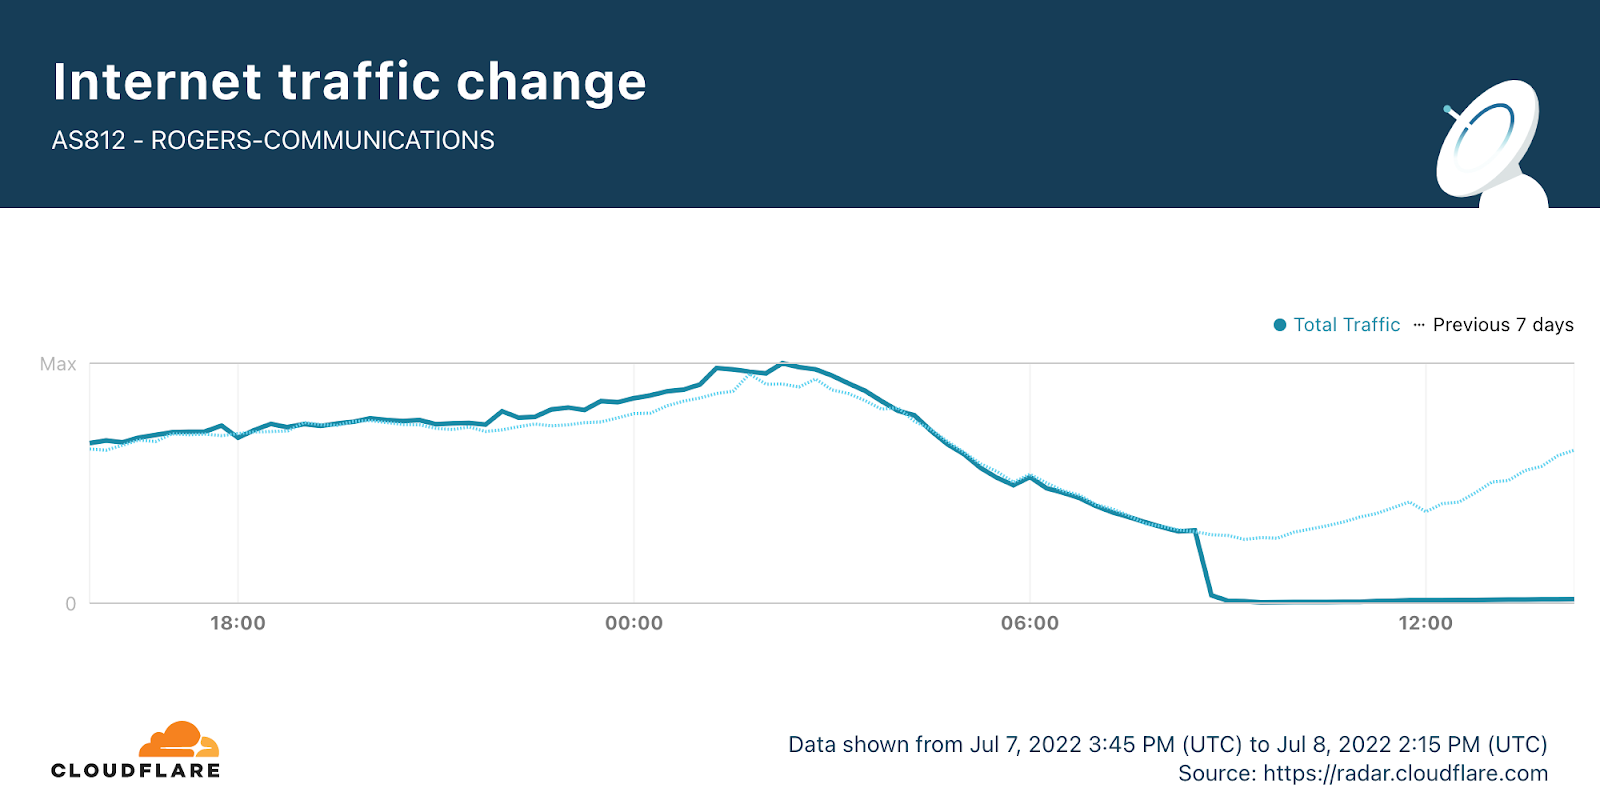
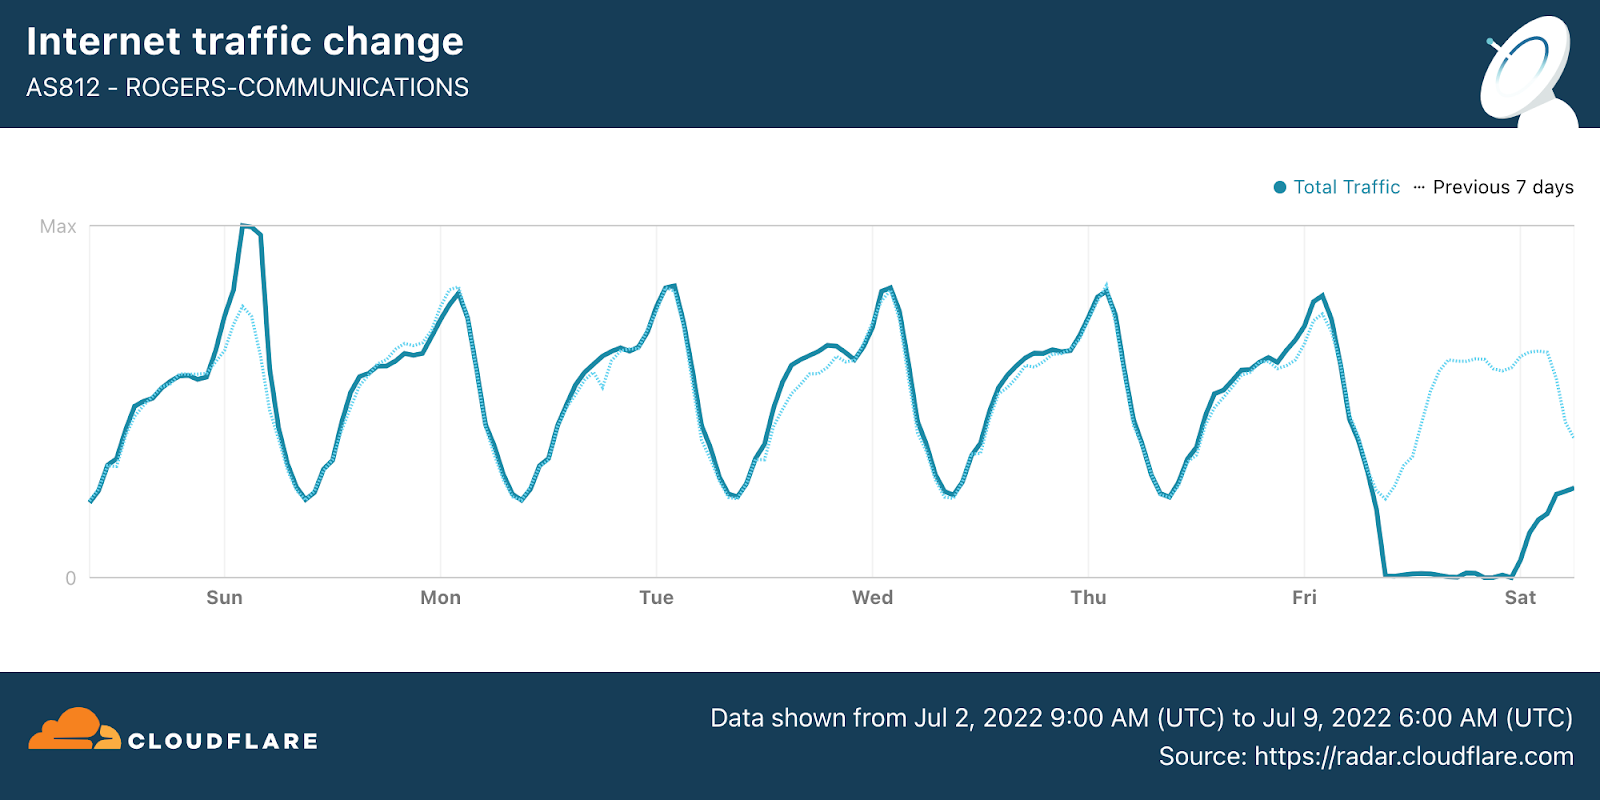
One of the most significant Internet disruptions of the year took place on AS812 (Rogers), one of Canada’s largest Internet service providers. During the morning of July 8, a near complete loss of traffic was observed, and it took nearly 24 hours for traffic volumes to return to normal levels. A Cloudflare blog post covered the Rogers outage in real-time as the provider attempted to restore connectivity. Data from APNIC estimates that as many as five million users were directly affected, while press coverage noted that the outage also impacted phone systems, retail point of sale systems, automatic teller machines, and online banking services. According to a notice posted by the Rogers CEO, the outage was attributed to “a network system failure following a maintenance update in our core network, which caused some of our routers to malfunction”.
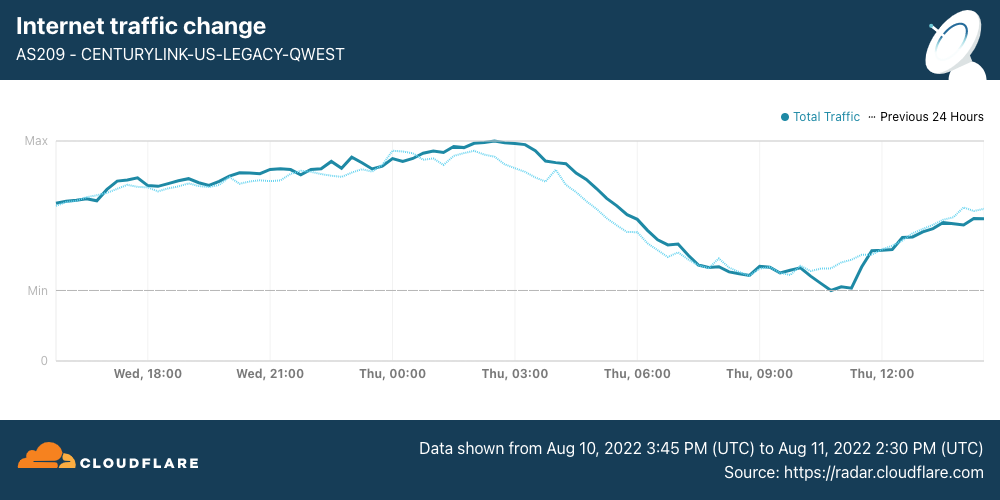
Three of the major mobile network providers — AS44244 (Irancell), AS57218 (RighTel), and AS197207 (MCCI) — started implementing daily Internet “curfews” on September 21, generally taking place between 1600 and midnight local time (1230-2030 UTC), although the start times varied on several days. These regular shutdowns lasted into early October, with several more ad-hoc disruptions taking place through the middle of the month, as well as other more localized shutdowns of Internet connectivity. Over 75 million users were impacted by these shutdowns, based on subscriber figures for MCCI alone.
Cable cuts are also a frequent cause of Internet outages, with an old joke among network engineers that suggested that backhoes were the Internet’s natural enemy. While backhoes may be a threat to terrestrial fiber-optic cable, natural disasters can wreak havoc on submarine cables.
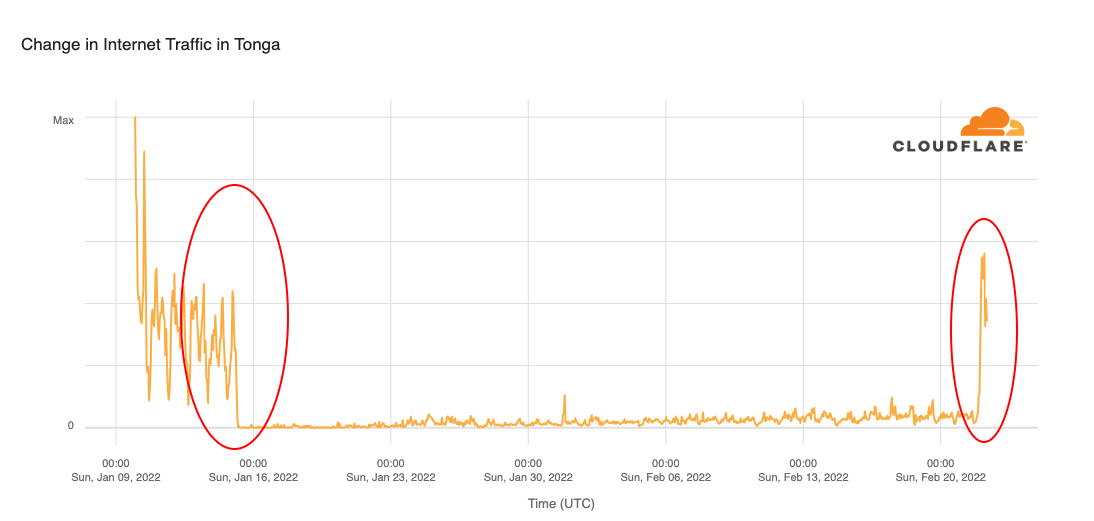
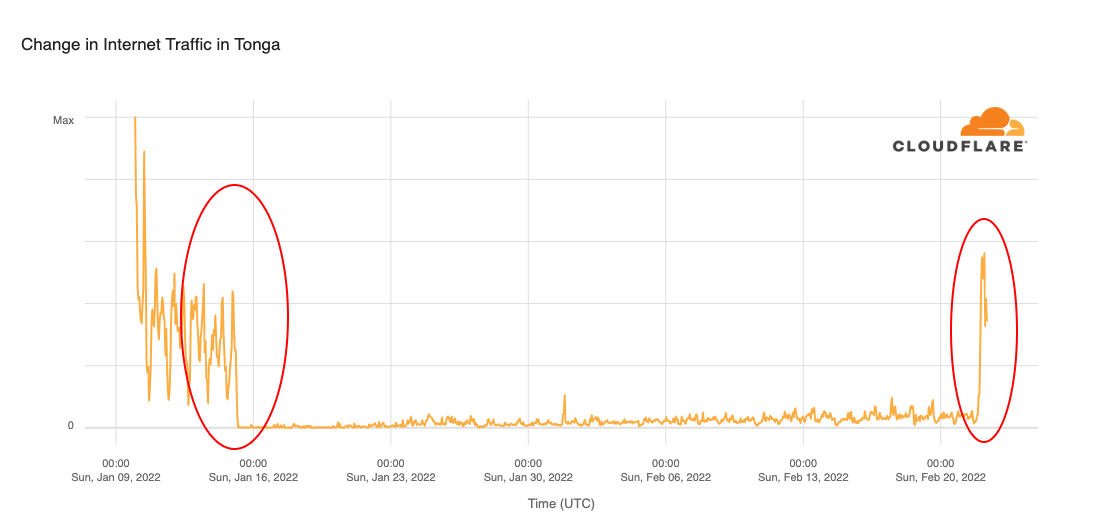
A prime example took Tonga offline earlier this year, when the Hunga Tonga–Hunga Ha’apai volcanic eruption damaged the submarine cable connecting Tonga to Fiji, resulting in a 38-day Internet outage. After the January 14 eruption, only minimal Internet traffic (via limited satellite services) was seen from Tonga. On February 22, Digicel announced that the main island was back online after initial submarine cable repairs were completed, but it was estimated that repairs to the domestic cable, connecting outlying islands, could take an additional six to nine months. We saw rapid growth in traffic from Tonga once the initial cable repairs were completed.
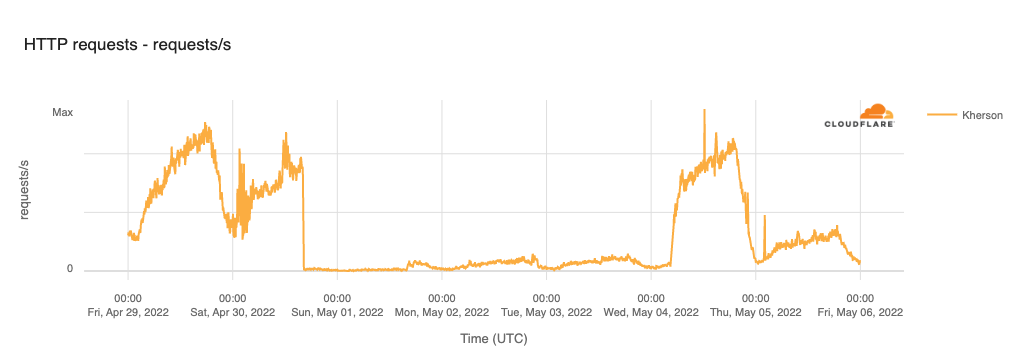
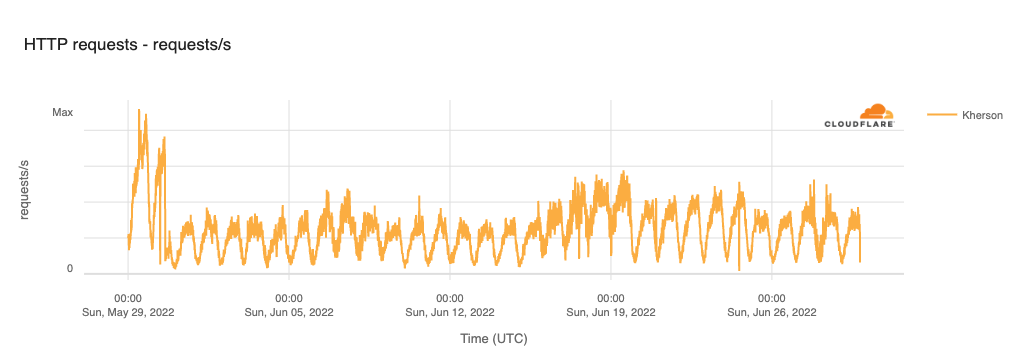
The war in Ukraine is now ten months old, and throughout the time it has been going on, multiple networks across the country have experienced outages. In March, we observed outages in Mariupol and other cities where fighting was taking place. In late May, an extended Internet disruption began in Kherson, coincident with AS47598 (Khersontelecom) starting to route traffic through Russian network provider AS201776 (MIranda), rather than a Ukrainian upstream. And in October, widespread power outages disrupted Internet connectivity in Kharkiv, Lviv, Kyiv, Poltova Oblast, and Zhytomyr. These outages and others were covered in more detail in the quarterly Internet disruption overview blog posts, as well as several other Ukraine-specific blog posts.
Adoption
Working with millions of websites and applications accessed by billions of people as well as providing an industry-leading DNS resolver service gives Cloudflare a unique perspective on the adoption of key technologies and platforms. SpaceX Starlink was frequently in the news this year, and we observed a 15x increase in traffic from the satellite Internet service provider. Social networking platform Mastodon was also in the news this year, and saw significant growth in interest as well.
IPv6 remains increasingly important as connected device growth over the last decade has exhausted available IPv4 address space, but global adoption remained around 35% across the year. And as the Internet-connected population continues to grow, many of those people are using mobile devices as their primary means of access. To that end, we also explore mobile device usage trends across the year.
Starlink adoption
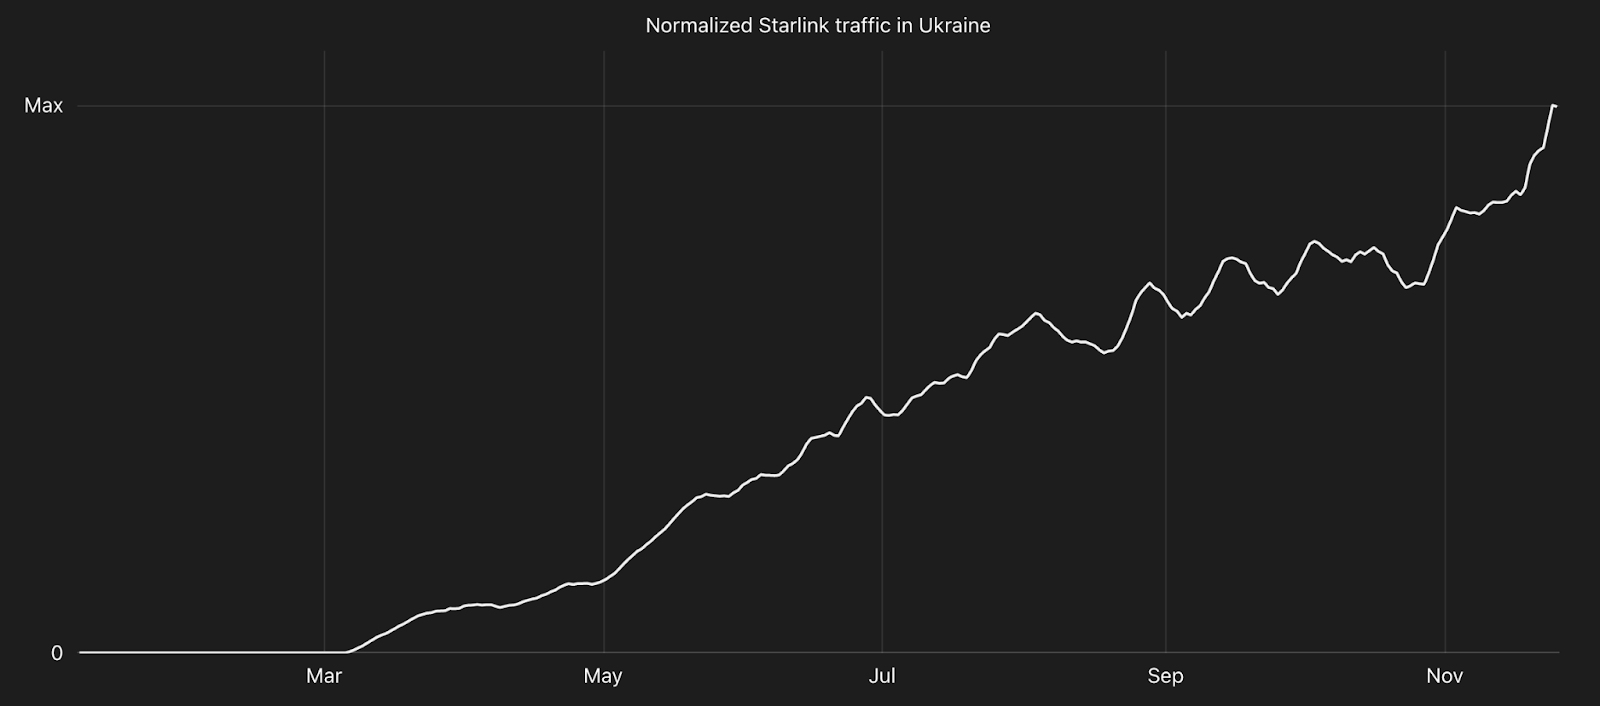
Internet connectivity through satellites in geostationary orbit (GEO) has been around for a number of years, but services have historically been hampered by high latency and slower speeds. However, the launch of SpaceX Starlink’sLow Earth Orbit (LEO) satellite Internet service in 2019 and subsequent expansion of the satellite constellation has made high performance Internet connections available in many locations that were previously unserved or underserved by traditional wired or wireless broadband. To track the growth in usage and availability of Starlink’s service, we analyzed aggregate Cloudflare traffic volumes associated with the service’s autonomous system (AS14593) throughout 2022. Although Starlink is not yet available globally, we did see traffic growth across a number of locations. The request volume shown on the trend line in the chart represents a seven-day trailing average.
Damage from the war in Ukraine has disrupted traditional wired and wireless Internet connectivity since the invasion started in late February. Starlink made headlines that month after the company activated service within the country, and the necessary satellite Internet terminals became more widely available. Within days, Cloudflare began to see Starlink traffic, with volume growing consistently throughout the year.
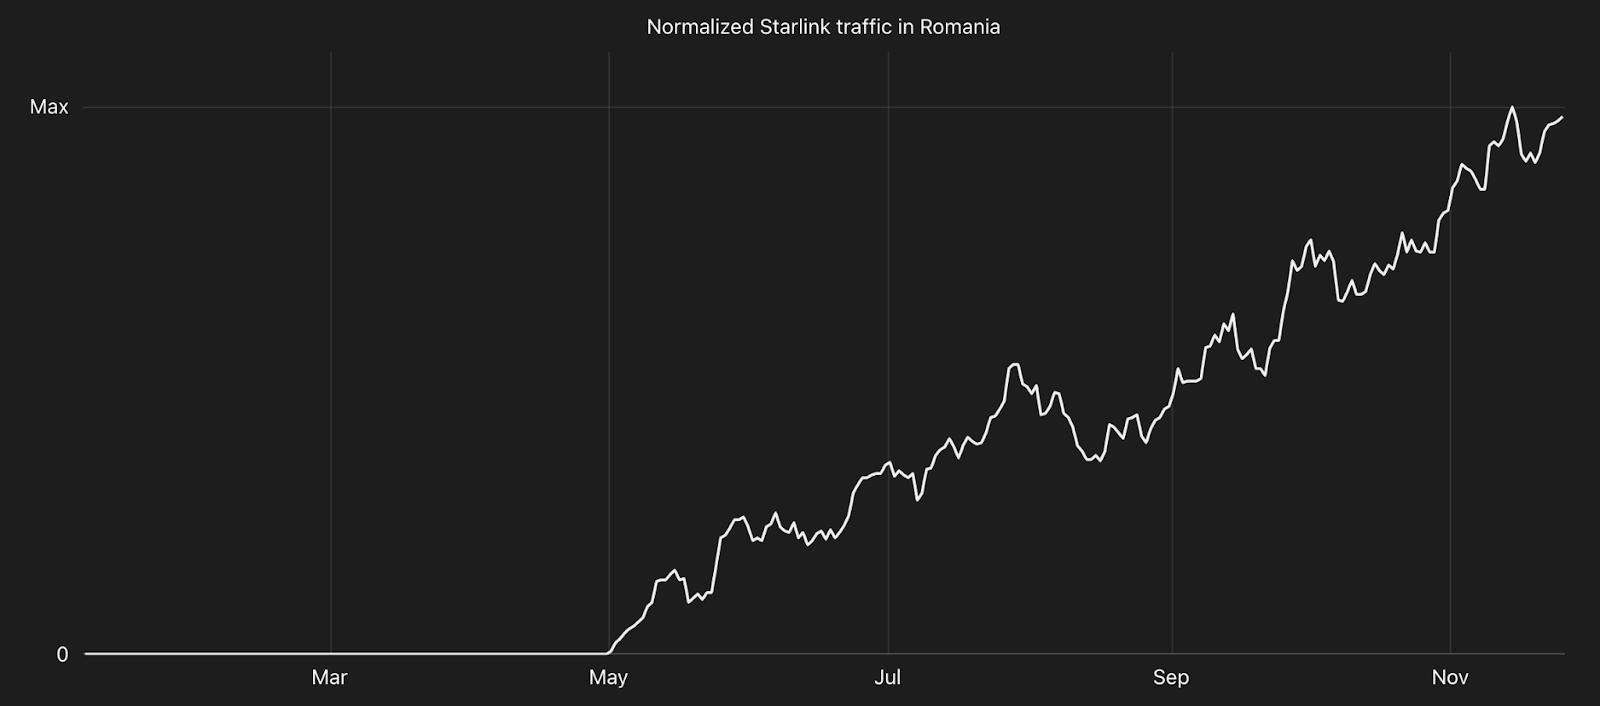
Latent interest in the service was also apparent in a number of locations where traffic grew quickly after Starlink announced availability. One such example is Romania, which was included in Starlink’s May announcement of an expanded service footprint, and which saw rapid traffic growth after the announcement.
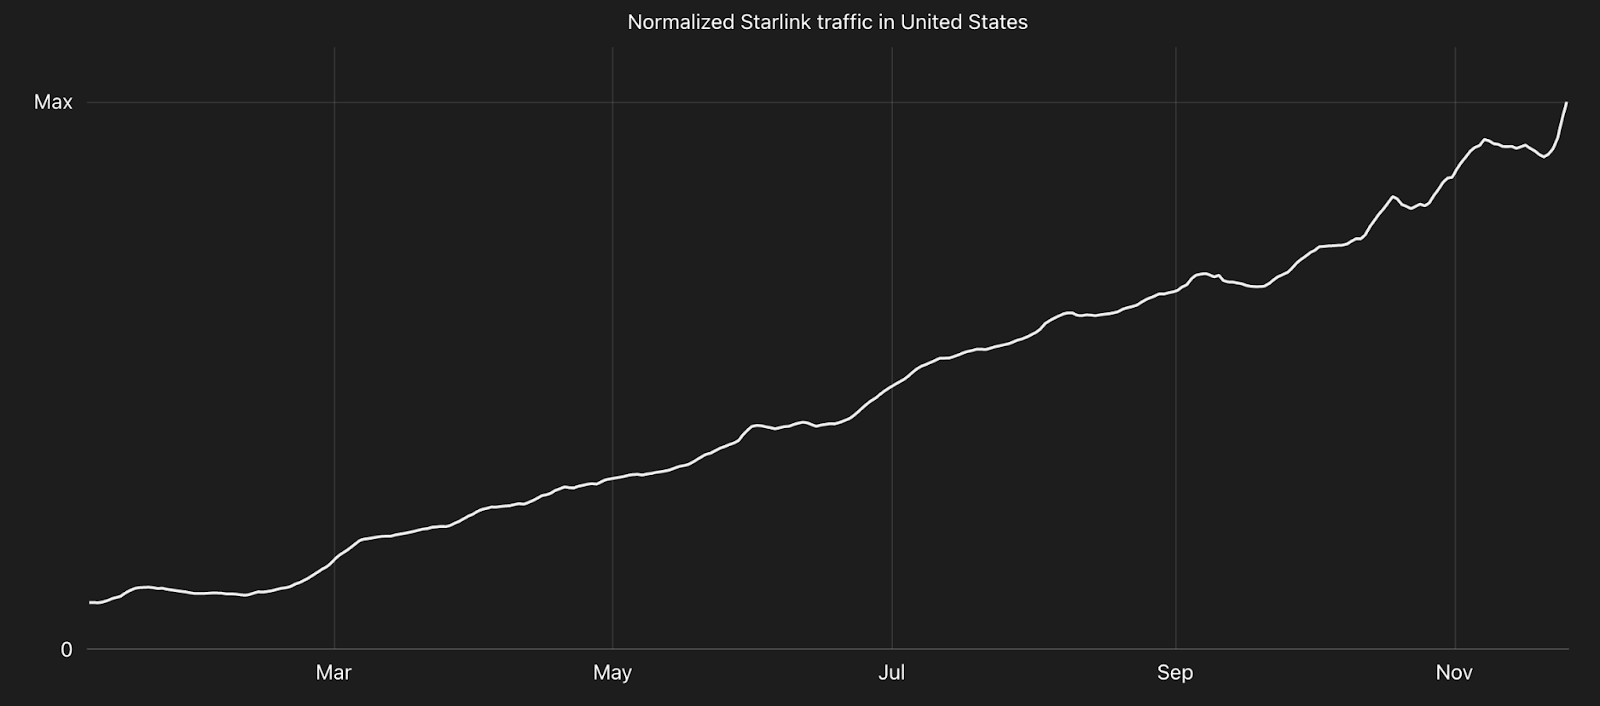
And in the United States, where Starlink has provided service since launch, traffic grew more than 10x through the end of November. Service enhancements announced during the year, like the ability to get Internet connectivity from moving vehicles, boats, and planes will likely drive additional traffic growth in the future.
Mastodon interest
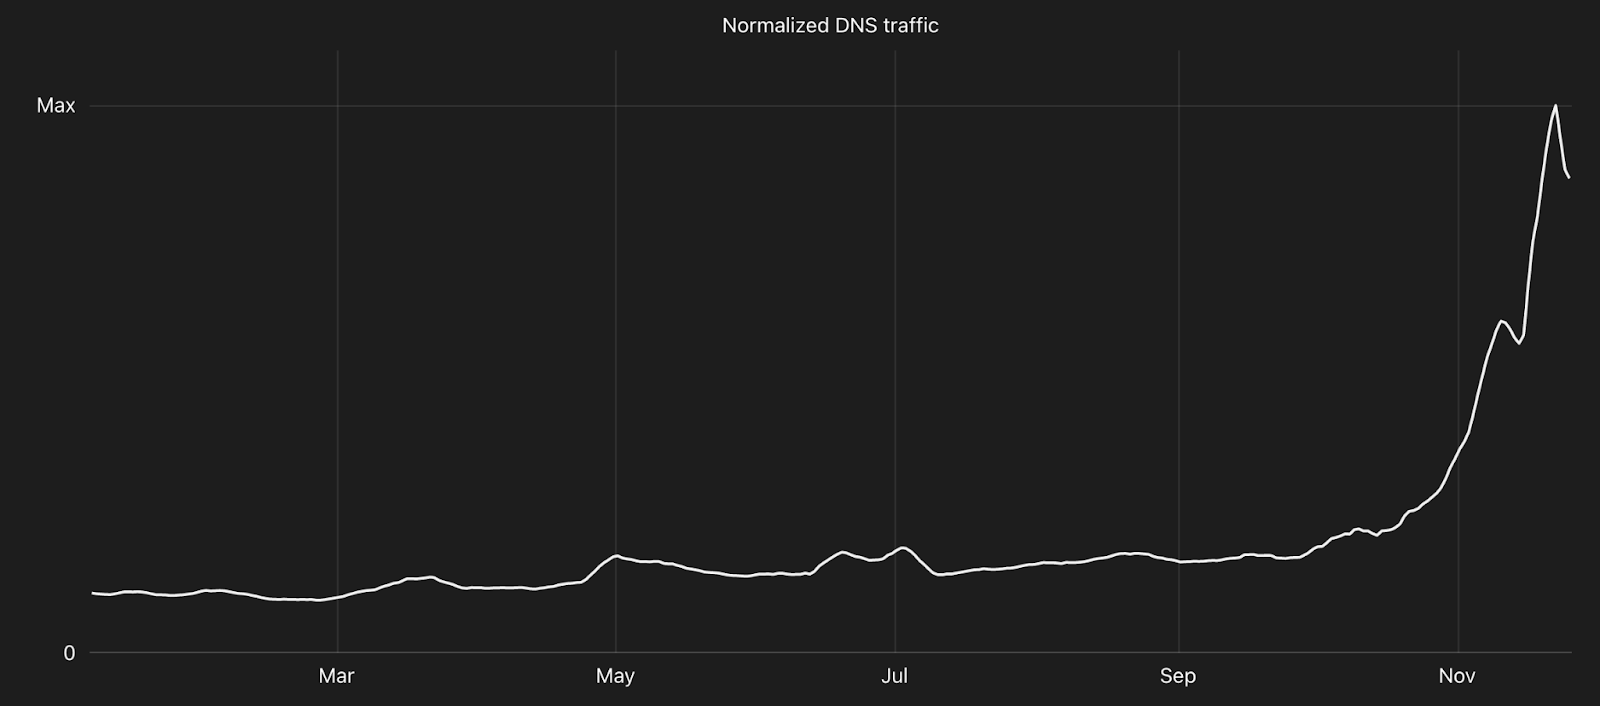
Above, we showed that Mastodon hit an inflection point in its popularity during the last few months of 2022. To better understand how interest in Mastodon evolved during 2022, we analyzed aggregate 1.1.1.1 request volume data for the domain names associated with 400 top Mastodon instances, looking at aggregate request volume by location. The request volume shown on the trend line in the chart represents a seven-day trailing average.
Although interest in Mastodon clearly accelerated over the last few months of the year, this interest was unevenly distributed throughout the world as we saw little to no traffic across many locations. Graphs for those locations are not included within the Year In Review website. However, because Mastodon has been around since 2016, it built a base of early adopters over the last six years before being thrust into the spotlight in 2022.
Those early adopters are visible at a global level, as we see a steady volume of resolver traffic for the analyzed Mastodon instance domain names through the first nine months of the year, with the timing of the increase visible in late April aligning with the announcement that Elon Musk had reached a deal to acquire Twitter for $44 billion. The slope of the graph clearly shifted in October as it became increasingly clear that the acquisition would close shortly, with additional growth into November after the deal was completed. This growth is likely due to a combination of existing but dormant Mastodon accounts once again becoming active, and an influx of new users.
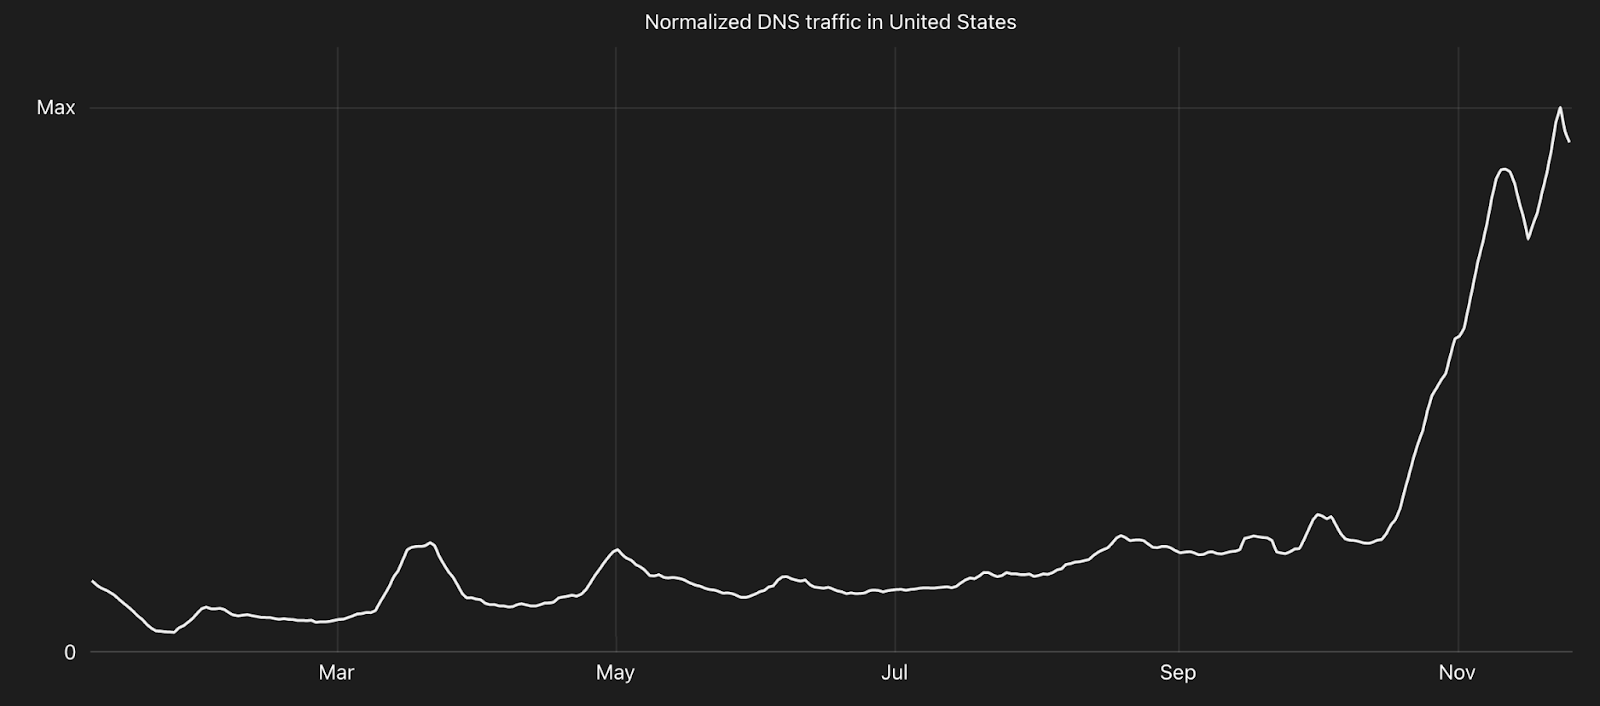
The traffic pattern observed for the United States appears fairly similar to the global pattern, with traffic from an existing set of users seeing massive growth starting in late October as well.
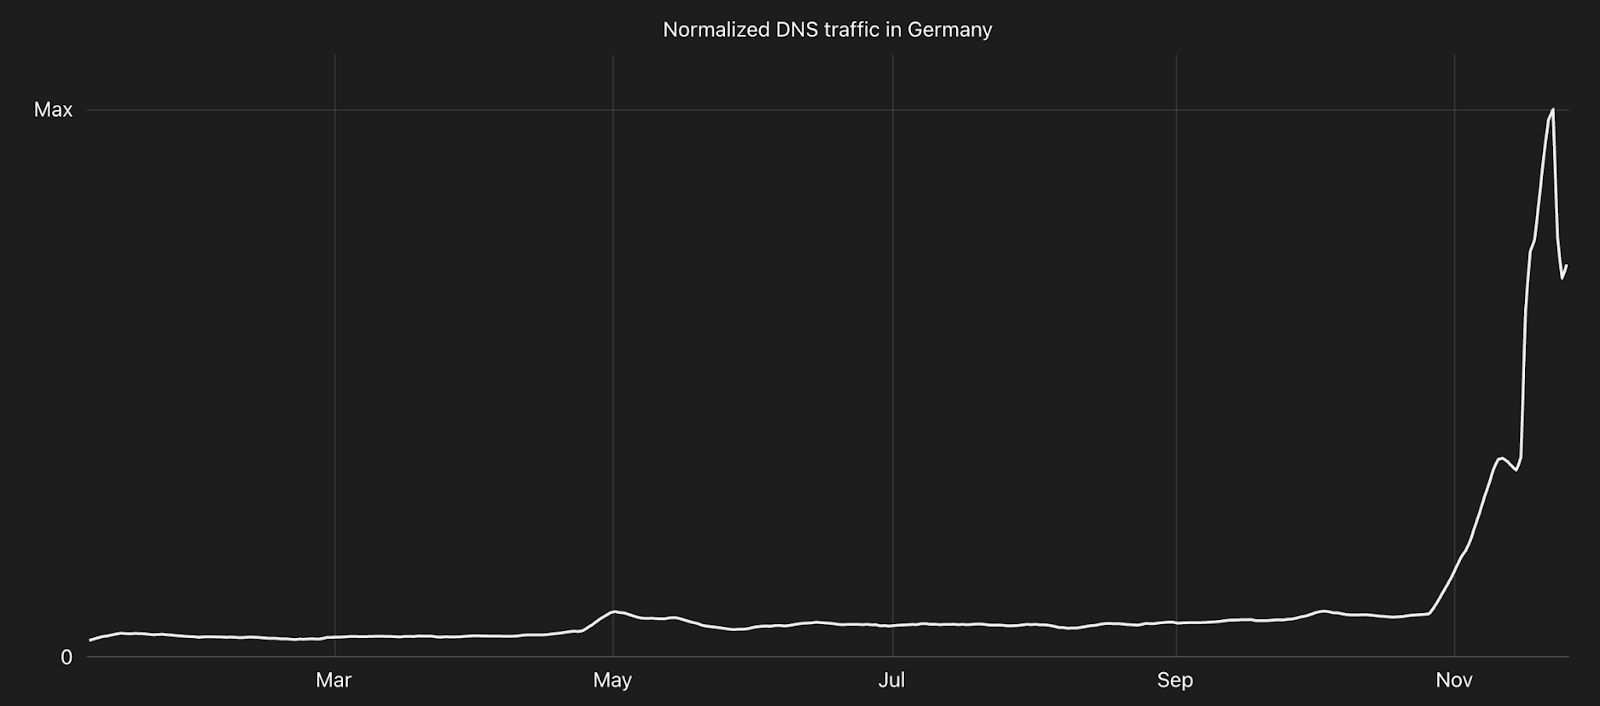
Although the core Mastodon software was developed by a programmer living in Germany, and the associated organization is incorporated as a German not-for-profit, it didn’t appear to have any significant home field advantage. Query volume for Germany was relatively low throughout most of the year, and only started to rapidly increase at the end of October, similar to behavior observed in a number of other countries.
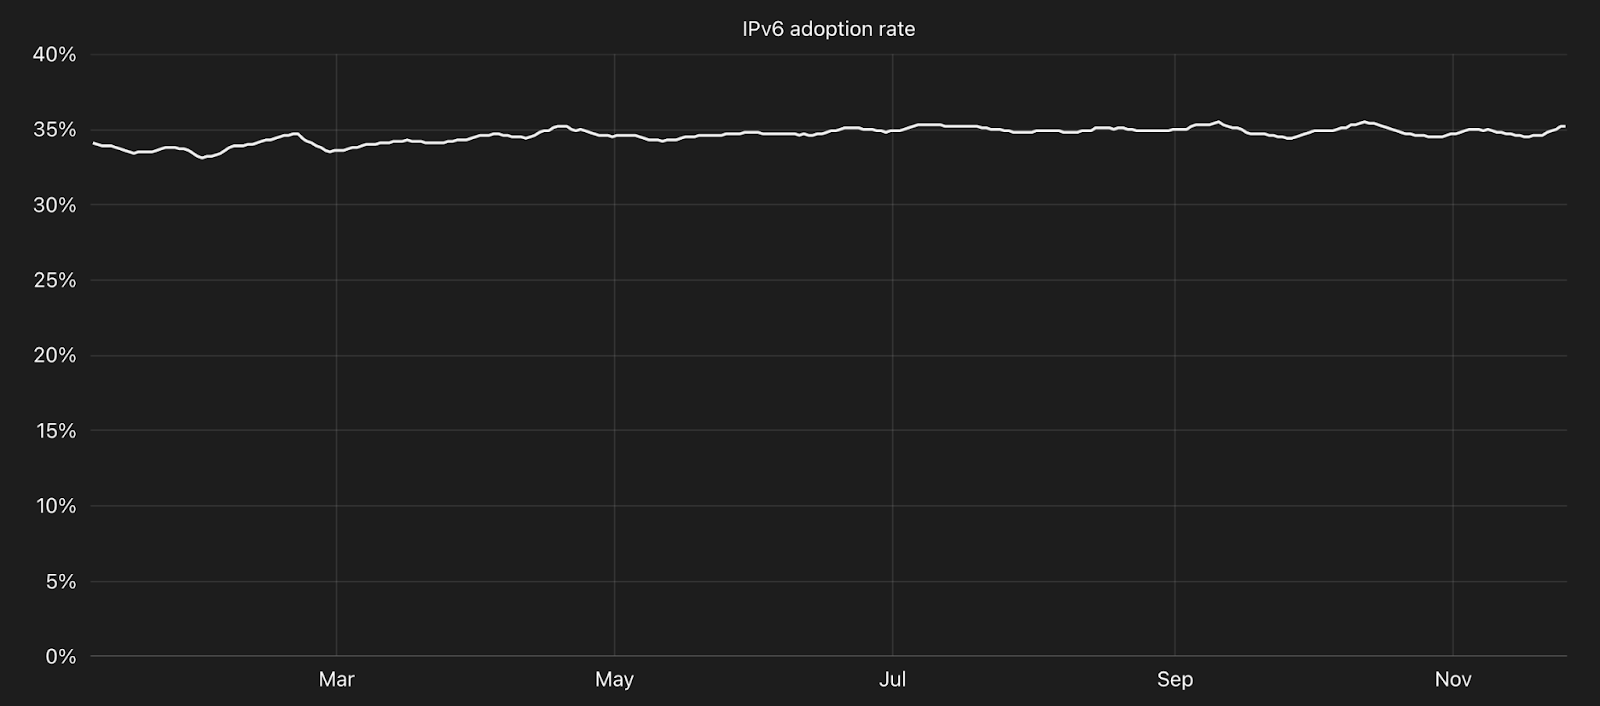
On a global basis, IPv6 adoption hovered around the 35% mark throughout the year, with nominal growth evident in the trend line shown in the graph. While it is encouraging to see one of every three requests for dual stacked content being made over IPv6, this adoption rate demonstrates a clear opportunity for improvement.
To calculate IPv6 adoption for each location, we identified the set of customer zones that had IPv6 enabled (were “dual stacked”) during 2022, and then divided the daily request count for the zones over IPv6 by the daily sum of IPv4 and IPv6 requests for the zones, filtering out bot traffic in both cases. The line shown in the trends graph represents a seven-day trailing average. For the top 10 chart, we calculated the average IPv6 adoption level on a monthly basis per location, and then ranked the locations by percentage. The chart illustrates the ranking by month, and how those rankings change across the year.
One location that has seized that opportunity is India, which recorded the highest IPv6 adoption rate throughout the year. After seeing more than 70% adoption through July, it began to drop slightly in late summer, losing a couple of percentage points over the subsequent months.
One key driver behind India’s leadership in this area is IPv6 support from Jio, India’s largest mobile network operator, as well as being a provider of fiber-to-the-home broadband connectivity. They aggressively started their IPv6 journey in late 2015, and now much of Jio’s core network infrastructure is IPv6-only, while customer-facing mobile and fiber connections are dual-stacked.
Also heading in the right direction are the more than 60 locations around the world that saw IP adoption rates more than double this year. One of the largest increases was seen in the European country of Georgia, which grew more than 3,500% to close out the year at 10% adoption thanks to rapid growth across February and March at Magticom, a leading Georgian telecommunications provider.
Many of the other locations in this set also experienced large gains over a short period of time, likely due to a local network provider enabling subscriber support for IPv6. While significant gains seen in over a quarter of the total surveyed locations is certainly a positive sign, it must be noted that over 50 are under 10% adoption, with more than half of those remaining well under 1%, even after seeing adoption more than double. Internet service providers around the world continue to add or improve IPv6 support for their subscribers, but many have low to non-existent adoption rates, presenting significant opportunity to improve in the future.
As noted above, India had the highest level of IPv6 adoption through 2022. In looking at the remainder of the top 10 list, Saudi Arabia and Malaysia traded places several times during the year as the locations with the second and third-highest adoption rates, at just under 60% and around 55% respectively. The United States appeared towards the bottom of the top 10 list during the first quarter, but ranked lower for the remainder of the year. Belgium proved to be the most consistent, holding the fourth-place spot from March through November, with around 55% IPv6 adoption. Overall, a total of 14 locations appeared among the top 10 at some point during the year.
Mobile device usage
Each year, mobile devices become more and more powerful, and are increasingly being used as the primary onramp to the Internet in many places. In fact, in some parts of the world, so-called “desktop” devices (which includes laptop form factors) are the exception for Internet access, not the rule.
Analysis of the information included with each content request enables us to classify the type of device (mobile or desktop) used to make the request. To calculate the percentage of mobile device usage by location, we divided the number of requests made by mobile devices over the course of a week by the total number of requests seen that week, filtering out bot traffic in both cases. For the top 10 chart, we ranked the locations by the calculated percentage. The chart illustrates the ranking by month, and how those rankings change across the year.
In looking at the top 10 chart, we note that Iran and Sudan held the top two slots for much of the year, bookended by Yemen in January and Mauritania in November. Below the top two spots, however, significant volatility is clear throughout the year within the rest of the top 10. However, this movement was actually concentrated across a relatively small percentage range, with just five to ten percentage points separating the top and bottom ranked locations, depending on the week. The top ranked locations generally saw 80-85% of traffic from mobile devices, while the bottom ranked locations saw 75-80% of traffic from mobile devices.
This analysis reinforces the importance of mobile connectivity in Iran, and underscores why mobile network providers were targeted for Internet shutdowns in September and October, as discussed above. (And the shutdowns subsequently explain why Iran disappears from the top 10 list after September.)
Security
Improving Internet security is a key part of Cloudflare’s drive to help build a better Internet. One way we do that is by protecting customer websites, applications, and network infrastructure from malicious traffic and attacks. Because malicious actors regularly use a variety of techniques and approaches in launching their attacks, we have a number of products within our security solution portfolio that provide customers with flexibility around how they handle these attacks. Below, we explore insights derived from the attack mitigation we do on behalf of customers, including how we are mitigating attacks, what kinds of websites and applications attacks are targeting, and where these attacks appear to be coming from. In addition, with the acquisition of Area 1 earlier in 2022, we are presenting insight into where malicious email originates from. Analysis of this data highlights that there is very much no “one size fits all” security solution, as attackers use a wide variety of techniques, frequently shifting between them. As such, having a broad but flexible portfolio of security solutions at the ready is critical for CISOs and CIOs.
Mitigation sources
Depending on the approach taken by an attacker, and the type of content being targeted, one attack mitigation technique may be preferable over another. Cloudflare refers to these techniques as “mitigation sources”, and they include popular tools and techniques like Web Application Firewall (WAF) and DDoS Mitigation (DDoS), but also lesser known ones like IP Reputation (IPR), Access Rules (AR), Bot Management (BM), and API Shield (APIS). Examining the distribution of mitigation sources applied by location can help us better understand the types of attacks originating from those locations. To calculate the percentage of mitigated traffic associated with each mitigation source by location, we divided the total number of daily mitigated requests for each source by the total number of mitigated requests seen that day. Bot traffic is included in these calculations, given that many attacks originate from bots. A single request can be mitigated by multiple techniques, and here we consider the last technique that mitigated the request.
Across many locations, IP Reputation, Bot Management, and Access Rules accounted for small amounts of mitigated traffic throughout the year, with the volumes varying by country. However, in other locations, IP Reputation and Access Rules were responsible for larger amounts of mitigated traffic, possibly indicating those places had more of their traffic being blocked outright. A number of countries saw a rapid and significant increase in DDoS mitigated traffic during January to the 80-90% range, followed by a rapid drop to the 10-20% range. In that vein, DDoS Mitigation and WAF percentage shifts were frequently very spiky, with only occasional sustained periods of relatively consistent percentages.
Overall, DDoS Mitigation and WAF were the two most frequently used techniques to address attacks. The former’s share on a global basis was highest in mid-January, growing to nearly 80%, while the latter’s peak was during February, when it accounted for almost 60% of mitigated traffic. A spike in the usage of Access Rules is clearly visible in August, related to similar spikes observed for the United States, United Arab Emirates, and Malaysia.
Although Access Rules accounted for as much as 20% of mitigated traffic from the United States in August, it saw much lower usage throughout the balance of the year. DDoS Mitigation was the primary technique used to mitigate attack traffic coming from the United States, responsible for over 80% of such traffic during the first quarter, though it steadily declined through August. In a complimentary fashion, WAF drove only ~20% of mitigated traffic early in the year, but that volume steadily grew and had tripled through August. Interestingly, the growth in Access Rules usage followed rapid growth and then similarly rapid decline in WAF, possibly suggesting that more targeted rules were implemented to augment the managed rules applied by the Web Application Firewall against US-originated attacks.
Access Rules and IP Reputation were applied more frequently to mitigate attack traffic coming from Germany, with Bot Management also seeing increased usage in February, March, and June. However, except for periods in February and July, DDoS Mitigation drove the bulk of mitigated traffic, generally ranging between 60-80%. WAF mitigation was clearly most significant during February, with 70-80% of mitigated traffic, and July, at around 60%.
In mitigating attacks coming from Japan, it is interesting to see a couple of notable spikes in Bot Management. In March, it was briefly responsible for upwards of 40% of mitigated traffic, with another spike that was half as big in June. Access Rules also maintained a consistent presence in the graph, with around 5% of mitigated traffic through August, but slightly less in the following months. In dealing with Japanese attack traffic, WAF & DDoS Mitigation frequently traded positions as the largest source of mitigated traffic, although there was no clear pattern or apparent cycle. Both reached as much as 90% of mitigated traffic at times throughout the year – WAF in February and DDoS Mitigation in March. DDoS Mitigation’s periods of “dominance” tended to be more sustained, lasting for several weeks, but were punctuated by brief WAF spikes.
WAF rules
As noted above, Cloudflare’s WAF is frequently used to mitigate application layer attacks. There are hundreds of individually managed rules that can be applied by the WAF depending on the characteristics of the mitigated request, but these rules can be grouped into over a dozen types. Examining the distribution of WAF rules by location can help us better understand the techniques that attacks coming from that location are using. (For example, are attackers trying to inject SQL code into a form field, or exploit a published CVE?) To calculate the distribution of WAF mitigated traffic across the set of rule types for each location, we divided the number of requests mitigated by a particular type of WAF rule seen over the course of a week by the total number of WAF mitigated requests seen over that week. A single request can be mitigated by multiple rules and here we consider the last rule in a sequence that mitigated the request. The chart shows how the distribution of mitigated requests across the selected rule types changes over the course of the year. Bot traffic is included in these calculations.
At a worldwide level, during the first few months of the year, approximately half of HTTP requests blocked by our Managed WAF Rules contained HTTP anomalies, such as malformed method names, null byte characters in headers, non-standard ports, or content length of zero with a POST request. During that period, Directory Traversal and SQL Injection (SQLi) rules both accounted for just over 10% of mitigated requests as well. Attackers began to further vary their approach starting in May, as Cross Site Scripting (XSS) and File Inclusion both grew to over 10% of mitigations, while HTTP anomalies dropped to below 30%. Use of Software Specific rules grew above 10% in July, as attackers apparently ramped their efforts to exploit vendor-specific vulnerabilities. Broken Authentication and Command Injection rulesets also saw some growth in activity during the last several months, suggesting that attackers increased their efforts to find vulnerabilities in login/authentication systems or to execute commands on vulnerable systems in an attempt to gain access.
Although HTTP Anomaly was the most frequently applied rule when mitigations are aggregated at a global level, there were a number of locations where it held the top spot only briefly, if at all, as discussed below.
Attacks originating in Australia were WAF-mitigated using a number of rulesets, with the most applied ruleset changing frequently during the first half of the year. In contrast to the global overview, HTTP Anomaly was the top ruleset for only a single week in February, when it accounted for just over 30% of mitigations. Otherwise, attacks were most frequently mitigated with Software Specific, Directory Traversal, File Inclusion, and SQLi rules, generally accounting for 25-35% of mitigations. This pattern shifted starting in July, though, as Directory Traversal attacks became the most common, staying that way through the balance of the year. After peaking in June, SQLi attacks became significantly less common, rapidly falling and staying below 10% of mitigations.
WAF mitigations of attacks originating in Canada also demonstrated a pattern that differed from the global one. Although the HTTP Anomaly ruleset started the year accounting for approximately two thirds of mitigated requests, it was half that by the end of January, and saw significant volatility throughout the balance of the year. SQLi mitigations of Australian traffic effectively saw an opposite pattern, starting the year below 10% of mitigations but growing rapidly, accounting for 60% or more of mitigated traffic at multiple times throughout the year. Interestingly, SQLi attacks from Canada appeared to come in multi-week waves, becoming the most applied ruleset during those waves, and then receding for a brief period.
For attacks originating in Switzerland, the HTTP Anomaly ruleset was never the most frequently invoked, although it remained among the top five throughout the year. Instead, Directory Traversal and XSS rules were most frequently used, accounting for as much as 40% of mitigations. Directory Traversal most consistently held the top spot, though XSS attacks were the most prevalent during August. SQLi attacks saw peaks in April, July/August, and then again at the end of November. The Software Specific ruleset also breakout growth in September to as much as 20% of mitigated requests.
Target categories
Above, we discussed how traffic distribution across a set of categories provides insights into the types of content that users are most interested in. By performing similar analysis through a mitigation lens, we can gain insights into the types of websites and applications that are being most frequently targeted by attackers. To calculate the distribution of mitigated traffic across the set of categories for each location, we divided the number of mitigated requests for domains associated with a given category seen over the course of a week by the total number of requests mapped to that category during that week. The chart shows how the distribution of mitigated requests across each category changes over the course of the year. (As such, percentages will not sum to 100%). Bot traffic is included in these calculations. The percentage of traffic that was mitigated as an attack varied widely across industries and originating locations. In some places, a nominal percentage of traffic across all categories was mitigated, while in others, multiple categories experienced spikes in mitigated traffic at multiple times during 2022.
When aggregated at a global level, there was significant variance over the course of the year in the industry categories that attracted the most attacks as a fraction of their overall traffic. Through January and February, Technology sites had the largest percentage of mitigated requests, ranging between 20-30%. After that, a variety of categories moved in and out of the top slot, with none holding it for more than a few weeks. The biggest spike in attacks was targeted at Travel sites in mid-April, when more than half of the category’s traffic was mitigated. Coincident with the start of the 2022 World Cup in the last week of November, Gambling and Entertainment sites saw the largest percentages of mitigated traffic.
For attacks coming from the United Kingdom, Technology sites consistently saw around 20% of mitigated traffic through the year. During those times that it was not the most mitigated category, half a dozen other categories topped the list. Travel sites experienced two significant bursts of attacks, with nearly 60% of traffic mitigated in April, and nearly 50% in October. Other categories, including Government & Politics, Real Estate, Religion, and Education had the largest shares of mitigated traffic at various times throughout the year. UK-originated attacks on Entertainment sites jumped significantly in late November, with 40% of traffic mitigated at the end of the month.
Similar to the trends seen at the global level, Technology sites accounted for the largest percentage of mitigated attacks from the United States in January and February, clocking in between 30-40%. After that, attackers shifted their focus to target other industry categories. In mid-April, Travel sites had over 60% of requests mitigated as attacks. However, starting in May, Gambling sites most frequently had the highest percentage of traffic being mitigated, generally ranging between 20-40%, but spiking up to 70% in late October/early November.
In contrast, significantly smaller percentages of traffic across the surveyed categories from Japan was mitigated as attacks throughout 2022. Most categories saw mitigation shares of less than 10%, although there were a number of brief spikes observed at times. In late March, traffic to sites in the Government & Politics category briefly jumped to a nearly 80% mitigation share, while Travel sites spiked to nearly 70% of requests mitigated as attacks, similar to the behavior seen in other locations. In late June, Religion sites had a mitigation share of over 60%, and a couple of months later, Gambling sites experienced a rapid increase in mitigated traffic, reaching just over 40%. These attacks targeting Gambling sites then receded for a few months before starting to aggressively increase again in October.
Phishing email sources
Phishing emails are ultimately intended to trick users into providing attackers with login credentials for important websites and applications. At a consumer level, this could include an e-commerce site or banking application, while for businesses, this could include code repositories or employee information systems. For customers protected by Cloudflare Area 1 Email Security, we can identify the location that these phishing emails are being sent from. IP address geolocation is used to identify origination location, and the aggregate email counts apply to emails processed by Area 1 only. For the top 10 chart, we aggregated the number of phishing emails seen on a weekly basis per location, and then ranked the locations by phishing email volume. The chart illustrates the ranking by week, and how those rankings change across the year.
Reviewing the top 10 list, we find that the United States was the top source of phishing emails observed by Area 1 during 2022. It held the top spot for nearly the entire year, ceding it only once to Germany in November. The balance of the top 10 saw a significant amount of volatility over time, with a total of 23 locations holding a spot in the rankings for at least one month during the year. These locations were well-distributed geographically across the Americas, Europe, and Asia, highlighting that no one region of the world is a greater threat than others. Obviously, distrusting or rejecting all email originating from these locations is not a particularly practical response, but applying additional scrutiny can help keep your organization, and the Internet, safer.
Conclusion
Attempting to concisely summarize our “year in review” observations is challenging, especially as we only looked at trends in this blog post across a small fraction of the nearly 200 locations included in the website’s visualizations. Having said that, we will leave you with the following brief thoughts:
Attack traffic comes from everywhere, with constantly shifting targets, using widely varied techniques. Ensure that your security solutions provider offers a comprehensive portfolio of services to help keep your sites, applications, and infrastructure safe.
Internet service providers around the world need to improve support for IPv6 — it is no longer a “new” technology, and available IPv4 address space will become both increasingly scarce and increasingly expensive. Support for IPv6 needs to become the default going forward.
Internet shutdowns are being increasingly used by governments to limit communications within a country, as well as limiting communications with the rest of the world. As the United Nations stated in a May 2022 report, “Blanket shutdowns in particular inherently impose unacceptable consequences for human rights and should never be imposed.”
As we said in the introduction, we encourage you to visit the full Cloudflare Radar 2022 Year In Review website and explore the trends relevant to locations and industries of interest, and to consider how they impact your organization so that you are appropriately prepared for 2023.
It truly took a village to produce the Cloudflare Radar 2022 Year In Review, and we would be remiss if we didn’t acknowledge the contributions of colleagues that were instrumental in making this project possible. Thank you to: Sabina Zejnilovic, Carlos Azevedo, Jorge Pacheco (Data Science); Ricardo Baeta, Syeef Karim (Design); Nuno Pereira, Tiago Dias, Junior Dias de Oliveira (Front End Development); João Tomé (Most popular Internet services); and Davide Marques, Paula Tavares, Celso Martinho (Project/Engineering Management).
Brasil, sei lá Ou o meu coração se engana Ou uma terra igual não há — From Tom Jobim’s song, Brasil Nativo
Brazil’s recent presidential election got significant attention from both global and national media outlets, not only because of the size of the country, but also because of premature allegations of electoral fraud. The first round of the Brazilian 2022 general election was held on October 2, and the runoff was held on Sunday, October 30. With 124 million votes counted, former president Lula da Silva (2003-2010) won with 50.9% of the votes, beating incumbent Jair Bolsonaro, who had 49.1% of the votes.
The final results of the elections as published by the official Tribunal Super Eleitoral, with more than 124 million votes counted.)
Using Cloudflare’s data, we can explore the impact that this election had on Internet traffic patterns in Brazil, as well as interest in content from election-related websites, news organizations, social media platforms, and video platforms.
Here are a few highlights: while the runoff generated much more interest to election related websites (we actually have a view to DNS queries, a proxy to websites), the first round showed bigger increases in traffic to news organizations.
For the candidate’s domains, Lula’s win had the higher impact.
Also: official results came earlier on the runoff than the first round, and spikes in traffic were higher earlier that day (October 30).
(Note: we’re using local times — that means UTC-3, that is related to the more populated regions of Brazil — in this blog, although some charts have x-axis UTC).
Let’s start by looking at general Internet traffic in Brazil.
On election days, traffic goes down (during the day)
Using Cloudflare Radar, we can see something that has also been observed in other countries that hold Sunday elections: when most people are getting outside to vote, Internet traffic goes down (in comparison with previous Sundays). We saw this in the two rounds of the Presidential elections in France back in April 2022, in Portugal’s legislative elections in January 2022 and now, in Brazil.
We can also compare Sundays in October. There were five weekends. The two that had elections show the same pattern of lower traffic during the day, as seen in the previous chart. Comparing the two election days, there was a bigger drop in traffic on October 30 (down 21% at around 18:00 local time), than on October 2 (down 10% at around 20:00). Related or not, there was a bigger turnout on the runoff (124 million votes) than on the first round (123 million). Here’s the view on October 30:
And here’s October 2:
A more clear view in comparing the October weekends, and where you can see how the October 2 and 30 Sundays have the same pattern and different from the others three of the month, is this one (bear in mind that the x-axis is showing UTC time, it’s -3 hours in Brazil):
If we look at the main network providers (ASNs) in Brazil, the trend is the same. Claro (AS28573) also shows the drop in traffic on October 30, as does Telefonica (AS27699):
Here’s Telefonica:
We observed a similar impact from the October 30 runoff election to traffic from different states in Brazil, including São Paulo, Rio de Janeiro, Rio Grande do Norte, Minas Gerais, and Bahia.
Mobile device usage greater on weekends (and on election days)
When we look at the share of Brazil’s Internet traffic from mobile devices during October, we find that the highest percentages were on October 2 (first round of the elections, 66.3%), October 9 (66.4%) and October 30 (runoff election, 65%). We’ve seen this in other elections, an increase in mobile device traffice, so this seems to follow the same trend.
This chart also shows how mobile device usage in Brazil is at its highest on the weekends (all the main spikes for percentage of mobile devices are over the weekend, and more on Sundays).
Now, let’s look at anonymized and aggregated DNS traffic data from our 1.1.1.1 resolver. This data provides a proxy for traffic to, and thus interest in, different categories of sites from users in Brazil around the election.
Election-related sites: higher interest in the runoff
Brazil has government websites related to elections, but also its own Tribunal Superior Eleitoral (Electoral Superior Court) that includes a website and app with live updates on the results of the elections for everyone to check. Looking at those related domains and using mean hourly traffic in September as a baseline, we can see that the October 2 first round spiked to 16x more DNS queries at 20:00 local time. However, DNS query traffic during the runoff election peaked at 18:00 local time on October 30 with 17.4x more DNS traffic as compared to the September baseline.
We can look more closely at each one of those two election days. On October 2, traffic had its first significant increase at around 17:00 local time, reaching 15x more requests to election-related domains as compared to the September baseline. This initial peak occurred at the same time the polling stations were closing. However, the peak that day, at 16x above baseline, was reached at 20:00 local time, as seen in the figure below.
On Sunday, October 30, 2022, the pattern is similar, although the peak was reached earlier, given that results started to arrive earlier than on the first round. The peak was reached at around 18:00 local time, with request traffic 17.4x above baseline.
As seen in the figure below, Lula first led in the official results at 18:45 local time, with votes from 67% of the polling stations counted at that time. Around 20:00 Lula was considered the winner (the peak seen in the previous chart was at that time).
Candidate websites: in the end, winner takes all?
For Lula-related domains, there are clear spikes around the first round of elections on October 2. A 13x spike was observed on October 1 at around 21:00 local time. Two notable spikes were observed on October 2 — one at 16.7x above baseline at 09:00 local time, and the other at 10.7x above baseline at 21:00 local time. During the October 30 runoff election, only one clear spike was observed. The spike, at 16.7x above baseline, occurred at around 20:00, coincident with the time Lula was being announced as the winner.
For Bolsonaro-related domains, we observed a different pattern. Increased traffic as compared to the baseline is visible in the days leading up to the first round election, reaching 10x on September 30. On October 2, a 8x spike above baseline was seen at 18:00 local time. However, the two most significant spikes seen over the course of the month were observed on October 16, at 20x above baseline, a few hours after the first Lula-Bolsonaro television debate, and on October 25, at around 20:00, at 22x above baseline. That was the last week of campaigning before the October 30 runoff and when several polling predictions were announced. The second and last Bolsonaro-Lula debate was on October 28, and there’s a spike at 22:00 to Lula’s websites, and a smaller but also clear one at 21:00 to Bolsonaro’s websites).
News websites: more interest in the first round
With official election results being available more rapidly, DNS traffic for Brazilian news organization websites peaked much earlier in the evening than what we saw in France, for example, where more definitive election results arrived much later on election day. But another interesting trend here is how the first round, on October 2, had 9.1x more DNS traffic (compared with the September baseline), than what we saw during the runoff on October 30 (6.1x).
The way the results arrived faster also had an impact on the time of the peak, occurring at around 19:00 local time on October 30, as compared to around 20:00 on October 2.
At 19:45 local time on October 30, Lula was already the winner with more than 98% of the votes counted. After 20:00 there was a clear drop in DNS traffic to news organizations.
On October 2, it was only around 22:00 that it became official that there would be a runoff between Lula and Bolsonaro. Peak request volume was reached at 20:00 (9x), but traffic remained high (8x) at around 21:00 and until 22:00, like the following chart shows:
Conclusion: Real world events impact the Internet
Cloudflare Radar, our tool for Internet insights, can provide a unique perspective on how major global or national events impact the Internet. It is interesting to not only see that a real world event can impact Internet traffic (and different types of websites) for a whole country, but also see how much that impact is represented at specific times. It’s all about human behavior at relevant moments in time, like elections as a collective event is.
Cloudflare operates in more than 275 cities in over 100 countries, where we interconnect with over 10,000 network providers in order to provide a broad range of services to millions of customers. The breadth of both our network and our customer base provides us with a unique perspective on Internet resilience, enabling us to observe the impact of Internet disruptions. In many cases, these disruptions can be attributed to a physical event, while in other cases, they are due to an intentional government-directed shutdown. In this post, we review selected Internet disruptions observed by Cloudflare during the third quarter of 2022, supported by traffic graphs from Cloudflare Radar and other internal Cloudflare tools, and grouped by associated cause or common geography. The new Cloudflare Radar Outage Center provides additional information on these, and other historical, disruptions.
Government directed shutdowns
Unfortunately, for the last decade, governments around the world have turned to shutting down the Internet as a means of controlling or limiting communication among citizens and with the outside world. In the third quarter, this was an all too popular cause of observed disruptions, impacting countries and regions in Africa, the Middle East, Asia, and the Caribbean.
Iraq
As mentioned in our Q2 summary blog post, on June 27, the Kurdistan Regional Government in Iraq began to implement twice-weekly (Mondays and Thursday) multi-hour regional Internet shutdowns over the following four weeks, intended to prevent cheating on high school final exams. As seen in the figure below, these shutdowns occurred as expected each Monday and Thursday through July 21, with the exception of July 21. They impacted three governorates in Iraq, and lasted from 0630–1030 local time (0330–0730 UTC) each day.
In Cuba, an Internet disruption was observed between 0055-0150 local time (0455-0550 UTC) on July 15 amid reported anti-government protests in Los Palacios and Pinar del Rio.
Closing out the quarter, another significant disruption was observed in Cuba, reportedly in response to protests over the lack of electricity in the wake of Hurricane Ian. A complete outage is visible in the figure below between 2030 on September 29 and 0315 on September 30 local time (0030-0715 UTC on September 30).
Afghanistan
Telecommunications services were reportedly shut down in part of Kabul, Afghanistan on the morning of August 8. The figure below shows traffic dropping starting around 0930 local time (0500 UTC), recovering 11 hours later, around 2030 local time (1600 UTC).
Protests in Freetown, Sierra Leone over the rising cost of living likely drove the Internet disruptions observed within the country on August 10 & 11. The first one occurred between 1200-1400 local time (1200-1400 UTC) on August 10. While this outage is believed to have been government directed as a means of quelling the protests, Zoodlabs, which manages Sierra Leone Cable Limited, claimed that the outage was the result of “emergency technical maintenance on some of our international routes”.
A second longer outage was observed between 0100-0730 local time (0100-0730 UTC) on August 11, as seen in the figure below. These shutdowns follow similar behavior in years past, where Internet connectivity was shut off following elections within the country.
In Somaliland, local authorities reportedly cut off Internet service on August 11 ahead of scheduled opposition demonstrations. The figure below shows a complete Internet outage in Woqooyi Galbeed between 0645-1355 local time (0345-1055 UTC.)
At a network level, the observed outage was due to a loss of traffic from AS37425 (SomCable) and AS37563 (Somtel), as shown in the figures below. Somtel is a mobile services provider, while SomCable is focused on providing wireline Internet access.
India
India is no stranger to government-directed Internet shutdowns, taking such action hundreds of times over the last decade. This may be changing in the future, however, as the country’s Supreme Court ordered the Ministry of Electronics and Information Technology (MEITY) to reveal the grounds upon which it imposes or approves Internet shutdowns. Until this issue is resolved, we will continue to see regional shutdowns across the country.
One such example occurred in Assam, where mobile Internet connectivity was shut down to prevent cheating on exams. The figure below shows that these shutdowns were implemented twice daily on August 21 and August 28. While the shutdowns were officially scheduled to take place between 1000-1200 and 1400-1600 local time (0430-0630 and 0830-1030 UTC), some providers reportedly suspended connectivity starting in the early morning.
In addition to multi-hour outages in Sanadij and Tehran province on September 19 and 21 that were covered in a blog post, three mobile network providers — AS44244 (Irancell), AS57218 (RighTel), and AS197207 (MCCI) — implemented daily Internet “curfews”, generally taking place between 1600 and midnight local time (1230-2030 UTC), although the start times varied on several days. These regular shutdowns are clearly visible in the figure below, and continued into early October.
As noted in the blog post, access to DNS-over-HTTPS (DoH) and DNS-over-TLS (DoT) services was also blocked in Iran starting on September 20, and in a move that is likely related, connections over HTTP/3 and QUIC were blocked starting on September 22, as shown in the figure below from Cloudflare Radar.
Natural disasters
Natural disasters such as earthquakes and hurricanes wreak havoc on impacted geographies, often causing loss of life, as well as significant structural damage to buildings of all types. Infrastructure damage is also extremely common, with widespread loss of both electrical power and telecommunications infrastructure.
Papua New Guinea
On September 11, a 7.6 magnitude earthquake struck Papua New Guinea, resulting in landslides, cracked roads, and Internet connectivity disruptions. Traffic to the country dropped by 26% just after 1100 local time (0100 UTC) . The figure below shows that traffic volumes remained lower into the following day as well. An announcement from PNG DataCo, a local provider, noted that the earthquake “has affected the operations of the Kumul Submarine Cable Network (KSCN) Express Link between Port Moresby and Madang and the PPC-1 Cable between Madang and Sydney.” This damage, they stated, resulted in the observed outage and degraded service.
Several major hurricanes plowed their way up the east coast of North America in late September, causing significant damage, resulting in Internet disruptions. On September 18, island-wide power outages caused by Hurricane Fiona disrupted Internet connectivity on Puerto Rico. As the figure below illustrates, it took over 10 days for traffic volumes to return to expected levels. Luma Energy, the local power company, kept customers apprised of repair progress through regular updates to its Twitter feed.
Two days later, Hurricane Fiona slammed the Turks and Caicos islands, causing flooding and significant damage, as well as disrupting Internet connectivity. The figure below shows traffic starting to drop below expected levels around 1245 local time (1645 UTC) on September 20. Recovery took approximately a day, with traffic returning to expected levels around 1100 local time (1500 UTC) on September 21.
Continuing to head north, Hurricane Fiona ultimately made landfall in the Canadian province of Nova Scotia on September 24, causing power outages and disrupting Internet connectivity. The figure below shows that the most significant impact was seen in Nova Scotia. As Nova Scotia Power worked to restore service to customers, traffic volumes gradually increased, as seen in the figure below. By September 29, traffic volumes on the island had returned to normal levels.
Hurricane Ian
On September 28, Hurricane Ian made landfall in Florida, and was the strongest hurricane to hit Florida since Hurricane Michael in 2018. With over four million customers losing power due to damage from the storm, a number of cities experienced associated Internet disruptions. Traffic from impacted cities dropped significantly starting around 1500 local time (1900 UTC), and as the figure below shows, recovery has been slow, with traffic levels still not back to pre-storm volumes more than two weeks later.
In addition to power outages caused by earthquakes and hurricanes, a number of other power outages caused multi-hour Internet disruptions during the third quarter.
Iran
A reported power outage in a key data center building disrupted Internet connectivity for customers of local ISP Shatel in Iran on July 25. As seen in the figure below, traffic dropped significantly at approximately 0715 local time (0345 UTC). Recovery began almost immediately, with traffic nearing expected levels by 0830 local time (0500 UTC).
Venezuela
Electrical issues frequently disrupt Internet connectivity in Venezuela, and the independent @vesinfiltro Twitter account tracks these events closely. One such example occurred on August 9, when electrical issues disrupted connectivity across multiple states, including Mérida, Táchira, Barinas, Portuguesa, and Estado Trujillo. The figure below shows evidence of two disruptions, the first around 1340 local time (1740 UTC) and the second a few hours later, starting at around 1615 local time (2015 UTC). In both cases, traffic volumes appeared to recover fairly quickly.
On September 5, a power outage in Oman impacted energy, aviation, and telecommunications services. The latter is evident in the figure below, which shows the country’s traffic volume dropping nearly 60% when the outage began just before 1515 local time (0915 UTC). Although authorities claimed that “the electricity network would be restored within four hours,” traffic did not fully return to normal levels until 0400 local time on September 6 (2200 UTC on September 5) the following day, approximately 11 hours later.
Ukraine
Over the last seven-plus months of war in Ukraine, we have observed multiple Internet disruptions due to infrastructure damage and power outages related to the fighting. We have covered these disruptions in our first and second quarter summary blog posts, and continue to do so on our @CloudflareRadar Twitter account as they occur. Power outages were behind Internet disruptions observed in Kharkiv on September 11, 12, and 13.
The figure below shows that the first disruption started around 2000 local time (1700 UTC) on September 11. This near-complete outage lasted just over 12 hours, with traffic returning to normal levels around 0830 local time (0530 UTC) on the 12th. However, later that day, another partial outage occurred, with a 50% traffic drop seen at 1330 local time (1030 UTC). This one was much shorter, with recovery starting approximately an hour later. Finally, a nominal disruption is visible at 0800 local time (0500 UTC) on September 13, with lower than expected traffic volumes lasting for around five hours.
Cable damage
Damage to both terrestrial and submarine cables have caused many Internet disruptions over the years. The recent alleged sabotage of the sub-sea Nord Stream natural gas pipelines has brought an increasing level of interest from European media (including Swiss and French publications) around just how important submarine cables are to the Internet, and an increasing level of concern among policymakers about the safety of these cable systems and the potential impact of damage to them. However, the three instances of cable damage reviewed below are all related to terrestrial cable.
Iran
On August 1, a reported “fiber optic cable” problem caused by a fire in a telecommunications manhole disrupted connectivity across multiple network providers, including AS31549 (Aria Shatel), AS58224 (TIC), AS43754 (Asiatech), AS44244 (Irancell), and AS197207 (MCCI). The disruption started around 1215 local time (0845 UTC) and lasted for approximately four hours. Because it impacted a number of major wireless and wireline networks, the impact was visible at a country level as well, as seen in the figure below.
Pakistan
Cable damage due to heavy rains and flooding caused several Internet disruptions in Pakistan in August. The first notable disruption occurred on August 19, starting around 0700 local time (0200 UTC) and lasted just over six and a half hours. On August 22, another significant disruption is also visible, starting at 2250 local time (1750 UTC), with a further drop at 0530 local time (0030 UTC) on the 23rd. The second more significant drop was brief, lasting only 45 minutes, after which traffic began to recover.
Haiti
Amidst protests over fuel price hikes, fiber cuts in Haiti caused Internet outages on multiple network providers. Starting at 1500 local time (1900 UTC) on September 14, traffic on AS27759 (Access Haiti) fell to zero. According to a (translated) Twitter post from the provider, they had several fiber optic cables that were cut in various areas of the country, and blocked roads made it “really difficult” for their technicians to reach the problem areas. Repairs were eventually made, with traffic starting to increase again around 0830 local time (1230 UTC) on September 15, as shown in the figure below.
Access Haiti provides AS27774 (Haiti Networking Group) with Internet connectivity (as an “upstream” provider), so the fiber cut impacted their connectivity as well, causing the outage shown in the figure below.
Technical problems
As a heading, “technical problems” can be a catch-all, referring to multiple types of issues, including misconfigurations and routing problems. However, it is also sometimes the official explanation given by a government or telecommunications company for an observed Internet disruption.
Rogers
Arguably the most significant Internet disruption so far this year took place on AS812 (Rogers), one of Canada’s largest Internet service providers. At around 0845 UTC on July 8, a near complete loss of traffic was observed, as seen in the figure below.
The figure below shows that small amounts of traffic were seen from the network over the course of the outage, but it took nearly 24 hours for traffic to return to normal levels.
A notice posted by the Rogers CEO explained that “We now believe we’ve narrowed the cause to a network system failure following a maintenance update in our core network, which caused some of our routers to malfunction early Friday morning. We disconnected the specific equipment and redirected traffic, which allowed our network and services to come back online over time as we managed traffic volumes returning to normal levels.” A Cloudflare blog post covered the Rogers outage in real-time, highlighting related BGP activity and small increases of traffic.
Chad
A four-hour near-complete Internet outage took place in Chad on August 12, occurring between 1045 and 1300 local time (0945 to 1400 UTC). Authorities in Chad said that the disruption was due to a “technical problem” on connections between Sudachad and networks in Cameroon and Sudan.
Unknown
In many cases, observed Internet disruptions are attributed to underlying causes thanks to statements by service providers, government officials, or media coverage of an associated event. However, for some disruptions, no published explanation or associated event could be found.
On August 11, a multi-hour outage impacted customers of US telecommunications provider Centurylink in states including Colorado, Iowa, Missouri, Montana, New Mexico, Utah, and Wyoming, as shown in the figure below. The outage was also visible in a traffic graph for AS209, the associated autonomous system.
Starlink
On August 30, satellite Internet provider suffered a global service disruption, lasting between 0630-1030 UTC as seen in the figure below.
Conclusion
As part of Cloudflare’s Birthday Week at the end of September, we launched the Cloudflare Radar Outage Center (CROC). The CROC is a section of our new Radar 2.0 site that archives information about observed Internet disruptions. The underlying data that powers the CROC is also available through an API, enabling interested parties to incorporate data into their own tools, sites, and applications. For regular updates on Internet disruptions as they occur and other Internet trends, follow @CloudflareRadar on Twitter.
Published reports indicate that the growing protests have resulted in at least eight deaths. Iran has a history of restricting Internet connectivity in response to protests, taking such steps in May 2022, February 2021, and November 2019. They have taken a similar approach to the current protests, including disrupting Internet connectivity, blocking social media platforms, and blocking DNS. The impact of these actions, as seen through Cloudflare’s data, are reviewed below.
On September 21, Internet disruptions started to become more widespread, with mobile networks effectively shut down nationwide. (Iran is a heavily mobile-centric country, with Cloudflare Radar reporting that 85% of requests are made from mobile devices.) Internet traffic from Iran Mobile Communications Company (AS197207) started to decline around 1530 UTC, and remained near zero until it started to recover at 2200 UTC, returning to “normal” levels by the end of the day.
Internet traffic from RighTel (AS57218) began to decline around 1630 UTC. After an outage lasting more than 12 hours, traffic returned at 0510 UTC.
Internet traffic from MTN Irancell (AS44244) began to drop just before 1700 UTC. After a 12-hour outage, traffic began recovering at 0450 UTC.
The impact of these disruptions is also visible when looking at traffic at both a regional and national level. In Tehran Province, HTTP request volume declined by approximately 70% around 1600 UTC, and continued to drop for the next several hours before seeing a slight recovery at 2200 UTC, likely related to the recovery also seen at that time on AS197207.
Similarly, Internet traffic volumes across the whole country began to decline just after 1600 UTC, falling approximately 40%. Nominal recovery at 2200 UTC is visible in this view as well, again likely from the increase in traffic from AS197207. More aggressive traffic growth is visible starting around 0500 UTC, after the remaining two mobile network providers came back online.
In analyzing DNS requests to Cloudflare’s resolver for domains associated with leading social media platforms, we observe that requests for instagram.com hostnames drop sharply at 1310 UTC, remaining lower for the rest of the day, except for a significant unexplained spike in requests between 1540 and 1610 UTC. Request volumes for hostnames associated with other leading social media platforms did not appear to be similarly affected.
In addition, it was reported that access to WhatsApp had also been blocked in Iran. This can be seen in resolution requests to Cloudflare’s resolver for whatsapp.com hostnames. The graph below shows a sharp decline in query traffic at 1910 UTC, dropping to near zero.
The Open Observatory for Network Interference (OONI), an organization that measures Internet censorship, reported in a Tweet that the cloudflare-dns.com domain name, used for DNS-over-HTTPS (DoH) and DNS-over-TLS (DoT) connections to Cloudflare’s DNS resolver, was blocked in Iran on September 20. This is clearly evident in the graph below, with resolution volume over DoH and DoT dropping to zero at 1940 UTC. The OONI tweet also noted that the 1.1.1.1 IP address “remains blocked on most networks.” The trend line for resolution over TCP or UDP (on port 53) in the graph below suggests that the IP address is not universally blocked, as there are still resolution requests reaching Cloudflare.
Interested parties can use Cloudflare Radar to monitor the impact of such government-directed Internet disruptions, and can follow @CloudflareRadar on Twitter for updates on Internet disruptions as they occur.
When August comes, for many, at least in the Northern Hemisphere, it’s time to enjoy summer and/or vacations. Here are some deep dive reading suggestions from our Cloudflare Blog for any time, weather or time of the year. There’s also some reading material on how the Internet works, and a glimpse into our history.
To create the list (that goes beyond 2022), initially we asked inside the company for favorite blog posts. Many explained how a particular blog post made them want to work at Cloudflare (including some of those who have been at the company for many years). And then, we also heard from readers by asking the question on our Twitter account: “What’s your favorite blog post from the Cloudflare Blog and why?”
2022, deep dive & trends odyssey
In early July (thinking of the July 4 US holiday) we did a sum up where some of the more recent blog posts were referenced. We’ve added a few to that list:
Eliminating CAPTCHAs on iPhones and Macs (✍️) How it works using open standards. On this topic, you can also read the detailed blog post from our research team, from 2021: Humanity wastes about 500 years per day on CAPTCHAs. It’s time to end this madness.
Optimizing TCP for high WAN throughput while preserving low latency(✍️) If you like networks, this is an in depth look of how we tune TCP parameters for low latency and high throughput.
Live-patching the Linux kernel (✍️) A detail focused blog focused on using eBPF. Code, Makefiles and more within.
Early Hints in the real world (✍️) In depth dataabout it where we show how much faster the web is with it (in a Cloudflare, Google, and Shopify partnership).
Internet Explorer, we hardly knew ye (✍️) A look at the demise of Internet Explorer and the rise of the Edge browser (after Microsoft announced the end-of-life for IE).
When the window is not fully open, your TCP stack is doing more than you think (✍️) A recent deep dive shows how Linux manages TCP receive buffers and windows, and how to tune the TCP connection for the best speed. Similar blogs are: How to stop running out of ephemeral ports and start to love long-lived connections; Everything you ever wanted to know about UDP sockets but were afraid to ask.
How Ramadan shows up in Internet trends (✍️) What happens to the Internet traffic in countries where many observe Ramadan? Depending on the country, there are clear shifts and changing patterns in Internet use, particularly before dawn and after sunset. This is all coming from our Radar platform. We can see many human trends, from a relevant outage in a country (here’s the list of Q2 2022 disruptions), to events like elections, the Eurovision, the ‘Jubilee’ celebration or the James Webb Telescope pictures revelation.
2022, research focused
Hertzbleed attack (✍️) A deep explainerwhere we compare a runner in a long distance race with how CPU frequency scaling leads to a nasty side channel affecting cryptographic algorithms. Don’t be confused with the older and impactful Heartbleed.
Unlocking QUIC’s proxying potential with MASQUE (✍️) A deep dive into QUIC transport protocol and a good up to date way to know more about it (related: HTTP usage trends).
HPKE: Standardizing public-key encryption (finally!)(✍️) Two research groups have finally published the next reusable, and future-proof generation of (hybrid) public-key encryption (PKE) for Internet protocols and applications: Hybrid Public Key Encryption (HPKE).
Sizing Up Post-Quantum Signatures (✍️) This blog (followed by this deep dive one that includes quotes from Ancient Greece) was highlighted by a reader as “life changing”. It shows the peculiar relationship between PQC (post-quantum cryptography) signatures and TLS (Transport Layer Security) size and connection quality. It’s research about how quantum computers could unlock the next age of innovation, and will break the majority of the cryptography used to protect our web browsing (more on that below). But it is also about how to make a website really fast.
If you like Twitter threads, here is a recent one from our Head of Cloudflare Research, Nick Sullivan, that explains in simple terms the way privacy on the Internet works and challenges in protecting it now and for the future.
This month we also did a full reading list/guide with our blog posts about all sorts of attacks (from DDoS to phishing, malware or ransomware) and how to stay protected in 2022.
How does it (the Internet) work
Cloudflare’s view of the Rogers Communications outage in Canada (✍️ 2022) One of the largest ISPs in Canada, Rogers Communications, had a huge outage on July 8, 2022, that lasted for more than 17 hours. From our view of the Internet, we show why we concluded it seemed caused by an internal error and how the Internet, being a network of networks, all bound together by BGP, was related to the disruption.
Understanding how Facebook disappeared from the Internet (✍️ 2021). “Facebook can’t be down, can it?”, we thought, for a second, on October 4, 2021. It was, and we had a deep dive about it, where BGP was also ‘king’.
Albert Einstein’s special theory of relativity famously dictates that no known object can travel faster than the speed of light in vacuum, which is 299,792 km/s.
Welcome to Speed Week and a Waitless Internet(✍️ 2021). There’s no object, as far as we, humans, know, that is faster than the speed of light. In this blog post you’ll get a sense of the physical limits of Internet speeds (“the speed of light is really slow”). How it all works through electrons through wires, lasers blasting data down fiber optic cables, and how building a waitless Internet is hard. We go on to explain the factors that go into building our fast global network: bandwidth, latency, reliability, caching, cryptography, DNS, preloading, cold starts, and more; and how Cloudflare zeroes in on the most powerful number there is: zero. And here’s a challenge, there are a few movies, books, board game references hidden in the post for you to find.
“People ask me to predict the future, when all I want to do is prevent it. Better yet, build it. Predicting the future is much too easy, anyway. You look at the people around you, the street you stand on, the visible air you breathe, and predict more of the same. To hell with more. I want better.” — Ray Bradbury, from Beyond 1984: The People Machines
Securing the post-quantum world (✍️ 2020). This one is more about the future of the Internet. We have many post-quantum related posts, including the recent standardization one (‘NIST’s pleasant post-quantum surprise’), but here you have an easy-to-understand explanation of a complex but crucial for the future of the Internet topic. More on those challenges and opportunities in 2022 here. The sum up is: “Quantum computers are coming that will have the ability to break the cryptographic mechanisms we rely on to secure modern communications, but there is hope”. For a quantum computing starting point, check: The Quantum Menace.
SAD DNS Explained (✍️ 2020). A 2020 attack against the Domain Name System (DNS) called SAD DNS (Side channel AttackeD DNS) leveraged features of the networking stack in modern operating systems. It’s a good excuse to explain how the DNS protocol and spoofing work, and how the industry can prevent it — another post expands on improving DNS privacy with Oblivious DoH in 1.1.1.1.
Privacy needs to be built into the Internet (✍️ 2020) A bit of history is always interesting and of value (at least for me). To launch one of our Privacy Weeks, in 2020, here’s a general view to the three different phases of the Internet. Until the 1990s the race was for connectivity. With the introduction of SSL in 1994, the Internet moved to a second phase where security became paramount (it helped create the dotcom rush and the secure, online world we live in today). Now, it’s all about the Phase 3 of the Internet we’re helping to build: always on, always secure, always private.
50 Years of The Internet. Work in Progress to a Better Internet (✍️2019) In 2019, we were celebrating 50 years from when the very first network packet took flight from the Los Angeles campus at UCLA to the Stanford Research Institute (SRI) building in Palo Alto. Those two California sites had kicked-off the world of packet networking, on the ARPANET, and of the modern Internet as we use and know it today. Here we go through some Internet history. This reminds me of this December 2021 conversation about how the Web began, 30 years earlier. Cloudflare CTO John Graham-Cumming meets Dr. Ben Segal, early Internet pioneer and CERN’s first official TCP/IP Coordinator, and Francois Fluckiger, director of the CERN School of Computing. Here, we learn how the World Wide Web became an open source project.
Welcome to Crypto Week (✍️2018). If you want to know why cryptography is so important for the Internet, here’s a good place to start. The Internet, with all of its marvels in connecting people and ideas, needs an upgrade, and one of the tools that can make things better is cryptography. There’s also a more mathematical privacy pass protocol related perspective (that is the basis of the work to eliminate CAPTCHAs).
Why TLS 1.3 isn’t in browsers yet (✍️ 2017). It’s all about: “Upgrading a security protocol in an ecosystem as complex as the Internet is difficult. You need to update clients and servers and make sure everything in between continues to work correctly. The Internet is in the middle of such an upgrade right now.” More on that from 2021 here: Handshake Encryption: Endgame (an ECH update).
How to build your own public key infrastructure (✍️2015). A way of getting to know how a major part of securing a network as geographically diverse as Cloudflare’s is protecting data as it travels between datacenters. “Great security architecture requires a defense system with multiple layers of protection”. From the same year, here’s something about digital signatures being the bedrock of trust.
A (Relatively Easy To Understand) Primer on Elliptic Curve Cryptography (✍️ 2013). Also thinking of how the Internet will continue to work for years to come, here’s a very complex topic made simple about one of the most powerful but least understood types of cryptography in wide use.
Why Google Went Offline Today and a Bit about How the Internet Works (✍️ 2012). We had several similar blog posts over the years, but this 10-year old one from Tom Paseka set the tone on how we could give a good technical explanation for something that was impacting so many. Here Internet routing, route leakages are discussed and it all ends on a relevant note: “Just another day in our ongoing efforts to #savetheweb.” Quoting from someone in the company for nine years: “This blog was the one that first got me interested in Cloudflare”.
Again, if you like Twitter threads, this recent Nick Sullivan one starts with an announcement (Cloudflare now allows experiments with post-quantum cryptography) and goes on explaining what some of the more relevant Internet acronyms mean. Example: TLS, or Transport Layer Security, it’s the ubiquitous encryption and authentication protocol that protects web requests online.
Blast from the past (some history)
A few also recently referenced blog posts from the past, some more technical than others.
Introducing DNS Resolver, 1.1.1.1 (not a joke) (✍️ 2018). The first consumer-focused service Cloudflare has ever released, our DNS resolver, 1.1.1.1 — a recursive DNS service — was launched on April 1, 2018, and this is the technical explanation. With this offering, we started fixing the foundation of the Internet by building a faster, more secure and privacy-centric public DNS resolver. And, just this month, we’ve added privacy proofed features (a geolocation accuracy “pizza test” included).
Cloudflare goes InterPlanetary – Introducing Cloudflare’s IPFS Gateway (✍️ 2018). We introduced Cloudflare’s IPFS Gateway, an easy way to access content from the InterPlanetary File System (IPFS). This served as the platform for many new, at the time, highly-reliable and security-enhanced web applications. It was the first product to be released as part of our Distributed Web Gateway project and is a different perspective from the traditional web. IPFS is a peer-to-peer file system composed of thousands of computers around the world, each of which stores files on behalf of the network. And, yes, it can be used as a method for a possible Mars (Moon, etc.) Internet in the future. About that, the same goes for code that will need to be running on Mars, something we mention about Workers here.
LavaRand in Production: The Nitty-Gritty Technical Details (✍️ 2017). Our lava lamps wall in the San Francisco office is much more than a wall of lava lamps (the YouTuber Tom Scott did a 2017 video about it) and in this blog we explain the in-depth look at the technical details (there’s a less technical one on how randomness in cryptography works).
Introducing Cloudflare Workers (✍️ 2017). There are several announcements each year, but this blog (associated with the explanation, Code Everywhere: Why We Built Cloudflare Workers) was referenced this week by some as one of those with a clear impact. It was when we started making Cloudflare’s network programmable. In 2018, Workers was available to everyone and, in 2019, we registered the trademark for The Network is the Computer®, to encompass how Cloudflare is using its network to pave the way for the future of the Internet.
What’s the story behind the names of CloudFlare’s name servers? (✍️ 2013) Another one referenced this week is the answer to the question we got often back in 2013: what the names of our nameservers mean. Here’s the story — there’s even an Apple co-founder Steve Wozniak tribute.
The James Webb Telescope reveals emerging stellar nurseries and individual stars in the Carina Nebula that were previously obscured. Credits: NASA, ESA, CSA, and STScI. Full image here.
“Somewhere, something incredible is waiting to be known.” — Carl Sagan
In the past few years, space technology and travel have been trending with increased attention and endeavors (including private ones). In our 2021 Year in Review we showed how NASA and SpaceX flew higher, at least in terms of interest on the Internet.
This week, NASA in collaboration with the European Space Agency (ESA) and the Canadian Space Agency (CSA), released the first images from the James Webb Telescope (JWST) which conducts infrared astronomy to “reveal the unseen universe”.
Webb’s First Deep Field is the first operational image taken by the James Webb Space Telescope, depicting a galaxy cluster with a distance of 5.12 billion light-years from Earth. Revealed to the public on 11 July 2022. Credits: NASA, ESA, CSA, and STScI. Full image here.
So, let’s dig into something we really like here at Cloudflare, checking how real life and human interest has an impact on the Internet. In terms of general Internet traffic in the US, Radar shows us that there was an increase both on July 11 and July 12, compared to the previous week (bear in mind that July 4, the previous Monday, was the Independence Day holiday in the US).
Next, we look at DNS request trends to get a sense of traffic to Internet properties (and using from this point on EST time in all the charts). Let’s start with the cornucopia of NASA, ESA and other websites (there are many, some dedicated just to the James Webb Telescope findings).
There are two clear spikes in the next chart. The first was around the time the first galaxy cluster infrared image was announced by Joe Biden, on Monday, July 11, 2022 (at 17:00), with traffic rising 13x higher than in the previous week. There was also a 5x spike at 01:00 EST that evening. The second spike was higher and longer and happened during Tuesday, July 12, 2022, when more images were revealed. Tuesday’s peak was at 10:00, with traffic being 19x higher than in the previous week — traffic was higher than 10x between 09:00 and 13:00.
The first image was presented by US president at around 17:00 on July 11. DNS traffic was 1.5x higher to White House-related websites than any time in the preceding month.
Conclusion: space, the final frontier
As we saw in 2021, space projects and announcements continue to have a clear impact on the Internet, in this case in our DNS request view of Internet traffic. So far, what the James Webb Telescope images are showing us is a glimpse of a never-before-seen picture of parts of the universe (there’s no lack of excitement in Cloudflare’s internal chat groups).
You can keep an eye on these and other trends using Cloudflare Radar and follow @CloudflareRadar on Twitter — recently we covered extensively Canada’s Internet outage.
Cloudflare operates in more than 270 cities in over 100 countries, where we interconnect with over 10,000 network providers in order to provide a broad range of services to millions of customers. The breadth of both our network and our customer base provides us with a unique perspective on Internet resilience, enabling us to observe the impact of Internet disruptions. In many cases, these disruptions can be attributed to a physical event, while in other cases, they are due to an intentional government-directed shutdown. In this post, we review selected Internet disruptions observed by Cloudflare during the second quarter of 2022, supported by traffic graphs from Cloudflare Radar and other internal Cloudflare tools, and grouped by associated cause or common geography.
Optic outages
This quarter, we saw the usual complement of damage to both terrestrial and submarine fiber-optic cables, including one that impacted multiple countries across thousands of miles, and another more localized outage that was due to an errant rodent.
Comcast
On April 25, Comcast subscribers in nearly 20 southwestern Florida cities experienced an outage, reportedly due to a fiber cut. The traffic impact of this cut is clearly visible in the graph below, with Cloudflare traffic for these cities dropping to zero between 1915–2050 UTC (1515–1850 local time).
Not only did the fiber cut force a significant number of Comcast subscribers offline, but it also impacted the types of traffic observed across Comcast as a whole. The graphs below illustrate the mix of mobile vs desktop clients, as well as IPv4 vs. IPv6 request volume across AS7922, Comcast’s primary autonomous system. During the brief disruption period, the percentage of Comcast traffic from mobile devices increased, while desktop devices dropped, and the percentage of IPv4 traffic dropped, with a corresponding increase in IPv6 traffic share.
South Africa
On the morning of May 17, Telkom SA, a South African telecommunications provider, tweeted an “important notice” to customers, noting that “Damage to a Fibre cable was detected on the Telkom network around 8:00am on Tuesday, 17 May 2022.” and outlining the impacted services and geographies. The graphs below show the impact to Cloudflare traffic from the Telkom autonomous system in three South African provinces. The top graph shows the impact to traffic in Gauteng, while the lower graph shows the impact in Limpopo and North West. Across all three, traffic falls at 0600 UTC (0800 local time), recovering around 1300 UTC (1500 local time). Telkom SA did not provide any additional information on where the fiber cut occurred or what caused it.
Venezuela
Although unconfirmed, a fiber cut was suspected to be the cause of an Internet disruption experienced by CANTV subscribers in Venezuela on May 19, the latest of several such incidents affecting that provider. Although the fiber cut reportedly impacted subscribers in multiple states, the most significant impact was measured in Falcón, as shown in the graph below. In this state, traffic dropped precipitously at 1800 UTC (1400 local time), finally recovering approximately 24 hours later.
AAE-1 & SMW-5
Just after 1200 UTC on Tuesday, June 7, the Africa-Asia-Europe-1 (AAE-1) and SEA-ME-WE-5 (SMW-5) submarine cables suffered cable cuts, impacting Internet connectivity for millions of Internet users across multiple countries in the Middle East and Africa, as well as thousands of miles away in Asia. Although specific details are sparse, the cable damage reportedly occurred in Egypt – both of the impacted cables land in Abu Talat and Zafarana, which also serve as landing points for a number of other submarine cables.
Finally, on June 13, a beaver was responsible for an outage that impacted Internet users in British Columbia, Canada. According to a published report, a beaver gnawed its way through a tree, causing it to fall on both power lines and a Telus fiber optic cable. The damage to the fiber optic cable affected connectivity customers in over a dozen communities across British Columbia, including those using CityWest (AS18988), a utility company that uses the Telus cable. In the graph below, the impact of the damage to the fiber optic cable is clearly visible, with no traffic to Cloudflare from CityWest subscribers in British Columbia between 1800 UTC on June 7 until 0310 UTC on June 8 (1100–2010 local time).
School’s in, Internet’s out
Nationwide Internet shutdowns have, unfortunately, become a popular approach taken by authoritarian regimes over the past half dozen years to prevent cheating on secondary school exams. It is not clear that this heavy-handed tactic is actually effective in preventing cheating, but the associated damage to the national economies has been estimated to be in the tens to hundreds of millions of US dollars, depending on the duration and frequency of the shutdowns.
This year, governments in Sudan and Syria implemented a number of multi-hour shutdowns in late May into June, while Algeria’s government appears to have resorted to more targeted content blocking. Additional details on these Internet disruptions can be found in the recent “Exam time means Internet disruptions in Syria, Sudan and Algeria” blog post.
Starting on May 30, Syria implemented the first of four nationwide Internet shutdowns, the last of which occurred on June 12, as seen in the graph below. Interestingly, we have observed that these shutdowns tend to be “asymmetric” in nature — that is, inbound traffic (into the country) is disabled, but egress traffic (from the country) remains. One effect of this is visible as spikes in the DNS graph below. During three of the four shutdowns, requests to Cloudflare’s 1.1.1.1 resolver from clients in Syria increased because DNS queries were able to exit the country, but responses couldn’t return, leading to retry floods.
In Sudan, daily shutdowns were implemented 0530-0830 UTC (0730–1030 local time) between June 11 and June 22, except for June 17. (It isn’t clear why that date was skipped.) The graph below shows that these shutdowns were nationwide, but not complete, as traffic from the country did not drop to zero.
In Algeria, exams took place June 12 through June 16. In the past, the country has implemented nationwide shutdowns, but after recognizing the enormous cost to the economy, the government has apparently chosen an alternate tactic this year. The graph below shows nominal drops in country-level traffic during the two times each day that the exams took place—0730–1000 UTC (0830–1100 am local time) and 1330–1600 UTC (1430–1700 local time). These drops in traffic are likely more indicative of a content-blocking approach, instead of a broad Internet shutdown.
On June 27, the Kurdistan Regional Government in Iraq began to implement twice-weekly (Mondays and Thursday) multi-hour regional Internet shutdowns, expected to last for a four-week period. The shutdowns are intended to prevent cheating on high school final exams, according to a published report, and are scheduled for 0630–1030 am local time (0330–0730 UTC). The graph below shows the impact to traffic from three governorates in Kurdistan, with traffic dropping to near zero in all three areas during the duration of the shutdowns.
Government-guided
In addition to shutting down the Internet to prevent cheating on exams, governments have also been known to use shutdowns as a tool to limit or control communication around elections, rallies, protests, etc. During the second quarter, we observed several such shutdowns of note.
A month and a half later, on May 25, an Internet disruption was observed in Pakistan amid protests led by the country’s former Prime Minister. The disruption lasted only two hours, and was limited in scope — it was not a nationwide shutdown. (Telecom providers claimed that it was due to problems with a web filtering system.) At a national level, the impact of the disruption is visible as a slight drop in traffic.
In the cities of Lahore and Karachi, the disruption is visible a little more clearly, as is the rapid recovery in traffic.
The impact of the disruption is most evident at a network level, as seen in the graphs below. Cyber Internet Services (AS9541) saw a modest drop in traffic, while Mobilink (AS45669) experienced a near complete outage.
Closing out the quarter, a communications blackout, including an Internet shutdown, was imposed in Sudan on June 30 as protestors staged rallies against the country’s military leadership. This shutdown follows similar disruptions seen in October 2021 after the military toppled the transitional government and attempted to limit protests, as well the shutdowns seen earlier in June as the government attempted to prevent cheating on exams. The graphs below show that the shutdown started at 0600 UTC (0800 local time) and initially ended almost 12 hours later at 1740 UTC (1940 local time). Connectivity returned for approximately three hours, with traffic again dropping to near-zero levels again around 2040 UTC (2240 local time). This second outage remained active at the end of the day.
In addition to fiber/cable cuts, as discussed above, problems with other infrastructure, whether due to fires, electrical issues, or maintenance, can also disrupt Internet services.
Around 2030 local time on April 6 (0030 UTC on April 7), a fire erupted at the Costa Sur generation plant, one of the largest power plants in Puerto Rico, resulting in a widespread power outage across the island territory. This island-wide outage caused a significant interruption to Internet services, clearly visible in Cloudflare traffic data. The graph below shows that as the power failed, traffic from Puerto Rico immediately fell by more than half. The regular diurnal pattern remained in place, albeit at lower levels, over the next three days, with traffic returning to “normal levels” three days later. By April 10, Luma Energy reported that it had restored electrical power to 99.7% of its 1.5M customers.
The impact of the Internet service disruption is also fairly significant when viewed at a network level. The graphs below show traffic for Datacom Caribe/Claro (AS10396) and Liberty Cablevision of Puerto Rico (AS14638). At Datacom Caribe/Claro, traffic immediately fell by more than half, while Liberty Cablevision traffic declined approximately 85%.
On the evening of May 3, Swiss telecom provider Swisscom tweeted that there had been an interruption to Internet service following maintenance work. A published report noted that the interruption occurred between 2223–2253 local time (2023–2053 UTC), and the graph below shows a complete loss of traffic, but quick recovery, during that 30-minute window. Beyond citing maintenance work, Swisscom did not provide any additional details about the Internet disruption.
On May 6, the government disrupted Internet connectivity in Khuzestan province, reportedly in response to mass protests around shortages of bread and water. It was reported that mobile data had been cut off locally, and that fixed connectivity speeds were significantly reduced. To this end, we observed a drop in traffic for Irancell (AS44244) (a mobile network provider) in Khuzestan starting around 1000 UTC as seen in the graph below.
A similar disruption affecting Irancell, occurring amid reports of ongoing protests in the country, was observed on May 12, with lower peak traffic during the day, and a further drop around 1800 UTC.
Mobile provider Mobinnet (AS50810) experienced a multi-hour Internet disruption on May 14, lasting from 1230–1530 UTC (1700–2000 local time). According to a tweet from Mobinnet, the disruption was due to a “widespread cyber attack of foreign origin”.
Ukraine
Now more than four months into the war in Ukraine, the Internet continues to be an active battlefield, with ongoing Internet outages in multiple cities and across multiple networks. However, we want to highlight here two similar events observed during the second quarter.
The Russian-occupied city of Kherson experienced a near-complete Internet outage between 1600 UTC (1900 local time) on April 30 and 0430 UTC (0730 local time) on May 4. According to social media posts from Ukraine’s vice Prime-Minister Mykhailo Fedorov and the State Service of Special Communications and Information Protection, the outage was caused by “interruptions of fiber-optic trunk lines and disconnection from the power supply of equipment of operators in the region”. The graph below shows effectively no traffic for Kherson for approximately 24 hours after the disruption began, followed by a nominal amount of traffic for the next several days.
Around the time that the nominal amount of traffic returned, we also observed a shift in routing for an IPv4 prefix announced by AS47598 (Khersontelecom). As shown in the table below, prior to the outage, it reached the Internet through several other Ukrainian network providers, including AS12883, AS3326, and AS35213. However, as traffic returned, its routing path now showed a Russian network, AS201776 (Miranda) as the upstream provider. The path through Miranda also includes AS12389 (Rostelecom), which bills itself as “the largest digital services provider in Russia”.
Peer AS
Last Update
AS Path
AS1299 (TWELVE99 Arelion, fka Telia Carrier)
5/1/2022 16:02:26
1299 12389 201776 47598
AS6777 (AMS-IX-RS)
4/28/2022 11:23:33
12883 47598
As the disruption ended on May 4, we observed updates to Khersontelecom’s routing path that enabled it to return to reaching the global Internet through non-Russian upstream providers.
A month later, on May 30, we again observed a significant Internet disruption in Kherson starting at 1435 UTC (1735 local time). And once again, we observed updated routing for Khersontelecom, as it shifted from Ukrainian upstream providers to Russian ones. As of the end of June, the Internet disruption in Kherson and the routing through Russian upstream providers both remain firmly in place, although the loss of traffic has not been nearly as significant as the April/May disruption.
Peer AS
Last Update
AS Path
AS4775 (Globe Telecoms)
5/30/2022 13:56:22
4775 1273 12389 201776 47598
AS9002 (RETN-AS)
5/30/2022 09:58:16
9002 3326 47598
Conclusion
This post is by no means an exhaustive review of the Internet outages, shutdowns, and disruptions that have occurred throughout the second quarter. Some were extremely brief or limited in scope, while others were observed but had no known or publicly conjectured underlying cause. Having said that, it is important to bring increased visibility to these events so that the community can share information on what is happening, why it happened, and what the impact was — human, financial, or otherwise.
Follow @CloudflareRadar on Twitter for updates on Internet disruptions as they occur, and find up-to-date information on Internet trends using Cloudflare Radar.
Just after 1200 UTC on Tuesday, June 7, the Africa-Asia-Europe-1 (AAE-1) and SEA-ME-WE-5 (SMW-5) submarine cables suffered cable cuts. The damage reportedly occurred in Egypt, and impacted Internet connectivity for millions of Internet users across multiple countries in the Middle East and Africa, as well as thousands of miles away in Asia. In addition, Google Cloud Platform and OVHcloud reported connectivity issues due to these cable cuts.
The impact
Data from Cloudflare Radar showed significant drops in traffic across the impacted countries as the cable damage occurred, recovering approximately four hours later as the cables were repaired.
It appears that Saudi Arabia may have also been affected by the cable cut(s), but the impact was much less significant, and traffic recovered almost immediately.
In the graphs above, we show that Ethiopia was one of the impacted countries. However, as it is landlocked, there are obviously no submarine cable landing points within the country. The Afterfibre map from the Network Startup Resource Center (NSRC) shows that that fiber in Ethiopia connects to fiber in Somalia, which experienced an impact. In addition, Ethio Telecom also routes traffic through network providers in Kenya and Djibouti. Djibouti Telecom, one of these providers, in turn peers with larger global providers like Telecom Italia (TI) Sparkle, which is one of the owners of SMW5.
In addition to impacting end-user connectivity in the impacted countries, the cable cuts also reportedly impacted cloud providers including Google Cloud Platform and OVHcloud. In their incident report, Google Cloud noted“Google Cloud Networking experienced increased packet loss for egress traffic from Google to the Middle East, and elevated latency between our Europe and Asia Regions as a result, for 3 hours and 12 minutes, affecting several related products including Cloud NAT, Hybrid Connectivity and Virtual Private Cloud (VPC). From preliminary analysis, the root cause of the issue was a capacity shortage following two simultaneous fiber-cuts.” OVHcloud noted that “Backbone links between Marseille and Singapore are currently down” and that “Upon further investigation, our Network OPERATION teams advised that the fault was related to our partner fiber cuts.”
When concurrent disruptions like those highlighted above are observed across multiple countries in one or more geographic areas, the culprit is often a submarine cable that connects the impacted countries to the global Internet. The impact of such cable cuts will vary across countries, largely due to the levels of redundancy that they may have in place. That is, are these countries solely dependent on an impacted cable for global Internet connectivity, or do they have redundant connectivity across other submarine or terrestrial cables? Additionally, the location of the country relative to the cable cut will also impact how connectivity in a given country may be affected. Due to these factors, we didn’t see a similar impact across all of the countries connected to the AAE-1 and SMW5 cables.
What happened?
Specific details are sparse, but as noted above, the cable damage reportedly occurred in Egypt – both of the impacted cables land in Abu Talat and Zafarana, which also serve as landing points for a number of other submarine cables. According to a 2021 article in Middle East Eye, “There are 10 cable landing stations on Egypt’s Mediterranean and Red Sea coastlines, and some 15 terrestrial crossing routes across the country.” Alan Mauldin, research director at telecommunications research firm TeleGeography, notes that routing cables between Europe and the Middle East to India is done via Egypt, because there is the least amount of land to cross. This places the country in a unique position as a choke point for international Internet connectivity, with damage to infrastructure locally impacting the ability of millions of people thousands of miles away to access websites and applications, as well as impacting connectivity for leading cloud platform providers.
As the graphs above show, traffic returned to normal levels within a matter of hours, with tweets from telecommunications authorities in Pakistan and Oman also noting that Internet services had returned to their countries. Such rapid repairs to submarine cable infrastructure are unusual, as repair timeframes are often measured in days or weeks, as we saw with the cables damaged by the volcanic eruption in Tonga earlier this year. This is due to the need to locate the fault, send repair ships to the appropriate location, and then retrieve the cable and repair it. Given this, the damage to these cables likely occurred on land, after they came ashore.
Keeping content available
By deploying in data centers close to end users, Cloudflare helps to keep traffic local, which can mitigate the impact of catastrophic events like cable cuts, while improving performance, availability, and security. Being able to deliver content from our network generally requires first retrieving it from an origin, and with end users around the world, Cloudflare needs to be able to reach origins from multiple points around the world at the same time. However, a customer origin may be reachable from some networks but not from others, due to a cable cut or some other network disruption.
In September 2021, Cloudflare announced Orpheus, which provides reachability benefits for customers by finding unreachable paths on the Internet in real time, and guiding traffic away from those paths, ensuring that Cloudflare will always be able to reach an origin no matter what is happening on the Internet.
Conclusion
Because the Internet is an interconnected network of networks, an event such as a cable cut can have a ripple effect across the whole Internet, impacting connectivity for users thousands of miles away from where the incident occurred. Users may be unable to access content or applications, or the content/applications may suffer from reduced performance. Additionally, the providers of those applications may experience problems within their own network infrastructure due to such an event.
For network providers, the impact of such events can be mitigated through the use of multiple upstream providers/peers, and diverse physical paths for critical infrastructure like submarine cables. Cloudflare’s globally deployed network can help content and application providers ensure that their content and applications remain available and performant in the face of network disruptions.
“I declare before you all that my whole life, whether it be long or short, shall be devoted to your service and the service of our great imperial family to which we all belong.” — Queen Elizabeth II birthday speech, April 21, 1947
When Elizabeth II’s reign started, on February 6, 1952 (the coronation was on June 2, 1953), the Turing machine had already been proposed (1936), and with that the basis for computer science. ARPANET, which became the technical foundation of the Internet, was still a dream that came to fruition in the late 60s — the World Wide Web is from 1989 and in 2014 we celebrated its Silver Jubilee. So, with that in mind, let’s answer the question: did the 2022 celebrations of the first British monarch with a 70th anniversary on the throne have an impact on the UK’s Internet traffic?
First, some details about the Platinum Jubilee. There was a four-day bank holiday (June 2-5) in the UK for the celebration that included parades and pageants, and several ceremonies. There was a Big Jubilee Lunch in many communities on Sunday, June 5, and more than 16,000 street parties (pubs and bars were also allowed to stay open for extra two hours). In events like these, not only there’s a lot to do outside, but also to see on the television and that impacts the Internet — we saw it during the Eurovision 2022 final.
Looking at Cloudflare Radar’s data from the UK, we can see that this past weekend clearly had less Internet traffic compared to recent weekends, so people were less online during the daytime, when the Jubilee was being celebrated. Here’s the chart with the previous four weekends of the UK’s Internet traffic:
That lower traffic trend is most clear on Saturday, June 4, at 20:00 local time, when traffic was 23% lower than on the previous Saturday, and on Sunday, June 5, at 15:00, when traffic was 25% lower than on the previous Sunday. The weather was actually sunnier on the previous weekend, May 28-29, but people did seem to have many reasons (related to the Jubilee) to go outside or at least be less online.
Looking at the full picture of when the four-day bank holiday started, Thursday, June 2, 2022, until Sunday, June 5, there’s a clear trend of less traffic through all of those days, which is not unusual, at least for Thursday and Friday, considering that holidays usually have traffic more similar to weekends than weekdays.
No surprise, when there’s a holiday, or it’s the weekend people tend to use their mobile devices more to access the Internet, and that was clearly what we saw in the UK since Thursday, June 2, mobile traffic (green line) was always prevalent compared to desktop traffic (blue line) since then.
On the weekdays before June 2, we can see that Internet traffic by mobile devices only stands out after 18:00 (before that, with people working, desktop took the lead).
From Canada to New Zealand
There are several other commonwealth countries that also had relevant events to celebrate since June 2 and through the past weekend for the Queen’s Platinum Jubilee. Canada is one with several activities throughout the country, including free admission to museums and historic sites, park parties and concerts.
Related to the Jubilee celebrations or not, Internet traffic in Canada was lower this past weekend than in the previous one. Saturday, June 4, at 22:00 in Toronto traffic was 13% lower than in the previous period, and throughout the day that was also the case. On Sunday, traffic was only lower during daytime, especially around 12:00 in Toronto, when it was 15% lower than in the previous Sunday. That was the time of the Jubilee Pageant, in central London (in the next charts, times are in UTC).
Something similar can be seen in terms of lower traffic this weekend in Australia:
And also New Zealand:
Royal family and news websites (Boris Johnson’s no confidence vote included)
Here we’re looking at DNS request trends to get a sense of traffic to Internet properties. First, we can see that websites concerning the UK Royal family and the Jubilee were clearly seeing more traffic after Wednesday, June 1 (the day before the four-day bank holiday). The three biggest spikes were: Wednesday evening, when traffic was 777% higher at 22:00 (compared to the previous week); the next morning (08:00), when it rose 1060%; and on Saturday evening (21:00) it got 1043% more traffic.
UK-based news websites (TV broadcasters and newspapers) also covered Queen Elizabeth II’s Platinum Jubilee extensively over the extended weekend. And there are three big highlights/spikes from the past few days regarding media outlets’ websites, but only two seem to be related to the Jubilee or the bank holidays.
We can see that the biggest spike in traffic (75% more than the previous period) was the night before the Jubilee four-day bank holiday started. Then, Sunday afternoon when the London Jubilee Pageant was ending, there was another spike (25% higher).
But the day with more sustained traffic from the last 14 days was actually Monday, June 6. That was the day that Boris Johnson, the British prime minister, won a no confidence vote in the UK’s Parliament. There was a clear first spike at around 08:00, when the news that a vote of no confidence would take place on that day broke, and a much bigger one at 21:00 (68% higher), when the final result of the vote was announced.
Social media and messaging trends
Social media trends show a similar pattern to Internet traffic in general, but it’s interesting to see that Thursday, June 2, the first day of the extended weekend, was the one of the full 14 days we’re looking at with less DNS traffic to those platforms.
Messaging, on the other hand, had consistently much lower traffic during the four-day bank holiday, even compared to the previous weekend. Saturday, June 4, was the day with less messaging DNS traffic, at least of the two weeks period we’re observing. At 11:00 Saturday, traffic was 18% lower than in the previous period, the same level of lower DNS requests at 15:00 and through most of the day.
Conclusion: celebrations and events ‘move’ the Internet
When there’s a big country-wide celebration going on, especially one that has a lot of outdoor events and activities, Internet patterns do change. That happens, in this case, for a monarch whose reign began in 1952, when there wasn’t any Internet (it took more than 40 years for the network of networks that can connect us all on Earth to reach its more popular global form).
There’s only one song contest that is more than six decades old and not only presents many new songs (ABBA, Celine Dion, Julio Iglesias and Domenico Modugno shined there), but also has a global stage that involves 40 countries — performers represent those countries and the public votes. The 66th edition of the Eurovision Song Contest, in Turin, Italy, had two semi-finals (May 10 and 12) and a final (May 14), all of them with highlights, including Ukraine’s victory. The Internet was impacted in more than one way, from whole countries to the fan and official broadcasters sites, but also video platforms.
On our Eurovision dedicated page, it was possible to see the level of Internet traffic in the 40 participant countries, and we tweeted some highlights during the final.
— Cloudflare Radar (@CloudflareRadar) May 14, 2022
First, some technicalities. The baseline for the values we use in the following charts is the average of the preceding week, except for the more granular minute by minute view that uses the traffic average of May 9 and 10 as baseline. To estimate the traffic to the several types of websites from the 40 participating countries, we use DNS name resolution data. In this blog post, we’re using CEST, Central European Summer Time.
It’s not often that an entertainment event has an impact on a country’s Internet. So, was there an impact on Eurovision nights?
Let’s start with aggregate Internet traffic to the 40 participant countries (Australia included). In the first May 10 semi-final, there seems to be a slight decrease in traffic during the contest — it makes sense if we think that most people were probably watching the broadcast on national TV (and not on YouTube, that was also transmitting live the event). Traffic was lower than in the previous period between 21:00 and 23:00 (the event was between 21:00 to 23:14), but it was back to normal at 23:00.
For the second semi-finalthat trend is less clear. But the May 14 final (that lasted from 21:00 CEST to 01:10) told a different story. Traffic was 6% lower than on the previous Saturday after 21:00, mostly around 22:00, and after 23:15 it was actually higher (between 4% and 6%) than before and continued that way until 02:00.
What happened at that 23:15 time in Eurovision? The last of the 25 songs at the contest was Estonia’s “Hope”, by Stefan, and it ended at 23:14 (also in this blog post we will also see how 23:16 was the highest spike in terms of DNS traffic to fan websites during the final). This is the Internet traffic in the participating countries on May 14 chart:
There were several countries that showed similar impact in terms of traffic change during at least the final. France, UK, Germany, Iceland, Greece and Switzerland are examples.
Eurovision & the UK
The UK was one of the countries where there seems to be more impact during the time of the grand final — last year, according to the ratings, eight million were watching the BBC transmission with the commentator Graham Norton. Traffic started to drop to lower levels than usual at 20:30 (a few minutes before the final) and was 20% lower at 22:00, starting to go closer to normal levels after 23:00, when the set of 25 finalists’ songs came to an end.
Here’s the UK’s Internet traffic trend during the Eurovision May 14 final:
Fan sites: what a difference a winner makes
The most obvious thing to check in terms of impact are the fan websites. Eurovision has many, some general (there’s the OGAE, General Organisation of Eurovision Fans), others more local. And DNS traffic to them was clearly impacted.
The first semi-final, on May 10, had 33x more traffic than in the average of the previous week, with a clear 22:00 CEST spike. But the second semi-final, May 12, topped that, with 42x more traffic at the same time. The final, with the 25 finalists, clearly surpassed that and at 22:00 traffic was already 70x. But because the final was much longer (in the semi-finals it was around 23:00 that the finalists were announced), the peak was reached at 23:00, with 86x more traffic than usual.
“We have a winner. The winner of the Eurovision Song Contest 2022 is… Ukraine!”. — Alessandro Cattelan, Laura Pausini and Mika at 01:01 CEST, May 15, 2022.
Saturday’s final was more than four hours long (the semi-finals took little over two hours), and it finished a few minutes after 01:00 CEST. DNS traffic to fan websites dropped from 86x to 45x at midnight, but it went up again to 49x more traffic when it was already 01:00 CEST in most of Europe and Ukraine was announced the winner of Eurovision 2022. This next chart shows Saturday’s May 14 final traffic change to fan sites:
We can also clearly see that on Sunday morning, at 09:00, there was a 20x peak to fan sites, and also at 11:00 (17%).
Now, let’s go deeper by looking at a minute by minute view (the previous charts show hourly data) of DNS traffic to fan sites. In the two semi-finals it’s easy to see that the moment the finalists were announced, and the event was ending, around 23:12, was when traffic was higher. Here’s what the May 10 (yellow) and May 12 (green) two semi-finals fan sites growth looked like:
We can also spot some highlights in fan sites during the semi-final besides the finalists’ announcement, which we saw were definitely the most popular moments of the two nights. First, on May 10 there was more traffic before the event (21:00) than on May 12, so people seem to have greater expectations of the first Eurovision 2022 event of the week. In terms of spikes (before the winners’ announcements), we created a list of moments in time with more interest to the fan websites and connected them to the events that were taking place at that time in Eurovision (ordered by impact):
First semi-final, May 10 #1. 22:47 Sum up of all the songs. #2. 22:25 Norway’s song (Subwoolfer, “Give That Wolf a Banana”). #3. 21:42 Bulgaria’s song (Intelligent Music Project, “Intention”). #4. 21:51 Moldova’s song (Zdob și Zdub and Advahov Brothers, “Trenulețul”). #5. 22:20 Greece’s song (Amanda Georgiadi Tenfjord, “Die Together”).
Second semi-final, May 12 #1. 21:22 Between Serbia (Konstrakta, “In corpore sano”) and Azerbaijan (Nadir Rustamli, “Fade to Black”). #2. 22:48 Voting period starts. #3. 22:30 Czech Republic’s song (We Are Domi, “Lights Off”). #4. 22:38 Laura Pausini & Mika performing (“Fragile” Sting cover song). #5. 22:21 Belgium’s song (Jérémie Makiese, “Miss You”).
How about the May 14 final? This chart (followed by a ranking list) shows DNS traffic spikes in fan sites on Saturday’s final:
Final, May 14 #1. 23:11 Between Serbia (Konstrakta, “In corpore sano”) and Estonia (Stefan, “Hope”). #2. 23:33 Sum up of all the songs. #3. 23:57 Voting ended. #4. 23:19 Sum up of all the songs. #5. 23:01 Ending of the United Kingdom’s song (Sam Ryder, “Space Man”).
— BBC Eurovision🇬🇧 | 👩🚀#teamSPACEMAN (@bbceurovision) May 15, 2022
(UK’s performer and representative Sam Ryder with Graham Norton, the BBC commentator of Eurovision since 2009 — the BBC broadcasts the event since 1956.)
The broadcasters show
How about official national broadcaster websites? Around 23:00 CEST traffic to the aggregate of 40 broadcasters was generally higher on the semi-finals and final nights (represented in grey on the next chart). That’s more clear on the final at 23:00, when DNS traffic was 18% higher than in the previous Saturday (and 50% compared to the previous day). During the semi-finals the difference is more subtle, but at 23:00 traffic in both May 10 and 12 traffic was ~6% higher than in previous days.
When we focus on the minute by minute view also on the broadcaster sites but on the three Eurovision evenings, the highest growth in traffic is also during the final (like we saw in the fan sites), mainly after 23:00, which seems normal, considering that the final was much longer in time than the semi-finals that ended around that time.
During the final (represented in pink in the previous chart), there were some clear spikes. We’ve added them to a ranking that also shows what was happening in the event at that time.
Broadcaster site spikes. Final, May 14 #1. 21:52 Best moments clip of the two semi-finals #2. 21:00 Contest starts #3. 00:24 Sam Ryder, the UK representative (with the song “Space Man”) being interviewed after reaching the #1 in the voting process. #4. 01:09 Ukraine’s (Kalush Orchestra, “Stefania”) performance as the winner #5. 01:02 Ukraine was announced as the Eurovision 2022 winner.
Video platforms: the post-final growth
Eurovision uses video platforms like YouTube and TikTok to share all the songs, clips of the events and performers and there was also a live transmission on YouTube of the three nights. Given that, we looked at DNS traffic to the video platforms in an aggregate for the 40 participating countries. So, was there an impact to this well known and high performing social and video platforms? The short answer is: yes.
The final was also the most evident example, especially after 23:15, when all the 25 finalists songs already performed and the event had two more hours of non-participant performances, video clips that summarize the songs and the voting process — the famous moment in Europe to find out who will get from each of the 40 participant countries the maximum of 12 points.
In this comparison between the semi-finals and final day, we can see how on May 10, the day of the first semi-final, video platform traffic had more growth before the contest started, which is not that surprising given that it was the first Eurovision 2022 event and there was perhaps curiosity to check who were the other contestants (by then Eurovision had videos of them all on YouTube).
But the May 14 final shows more DNS traffic growth than the other Eurovision days after 23:16 (as we saw before, that was the time when all the finalists’ songs had already been performed). The difference in traffic compared to the semi-finals was higher at 1:11 CEST. That was the moment that the final came to an end on Saturday night, and at that time it reached 31% more traffic to video platforms than on May 10, and 38% than on May 12.
Australia’s impact (with an eight hours difference)
Australia was one of the 40 participants, and it had a major time difference (there’s an eight-hour difference to CEST). Continuing to look at video platforms, DNS traffic in Australia was 22% higher at 23:00 CEST (07:00 local time) than it was in the previous Saturday and continued high around 17% of increase a few hours after. Before the 23:00 peak, traffic was 20% higher at 22:00 and 17% at 21:00, when the event was beginning.
The winners & social media
Social media in general in the 40 participating countries wasn’t as impacted, but there was a 01:00 CEST spike during the final at around the time the decision to choose the winner was between Ukraine and the UK — at 01:01 Ukraine was announced the winner of Eurovision 2022.
We can also see an impact on social media in Ukraine, when Kalush Orchestra’s “Stefania” song was announced the winner at Saturday’s, May 14, final (it was already after midnight, May 15). The usual traffic slowing down night trend that is seen in other days was clearly interrupted after 01:02 CEST (02:02 local time in Ukraine).
Conclusion: the Eurovision effect
When an event like Eurovision happens, there are different patterns on the Internet in the participating countries, usually all in Europe (although this year Australia was also there). Fan and broadcaster websites have specific impact because of the event, but in such a multimedia event, there are also some changes in video platforms’ DNS traffic.
And that trend goes as far as the Internet traffic of the participating countries at a more general level, something that seems to indicate that people, at least for some parts of Eurovision and in some countries, were more focused on their national TV broadcast.
What happens to the Internet traffic in countries where many observe Ramadan? Depending on the country, there are clear shifts and changing patterns in Internet use, particularly before dawn and after sunset.
This year, Ramadan started on April 2, and it continued until May 1, 2022, (dates vary and are dependent on the appearance of the crescent moon). For Muslims, it is a period of introspection, communal prayer and also of fasting every day from dawn to sunset. That means that people only eat at night (Iftar is the first meal after sunset that breaks the fast and often also a family or community event), and also before sunrise (Suhur).
In some countries, the impact is so big that we can see in our Internet traffic charts when the sun sets. Sunrise is more difficult to check in the charts, but in the countries more impacted, people wake up much earlier than usual and were using the Internet in the early morning because of that.
Cloudflare Radar data shows that Internet traffic was impacted in several countries by Ramadan, with a clear increase in traffic before sunrise, and a bigger than usual decrease after sunset. All times in this blog post are local. The data in the charts is bucketed into hours. So, for example, when we show an increase in traffic at 0400 we are showing that an increase occurred between 0400 and 0459 local time.
Indonesia is a clear example of that, showing trends that continued until the end of Ramadan:
In the next table, we show a country ranking by order of impact. Here, we include traffic changes before dawn and after sunset. In the last column, you can also see the change in traffic after Ramadan ended, right after sunset. In this case, we’re looking at Wednesday, May 4, right after the Eid al-fitr — the May 2-3, 2022 holiday of breaking the fast, in a comparison with the previous Wednesday at the same time (when Ramadan was ongoing):
Internet traffic: Ramadan’s impact
Before sunrise
After sunset
Post-Ramadan, May 4 (after sunset)
Afghanistan
+203%
-28%
+20%
Pakistan
+119%
-39%
+13%
Indonesia
+98%
-13%
–
Morocco
+90%
-36%
+44%
Libya
+81%
-27%
+48%
Turkey
+78%
-19%
+22%
Bangladesh
+62%
-40%
+12%
Saudi Arabia
+55%
-45%
-5%
United Arab Emirates
+52%
-13%
+4%
Bahrain
+44%
-31%
+21%
Malaysia
+41%
-8%
-9%
Qatar
+35%
-23%
+5%
Egypt
+31%
-32%
+56%
Tunisia
+25%
-43%
+101%
Iran
+24%
+10%
-12%
Singapore
+8%
-5%
+4%
India
–
-15%
–
Afghanistan, Pakistan, Indonesia, Morocco, Libya and Turkey had the biggest impact in an increase in traffic before sunrise. After sunset, it was (by order of impact) Saudi Arabia, Tunisia, Bangladesh, Pakistan that showed a more clear decrease in traffic after sunset.
Here’s the impact of the start of Ramadan on Bangladesh, with more highlights inside the next chart:
Waking up earlier
There’s a clear pattern in most of the countries, Internet traffic was much higher than usual between 04:00 to 04:59 local time (where usually it’s the time with the lowest traffic).
The same early spike is seen in Turkey and the United Arab Emirates. In the case of the United Arab Emirates, the time before sunrise for the Suhur meal had more mobile usage than usual (so people were using their mobile devices to access the Internet more than usual at that time).
That’s also the case for Pakistan, where traffic is 119% higher on the 04:00 to 04:59 hour on April 3, than on the previous Sunday, but also in Qatar (sunrise at 05:25 and a spike of 35%) or Afghanistan. In the latter, the spike is 203% higher:
We also saw the same trend in Indonesia, sunrise was at 05:55 local time at the beginning of April, and there’s a clear spike in traffic in the 04:00 to 04:59 hour with a 98% growth in requests.
Northern African countries like Egypt, Tunisia, Morocco or Libya (sunrise at 06:54), show the same 04:00 to 04:59 hour spike. In Libya, traffic was 81% higher on Sunday, April 3, than it was the previous Sunday at the same time. Usually, the 04:00 to 04:59 hour is the lowest point in traffic in the country, but on April 3 and the following days it was at 08:00.
Saudi Arabia shows a similar pattern in terms of Internet traffic on Sunday, April 3, 2022, sunrise was at 05:44, and there was 55% more Internet use than at the same time on the previous Sunday, before Ramadan.
Does daily total Internet traffic go up or down?
The short answer is: depends on the country, given that there are examples of a general increase and decrease in traffic in the most impacted countries. We see similar trends for the sunset and sunrise times of day, but it’s a different story throughout the 30 days of Ramadan.
Iran, in general, shows an increase in traffic after Ramadan started on April 2, and a decrease after it ended on May 3 (of around 15%).
Something similar is seen in Pakistan, that had a general decrease in traffic the week after Ramadan ended, but during the 18:00 to 18:59 hour, May 4, had 13% more traffic than at the same time on the previous Wednesday, when Ramadan was being observed and the iftar meal would have happened during the 18:00 to 18:59 hour.
The opposite happens in Libya, where traffic, generally speaking, declined during Ramadan and picked up after — comparing Wednesday, May 4, 2022, with the previous one during the 19:00 to 19:59 hour, traffic grew around 48%. The same trend is seen in another North African country: Morocco (growth of 44% after Ramadan ended).
After Ramadan, sunsets ‘bring’ more Internet traffic
Another pattern, unsurprisingly, that our chart at the beginning of this blog post shows is how the sunset period changes when Ramadan (and the holiday that follows) ends, in most cases clearly increasing traffic at around 18:00 or 19:00.
Of the 16 countries with a bigger Ramadan impact, only four had a decrease in traffic after sunset on May 4: Iran, Indonesia, Saudi Arabia and Malaysia. All of these countries had an increase (or sustained traffic) in daily traffic during Ramadan and lost daily Internet usage after it ended (in May).
Here’s the example of Indonesia through the Ramadan period that includes April and May:
And a zoomed-in Indonesia chart after Ramadan ended (May 1, but bear in mind that May 2-3 is the holiday Eid al-fitr) that shows not only the general decrease in traffic, but also how the sunset period doesn’t have a clear drop in requests as seen in the Ramadan period:
Conclusion: a human impact
Ramadan has a clear impact on Internet traffic patterns as humans change their habits.
The Internet may be the network of networks, where there are many bots (friendly and less friendly), but it continues to be a human-powered network, made by humans for humans.
“Our new Constitution is now established, and has an appearance that promises permanency; but in this world nothing can be said to be certain, except death and taxes.” — Benjamin Franklin, in a letter to Jean-Baptiste Le Roy, 1789
The famous expression highlighting that only “death and taxes” seem certain in life (something that goes back to the beginning of civilization and to Ancient Egypt) is on people’s minds during the month of April in the United States. This past Monday, April 18, 2022, was Tax Day. So, were US citizens procrastinators, leaving their federal (and state) tax returns to the last day? Traffic to tax-related official federal and state websites seems to show it: there was a spike of more than 470% on April 18.
Just for reference, we can see on Cloudflare Radar that Internet traffic in the US, from our perspective, wasn’t significantly impacted on Monday, April 18, although there was a clear peak, higher than in the previous 14 days, that night at 22:00 EST (that’s 02:00 UTC on April 19). So, traffic (that includes DNS and HTTP requests from our standpoint) was 18% higher compared to the same time on the previous Monday.
For the following charts, Cloudflare Radar uses a variety of sources to provide aggregate information about Internet traffic and attack trends. In this blog post, we will use DNS name resolution data as a proxy for traffic to Internet services, as we did for Super Bowl LVI or for the Oscars 2022.
In this case, the baseline value for the charts (that we use to get the percent growth) was calculated by taking the mean DNS traffic level for the associated Internet services on March 31 — a typical day before from the April 18 deadline. On these charts, we are using the EST timezone.
Let’s start with an aggregate of all the federal and state level official tax-related sites. This Monday, DNS requests jumped at 13:00 EST to 472% more than usual (the average on March 31 for all the 51 sites we’re checking is the baseline here). That’s 203% more than the previous highest growth day in April.
Here are the top five days in April ranked by traffic increase:
US federal and state official tax sites peaks in requests
Monday, April 18 (Tax Day 2022), 13:00 — 472% growth.
Thursday, April 14, 15:00 — 269%.
Friday, April 15, 15:00 — 264%.
Monday, April 11, 13:00 — 252%.
Wednesday, April 13, 14:00 — 251%.
Taxes on weekdays
Another trend in the previous chart is that people seem to use more weekdays in April than the weekends to submit their taxes (or to visit official tax-related sites). That’s a trend we see not only for federal sites, but also for the state ones (even more in the latter).
State official tax sites also have a bigger growth in requests in April, from our perspective, than federal, but the general growth is very clear right from the beginning of April, with a relevant peak going up to 221% of increase in traffic at 13:00 EST on April 4.
Another more specific trend regarding Tax Day 2022 was that traffic was higher than before any other day in April right around 09:00 (with 293% increase) and it continued that way until 20:00.
Tax services with a growth up to 680%
In the taxes filling realm there are also many services, some smaller and local, others national and well known, that help people to do the inevitable business of dealing with sales, income, property, license or other taxes.
The peak was reached on Monday, April 18, at 19:00 EST with a growth in requests of 680%. It was a busy afternoon and evening across the US for tax services.
And here’s the top five ranking of traffic growth for tax services sites in April:
US tax services sites peaks in requests
Monday, April 18 (Tax Day 2022), 19:00 — 680% growth
Sunday, April 17, 20:00 — 439%
Friday, April 15, 12:00 — 328%
Saturday, April 16, 14:00 — 326%
Sunday, April 10, 15:00 — 311%
For these types of sites, there are more spikes of traffic on the weekends than on weekdays and that started right at the beginning of April, with Sunday, April 3, reaching 295% in growth, not that far from the peaks on the days prior to Tax Day 2022.
We can also see in a more detailed view in the next chart that at 10:00 on Tax Day 2022 requests growth were already at an all month high with more than 478% of increase. The sustained growth was maintained throughout the day and only after 22:00 (474%) did it drop lower than in previous days.
Conclusion
No surprise, people are aware of the deadlines for their tax returns, and many do leave it to the last day and that is very clear looking at the trends related to tax sites.
If you’re curious about these types of trends, check Cloudflare Radar for up-to-date insights about all the countries on Earth.
The first round of the 2022 French presidential elections were held this past Sunday, April 10, 2022, and a run-off will be held on April 24 between the top two candidates, Emmanuel Macron and Marine Le Pen. Looking at Internet trends in France for Sunday, it appears that when people were voting Internet traffic went down, and, no surprise, it went back up when results are coming in — that includes major spikes to news and election-related websites.
Cloudflare Radar data shows that Sundays are usually high-traffic days in France. But this Sunday looked a little different.
The seven-day Radar chart shows that there was a decrease in traffic compared to the previous Sunday between 08:00 and 16:00 UTC, that’s 10:00 and 18:00 in local time — bear in mind that polling stations in France were open between 08:00 and 19:00 (or 20:00 in big cities) local time. So, the decrease in traffic was ‘inside’ the period when French citizens were allowed to vote.
That’s a similar trend we have seen in other elections, like the Portuguese one back in January 2022.
The time of the French election day with the largest difference compared to the previous Sunday was 14:00 UTC (16:00 in local time), when traffic decreased as much as 16% (as the previous 7-day chart shows). That’s clear in this chart:
That doesn’t show us precisely how people use the Internet differently on an election day — note that we already saw in the past how the weather, times of the year or even events affect human behaviour and subsequently Internet trends.
Let’s look deeper into those trends. We know that weekdays, weekends and even Sundays have, in many countries, specific patterns so, when we compare the previous four Sundays in France since March 20, we can see some trends highlighted in the next chart:
April 10, Election Day, was the Sunday with the most traffic of the previous month at 06:30 UTC (08:30 local time) and in several periods between 16:30 and 20:45 UTC (18:30 and 22:45 local time).
April 10, Election Day, was the Sunday with the least traffic of the previous month in several periods between 09:45 and 11:15 (11:45 and 13:15 local time) and it was the #3 out of #4 with less traffic between 12:15 and 16:15 (14:15 and 18:15 local time).
This seems to show patterns such as: before going to vote more people than usual were online on Sunday, Election Day (08:30 local time), but traffic went down considerably in the late morning period between (11:30-13:15) and again after lunch (14:15 and 18:15) shortly before the polling stations were closed.
The first exit polls started to be published around 18:40 local time (seen in the second and biggest green circle in the previous chart), but the main exit poll was at 20:00 local time, when all the polling stations were already closed, at that time Internet traffic in France was at its highest compared to Sundays during the past 30 days (seen in the third green circle in the previous chart, 18:00 UTC).
How about mobile devices’ usage trends? People in France were definitely using their mobile devices more on Election Day, and that is also evident when compared to the previous Sunday, April 3.
On Election Day, April 10, 2022, at around 09:00 local time mobile usage represented 60% of Internet traffic and had another spike at 21:00 local time with 58% (the seven-day average for mobile usage in France is 48%).
When results arrive, people go online
Official websites usually aren’t the most popular sites in a given country, their popularity is mostly connected to when citizens have to fill in their tax forms online or want to see something like election results — although news media outlets are also important there. Here we’re looking at DNS request trends to get a sense of traffic to Internet properties.
Official French election-related websites like elections.interieur.gouv.fr (where the results are published) had an increase in traffic throughout the week mainly after Monday, April 4, but on election day there were two major spikes.
The first spike in traffic was around 20:00 local time (370% more than the previous Sunday at the same time), when all the polling stations were already closed and the first major polls were revealed. But the main spike was later, at midnight (local time), when 84% of the votes were already counted and published — Macron was leading (27%) followed closely by Le Pen (25%). That spike represented 925% more requests than in the previous Sunday.
The news Internet traffic spike ‘knocks’ at 20:00
When there are elections in a country, people tend to see the analysis and results using media outlets from radio to TV, but also the Internet — media websites and social media. Let’s focus on French media outlets. The biggest spike of the week in our aggregate DNS chart, that shows trends from 12 news websites, was definitely on Election Day, around 20:00 local time, when those domains had 116% more traffic than at the same time on the previous Sunday.
Nonetheless, after 16:00 local time, traffic started to increase to those news outlets and by 18:00 local time it had its largest spike of the week with sustained growth until 20:00. At 23:00 local time there was another increase in traffic and after that it started to decrease. But, this Monday morning, traffic at 08:00 was already higher again than during the previous week (Election Day excluded). So, no surprise, Sunday night was when people were looking more into the news.
The same trend is seen on the major French TV station websites, with an even more isolated spike at 20:00 local time and a 472% increase in traffic compared to the previous Sunday, when the main exit polls were announced.
This was also similar to the broadcast radio website trends. Besides the 20:00 local time spike (272% increase compared to the previous Sunday), there was also a big one at 23:00 local time (300%) and a Monday morning spike with higher than before traffic (82% increase):
How about social media?
Regarding social media in France (looking at the aggregate DNS of the several sites), there’s no clear trend regarding the elections, but there were slightly fewer requests than on the previous Sunday. So social media doesn’t appear to have been as impacted by the elections as news websites.
Conclusion
Although there aren’t big changes in Internet traffic, like those seen in countries that shut down the Internet during election periods, Election Day seems to influence human and Internet patterns, in this case when results started to pour in on election night people went to news or official election websites.
Cloudflare operates in more than 250 cities in over 100 countries, where we interconnect with over 10,000 network providers in order to provide a broad range of services to millions of customers. The breadth of both our network and our customer base provides us with a unique perspective on Internet resilience, enabling us to observe the impact of Internet disruptions. In many cases, these disruptions can be attributed to a physical event, while in other cases, they are due to an intentional government-directed shutdown. In this post, we review selected Internet disruptions observed by Cloudflare during the first quarter of 2022, supported by traffic graphs from Cloudflare Radar and other internal Cloudflare tools, and grouped by associated cause.
Plate tectonics
Internet outages caused by “earth movers” are more frequently caused by errant backhoes. However, two Internet disruptions in the first quarter were caused by more significant earth movement — a volcanic eruption and an earthquake.
The first impacted connectivity on the island nation of Tonga, when the Hunga Tonga–Hunga Ha’apai volcanic eruption damaged the submarine cable connecting Tonga to Fiji, resulting in a 38 day Internet outage. After the January 14 eruption, only minimal Internet traffic (via satellite services) was seen from Tonga. On February 22, Digicel announced that the main island was back online after initial submarine cable repairs were completed – the immediate return of traffic is clearly visible in the figure below. However, it was estimated that repairs to the domestic cable, connecting outlying islands, could take an additional six to nine months.
The second disruption, caused by a 7.3 magnitude earthquake off the coast of central Japan on March 16, was significantly shorter, and had a significantly smaller impact. The earthquake occurred around 1436 UTC, causing power outages that resulted in a loss of Internet connectivity in cities including Tokyo for several hours, as seen in the figure below. Almost exactly 11 years prior, a magnitude 8.9 earthquake also had a nominal impact on Internet connectivity in Japan, that time apparently due to damage to subsea cable systems.
Infrastructure damage
Internet resilience is, of course, heavily dependent on the resilience of the underlying physical infrastructure, including data centers, terrestrial fiber, and submarine cables. Damage to this infrastructure often disrupts Internet connectivity.
Early in the morning of January 5, the Gambia was completely isolated from the global Internet. As evident in the figure below, the incident lasted over eight hours, between 0117 and 0945 UTC. According to a press release from GAMTEL, after the failure of the primary link (damage to the ACE submarine cable), traffic was routed onto two backup links through Senegal. However, these backup links also failed because they converged in a location that was ultimately identified as a single point of failure.
Around 2130 UTC on January 20, Internet traffic to Yemen dropped to near zero, as shown in the figure below, after ongoing airstrikes reportedly hit a telecommunications building in Al-Hudaydah where the FALCON undersea cable lands. The outage lasted four days, finally recovering around 2100 on January 24. The outage primarily affected YemenNet (Public Telecommunication Corporation), the state-owned telecommunications provider.
According to a published report, one of the cuts was on the Victorian (mainland) end, and the other on the Tasmanian side, with both cuts caused by “third parties”. A significant reduction in traffic between 0130 – 0800 UTC is visible in the figure below.
On March 15, ETECSA, the Cuban state telecommunications company, reported that a fiber optic cable had been cut on a public road in the capital that morning. The impact of this fiber cut on Internet traffic to Cuba and ETECSA is visible in the figures below, starting just after 1200 UTC, lasting for over six hours.
Although initially believed to be the result of a power outage (all too common in Venezuela), a March 24 Internet disruption in the country was ultimately due to a fiber cut. Internet traffic to CANTV customers in multiple Venezuelan states dropped significantly between 1140 and 1740 UTC, as seen in the figure below. In addition to this disruption, VE sin Filtro reported a number of additional multi-hour, multi-state Internet disruptions in Venezuela during the first quarter.
On March 31, Internet traffic to Telenor Pakistan dropped 60% between 0600-0745 UTC, as shown in the figure below. According to Telenor Pakistan responses to hundreds of customer complaints lodged via Twitter, the disruption was due to multiple fiber-optic cable cuts in several locations. Just after 1800 UTC, Telenor Pakistan Tweeted that services had been fully restored.
Power outages
In addition to the physical infrastructure, reliable electrical power is also critical for resilient Internet connectivity. At a provider level, loss of power can take key data centers and routers offline, impacting connectivity for customers and other connected networks. Consumer power outages can take home/business routers and connected devices offline, forcing users onto mobile connectivity, assuming that is/remains available.
The interconnected electrical grids of Kazakhstan, Uzbekistan, and Kyrgyzstan all suffered outages on January 24 after Kazakhstan’s North-South power line was disconnected due to “emergency imbalances”. These power outages caused multi-hour Internet disruptions across all three countries starting around 0600 UTC, as the figures below show. The impact to traffic in Kazakhstan appeared to be fairly minor, while traffic declined significantly in Uzbekistan and Kyrgyzstan and took longer to recover.
A power outage across multiple counties and cities in Taiwan starting around 0100 UTC on March 3 caused a brief #Internet disruption. The figure below shows a nominal initial drop in traffic, though traffic remained lower throughout the next several hours. The power outage was reportedly caused by human negligence during annual repairs of a generator at the Hsinta power plant.
In addition to the fiber cut discussed above, Cuba’s Internet suffered a second disruption on March 24. A Tweet from ETECSA stated that a power failure had caused a disruption to voice service, SMS, and mobile data. Analysis of Internet traffic for both Cuba and ETECSA finds that the disruption started around 1230 UTC, and lasted for approximately 90 minutes, as shown in the figures below.
DDoS attack
Although distributed denial of service (DDoS) attacks often target web or application servers in an attempt to knock a given website or application offline, such attacks that target network infrastructure can have more widespread impact, not only restricting access to sites and applications hosted within that network, but also disrupting connectivity for users attached to the network.
Such a DDoS attack targeted AS8867 (E-Gov – Tehila Project) in Israel on March 14. The figure below shows that Internet traffic to that ASN began to decline just before 1530 UTC. A published report notes that the websites of the interior, health, justice and welfare ministries, as well as that of the Prime Minister’s office, were all taken offline as a result of the attack.
Unspecified technical causes
As discussed above, the underlying technical or physical causes of Internet disruptions are often easily identified, frequently thanks to social media or other communications from the impacted network providers. However, sometimes disruptions are observed that are correlated with a real-world (often political) event with no specified technical or physical cause, while other times disruptions are observed but are both uncorrelated and unattributed.
In Kazakhstan, an Internet disruption began on January 5 amid mass protests against sudden increases in energy prices. Starting around 1030 UTC, traffic from Kazakhstan dropped to near zero. The figure below shows that traffic returned to a regular diurnal pattern on January 11, but several apparent restorations of connectivity are also visible during the six-day disruption. These brief periods of connectivity appeared to align with televised speeches or announcements from the Zazakh president.
In Burkina Faso, heavy gunfire related to an army mutiny was reported early in the morning of January 23. A significant drop in traffic from the country was observed in Cloudflare Radar starting around 0915 UTC, with Orange, FasoNet, and Telecel Faso all seeing lower traffic volumes. As the figure below shows, the disruption lasted for nearly a day and a half, recovering around 2000 UTC on January 24.
Just after 2200 UTC on March 15, Yemen experienced a significant, albeit brief, Internet disruption, lasting just 30 minutes. As the figures below show, the disruption was primarily due to an issue at YemenNet. A published report claims that the disruption was due to a deliberate act by the Houthi coup militia.
Russian invasion of Ukraine
The Russian invasion of Ukraine has now been going on for over a month. In some cases, Internet connectivity has been collateral damage from the kinetic military action, while in other cases, targeted attacks on network providers and power outages have disrupted connectivity. Technicians from Ukrainian service providers have been risking their lives to keep the country online, and have been largely successful – Cloudflare Radar traffic data for Ukraine shows that as of the end of March, peak traffic levels are at 85-90% of pre-invasion peaks. An earlier blog post provides additional details about Internet traffic patterns observed in Ukraine during the first week after the conflict began.
Below we highlight just a few significant disruptions observed on major Ukrainian network providers in March.
Two brief outages were observed at Ukrtelecom during the second week of March, shown in the figure below. The first, on March 8, lasted for just over two hours, while the second one, on March 10, lasted for approximately 40 minutes. No root cause has been reported for these disruptions.
Later in the month, on March 28, Ukrtelecom experienced a ~15 hour outage, lasting from 0800 UTC to approximately 0100 on March 29, as seen in the figure below. A Twitter thread from the State Service of Special Communications and Information Protection of Ukraine explained that the outage was caused by “a powerful cyberattack” against Ukrtelecom’s infrastructure, and that “In order to preserve its network infrastructure and to continue providing services to Ukraine’s Armed Forces and other military formations as well as to the customers, Ukrtelecom has temporarily limited providing its services to the majority of private users and business-clients.” A LinkedIn post from Ukrtelecom also highlights the non-stop work that the company has been doing to re-establish telecommunications services in impacted regions across the country.
The figure below shows that around 2100 UTC on March 9, Ukrainian Internet service provider Triolan suffered a significant disruption, reportedly resulting from a cyber attack. Traffic began to gradually return after approximately 10 hours.
Conclusion
Despite occasional connectivity disruptions, the Internet remains remarkably resilient. This resiliency is increasingly critical as the Internet finds its way into more and more areas of everyday life around the world. In addition to providing a suite of solutions that support that resiliency, we use the data exhaust from these solutions to monitor Internet reliability, availability, security, and performance.
Follow @CloudflareRadar on Twitter for updates on Internet disruptions as they occur, and find up-to-date information on Internet trends using Cloudflare Radar.
The 94th Academy Awards happened this past Sunday, March 27, 2022. In the global event we got to see several Oscars attributed to winners like CODA, Jane Campion (the director of The Power of the Dog) and also Dune (which won six Oscars), but also moments that had a clear impact in the Internet traffic, like the altercation on stage between Will Smith and Chris Rock.
Cloudflare Radar uses a variety of sources to provide aggregate information about Internet traffic and attack trends. In this blog post, we will use DNS name resolution data as a proxy for traffic to Internet services, as we did for the Super Bowl LVI.
The baseline value for the charts (that are only focused on the US) was calculated by taking the mean DNS traffic level for the associated Internet services between 08:00 – 12:00 PST on Sunday (March 27, 2022) — usually we use UTC, but we chose to use Los Angeles time as that’s where the event took place.
The event started with Beyoncé singing at 17:00 PST and ended at around 20:30. In terms of growth in traffic, the start of the show didn’t show much for social media, although TikTok and Twitter started to decrease in DNS requests after that time.
Will Smith makes Twitter and TikTok rise in requests
Twitter and TikTok were the social networks that seemed most impacted by the moment Will Smith went on stage and started an altercation with Chris Rock after a joke.
For Twitter, the major change in DNS requests was exactly after that incident (at 19:25); before that, at 18:00, the moment Sebastián Yatra performed Encanto’s Dos Oruguitas song also had a small spike.
There were 32% more DNS requests for Twitter a few minutes after the altercation, and that growth peaked at 20:15 with 51% more requests than there were at 19:20 — that was after Will Smith (20:05) gave his acceptance and apology speech, when he was awarded the Best Actor Oscar. The ceremony ended at 20:30, and after that traffic went down.
TikTok also seemed to be used during the ceremony and the breaks, and after a spike during one of the commercial breaks, around 18:40, after Troy Kotsur won the Best Supporting Actor Oscar for his role in CODA.
The Will Smith incident seems to be associated with an increase of 20% in requests from 19:20 to 19:30. The trend continued with a 25% increase (19:40) and a peak of 40% more traffic at 20:15, right after Will Smith’s speech. After the ceremony ended (20:30), traffic went down.
Facebook (yellow line) and Instagram (green) weren’t particularly impacted, although there’s a decrease in traffic after the ceremony started and requests start to decrease after 19:00, especially Facebook.
Actresses made IMDb.com tick
One of the main sources of information about the movie industry is IMDb.com, the Internet Movie Database, and traffic to the site was impacted by the Oscars in a way not related to the Will Smith incident. Requests almost doubled (93% increase) in the minutes before the Oscars started (between 16:50 and 17:00).
And there was another clear spike right after Ariana DeBose won (at 17:23) the Best Supporting Actress Oscar for West Side Story, with almost 90% growth in traffic compared to the previous 10 minutes.
There is also an increase at 19:00, when Kenneth Branagh won the Best Original Screenplay Oscar for writing Belfast. The other major spike in traffic, with 55% increase compared to the previous minutes, was right around the time Jessica Chastain got the Oscar for Best Actress for her role in the movie The Eyes of Tammy Faye.
ABC and Oscars.com trends
ABC was the official broadcaster for the 2022 Oscars, and throughout the event had good numbers: two hours before the ceremony, ABC.com and also their dedicated page Oscars.com (that redirects to abc.com/shows/oscars) had between 200 to 600% more traffic than in our baseline (the morning period, 08:00 – 12:00 PST).
The biggest spike was around 19:45, a few minutes after the Will Smith incident. This was around the time Questlove received the Best Documentary Oscar for Summer of Soul (…Or, When the Revolution Could Not Be Televised), and there was a reunion for The Godfather, with Francis Ford Coppola and actors Al Pacino and Robert DeNiro, on stage.
Oscars official website
The official Oscars.org website also had some trends worth mentioning. Requests to the site increased 400% in the hour before the ceremony started, from 16:00 to 17:00, and remained high after that.
But at 19:45 there was a clearer spike in traffic of around 1,300% increase compared to the previous 10 minutes — that was 20 minutes after the Will Smith incident, right after Questlove’s Oscar and at the time of The Godfather reunion. There was another spike right after the Best Actress award and before the event ended. The full list of winners was published on Oscars.org right after 20:30.
Movie news sites trends
So, how about the trends for movie news sites like Variety, Hollywood Reporter, Vulture or E Online? For this we went on to look at the whole Oscars week (the baseline is a mean of the previous Sunday, March 20, 2022). The Oscars Sunday, March 27, was definitely the main day of the week, with DNS requests for those websites growing 833% more than the best days of the week.
That growth was even higher the next day, Monday, March 28, 2022, when traffic rose to 1,200% more than the best days of the previous week.
Conclusion
As we saw with the Super Bowl LVI, an out of the ordinary moment in a popular event, even when it’s broadcasted via television, causes changes in social media and Internet traffic. In the case of the Super Bowl LVI it was the Coinbase ad; here it was an unexpected incident on stage.
On the morning of March 8, a post to Hacker News stated that “All .fj domains have gone offline”, listing several hostnames in domains within the Fiji top level domain (known as a ccTLD) that had become unreachable. Commenters in the associated discussion thread had mixed results in being able to reach .fj hostnames—some were successful, while others saw failures. The fijivillage news site also highlighted the problem, noting that the issue also impacted Vodafone’s M-PAiSA app/service, preventing users from completing financial transactions.
The impact of this issue can be seen in traffic to Cloudflare customer zones in the .com.fj second-level domain. The graph below shows that HTTP traffic to these zones dropped by approximately 40% almost immediately starting around midnight UTC on March 8. Traffic volumes continued to decline throughout the rest of the morning.
Looking at Cloudflare’s 1.1.1.1 resolver data for queries for .com.fj hostnames, we can also see that error volume associated with those queries climbs significantly starting just after midnight as well. This means that our resolvers encountered issues with the answers from .fj servers.
This observation suggests that the problem was strictly DNS related, rather than connectivity related—Cloudflare Radar does not show any indication of an Internet disruption in Fiji coincident with the start of this problem.
It was suggested within the Hacker News comments that the problem could be DNSSEC related. Upon further investigation, it appears that may be the cause. In verifying the DNSSEC record for the .fj ccTLD, shown in the dig output below, we see that it states EDE: 9 (DNSKEY Missing): 'no SEP matching the DS found for fj.'
kdig fj. soa +dnssec @1.1.1.1
;; ->>HEADER<<- opcode: QUERY; status: SERVFAIL; id: 12710
;; Flags: qr rd ra; QUERY: 1; ANSWER: 0; AUTHORITY: 0; ADDITIONAL: 1

;; EDNS PSEUDOSECTION:
;; Version: 0; flags: do; UDP size: 1232 B; ext-rcode: NOERROR
;; EDE: 9 (DNSKEY Missing): 'no SEP matching the DS found for fj.'

;; QUESTION SECTION:
;; fj.                          IN      SOA

;; Received 73 B
;; Time 2022-03-08 08:57:41 EST
;; From 1.1.1.1@53(UDP) in 17.2 ms
Extended DNS Error 9 (EDE: 9) is defined as “A DS record existed at a parent, but no supported matching DNSKEY record could be found for the child.” The Cloudflare Learning Center article on DNSKEY and DS records explains this relationship:
The DS record is used to verify the authenticity of child zones of DNSSEC zones. The DS key record on a parent zone contains a hash of the KSK in a child zone. A DNSSEC resolver can therefore verify the authenticity of the child zone by hashing its KSK record, and comparing that to what is in the parent zone’s DS record.
Ultimately, it appears that around midnight UTC, the .fj zone started to be signed with a key that was not in the root zone DS, possibly as the result of a scheduled rollover that happened without checking that the root zone was updated first by IANA, which updates the root zone. (IANA owns contact with the TLD operators, and instructs the Root Zone Publisher on the changes to make in the next version of the root zone.)
DNSSEC problems as the root cause of the observed issue align with the observation in the Hacker News comments that some were able to access .fj websites, while others were not. Users behind resolvers doing strict DNSSEC validation would have seen an error in their browser, while users behind less strict resolvers would have been able to access the sites without a problem.
Conclusion
Further analysis of Cloudflare resolver metrics indicates that the problem was resolved around 1400 UTC, when the DS was updated. When DNSSEC is improperly configured for a single domain name, it can cause problems accessing websites or applications in that zone. However, when the misconfiguration occurs at a ccTLD level, the impact is much more significant. Unfortunately, this seems to occur all too often.
(Thank you to Ólafur Guðmundsson for his DNSSEC expertise.)
At Cloudflare, we’ve watched in horror the Russian invasion of Ukraine. As the possibility of war looked more likely, we began to carefully monitor the situation on the ground, with the goal of keeping our employees, our customers, and our network safe.
Helping protect Ukraine against cyberattacks
Attacks against the Internet in Ukraine began even before the start of the invasion. Those attacks—and the steady stream of DDoS attacks we’ve seen in the days since—prompted us to extend our services to Ukrainian government and telecom organizations at no cost in order to ensure they can continue to operate and deliver critical information to their citizens as well as to the rest of the world about what is happening to them.
Going beyond that, under Project Galileo, we are expediting onboarding of any Ukrainian entities for our full suite of protections. We are currently assisting more than sixty organizations in Ukraine and the region—with about 25% of those organizations coming aboard during the current crisis. Many of the new organizations are groups coming together to assist refugees, share vital information, or members of the Ukrainian diaspora in nearby countries looking to organize and help. Any Ukrainian organizations that are facing attack can apply for free protection under Project Galileo by visiting www.cloudflare.com/galileo, and we will expedite their review and approval.
Securing our customers’ data during the conflict
In order to preserve the integrity of customer data, we moved customer encryption key material out of our data centers in Ukraine, Russia, and Belarus. Our services continued to operate in the regions using our Keyless SSL technology, which allows encryption sessions to be terminated in a secure data center away from where there may be a risk of compromise.
If any of our facilities or servers in Ukraine, Belarus, or Russia lose power or connectivity to the Internet, we have configured them to brick themselves. All data on disk is encrypted with keys that are not stored on site. Bricked machines will not be able to be booted unless a secure, machine-specific key that is not stored on site is entered.
Monitoring Internet availability in Ukraine
Our team continues to monitor Internet patterns across Ukraine. While usage across the country has declined over the last 10 days, we are thankful that in most locations the Internet is still accessible.
We are taking steps to ensure that, as long as there is connectivity out of the country, our services will continue to operate.
Staying ahead of the threat globally
Cyber threats to Ukrainian customers and telecoms is only part of the broader story of potential cyberattacks. Governments around the world have emphasized that organizations must be prepared to respond to disruptive cyber activity. The US Cybersecurity and Infrastructure Security Agency (CISA), for example, has recommended that all organizations—large and small—go “Shields Up” to protect themselves from attack. The UK’s National Cyber Security Centre has encouraged organizations to improve their cyber resilience.
This is where careful monitoring of the attacks in Ukraine is so important. It doesn’t just help our customers in Ukraine — it helps us learn and improve our products so that we can protect all of our customers globally. When wiper malware was identified in Ukraine, for example, we adapted our Zero Trust products to make sure our customers were protected.
We’ve long believed that everyone should have access to cybersecurity tools to protect themselves, regardless of their size or resources. But during this time of heightened threat, access to cybersecurity services is particularly critical. We have a number of free services available to protect you online — and we encourage you to take advantage of them.
Providing services in Russia
Since the invasion, providing any services in Russia is understandably fraught. Governments have been united in imposing a stream of new sanctions and there have even been some calls to disconnect Russia from the global Internet. As discussed by ICANN, the Internet Society, the Electronic Frontier Foundation, and Techdirt, among others, the consequences of such a shutdown would be profound.
The scope of new sanctions issued in the last few weeks have been unprecedented in their reach, frequency, and the number of different governments involved. Governments have issued sweeping new sanctions designed to impose severe costs against those who supported the invasion of Ukraine, including government entities and officials in Russia and Belarus. Sanctions have been imposed against Russia’s top financial institutions, including Russia’s two largest banks, fundamentally altering the ability of Russians to access capital. The entire break away territories of Donetsk and Luhansk, including all of the residents of those regions, are subject to comprehensive sanctions. We’ve seen sanctions on state-owned enterprises, elite Russian families, and the leaders of intelligence-directed disinformation outlets.
These sanctions are intended to make sure that those who supported the invasion are held to account. And Cloudflare has taken action to comply. Over the past several years, Cloudflare has developed a robust and comprehensive sanctions compliance program that allows us to track and take immediate steps to comply with new sanctions regulations as they are implemented. In addition to an internal compliance team and outside counsel, we employ third party tools to flag potential matches or partial ownership by sanctioned parties, and we review reports from third-parties about potential connections. We have also worked with government experts inside and outside of the United States to identify when there is a connection between a sanctioned entity and a Cloudflare account.
Over the past week, our team has ensured that we are complying with these new sanctions as they are announced. We have closed off paid access to our network and systems in the new comprehensively-sanctioned regions. And we have terminated any customers we have identified as tied to sanctions, including those related to Russian financial institutions, Russian influence campaigns, and the Russian-affiliated Donetsk and Luhansk governments. We expect additional sanctions are likely to come from governments as they determine additional steps are appropriate, and we will continue to move quickly to comply with those requirements as they are announced.
Beyond this, we have received several calls to terminate all of Cloudflare’s services inside Russia. We have carefully considered these requests and discussed them with government and civil society experts. Our conclusion, in consultation with those experts, is that Russia needs more Internet access, not less.
As the conflict has continued, we’ve seen a dramatic increase in requests from Russian networks to worldwide media, reflecting a desire by ordinary Russian citizens to see world news beyond that provided within Russia.
We’ve also seen an increase in Russian blocking and throttling efforts, combined with Russian efforts to control the content of the media operating inside Russia with a new “fake news” law.
The Russian government itself, over the last several years, has threatened repeatedly to block certain Cloudflare services and customers. Indiscriminately terminating service would do little to harm the Russian government, but would both limit access to information outside the country, and make significantly more vulnerable those who have used us to shield themselves as they have criticized the government.
In fact, we believe the Russian government would celebrate us shutting down Cloudflare’s services in Russia. We absolutely appreciate the spirit of many Ukrainians making requests across the tech sector for companies to terminate services in Russia. However, when what Cloudflare is fundamentally providing is a more open, private, and secure Internet, we believe that shutting down Cloudflare’s services entirely in Russia would be a mistake.
Our thoughts are with the people of Ukraine and the entire team at Cloudflare prays for a peaceful resolution as soon as possible.
The collective thoughts of the interwebz
Manage Consent
To provide the best experiences, we use technologies like cookies to store and/or access device information. Consenting to these technologies will allow us to process data such as browsing behavior or unique IDs on this site. Not consenting or withdrawing consent, may adversely affect certain features and functions.
Functional
Always active
The technical storage or access is strictly necessary for the legitimate purpose of enabling the use of a specific service explicitly requested by the subscriber or user, or for the sole purpose of carrying out the transmission of a communication over an electronic communications network.
Preferences
The technical storage or access is necessary for the legitimate purpose of storing preferences that are not requested by the subscriber or user.
Statistics
The technical storage or access that is used exclusively for statistical purposes.The technical storage or access that is used exclusively for anonymous statistical purposes. Without a subpoena, voluntary compliance on the part of your Internet Service Provider, or additional records from a third party, information stored or retrieved for this purpose alone cannot usually be used to identify you.
Marketing
The technical storage or access is required to create user profiles to send advertising, or to track the user on a website or across several websites for similar marketing purposes.