Tag Archives: mlops

Democratizing Machine Learning at Netflix: Building the Model Lifecycle Graph

Post Syndicated from Netflix Technology Blog original https://netflixtechblog.com/democratizing-machine-learning-at-netflix-building-the-model-lifecycle-graph-5cc6d5828bb1

Saish Sali, Nipun Kumar, Sura Elamurugu

Introduction

As Netflix has grown, machine learning continues to support our ability to deliver value to members and drive excellence across multiple areas of our business. When Netflix began investing in machine learning over a decade ago, it was primarily focused on a single domain: personalization. Scala was the industry standard, our ML teams were relatively small, and optimizing member engagement was our primary use case. Fast forward to today, and machine learning has become the backbone of Netflix’s business transformation. We now apply ML across various business domains, including:

  • Personalization: Optimizing engagement and helping members discover content they’ll love
  • Studio: Pre and post-production workflows
  • Payments: Fraud detection, payment routing, and recurring billing optimization
  • Ads: Our newest domain, requiring real-time decisioning and targeting

… and a growing number of additional use cases across the company

Each domain operates with a different tech stack, different business metrics, and a distinct organizational structure. While this diversity is a testament to how machine learning has evolved to drive value across many verticals at Netflix, this growth introduces a new challenge: enabling cross-pollination of models and data across domains.

The Challenge: A Fragmented ML Landscape

As our ML investments scaled across these domains, a critical problem emerged: the models produced largely became black boxes. Without any discovery infrastructure, ML practitioners couldn’t easily collaborate or share work across business verticals.

Consider a concrete example: content embeddings. Our Studio teams create sophisticated embeddings that identify scene boundaries, detect visual transitions, and understand content structure. These embeddings were originally built for production workflows.

But those same embeddings could be incredibly valuable elsewhere. Ads could hypothetically use content embeddings for context matching (ensuring advertisements align with the tone and content of what’s currently playing). Personalization could leverage them for episodic merchandising and recommendations (matching the topic or mood of an episode with a user’s preferred viewing preferences). Yet making this cross-pollination happen is extraordinarily difficult.

Why? Our ML tools exist in silos, each with its own backend services and user interface. The model registry is unaware of which A/B tests were using its models, and the pipeline orchestrator is unaware of downstream model dependencies. ML practitioners have to traverse multiple systems to answer basic questions about their work. Finding a model requires opening the model registry, understanding its lineage means switching to the pipeline orchestrator, and tracking which A/B tests use that model requires navigating to the experimentation platform. This fragmentation prevents practitioners from answering critical questions:

  • Discovery: What features exist? What data sources are available for generating features for a model?
  • Lineage: Which pipeline is generating data for a specific model? What data sources feed those features?
  • Impact: Which A/B tests are running this model? Which models will break if I change this feature? Who owns each piece of this chain?

The Hard Problem: Connecting everything

The real challenge wasn’t just building a consolidated UI. We needed to connect the different pieces of infrastructure our ML practitioners were using to perform different parts of the ML lifecycle.

Our ML ecosystem generates metadata from dozens of sources:

  • Pipeline orchestration systems emit execution details, stage dependencies, and data transformations
  • Deployed model registry tracks model versions, artifacts, staleness, and deployment history
  • Experimentation platform manages A/B tests and their configurations
  • Feature store catalog feature definitions and usage
  • AI Dataset platform tracks the creation, management, discovery, and loading of datasets.
  • Identity platform maintains user, team, and organization metadata

Each system employs different formats, identifiers, and mental models. The hard technical problem we had to solve was: How do we collect this heterogeneous metadata, transform it into a unified entity model, and build a connected graph that enables true exploration and collaboration across business domains?

The Solution: Metadata Service and the Model Lifecycle Graph

Our answer was the Metadata Service (MDS), which builds a Model Lifecycle Graph that indexes and connects ML-related entities across Netflix. MDS is optimized for real-time ingestion of ML metadata (e.g., models, features, pipelines, experiments, datasets) and to answer cross-domain questions such as “Which experiments are running this model?” or “Which models share these features?” It is the foundation that enables discovery, ingesting events from diverse sources, enriching them with context, and materializing relationships across entities.

Our vision: to make every ML asset at Netflix discoverable, understandable, and reusable by every ML practitioner, regardless of their team or domain.

Core Abstractions: The Vocabulary of the System

Before diving into the technical implementation, it’s helpful to understand the conceptual model that underpins MDS. This vocabulary enables consistent communication across teams and systems:

Component: Any object that is uniquely addressable using an AI Platform’s (AIP) Uniform Resource Identifier (URI). An AIP URI follows the formataip://<componentType>/<platformId>/<resourceId>, ensuring global uniqueness. For example:

  • Models: aip://model/registry/ranking-v5
  • Users: aip://user/identity/alice
  • Pipelines: aip://pipeline/orchestrator/weekly-training

Entity: A component within the ML ecosystem, characterized by additional properties such as name, description, creation date, and owners. Entities represent ML-specific assets, such as models, features, and pipelines.

Entity Type: A group of entities that share the same data shape. A data shape is a set of property constraints that specify the attributes and relationships an entity must have.

Domain: A functional grouping of related entity types that defines the abstract interface for a category of ML assets. For example, the Models domain defines what a Model and Model Instance look like, while the Pipelines domain defines Schedules, Requests, and Executions.

Provider: A concrete implementation of a domain, backed by a specific source system. For example, the Models domain is currently backed by our internal model registry. This separation allows MDS to support multiple providers for the same domain. If a new model registry were introduced, it could be added as an additional provider without changing the domain interface.

We can summarize these concepts with a concrete example:
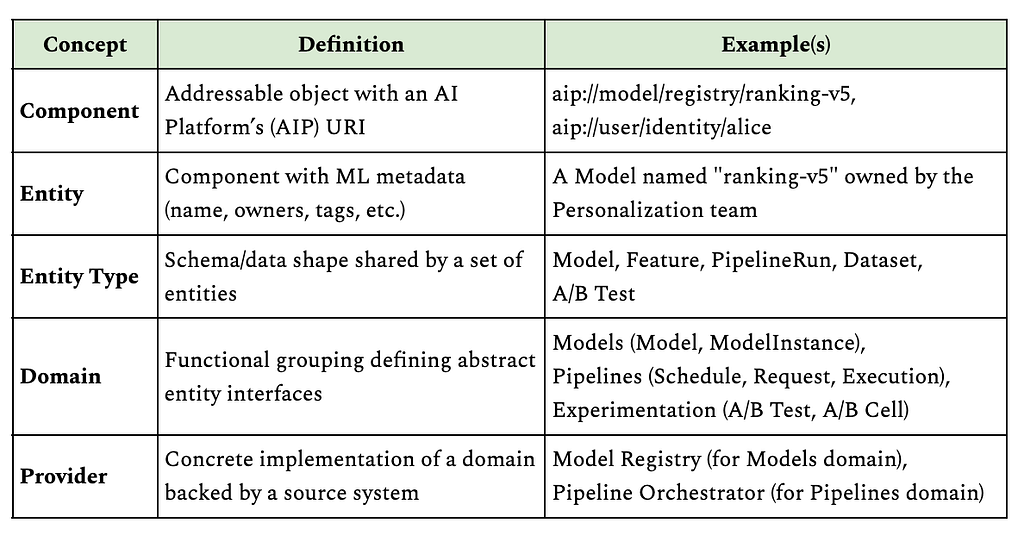
This URI-based addressing scheme is crucial as it allows any service to reference any ML asset with a single string, and MDS can resolve that reference back to rich, connected metadata.

From Events to Entities to Graph
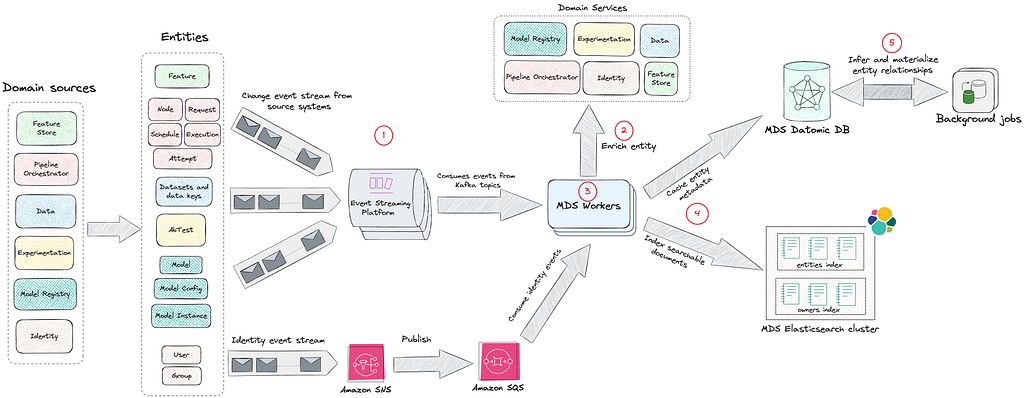
The journey from raw system events to a queryable graph happens in stages. Let’s walk through each with a concrete example: connecting a model to its A/B tests through relationship inference.

1 Event Ingestion

MDS integrates with various source systems via Kafka and AWS SNS/SQS, consuming events in real-time. Source systems emit thin events that include an identifier and an event type.

Example event:

{
"event_type": "model_instance_created",
"instance_id": "ranking-model-v5-20XX0101",
...
}

This design keeps producers simple. Source systems only need to announce that a change occurred, without building complete payloads or understanding downstream requirements.

Each source system has dedicated event handlers in MDS:

  • Pipeline Orchestration: Ingests pipeline execution events, including node definitions, schedules, requests, and job attempts
  • Model Registry: Captures model deployments, configurations, and version updates
  • Feature Store: Tracks feature definitions and their versions
  • Experimentation Platform: Monitors A/B test configurations and allocations
  • Datasets: Tracks ML datasets and their versions
  • Identity Platform: Maintains ownership and team membership information

2 Entity Enrichment

MDS implements a hydration contract for each event type. When an event arrives, MDS:

  1. Validates the event schema
  2. Calls the source system’s API to fetch the complete, current state
  3. Transforms the response into a normalized entity

This design has a crucial property: the order of events doesn’t matter. MDS always fetches the latest facts from the source of truth. This pattern decouples the event stream from state consistency. If the event bus drops a message or delivers it out of order, the next event corrects the state. The event stream becomes a notification of change rather than a log of changes.

This notification of change pattern has a few important tradeoffs. On the plus side, it keeps producers simple, makes us robust to out-of-order or dropped events, and ensures that MDS can always reconcile to the latest state by reading from the source of truth. The tradeoff is that we place additional read load on source systems during hydration and need to be deliberate about rate limiting, caching, and backoff in our enrichment workers so that we don’t overload them.

For our ranking model example, when the model_instance_created event arrives, MDS calls the Model Registry API: GET /api/v1/instances/ranking-model-v5-20XX0101

The registry responds with a full descriptor. Example response (key fields only):

{
"id": "ranking-model-v5-20XX0101",
"pipeline_run_id": "train-weekly-ranking-20XX0101",
"owner_emails": ["[email protected]"],
"labels": [{"key": "team", "value": "personalization"}],
...
}

3 Data Transformation and Normalization

Raw events are heterogeneous and each source system has its own schema and semantics. MDS workers transform these events into a unified entity model with standardized fields.

Without normalization, downstream consumers would need to understand every source system’s schema. Normalization creates a consistent interface, allowing queries and relationships to work across all entity types. Here is an example.

Normalized MDS entity:

{
"id": "aip://model/registry/ranking-model-v5-20XX0101",
"pipeline_run": "aip://pipeline-run/orchestrator/train-weekly-ranking-20XX0101",
"entity_type": "ModelInstance",
"owners": ["aip://user/identity/alice"],
"tags": [{"tag": "team", "value": "personalization"}],
...
}

The normalization process standardizes field names and formats. For example, platform-specific IDs become global AIP URIs, owner_emails becomes owners with resolved user URIs, and labels become tags. Foreign keys like pipeline_run_id are transformed into entity references. However, there’s still no reference to which A/B tests are using this model. The Model Registry doesn’t track experiments, and the Experimentation Platform doesn’t track which pipeline produced a given model. This is where knowledge enrichment becomes critical.

4 Storage and Indexing

Once normalized, entities are persisted to Datomic and immediately indexed in Elasticsearch. This happens synchronously within the event processing flow.

Datomic for Caching and Relationships
Normalized entities are first written to Datomic, which serves as both a local cache and a graph database.

Why Datomic? Datomic serves as both the system of record for MDS and the working dataset for enrichment processes. Its immutable fact model means we can continuously add relationships without losing the original entity state.

What we store:

  • All entity attributes as facts
  • Entity references (foreign keys that may point to entities not yet fully resolved)
  • All relationships as reified edges (added by enrichment processes)
  • Entity lifecycle state (tracking which entities are fully enriched vs awaiting hydration)

This enables:

  • Complex graph traversals: Navigate from a model to its features to their data sources in a single query
  • Entity relationships: Join across multiple domains without N+1 query problems
  • Flexible schema evolution: Easy to add new entity types and attributes as the catalog grows
  • Progressive enrichment: Background jobs efficiently identify and process entities requiring additional hydration, enabling gradual graph completion without reprocessing fully enriched entities

In practice, we use Datomic for relationship-heavy, navigational queries such as:

  • Starting from this model instance, show me all upstream datasets and downstream experiments.
  • Given this feature, list all consuming models and their owning teams.

These queries often span multiple hops in the graph and benefit from Datomic’s immutable fact model and efficient joins across entity relationships.

Elasticsearch for Discovery
Immediately after writing to Datomic, entities are indexed in Elasticsearch to power fast, full-text search across the catalog.

What we index:

  • Primary fields: Entity name, description, entity type, owner names
  • Relationship metadata: Names of related entities (e.g., a model’s features, pipelines, A/B tests) stored in the related field
  • Tags: Domain-specific metadata stored as key-value pairs (e.g., team::personalization, env::production, model.state::released)

Index structure:

  • Single entities index: All entity types (models, features, pipelines, etc.) are indexed in one unified index, differentiated by the entityType field
  • Separate owners index: Dedicated index for users and groups to enable cross-entity owner searches
  • Relevance boosting: Exact name matches score higher than other relevant matches

This enables:

  • Multi-field text search across entity names, descriptions, tags, and related metadata
  • Relevance ranking with boosting (exact name matches score significantly higher)
  • Complex filtering by entity type, ownership, tags, and domain-specific attributes (stored as tags)
  • Fuzzy matching to handle typos and partial queries

Elasticsearch powers the entry point into the system: users typically start with a free-text search in the AIP Portal (for a model name, a team, or a domain term), and then switch to graph navigation once they land on an entity page. Indexing happens in near real-time as part of the ingestion and enrichment workflows, so changes are usually visible in the Portal with a short delay that is acceptable for interactive use.

5 Knowledge Enrichment and Graph Formation

Once entity metadata is persisted in Datomic, scheduled background processes take over to discover and materialize relationships. These enrichment jobs run periodically, scanning for uncached or partially resolved entities (entities that exist only as references without full metadata).

The enrichment workflow:

  • Identify candidates: Find entities marked as uncached or with unresolved references
  • Hydrate relationships: Query source-of-truth systems to fetch related entity details
  • Materialize edges: Write discovered relationships back to Datomic
  • Re-index: Trigger Elasticsearch indexing for updated entities
  • Mark as enriched: Update entity status to prevent redundant processing

This asynchronous approach allows MDS to handle the computational cost of graph formation without blocking real-time event ingestion. It also enables retry logic and gradual enrichment as new entities become available.

Because enrichment is asynchronous, newly discovered relationships may appear with a short delay after the underlying entities are created (typically minutes rather than seconds). We track when each entity was last enriched and surface this timestamp in the AIP Portal, so practitioners can reason about staleness and know when it’s safe to rely on a particular relationship for debugging or impact analysis.

Why enrich? Source systems are purpose-built and don’t know about entities in other domains. Enrichment discovers and materializes cross-system relationships that enable powerful lineage and impact queries.

Example: Connecting Models to A/B Tests

When MDS processes a new model instance, background enrichment jobs discover relationships through multi-hop inference:

Step 1: Direct link to pipeline

The model references a pipeline_run_id. An enrichment job hydrates the pipeline and discovers its A/B test associations: GET /api/v1/pipeline-runs/train-weekly-ranking-20XX0101

Response:

{
"run_id": "train-weekly-ranking-20XX0101", "pipeline": "weekly-ranking-trainer",
"ab_test_cells": [
{"test_id": "12345","cell_number": 2,"cell_name": "treatment_ranking_v5"}
]
...
}

Step 2: Discover A/B test context
The enrichment job discovers the pipeline ran for A/B test cell #2 and queries the Experimentation Platform for test details: GET /api/v1/tests/12345

{
"test_id": "12345",
"name": "Ranking Model v5 vs v4",
"status": "ACTIVE",
"cells": [{"cell_number": 1, "name": "control_ranking_v4"}],
...
}

Step 3: Infer transitive relationships
The enrichment job now has the complete chain:

  • Model Instance was produced by Pipeline Run
  • Pipeline Run was executed for A/B Test Cell #2
  • The A/B Test Cell #2 belongs to A/B Test “Ranking Model v5 vs v4”
  • Model Instance now gets associated with this A/B Test

The job writes the inferred relationship back to Datomic and triggers re-indexing, and materializes these edges in the graph. MDS doesn’t just store what it’s told; it derives new knowledge by walking the graph in the background.

Why this matters: Without MDS, answering “Which A/B tests are using this model?” requires:

  1. Looking up the model in the Model Registry
  2. Finding which pipeline produced it
  3. Checking the Pipeline Orchestrator for A/B test tags
  4. Querying the Experimentation Platform for test details

With the model lifecycle graph, it’s a single query:

query {
model(id: "aip://model/registry/ranking-model-v5-20XX0101") {
name
owners { name }
currentInstance {
version
pipeline {
name
owners { name }
}
features {
edges {
node {
name
data { edges { node { name } } }
}
}
}
associatedAbTests {
name
cells { number name }
}
}
}
}

The reverse query also works: “What models are being tested in experiment 12345?”

Enabling Exploration, Not Just Search
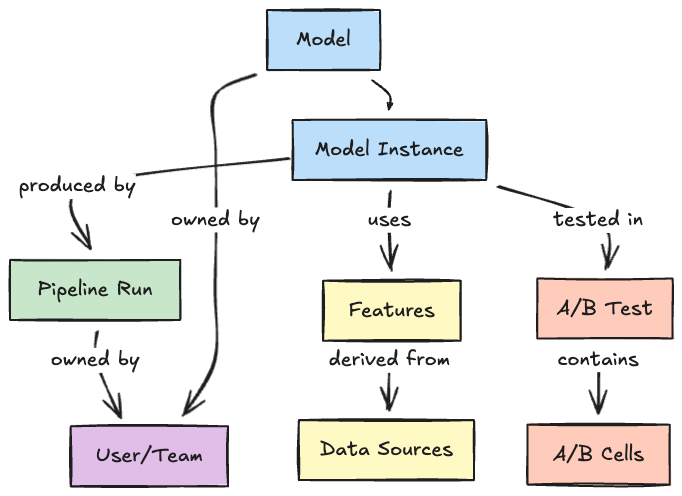
With the Model Lifecycle Graph in place, we shift from entity search to entity exploration. Discovery isn’t just about finding a model; It’s about traversing relationships:

  • Start with a model, explore its features
  • From features, navigate to the core data driving them
  • From the data, trace back to the pipelines generating it
  • From pipelines, see which teams own and depend on them
  • From experiments, understand which models are being tested

For example, imagine an engineer investigating a degraded engagement metric for a personalization model. They might:

  1. Start with the model instance powering the affected recommendations in the AIP Portal.
  2. Inspect the model’s features and follow a suspicious feature to its upstream dataset.
  3. From the dataset page, see that its pipeline recently had failed runs and identify the owning team.
  4. Confirm which A/B tests are currently running this model instance to understand which members and surfaces are impacted.

Before MDS and the Model Lifecycle Graph, this required manual checks across multiple tools (model registry, pipeline orchestrator, experiment platform). Now it’s a contiguous journey in a single interface.

This graph-based exploration answers questions that were previously impossible:

  • Lineage queries: What is the complete lineage of this model, from training data to production experiments?
  • Impact analysis: Which models will be affected if I change this feature?
  • Usage discovery: Which A/B tests are using this model?
  • Dependency mapping: What data sources does my pipeline transitively depend on?
  • Deprecation planning: Which entities are no longer being used and can be retired?

Every entity has deep context: its creation time, ownership, update history, and most importantly, its relationships to other entities.

The Model Lifecycle Graph is surfaced to practitioners through the AIP Portal, a unified interface that provides full-text search across all entity types, detailed entity pages with navigable relationships, and personalized views for teams and individuals.

A typical interaction in the AIP Portal looks like:

  • Search: Type a model, feature, dataset, or team name into the single search box backed by Elasticsearch.
  • Inspect: Land on an entity page that shows key metadata (description, owners, domains, tags) alongside a relationships panel.
  • Explore: Click through to related entities (upstream datasets, downstream experiments, and sibling model versions) to navigate the Model Lifecycle Graph without leaving the portal.

When new entity types are introduced into MDS, the portal automatically provides baseline search, entity pages, and relationship navigation, and we can then layer on domain-specific visualizations (such as model deployment history or dataset version timelines) over time.

The Road Ahead: Open Challenges

Building the ML lifecycle graph is an ongoing journey. Significant challenges remain, and these represent the future opportunities for us:

  • Tool Proliferation: As new ML tools emerge, we need robust integration patterns that scale. How do we design plugin architectures that make adding new sources seamless? If we don’t keep up with new tools, practitioners will be forced back into fragmented views, and the Model Lifecycle Graph will lose coverage and trust.
  • Domain-Specific Visualizations: Different entity types require distinct visualization experiences. Model pages should display deployment history, A/B test associations, and performance metrics. Feature pages should highlight data lineage and consuming models. Pipeline pages must show execution history, dependencies, and schedules. Dataset pages require versioning timelines and downstream consumers. How do we design a flexible UI framework that allows each entity type to have its own tailored experience while maintaining consistent navigation and interaction patterns across the portal? Without rich, domain-specific experiences, the portal risks becoming a generic catalog rather than a tool that ML practitioners rely on in their daily workflows.
  • Metadata Quality: Today, MDS ensures data consistency through source-of-truth hydration and schema validation at ingestion. Background enrichment jobs continuously infer relationships and materialize entities from source systems. However, challenges remain in ensuring completeness and timeliness at scale. When source systems fail to emit events, when ownership information becomes stale, or when entities lack descriptions and contextual metadata, the graph’s utility degrades. How do we build automated validation and enrichment systems to detect metadata anomalies, suggest missing relationships, and maintain quality benchmarks across millions of entities? Poor or stale metadata erodes practitioner trust: if the graph is incomplete or incorrect, teams will revert to ad hoc knowledge and one-off integrations rather than using MDS as their source of truth.
  • Advanced Relationship Inference: Beyond explicit relationships declared in source systems, how do we infer implicit connections? Can we detect that two models serve similar purposes based on shared features? Can we recommend features based on usage patterns from similar pipelines? We are in the early stages of exploring these ideas. Done well, they would turn MDS from a passive catalog into an active recommendation engine for ML assets, accelerating reuse and reducing duplicate work across domains.

Acknowledgments

This work represents the collective effort of stunning colleagues across the AI Platform organization: Emma Carney, Megan Ren, Nadeem Ahmad, Pat Olenik, Prateek Agarwal, Tigran Hakobyan, Yinglao Liu


Democratizing Machine Learning at Netflix: Building the Model Lifecycle Graph was originally published in Netflix TechBlog on Medium, where people are continuing the conversation by highlighting and responding to this story.
Supercharging the ML and AI Development Experience at Netflix

Post Syndicated from Netflix Technology Blog original https://netflixtechblog.com/supercharging-the-ml-and-ai-development-experience-at-netflix-b2d5b95c63eb

Supercharging the ML and AI Development Experience at Netflix with Metaflow

Shashank Srikanth, Romain Cledat

Metaflow — a framework we started and open-sourced in 2019 — now powers a wide range of ML and AI systems across Netflix and at many other companies. It is well loved by users for helping them take their ML/AI workflows from prototype to production, allowing them to focus on building cutting-edge systems that bring joy and entertainment to audiences worldwide.

Metaflow allows users to:

  1. Iterate and ship quickly by minimizing friction
  2. Operate systems reliably in production with minimal overhead, at Netflix scale.

Metaflow works with many battle-hardened tooling to address the second point — among them Maestro, our newly open-sourced workflow orchestrator that powers nearly every ML and AI system at Netflix and serves as a backbone for Metaflow itself.

In this post, we focus on the first point and introduce a new Metaflow functionality, Spin, that helps users accelerate their iterative development process. By the end, you’ll have a solid understanding of Spin’s capabilities and learn how to try it out yourself with Metaflow 2.19.

Iterative development in ML and AI workflows

Developing a Metaflow flow with cards in VSCode

To understand our approach to improving the ML and AI development experience, it helps to consider how these workflows differ from traditional software engineering.

ML and AI development revolves not just around code but also around data and models, which are large, mutable, and computationally expensive to process. Iteration cycles can involve long-running data transformations, model training, and stochastic processes that yield slightly different results from run to run. These characteristics make fast, stateful iteration a critical part of productive development.

This is where notebooks — such as Jupyter, Observable, or Marimo — shine. Their ability to preserve state in memory allows developers to load a dataset once and iteratively explore, transform, and visualize it without reloading or recomputing from scratch. This persistent, interactive environment turns what would otherwise be a slow, rigid loop into a fluid, exploratory workflow — perfectly suited to the needs of ML and AI practitioners.

Because ML and AI development is computationally intensive, stochastic, and data- and model-centric, tools that optimize iteration speed must treat state management as a first-class design concern. Any system aiming to improve the development experience in this domain must therefore enable quick, incremental experimentation without losing continuity between iterations.

New: rapid, iterative development with spin

At first glance, Metaflow code looks like a workflow — similar to Airflow — but there’s another way to look at it: each Metaflow @step serves as a checkpoint boundary. At the end of every step, Metaflow automatically persists all instance variables as artifacts, allowing the execution to resume seamlessly from that point onward. The below animation shows this behavior in action:

An animated GIF showing how resume can be used in Metaflow. The GIF shows how using `flow.py resume join` makes Metaflow clone previously executed steps and resumes the computation from the `join` step and continues executing till the end of the flow.
Using resume in Metaflow

In a sense, we can consider a @step similar to a notebook cell: it is the smallest unit of execution that updates state upon completion. It does have a few differences that address the issues with notebook cells:

  • The execution order is explicit and deterministic: no surprises due to out-of-order cell execution;
  • The state is not hidden: state is explicitly stored as self. variables as shared state, which can be discovered and inspected;
  • The state is versioned and persisted making results more reproducible.

While Metaflow’s resume feature can approximate the incremental and iterative development approach of notebooks, it restarts execution from the selected step onward, introducing more latency between iterations. In contrast, a notebook allows near-instant feedback by letting users tweak and rerun individual cells while seamlessly reusing data from earlier cells held in memory.

The new spin command in Metaflow 2.19 addresses this gap. Similar to executing a single notebook cell, it quickly executes a single Metaflow @step — with all the state carried over from the parent step. As a result, users can develop and debug Metaflow steps as easily as a cell in a notebook.

The effect becomes clear when considering the three complementary execution modes — run, resume, and spin — side by side, mapping them to the corresponding notebook behavior:

Diagram showing the various modes of execution in Metaflow: Run, Resume and Spin
Run, Resume and Spin “modes”

Another major difference isn’t just what gets executed, but what gets recorded. Both run and resume create a full, versioned run with complete metadata and artifacts, while spin skips tracking altogether. It’s built for fast, throw-away iterations during development.

The one-minute clip below illustrates a typical iterative development workflow that alternates between run and spin. In this example, we are building a flow that reads a dataset from a Parquet file and trains a separate model for each product category, focusing on computer-related categories.

As shown in the video, we start by creating a flow from scratch and running a minimal version of it to persist test artifacts — in this case, a Parquet dataset. From there, we can use spin to iterate on one step at a time, incrementally building out the flow, for example, by adding the parallel training steps demonstrated in the clip.

Once the flow has been iterated on locally, it can be seamlessly deployed to production orchestrators like Maestro or Argo, and scaled up on compute platforms such as AWS Batch, Titus, Kubernetes and more. Thus, the experience is as smooth as developing in a notebook, but the outcome is a production-ready, scalable workflow, implemented as an idiomatic Python project!

Spin up smooth development in VSCode/Cursor

Instead of typing run and spin manually in the terminal, we can bind them to keyboard shortcuts. For example, the simple metaflow-dev VS Code extension (works with Cursor as well) maps Ctrl+Opt+R to run and Ctrl+Opt+S to spin. Just hack away, hit Ctrl+Opt+S, and the extension will save your file and spin the step you are currently editing.

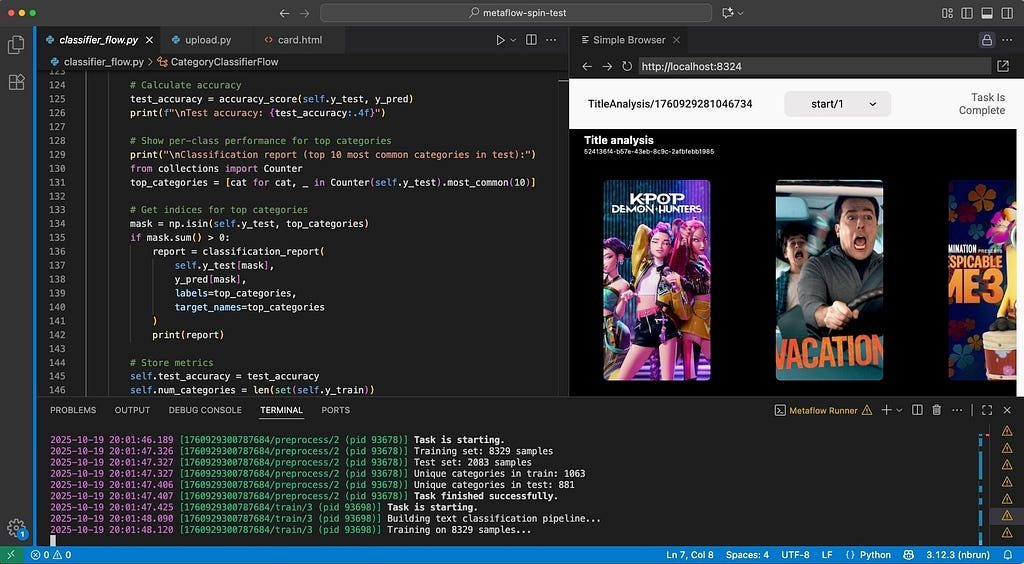
One area where spin truly shines is in creating mini-dashboards and reports with Metaflow Cards. Visualization is another strong point of notebooks but the combination of spin and cards makes Metaflow a very compelling alternative for developing real-time and post-execution visualizations. Developing cards is inherently iterative and visual (much like building web pages) where you want to tweak code and see the results instantly. This workflow is readily available with the combination of VSCode/Cursor, which includes a built-in web-view, the local card viewer, and spin.

To see the trio of tools — along with the VS Code extension — in action, in this short clip we add observability to the train step that we built in the earlier example:

A major benefit of Metaflow Cards is that we don’t need to deploy any extra services, data streams, and databases for observability. Just develop visual outputs as above, deploy the flow, and wehave a complete system in production with reporting and visualizations included.

Spin to the next level: injecting inputs, inspecting outputs

Spin does more than just run code — it also lets us take full control of a spun @step’s inputs and outputs, enabling a range of advanced patterns.

In contrast to notebooks, we can spin any arbitrary @step in a flow using state from any past run, making it easy to test functions with different inputs. For example, if we have multiple models produced by separate runs, we could spin an inference step, supplying a different model run each time.

We can also override artifact values or inject arbitrary Python objects — similar to a notebook cell — for spin. Simply specify a Python module with an ARTIFACTS dictionary:

ARTIFACTS = {
"model": "kmeans",
"k": 15
}

and point spin at the module:

spin train --artifacts-module artifacts.py

By default spin doesn’t persist artifacts, but we can easily change this by adding –persist. Even in this case, artifacts are not persisted in the usual Metaflow datastore but to a directory-specific location which you can easily clean up after testing. We can access the results with the Client API as usual — just specify the directory you want to inspect with inspect_spin:

from metaflow import inspect_spin

inspect_spin(".")
Flow("TrainingFlow").latest_run["train"].task["model"].data

Being able to inspect and modify a step’s inputs and outputs on the fly unlocks a powerful use case: unit testing individual steps. We can use spin programmatically through the Runner API and assert the results:

from metaflow import Runner

with Runner("flow.py").spin("train", persist=True) as spin:
assert spin.task["model"].data == "kmeans"

Making AI agents spin

In addition to speeding up development for humans, spin turns out to be surprisingly handy for coding agents too. There are two major advantages to teaching AI how to spin:

  1. It accelerates the development loop. Agents don’t naturally understand what’s slow, or why speed matters, so they need to be nudged to favor faster tools over slower ones.
  2. It helps surface errors faster and contextualizes them to a specific piece of code, increasing the chance that the agent is able to fix errors by itself.

Metaflow users are already using Claude Code; spin makes this even easier. In the example below, we added the following section in a CLAUDE.md file:

## Developing Metaflow code
Follow this incremental development workflow that ensures quick iterations
and correct results. You must create a flow incrementally, step by step
following this process:
1. Create a flow skeleton with empty `@step`s.
2. Add a data loading step.
3. `run` the flow.
4. Populate the next step and use `spin` to test it with the correct inputs.
5. `run` the flow to record outputs from the new step.
5. Iterate on (4–5) until all steps have been implemented and work correctly.
6. `run` the whole flow to ensure final correctness.

To test a flow, run the flow as follows
```
python flow.py - environment=pypi run
```

Do this once before running `spin`.
As you are building the flow, you `spin` to test steps quickly.
For instance
```
python flow.py - environment=pypi spin train
```

Just based on these quick instructions, the agent is able to use spin effectively. Take a look at the following inspirational example that one-shots Claude to create a flow, along the lines of our earlier examples, which trains a classifier to predict product categories:

In the video, we can see Claude using spin around the 45-second mark to test a preprocess step. The step initially fails due to a classic data science pitfall: during testing, Claude samples only a small subset of data, causing some classes to be underrepresented. The first spin surfaces the issue, which Claude then fixes by switching to stratified sampling — and finally does another spin to confirm the fix, before proceeding to complete the task.

The inner loop of end-to-end ML/AI

To circle back to where we started, our motivation for adding spin — and for creating Metaflow in the first place — is to accelerate development cycles so we can deliver more joy to our subscribers, faster. Ultimately, we believe there’s no single magic feature that makes this possible. It takes all parts of an ML/AI platform working together coherently — spin included.

From this perspective, it’s useful to place spin in the context of other Metaflow features. It’s designed for the innermost loop of model and business-logic development, with the added benefit of supporting unit testing during deployment, as shown in the overall blueprint of the Metaflow toolchain below.

Metaflow tool-chain.
Metaflow tool-chain

In this diagram, the solid blue boxes represent different Metaflow commands, while the blue text denotes decorators and other features. In particular, note the Shared Functionality box — another key focus area for us over the past year — which includes configuration management and custom decorators. These capabilities let domain-specific teams and platform providers tailor Metaflow to their own use cases. Following our ethos of composability, all of these features integrate seamlessly with spin as well.

Another key design philosophy of Metaflow is to let projects start small and simple, adding complexity only when it becomes necessary. So don’t be overwhelmed by the diagram above. To get started, install Metaflow easily with

pip install metaflow

and take your first baby @steps for a spin! Check out the docs and for questions, support, and feedback, join the friendly Metaflow Community Slack.

Acknowledgments

We would like to thank our partners at Outerbounds, and particularly Ville Tuulos, Savin Goyal, and Madhur Tandon, for their collaboration on this feature, from initial ideation to review, testing and documentation. We would also like to acknowledge the rest of the Model Development and Management team (Maria Alder, David J. Berg, Shaojing Li, Rui Lin, Nissan Pow, Chaoying Wang, Regina Wang, Seth Yang, Darin Yu) for their input and comments.


Supercharging the ML and AI Development Experience at Netflix was originally published in Netflix TechBlog on Medium, where people are continuing the conversation by highlighting and responding to this story.

Introducing Configurable Metaflow

Post Syndicated from Netflix Technology Blog original https://netflixtechblog.com/introducing-configurable-metaflow-d2fb8e9ba1c6

David J. Berg*, David Casler^, Romain Cledat*, Qian Huang*, Rui Lin*, Nissan Pow*, Nurcan Sonmez*, Shashank Srikanth*, Chaoying Wang*, Regina Wang*, Darin Yu*
*: Model Development Team, Machine Learning Platform
^: Content Demand Modeling Team

A month ago at QConSF, we showcased how Netflix utilizes Metaflow to power a diverse set of ML and AI use cases, managing thousands of unique Metaflow flows. This followed a previous blog on the same topic. Many of these projects are under constant development by dedicated teams with their own business goals and development best practices, such as the system that supports our content decision makers, or the system that ranks which language subtitles are most valuable for a specific piece of content.

As a central ML and AI platform team, our role is to empower our partner teams with tools that maximize their productivity and effectiveness, while adapting to their specific needs (not the other way around). This has been a guiding design principle with Metaflow since its inception.

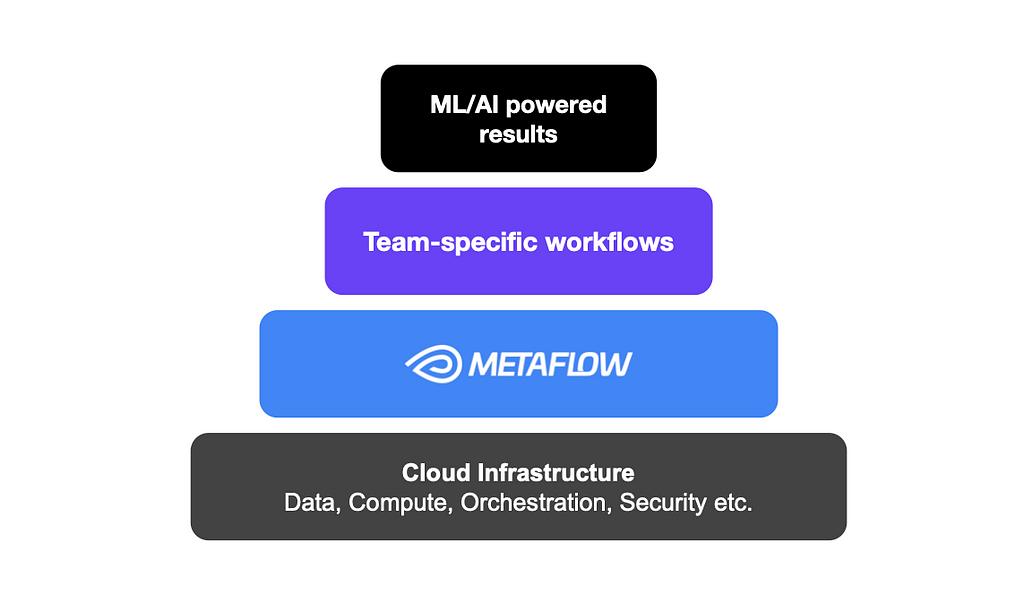
Metaflow infrastructure stack

Standing on the shoulders of our extensive cloud infrastructure, Metaflow facilitates easy access to data, compute, and production-grade workflow orchestration, as well as built-in best practices for common concerns such as collaboration, versioning, dependency management, and observability, which teams use to setup ML/AI experiments and systems that work for them. As a result, Metaflow users at Netflix have been able to run millions of experiments over the past few years without wasting time on low-level concerns.

A long standing FAQ: configurable flows

While Metaflow aims to be un-opinionated about some of the upper levels of the stack, some teams within Netflix have developed their own opinionated tooling. As part of Metaflow’s adaptation to their specific needs, we constantly try to understand what has been developed and, more importantly, what gaps these solutions are filling.

In some cases, we determine that the gap being addressed is very team specific, or too opinionated at too high a level in the stack, and we therefore decide to not develop it within Metaflow. In other cases, however, we realize that we can develop an underlying construct that aids in filling that gap. Note that even in that case, we do not always aim to completely fill the gap and instead focus on extracting a more general lower level concept that can be leveraged by that particular user but also by others. One such recurring pattern we noticed at Netflix is the need to deploy sets of closely related flows, often as part of a larger pipeline involving table creations, ETLs, and deployment jobs. Frequently, practitioners want to experiment with variants of these flows, testing new data, new parameterizations, or new algorithms, while keeping the overall structure of the flow or flows intact.

A natural solution is to make flows configurable using configuration files, so variants can be defined without changing the code. Thus far, there hasn’t been a built-in solution for configuring flows, so teams have built their bespoke solutions leveraging Metaflow’s JSON-typed Parameters, IncludeFile, and deploy-time Parameters or deploying their own home-grown solution (often with great pain). However, none of these solutions make it easy to configure all aspects of the flow’s behavior, decorators in particular.

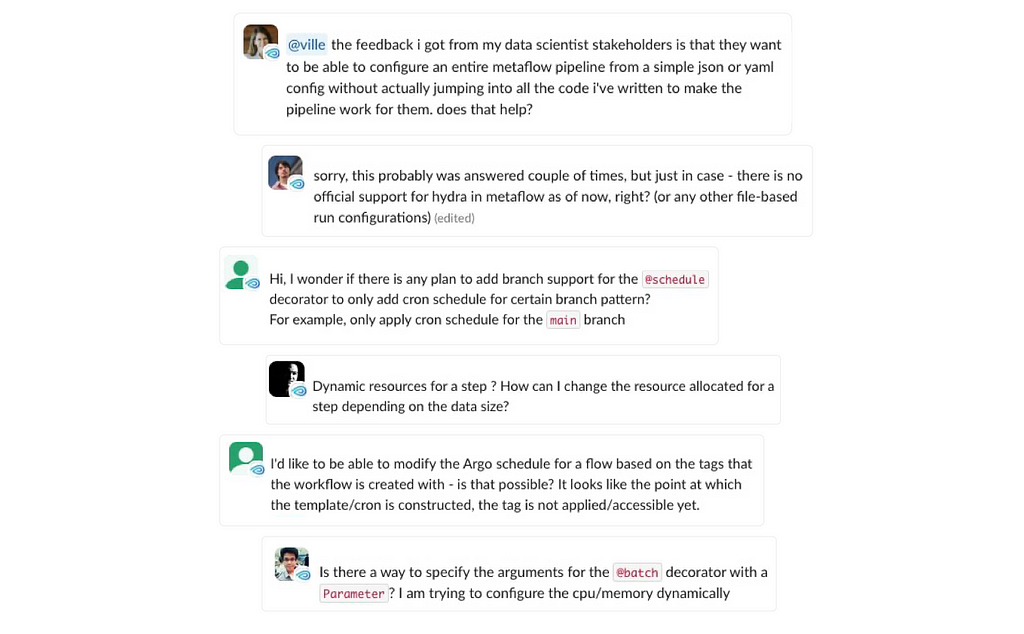
Requests for a feature like Metaflow Config

Outside Netflix, we have seen similar frequently asked questions on the Metaflow community Slack as shown in the user quotes above:

  • how can I adjust the @resource requirements, such as CPU or memory, without having to hardcode the values in my flows?
  • how to adjust the triggering @schedule programmatically, so our production and staging deployments can run at different cadences?

New in Metaflow: Configs!

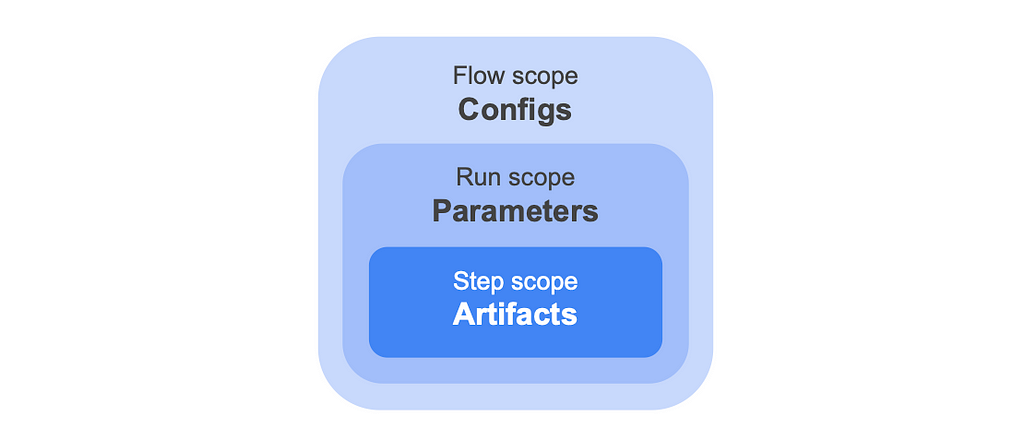
Today, to answer the FAQ, we introduce a new — small but mighty — feature in Metaflow: a Config object. Configs complement the existing Metaflow constructs of artifacts and Parameters, by allowing you to configure all aspects of the flow, decorators in particular, prior to any run starting. At the end of the day, artifacts, Parameters and Configs are all stored as artifacts by Metaflow but they differ in when they are persisted as shown in the diagram below:

Different data artifacts in Metaflow

Said another way:

  • An artifact is resolved and persisted to the datastore at the end of each task.
  • A parameter is resolved and persisted at the start of a run; it can therefore be modified up to that point. One common use case is to use triggers to pass values to a run right before executing. Parameters can only be used within your step code.
  • A config is resolved and persisted when the flow is deployed. When using a scheduler such as Argo Workflows, deployment happens when create’ing the flow. In the case of a local run, “deployment” happens just prior to the execution of the run — think of “deployment” as gathering all that is needed to run the flow. Unlike parameters, configs can be used more widely in your flow code, particularly, they can be used in step or flow level decorators as well as to set defaults for parameters. Configs can of course also be used within your flow.

As an example, you can specify a Config that reads a pleasantly human-readable configuration file, formatted as TOML. The Config specifies a triggering ‘@schedule’ and ‘@resource’ requirements, as well as application-specific parameters for this specific deployment:

[schedule]
cron = "0 * * * *"

[model]
optimizer = "adam"
learning_rate = 0.5

[resources]
cpu = 1

Using the newly released Metaflow 2.13, you can configure a flow with a Config like above, as demonstrated by this flow:

import pprint
from metaflow import FlowSpec, step, Config, resources, config_expr, schedule

@schedule(cron=config_expr("config.schedule.cron"))
class ConfigurableFlow(FlowSpec):
config = Config("config", default="myconfig.toml", parser="tomllib.loads")

@resources(cpu=config.resources.cpu)
@step
def start(self):
print("Config loaded:")
pprint.pp(self.config)
self.next(self.end)

@step
def end(self):
pass

if __name__ == "__main__":
ConfigurableFlow()

There is a lot going on in the code above, a few highlights:

  • you can refer to configs before they have been defined using ‘config_expr’.
  • you can define arbitrary parsers — using a string means the parser doesn’t even have to be present remotely!

From the developer’s point of view, Configs behave like dictionary-like artifacts. For convenience, they support the dot-syntax (when possible) for accessing keys, making it easy to access values in a nested configuration. You can also unpack the whole Config (or a subtree of it) with Python’s standard dictionary unpacking syntax, ‘**config’. The standard dictionary subscript notation is also available.

Since Configs turn into dictionary artifacts, they get versioned and persisted automatically as artifacts. You can access Configs of any past runs easily through the Client API. As a result, your data, models, code, Parameters, Configs, and execution environments are all stored as a consistent bundle — neatly organized in Metaflow namespaces — paving the way for easily reproducible, consistent, low-boilerplate, and now easily configurable experiments and robust production deployments.

More than a humble config file

While you can get far by accompanying your flow with a simple config file (stored in your favorite format, thanks to user-definable parsers), Configs unlock a number of advanced use cases. Consider these examples from the updated documentation:

A major benefit of Config over previous more hacky solutions for configuring flows is that they work seamlessly with other features of Metaflow: you can run steps remotely and deploy flows to production, even when relying on custom parsers, without having to worry about packaging Configs or parsers manually or keeping Configs consistent across tasks. Configs also work with the Runner and Deployer.

The Hollywood principle: don’t call us, we’ll call you

When used in conjunction with a configuration manager like Hydra, Configs enable a pattern that is highly relevant for ML and AI use cases: orchestrating experiments over multiple configurations or sweeping over parameter spaces. While Metaflow has always supported sweeping over parameter grids easily using foreaches, it hasn’t been easily possible to alter the flow itself, e.g. to change @resources or @pypi/@conda dependencies for every experiment.

In a typical case, you trigger a Metaflow flow that consumes a configuration file, changing how a run behaves. With Hydra, you can invert the control: it is Hydra that decides what gets run based on a configuration file. Thanks to Metaflow’s new Runner and Deployer APIs, you can create a Hydra app that operates Metaflow programmatically — for instance, to deploy and execute hundreds of variants of a flow in a large-scale experiment.

Take a look at two interesting examples of this pattern in the documentation. As a teaser, this video shows Hydra orchestrating deployment of tens of Metaflow flows, each of which benchmarks PyTorch using a varying number of CPU cores and tensor sizes, updating a visualization of the results in real-time as the experiment progresses:

Metaboosting Metaflow — based on a true story

To give a motivating example of what configurations look like at Netflix in practice, let’s consider Metaboost, an internal Netflix CLI tool that helps ML practitioners manage, develop and execute their cross-platform projects, somewhat similar to the open-source Hydra discussed above but with specific integrations to the Netflix ecosystem. Metaboost is an example of an opinionated framework developed by a team already using Metaflow. In fact, a part of the inspiration for introducing Configs in Metaflow came from this very use case.

Metaboost serves as a single interface to three different internal platforms at Netflix that manage ETL/Workflows (Maestro), Machine Learning Pipelines (Metaflow) and Data Warehouse Tables (Kragle). In this context, having a single configuration system to manage a ML project holistically gives users increased project coherence and decreased project risk.

Configuration in Metaboost

Ease of configuration and templatizing are core values of Metaboost. Templatizing in Metaboost is achieved through the concept of bindings, wherein we can bind a Metaflow pipeline to an arbitrary label, and then create a corresponding bespoke configuration for that label. The binding-connected configuration is then merged into a global set of configurations containing such information as GIT repository, branch, etc. Binding a Metaflow, will also signal to Metaboost that it should instantiate the Metaflow flow once per binding into our orchestration cluster.

Imagine a ML practitioner on the Netflix Content ML team, sourcing features from hundreds of columns in our data warehouse, and creating a multitude of models against a growing suite of metrics. When a brand new content metric comes along, with Metaboost, the first version of the metric’s predictive model can easily be created by simply swapping the target column against which the model is trained.

Subsequent versions of the model will result from experimenting with hyper parameters, tweaking feature engineering, or conducting feature diets. Metaboost’s bindings, and their integration with Metaflow Configs, can be leveraged to scale the number of experiments as fast as a scientist can create experiment based configurations.

Scaling experiments with Metaboost bindings — backed by Metaflow Config

Consider a Metaboost ML project named `demo` that creates and loads data to custom tables (ETL managed by Maestro), and then trains a simple model on this data (ML Pipeline managed by Metaflow). The project structure of this repository might look like the following:

├── metaflows
│ ├── custom -> custom python code, used by
| | | Metaflow
│ │ ├── data.py
│ │ └── model.py
│ └── training.py -> defines our Metaflow pipeline
├── schemas
│ ├── demo_features_f.tbl.yaml -> table DDL, stores our ETL
| | output, Metaflow input
│ └── demo_predictions_f.tbl.yaml -> table DDL,
| stores our Metaflow output
├── settings
│ ├── settings.configuration.EXP_01.yaml -> defines the additive
| | config for Experiment 1
│ ├── settings.configuration.EXP_02.yaml -> defines the additive
| | config for Experiment 2
│ ├── settings.configuration.yaml -> defines our global
| | configuration
│ └── settings.environment.yaml -> defines parameters based on
| git branch (e.g. READ_DB)
├── tests
├── workflows
│ ├── sql
│ ├── demo.demo_features_f.sch.yaml -> Maestro workflow, defines ETL
│ └── demo.main.sch.yaml -> Maestro workflow, orchestrates
| ETLs and Metaflow
└── metaboost.yaml -> defines our project for
Metaboost

The configuration files in the settings directory above contain the following YAML files:

# settings.configuration.yaml (global configuration)
model:
fit_intercept: True
conda:
numpy: '1.22.4'
"scikit-learn": '1.4.0'
# settings.configuration.EXP_01.yaml
target_column: metricA
features:
- runtime
- content_type
- top_billed_talent
# settings.configuration.EXP_02.yaml
target_column: metricA
features:
- runtime
- director
- box_office

Metaboost will merge each experiment configuration (*.EXP*.yaml) into the global configuration (settings.configuration.yaml) individually at Metaboost command initialization. Let’s take a look at how Metaboost combines these configurations with a Metaboost command:

(venv-demo) ~/projects/metaboost-demo [branch=demoX] 
$ metaboost metaflow settings show --yaml-path=configuration

binding=EXP_01:
model: -> defined in setting.configuration.yaml (global)
fit_intercept: true
conda: -> defined in setting.configuration.yaml (global)
numpy: 1.22.4
"scikit-learn": 1.4.0
target_column: metricA -> defined in setting.configuration.EXP_01.yaml
features: -> defined in setting.configuration.EXP_01.yaml
- runtime
- content_type
- top_billed_talent

binding=EXP_02:
model: -> defined in setting.configuration.yaml (global)
fit_intercept: true
conda: -> defined in setting.configuration.yaml (global)
numpy: 1.22.4
"scikit-learn": 1.4.0
target_column: metricA -> defined in setting.configuration.EXP_02.yaml
features: -> defined in setting.configuration.EXP_02.yaml
- runtime
- director
- box_office

Metaboost understands it should deploy/run two independent instances of training.py — one for the EXP_01 binding and one for the EXP_02 binding. You can also see that Metaboost is aware that the tables and ETL workflows are not bound, and should only be deployed once. These details of which artifacts to bind and which to leave unbound are encoded in the project’s top-level metaboost.yaml file.

(venv-demo) ~/projects/metaboost-demo [branch=demoX] 
$ metaboost project list

Tables (metaboost table list):
schemas/demo_predictions_f.tbl.yaml (binding=default):
table_path=prodhive/demo_db/demo_predictions_f
schemas/demo_features_f.tbl.yaml (binding=default):
table_path=prodhive/demo_db/demo_features_f

Workflows (metaboost workflow list):
workflows/demo.demo_features_f.sch.yaml (binding=default):
cluster=sandbox, workflow.id=demo.branch_demox.demo_features_f
workflows/demo.main.sch.yaml (binding=default):
cluster=sandbox, workflow.id=demo.branch_demox.main

Metaflows (metaboost metaflow list):
metaflows/training.py (binding=EXP_01): -> EXP_01 instance of training.py
cluster=sandbox, workflow.id=demo.branch_demox.EXP_01.training
metaflows/training.py (binding=EXP_02): -> EXP_02 instance of training.py
cluster=sandbox, workflow.id=demo.branch_demox.EXP_02.training

Below is a simple Metaflow pipeline that fetches data, executes feature engineering, and trains a LinearRegression model. The work to integrate Metaboost Settings into a user’s Metaflow pipeline (implemented using Metaflow Configs) is as easy as adding a single mix-in to the FlowSpec definition:

from metaflow import FlowSpec, Parameter, conda_base, step
from custom.data import feature_engineer, get_data
from metaflow.metaboost import MetaboostSettings

@conda_base(
libraries=MetaboostSettings.get_deploy_time_settings("configuration.conda")
)
class DemoTraining(FlowSpec, MetaboostSettings):
prediction_date = Parameter("prediction_date", type=int, default=-1)

@step
def start(self):
# get show_settings() for free with the mixin
# and get convenient debugging info
self.show_settings(exclude_patterns=["artifact*", "system*"])

self.next(self.get_features)

@step
def get_features(self):
# feature engineers on our extracted data
self.fe_df = feature_engineer(
# loads data from our ETL pipeline
data=get_data(prediction_date=self.prediction_date),
features=self.settings.configuration.features +
[self.settings.configuration.target_column]
)

self.next(self.train)

@step
def train(self):
from sklearn.linear_model import LinearRegression

# trains our model
self.model = LinearRegression(
fit_intercept=self.settings.configuration.model.fit_intercept
).fit(
X=self.fe_df[self.settings.configuration.features],
y=self.fe_df[self.settings.configuration.target_column]
)
print(f"Fit slope: {self.model.coef_[0]}")
print(f"Fit intercept: {self.model.intercept_}")

self.next(self.end)

@step
def end(self):
pass


if __name__ == "__main__":
DemoTraining()

The Metaflow Config is added to the FlowSpec by mixing in the MetaboostSettings class. Referencing a configuration value is as easy as using the dot syntax to drill into whichever parameter you’d like.

Finally let’s take a look at the output from our sample Metaflow above. We execute experiment EXP_01 with

metaboost metaflow run --binding=EXP_01

which upon execution will merge the configurations into a single settings file (shown previously) and serialize it as a yaml file to the .metaboost/settings/compiled/ directory.

You can see the actual command and args that were sub-processed in the Metaboost Execution section below. Please note the –config argument pointing to the serialized yaml file, and then subsequently accessible via self.settings. Also note the convenient printing of configuration values to stdout during the start step using a mixed in function named show_settings().

(venv-demo) ~/projects/metaboost-demo [branch=demoX] 
$ metaboost metaflow run --binding=EXP_01

Metaboost Execution:
- python3.10 /root/repos/cdm-metaboost-irl/metaflows/training.py
--no-pylint --package-suffixes=.py --environment=conda
--config settings
.metaboost/settings/compiled/settings.branch_demox.EXP_01.training.mP4eIStG.yaml
run --prediction_date20241006

Metaflow 2.12.39+nflxfastdata(2.13.5);nflx(2.13.5);metaboost(0.0.27)
executing DemoTraining for user:dcasler
Validating your flow...
The graph looks good!
Bootstrapping Conda environment... (this could take a few minutes)
All packages already cached in s3.
All environments already cached in s3.

Workflow starting (run-id 50), see it in the UI at
https://metaflowui.prod.netflix.net/DemoTraining/50

[50/start/251640833] Task is starting.
[50/start/251640833] Configuration Values:
[50/start/251640833] settings.configuration.conda.numpy = 1.22.4
[50/start/251640833] settings.configuration.features.0 = runtime
[50/start/251640833] settings.configuration.features.1 = content_type
[50/start/251640833] settings.configuration.features.2 = top_billed_talent
[50/start/251640833] settings.configuration.model.fit_intercept = True
[50/start/251640833] settings.configuration.target_column = metricA
[50/start/251640833] settings.environment.READ_DATABASE = data_warehouse_prod
[50/start/251640833] settings.environment.TARGET_DATABASE = demo_dev
[50/start/251640833] Task finished successfully.

[50/get_features/251640840] Task is starting.
[50/get_features/251640840] Task finished successfully.

[50/train/251640854] Task is starting.
[50/train/251640854] Fit slope: 0.4702672504331096
[50/train/251640854] Fit intercept: -6.247919678070083
[50/train/251640854] Task finished successfully.

[50/end/251640868] Task is starting.
[50/end/251640868] Task finished successfully.

Done! See the run in the UI at
https://metaflowui.prod.netflix.net/DemoTraining/50

Takeaways

Metaboost is an integration tool that aims to ease the project development, management and execution burden of ML projects at Netflix. It employs a configuration system that combines git based parameters, global configurations and arbitrarily bound configuration files for use during execution against internal Netflix platforms.

Integrating this configuration system with the new Config in Metaflow is incredibly simple (by design), only requiring users to add a mix-in class to their FlowSpec — similar to this example in Metaflow documentation — and then reference the configuration values in steps or decorators. The example above templatizes a training Metaflow for the sake of experimentation, but users could just as easily use bindings/configs to templatize their flows across target metrics, business initiatives or any other arbitrary lines of work.

Try it at home

It couldn’t be easier to get started with Configs! Just

pip install -U metaflow

to get the latest version and head to the updated documentation for examples. If you are impatient, you can find and execute all config-related examples in this repository as well.

If you have any questions or feedback about Config (or other Metaflow features), you can reach out to us at the Metaflow community Slack.

Acknowledgments

We would like to thank Outerbounds for their collaboration on this feature; for rigorously testing it and developing a repository of examples to showcase some of the possibilities offered by this feature.


Introducing Configurable Metaflow was originally published in Netflix TechBlog on Medium, where people are continuing the conversation by highlighting and responding to this story.

Scaling Media Machine Learning at Netflix

Post Syndicated from Netflix Technology Blog original https://netflixtechblog.com/scaling-media-machine-learning-at-netflix-f19b400243

By Gustavo Carmo, Elliot Chow, Nagendra Kamath, Akshay Modi, Jason Ge, Wenbing Bai, Jackson de Campos, Lingyi Liu, Pablo Delgado, Meenakshi Jindal, Boris Chen, Vi Iyengar, Kelli Griggs, Amir Ziai, Prasanna Padmanabhan, and Hossein Taghavi

Figure 1 – Media Machine Learning Infrastructure

Introduction

In 2007, Netflix started offering streaming alongside its DVD shipping services. As the catalog grew and users adopted streaming, so did the opportunities for creating and improving our recommendations. With a catalog spanning thousands of shows and a diverse member base spanning millions of accounts, recommending the right show to our members is crucial.

Why should members care about any particular show that we recommend? Trailers and artworks provide a glimpse of what to expect in that show. We have been leveraging machine learning (ML) models to personalize artwork and to help our creatives create promotional content efficiently.

Our goal in building a media-focused ML infrastructure is to reduce the time from ideation to productization for our media ML practitioners. We accomplish this by paving the path to:

  • Accessing and processing media data (e.g. video, image, audio, and text)
  • Training large-scale models efficiently
  • Productizing models in a self-serve fashion in order to execute on existing and newly arriving assets
  • Storing and serving model outputs for consumption in promotional content creation

In this post, we will describe some of the challenges of applying machine learning to media assets, and the infrastructure components that we have built to address them. We will then present a case study of using these components in order to optimize, scale, and solidify an existing pipeline. Finally, we’ll conclude with a brief discussion of the opportunities on the horizon.

Infrastructure challenges and components

In this section, we highlight some of the unique challenges faced by media ML practitioners, along with the infrastructure components that we have devised to address them.

Media Access: Jasper

In the early days of media ML efforts, it was very hard for researchers to access media data. Even after gaining access, one needed to deal with the challenges of homogeneity across different assets in terms of decoding performance, size, metadata, and general formatting.

To streamline this process, we standardized media assets with pre-processing steps that create and store dedicated quality-controlled derivatives with associated snapshotted metadata. In addition, we provide a unified library that enables ML practitioners to seamlessly access video, audio, image, and various text-based assets.

Media Feature Storage: Amber Storage

Media feature computation tends to be expensive and time-consuming. Many ML practitioners independently computed identical features against the same asset in their ML pipelines.

To reduce costs and promote reuse, we have built a feature store in order to memoize features/embeddings tied to media entities. This feature store is equipped with a data replication system that enables copying data to different storage solutions depending on the required access patterns.

Compute Triggering and Orchestration: Amber Orchestration

Productized models must run over newly arriving assets for scoring. In order to satisfy this requirement, ML practitioners had to develop bespoke triggering and orchestration components per pipeline. Over time, these bespoke components became the source of many downstream errors and were difficult to maintain.

Amber is a suite of multiple infrastructure components that offers triggering capabilities to initiate the computation of algorithms with recursive dependency resolution.

Training Performance

Media model training poses multiple system challenges in storage, network, and GPUs. We have developed a large-scale GPU training cluster based on Ray, which supports multi-GPU / multi-node distributed training. We precompute the datasets, offload the preprocessing to CPU instances, optimize model operators within the framework, and utilize a high-performance file system to resolve the data loading bottleneck, increasing the entire training system throughput 3–5 times.

Serving and Searching

Media feature values can be optionally synchronized to other systems depending on necessary query patterns. One of these systems is Marken, a scalable service used to persist feature values as annotations, which are versioned and strongly typed constructs associated with Netflix media entities such as videos and artwork.

This service provides a user-friendly query DSL for applications to perform search operations over these annotations with specific filtering and grouping. Marken provides unique search capabilities on temporal and spatial data by time frames or region coordinates, as well as vector searches that are able to scale up to the entire catalog.

ML practitioners interact with this infrastructure mostly using Python, but there is a plethora of tools and platforms being used in the systems behind the scenes. These include, but are not limited to, Conductor, Dagobah, Metaflow, Titus, Iceberg, Trino, Cassandra, Elastic Search, Spark, Ray, MezzFS, S3, Baggins, FSx, and Java/Scala-based applications with Spring Boot.

Case study: scaling match cutting using the media ML infra

The Media Machine Learning Infrastructure is empowering various scenarios across Netflix, and some of them are described here. In this section, we showcase the use of this infrastructure through the case study of Match Cutting.

Background

Match Cutting is a video editing technique. It’s a transition between two shots that uses similar visual framing, composition, or action to fluidly bring the viewer from one scene to the next. It is a powerful visual storytelling tool used to create a connection between two scenes.

Figure 2 – a series of frame match cuts from Wednesday.

In an earlier post, we described how we’ve used machine learning to find candidate pairs. In this post, we will focus on the engineering and infrastructure challenges of delivering this feature.

Where we started

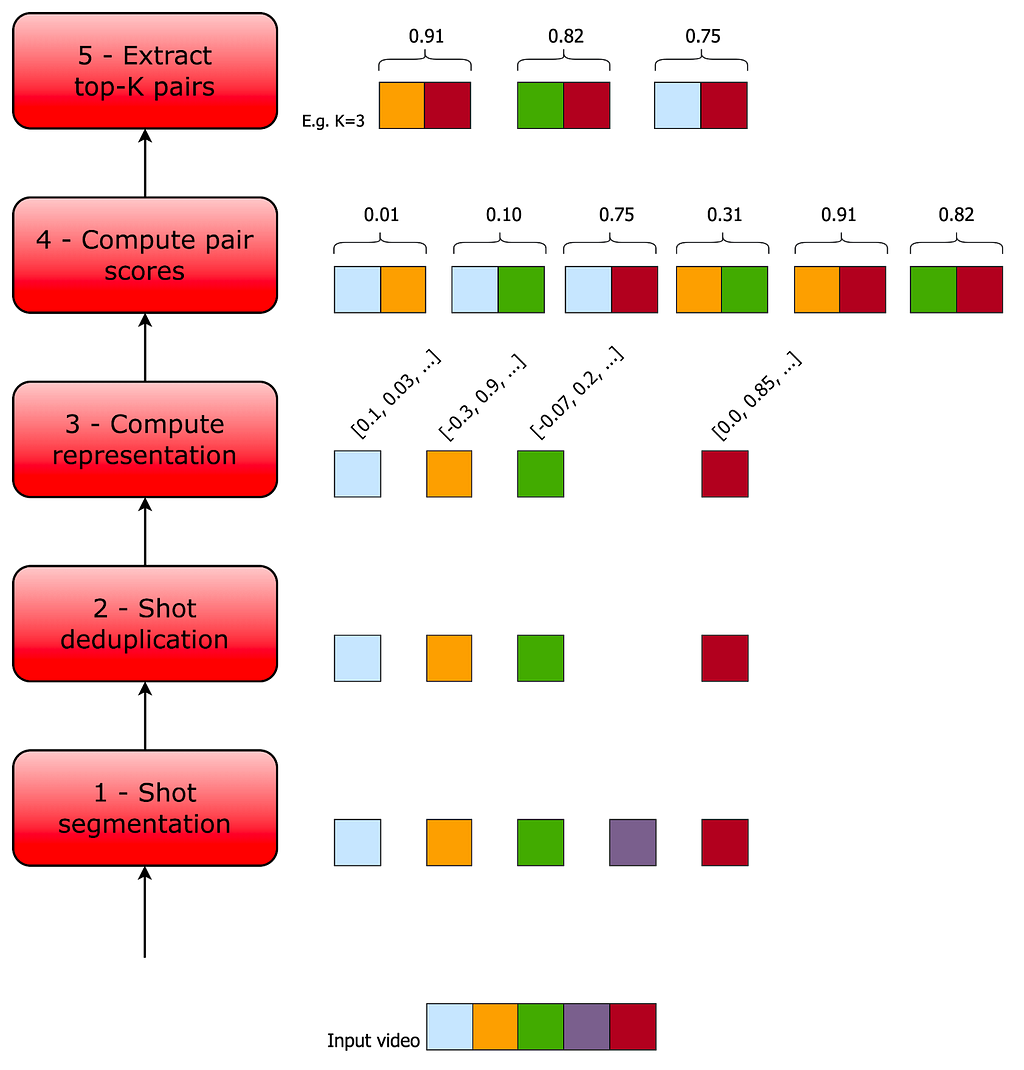
Initially, we built Match Cutting to find matches across a single title (i.e. either a movie or an episode within a show). An average title has 2k shots, which means that we need to enumerate and process ~2M pairs.

Figure 3- The original Match Cutting pipeline before leveraging media ML infrastructure components.

This entire process was encapsulated in a single Metaflow flow. Each step was mapped to a Metaflow step, which allowed us to control the amount of resources used per step.

Step 1

We download a video file and produce shot boundary metadata. An example of this data is provided below:

SB = {0: [0, 20], 1: [20, 30], 2: [30, 85], …}

Each key in the SB dictionary is a shot index and each value represents the frame range corresponding to that shot index. For example, for the shot with index 1 (the second shot), the value captures the shot frame range [20, 30], where 20 is the start frame and 29 is the end frame (i.e. the end of the range is exclusive while the start is inclusive).

Using this data, we then materialized individual clip files (e.g. clip0.mp4, clip1.mp4, etc) corresponding to each shot so that they can be processed in Step 2.

Step 2

This step works with the individual files produced in Step 1 and the list of shot boundaries. We first extract a representation (aka embedding) of each file using a video encoder (i.e. an algorithm that converts a video to a fixed-size vector) and use that embedding to identify and remove duplicate shots.

In the following example SB_deduped is the result of deduplicating SB:

# the second shot (index 1) was removed and so was clip1.mp4
SB_deduped = {0: [0, 20], 2: [30, 85], …}

SB_deduped along with the surviving files are passed along to step 3.

Step 3

We compute another representation per shot, depending on the flavor of match cutting.

Step 4

We enumerate all pairs and compute a score for each pair of representations. These scores are stored along with the shot metadata:

[
# shots with indices 12 and 729 have a high matching score
{shot1: 12, shot2: 729, score: 0.96},
# shots with indices 58 and 419 have a low matching score
{shot1: 58, shot2: 410, score: 0.02},

]

Step 5

Finally, we sort the results by score in descending order and surface the top-K pairs, where K is a parameter.

The problems we faced

This pattern works well for a single flavor of match cutting and finding matches within the same title. As we started venturing beyond single-title and added more flavors, we quickly faced a few problems.

Lack of standardization

The representations we extract in Steps 2 and Step 3 are sensitive to the characteristics of the input video files. In some cases such as instance segmentation, the output representation in Step 3 is a function of the dimensions of the input file.

Not having a standardized input file format (e.g. same encoding recipes and dimensions) created matching quality issues when representations across titles with different input files needed to be processed together (e.g. multi-title match cutting).

Wasteful repeated computations

Segmentation at the shot level is a common task used across many media ML pipelines. Also, deduplicating similar shots is a common step that a subset of those pipelines shares.

We realized that memoizing these computations not only reduces waste but also allows for congruence between algo pipelines that share the same preprocessing step. In other words, having a single source of truth for shot boundaries helps us guarantee additional properties for the data generated downstream. As a concrete example, knowing that algo A and algo B both used the same shot boundary detection step, we know that shot index i has identical frame ranges in both. Without this knowledge, we’ll have to check if this is actually true.

Gaps in media-focused pipeline triggering and orchestration

Our stakeholders (i.e. video editors using match cutting) need to start working on titles as quickly as the video files land. Therefore, we built a mechanism to trigger the computation upon the landing of new video files. This triggering logic turned out to present two issues:

  1. Lack of standardization meant that the computation was sometimes re-triggered for the same video file due to changes in metadata, without any content change.
  2. Many pipelines independently developed similar bespoke components for triggering computation, which created inconsistencies.

Additionally, decomposing the pipeline into modular pieces and orchestrating computation with dependency semantics did not map to existing workflow orchestrators such as Conductor and Meson out of the box. The media machine learning domain needed to be mapped with some level of coupling between media assets metadata, media access, feature storage, feature compute and feature compute triggering, in a way that new algorithms could be easily plugged with predefined standards.

This is where Amber comes in, offering a Media Machine Learning Feature Development and Productization Suite, gluing all aspects of shipping algorithms while permitting the interdependency and composability of multiple smaller parts required to devise a complex system.

Each part is in itself an algorithm, which we call an Amber Feature, with its own scope of computation, storage, and triggering. Using dependency semantics, an Amber Feature can be plugged into other Amber Features, allowing for the composition of a complex mesh of interrelated algorithms.

Match Cutting across titles

Step 4 entails a computation that is quadratic in the number of shots. For instance, matching across a series with 10 episodes with an average of 2K shots per episode translates into 200M comparisons. Matching across 1,000 files (across multiple shows) would take approximately 200 trillion computations.

Setting aside the sheer number of computations required momentarily, editors may be interested in considering any subset of shows for matching. The naive approach is to pre-compute all possible subsets of shows. Even assuming that we only have 1,000 video files, this means that we have to pre-compute 2¹⁰⁰⁰ subsets, which is more than the number of atoms in the observable universe!

Ideally, we want to use an approach that avoids both issues.

Where we landed

The Media Machine Learning Infrastructure provided many of the building blocks required for overcoming these hurdles.

Standardized video encodes

The entire Netflix catalog is pre-processed and stored for reuse in machine learning scenarios. Match Cutting benefits from this standardization as it relies on homogeneity across videos for proper matching.

Shot segmentation and deduplication reuse

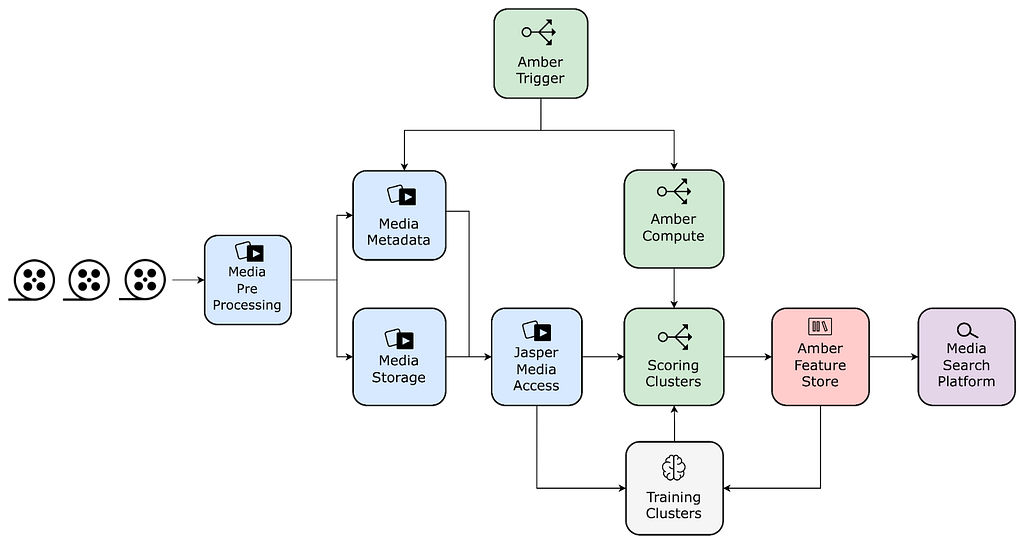
Videos are matched at the shot level. Since breaking videos into shots is a very common task across many algorithms, the infrastructure team provides this canonical feature that can be used as a dependency for other algorithms. With this, we were able to reuse memoized feature values, saving on compute costs and guaranteeing coherence of shot segments across algos.

Orchestrating embedding computations

We have used Amber’s feature dependency semantics to tie the computation of embeddings to shot deduplication. Leveraging Amber’s triggering, we automatically initiate scoring for new videos as soon as the standardized video encodes are ready. Amber handles the computation in the dependency chain recursively.

Feature value storage

We store embeddings in Amber, which guarantees immutability, versioning, auditing, and various metrics on top of the feature values. This also allows other algorithms to be built on top of the Match Cutting output as well as all the intermediate embeddings.

Compute pairs and sink to Marken

We have also used Amber’s synchronization mechanisms to replicate data from the main feature value copies to Marken, which is used for serving.

Media Search Platform

Used to serve high-scoring pairs to video editors in internal applications via Marken.

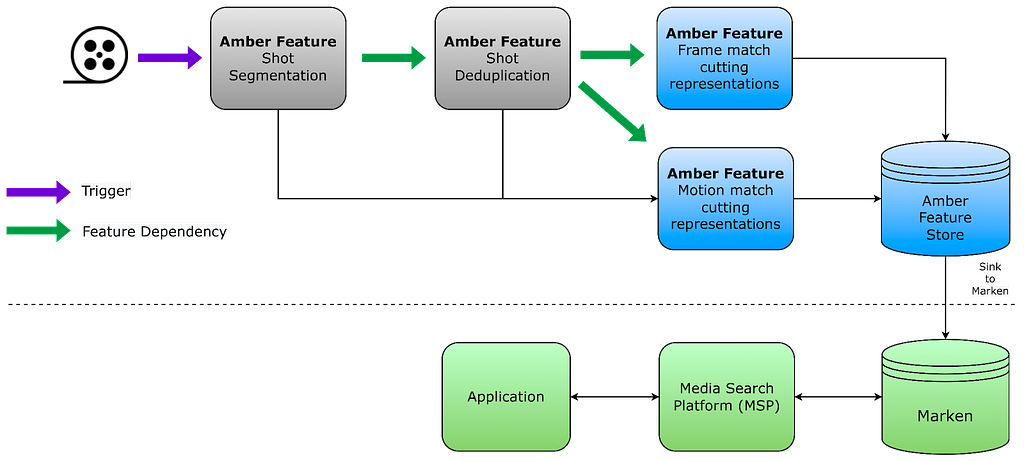
The following figure depicts the new pipeline using the above-mentioned components:

Figure 4 – Match cutting pipeline built using media ML infrastructure components. Interactions between algorithms are expressed as a feature mesh, and each Amber Feature encapsulates triggering and compute.

Conclusion and Future Work

The intersection of media and ML holds numerous prospects for innovation and impact. We examined some of the unique challenges that media ML practitioners face and presented some of our early efforts in building a platform that accommodates the scaling of ML solutions.

In addition to the promotional media use cases we discussed, we are extending the infrastructure to facilitate a growing set of use cases. Here are just a few examples:

  • ML-based VFX tooling
  • Improving recommendations using a suite of content understanding models
  • Enriching content understanding ML and creative tooling by leveraging personalization signals and insights

In future posts, we’ll dive deeper into more details about the solutions built for each of the components we have briefly described in this post.

If you’re interested in media ML, we’re always looking for engineers and ML researchers and practitioners to join us!

Acknowledgments

Special thanks to Ben Klein, Fernando Amat Gil, Varun Sekhri, Guru Tahasildar, and Burak Bacioglu for contributing to ideas, designs, and discussions.


Scaling Media Machine Learning at Netflix was originally published in Netflix TechBlog on Medium, where people are continuing the conversation by highlighting and responding to this story.