This post is written by Rafa Xu, Cloud Architect, Serverless and Joely Huang, Cloud Architect, Serverless.
Amazon Simple Notification Service (SNS) is a fast, flexible, fully managed push messaging service in the cloud. SNS can send mobile push notifications directly to applications on mobile devices such as message alerts and badge updates. SNS sends push notifications to a mobile endpoint created by supplying a mobile token and platform application.
When publishing mobile push notifications, a device token is used to generate an endpoint. This identifies where the push notification is sent (target destination). To push notifications successfully, the token must be up to date and the endpoint must be validated and enabled.
A common challenge when pushing notifications is keeping the token up to date. Tokens can automatically change due to reasons such as mobile operating system (OS) updates and application store updates.
This post provides a serverless solution to this challenge. It also provides a way to publish push notifications to specific end users by maintaining a mapping between users, endpoints, and tokens.
Overview
To publish mobile push notifications using SNS, generate an SNS endpoint to use as a destination target for the push notification. To create the endpoint, you must supply:
A mobile application token: The mobile operating system (OS) issues the token to the application. It is a unique identifier for the application and mobile device pair.
Platform Application Amazon Resource Name (ARN): SNS provides this ARN when you create a platform application object. The platform application object requires a valid set of credentials issued by the mobile platform, which you provide to SNS.
Once the endpoint is generated, you can store and reuse it again. This prevents the application from creating endpoints indefinitely, which could exhaust the SNS endpoint limit.
To reuse the endpoints and successfully push notifications, there are a number of challenges:
Mobile application tokens can change due to a number of reasons, such as application updates. As a result, the publisher must update the platform endpoint to ensure it uses an up-to-date token.
Mobile application tokens can become invalid. When this happens, messages won’t be published, and SNS disables the endpoint with the invalid token. To resolve this, publishers must retrieve a valid token and re-enable the platform endpoint
Mobile applications can have many users, each user could have multiple devices, or one device could have multiple users. To send a push notification to a specific user, a mapping between the user, device, and platform endpoints should be maintained.
For more information on best practices for managing mobile tokens, refer to this post.
Follow along the blog post to learn how to implement a serverless workflow for managing and maintaining valid endpoints and user mappings.
Solution overview
The solution uses the following AWS services:
Amazon API Gateway: Provides a token registration endpoint URL used by the mobile application. Once called, it invokes an AWS Lambda function via the Lambda integration.
Amazon SNS: Generates and maintains the target endpoint and manages platform application objects.
Amazon DynamoDB: Serverless database for storing endpoints that also maintains a mapping between the user, endpoint, and mobile operating system.
AWS Lambda: Retrieves endpoints from DynamoDB, validates and generates endpoints, and publishes notifications by making requests to SNS.
The following diagram represents a simplified interaction flow between the AWS services:
To register the token, the mobile app invokes the registration token endpoint URL generated by Amazon API Gateway. The token registration happens every time a user logs in or opens the application. This ensures that the token and endpoints are always valid during the application usage.
The mobile application passes the token, user, and mobileOS as parameters to API Gateway, which forwards the request to the Lambda function.
The Lambda function validates the token and endpoint for the user by making API calls to DynamoDB and SNS:
The Lambda function checks DynamoDB to see if the endpoint has been previously created.
To deploy the AWS SAM template, navigate to the directory where the template is located. Run the commands in the terminal:
git clone https://github.com/aws-samples/serverless-mobile-push-notification
cd serverless-mobile-push-notification
sam build
sam deploy --guided
Lambda function code snippets
The following section explains code from the Lambda function for the workflow.
Create the platform endpoint
If the endpoint exists, store it as a variable in the code. If the platform endpoint does not exist in the DynamoDB database, create a new endpoint:
need_update_ddb = False
response = table.get_item(Key={'username': username, 'appos': appos})
if 'Item' not in response:
# create endpoint
response = snsClient.create_platform_endpoint(
PlatformApplicationArn=SUPPORTED_PLATFORM[appos],
Token=token,
)
devicePushEndpoint = response['EndpointArn']
need_update_ddb = True
else:
# update the endpoint
devicePushEndpoint = response['Item']['endpoint']
Check and update endpoint attributes
Check that the token attribute for the platform endpoint matches the token received from the mobile application through the request. This also checks for the endpoint “enabled” attribute and re-enables the endpoint if necessary:
As best practice, the code cleans up the table, in case there are multiple entries for the same endpoint mapped to different users. This can happen when the mobile application is used by multiple users on the same device. When one user logs out and a different user logs in, this creates a new entry in the DynamoDB table to map the endpoint with the new user.
As a result, you must remove the entry that maps the same endpoint to the previously logged in user. This way, you only keep the endpoint that matches the user provided by the mobile application through the request.
result = table.query(
# Add the name of the index you want to use in your query.
IndexName="endpoint-index",
KeyConditionExpression=Key('endpoint').eq(devicePushEndpoint),
)
for item in result['Items']:
if item['username'] != username and item['appos'] == appos:
print(f"deleting orphan item: username {username}, os {appos}".format(username=item['username'], appos=appos))
table.delete_item(
Key={
'username': item['username'],
'appos': appos
},
)
Conclusion
This blog shows how to deploy a serverless solution for validating and managing SNS platform endpoints and tokens. To publish push notifications successfully, use SNS to check the endpoint attribute and ensure it is mapped to the correct token and the endpoint is enabled.
This approach uses DynamoDB to store the device token and platform endpoints for each user. This allows you to send push notifications to specific users, retrieve, and reuse previously created endpoints. You create a Lambda function to facilitate the workflow, including validating the DynamoDB item for storing an enabled and up-to-date token.
This series of blog posts uses the AWS Well-Architected Tool with the Serverless Lens to help customers build and operate applications using best practices. In each post, I address the serverless-specific questions identified by the Serverless Lens along with the recommended best practices. See the introduction post for a table of contents and explanation of the example application.
PERF 1. Optimizing your serverless application’s performance
This post continues part 1 of this security question. Previously, I cover measuring and optimizing function startup time. I explain cold and warm starts and how to reuse the Lambda execution environment to improve performance. I show a number of ways to analyze and optimize the initialization startup time. I explain how only importing necessary libraries and dependencies increases application performance.
Good practice: Design your function to take advantage of concurrency via asynchronous and stream-based invocations
AWS Lambda functions can be invoked synchronously and asynchronously.
Favor asynchronous over synchronous request-response processing.
Consider using asynchronous event processing rather than synchronous request-response processing. You can use asynchronous processing to aggregate queues, streams, or events for more efficient processing time per invocation. This reduces wait times and latency from requesting apps and functions.
When you invoke a Lambda function with a synchronous invocation, you wait for the function to process the event and return a response.
Synchronous invocation
As synchronous processing involves a request-response pattern, the client caller also needs to wait for a response from a downstream service. If the downstream service then needs to call another service, you end up chaining calls that can impact service reliability, in addition to response times. For example, this POST /order request must wait for the response to the POST /invoice request before responding to the client caller.
Example synchronous processing
The more services you integrate, the longer the response time, and you can no longer sustain complex workflows using synchronous transactions.
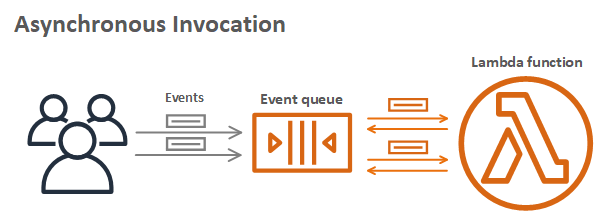
Asynchronous processing allows you to decouple the request-response using events without waiting for a response from the function code. This allows you to perform background processing without requiring the client to wait for a response, improving client performance. You pass the event to an internal Lambda queue for processing and Lambda handles the rest. An external process, separate from the function, manages polling and retries. Using this asynchronous approach can also make it easier to handle unpredictable traffic with significant volumes.
Asynchronous invocation
For example, the client makes a POST /order request to the order service. The order service accepts the request and returns that it has been received, without waiting for the invoice service. The order service then makes an asynchronous POST /invoice request to the invoice service, which can then process independently of the order service. If the client must receive data from the invoice service, it can handle this separately via a GET /invoice request.
Example asynchronous processing
You can configure Lambda to send records of asynchronous invocations to another destination service. This helps you to troubleshoot your invocations. You can also send messages or events that can’t be processed correctly into a dedicated Amazon Simple Queue Service (SQS) dead-letter queue for investigation.
You can add triggers to a function to process data automatically. For more information on which processing model Lambda uses for triggers, see “Using AWS Lambda with other services”.
Asynchronous workflows handle a variety of use cases including data Ingestion, ETL operations, and order/request fulfillment. In these use-cases, data is processed as it arrives and is retrieved as it changes. For example asynchronous patterns, see “Serverless Data Processing” and “Serverless Event Submission with Status Updates”.
Tune batch size, batch window, and compress payloads for high throughput
When using Lambda to process records using Amazon Kinesis Data Streams or SQS, there are a number of tuning parameters to consider for performance.
You can configure a batch window to buffer messages or records for up to 5 minutes. You can set a limit of the maximum number of records Lambda can process by setting a batch size. Your Lambda function is invoked whichever comes first.
For high volume SQS standard queue throughput, Lambda can process up to 1000 concurrent batches of records per second. For more information, see “Using AWS Lambda with Amazon SQS”.
For high volume Kinesis Data Streams throughput, there are a number of options. Configure the ParallelizationFactor setting to process one shard of a Kinesis Data Stream with more than one Lambda invocation simultaneously. Lambda can process up to 10 batches in each shard. For more information, see “New AWS Lambda scaling controls for Kinesis and DynamoDB event sources.” You can also add more shards to your data stream to increase the speed at which your function can process records. This increases the function concurrency at the expense of ordering per shard. For more details on using Kinesis and Lambda, see “Monitoring and troubleshooting serverless data analytics applications”.
Kinesis stream producers can also compress records. This is at the expense of additional CPU cycles for decompressing the records in your Lambda function code.
Required practice: Measure, evaluate, and select optimal capacity units
Capacity units are a unit of consumption for a service. They can include function memory size, number of stream shards, number of database reads/writes, request units, or type of API endpoint. Measure, evaluate and select capacity units to enable optimal configuration of performance, throughput, and cost.
Identify and implement optimal capacity units.
For Lambda functions, memory is the capacity unit for controlling the performance of a function. You can configure the amount of memory allocated to a Lambda function, between 128 MB and 10,240 MB. The amount of memory also determines the amount of virtual CPU available to a function. Adding more memory proportionally increases the amount of CPU, increasing the overall computational power available. If a function is CPU-, network- or memory-bound, then changing the memory setting can dramatically improve its performance.
Choosing the memory allocated to Lambda functions is an optimization process that balances performance (duration) and cost. You can manually run tests on functions by selecting different memory allocations and measuring the time taken to complete. Alternatively, use the AWS Lambda Power Tuning tool to automate the process.
The tool allows you to systematically test different memory size configurations and depending on your performance strategy – cost, performance, balanced – it identifies what is the most optimum memory size to use. For more information, see “Operating Lambda: Performance optimization – Part 2”.
AWS Lambda Power Tuning report
Amazon DynamoDB manages table processing throughput using read and write capacity units. There are two different capacity modes, on-demand and provisioned.
On-demand capacity mode supports up to 40K read/write request units per second. This is recommended for unpredictable application traffic and new tables with unknown workloads. For higher and predictable throughputs, provisioned capacity mode along with DynamoDB auto scaling is recommended. For more information, see “Read/Write Capacity Mode”.
For high throughput Amazon Kinesis Data Streams with multiple consumers, consider using enhanced fan-out for dedicated 2 MB/second throughput per consumer. When possible, use Kinesis Producer Library and Kinesis Client Library for effective record aggregation and de-aggregation.
Amazon API Gateway supports multiple endpoint types. Edge-optimized APIs provide a fully managed Amazon CloudFront distribution. These are better for geographically distributed clients. API requests are routed to the nearest CloudFront Point of Presence (POP), which typically improves connection time.
Edge-optimized API Gateway deployment
Regional API endpoints are intended when clients are in the same Region. This helps you to reduce request latency and allows you to add your own content delivery network if necessary.
AWS Step Functions has two workflow types, standard and express. Standard Workflows have exactly once workflow execution and can run for up to one year. Express Workflows have at-least-once workflow execution and can run for up to five minutes. Consider the per-second rates you require for both execution start rate and the state transition rate. For more information, see “Standard vs. Express Workflows”.
Performance load testing is recommended at both sustained and burst rates to evaluate the effect of tuning capacity units. Use Amazon CloudWatch service dashboards to analyze key performance metrics including load testing results. I cover performance testing in more detail in “Regulating inbound request rates – part 1”.
Evaluate and optimize your serverless application’s performance based on access patterns, scaling mechanisms, and native integrations. You can improve your overall experience and make more efficient use of the platform in terms of both value and resources.
This post continues from part 1 and looks at designing your function to take advantage of concurrency via asynchronous and stream-based invocations. I cover measuring, evaluating, and selecting optimal capacity units.
This well-architected question will continue in part 3 where I look at integrating with managed services directly over functions when possible. I cover optimizing access patterns and applying caching where applicable.
For more serverless learning resources, visit Serverless Land.
This post is written by Dathu Patil, Solutions Architect and Naomi Joshi, Cloud Application Architect.
AWS CloudFormation custom resources allow you to write custom provisioning logic in templates. These run anytime you create, update, or delete stacks. Using AWS Lambda-backed custom resources, you can associate a Lambda function with a CloudFormation custom resource. The function is invoked whenever the custom resource is created, updated, or deleted.
When CloudFormation asynchronously invokes the function, it passes the request data, such as the request type and resource properties to the function. The customizability of Lambda functions in combination with CloudFormation allow a wide range of scenarios. For example, you can dynamically look up Amazon Machine Image (AMI) IDs during stack creation or use utilities such as string reversal functions.
Unhandled exceptions or transient errors in the custom resource Lambda function can cause your code to exit without sending a response. CloudFormation requires an HTTPS response to confirm if the operation is successful or not. An unreported exception causes CloudFormation to wait until the operation times out before starting a stack rollback.
If the exception occurs again on rollback, CloudFormation waits for a timeout exception before ending in a rollback failure. During this time, your stack is unusable. You can learn more about this and best practices by reviewing Best Practices for CloudFormation Custom Resources.
In this blog, you learn how you can use Amazon SQS and Lambda to add resiliency to your Lambda-backed CloudFormation custom resource deployments. The example shows how to use CloudFormation custom resource to look up an AMI ID dynamically during Amazon EC2 creation.
Overview
CloudFormation templates that declare an EC2 instance must also specify an AMI ID. This includes an operating system and other software and configuration information used to launch the instance. The correct AMI ID depends on the instance type and Region in which you’re launching your stack. AMI ID can change regularly, such as when an AMI is updated with software updates.
Customers often implement a CloudFormation custom resource to look up an AMI ID while creating an EC2 instance. In this example, the lookup Lambda function calls the EC2 API. It fetches the available AMI IDs, uses the latest AMI ID, and checks for a compliance tag. This implementation assumes that there are separate processes for creating AMI and running compliance checks. The process that performs compliance and security checks creates a compliance tag on a successful scan.
This solution shows how you can use SQS and Lambda to add resiliency to handle an exception. In this case, the exception occurs in the AMI lookup custom resource due to a missing compliance tag. When the AMI lookup function fails processing, it uses the Lambda destination configuration to send the request to an SQS queue. The message is reprocessed using the SQS queue and Lambda function.
The CloudFormation custom resource asynchronously invokes the AMI lookup Lambda function to perform appropriate actions.
The AMI lookup Lambda function calls the EC2 API to fetch the list of AMIs and checks for a compliance tag. If the tag is missing, it throws an unhandled exception.
On failure, the Lambda destination configuration sends the request to the retry queue that is configured as a dead-letter queue (DLQ). SQS adds a custom delay between retry processing to support more than two retries.
The retry Lambda function processes messages in the retry queue using Lambda with SQS. Lambda polls the queue and invokes the retry Lambda function synchronously with an event that contains queue messages.
The retry function then synchronously invokes the AMI lookup function using the information from the request SQS message.
The AMI Lookup Lambda function
An AWS Serverless Application Model (AWS SAM) template is used to create the AMI lookup Lambda function. You can configure async event options such as number of retries on the Lambda function. The maximum retries allowed is 2 and there is no option to set a delay between the invocation attempts.
When a transient failure or unhandled error occurs, the request is forwarded to the retry queue. This part of the AWS SAM template creates AMI lookup Lambda function:
This function calls the EC2 API using the boto3 AWS SDK for Python. It calls the describe_images method to get a list of images with given filter conditions. The Lambda function iterates through the AMI list and checks for compliance tags. If the tag is not present, it raises an exception:
ec2_client = boto3.client('ec2', region_name=region)
# Get AMI IDs with the specified name pattern and owner
describe_response = ec2_client.describe_images(
Filters=[{'Name': "name", 'Values': architectures},
{'Name': "tag-key", 'Values': ['ami-compliance-check']}],
Owners=["amazon"]
)
The queue and the retry Lambda function
The retry queue adds a 60-second delay before a message is available for the processing. The time delay between retry processing attempts provides time for transient errors to be corrected. This is the AWS SAM template for creating these resources:
The retry Lambda function periodically polls for new messages in the retry queue. The function synchronously invokes the AMI lookup Lambda function. On success, a response is sent to CloudFormation. This process runs until the AMI lookup function returns a successful response or the message is deleted from the SQS queue. The deletion is based on the MessageRetentionPeriod, which is set to 600 seconds in this case.
for record in event['Records']:
body = json.loads(record['body'])
response = client.invoke(
FunctionName=body['requestContext']['functionArn'],
InvocationType='RequestResponse',
Payload=json.dumps(body['requestPayload']).encode()
)
An existing Amazon EC2 public image. You can choose any of the AMIs from the AWS Management Console with Architecture = X86_64 and Owner = amazon for test purposes. Note the AMI ID.
Download the source code from the resilient-cfn-custom-resource GitHub repository. The template.yaml file is an AWS SAM template. It deploys the Lambda functions, SQS, and IAM roles required for the Lambda function. It uses Python 3.8 as the runtime and assigns 128 MB of memory for the Lambda functions.
To build and deploy this application using the AWS SAM CLI build and guided deploy:
sam build --use-container
sam deploy --guided
The custom resource stack creation invokes the AMI lookup Lambda function. This fetches the AMI ID from all public EC2 images available in your account with the tag ami-compliance-check. Typically, the compliance tags are created by a process that performs security scans.
In this example, the security scan process is not running and the tag is not yet added to any AMIs. As a result, the custom resource throws an exception, which goes to the retry queue. This is retried by the retry function until it is successfully processed.
Use the console or AWS CLI to add the tag to the chosen EC2 AMI. In this example, this is analogous to a separate governance process that checks for AMI compliance and adds the compliance tag if passed. Replace the $AMI-ID with the AMI ID captured in the prerequisites:
After the tags are added, a response is sent successfully from the custom resource Lambda function to the CloudFormation stack. It includes your $AMI-ID and a test EC2 instance is created using that image. The stack creation completes successfully with all resources deployed.
Conclusion
This blog post demonstrates how to use SQS and Lambda to add resiliency to CloudFormation custom resources deployments. This solution can be customized for use cases where CloudFormation stacks have a dependency on a custom resource.
CloudFormation custom resource failures can happen due to unhandled exceptions. These are caused by issues with a dependent component, internal service, or transient system errors. Using this solution, you can handle the failures automatically without the need for manual intervention. To get started, download the code from the GitHub repo and start customizing.
For more serverless learning resources, visit Serverless Land.
This series of blog posts uses the AWS Well-Architected Tool with the Serverless Lens to help customers build and operate applications using best practices. In each post, I address the serverless-specific questions identified by the Serverless Lens along with the recommended best practices. See the introduction post for a table of contents and explanation of the example application.
PERF 1. Optimizing your serverless application’s performance
Evaluate and optimize your serverless application’s performance based on access patterns, scaling mechanisms, and native integrations. This allows you to continuously gain more value per transaction. You can improve your overall experience and make more efficient use of the platform in terms of both value and resources.
Good practice: Measure and optimize function startup time
Evaluate your AWS Lambda function startup time for both performance and cost.
Take advantage of execution environment reuse to improve the performance of your function.
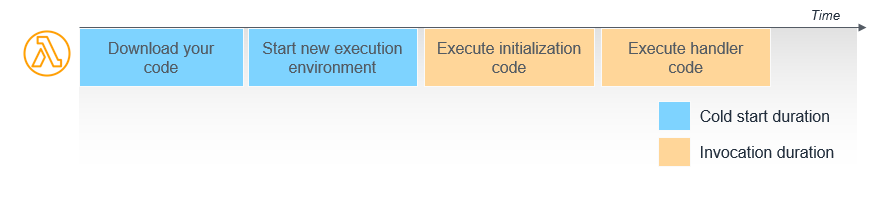
Lambda invokes your function in a secure and isolated runtime environment, and manages the resources required to run your function. When a function is first invoked, the Lambda service creates an instance of the function to process the event. This is called a cold start. After completion, the function remains available for a period of time to process subsequent events. These are called warm starts.
Lambda functions must contain a handler method in your code that processes events. During a cold start, Lambda runs the function initialization code, which is the code outside the handler, and then runs the handler code. During a warm start, Lambda runs the handler code.
Lambda function cold and warm starts
Initialize SDK clients, objects, and database connections outside of the function handler so that they are started during the cold start process. These connections then remain during subsequent warm starts, which improves function performance and cost.
Lambda provides a writable local file system available at /tmp. This is local to each function but shared between subsequent invocations within the same execution environment. You can download and cache assets locally in the /tmp folder during the cold start. This data is then available locally by all subsequent warm start invocations, improving performance.
In the serverless airline example used in this series, the confirm booking Lambda function initializes a number of components during the cold start. These include the Lambda Powertools utilities and creating a session to the Amazon DynamoDB table BOOKING_TABLE_NAME.
There are a number of steps you can take to measure and optimize Lambda function initialization time.
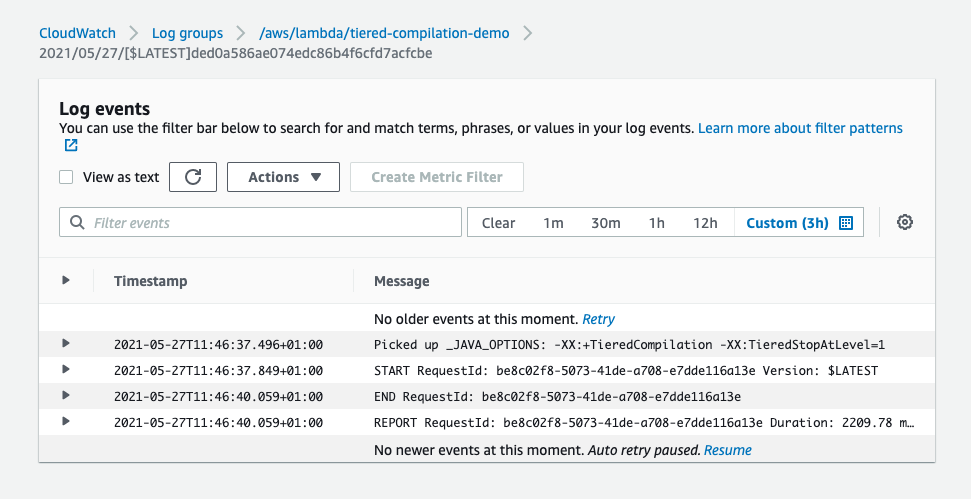
You can view the function cold start initialization time using Amazon CloudWatch Logs and AWS X-Ray. A log REPORT line for a cold start includes the Init Duration value. This is the time the initialization code takes to run before the handler.
CloudWatch Logs cold start report line
When X-Ray tracing is enabled for a function, the trace includes the Initialization segment.
A subsequent warm start REPORT line does not include the Init Duration value, and is not present in the X-Ray trace:
CloudWatch Logs warm start report line
X-Ray trace warm start without showing initialization segment
CloudWatch Logs Insights allows you to search and analyze CloudWatch Logs data over multiple log groups. There are some useful searches to understand cold starts.
Understand cold start percentage over time:
filter @type = "REPORT"
| stats
sum(strcontains(
@message,
"Init Duration"))
/ count(*)
* 100
as coldStartPercentage,
avg(@duration)
by bin(5m)
Cold start percentage over time
Cold start count and InitDuration:
filter @type="REPORT"
| fields @memorySize / 1000000 as memorySize
| filter @message like /(?i)(Init Duration)/
| parse @message /^REPORT.*Init Duration: (?<initDuration>.*) ms.*/
| parse @log /^.*\/aws\/lambda\/(?<functionName>.*)/
| stats count() as coldStarts, median(initDuration) as avgInitDuration, max(initDuration) as maxInitDuration by functionName, memorySize
Cold start count and InitDuration
Once you have measured cold start performance, there are a number of ways to optimize startup time. For Python, you can use the PYTHONPROFILEIMPORTTIME=1 environment variable.
PYTHONPROFILEIMPORTTIME environment variable
This shows how long each package import takes to help you understand how packages impact startup time.
Python import time
Previously, for the AWS Node.js SDK, you enabled HTTP keep-alive in your code to maintain TCP connections. Enabling keep-alive allows you to avoid setting up a new TCP connection for every request. Since AWS SDK version 2.463.0, you can also set the Lambda function environment variable AWS_NODEJS_CONNECTION_REUSE_ENABLED=1 to make the SDK reuse connections by default.
You can configure Lambda’s provisioned concurrency feature to pre-initialize a requested number of execution environments. This runs the cold start initialization code so that they are prepared to respond immediately to your function’s invocations.
Choose frameworks that load quickly on function initialization startup. For example, prefer simpler Java dependency injection frameworks like Dagger or Guice over more complex framework such as Spring. When using the AWS SDK for Java, there are some cold start performance optimization suggestions in the documentation. For further Java performance optimization tips, see the AWS re:Invent session, “Best practices for AWS Lambda and Java”.
To minimize deployment packages, choose lightweight web frameworks optimized for Lambda. For example, use MiddyJS, Lambda API JS, and Python Chalice over Node.js Express, Python Django or Flask.
If your function has many objects and connections, consider splitting the function into multiple, specialized functions. These are individually smaller and have less initialization code. I cover designing smaller, single purpose functions from a security perspective in “Managing application security boundaries – part 2”.
Minimize your deployment package size to only its runtime necessities
Smaller functions also allow you to separate functionality. Only import the libraries and dependencies that are necessary for your application processing. Use code bundling when you can to reduce the impact of file system lookup calls. This also includes deployment package size.
For example, if you only use Amazon DynamoDB in the AWS SDK, instead of importing the entire SDK, you can import an individual service. Compare the following three examples as shown in the Lambda Operator Guide:
In testing, importing the DynamoDB library instead of the entire AWS SDK was 125 ms faster. Importing the X-Ray core library was 5 ms faster than the X-Ray SDK. Similarly, when wrapping a service initialization, preparing a DocumentClient before wrapping showed a 140-ms gain. Version 3 of the AWS SDK for JavaScript supports modular imports, which can further help reduce unused dependencies.
For additional options when for optimizing AWS Node.js SDK imports, see the AWS Serverless Hero blog post.
Conclusion
Evaluate and optimize your serverless application’s performance based on access patterns, scaling mechanisms, and native integrations. You can improve your overall experience and make more efficient use of the platform in terms of both value and resources.
In this post, I cover measuring and optimizing function startup time. I explain cold and warm starts and how to reuse the Lambda execution environment to improve performance. I show a number of ways to analyze and optimize the initialization startup time. I explain how only importing necessary libraries and dependencies increases application performance.
This well-architected question will be continued is part 2 where I look at designing your function to take advantage of concurrency via asynchronous and stream-based invocations. I cover measuring, evaluating, and selecting optimal capacity units.
For more serverless learning resources, visit Serverless Land.
Configuring cross-origin resource sharing (CORS) settings for a backend server is a typical challenge that developers face when building web applications. CORS is a layer of security enforced by modern browsers and is required when the client domain does not match the server domain. The complexity of CORS often leads developers to abandon it entirely by allowing all-access with the proverbial “*” permissions setting. However, CORS is an essential part of your application’s security posture and should be correctly configured.
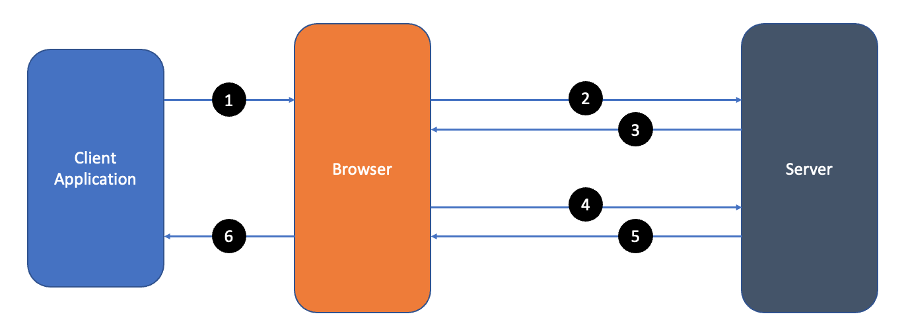
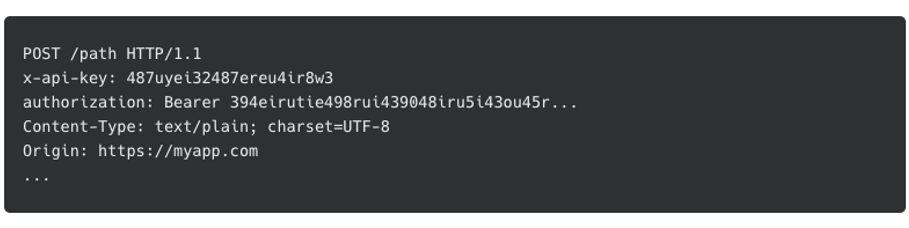
CORS is a mechanism by which a server limits access through the use of headers. In requests that are not considered simple, the server relies on the browser to make a CORS preflight or OPTIONS request. A full request looks like this:
CORS request flow
Client application initiates a request
Browser sends a preflight request
Server sends a preflight response
Browser sends the actual request
Server sends the actual response
Client receives the actual response
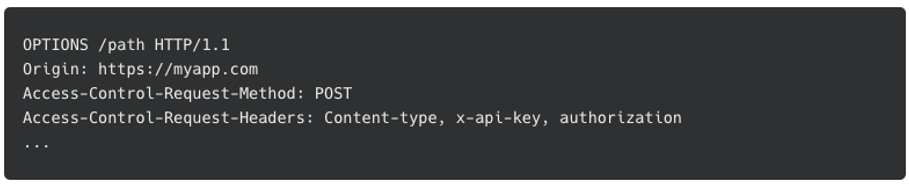
The preflight request verifies the requirements of the server by indicating the origin, method, and headers to come in the actual request.
OPTIONS preflight request
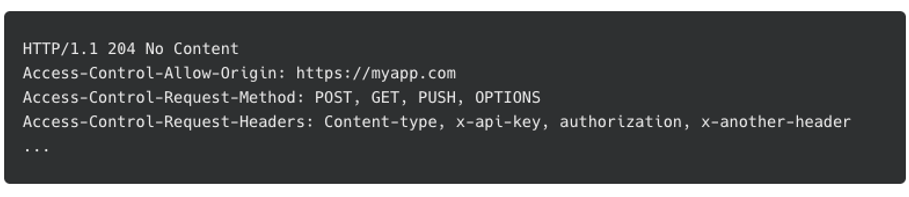
The response from the server differs based on the backend you are using. Some servers respond with the allowed origin, methods, and headers for the endpoint.
OPTIONS preflight response
Others only return CORS headers if the requested origin, method, and headers meet the requirements of the server. If the requirements are not met, then the response does not contain any CORS access control headers. The browser verifies the request’s origin, method, and headers against the data returned in the preflight response. If validation fails, the browser throws a CORS error and halts the request. If the validation is successful, the browser continues with the actual request.
Actual request
The browser only sends the access-control-allow-origin header to verify the requesting origin during the actual request. The server then responds with the requested data.
Actual response
This step is where many developers run into issues. Notice the endpoint of the actual request returns the access-control-allow-origin header. The browser once again verifies this before taking action.
Both the preflight and the actual response require CORS configuration, and it looks different depending on whether you select REST API or HTTP API.
Configuring API Gateway for CORS
While Amazon API Gateway offers several API endpoint types, this post focuses on REST API (v1) and HTTP API (v2). Both types create a representational state transfer (REST) endpoint that proxies an AWS Lambda function and other AWS services or third-party endpoints. Both types process preflight requests. However, there are differences in both the configuration, and the format of the integration response.
Terminology
Before walking through the configuration examples, it is important to understand some terminology:
Resource: A unique identifier for the API path (/customer/reports/{region}). Resources can have subresources that combine to make a unique path.
Method: the REST methods (for example, GET, POST, PUT, PATCH) the resource supports. The method is not part of the path but is passed through the headers.
Endpoint: A combination of resources and methods to create a unique API URL.
REST APIs
A popular use of API Gateway REST APIs is to proxy one or more Lambda functions to build a serverless backend. In this pattern, API Gateway does not modify the request or response payload. Therefore, REST API manages CORS through a combination of preflight configuration and a properly formed response from the Lambda function.
Preflight requests
Configuring CORS on REST APIs is generally configured in four lines of code with AWS SAM:
Cors:
AllowMethods: "'GET, POST, OPTIONS'"
AllowOrigin: "'http://localhost:3000'"
AllowHeaders: "'Content-type, x-api-key'"
This code snippet creates a MOCK API resource that processes all preflight requests for that resource. This configuration is an example of the least privileged access to the server. It only allows GET, POST, and OPTIONS methods from a localhost endpoint on port 3000. Additionally, it only allows the Content-type and x-api-key CORS headers.
Notice that the preflight response only allows one origin to call this API. To enable multiple origins with REST APIs, use ‘*’ for the allow-control-allow-origin header. Alternatively, use a Lambda function integration instead of a MOCK integration to set the header dynamically based on the origin of the caller.
Authorization
When configuring CORS for REST APIs that require authentication, it is important to configure the preflight endpoint without authorization required. The preflight is generated by the browser and does not include the credentials by default. To remove the authorizer from the OPTIONS method add the AddDefaultAuthorizerToCorsPreflight: false setting to the authorization configuration.
In REST APIs proxy configurations, CORS settings only apply to the OPTIONS endpoint and cover only the preflight check by the browser. The Lambda function backing the method must respond with the appropriate CORS information to handle CORS properly in the actual response. The following is an example of a proper response:
In this response, the critical parts are the statusCode returned to the user as the response status and the access-control-allow-origin header required by the browser’s CORS validation.
HTTP APIs
Like REST APIs, Amazon API Gateway HTTP APIs are commonly used to proxy Lambda functions and are configured to handle preflight requests. However, unlike REST APIs, HTTP APIs handle CORS for the actual API response as well.
Preflight requests
The following example shows how to configure CORS on HTTP APIs with AWS SAM:
CorsConfiguration
AllowMethods:
- GET
- POST
- OPTIONS
AllowOrigin:
- http://localhost:3000
- https://myproddomain.com
AllowHeaders:
- Content-type
- x-api-key
This template configures HTTP APIs to manage CORS for the preflight requests and the actual requests. Note that the AllowOrigin section allows more than one domain. When the browser makes a request, HTTP APIs checks the list for the incoming origin. If it exists, HTTP APIs adds it to the access-control-allow-origin header in the response.
Authorization
When configuring CORS for HTTP APIs with authorization configured, HTTP APIs automatically configures the preflight endpoint without authorization required. The only caveat to this is the use of the $default route. When configuring a $default route, all methods and resources are handled by the default route and the integration behind it. This includes the preflight OPTIONS method.
There are two options to handle preflight. First, and recommended, is to break out the routes individually. Create a route specifically for each method and resource as needed. The second is to create an OPTIONS /{proxy+} method to override the $defaut route for preflight requests.
Response
Unlike REST APIs, by default, HTTP APIs modify the response for the actual request by adding the appropriate CORS headers based upon the CORS configuration. The following is an example of a simple response:
"hello world"
HTTP APIs then constructs the complete response with your data, status code, and any required CORS headers:
To set the status code manually, configure your response as follows:
{
"statusCode": 201,
"body": "hello world"
}
To manage the complete response like in REST APIs, set the payload format to version one. The payload format for HTTP API changes the structure of the payload sent to the Lambda function and the expected response from the Lambda function. By default, HTTP API uses version two, which includes the dynamic CORS settings. For more information, read how the payload version affects the response format in the documentation.
The Amazon API Gateway CORS Configurator
The AWS serverless developer advocacy team built the Amazon API Gateway CORS Configurator to help you configure CORS for your serverless applications.
Amazon API Gateway CORS Configurator
Start by entering the information on the left. The CORS Configurator builds the proper snippets to add the CORS settings to your AWS SAM template as you add more information. The utility demonstrates adding the configuration to all APIs in the template by using the Globals section. You can also add to an API’s specific resource to affect only that API.
Additionally, the CORS Configurator constructs an example response based on the API type you are using.
CORS can be challenging. For API Gateway, CORS configuration is the number one question developers ask. In this post, I give an overview of CORS with a link to an in-depth explanation. I then show how to configure API Gateway to create the least privileged access to your server using CORS. I also discuss the differences in how REST APIs and HTTP APIs handle CORS. Finally, I introduced you to the API Gateway CORS Configurator to help you configure CORS using AWS SAM.
I hope to provide you with enough information that you can avoid opening up your servers with the “*” setting for CORS. Take the time to understand your application and limit requests to only methods you support and from only originating hosts you intended.
New features and improvements to the Python language
Python 3.9 introduces new features for strings and dictionaries. There are new methods to remove prefixes and suffixes in strings. To remove a prefix, use str.removeprefix(prefix). To remove a suffix, use str.removesuffix(suffix). To learn more, read about PEP 616.
Dictionaries now offer two new operators (| and |=). The first is a union operator for merging dictionaries and the second allows developers to update the contents of a dictionary with another dictionary. To learn more, read about PEP 584.
You can alter the behavior of Python functions by using decorators. Previously, these could only consist of the @ symbol, a name, a dotted name, and an optional single call. Decorators can now consist of any valid expression, as explained in PEP 614.
There are also improvements for time zone handling. The zoneinfo module now supports the IANA time zone database. This can help remove boilerplate and brings improvements for code handling multiple timezones.
While existing Python 3 versions support TLS1.2, Python 3.9 now provides support for TLS1.3. This helps improve the performance of encrypted connections with features such as False Start and Zero Round Trip Time (0-RTT).
For a complete list of updates in Python 3.9, read the launch documentation on the Python website.
Performance improvements in Python 3.9
There are two important performance improvements in Python 3.9 that you can benefit from without making any code changes.
The first impacts code that uses the built-in Python data structures tuple, list, dict, set, or frozenset. In Python 3.9, these internally use the vectorcall protocol, which can make function calls faster by reducing the number of temporary objects used. Second, Python 3.9 uses a new parser that is more performant than previous versions. To learn more, read about PEP 617.
Changes to how Lambda works with the Python runtime
In Python, the presence of an __init__.py file in a directory causes it to be treated as a package. Frequently, __init__.py is an empty file that’s used to ensure that Python identifies the directory as a package. However, it can also contain initialization code for the package. Before Python 3.9, where you provided your Lambda function in a package, Lambda did not run the __init__.py code in the handler’s directory and parent directories during function initialization. From Python 3.9, Lambda now runs this code during the initialization phase. This ensures that imported packages are properly initialized if they make use of __init__.py. Note that __init__.py code is only run when the execution environment is first initialized.
Finally, there is a change to the error response in this new version. When previous Python versions threw errors, the formatting appeared as:
{"errorMessage": "name 'x' is not defined", "errorType": "NameError", "stackTrace": [" File \"/var/task/error_function.py\", line 2, in lambda_handler\n return x + 10\n"]}
From Python 3.9, the error response includes a RequestId:
{"errorMessage": "name 'x' is not defined", "errorType": "NameError", **"requestId"**: "<request id of function invoke>" "stackTrace": [" File \"/var/task/error_function.py\", line 2, in lambda_handler\n return x + 10\n"]}
Using Python 3.9 in Lambda
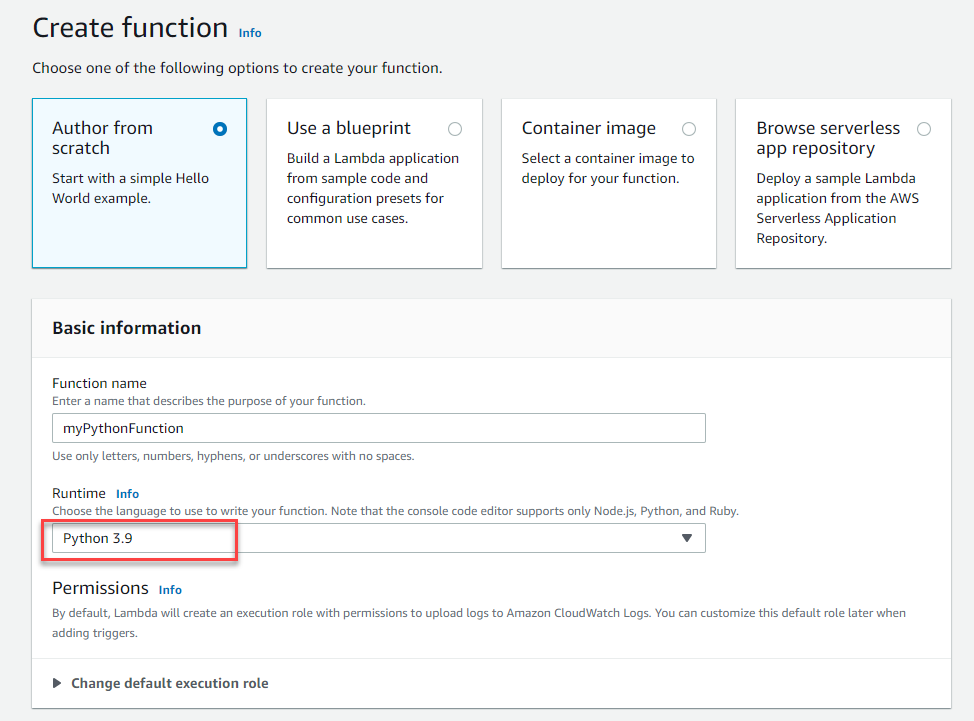
You can now use the Python 3.9 runtime to develop your AWS Lambda functions. To use this version, specify a runtime parameter value python3.9 when creating or updating Lambda functions. You can see the new version in the Runtime dropdown in the Create function page.
To update an existing Lambda function to Python 3.9, navigate to the function in the Lambda console, then choose Edit in the Runtime settings panel. You see the new version in the Runtime dropdown:
In the AWS Serverless Application Model (AWS SAM), set the Runtime attribute to python3.9 to use this version in your application deployments:
AWSTemplateFormatVersion: '2010-09-09'
Transform: AWS::Serverless-2016-10-31
Description: Simple Lambda Function
Resources:
MyFunction:
Type: AWS::Serverless::Function
Description: My Python Lambda Function
Properties:
CodeUri: my_function/
Handler: lambda_function.lambda_handler
Runtime: python3.9
Conclusion
You can now create new functions or upgrade existing Python functions to Python 3.9. Lambda’s support of the Python 3.9 runtime enables you to take advantage of improved performance and new features in this version. Additionally, the Lambda service now runs the __init_.py code before the handler, supports TLS 1.3, and provides enhanced logging for errors.
For more serverless learning resources, visit Serverless Land.
There are a lot of experiences we have all grown to miss over the last year and a half. After hearing from our community, two of the top experiences they miss are collaborating with peers, and getting Cloudflare swag. Perhaps even in the reverse order! In-person events like conferences were once a key channel to satisfy both these interests, however today’s remote world makes that much harder. But does it have to?
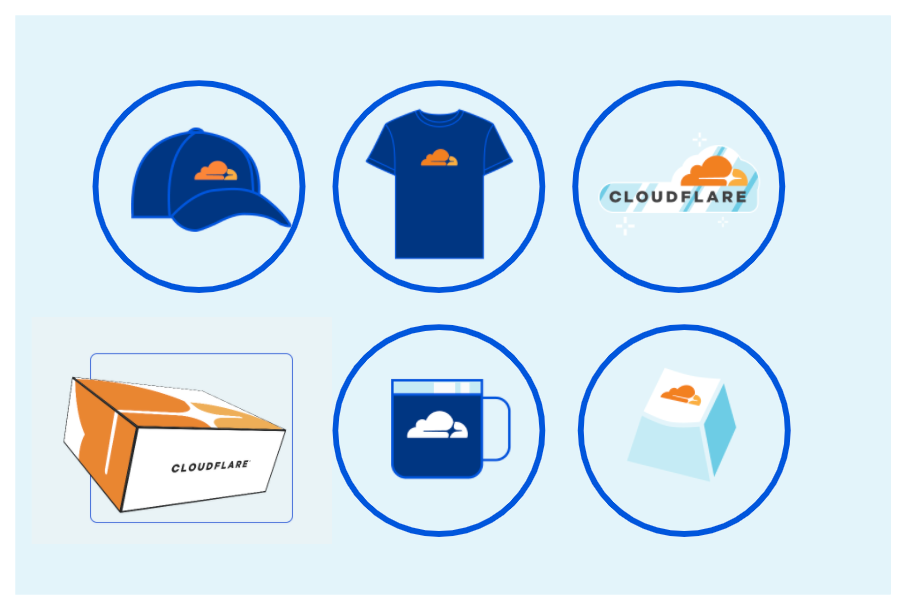
Today, we are excited to introduce the Cloudflare Developer Summer Challenge. We will be rewarding 300 participants with boxes of our most popular swag, while enabling collaboration with other participants through our Workers Discord channel.
To participate, you have to build a project that uses Cloudflare Workers and at least one other product in our rapidly expanding developer platform. We will judge submissions and award swag boxes to those with the most innovative projects, limited to one box per person.The Challenge will be open for submissions between today, and closing November 1, 2021. See a full list of terms and conditions here.
What are the details?
Cloudflare’s developer platform offers all the building blocks to create end-to-end applications with products across compute, storage, and frontend services. To successfully participate in the Cloudflare Developer Summer Challenge, you need to build a project with at least two of the following products in the Cloudflare developer platform. Bonus points for using more! These products include:
Cloudflare Workers: an edge-based serverless computing platform where you can deploy code automatically worldwide, with speed, security, and scale baked in.
Workers KV: a global low-latency key value data store for exceptionally high read volumes, making it possible to build highly dynamic APIs and websites which respond as quickly as a cached static file would.
Durable Objects: a storage platform providing low-latency coordination and consistent storage at the edge, enabling stateful serverless use cases.
Cloudflare Pages: a Jamstack web development platform to collaborate on and deploy high performance sites quickly across the world.
How will submissions be judged?
Submissions will be based on three criteria:
The first criteria is to meet the basic requirements of the challenge. This includes using at least two products in the platform, and submitting the live link of your project and your code repository. You must submit before November 1, 2021.
The second criteria we will judge is around innovation. Projects that are unique and useful to users will be more likely to win the swag boxes.
The third criteria is based on the breadth of the Cloudflare platform you use. The more products you integrate, the better!
How do I participate?
Step 1: Get Started: You can get started with the developer platform by visiting the Cloudflare Workers Quickstart Guide, and reviewing the Workers KV and/or Durable Objects documentation. To host your frontend site on Cloudflare Pages, you can visit the Pages Quickstart Guide.
Step 2: Build your Project: If you would like inspiration, you can view our tutorials, and examples. You can also view our Built With Workers page. If you want to try and build something more advanced, you can see some additional examples below.
Step 3: Share your Project: Successful submission includes a link to your live project, and a link to your code repository. We also encourage you to share your work, or pictures of you unboxing/ using your swag by tagging @CloudflareDev on Twitter with the hashtag #CloudflareSummerChallenge.
Optional: Engage with the Community To promote collaboration and interaction with peers, we will have a dedicated channel in the Cloudflare Workers Discord server. For those who want to, you can learn what others are building, share your project, or join Q&A sessions if you have questions or need help getting started. You can also meet developers participating around the world.
What are examples of advanced projects I can build?
The Cloudflare developer platform is ideal for a wide range of use cases – from augmenting existing applications to building entirely new ones without needing to maintain underlying infrastructure. Essentially, you write the code, and we handle the rest. Running on the Cloudflare edge network, applications scale automatically and run worldwide within seconds of users.
Build a Serverless API for your Frontend
Cloudflare Workers’ high performance and edge network make it well-suited for building APIs. It is also a great companion to your frontend applications on Cloudflare Pages. You can use Workers as the backend, and build your frontend with frameworks such as React, Gatsby, Hugo, Svelte, and more — and then deploy your site onto Pages.
You can easily begin building a serverless API for your frontend by creating a new Workers project with the Wrangler CLI:
To complete this type of project, you can follow the rest of the steps outlined in our Pages documentation.
Build an Interactive Game
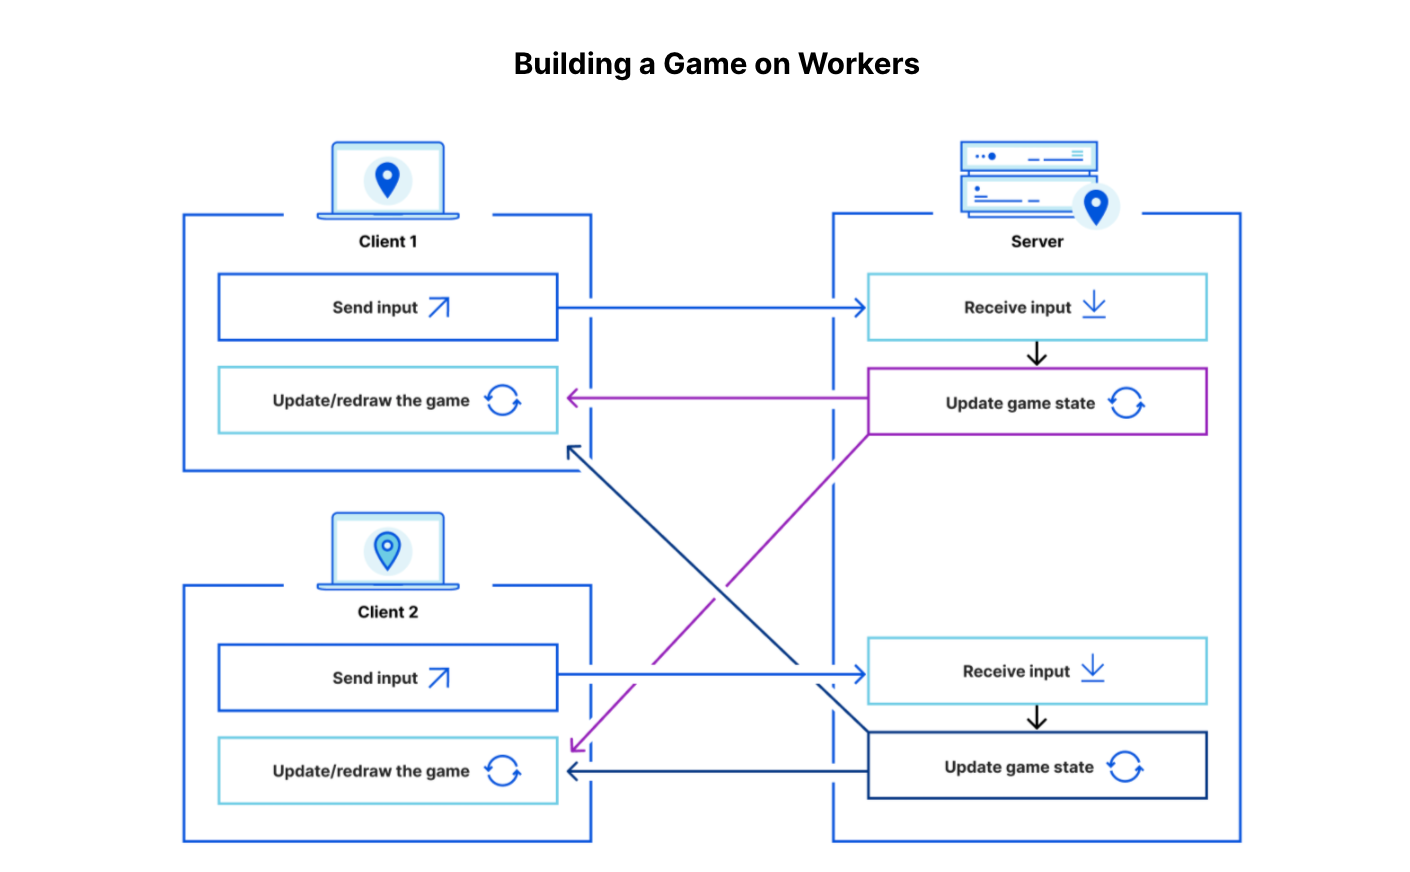
Combining Cloudflare Workers, Durable Objects, and WebSockets makes a powerful platform for managing state at the edge. Running on Cloudflare’s global network enables exceptionally low latency, so users can interact instantly worldwide. Examples of interactive applications can range from chat rooms to multiplayer video games.
To build interactive video games, you can integrate with popular tools such as Unity and WebGL using an authoritative client model (we have an example of how to achieve this). You do not even need expertise in building video games. Following this example above, the client can run a compiled game directly in the browser with WebAssembly. The server, running on Cloudflare Workers, can be interacted with via WebSockets, and uses Durable Objects to manage game state.
Build an E-Commerce Experience
Whether you are building a small e-commerce app or an online ordering site with millions of requests per month, your users can experience exceptional performance and reliability with Cloudflare’s developer platform.
At a small scale, you can instantly personalize a user’s e-commerce experience by setting up A/B testing, performing localization, or providing geo-specific targeting, such as local currency or exchange rates. You can see the linked code samples to quickly get started.
Integration with Workers KV and other third party tools can also streamline the development process. Instead of having to build out an entire database for your application, you can use Workers KV to store product information such as product ID, name, description, price, etc. Outside the Workers platform, you can integrate with popular tools such as Stripe or Shopify. To learn more about how to build an e-commerce application with Workers, Workers KV, and Stripe, you can read this blog post on building an e-commerce experience.
At a larger scale, we have customers building their entire online ordering site on Workers and Pages. Dig, a popular American restaurant chain with nearly 50 locations nationwide, decided to run their ordering site on Cloudflare’s developer platform. They needed high performance and reliability as traffic spiked during the pandemic. The team used a headless React application that is entirely hosted on Cloudflare Pages. Javascript calls an underlying API to get and handle dynamic ordering logic. You can learn more about their story in this case study.
Conclusion
We have heard from our community, and we want to help bring back some of their favorite pre-pandemic experiences: collaboration and swag. The Cloudflare Developer Summer Challenge is meant to do just that. While the last year and a half has transformed the way we all live, it has also been a period of significant expansion of the Cloudflare developer platform. With new products across compute, storage, and frontend services, you now have all the building blocks to quickly create powerful applications end-to-end on our edge network. We hope you enjoy the experience (and the swag!). We cannot wait to see what you build!
If you haven’t already heard, we’re hosting the Cloudflare Summer Developer Challenge, a contest for the Cloudflare community at large. Anybody – yes, including you – can sign up for free and compete for a chance to win one of 300 available prizes. To submit you need to use at least two products from the Cloudflare developer platform — which makes this contest a great opportunity to give them a try if you haven’t already! The top 300 submissions will receive a box of our most popular swag, so you should give it a go!
Coincidentally, the Cloudflare Summer Developer Challenge’s landing page and signup workflow qualifies as a valid project submission (so meta), so if you’re looking for some inspiration, this walkthrough will shed some light on how it was built.
Overview
At its core, the application is a series of static HTML pages, most of which have a form to submit, with a backend API to handle those submissions, and a storage layer to persist the data. In a Cloudflare lens, this would point towards using Pages, a Worker, and Workers KV. And while this should be the preferred stack for a project like this, truthfully, this “application” was originally intended to be a single HTML page with a single form, but its list of requirements grew over time, as things tend to do. So instead, this project began as–and remains–a Workers Site project, comprised of a single Worker and a single Workers KV namespace.
Workers Sites, the precursor to our Pages product, is a pattern where your Worker handles all the requests for your site’s assets. While doing this, your Worker Site can still include backend-y things, like offering a collection of JSON API endpoints. Basically, Workers Sites is a coined term for building monoliths within a Worker, but without the negative associations that the word “monolith” can bring. Given that a Workers Site is still a Worker, this means your monolith is deployed globally – tough to beat!
As with all Workers Sites, routing is the primary concern. For this, I used the worktop web framework, which includes a router among many other utilities. (Disclosure: I am also the author of worktop.) This allowed me to quickly structure the layout of the entire application:
import { Router } from 'worktop';
import * as Cache from 'worktop/cache';
const API = new Router;
API.add('GET', '/', (req, res) => {
res.send(200, 'TODO: send HTML for landing page');
});
API.add('GET', '/rules', (req, res) => {
res.send(200, 'TODO: send HTML for terms & conditions');
});
API.add('POST', '/signup', (req, res) => {
res.send(201, 'TODO: parse & save initial registration');
});
API.add('GET', '/submit', (req, res) => {
res.send(200, 'TODO: render the unique submission form');
});
API.add('POST', '/submit', (req, res) => {
res.send(201, 'TODO: parse, validate, save submission data');
});
// init; w/ Cache API
Cache.listen(API.run);
At this point, nothing useful is happening, but having an application skeleton laid out like this is my preferred format for a TODO list. It’s very satisfying to go through and fill out the handler bodies as development progresses. Additionally, the Cache.listen helper at the bottom of the file integrates the entire application with the Cache API, which I know I’ll want since most of the requests will be for the static HTML pages anyway.
Building and Optimizing the Client pages
Historically, deploying a Workers Site meant uploading all of your assets into a KV namespace. Then you would include something like @cloudflare/kv-asset-handler into your Worker so that incoming requests would seamlessly route to keys within the namespace. However, I chose to go a different route.
Knowing that each of my static pages would – at most – have one CSS stylesheet and sometimes only one JavaScript file, I thought it would be pretty nifty to include a build system that would inline these assets into the built HTML page. This would mean that my static HTML pages would have absolutely zero network requests for additional resources, which is generally good news for performance.
And while I would love to say that I did this purely for performance reasons, I must also admit that the lazy-me appreciated that I didn’t have to set up additional URL routing, deal with KV asset uploading, or deal with additional Cache lifespans. A win-win in this case!
The trouble is: avoiding any external assets is not a common goal. In fact, this is very much a side quest I bestowed upon myself. And since no frameworks (that I know of, at least) can do this, I had to assemble my own miniature toolkit to accommodate my needs.
In the end, it proved to be a fun detour and didn’t take very long at all to put together. I incorporated Stylus, my preferred CSS preprocessor, and came up with a rather simple convention to inline CSS and/or JS files where needed. Instead of fancy AST parsers and transformers, I opted to simply read the HTML file contents as strings and search for HTML comments that matched the <!-- inject:(path) --> format:
In this example, the submit/index.html file is injecting the submit/index.styl, which is its own stylesheet, and the index.js script, which does not live within the `submit` directory because it’s used by other pages. The toolkit looks at both asset paths, converts the Stylus to plain CSS, and then embeds the contents into the appropriate <script> or <style> HTML tags.
Finally, for production builds, the setup will pass the final HTML source through a minifier, which compresses the entire document, including any CSS or JavaScript that was injected. This step is optional, but it never hurts to send fewer bytes down the wire.
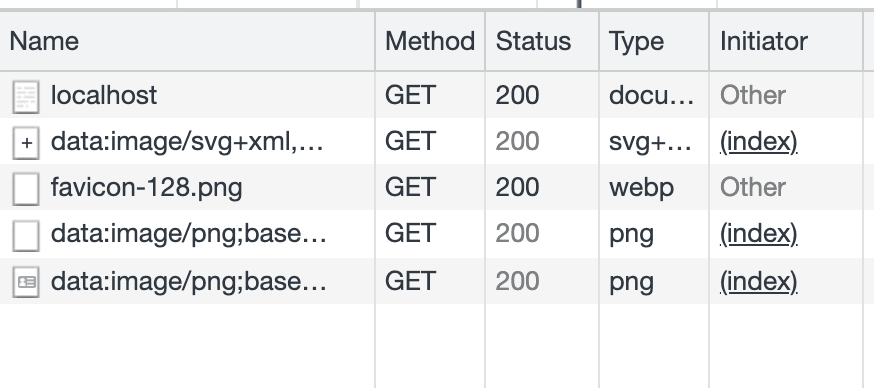
Once these pages were built, I was satisfied with the Network Activity panel when loading the main page:
You can see how the localhost document loads, only dispatching a single request for the favicon-128.png file, which is hosted externally. The three data:image/* requests are Blob URLs and don’t actually transfer network packets. All in all, this means that the HTML document is fully self-contained.
Including HTML into the Worker
Workers can send anything in a Response. Of course, this includes a HTML string. If I wanted to make things incredibly difficult for myself, I could have skipped the /src directory with its own build system, and instead written the HTML, CSS, and JS entirely within a JS string. This would certainly work, but it would be a nightmare to maintain and (for me, at least) be extremely error prone:
Thankfully, I planned ahead and already have a build system that produces better HTML files anyway. So now I just needed a way to load those built outputs into my Worker code.
Now for the second half of this project’s toolkit; I find it perfectly acceptable to have a two-step build pipeline. Here, this means that the static site should be built first, followed by building the Worker. I was planning to use TypeScript to author my Worker anyway, which meant I was already going to need a build step – the only change here is that these build steps would now have to be sequential and ordered.
The Worker is built using esbuild, which is an extremely quick JavaScript bundler and compiler that is capable of translating TypeScript, too. It also has its own plugin system, which allowed me the opportunity to add the “inline my HTML files” behavior I needed. The Worker’s build script actually isn’t too intimidating and allows the Worker to `import` HTML files directly. This allows the insanity from above can be safely replaced with this pattern:
import { Router } from 'worktop';
import * as Cache from 'worktop/cache';
// loaded via esbuild plugin
import LANDING from 'index.html';
import RULES from 'rules/index.html';
API.add('GET', '/', (req, res) => {
res.setHeader('Content-Type', 'text/html;charset=utf-8');
res.setHeader('Cache-Control', 'public,max-age=60');
res.send(200, LANDING);
});
API.add('GET', '/rulees', (req, res) => {
res.setHeader('Content-Type', 'text/html;charset=utf-8');
res.setHeader('Cache-Control', 'public,max-age=1800');
res.send(200, RULES);
});
// ...
// init; w/ Cache API
Cache.listen(API.run);
Of course, this is much cleaner and sensible in the long-run. Clarity makes it easier to identify and extract common patterns into utility functions. I took the opportunity to introduce a render function, the first of many reusable helpers this project would encounter:
Finally, most of the pages need to dynamically insert values into the HTML markup. For example, the submission form should render with the participant’s name and email address and the landing page is required to reflect the current value of remaining prizes. Much like any other monolithic application, the Worker Site is fully aware – and capable – of injecting these values where needed.
To do this, I standardized the {{ variable }} syntax in my project’s HTML. Each of these variables would be replaced during the Worker request with the appropriate value. Of course, it also requires that each endpoint actually provide the correct information to make the substitutions. With this in mind, I modified the `render` utility and updated the landing page’s route handler:
// worker/utils.ts
import type { KV } from 'worktop/kv';
import type { ServerResponse } from 'worktop/response';
// TypeScript placeholder
// Defines the `DATA` KV binding
declare const DATA: KV.Namespace;
export function render(res: ServerResponse, template: string, values: Record<string, string> = {}) {
for (let key in values) {
template = template.replace('{{ ' + key + ' }}', values[key]);
}
res.setHeader('Content-Type', 'text/html;charset=UTF-8');
res.send(200, template);
}
export function toCount(): Promise<string> {
return DATA.get('::remain', 'text').then(v => v || '300+');
}
// worker/index.ts
import * as utils from './utils';
API.add('GET', '/', async (req, res) => {
// Get the "::remain" count from KV
const count = await utils.toCount();
// Short-term TTL for remaining swag updates
res.setHeader('Cache-Control', 'public,max-age=60');
// Render the HTML, passing in `count` variable
return utils.render(res, LANDING, { count });
});
With these changes, the landing page will always check the KV namespace for the latest ::remain value and inject it into the correct location. If you’re interested in checking out the project’s source code, you’ll find that this pattern is used in nearly every HTML response.
Accepting Form Submissions
As expected, this application made heavy use of form submissions. Luckily, the Fetch API offers a variety of built-in body parsers to make retrieval of the data trivial. Additionally, worktop offers a convenience function that will automatically invoke the correct parser based on the request’s Content-Type header. It’s aptly named req.body().
It’s easy to parse and retrieve user data, but it still has to be validated. There are a number of ways to do this, all of which boil down to an input object, a group of rules, and a loop through those rules, collecting any error messages into an errors object. This is precisely what my utils.validate helper does, allowing me to clearly define and manage my rules inline.
Let’s see how this looks within the POST /submit handler, which accepts the initial registration form:
Only after the data is considered valid can data be stored into KV for future use. For the initial registration, a number of things need to happen:
Ensure that the input.email hasn’t already been registered;
Persist the new registration using the `input` values, identifying each document with the user:<email> key;
Generate and save a unique code for the registration, which will be used later to ensure (a) that unregistered persons cannot submit projects and (b) that a registrant can only submit once;
Send the user an email, containing their unique submission link; and
Render a confirmation page, reminding the user to check their inbox for their link.
It can seem like a lot, but after piecing together a few utility helpers and abstractions, it can actually feel quite approachable:
// worker/index.ts
import * as utils from './utils';
import * as Sparkpost from './emails';
import * as Signup from './signup';
import * as Code from './code';
function toError(res: ServerResponse, status: number, reason: string) {
return res.send(status, { status, reason });
}
API.add('POST', '/signup', async (req, res) => {
try {
var input = await req.body<Entry>();
} catch (err) {
return toError(res, 400, 'Error parsing input');
}
let { email, firstname, lastname } = input || {};
firstname = String(firstname||'').trim();
lastname = String(lastname||'').trim();
email = String(email||'').trim();
// truncated: validation
// Ensure email is not already in use
let exists = await Signup.find(email);
if (exists) return toError(res, 400, 'You have already signed up');
// Generate new `Entry` record
let entry = Signup.prepare({ email, firstname, lastname });
// create "user:<unique email>" document
let isOK = await Signup.save(entry);
if (!isOK) return toError(res, 500, 'Error persisting entry');
// create "code:<unique value>" document
isOK = await Code.save(entry);
if (!isOK) return toError(res, 500, 'Error saving unique code');
// dispatch "We received your registration" email
let sent = await Sparkpost.confirm(entry);
if (!sent) return toError(res, 500, 'Error sending confirmation email');
// render "Thank you, check your {{ email }} for next steps" page
return utils.render(res, CONFIRM, { email: entry.email });
});
A full HTML response is returned, which means that the client-side form handler should be able to see this content and render it directly in the browser window. This can be seen in the following index.js snippet, which was referenced earlier in the submit/index.html as an injected asset:
// (client) index.js
$('form').onsubmit = async function (ev) {
ev.preventDefault();
var form = ev.target;
var res = await fetch(form.action, {
method: form.method || 'POST',
body: new FormData(form),
});
// truncate: clear existing errors
if (res.ok) {
form.reset();
// Receive HTML response
let html = await res.text();
// Force-write the new HTML into this window
document.documentElement.innerHTML = html;
} else {
// truncate: render errors
}
};
BONUS: Because a full HTML response is returned, and all the client-side <form> elements are semantically correct, the form submission workflow will work with JavaScript disabled! The client-side validation will remain functional, but be a degraded experience – the error dialog won’t popup and any error messages will not appear beneath their respective form inputs.
Sending Transactional Emails
It should (hopefully) come as no surprise that programmatically sending an email is pretty straightforward these days. We chose to use SparkPost, but practically every service has the same API mechanics:
Obtain an API Token
Send a POST request to an endpoint with:
your API Token as an Authorization header
your recipient, sender identity, and text and/or HTML content as the POST body
Wait for a 200-level response, or deal with any API errors
Most email-as-a-service providers allow you to define templates, which allow you to replace variables with unique values per email – essentially the same thing our utils.render function is doing with our HTML contents. The benefit of this is that you only have to worry about writing your emails once; then you’re just POST’ing new values to the API endpoint.
SparkPost allows templates to be referenced by a custom name rather than a randomly generated identifier, which makes it easy to track and debug templates over time.
The above snippet includes the entirePOST request formatter – there’s nearly more type-hinting than there is code! Also shown is an example confirm method, which is responsible for sending the unique submission link to the newly-registered user. You’ll notice that firstname and code are the injected variables, required by the “devchallenge-confirm” template.
Overall Performance
I’d call this a success!
Even though this certainly wasn’t my first Worker project – and definitely won’t be my last – I’m consistently amazed how much the Workers runtime lets me get away with. I mean, if you could only take away two points from this article, they should be:
I was able to build a moderately complex application, from scratch, while incorporating a Cache layer, a globally-replicated storage layer, and a super-performant JS runtime, all of which live under the same roof.
I (probably) spent more time fussing with a custom client-side build pipeline than I did piecing together the mission-critical API form handlers.
The cherry on top: Should this contest go viral and lure in millions of visitors, I’d only be paying a couple of dollars at the end of the month. Obviously I have a bias here, but it’s pretty amazing really.
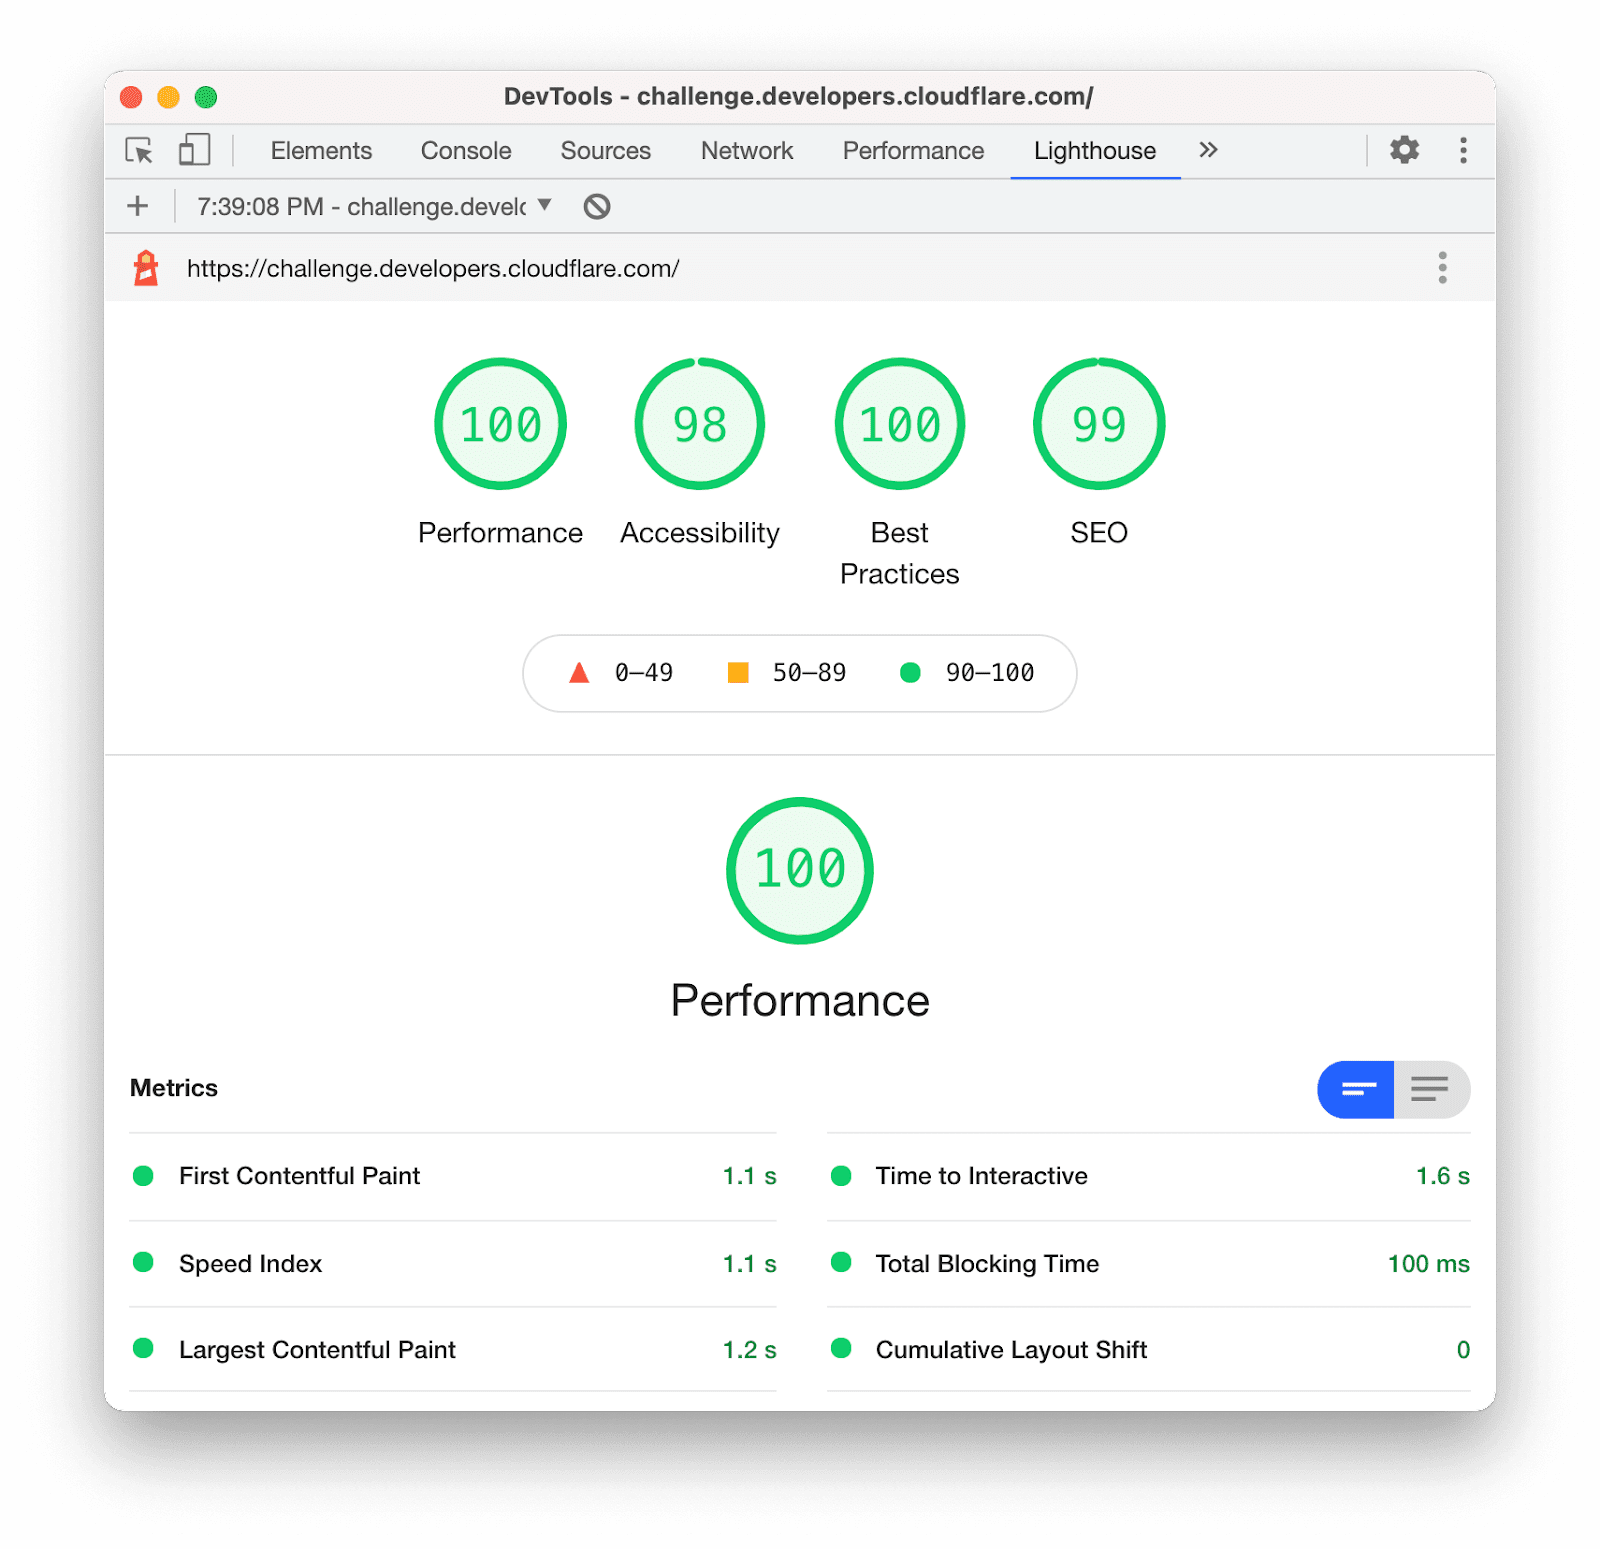
Finally, performance-wise, this may justify the time spent fiddling with the HTML build output:
Lessons Learned
As I alluded to earlier, if I were to rebuild this application, or if I were to add more to it down the road, I would replace the Workers Site architecture with a Pages project and deploy a Worker in front of it for my API requirements and dynamic KV injections.
Since the static assets would no longer be embedded into the Worker’s source, I would need to replace the `utils.render` approach for another utility that fetches the URL from Pages (which becomes my “origin server”) and then uses HTMLRewriter to inject the variables. Also, not that I was anywhere near the 1MB size limit, the largest contributor to my Worker’s bytesize would disappear.
But, more significantly, this refactor would also reduce my total tooling since the majority of the project’s complexity lies in the custom build system for the frontend assets. In other words, the entire /src directory could have been built and deployed like a normal static website, which would allow me to make use of existing frameworks and/or toolkits instead of taking my self-imposed detour. There would have been no need to create a custom frontend toolkit and its bridge to get the static assets loaded into my Worker.
However, none of this is to say that Workers Sites was a bad approach for this application. It’s quite the contrary! This is all to highlight the flexibility of Worker Sites – and the Workers platform at large. Cloudflare Pages exists so that I, the developer, can lean into existing, well-traveled paths and let the experts worry about toolkits, build pipelines, and deployments… But that doesn’t prevent you, the resident expert, from customizing every aspect if that’s your desire.
This post is written by Dominic Gagné and Mithun Mallick.
Amazon MQ is a managed message broker service for Apache ActiveMQ and RabbitMQ that simplifies setting up and operating message brokers in the AWS Cloud. Integrating an Amazon MQ broker with a Lightweight Directory Access Protocol (LDAP) server allows you to manage credentials and permissions for users in a single location. There is also the added benefit of not requiring a message broker reboot for new authorization rules to take effect.
This post explores concepts around Amazon MQ’s authentication and authorization model. It covers the steps to set up Amazon MQ access for a Microsoft Active Directory user.
Authentication and authorization
Amazon MQ for ActiveMQ uses native ActiveMQ authentication to manage user permissions by default. Users are created within Amazon MQ to allow broker access, and are mapped to read, write, and admin operations on various destinations. This local user model is referred to as the simple authentication type.
As an alternative to simple authentication, you can maintain broker access control authorization rules within an LDAP server on a per-destination or destination set basis. Wildcards are also supported for rules that apply to multiple destinations.
The LDAP integration feature uses the ActiveMQ standard Java Authentication and Authorization Service (JAAS) plugin. Additional details on the plugin can be found within ActiveMQ security documentation. Authentication details are defined as part of the ldapServerMetadata attribute. Authorization settings are configured as part of the cachedLDAPAuthorizationMap node in the broker’s activemq.xml configuration.
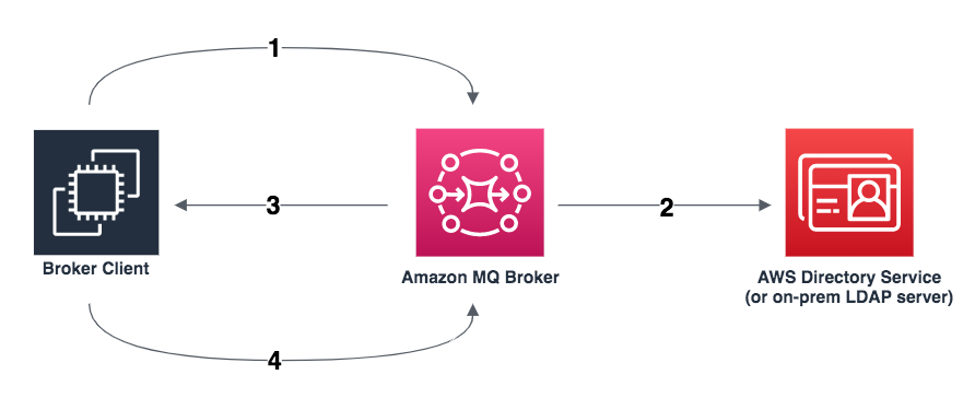
Here is an overview of the integration:
Client requests access to a queue or topic.
Authenticate and authorize the client via JAAS.
Grant or deny Access to the specified queue or topic.
If access is granted, allow the client to read, write, or create.
Integration with LDAP
ActiveMQ integration with LDAP sets up a secure LDAP access connection between an Amazon MQ for ActiveMQ broker and a Microsoft Active Directory server. You can also use other implementations of LDAP as the directory server, such as OpenLDAP.
Amazon MQ encrypts all data between a broker and LDAP server, and enforces secure LDAP (LDAPS) via public certificates. Unsecured LDAP on port 389 is not supported; traffic must communicate via the secure LDAP port 636. In this example, a Microsoft Active Directory server has LDAPS configured with a public certificate. To set up a Simple AD server with LDAPS and a public certificate, read this blog post.
To integrate with a Microsoft Active Directory server:
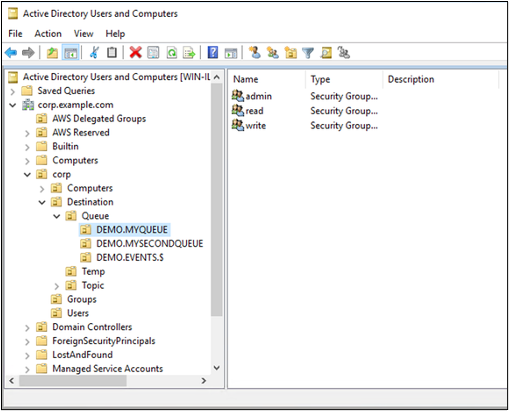
Configure users in the Microsoft Active Directory directory information tree (DIT) structure for client authentication to the broker.
Configure destinations in the Microsoft Active Directory DIT structure to allow destination-level authorization for individual users or entire groups.
Create an ActiveMQ configuration to allow authorization via LDAP.
Create a broker and perform a basic test to validate authentication and authorization access for a test user.
Configuring Microsoft Active Directory for client authentication
Create the hierarchy structure within the Microsoft Active Directory DIT to provision users. The server must be part of the domain and has a domain admin user. The domain admin user is needed in the broker configuration.
In this DIT, the domain corp.example.com is used, though you can use any domain name. An organizational unit (OU) named corp exists under the root. ActiveMQ related entities are defined under the corp OU.
This OU is the user base that the broker uses to search for users when performing authentication operations. Represented as LDIF, the user base is:
OU=Users,OU=corp,DC=corp,DC=example,DC=com
To create this OU and user:
Log on to the Windows Server using a domain admin user.
Open Active Directory Users and Computers by running dsa.msc from the command line.
Choose corp and create an OU named Users, located within corp.
Select the Users OU and enter the name mquser.
Deselect the option to change password on next logon.
Finally, choose Next to create the user.
Because the ActiveMQ source code hardcodes the attribute name for users to uid, make sure that each user has this attribute set. For simplicity, use the user’s connection user name. For more information, see the ActiveMQ source code and knowledgebase article.
Users must belong to the amazonmq-console-admins group to enable console access. Members of this group can create and delete any destinations via the console, regardless of other authorization rules in place. Access to this group should be granted sparingly.
Configuring Microsoft Active Directory for authorization
Now that our broker knows where to search for users, configure the DIT such that the broker can search for user permissions relating to authorization.
Back in the root OU corp where the Users OU was previously created:
Create a new OU named Destination.
Within the Destination OU, create an OU for each type of destination that ActiveMQ offers. These are Queue, Topic, and Temp.
For each destination that you want to allow authorization:
Add an OU under the type of destination.
Provide the name of the destination as the name of the OU. Wildcards are also supported, as found in ActiveMQ documentation.
This example shows three OUs that require authorization. These are DEMO.MYQUEUE, DEMO.MYSECONDQUEUE, and DEMO.EVENTS.$. The queue search base, which provides authorization information for destinations of type Queue, has the following location in the DIT:
Note the DEMO.EVENTS.$ wildcard queue name. Permissions in that OU apply to all queue names matching that wildcard.
Within each OU representing a destination or wildcard destination set, create three security groups. These groups relate to specific permissions on the relevant destination, using the same admin, read, and write permissions rules as ActiveMQ documentation describes.
There is a conflict with the group name “admin”. Legacy “pre-Windows 2000” rules do not allow groups to share the same name, even in different locations of the DIT. The value in the “pre-Windows 2000” text box does not impact the setup but it must be globally unique. In the following screenshot, a uuid suffix is appended to each admin group name.
Adding a user to the admin security group for a particular destination enables the user to create and delete that topic. Adding them to the read security group enables them to read from the destination, and adding them to the write group enables them to write to the destination.
In this example, mquser is added to the admin and write groups for the queue DEMO.MYQUEUE. Later, you test this user’s authorization permissions to confirm that the integration works as expected.
In addition to adding individual users to security group permissions, you can add entire groups. Because ActiveMQ hardcodes attribute names for groups, ensure that the group has the object class groupOfNames, as shown in the ActiveMQ source code.
To do this, follow the same process as with the UID for users. See the knowledgebase article for additional information.
The LDAP server is now compatible with ActiveMQ. Next, create a broker and configure LDAP values based on the LDAP deployment.
Creating a configuration to enable authorization via LDAP
Authorization rules in ActiveMQ are sourced from the broker’s activemq.xml configuration file.
Begin by navigating to the Amazon MQ console to create a configuration with the Authentication Type set as LDAP.
Edit this configuration to include the cachedLDAPAuthorizationMap, which is the node used to configure the locations in the LDAP DIT where authorization rules are stored. For more information on this topic, visit ActiveMQ documentation.
Within the cachedLDAPAuthorizationMap in the broker’s configuration,Add the location of the OUs related to authorization in the broker’s configuration.
Under the authorizationPlugin tag, enter a cachedLDAPAuthorizationMap node.
Do not specify connectionUrl, connectionUsername, or connectionPassword. These values are filled in using the LDAP Server Metadata specified when creating the broker. If you specify these values, they are ignored.An example cachedLDAPAuthorizationMap is presented in the following image:
Creating a broker and testing Active Directory integration
Start by creating a broker using the default durability optimized storage.
Select a Single-instance broker. You can use Active/standby broker or Network of Brokers if required.
Choose Next.
In the next page, under Configure Settings, set a name for the broker.
Select an instance type.
In the ActiveMQ Access section, select LDAP Authentication & Authorization.The input fields display parameters for connecting with the LDAP server. The service account must be associated with a user that can bind to your LDAP server. The server does not need to be public but the domain name must be publicly resolvable.
The next section of the page includes the search configuration for Active Directory users who are authorized to access the queues and topics. The values depend on the org structure created in the Active Directory setup. These values are based on your DIT.
Once users and role search metadata are provided, configure the broker to launch with the configuration created in the previous section (named my-ldap-authorization-conf). Do this by selecting the Additional Settings drop-down and choose the correct configuration file.
Use the configuration where you defined cachedLDAPAuthorizationMap. This enables the broker to enforce read/write/admin permissions for client connections to the broker. These are defined in the LDAP server’s Destination OU.
Once the broker is running, authentication and authorization rules are enforced using the users and authorization rules defined in the configured LDAP server. During the Microsoft Active Directory setup, mquser is added to the admin and write groups for the queue DEMO.MYQUEUE. This means mquser can create and write to the queue DEMO.MYQUEUE but cannot perform any actions on other queues.
Test this by writing to the queue:
The client can connect to the broker and send messages to the queue DEMO.MYQUEUE using the credentials for mquser.
Conclusion
This post shows the steps to integrate an LDAP server with an Amazon MQ broker. After the integration, you can manage authentication and authorization rules for your users, without rebooting the broker.
For more serverless learning resources, visit Serverless Land.
This post is written by Jose Eduardo Montilla Lugo, Security Consultant, AWS.
A VPC link is a resource in Amazon API Gateway that allows for connecting API routes to private resources inside a VPC. A VPC link acts like any other integration endpoint for an API and is an abstraction layer on top of other networking resources. This helps simplify configuring private integrations.
This post looks at the underlying technologies that make VPC links possible. I further describe what happens under the hood when a VPC link is created for both REST APIs and HTTP APIs. Understanding these details can help you better assess the features and benefits provided by each type. This also helps you make better architectural decisions when designing API Gateway APIs.
This article assumes you have experience in creating APIs in API Gateway. The main purpose is to provide a deeper explanation of the technologies that make private integrations possible. For more information on creating API Gateway APIs with private integrations, refer to the Amazon API Gateway documentation.
Overview
AWS Hyperplane and AWS PrivateLink
There are two types of VPC links: VPC links for REST APIs and VPC links for HTTP APIs. Both provide access to resources inside a VPC. They are built on top of an internal AWS service called AWS Hyperplane. This is an internal network virtualization platform, which supports inter-VPC connectivity and routing between VPCs. Internally, Hyperplane supports multiple network constructs that AWS services use to connect with the resources in customers’ VPCs. One of those constructs is AWS PrivateLink, which is used by API Gateway to support private APIs and private integrations.
AWS PrivateLink allows access to AWS services and services hosted by other AWS customers, while maintaining network traffic within the AWS network. Since the service is exposed via a private IP address, all communication is virtually local and private. This reduces the exposure of data to the public internet.
In AWS PrivateLink, a VPC endpoint service is a networking resource in the service provider side that enables other AWS accounts to access the exposed service from their own VPCs. VPC endpoint services allow for sharing a specific service located inside the provider’s VPC by extending a virtual connection via an elastic network interface in the consumer’s VPC.
An interface VPC endpoint is a networking resource in the service consumer side, which represents a collection of one or more elastic network interfaces. This is the entry point that allows for connecting to services powered by AWS PrivateLink.
Comparing private APIs and private integrations
Private APIs are different to private integrations. Both use AWS PrivateLink but they are used in different ways.
A private API means that the API endpoint is reachable only through the VPC. Private APIs are accessible only from clients within the VPC or from clients that have network connectivity to the VPC. For example, from on-premises clients via AWS Direct Connect. To enable private APIs, an AWS PrivateLink connection is established between the customer’s VPC and API Gateway’s VPC.
Clients connect to private APIs via an interface VPC endpoint, which routes requests privately to the API Gateway service. The traffic is initiated from the customer’s VPC and flows through the AWS PrivateLink to the API Gateway’s AWS account:
Consumer connected to provider through VPC Link
When the VPC endpoint for API Gateway is enabled, all requests to API Gateway APIs made from inside the VPC go through the VPC endpoint. This is true for private APIs and public APIs. Public APIs are still accessible from the internet and private APIs are accessible only from the interface VPC endpoint. Currently, you can only configure REST APIs as private.
A private integration means that the backend endpoint resides within a VPC and it’s not publicly accessible. With a private integration, API Gateway service can access the backend endpoint in the VPC without exposing the resources to the public internet.
A private integration uses a VPC link to encapsulate connections between API Gateway and targeted VPC resources. VPC links allow access to HTTP/HTTPS resources within a VPC without having to deal with advanced network configurations. Both REST APIs and HTTP APIs offer private integrations but only VPC links for REST APIs use AWS PrivateLink internally.
VPC links for REST APIs
When you create a VPC link for a REST API, a VPC endpoint service is also created, making the AWS account a service provider. The service consumer in this case is API Gateway’s account. The API Gateway service creates an interface VPC endpoint in their account for the Region where the VPC link is being created. This establishes an AWS PrivateLink from the API Gateway VPC to your VPC. The target of the VPC endpoint service and the VPC link is a Network Load Balancer, which forwards requests to the target endpoints:
VPC Link for REST APIs
Before establishing any AWS PrivateLink connection, the service provider must approve the connection request. Requests from the API Gateway accounts are automatically approved in the VPC link creation process. This is because the AWS accounts that serve API Gateway for each Region are allow-listed in the VPC endpoint service.
When a Network Load Balancer is associated with an endpoint service, the traffic to the targets is sourced from the NLB. The targets receive the private IP addresses of the NLB, not the IP addresses of the service consumers.
This is helpful when configuring the security groups of the instances behind the NLB for two reasons. First, you do not know the IP address range of the VPC that’s connecting to the service. Second, NLB’s elastic network interfaces do not have any security groups attached. This means that they cannot be used as a source in the security groups of the targets. To learn more, read how to find the internal IP addresses assigned to an NLB.
To create a private API with a private integration, two AWS PrivateLink connections are established. The first is from a customer VPC to API Gateway’s VPC so that clients in the VPC can reach the API Gateway service endpoint. The other is from API Gateway’s VPC to the customer VPC so that API Gateway can reach the backend endpoint. Here is an example architecture:
Private API with private integrations
VPC links for HTTP APIs
HTTP APIs are the latest type of API Gateway APIs that are cheaper and faster than REST APIs. VPC links for HTTP APIs do not require the creation of VPC endpoint services so a Network Load Balancer is not necessary. With VPC Links for HTTP APIs, you can now use an ALB or an AWS Cloud Map service to target private resources. This allows for more flexibility and scalability in the configuration required on both sides.
Configuring multiple integration targets is also easier with VPC links for HTTP APIs. For example, VPC links for REST APIs can be associated only with a single NLB. Configuring multiple backend endpoints requires some workarounds such as using multiple listeners on the NLB, associated with different target groups.
In contrast, a single VPC link for HTTP APIs can be associated with multiple backend endpoints without additional configuration. Also, with the new VPC link, customers with containerized applications can use ALBs instead of NLBs and take advantage of layer-7 load-balancing capabilities and other features such as authentication and authorization.
AWS Hyperplane supports multiple types of network virtualization constructs, including AWS PrivateLink. VPC links for REST APIs rely on AWS PrivateLink. However, VPC links for HTTP APIs use VPC-to-VPC NAT, which provides a higher level of abstraction.
The new construct is conceptually similar to a tunnel between both VPCs. These are created via elastic network interface attachments on the provider and consumer ends, which are both managed by AWS Hyperplane. This tunnel allows a service hosted in the provider’s VPC (API Gateway) to initiate communications to resources in a consumer’s VPC. API Gateway has direct connectivity to these elastic network interfaces and can reach the resources in the VPC directly from their own VPC. Connections are permitted according to the configuration of the security groups attached to the elastic network interfaces in the customer side.
Although it seems to provide the same functionality as AWS PrivateLink, these constructs differ in implementation details. A service endpoint in AWS PrivateLink allows for multiple connections to a single endpoint (the NLB), whereas the new approach allows a source VPC to connect to multiple destination endpoints. As a result, a single VPC link can integrate with multiple Application Load Balancers, Network Load Balancers, or resources registered with an AWS Cloud Map service on the customer side:
This post explores how VPC links can set up API Gateway APIs with private integrations. VPC links for REST APIs encapsulate AWS PrivateLink resources such as interface VPC endpoints and VPC endpoint services to configure connections from API Gateway’s VPC to customer’s VPC to access private backend endpoints.
VPC links for HTTP APIs use a different construct in the AWS Hyperplane service to provide API Gateway with direct network access to VPC private resources. Understanding the differences between the two is important when adding private integrations as part of your API architecture design.
For more serverless learning resources, visit Serverless Land.
This series of blog posts uses the AWS Well-Architected Tool with the Serverless Lens to help customers build and operate applications using best practices. In each post, I address the serverless-specific questions identified by the Serverless Lens along with the recommended best practices. See the introduction post for a table of contents and explanation of the example application.
Reliability question REL2: How do you build resiliency into your serverless application?
This post continues part 1 of this reliability question. Previously, I cover managing failures using retries, exponential backoff, and jitter. I explain how DLQs can isolate failed messages. I show how to use state machines to orchestrate long running transactions rather than handling these in application code.
Required practice: Manage duplicate and unwanted events
Duplicate events can occur when a request is retried or multiple consumers process the same message from a queue or stream. A duplicate can also happen when a request is sent twice at different time intervals with the same parameters. Design your applications to process multiple identical requests to have the same effect as making a single request.
Idempotency refers to the capacity of an application or component to identify repeated events and prevent duplicated, inconsistent, or lost data. This means that receiving the same event multiple times does not change the result beyond the first time the event was received. An idempotent application can, for example, handle multiple identical refund operations. The first refund operation is processed. Any further refund requests to the same customer with the same payment reference should not be processes again.
When using AWS Lambda, you can make your function idempotent. The function’s code must properly validate input events and identify if the events were processed before. For more information, see “How do I make my Lambda function idempotent?”
When processing streaming data, your application must anticipate and appropriately handle processing individual records multiple times. There are two primary reasons why records may be delivered more than once to your Amazon Kinesis Data Streams application: producer retries and consumer retries. For more information, see “Handling Duplicate Records”.
Generate unique attributes to manage duplicate events at the beginning of the transaction
Create, or use an existing unique identifier at the beginning of a transaction to ensure idempotency. These identifiers are also known as idempotency tokens. A number of Lambda triggers include a unique identifier as part of the event:
You can also create your own identifiers. These can be business-specific, such as transaction ID, payment ID, or booking ID. You can use an opaque random alphanumeric string, unique correlation identifiers, or the hash of the content.
A Lambda function, for example can use these identifiers to check whether the event has been previously processed.
Depending on the final destination, duplicate events might write to the same record with the same content instead of generating a duplicate entry. This may therefore not require additional safeguards.
Use an external system to store unique transaction attributes and verify for duplicates
Lambda functions can use Amazon DynamoDB to store and track transactions and idempotency tokens to determine if the transaction has been handled previously. DynamoDB Time to Live (TTL) allows you to define a per-item timestamp to determine when an item is no longer needed. This helps to limit the storage space used. Base the TTL on the event source. For example, the message retention period for SQS.
Using DynamoDB to store idempotent tokens
You can also use DynamoDB conditional writes to ensure a write operation only succeeds if an item attribute meets one of more expected conditions. For example, you can use this to fail a refund operation if a payment reference has already been refunded. This signals to the application that it is a duplicate transaction. The application can then catch this exception and return the same result to the customer as if the refund was processed successfully.
Third-party APIs can also support idempotency directly. For example, Stripe allows you to add an Idempotency-Key: <key> header to the request. Stripe saves the resulting status code and body of the first request made for any given idempotency key, regardless of whether it succeeded or failed. Subsequent requests with the same key return the same result.
Validate events using a pre-defined and agreed upon schema
Implicitly trusting data from clients, external sources, or machines could lead to malformed data being processed. Use a schema to validate your event conforms to what you are expecting. Process the event using the schema within your application code or at the event source when applicable. Events not adhering to your schema should be discarded.
SNS supports message filtering. This allows a subscriber to receive a subset of the messages sent to the topic using a filter policy. For more information, see the documentation.
JSON Schema is a tool for validating the structure of JSON documents. There are a number of implementations available.
Best practice: Consider scaling patterns at burst rates
Load testing your serverless application allows you to monitor the performance of an application before it is deployed to production. Serverless applications can be simpler to load test, thanks to the automatic scaling built into many of the services. For more information, see “How to design Serverless Applications for massive scale”.
In addition to your baseline performance, consider evaluating how your workload handles initial burst rates. This ensures that your workload can sustain burst rates while scaling to meet possibly unexpected demand.
Perform load tests using a burst strategy with random intervals of idleness
Perform load tests using a burst of requests for a short period of time. Also introduce burst delays to allow your components to recover from unexpected load. This allows you to future-proof the workload for key events when you do not know peak traffic levels.
There are a number of AWS Marketplace and AWS Partner Network (APN) solutions available for performance testing, including Gatling FrontLine, BlazeMeter, and Apica.
Amazon does have a network stress testing policy that defines which high volume network tests are allowed. Tests that purposefully attempt to overwhelm the target and/or infrastructure are considered distributed denial of service (DDoS) tests and are prohibited. For more information, see “Amazon EC2 Testing Policy”.
Review service account limits with combined utilization across resources
AWS accounts have default quotas, also referred to as limits, for each AWS service. These are generally Region-specific. You can request increases for some limits while other limits cannot be increased. Service Quotas is an AWS service that helps you manage your limits for many AWS services. Along with looking up the values, you can also request a limit increase from the Service Quotas console.
Service Quotas dashboard
As these limits are shared within an account, review the combined utilization across resources including the following:
Amazon API Gateway: number of requests per second across all APIs. (link)
This post continues from part 1 and looks at managing duplicate and unwanted events with idempotency and an event schema. I cover how to consider scaling patterns at burst rates by managing account limits and show relevant metrics to evaluate
Build resiliency into your workloads. Ensure that applications can withstand partial and intermittent failures across components that may only surface in production. In the next post in the series, I cover the performance efficiency pillar from the Well-Architected Serverless Lens.
For more serverless learning resources, visit Serverless Land.
Traditionally, streaming data can be complex to manage due to the large amounts of data arriving from many separate sources. Managing fluctuations in traffic and durably persisting messages as they arrive is a non-trivial task. Using a serverless approach, AWS provides a number of services that help manage large numbers of messages, alleviating much of the infrastructure burden.
In this blog post, I compare several AWS services and how to choose between these options in streaming data workloads.
Comparing Amazon Kinesis Data Streams with Amazon SQS queues
While you can use both services to decouple data producers and consumers, each is suited to different types of workload. Amazon SQS is primarily used as a message queue to store messages durably between distributed services. Amazon Kinesis is primarily intended to manage streaming big data.
Kinesis supports ordering of records and the ability for multiple consumers to read messages from the same stream concurrently. It also allows consumers to replay messages from up to 7 days previously. Scaling in Kinesis is based upon shards and you must reshard to scale a data stream up or down.
With SQS, consumers pull data from a queue and it’s hidden from other consumers until processed successfully (known as a visibility timeout). Once a message is processed, it’s deleted from the queue. A queue may have multiple consumers but they all receive separate batches of messages. Standard queues do not provide an ordering guarantee but scaling in SQS is automatic.
Amazon Kinesis Data Streams
Amazon SQS
Ordering guarantee
Yes, by shard
No for standard queues; FIFO queues support ordering by group ID.
Scaling
Resharding required to provision throughput
Automatic for standard queues; up to 30,000 message per second for FIFO queues (more details).
While some functionality of both services is similar, Kinesis is often a better fit for many streaming workloads. Kinesis has a broader range of options for ingesting large amounts of data, such as the Kinesis Producer Library and Kinesis Aggregation Library. You can also use the PutRecords API to send up to 500 records (up to a maximum 5 MiB) per request.
Choosing between Kinesis Data Streams and Kinesis Data Firehose
Both of these services are part of Kinesis but they have different capabilities and target use-cases. Kinesis Data Firehose is a fully managed service that can ingest gigabytes of data from a variety of producers. When Kinesis Data Streams is the source, it automatically scales up or down to match the volume of data. It can optionally process records as they arrive with AWS Lambda and deliver batches of records to services like Amazon S3 or Amazon Redshift. Here’s how the service compares with Kinesis Data Streams:
Kinesis Data Streams
Kinesis Data Firehose
Scaling
Resharding required
Automatic
Supports compression
No
Yes (GZIP, ZIP, and SNAPPY)
Latency
~200 ms per consumer (~70 ms if using enhanced fan-out)
Seconds (depends on buffer size configuration); minimum buffer window is 60 seconds
Hourly charge plus data volume. Some features have additional charges – see pricing
Based on data volume, format conversion and VPC delivery – see pricing
The needs of your workload determine the choice between the two services. To prepare and load data into a data lake or data store, Kinesis Data Firehose is usually the better choice. If you need low latency delivery of records and the ability to replay data, choose Kinesis Data Streams.
Using Kinesis Data Firehose to prepare and load data
Kinesis Data Firehose buffers data based on two buffer hints. You can configure a time-based buffer from 1-15 minutes and a volume-based buffer from 1-128 MB. Whichever limit is reached first causes the service to flush the buffer. These are called hints because the service can adjust the settings if data delivery falls behind writing to the stream. The service raises the buffer settings dynamically to allow the service to catch up.
This is the flow of data in Kinesis Data Firehose from a data source through to a destination, including optional settings for a delivery stream:
The service continuously loads from the data source as it arrives.
The data transformation Lambda function processes individual records and returns these to the service.
Transformed records are delivered to the destination once the buffer size or buffer window is reached.
Any records that could not be delivered to the destination are written to an intermediate S3 bucket.
Any records that cannot be transformed by the Lambda function are written to an intermediate S3 bucket.
Optionally, the original, untransformed records are written to an S3 bucket.
Data transformation using a Lambda function
The data transformation process enables you to modify the contents of individual records. Kinesis Data Firehose synchronously invokes the Lambda function with a batch of records. Your custom code modifies the records and then returns an array of transformed records.
The incoming payload provides the data attribute in base64 encoded format. Once the transformation is complete, the returned array must include the following attributes per record:
recordId: This must match the incoming recordId to enable the service to map the new data to the record.
result: “Ok”, “Dropped”, or “ProcessingFailed”. Dropped means that your logic has intentionally removed the record whereas ProcessingFailed indicates that an error has occurred.
data: The transformed data must be base64 encoded.
exports.handler = async (event) => {
const output = event.records.map((record) => {
// Extract JSON record from base64 data
const buffer = Buffer.from(record.data, 'base64').toString()
const jsonRecord = JSON.parse(buffer)
// Add the calculated field
jsonRecord.output = ((jsonRecord.cadence + 35) * (jsonRecord.resistance + 65)) / 100
// Convert back to base64 + add a newline
const dataBuffer = Buffer.from(JSON.stringify(jsonRecord) + '\n', 'utf8').toString('base64')
return {
recordId: record.recordId,
result: 'Ok',
data: dataBuffer
}
})
console.log(`Output records: ${output.length}`)
return { records: output }
}
Comparing scaling and throughput with Kinesis Data Streams and Kinesis Data Firehose
Kinesis Data Firehose manages scaling automatically. If the data source is a Kinesis Data Stream, there is no limit to the amount of data the service can ingest. If the data source is a direct put using the PutRecordBatch API, there are soft limits of up to 500,000 records per second, depending upon the Region. See the Kinesis Data Firehose quota page for more information.
Kinesis Data Firehose invokes a Lambda transformation function synchronously and scales up the function as the number of records in the stream grows. When the destination is S3, Amazon Redshift, or the Amazon Elasticsearch Service, Kinesis Data Firehose allows up to five outstanding Lambda invocations per shard. When the destination is Splunk, the quota is 10 outstanding Lambda invocations per shard.
With Kinesis Data Firehose, the buffer hints are the main controls for influencing the rate of data delivery. You can decide between more frequent delivery of small batches of message or less frequent delivery of larger batches. This can impact the PUT cost when using a destination like S3. However, this service is not intended to provide real-time data delivery due to the transformation and batching processes.
With Kinesis Data Streams, the number of shards in a stream determines the ingestion capacity. Each shard supports ingesting up to 1,000 messages or 1 MB per second of data. Unlike Kinesis Data Firehose, this service does not allow you to transform records before delivery to a consumer.
Data Streams has additional capabilities for increasing throughput and reducing the latency of data delivery. The service invokes Lambda consumers every second with a configurable batch size of messages. If the consumers are falling behind data production in the stream, you can increase the parallelization factor. By default, this is set to 1, meaning that each shard has a single instance of a Lambda function it invokes. You can increase this up to 10 so that multiple instances of the consumer function process additional batches of messages.
Data Streams consumers use a pull model over HTTP to fetch batches of records, operating in serial. A stream with five standard consumers averages 200 ms of latency each, taking up to 1 second in total. You can improve the overall latency by using enhanced fan-out (EFO). EFO consumers use a push model over HTTP/2 and are independent of each other.
With EFO, all five consumers in the previous example receive batches of messages in parallel using dedicated throughput. The overall latency averages 70 ms and typically data delivery speed is improved by up to 65%. Note that there is an additional charge for this feature.
Conclusion
This blog post compares different AWS services for handling streaming data. I compare the features of SQS and Kinesis Data Streams, showing how ordering, ingestion throughput, and multiple consumers often make Kinesis the better choice for streaming workloads.
I compare Data Streams and Kinesis Data Firehose and show how Kinesis Data Firehose is the better option for many data loading operations. I show how the data transformation process works and the overall workflow of a Kinesis Data Firehose stream. Finally, I compare the scaling and throughput options for these two services.
For more serverless learning resources, visit Serverless Land.
This series of blog posts uses the AWS Well-Architected Tool with the Serverless Lens to help customers build and operate applications using best practices. In each post, I address the serverless-specific questions identified by the Serverless Lens along with the recommended best practices. See the introduction post for a table of contents and explanation of the example application.
Reliability question REL2: How do you build resiliency into your serverless application?
Evaluate scaling mechanisms for serverless and non-serverless resources to meet customer demand. Build resiliency into your workload to make your serverless application resilient to withstand partial and intermittent failures across components that may only surface in production.
Required practice: Manage transaction, partial, and intermittent failures
Whenever one service or system calls another, there is a chance that failures can happen. Services or systems often don’t fail as a single unit, but rather suffer partial or transient failures. Applications should be designed to handle component failures as part of the architecture. The system should be designed to detect failure and, ideally, automatically heal itself.
Transaction failures can occur when a component is unavailable or under high load. Partial failures can occur when a percentage of requests succeeds, including during batch processing. Intermittent failures might occur when a request fails for a short period of time due to network or other transient issues.
AWS serverless services, including AWS Lambda, are fault-tolerant and designed to handle failures. If a service invokes a Lambda function and there is a service disruption, Lambda invokes the function in a different Availability Zone.
When you invoke a function directly, you determine the strategy for handling errors. You can retry, send the event to a destination or queue for debugging, or ignore the error. Clients such as the AWS Command Line Interface (CLI) and the AWS SDK retry on client timeouts, throttling errors (429), and other errors that are not caused by a bad request.
When you invoke a function indirectly, you must be aware of the retry behavior of the invoker and any service that the request encounters along the way. For more information, see “Error handling and automatic retries in AWS Lambda”. You can configure Maximum Retry Attempts and Maximum Event Age for asynchronous invocations.
When reading from Amazon Kinesis Data Streams and Amazon DynamoDB Streams, Lambda retries the entire batch of items. Retries continue until the records expire or exceed the maximum age that you configure on the event source mapping. You can also configure the event source mapping to split a failed batch into two batches. Retrying with smaller batches isolates bad records and works around timeout issues.
Partial failures can occur in non-atomic operations. PutRecords for Kinesis and BatchWriteItem for DynamoDB return a successful response if at least one record is ingested successfully. Always inspect the response when using such operations and programmatically deal with partial failures.
Use exponential backoff with jitter
The simplest technique for dealing with failures in a networked environment is to retry calls until they succeed. This technique increases the reliability of the application and reduces operational costs for the developer.
However, it is not always safe to retry. A retry can further increase the load on the system being called if the system is already failing due to an overload. To avoid this problem, use backoff. Instead of retrying immediately and aggressively, the client waits some amount of time between tries. The most common pattern is an exponential backoff, which uses exponentially longer wait times between retries. This is typically capped to a maximum delay and number of retries.
If all backoff retries are still happening at the same time, this can still overload a system or cause contention. To avoid this problem, use jitter. Jitter adds some amount of randomness to the backoff to spread the retries around in time. This can help prevent large bursts by spreading out the rate when clients connect. For more information see the Amazon Builders’ Library article “Timeouts, retries, and backoff with jitter” and AWS Architecture blog post “Exponential Backoff And Jitter”.
Exponential backoff and jitter
When your application responds to callers in fail-fast scenarios and when performance is degraded, inform the caller via headers or metadata when they can retry.
Each AWS SDK implements automatic retry logic including exponential backoff. For downstream calls, you can adjust AWS and third-party SDK retries, backoffs, TCP, and HTTP timeouts. This helps you decide when to stop retrying. For more information, see the documentation and troubleshooting steps for Lambda and the AWS SDK.
Use a dead-letter queue mechanism to retain, investigate and retry failed transactions
There are a number of ways to handle message failures including destinations and dead-letter queues.
You can configure Lambda to send records of asynchronous invocations to another destination service. These include Amazon Simple Queue Service (SQS), Amazon Simple Notification Service (SNS), Lambda, and Amazon EventBridge. You can configure separate destinations for events that fail processing and events that are successfully processed. The invocation record contains details about the event, the response, and the reason that the record was sent.
The following example shows a function that sends a record of a successful invocation to an EventBridge event bus. When an event fails all processing attempts, Lambda sends an invocation record to an SQS queue. It includes the function’s response in the invocation record.
AWS Lambda destinations for asynchronous invocation
SNS, SQS, Lambda, and EventBridge support dead-letter queues (DLQs). DLQs make your applications more resilient and durable by storing messages or events that can’t be processed correctly into a dedicated SQS queue. This helps you debug your application by isolating the problematic messages to determine why their processing failed. One you have resolved the issue, re-process the failed message. For more information, see “When should I use a dead-letter queue?” There is an example serverless application to redrive the messages from an SQS DLQ back to its source SQS queue.
For Lambda, DLQs provide an alternative to a failure destination. Lambda destinations is preferable for asynchronous invocations.
Good practice: Orchestrate long-running transactions
Long-running transactions can be processed by one or multiple components. Consider implementing the saga pattern using state machines for these types of transactions.
The saga pattern coordinates transactions between multiple microservices as part of a state machine. Each service that performs a transaction publishes an event to trigger the next transaction in the saga. This continues until the transaction chain is complete. If a transaction fails, saga orchestrates a series of compensating transactions that undo the changes that were made by the preceding transactions.
This is preferable to handling complex or long-running transactions within application code. State machines prevent cascading failures and avoid tightly coupling components with orchestrating logic and business logic.
Use a state machine to visualize distributed transactions, and to separate business logic from orchestration logic.
AWS Step Functions lets you coordinate multiple AWS services into serverless workflows via state machines. Within Step Functions, you can set separate retries, backoff rates, max attempts, intervals, and timeouts. These are set for every step of your state machine using a declarative language.
In the serverless airline example used in this series, Step Functions is used to orchestrate the Booking microservice. The ProcessBooking state machine handles all the necessary steps to create bookings, including payment.
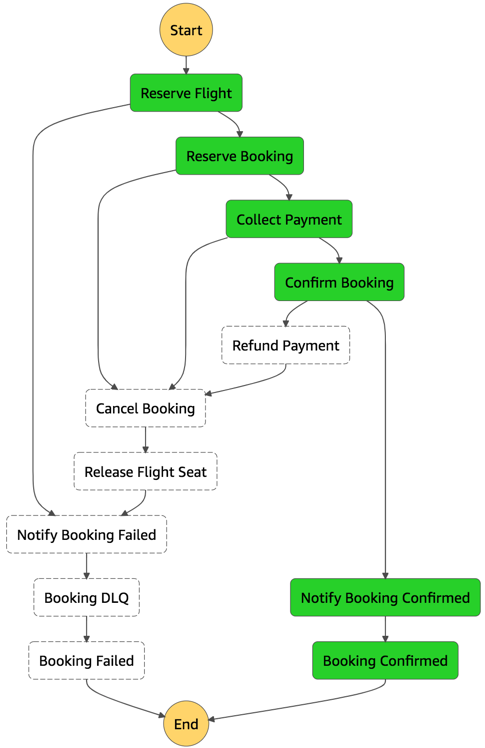
Booking service Step Functions state machine
The state machine uses a combination of service integrations using DynamoDB, SQS, and Lambda functions to coordinate transactions and handle failures.
For example, the Reserve Booking task invokes a Lambda function. The task has retry and error handling configured as part of the task definition.
Step Functions supports direct service integrations, including DynamoDB. The Reserve Flight task directly updates the flightTable without requiring a Lambda function.
By default, when a state reports an error, Step Functions causes the execution to fail entirely.
Utilize dead-letter queues in response to failed state machine executions
Any state within the Step Functions workflow can encounter runtime errors. These include state machine definition issues, task failures such as Lambda function exceptions, or transient issues such as network connectivity issues. For more information, see “Error handling in Step Functions”.
Use the Step Functions service integration with SQS to send failed transactions to a DLQ as the final step. This adds a higher level of durability within your state machines.
For example, the airline Notify Failed Booking final task catches failed states from four previous steps. It sends the results to the Booking DLQ.
Booking service Step Functions DLQ
The message includes the output of the previous failed states for further troubleshooting.
The Step Functions documentation has more information on calling SQS.
Conclusion
Build resiliency into your workloads. This makes sure that your application can withstand partial and intermittent failures across components that may only surface in production.
In this post, I cover managing failures using retries, exponential backoff, and jitter. I explain how DLQs can isolate failed messages. I show how to use state machines to orchestrate long running transactions rather than handling these in application code.
This well-architected question continues in part 2 where I look at managing duplicate and unwanted events with idempotency and an event schema. I cover how to consider scaling patterns at burst rates by managing account limits and show relevant metrics to evaluate.
For more serverless learning resources, visit Serverless Land.

This post is written by Vito De Giosa, Sr. Solutions Architect and Tim Bruce, Sr. Solutions Architect, Developer Acceleration.
This series discusses solutions for scaling serverless games, using the Simple Trivia Service, a game that relies on user-generated content. Part 1 describes the overall architecture, how to deploy to your AWS account, and different communications methods.
This post discusses how to scale via automation and asynchronous processes. You can use automation to minimize the need to scale personnel to review player-generated content for acceptability. It also introduces asynchronous processing, which allows you to run non-critical processes in the background and batch data together. This helps to improve resource usage and game performance. Both scaling techniques can also reduce overall spend.
To set up the example, see the instructions in the GitHub repo and the README.md file. This example uses services beyond the AWS Free Tier and incurs charges. Instructions to remove the example application from your account are also in the README.md file.
Technical implementation
Games require a mechanism to support auto-moderated avatars. Specifically, this is an upload process to allow the player to send the content to the game. There is a content moderation process to remove unacceptable content and a messaging process to provide players with a status regarding their content.
Here is the architecture for this feature in Simple Trivia Service, which is combined within the avatar workflow:
Players start the process by uploading avatars via the game client. Using presigned URLs, the client allows players to upload images directly to S3 without sharing AWS credentials or exposing the bucket publicly.
The URL embeds all the parameters of the S3 request. It includes a SignatureV4 generated with AWS credentials from the backend allowing S3 to authorize the request.
The front end retrieves the presigned URL invoking an AWS Lambda function through an Amazon API Gateway HTTP API endpoint.
The front end uses the URL to send a PUT request to S3 with the image.
Processing avatars
After the upload completes, the backend performs a set of activities. These include content moderation, generating the thumbnail variant, and saving the image URL to the player profile. AWS Step Functions orchestrates the workflow by coordinating tasks and integrating with AWS services, such as Lambda and Amazon DynamoDB. Step Functions enables creating workflows without writing code and handles errors, retries, and state management. This enables traffic control to avoid overloading single components when traffic surges.
The avatar processing workflow runs asynchronously. This allows players to play the game without being blocked and enables you to batch the requests. The Step Functions workflow is triggered from an Amazon EventBridge event. When the user uploads an image to S3, an event is published to EventBridge. The event is routed to the avatar processing Step Functions workflow.
The single avatar feature runs in seconds and uses Step Functions Express Workflows, which are ideal for high-volume event-processing use cases. Step Functions can also support longer running processes and manual steps, depending on your requirements.
To keep performance at scale, the solution adopts four strategies. First, it moderates content automatically, requiring no human intervention. This is done via Amazon Rekognition moderation API, which can discover inappropriate content in uploaded avatars. Developers do not need machine learning expertise to use this API. If it identifies unacceptable content, the Step Functions workflow deletes the uploaded picture.
Second, it uses avatar thumbnails on the top navigation bar and on leaderboards. This speeds up page loading and uses less network bandwidth. Image-editing software runs in a Lambda function to modify the uploaded file and store the result in S3 with the original.
Third, it uses Amazon CloudFront as a content delivery network (CDN) with the S3 bucket hosting images. This improves performance by implementing caching and serving static content from locations closer to the player. Additionally, using CloudFront allows you to keep the bucket private and provide greater security for the content stored within S3.
Finally, it stores profile picture URLs in DynamoDB and replicates the thumbnail URL in an Amazon Cognito user attribute named picture. This allows the game to retrieve the avatar URL as part of the login process, saving an HTTP GET request for the player profile.
The last step of the workflow publishes the result via an event to EventBridge for downstream systems to consume. The service routes the event to the notification component to inform the player about the moderation status.
Notifying users of the processing result
The result of the avatar workflow to the player is important but not urgent. Players want to know the result but not impact their gameplay experience. A solution for this challenge is to use HTTP web push. It uses the HTTP protocol and does not require a constant communication channel between backend and front end. This allows players to play games without being blocked or by introducing latency to the game communications channel.
Applications requiring low latency fully bidirectional communication, such as highly interactive multi-player games, typically use WebSockets. This creates a persistent two-way channel for front end and backend to exchange information. The web push mechanism can provide non-urgent data and messages to the player without interrupting the WebSockets channel.
The web push protocol describes how to use a consolidated push service as a broker between the web-client and the backend. It accepts subscriptions from the client and receives push message delivery requests from the backend. Each browser vendor provides a push service implementation that is compliant with the W3C Push API specification and is external to both client and backend.
The web client is typically a browser where a JavaScript application interacts with the push service to subscribe and listen for incoming notifications. The backend is the application that notifies the front end. Here is an overview of the protocol with all the parties involved.
A component on the client subscribes to the configured push service by sending an HTTP POST request. The client keeps a background connection waiting for messages.
The push service returns a URL identifying a push resource that the client distributes to backend applications that are allowed to send notifications.
Backend applications request a message delivery by sending an HTTP POST request to the previously distributed URL.
The push service forwards the information to the client.
This approach has four advantages. First, it reduces the effort to manage the reliability of the delivery process by off-loading it to an external and standardized component. Second, it minimizes cost and resource consumption. This is because it doesn’t require the backend to keep a persistent communication channel or compute resources to be constantly available. Third, it keeps complexity to a minimum because it relies on HTTP only without requiring additional technologies. Finally, HTTP web push addresses concepts such as message urgency and time-to-live (TTL) by using a standard.
Serverless HTTP web push
The implementation of the web push protocol requires the following components, per the Push API specification. First, the front end is required to create a push subscription. This is implemented through a service worker, a script running in the origin of the application. The service worker exposes operations to access the push service either creating subscriptions or listening for push events.
The client uses the service worker to subscribe to the push service via the Push API.
The push service responds with a payload including a URL, which is the client’s push endpoint. The URL is used to create notification delivery requests.
The browser enriches the subscription with public cryptographic keys, which are used to encrypt messages ensuring confidentiality.
The backend must receive and store the subscription for when a delivery request is made to the push service. This is provided by API Gateway, Lambda, and DynamoDB. API Gateway exposes an HTTP API endpoint that accepts POST requests with the push service subscription as payload. The payload is stored in DynamoDB alongside the player identifier.
This front end code implements the process:
//Once service worker is ready
navigator.serviceWorker.ready
.then(function (registration) {
//Retrieve existing subscription or subscribe
return registration.pushManager.getSubscription()
.then(async function (subscription) {
if (subscription) {
console.log('got subscription!', subscription)
return subscription;
}
/*
* Using Public key of our backend to make sure only our
* application backend can send notifications to the returned
* endpoint
*/
const convertedVapidKey = self.vapidKey;
return registration.pushManager.subscribe({
userVisibleOnly: true,
applicationServerKey: convertedVapidKey
});
});
}).then(function (subscription) {
//Distributing the subscription to the application backend
console.log('register!', subscription);
const body = JSON.stringify(subscription);
const parms = {jwt: jwt, playerName: playerName, subscription: body};
//Call to the API endpoint to save the subscription
const res = DataService.postPlayerSubscription(parms);
console.log(res);
});
Next, the backend reacts to the avatar workflow completed custom event to create a delivery request. This is accomplished with EventBridge and Lambda.
EventBridge routes the event to a Lambda function.
The function retrieves the player’s agent subscriptions, including push endpoint and encryption keys, from DynamoDB.
The function sends an HTTP POST to the push endpoint with the encrypted message as payload.
When the push service delivers the message, the browser activates the service worker updating local state and displaying the notification.
The push service allows creating delivery requests based on the knowledge of the endpoint and the front end allows the backend to deliver messages by distributing the endpoint. HTTPS provides encryption for data in transit while DynamoDB encrypts all your data at rest to provide confidentiality and security for the endpoint.
Security of WebPush can be further improved by using Voluntary Application Server Identification (VAPID). With WebPush, the clients authenticate messages at delivery time. VAPID allows the push service to perform message authentication on behalf of the web client avoiding denial-of-service risk. Without the additional security of VAPID, any application knowing the push service endpoint might successfully create delivery requests with an invalid payload. This can cause the player’s agent to accept messages from unauthorized services and, possibly, cause a denial-of-service to the client by overloading its capabilities.
The front end specifies which backend the push service can accept messages from. It does this by including the public key from VAPID in the subscription request.
When requesting a message delivery, the backend self-identifies by including the public key and a token signed with the private key in the HTTP Authorization header. If the keys match and the client uses the public key at subscription, the message is sent. If not, the message is blocked by the push service.
The Lambda function that sends delivery requests to the push service reads the key values from SSM. It uses them to generate the Authorization header to include in the request, allowing for successful delivery to the client endpoint.
Conclusion
This post shows how you can add scaling support for a game via automation. The example uses Amazon Rekognition to check images for unacceptable content and uses asynchronous architecture patterns with Step Functions and HTTP WebPush. These scaling approaches can help you to maximize your technical and personnel investments.
For more serverless learning resources, visit Serverless Land.
One of the challenges businesses have is to constantly monitor information via media outlets and be alerted when a key interest is picked up, such as individual, product, or company information. One way to do this is to scan media and news feeds against a company watchlist. The list may contain personal names, organizations or suborganizations of interest, and other type of entities (for example, company products). There are several reasons why a company might need to develop such a process: reputation risk mitigation, data leaks, competitor influence, and market change awareness.
In this post, I will share with you a prototype solution that combines several AWS Services: Amazon Comprehend, Amazon API Gateway, AWS Lambda, and Amazon Aurora Serverless. We will examine the solution architecture and I will provide you with the steps to create the solution in your AWS environment.
Overview of solution
Figure 1 – Architecture showing how to build a Scalable Real-Time Newsfeed Watchlist Using Amazon Comprehend
Walkthrough
The preceding architecture shows an Event-driven design. To interact with the solution we use API Lambda functions which are initiated upon user request. Following are the high-level steps.
Create a watchlist. Use the “Refresh_watchlist” API to submit new data, or load existing data from a CSV file located in a bucket. More details in the following “Loading Data” section.
Make sure the data is loaded properly and check a known keyword. Use the “check-keyword” API. More details in the following “Testing” section.
Once the watchlist data is ready, submit a request to “query_newsfeed” with a given newsfeed configuration (url, document section qualifier) to submit a new job to scan the content against the watchlist. Review the example in the “Testing” section.
If an entity or keyword matched, you will get a notification email with the match results.
Technical Walkthrough
When a new request to “query_newsfeed” is submitted. The Lambda handler extracts the content of the URL and creates a new message in the ‘Incoming Queue’.
Once there are available messages in the incoming queue, a subscribed Lambda function is invoked “evaluate content”. Thistakes the scraped content from the message and submits it to Amazon Comprehend to extract the desired elements (entities, key phrase, sentiment).
The result of Amazon Comprehend is passed through a matching logic component, which runs the results against the watchlist (Aurora Serverless Postgres DB), utilizing Fuzzy Name matching.
If a match occurs, a new message is generated for Amazon SNS which initiates a notification email.
To deploy and test the solution we follow four steps:
Create infrastructure
Create serverless API Layer
Load Watchlist data
Test the match
The code for Building a Scalable real-time newsfeed watchlist is available in this repository.
Prerequisites
You will need an AWS account and a Serverless Framework CLI Installed.
Security best practices
Before setting up your environment, review the following best practices, and if required change the source code to comply with your security standards.
6. Load data to the watchlist using a standard web service call to the “refresh_watchlist” API.
7. Test the service by calling the web service “check-keyword”.
8. Use “query_newsfeed” Web service to scan newsfeed and articles against the watchlist.
9. Check your mailbox for match notifications.
10. For cleanup and removal of the solution, review the “clean up” section at the end of this post.
The following screenshot shows best practices for images.
Figure 2 – Screenshot showing image best practices
Loading the watchlist data
We can use the refresh watchlist API to recreate the list with the list provided in the message. Use a tool like Postman to send a POST web service call to the refresh_watchlist.
It is possible to use a CSV file to load the data into the watchlist. Locate your newsfeed bucket and upload a CSV file “watchlist.csv” (no header required) under a directory “watchlist” in the newsfeed bucket (create the directory).
CSV Example:
The following is a screenshot showing how Postman initiates the request.
Figure 3 – Screenshot showing Postman initiate the request
Testing
You can use the dedicated check keyword API to test against a list of keywords to see if the match works. This does not utilize Amazon Comprehend, but it can verify that the list is loaded properly and match against a given criterion.
Figure 4 – You can use the dedicated check keyword API to test against a list of keywords
Note: the spelling mistake for alise with an “s” instead of “c”, and, the pronunciation of Li is spelled as Lee. Both returned as a match.
Now, let’s test it with a related news article.
Figure 5 – Screenshot showing test with a related news article
Check your mailbox! You should receive an email with the match result.
In this post, you learned how to create a scalable watchlist and use it to monitor newsfeed content. This is a practical demonstration for a typical customer problem. The algorithms Levenshtein distance and soundex, along with Amazon Comprehend built-in machine learning capabilities, provides a powerful method to process and analyze text. To support a high volume of queries, the solution uses Amazon SQS to process messages and Amazon Aurora Serverless to automatically scale the database as needed. It is possible to use the same queue for additional data source ingestion.
This solution can be modified for additional purposes such as financial institutions OFAC watchlist (Work in progress) or other monitoring applications. Feel free to provide feedback and tell us how this solution can be useful for you.
Field Notes provides hands-on technical guidance from AWS Solutions Architects, consultants, and technical account managers, based on their experiences in the field solving real-world business problems for customers.
This post is written by Mark Richman, Senior Solutions Architect.
Amazon Managed Workflows for Apache Airflow (MWAA) is a fully managed service that makes it easier to run open-source versions of Apache Airflow on AWS. It allows you to build workflows to run your extract-transform-load (ETL) jobs and data pipelines.
When working with MWAA, you often need to know more about the performance of your Airflow environment to achieve full insight and observability of your system. Airflow emits a number of useful metrics to Amazon CloudWatch, which are described in the product documentation. MWAA allows customers to define CloudWatch dashboards and alarms based upon the metrics and logs that Apache Airflow emits.
Airflow exposes metrics such as number of Directed Acyclic Graph (DAG) processes, DAG bag size, number of currently running tasks, task failures, and successes. Airflow is already set up to send metrics for an MWAA environment to CloudWatch.
This blog demonstrates a solution that automatically detects any deployed Airflow environments associated with the AWS account. It builds a CloudWatch dashboard and some useful alarms for each. All source code for this blog post is available on GitHub.
You automate the creation of a CloudWatch dashboard, which displays several of these key metrics together with CloudWatch alarms. These alarms receive notifications when the metrics fall outside of the thresholds that you configure, and allow you to perform actions in response.
Step Function orchestrates several AWS Lambda functions to query the existing MWAA environments.
Lambda functions will update the CloudWatch dashboard definition to include metrics such as QueuedTasks, RunningTasks, SchedulerHeartbeat, TasksPending, and TotalParseTime.
CloudWatch alarms are created for unhealthy workers and heartbeat failure across all MWAA environments. These alarms are removed for any nonexistent environments.
Any MWAA environments that no longer exist have their respective CW dashboards removed.
EventBridge, a serverless event service, is configured to invoke a Step Functions workflow every 10 minutes. You can configure this for your preferred interval. Step Functions invokes a number of Lambda functions in parallel. If a function throws an error, the failed step in the state machine transitions to its respective failed state and the entire workflow ends.
Each of the Lambda functions performs a single task, orchestrated by Step Functions. Each function has a descriptive name for the task it performs in the workflow.
Understanding the CreateDashboardFunction function
When you deploy the AWS SAM template, the SeedDynamoDBFunction Lambda function is invoked. The function populates a DynamoDB table called DashboardTemplateTable with a CloudWatch dashboard definition. This definition is a template for any new CloudWatch dashboard created by CreateDashboardFunction.
When this Step Functions workflow runs, it runs CreateDashboardFunction. This iterates through all the MWAA environments in the account, creating or updating its corresponding CloudWatch dashboard. You can see the code in /functions/create_dashboard/app.py:
Here is a visualization of the Step Functions state machine:
Step Functions is based on state machines and tasks. A state machine is a workflow. A task is a state in a workflow that represents a single unit of work that another AWS service performs. Each step in a workflow is a state. The state machine in this solution is defined in JSON format in the repo.
Building and deploying the example application
To build and deploy this solution:
Clone the repo from GitHub:
git clone https://github.com/aws-samples/mwaa-dashboard
cd mwaa-dashboard
Build the application. Since Lambda functions may depend on packages that have natively compiled programs, use the --use-container flag. This flag compiles your functions locally in a Docker container that behaves like the Lambda environment:
sam build --use-container
Deploy the application to your AWS account:
sam deploy --guided
This command packages and deploys the application to your AWS account. It provides a series of prompts:
Stack Name: The name of the stack to deploy to AWS CloudFormation. This should be unique to your account and Region. This walkthrough uses mwaa-dashboard throughout this project.
AWS Region: The AWS Region you want to deploy your app to.
Confirm changes before deploy: If set to yes, any change sets will be shown to you for manual review. If set to no, the AWS SAM CLI automatically deploys application changes.
Updating the CloudWatch dashboard template definition in DynamoDB
The CloudWatch dashboard template definition is stored in DynamoDB. This is a one-time setup step, performed by the functions/seed_dynamodb Lambda custom resource at stack deployment time.
To override the template, you can edit the data directly in DynamoDB using the AWS Management Console. Alternatively, modify the scripts/dashboard-template.json file and update DynamoDB using the scripts/seed.py script.
cd scripts
./seed.py -t <dynamodb-table-name>
cd ..
Here, <dynamodb-table-name> is the name of the DynamoDB table created during deployment. For example:
If you have any existing MWAA environments, or create new ones, a dashboard for each appears with the Airflow- prefix. If you delete an MWAA environment, the corresponding dashboard is also deleted. No CloudWatch metrics are deleted.
Upon successful completion of the Step Functions workflow, you see a list of custom dashboards. There is one for each of your MWAA environments:
Choosing the dashboard name displays the widgets defined in the JSON described previously. Each widget corresponds to an Airflow key performance indicator (KPI). The dashboards can be customized through the AWS Management Console without any code changes.
These are the metrics:
QueuedTasks: The number of tasks with queued state. Corresponds to the executor.queued_tasks Airflow metric.
TasksPending: The number of tasks pending in executor. Corresponds to the scheduler.tasks.pending Airflow metric.
RunningTasks: The number of tasks running in executor. Corresponds to the executor.running_tasks Airflow metric.
SchedulerHeartbeat: The number of check-ins Airflow performs on the scheduler job. Corresponds to the scheduler_heartbeat Airflow metrics.
TotalParseTime: Number of seconds taken to scan and import all DAG files once. Corresponds to the dag_processing.total_parse_time Airflow metric.
More information on all MWAA metrics available in CloudWatch can be found in the documentation. CloudWatch alarms are also created for each MWAA environment:
By default, you create two alarms:
{environment name}-UnhealthyWorker: This alarm triggers if the number of QueuedTasks is greater than the number of RunningTasks, and the number of RunningTasks is zero, for a period of 15 minutes.
{environment name}-HeartbeatFail: This alarm triggers if SchedulerHeartbeat is zero for a period of five minutes.
After testing this application, delete the resources created to avoid ongoing charges. You can use the AWS CLI, AWS Management Console, or the AWS APIs to delete the CloudFormation stack deployed by AWS SAM.
To delete the stack via the AWS CLI, run the following command:
With Amazon MWAA, you can spend more time building workflows and less time managing and scaling infrastructure. This article shows a serverless example that automatically creates CloudWatch dashboards and alarms for all existing and new MWAA environments. With this example, you can achieve better observability for your MWAA environments.
To get started with MWAA, visit the user guide. To deploy this solution in your own AWS account, visit the GitHub repo for this article.
For more serverless learning resources, visit Serverless Land.
This series of blog posts uses the AWS Well-Architected Tool with the Serverless Lens to help customers build and operate applications using best practices. In each post, I address the serverless-specific questions identified by the Serverless Lens along with the recommended best practices. See the introduction post for a table of contents and explanation of the example application.
Reliability question REL1: How do you regulate inbound request rates?
This post continues part 1 of this security question. Previously, I cover controlling inbound request rates using throttling. I go through how to use throttling to control steady-rate and burst rate requests. I show some solutions for performance testing to identify the request rates that your workload can sustain before impacting performance.
Good practice: Use, analyze, and enforce API quotas
API quotas limit the maximum number of requests a given API key can submit within a specified time interval. Metering API consumers provides a better understanding of how different consumers use your workload at sustained and burst rates at any point in time. With this information, you can determine fine-grained rate limiting for multiple quota limits. These can be done according to a group of consumer needs, and can adjust their limits on a regular basis.
Segregate API consumers steady-rate requests and their quota into multiple buckets or tiers
Amazon API Gateway usage plans allow your API consumer to access selected APIs at agreed-upon request rates and quotas. These help your consumers meet their business requirements and budget constraints. Create and attach API keys to usage plans to control access to certain API stages. I show how to create usage plans and how to associate them with API keys in “Building well-architected serverless applications: Controlling serverless API access – part 2”.
API key associated with usage plan
You can extract utilization data from usage plans to analyze API usage on a per-API key basis. In the example, I show how to use usage plans to see how many requests are made.
View API key usage
This allows you to generate billing documents and determine whether your customers need higher or lower limits. Have a mechanism to allow customers to request higher limits preemptively. When customers anticipate greater API usage, they can take action proactively.
API Gateway Lambda authorizers can dynamically associate API keys to a given request. This can be used where you do not control API consumers, or want to associate API keys based on your own criteria. For more information, see the documentation.
Define whether your API consumers are end users or machines
Understanding your API consumers helps you manage how they connect to your API. This helps you define a request access pattern strategy, which can distinguish between end users or machines.
Machine consumers make automated connections to your API, which may require a different access pattern to end users. You may decide to prioritize end user consumers to provide a better experience. Machine consumers may be able to handle request throttling automatically.
Best practice: Use mechanisms to protect non-scalable resources
Limit component throughput by enforcing how many transactions it can accept
AWS Lambda functions can scale faster than traditional resources, such as relational databases and cache systems. Protect your non-scalable resources by ensuring that components that scale quickly do not exceed the throughput of downstream systems. This can prevent system performance degrading. There are a number of ways to achieve this, either directly or via buffer mechanisms such as queues and streams.
For relational databases such as Amazon RDS, you can limit the number of connections per user, in addition to the global maximum number of connections. With Amazon RDS Proxy, your applications can pool and share database connections to improve their ability to scale.
Cache results and only connect to, and fetch data from databases when needed. This reduces the load on the downstream database. Adjust the maximum number of connections for caching systems. Include a caching expiration mechanism to prevent serving stale records. For more information on caching implementation patterns and considerations, see “Caching Best Practices”.
Lambda provides managed scaling. When a function is first invoked, the Lambda service creates an instance of the function to process the event. This is called a cold start. After completion, the function remains available for a period of time to process subsequent events. These are called warm starts. If other events arrive while the function is busy, Lambda creates more instances of the function to handle these requests concurrently as cold starts. The following example shows 10 events processed in six concurrent requests.
Lambda concurrency
You can control the number of concurrent function invocations to both reserve and limit the maximum concurrency your function can achieve. You can configure reserved concurrency to set the maximum number of concurrent instances for the function. This can protect downstream resources such as a database by ensuring Lambda can only scale up to the number of connections the database can support.
For example, you may have a traditional database or external API that can only support a maximum of 50 concurrent connections. You can set the maximum number of concurrent Lambda functions using the function concurrency settings. Setting the value to 50 ensures that the traditional database or external API is not overwhelmed.
Edit Lambda concurrency
You can also set the Lambda function concurrency to 0, which disables the Lambda function in the event of anomalies.
Another solution to protect downstream resources is to use an intermediate buffer. A buffer can persistently store messages in a stream or queue until a receiver processes them. This helps you control how fast messages are processed, which can protect the load on downstream resources.
Amazon Kinesis Data Streams allows you to collect and process large streams of data records in real time, and can act as a buffer. Streams consist of a set of shards that contain a sequence of data records. When using Lambda to process records, it processes one batch of records at a time from each shard.
Kinesis Data Streams control concurrency at the shard level, meaning that a single shard has a single concurrent invocation. This can reduce downstream calls to non-scalable resources such as a traditional database. Kinesis Data Streams also support batch windows up to 5 minutes and batch record sizes. These can also be used to control how frequent invocations can occur.
Amazon Simple Queue Service (SQS) is a fully managed serverless message queuing service that enables you to decouple and scale microservices. You can offload tasks from one component of your application by sending them to a queue and processing them asynchronously.
SQS can act as a buffer, using a Lambda function to process the messages. Lambda polls the queue and invokes your Lambda function synchronously with an event that contains queue messages. Lambda reads messages in batches and invokes your function once for each batch. When your function successfully processes a batch, Lambda deletes its messages from the queue.
You can protect downstream resources using the Lambda concurrency controls. This limits the number of concurrent Lambda functions that pull messages off the queue. The messages persist in the queue until Lambda can process them. For more information see, “Using AWS Lambda with Amazon SQS”
Lambda and SQS
Conclusion
Regulating inbound requests helps you adapt different scaling mechanisms based on customer demand. You can achieve better throughput for your workloads and make them more reliable by controlling requests to a rate that your workload can support.
In this post, I cover using, analyzing, and enforcing API quotas using usage plans and API keys. I show mechanisms to protect non-scalable resources such as using RDS Proxy to protect downstream databases. I show how to control the number of Lambda invocations using concurrency controls to protect downstream resources. I explain how you can use streams and queues as an intermediate buffer to store messages persistently until a receiver processes them.
In the next post in the series, I cover the second reliability question from the Well-Architected Serverless Lens, building resiliency into serverless applications.
For more serverless learning resources, visit Serverless Land.
All too often we are confronted with the choice to move quickly or act responsibly. Whether the topic is safety, security, or in this case sustainability, we’re asked to make the trade off of halting innovation to protect ourselves, our users, or the planet. But what if that didn’t always need to be the case? At Cloudflare, our goal is to bring sustainable computing to you without the need for any additional time, work, or complexity.
Enter Green Compute on Cloudflare Workers.
Green Compute can be enabled for any Cron triggered Workers. The concept is simple: when turned on, we’ll take your compute workload and run it exclusively on parts of our edge network located in facilities powered by renewable energy. Even though all of Cloudflare’s edge network is powered by renewable energy already, some of our data centers are located in third-party facilities that are not 100% powered by renewable energy. Green Compute takes our commitment to sustainability one step further by ensuring that not only our network equipment but also the building facility as a whole are powered by renewable energy. There are absolutely no code changes needed. Now, whether you need to update a leaderboard every five minutes or do DNA sequencing directly on our edge (yes, that’s a real use case!), you can minimize the impact of any scheduled work, regardless of how complex or energy intensive.
How it works
Cron triggers allow developers to set time-based invocations for their Workers. These Workers happen on a recurring schedule, as opposed to being triggered by application users via HTTP requests. Developers specify a job schedule in familiar cron syntax either through wrangler or within the Workers Dashboard. To set up a scheduled job, first create a Worker that performs a periodic task, then navigate to the ‘Triggers’ tab to define a Cron Trigger.
The great thing about cron triggered Workers is that there is no human on the other side waiting for a response in real time. There is no end user we need to run the job close to. Instead, these Workers are scheduled to run as (often computationally expensive) background jobs making them a no-brainer candidate to run exclusively on sustainable hardware, even when that hardware isn’t the closest to your user base.
Cloudflare’s massive global network is logically one distributed system with all the parts connected, secured, and trusted. Because our network works as a single system, as opposed to a system with logically isolated regions, we have the flexibility to seamlessly move workloads around the world keeping your impact goals in mind without any additional management complexity for you.
When you set up a Cron Trigger with Green Compute enabled, the Cloudflare network will route all scheduled jobs to green energy hardware automatically, without any application changes needed. To turn on Green Compute today, signup for our beta.
Real world use
If you haven’t ever had the pleasure of writing a cron job yourself, you might be wondering — what do you use scheduled compute for anyway?
There are a wide range of periodic maintenance tasks necessary to power any application. In my working life, I’ve built a scheduled job that ran every minute to monitor the availability of the system I was responsible for, texting me if any service was unavailable. In another instance, a job ran every five mins, keeping the core database and search feature in sync by pulling all new application data, transforming it, then inserting into a search database. In yet another example, a periodic job ran every half hour to iterate over all user sessions and cleanup sessions that were no longer active.
Scheduled jobs are the backbone of real world systems. Now, with Green Compute on Cloudflare Workers all these real world systems and their computationally expensive background maintenance tasks, can take advantage of running compute exclusively on machines powered by renewable energy.
The Green Network
Our mission at Cloudflare is to help you tackle your sustainability goals. Today, with the launch of the Carbon Impact Report we gave you visibility into your environmental impact. The collaboration with the Green Web Foundation gave green hosting certification for Cloudflare Pages. And our launch of Green Compute on Cloudflare Workers allows you to exclusively run on hardware powered by renewable energy. And the best part? No additional system complexity is required for any of the above.
Cloudflare is focused on making it easy to hit your ambitious goals. We are just getting started.
Amazon DynamoDB is a highly performant NoSQL database that provides data storage for many serverless applications. Unlike traditional SQL databases, it does not use table joins and other relational database constructs. However, you can model many common relational designs in a single DynamoDB table but the process is different using a NoSQL approach.
This blog post uses the Alleycat racing application to explain the benefits of a single-table DynamoDB table. It also shows how to approach modeling data access requirements in a DynamoDB table. Alleycat is a home fitness system that allows users to compete in an intense series of 5-minute virtual bicycle races. Up to 1,000 racers at a time take the saddle and push the limits of cadence and resistance to set personal records and rank on virtual leaderboards.
Alleycat requirements
In the Alleycat example, the application offers a number of exercise classes. Each class has multiple races, and there are multiple racers in each race. The system logs the output for each racer per second of the race. An entity-relationship diagram in a traditional relational database shows how you could use normalized tables and relationships to store this data:
In a relational database, often each table has a key that relates to a foreign key in another table. By joining multiple tables, you can query related tables and return the results in a single table view. While this is flexible and convenient, it’s also computationally expensive and difficult to scale horizontally.
Many serverless architectures are built for scale and the relational database paradigm often does not scale as efficiently as a workload demands. DynamoDB scales to almost any level of traffic but one of the tradeoffs is the lack of joins. Fortunately, it offers alternative ways to model the data to meet Alleycat’s requirements.
DynamoDB terminology and concepts
Unlike traditional databases, there is no limit to how much data can be stored in a DynamoDB table. The service is also designed to provide predictable performance at any scale, so you can expect similar query latency regardless of the level of traffic.
The most important operational aspect of running DynamoDB in production is setting and managing throughput. There is a provisioned mode, where you set the throughput, and on-demand, which is managed by the service. In the provisioned mode, you can also use automatic scaling to let the service set the throughput between lower and upper limits you define.
The choice here is determined by the traffic patterns in your workload. For applications with predictable traffic with gradual changes, provisioned mode is the better choice and is more cost effective. If traffic patterns are unknown or you prefer to have capacity managed automatically, choose on-demand. To learn more about the capacity modes, visit the documentation page.
Within each table, you must have a partition key, which is a string, numeric, or binary value. This key is a hash value used to locate items in constant time regardless of table size. It is conceptually different to an ID or primary key field in a SQL-based database and does not relate to data in other tables. When there is only a partition key, these values must be unique across items in a table.
Each table can optionally have a sort key. This allows you to search and sort within items that match a given primary key. While you must search on exact single values in the partition key, you can pattern search on sort keys. It’s common to use a numeric sort key with timestamps to find items within a date range, or use string search operators to find data in hierarchical relationships.
With only partition key and sort keys, this limits the possible types of query without duplicating data in a table. To solve this issue, DynamoDB also offers two types of indexes:
Local secondary indexes (LSIs): these must be created at the same time the table is created and effectively enable another sort key using the same partition key.
Global secondary indexes (GSIs): create and delete these at any time, and optionally use a different partition key from the existing table.
There are other important differences between the two index types:
LSI
GSI
Create
At table creation
Anytime
Delete
At table deletion
Anytime
Size
Up to 10 GB per partition
Unlimited
Throughput
Shared with table
Separate throughput
Key type
Primary key only or composite key (partition key and sort key)
Composite key only
Consistency model
Both eventual and strong consistency
Eventual consistency only
Determining data access requirements
Relational database design focuses on the normalization process without regard to data access patterns. However, designing NoSQL data schemas starts with the list of questions the application must answer. It’s important to develop a list of data access patterns before building the schema, since NoSQL databases offer less dynamic query flexibility than their SQL equivalents.
To determine data access patterns in new applications, user stories and use-cases can help identify the types of query. If you are migrating an existing application, use the query logs to identify the typical queries used. In the Alleycat example, the frontend application has the following queries:
Get the results for each race by racer ID.
Get a list of races by class ID.
Get the best performance by racer for a class ID.
Get the list of top scores by race ID.
Get the second-by-second performance by racer for all races.
While it’s possible to implement the design with multiple DynamoDB tables, it’s unnecessary and inefficient. A key goal in querying DynamoDB data is to retrieve all the required data in a single query request. This is one of the more difficult conceptual ideas when working with NoSQL databases but the single-table design can help simplify data management and maximize query throughput.
Modeling many-to-many relationships with DynamoDB
In traditional SQL, a many-to-many relationship is classically represented with three tables. In the earlier diagram for the Alleycat application, these tables are racers, raceResults, and races. Populated with sample data, the tables look like this:
In DynamoDB, the adjacency list design pattern enables you to combine multiple SQL-type tables into a single NoSQL table. It has multiple uses but in this case can model many-to-many relationships. To do this, the partition key contains both types of item – races and racers. The key value contains the type of data expected in the item (for example, “race-1” or “racer-2”):
With this table design, you can query by racer ID or by race ID. For a single race, you can query by partition key to return all results for a single race, or use the sort key to limit by a single racer or for the overall results. For per racer results, the second-by-second data is stored in a nested JSON structure.
To allow sorting by output to create leaderboard results, the output value must be a sort key. However, the sort key cannot be updated once it is set. Using the main sort key, the application would only be able to write a final race result per racer to query and sort on this data.
To resolve this problem, use an index. The index can use a separate sort key where the value can be updated. This allows Alleycat to store the latest results in this field, and then for queries to sort by output to create a leaderboard.
The preceding table does not represent the races table in the normalized view, so you cannot query by class ID to retrieve a list of races. Depending on your design, you can solve this by adding a second index to the table to enable querying by class ID and returning a list of partition keys (race IDs). However, you can also overload GSIs to contain multiple types of value.
The AlleyCat application uses both an LSI and GSI to accommodate all the data access patterns. This table shows how this is modeled, although the results attribute names are shorter in the application:
Main composite key: PK and SK.
Local secondary index: Partition key is PK and sort key is Numeric.
Global secondary index: Partition key is SK and sort key is Numeric.
Reviewing the data access patterns for Alleycat
Before creating the DynamoDB table, test the proposed schema against the list of data access patterns. In this section, I review Alleycat’s list of queries to ensure that each is supported by the table schema. I use the Item explorer feature to run queries against a test table, after running the Alleycat simulator for multiple races.
1. Get the results for each race by racer ID
Use the table’s partition key, searching for PK = racer ID. This returns a list of all races (PK) for a given racer. See the updateRaceResults function for an example of how this is used:
2. Get a list of races by class ID
Use the local secondary index, searching for partition key = class ID. This results in a list of races (PK) for a given class ID. See the getRaces function code for an example of this query:
3. Get the best performance by racer for a class ID.
Use the table’s partition key, searching for PK = class ID. This returns a list of racers and their best outputs for the given class ID. See the getLeaderboard function code for an example of this query:
4. Get the list of top scores by race ID.
Use the global secondary index, searching for PK = race ID, sorting by the GSI sort key (descending) to rank the results. This returns a sorted list of results for a race. See the updateRaceResults function for an example of how this is used:
5. Get the second-by-second performance by racer for all races.
Use the main table index, searching for PK = racer ID. Optionally use the sort key to restrict to a single race. This returns items with second-by-second performance stored in a nested JSON attribute. See the loadRealtimeHistory function for an example of how this is used:
Optimizing items and capacity
In the Alleycat application, races are only 5 minutes long so the results attribute only contains 300 separate data points (once per second). By using a nested JSON structure in the items, the schema flattens data that otherwise would use 300 rows in the earlier SQL-based design.
The maximum item size in DynamoDB is 400 KB, which includes attribute names. If you have many more data points, you may reach this limit. To work around this, split the data across multiple items and provide the item order in the sort key. This way, when your application retrieves the items, it can reassemble the attributes to create the original dataset.
For example, if races in Alleycat were an hour long, there would be 3,600 data points. These may be stored in six rows containing 600 second-by-second results each:
Additionally, to maximize the storage per row, choose short attribute names. You can also compress data in attributes by storing as GZIP output instead of raw JSON, and using a binary data type for the attribute. This increases processing for the producing and consuming applications, which must compress and decompress the items. However, it can significantly increase the amount of data stored per row.
This post looks at implementing common relational database patterns using DynamoDB. Instead of using multiple tables, the single-table design pattern can use adjacency lists to provide many-to-many relational functionality.
Using the Alleycat example, I show how to list the data access patterns required by an application, and then model the data using composite keys and indexes to return the relevant data using single queries. Finally, I show how to optimize items and capacity for workloads storing large amounts of data.
For more serverless learning resources, visit Serverless Land.
This series of blog posts uses the AWS Well-Architected Tool with the Serverless Lens to help customers build and operate applications using best practices. In each post, I address the serverless-specific questions identified by the Serverless Lens along with the recommended best practices. See the introduction post for a table of contents and explanation of the example application.
Reliability question REL1: How do you regulate inbound request rates?
Defining, analyzing, and enforcing inbound request rates helps achieve better throughput. Regulation helps you adapt different scaling mechanisms based on customer demand. By regulating inbound request rates, you can achieve better throughput, and adapt client request submissions to a request rate that your workload can support.
Required practice: Control inbound request rates using throttling
Throttle inbound request rates using steady-rate and burst rate requests
Throttling requests limits the number of requests a client can make during a certain period of time. Throttling allows you to control your API traffic. This helps your backend services maintain their performance and availability levels by limiting the number of requests to actual system throughput.
To prevent your API from being overwhelmed by too many requests, Amazon API Gateway throttles requests to your API. These limits are applied across all clients using the token bucket algorithm. API Gateway sets a limit on a steady-state rate and a burst of request submissions. The algorithm is based on an analogy of filling and emptying a bucket of tokens representing the number of available requests that can be processed.
API Gateway limits the steady-state rate and burst requests per second. These are shared across all APIs per Region in an account. For further information on account-level throttling per Region, see the documentation. You can request account-level rate limit increases using the AWS Support Center. For more information, see Amazon API Gateway quotas and important notes.
You can configure your own throttling levels, within the account and Region limits to improve overall performance across all APIs in your account. This restricts the overall request submissions so that they don’t exceed the account-level throttling limits.
You can also configure per-client throttling limits. Usage plans restrict client request submissions to within specified request rates and quotas. These are applied to clients using API keys that are associated with your usage policy as a client identifier. You can add throttling levels per API route, stage, or method that are applied in a specific order.
Identify steady-rate and burst rate requests that your workload can sustain at any point in time before performance degraded
Load testing your serverless application allows you to monitor the performance of an application before it is deployed to production. Serverless applications can be simpler to load test, thanks to the automatic scaling built into many of the services. During a load test, you can identify quotas that may act as a limiting factor for the traffic you expect and take action.
Perform load testing for a sustained period of time. Gradually increase the traffic to your API to determine your steady-state rate of requests. Also use a burst strategy with no ramp up to determine the burst rates that your workload can serve without errors or performance degradation. There are a number of AWS Marketplace and AWS Partner Network (APN) solutions available for performance testing, Gatling Frontline, BlazeMeter, and Apica.
To deploy the test suite, follow the instructions in the GitHub repository perf-tests directory. Uncomment the deploy.perftest line in the repository Makefile.
The Gatling simulation script uses constantUsersPerSec and rampUsersPerSec to add users for a number of test scenarios. You can use the test to simulate load on the application. Once the tests run, it generates a downloadable report.
Gatling performance results
Artillery Community Edition is another open-source tool for testing serverless APIs. You configure the number of requests per second and overall test duration, and it uses a headless Chromium browser to run its test flows. For Artillery, the maximum number of concurrent tests is constrained by your local computing resources and network. To achieve higher throughput, you can use Serverless Artillery, which runs the Artillery package on Lambda functions. As a result, this tool can scale up to a significantly higher number of tests.
For more information on how to use Artillery, see “Load testing a web application’s serverless backend”. This runs tests against APIs in a demo application. For example, one of the tests fetches 50,000 questions per hour. This calls an API Gateway endpoint and tests whether the AWS Lambda function, which queries an Amazon DynamoDB table, can handle the load.
Artillery performance test
This is a synchronous API so the performance directly impacts the user’s experience of the application. This test shows that the median response time is 165 ms with a p95 time of 201 ms.
API load testing with authentication and authorization
Conclusion
Regulating inbound requests helps you adapt different scaling mechanisms based on customer demand. You can achieve better throughput for your workloads and make them more reliable by controlling requests to a rate that your workload can support.
In this post, I cover controlling inbound request rates using throttling. I show how to use throttling to control steady-rate and burst rate requests. I show some solutions for performance testing to identify the request rates that your workload can sustain before performance degradation.
This well-architected question will be continued where I look at using, analyzing, and enforcing API quotas. I cover mechanisms to protect non-scalable resources.
For more serverless learning resources, visit Serverless Land.
The collective thoughts of the interwebz
Manage Consent
To provide the best experiences, we use technologies like cookies to store and/or access device information. Consenting to these technologies will allow us to process data such as browsing behavior or unique IDs on this site. Not consenting or withdrawing consent, may adversely affect certain features and functions.
Functional
Always active
The technical storage or access is strictly necessary for the legitimate purpose of enabling the use of a specific service explicitly requested by the subscriber or user, or for the sole purpose of carrying out the transmission of a communication over an electronic communications network.
Preferences
The technical storage or access is necessary for the legitimate purpose of storing preferences that are not requested by the subscriber or user.
Statistics
The technical storage or access that is used exclusively for statistical purposes.The technical storage or access that is used exclusively for anonymous statistical purposes. Without a subpoena, voluntary compliance on the part of your Internet Service Provider, or additional records from a third party, information stored or retrieved for this purpose alone cannot usually be used to identify you.
Marketing
The technical storage or access is required to create user profiles to send advertising, or to track the user on a website or across several websites for similar marketing purposes.