Tag Archives: Trends

2020 U.S. Election: Cybersecurity Analysis

Post Syndicated from Jocelyn Woolbright original https://blog.cloudflare.com/2020-us-election-cybersecurity-analysis/

2020 U.S. Election: Cybersecurity Analysis

As the election season has ramped down and the new Presidential Administration begins, we think it’s important to assess whether there are lessons we can draw from our experience helping to provide cybersecurity services for those involved in the 2020 U.S. elections.

Cloudflare built the Athenian Project – our project to provide free services to state and local election websites – around the idea that access to the authoritative voting information offered by state and local governments is key to a functioning democracy and that Cloudflare could play an important role in ensuring that election-related websites are protected from cyberattacks intended to disrupt that access. Although the most significant challenges in this election cycle fell outside the realm of cybersecurity, the 2020 election certainly validated the importance of having access to definitive sources of authoritative election information.

We were pleased that the robust cybersecurity preparations we saw for the 2020 U.S. election appeared to be successful. From the Cloudflare perspective, we had the opportunity to witness firsthand the benefits of having access to free cybersecurity services provided to organizations that promote accurate voting information and election results, state and local governments conducting elections, and federal U.S candidates running for office. As we protect many entities in the election space, we have the ability to identify, learn and analyze attack trends targeted at these sites that provide authoritative election information. We hope that we will continue to be able to assist researchers, policymakers and security experts looking to support best practices to protect the integrity of the electoral process.

Supporting free and fair elections

Many state and local governments bolstered their security postures ahead of the 2020 elections. There have been partnerships between governments, organizations, and private companies assisting election officials with the tools and expertise on best ways to secure the democratic process. Additionally, the spread of COVID-19 has prompted unprecedented challenges on how citizens can vote safely and securely.

Before the 2020 U.S. election, we detailed much of the activity targeting those in the election space to prepare for election day. To the relief of security experts, there were no significant publicly reported cybersecurity incidents as Chris Krebs, Director of the Cybersecurity and Infrastructure Security Agency during the 2020 election described it as “just another Tuesday on the Internet.” On November 12, 2020, a joint statement from the leading election security organizations stated “The November 3rd election was the most secure in American history . . . [T]here is no evidence that any voting system deleted or lost votes, changed votes, or was in any way compromised.”

At Cloudflare, we had a team of over 50 employees monitoring and addressing any issues to ensure we were providing our highest level of support to those working in the election space. It is important to note that our services do not protect electronic voting boxes or ballot counters; instead, Cloudflare services provide protection to websites, applications, and APIs. But we do protect many websites that provide pertinent information on the electoral process in the United States. This includes a wide range of players in the election space that facilitate voter registration, provide information on polling places, and publish election results. Since the 2016 election, state and local government websites that provide information such as voter registration, polling places, and election results, which have been increasingly targeted with cyberattacks.

Protecting organizations in the election space with Project Galileo

We launched Project Galileo in 2014 to provide a free set of security services to a range of vulnerable groups on the Internet such as human rights organizations, journalists and social justice organizations. Under the project, we currently protect more than 1,400 organizations working in regions all over the world with many organizations that work towards providing accurate voting information, tackling voter suppression, providing resources on voting rights and publishing election results. Cloudflare works with a variety of different types of non-governmental entities under Project Galileo, but we generally put them into two groups: participants, who are granted the benefits of Project Galileo, and partners, who work with us to identify other organizations who might be worth supporting. Our partners are typically larger civil society organizations and high profile NGOs, who work with entities who might benefit from our services and decide who should receive Cloudflare protections under the project.

Many of these organizations need cybersecurity protections well before election day. Belmont University is a private, four-year university located in Nashville, Tennessee. Shortly after the University was selected to be the site of the third and final 2020 U.S. Presidential Debate, the University reached out to Cloudflare asking for assistance. As part of the support for the debate, Belmont launched a new website to provide a centralized space for volunteers, media, and the community to prepare and organize the debate.

The project was quickly accepted to Project Galileo and we worked with Paul Chenoweth, Web Programming Service Manager for Belmont University to tackle concerns over server capacity, visitor traffic, site security, and analytics. Chenoweth explains, “We faced a number of web site challenges in 2008 when the university hosted the Town Hall Presidential Debate and with a totally new set of conditions in 2020, we did not know what to expect. We were worried about our site being taken down by malicious actors but also by unpredictable surges in traffic to the site. The Cloudflare team helped us create firewall rules, lock down our origin, and provided support during the Presidential debate.” Due to the spread of COVID-19, the debate website was the primary source of information for media registration, volunteer applications, and the event calendar for more than 40 themed virtual education events for the community. Overall, the university saw a 5x increase in traffic and blocked more than 80,000 malicious HTTP requests targeting their site.

Read stories from these organizations and Project Galileo here.

2020 U.S. Election: Cybersecurity Analysis

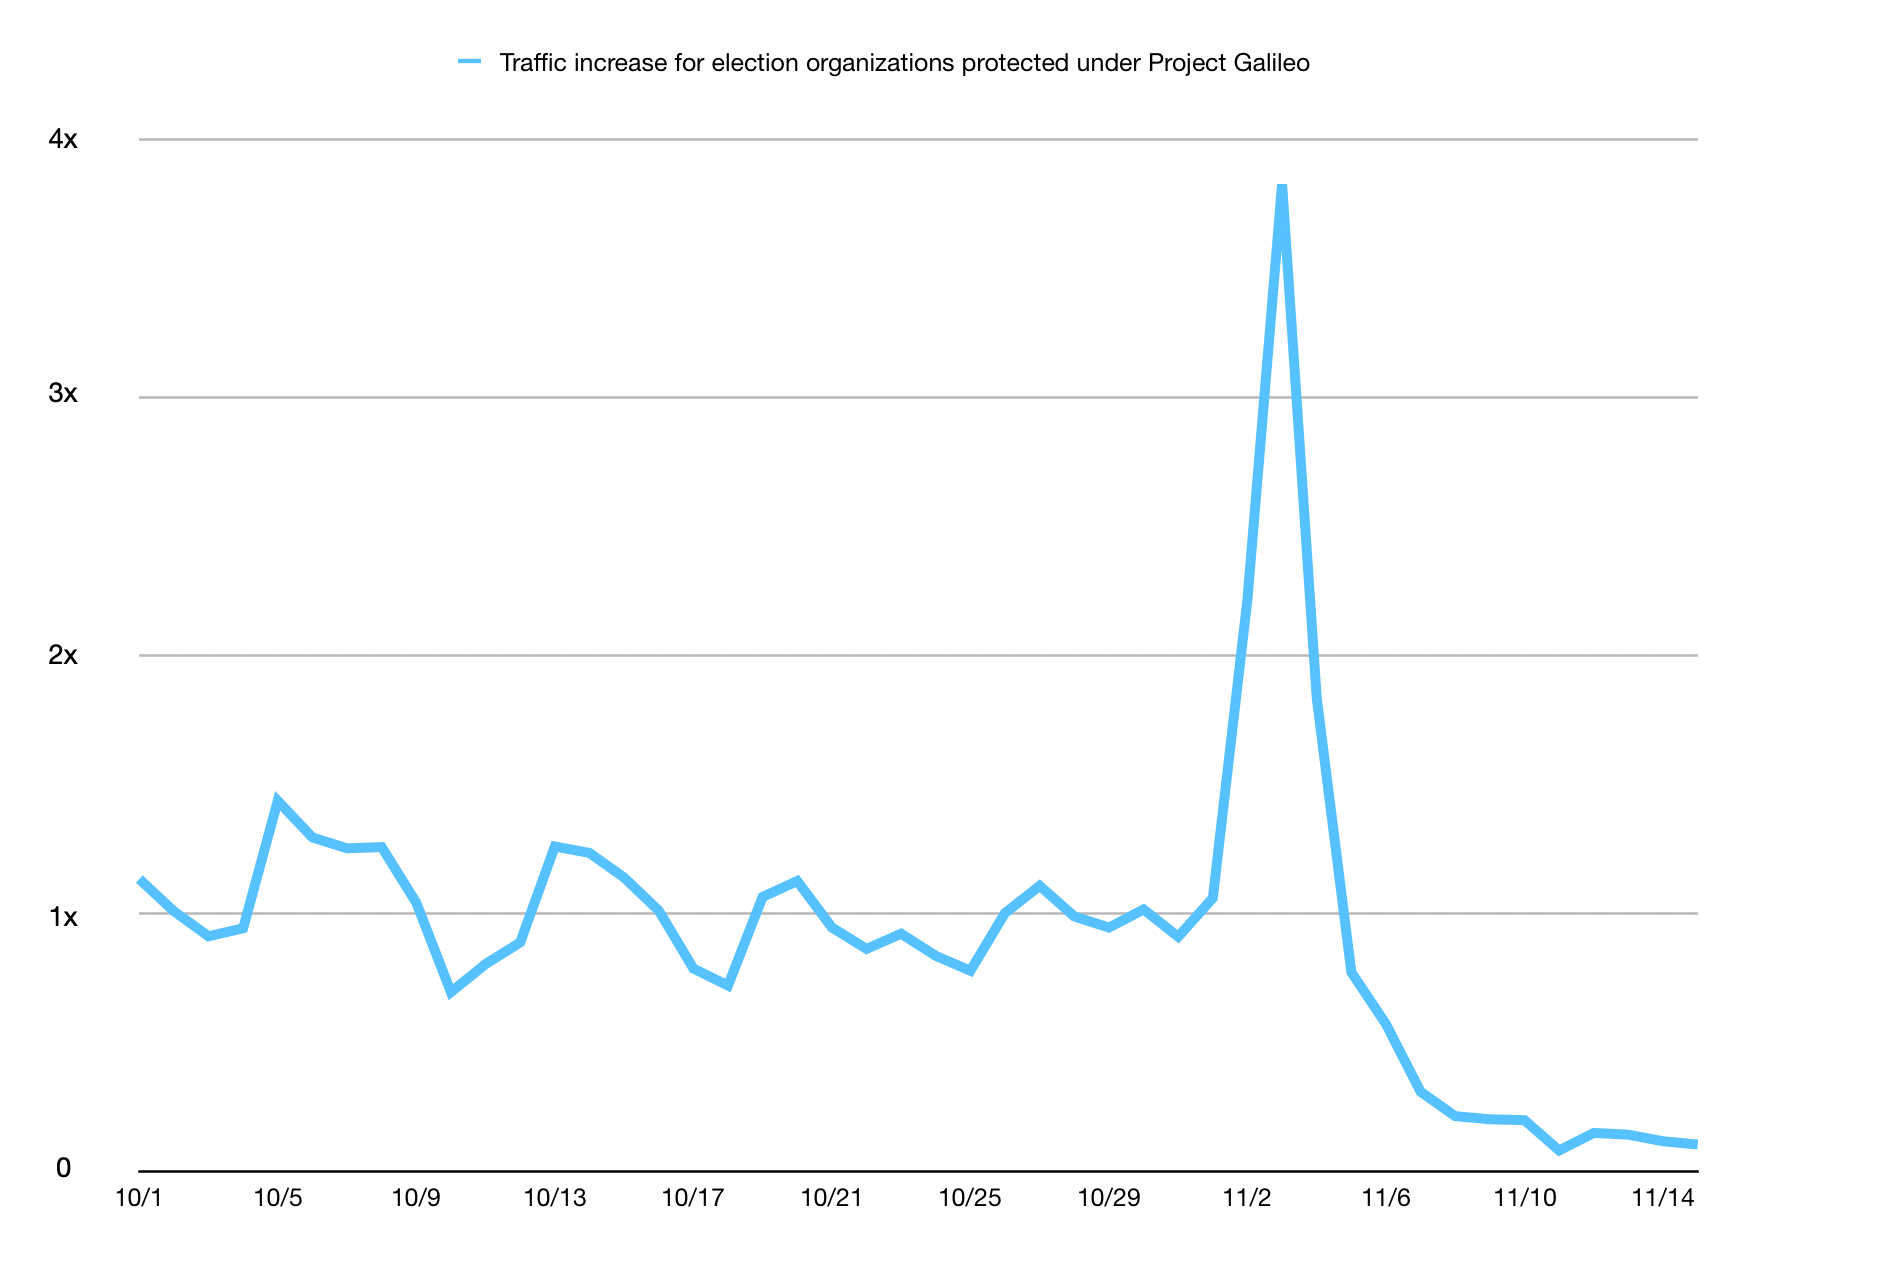
Under Project Galileo, we provide powerful cybersecurity tools to assist organizations such as Vote America, U.S. Vote Foundation, Decision Desk HQ, and many more working in the election space to identify and mitigate attacks targeting their web infrastructure. Along with protection from malicious DDoS attacks, our services also help with large influxes of unexpected traffic as organizations tend to see traffic spikes during voter registration deadlines. During the months leading up to elections, many of these organizations provided up to date information on the changing voting processes due to COVID-19. During the ballot count, many organizations posted election results online as state and local governments began reporting official numbers.

2020 U.S. Election: Cybersecurity Analysis

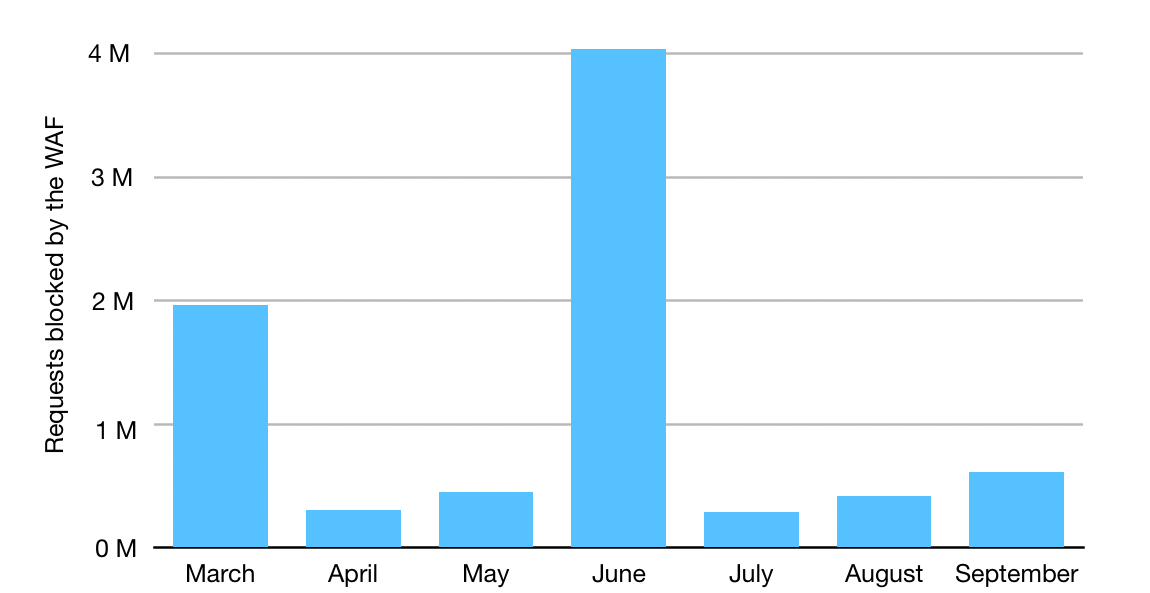
Many of the election-related organizations under Project Galileo allow you to register to vote, view the status of your voting ballot, and much more. States often hold their state and presidential primaries on different dates with the earliest primaries for 2020 held in March with 24 states and June with 23 states. When looking at cyberattacks against election organizations during the elections, the Cloudflare WAF blocked more than 10 million attacks in 2020. We can see that the WAF mitigated a majority of attacks during these two months, as many states held elections and voter registration deadlines.

2020 U.S. Election: Cybersecurity Analysis

Protecting election websites with the Athenian Project

In 2017, we launched the Athenian Project to provide our highest level of service to U.S. state and local governments running elections. This includes county board of election websites, Secretaries of State, and many smaller municipalities that register citizens to vote and publish election results. Under the Athenian Project, we protect more than 275 election entities in 30 states. In the past year, we onboarded more than 100 government election sites in preparation for the November 3rd election.

Read stories from state and local governments protected under the Athenian project here.

2020 U.S. Election: Cybersecurity Analysis

During the month leading up to elections, we had a team of engineers ready to assist state and local governments looking for help protecting their websites from cyberattacks. We onboarded Solano County in California, who engaged with our team on the best way to secure their election resources as we approached November 3rd.  The right to a free and fair election is one of the most basic civil rights we enjoy as Americans; it is a right upon which many of our foundational civil rights depend. Creating the conditions for transparent, clear, and truthful communications about the process and outcomes of elections is crucial to maintain the public trust in our electoral process, says Tim Flanagan, Chief Information Officer for Solano County. In a few hours, we onboarded the county to Cloudflare and implemented best-practices tailored for election entities that use our services under the Athenian Project. Cloudflare’s services added additional layers of security to our web presence that raised confidence in our ability to assure County’s residents that our election results were trustworthy.

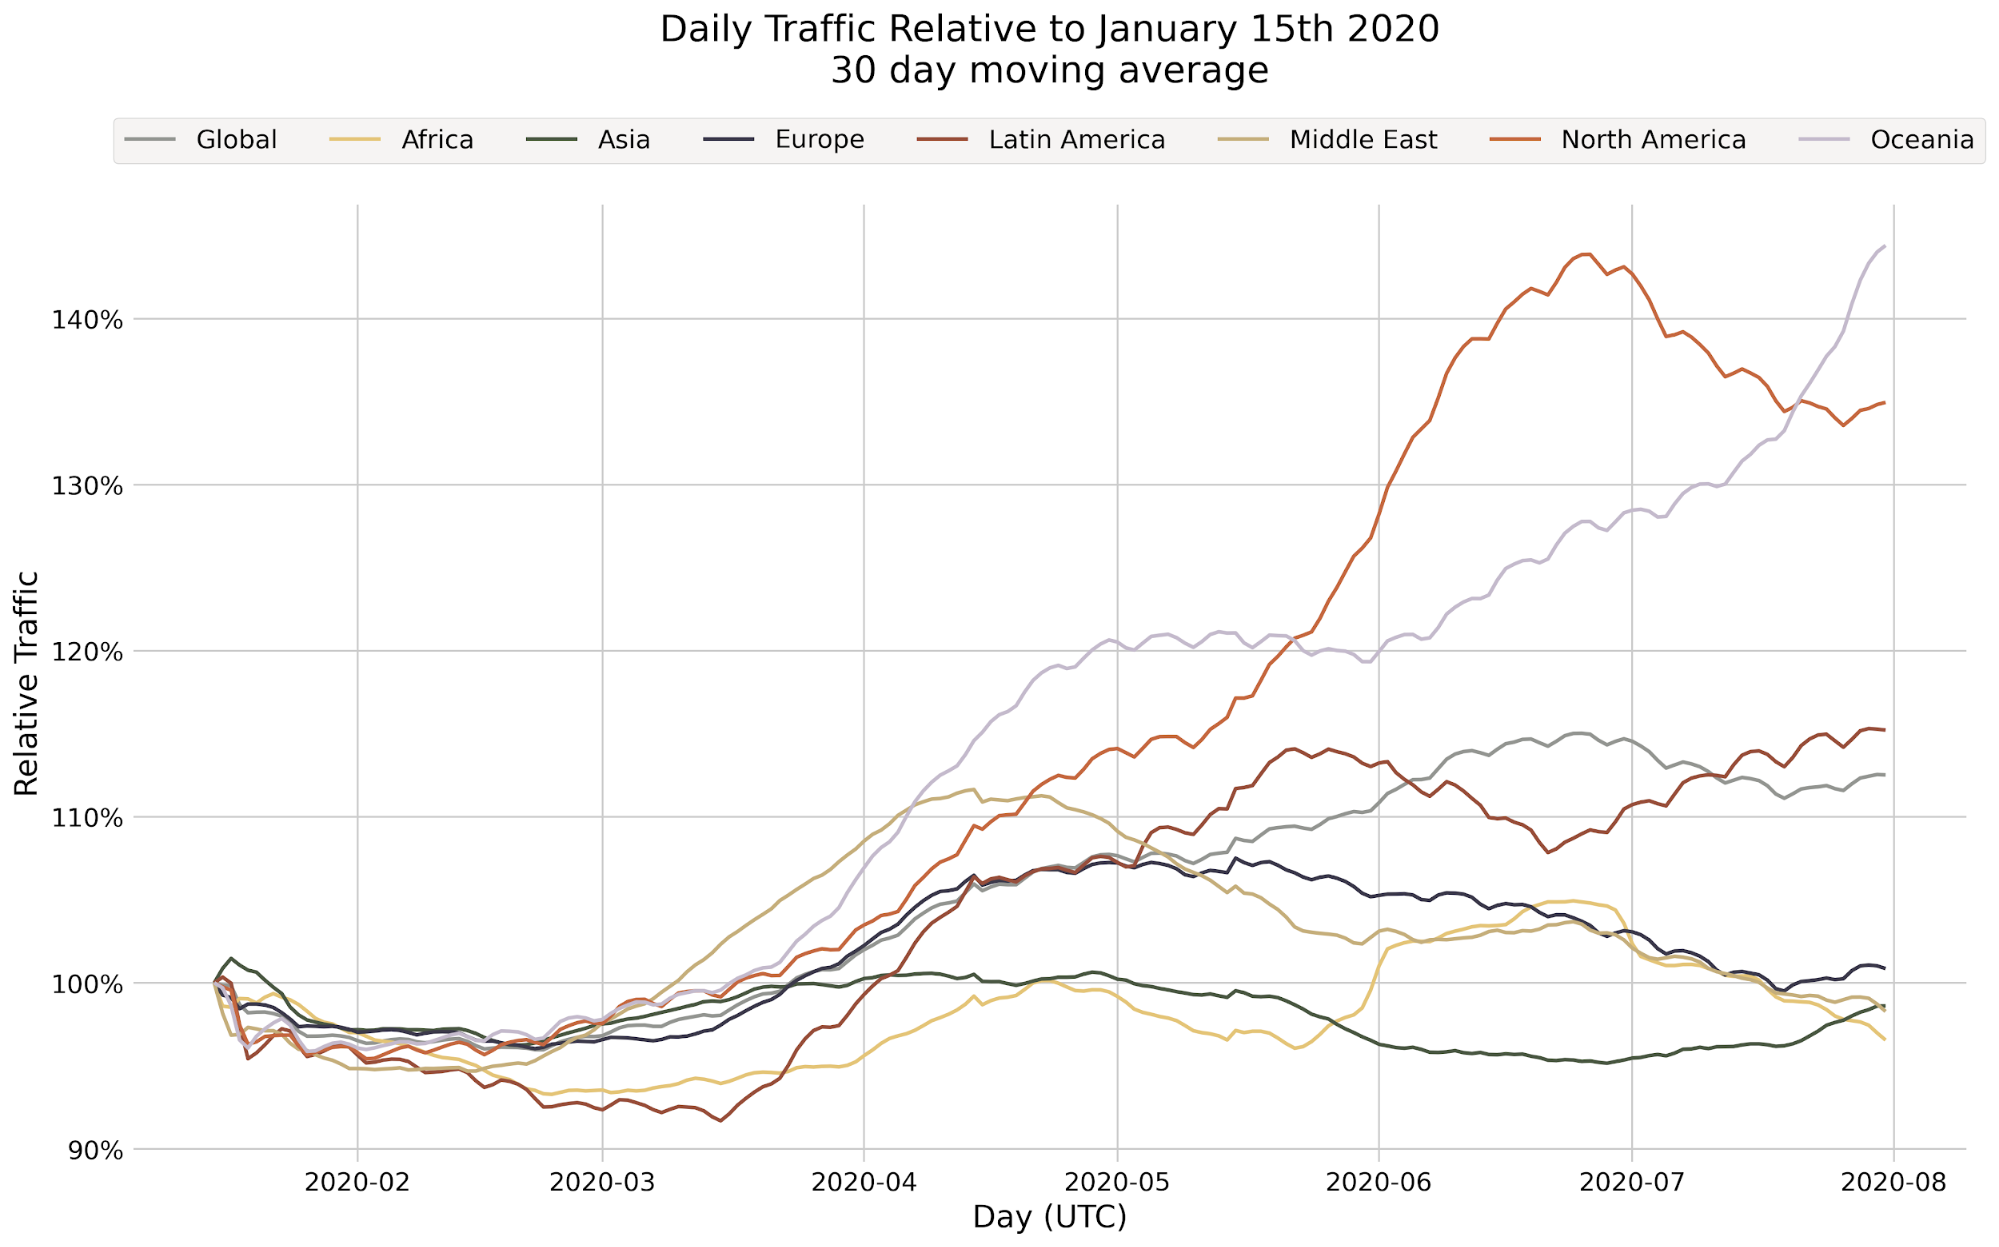
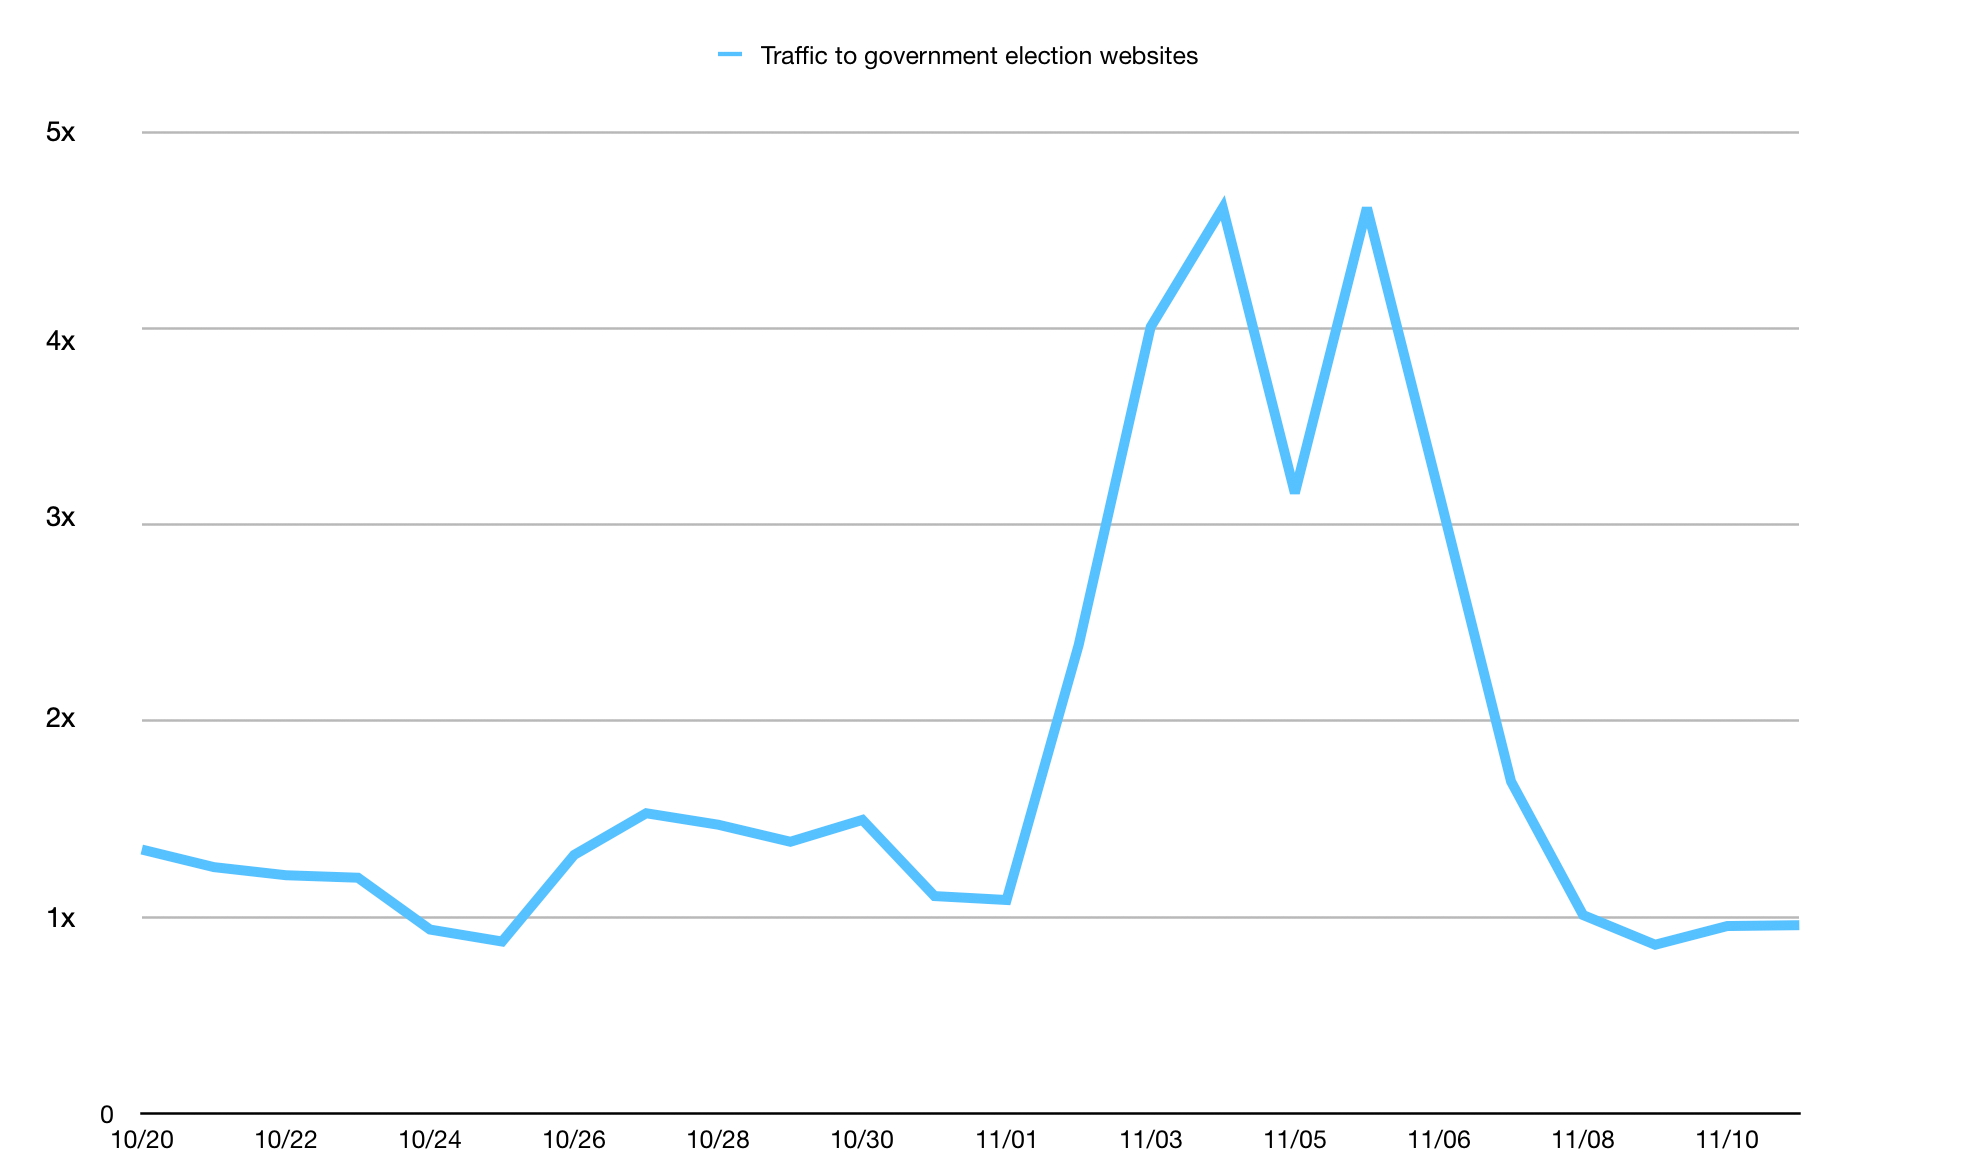
Starting in November, we saw traffic to government election sites increase as many people looked for polling places or how to contact local election officials. We also saw those traffic spikes after election day, as many election websites post periodic updates as the counting of ballots ensues. We reported many of these traffic spikes in the Election Dashboard with Cloudflare Radar.

2020 U.S. Election: Cybersecurity Analysis

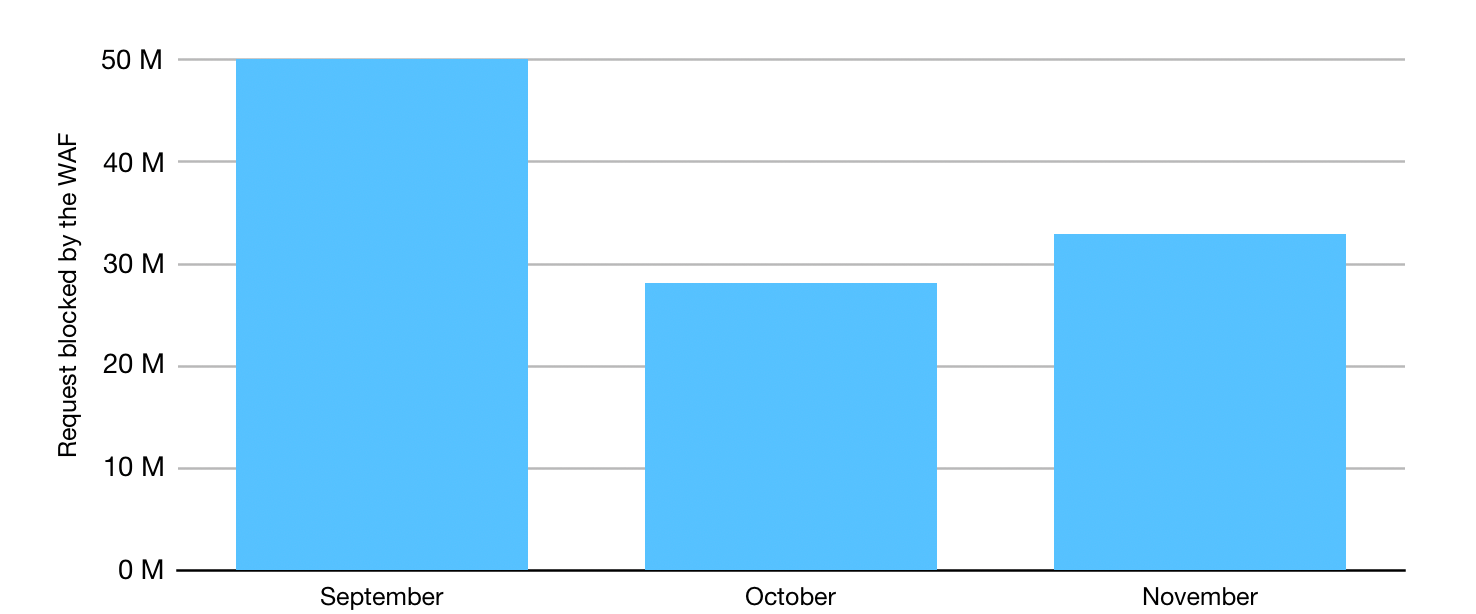
For cyberattacks targeting government election websites, we found a majority of attacks before election day and primarily in September with about 50 million HTTPS requests blocked by the web application firewall.

2020 U.S. Election: Cybersecurity Analysis

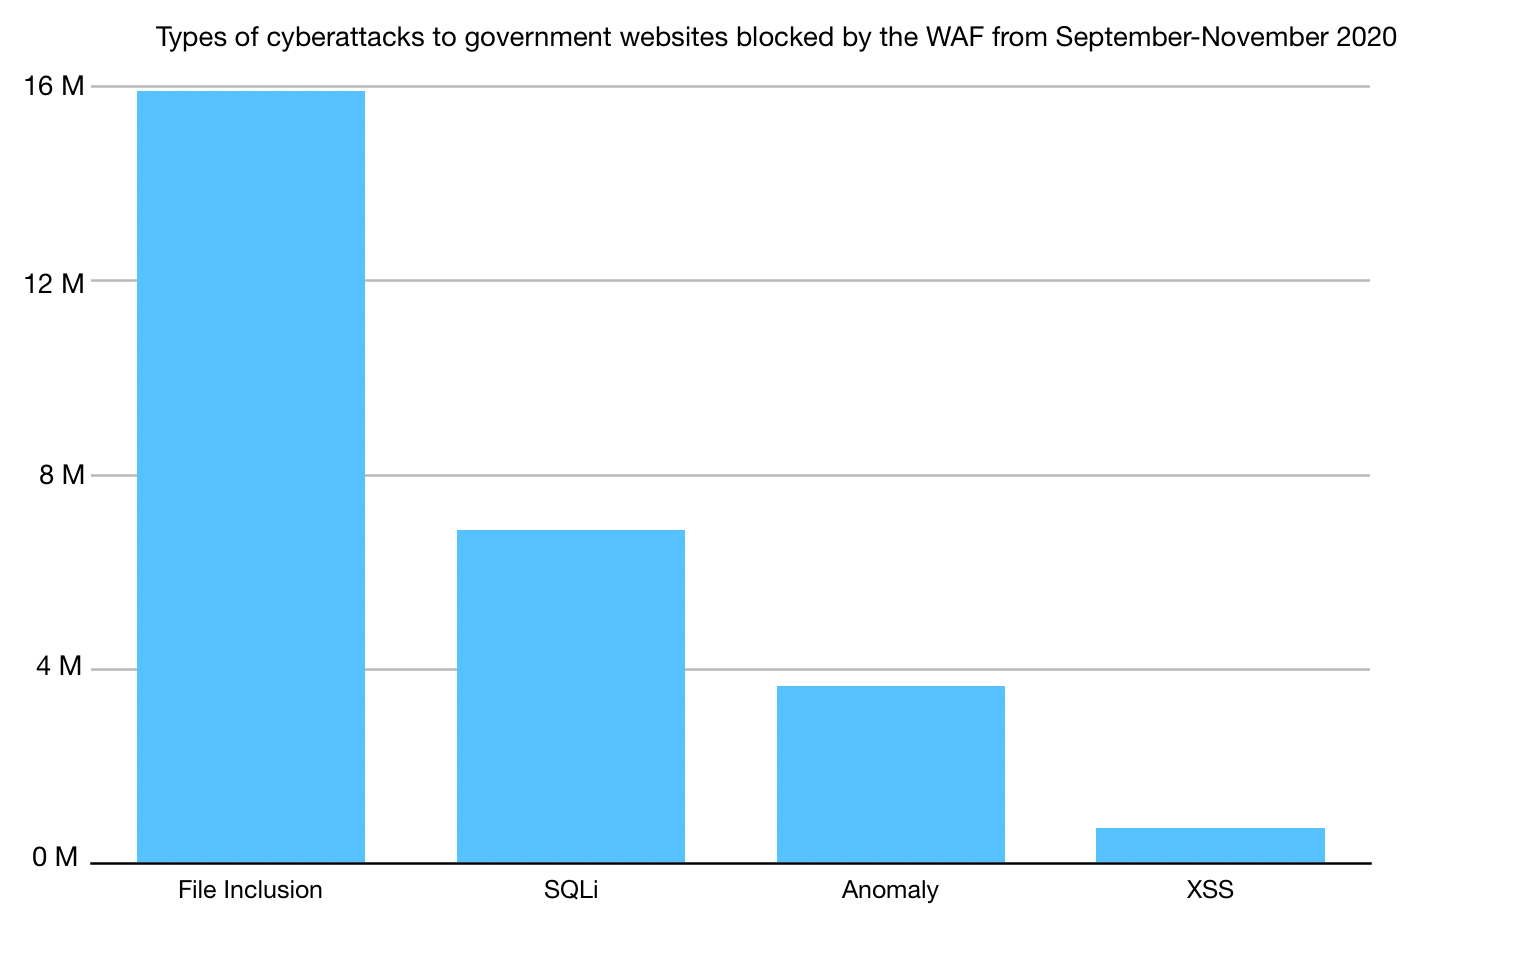
From November 4 to November 11, the WAF mitigated 16,304,656 malicious requests to sites under the Athenian Project. During this time, many state and local governments were counting ballots and posting election results to their websites. A majority of attacks were blocked by the managed ruleset in the WAF – a set of rules curated by Cloudflare engineers to block against common vulnerabilities – including SQLi, cross-site scripting and cross-site forgery requests. These are not sophisticated attacks that we see, but hackers looking for vulnerabilities to access or modify sensitive information. For example, file inclusion is an attack targeting web applications to upload malware to steal or modify the content of the site.

2020 U.S. Election: Cybersecurity Analysis

Protecting Political Campaigns in 2020

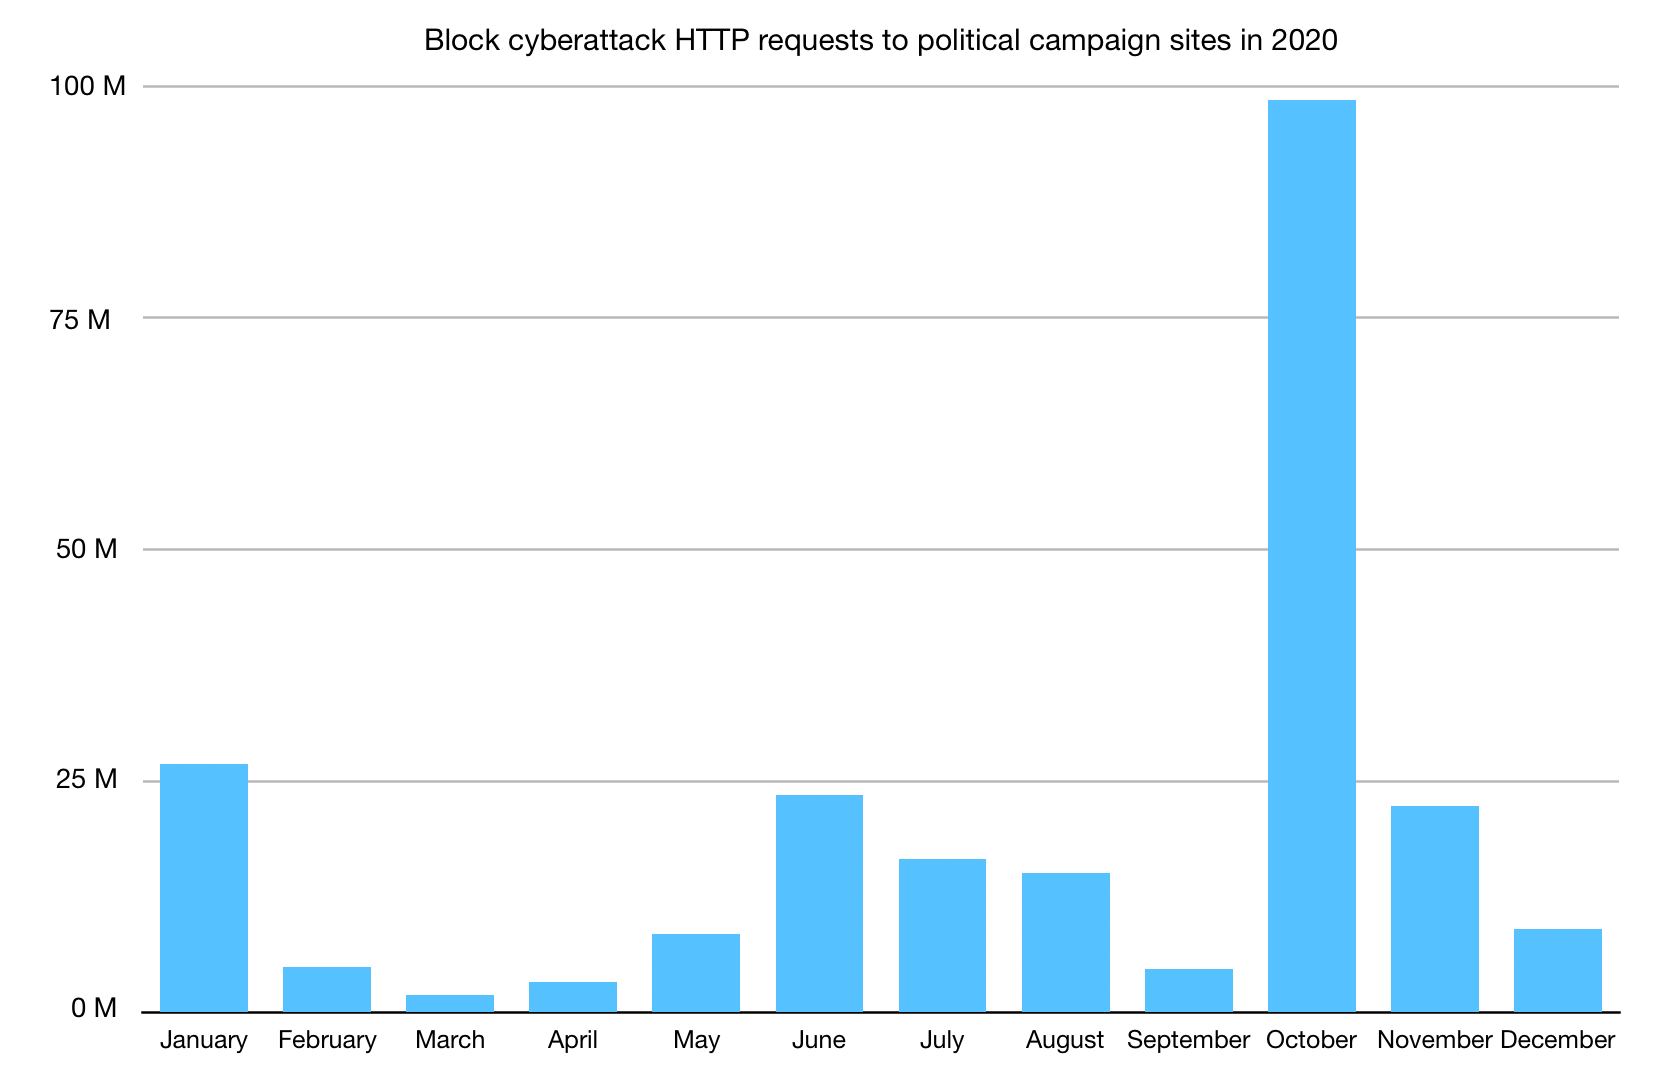
In January 2020, we launched Cloudflare for Campaigns, a suite of free security services to federal campaigns with our partnership with Defending Digital Campaigns. During the course of the year, we onboarded 75 campaigns ranging from House, Senate, and Presidential candidates running for election in 2020. At Cloudflare, we have a range of campaigns that use our services ranging from free up to our Enterprise level plan. Overall, we protected more than 450 candidate sites running for federal office in 2020.

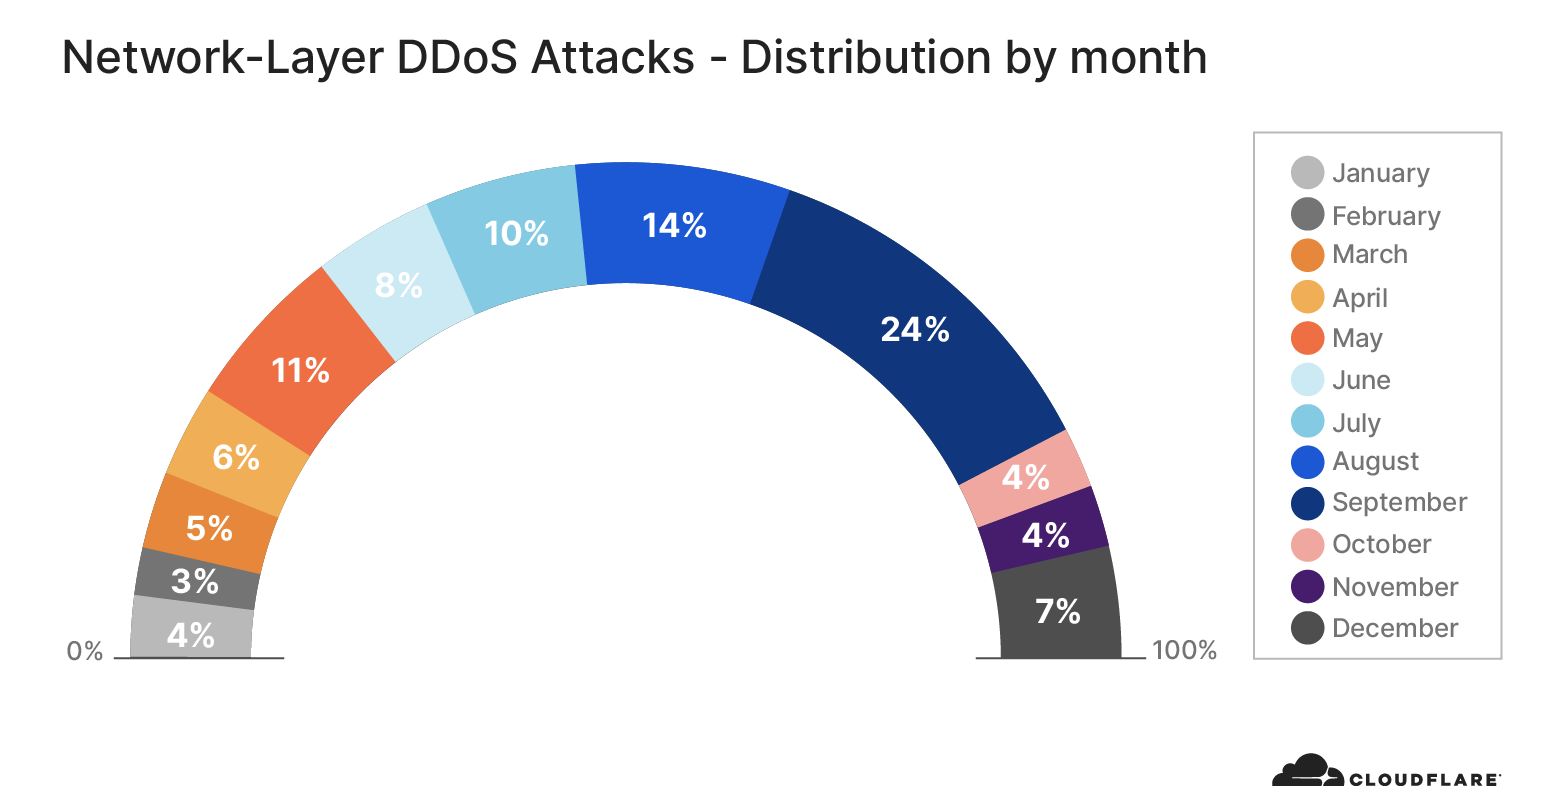
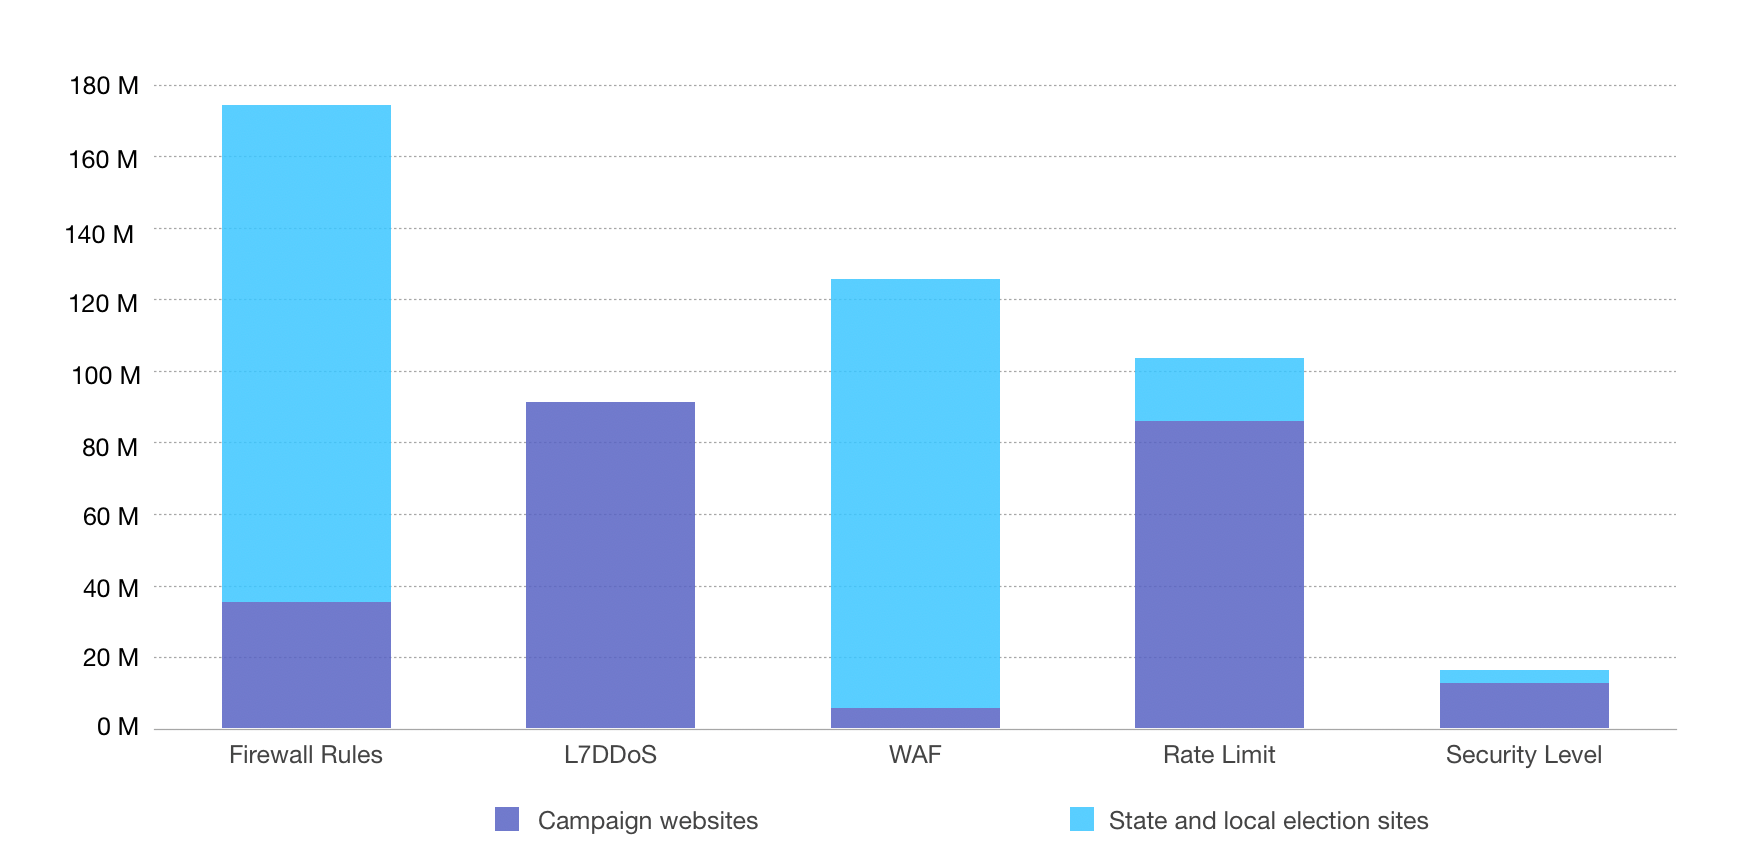
In 2020, the average number of attacks on U.S. campaign websites on Cloudflare per month was about 13 million. When comparing attacks against political campaigns and government election sites, we saw more DDoS attacks rather than hackers trying to exploit website vulnerabilities. As depicted below, campaigns used Cloudflare’s layer 7 DDoS protection that automatically monitors and mitigates large DDoS attacks, alongside rate-limiting to mitigate malicious traffic. For election websites, it’s clear that hackers tried to exploit common website vulnerabilities that were blocked by the WAF and firewall rules, with the goal of gaining access to internal systems rather than make the site inaccessible like we see in DDoS attacks.

2020 U.S. Election: Cybersecurity Analysis

Lessons learned and how we move forward

We learned a lot from preparing for the 2020 U.S. election while engaging with those in the election space and learned to be flexible in the face of the unexpected. We learned that COVID-19 had impacted many of these groups at a disportionate rate.  For example, organizations that work in promoting online voter registration were well suited for the move to online that we found ourselves in during COVID-19. For political candidates, they had to adapt to moving campaign events and outreach to an online environment rather than the traditional campaign operations of door-knocking and large fundraising events. This move online meant that campaigns needed to pay more attention to digital risks.

We also learned as we approached the November election that the election space involves a range of players. Protecting elections requires not only working with governments to secure their websites for the unexpected, but also working with campaigns and non-profit organizations who work on election-related issues. We appreciated the fact that Cloudflare has many different projects that support a range of players working in promoting trust in the electoral process, giving us the flexibility to protect them. Many of these players need different levels of support and assistance with how to properly protect their web infrastructure from cyberattacks, and having a range of projects offering a different level of plans and support, helped us in finding the best way to protect them. We were able to provide a free set of services to a wide range of players each with separate goals but a common mission: providing authoritative information to build trust in the electoral process.

Both the awareness of the importance of election security and election security itself has improved since the 2016 election. We have seen the benefits of sharing information across many partners, organizations, and local players. To help prepare state and local governments for elections, we conducted webinars and security tunings sessions for many of these election players. In the case of state and local governments we protect under the Athenian Project, as we conducted more security training, we saw many participants recommend others in their state to ensure they were protected as well. For example, a week before the general election, the Wisconsin Election Commission sent an election security reminder with resources on how to mitigate a DDoS attack with Cloudflare to county and municipal clerks across Wisconsin.

At Cloudflare, we worked with a variety of government agencies to share threat information that we saw targeted against these participants. Days before the November 3rd election, we were invited to the last meeting conducted by the Cybersecurity and Infrastructure Security Agency to share threats data we had seen against government election websites and how they could be mitigated to more than 200 general election stakeholders, including counties across the United States.

Weeks after the election, I spoke with Stacy Mahaney, the Chief Information Officer at the Missouri Secretary of State, which is currently protected under the Athenian Project. His comment aptly summarized Cloudflare’s security practices. Security is like an onion. Every layer of security that you add protects against various layers of attack or exposure. We were able to add layers to our security defenses with Cloudflare. The more layers you add, the more difficult it is for attackers to succeed in making voters question the trust of the democratic process that we work to protect every day.”  Information security is about prevention and detection and is a continual process that involves monitoring, training, and threat analysis. By adding more layers including tools such as a web application firewall, 2FA, SSL encryption, authentication protocols, and security awareness training, it makes it more difficult for hackers to penetrate through the security layers.

Although cybersecurity experts concluded that the 2020 election was one of the safest in the history of elections, the work is not done yet. Not only will future U.S. election cycles begin again soon,  but election security is a global concern that benefits from the involvement of experienced players with appropriate expertise. The longer we engage with those working with those in the election space, the more we learn the best ways to protect their web infrastructure and internal teams. We look forward to continuing our work to protect resources in the voting process and help build trust in democratic institutions.

Network-layer DDoS attack trends for Q4 2020

Post Syndicated from Vivek Ganti original https://blog.cloudflare.com/network-layer-ddos-attack-trends-for-q4-2020/

Network-layer DDoS attack trends for Q4 2020

Network-layer DDoS attack trends for Q4 2020

DDoS attack trends in the final quarter of 2020 defied norms in many ways. For the first time in 2020, Cloudflare observed an increase in the number of large DDoS attacks. Specifically, the number of attacks over 500Mbps and 50K pps saw a massive uptick.

In addition, attack vectors continued to evolve, with protocol-based attacks seeing a 3-10x increase compared to the prior quarter. Attackers were also more persistent than ever — nearly 9% of all attacks observed between October and December lasted more than 24 hours.

Below are additional noteworthy observations from the fourth quarter of 2020, which the rest of this blog explores in greater detail.

  • Number of attacks: For the first time in 2020, the total number of attacks observed in Q4 decreased compared to the prior quarter.
  • Attack duration: 73% of all attacks observed lasted under an hour, a decrease from 88% in Q3.
  • Attack vectors: While SYN, ACK, and RST floods continued to be the dominant attack vectors deployed, attacks over NetBIOS saw a whopping 5400% increase, followed by those over ISAKMP and SPSS.
  • Global DDoS activity: Our data centers in Mauritius, Romania, and Brunei recorded the highest percentages of DDoS activity relative to non-attack traffic.
  • Additional attack tactics: Ransom DDoS (RDDoS) attacks continue to target organizations around the world as criminal groups attempt to extort a ransom in the form of Bitcoin under a threat of a DDoS attack.

Number of attacks

Network-layer DDoS attack trends for Q4 2020

For the first time in 2020, the total number of network layer DDoS attacks we observed decreased compared to the previous quarter. Q4 constituted 15% of all attacks observed in 2020, compared to Q3’s 48%. In fact, the total number of attacks in Q4 was less than that seen in the month of September alone by a whopping 60%. On a monthly basis, December was Q4’s busiest month for attackers.

Network-layer DDoS attack trends for Q4 2020

Attack rates

There are different ways of measuring an L3/4 DDoS attack’s size. One is the volume of traffic it delivers, or its ‘bit rate’ (measured in gigabits-per-second). Another is the number of packets it delivers, or its ‘packet rate’ (measured in packets-per-second). Attacks with high bit rates attempt to saturate last-mile network links of the target, and attacks with high packet rates attempt to overwhelm routers or other in-line hardware devices.

Network-layer DDoS attack trends for Q4 2020

In Q4, as in previous quarters, the majority of attacks were quite small —  under 1 Gbps and 1M pps, specifically. This trend is not surprising, since most attacks are launched by amateur attackers using tools that are easy to use and cost a few dollars at most. Small attacks may also serve as a smokescreen to distract security teams from other kinds of cyberattacks, or to test a network’s existing defense mechanisms.

Network-layer DDoS attack trends for Q4 2020

However, the overall popularity of small attacks didn’t tell the whole story in Q4. Attacks over 500Mbps and 50K pps constituted a larger percentage of total attacks than they did in previous quarters. In fact, the number of attacks over 100 Gbps increased by 10x from Q3, and those over 10M pps increased by 3.6x.

One unique large attack Cloudflare observed was an ACK flood DoS attack that was automatically detected and mitigated by Cloudflare’s systems. What was unique about this attack was not the max packet rate, but the attack method that appears to have been borrowed from the world of acoustics.

Network-layer DDoS attack trends for Q4 2020

As can be seen in the graph above, the attack’s packet rate followed a wave-shaped pattern for over 19 hours. It seems as though the attacker was inspired by an acoustics concept called beat. For this reason, we codenamed this attack “Beat”. In acoustics, a beat is a term that is used to describe an interference of two different wave frequencies. You can read more about the Beat attack in our blog post: Beat – An Acoustics Inspired DDoS Attack

Network-layer DDoS attack trends for Q4 2020

Whether packet intensive or bit intensive, the increase in large DDoS attacks is a disturbing trend. It indicates that attackers are getting more brazen, and are using tools that allow them to launch larger attacks. What’s worse, often larger attacks have implications to not just target the network, but also intermediary service providers that serve the target network downstream.

Network-layer DDoS attack trends for Q4 2020

Attack Duration

73% of attacks in Q4 ‘20 lasted for under an hour. On the other end of the spectrum, nearly 9% of attacks lasted over 24 hrs (compared to a mere 1.5% in Q3 ’20). This increase reinforces the need for a real-time, always-on defense system to protect against attacks of every size and duration.

Network-layer DDoS attack trends for Q4 2020

Attack vectors

An ‘attack vector’ is a term used to describe the attack method. The most popular method, SYN floods, constituted nearly 42% of all attacks observed in Q3, followed by ACK, RST, and UDP-based DDoS attacks. This is relatively consistent with observations from previous quarters. However, ACK attacks jumped from ninth place in Q3 to second place — a 13x increase quarter-over-quarter— dethroning RST attacks from second place.

Network-layer DDoS attack trends for Q4 2020

Top emerging threats

While TCP based attacks like SYN and RST floods remain popular, UDP-protocol specific attacks such as NetBIOS and ISAKMP-based DDoS attacks are seeing an explosion compared to the prior quarter.

NetBIOS is a protocol that allows applications on separate machines to communicate and access shared resources over a local area network, and ISAKMP is a protocol used to establish Security Associations (SAs) and cryptographic keys when setting up an IPsec VPN connection (IPsec uses the Internet Key Exchange (IKE) protocol to ensure secure connections and will authenticate and encrypt packets of data sent over an Internet Protocol (IP) network.)

Cloudflare continues to see protocol based attacks — and indeed, multi-vector attacks — deployed to attempt to bring networks down. As the complexity of attacks elevates, adequate DDoS protection needs to be put in place to keep organizations secure and online at all times.

Network-layer DDoS attack trends for Q4 2020

Global DDoS activity

To understand where these attacks come from, we look at the Cloudflare edge network data centers where the traffic was ingested, rather than the location of the source IP. The reason? When attackers launch L3/4 attacks, they can spoof the source IP address in order to obfuscate their attack’s source.

In this report, we also measure the attack traffic observed at a Cloudflare data center relative to the non-attack traffic observed at the same data center for geo-based distribution. This gives us more accuracy in our endeavor to pinpoint geographic locations that are observing more threats than others. We’re able to achieve geographical accuracy in our report because we have data centers in over 200 cities, in more than 100 countries around the world.

Looking at Q4 metrics, we observed interesting insights — our data centers in Mauritius, Romania, and Brunei recorded the highest percentages of attack traffic relative to non-attack traffic. Specifically, between 4.4% and 4.9% of all traffic in those countries came from DDoS attacks. Another way of saying this is that almost 5 out of every 100 bytes was part of attack traffic. These observations indicate increased botnet activities in those countries.

Network-layer DDoS attack trends for Q4 2020

What might explain the comparatively high incidence of DDoS attacks in these countries? While it’s impossible to say for sure, here are some possibilities for the top two countries on the list:

Mauritius – In August 2020, a state of environmental emergency was declared in Mauritius after a ship carrying nearly 4,000 tons of fuel cracked its hull. The oil spill ignited anti-government protests calling for the resignation of the prime minister. Since then, the government has suspended the parliament twice, and has also been accused of suppressing local media and independent reporting covering the incident. Even five months after, following a series of human-rights scandals, the protests continue. The events in Mauritius may be linked to the increased DDoS activity.

Network-layer DDoS attack trends for Q4 2020
Source: wikipedia

Romania – Two events may be behind the increased DDoS activity in Romania. Romania recently held parliamentary elections which ended on December 6, 2020. In addition, the EU announced on December 9th that Romania will host their new cyber security research hub, the European Cybersecurity Industrial, Technology and Research Competence Centre (ECCC). Another possible explanation is that Romania is the country with the cheapest super-fast broadband Internet in the world — making it easier for anyone to launch volumetric attacks from within Romania.

DDoS activity by region

Africa

Network-layer DDoS attack trends for Q4 2020

Asia Pacific and Oceania

Network-layer DDoS attack trends for Q4 2020

Europe

Network-layer DDoS attack trends for Q4 2020

Middle East

Network-layer DDoS attack trends for Q4 2020

North America

Network-layer DDoS attack trends for Q4 2020

South America

Network-layer DDoS attack trends for Q4 2020

United States

Network-layer DDoS attack trends for Q4 2020

Ransom-based attacks continue to plague organizations

In our previous quarterly DDoS report, we noted a rise in extortion and ransom-based DDoS (RDDoS) attacks around the world. In a RDDoS attack, a malicious party threatens a person or organization with a cyberattack that could knock their networks, websites, or applications offline for a period of time, unless the person or organization pays a ransom. You can read more about RDDoS attacks here.

In Q4 ‘20, this disturbing trend continued. Organizations large and small came to Cloudflare asking for help in keeping their network infrastructure online while they figured out how to respond to ransom notes. Read this story of what a Fortune Global 500 company did when they received a ransom note, and about their recommendations for organizations.

Cloudflare continues to closely monitor this trend. If you receive a threat:

  1. Do not panic — we recommend you to not pay the ransom: Paying the ransom only encourages bad actors and finances illegal activities — and there’s no guarantee attackers won’t attack your network anyway.
  2. Notify local law enforcement: They will also likely request a copy of the ransom letter that you received.
  3. Contact Cloudflare: We can help ensure your website and network infrastructure are safeguarded from these ransom attacks.

Cloudflare DDoS Protection

Cloudflare provides comprehensive L3-L7 DDoS protection. In 2017, we pioneered the elimination of the industry standard surge pricing for DDoS attacks, providing customers with unmetered and unlimited DDoS protection. Since then, we’ve onboarded thousands of customers of all sizes — including Wikimedia, Panasonic, and Discord — that use Cloudflare to  protect and accelerate their Internet properties. Why do they choose Cloudflare? Three main reasons:

1. No scrubs
Cloudflare doesn’t operate scrubbing centers as we believe that the scrubbing center model is a flawed approach to DDoS protection. Scrubbing centers cause delays and cost too much to build and run. What’s more, DDoS attacks are asymmetric — attackers have more available bandwidth than a single scrubbing center will ever be able to handle.

Cloudflare’s network is architected so that every machine in every data center performs DDoS mitigation. Doing this at the edge is the only way to mitigate at scale without impacting performance. Our Anycast-based architecture makes our capacity equivalent to our DDoS scrubbing capacity, the largest in the market at 51 Tbps. This means Cloudflare detects and mitigates DDoS attacks close to the source of attack. Better yet, Cloudflare’s global threat intelligence acts like an immune system for the Internet — employing our machine learning models to learn from and mitigate attacks against any customer to protect them all.

2. It’s about time
Most organizations are in some stage of their journey from on-prem to the cloud. The threat landscape, functional requirements, and scale of business applications are evolving faster than ever before, and the volume and sophistication of network attacks are already straining the defensive capabilities of even the most advanced enterprises. One concern many enterprises have when adopting the cloud is added latency for applications. Most cloud-based DDoS protection services rely on specialized data centers aka “scrubbing centers” for DDoS mitigation. Backhauling traffic to those data centers can add significant latency depending on its location relative to the destination server.

This problem compounds when an organization uses different providers for different networking functions. When traffic must hop from provider to provider, latency can be measured in hundreds of milliseconds.

Cloudflare’s distributed geographical presence ensures that attacks are globally detected and mitigated in under 3 seconds on average — making it one of the fastest in the industry.

3. It’s not just about DDoS
DDoS attacks constitute just one facet of the many cyber threats organizations are facing today. As businesses shift to a Zero Trust approach, network and security buyers will face larger threats related to network access, and a continued surge in the frequency and sophistication of bot-related attacks.

A key design tenet while building products at Cloudflare is integration. Cloudflare One is a solution that uses a Zero Trust security model to provide companies a better way to protect devices, data, and applications — and is deeply integrated with our existing platform of security and DDoS solutions.

To learn more about Cloudflare’s DDoS solution contact us or get started today by signing up on our dashboard.

Network-layer DDoS attack trends for Q3 2020

Post Syndicated from Omer Yoachimik original https://blog.cloudflare.com/network-layer-ddos-attack-trends-for-q3-2020/

Network-layer DDoS attack trends for Q3 2020

Network-layer DDoS attack trends for Q3 2020

DDoS attacks are surging — both in frequency and sophistication. After doubling from Q1 to Q2, the total number of network layer attacks observed in Q3 doubled again — resulting in a 4x increase in number compared to the pre-COVID levels in the first quarter. Cloudflare also observed more attack vectors deployed than ever — in fact, while SYN, RST, and UDP floods continue to dominate the landscape, we saw an explosion in protocol specific attacks such as mDNS, Memcached, and Jenkins DoS attacks.

Here are other key network layer DDoS trends we observed in Q3:

  • Majority of the attacks are under 500 Mbps and 1 Mpps — both still suffice to cause service disruptions
  • We continue to see a majority of attacks be under 1 hr in duration
  • Ransom-driven DDoS attacks (RDDoS) are on the rise as groups claiming to be Fancy Bear, Cozy Bear and the Lazarus Group extort organizations around the world. As of this writing, the ransom campaign is still ongoing. See a special note on this below.

Number of attacks

The total number of L3/4 DDoS attacks we observe on our network continues to increase substantially, as indicated in the graph below. All in all, Q3 saw over 56% of all attacks this year — double that of Q2, and four times that of Q1. In addition, the number of attacks per month increased throughout the quarter.

Network-layer DDoS attack trends for Q3 2020

While September witnessed the largest number of attacks overall, August saw the most large attacks (over 500Mbps). Ninety-one percent of large attacks in Q3 took place in that month—while monthly distribution of other attack sizes was far more even.

Network-layer DDoS attack trends for Q3 2020

While the total number of attacks between 200-300 Gbps decreased in September, we saw more global attacks on our network in Q3. This suggests the increase in the use of distributed botnets to launch attacks. In fact, in early July, Cloudflare witnessed one of the largest-ever attacks on our network — generated by Moobot, a Mirai-based botnet. The attack peaked at 654 Mbps and originated from 18,705 unique IP addresses, each believed to be a Moobot-infected IoT device. The attack campaign lasted nearly 10 days, but the customer was protected by Cloudflare, so they observed no downtime or service degradation.

Attack size (bit rate and packet rate)

There are different ways of measuring a L3/4 DDoS attack’s size. One is the volume of traffic it delivers, measured as the bit rate (specifically, Gigabits-per-second). Another is the number of packets it delivers, measured as the packet rate (specifically, packets-per-second). Attacks with high bit rates attempt to saturate the Internet link, and attacks with high packet rates attempt to overwhelm the routers or other in-line hardware devices.

In Q3, most of the attacks we observed were smaller in size. In fact, over 87% of all attacks were under 1 Gbps. This represents a significant increase from Q2, when roughly 52% of attacks were that small.  Note that, even ‘small’ attacks of under 500 Mbps are many times sufficient to create major disruptions for Internet properties that are not protected by a Cloud based DDoS protection service. Many organizations have uplinks provided by their ISPs that are far less than 1 Gbps. Assuming their public facing network interface also serves legitimate traffic, you can see how even these ‘small’ DDoS attacks can easily take down Internet properties.

Network-layer DDoS attack trends for Q3 2020

This trend holds true for attack packet rates. In Q3, 47% of attacks were under 50k pps — compared to just 19% in Q2.

Network-layer DDoS attack trends for Q3 2020

Smaller attacks can indicate that amateur attackers may be behind the attacks — using tools easily available to generate attacks on exposed IPs/ networks. Alternatively, small attacks may serve as a smokescreen to distract security teams from other kinds of cyberattacks that might be taking place simultaneously.

Attack duration

Network-layer DDoS attack trends for Q3 2020

In terms of length, very short attacks were the most common attack type observed in Q3, accounting for nearly 88% of all attacks. This observation is in line with our prior reports — in general, Layer 3/4 DDoS attacks are getting shorter in duration.

Short burst attacks may attempt to cause damage without being detected by DDoS detection systems. DDoS services that rely on manual analysis and mitigation may prove to be useless against these types of attacks because they are over before the analyst even identifies the attack traffic.

Alternatively, the use of short attacks may be used to probe the cyber defenses of the target. Load-testing tools and automated DDoS tools, that are widely available on the dark web, can generate short bursts of, say, a SYN flood, and then following up with another short attack using an alternate attack vector. This allows attackers to understand the security posture of their targets before they decide to potentially launch larger attacks at larger rates and longer durations – which come at a cost.

In other cases, attackers generate small DDoS attacks as proof and warning to the target organization of the attacker’s ability to cause real damage later on. It’s often followed by a ransom note to the target organization, demanding payment so as to avoid suffering an attack that could more thoroughly cripple network infrastructure.

Whatever their motivation, DDoS attacks of any size or duration are not going away anytime soon. Even short DDoS attacks cause harm, and having an automated real-time defense mechanism in place is critical for any online business.

Attack vectors

SYN floods constituted nearly 65% of all attacks observed in Q3, followed by RST floods and UDP floods in second and third places. This is relatively consistent with observations from previous quarters, highlighting the DDoS attack vector of choice by attackers.

While TCP based attacks like SYN and RST floods continue to be popular, UDP-protocol specific attacks such as mDNS, Memcached, and Jenkins are seeing an explosion compared to the prior quarter.

Network-layer DDoS attack trends for Q3 2020

Multicast DNS (mDNS) is a UDP-based protocol that is used in local networks for service/device discovery. Vulnerable mDNS servers respond to unicast queries originating outside of the local network, which are ‘spoofed’ (altered) with the victim’s source address. This results in amplification attacks. In Q3, we noticed an explosion of mDNS attacks — specifically, we saw a 2,680% increase compared to the previous quarter.

This was followed by Memcached and Jenkins attacks. Memcached is a Key Value database. Requests can be made over the UDP protocol with a spoofed source address of the target. The size of the Value stored in the requested Key will affect the amplification factor, resulting in a DDoS amplification attack. Similarly, Jenkins, NTP, Ubiquity and the other UDP based protocols have seen a dramatic increase over the quarter due to its UDP stateless nature. A vulnerability in the older version (Jenkins 2.218 and earlier) aided the launch of DDoS attacks. This vulnerability was fixed in Jenkins 2.219 by disabling UDP multicast/ broadcast messages by default. However there are still many vulnerable and exposed devices that run UDP based services which are being harnessed to generate volumetric amplification attacks.

Attack by country

Network-layer DDoS attack trends for Q3 2020

Looking at country-based distribution, the United States observed the most number of L3/4 DDoS attacks, followed by Germany and Australia. Note that when analyzing L3/4 DDoS attacks, we bucket the traffic by the Cloudflare edge data center locations where the traffic was ingested, and not by the location of the source IP. The reason is when attackers launch L3/4 attacks they can spoof the source IP address in order to obfuscate the attack source. If we were to derive the country based on a spoofed source IP, we would get a spoofed country. Cloudflare is able to overcome the challenges of spoofed IPs by displaying the attack data by the location of Cloudflare’s data center in which the attack was observed. We’re able to achieve geographical accuracy in our report because we have data centers in over 200 cities around the world.

Africa

Network-layer DDoS attack trends for Q3 2020

Asia Pacific & Oceania

Network-layer DDoS attack trends for Q3 2020

Europe

Network-layer DDoS attack trends for Q3 2020

Middle East

Network-layer DDoS attack trends for Q3 2020

North America

Network-layer DDoS attack trends for Q3 2020

South America

Network-layer DDoS attack trends for Q3 2020

United States

Network-layer DDoS attack trends for Q3 2020

A note on recent ransom-driven DDoS attacks

Over the past months, Cloudflare has observed another disturbing trend — a rise in extortion and ransom-based DDoS (RDDoS) attacks targeting organizations around the world. While RDDoS threats do not always result in an actual attack, the cases seen in recent months show that attacker groups are willing to carry out the threat, launching large scale DDoS attacks that can overwhelm organizations that lack adequate protection. In some cases, the initial teaser attack may be sufficient to cause impact if not protected by a Cloud based DDoS protection service.

In a RDDoS attack, a malicious party threatens a person or organization with a cyberattack that could knock their networks, websites, or applications offline for a period of time, unless the person or organization pays a ransom. You can read more about RDDoS attacks here.

Entities claiming to be Fancy Bear, Cozy Bear, and Lazarus have been threatening to launch DDoS attacks against organizations’ websites and network infrastructure unless a ransom is paid before a given deadline. Additionally, an initial ‘teaser’ DDoS attack is usually launched as a form of demonstration before parallel to the ransom email. The demonstration attack is typically a UDP reflection attack using a variety of protocols, lasting roughly 30 minutes in duration (or less).

What to do if you receive a threat:

  1. Do not panic and we recommend you to not pay the ransom: Paying the ransom only encourages bad actors, finances illegal activities —and there’s no guarantee that they won’t attack your network now or later.
  2. Notify local law enforcement: They will also likely request a copy of the ransom letter that you received.
  3. Contact Cloudflare: We can help ensure your website and network infrastructure are safeguarded from these ransom attacks.

Cloudflare DDoS protection is different

On-prem hardware/cloud-scrubbing centers can’t address the challenges of modern volumetric DDoS attacks. Appliances are easily overwhelmed by large DDoS attacks, Internet links quickly saturate, and rerouting traffic to cloud scrubbing centers introduces unacceptable latency penalties. Our cloud-native, always-on, automated DDoS protection approach solves problems that traditional cloud signaling approaches were originally created to address.

Cloudflare’s mission is to help build a better Internet, which grounds our DDoS approach and is why in 2017, we pioneered unmetered DDoS mitigation for all of our customers on all plans including the free plan. We are able to provide this level of protection because every server on our network can detect & block threats, enabling us to absorb attacks of any size/kind, with no latency impact. This architecture gives us unparalleled advantages compared to any other vendor.

  • 51 Tbps of DDoS mitigation capacity and under 3 sec TTM: Every data center in Cloudflare’s network detects and mitigates DDoS attacks. Once an attack is identified, the Cloudflare’s local data center mitigation system (dosd) generates and applies a dynamically crafted rule with a real-time signature — and mitigates attacks in under 3 seconds globally on average. This 3-second Time To Mitigate (TTM) is one of the fastest in the industry. Firewall rules and “proactive”/static configurations take effect immediately.
  • Fast performance included:  Cloudflare is architected so that customers do not incur a latency penalty as a result of attacks. We deliver DDoS protection from every Cloudflare data center (instead of legacy scrubbing centers or on-premise hardware boxes) which allows us to mitigate attacks closest to the source. Cloudflare analyzes traffic out-of-path ensuring that our DDoS mitigation solution doesn’t add any latency to legitimate traffic. The rule is applied at the most optimal place in the Linux stack for a cost efficient mitigation, ensuring no performance penalty.
  • Global Threat Intelligence: Like an immune system, our network learns from/mitigates attacks against any customer to protect them all. With threat intelligence (TI), it automatically blocks attacks and is employed in customer facing features (Bot Fight mode, Firewall Rules & Security Level). Users create custom rules to mitigate attacks based on traffic attribute filters, threat & bot scores generated using ML models (protecting against bots/botnets/DDoS).

To learn more about Cloudflare’s DDoS solution contact us or get started.

Bot Attack trends for Jan-Jul 2020

Post Syndicated from Ricardo Pacheco original https://blog.cloudflare.com/bot-attack-trends-for-jan-jul-2020/

Bot Attack trends for Jan-Jul 2020

Bot Attack trends for Jan-Jul 2020

Now that we’re a long way through 2020, let’s take a look at automated traffic, which makes up almost 40% of total Internet traffic.

This blog post is a high-level overview of bot traffic on Cloudflare’s network. Cloudflare offers a comprehensive Bot Management tool for Enterprise customers, along with an effective free tool called Bot Fight Mode. Because of the tremendous amount of traffic that flows through our network each day, Cloudflare is in a unique position to analyze global bot trends.

In this post, we will cover the basics of bot traffic and distinguish between automated requests and other human requests (What Is A Bot?). Then, we’ll move on to a global overview of bot traffic around the world (A RoboBird’s Eye View, A Bot Day and Bots All Over The World), and dive into North American traffic (A Look into North American Traffic).  Lastly, we’ll finish with an overview of how the coronavirus pandemic affected global traffic, and we’ll take a deeper look at European traffic (Bots During COVID-19 In Europe).

On average, Cloudflare processes 18 million HTTP requests every second. This is a great opportunity to understand how bots shape the Internet, how much infrastructure is dedicated to these automated requests, and why our customers need a great bot management solution.

What Is A Bot?

Bot Attack trends for Jan-Jul 2020

Cloudflare groups traffic into four bot-related categories:

1. Verified
2. Definitely automated
3. Likely automated
4. Likely human

Our goal is to stop malicious and unwanted bots from harming our customers, while giving customers the opportunity to control how other automated traffic is managed.

We label each request that comes into Cloudflare with a “bot score” 1 through 99, where a lower score means that a request probably came from a bot. A higher score means that a request probably came from a human. This score is available in our Firewall, logs, and Workers, giving customers the flexibility to act on any score.

Cloudflare also maintains a challenge platform that customers can choose to deploy on suspected bots. You’ll recognize these as CAPTCHA challenges or JavaScript challenges. In fact, having the score available in Firewall Rules means that customers can take any action they choose. This platform can be used for mitigation, ensuring that unwanted traffic is stopped in its tracks.

To learn more about how Bot Management interacts with our firewall, check out our support page.

We track successes and failures during these challenges, which ultimately allows us to improve our detection systems. Assuming that our challenges are solvable by humans, effective detections should have low solve rates, given that they are usually presented to bots.

Bot Attack trends for Jan-Jul 2020

Verified bots are registered in an internal verified bot directory. These good bots power search engines and monitoring tools. Good bots enable our customers’ web pages to be found by search engines, for example.

For known non-verified bots (such as a scraper using a simple curl library), we keep a similar directory that is managed by our heuristics engine. If not otherwise verified, we consider requests caught by this engine to be definitely automated.

Our machine learning engine provides another way to identify potential bots. This engine identifies requests with a high probability of automation and marks them as likely automated. This detection mechanism benefits from models built on data from our global network.

If a request is not marked as automated, we mark it as likely human and pass along the bot score from our machine learning system.

We also have a behavioral analysis engine and a JavaScript detections engine. You can learn more about these systems by checking out Alex Bocharov’s previous post on Cloudflare Bot Management.

The two bot definitions for automated traffic are somewhat complementary. Requests caught by heuristic detections will not count towards machine learning detections. Requests that are reliably caught by our machine learning detections won’t need to be registered in our known heuristics bot directory. Because of this, we combine these two together when we discuss “automated traffic” in general.

A RoboBird’s Eye View

Data from this piece comes from information about Cloudflare’s customers, analyzed between January 15, 2020 and July 31, 2020.

First, let’s get a basic understanding of the traffic on our network.

Bot Attack trends for Jan-Jul 2020
Figure 1.1 Traffic type on Cloudflare’s network.

Figure 1.1 has a global breakdown regarding classification; 60.6% of traffic is likely human, 19.3% is likely automated, 18.1% is definitely automated and only 2.1% is from verified bots. In total, 39.5% of requests we score come from some kind of bot.

A Bot Day

Regular traffic fluctuates throughout the day. Do bots follow suit? Let’s check. Figure 2.1 represents traffic deviation from the average hourly traffic. An increase of 10% would mean that the hour is 10% busier than the average hour (measuring requests per hour). We include the total overall traffic in this chart to serve as a comparison to other types of traffic.

Bot Attack trends for Jan-Jul 2020
Figure 2.1 Hourly traffic as a deviation from the average hour.
Bot Attack trends for Jan-Jul 2020
Figure 2.2 Bot classification over an average day. 

We can clearly see a difference between human traffic and bot traffic. Human traffic varies heavily, but predictably, throughout the day. We can see a 15% decrease in human traffic early in the day, between midnight and 05:00 UTC, corresponding to the end of business hours in the Americas, and up to a 25% increase during business hours, 14:00 to 17:00 UTC, where traffic is highest. Conversely, bot traffic is more consistent. Slow hours still see a smaller drop than overall traffic, and busy hours are less busy. The difference between good and bad bots is also apparent: good bots are even more consistent, with small fluctuations in hourly traffic.

But why would this happen? A large portion of bots, good and bad, perform the same task across the Internet. Bad bots may be scraping websites or looking to infect unprotected machines, and they will do this with little intervention from human operators. Good bots could be doing some of these operations, but less frequently and in a more targeted fashion. A good bot scraping a website may be doing so to add it to a search engine, while a bad bot will do the same thing at a much higher rate, for other reasons.

A lot of bots follow business hours. For example, sneaker bots—focused on nabbing exclusive items from sneaker stores—will naturally be active when new products launch.

This difference in volume does not mean that our classifications are affected: our scores remain consistent throughout the day, as Figure 2.1 shows.

Bot Attack trends for Jan-Jul 2020
Figure 2.3 Daily traffic as a deviation from the average day. Grouped by day of week.
Bot Attack trends for Jan-Jul 2020
Figure 2.4 Bot classification over an average week.

We can also see that good bots don’t take weekends off. Weekdays and weekends have fairly marked differences for most traffic, but good bots keep a consistent schedule. Whereas a typical weekday is slightly above average, we can see a drop of about 4% in overall traffic. This does not fully apply to verified bots, which only see a small 1% drop in traffic.

Bots All Over The World

Now that we’ve taken a look at global traffic, let’s dig a little deeper.

Different regions have distinct traffic landscapes regarding automated traffic.

Bot Attack trends for Jan-Jul 2020
Figure 3.1 Traffic type by region.

Figure 3.1 breaks down traffic by region, letting us peek into where each type of traffic comes from. North America stands out as a major automated traffic source; over 50% of definitely automated traffic comes from there, and they also contribute almost 80% of all verified bot traffic. Europe makes up the second largest chunk of traffic, followed by Asia.

Bot Attack trends for Jan-Jul 2020
Figure 3.2 Traffic classification within each region.

Looking at regional breakdown of traffic in Figure 3.2, we can see just how much North American traffic is automated, well above the global average.

A Look into North American Traffic

As the largest source of automated traffic, North America deserves a closer look.

First, we’ll start with a breakdown of each country.

Bot Attack trends for Jan-Jul 2020
Figure 3.3 Percentage of traffic within North America.

Most of our requests in North America come from just three countries—the United States, Canada and Mexico. These account for 98% of all requests from North America, 97% of all requests from likely human sources and 100% of requests from verified bots. The United States alone accounts for 88% of total requests, 82% of requests from likely human sources, 96% of requests from definitely automated sources, 88% of requests from likely automated traffic sources and  98% of requests from verified bot.

However, this alone does not mean that the United States has an unusual amount of activity. These countries have a combined population of roughly 497 million people. The United States accounts for 66.5% of that, Mexico 25.9% and Canada 7.6%. With this context, we can see that the United States is overrepresented in terms of raw requests, but underrepresented in terms of how much of that traffic is likely to be human. Conversely, Canadian traffic is more likely to be human.

Let’s take another look at each country.

Bot Attack trends for Jan-Jul 2020
Figure 3.4 Percentage of traffic within each country.

Over half of the traffic from the United States is automated in some way, which is a clear departure from trends in Mexico and Canada.

American Bots

So far, we’ve seen how much the United States contributes to automated traffic. If we want to go deeper, a good place to start is by understanding how these bots get online. We can do this by examining the networks from which the traffic originates. Networks are identified by Autonomous System Numbers, or ASNs. These form the backbone of the Internet infrastructure.

Think of these as Internet Service Providers, but facing inward towards the network instead of outward towards end consumers. ISPs like Comcast and Verizon are examples of residential ASNs, where we expect mostly human traffic. Cloud providers such as Google and Amazon are also ASNs, but targeted towards cloud services. We expect most of these requests to be automated in some way.

Looking at traffic on the ASN level is important because we can identify cloud-based traffic, or traffic using residential proxies, among others.

Let’s take a look at which ASNs are associated with visitors in the United States. We’ll restrict ourselves to “eyeball” traffic, which is the term we use for requests coming from site visitors.

Bot Attack trends for Jan-Jul 2020
Figure 4.1 Top ASN in the United States.

From figure 4.1 we can clearly see the impact that cloud services have on traffic; 11.5% of all eyeball traffic comes from Amazon and Google.

Bot Attack trends for Jan-Jul 2020
Figure 4.2 Top ASN in the United States for verified bot traffic.

Verified bots operate in a different landscape, coming from cloud providers such as Amazon, Google, Microsoft, Advanced Hosting and Wowrack.

Bot Attack trends for Jan-Jul 2020
Figure 4.3 Top ASN in the United States for likely and definitely automated traffic.

Automated traffic has a variety of ASNs. Cloud providers such as Amazon, Google and Microsoft make up the 30% of automated traffic. Comcast also makes up a significant portion of traffic at 4.8%, indicating that some bots come from residential services.

Bots During COVID-19 In Europe

Lockdowns and limits on public events came as a consequence of the ongoing coronavirus pandemic. Many people have been working from home, and even those who do not have this option are using the Internet in new ways. Overall, this has meant that Cloudflare’s network has grown tremendously.

But how does this impact bot traffic? First let’s get an idea of how it impacted traffic in general. Countries were impacted by the virus at different times, so we expect to see differences, right?

Bot Attack trends for Jan-Jul 2020
Figure 5.1 Total traffic across all regions.

Figure 5.1 has just the traffic increase. Globally, we are seeing an average increase of 10%, while North America saw an increase of over 40% compared to the beginning of the year. Some regions did not change much, such as Africa and Asia, while others, such as Europe saw an increased period, but has since normalized to previous levels.

Let’s look at a few countries, so we can understand what this looks like.

Bot Attack trends for Jan-Jul 2020
Figure 5.2 Daily traffic evolution for Italy, the United Kingdom and Portugal, overlaid with Europe.

Figure 5.2 shows daily traffic relative to January 15, when data collection started. For comparison, we have overall European traffic, and three selected countries: Italy, the United Kingdom and Portugal. Italy was picked because it was one of the first countries in Europe to face the worst of the coronavirus and enact lockdown measures. The United Kingdom took another strategy, with an initial focus on herd immunity, and enacted measures later than the others. Portugal is somewhere in between, locking down later than Italy, in slightly different circumstances.

At the beginning of the year, traffic kept stable and fluctuations kept in line with the European average. As lockdown measures began, traffic increased. Italy was first out of these countries, rising a few weeks before the others, and keeping well above average. Eventually, all countries saw a growth in traffic, followed by a stabilization. Italy seems to have adjusted to a normal, with its growth in line with the European average. Portugal has also stabilized, but with busier weekdays. Conversely, the United Kingdom showed no signs of stopping, exceeding a growth of 40% compared to the beginning of the year.

Bot Attack trends for Jan-Jul 2020
Figure 5.3 Daily definitely automated traffic evolution for Italy, the United Kingdom and Portugal, overlaid with Europe.

Definitely automated traffic did not have that much of a pronounced variation. Italian traffic kept steady throughout, and Portugal had a rather large increase. The biggest one, however, was the United Kingdom, which tripled its initial count.

Bot Attack trends for Jan-Jul 2020
Figure 5.4 Verified bot traffic evolution for Italy, the United Kingdom and Portugal, overlaid with Europe. 

Verified bot traffic is steady, except in Italy, with a massive increase between March and May. What could be the cause of this? Are these a few zones, getting a massive number of requests?

Bot Attack trends for Jan-Jul 2020
Figure 5.5 Verified bot traffic in Italy for the top 10 000 zones, relative to January 15th 2020.

Well, no. If we only examine the top 10,000 zones (by total verified bot requests), we can still see a massive increase in traffic for other zones. So, what’s happening?

Let’s look at user agents. We can separate the top 10 user agents during the bump, and see how they evolve over time.

Bot Attack trends for Jan-Jul 2020
Figure 5.6 Verified bot traffic in Italy for the top 10 user agents, relative to January 15th 2020.

We can see that these 10 user agents are responsible for the majority of verified traffic coming from Italy.

Bot Attack trends for Jan-Jul 2020
Figure 5.7 Verified bot traffic in Italy for the top user agent, relative to January 15 2020.

In fact, most of this increase is from a single user agent. This instance of Google image proxy anonymizes image requests from Gmail, which explains its popularity.

Where does this increase come from? Did this bot suddenly appear and disappear?

Not quite. One thing to keep in mind when dealing with bots is that they cross borders easily. As a proxy service, this bot is making calls on behalf of the end user – people opening emails. These requests will originate from a data center, which can be anywhere in the world. To see this in action, let’s take a look at traffic for this bot in a few select countries.

Bot Attack trends for Jan-Jul 2020
Figure 5.8. Countries of origin for GoogleImageProxy.

We can see that the global average barely budges. It appears that Google may be moving image proxy traffic between data centers and during the period we observed above that traffic was coming from Italy.

Summary

With Cloudflare’s global reach, we’re in a position to understand how bots behave.

The first half of 2020 saw a massive increase in web traffic of around 35% since the beginning of the year, driven by the ongoing coronavirus pandemic, and some bots have taken advantage of it.

We explained how bot management works for our customers, and how we distinguish between likely automated and human traffic.

We showed an overview of how much of our global traffic is automated, and how bots change their behavior throughout the day and the week. Notably, 39.4% of all traffic Cloudflare processes comes from a suspected automated source.

A regional overview of automated traffic lets us know which regions were the source of traffic from likely automated agents. North America, Europe and Asia were the primary sources of traffic, and also of automated traffic in particular.

We then focused on North America, where the majority of automated traffic originates. The United States alone accounted for the majority of requests, over half of which come from automated sources.

To explore this further, we briefly dived into ASN traffic in the United States, so we could see where these requests were coming from. ASNs like Comcast and AT&T were the top ASNs for overall traffic, but unsurprisingly, data centers like Google and Amazon AWS were the main drivers of automated traffic.

Finally, we examined how the coronavirus has impacted traffic in Europe, with a deeper dive on Italian traffic. This led to some interesting insights on verified bot traffic, which saw a massive increase in Italy for a few months.

This post is a small peek into bot management at Cloudflare. In the future, we hope to expand this series of blog posts on bot management, exposing even more insights about bots on the Internet.