Historically, Cloudflare has covered large-scale Internet outages with timely blog posts, such as those published for Iran, Sudan, Facebook, and Syria. While we still explore such outages on the Cloudflare blog, throughout 2022 we have ramped up our monitoring of Internet outages around the world, posting timely information about those outages to @CloudflareRadar on Twitter.
Furthermore, this initial release is also laying the groundwork for the CROC to become a first stop and key resource for civil society organizations, journalists/news media, and impacted parties to get information on, or corroboration of, reported or observed Internet outages.
What information does the CROC contain?
At launch, the CROC includes summary information about observed outage events. This information includes:
Location: Where was the outage?
ASN: What autonomous system experienced a disruption in connectivity?
Type: How broad was the outage? Did connectivity fail nationwide, or at a sub-national level? Did just a single network provider have an outage?
Scope: If it was a sub-national/regional outage, what state or city was impacted? If it was a network-level outage, which one?
Cause: Insight into the likely cause of the outage, based on publicly available information. Historically, some have been government directed shutdowns, while others are caused by severe weather or natural disasters, or by infrastructure issues such as cable cuts, power outages, or filtering/blocking.
Start time: When did the outage start?
End time: When did the outage end?
Using the CROC
Radar pages, including the main landing page, include a card displaying information about the most recently observed outage, along with a link to the CROC. The CROC will also be linked from the left-side navigation bar
Within the CROC, we have tried to keep the interface simple and easily understandable. Based on the selected time period, the global map highlights locations where Internet outages have been observed, along with a tooltip showing the number of outages observed during that period. Similarly, the table includes information (as described above) about each observed outage, along with a link to more information. The linked information may be a Twitter post, a blog post, or a custom Radar graph.
As mentioned in the Radar 2.0 launch blog post, we launched an associated API alongside the new site. Outage information is available through this API as well — in fact, the CROC is built on top of this API. Interested parties, including civil society organizations, data journalists, or others, can use the API to integrate the available outage data with their own data sets, build their own related tools, or even develop a custom interface.
Information about the related API endpoint and how to access it can be found in the Cloudflare API documentation.
We recognize that some users may want to download the whole list of observed outages for local consumption and analysis. They can do so by clicking the “Download CSV” link below the table.
The status page the Internet needs (coming soon)
Today’s launch of the Cloudflare Radar Outage Center is just the beginning, as we plan to improve it over time. This includes increased automation of outage detection, enabling us to publish more timely information through both the API and the CROC tool, which is important for members of the community that track and respond to Internet outages. We are also exploring how we can use synthetic monitoring in combination with other network-level performance and availability information to detect outages of popular consumer and business applications/platforms.
And anyone who uses a cloud platform provider (such as AWS) will know that those companies’ status pages take a surprisingly long time to update when there’s an outage. It’s very common to experience difficulty accessing a service, see hundreds of messages on Twitter and message boards about a service being down, only to go to the cloud platform provider’s status page and see everything green and “All systems normal”.
For the last few months we’ve been monitoring the performance of cloud platform providers to see if we can detect when they go down and provide our own, real time status page for them. We believe we can and Cloudflare Radar Outage Center will be extended to include cloud service providers and give the Internet the status page it needs.
If you have questions about the CROC, or suggestions for features that you would like to see, please reach out to us on Twitter at @CloudflareRadar.
When August comes, for many, at least in the Northern Hemisphere, it’s time to enjoy summer and/or vacations. Here are some deep dive reading suggestions from our Cloudflare Blog for any time, weather or time of the year. There’s also some reading material on how the Internet works, and a glimpse into our history.
To create the list (that goes beyond 2022), initially we asked inside the company for favorite blog posts. Many explained how a particular blog post made them want to work at Cloudflare (including some of those who have been at the company for many years). And then, we also heard from readers by asking the question on our Twitter account: “What’s your favorite blog post from the Cloudflare Blog and why?”
2022, deep dive & trends odyssey
In early July (thinking of the July 4 US holiday) we did a sum up where some of the more recent blog posts were referenced. We’ve added a few to that list:
Eliminating CAPTCHAs on iPhones and Macs (✍️) How it works using open standards. On this topic, you can also read the detailed blog post from our research team, from 2021: Humanity wastes about 500 years per day on CAPTCHAs. It’s time to end this madness.
Optimizing TCP for high WAN throughput while preserving low latency(✍️) If you like networks, this is an in depth look of how we tune TCP parameters for low latency and high throughput.
Live-patching the Linux kernel (✍️) A detail focused blog focused on using eBPF. Code, Makefiles and more within.
Early Hints in the real world (✍️) In depth dataabout it where we show how much faster the web is with it (in a Cloudflare, Google, and Shopify partnership).
Internet Explorer, we hardly knew ye (✍️) A look at the demise of Internet Explorer and the rise of the Edge browser (after Microsoft announced the end-of-life for IE).
When the window is not fully open, your TCP stack is doing more than you think (✍️) A recent deep dive shows how Linux manages TCP receive buffers and windows, and how to tune the TCP connection for the best speed. Similar blogs are: How to stop running out of ephemeral ports and start to love long-lived connections; Everything you ever wanted to know about UDP sockets but were afraid to ask.
How Ramadan shows up in Internet trends (✍️) What happens to the Internet traffic in countries where many observe Ramadan? Depending on the country, there are clear shifts and changing patterns in Internet use, particularly before dawn and after sunset. This is all coming from our Radar platform. We can see many human trends, from a relevant outage in a country (here’s the list of Q2 2022 disruptions), to events like elections, the Eurovision, the ‘Jubilee’ celebration or the James Webb Telescope pictures revelation.
2022, research focused
Hertzbleed attack (✍️) A deep explainerwhere we compare a runner in a long distance race with how CPU frequency scaling leads to a nasty side channel affecting cryptographic algorithms. Don’t be confused with the older and impactful Heartbleed.
Unlocking QUIC’s proxying potential with MASQUE (✍️) A deep dive into QUIC transport protocol and a good up to date way to know more about it (related: HTTP usage trends).
HPKE: Standardizing public-key encryption (finally!)(✍️) Two research groups have finally published the next reusable, and future-proof generation of (hybrid) public-key encryption (PKE) for Internet protocols and applications: Hybrid Public Key Encryption (HPKE).
Sizing Up Post-Quantum Signatures (✍️) This blog (followed by this deep dive one that includes quotes from Ancient Greece) was highlighted by a reader as “life changing”. It shows the peculiar relationship between PQC (post-quantum cryptography) signatures and TLS (Transport Layer Security) size and connection quality. It’s research about how quantum computers could unlock the next age of innovation, and will break the majority of the cryptography used to protect our web browsing (more on that below). But it is also about how to make a website really fast.
If you like Twitter threads, here is a recent one from our Head of Cloudflare Research, Nick Sullivan, that explains in simple terms the way privacy on the Internet works and challenges in protecting it now and for the future.
This month we also did a full reading list/guide with our blog posts about all sorts of attacks (from DDoS to phishing, malware or ransomware) and how to stay protected in 2022.
How does it (the Internet) work
Cloudflare’s view of the Rogers Communications outage in Canada (✍️ 2022) One of the largest ISPs in Canada, Rogers Communications, had a huge outage on July 8, 2022, that lasted for more than 17 hours. From our view of the Internet, we show why we concluded it seemed caused by an internal error and how the Internet, being a network of networks, all bound together by BGP, was related to the disruption.
Understanding how Facebook disappeared from the Internet (✍️ 2021). “Facebook can’t be down, can it?”, we thought, for a second, on October 4, 2021. It was, and we had a deep dive about it, where BGP was also ‘king’.
Albert Einstein’s special theory of relativity famously dictates that no known object can travel faster than the speed of light in vacuum, which is 299,792 km/s.
Welcome to Speed Week and a Waitless Internet(✍️ 2021). There’s no object, as far as we, humans, know, that is faster than the speed of light. In this blog post you’ll get a sense of the physical limits of Internet speeds (“the speed of light is really slow”). How it all works through electrons through wires, lasers blasting data down fiber optic cables, and how building a waitless Internet is hard. We go on to explain the factors that go into building our fast global network: bandwidth, latency, reliability, caching, cryptography, DNS, preloading, cold starts, and more; and how Cloudflare zeroes in on the most powerful number there is: zero. And here’s a challenge, there are a few movies, books, board game references hidden in the post for you to find.
“People ask me to predict the future, when all I want to do is prevent it. Better yet, build it. Predicting the future is much too easy, anyway. You look at the people around you, the street you stand on, the visible air you breathe, and predict more of the same. To hell with more. I want better.” — Ray Bradbury, from Beyond 1984: The People Machines
Securing the post-quantum world (✍️ 2020). This one is more about the future of the Internet. We have many post-quantum related posts, including the recent standardization one (‘NIST’s pleasant post-quantum surprise’), but here you have an easy-to-understand explanation of a complex but crucial for the future of the Internet topic. More on those challenges and opportunities in 2022 here. The sum up is: “Quantum computers are coming that will have the ability to break the cryptographic mechanisms we rely on to secure modern communications, but there is hope”. For a quantum computing starting point, check: The Quantum Menace.
SAD DNS Explained (✍️ 2020). A 2020 attack against the Domain Name System (DNS) called SAD DNS (Side channel AttackeD DNS) leveraged features of the networking stack in modern operating systems. It’s a good excuse to explain how the DNS protocol and spoofing work, and how the industry can prevent it — another post expands on improving DNS privacy with Oblivious DoH in 1.1.1.1.
Privacy needs to be built into the Internet (✍️ 2020) A bit of history is always interesting and of value (at least for me). To launch one of our Privacy Weeks, in 2020, here’s a general view to the three different phases of the Internet. Until the 1990s the race was for connectivity. With the introduction of SSL in 1994, the Internet moved to a second phase where security became paramount (it helped create the dotcom rush and the secure, online world we live in today). Now, it’s all about the Phase 3 of the Internet we’re helping to build: always on, always secure, always private.
50 Years of The Internet. Work in Progress to a Better Internet (✍️2019) In 2019, we were celebrating 50 years from when the very first network packet took flight from the Los Angeles campus at UCLA to the Stanford Research Institute (SRI) building in Palo Alto. Those two California sites had kicked-off the world of packet networking, on the ARPANET, and of the modern Internet as we use and know it today. Here we go through some Internet history. This reminds me of this December 2021 conversation about how the Web began, 30 years earlier. Cloudflare CTO John Graham-Cumming meets Dr. Ben Segal, early Internet pioneer and CERN’s first official TCP/IP Coordinator, and Francois Fluckiger, director of the CERN School of Computing. Here, we learn how the World Wide Web became an open source project.
Welcome to Crypto Week (✍️2018). If you want to know why cryptography is so important for the Internet, here’s a good place to start. The Internet, with all of its marvels in connecting people and ideas, needs an upgrade, and one of the tools that can make things better is cryptography. There’s also a more mathematical privacy pass protocol related perspective (that is the basis of the work to eliminate CAPTCHAs).
Why TLS 1.3 isn’t in browsers yet (✍️ 2017). It’s all about: “Upgrading a security protocol in an ecosystem as complex as the Internet is difficult. You need to update clients and servers and make sure everything in between continues to work correctly. The Internet is in the middle of such an upgrade right now.” More on that from 2021 here: Handshake Encryption: Endgame (an ECH update).
How to build your own public key infrastructure (✍️2015). A way of getting to know how a major part of securing a network as geographically diverse as Cloudflare’s is protecting data as it travels between datacenters. “Great security architecture requires a defense system with multiple layers of protection”. From the same year, here’s something about digital signatures being the bedrock of trust.
A (Relatively Easy To Understand) Primer on Elliptic Curve Cryptography (✍️ 2013). Also thinking of how the Internet will continue to work for years to come, here’s a very complex topic made simple about one of the most powerful but least understood types of cryptography in wide use.
Why Google Went Offline Today and a Bit about How the Internet Works (✍️ 2012). We had several similar blog posts over the years, but this 10-year old one from Tom Paseka set the tone on how we could give a good technical explanation for something that was impacting so many. Here Internet routing, route leakages are discussed and it all ends on a relevant note: “Just another day in our ongoing efforts to #savetheweb.” Quoting from someone in the company for nine years: “This blog was the one that first got me interested in Cloudflare”.
Again, if you like Twitter threads, this recent Nick Sullivan one starts with an announcement (Cloudflare now allows experiments with post-quantum cryptography) and goes on explaining what some of the more relevant Internet acronyms mean. Example: TLS, or Transport Layer Security, it’s the ubiquitous encryption and authentication protocol that protects web requests online.
Blast from the past (some history)
A few also recently referenced blog posts from the past, some more technical than others.
Introducing DNS Resolver, 1.1.1.1 (not a joke) (✍️ 2018). The first consumer-focused service Cloudflare has ever released, our DNS resolver, 1.1.1.1 — a recursive DNS service — was launched on April 1, 2018, and this is the technical explanation. With this offering, we started fixing the foundation of the Internet by building a faster, more secure and privacy-centric public DNS resolver. And, just this month, we’ve added privacy proofed features (a geolocation accuracy “pizza test” included).
Cloudflare goes InterPlanetary – Introducing Cloudflare’s IPFS Gateway (✍️ 2018). We introduced Cloudflare’s IPFS Gateway, an easy way to access content from the InterPlanetary File System (IPFS). This served as the platform for many new, at the time, highly-reliable and security-enhanced web applications. It was the first product to be released as part of our Distributed Web Gateway project and is a different perspective from the traditional web. IPFS is a peer-to-peer file system composed of thousands of computers around the world, each of which stores files on behalf of the network. And, yes, it can be used as a method for a possible Mars (Moon, etc.) Internet in the future. About that, the same goes for code that will need to be running on Mars, something we mention about Workers here.
LavaRand in Production: The Nitty-Gritty Technical Details (✍️ 2017). Our lava lamps wall in the San Francisco office is much more than a wall of lava lamps (the YouTuber Tom Scott did a 2017 video about it) and in this blog we explain the in-depth look at the technical details (there’s a less technical one on how randomness in cryptography works).
Introducing Cloudflare Workers (✍️ 2017). There are several announcements each year, but this blog (associated with the explanation, Code Everywhere: Why We Built Cloudflare Workers) was referenced this week by some as one of those with a clear impact. It was when we started making Cloudflare’s network programmable. In 2018, Workers was available to everyone and, in 2019, we registered the trademark for The Network is the Computer®, to encompass how Cloudflare is using its network to pave the way for the future of the Internet.
What’s the story behind the names of CloudFlare’s name servers? (✍️ 2013) Another one referenced this week is the answer to the question we got often back in 2013: what the names of our nameservers mean. Here’s the story — there’s even an Apple co-founder Steve Wozniak tribute.
The James Webb Telescope reveals emerging stellar nurseries and individual stars in the Carina Nebula that were previously obscured. Credits: NASA, ESA, CSA, and STScI. Full image here.
“Somewhere, something incredible is waiting to be known.” — Carl Sagan
In the past few years, space technology and travel have been trending with increased attention and endeavors (including private ones). In our 2021 Year in Review we showed how NASA and SpaceX flew higher, at least in terms of interest on the Internet.
This week, NASA in collaboration with the European Space Agency (ESA) and the Canadian Space Agency (CSA), released the first images from the James Webb Telescope (JWST) which conducts infrared astronomy to “reveal the unseen universe”.
Webb’s First Deep Field is the first operational image taken by the James Webb Space Telescope, depicting a galaxy cluster with a distance of 5.12 billion light-years from Earth. Revealed to the public on 11 July 2022. Credits: NASA, ESA, CSA, and STScI. Full image here.
So, let’s dig into something we really like here at Cloudflare, checking how real life and human interest has an impact on the Internet. In terms of general Internet traffic in the US, Radar shows us that there was an increase both on July 11 and July 12, compared to the previous week (bear in mind that July 4, the previous Monday, was the Independence Day holiday in the US).
Next, we look at DNS request trends to get a sense of traffic to Internet properties (and using from this point on EST time in all the charts). Let’s start with the cornucopia of NASA, ESA and other websites (there are many, some dedicated just to the James Webb Telescope findings).
There are two clear spikes in the next chart. The first was around the time the first galaxy cluster infrared image was announced by Joe Biden, on Monday, July 11, 2022 (at 17:00), with traffic rising 13x higher than in the previous week. There was also a 5x spike at 01:00 EST that evening. The second spike was higher and longer and happened during Tuesday, July 12, 2022, when more images were revealed. Tuesday’s peak was at 10:00, with traffic being 19x higher than in the previous week — traffic was higher than 10x between 09:00 and 13:00.
The first image was presented by US president at around 17:00 on July 11. DNS traffic was 1.5x higher to White House-related websites than any time in the preceding month.
Conclusion: space, the final frontier
As we saw in 2021, space projects and announcements continue to have a clear impact on the Internet, in this case in our DNS request view of Internet traffic. So far, what the James Webb Telescope images are showing us is a glimpse of a never-before-seen picture of parts of the universe (there’s no lack of excitement in Cloudflare’s internal chat groups).
You can keep an eye on these and other trends using Cloudflare Radar and follow @CloudflareRadar on Twitter — recently we covered extensively Canada’s Internet outage.
In June 2022, we reported on the largest HTTPS DDoS attack that we’ve ever mitigated — a 26 million request per second attack – the largest attack on record. Our systems automatically detected and mitigated this attack and many more. Since then, we have been tracking this botnet, which we’ve called “Mantis”, and the attacks it has launched against almost a thousand Cloudflare customers.
Cloudflare WAF/CDN customers are protected against HTTP DDoS attacks including Mantis attacks. Please refer to the bottom of this blog for additional guidance on how to best protect your Internet properties against DDoS attacks.
Have you met Mantis?
We named the botnet that launched the 26M rps (requests per second) DDoS attack “Mantis” as it is also like the Mantis shrimp, small but very powerful. Mantis shrimps, also known as “thumb-splitters”, are very small; less than 10 cm in length, but their claws are so powerful that they can generate a shock wave with a force of 1,500 Newtons at speeds of 83 km/h from a standing start. Similarly, the Mantis botnet operates a small fleet of approximately 5,000 bots, but with them can generate a massive force — responsible for the largest HTTP DDoS attacks we have ever observed.
The Mantis botnet was able to generate the 26M HTTPS requests per second attack using only 5,000 bots. I’ll repeat that: 26 million HTTPS requests per second using only 5,000 bots. That’s an average of 5,200 HTTPS rps per bot. Generating 26M HTTP requests is hard enough to do without the extra overhead of establishing a secure connection, but Mantis did it over HTTPS. HTTPS DDoS attacks are more expensive in terms of required computational resources because of the higher cost of establishing a secure TLS encrypted connection. This stands out and highlights the unique strength behind this botnet.
As opposed to “traditional” botnets that are formed of Internet of Things (IoT) devices such as DVRs, CC cameras, or smoke detectors, Mantis uses hijacked virtual machines and powerful servers. This means that each bot has a lot more computational resources — resulting in this combined thumb-splitting strength.
Mantis is the next evolution of the Meris botnet. The Meris botnet relied on MikroTik devices, but Mantis has branched out to include a variety of VM platforms and supports running various HTTP proxies to launch attacks. The name Mantis was chosen to be similar to “Meris” to reflect its origin, and also because this evolution hits hard and fast. Over the past few weeks, Mantis has been especially active directing its strengths towards almost 1,000 Cloudflare customers.
Who is Mantis attacking?
In our recent DDoS attack trends report, we talked about the increasing number of HTTP DDoS attacks. In the past quarter, HTTP DDoS attacks increased by 72%, and Mantis has surely contributed to that growth. Over the past month, Mantis has launched over 3,000 HTTP DDoS attacks against Cloudflare customers.
When we take a look at Mantis’ targets we can see that the top attacked industry was the Internet & Telecommunications industry with 36% of attack share. In second place, the News, Media & Publishing industry, followed by Gaming and Finance.
When we look at where these companies are located, we can see that over 20% of the DDoS attacks targeted US-based companies, over 15% Russia-based companies, and less than five percent included Turkey, France, Poland, Ukraine, and more.
How to protect against Mantis and other DDoS attacks
Cloudflare’s automated DDoS protection system leverages dynamic fingerprinting to detect and mitigate DDoS attacks. The system is exposed to customers as the HTTP DDoS Managed Ruleset. The ruleset is enabled and applying mitigation actions by default, so if you haven’t made any changes, there is no action for you to take — you are protected. You can also review our guides Best Practices: DoS preventive measures and Responding to DDoS attacks for additional tips and recommendations on how to optimize your Cloudflare configurations.
Welcome to our 2022 Q2 DDoS report. This report includes insights and trends about the DDoS threat landscape — as observed across the global Cloudflare network. An interactive version of this report is also available on Radar.
In Q2, we’ve seen some of the largest attacks the world has ever seen including a 26 million request per second HTTPS DDoS attacks that Cloudflare automatically detected and mitigated. Furthermore, attacks against Ukraine and Russia continue, whilst a new Ransom DDoS attack campaign emerged.
The Highlights
Ukrainian and Russian Internet
The war on the ground is accompanied by attacks targeting the spread of information.
Broadcast Media companies in the Ukraine were the most targeted in Q2 by DDoS attacks. In fact, all the top five most attacked industries are all in online/Internet media, publishing, and broadcasting.
In Russia on the other hand, Online Media drops as the most attacked industry to the third place. Making their way to the top, Banking, Financial Services and Insurance (BFSI) companies in Russia were the most targeted in Q2; almost 45% of all application-layer DDoS attacks targeted the BFSI sector. Cryptocurrency companies in Russia were the second most attacked.
We’ve seen a new wave of Ransom DDoS attacks by entities claiming to be the Fancy Lazarus.
In June 2022, ransom attacks peaked to the highest of the year so far: one out of every five survey respondents who experienced a DDoS attack reported being subject to a Ransom DDoS attack or other threats.
Overall in Q2, the percent of Ransom DDoS attacks increased by 11% QoQ.
Application-layer DDoS attacks
In 2022 Q2, application-layer DDoS attacks increased by 72% YoY.
Organizations in the US were the most targeted, followed by Cyprus, Hong Kong, and China. Attacks on organizations in Cyprus increased by 166% QoQ.
The Aviation & Aerospace industry was the most targeted in Q2, followed by the Internet industry, Banking, Financial Services and Insurance, and Gaming / Gambling in fourth place.
Network-layer DDoS attacks
In 2022 Q2, network-layer DDoS attacks increased by 109% YoY. Attacks of 100 Gbps and larger increased by 8% QoQ, and attacks lasting more than 3 hours increased by 12% QoQ.
The top attacked industries were Telecommunications, Gaming / Gambling and the Information Technology and Services industry.
Organizations in the US were the most targeted, followed by China, Singapore, and Germany.
This report is based on DDoS attacks that were automatically detected and mitigated by Cloudflare’s DDoS Protection systems. To learn more about how it works, check out this deep-dive blog post.
A note on how we measure DDoS attacks observed over our network
To analyze attack trends, we calculate the “DDoS activity” rate, which is either the percentage of attack traffic out of the total traffic (attack + clean) observed over our global network, or in a specific location, or in a specific category (e.g., industry or billing country). Measuring the percentages allows us to normalize data points and avoid biases reflected in absolute numbers towards, for example, a Cloudflare data center that receives more total traffic and likely, also more attacks.
Ransom Attacks
Our systems constantly analyze traffic and automatically apply mitigation when DDoS attacks are detected. Each DDoS’d customer is prompted with an automated survey to help us better understand the nature of the attack and the success of the mitigation.
For over two years now, Cloudflare has been surveying attacked customers — one question on the survey being if they received a threat or a ransom note demanding payment in exchange to stop the DDoS attack.
The number of respondents reporting threats or ransom notes in Q2 increased by 11% QoQ and YoY. During this quarter, we’ve been mitigating Ransom DDoS attacks that have been launched by entities claiming to be the Advanced Persistent Threat (APT) group “Fancy Lazarus”. The campaign has been focusing on financial institutions and cryptocurrency companies.
The percentage of respondents reported being targeted by a ransom DDoS attack or that have received threats in advance of the attack.
Drilling down into Q2, we can see that in June one out of every five respondents reported receiving a ransom DDoS attack or threat — the highest month in 2022, and the highest since December 2021.
Application-layer DDoS attacks
Application-layer DDoS attacks, specifically HTTP DDoS attacks, are attacks that usually aim to disrupt a web server by making it unable to process legitimate user requests. If a server is bombarded with more requests than it can process, the server will drop legitimate requests and — in some cases — crash, resulting in degraded performance or an outage for legitimate users.
Application-layer DDoS attacks by month
In Q2, application-layer DDoS attacks increased by 72% YoY.
Overall, in Q2, the volume of application-layer DDoS attacks increased by 72% YoY, but decreased 5% QoQ. May was the busiest month in the quarter. Almost 41% of all application-layer DDoS attacks took place in May, whereas the least number of attacks took place in June (28%).
Application-layer DDoS attacks by industry
Attacks on the Aviation and Aerospace industry increased by 493% QoQ.
In Q2, Aviation and Aerospace was the most targeted industry by application-layer DDoS attacks. After it, was the Internet industry, Banking, Financial Institutions and Insurance (BFSI) industry, and in fourth place the Gaming / Gambling industry.
Ukraine and Russia cyberspace
Media and publishing companies are the most targeted in Ukraine.
As the war in Ukraine continues on the ground, in the air and on the water, so does it continue in cyberspace. Entities targeting Ukrainian companies appear to be trying to silence information. The top five most attacked industries in the Ukraine are all in broadcasting, Internet, online media, and publishing — that’s almost 80% of all DDoS Attacks targeting Ukraine.
On the other side of the war, the Russian Banks, Financial Institutions and Insurance (BFSI) companies came under the most attacks. Almost 45% of all DDoS attacks targeted the BFSI sector. The second most targeted was the Cryptocurrency industry, followed by Online media.
In both sides of the war, we can see that the attacks are highly distributed, indicating the use of globally distributed botnets.
Application-layer DDoS attacks by source country
In Q2, attacks from China shrank by 78%, and attacks from the US shrank by 43%.
To understand the origin of the HTTP attacks, we look at the geolocation of the source IP address belonging to the client that generated the attack HTTP requests. Unlike network-layer attacks, source IP addresses cannot be spoofed in HTTP attacks. A high percentage of DDoS activity in a given country doesn’t mean that that specific country is launching the attacks but rather indicates the presence of botnets operating from within the country’s borders.
For the second quarter in a row, the United States tops the charts as the main source of HTTP DDoS attacks. Following the US is China in second place, and India and Germany in the third and fourth. Even though the US remained in the first place, attacks originating from the US shrank by 48% QoQ while attacks from other regions grew; attacks from India grew by 87%, from Germany by 33%, and attacks from Brazil grew by 67%.
Application-layer DDoS attacks by target country
In order to identify which countries are targeted by the most HTTP DDoS attacks, we bucket the DDoS attacks by our customers’ billing countries and represent it as a percentage out of all DDoS attacks.
HTTP DDoS attacks on US-based countries increased by 67% QoQ pushing the US back to the first place as the main target of application-layer DDoS attacks. Attacks on Chinese companies plunged by 80% QoQ dropping it from the first place to the fourth. Attacks on Cyprus increase by 167% making it the second most attacked country in Q2. Following Cyprus is Hong Kong, China, and the Netherlands.
Network-layer DDoS attacks
While application-layer attacks target the application (Layer 7 of the OSI model) running the service that end users are trying to access (HTTP/S in our case), network-layer attacks aim to overwhelm network infrastructure (such as in-line routers and servers) and the Internet link itself.
Network-layer DDoS attacks by month
In Q2, network-layer DDoS attacks increased by 109% YoY, and volumetric attacks of 100 Gbps and larger increased by 8% QoQ.
In Q2, the total amount of network-layer DDoS attacks increased by 109% YoY and 15% QoQ. June was the busiest month of the quarter with almost 36% of the attacks occurring in June.
Network-layer DDoS attacks by industry
In Q2, attacks on Telecommunication companies grew by 66% QoQ.
For the second consecutive quarter, the Telecommunications industry was the most targeted by network-layer DDoS attacks. Even more so, attacks on Telecommunication companies grew by 66% QoQ. The Gaming industry came in second place, followed by Information Technology and Services companies.
Network-layer DDoS attacks by target country
Attacks on US networks grew by 95% QoQ.
In Q2, the US remains the most attacked country. After the US came China, Singapore and Germany.
Network-layer DDoS attacks by ingress country
In Q2, almost a third of the traffic Cloudflare observed in Palestine and a fourth in Azerbaijan was part of a network-layer DDoS attack.
When trying to understand where network-layer DDoS attacks originate, we cannot use the same method as we use for the application-layer attack analysis. To launch an application-layer DDoS attack, successful handshakes must occur between the client and the server in order to establish an HTTP/S connection. For a successful handshake to occur, the attacks cannot spoof their source IP address. While the attacker may use botnets, proxies, and other methods to obfuscate their identity, the attacking client’s source IP location does sufficiently represent the attack source of application-layer DDoS attacks.
On the other hand, to launch network-layer DDoS attacks, in most cases, no handshake is needed. Attackers can spoof the source IP address in order to obfuscate the attack source and introduce randomness into the attack properties, which can make it harder for simple DDoS protection systems to block the attack. So if we were to derive the source country based on a spoofed source IP, we would get a ‘spoofed country’.
For this reason, when analyzing network-layer DDoS attack sources, we bucket the traffic by the Cloudflare data center locations where the traffic was ingested, and not by the (potentially) spoofed source IP to get an understanding of where the attacks originate from. We are able to achieve geographical accuracy in our report because we have data centers in over 270 cities around the world. However, even this method is not 100% accurate, as traffic may be back hauled and routed via various Internet Service Providers and countries for reasons that vary from cost reduction to congestion and failure management.
Palestine jumps from the second to the first place as the Cloudflare location with the highest percentage of network-layer DDoS attacks. Following Palestine is Azerbaijan, South Korea, and Angola.
To view all regions and countries, check out the interactive map.
Attack vectors
In Q2, DNS attacks increased making it the second most frequent attack vector.
An attack vector is a term used to describe the method that the attacker uses to launch their DDoS attack, i.e., the IP protocol, packet attributes such as TCP flags, flooding method, and other criteria.
In Q2, 53% of all network-layer attacks were SYN floods. SYN floods remain the most popular attack vector. They abuse the initial connection request of the stateful TCP handshake. During this initial connection request, servers don’t have any context about the TCP connection as it is new and without the proper protection may find it hard to mitigate a flood of initial connection requests. This makes it easier for the attacker to consume an unprotected server’s resources.
After the SYN floods are attacks targeting DNS infrastructure, RST floods again abusing TCP connection flow, and generic attacks over UDP.
Emerging threats
In Q2, the top emerging threats included attacks over CHARGEN, Ubiquiti and Memcached.
Identifying the top attack vectors helps organizations understand the threat landscape. In turn, this may help them improve their security posture to protect against those threats. Similarly, learning about new emerging threats that may not yet account for a significant portion of attacks, can help mitigate them before they become a significant force.
In Q2, the top emerging threats were amplification attacks abusing the Character Generator Protocol (CHARGEN), amplification attacks reflecting traffic off of exposed Ubiquiti devices, and the notorious Memcached attack.
Abusing the CHARGEN protocol to launch amplification attacks
In Q2, attacks abusing the CHARGEN protocol increased by 378% QoQ.
Initially defined in RFC 864 (1983), the Character Generator (CHARGEN) protocol is a service of the Internet Protocol Suite that does exactly what it says it does – it generates characters arbitrarily, and it doesn’t stop sending them to the client until the client closes the connection. Its original intent was for testing and debugging. However, it’s rarely used because it can so easily be abused to generate amplification/reflection attacks.
An attacker can spoof the source IP of their victim and fool supporting servers around the world to direct a stream of arbitrary characters “back” to the victim’s servers. This type of attack is amplification/reflection. Given enough simultaneous CHARGEN streams, the victim’s servers, if unprotected, would be flooded and unable to cope with legitimate traffic — resulting in a denial of service event.
Amplification attacks exploiting the Ubiquiti Discovery Protocol
In Q2, attacks over Ubiquity increased by 327% QoQ.
Ubiquiti is a US-based company that provides networking and Internet of Things (IoT) devices for consumers and businesses. Ubiquiti devices can be discovered on a network using the Ubiquiti Discovery protocol over UDP/TCP port 10001.
Similarly to the CHARGEN attack vector, here too, attackers can spoof the source IP to be the victim’s IP address and spray IP addresses that have port 10001 open. Those would then respond to the victim and essentially flood it if the volume is sufficient.
Memcached DDoS attacks
In Q2, Memcached DDoS attacks increased by 287% QoQ.
Memcached is a database caching system for speeding up websites and networks. Similarly to CHARGEN and Ubiquiti, Memcached servers that support UDP can be abused to launch amplification/reflection DDoS attacks. In this case, the attacker would request content from the caching system and spoof the victim’s IP address as the source IP in the UDP packets. The victim will be flooded with the Memcache responses which can be amplified by a factor of up to 51,200x.
Network-layer DDoS attacks by attack rate
Volumetric attacks of over 100 Gbps increase by 8% QoQ.
There are different ways of measuring the size of an L3/4 DDoS attack. One is the volume of traffic it delivers, measured as the bit rate (specifically, terabits per second or gigabits per second). Another is the number of packets it delivers, measured as the packet rate (specifically, millions of packets per second).
Attacks with high bit rates attempt to cause a denial-of-service event by clogging the Internet link, while attacks with high packet rates attempt to overwhelm the servers, routers, or other in-line hardware appliances. These devices dedicate a certain amount of memory and computation power to process each packet. Therefore, by bombarding it with many packets, the appliance can be left with no further processing resources. In such a case, packets are “dropped,” i.e., the appliance is unable to process them. For users, this results in service disruptions and denial of service.
Distribution by packet rate
The majority of network-layer DDoS attacks remain below 50,000 packets per second. While 50 kpps is on the lower side of the spectrum at Cloudflare scale, it can still easily take down unprotected Internet properties and congest even a standard Gigabit Ethernet connection.
When we look at the changes in the attack sizes, we can see that packet-intensive attacks above 50 kpps decreased in Q2, resulting in an increase of 4% in small attacks.
Distribution by bitrate
In Q2, most of the network-layer DDoS attacks remain below 500 Mbps. This too is a tiny drop in the water at Cloudflare scale, but can very quickly shut down unprotected Internet properties with less capacity or at the very least cause congestion for even a standard Gigabit Ethernet connection.
Interestingly enough, large attacks between 500 Mbps and 100 Gbps decreased by 20-40% QoQ, but volumetric attacks above 100 Gbps increased by 8%.
Network-layer DDoS attacks by duration
In Q2, attacks lasting over three hours increased by 9%.
We measure the duration of an attack by recording the difference between when it is first detected by our systems as an attack and the last packet we see with that attack signature towards that specific target.
In Q2, 52% of network-layer DDoS attacks lasted less than 10 minutes. Another 40% lasted 10-20 minutes. The remaining 8% include attacks ranging from 20 minutes to over three hours.
One important thing to keep in mind is that even if an attack lasts only a few minutes, if it is successful, the repercussions could last well beyond the initial attack duration. IT personnel responding to a successful attack may spend hours and even days restoring their services.
While most of the attacks are indeed short, we can see an increase of over 15% in attacks ranging between 20-60 minutes, and a 12% increase of attacks lasting more than three hours.
Short attacks can easily go undetected, especially burst attacks that, within seconds, bombard a target with a significant number of packets, bytes, or requests. In this case, DDoS protection services that rely on manual mitigation by security analysis have no chance in mitigating the attack in time. They can only learn from it in their post-attack analysis, then deploy a new rule that filters the attack fingerprint and hope to catch it next time. Similarly, using an “on-demand” service, where the security team will redirect traffic to a DDoS provider during the attack, is also inefficient because the attack will already be over before the traffic routes to the on-demand DDoS provider.
It’s recommended that companies use automated, always-on DDoS protection services that analyze traffic and apply real-time fingerprinting fast enough to block short-lived attacks.
Summary
Cloudflare’s mission is to help build a better Internet. A better Internet is one that is more secure, faster, and reliable for everyone — even in the face of DDoS attacks. As part of our mission, since 2017, we’ve been providing unmetered and unlimited DDoS protection for free to all of our customers. Over the years, it has become increasingly easier for attackers to launch DDoS attacks. But as easy as it has become, we want to make sure that it is even easier — and free — for organizations of all sizes to protect themselves against DDoS attacks of all types.
Not using Cloudflare yet? Start now with our Free and Pro plans to protect your websites, or contact us for comprehensive DDoS protection for your entire network using Magic Transit.
On May 19, 2021, a Microsoft blog post announced that “The future of Internet Explorer on Windows 10 is in Microsoft Edge” and that “the Internet Explorer 11 desktop application will be retired and go out of support on June 15, 2022, for certain versions of Windows 10.” According to an associated FAQ page, those “certain versions” include Windows 10 client SKUs and Windows 10 IoT. According to data from Statcounter, Windows 10 currently accounts for over 70% of desktop Windows market share on a global basis, so this “retirement” impacts a significant number of Windows systems around the world.
As the retirement date for Internet Explorer 11 has recently passed, we wanted to explore several related usage trends:
Is there a visible indication that use is declining in preparation for its retirement?
Where is Internet Explorer 11 still in the heaviest use?
How does the use of Internet Explorer 11 compare to previous versions?
How much Internet Explorer traffic is “likely human” vs. “likely automated”?
How do Internet Explorer usage patterns compare with those of Microsoft Edge, its replacement?
The long goodbye
Publicly released in January 2020, and automatically rolled out to Windows users starting in June 2020, Chromium-based Microsoft Edge has become the default browser for the Windows platform, intended to replace Internet Explorer. Given the two-year runway, and Microsoft’s May 2021 announcement, we would expect to see Internet Explorer traffic decline over time as users shift to Edge.
Looking at global request traffic to Cloudflare from Internet Explorer versions between January 1 and June 20, 2022, we see in the graph below that peak request volume for Internet Explorer 11 has declined by approximately one-third over that period. The clear weekly usage pattern suggests higher usage in the workplace than at home, and the nominal decline in traffic year-to-date suggests that businesses are not rushing to replace Internet Explorer with Microsoft Edge. However, we expect traffic from Internet Explorer 11 to drop more aggressively as Microsoft rolls out a two-phase plan to redirect users to Microsoft Edge, and then ultimately disable Internet Explorer. Having said that, we do not expect Internet Explorer 11 traffic to ever fully disappear for several reasons, including Microsoft Edge’s “IE Mode” representing itself as Internet Explorer 11, the ongoing usage of Internet Explorer 11 on Windows 8.1 and Windows 7 (which were out of scope for the retirement announcement), and automated (bot) traffic masquerading as Internet Explorer 11.
It is also apparent in the graph above that traffic from earlier versions of Internet Explorer has never fully disappeared. (In fact, we still see several million requests each day from clients purporting to be Internet Explorer 2, which was released in November 1995 — over a quarter-century ago.) After version 11, Internet Explorer 7, first released in October 2006 and last updated in May 2009, generates the next largest volume of requests. Traffic trends for this version have remained relatively consistent. Internet Explorer 9 was the next largest traffic generator through late May, when Internet Explorer 6 seemed to stage a comeback. (Internet Explorer 7 saw a slight bump in traffic at that time as well.)
Where is Internet Explorer 11 used?
Perhaps unsurprisingly, the United States has accounted for the largest volume of Internet Explorer 11 requests year-to-date. Similar to the global observation above, daily peak request traffic has declined by approximately one-third. With request volume approximately one-fourth that seen in the United States, Japan ostensibly has the next largest Internet Explorer 11 user base. (And published reports note that Internet Explorer’s retirement is likely to cause Japan headaches ‘for months’” because local businesses and government agencies didn’t take action in the months ahead of the event.)
However, unusual shifts in Brazil’s request volume, seen in the graph above, are particularly surprising. For several weeks in January, Internet Explorer 11 traffic from the country appears to quadruple, with the same behavior seen from early May through mid-June, as well as a significant spike in March. Classifying the request traffic by bot score, as shown in the graph below, makes it clear that the observed increases are the result of automated (bot) traffic presenting itself as coming from Internet Explorer 11.
Further, analyzing this traffic to see what percentage of requests were mitigated by Cloudflare’s Web Application Firewall, we find that the times when the mitigation percentage increased, as shown in the graph below, align very closely with the periods where we observed the higher levels of automated (bot) traffic. This suggests that the spikes in Internet Explorer 11 traffic coming from Brazil that were seen over the last six months were from a botnet presenting itself as that version of the browser.
Bot or not
Building on the Brazil analysis, breaking out the traffic for each version by associated bot score can help us better understand the residual traffic from long-deprecated versions of Internet Explorer shown above. For requests with a bot score that characterizes the traffic as “likely human”, the graph below shows clear weekly traffic patterns for versions 11 and 7, suggesting that the traffic is primarily driven by systems primarily in use on weekdays, likely by business users. For Internet Explorer 7, that traffic pattern becomes more evident starting in mid-February, after a significant decline in associated request volume.
Interestingly, that decline in “likely human” Internet Explorer 7 request volume aligns with an increase in “likely automated” (bot) request volume for that version, visible in the graph below. Given that the “likely human” traffic didn’t appear to migrate to another version of Internet Explorer, the shift may be related to improvements to the machine learning model that powers bot detection that were rolled out in the January/February time frame. It is also interesting to note that “likely automated” request volume for both Internet Explorer 11 and 7 has been extremely similar since mid-March. It is not immediately clear why this is the case.
We can also use this data to understand what percentage of the traffic from a given version of Internet Explorer is likely to be automated (coming from bots). The graph below highlights the ratios for Internet Explorer 11 and 7. For version 11, we can see that the percentage has grown from around 60% at the start of 2022 to around 80% in June. For version 7, it starts the year in the 40% range, and more than doubles to over 80% in February and remains consistent at that level.
However, when we look at firewall mitigated traffic percentages, we don’t see the same clear alignment of trends as was visible for Brazil, as discussed above. In addition, only a fraction of the “likely automated” traffic was mitigated, suggesting that the automated traffic is split between being generated by bots and other non-malicious tools, such as performance testing.
Internet Explorer versions 6 & 9 were also discussed above, with respect to driving the largest volume of requests. However, when we examine the “likely automated” request ratios for these two browsers, we find that most of their traffic appears to be bot-driven. Internet Explorer 6 started 2022 at around 80%, growing to 95% in June. In contrast, Internet Explorer 9 starts the year around 90%, drops to 60% at the end of January, and then gradually increases back to the 75-80% range.
As Internet Explorer 6’s “likely automated” traffic has increased, the fraction of it that was mitigated has increased as well. The small bumps visible in the graph above align with the larger spikes in the graph below, potentially due to brief bursts of bot activity. In contrast, mitigated Internet Explorer 9 traffic has remained relatively consistent, even as its automated request percentage dropped and then gradually increased.
For the oldest, long-deprecated versions of Internet Explorer, automated traffic frequently comprises more than 80% of request volume, reaching 100% on multiple days year-to-date. Mitigated traffic generally amounted to under 30% of request volume, although Internet Explorer 2 frequently increased to the 50% range, spiking as high as 90%.
Edging into the future
As Microsoft stated, “the future of Internet Explorer on Windows 10 is in Microsoft Edge.” Given that, we wanted to understand the usage patterns of Microsoft Edge. Similar to the analysis above, we looked at request volumes for the last ten versions of the browser year-to-date. The graph below clearly illustrates strong enterprise usage of edge, with weekday peaks, and lower traffic on the weekends. In addition, the four-week major release cycle cadence is clearly evident, with a long tail of usage extending across eight weeks due to enterprise customers who need an extended timeline to manage updates.
Having said that, in analyzing the split by bot score for these Edge versions, we note that only around 80% of requests are classified as “likely human” for about eight weeks after a given version is released, after which it gradually tapers to around 60%. The balance is classified as “likely automated”, suggesting that those who develop bots and other automated processes recognize the value in presenting their user agents as the latest version of Microsoft’s web browser. For Edge, there does not appear to be any meaningful correlation between firewall mitigated traffic percentages and “likely automated” traffic percentages or the traffic cycles visible in the graph above.
Conclusion
Analyzing traffic trends from deprecated versions of Internet Explorer brought to mind the “I’m not dead yet” scene from Monty Python and the Holy Grail with these older versions of the browser claiming to still be alive, at least from a traffic perspective. However, categorizing this traffic to better understand the associated bot/human split showed that the majority of Internet Explorer traffic seen by Cloudflare, including for Internet Explorer 11, is apparently not coming from actual browser clients installed on user systems, but rather from bots and other automated processes. For the automated traffic, analysis of firewall mitigation activity shows that the percentage likely coming from malicious bots varies by version.
As Microsoft executes its planned two-phase approach for actively moving users off of Internet Explorer, it will be interesting to see how both request volumes and bot/human splits for the browser change over time – check back later this year for an updated analysis.
Welcome to our first DDoS report of 2022, and the ninth in total so far. This report includes new data points and insights both in the application-layer and network-layer sections — as observed across the global Cloudflare network between January and March 2022.
The first quarter of 2022 saw a massive spike in application-layer DDoS attacks, but a decrease in the total number of network-layer DDoS attacks. Despite the decrease, we’ve seen volumetric DDoS attacks surge by up to 645% QoQ, and we mitigated a new zero-day reflection attack with an amplification factor of 220 billion percent.
In the Russian and Ukrainian cyberspace, the most targeted industries were Online Media and Broadcast Media. In our Azerbaijan and Palestinian Cloudflare data centers, we’ve seen enormous spikes in DDoS activity — indicating the presence of botnets operating from within.
The Highlights
The Russian and Ukrainian cyberspace
Russian Online Media companies were the most targeted industries within Russia in Q1. The next most targeted was the Internet industry, then Cryptocurrency, and then Retail. While many attacks that targeted Russian Cryptocurrency companies originated in Ukraine or the US, another major source of attacks was from within Russia itself.
The majority of HTTP DDoS attacks that targeted Russian companies originated from Germany, the US, Singapore, Finland, India, the Netherlands, and Ukraine. It’s important to note that being able to identify where cyber attack traffic originates is not the same as being able to attribute where the attacker is located.
Attacks on Ukraine targeted Broadcast Media and Publishing websites and seem to have been more distributed, originating from more countries — which may indicate the use of global botnets. Still, most of the attack traffic originated from the US, Russia, Germany, China, the UK, and Thailand.
In January 2022, over 17% of under-attack respondents reported being targeted by ransom DDoS attacks or receiving a threat in advance.
That figure drastically dropped to 6% in February, and then to 3% in March.
When compared to previous quarters, we can see that in total, in Q1, only 10% of respondents reported a ransom DDoS attack; a 28% decrease YoY and 52% decrease QoQ.
Application-layer DDoS attacks
2022 Q1 was the busiest quarter in the past 12 months for application-layer attacks. HTTP-layer DDoS attacks increased by 164% YoY and 135% QoQ.
Diving deeper into the quarter, in March 2022 there were more HTTP DDoS attacks than in all of Q4 combined (and Q3, and Q1).
After four consecutive quarters in a row with China as the top source of HTTP DDoS attacks, the US stepped into the lead this quarter. HTTP DDoS attacks originating from the US increased by a staggering 6,777% QoQ and 2,225% YoY.
Network-layer DDoS attacks
Network-layer attacks in Q1 increased by 71% YoY but decreased 58% QoQ.
The Telecommunications industry was the most targeted by network-layer DDoS attacks, followed by Gaming and Gambling companies, and the Information Technology and Services industry.
Volumetric attacks increased in Q1. Attacks above 10 Mpps (million packets per second) grew by over 300% QoQ, and attacks over 100 Gbps grew by 645% QoQ.
This report is based on DDoS attacks that were automatically detected and mitigated by Cloudflare’s DDoS Protection systems. To learn more about how it works, check out this deep-dive blog post.
A note on how we measure DDoS attacks observed over our network To analyze attack trends, we calculate the “DDoS activity” rate, which is either the percentage of attack traffic out of the total traffic (attack + clean) observed over our global network, or in a specific location, or in a specific category (e.g., industry or billing country). Measuring the percentages allows us to normalize data points and avoid biases reflected in absolute numbers towards, for example, a Cloudflare data center that receives more total traffic and likely, also more attacks.
To view an interactive version of this report view it on Cloudflare Radar.
Ransom Attacks
Our systems constantly analyze traffic and automatically apply mitigation when DDoS attacks are detected. Each DDoS’d customer is prompted with an automated survey to help us better understand the nature of the attack and the success of the mitigation.
For over two years now, Cloudflare has been surveying attacked customers — one question on the survey being if they received a threat or a ransom note demanding payment in exchange to stop the DDoS attack. In the last quarter, 2021 Q4, we observed a record-breaking level of reported ransom DDoS attacks (one out of every five customers). This quarter, we’ve witnessed a drop in ransom DDoS attacks with only one out of 10 respondents reporting a ransom DDoS attack; a 28% decrease YoY and 52% decrease QoQ.
When we break it down by month, we can see that January 2022 saw the largest number of respondents reporting receiving a ransom letter in Q1. Almost one out of every five customers (17%).
Application-layer DDoS attacks
Application-layer DDoS attacks, specifically HTTP DDoS attacks, are attacks that usually aim to disrupt a web server by making it unable to process legitimate user requests. If a server is bombarded with more requests than it can process, the server will drop legitimate requests and — in some cases — crash, resulting in degraded performance or an outage for legitimate users.
Application-layer DDoS attacks by month
In Q1, application-layer DDoS attacks soared by 164% YoY and 135% QoQ – the busiest quarter within the past year.
Application-layer DDoS attacks increased to new heights in the first quarter of 2022. In March alone, there were more HTTP DDoS attacks than in all of 2021 Q4 combined (and Q3, and Q1).
Application-layer DDoS attacks by industry
Consumer Electronics was the most targeted industry in Q1.
Globally, the Consumer Electronics industry was the most attacked with an increase of 5,086% QoQ. Second was the Online Media industry with a 2,131% increase in attacks QoQ. Third were Computer Software companies, with an increase of 76% QoQ and 1,472 YoY.
To understand the origin of the HTTP attacks, we look at the geolocation of the source IP address belonging to the client that generated the attack HTTP requests. Unlike network-layer attacks, source IP addresses cannot be spoofed in HTTP attacks. A high percentage of DDoS activity in a given country usually indicates the presence of botnets operating from within the country’s borders.
After four consecutive quarters in a row with China as the top source of HTTP DDoS attacks, the US stepped into the lead this quarter. HTTP DDoS attacks originating from the US increased by a staggering 6,777% QoQ and 2,225% YoY. Following China in second place are India, Germany, Brazil, and Ukraine.
Application-layer DDoS attacks by target country
In order to identify which countries are targeted by the most HTTP DDoS attacks, we bucket the DDoS attacks by our customers’ billing countries and represent it as a percentage out of all DDoS attacks.
The US drops to second place, after being first for three consecutive quarters. Organizations in China were targeted the most by HTTP DDoS attacks, followed by the US, Russia, and Cyprus.
Network-layer DDoS attacks
While application-layer attacks target the application (Layer 7 of the OSI model) running the service that end users are trying to access (HTTP/S in our case), network-layer attacks aim to overwhelm network infrastructure (such as in-line routers and servers) and the Internet link itself.
Network-layer DDoS attacks by month
While HTTP DDoS attacks soared in Q1, network-layer DDoS attacks actually decreased by 58% QoQ, but still increased by 71% YoY.
Diving deeper into Q1, we can see that the amount of network-layer DDoS attacks remained mostly consistent throughout the quarter with about a third of attacks occurring every month.
Amongst these network-layer DDoS attacks are also zero-day DDoS attacks that Cloudflare automatically detected and mitigated.
In the beginning of March, Cloudflare researchers helped investigate and expose a zero-day vulnerability in Mitel business phone systems that amongst other possible exploitations, also enables attackers to launch an amplification DDoS attack. This type of attack reflects traffic off vulnerable Mitel servers to victims, amplifying the amount of traffic sent in the process by an amplification factor of 220 billion percent in this specific case. You can read more about it in our recent blog post.
We observed several of these attacks across our network. One of them targeted a North American cloud provider using the Cloudflare Magic Transit service. The attack originated from 100 source IPs mainly from the US, UK, Canada, Netherlands, Australia, and approximately 20 other countries. It peaked above 50 Mpps (~22 Gbps) and was automatically detected and mitigated by Cloudflare systems.
In this report, for the first time, we’ve begun classifying network-layer DDoS attacks according to the industries of our customers using the Spectrum and Magic products. This classification allows us to understand which industries are targeted the most by network-layer DDoS attacks.
When we look at Q1 statistics, we can see that in terms of attack packets and attack bytes launched towards Cloudflare customers, the Telecommunications industry was targeted the most. More than 8% of all attack bytes and 10% of all attack packets that Cloudflare mitigated targeted Telecommunications companies.
Following not too far behind, in second and third place were the Gaming / Gambling and Information Technology and Services industries.
Network-layer DDoS attacks by target country
Similarly to the classification by our customers’ industry, we can also bucket attacks by our customers’ billing country as we do for application-layer DDoS attacks, to identify the top attacked countries.
Looking at Q1 numbers, we can see that the US was targeted by the highest percentage of DDoS attacks traffic — over 10% of all attack packets and almost 8% of all attack bytes. Following the US is China, Canada, and Singapore.
Network-layer DDoS attacks by ingress country
When trying to understand where network-layer DDoS attacks originate, we cannot use the same method as we use for the application-layer attack analysis. To launch an application-layer DDoS attack, successful handshakes must occur between the client and the server in order to establish an HTTP/S connection. For a successful handshake to occur, the attacker cannot spoof their source IP address. While the attacker may use botnets, proxies, and other methods to obfuscate their identity, the attacking client’s source IP location does sufficiently represent the attack source of application-layer DDoS attacks.
On the other hand, to launch network-layer DDoS attacks, in most cases, no handshake is needed. Attackers can spoof the source IP address in order to obfuscate the attack source and introduce randomness into the attack properties, which can make it harder for simple DDoS protection systems to block the attack. So if we were to derive the source country based on a spoofed source IP, we would get a ‘spoofed country’.
For this reason, when analyzing network-layer DDoS attack sources, we bucket the traffic by the Cloudflare edge data center locations where the traffic was ingested, and not by the (potentially) spoofed source IP to get an understanding of where the attacks originate from. We are able to achieve geographical accuracy in our report because we have data centers in over 270 cities around the world. However, even this method is not 100% accurate, as traffic may be back hauled and routed via various Internet Service Providers and countries for reasons that vary from cost reduction to congestion and failure management.
In Q1, the percentage of attacks detected in Cloudflare’s data centers in Azerbaijan increased by 16,624% QoQ and 96,900% YoY, making it the country with the highest percentage of network-layer DDoS activity (48.5%).
Following our Azerbaijanian data center is our Palestinian data center where a staggering 41.9% of all traffic was DDoS traffic. This represents a 10,120% increase QoQ and 46,456% YoY.
To view all regions and countries, check out the interactive map.
Attack vectors
SYN Floods remain the most popular DDoS attack vector, while use of generic UDP floods drops significantly in Q1.
An attack vector is a term used to describe the method that the attacker uses to launch their DDoS attack, i.e., the IP protocol, packet attributes such as TCP flags, flooding method, and other criteria.
In Q1, SYN floods accounted for 57% of all network-layer DDoS attacks, representing a 69% increase QoQ and a 13% increase YoY. In second place, attacks over SSDP surged by over 1,100% QoQ. Following were RST floods and attacks over UDP. Last quarter, generic UDP floods took the second place, but this time, generic UDP DDoS attacks plummeted by 87% QoQ from 32% to a mere 3.9%.
Emerging threats
Identifying the top attack vectors helps organizations understand the threat landscape. In turn, this may help them improve their security posture to protect against those threats. Similarly, learning about new emerging threats that may not yet account for a significant portion of attacks, can help mitigate them before they become a significant force.
When we look at new emerging attack vectors in Q1, we can see increases in DDoS attacks reflecting off of Lantronix services (+971% QoQ) and SSDP reflection attacks (+724% QoQ). Additionally, SYN-ACK attacks increased by 437% and attacks by Mirai botnets by 321% QoQ.
Attacker reflecting traffic off of Lantronix Discovery Service
Lantronix is a US-based software and hardware company that provides solutions for Internet of Things (IoT) management amongst their vast offering. One of the tools that they provide to manage their IoT components is the Lantronix Discovery Protocol. It is a command-line tool that helps to search and find Lantronix devices. The discovery tool is UDP-based, meaning that no handshake is required. The source IP can be spoofed. So an attacker can use the tool to search for publicly exposed Lantronix devices using a 4 byte request, which will then in turn respond with a 30 byte response from port 30718. By spoofing the source IP of the victim, all Lantronix devices will target their responses to the victim — resulting in a reflection/amplification attack.
Simple Service Discovery Protocol used for reflection DDoS attacks
The Simple Service Discovery Protocol (SSDP) protocol works similarly to the Lantronix Discovery protocol, but for Universal Plug and Play (UPnP) devices such as network-connected printers. By abusing the SSDP protocol, attackers can generate a reflection-based DDoS attack overwhelming the target’s infrastructure and taking their Internet properties offline. You can read more about SSDP-based DDoS attacks here.
Network-layer DDoS attacks by attack rate
In Q1, we observed a massive uptick in volumetric DDoS attacks — both from the packet rate and bitrate perspective. Attacks over 10 Mpps grew by over 300% QoQ, and attacks over 100 Gbps grew by 645% QoQ.
There are different ways of measuring the size of an L3/4 DDoS attack. One is the volume of traffic it delivers, measured as the bit rate (specifically, terabits per second or gigabits per second). Another is the number of packets it delivers, measured as the packet rate (specifically, millions of packets per second).
Attacks with high bit rates attempt to cause a denial-of-service event by clogging the Internet link, while attacks with high packet rates attempt to overwhelm the servers, routers, or other in-line hardware appliances. These devices dedicate a certain amount of memory and computation power to process each packet. Therefore, by bombarding it with many packets, the appliance can be left with no further processing resources. In such a case, packets are “dropped,” i.e., the appliance is unable to process them. For users, this results in service disruptions and denial of service.
Distribution by packet rate
The majority of network-layer DDoS attacks remain below 50,000 packets per second. While 50 kpps is on the lower side of the spectrum at Cloudflare scale, it can still easily take down unprotected Internet properties and congest even a standard Gigabit Ethernet connection.
When we look at the changes in the attack sizes, we can see that attacks of over 10 Mpps grew by over 300% QoQ. Similarly, attacks of 1-10 Mpps grew by almost 40% QoQ.
Distribution by bitrate
In Q1, most of the network-layer DDoS attacks remain below 500 Mbps. This too is a tiny drop in the water at Cloudflare scale, but can very quickly shut down unprotected Internet properties with less capacity or at the very least congest, even a standard Gigabit Ethernet connection.
Graph of the distribution of network-layer DDoS attacks by bit rate in 2022 Q1
Similarly to the trends observed in the packet-per-second realm, here we can also see large increases. The amount of DDoS attacks that peaked over 100 Gbps increased by 645% QoQ; attacks peaking between 10 Gbps to 100 Gbps increased by 407%; attacks peaking between 1 Gbps to 10 Gbps increased by 88%; and even attacks peaking between 500 Mbps to 1 Gbps increased by almost 20% QoQ.
Network-layer DDoS attacks by duration
Most attacks remain under one hour in duration, reiterating the need for automated always-on DDoS mitigation solutions.
We measure the duration of an attack by recording the difference between when it is first detected by our systems as an attack and the last packet we see with that attack signature towards that specific target.
In previous reports, we provided a breakdown of ‘attacks under an hour’, and larger time ranges. However, in most cases over 90 percent of attacks last less than an hour. So starting from this report, we broke down the short attacks and grouped them by shorter time ranges to provide better granularity.
One important thing to keep in mind is that even if an attack lasts only a few minutes, if it is successful, the repercussions could last well beyond the initial attack duration. IT personnel responding to a successful attack may spend hours and even days restoring their services.
In the first quarter of 2022, more than half of the attacks lasted 10-20 minutes, approximately 40% ended within 10 minutes, another ~5% lasted 20-40 minutes, and the remaining lasted longer than 40 minutes.
Short attacks can easily go undetected, especially burst attacks that, within seconds, bombard a target with a significant number of packets, bytes, or requests. In this case, DDoS protection services that rely on manual mitigation by security analysis have no chance in mitigating the attack in time. They can only learn from it in their post-attack analysis, then deploy a new rule that filters the attack fingerprint and hope to catch it next time. Similarly, using an “on-demand” service, where the security team will redirect traffic to a DDoS provider during the attack, is also inefficient because the attack will already be over before the traffic routes to the on-demand DDoS provider.
It’s recommended that companies use automated, always-on DDoS protection services that analyze traffic and apply real-time fingerprinting fast enough to block short-lived attacks.
Summary
Cloudflare’s mission is to help build a better Internet. A better Internet is one that is more secure, faster, and reliable for everyone — even in the face of DDoS attacks. As part of our mission, since 2017, we’ve been providing unmetered and unlimited DDoS protection for free to all of our customers. Over the years, it has become increasingly easier for attackers to launch DDoS attacks. But as easy as it has become, we want to make sure that it is even easier — and free — for organizations of all sizes to protect themselves against DDoS attacks of all types.
Not using Cloudflare yet? Start now with our Free and Pro plans to protect your websites, or contact us for comprehensive DDoS protection for your entire network using Magic Transit.
“It’s ridiculous for a country to get all worked up about a game—except the Super Bowl, of course. Now that’s important.” – Andy Rooney, American radio and television writer
When the Super Bowl is on, there are more winners than just one of the teams playing, especially when we look at Internet trends. By now, everyone knows that the Los Angeles Rams won, but we also want to look at which Super Bowl advertisers were the biggest winners, and how traffic to food delivery services, social media and messaging apps, and sports and betting websites changed throughout the game.
We covered some of these questions during our Super Bowl live-tweeting on our Cloudflare Radar account. (Hint: follow us if you’re interested in Internet trends).
Cloudflare Radar uses a variety of sources to provide aggregate information about Internet traffic and attack trends. In this blog post, as we did last year, we use DNS name resolution data to estimate traffic to websites. We can’t see who visited the websites mentioned, or what anyone did on the websites, but DNS can give us an estimate of the interest generated by the ads or across a set of sites in the categories listed above.
The baseline value for the charts was calculated by taking the mean traffic level for the associated websites during 12:00 – 15:00 EST on Super Bowl Sunday (February 13, 2022).
The Big Picture
Focusing on the two teams that made it to the big game and to get the ball rolling already, the Bengals website had some spikes before kickoff and during the second half, but the Rams website had a great run and just like on the field, had their biggest peak at the end.
The @Bengals website had some spikes before kickoff and during the second half but @RamsNFL had a great run and just like on the field, had their biggest peak at the end. Congratulations to the #Rams for winning the #SuperBowl. pic.twitter.com/YfJgv0RHXP
Super Bowl Sunday is not only about the ads – part of the excitement around watching the game with friends and family is having a great assortment of food and snacks. So, let’s start with the aggregated traffic to a set of food delivery services that clearly builds to a peak around 17:30, one hour before kickoff. After that, traffic generally decreases but increases slightly after the second half starts.
When we look at traffic to sports websites, there’s a build up to a peak as the game began at 18:30.
As the game progressed, traffic dropped off, but spiked three times during halftime (between 20:00 and 20:30). After the Rams victory was assured, traffic to those websites saw a final peak.
We can also see below that aggregated traffic to video platforms had a pattern similar to sports websites, with two peaks at halftime and a third notable one at the end of the game. After kickoff (18:30) the first peak occurred around the same time Coinbase’s bouncing QR code commercial aired.
How about social media? Aggregate traffic to social media sites started to decrease after 17:00, hitting its lowest point just before kickoff.
During the game, there was a clear spike (the biggest of the afternoon/evening) after the Coinbase QR code ad aired. At halftime, social media traffic dropped off before peaking again right before the second half started. A final peak occurred after the game ended.
Finally, let’s look at messaging services. Among this set of domains, there wasn’t as much of a decrease as we saw in social media heading into kickoff, but there was a spike around 19:00 after the second batch of commercials was aired. Traffic continued to grow through halftime and into the third quarter before starting to drop heading towards the end of the game. Similar to several of the other categories above, messaging traffic again rose after the end of the game.
The Internet Impact of Commercials
Historically, many people have watched the Super Bowl as much for the ads as the actual football game. (Maybe even more so some years…) Many of the advertisements are now posted online ahead of Super Bowl Sunday. Given that, do these commercials still drive traffic to the company’s web site while the game is on?” As we saw in 2021, the answer remains a resounding yes.
The first Bud Light ad during the game (at 18:52) drove a more than 25x increase to their site, and the Bud Light Seltzer Hard Soda ad with Guy Fieri at 21:00 drove a second peak in traffic, with a 15x increase over baseline.
The Pringles commercial (at 21:00), where a hand stuck in a Pringles can really stuck with viewers, resulted in a greater than 35x increase. On the other hand, Lays got a 30x bump in traffic from their wedding memories ad at 20:53.
The Doritos website had already experienced some spikes throughout the afternoon, but jungle animals singing the Salt-N-Pepa hit ‘Push It’ (19:13) drove a more than 12x increase in traffic. However, last year’s ad with a flat virtual Matthew McConaughey seemed to have more impact.
Brands that might not be so well known often get a large traffic boost from their Super Bowl commercials. For example, the cocktail company Cutwater Spirits “here’s to the lazy ones” ad, their first at the Super Bowl, resulted in an 800x increase in traffic. (The Michelob Ultra bowling ad with Peyton Manning drive a similar increase in traffic.:
Financial services: the QR code
We already saw that the Coinbase ad seems to have made social media tick up after its ad aired, but what about traffic to them? The ad drove a 14x increase in traffic. (However, it is worth noting that scanning the QR code in the advertisement took viewers to drops.coinbase.com – this specific hostname is not included in the traffic analyzed for this graph.)
In comparison, the Crypto.com ad featuring LeBron James having a conversation with his 2003 self generated a 3x increase in traffic to their website, while the FTX ad where Larry David gives bad advice through human history only resulted in 1.5x traffic growth.
On the other hand, the eToro “to the moon” ad that ran during the second half of the game drove a 25x increase in traffic (at halftime there was another 20x bump).
In the classic financial services world, there was another kid on the block that experienced a much bigger bump (140x) in traffic growth. The Greenlight ad featuring Modern Family’s Phil Dunphy’s (Ty Burrell) purchasing habits aired late in the game, (21:45) but clearly made an impact.
Electric cars (Dr. Evil) takeover
Car commercials have aired for many years during the Super Bowl, teasing new models and technologies. In 2022, electric cars were (again) a popular subject of Super Bowl ads. Bending modern day, 80’s nostalgia, and ancient mythology, BMW rocked down to Electric Avenue as their ad (18:54) resulted in a 14x increase over baseline in traffic.
However, our data showed that there was a clear winner among automobile makers: the Dr. Evil (one of Mike Myers’s characters from Austin Powers) takeover of General Motors ad drove traffic to a peak of over 400x above baseline.
Ads from other car vendors including Toyota (5x), Kia (16x), Vroom (70x), Nissan (30x) also generated attention and increased traffic to their websites. Highlighting the importance of charging to the electric car ecosystem, the first ever Super Bowl ad from Wallbox (a manufacturer of electric car chargers) powered a huge increase in traffic to their website, reaching a peak over 2,500x higher than baseline.
Last but not least
One of the health-related products that had made its mark on the Super Bowl was the early detection medical service Hologic that featured Mary J. Blige. They experienced a 140x traffic spike.
Another example that really showed that having a successful Super Bowl commercial doesn’t stink was for Irish Spring soap. Their good ‘smelling’ ad drove a traffic increase to their website of nearly 200x over baseline.
Among ads for travel-related companies, the biggest increase in traffic we saw was from Booking.com (21:23), with the adventures of Idris Elba gaining them a 1.6x bump.
Several ads promoted shows and movie trailers, including Dr. Strange 2 and Amazon Prime Video’s The Rings of Power, but the trailer for Jordan Peele’s Nope movie generated a nearly 40x increase in traffic.
And the winner is…
Popular smart home gadgets appeared to be jealous of the new COVID-19 testing device from Cue Health, but Super Bowl viewers were clearly curious about it. The company’s ad drove an astronomical 10,000x increase in traffic to their website after it aired.
Conclusion
We saw again that when humans change their behavior that impacts the Internet traffic (the network of networks is, after all, a human invention for humans).
Remember, visit Cloudflare Radar for up to date Internet traffic and attack trends and follow the Cloudflare Radar Twitter account for regular insights on Internet events.
The first half of 2021 witnessed massive ransomware and ransom DDoS attack campaigns that interrupted aspects of critical infrastructure around the world (including one of the largest petroleum pipeline system operators in the US) and a vulnerability in IT management software that targeted schools, public sector, travel organizations, and credit unions, to name a few.
The second half of the year recorded a growing swarm of one of the most powerful botnets deployed (Meris) and record-breaking HTTP DDoS attacks and network-layer attacks observed over the Cloudflare network. This besides the Log4j2 vulnerability (CVE-2021-44228) discovered in December that allows an attacker to execute code on a remote server — arguably one of the most severe vulnerabilities on the Internet since both Heartbleed and Shellshock.
Prominent attacks such as the ones listed above are but a few examples that demonstrate a trend of intensifying cyber-insecurity that affected everyone, from tech firms and government organizations to wineries and meat processing plants.
Here are some DDoS attack trends and highlights from 2021 and Q4 ‘21 specifically:
In December alone, one out of every three survey respondents reported being targeted by a ransom DDoS attack or threatened by the attacker.
Application-layer DDoS attacks
The Manufacturing industry was the most attacked in Q4 ’21, recording a whopping 641% increase QoQ in the number of attacks. The Business Services and Gaming/Gambling industries were the second and third most targeted industries by application-layer DDoS attacks.
For the fourth time in a row this year, China topped the charts with the highest percentage of attack traffic originating from its networks.
Q4 ’21 was the busiest quarter for attackers in 2021. In December 2021 alone, there were more than all the attacks observed in Q1 and Q2 ’21 separately.
While the majority of attacks were small, terabit-strong attacks became the new norm in the second half of 2021. Cloudflare automatically mitigated dozens of attacks peaking over 1 Tbps, with the largest one peaking just under 2 Tbps — the largest we’ve ever seen.
Attacks originating from Moldova quadrupled in Q4 ’21 QoQ, making it the country with the highest percentage of network-layer DDoS activity.
SYN floods and UDP floods were the most frequent attack vectors while emerging threats such as SNMP attacks increased by nearly 5,800% QoQ.
This report is based on DDoS attacks that were automatically detected and mitigated by Cloudflare’s DDoS Protection systems. To learn more about how it works, check out this deep-dive blog post.
A note on how we measure DDoS attacks observed over our network
To analyze attack trends, we calculate the “DDoS activity” rate, which is the percentage of attack traffic out of the total traffic (attack + clean) observed over our global network. Measuring attack numbers as a percentage of the total traffic observed allows us to normalize data points and avoid biases reflected in absolute numbers towards, for example, a Cloudflare data center that receives more total traffic and likely, also more attacks.
An interactive version of this report is available on Cloudflare Radar.
Ransom Attacks
Our systems constantly analyze traffic and automatically apply mitigation when DDoS attacks are detected. Each DDoS’d customer is prompted with an automated survey to help us better understand the nature of the attack and the success of the mitigation.
For over two years now, Cloudflare has been surveying attacked customers — one question on the survey being if they received a ransom note demanding payment in exchange to stop the DDoS attack. Q4 ’21 recorded the highest survey responses ever that indicated ransom threats — ransom attacks increased by 29% YoY and 175% QoQ. More specifically, one out of every 4.5 respondents (22%) reported receiving a ransom letter demanding payment by the attacker.
The percentage of respondents reported being targeted by a ransom DDoS attack or that have received threats in advance of the attack.
When we break it down by month, we can see that December 2021 topped the charts with 32% of respondents reporting receiving a ransom letter — that’s nearly one out of every three surveyed respondents.
Application-layer DDoS attacks
Application-layer DDoS attacks, specifically HTTP DDoS attacks, are attacks that usually aim to disrupt a web server by making it unable to process legitimate user requests. If a server is bombarded with more requests than it can process, the server will drop legitimate requests and — in some cases — crash, resulting in degraded performance or an outage for legitimate users.
Application-layer DDoS attacks by industry
In Q4, DDoS attacks on Manufacturing companies increased by 641% QoQ, and DDoS attacks on the Business Services industry increased by 97%.
When we break down the application-layer attacks targeted by industry, the Manufacturing, Business Services, and Gaming/Gambling industries were the most targeted industries in Q4 ’21.
Application-layer DDoS attacks by source country
To understand the origin of the HTTP attacks, we look at the geolocation of the source IP address belonging to the client that generated the attack HTTP requests. Unlike network-layer attacks, source IP addresses cannot be spoofed in HTTP attacks. A high percentage of DDoS activity in a given country usually indicates the presence of botnets operating from within the country’s borders.
For the fourth quarter in a row, China remains the country with the highest percentage of DDoS attacks originating from within its borders. More than three out of every thousand HTTP requests that originated from Chinese IP addresses were part of an HTTP DDoS attack. The US remained in second place, followed by Brazil and India.
Application-layer DDoS attacks by target country
In order to identify which countries are targeted by the most HTTP DDoS attacks, we bucket the DDoS attacks by our customers’ billing countries and represent it as a percentage out of all DDoS attacks.
For the third consecutive time this year, organizations in the United States were targeted by the most HTTP DDoS attacks, followed by Canada and Germany.
Network-layer DDoS attacks
While application-layer attacks target the application (Layer 7 of the OSI model) running the service that end users are trying to access, network-layer attacks aim to overwhelm network infrastructure (such as in-line routers and servers) and the Internet link itself.
Cloudflare thwarts an almost 2 Tbps attack
In November, our systems automatically detected and mitigated an almost 2 Tbps DDoS attack. This was a multi-vector attack combining DNS amplification attacks and UDP floods. The entire attack lasted just one minute. The attack was launched from approximately 15,000 bots running a variant of the original Mirai code on IoT devices and unpatched GitLab instances.
Network-layer DDoS attacks by month
December was the busiest month for attackers in 2021.
Q4 ‘21 was the busiest quarter in 2021 for attackers. Over 43% of all network-layer DDoS attacks took place in the fourth quarter of 2021. While October was a relatively calmer month, in November, the month of the Chinese Singles’ Day, the American Thanksgiving holiday, Black Friday, and Cyber Monday, the number of network-layer DDoS attacks nearly doubled. The number of observed attacks increased towards the final days of December ’21 as the world prepared to close out the year. In fact, the total number of attacks in December alone was higher than all the attacks in Q2 ’21 and almost equivalent to all attacks in Q1 ’21.
Network-layer DDoS attacks by attack rate
While most attacks are still relatively ‘small’ in size, terabit-strong attacks are becoming the norm.
There are different ways of measuring the size of an L3/4 DDoS attack. One is the volume of traffic it delivers, measured as the bit rate (specifically, terabits per second or gigabits per second). Another is the number of packets it delivers, measured as the packet rate (specifically, millions of packets per second).
Attacks with high bit rates attempt to cause a denial-of-service event by clogging the Internet link, while attacks with high packet rates attempt to overwhelm the servers, routers, or other in-line hardware appliances. These devices dedicate a certain amount of memory and computation power to process each packet. Therefore, by bombarding it with many packets, the appliance can be left with no further processing resources. In such a case, packets are “dropped,” i.e., the appliance is unable to process them. For users, this results in service disruptions and denial of service.
The distribution of attacks by their size (in bit rate) and month is shown below. As seen in the graph above, the majority of attacks took place in December. However, the graph below illustrates that larger attacks, over 300 Gbps in size, took place in November. Most of the attacks between 5-20 Gbps took place in December.
Distribution by packet rate
An interesting correlation Cloudflare has observed is that when the number of attacks increases, their size and duration decrease. In the first two-thirds of 2021, the number of attacks was relatively small, and correspondingly, their rates increased, e.g., in Q3 ’21, attacks ranging from 1-10 million packets per second (mpps) increased by 196%. In Q4 ’21, the number of attacks increased and Cloudflare observed a decrease in the size of attacks. 91% of all attacks peaked below 50,000 packets per second (pps) — easily sufficient to take down unprotected Internet properties.
Larger attacks of over 1 mpps decreased by 48% to 28% QoQ, while attacks peaking below 50K pps increased by 2.36% QoQ.
Distribution by bit rate
Similar to the trend observed in packet-intensive attacks, the amount of bit-intensive attacks shrunk as well. While attacks over 1 Tbps are becoming the norm, with the largest one we’ve ever seen peak just below 2 Tbps, the majority of attacks are still small and peaked below 500 Mbps (97.2%).
In Q4 ’21, larger attacks of all ranges above 500 Mbps saw massive decreases ranging from 35% to 57% for the larger 100+ Gbps attacks.
Network-layer DDoS attacks by duration
Most attacks remain under one hour in duration, reiterating the need for automated always-on DDoS mitigation solutions.
We measure the duration of an attack by recording the difference between when it is first detected by our systems as an attack and the last packet we see with that attack signature towards that specific target. In the last quarter of 2021, 98% of all network-layer attacks lasted less than one hour. This is very common as most of the attacks are short-lived. Even more so, a trend we’ve seen is that when the number of attacks increases, as in this quarter, their rate and duration decreases.
Short attacks can easily go undetected, especially burst attacks that, within seconds, bombard a target with a significant number of packets, bytes, or requests. In this case, DDoS protection services that rely on manual mitigation by security analysis have no chance in mitigating the attack in time. They can only learn from it in their post-attack analysis, then deploy a new rule that filters the attack fingerprint and hope to catch it next time. Similarly, using an “on-demand” service, where the security team will redirect traffic to a DDoS provider during the attack, is also inefficient because the attack will already be over before the traffic routes to the on-demand DDoS provider.
It’s recommended that companies use automated, always-on DDoS protection services that analyze traffic and apply real-time fingerprinting fast enough to block short-lived attacks.
Attack vectors
SYN floods remain attackers’ favorite method of attack, while attacks over SNMP saw a massive surge of almost 5,800% QoQ.
An attack vector is a term used to describe the method that the attacker uses to launch their DDoS attack, i.e., the IP protocol, packet attributes such as TCP flags, flooding method, and other criteria.
For the first time in 2021, the percentage of SYN flood attacks significantly decreased. Throughout 2021, SYN floods accounted for 54% of all network-layer attacks on average. While still grabbing first place as the most frequent vector, its share dropped by 38% QoQ to 34%.
However, it was a close-run for SYN attacks and UDP attacks. A UDP flood is a type of denial-of-service attack in which a large number of User Datagram Protocol (UDP) packets are sent to a targeted server with the aim of overwhelming that device’s ability to process and respond. Oftentimes, the firewall protecting the targeted server can also become exhausted as a result of UDP flooding, resulting in a denial-of-service to legitimate traffic. Attacks over UDP jumped from fourth place in Q3 ’21 to second place in Q4 ’21, with a share of 32% of all network-layer attacks — a 1,198% increase in QoQ.
In third place came the SNMP underdog that made a massive leap with its first time 2021 appearance in the top attack vectors.
Emerging threats
When we look at emerging attack vectors — which helps us understand what new vectors attackers are deploying to launch attacks — we observe a massive spike in SNMP, MSSQL, and generic UDP-based DDoS attacks.
Both SNMP and MSSQL attacks are used to reflect and amplify traffic on the target by spoofing the target’s IP address as the source IP in the packets used to trigger the attack.
Simple Network Management Protocol (SNMP) is a UDP-based protocol that is often used to discover and manage network devices such as printers, switches, routers, and firewalls of a home or enterprise network on UDP well-known port 161. In an SNMP reflection attack, the attacker sends out a large number of SNMP queries while spoofing the source IP address in the packet as the targets to devices on the network that, in turn, reply to that target’s address. Numerous responses from the devices on the network results in the target network being DDoSed.
Similar to the SNMP amplification attack, the Microsoft SQL (MSSQL) attack is based on a technique that abuses the Microsoft SQL Server Resolution Protocol for the purpose of launching a reflection-based DDoS attack. The attack occurs when a Microsoft SQL Server responds to a client query or request, attempting to exploit the Microsoft SQL Server Resolution Protocol (MC-SQLR), listening on UDP port 1434.
Network-layer DDoS attacks by country
Attacks originating from Moldova quadrupled, making it the country with the highest percentage of network-layer DDoS activity.
When analyzing network-layer DDoS attacks, we bucket the traffic by the Cloudflare edge data center locations where the traffic was ingested, and not by the source IP. The reason for this is that, when attackers launch network-layer attacks, they can spoof the source IP address in order to obfuscate the attack source and introduce randomness into the attack properties, which can make it harder for simple DDoS protection systems to block the attack. Hence, if we were to derive the source country based on a spoofed source IP, we would get a spoofed country.
Cloudflare is able to overcome the challenges of spoofed IPs by displaying the attack data by the location of the Cloudflare data center in which the attack was observed. We are able to achieve geographical accuracy in our report because we have data centers in over 250 cities around the world.
To view all regions and countries, check out the interactive map.
Summary
Cloudflare’s mission is to help build a better Internet. A better Internet is one that is more secure, faster, and reliable for everyone — even in the face of DDoS attacks. As part of our mission, since 2017, we’ve been providing unmetered and unlimited DDoS protection for free to all of our customers. Over the years, it has become increasingly easier for attackers to launch DDoS attacks. To counter the attacker’s advantage, we want to make sure that it is also easy and free for organizations of all sizes to protect themselves against DDoS attacks of all types.
In 2021, we continued to live with the effects of the COVID pandemic and Internet traffic was also impacted by it. Although learning and exercising may have started to get back to something close to normal (depending on the country), the effects of what started almost two years ago on the way people work and communicate seems to be here to stay, and the lockdowns or restrictions continue to have an impact on where and how people go online.
So, Cloudflare Radar’s 2021 Year In Review is out with interactive maps and charts you can use to explore what changed on the Internet throughout this past year. Year In Review is part of Cloudflare Radar. We launched Radar in September 2020 to give anyone access to Internet use and abuse trends.
This year we’ve added a mobile vs desktop traffic chart, but also the attack distribution that shows the evolution throughout the year — the beginning of July 2021, more than a month after the famous Colonial Pipeline cyberattack, was the time of the year when attacks worldwide peaked.
There are also interesting pandemic-related trends like the (lack) of Internet activity in Tokyo with the Summer Olympics in town and how Thanksgiving week in the US in late November affected mobile traffic in the United States.
In 2020 by late April we saw that the Internet had seen incredible, sudden growth in traffic because of lockdowns and that was sustained throughout the year as we showed in our 2020 Year In Review. 2021 told a slightly different story, depending on the country.
The big April-March and May Internet traffic peak from 2020 related to the pandemic wasn’t there, in the same way, this year — it was more distributed depending on the local restrictions. In 2021, Internet traffic, globally, continued to grow throughout the year, and it was at the end of the year that was higher (a normal trend, given there’s a growth in categories like online shopping and the colder season in the Northern Hemisphere, where most Internet traffic occurs, affects human behaviour).
The day of the year with the highest growth in traffic worldwide, from our standpoint, was December 2, 2021, with 20% more than the first week of the year — the Y-axis shows the percentage change in Internet traffic using a cohort of top domains from each country. But in May there was also a bump (highlighted in red as a possible pandemic-related occurrence), although not as high as we saw in the March-May period of last year.
Spikes in Internet traffic — Worldwide 2021
#1 November-December1 (+23%) #2 September (+20%) #3 October (+19%) #4 August (+16%) #5 May (+13%) 1Beginning of December
When we focus on specific countries using our Year In Review 2021 page you can see that new restrictions or lockdowns affected (again) Internet traffic and, in some countries, that is more evident than others.
In the following table, we show the months with the highest traffic growth (the percentage shown focus on the spikes). From our standpoint the last four months of the year usually have the highest growth in traffic after September, but Canada, the UK, Germany, France, Portugal, South Korea and Brazil seemed to show (in red) an impact of restrictions in their Internet traffic — with higher increases in the first five months of the year.
Months with the largest traffic growth — 2021
United States
#1 November-Dec (+30%) #2 October (+26%) #3 September (+25%) #4 August (+15%) #5 May (+13%)
Canada
#1 November-Dec (+21%) #2 October (+10%) #3 April (+9%) #4 May (+8%) #5 March (+7%)
UK
#1 November-Dec (+23%) #2 March (+13%) #3 October (+12%) #4 February (+7%) #5 September (+5%)
Germany
#1 November-Dec (+25%) #2 October (+15%) #3 May (+7%) #4 February (+6%) #5 September (+5%)
France
#1 November-Dec (+24%) #2 May (+14%) #3 April (+13%) #4 January (+8%) #5 February (+7%)
Japan
#1 November-Dec (+32%) #2 October (+28%) #3 September (+28%) #4 August (+24%) #5 July (+18%)
Australia
#1 November-Dec (+42%) #2 September (+38%) #3 October (+37%) #4 August (+32%) #5 July (+27%)
Singapore
#1 November-Dec (+62%) #2 October (+58%) #3 September (+58%) #4 August (+41%) #5 July (+31%)
Portugal
#1February (+38%) #2 March (+23%) #3 January (+22%) #4 November-Dec (+18%) #5 April (+17%)
South Korea
#1 April (+21%) #2 May (+16%) #3 February (+10%) #4 August (+7%) #5 September (+7%)
Brazil
#1 May (+25%) #2 June (+23%) #3 November-Dec (+22%) #4 April (+21%) #5 July (+21%)
India
#1 November-Dec (+24%) #2 September (+22%) #3 October (+21%) #4 August (+19%) #5 July (+10%)
When we look at those countries’ trends we can see that Canada had lockdowns at the beginning of February that went through March and May, depending on the area of the country. That is in line with what we’ve seen in 2020: when restrictions/lockdowns are up, people tend to use the Internet more to communicate, work, exercise and learn.
Most of Europe also started 2021 with lockdowns and restrictions that included schools — so online learning was back on. That’s clear in the UK. From January to March showed a high increase in traffic percentage that went down when restrictions were relaxed.
The lines here show Internet traffic growth from our standpoint throughout 2020 and 2021 in the UK
The same happens in Portugal, where new measures on January 21, 2021, put the three first months of the year in the top 3 of the year in terms of growth of traffic, and April was #5.
We can also check the example of France. Lockdowns were imposed again especially during April and May 2021, and we can see the growth in Internet traffic during those months, slightly more timid than the first lockdown of 2020, but nonetheless evident in the 2021 chart.
Germany had the same situation in May (in April work from home was again the rule and the relaxation of measures for vaccinated people only began in mid-May), but in February the lockdown that started at the end of 2020 (and included schools) was also having an impact on Internet traffic.
In South Korea there was also an impact of the beginning of the year lockdown seen in spikes through February, April and May 2021.
Internet traffic growth in the United States had a very different year in 2021 than it had the year before, when the first lockdown had a major effect on Internet growth, but still, May was a month of high growth — it was in mid-May that there were new guidelines from the CDC about masks.
Mobile traffic: The Thanksgiving effect
Another trend worldwide from 2021 is the mobile traffic percentage evolution. Worldwide, from our standpoint, the more mobile-friendly months of the year — where mobile devices were more prevalent to go online — were July and August (typical vacations months in most of the Northern Hemisphere), but January and November were also very strong.
On our Year in Review page, you can also see the new mobile vs desktop traffic chart. The evolution of the importance of mobile traffic is different depending on the country.
For example, the United States has more desktop traffic throughout the year, but in 2021, during the Thanksgiving (November 25) week, mobile traffic took the lead for the first and only time in the whole year. We can also see that in July mobile traffic was also high in terms of relevance.
The UK has a similar trend, with June, July and August being the only months of the year when mobile traffic is prevalent compared to desktop.
If we go to the other side of the planet, to Singapore, there the mobile percentage is usually higher than desktop, and we see a completely different trend than in the US. Mobile traffic was higher in May, and desktop only went above mobile in some days of February, some in March, and especially after the end of October.
Where people accessed the Internet
We also have, again, available the possibility of selecting a city from the map of our Year in Review to zoom into a city to see the change in Internet use throughout the year. Let’s zoom in on San Francisco.
The following agglomeration of maps highlights (all available in our Year in Review site) the change in Internet use comparing the start of 2020, mid-January to mid-March — you can see that there’s still some increase in traffic, in orange —, to the total lockdown situation of April and May, with more blue areas (decrease in traffic).
The red circles shows San Francisco and its surroundings (home of a lot of companies) in a map that compares working hours Internet use on a weekday between two months.
The same trend is seen already in May 2021 in a time when remote work continued to be strong — especially in tech companies (employees moved from the Bay Area). Only in June of this year, there was some increase in traffic (more orange areas), especially further away from San Francisco (in residential areas).
London: From lockdown to a Euro Championship final
London tells us a different story. Looking through the evolution since the start of 2020 we can see that in March (compared to January) we have an increase in traffic (in orange) outside London (where blue is dominant).
The Internet activity only starts to get heavier in June, in time for the kick-off of the 2020 UEFA European Championship. The tournament played in several cities in Europe had a lot of restrictions and a number of games were played in London at Wembley Stadium — where Italy won the final by beating England on penalties. But at the time of the final, July, and especially August, blue was already dominant again — so people seemed to leave the London area. Only in September and October did the traffic start to pick up again, but mostly outside the city centre.
The Summer Olympics impact? Tokyo with low activity
After the UEFA European Championship, came the other big event postponed back in 2020, the Tokyo Summer Olympics. Our map seems to show the troubled months before the event with the pandemic numbers and the restrictions rising before the dates of the major event — late July and the first days of August.
There were athletes, but not fans from around the world and even locals weren’t attending — it was largely an event held behind closed doors with no public spectators permitted due to the declaration of a state of emergency in the Greater Tokyo Area. We can see that in our charts, especially when looking at the increase in activity in March (compared to January) and the decrease in August (compared to June), even with a global event in town (Tokyo is in the red circle).
There’s also another interesting trend pandemic-related in Lisbon, Portugal. With the lockdowns put in place since mid-January, the comparison with March shows the centre of the city losing Internet traffic and the residential areas outside Lisbon gaining it (in orange in the animation). But in April the activity decreased even around Lisbon and only started to get heavier in May when restrictions were more a lot more relaxed.
Lockdowns bring more traffic to Berlin
A different trend can be seen in Berlin, Germany. Internet activity in the city and its surroundings was very high in March and in April (compared to the previous two months) at a time when lockdowns were in place — nonetheless, in 2020 the activity decreased in April with the first major lockdown.
But in May and June, with the relaxation in restrictions, Internet activity decreased (blue) giving the idea that people left the city or, at least, weren’t using the Internet so much. Only in August did Internet activity begin to pick up again, but decreased once more in the colder months of November and December.
Cyberattacks: Threats that came in July
In terms of worldwide attacks, July and November (the month of Black Friday, when it reached a 78% in increase) were definitely the months with the highest peak of the year. The biggest peak was at the beginning of July 2021, when it reached 82%. That was more than a month after the Colonial Pipeline ransomware cyberattack — May was also the month of an attack on part of Toshiba and, in the same week, the Irish health system and of the meat processing company JBS.
The week of December 6 (the same when the Log4j vulnerability was disclosed) also had an increase in attacks — 42% more, and there was also a clear increase (42%) in the beginning of October, around the time of the Facebook outage.
In our dedicated page you can check — for the first time this year — the attack distribution in a selection of countries.
The UK had a very noticeable peak in overall Internet attacks (a growth of 150%) in August and that continued through September. We already saw that the beginning of the year, because of lockdowns, also had an increase in Internet traffic, and we can also see an increase in attacks in January 2021, but also in late November — around the time of the Black Friday week.
The United States, on the other hand, saw a growth in threats that was more uniform throughout the year. The biggest spike was between August and September (a time when students, depending on the state, were going back to school), with 65% of growth. July also had a big spike in threats (58%), but also late May (48%) — that was the month of the Colonial Pipeline ransomware cyberattack. Late November also had a spike (29%).
Countries like France had their peak in attacks (420% more) in late September and Germany it was in June (425%), but also in October (380%) and in November (350%).
The same trend can be seen in Singapore, but with an even higher growth. It reached 1,000% more threats in late November and 900% in the same month, around the time of the famous Singles’ Day (11.11, on November 11), the main e-commerce event in the region.
Also in the region, Australia, for example, also saw a big increase (more than 100%) in attacks in the beginning of September. In Japan, it was more in late May (over 40% of growth in threats).
What people did online in 2021
Last year we saw how the e-commerce category jumped in several countries after the first major lockdown — late March.
In New York, Black Friday, November 26, 2021, was the day of the whole year that e-commerce traffic peaked — it represented 31.9% of traffic, followed by Cyber Monday, November 29, with 26.6% (San Francisco has the same trend). It’s also interesting to see that in 2020 the same category peaked Black Friday, November 27, 2020 (24.3%) but April 22, during the first lockdowns, was a close second at 23.1% (this year the category only had ~14% in April).
Also with no surprise, messaging traffic peaked (20.6%) in the city that never sleeps on the first day of the year, January 1, 2021, to celebrate the New Year.
London calling (pre-Valentine messages)
But countries, cities and the people who live there have different patterns and in London messaging traffic actually peaks at 21.5% of traffic on Friday, February 12, 2021 (two days before Valentine’s Day). While in London, let’s check if Black Friday was also big outside the US. And the answer is: yes! E-commerce traffic peaked at 20.7% of traffic precisely on Black Friday, November 26.
The pandemic also has an influence in the types of websites people use and in London, travel websites had the biggest percentage in traffic on August 8, with only 1.4% — in Munich it was 1.1% on August 11. On the other hand, in New York and San Francisco, travel websites always had less than 1% of traffic.
Going back to Europe, Paris, France, saw a different trend. Travel websites had 1.9% of traffic on June 7, 2021, precisely the week that the pandemic restrictions were lifted — France opened to international travelers on June 9, 2021. The “City of Light” (and love) had its biggest day of the year for messaging websites (24.4%) on Sunday, January 31 — a time when there were new restrictions announced to try to avoid a total lockdown.
The hacker attack: 2021 methods
Our Year in Review site also lets you dig into which attack methods gained the most traction in 2021. It is a given that hackers continued to run their tools to attack websites, overwhelm APIs, and try to exfiltrate data — recently the Log4j vulnerability exposed the Internet to new possible exploitation.
Just to give some examples, in Paris “faking search engine bots” represented 48.3% of the attacks selected for the chart on January 14, 2021, but “SQL Injection” got to 59% on April 29.
Cyberattacks distribution throughout the year in San Francisco
In London “User-Agent Anomaly” was also relevant in some parts of the year, but in San Francisco it was mostly “information disclosure” that was more prevalent, especially in late November, at a time when online shopping was booming — in December “file inclusion” vulnerability had a bigger percentage.
Now it’s your turn: explore more
To explore data for 2021 (but also 2020), you can check out Cloudflare Radar’s Year In Review page. To go deep into any specific country with up-to-date data about current trends, start at Cloudflare Radar’s homepage.
The years come and go, Internet traffic continues to grow (at least so far and with some ‘help’ from the pandemic), and Internet applications, be they websites, IoT devices or mobile apps, continue to evolve throughout the year, depending on if they attract human beings.
We’ll have a more broad Internet traffic-related Year in Review 2021 in the next few days (you can check the 2020 one here), but for now, let’s focus on the most popular domains this year according to our data on Cloudflare Radar and those domains’ changes in our popularity ranking. With Alexa.com going away, if you need a domain ranking, you can get it from Cloudflare.
We’ll focus on space (NASA and SpaceX flew higher), e-commerce (Amazon and Taobao rule), and social media (TikTok ‘danced’ to take the crown from Facebook). We’ll also take a little ‘bite’ on video streaming wars. Netflix is a Squid Game of its own and January 2021 was at the highest in our ranking — probably lockdown and pandemic-related.
Chat domains (WhatsApp, what else) will also be present and, of course, the less established metaverse domains of sorts (Roblox took the lead from Fortnite late in the game). Come with us, let’s travel through 2021.
The following will show the way Cloudflare saw Internet traffic focusing on specific domains (some of which have many websites aggregated into them) and their highs and lows in our global popularity ranking.
Top Sites: Google dethroned by the young ‘padawan’ TikTok
Let’s start with our Top Domains Ranking and 2021 brought us a very interesting duel for the Number 1 spot in our global ranking. Google.com (which includes Maps, Translate, Photos, Flights, Books, and News, among others) ended 2020 as the undefeated leader in our ranking — from September to December of last year it was always on top. Back then TikTok.com was only ranked #7 or #8.
Amazon was #5 in November, but Netflix surpassed in December 2020 (on some days it was higher than Apple, in #4); Instagram and Twitter were constantly changing positions throughout November and December.
2021 told a different story. It was on February 17, 2021, that TikTok got the top spot for a day. Back in March, TikTok got a few more days and also in May, but it was after August 10, 2021, that TikTok took the lead on most days. There were some days when Google was #1, but October and November were mostly TikTok’s days, including on Thanksgiving (November 25) and Black Friday (November 26).
There are other trends we can see comparing both years — for 2020 we only show data of the end of the year, after September (Cloudflare Radar was launched that month). For example, Facebook.com was steadily number #2 across 2020, but with TikTok.com going up Facebook is now a solid #3, followed by Microsoft.com (Office365 and Teams numbers are included there) and by Apple.com (App Store and Apple TV+ numbers are included), the same trend as in 2020.
Amazon.com is the juggernaut that follows, but it is interesting to see that since January 2021 the e-commerce website (we will talk more about that category in a few paragraphs) jumped in front of Apple.com. But Apple got back in front, after September, with some exceptions like November 28, 2021, the day before Cyber Monday — and also December 1 and 6.
Christmas time, Netflix time
Netflix had a great 2020 Christmas but also January 2021, especially at the weekend
Another trend is that Netflix surpassed Amazon in December 2020, especially around Christmas week. On some days around 2020 Christmas, Netflix was even higher than Apple, in #4, that is the case with December 23, 25, and from December 29 to January 2, 2021.
February 2, 2021: The day YouTube (and an aerobics instructor) ruled the world
In our global popularity ranking we also saw another trend: YouTube, usually ranked #6 or #7, got to the top spot of our list on February 2, 2021 — and only on that day.
This fitness instructor video that happened while the Myanmar coup d’état was happening went viral on February 2, 2021, leading to the creation of thousands of memes
Why? One can only guess, but back then, although it was the week of the Super Bowl (some commercials, like the one from Doritos with Matthew McConaughey, were out on that day), there was another big newsworthy event: the Myanmar coup d’état on February 1, 2021. How can a coup in a Southeast Asian country have an impact on YouTube? A video of a fitness instructor who unwittingly filmed as the takeover unfolds behind her took the Internet by storm and became viral as the memes started to pour in.
That February day was also the one where Donald Trump announced his new legal team for the impeachment trial after the previous one quit, and Jeff Bezos announced he would step down as Amazon’s CEO. That was also the week prior to a record in YouTube’s history. On February 11, 2021, the video “Baby Shark Dance” from Korean education brand Pinkfong was the new most-viewed YouTube video of all time, surpassing the former record holder “Despacito” by Luis Fonsi.
Google Trends also shows that the week of February 2 was the one in 2021 that “YouTube” was more searched on Google.
Social media: There’s a new kid in town
In what was the second year of the pandemic, social media domains continued high on our ranking. The nine main social media applications were all in our top 100 list of most popular global domains — the only one out is Quora.com (during 2021 it was between #687 and #242).
We can see that TikTok (who also surpassed Google, as we explained before in the global #1 spot) took Facebook from its crown of the most popular social media website-domain in our ranking. So, that should mean that TikTok got more Internet traffic from our standpoint (our ranking is derived from our public DNS resolver 1.1.1.1 and so it’s not related to the number of unique users or visitors it gets per month) — Facebook is, by far, the platform with more users worldwide).
Top 10 — Most popular social media domains (late) 2021
The Facebook outage — that we explained from our standpoint extensively — on October 4, 2021, also had an impact on Facebook’s position in our ranking, leading to Facebook.com losing its #3 position (it was #4) for seven days in a row in that week. This number of days in #4 was something that never happened before (since September 2020) to the social media giant.
Looking to the top 10 list, it’s also clear that, just looking to social media domains, YouTube comes third and Twitter got a bump up and beat Instagram in 2021, getting the #5 place (barely, in what was a very close race). Back in late 2020 Twitter was behind Instagram in our ranking.
LinkedIn is the ninth most popular social media domain in our ranking and is still in our top 100 and throughout 2021 it got higher in our list, especially in February and March. The social media for professionals then started to drop in June and July (in the Northern Hemisphere’s summer), starting in late August to climb again and by November it reached the #52 place, the highest of the year in our global ranking — in January it was ~#78. In a year when terms like The Great Resignation and the reset of people and organizations’ mindsets were talked about, it makes sense to see this social media platform growing.
Streaming: The (Squid) Netflix Game rules
The so-called video streaming wars got another important round in 2021 with new players appearing and old ones having amazing numbers — not only in subscribers, revenue, and content budgets but also in… Internet traffic. In our ranking, Netflix is still the undefeated hero.
We added YouTube.com (its most important service is free) to the list to compare with the big numbers from Netflix, and still, the Squid Game phenomenon platform won our ranking for most of the year. Amazon Prime is not included because the streaming service mainly uses Amazon.com (ranked #5 or #6 most of the year) as a domain.
The days of the year when Netflix was more popular? January was a great month with Netflix reaching the #4 spot in our global ranking in the first two days of the year (and also all the weekends of January, Fridays included), going through February in the #5 place. For the rest of 2021, the platform was mostly #7. Yes, on the weekends Netflix seems to have a better performance in our ranking.
Roku.com seems to be the next video streaming platform after those two traffic giants, getting around the #80 position in our ranking through 2021. In late 2020 Hulu.com was the next one, but HBOMax.com surpassed Hulu in July 2021 and entered our top 100 list. In 2021, Disneyplus.com also rose in our ranking and surpassed the app-based TV service Sling.com later in the year. Our top 10 chart also includes Iq.com (iQiyi), the Chinese online video platform.
Top 10 — Most popular video streaming domains (late) 2021
In the chart Netflix.com, more dominant in most days, is in pink and YouTube.com is in yellowNetflix and YouTube, but also Roku, HBOMax, Hulu.com and Peacocktv are a lot higher in our list than the others — Disney+ is getting there
E-commerce: Podium to Amazon, Taobao and eBay
Since the pandemic started e-commerce has continued to strive and grow at an even faster pace than before. The top four e-commerce domains (Amazon, Taobao, eBay and Walmart) in our global ranking are all in the top 100 and that happens steadily throughout the year.
The fifth in the e-commerce list, the Chinese giant Jd.com had a few periods that it also entered the top 100 mainly in May and especially June — on the day of the 618 shopping event, on June 18, 2021, it reached #68 on our list, beating Walmart.com and almost catching Ebay.com.
In the following list it is easy to see that Jd.com surpassed Shopify.com in 2021, occupying the #5 place, and also Bestbuy.com and Target.com rose from one year to another.
Top 10 — Most popular e-commerce domains (late) 2021
Shein.com went ahead of Bestbuy.com and Target.com from December 19 to 24, 2020*
Here are other trends:
Amazon.com is a domain, as we already explained, with more than e-commerce services (that’s why globally it ranks between #4 and #6). In 2021, it had some good days in January and in late April 2021, reaching #4, but by the end of the year it got its best days in our ranking, especially on the day before Cyber Monday, November 28, and on December 1 and 6 — it reached #5.
Taobao.com had its best day of the year in our global ranking on August 20 — #15 — and by the popular Chinese shopping day, Singles’ Day, November 11, it was #17.
Ebay.com had a solid year and a good late August (#29 on August 31) and grew more after Cyber Monday, peaking on December 1, reaching #27.
Shopify had a great August (reaching #100 on August 18), the same with Etsy.com that peaked at #128 on August 21. Walmart had a great June (#66) and also end of November (it reached #70).
Ikea.com had a big increase in importance throughout the year and got very near to Homedepot.com’s position in September (peaked in the #695 position in our global ranking), staying up through November.
Best Buy peaked on October 6 and had a high growth throughout November, also matching Shopify in December.
When we look to Shein.com we see that it peaked last Christmas and is on the rise since November 2021
Shein.com, the global Chinese online fast-fashion retailer, went high in our ranking for the Christmas of 2020 — it went ahead of Bestbuy.com and Target.com from December 19 to 24, 2020, reaching the #253 position. In March, it had another peak, and it got the best position in 2021 in our ranking after Cyber Monday — it reached #301 on December 1, 2021.
2021: A Space Odyssey (for NASA, SpaceX, Blue Origin and Virgin Galactic)
This year was also a big year for space travel with several achievements. Spacecraft from three Mars exploration programs from the United Arab Emirates, China, and the United States arrived at Mars in February — NASA’s Perseverance rover landed on February 18, 2021, and after that the Ingenuity drone made history, being the first powered aircraft flight on another planet in human history. And there is also another big space event just around the corner — the James Webb Telescope launch.
Virgin Galactic (July 11), Blue Origin (July 20) and SpaceX (September 16 — but with several other events before that regarding satellites and reuse of space capsules) also stormed the Internet with space tourism achievements with different scopes. Only SpaceX offered an orbital ride.
In terms of domains, NASA.gov was way ahead of the others, but Elon Musk’s SpaceX.com was definitely second in our global ranking, followed by Blueorigin.com. Virgingalactic.com only appears once in our top 100k ranking on July 17 and 18 (a few days after Richard Branson’s spaceflight).
Since last year NASA is high on our global ranking, in the top 1,000 domains of our list, but after the rover Perseverance landed on Mars on February 18 NASA.gov entered our top 700 ranking — the highest day of that month was February 25, when it reached #657. In the summer it went down in our ranking, but it picked up in late September and on October 13, 2021, reached the highest position of the year (#637). That was the day the press conference about NASA’s Lucy mission, the agency’s first to Jupiter’s Trojan asteroids, took place (the launch was on October 16).
SpaceX.com had a great start of February, it entered our top 8,000, a month with a launch of 60 new Starlink internet satellites into orbit amidst a missed rocket landing and a fresh $850 million of new investment. And then it was after September 16, 2021, with the first orbital launch of an all-private crew, Inspiration4, that it flew again in our ranking.
For Blue Origin, after a strong start of the year — it reached our #32,000 on January 10 (a few days before New Shepard 4’s first test flight) — it went up between July 20- 27 after its first crewed flight, with Jeff Bezos onboard. It also went up in our ranking a few days after October 13, 2021 (the day William Shatner flew aboard a Blue Origin suborbital capsule).
Messaging or chat: WhatsApp, what else?
There aren’t as many messaging or chat platforms as there are popular social media sites, video streaming, or e-commerce platforms. So, this ranking is slim, and even slimmer because Messenger (uses Facebook.com) or iMessage (uses Apple.com) aren’t included. Snapchat is both a social media platform and a messaging app — the same with Instagram — and we added them in the social media ranking. If they were here they would be higher than WeChat but behind WhatsApp — Instagram actually started 2021 (it got to #8) in front of WhatsApp until February and went as low as #13 and Snapchat went between #29 to #16.
From our standpoint, WhatsApp is the undisputed leader of the messaging apps ranging from as low as #13 in our global ranking to as high as #8. Its best parts of the year were late March, late April, late October and then late November going through December 2021 as #8 in our ranking.
How Signal skyrocketed in January (and WeChat in February)
All the others are far away in our ranking, but 2021 brought three trends we should highlight:
Signal.org had an incredible month of January — on January 3 it was in #1815 in our ranking and by January 20 it rose to #766, a climb in more than 1,000 positions in just 17 days. Why? WhatsApp’s new privacy policy was in the headlines in the second week of January.
WeChat.com also had an amazing jump in our ranking, but more in February and by April it surpassed Signal.org — it went from #3142 at the start of February to #979 by April 25 and by October both of the messaging apps were almost tied at ~#370 and had a significantly higher place in our ranking than in late 2020.
Telegram.com on the other hand had a decrease in ranking throughout the year and ended up in the top 38,000.
“You can’t just materialize anywhere in the Metaverse, like Captain Kirk beaming down from on high. This would be confusing and irritating to the people around you. It would break the metaphor. Materializing out of nowhere (or vanishing back into Reality) is considered to be a private function best done in the confines of your own House.“ ― Neal Stephenson, Snow Crash (1992)
Metaverse: Don’t mess with Roblox
Back in November, we heard in the halls of Web Summit — the 42,000 in-person tech global event in Lisbon — that in a way the metaverse is already here (Roblox’s Global Head of Music had some thoughts on virtual concerts). But we’re still far from the promise of almost living in the virtual world that books like Neal Stephenson’s Snow Crash or Ernest Cline’s Ready Player One showed us.
Oculus shipped a lot of headsets and there are immersive experiences out there that are Metaverse-like (a step further than the now-usual-for-most spending all day working, learning, communicating through a screen) and we focused on that ones, like Fortnite, Roblox, Second Life (the oldest, from 2003), Minecraft and Oculus. But Oculus.com doesn’t have enough direct traffic (playing games using Oculus headset could direct the traffic elsewhere) to be in our top 100k domains ranking, and the same happens with Minecraft.
Oculus.com and Minecraft.net are not in our 100,000 ranking
The (short) list from 2020 and 2021 shows us that Roblox.com surpassed Epicgames.com (the home of the popular Fortnite) for the first time in July reaching back then #27 in our list. But it was after late September that it was consistently in front of the rival game platform, ending the year on a good note reaching #20 in our ranking.
Epicgames.com (Fortnite) started the year a lot better, reaching #14 on January 5, 2021, but it started to lose importance in February and that deepened after May, but mostly in July and August. It never truly recovered and ended the year between #26 and #47, depending on the day.
Conclusion: Human (online) trends
The Internet is not a quiet place, the same way humans on Earth (especially during a pandemic) aren’t quiet or passive but active and reactive. Although on the top of our domain ranking there don’t seem to be drastic ups and downs throughout the year (TikTok, and YouTube, were the exceptions), we saw how an event like the Myanmar coup and the subsequent viral video may have brought YouTube to #1 on our ranking. We also saw how e-commerce was affected throughout the year, how space-related websites had a big (online) year with important events, and how Netflix rose around Christmas time.
And remember: you can keep an eye on Cloudflare Radar to monitor how we see Internet traffic globally and in every country.
This week, a group of US lawmakers introduced the Stopping Grinch Bots Act — new legislation that could stop holiday hoarders on the Internet. This inspired us to put a spin on a Dr. Seuss classic:
Each person on the Internet liked Christmas a lot But the Grinch Bot, built by the scalper did not! The Grinch Bot hated Christmas! The whole Christmas season! Now, please don’t ask why. No one quite knows the reason.
Cloudflare stops billions of bad bots every day. As you might have guessed, we see all types of attacks, but none is more painful than a Grinch Bot attack. Join us as we take a closer look at this notorious holiday villain…
25 days seconds of Christmas
What is the Grinch Bot? Technically speaking, it’s just a program running on a computer, making automated requests that reach different websites. We’ve come to refer to these requests as “bots” on the Internet. Bots move quickly, leveraging the efficiency of computers to carry out tasks at scale. The Grinch Bot is a very special type that satisfies two conditions:
It only pursues online inventory, attempting to purchase items before humans can complete their orders.
It only operates during the holiday season.
Now, attackers use bots to perform these tasks all year long. But in these winter months, we like to use the term “Grinch Bot” as seasonal terminology.
The Grinch Bot strikes first around Black Friday. It knows that the best discounts come around Thanksgiving, and it loves to get a good deal. Exclusive items are always the first to go, so attackers use the Grinch Bot to cut every (virtual) line and checkpoint. Cloudflare detected nearly 1.5 trillion bot requests on Black Friday. That’s about half of all our traffic; but more on this in a bit.
The Grinch Bot strikes again on Cyber Monday. As shoppers find gifts for their loved ones, bots are ten steps ahead — selecting “add to cart” automatically. Many bots have payment details ready (perhaps even stolen from your account!).
The Grinch Bot will buy 500 pairs of Lululemon joggers before you even get one. And it’ll do so in seconds.
Nearly 44% of traffic comes from bad bots
The Grinch Bot has friends working throughout the year, putting pressure on security teams and moving undetected. 43.8% of Internet traffic comes from these bots. When the holidays arrive, the Grinch Bot can ask its friends how to attack the largest sites. They have already been testing tactics for months.
In response, many sites block individual IP addresses, groups of devices, or even entire countries. Other sites use Rate Limiting to reduce traffic volume. At Cloudflare, we’ve advocated not only for Rate Limiting, but also for a more sophisticated approach known as Bot Management, which dynamically identifies threats as they appear. Here’s a look at bot traffic before the holidays (1H 2021):
When we looked at bot traffic on Black Friday, we found that it had surged to nearly 50%.Cloudflare Radar showed data close to 55% (if you want to include the good bots as well). Businesses tell us this is the most vulnerable time of the year for their sites.
Over 300 billion bots…
Bots are highly effective at scale. While humans can purchase one or two items within a few minutes, bots can purchase far more inventory with little effort.
During the year, Cloudflare observed over 300 billion bots try to “add to cart.” How did we find this? We ran our bot detection engines on every endpoint that contains the word “cart.” Keep in mind, most bots are stopped before they can even view item details. There are trillions of inventory hoarding bots that were caught earlier in their efforts by our Bot Management and security solutions.
Even worse, some bots want to steal your holiday funds. They skip the ecommerce sites and head right for your bank, where they test stolen credentials and try to break into your account. 71% of login traffic comes from bots:
Bots operate at such an immense scale that they occasionally succeed. When this happens, they can break into accounts, retrieve your credit card information, and begin a holiday shopping spree.
Deck the halls with JS Challenges
We hate CAPTCHAs almost as much as we hate the Grinch Bot, so we built JS challenges as a lightweight, non-interactive alternative:
Not surprisingly, we issue more JS Challenges when more bots reach our network. These challenges are traditionally a middle ground between taking no action and completely blocking requests. They offer a chance for suspicious looking requests to prove their legitimacy. Cloudflare issued over 35 billion JS Challenges over the shopping weekend.
Even more impressive, however, is the number of threats blocked around this time. On Black Friday, Cloudflare blocked over 150 billion threats:
While we expected the Grinch Bot to make its move on Friday, we did not expect it to recede as it did on Cyber Monday. Bot traffic decreased as the shopping weekend continued. We like to think the Grinch Bot spent its time furiously trying to avoid blocks and JS Challenges, but eventually gave up.
Saving the Internet (and Christmas)
While large retailers can afford to purchase bot solutions, not every site is so fortunate. We decided to fix that.
Cloudflare’s Bot Fight Mode is a completely free tool that stops bots. You can activate it with one click, drawing on our advanced detection engines to protect your site. It’s easy:
And Bot Fight Mode doesn’t just stop bots — it makes them pay. We unleash a tarpit challenge that preoccupies each bot with nonsense puzzles, ultimately handing bot operators a special gift: a massive server bill. We even plant trees to offset the carbon emissions of these expensive challenges. In fact, with so many bots stopped in the snow, there’s really just one thing left to say…
Every person on the Internet, the tall and the small, Called out with joy that their shopping didn’t stall! He hadn’t stopped Christmas from coming! It came! Somehow or other, it came just the same! And the Grinch Bot, with his grinch feet ice-cold in the snow, Stood puzzling and puzzling. “How could it be so?”
November comes, the temperatures start to get colder for most of the planet’s population (87% live in the Northern Hemisphere) and many are also starting to prepare for the festive season. That also brings significant changes in Internet traffic, most notably the online shopping kind of traffic.
So, what were the November days that e-commerce websites had the most traffic in the US and what about worldwide? Is humanity using more mobile Internet at this time? And what are the most popular days online — is Black Friday the winner?
Let’s start with e-commerce — we added a chart to Radar that shows trends for e-commerce by country. The worldwide trend is pretty evident: Cyber Monday, the day for supposedly last-minute discounts, was the clear winner.
Worldwide most popular days for e-commerce
#1. Cyber Monday, November 29.
#2. Monday, November 23.
#3. Black Friday, November 26 — November 24 is pretty close to Black Friday. All in all a very good week in terms of e-commerce traffic.
US: November e-commerce traffic ‘rain’
When we focus on the United States, the country that instituted Black Friday (the day after US Thanksgiving has since become a “retail bonanza” in other countries), the trend is a little different when we look to the full month of November.
US most popular days for e-commerce
#1. Cyber Monday, November 29.
#2. Monday, November 2.
#3. Sunday, November 1.
The Black Friday week definitely had a big impact on e-commerce traffic, but besides the clear winner, Cyber Monday, the podium was actually completed with the first two days in November. Those days have a big traffic peak, but the Black Friday week has more sustained traffic over five days.
When we look just at last week, Black Friday isn’t actually the most popular day, it’s Monday, November 22 — that isn’t surprising given that shoppers also “returned to stores” on Black Friday 2021 and didn’t do everything online.
Despite this, Black Friday 2021 had definitely more sustained traffic throughout the day. The line in the next chart stays up on November 26 (Black Friday) for several hours after 12:00 UTC, early morning in the US, more than in the previous days.
For example, when we look at the 00:00 UTC mark in those red circles (19:00 US East Coast time; 16:00 US West Coast time), Black Friday evening was the most popular evening of the week — even more than November 22. In the past few days, only Cyber Monday had (a lot) more traffic than Black Friday.
And we can also notice the “pause” in online shopping for Thanksgiving Day (we wrote a blog post about that).
2021: How about the UK, France, Germany or India?
With our new Radar tool for e-commerce websites, everyone can see the trends for their country looking back to the previous seven or 30 days. We can give some interesting examples by looking at some countries.
In the UK, for example, the most popular day was Black Friday, followed by Cyber Monday.
In Germany, Black Friday 2021, followed by Cyber Monday, were the most popular days although there’s a bigger traffic peak on November 2.
In the neighbourhood, ‘down’ in France, the most popular days for e-commerce were Thursday, November 18, and Tuesday, November 23. Those days were even bigger than Black Friday or Cyber Monday — there’s also a clear sustained increase in traffic in the Black Friday week.
Now let’s ‘travel’ to India, the fastest growing online retail market in the world, which also had the Black Friday week as the best week of the month for online shopping. Cyber Monday was the most popular day, followed by Wednesday, November 24, and also Black Friday.
One exception seems to be Japan. The start of the Black Friday week and the end of the previous week were the better periods for online shopping traffic — November 18, 23 and 20 were much better days than Black Friday or Cyber Monday.
The mobile traffic percentage rose by the end of November
So how about November? If we look at the worldwide trend, it’s pretty clear that after Sunday, November 22, the mobile traffic percentage went up — Internet traffic from mobile devices represented 55% of the total in the past week.
We can also see in the next chart that Black Friday, November 26, saw an increase of more than 4% in the mobile traffic percentage, compared to the same period of the previous month. So, people were using their mobile devices a lot more to go online — 4% more.
Now let’s go to the US, where Thanksgiving (as we explained before) had a big influence on Internet traffic. That trend is even more pronounced, specifically on Thanksgiving day, November 25 (mobile traffic percentage grew more than 6%), but also on Black Friday, November 26. At the weekend mobile traffic went back down.
And remember: you can keep an eye on Cloudflare Radar to monitor how we see Internet traffic globally and in every country.
Cloudflare Radar launched as part of last year’s Birthday Week. We described it as a“newspaper for the Internet”, that gives“any digital citizen the chance to see what’s happening online [which] is part of our pursuit to help build a better, more informed, Internet”.
Since then, we have made considerable strides, including adding dedicated pages to cover how key events such as the UEFA Euro 2020 Championship and the Tokyo Olympics shaped Internet usage in participating countries, and added a Radar section for interactive deep-dive reports on topics such as DDoS.
Today, Radar has four main sections:
Main page with near real-time information about global Internet usage.
Internet usage details by country (see, for example, Portugal).
Domain insights, where searching for a domain returns traffic, registration and certificate information about it.
Deep-dive reports on complex and often underreported topics.
Cloudflare’s global network spans more than 250 cities in over 100 countries. Because of this, we have the unique ability to see both macro and micro trends happening online, including insights on how traffic is flowing around the world or what type of attacks are prevalent in a certain country.
Radar Maps will make this information even richer and easier to consume.
Introducing Radar Maps
Starting today, Radar has two new data visualizations to help us share more insights from our data and represent what’s happening on the Internet.
Geographical distribution of application-level attacks
Note: The identified location of the devices involved in the attack may not be the actual location of the people performing the attack.
Geographical distribution of application-level attacks, in both directions
Cyber threats are more common than ever. In the third quarter of 2021 Cloudflare blocked an average of 76 billion cyber threats each day and had visibility over many more. Helping build a better Internet also means giving people more visibility over our data. That’s why we’ve made a near real-time view of the types of attacks, protocol distribution, and attack volume over time available on Radar from day one.
Now we’re adding a geographical representation of origin and target of such attacks using two new visualizations.
First, we have a global map drawing near real-time directional lines of the attacks, also known as a “pew pew” map — thank you, 1983 and WarGames.
Second, we have Sankey diagrams that are great for representing how strongly the attacks are flowing from one country to the other.
We hope you like what we’ve built with our new Radar Maps. Radar, unlike any other insights platform out there, is totally built on Cloudflare components and our edge computing platform — Workers and Workers KV. This gives us new and unique ways of representing data at scale. So do keep checking back radar.cloudflare.com to see the Internet evolving in (near) real-time.
Meris first got our attention due to an exceptionally large 17.2 million requests per second (rps) DDoS attack that it launched against one of our customers. This attack, along with subsequent attacks originated by the Meris botnet, was automatically detected and mitigated by our DDoS protection systems. Cloudflare customers, even ones on the free plan, are protected against Meris attacks.
Over the past months, we’ve been tracking and analyzing the activity of the Meris botnet. Some main highlights include:
Meris targets approximately 50 different websites every single day with a daily average of 104 unique DDoS attacks.
More than 33% of all Meris DDoS attack traffic targeted China-based websites.
More than 12% of all websites that were attacked by Meris are operated by US-based companies.
View more Meris attack insights and trends in the interactive Radar dashboard.
So what is Meris?
Meris (Latvian for plague) is the name of an active botnet behind a series of recent DDoS attacks that have targeted thousands of websites around the world. It was originally detected in late June 2021 by QRator in joint research they conducted with Yandex. Their initial research identified 30,000 to 56,000 bots, but they estimated that the numbers are actually much higher, in the ballpark of 250,000 bots.
The Meris botnet is formed of infected routers and networking hardware manufactured by the Latvian company MikroTik. According to MikroTik’s blog, the attackers exploited a vulnerability in the router’s operating system (RouterOS) which enabled attackers to gain unauthenticated remote access to read and write arbitrary files (CVE-2018-14847).
RouterOS is the router operating system that’s used by MikroTik’s routers and the RouterBOARD hardware product family, which can also be used to turn any PC into a router. Administration of RouterOS can be done either via direct SSH connection or by using a configuration utility called WinBox. The vulnerability itself was possible due to a directory traversal vulnerability in the WinBox interface with RouterOS.
Directory traversal is a type of exploit that allows attackers to travel to the parent directories to gain access to the operating system’s file system, a method and structure of how data is stored and retrieved in the operating system. Once they gain access to the file system, attackers can then read the existing files that administer the router and write files directly into the file system to administer the routers to their botnet needs.
While the vulnerability was patched after its detection back in 2018, it’s still being exploited in compromised devices that do not use the patched RouterOS versions, or that use the default usernames and passwords. MicroTik has advised its customers to upgrade their devices’ OS version, to only allow access to the devices via secure IPsec, and to inspect for any abnormalities such as unknown SOCKS proxy settings and scripts.
To launch volumetric attacks, the botnet uses HTTP pipelining which allows it to send multiple requests over a single connection, thus increasing its total attack throughput. Furthermore, in an attempt to obfuscate the attack source, the botnet uses open SOCKS proxies to proxy their attack traffic to the target.
Cloudflare’s DDoS protection systems automatically detect and mitigate Meris attacks. One of the mitigation actions that the system can choose to use is the ‘Connection Close’ action which eliminates the risk of HTTP pipelining and helps slow down attackers. Additionally, as part of Cloudflare’s threat intelligence suite, we provide a Managed IP List of Open SOCKS Proxies that customers can use as part of their firewall rules — to block, challenge or rate-limit traffic that arrives via SOCKS proxies.
How does Meris compare to Mirai?
About five years ago, Mirai (Japanese for future) — the infamous botnet that infected hundreds of thousands of IoT devices — launched record-breaking DDoS attacks against websites.
There have been many variants of the Mirai botnet since its source code was leaked. One version of Mirai, called Moobot, was detected last year when it attacked a Cloudflare customer with a 654 Gbps DDoS attack. Another variant recently made a resurgence when it targeted Cloudflare customers with over a dozen UDP and TCP based DDoS attacks that peaked multiple times above 1 Tbps, with a max peak of approximately 1.2 Tbps.
While Mirai infected IoT devices with low computational power, Meris is a swarm of routers that have significantly higher processing power and data transfer capabilities than IoT devices, making them much more potent in causing harm at a larger scale to web properties that are not protected by sophisticated cloud-based DDoS mitigation.
Tracking the Meris botnet attacks
Since the appearance of Meris, Cloudflare’s systems automatically detected and mitigated Meris attacks using the existing mitigation rules. During our analysis of the Meris botnet attacks, our security experts noticed the attack vectors adapt to try and bypass Cloudflare’s defenses. Needless to say, they were not successful. But we wanted to stay many steps ahead of attackers — and so our engineers deployed additional rules that mitigate Meris attacks even more comprehensively. A side effect of these mitigation rules is that it also provides us with more granular threat intelligence on the Meris attacks.
Since we deployed the new rules in early August, we’ve seen Meris launch an average of 104 DDoS attacks on Cloudflare customers every day. The highest figure we’ve seen was on September 6, when Meris was used to launch 261 unique attacks against Cloudflare customers.
Overall, Meris targets about 50 different websites and applications every single day. Although the average attack peaked at 106K rps, the median attack size was actually smaller at 17.6K rps. The largest attack we’ve seen was 17.2M rps and that occurred in July. In the graph below, you can see the daily highest requests per second rate after we deployed the new rules. Since then, the largest attack we’ve seen was 16.7M rps, which took place on August 19.
Meris used to target Banks, Financial Services, and Insurance companies
Over the past few months, the industry that received the most attack traffic from the Meris botnet was the Banking, Financial Services, and Insurance (BFSI) industry
Following the BFSI industry, the most attacked industries were the Publishing, Gaming/Gambling, and IT Services industries. And while BFSI was the number one most attacked industry when considering the Meris DDoS activity rate, it only came in fourth place when considering the percentage of targeted websites.
In terms of the percentage of targeted websites, the Computer Software industry came in first place. Almost 4% of all impacted websites were of Computer Software companies protected by Cloudflare, followed by Gaming/Gambling and IT Services with 3% and 2%, respectively.
Besides the total breakdowns shown above, we can also view the top industries the botnet attacked over time to understand the changing trends. These trends may be tied to political events, new video game releases, sporting events, or any other global or local public interest events.
Off the top, we can already see the two largest peaks on August 9 and August 29 — mainly on the Computer Software, Gaming/Gambling, and IT industries. Another interesting peak occurred on August 14 against Cryptocurrency providers.
In late August, the botnet was pointed against gambling and casino websites, generating attacks at rates of hundreds of thousands to millions of requests per second. A second significant wave against the same industry was launched in early September.
Meris targets websites in China, Australia, and US
Similarly to the analysis of the top industries, we can calculate the Meris DDoS activity rate per target country to identify which countries came under the most attacks. In total, China-based companies saw the largest amount of DDoS attacks. More than 33% of all requests generated by Meris were destined for China-based companies that are protected by Cloudflare. Australia came in second place, and the US in third.
On the other hand, when we look at the number of websites that were targeted by Meris, the US came in first place. More than 12% of all websites that were targeted by Meris are operated by US-based companies. China came in second place with 5.6% and Russia in third with 4.4%.
Over time, we can see how the attacks on the top countries change. Similarly to the per-industry breakdown, we can also see two large peaks. The first one occurred on the same spike as the per-industry breakdown on August 9. However, the second one here occurred on September 1.
Although only tens of thousands of bots have been detected per attack, it is estimated that there are roughly 250,000 bots worldwide. As indicated above, the botnet is formed of MikroTik routers. Using the source IP address of the routers, we’re able to identify the origin country of the bots to paint a geographical representation of the bots’ presence and growth over time.
The change in the location of the bots doesn’t necessarily indicate that the botnet is growing or shrinking. It could also be that different bot groups are activated from time to time to spread the load of the attacks while attempting not to get caught.
At the beginning of August, the majority of the bots were located in Brazil. But by the end of August, that number plummeted to a single digit percentage close to zero. Meanwhile, the number of infected devices grew in the United States. From the beginning of September, the number of bots was significantly higher in the US, Russia, India, Indonesia, and China.
Cloudflare operates autonomous DDoS protection systems that automatically detect and mitigate DDoS attacks of all types, including attacks launched by Meris and Mirai. These systems are also customizable, and Cloudflare customers can tweak and tune their DDoS protection settings as needed with the HTTP DDoS Managed Rulesetand the L3/4 DDoS Managed Ruleset.
It’s been a few days now since Facebook, Instagram, and WhatsApp went AWOL and experienced one of the most extended and rough downtime periods in their existence.
When that happened, we reported our bird’s-eye view of the event and posted the blog Understanding How Facebook Disappeared from the Internet where we tried to explain what we saw and how DNS and BGP, two of the technologies at the center of the outage, played a role in the event.
In the meantime, more information has surfaced, and Facebook has published a blog post giving more details of what happened internally.
As we said before, these events are a gentle reminder that the Internet is a vast network of networks, and we, as industry players and end-users, are part of it and should work together.
In the aftermath of an event of this size, we don’t waste much time debating how peers handled the situation. We do, however, ask ourselves the more important questions: “How did this affect us?” and “What if this had happened to us?” Asking and answering these questions whenever something like this happens is a great and healthy exercise that helps us improve our own resilience.
Today, we’re going to show you how the Facebook and affiliate sites downtime affected us, and what we can see in our data.
1.1.1.1
1.1.1.1 is a fast and privacy-centric public DNS resolver operated by Cloudflare, used by millions of users, browsers, and devices worldwide. Let’s look at our telemetry and see what we find.
First, the obvious. If we look at the response rate, there was a massive spike in the number of SERVFAIL codes. SERVFAILs can happen for several reasons; we have an excellent blog called Unwrap the SERVFAIL that you should read if you’re curious.
In this case, we started serving SERVFAIL responses to all facebook.com and whatsapp.com DNS queries because our resolver couldn’t access the upstream Facebook authoritative servers. About 60x times more than the average on a typical day.
If we look at all the queries, not specific to Facebook or WhatsApp domains, and we split them by IPv4 and IPv6 clients, we can see that our load increased too.
As explained before, this is due to a snowball effect associated with applications and users retrying after the errors and generating even more traffic. In this case, 1.1.1.1 had to handle more than the expected rate for A and AAAA queries.
Here’s another fun one.
DNS vs. DoT and DoH. Typically, DNS queries and responses are sent in plaintext over UDP (or TCP sometimes), and that’s been the case for decades now. Naturally, this poses security and privacy risks to end-users as it allows in-transit attacks or traffic snooping.
With DNS over TLS (DoT) and DNS over HTTPS, clients can talk DNS using well-known, well-supported encryption and authentication protocols.
Our learning center has a good article on “DNS over TLS vs. DNS over HTTPS” that you can read. Browsers like Chrome, Firefox, and Edge have supported DoH for some time now, WAP uses DoH too, and you can even configure your operating system to use the new protocols.
When Facebook went offline, we saw the number of DoT+DoH SERVFAILs responses grow by over x300 vs. the average rate.
So, we got hammered with lots of requests and errors, causing traffic spikes to our 1.1.1.1 resolver and causing an unexpected load in the edge network and systems. How did we perform during this stressful period?
Quite well. 1.1.1.1 kept its cool and continued serving the vast majority of requests around the famous 10ms mark. An insignificant fraction of p95 and p99 percentiles saw increased response times, probably due to timeouts trying to reach Facebook’s nameservers.
Another interesting perspective is the distribution of the ratio between SERVFAIL and good DNS answers, by country. In theory, the higher this ratio is, the more the country uses Facebook. Here’s the map with the countries that suffered the most:
Here’s the top twelve country list, ordered by those that apparently use Facebook, WhatsApp and Instagram the most:
Country
SERVFAIL/Good Answers ratio
Turkey
7.34
Grenada
4.84
Congo
4.44
Lesotho
3.94
Nicaragua
3.57
South Sudan
3.47
Syrian Arab Republic
3.41
Serbia
3.25
Turkmenistan
3.23
United Arab Emirates
3.17
Togo
3.14
French Guiana
3.00
Impact on other sites
When Facebook, Instagram, and WhatsApp aren’t around, the world turns to other places to look for information on what’s going on, other forms of entertainment or other applications to communicate with their friends and family. Our data shows us those shifts. While Facebook was going down, other services and platforms were going up.
To get an idea of the changing traffic patterns we look at DNS queries as an indicator of increased traffic to specific sites or types of site.
Here are a few examples.
Other social media platforms saw a slight increase in use, compared to normal.
Traffic to messaging platforms like Telegram, Signal, Discord and Slack got a little push too.
Nothing like a little gaming time when Instagram is down, we guess, when looking at traffic to sites like Steam, Xbox, Minecraft and others.
And yes, people want to know what’s going on and fall back on news sites like CNN, New York Times, The Guardian, Wall Street Journal, Washington Post, Huffington Post, BBC, and others:
Attacks
One could speculate that the Internet was under attack from malicious hackers. Our Firewall doesn’t agree; nothing out of the ordinary stands out.
Network Error Logs
Network Error Logging, NEL for short, is an experimental technology supported in Chrome. A website can issue a Report-To header and ask the browser to send reports about network problems, like bad requests or DNS issues, to a specific endpoint.
Cloudflare uses NEL data to quickly help triage end-user connectivity issues when end-users reach our network. You can learn more about this feature in our help center.
If Facebook is down and their DNS isn’t responding, Chrome will start reporting NEL events every time one of the pages in our zones fails to load Facebook comments, posts, ads, or authentication buttons. This chart shows it clearly.
WARP
Cloudflare announced WARP in 2019, and called it “A VPN for People Who Don’t Know What V.P.N. Stands For” and offered it for free to its customers. Today WARP is used by millions of people worldwide to securely and privately access the Internet on their desktop and mobile devices. Here’s what we saw during the outage by looking at traffic volume between WARP and Facebook’s network:
You can see how the steep drop in Facebook ASN traffic coincides with the start of the incident and how it compares to the same period the day before.
Our own traffic
People tend to think of Facebook as a place to visit. We log in, and we access Facebook, we post. It turns out that Facebook likes to visit us too, quite a lot. Like Google and other platforms, Facebook uses an army of crawlers to constantly check websites for data and updates. Those robots gather information about websites content, such as its titles, descriptions, thumbnail images, and metadata. You can learn more about this on the “The Facebook Crawler” page and the Open Graph website.
Here’s what we see when traffic is coming from the Facebook ASN, supposedly from crawlers, to our CDN sites:
The robots went silent.
What about the traffic coming to our CDN sites from Facebook User-Agents? The gap is indisputable.
We see about 30% of a typical request rate hitting us. But it’s not zero; why is that?
We’ll let you know a little secret. Never trust User-Agent information; it’s broken. User-Agent spoofing is everywhere. Browsers, apps, and other clients deliberately change the User-Agent string when they fetch pages from the Internet to hide, obtain access to certain features, or bypass paywalls (because pay-walled sites want sites like Facebook to index their content, so that then they get more traffic from links).
Fortunately, there are newer, and privacy-centric standards emerging like User-Agent Client Hints.
Core Web Vitals
Core Web Vitals are the subset of Web Vitals, an initiative by Google to provide a unified interface to measure real-world quality signals when a user visits a web page. Such signals include Largest Contentful Paint (LCP), First Input Delay (FID), and Cumulative Layout Shift (CLS).
We use Core Web Vitals with our privacy-centric Web Analytics product and collect anonymized data on how end-users experience the websites that enable this feature.
One of the metrics we can calculate using these signals is the page load time. Our theory is that if a page includes scripts coming from external sites (for example, Facebook “like” buttons, comments, ads), and they are unreachable, its total load time gets affected.
We used a list of about 400 domains that we know embed Facebook scripts in their pages and looked at the data.
Now let’s look at the Largest Contentful Paint. LCP marks the point in the page load timeline when the page’s main content has likely loaded. The faster the LCP is, the better the end-user experience.
Again, the page load experience got visibly degraded.
The outcome seems clear. The sites that use Facebook scripts in their pages took 1.5x more time to load their pages during the outage, with some of them taking more than 2x the usual time. Facebook’s outage dragged the performance of some other sites down.
Conclusion
When Facebook, Instagram, and WhatsApp went down, the Web felt it. Some websites got slower or lost traffic, other services and platforms got unexpected load, and people lost the ability to communicate or do business normally.
Attackers continue targeting VoIP infrastructure around the world. In our blog from last week, May I ask who’s calling, please? A recent rise in VoIP DDoS attacks, we reviewed how the SIP protocol works, ways it can be abused, and how Cloudflare can help protect against attacks on VoIP infrastructure without impacting performance.
Cloudflare’s network stands in front of some of the largest, most performance-sensitive voice and video providers in the world, and is uniquely well suited to mitigating attacks on VoIP providers.
Because of the sustained attacks we are observing, we are sharing details on recent attack patterns, what steps they should take before an attack, and what to do after an attack has taken place.
Below are three of the most common questions we’ve received from companies concerned about attacks on their VoIP systems, and Cloudflare’s answers.
Question #1: How is VoIP infrastructure being attacked?
The attackers primarily use off-the-shelf booter services to launch attacks against VoIP infrastructure. The attack methods being used are not novel, but the persistence of the attacker and their attempts to understand the target’s infrastructure are.
Attackers have used various attack vectors to probe the existing defenses of targets and try to infiltrate any existing defenses to disrupt VoIP services offered by certain providers. In some cases, they have been successful. HTTP attacks against API gateways and the corporate websites of the providers have been combined with network-layer and transport-layer attack against VoIP infrastructures. Examples:
TCP floods targeting stateful firewalls These are being used in “trial-and-error” type attacks. They are not very effective against telephony infrastructure specifically (because it’s mostly UDP) but very effective at overwhelming stateful firewalls.
UDP floods targeting SIP infrastructure Floods of UDP traffic that have no well-known fingerprint, aimed at critical VoIP services. Generic floods like this may look like legitimate traffic to unsophisticated filtering systems.
UDP reflection targeting SIP infrastructure These methods, when targeted at SIP or RTP services, can easily overwhelm Session Border Controllers (SBCs) and other telephony infrastructure. The attacker seems to learn enough about the target’s infrastructure to target such services with high precision.
SIP protocol-specific attacks Attacks at the application layer are of particular concern because of the higher resource cost of generating application errors vs filtering on network devices.
Question #2: How should I prepare my organization in case our VoIP infrastructure is targeted?
Deploy an always-on DDoS mitigation service Cloudflare recommends the deployment of always-on network level protection, like Cloudflare Magic Transit, prior to your organization being attacked.
Do not rely on reactive on-demand SOC-based DDoS Protection services that require humans to analyze attack traffic — they take too long to respond. Instead, onboard to a cloud service that has sufficient network capacity and automated DDoS mitigation systems.
Cloudflare has effective mitigations in place for the attacks seen against VoIP infrastructure, including for sophisticated TCP floods and SIP specific attacks.
Enforce a positive security model Block TCP on IP/port ranges that are not expected to receive TCP, instead of relying on on-premise firewalls that can be overwhelmed. Block network probing attempts (e.g. ICMP) and other packets that you don’t normally expect to see.
Build custom mitigation strategies Work together with your DDoS protection vendor to tailor mitigation strategies to your workload. Every network is different, and each poses unique challenges when integrating with DDoS mitigation systems.
Educate your employees Train all of your employees to be on the lookout for ransom demands. Check email, support tickets, form submissions, and even server access logs. Ensure employees know to immediately report ransom demands to your Security Incident Response team.
Question #3: What should I do if I receive a ransom/threat?
Do not to pay the ransom Paying the ransom only encourages bad actors—and there’s no guarantee that they won’t attack your network now or later.
Notify Cloudflare We can help ensure your website and network infrastructure are safeguarded against these attacks.
Notify local law enforcement They will also likely request a copy of the ransom letter that you received.
Cloudflare is here to help
With over 100 Tbps of network capacity, a network architecture that efficiently filters traffic close to the source, and a physical presence in over 250 cities, Cloudflare can help protect critical VoIP infrastructure without impacting latency, jitter, and call quality. Test results demonstrate a performance improvement of 36% on average across the globe for a real customer network using Cloudflare Magic Transit.
Some of the largest voice and video providers in the world rely on Cloudflare to protect their networks and ensure their services remain online and fast. We stand ready to help.
Talk to a Cloudflare specialist to learn more. Under attack? Contact our hotline to speak with someone immediately.
“Facebook can’t be down, can it?”, we thought, for a second.
Today at 1651 UTC, we opened an internal incident entitled “Facebook DNS lookup returning SERVFAIL” because we were worried that something was wrong with our DNS resolver 1.1.1.1. But as we were about to post on our public status page we realized something else more serious was going on.
Social media quickly burst into flames, reporting what our engineers rapidly confirmed too. Facebook and its affiliated services WhatsApp and Instagram were, in fact, all down. Their DNS names stopped resolving, and their infrastructure IPs were unreachable. It was as if someone had “pulled the cables” from their data centers all at once and disconnected them from the Internet.
How’s that even possible?
Meet BGP
BGP stands for Border Gateway Protocol. It’s a mechanism to exchange routing information between autonomous systems (AS) on the Internet. The big routers that make the Internet work have huge, constantly updated lists of the possible routes that can be used to deliver every network packet to their final destinations. Without BGP, the Internet routers wouldn’t know what to do, and the Internet wouldn’t work.
The Internet is literally a network of networks, and it’s bound together by BGP. BGP allows one network (say Facebook) to advertise its presence to other networks that form the Internet. As we write Facebook is not advertising its presence, ISPs and other networks can’t find Facebook’s network and so it is unavailable.
The individual networks each have an ASN: an Autonomous System Number. An Autonomous System (AS) is an individual network with a unified internal routing policy. An AS can originate prefixes (say that they control a group of IP addresses), as well as transit prefixes (say they know how to reach specific groups of IP addresses).
Cloudflare’s ASN is AS13335. Every ASN needs to announce its prefix routes to the Internet using BGP; otherwise, no one will know how to connect and where to find us.
In this simplified diagram, you can see six autonomous systems on the Internet and two possible routes that one packet can use to go from Start to End. AS1 → AS2 → AS3 being the fastest, and AS1 → AS6 → AS5 → AS4 → AS3 being the slowest, but that can be used if the first fails.
At 1658 UTC we noticed that Facebook had stopped announcing the routes to their DNS prefixes. That meant that, at least, Facebook’s DNS servers were unavailable. Because of this Cloudflare’s 1.1.1.1 DNS resolver could no longer respond to queries asking for the IP address of facebook.com or instagram.com.
route-views>show ip bgp 185.89.218.0/23
% Network not in table
route-views>

route-views>show ip bgp 129.134.30.0/23
% Network not in table
route-views>
Meanwhile, other Facebook IP addresses remained routed but weren’t particularly useful since without DNS Facebook and related services were effectively unavailable:
route-views>show ip bgp 129.134.30.0
BGP routing table entry for 129.134.0.0/17, version 1025798334
Paths: (24 available, best #14, table default)
  Not advertised to any peer
  Refresh Epoch 2
  3303 6453 32934
    217.192.89.50 from 217.192.89.50 (138.187.128.158)
      Origin IGP, localpref 100, valid, external
      Community: 3303:1004 3303:1006 3303:3075 6453:3000 6453:3400 6453:3402
      path 7FE1408ED9C8 RPKI State not found
      rx pathid: 0, tx pathid: 0
  Refresh Epoch 1
route-views>
We keep track of all the BGP updates and announcements we see in our global network. At our scale, the data we collect gives us a view of how the Internet is connected and where the traffic is meant to flow from and to everywhere on the planet.
A BGP UPDATE message informs a router of any changes you’ve made to a prefix advertisement or entirely withdraws the prefix. We can clearly see this in the number of updates we received from Facebook when checking our time-series BGP database. Normally this chart is fairly quiet: Facebook doesn’t make a lot of changes to its network minute to minute.
But at around 15:40 UTC we saw a peak of routing changes from Facebook. That’s when the trouble began.
If we split this view by routes announcements and withdrawals, we get an even better idea of what happened. Routes were withdrawn, Facebook’s DNS servers went offline, and one minute after the problem occurred, Cloudflare engineers were in a room wondering why 1.1.1.1 couldn’t resolve facebook.com and worrying that it was somehow a fault with our systems.
With those withdrawals, Facebook and its sites had effectively disconnected themselves from the Internet.
DNS gets affected
As a direct consequence of this, DNS resolvers all over the world stopped resolving their domain names.
➜  ~ dig @1.1.1.1 facebook.com
;; ->>HEADER<<- opcode: QUERY, status: SERVFAIL, id: 31322
;facebook.com.			IN	A
➜  ~ dig @1.1.1.1 whatsapp.com
;; ->>HEADER<<- opcode: QUERY, status: SERVFAIL, id: 31322
;whatsapp.com.			IN	A
➜  ~ dig @8.8.8.8 facebook.com
;; ->>HEADER<<- opcode: QUERY, status: SERVFAIL, id: 31322
;facebook.com.			IN	A
➜  ~ dig @8.8.8.8 whatsapp.com
;; ->>HEADER<<- opcode: QUERY, status: SERVFAIL, id: 31322
;whatsapp.com.			IN	A
This happens because DNS, like many other systems on the Internet, also has its routing mechanism. When someone types the https://facebook.com URL in the browser, the DNS resolver, responsible for translating domain names into actual IP addresses to connect to, first checks if it has something in its cache and uses it. If not, it tries to grab the answer from the domain nameservers, typically hosted by the entity that owns it.
If the nameservers are unreachable or fail to respond because of some other reason, then a SERVFAIL is returned, and the browser issues an error to the user.
Again, our learning center provides a good explanation on how DNS works.
Due to Facebook stopping announcing their DNS prefix routes through BGP, our and everyone else’s DNS resolvers had no way to connect to their nameservers. Consequently, 1.1.1.1, 8.8.8.8, and other major public DNS resolvers started issuing (and caching) SERVFAIL responses.
But that’s not all. Now human behavior and application logic kicks in and causes another exponential effect. A tsunami of additional DNS traffic follows.
This happened in part because apps won’t accept an error for an answer and start retrying, sometimes aggressively, and in part because end-users also won’t take an error for an answer and start reloading the pages, or killing and relaunching their apps, sometimes also aggressively.
This is the traffic increase (in number of requests) that we saw on 1.1.1.1:
So now, because Facebook and their sites are so big, we have DNS resolvers worldwide handling 30x more queries than usual and potentially causing latency and timeout issues to other platforms.
Fortunately, 1.1.1.1 was built to be Free, Private, Fast (as the independent DNS monitor DNSPerf can attest), and scalable, and we were able to keep servicing our users with minimal impact.
The vast majority of our DNS requests kept resolving in under 10ms. At the same time, a minimal fraction of p95 and p99 percentiles saw increased response times, probably due to expired TTLs having to resort to the Facebook nameservers and timeout. The 10 seconds DNS timeout limit is well known amongst engineers.
Impacting other services
People look for alternatives and want to know more or discuss what’s going on. When Facebook became unreachable, we started seeing increased DNS queries to Twitter, Signal and other messaging and social media platforms.
We can also see another side effect of this unreachability in our WARP traffic to and from Facebook’s affected ASN 32934. This chart shows how traffic changed from 15:45 UTC to 16:45 UTC compared with three hours before in each country. All over the world WARP traffic to and from Facebook’s network simply disappeared.
The Internet
Today’s events are a gentle reminder that the Internet is a very complex and interdependent system of millions of systems and protocols working together. That trust, standardization, and cooperation between entities are at the center of making it work for almost five billion active users worldwide.
Update
At around 21:00 UTC we saw renewed BGP activity from Facebook’s network which peaked at 21:17 UTC.
This chart shows the availability of the DNS name ‘facebook.com’ on Cloudflare’s DNS resolver 1.1.1.1. It stopped being available at around 15:50 UTC and returned at 21:20 UTC.
Undoubtedly Facebook, WhatsApp and Instagram services will take further time to come online but as of 22:28 UTC Facebook appears to be reconnected to the global Internet and DNS working again.
Earlier this summer, Cloudflare’s autonomous edge DDoS protection systems automatically detected and mitigated a 17.2 million request-per-second (rps) DDoS attack, an attack almost three times larger than any previous one that we’re aware of. For perspective on how large this attack was: Cloudflare serves over 25 million HTTP requests per second on average. This refers to the average rate of legitimate traffic in 2021 Q2. So peaking at 17.2 million rps, this attack reached 68% of our Q2 average rps rate of legitimate HTTP traffic.
Comparison graph of Cloudflare’s average request per second rate versus the DDoS attack
Automated DDoS mitigation with Cloudflare’s autonomous edge
This attack, along with the additional attacks provided in the next sections, were automatically detected and mitigated by our autonomous edge DDoS protection systems. The system is powered by our very own denial of service daemon (dosd). Dosd is a home-grown software-defined daemon. A unique dosd instance runs in every server in each one of our data centers around the world. Each dosd instance independently analyzes traffic samples out-of-path. Analyzing traffic out-of-path allows us to scan asynchronously for DDoS attacks without causing latency and impacting performance. DDoS findings are also shared between the various dosd instances within a data center, as a form of proactive threat intelligence sharing.
Once an attack is detected, our systems generate a mitigation rule with a real-time signature that matches the attack patterns. The rule is propagated to the most optimal location in the tech stack. As an example, a volumetric HTTP DDoS attack may be blocked at L4 inside the Linux iptables firewall instead of at L7 inside the L7 reverse proxy which runs in the user space. Mitigating lower in the stack, e.g. dropping the packets at L4 instead of responding with a 403 error page in L7, is more cost-efficient. It reduces our edge CPU consumption and intra-data center bandwidth utilization — thus helping us mitigate large attacks at scale without impacting performance.
This autonomous approach, along with our network’s global scale and reliability, allow us to mitigate attacks that reach 68% of our average per-second-rate, and higher, without requiring any manual mitigation by Cloudflare personnel, nor causing any performance degradation.
The resurgence of Mirai and new powerful botnets
This attack was launched by a powerful botnet, targeting a Cloudflare customer in the financial industry. Within seconds, the botnet bombarded the Cloudflare edge with over 330 million attack requests.
Graph of 17.2M rps attack
The attack traffic originated from more than 20,000 bots in 125 countries around the world. Based on the bots’ source IP addresses, almost 15% of the attack originated from Indonesia and another 17% from India and Brazil combined. Indicating that there may be many malware infected devices in those countries.
Distribution of the attack sources by top countries
Volumetric attacks increase
This 17.2 million rps attack is the largest HTTP DDoS attack that Cloudflare has ever seen to date and almost three times the size of any other reported HTTP DDoS attack. This specific botnet, however, has been seen at least twice over the past few weeks. Just last week it also targeted a different Cloudflare customer, a hosting provider, with an HTTP DDoS attack that peaked just below 8 million rps.
Graph of 8M rps attack
Two weeks before, a Mirai-variant botnet launched over a dozen UDP and TCP based DDoS attacks that peaked multiple times above 1 Tbps, with a max peak of approximately 1.2 Tbps. And while the first HTTP attacks targeted Cloudflare customers on the WAF/CDN service, the 1+ Tbps network-layer attacks targeted Cloudflare customers on the Magic Transit and Spectrum services. One of these targets was a major APAC-based Internet services, telecommunications and hosting provider. The other was a gaming company. In all cases, the attacks were automatically detected and mitigated without human intervention.
Graph of Mirai botnet attack peaking at 1.2 Tbps
The Mirai botnet started with roughly 30K bots and slowly shrinked to approximately 28K. However, despite losing bots from its fleet, the botnet was still able to generate impressive volumes of attack traffic for short periods. In some cases, each burst lasted only a few seconds.
These attacks join the increase in Mirari-based DDoS attacks that we’ve observed on our network over the past weeks. In July alone, L3/4 Mirai attacks increased by 88% and L7 attacks by 9%. Additionally, based on the current August per-day average of the Mirai attacks, we can expect L7 Mirai DDoS attacks and other similar botnet attacks to increase by 185% and L3/4 attacks by 71% by the end of the month.
Graph of change in Mirai based DDoS attacks by month
Back to the Mirai
Mirai, which means ‘future’ in Japanese, is a codename for malware that was first discovered in 2016 by MalwareMustDie, a non-profit security research workgroup. The malware spreads by infecting Linux-operated devices such as security cameras and routers. It then self-propagates by searching for open Telnet ports 23 and 2323. Once found, it then attempts to gain access to vulnerable devices by brute forcing known credentials such as factory default usernames and passwords. Later variants of Mirai also took advantage of zero-day exploits in routers and other devices. Once infected, the devices will monitor a Command & Control (C2) server for instructions on which target to attack.
Diagram of Botnet operator controlling the botnet to attack websites
How to protect your home and business
While the majority of attacks are small and short, we continue to see these types of volumetric attacks emerging more often. It’s important to note that these volumetric short burst attacks can be especially dangerous for legacy DDoS protection systems or organizations without active, always-on cloud-based protection.
Furthermore, while the short duration may say something about the botnet’s capability to deliver sustained levels of traffic over time, it can be challenging or impossible for humans to react to it in time. In such cases, the attack is over before a security engineer even has time to analyze the traffic or activate their stand-by DDoS protection system. These types of attacks highlight the need for automated, always-on protection.
How to protect your business and Internet properties
Follow our preventive best practices, to ensure that both your Cloudflare settings and your origin server settings are optimized. As an example, make sure that you allow only traffic from Cloudflare’s IP range. Ideally, ask your upstream Internet Service Provider (ISP) to apply an access control list (ACL), otherwise, attackers may target your servers’ IP addresses directly and bypass your protection.
Recommendations on how to protect your home and IoT appliances
Change the default username and password of any device that is connected to the Internet such as smart cameras and routers. This will reduce the risk that malware such as Mirai can gain access to your router and IoT devices.
Protect your home against malware with Cloudflare for Families. Cloudflare for Families is a free service that automatically blocks traffic from your home to malicious websites and malware communication.
Recent weeks have witnessed massive ransomware and ransom DDoS (Distributed Denial of Service) attack campaigns that interrupted aspects of critical infrastructure around the world, including one of the largest petroleum pipeline system operators, and one of the world’s biggest meat processing companies. Earlier this quarter, more than 200 organizations across Belgium, including the government and parliament websites and other services, were also DDoS’d.
And when most of the United States were celebrating Independence Day on July 4, hundreds of US companies were hit by a ransomware attack demanding 70 million USD in Bitcoin. Attackers known to be affiliated with REvil, a Russian ransomware group, exploited multiple previously unknown vulnerabilities in IT management software. The targets included schools, small public-sector bodies, travel and leisure organizations, and credit unions, to name a few. While the threat of ransomware and ransom DDoS is not new (read our posts on ransomware and ransom DDoS from 2021 Q1), the latest attacks on Internet properties ranging from wineries, professional sports teams, ferry services and hospitals has brought them from just being background noise to front page headlines affecting our day-to-day lives. In fact, recent attacks have propelled ransomware and DDoS to the top of US President Biden’s national security agenda.
The DDoS attack trends observed over Cloudflare’s network in 2021 Q2 paint a picture that reflects the overall global cyber threat landscape. Here are some highlights.
Over 11% of our surveyed customers who were targeted by a DDoS attack reported receiving a threat or ransom letter threatening in advance, in the first six months of this year. Emergency onboarding of customers under an active DDoS attack increased by 41.8% in 2021 H1 compared to 2020 H2.
HTTP DDoS attacks targeting government administration/public sector websites increased by 491%, making it the second most targeted industry after Consumer Services whose DDoS activity increased by 684% QoQ.
China remains the country with the most DDoS activity originating from within their borders — 7 out of every 1,000 HTTP requests originating from China were part of an HTTP DDoS attack targeting websites, and more than 3 out of every 100 bytes that were ingested in our data centers in China were part of a network-layer DDoS attack.
Emerging threats included amplification DDoS attacks that abused the Quote of the Day (QOTD) protocol which increased by 123% QoQ. Additionally, as the adoption of QUIC protocol continues to increase, so do attacks over QUIC — registering a whopping 109% QoQ surge in 2021 Q2. The number of network-layer DDoS attacks in the range of 10-100 Gbps increased by 21.4% QoQ. One customer that was attacked is Hypixel, an American gaming company. Hypixel remained online with no downtime and no performance penalties to their gamer users, even when under an active DDoS attack campaign larger than 620 Gbps. Read their story here.
To view all DDoS attack insights across all regions and industries worldwide, visit Cloudflare’s interactive Radar DDoS dashboard.
Application-layer DDoS attacks
Application-layer DDoS attacks, specifically HTTP DDoS attacks, are attacks that usually aim to disrupt an HTTP server by making it unable to process legitimate user requests. If a server is bombarded with more requests than it can process, the server will drop legitimate requests or even crash resulting in performance penalties or a denial of service event for legitimate users.
DDoS activity per market industry
When we analyze attacks, we calculate the ‘DDoS activity’ rate, which is the percentage of attack traffic out of the total traffic (attack + clean). This allows us to normalize the data points and avoid biases towards, for example, a larger data center that naturally handles more traffic and therefore also more attacks.
In 2021 Q2, Consumer Services was the most targeted industry followed by Government Administration and Marketing & Advertising.
DDoS activity per source country
To understand the origin of the HTTP attacks we observed over Cloudflare’s network, we look at the source IP address of the client generating the attack HTTP requests. Unlike network-layer attacks, source IPs cannot be spoofed in HTTP attacks. A high DDoS activity rate in a given country indicates large botnets operating from within.
China and the US remain in the first and second places, respectively, regarding the percentage of DDoS activity originating from within their territories. In China, more than 7 out of every 1,000 HTTP requests were part of an HTTP DDoS attack, while in the US almost 5 out of 1,000 HTTP requests were part of an attack.
DDoS activity per target country
In order to identify which countries the targets of the DDoS attacks resided in, we break down the DDoS activity by our customers’ billing countries. Note that Cloudflare does not charge for attack traffic and has pioneered providing unmetered and unlimited DDoS protection since 2017. By cross-referencing the attack data with our customers’ billing country, we can identify which countries were attacked the most.
Data observed in 2021 Q2 suggest that organizations in the US and China were the most targeted by HTTP DDoS attacks. In fact, one out of every 200 HTTP requests destined to US-based organizations was part of a DDoS attack.
Network-layer DDoS attacks
While application-layer attacks strike the application (Layer 7 of the OSI model) running the service end users are trying to access, network-layer attacks target network infrastructure (such as in-line routers and other network servers) and the Internet link itself.
The chart above shows the distribution of network-layer DDoS attacks in 2021 Q2.
Distribution of attacks by size (packet rate and bit rate)
There are different ways of measuring the size of a L3/4 DDoS attack. One is the volume of traffic it delivers, measured as the bit rate (specifically, gigabits-per-second). Another is the number of packets it delivers, measured as the packet rate (specifically, packets-per-second). Attacks with high bit rates attempt to saturate the Internet link, while attacks with high packet rates attempt to overwhelm the servers, routers or other in-line hardware appliances.
The distribution of attacks by their size (in bit rate) and month is shown below. As observed in the chart, all attacks over 300 Gbps were observed in the month of June.
In terms of bit rate, attacks under 500 Mbps constituted a majority of all DDoS attacks observed in 2021 Q2.
Similarly, looking from the lens of packet rate, nearly 94% of attacks were under 50K pps. Even though attacks from 1-10M pps constituted only 1% of all DDoS attacks observed, this number is 27.5% higher than that observed in the previous quarter, suggesting that larger attacks are not diminishing either — but rather increasing.
Note that while attacks under 500 Mbps and 50K pps might seem ‘small’ compared to other headline-making large attacks, they are often sufficient to create major disruptions for Internet properties that are not protected by an always-on, automated cloud-based DDoS protection service. Moreso, many organisations have uplinks provided by their service providers with a bandwidth capacity smaller than 1 Gbps. Assuming their public-facing network interface also serves legitimate traffic, DDoS attacks smaller than 500 Mbps are often capable of taking down exposed Internet properties.
Distribution by attack duration
Cloudflare continues to see a large percentage of DDoS attacks that last under an hour. In Q2, over 97% of all DDoS attacks lasted less than an hour.
Short burst attacks may attempt to cause damage without being detected by DDoS detection systems. DDoS services that rely on manual analysis and mitigation may prove to be useless against these types of attacks because they are over before the analyst even identifies the attack traffic.
Alternatively, the use of short attacks may be used to probe the cyber defenses of the target. Load-testing tools and automated DDoS tools, that are widely available on the dark web, can generate short bursts of a SYN flood, for example, and then follow up with another short attack using a different attack vector. This allows attackers to understand the security posture of their targets before they decide to launch larger attacks at larger rates and longer durations — which come at a cost.
In other cases, attackers generate small DDoS attacks as proof and warning to the target organization of the attacker’s ability to cause real damage later on. It’s often followed by a ransom email to the target organization, demanding payment to avoid suffering an attack that could more thoroughly cripple network infrastructure.
This highlights the need for an always on, automated DDoS protection approach. DDoS protection services that rely on manual re-routing, analysis and mitigation may prove to be useless against these types of attacks because they are over before the analyst can even identify the attack traffic.
Distribution of attacks by attack vectors
An attack vector is the term used to describe the method that the attacker utilizes in their attempt to cause a denial of service event.
As observed in previous quarters, attacks utilizing SYN floods and UDP-based protocols remain the most popular methods by attackers.
What is a SYN flood attack? It’s a DDoS attack that exploits the very foundation of the TCP protocol. A stateful TCP connection between a client and a server begins with a 3-way TCP handshake. The client sends an initial connection request packet with a synchronize flag (SYN). The server responds with a packet that contains a synchronized acknowledgment flag (SYN-ACK). Finally, the client responds with an acknowledgment (ACK) packet. At this point, a connection is established and data can be exchanged until the connection is closed. This stateful process can be abused by attackers to cause denial of service events.
By repeatedly sending SYN packets, the attacker attempts to overwhelm a server or the router’s connection table that tracks the state of TCP connections. The router replies with a SYN-ACK packet, allocates a certain amount of memory for each given connection, and falsely waits for the client to respond with the final ACK. Given a sufficient number of connections occupying the router’s memory, the router is unable to allocate further memory for legitimate clients, causing the router to crash or preventing it from handling legitimate client connections, i.e., a denial of service event.
Emerging threats
Emerging threats included amplification DDoS attacks that abuse the Quote of the Day (QOTD) service which increased by 123% QoQ. QOTD was defined in RFC-865 (1983) and can be sent over either the UDP or TCP protocols. It was originally designed for debugging and as a measurement tool, with no specific syntax for the quote. The RFC does however recommend the use of ASCII characters and to limit the length to 512 characters.
Furthermore, we’ve seen a 107% increase QoQ in UDP Portmap and Echo attacks — all of which are really old attack vectors. This may indicate attackers digging up old methods and attack tools to try and overcome protection systems. As we’ve seen in previous quarters, the adoption of the QUIC protocol continues to increase. Consequently, so do attacks over QUIC, or more specifically floods and amplification attacks of non-QUIC traffic in places where we’d expect to see QUIC traffic. In 2021 Q2, these types of attacks increased by 109% QoQ. This continued trend may indicate that attackers are attempting to abuse the QUIC-designated ports and gateways into organizations’ networks — searching for vulnerabilities and security holes.
DDoS activity by Cloudflare data center country
In 2021 Q2, our data center in Haiti observed the largest percentage of network-layer DDoS attack traffic, followed by Brunei (almost 3 out of every 100 packets were part of an attack) and China.
Note that when analyzing network-layer DDoS attacks, we bucket the traffic by the Cloudflare edge data center locations where the traffic was ingested, and not by the source IP. The reason for this is that, when attackers launch network-layer attacks, they can spoof the source IP address in order to obfuscate the attack source and introduce randomness into the attack properties, which may make it harder for simple DDoS protection systems to block the attack. Hence, if we were to derive the source country based on a spoofed source IP, we would get a spoofed country. Cloudflare is able to overcome the challenges of spoofed IPs by displaying the attack data by the location of Cloudflare’s data center in which the attack was observed. We’re able to achieve geographical accuracy in our report because we have data centers in over 200 cities around the world.
A note on ransomware and ransom DDoS — a growing global threat
The last few weeks have seen a resurgence of ransom-driven cyber threats: ransomware and ransom DDoS (RDDoS).
So what is ransomware and ransom DDoS, and how are they different?
Ransomware is malicious software that encrypts an organization’s systems and databases, rendering them inaccessible and unusable. Malware is usually introduced into an organization’s systems via phishing emails — tricking employees to click on a link or download a file. Once the malware is installed on the employee’s device, it encrypts the device and can propagate to the entire network of the organization’s servers and employee devices. The attacker will demand money, usually in the form of Bitcoin, in exchange for decrypting the organization’s systems and granting them access back to their systems.
Unlike a ransomware attack, a ransom DDoS attack does not encrypt a company’s systems; it aims to knock them offline if the ransom is not paid. What makes ransom DDoS attacks even more dangerous is that they do not require the attacker to gain access to a business’s internal systems to execute the attack. However, with a strong DDoS protection strategy in place, a ransom DDoS attack has little to no effect on businesses.
Ransomware and ransom DDoS threats are impacting most industries across the globe — the financial industry, transportation, oil and gas, consumer goods, and even education and healthcare.
Entities claiming to be ‘Fancy Lazarus’, ‘Fancy Bear’, ‘Lazarus Group’, and ‘REvil’ are once again launching ransomware and ransom-DDoS attacks against organizations’ websites and network infrastructure unless a ransom is paid before a given deadline. In the case of DDoS threats, prior to the ransom note, a small DDoS attack is usually launched as a form of demonstration. The demonstration attack is typically over UDP, lasting roughly 30-120 minutes.
The ransom note is typically sent to the common group email aliases of the company that are publicly available online such as noc@, support@, help@, legal@, abuse@, etc. In several cases, it has ended up in spam. In other cases, we’ve seen employees disregard the ransom note as spam, increasing the organization’s response time which resulted in further damage to their online properties.
Cloudflare’s recommendation for organizations that receive a threat or ransom note:
Do not panic, and we recommend you do not pay the ransom: Paying ransom only encourages and funds bad actors. There’s also no guarantee that you won’t be attacked again anyway.
Contact local law enforcement: Be ready to provide a copy of the ransom letter you received and any other logs or packet captures.
Activate an effective DDoS protection strategy: Cloud-based DDoS protection can be quickly onboarded in the event of an active threat, and with a team of security experts on your side, risks can be mitigated quickly and effectively.
Here’s a short video by Cloudflare CTO, John Graham-Cumming addressing the threat of ransom DDoS attacks.
Cloudflare protects Hypixel against a massive DDoS attack campaign
At Cloudflare, our teams have been exceptionally busy this past quarter rapidly onboarding (onto our Magic Transit service) a multitude of new and existing customers that have either received a ransom letter or were under an active DDoS attack.
One such customer is Hypixel Inc, the development studio behind the world’s largest Minecraft minigame server. With over 24M total unique logins to date and a world record 216,000+ concurrent players on PC, the Hypixel team works hard to add value to the experience of millions of players across the globe.
The gaming industry is often subject to some of the largest volumetric DDoS attacks — and as a marquee brand, Hypixel attracts more than its fair share. Uptime and high performance are fundamental to the functioning of Hypixel’s servers. Any perceived downtime or noticeable lag could result in an exodus of gamers.
When Hypixel was under a massive DDoS attack campaign, they turned to Cloudflare to extend their services with Cloudflare to include Magic Transit, Cloudflare’s BGP-based DDoS protection service for network infrastructure. After rapidly onboarding them overnight, Cloudflare was automatically able to detect and mitigate DDoS attacks targeting their network — several of which were well over 620 Gbps. The DDoS attack comprised mostly TCP floods and UDP amplification attacks. In the graph, the various colors represent the multiple Cloudflare systems that contribute to detecting and mitigating the multi-vector attack — emphasising the value of our multi-layered DDoS approach.
Even as attack patterns changed in real-time, Magic Transit shielded Hypixel’s network. In fact, because all their clean traffic routed over Cloudflare’s high performing low-latency network, Hypixel’s users noticed no change in gamer experience — even during an active volumetric DDoS attack.
During the attack campaign, Cloudflare automatically detected and mitigated over 5,000 DDoS attacks: 53% were ACK floods, 39% were UDP-based attacks and 8% SYN floods.
“We had several attacks of well over 620 Gbps with no impact at all on our players. Their gaming experience remained uninterrupted and fast, thanks to Cloudflare Magic Transit.” – Simon Collins-Laflamme, CEO, Hypixel Inc.
Hypixel’s journey with Cloudflare began with them employing Cloudflare Spectrum to help protect their gaming infrastructure against DDoS attacks. As their user base grew, they adopted additional Cloudflare products to bolster the robustness and resilience of all of their critical infrastructure. Today, they use multiple Cloudflare products including CDN, Rate Limiting, Spectrum, Argo Smart Routing, and Load Balancing to build and secure infrastructure that provides gamers around the world the real-time gaming experiences they need.
Get holistic protection against cyber attacks of any kind
DDoS attacks constitute just one facet of the many cyber threats organizations are facing today. As businesses shift to a Zero Trust approach, network and security buyers will face larger threats related to network access, and a continued surge in the frequency and sophistication of bot-related and ransomware attacks.
A key design tenet while building products at Cloudflare is integration. Cloudflare One is a solution that uses a Zero Trust security model to provide companies a better way to protect devices, data, and applications — and is deeply integrated with our existing platform of security and DDoS solutions.
In fact, Cloudflare offers an integrated solution that comprises an all-star cast featuring the following to name a few:
DDoS: LEADER in Forrester Wave™ for DDoS Mitigation Solutions, Q1 20211
WAF: Cloudflare is a CHALLENGER in the 2020 Gartner Magic Quadrant for Web Application Firewall (receiving the highest placement in the ‘Ability to Execute’)2
Zero Trust: Cloudflare is a LEADER in the Omdia Market Radar: Zero-Trust Access Report, 20203
Web protection: Innovation leader in the Global Holistic Web Protection Market for 2020 by Frost & Sullivan4
Cloudflare’s global (and growing) network is uniquely positioned to deliver DDoS protection and other security, performance, and reliability services with unparalleled scale, speed, and smarts.
To provide the best experiences, we use technologies like cookies to store and/or access device information. Consenting to these technologies will allow us to process data such as browsing behavior or unique IDs on this site. Not consenting or withdrawing consent, may adversely affect certain features and functions.
Functional
Always active
The technical storage or access is strictly necessary for the legitimate purpose of enabling the use of a specific service explicitly requested by the subscriber or user, or for the sole purpose of carrying out the transmission of a communication over an electronic communications network.
Preferences
The technical storage or access is necessary for the legitimate purpose of storing preferences that are not requested by the subscriber or user.
Statistics
The technical storage or access that is used exclusively for statistical purposes.The technical storage or access that is used exclusively for anonymous statistical purposes. Without a subpoena, voluntary compliance on the part of your Internet Service Provider, or additional records from a third party, information stored or retrieved for this purpose alone cannot usually be used to identify you.
Marketing
The technical storage or access is required to create user profiles to send advertising, or to track the user on a website or across several websites for similar marketing purposes.


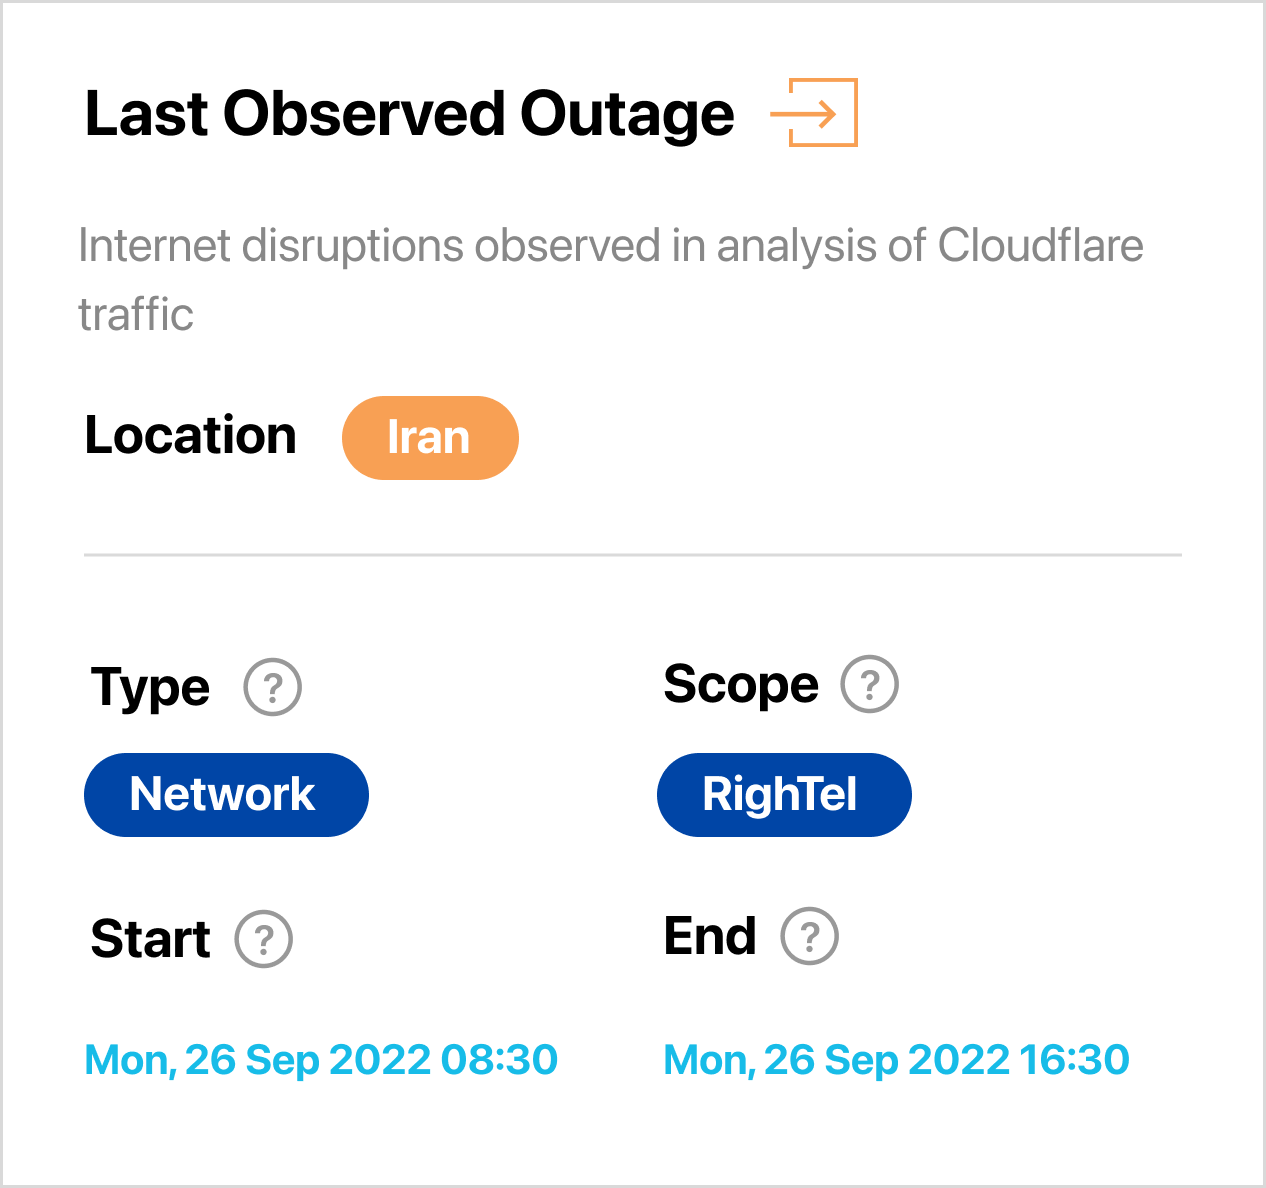
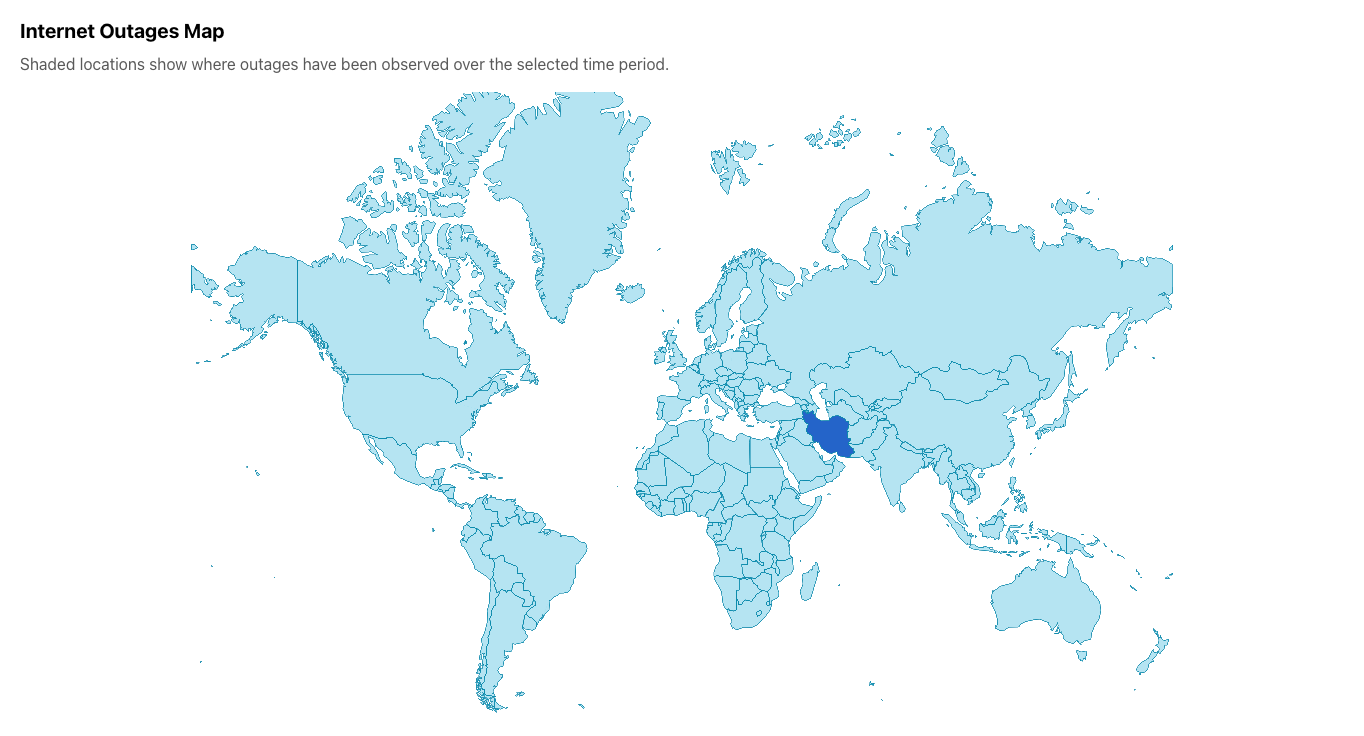
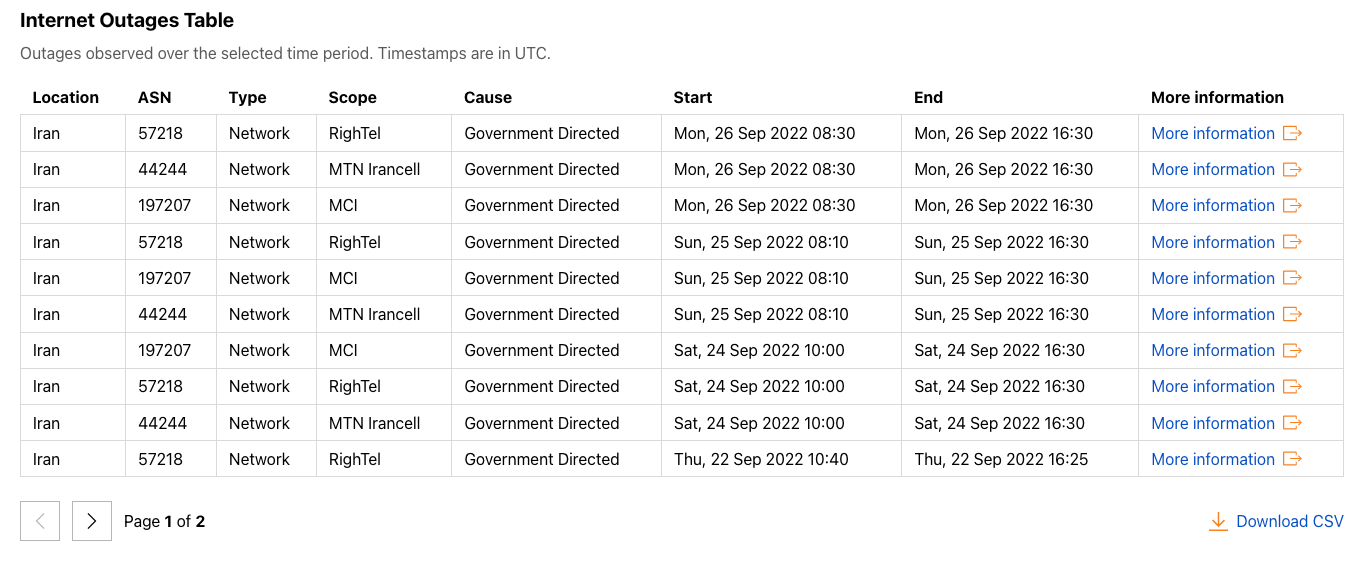
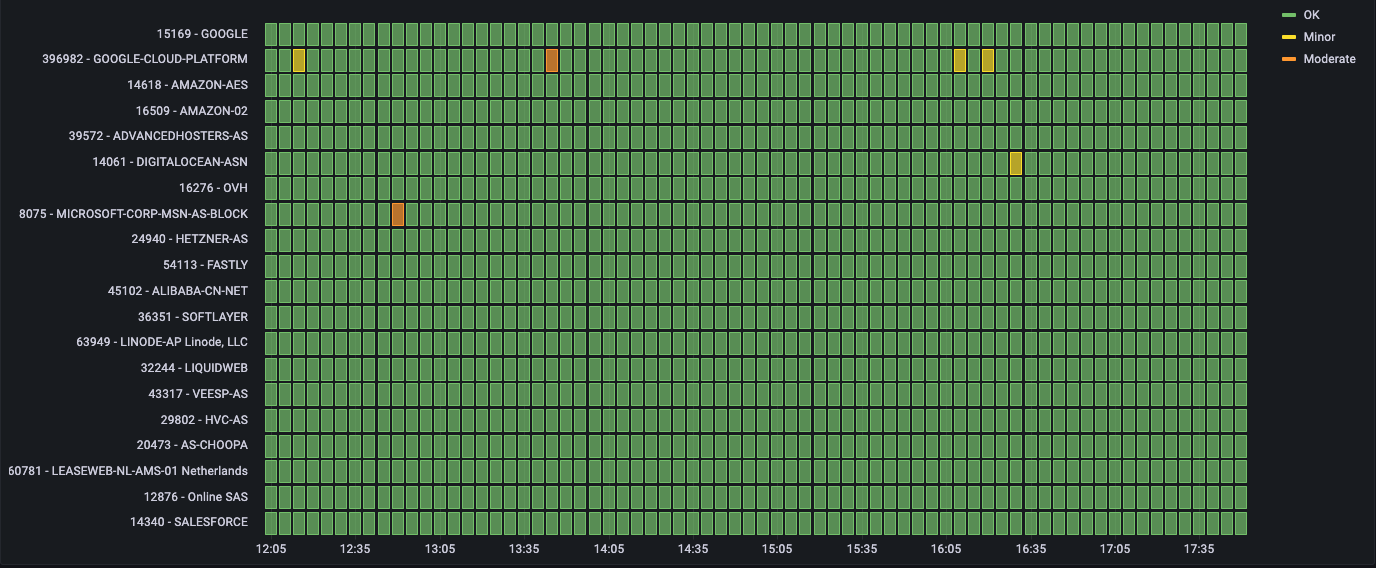


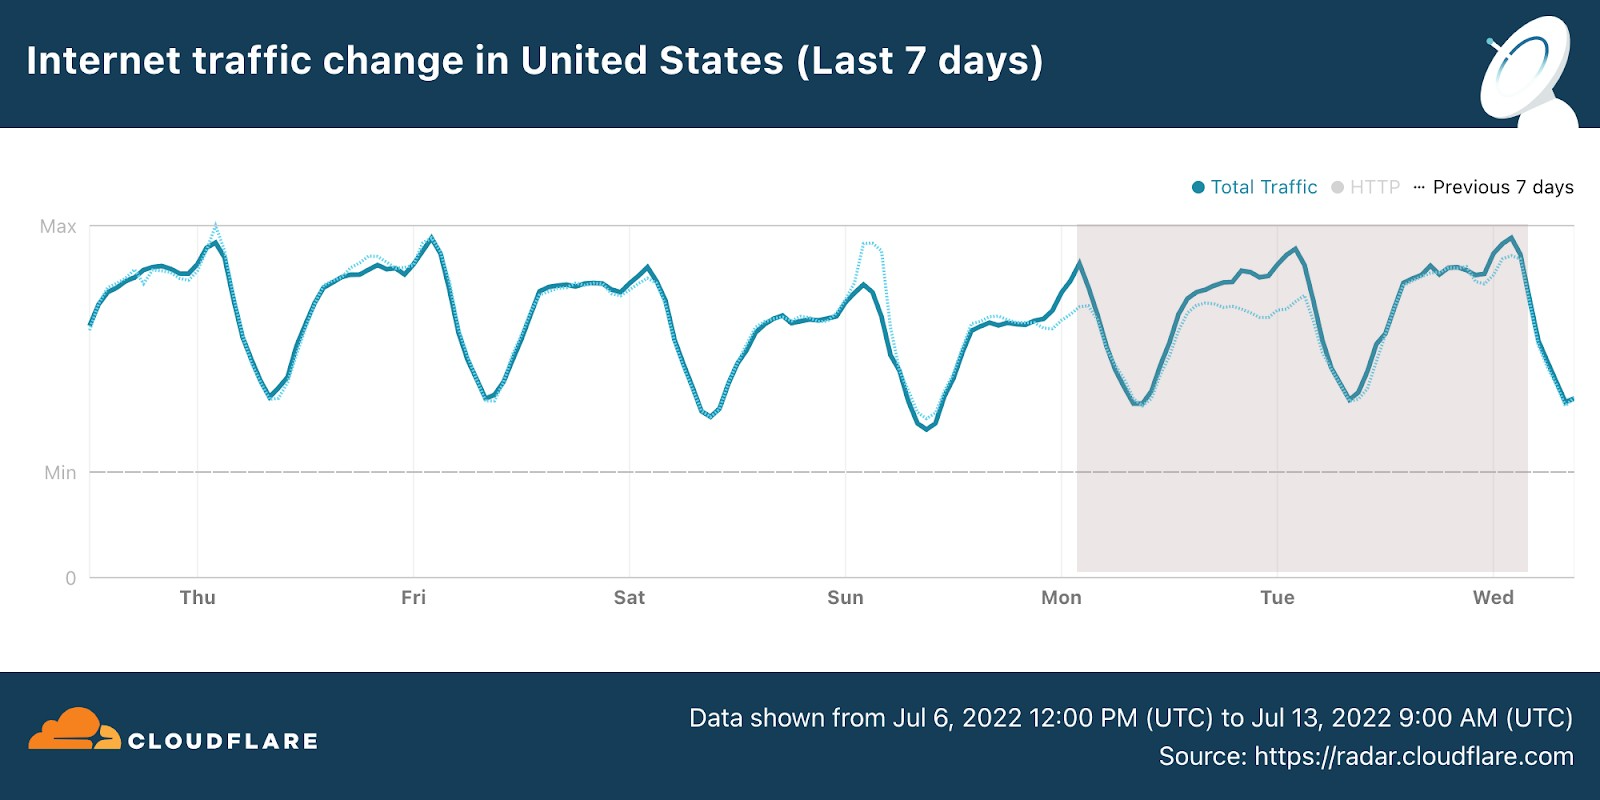
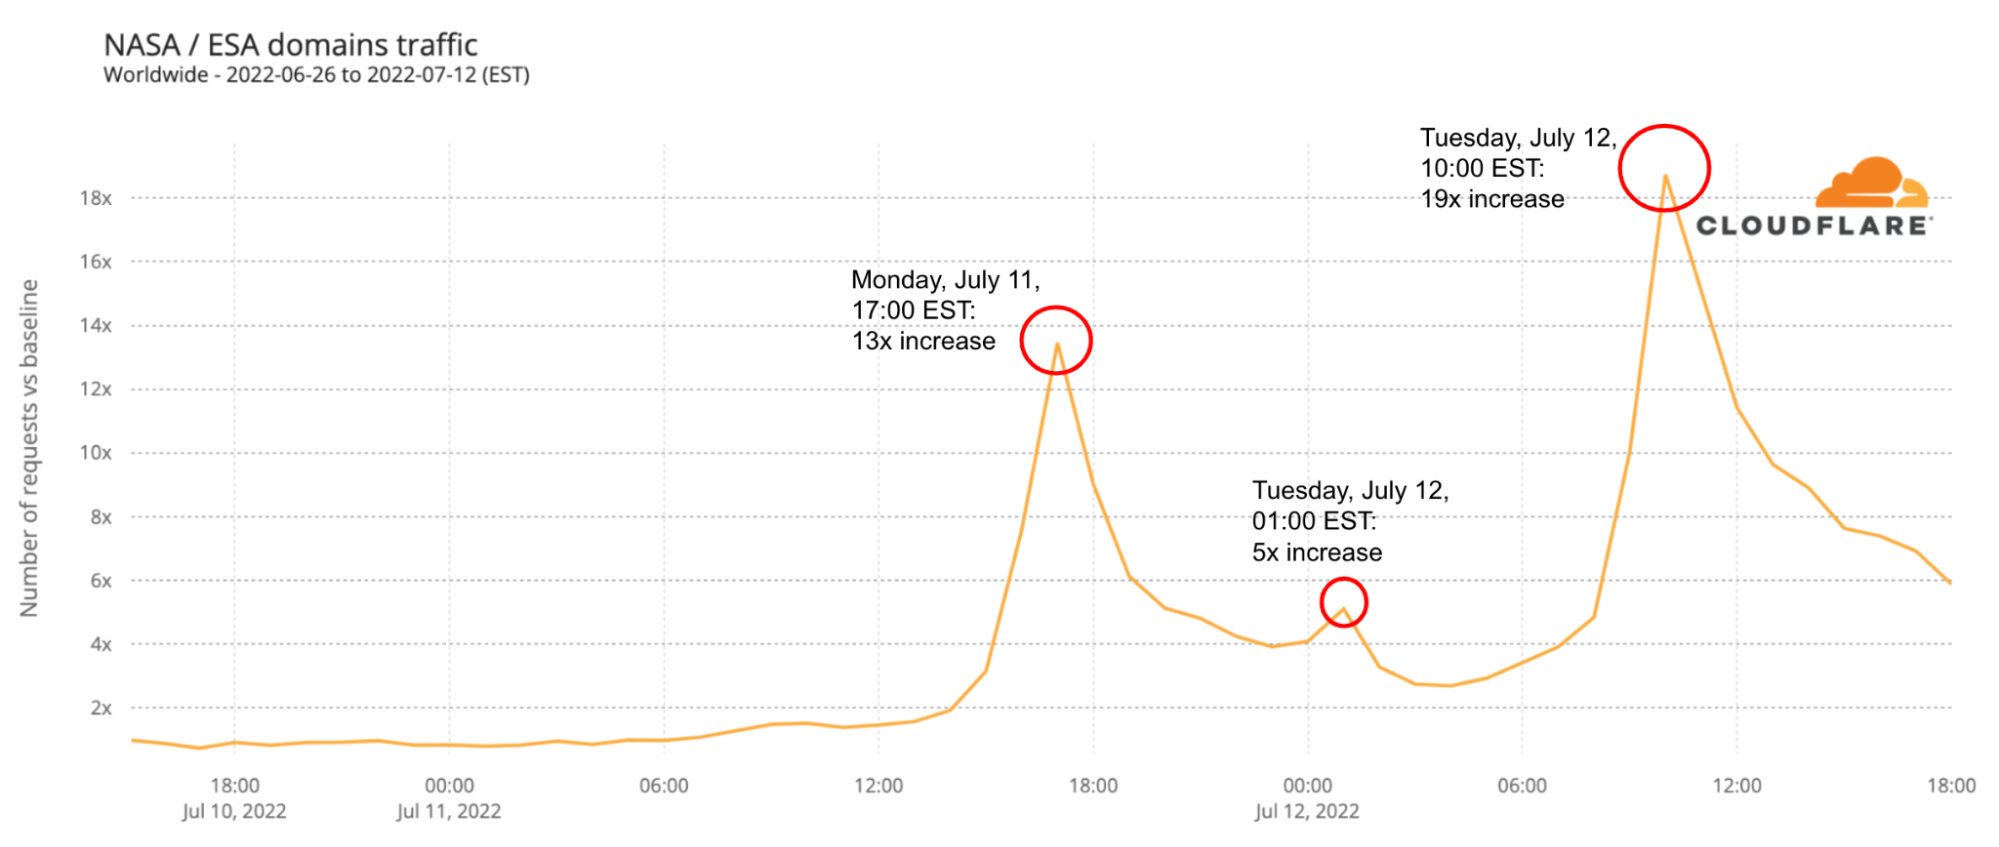
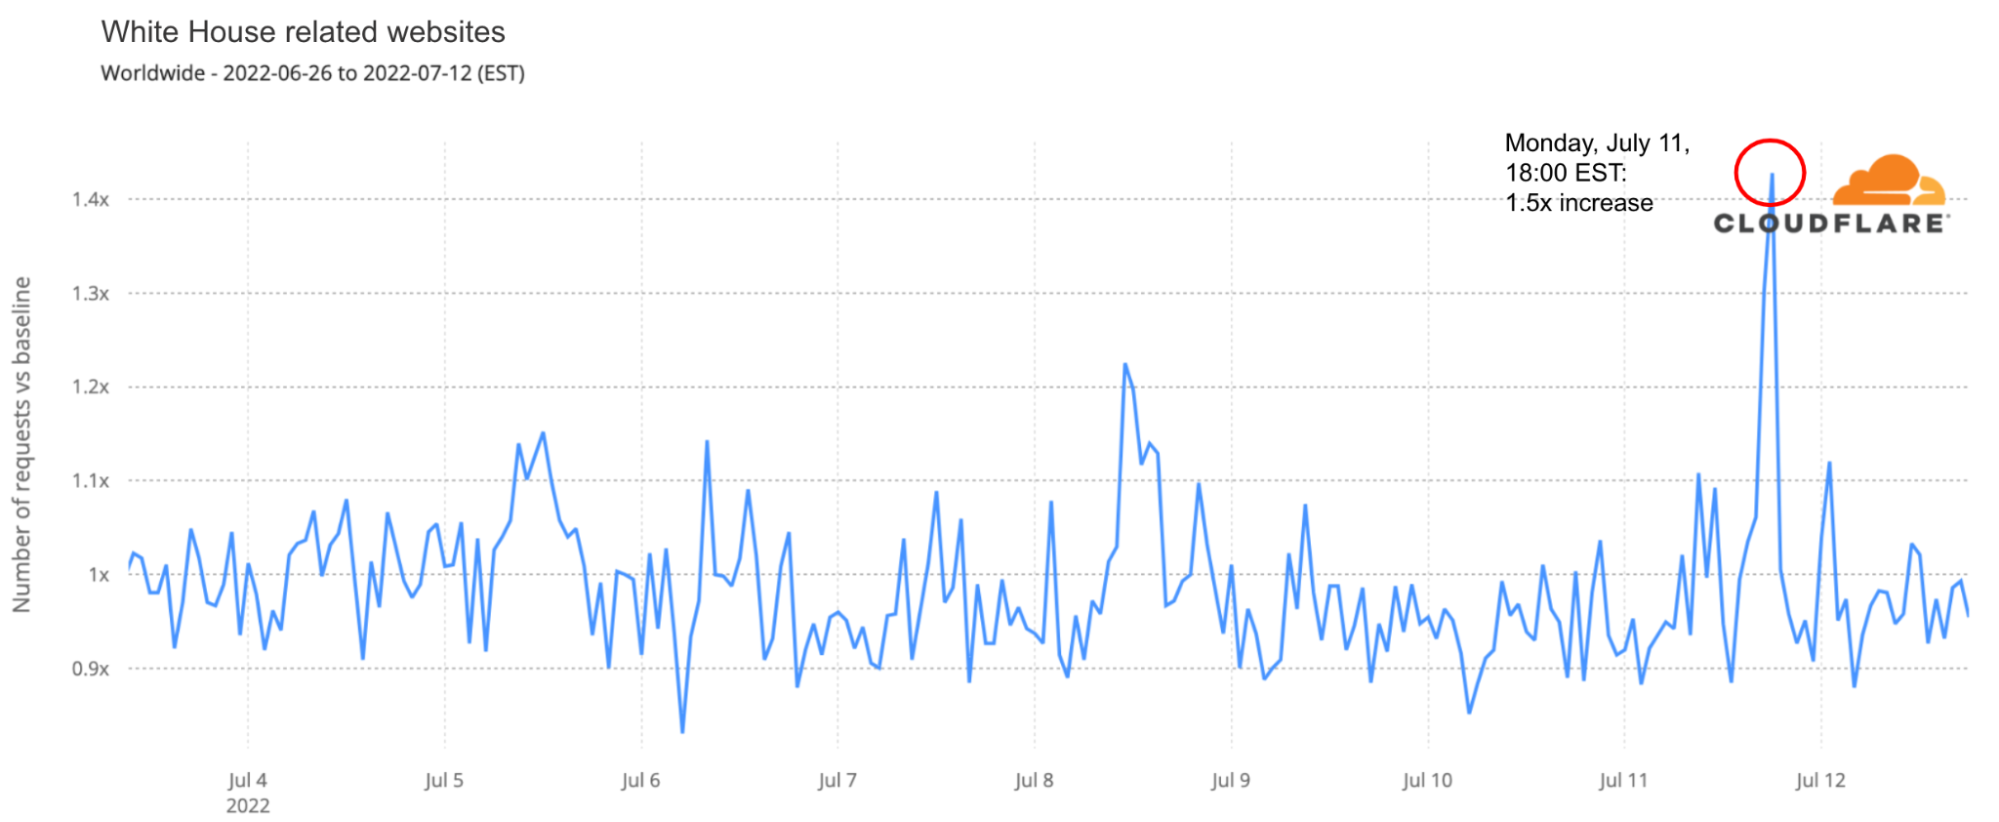


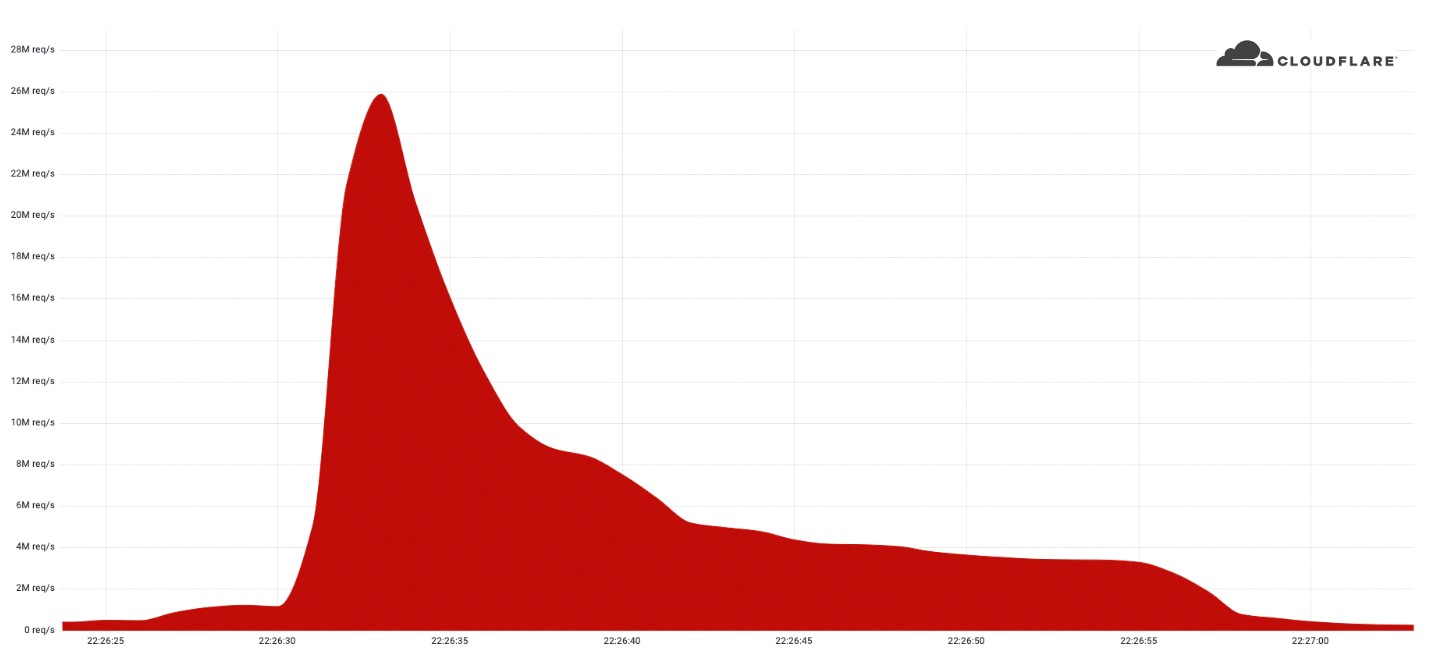
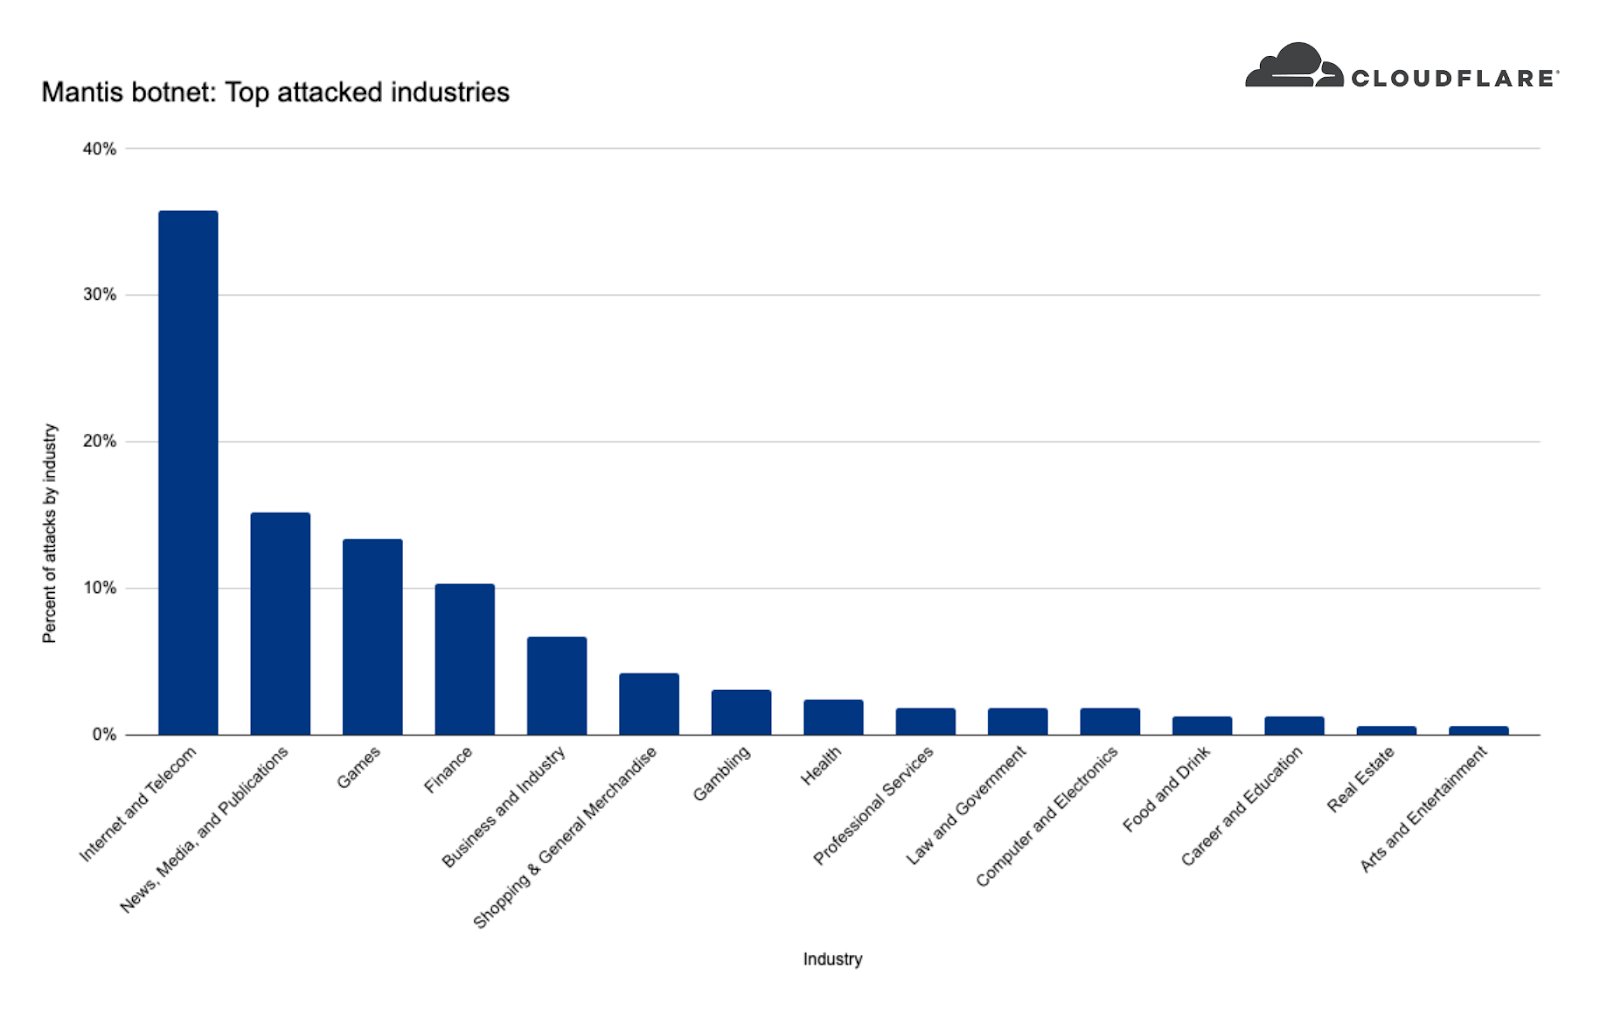
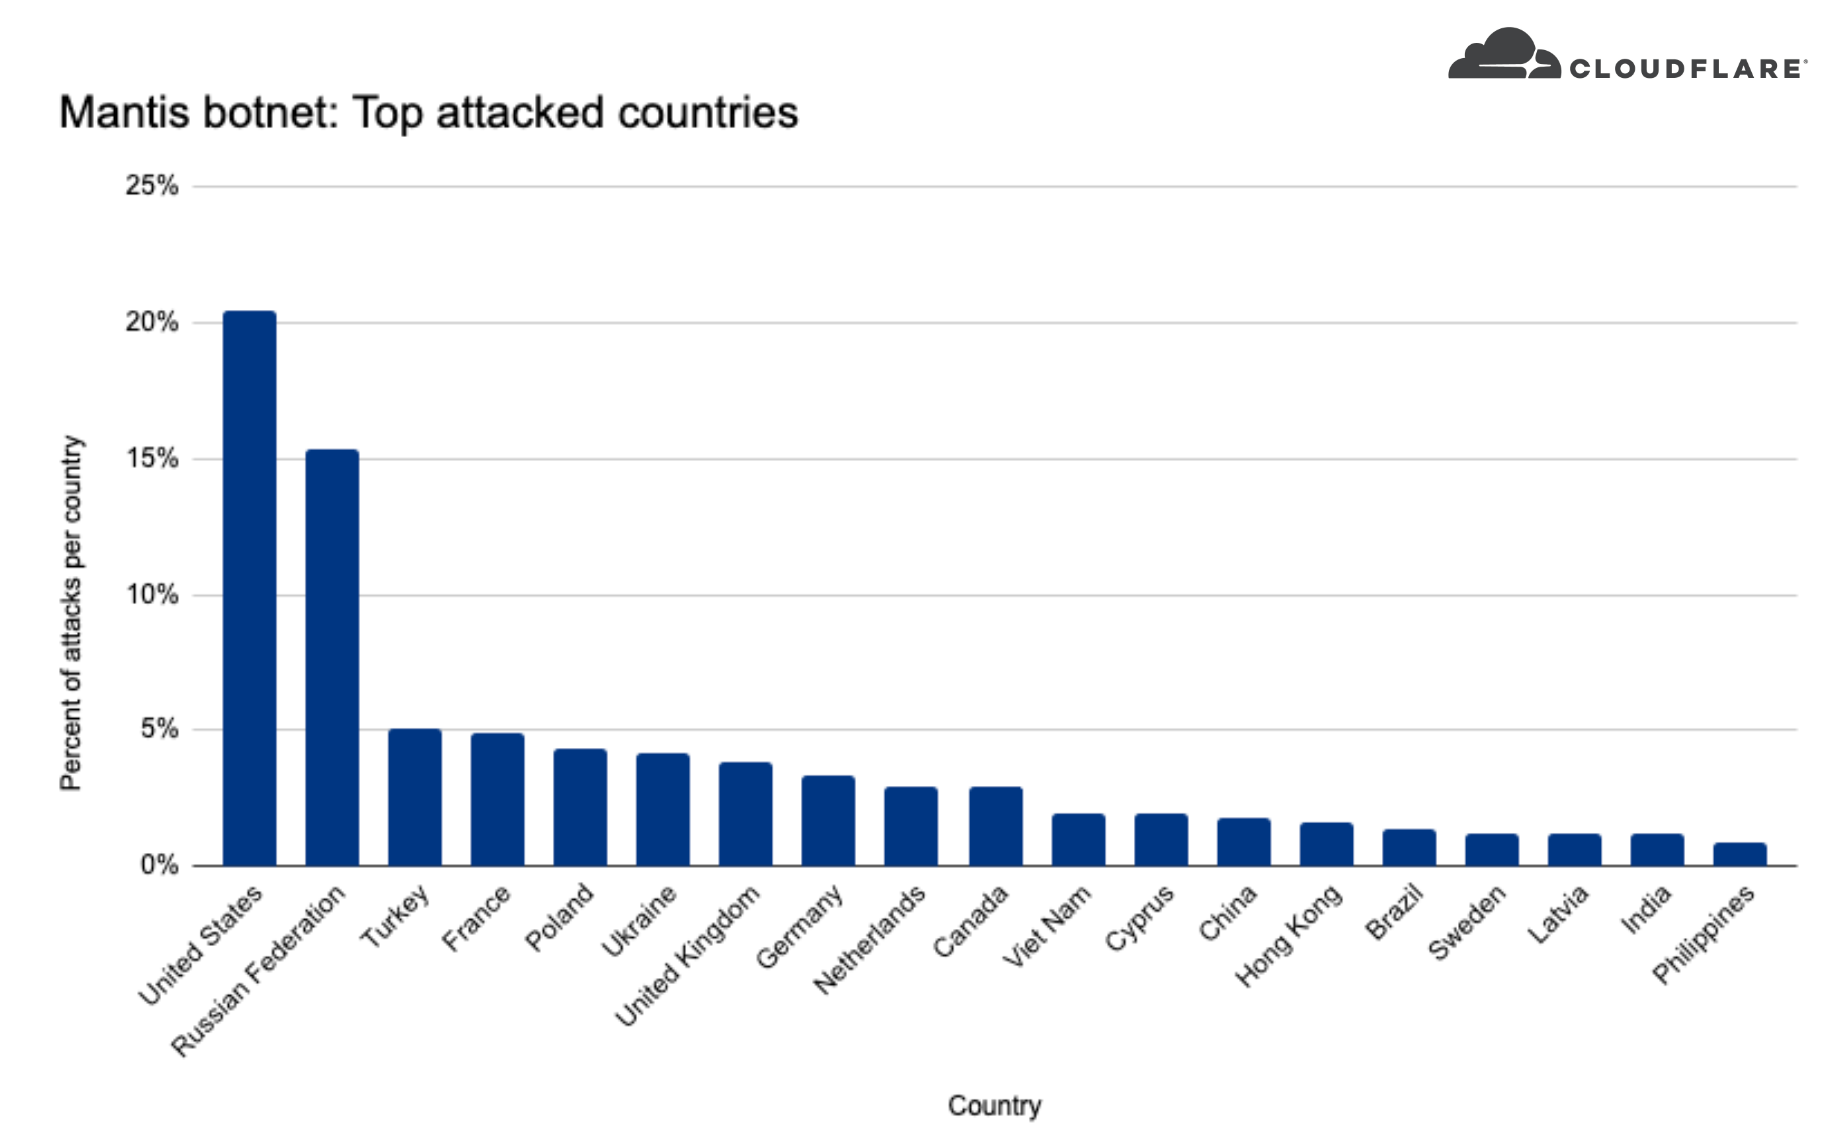


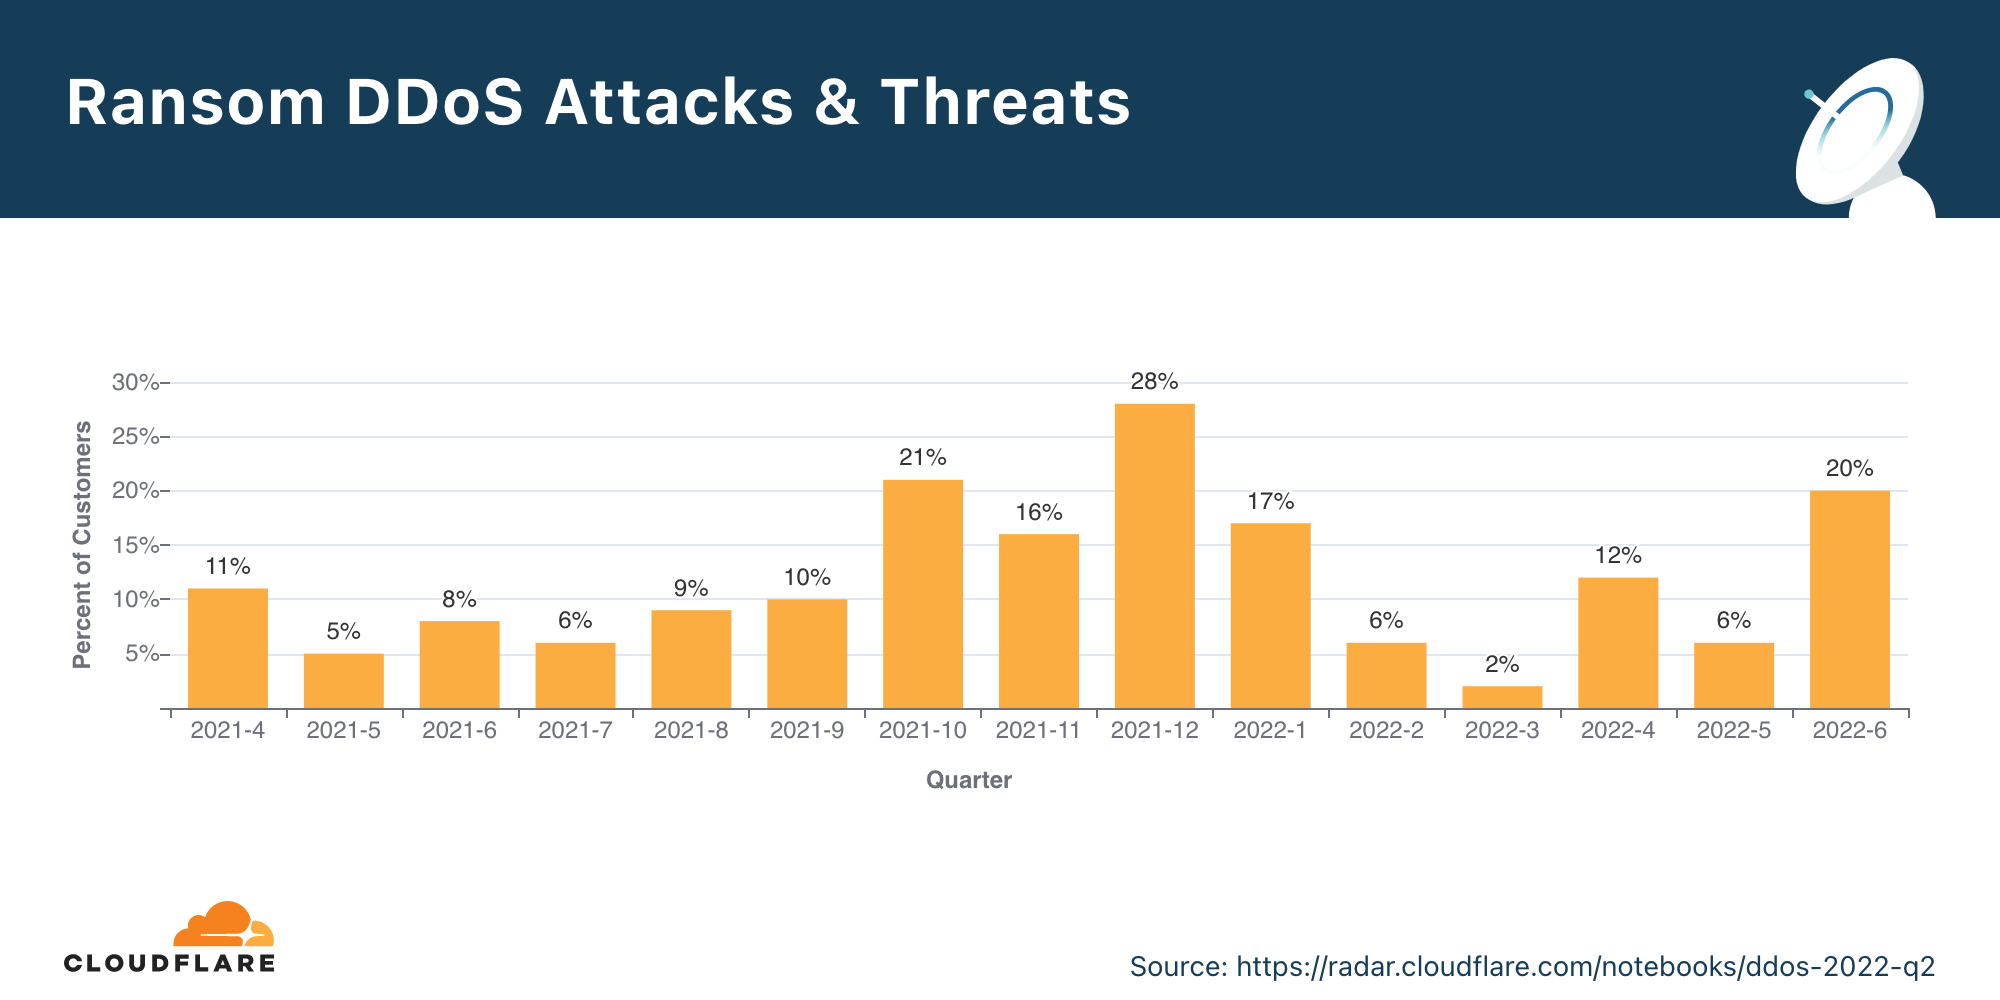

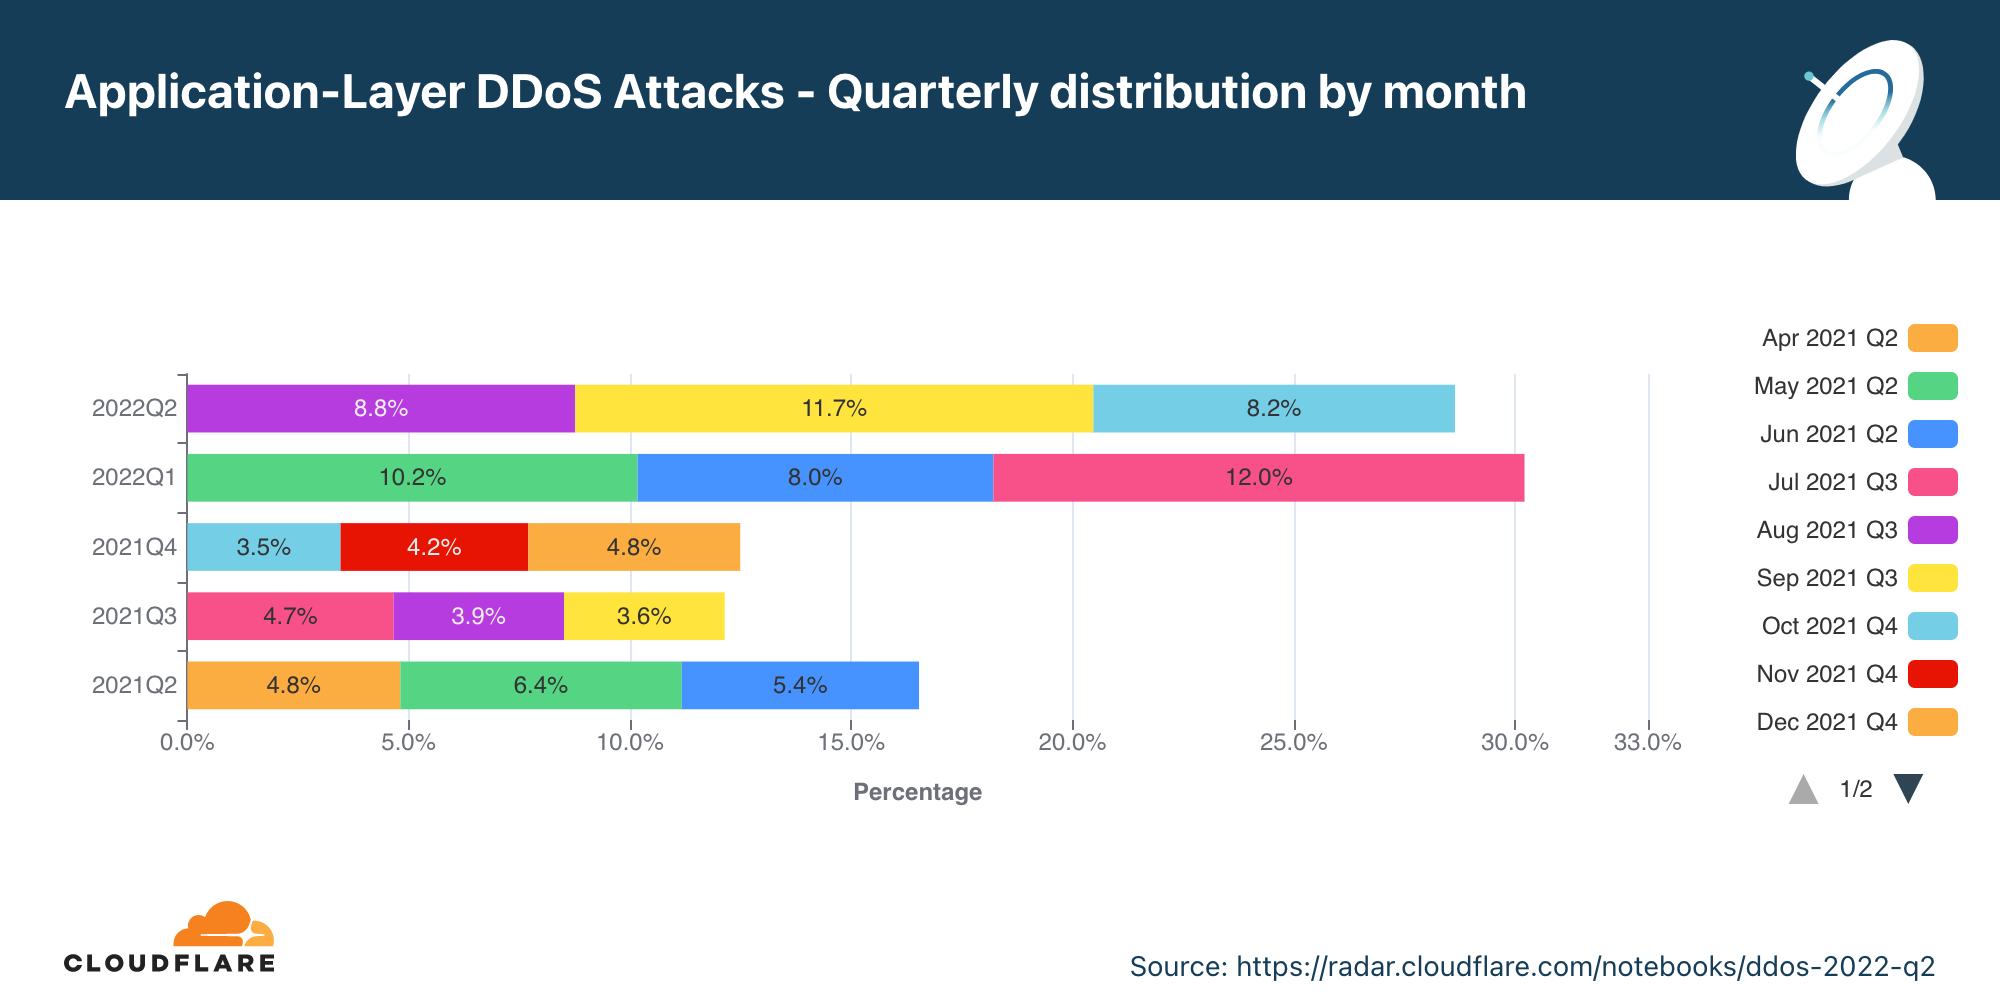
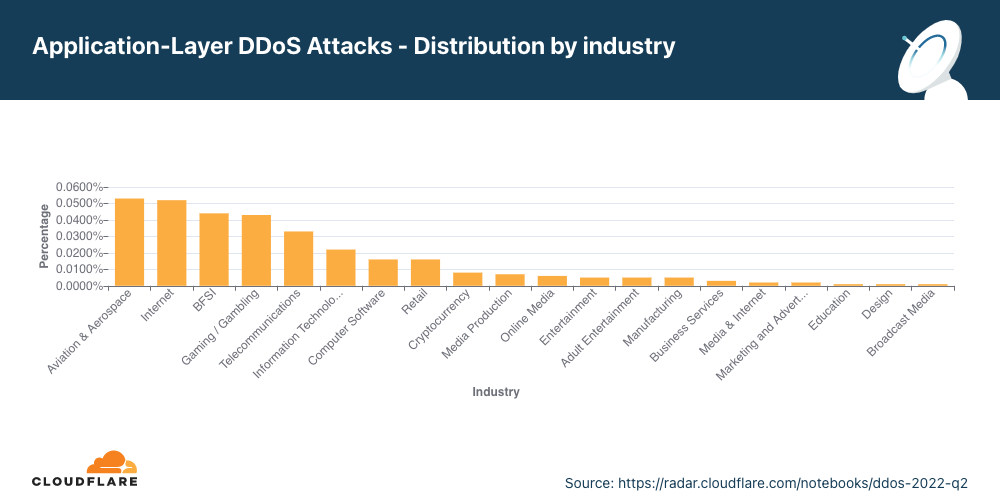
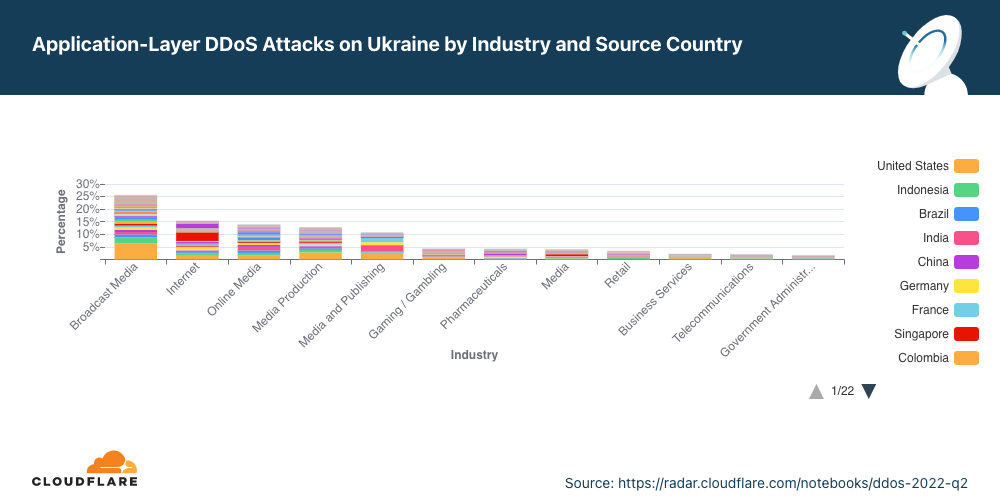
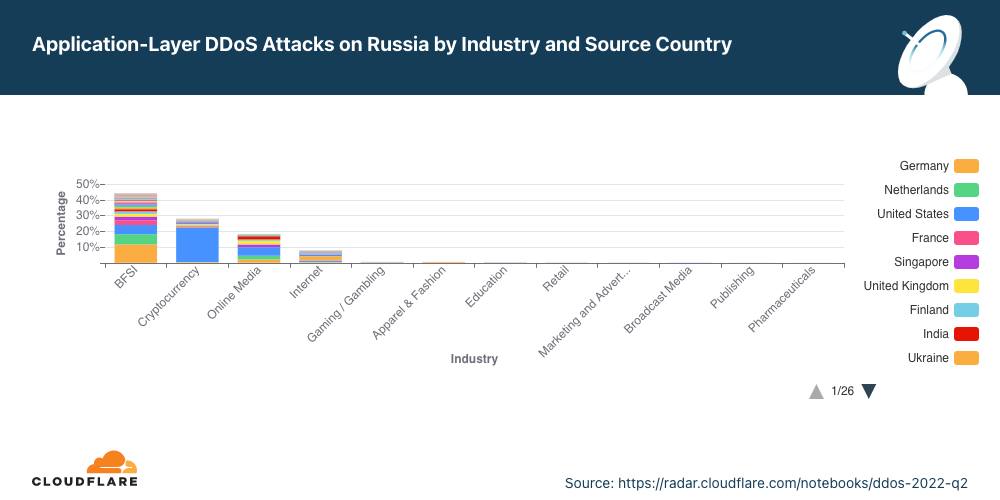
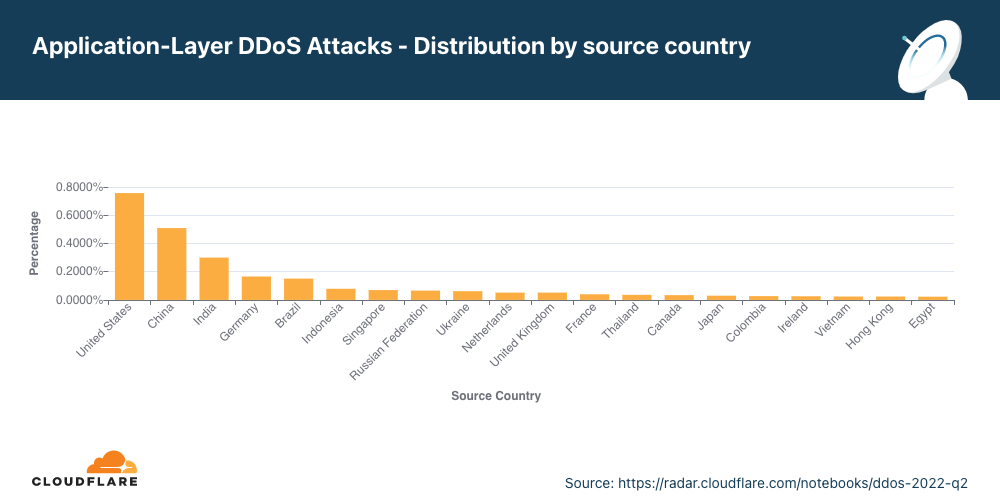
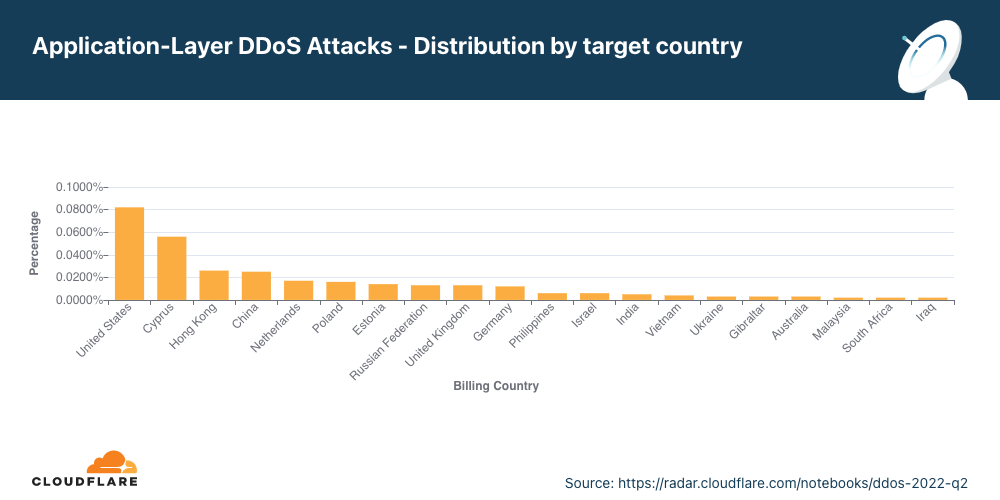
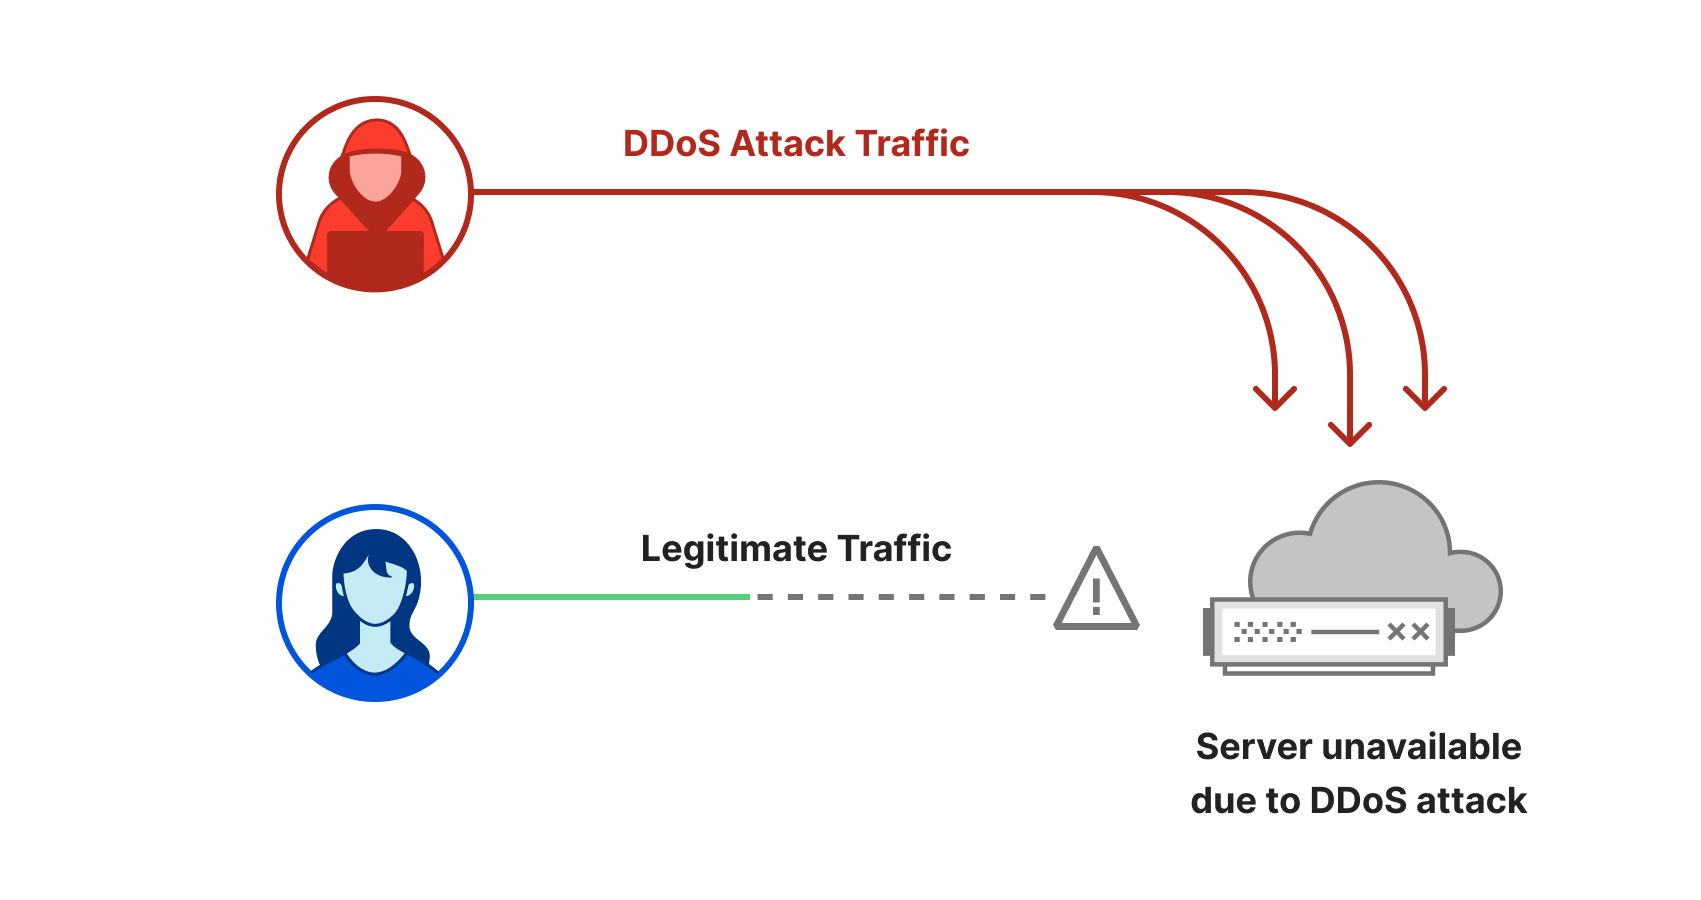
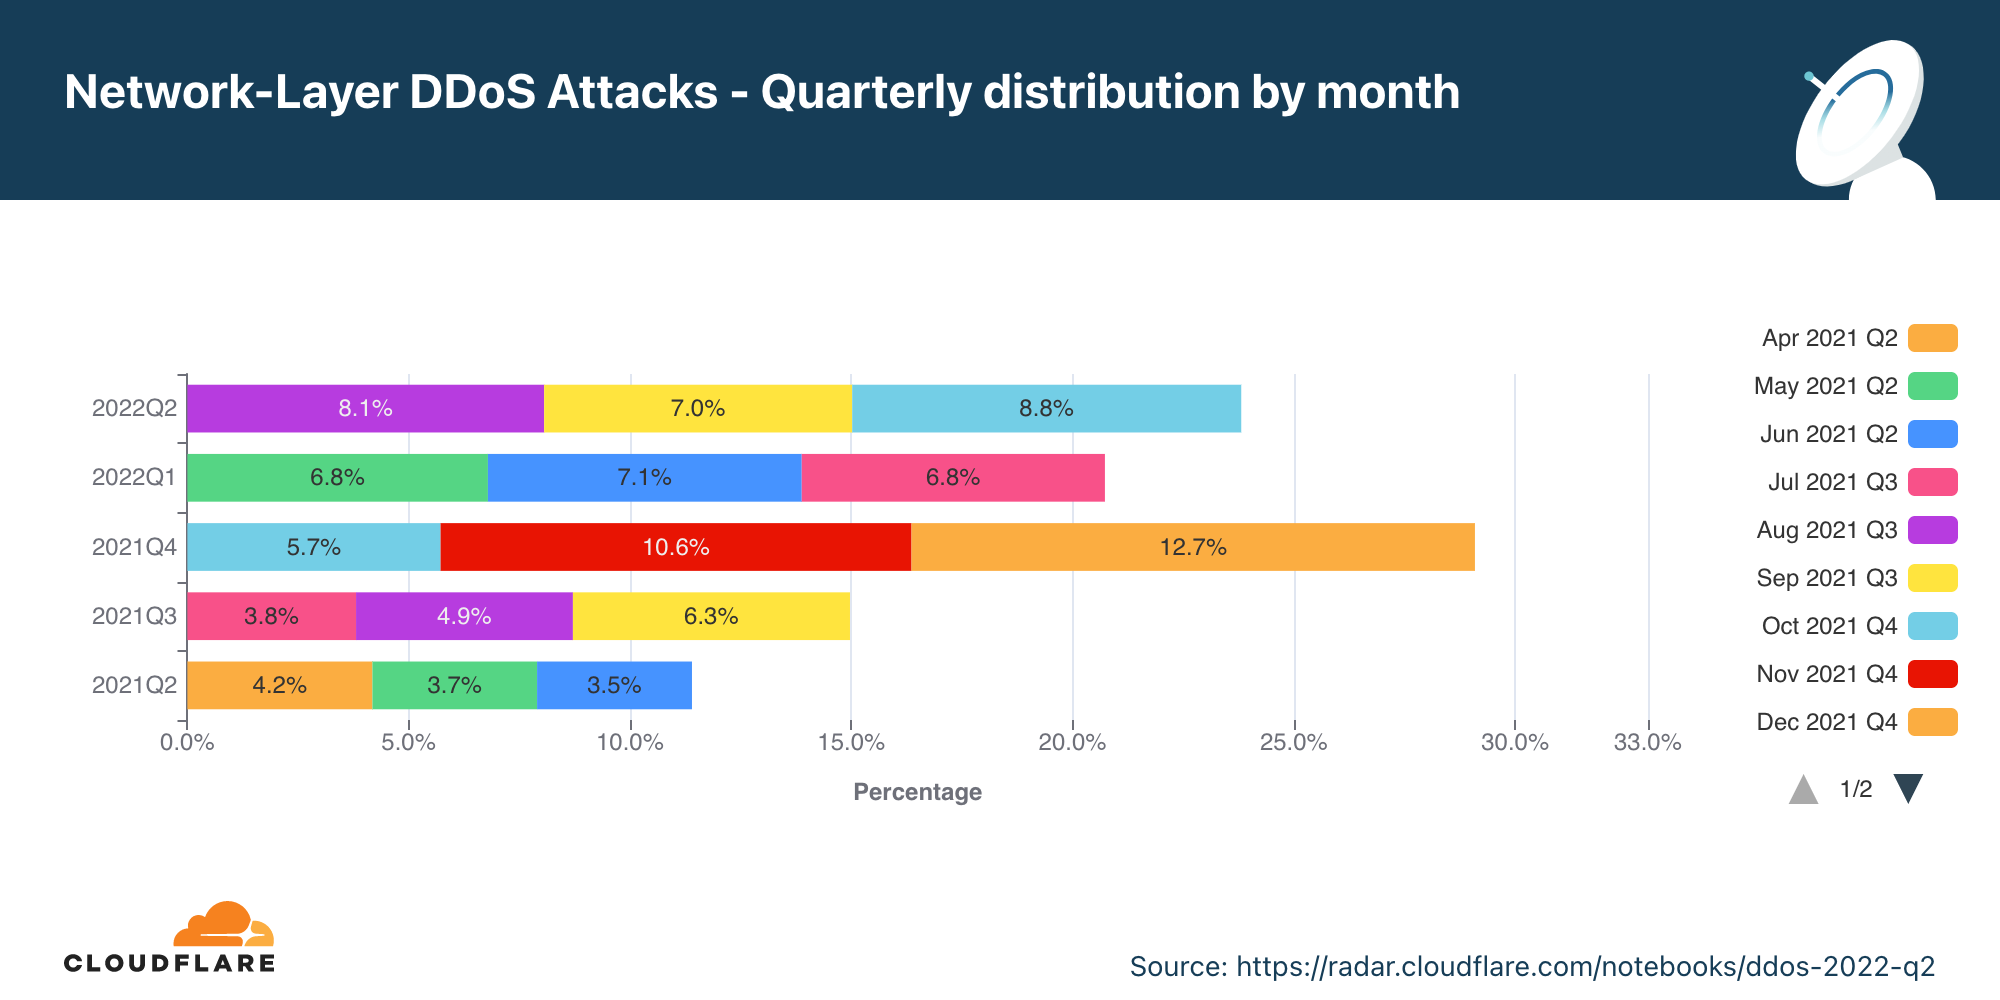
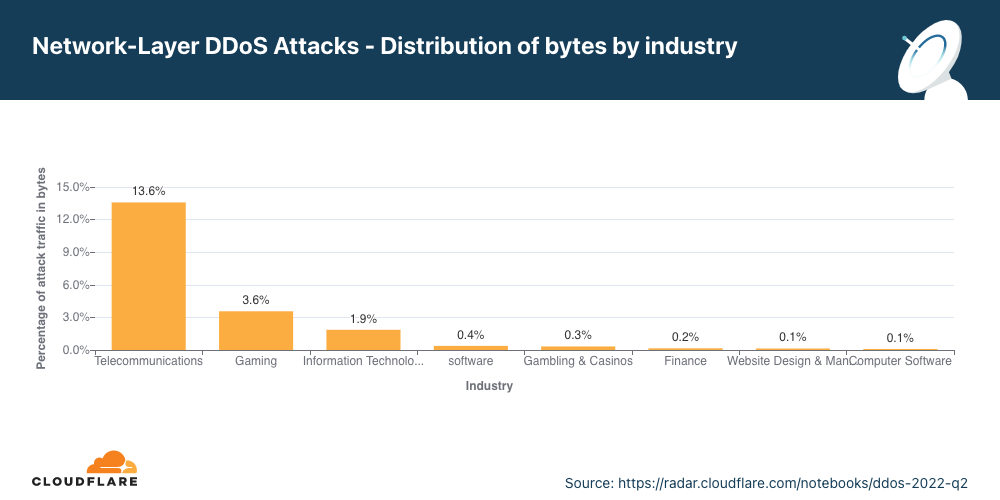
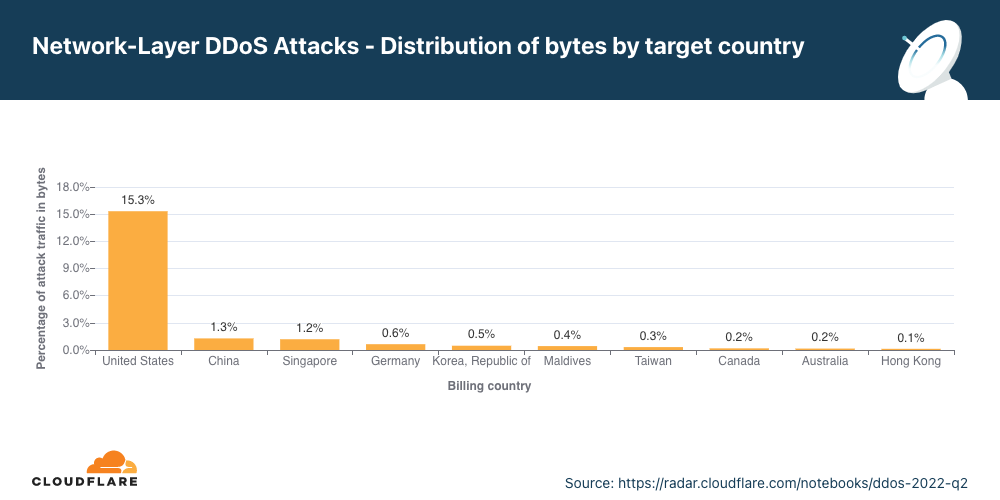
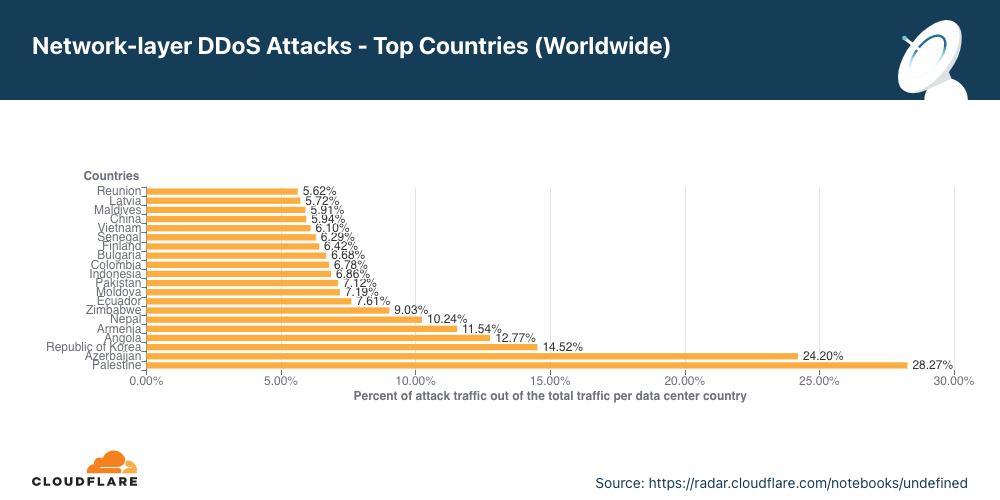
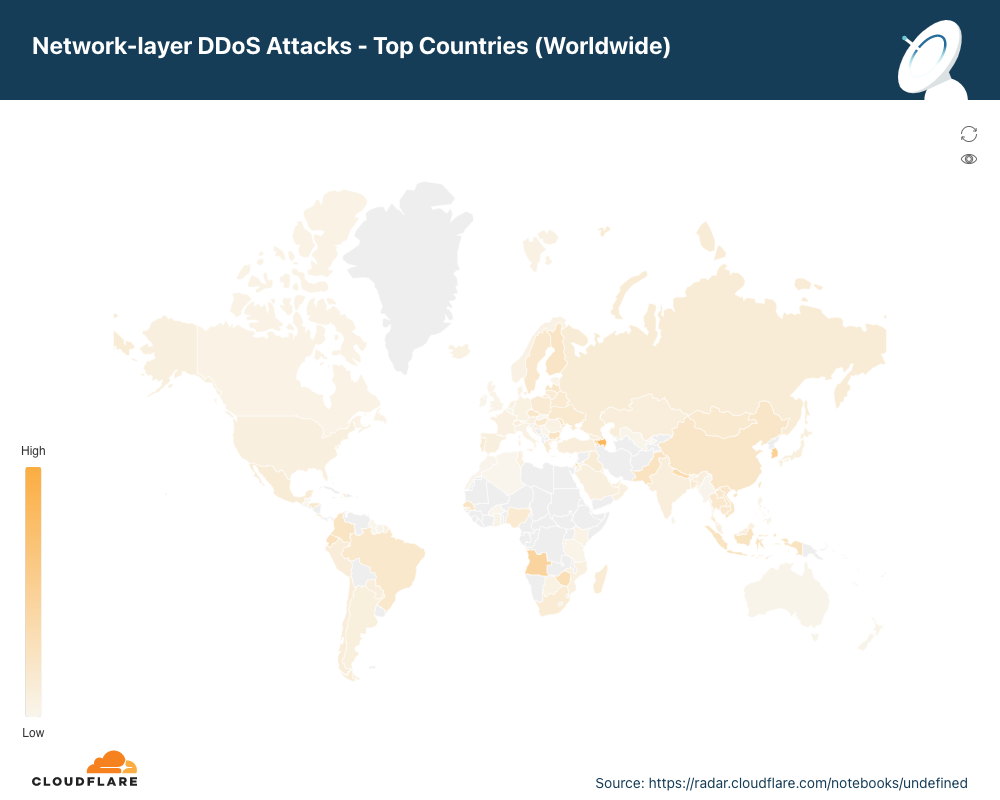
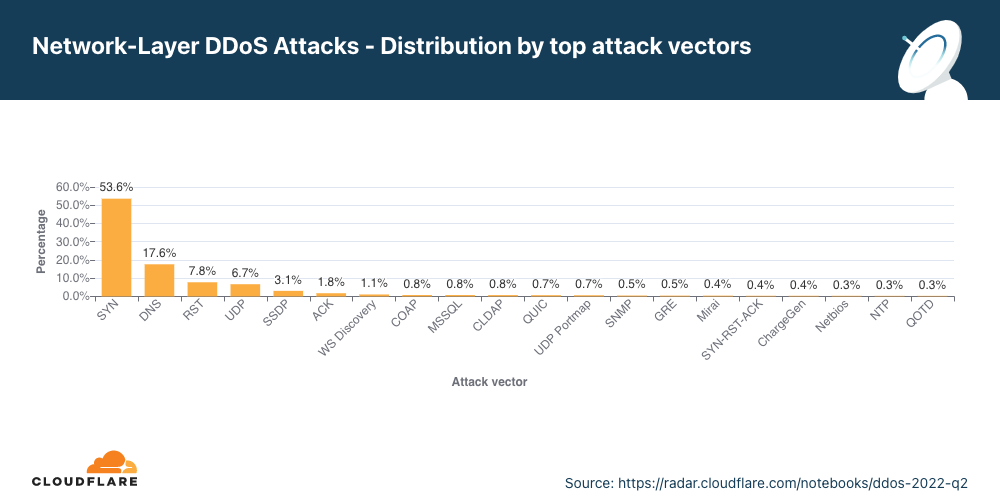
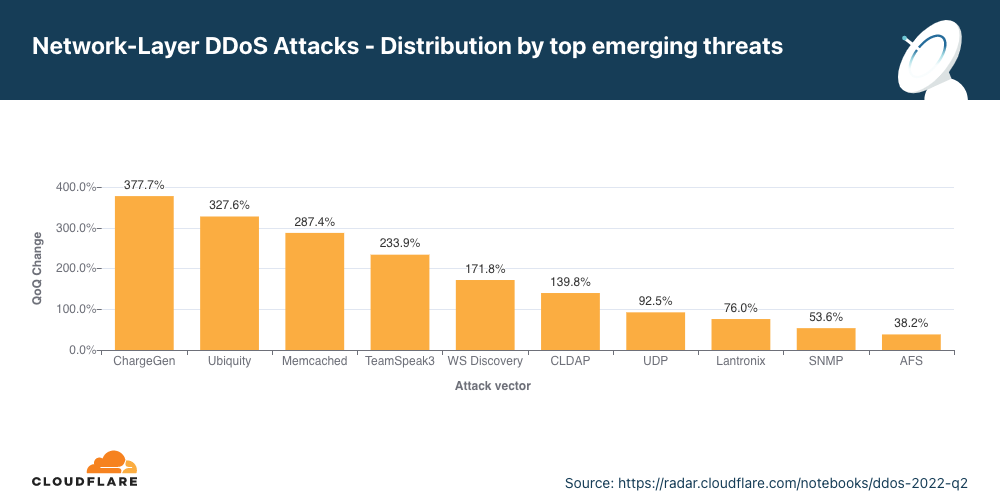
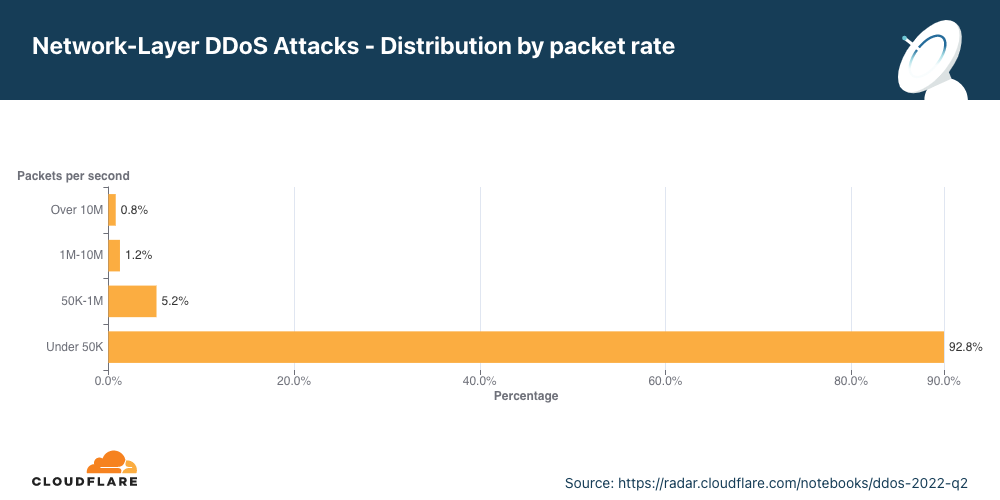
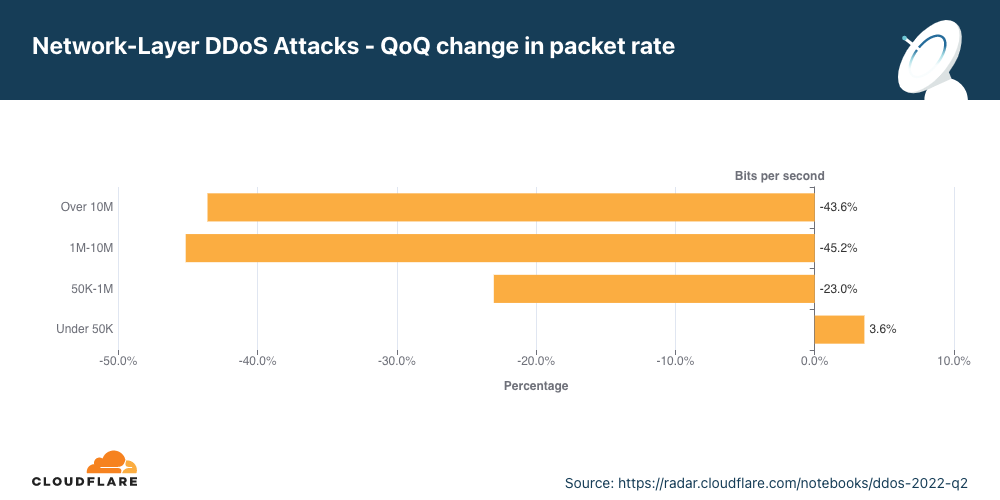
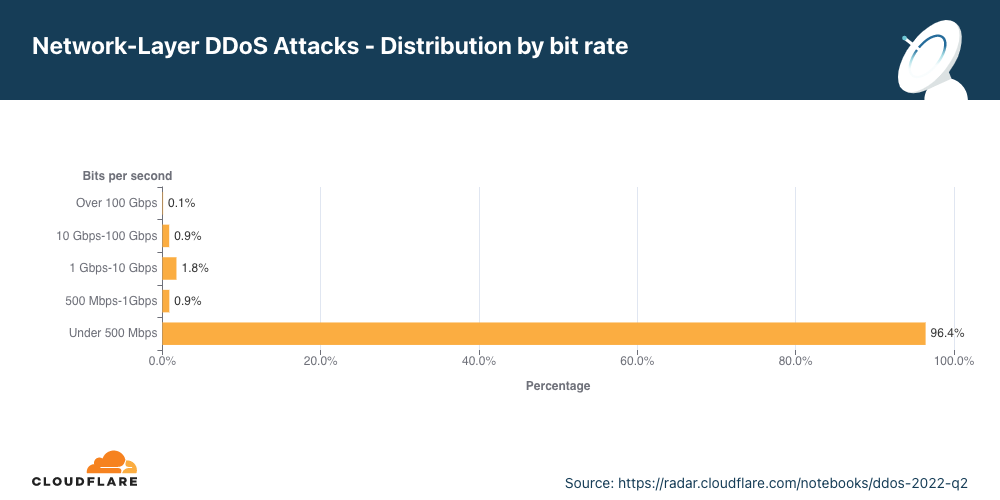
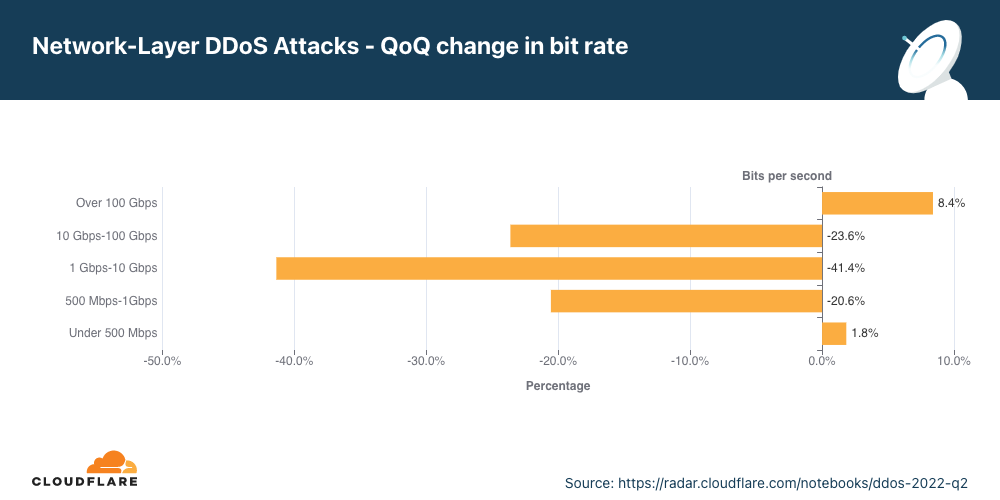
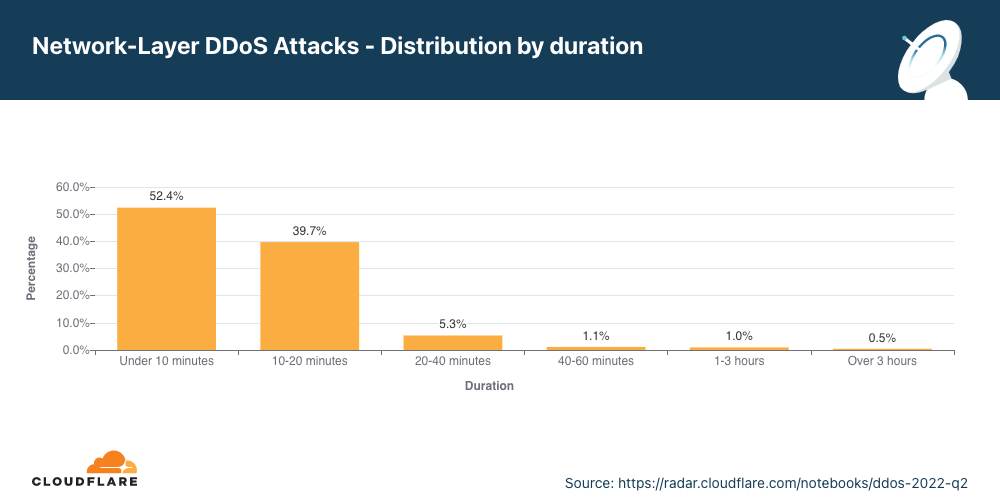
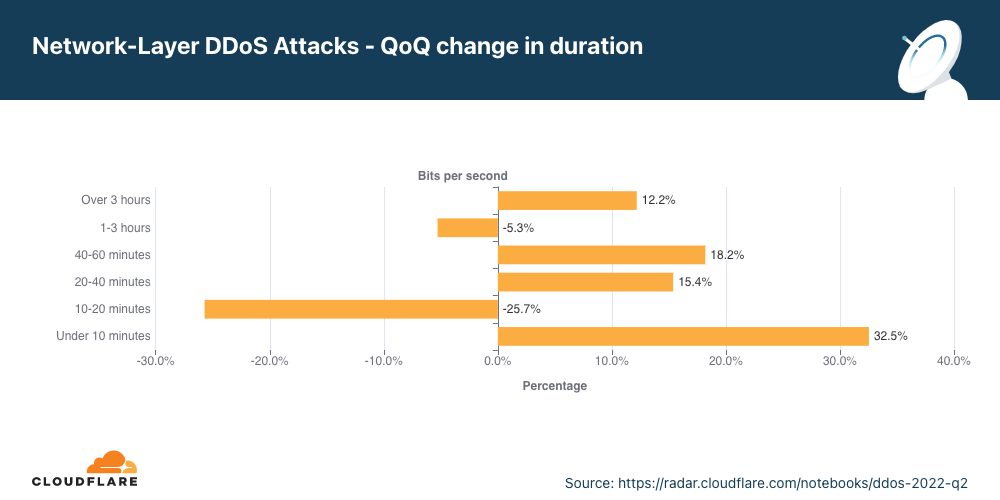
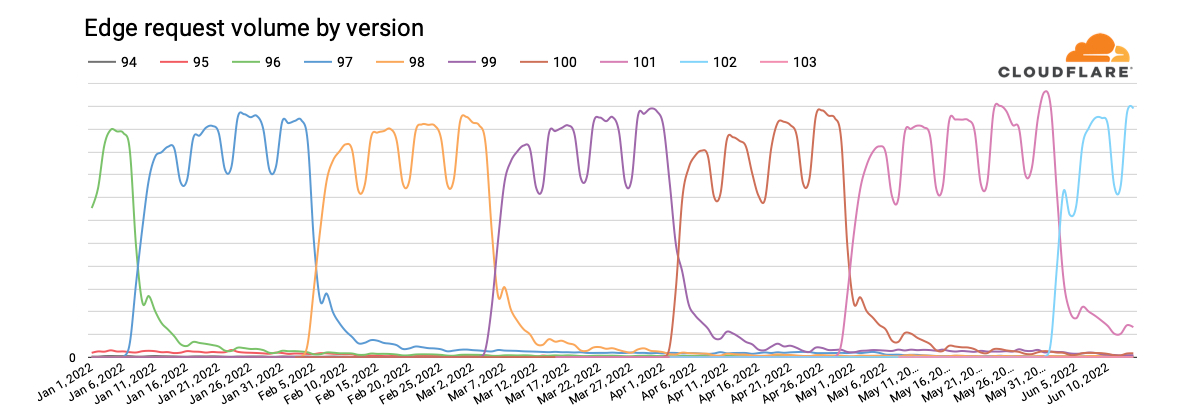
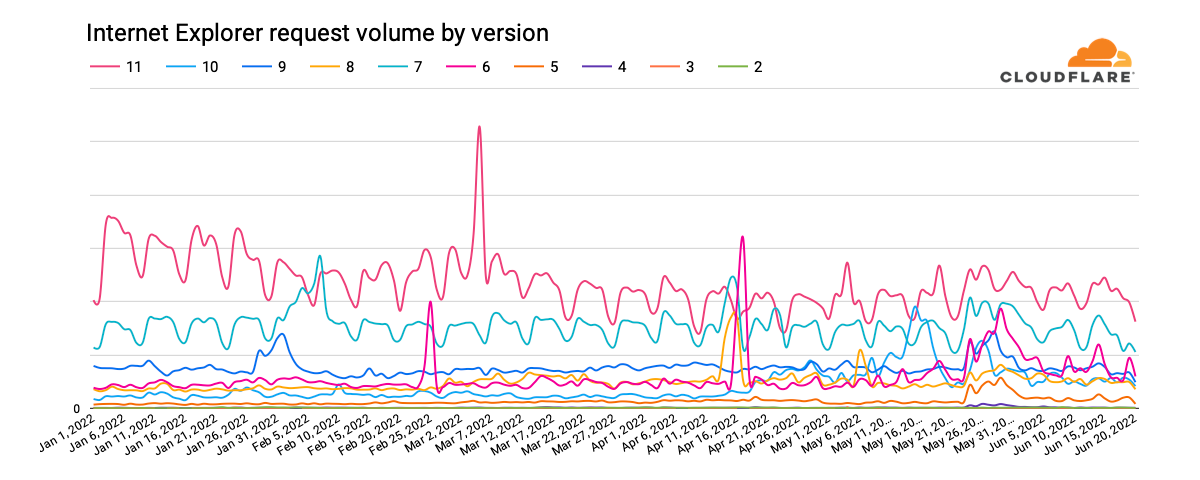
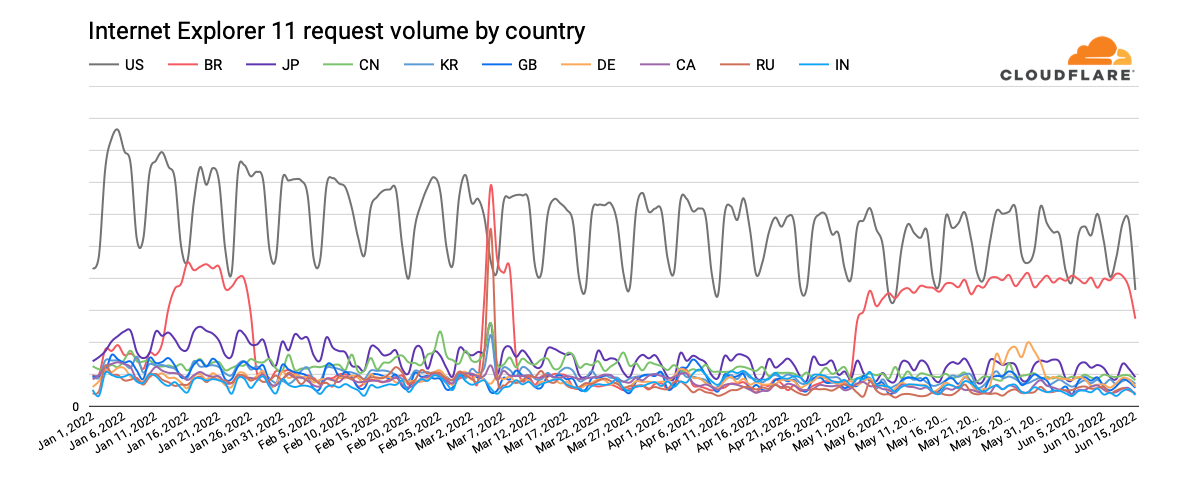
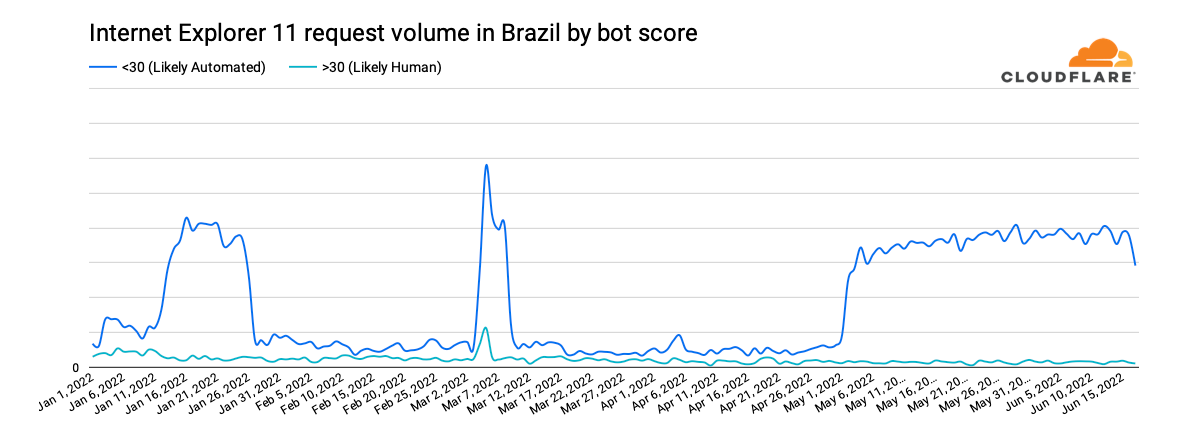
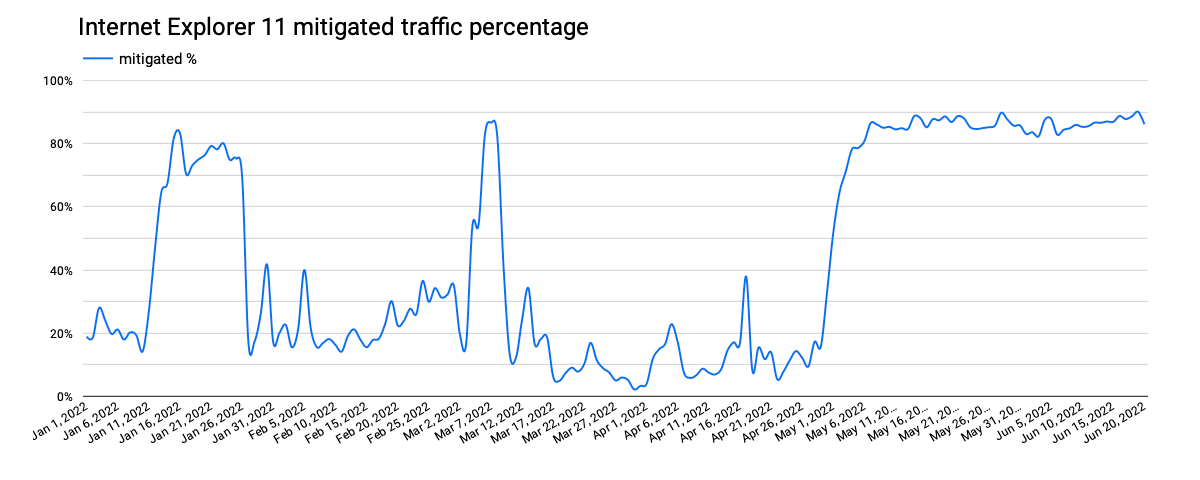
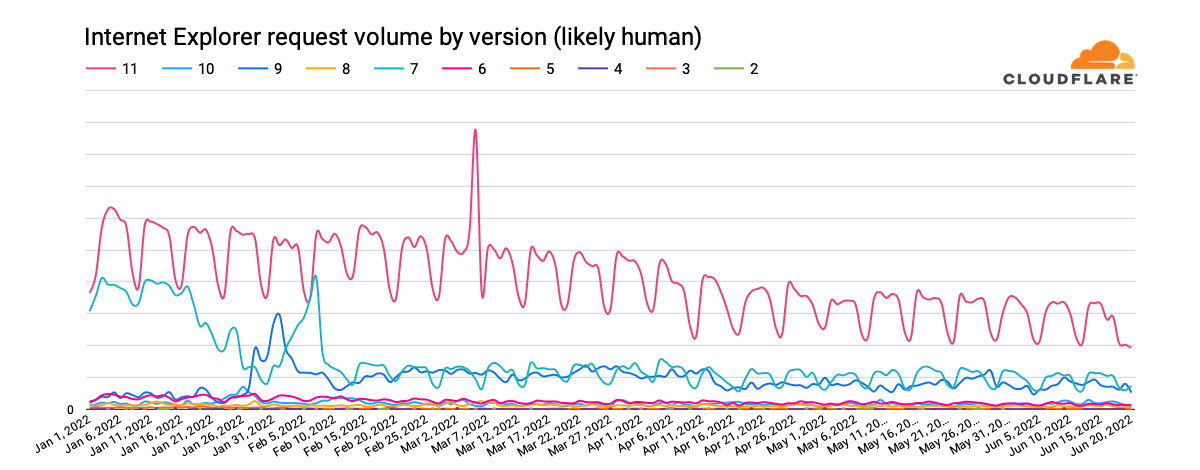
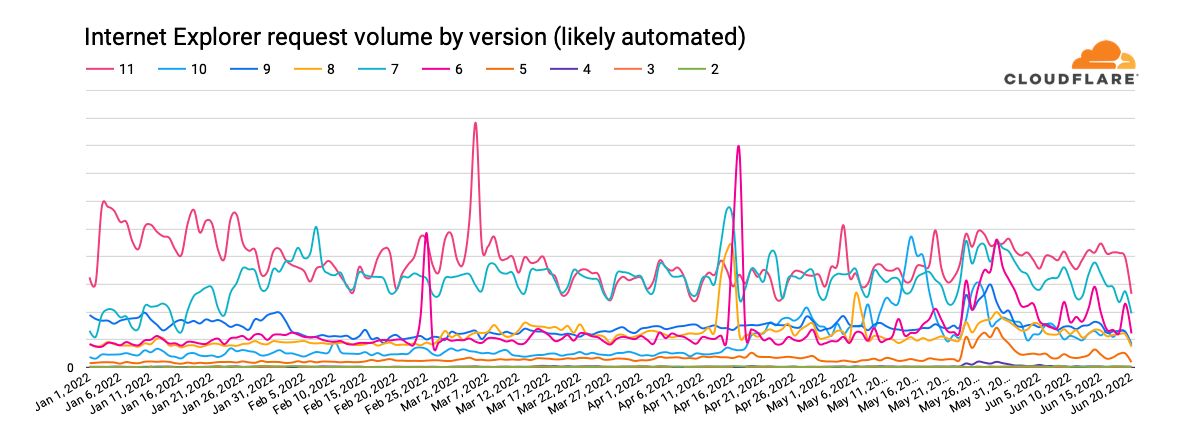
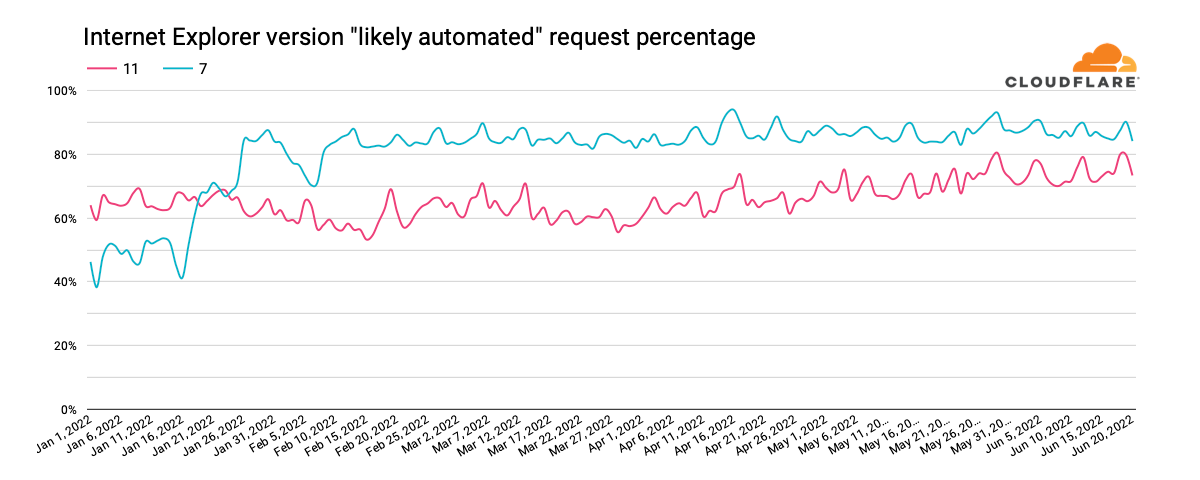
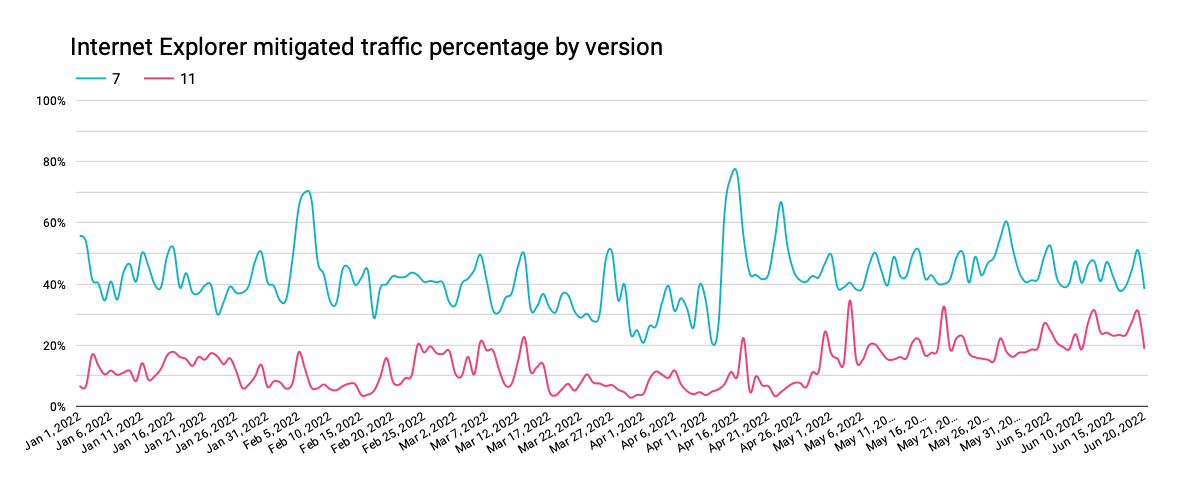
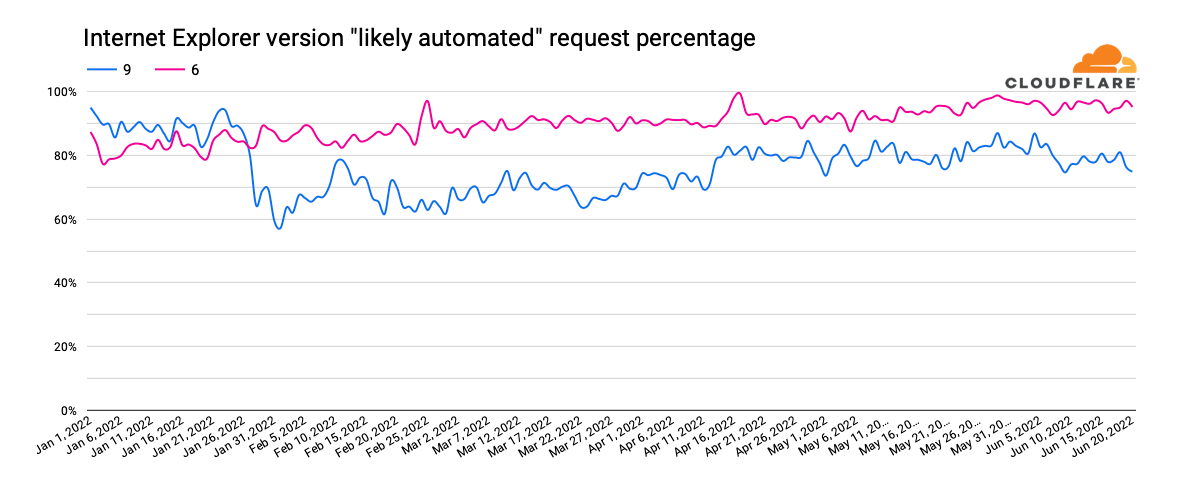
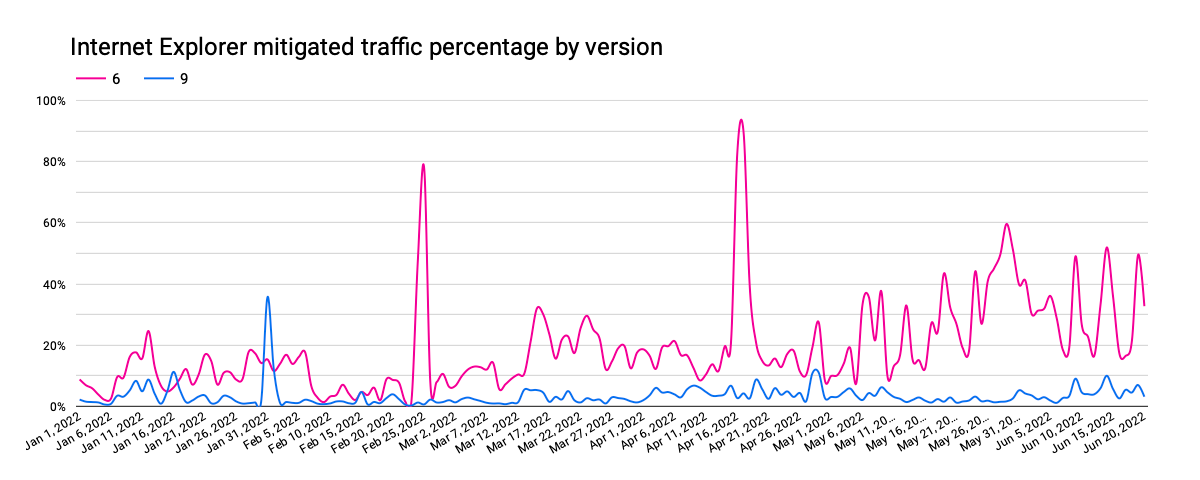

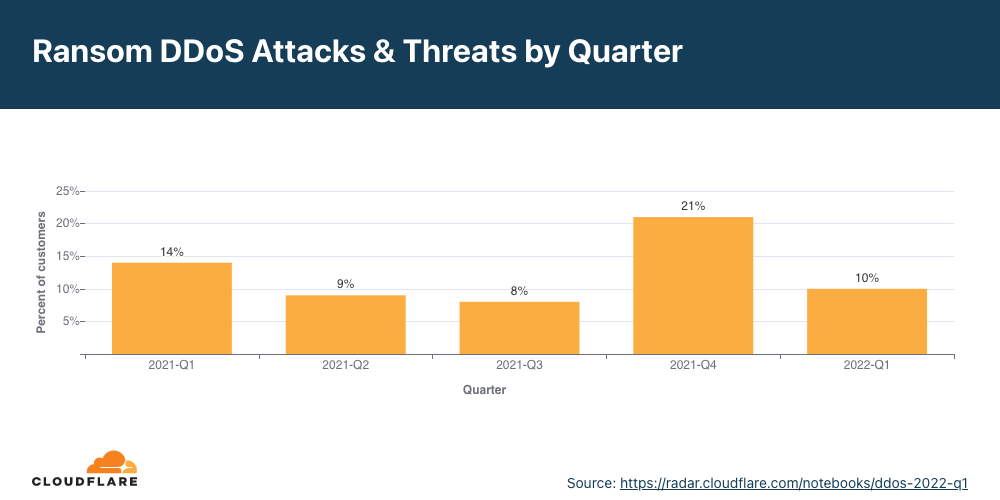
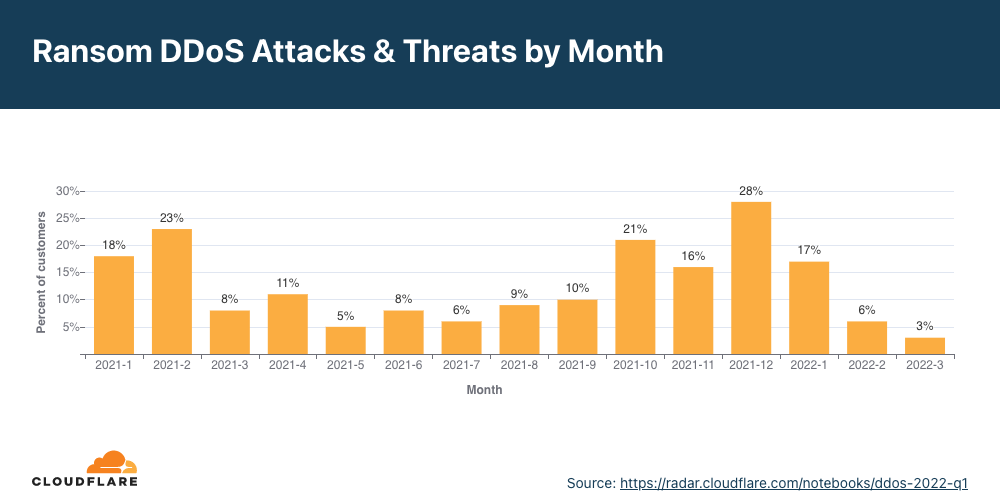
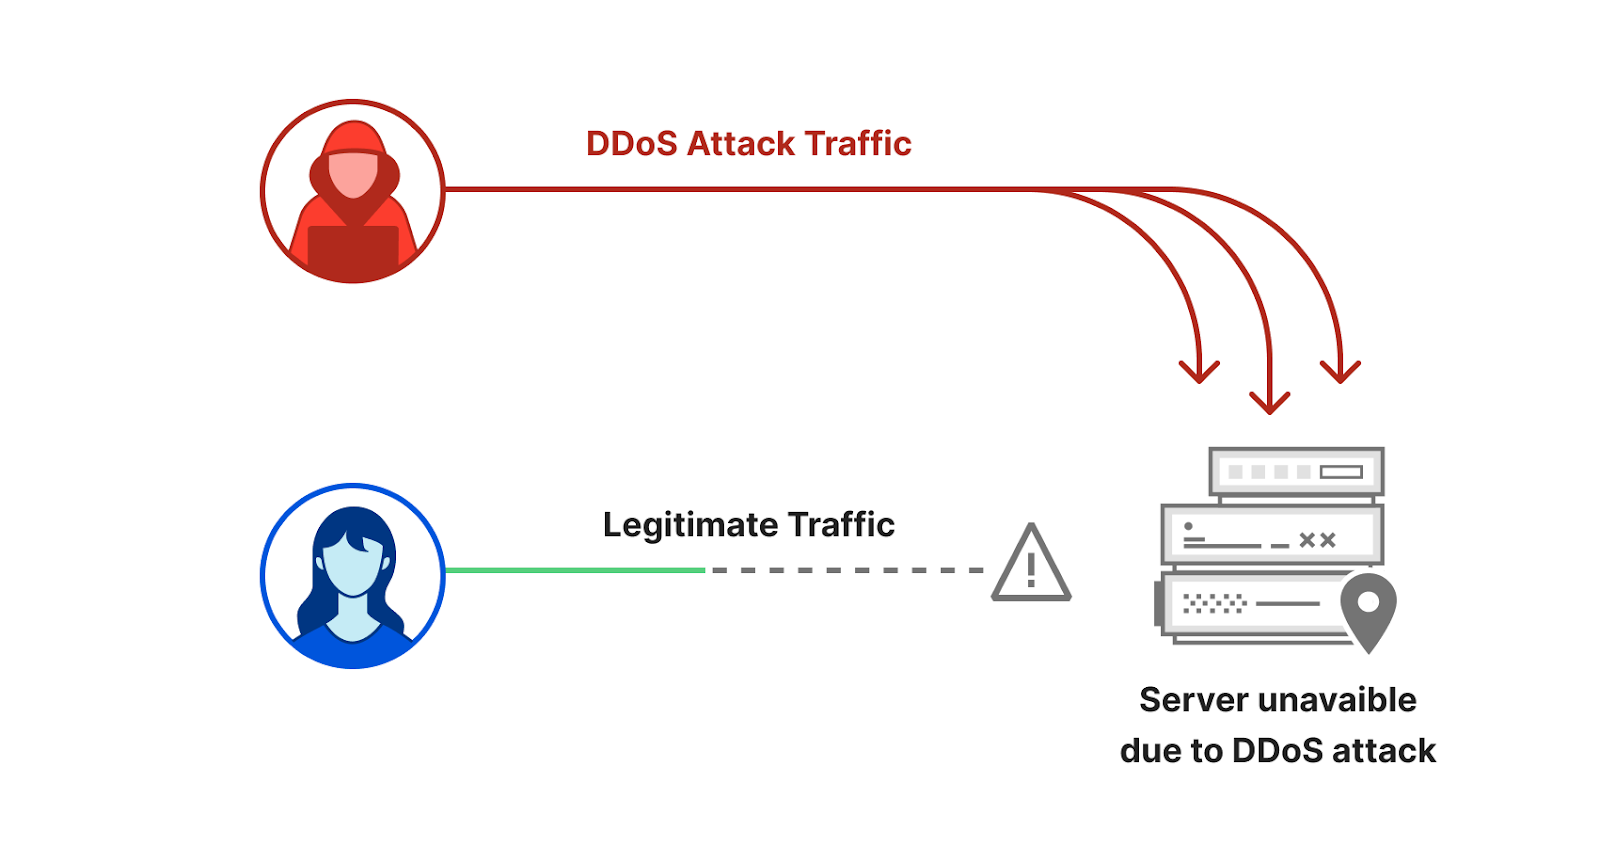
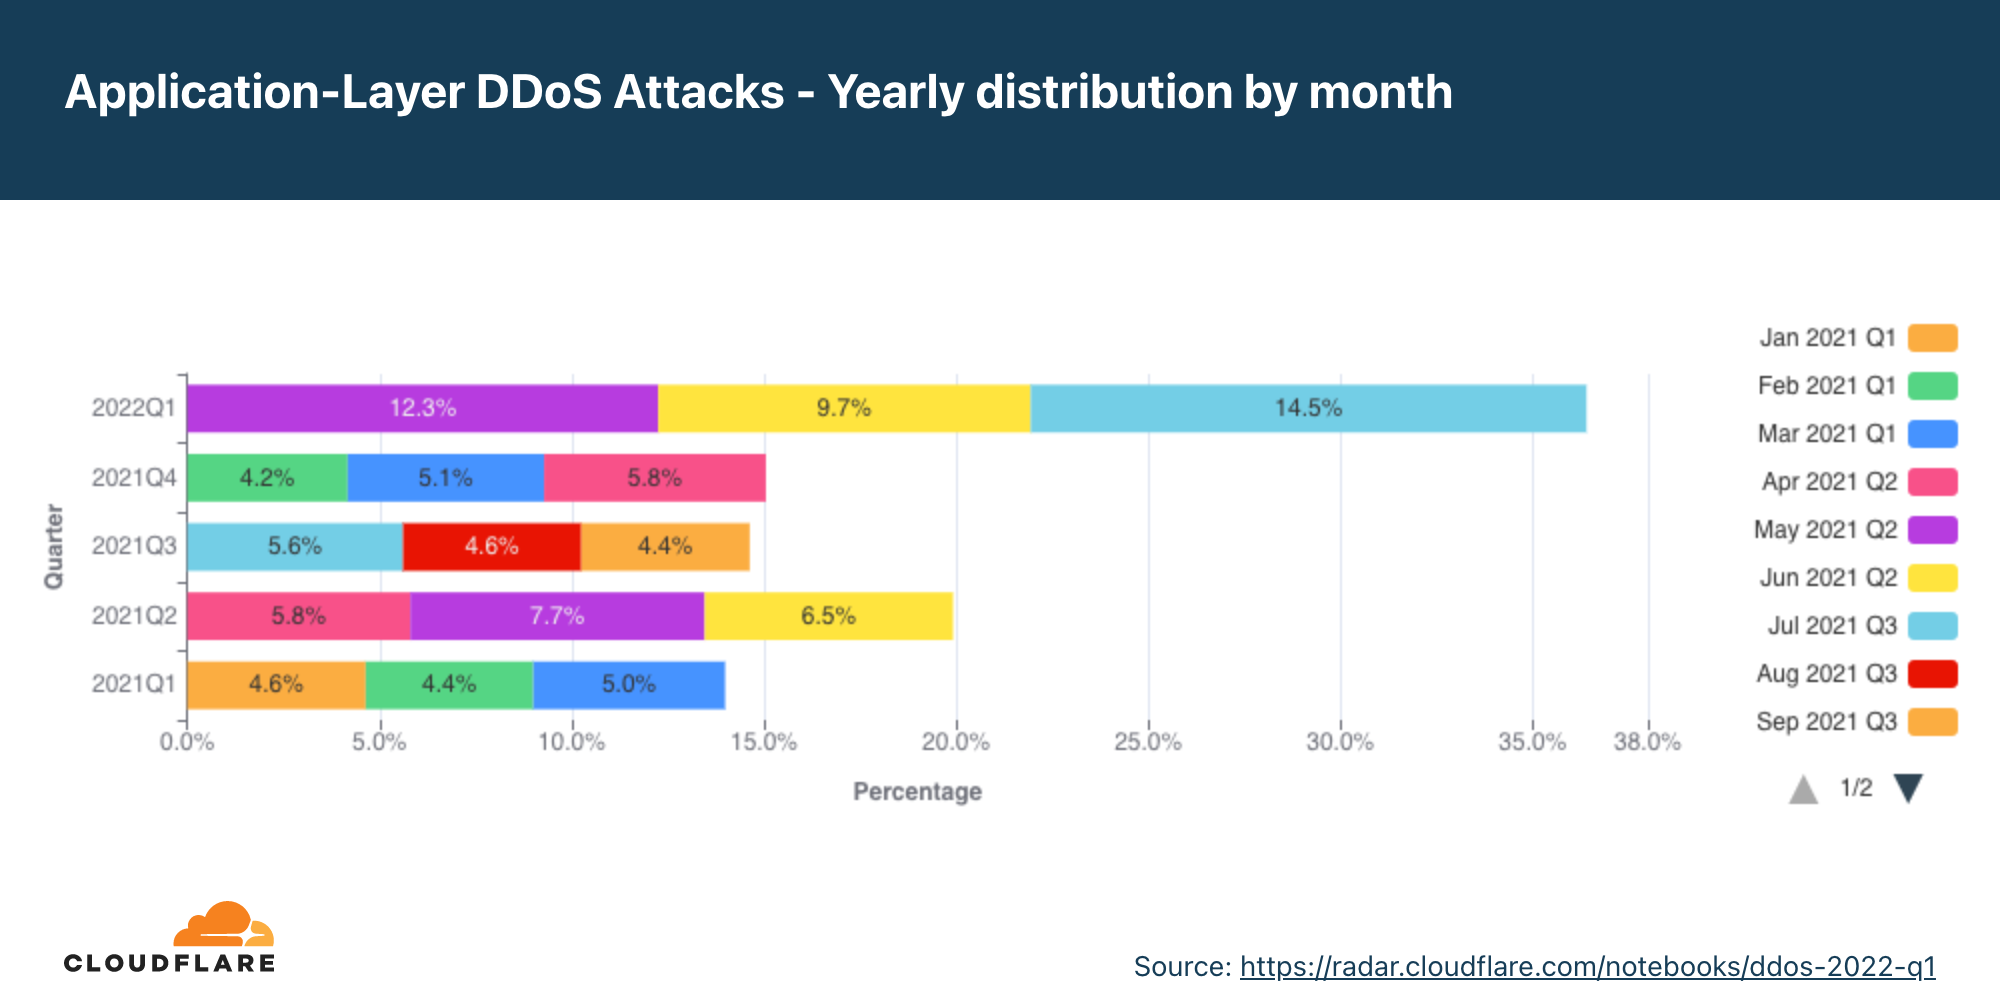
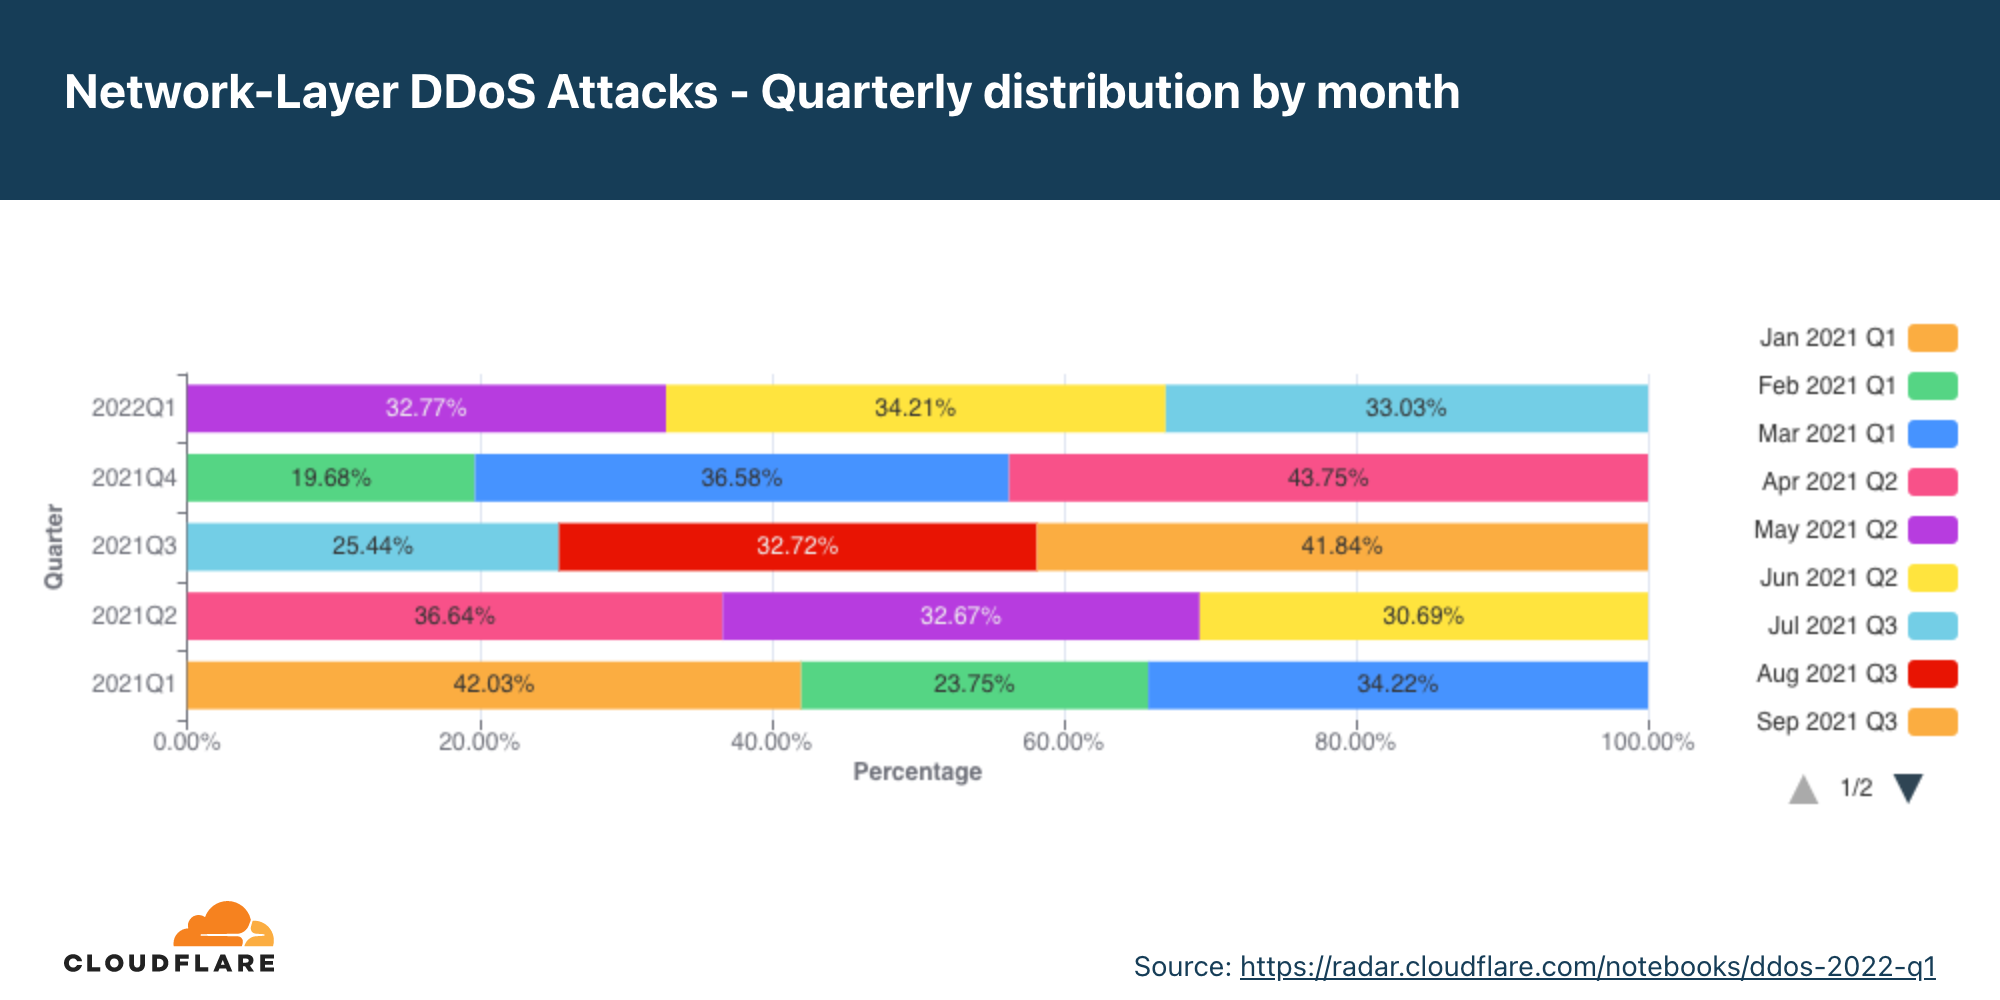
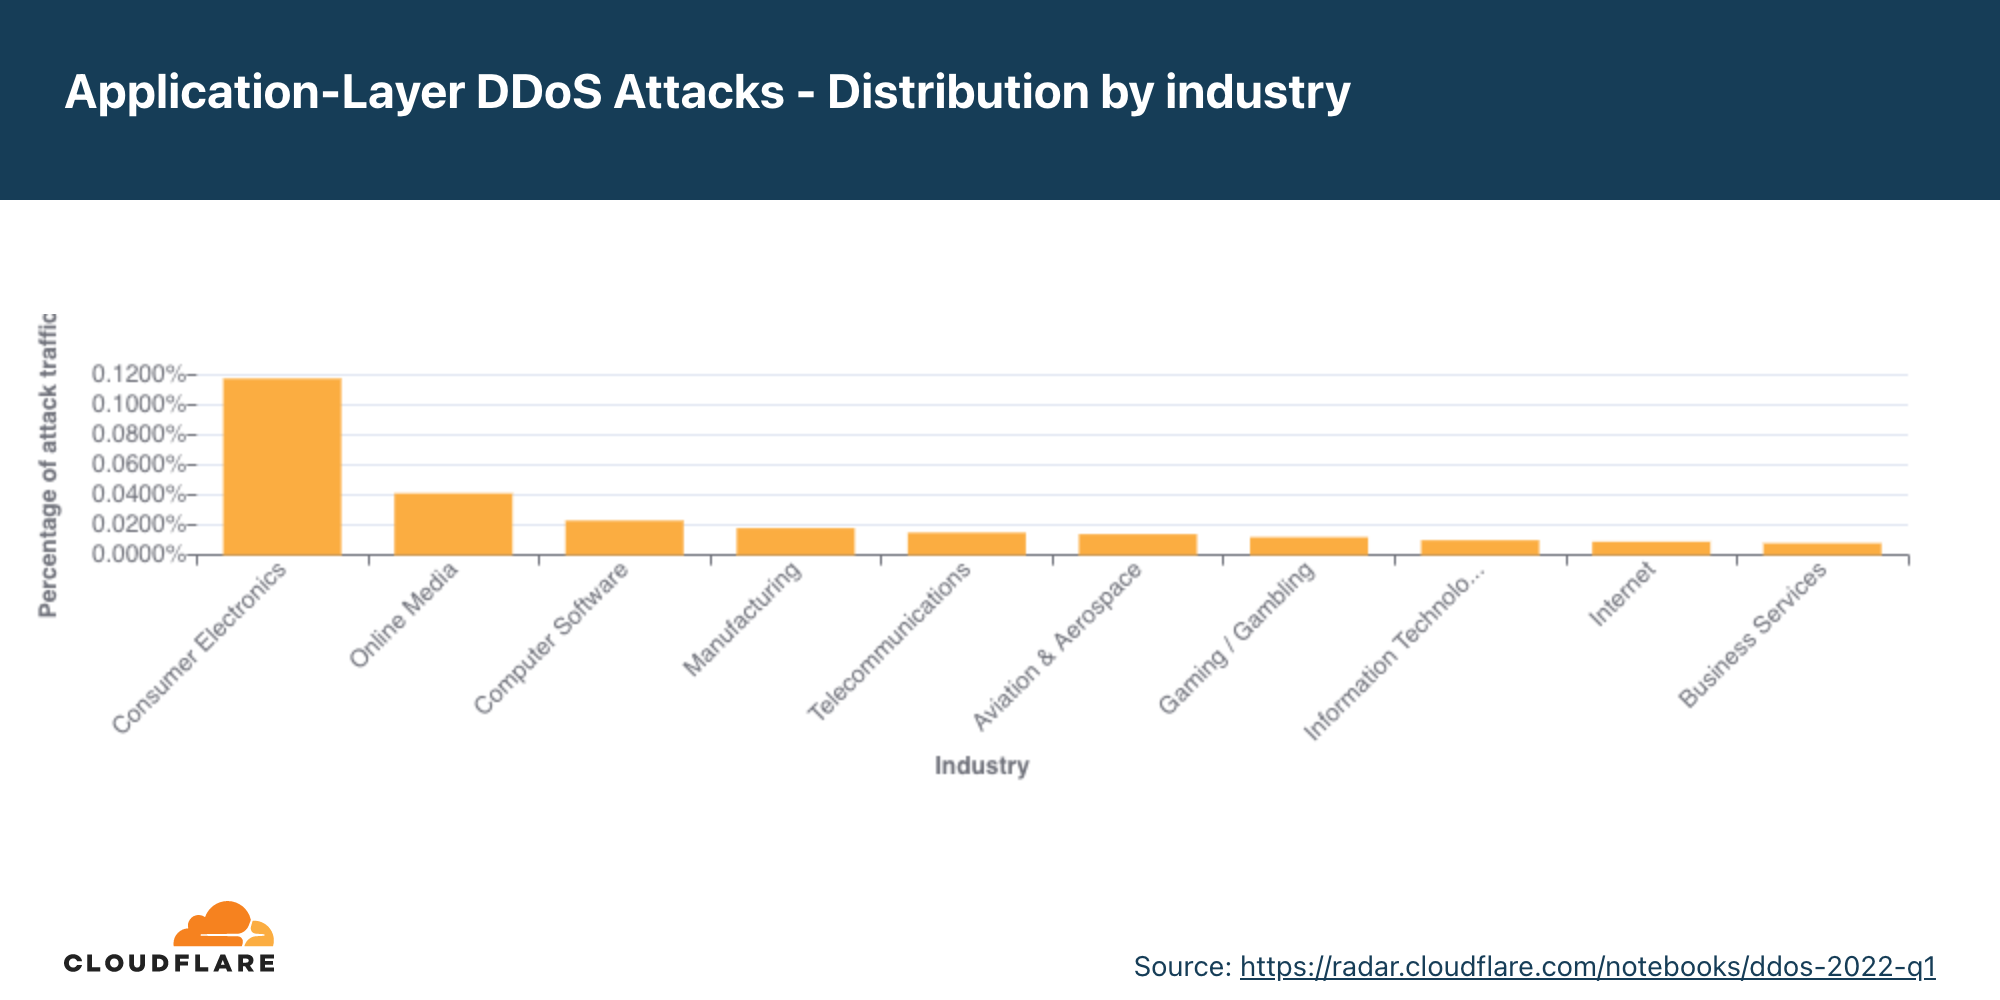
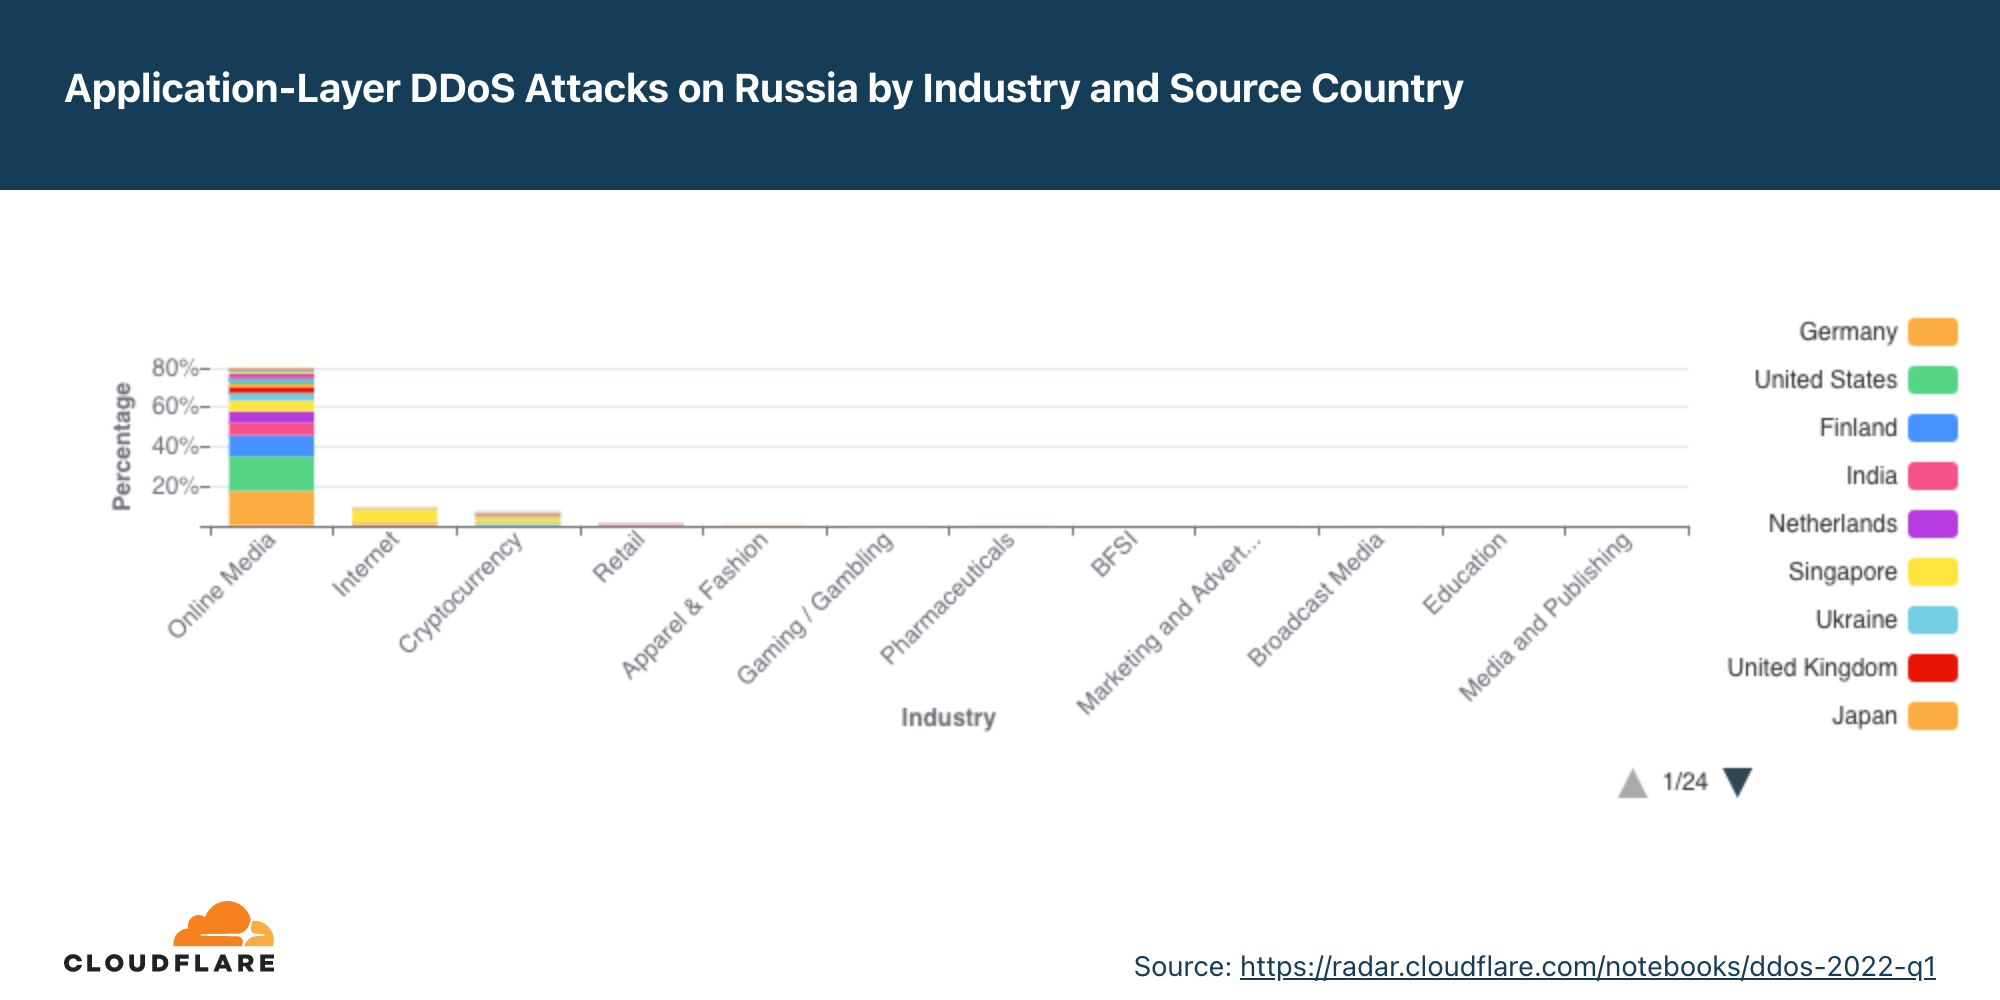
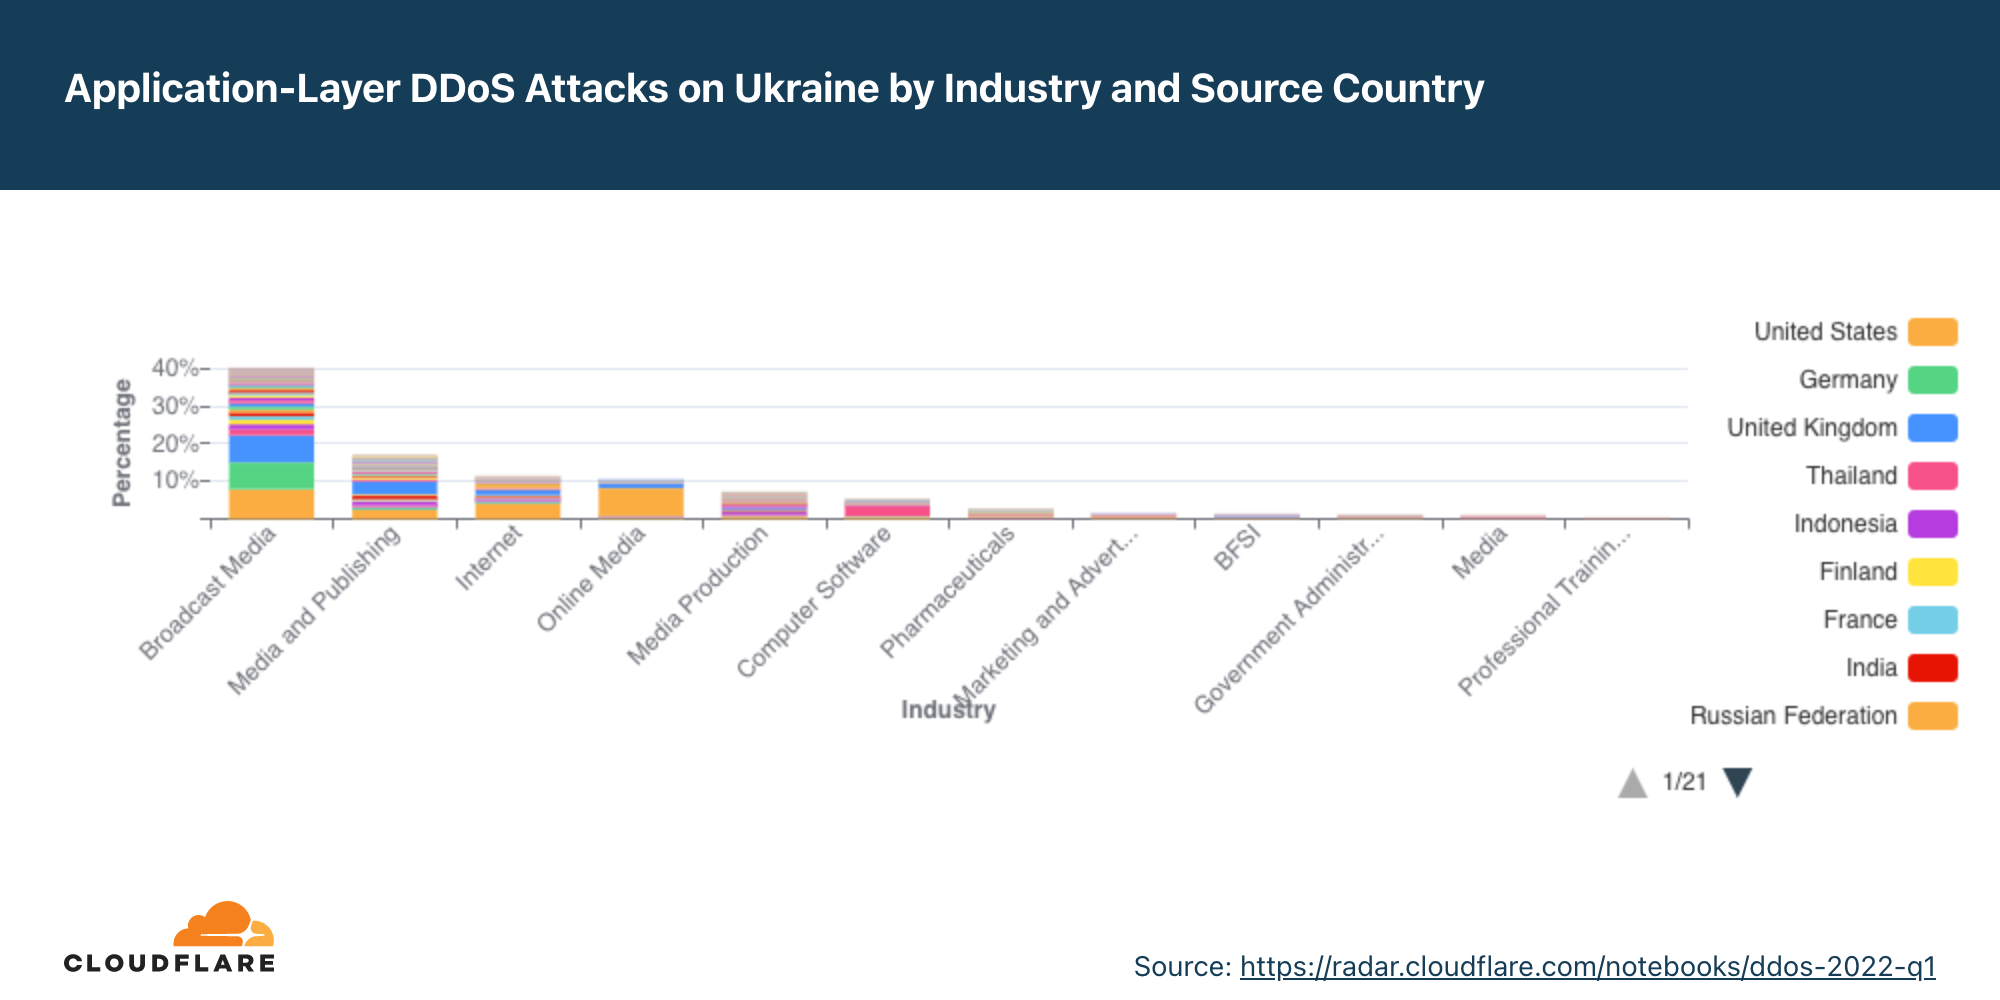
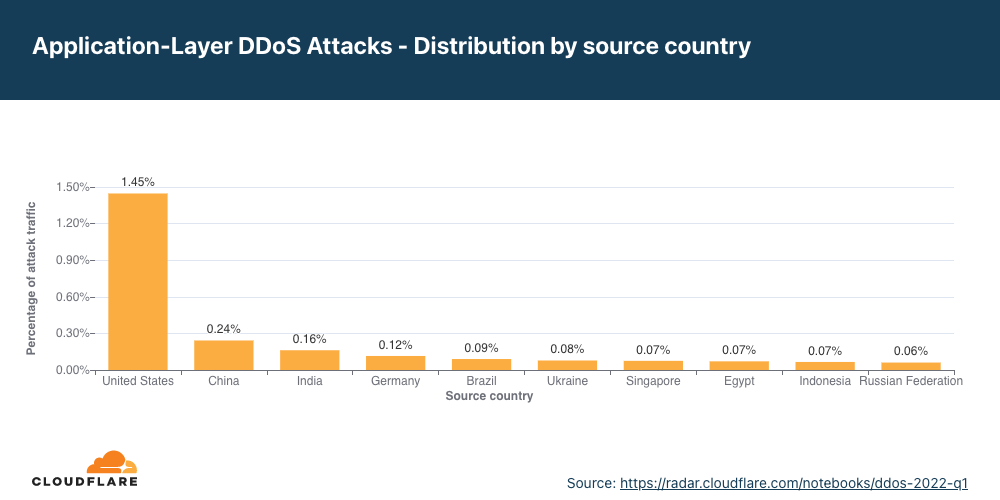
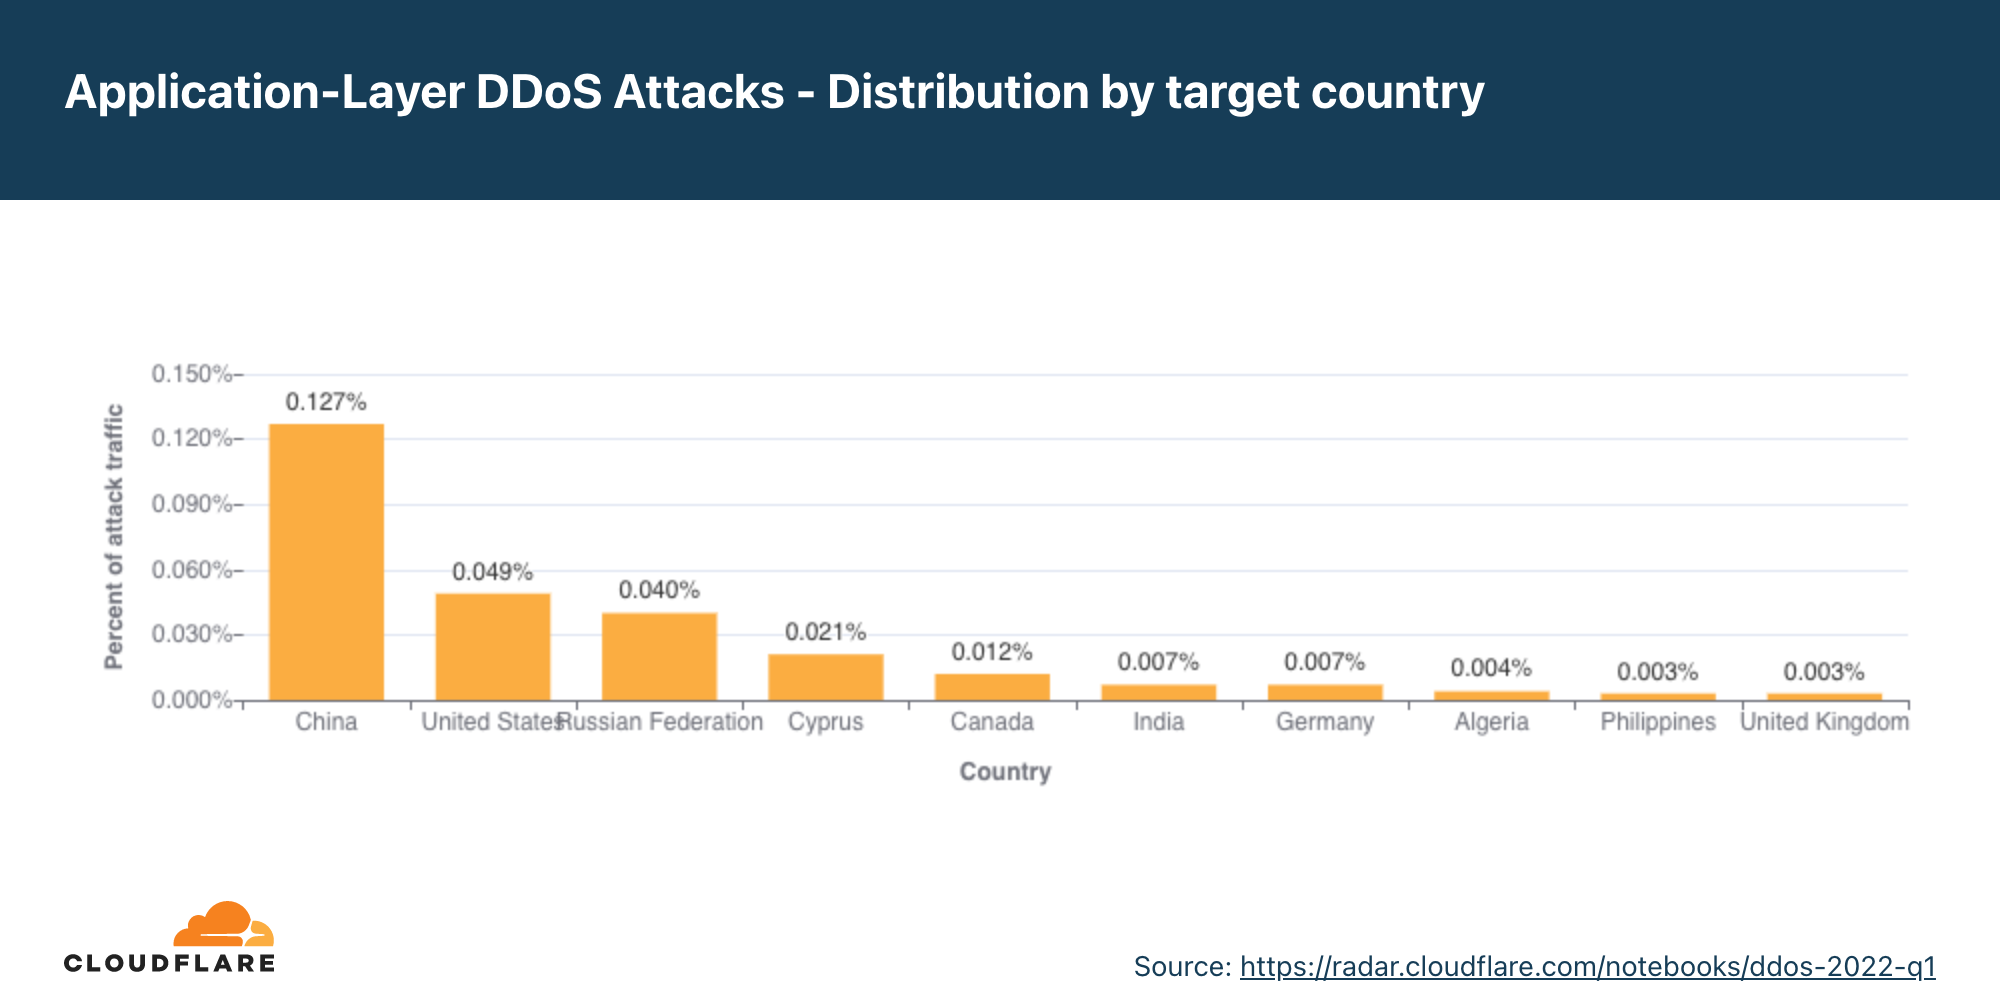
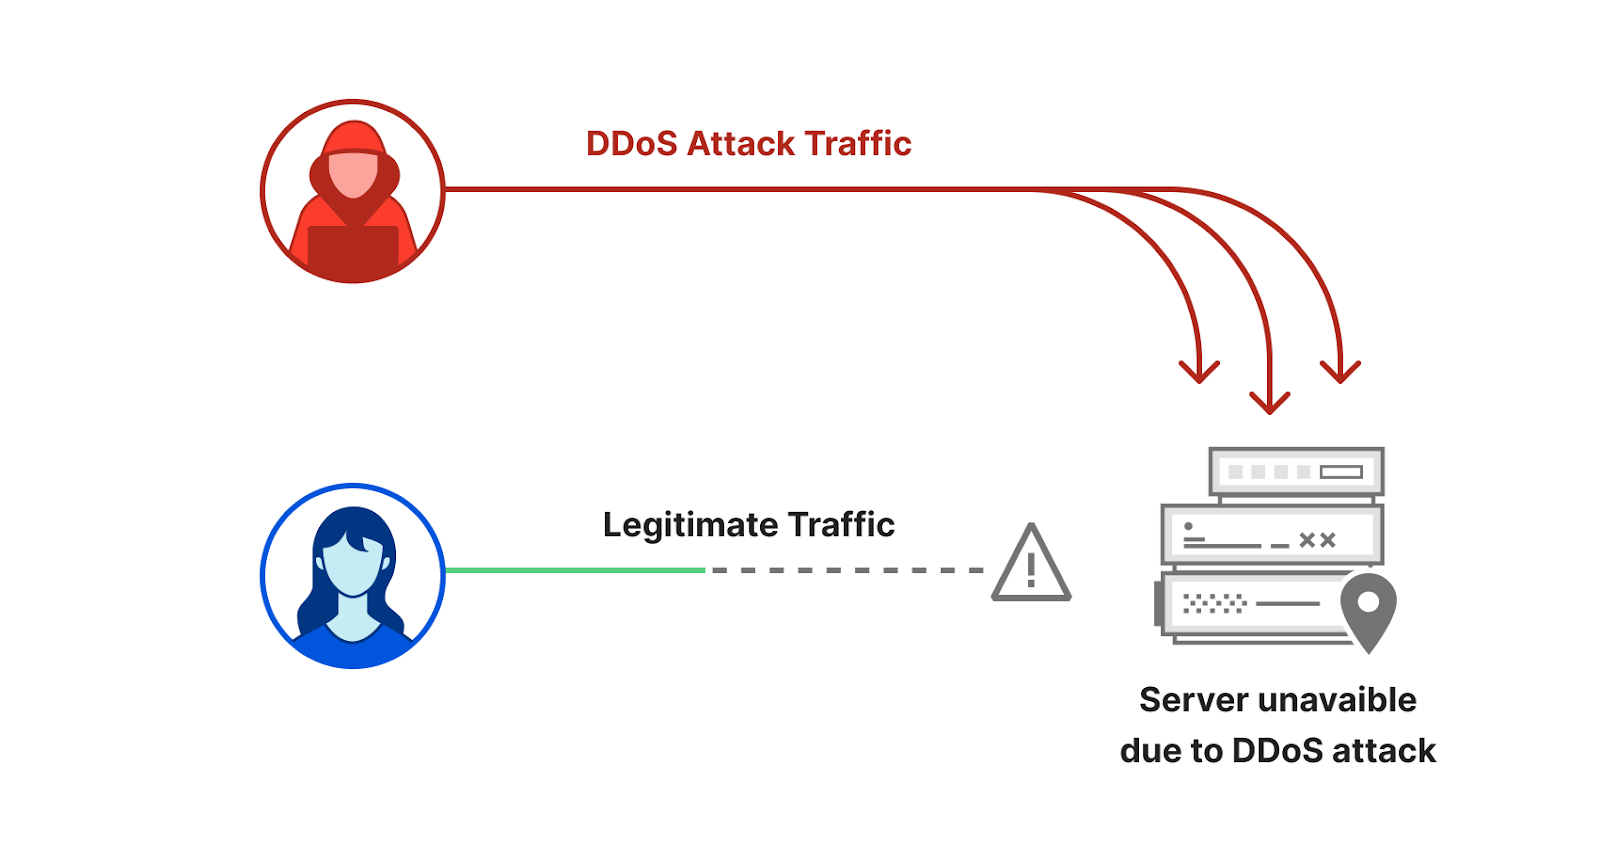
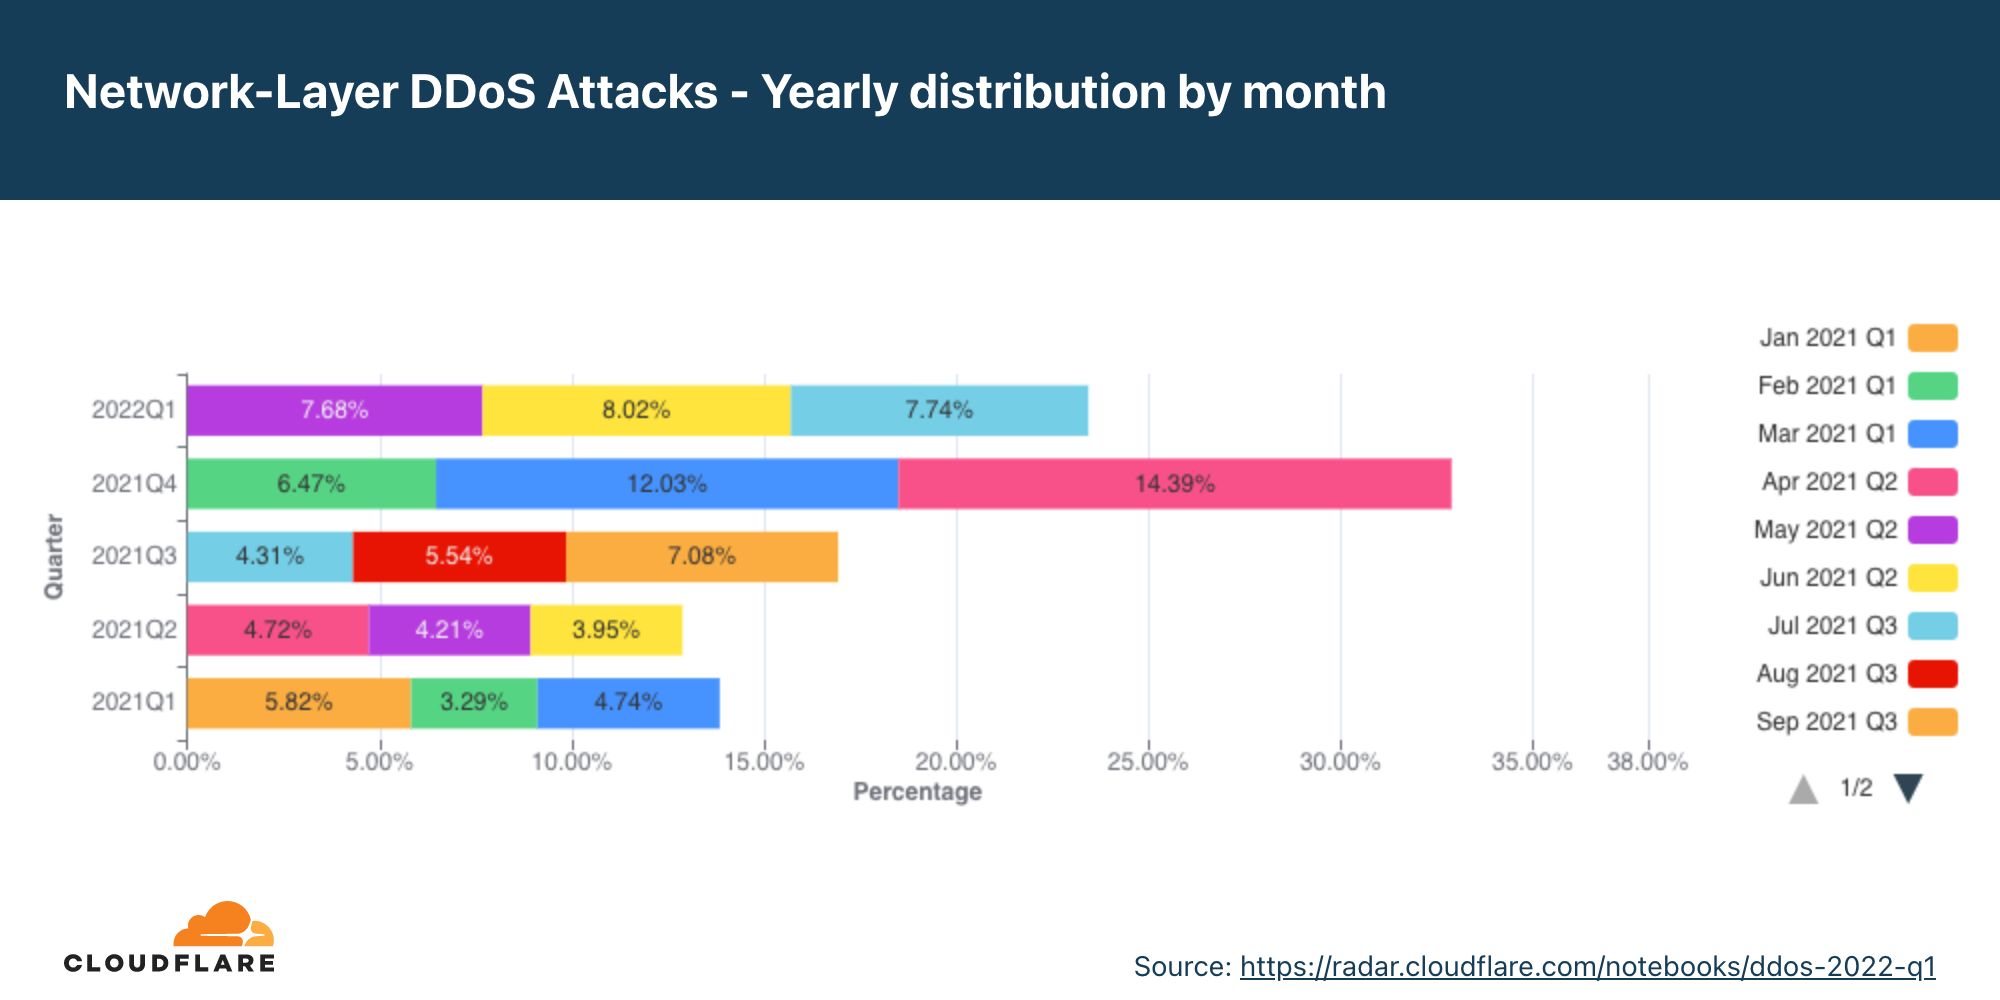
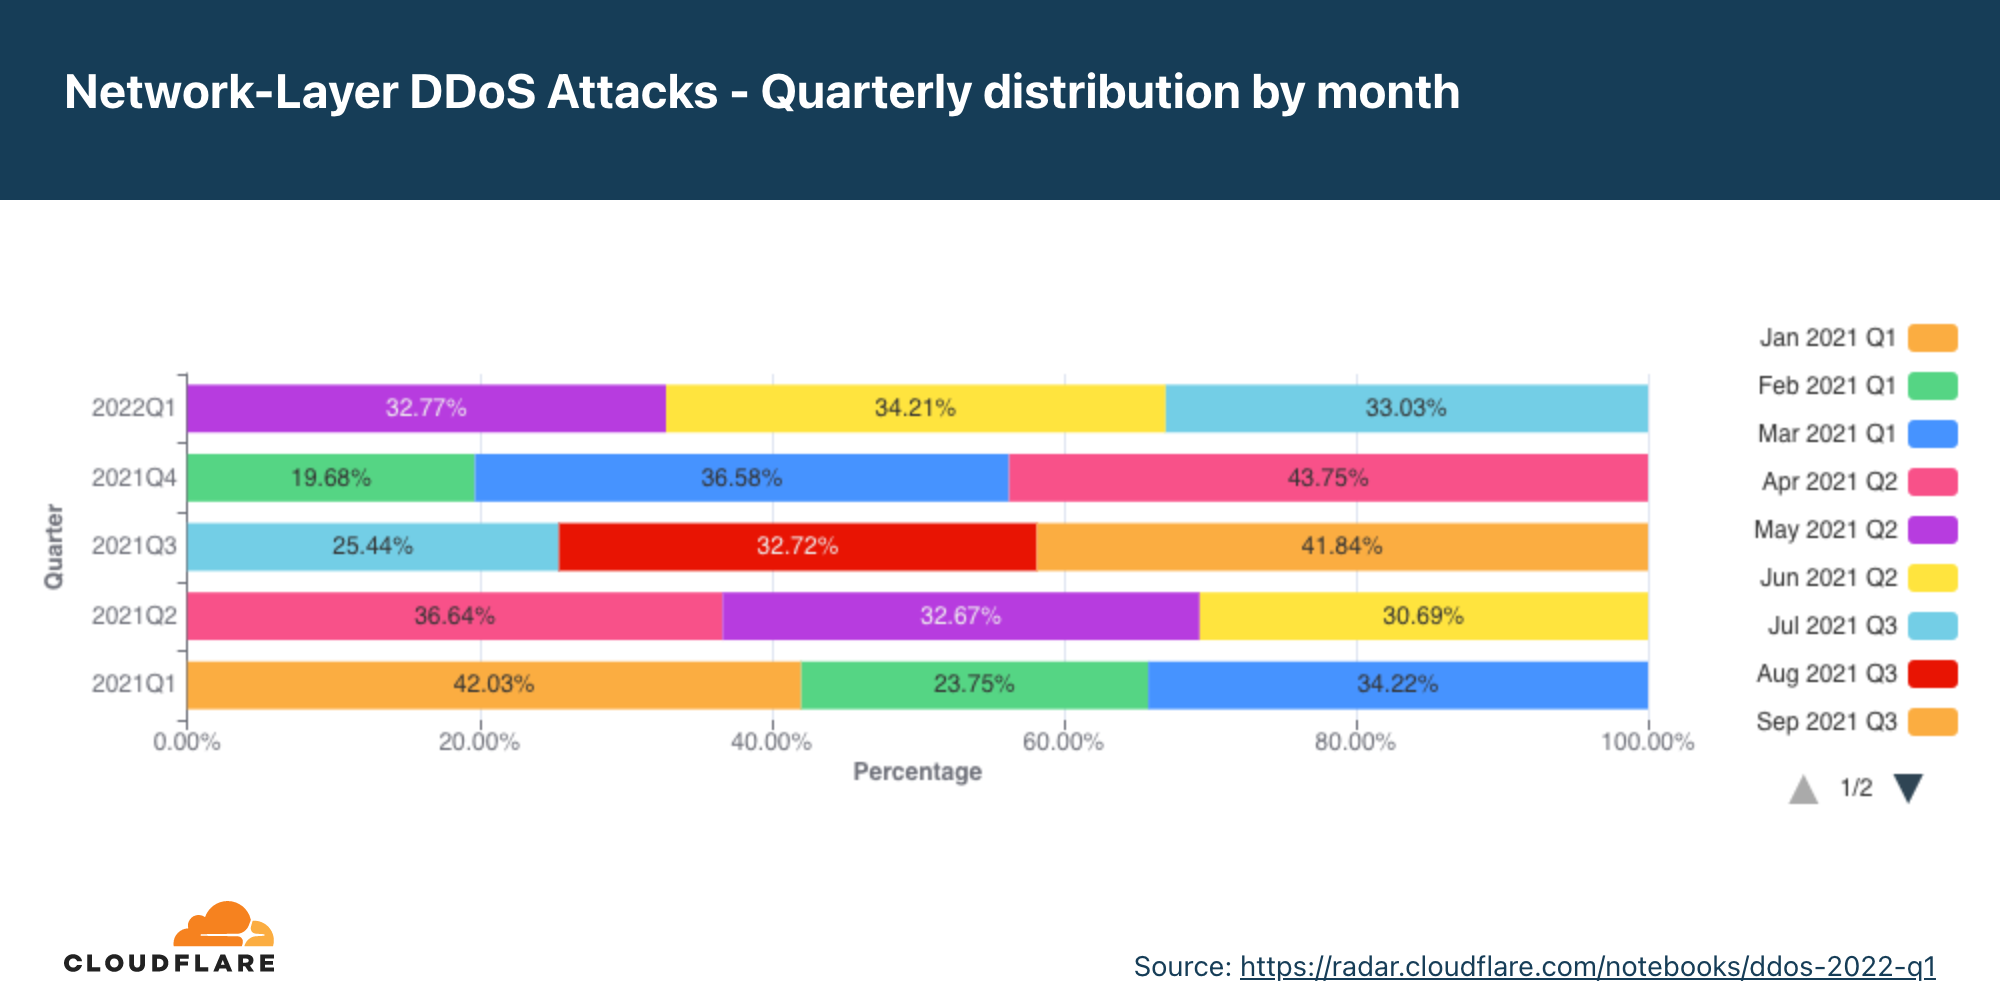
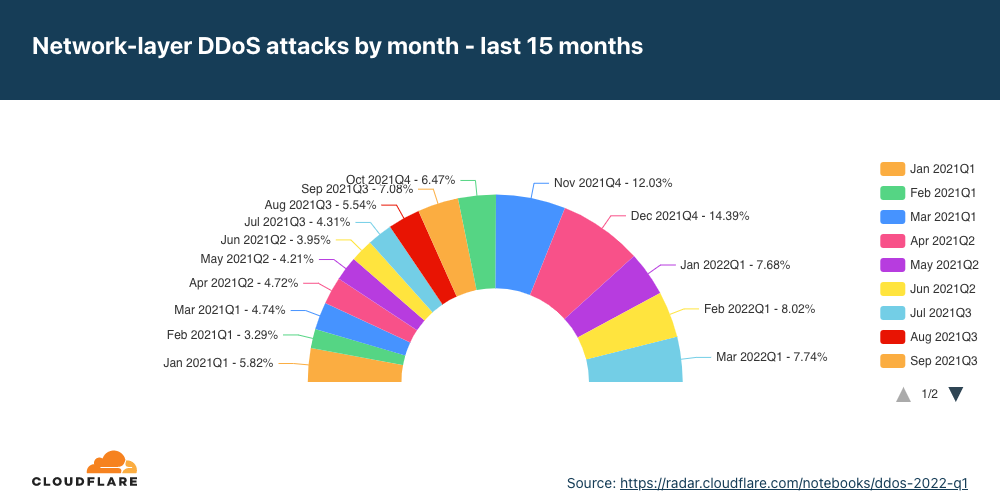
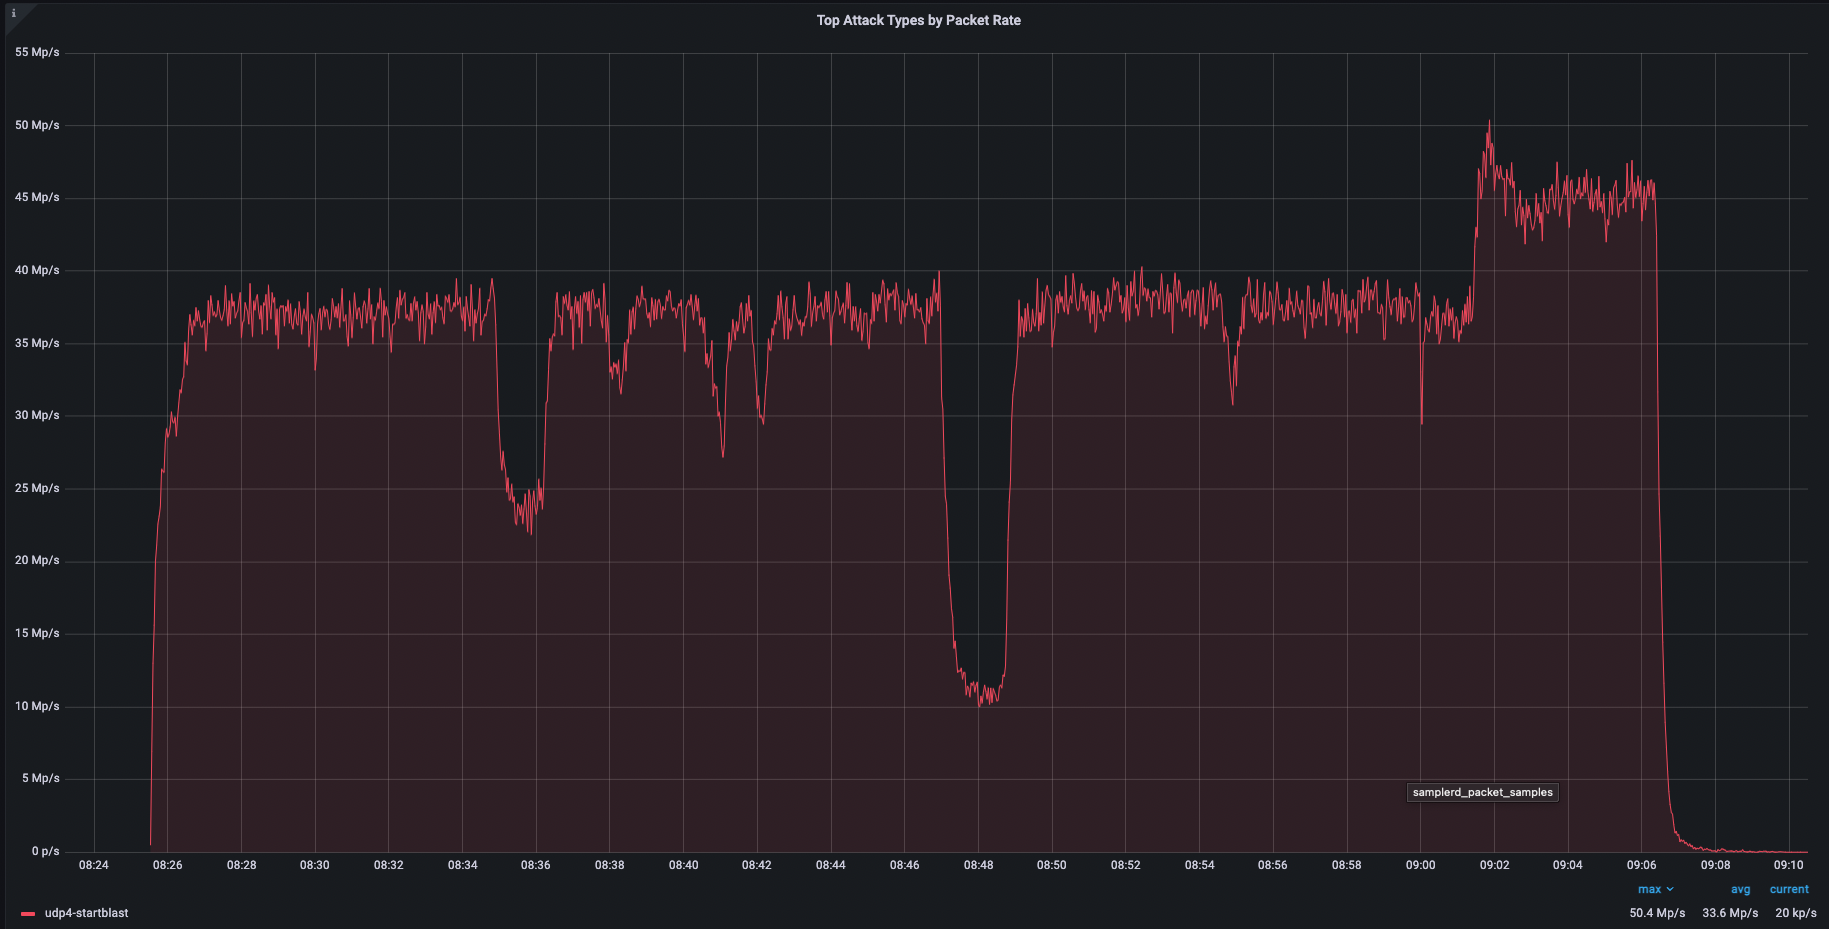
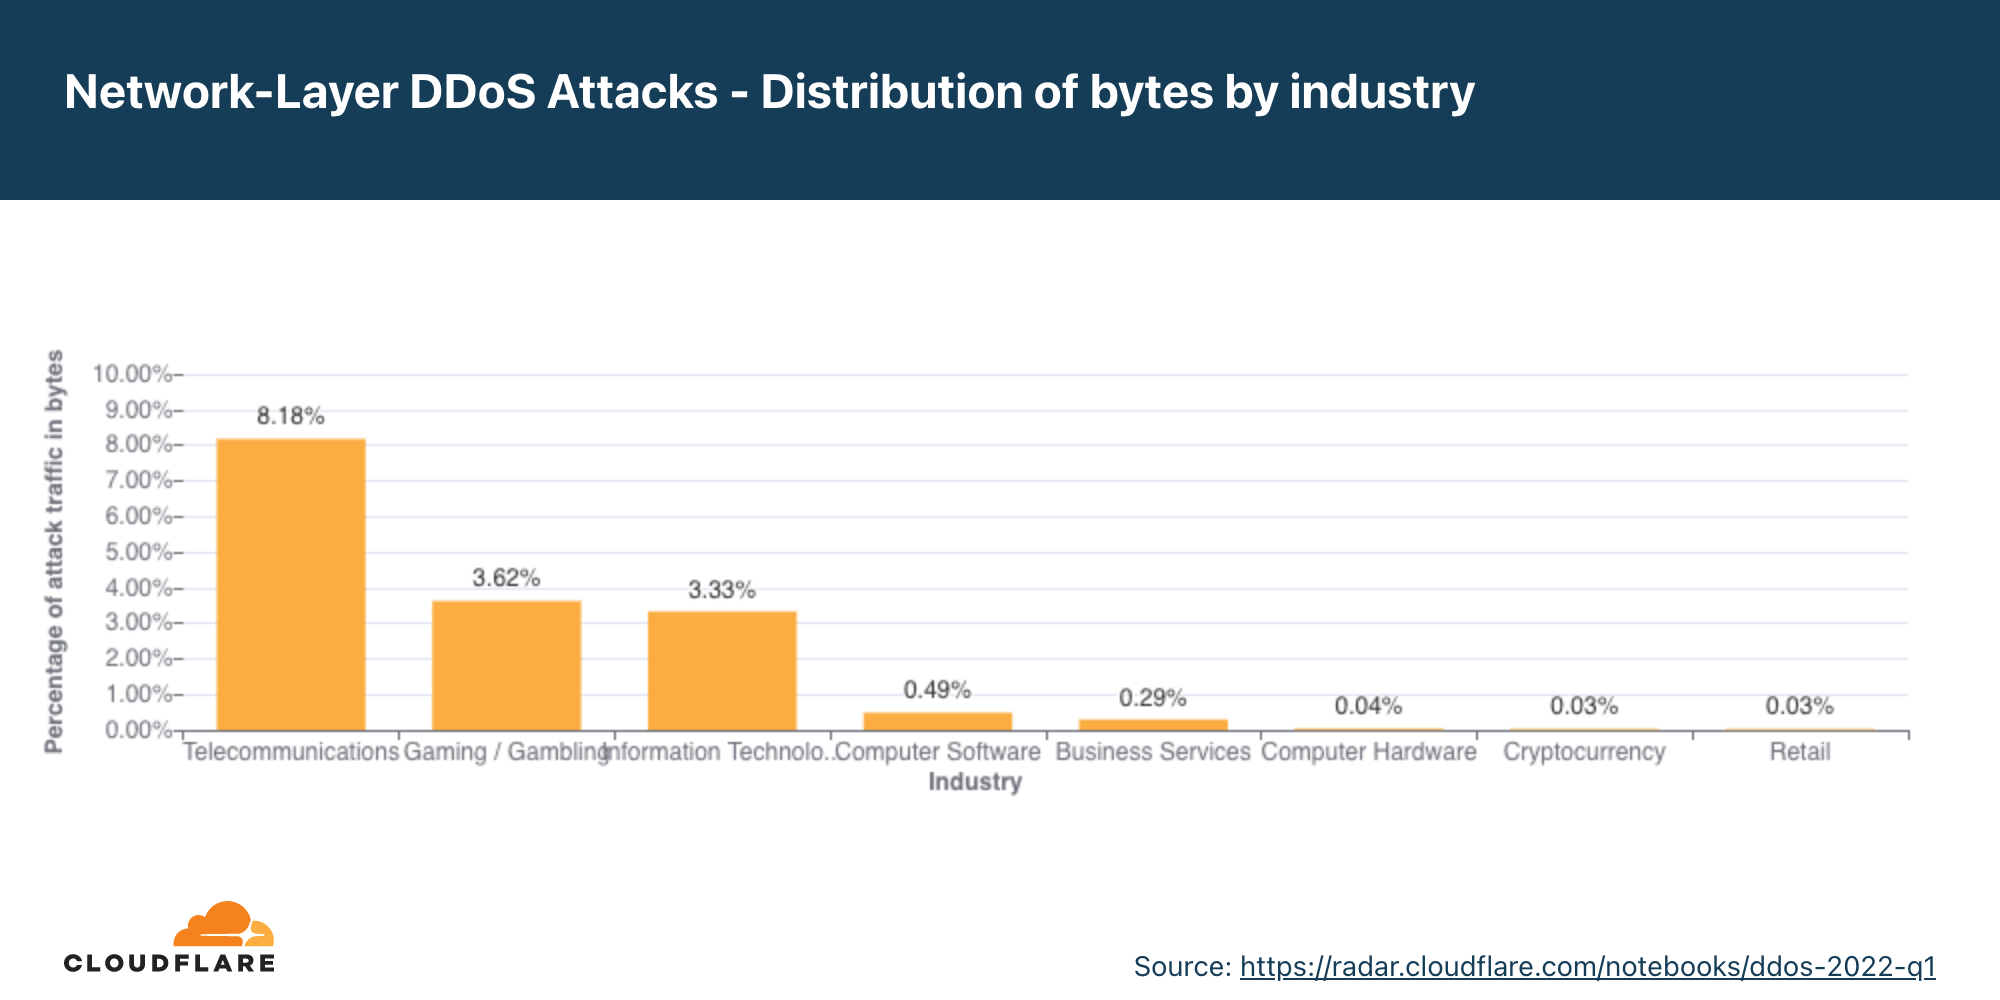
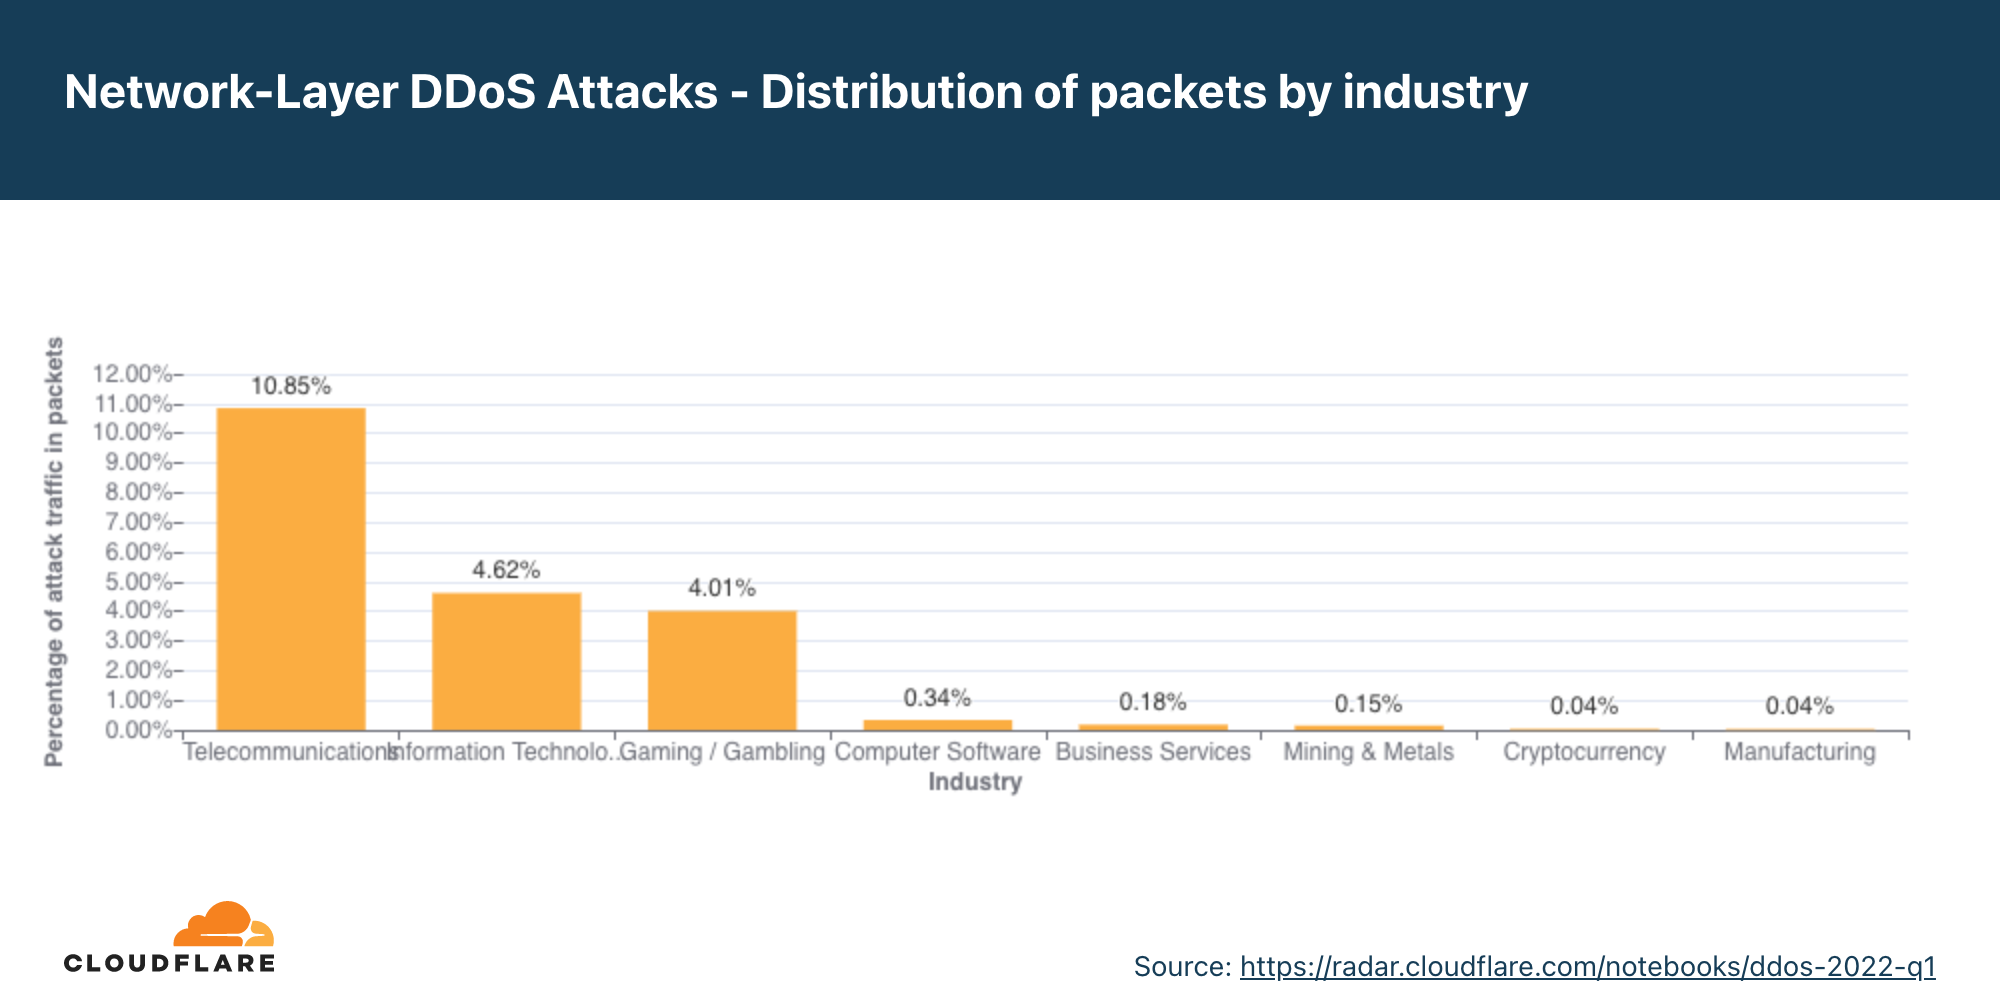
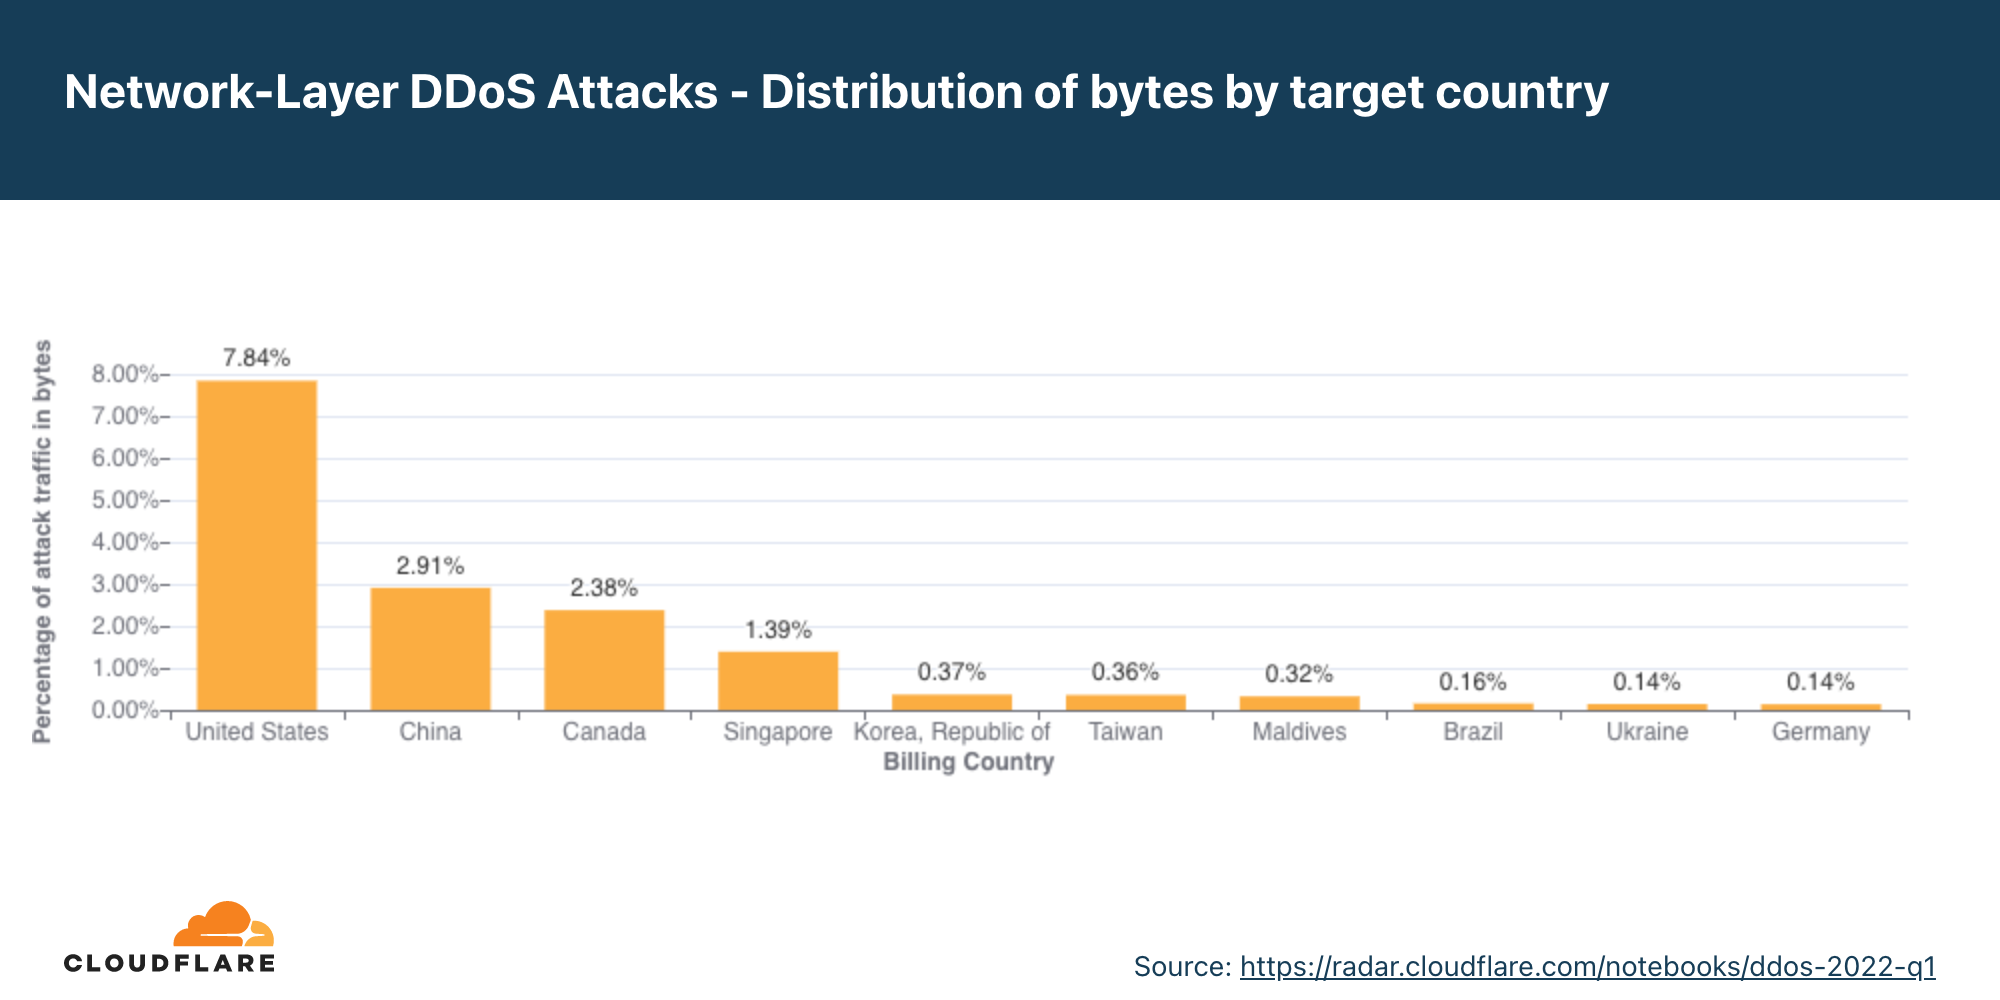
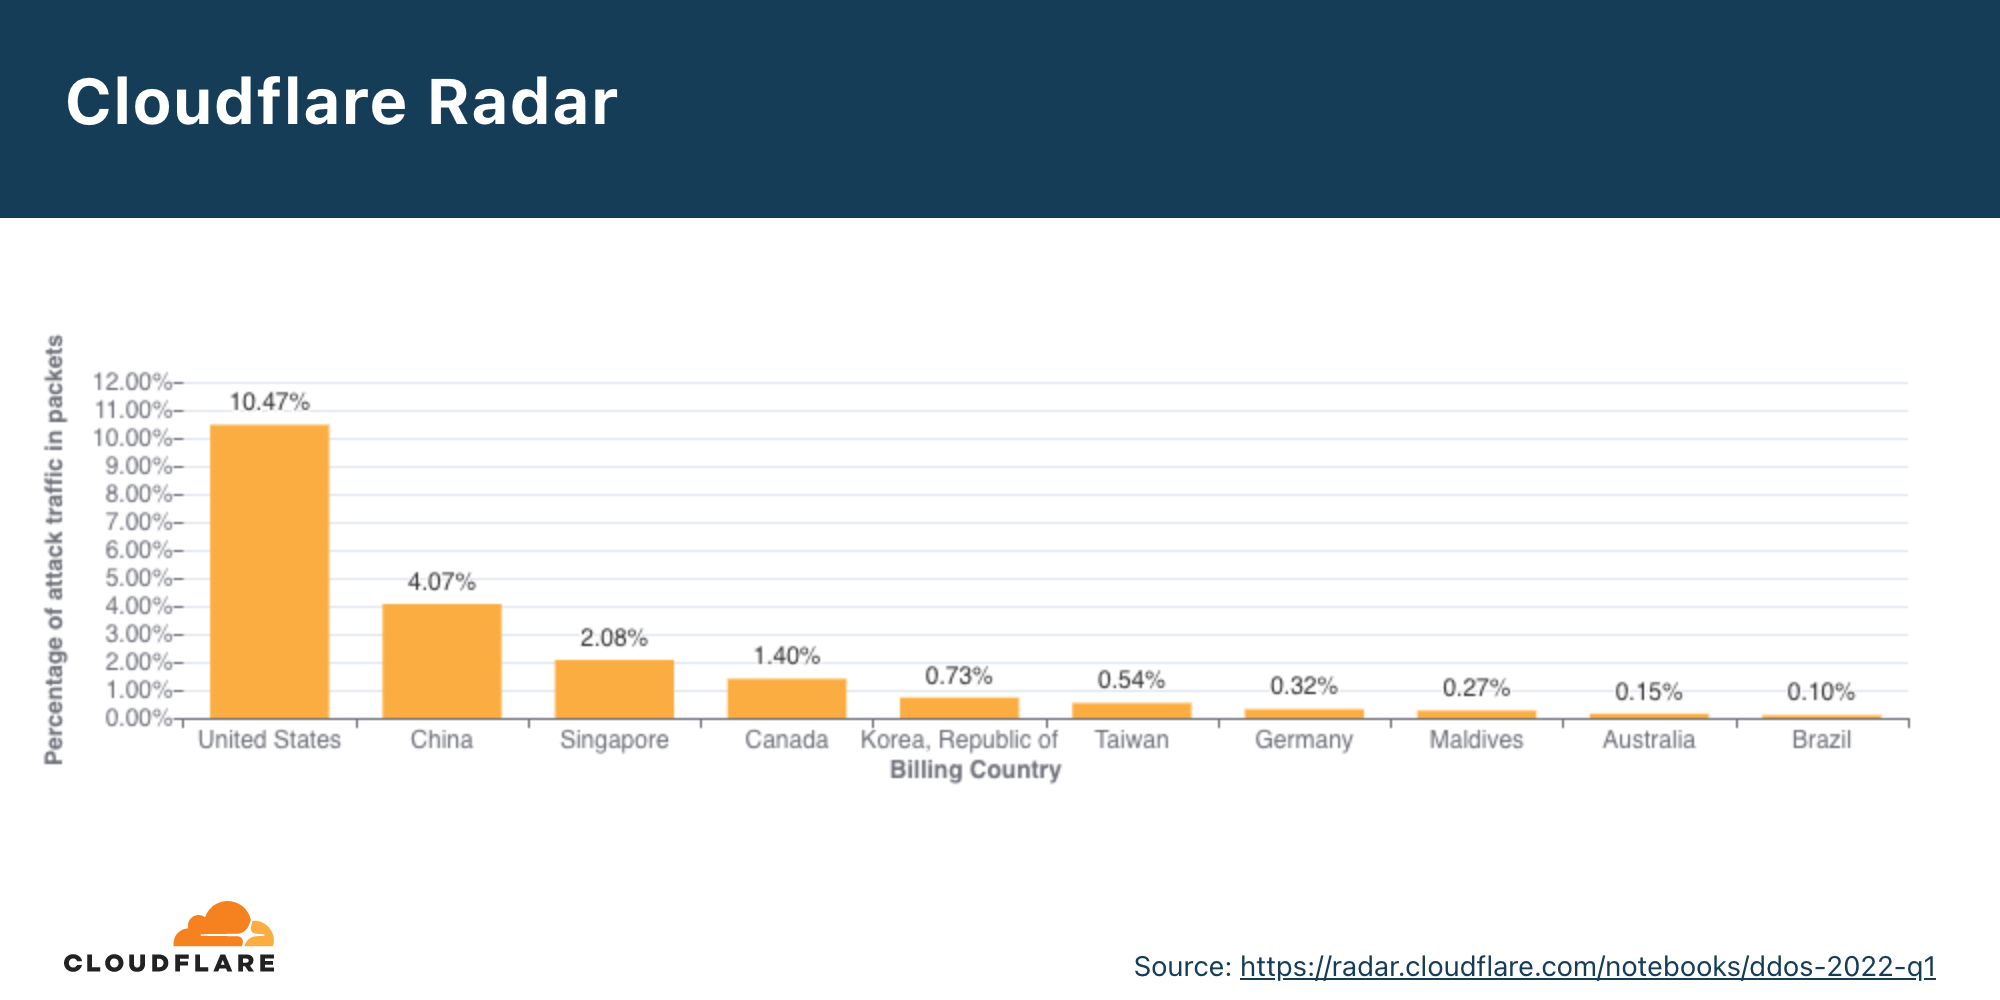
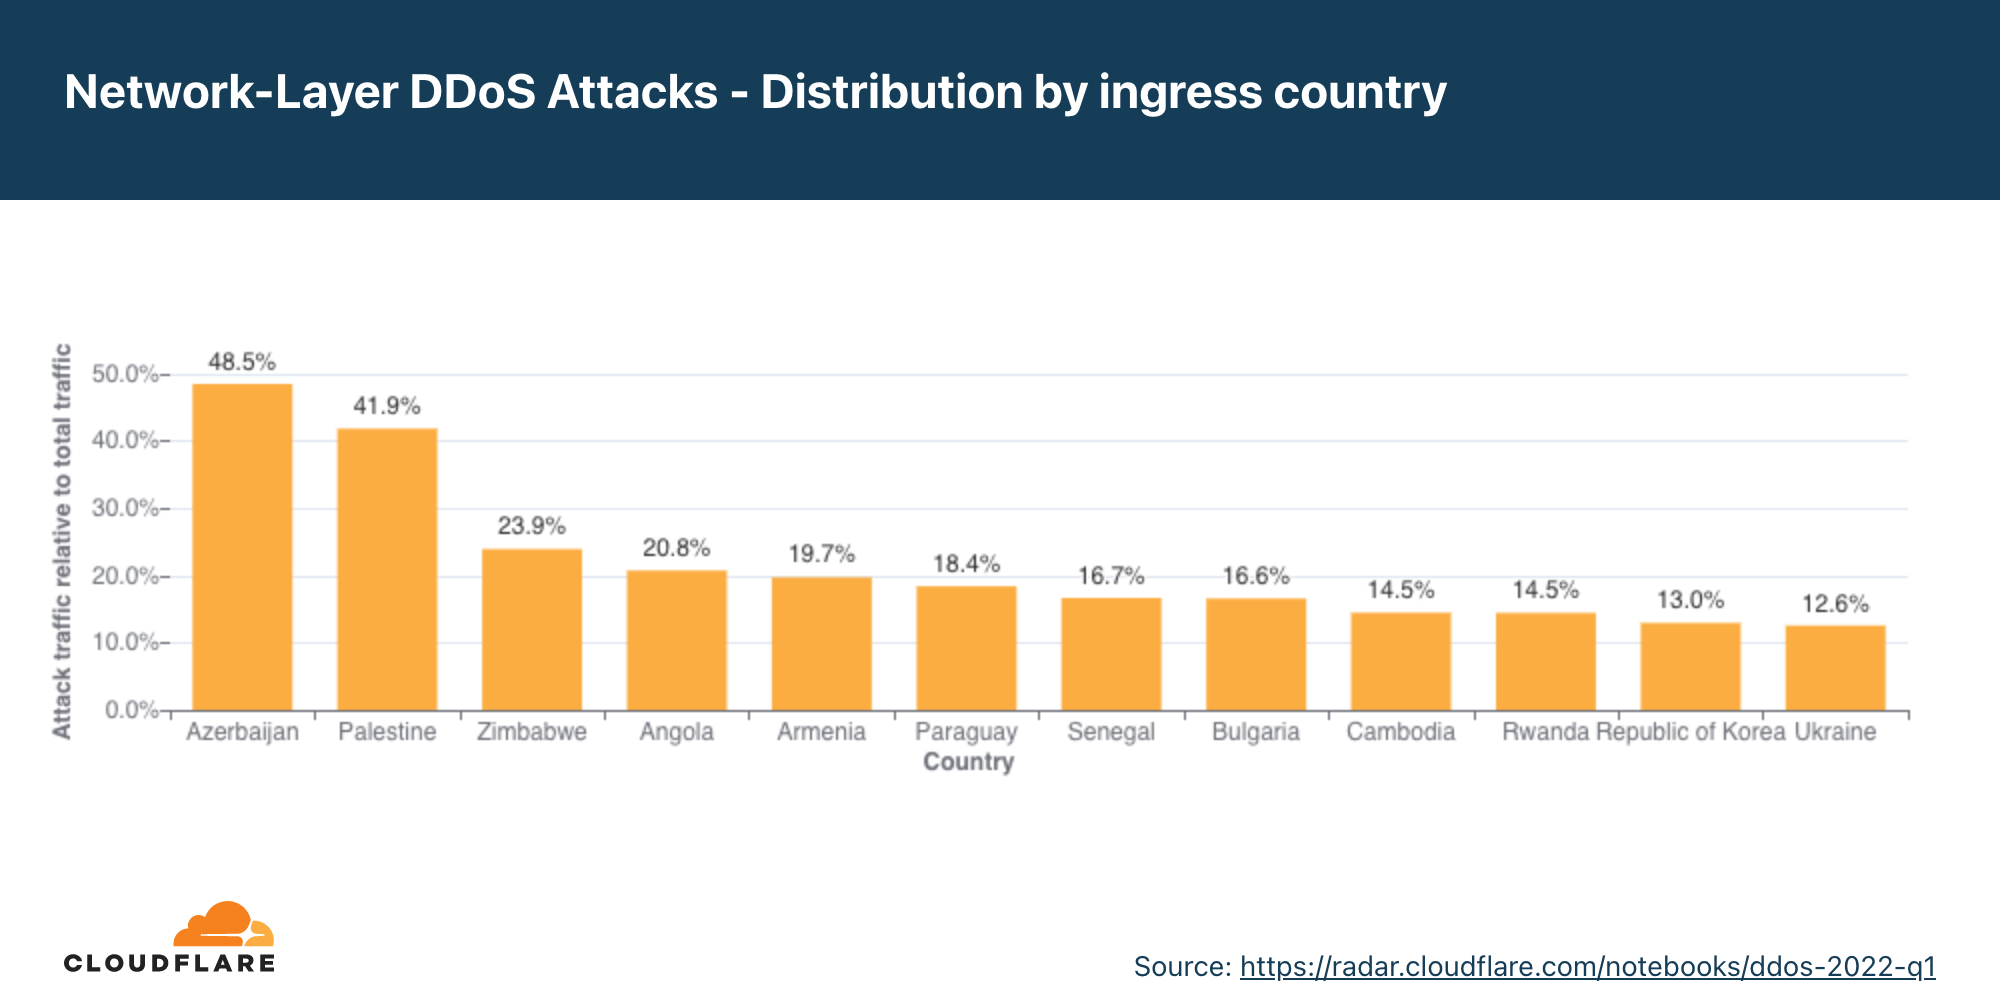
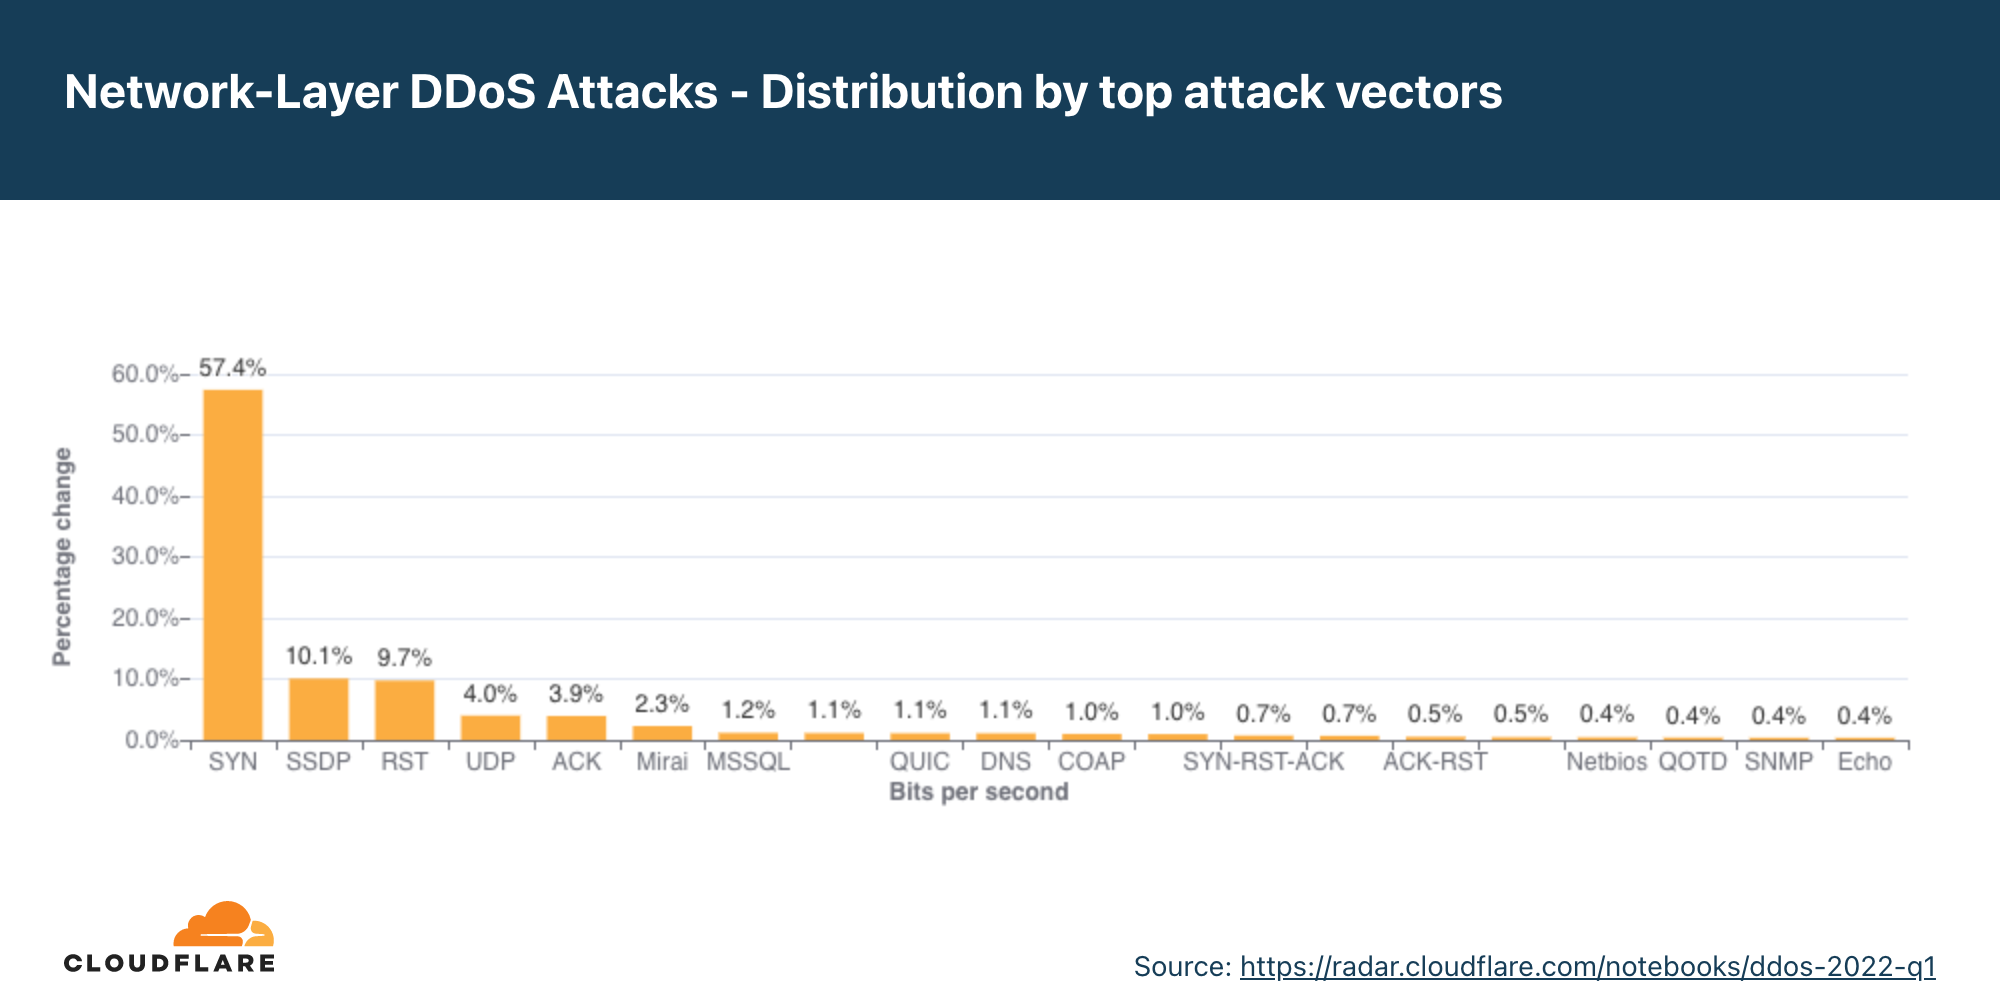
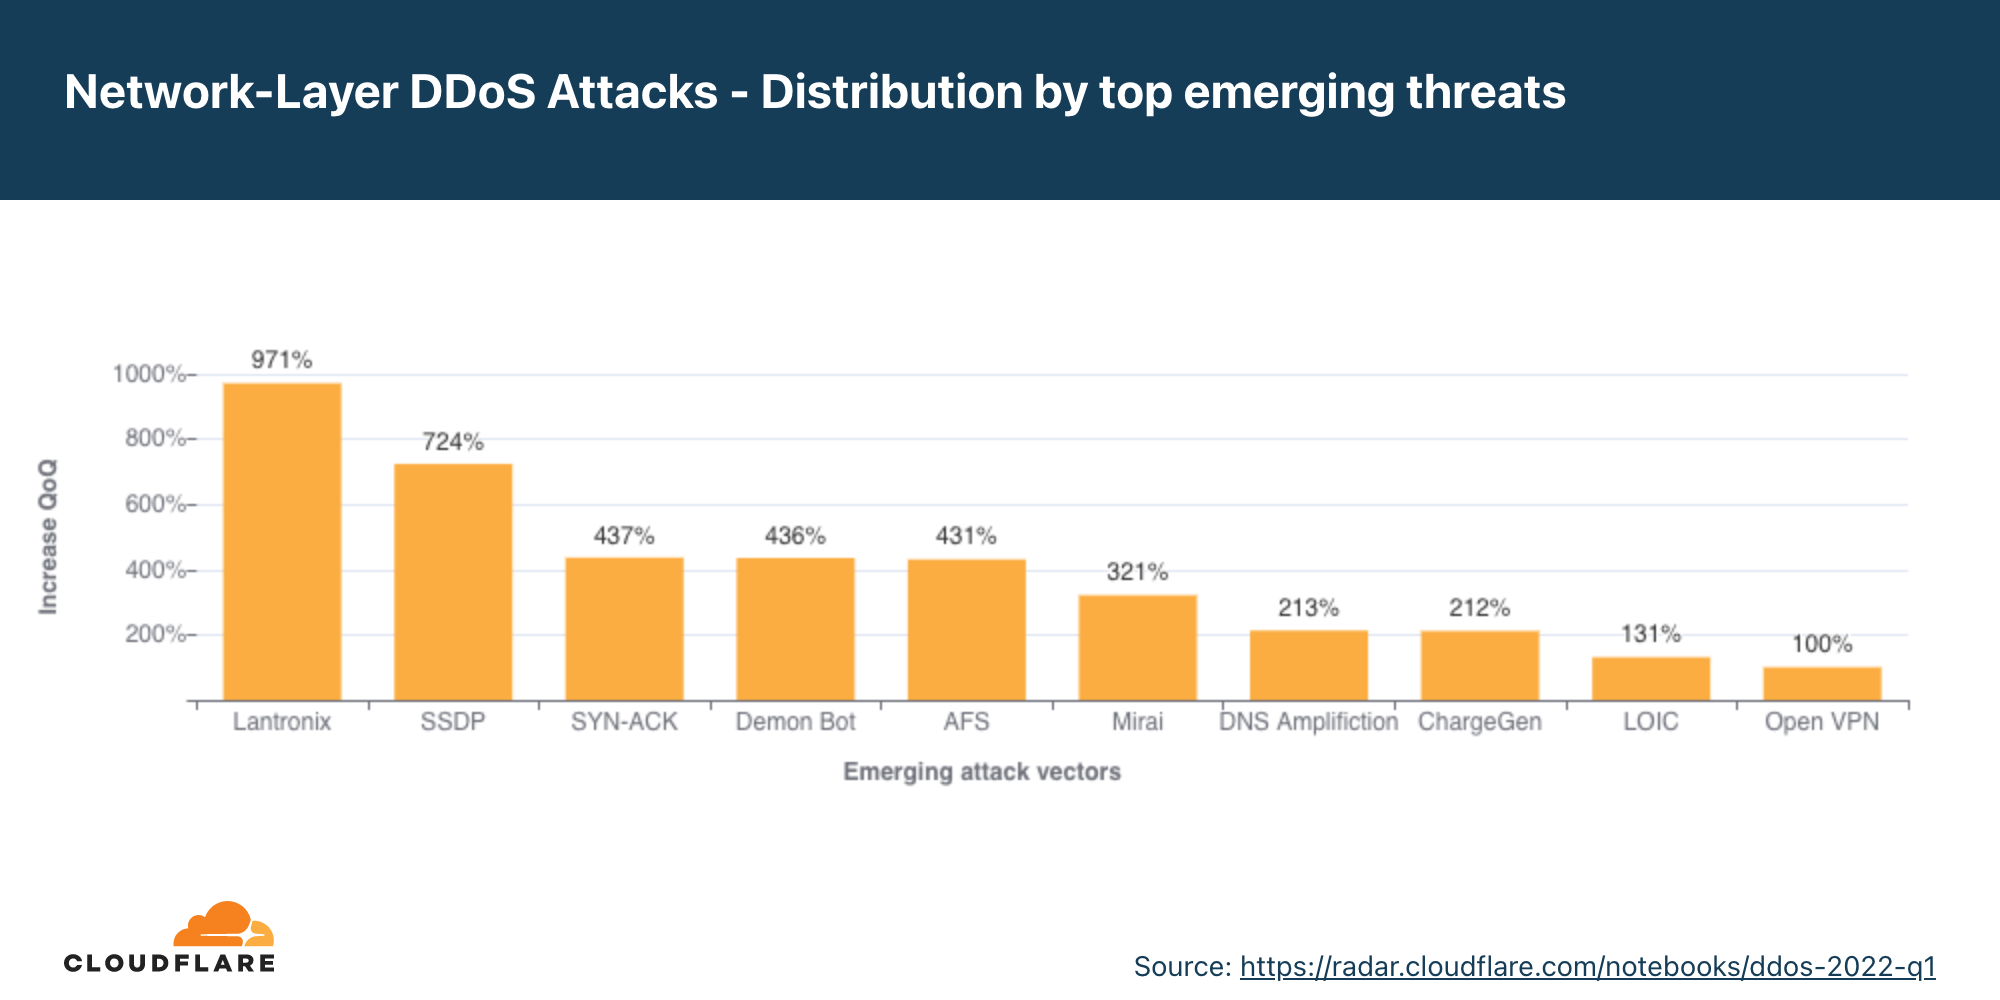

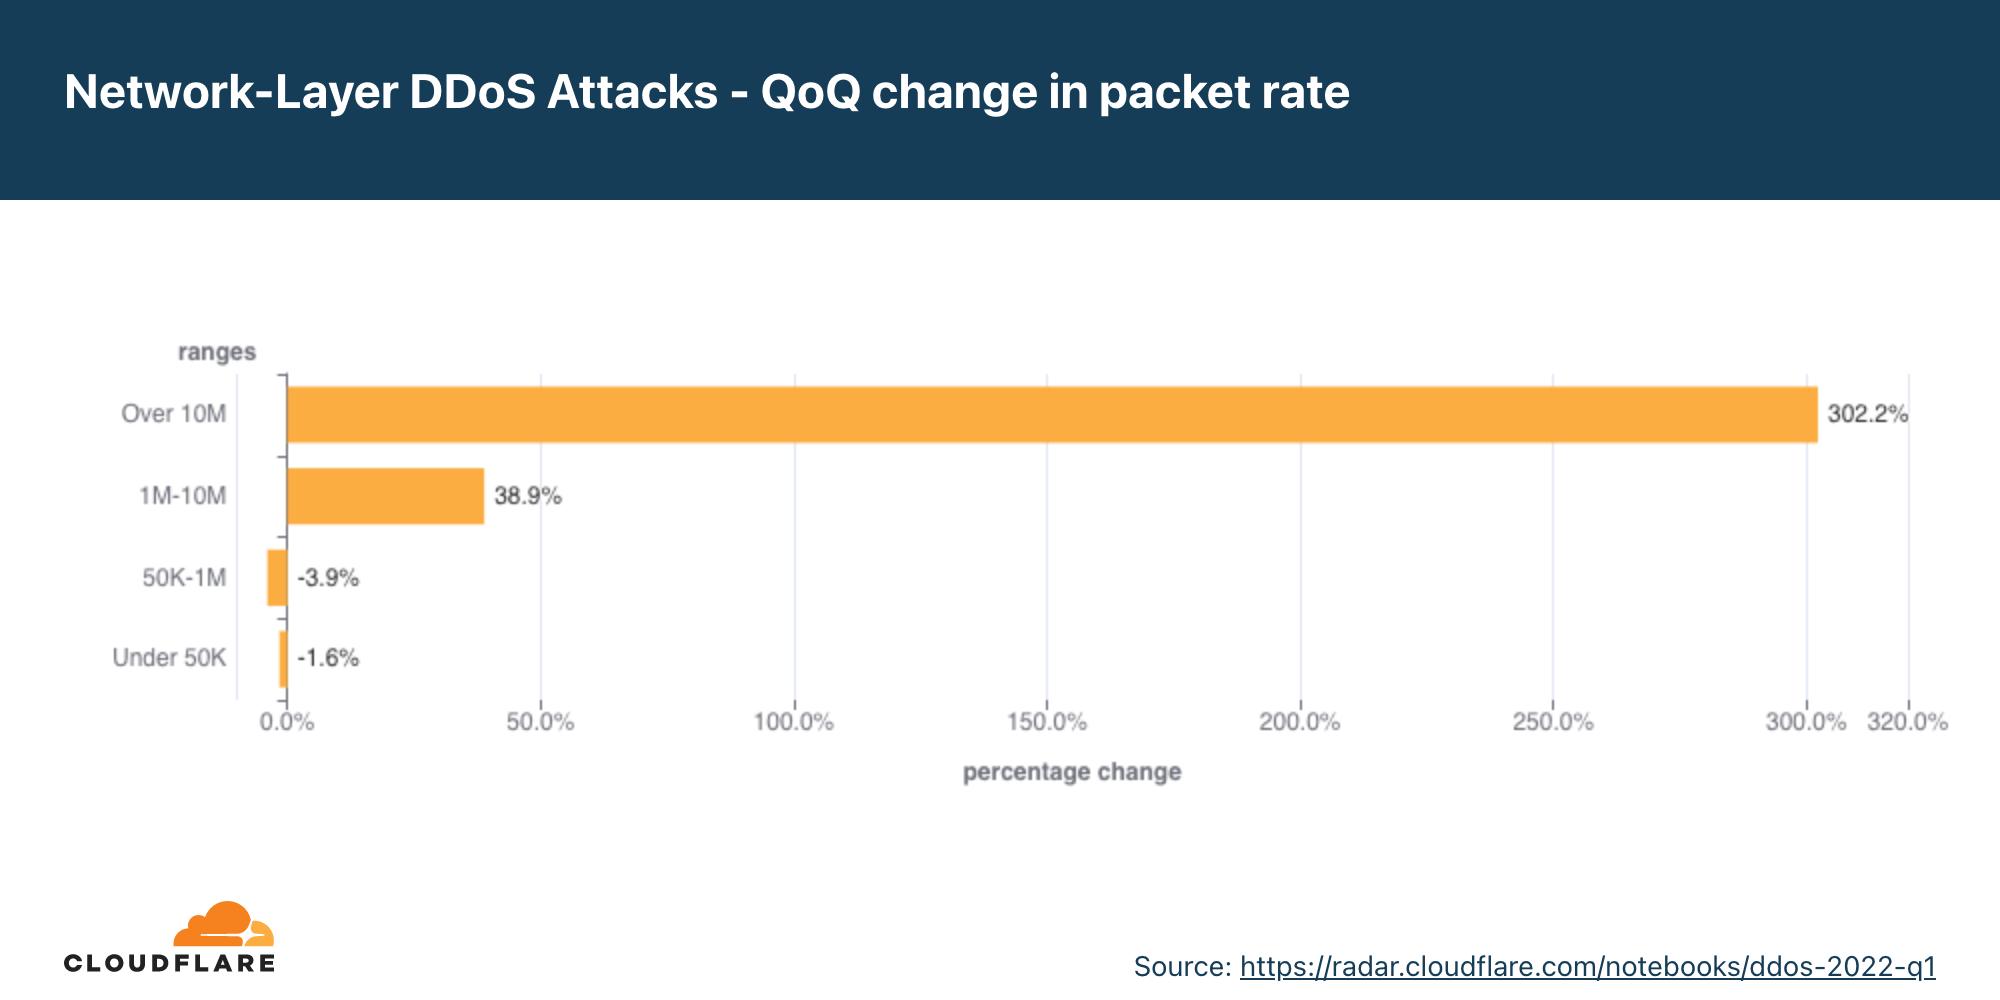
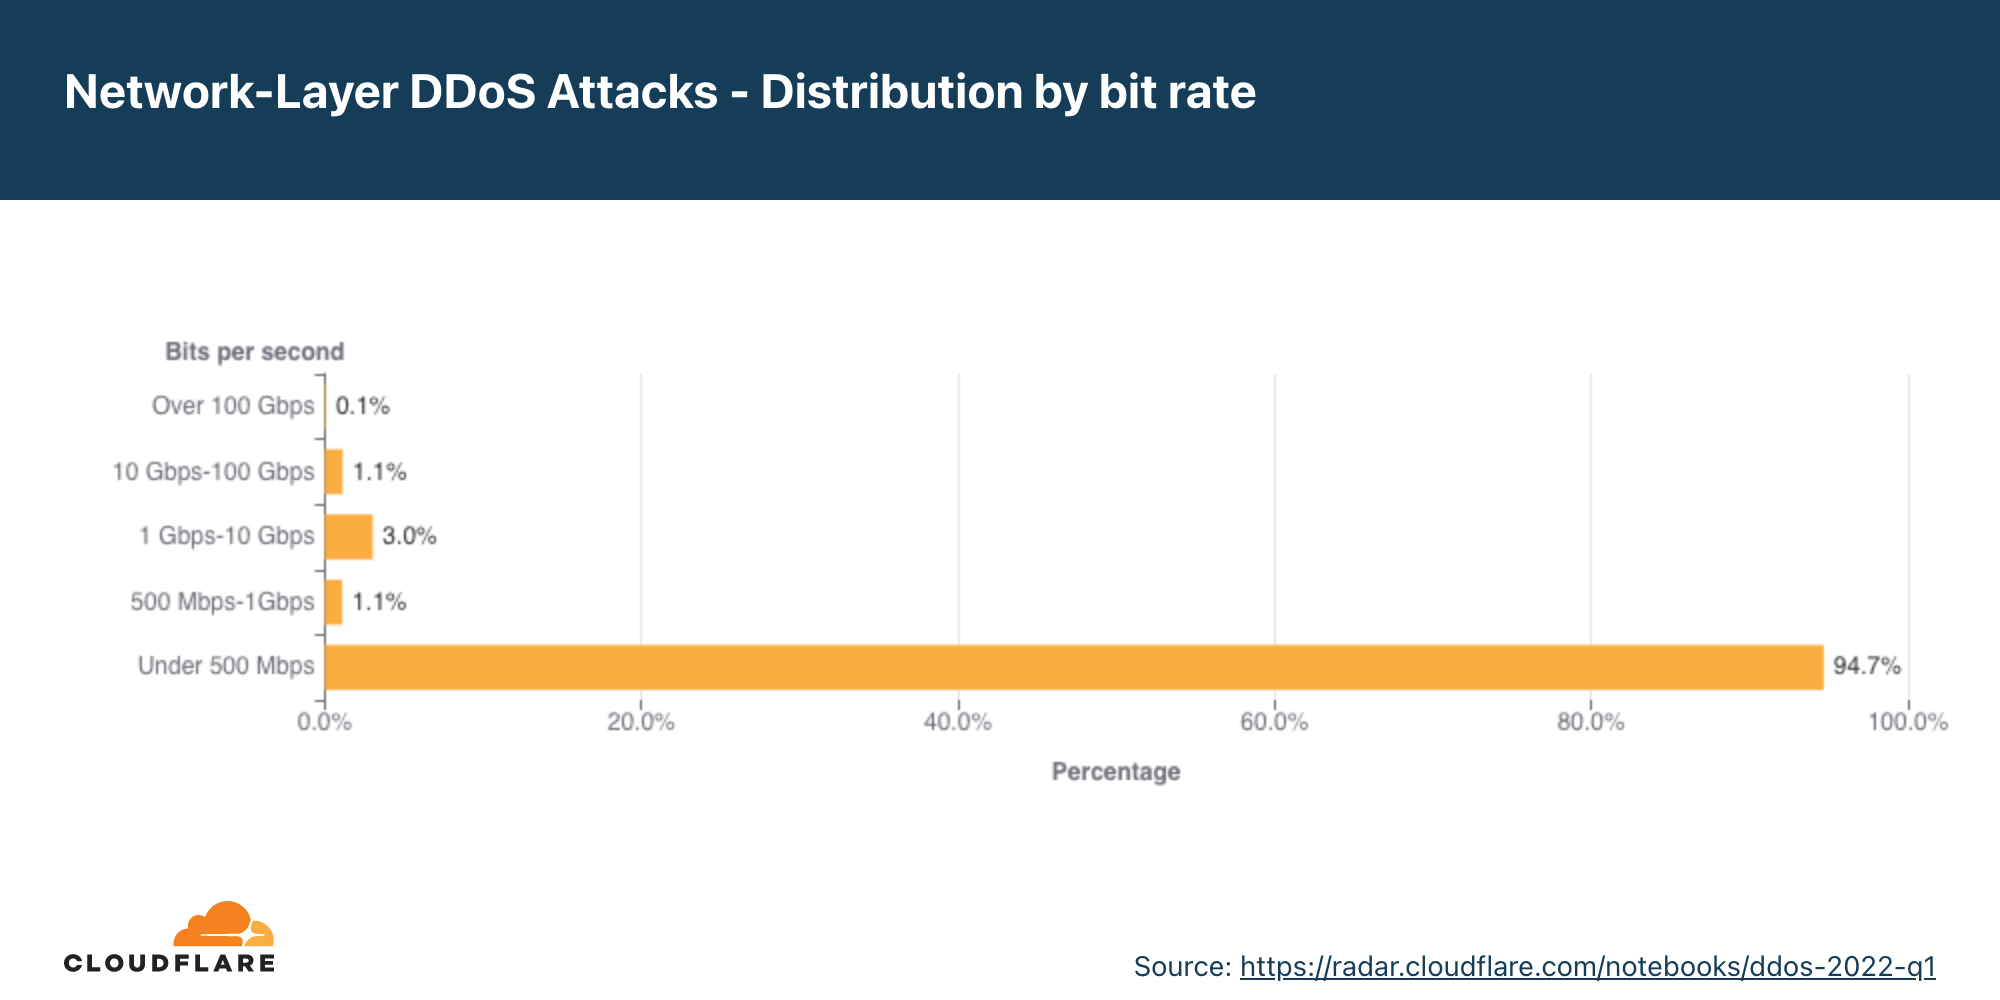
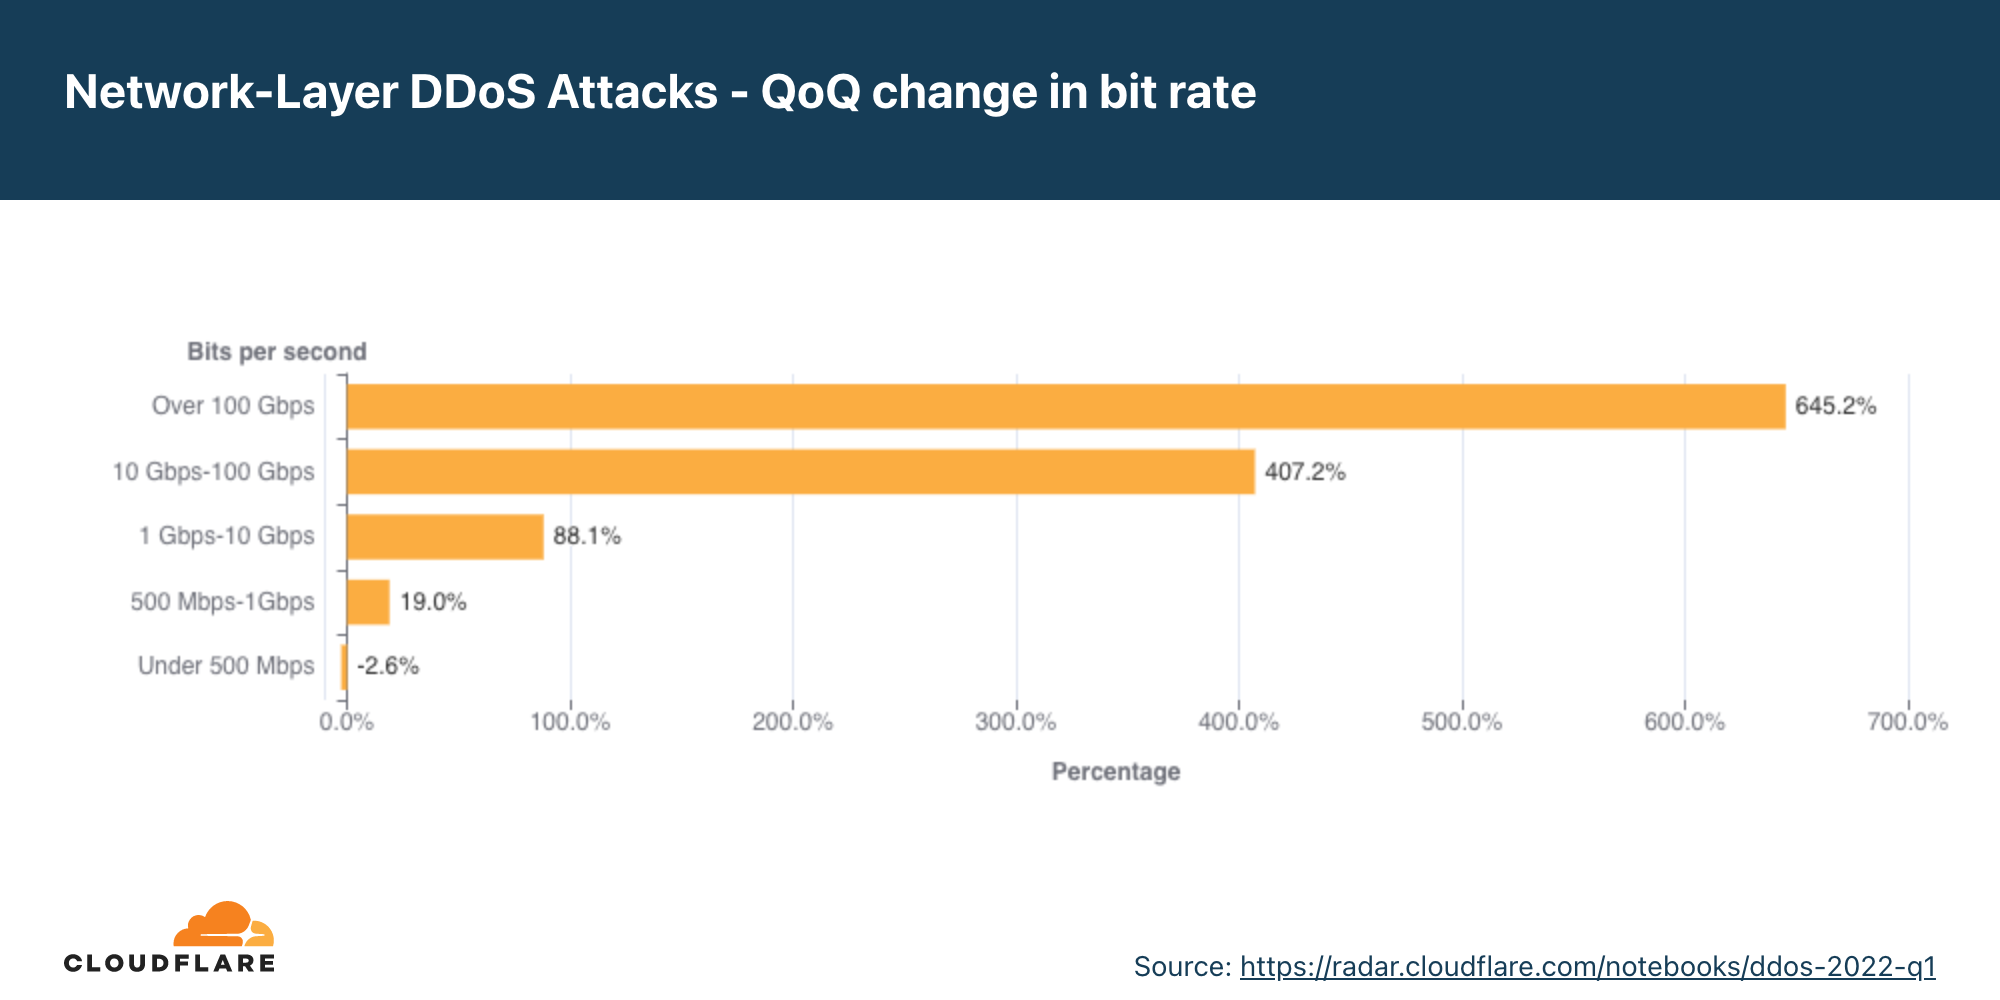
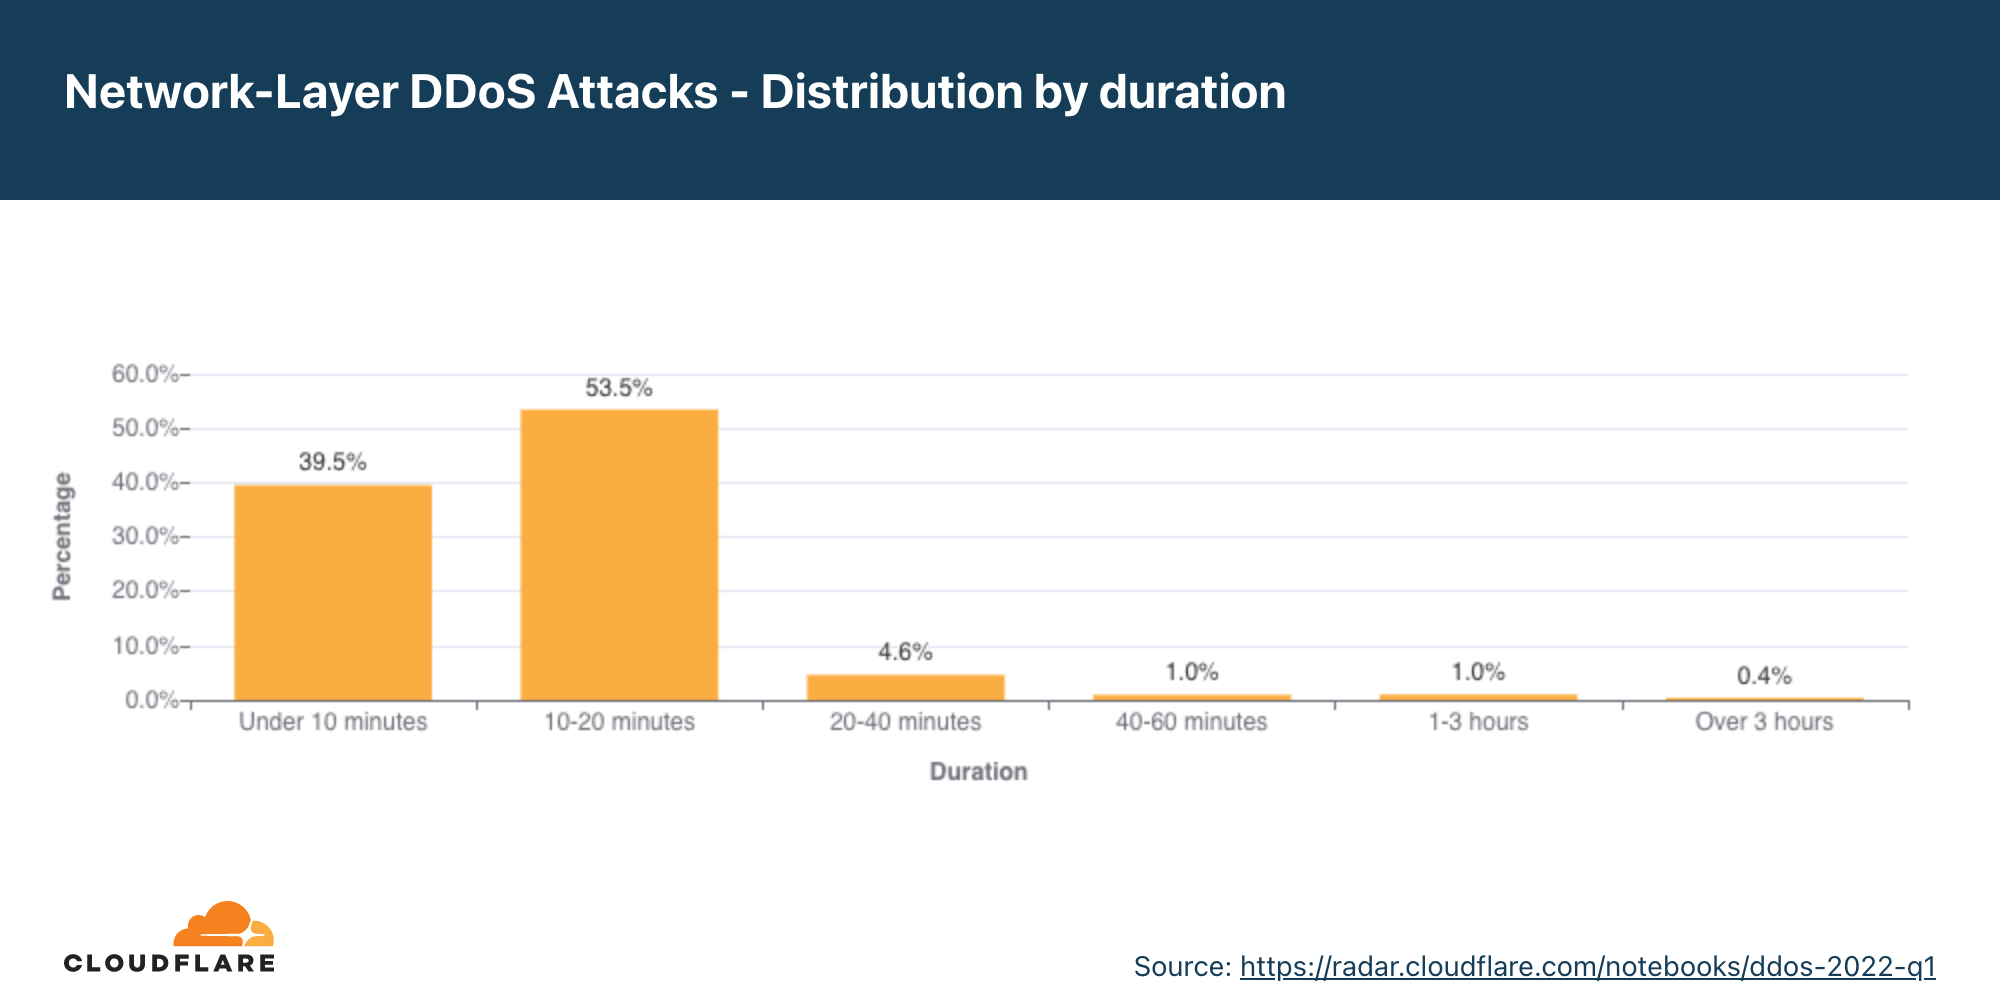


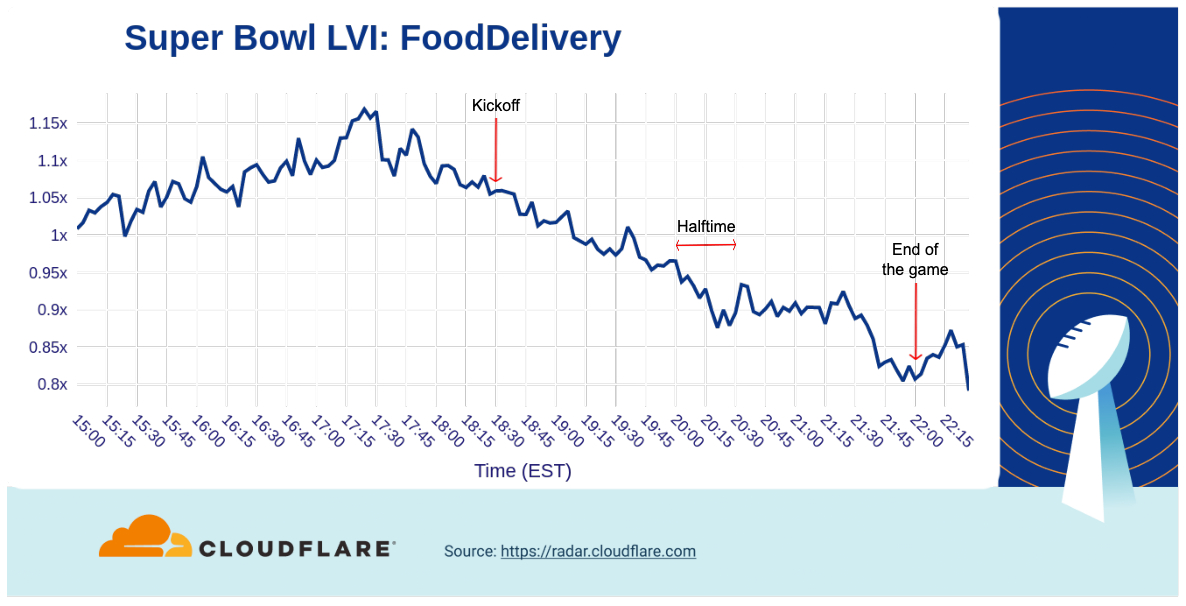
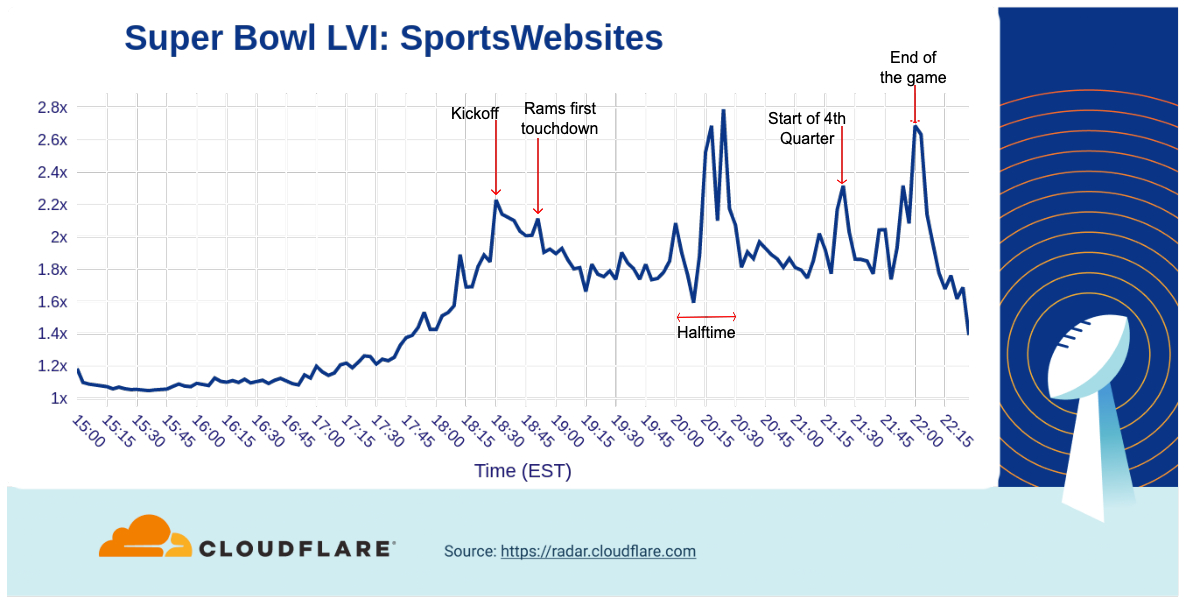
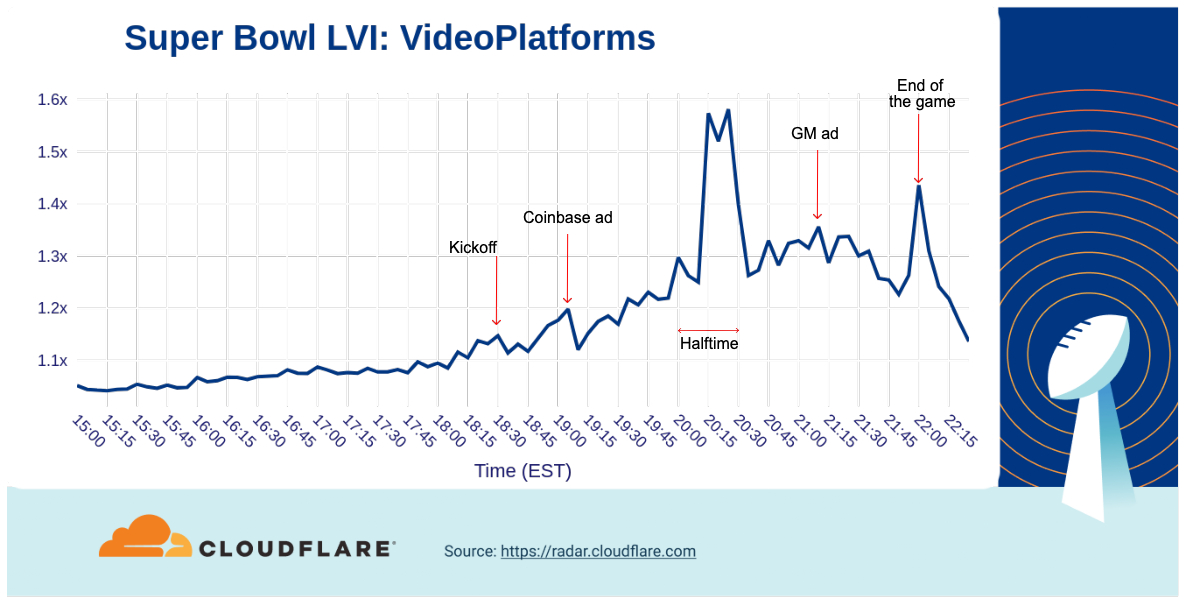
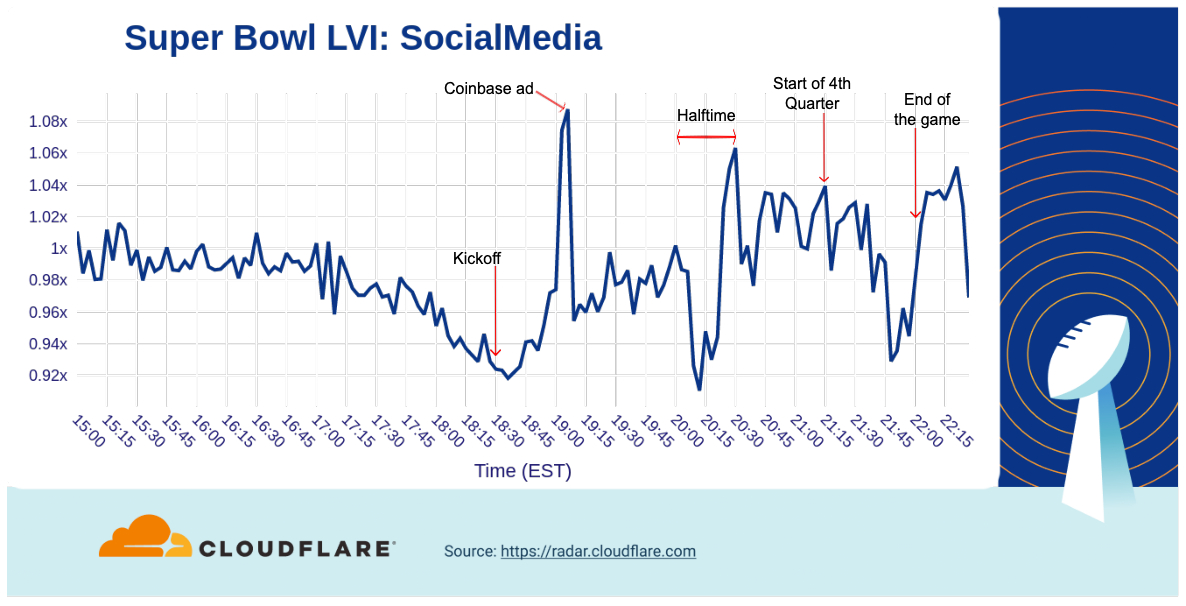
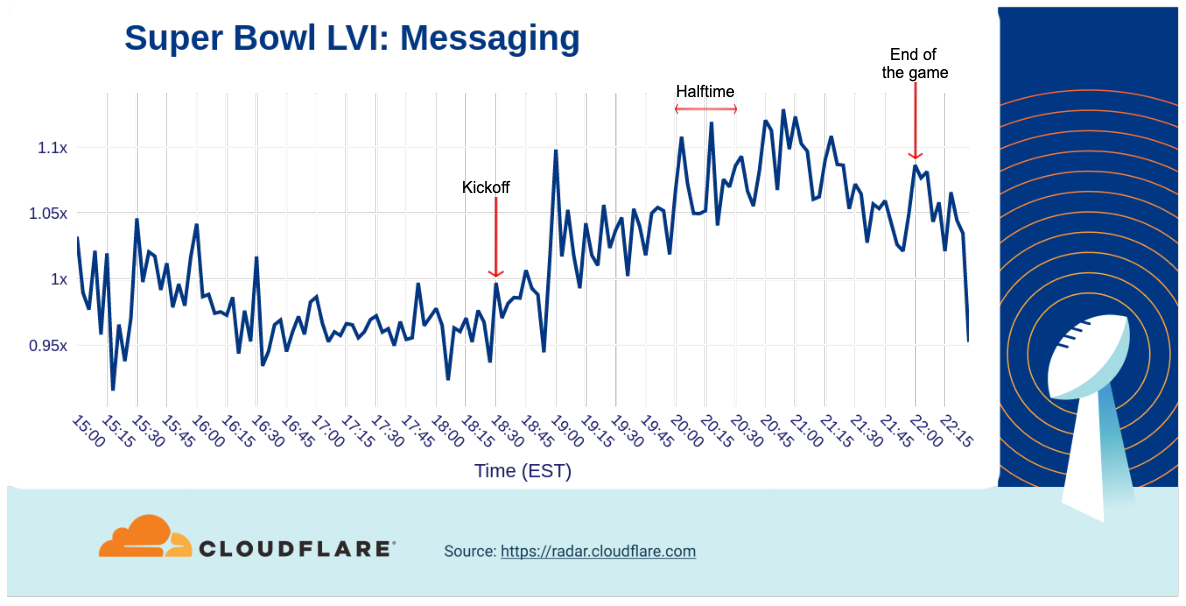
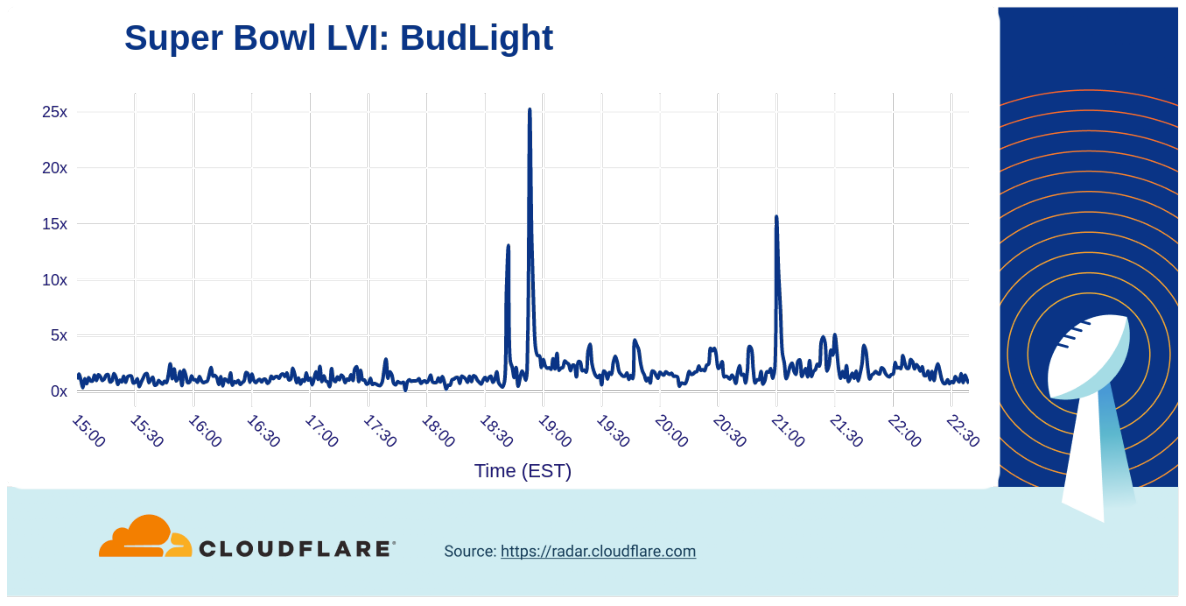
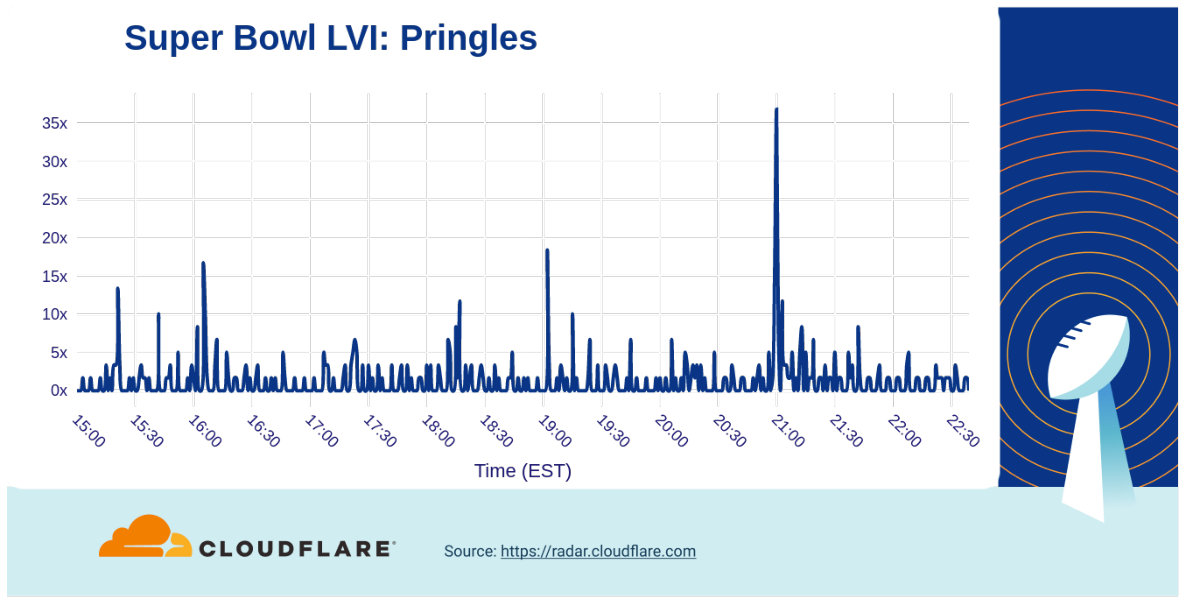
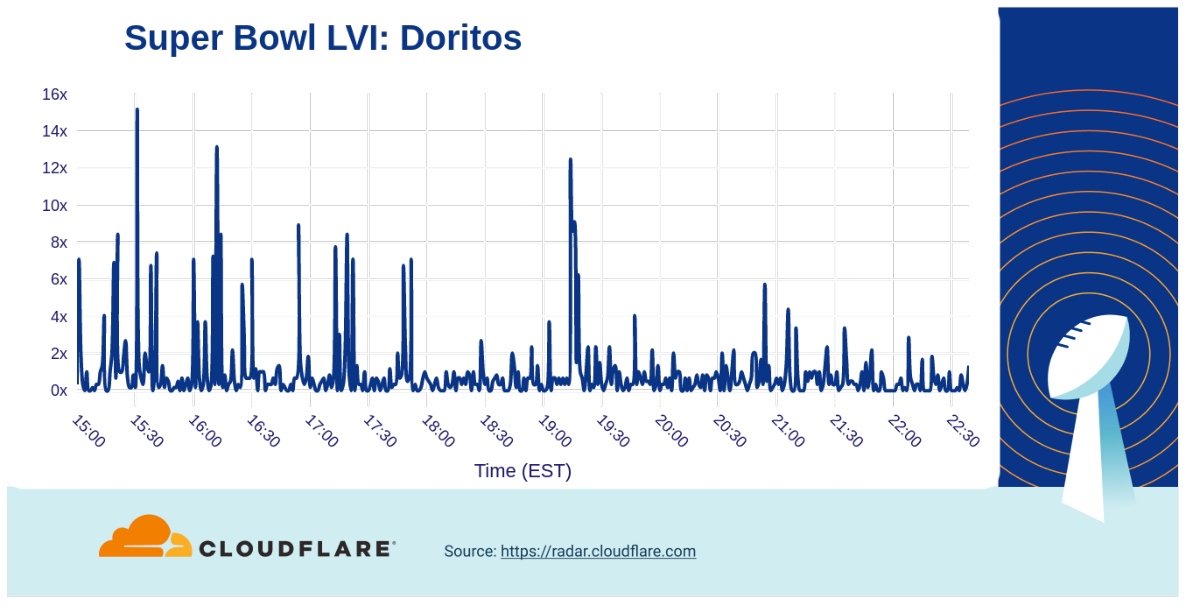
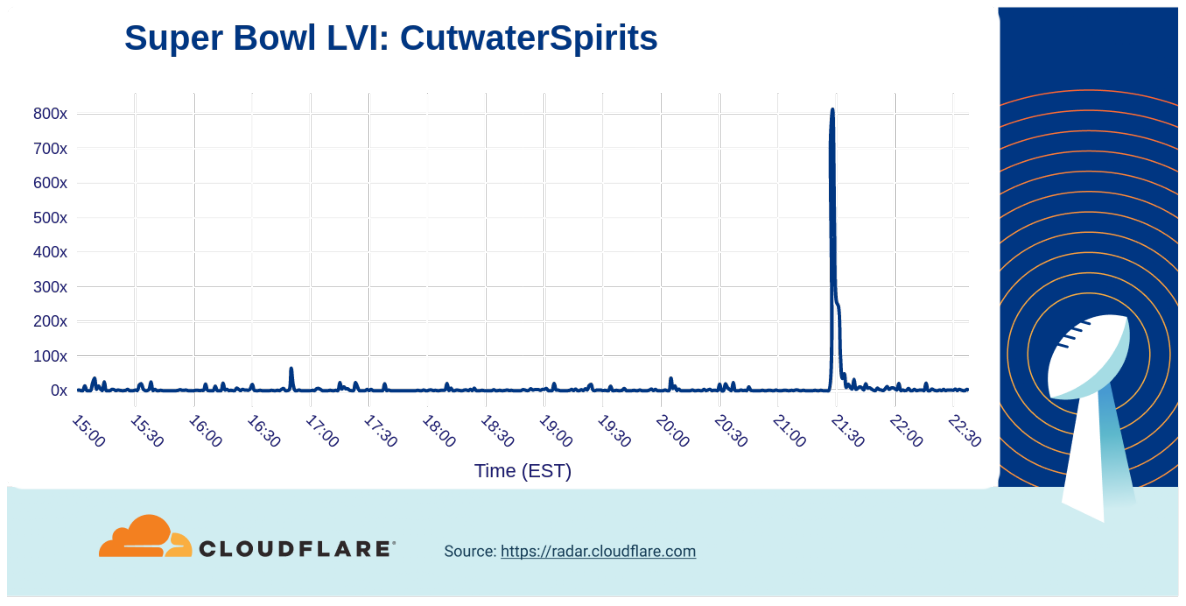
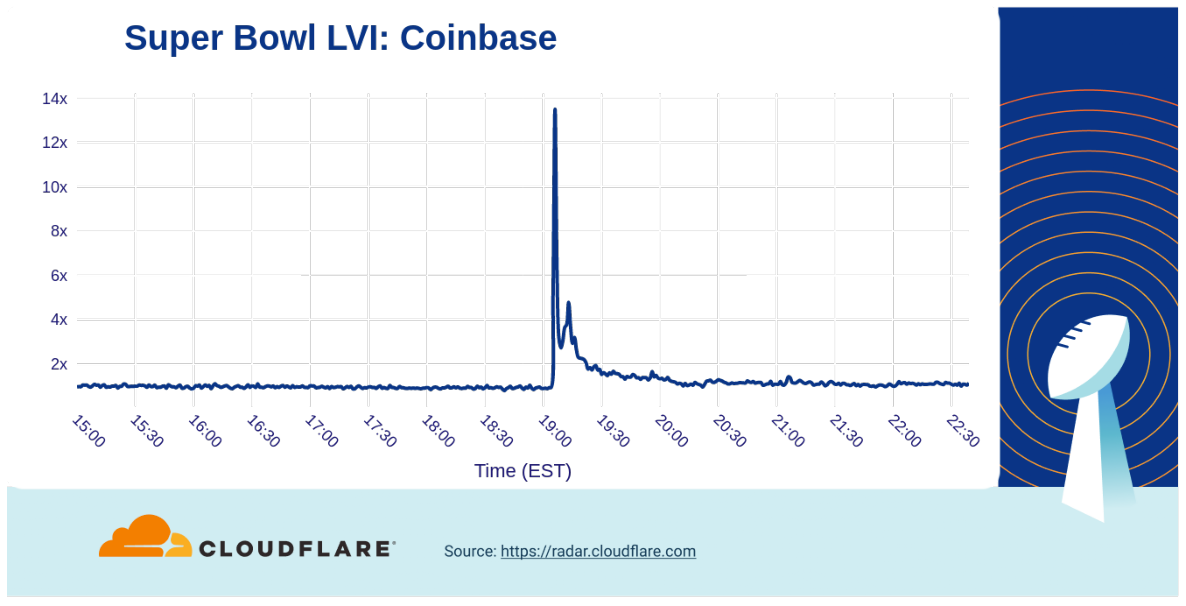
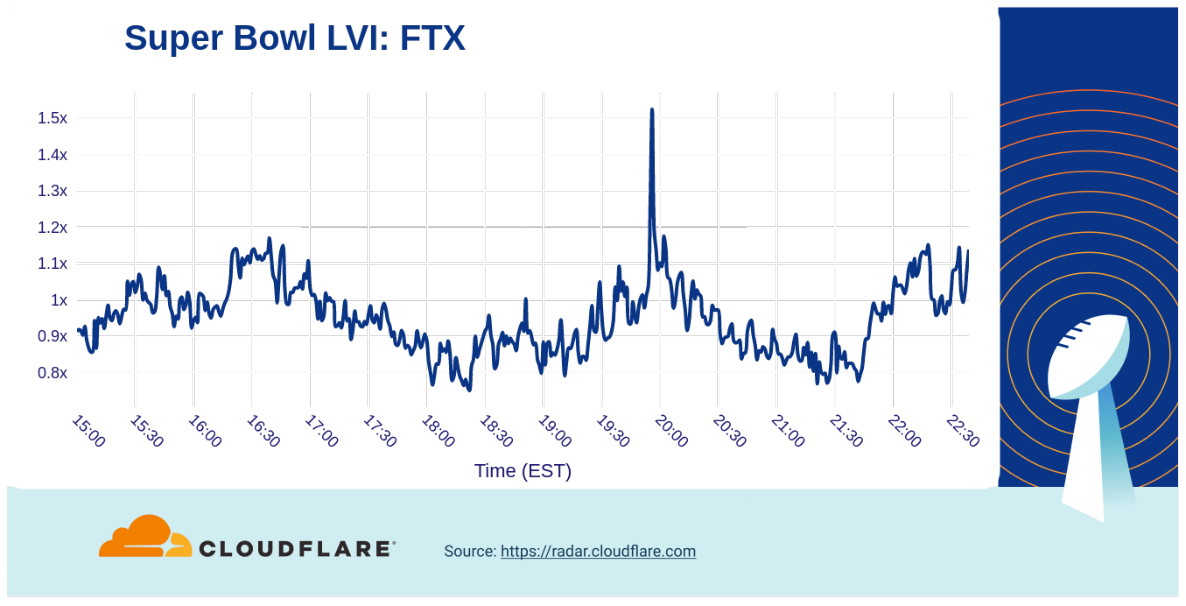
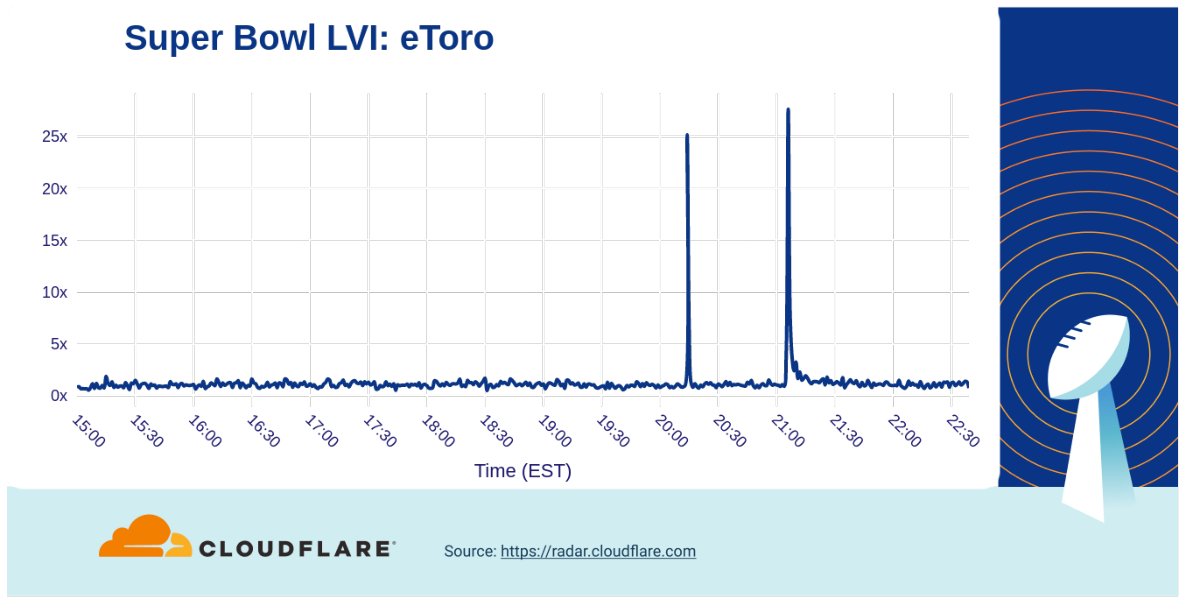
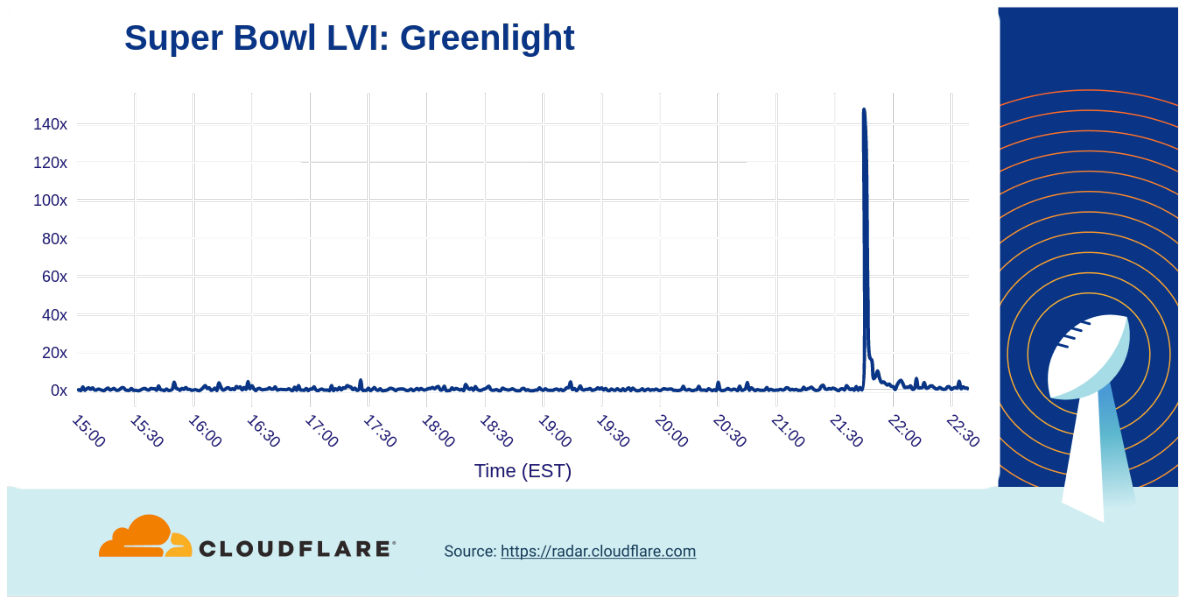
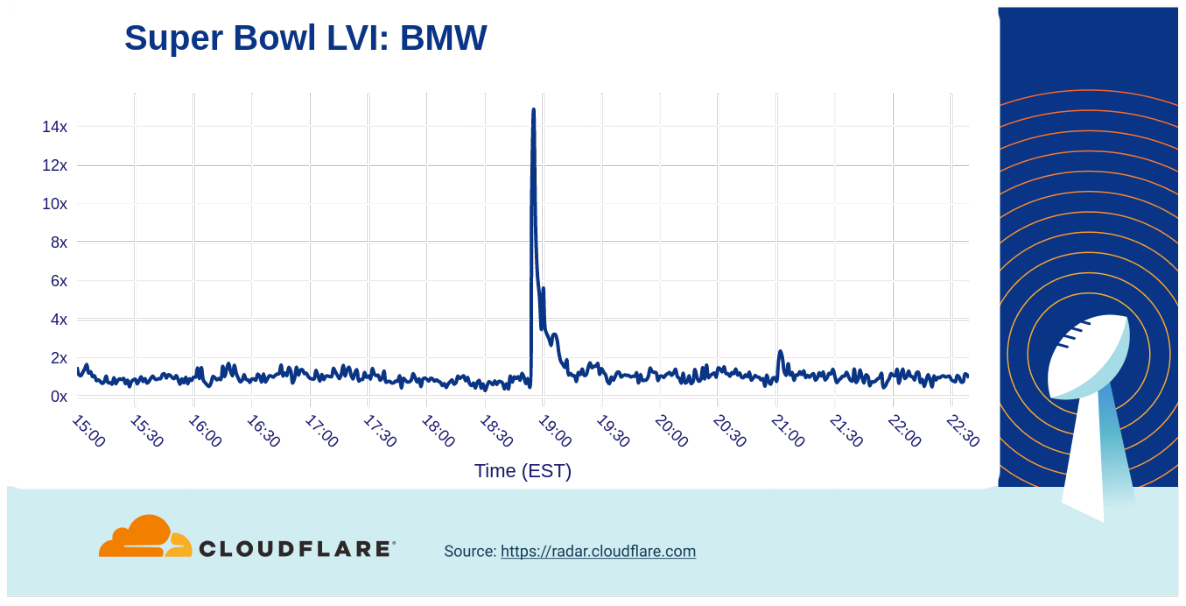
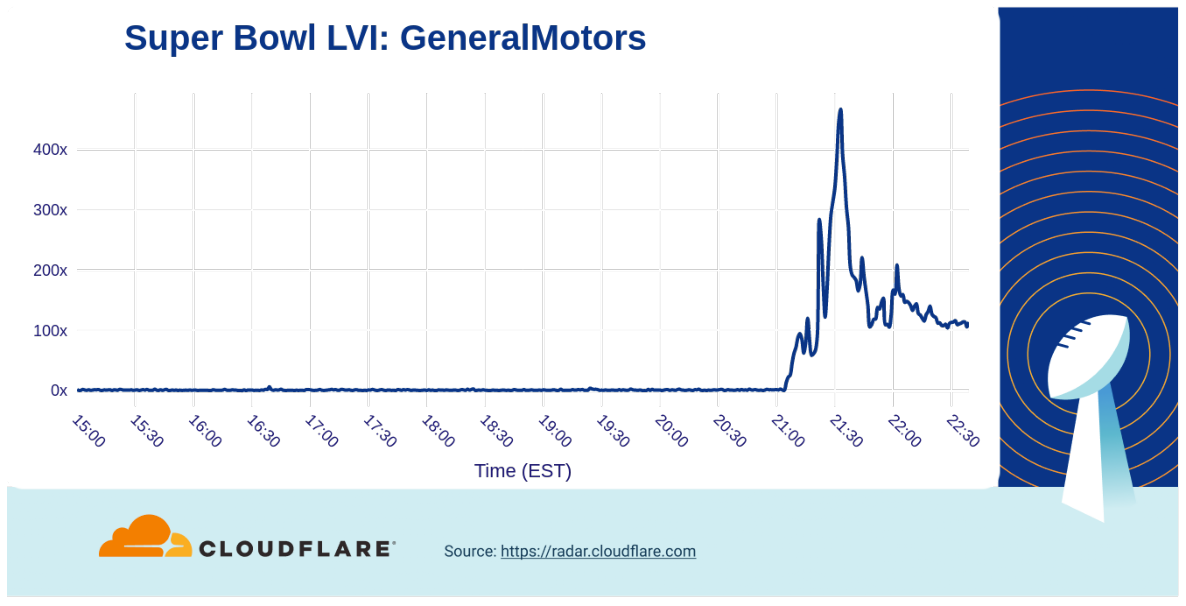
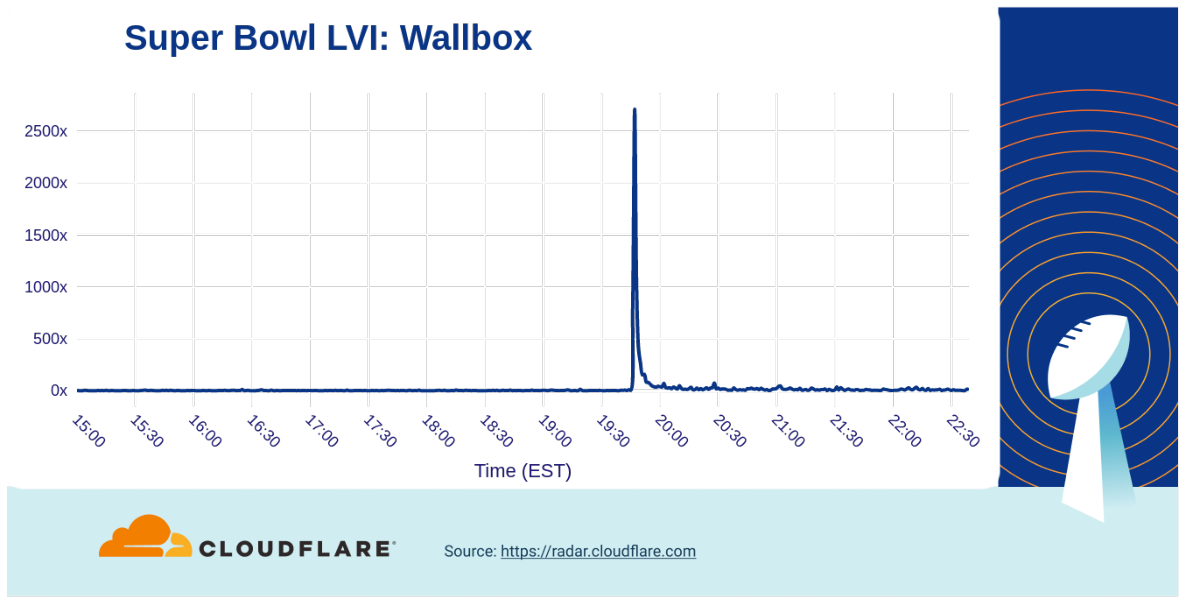
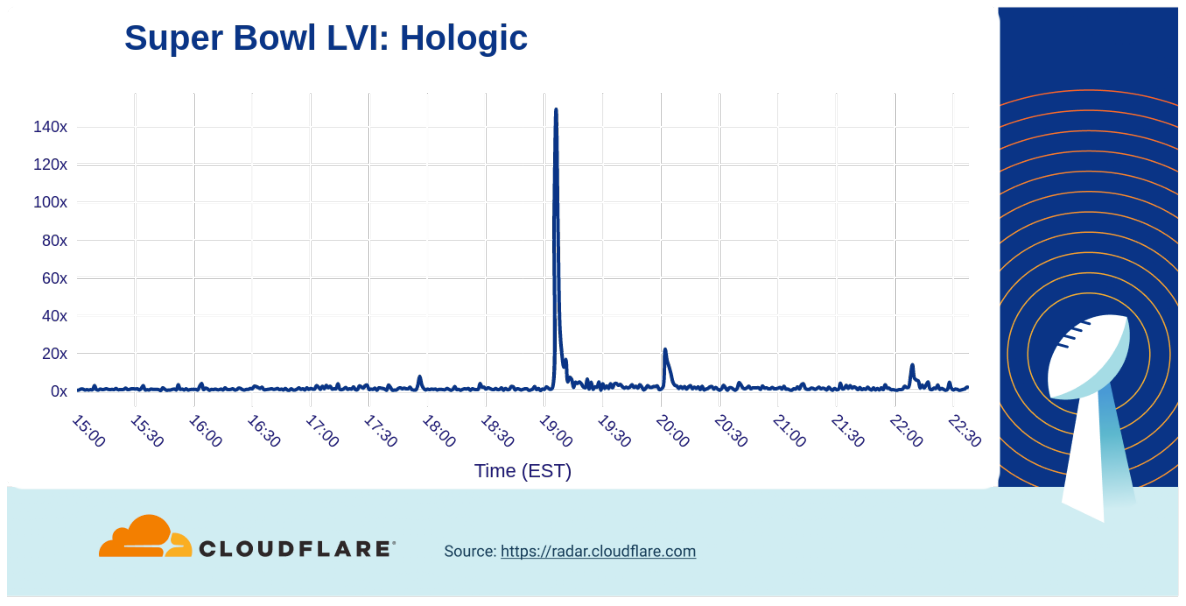
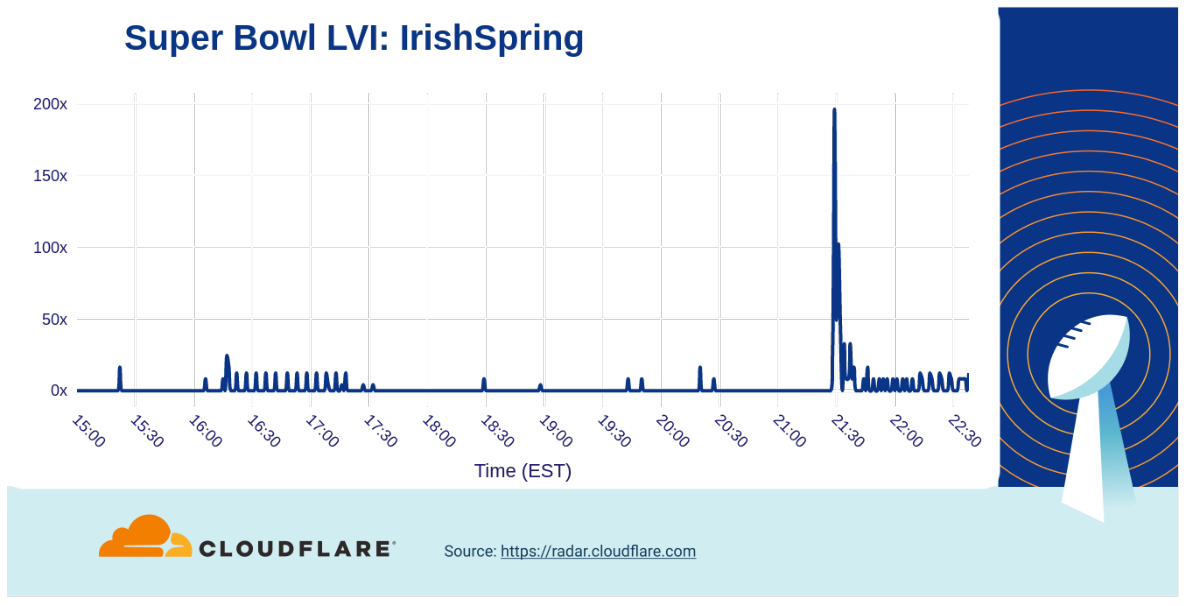
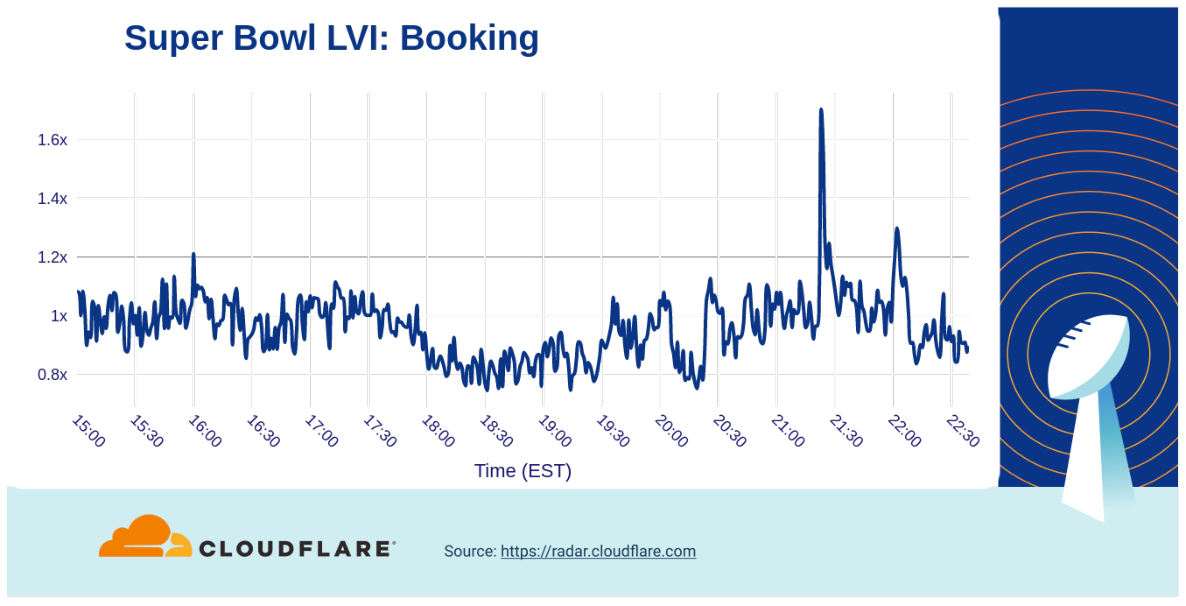

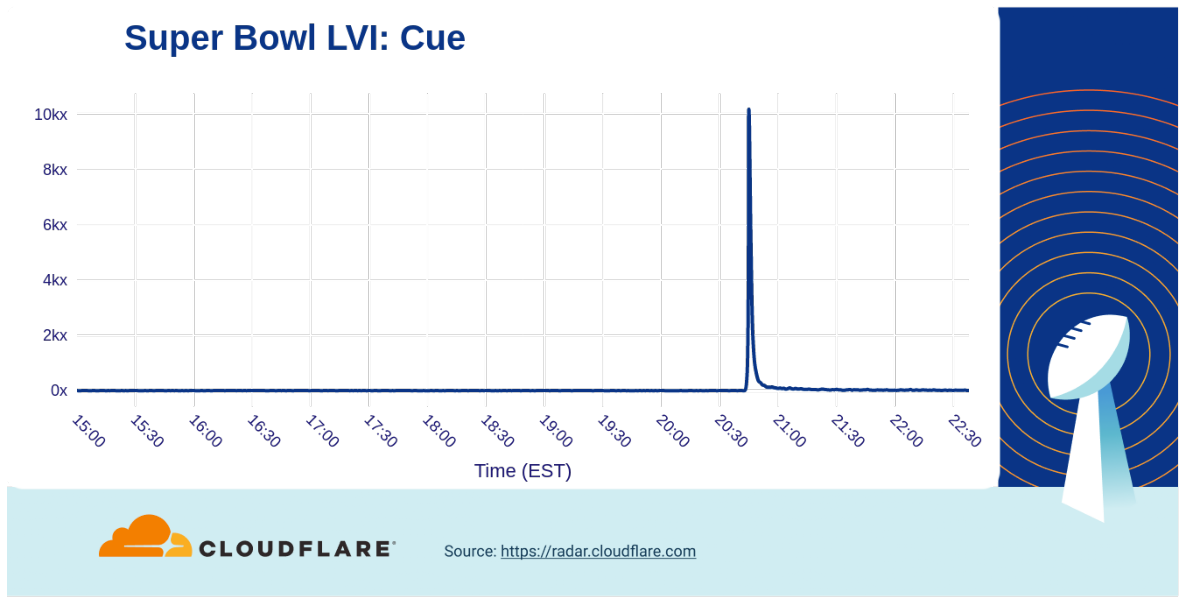


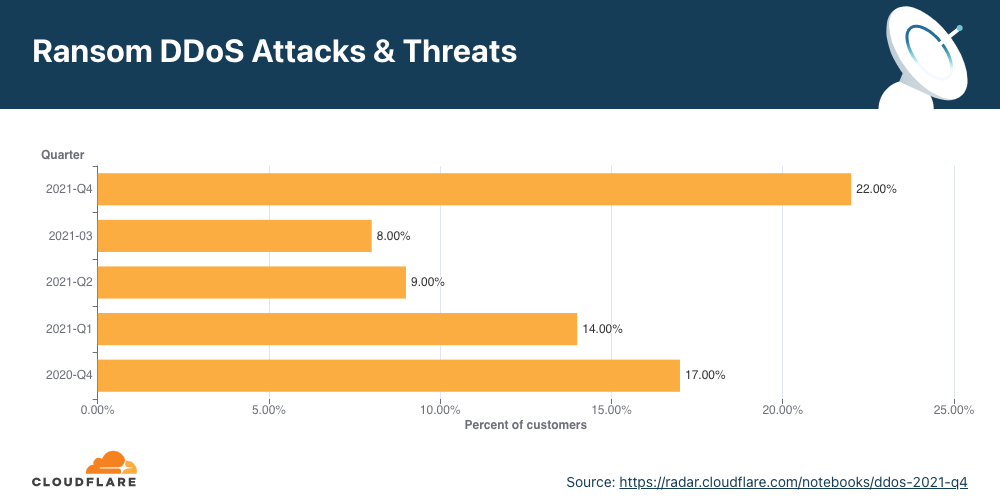

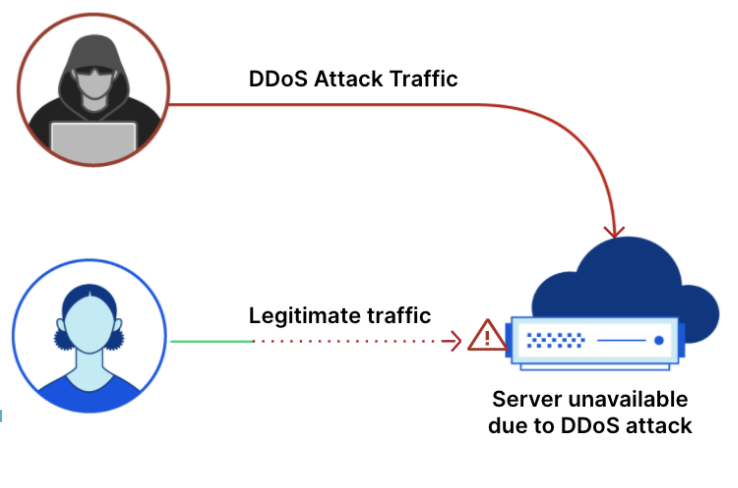
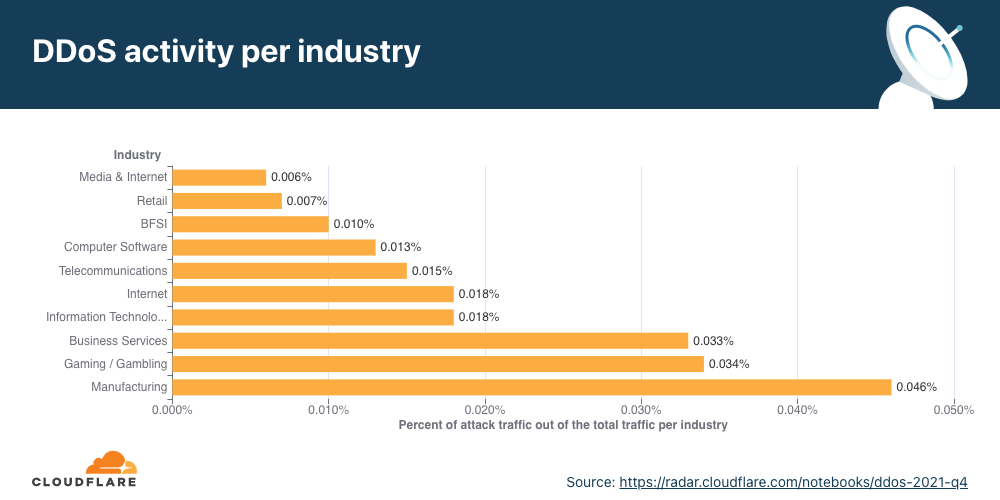
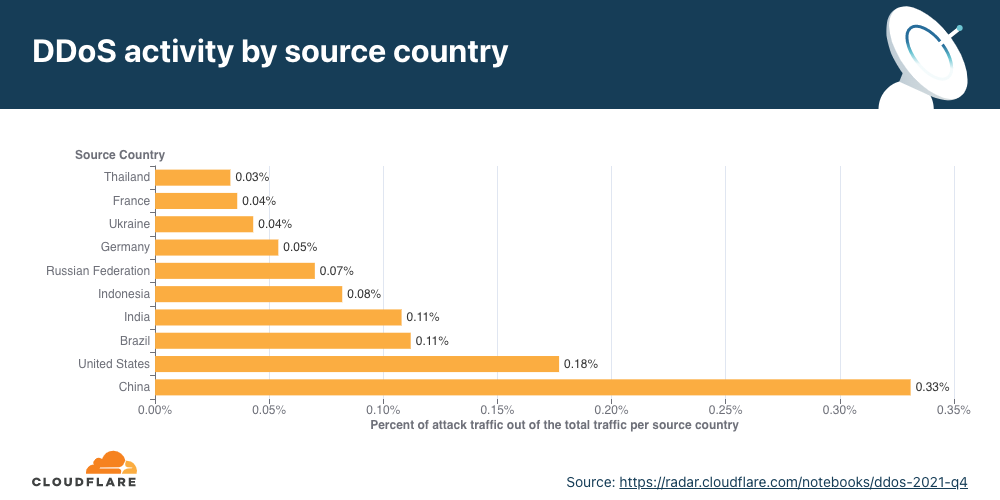
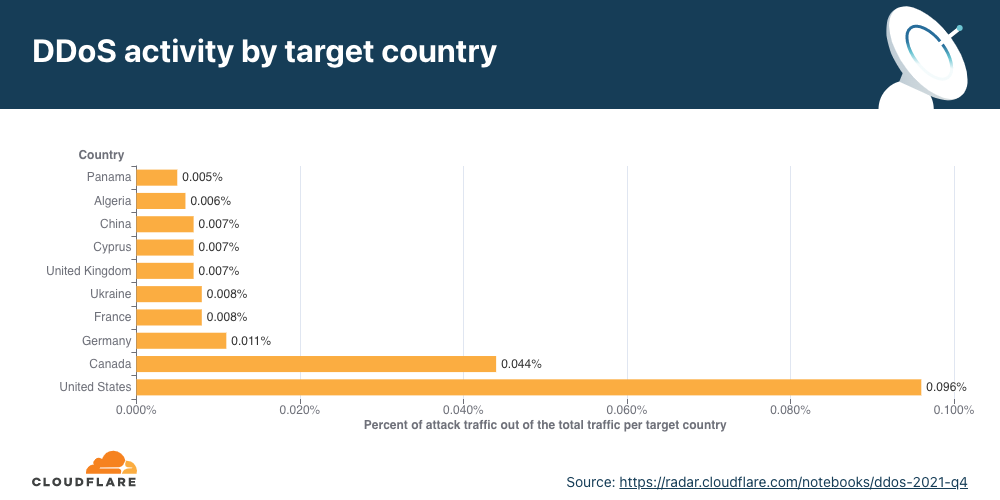
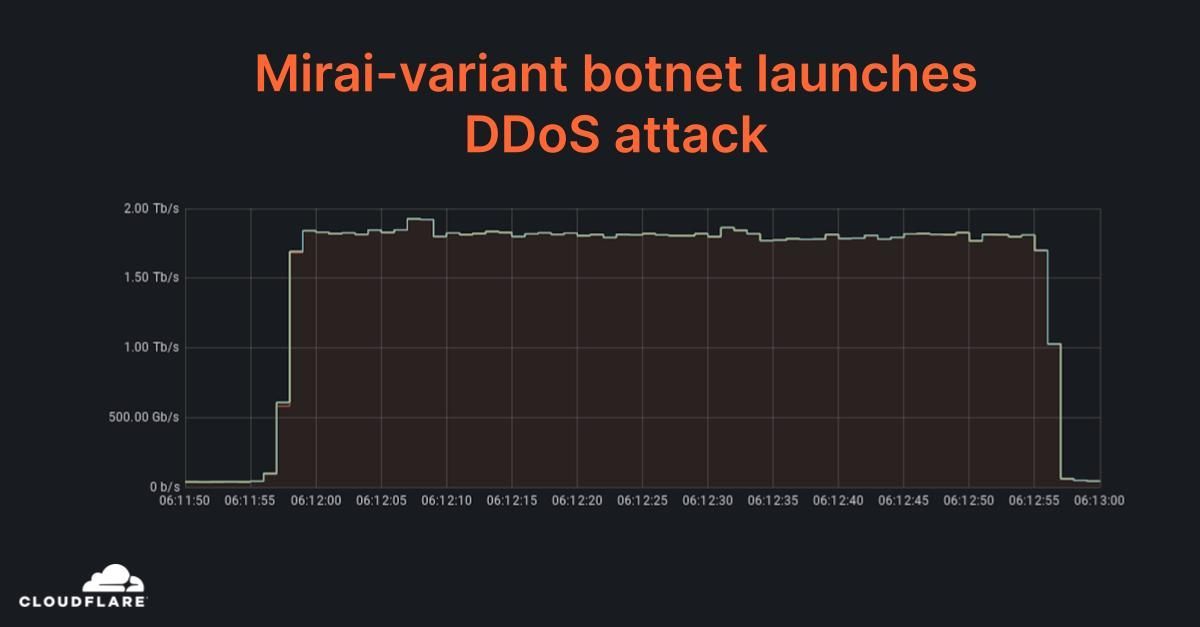
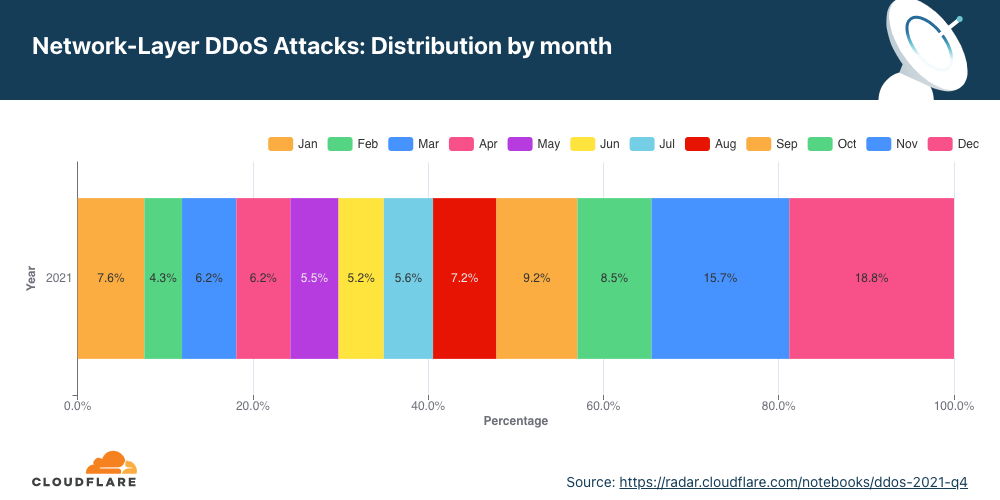
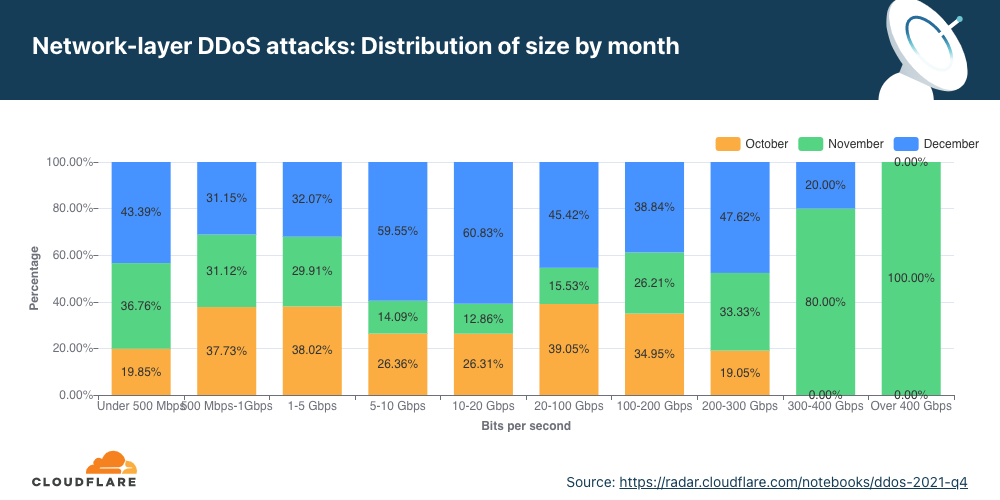
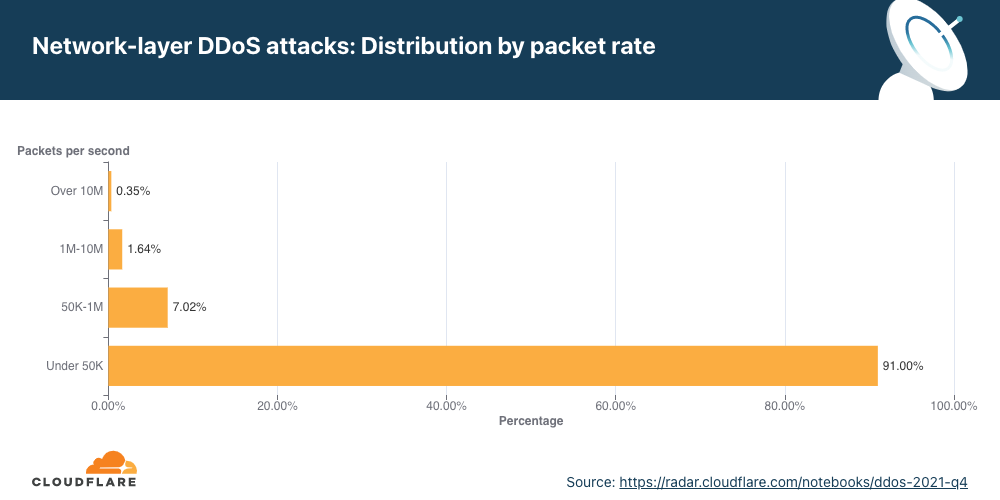
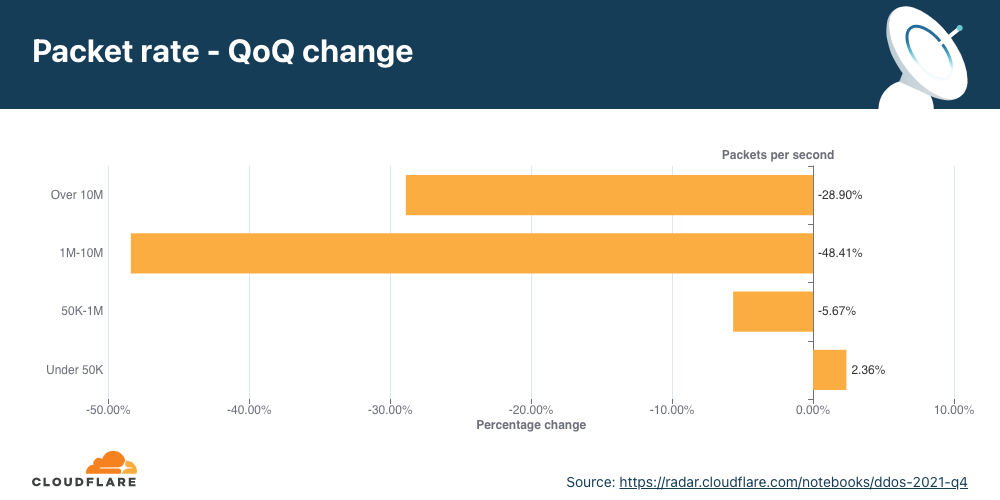
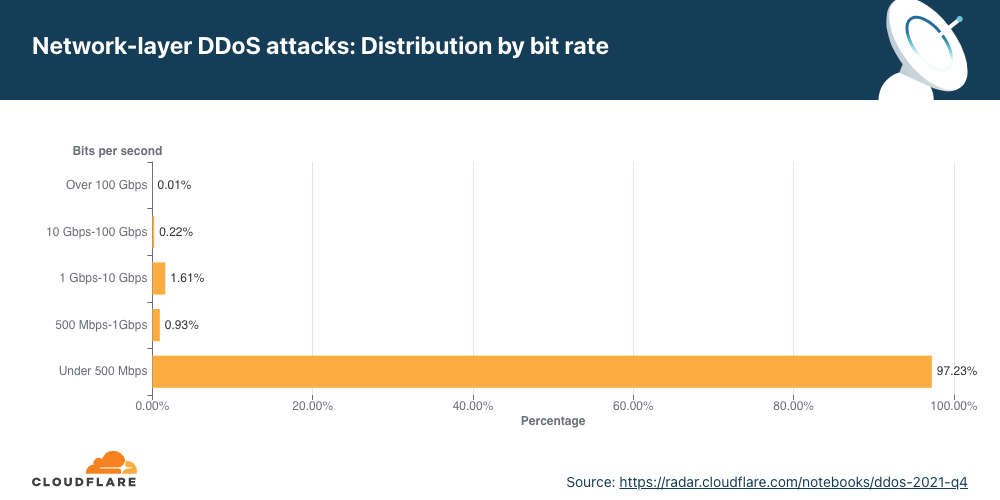
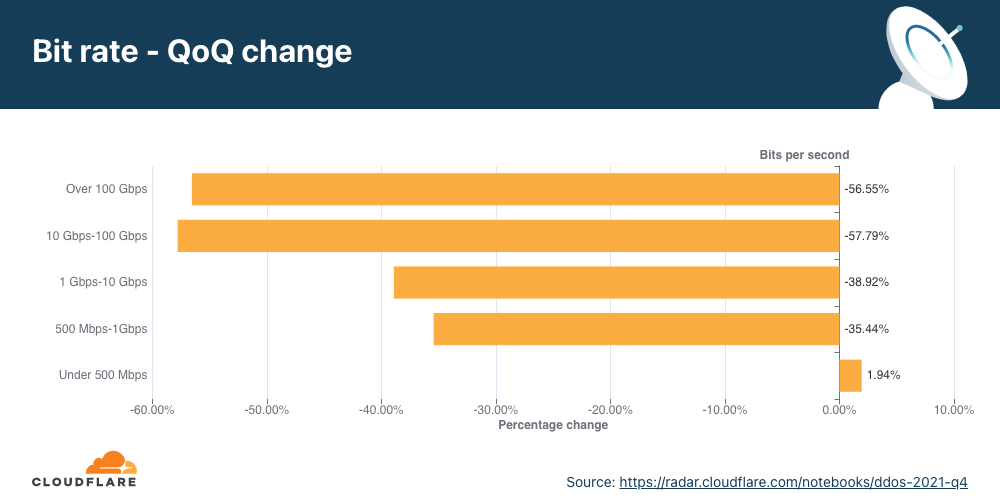
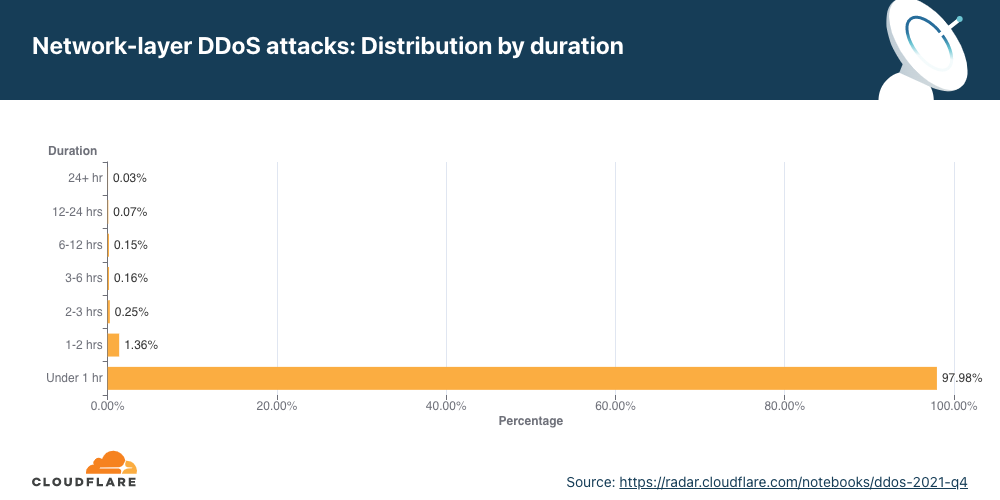
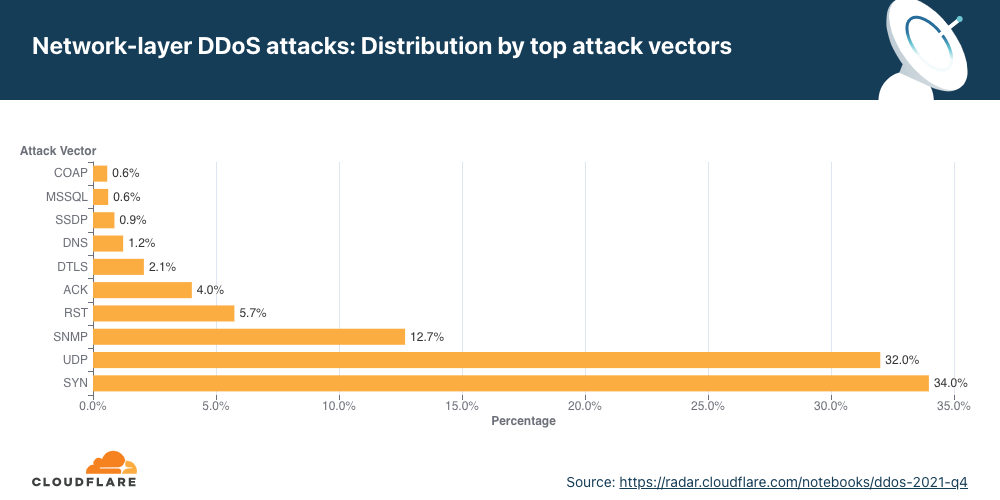
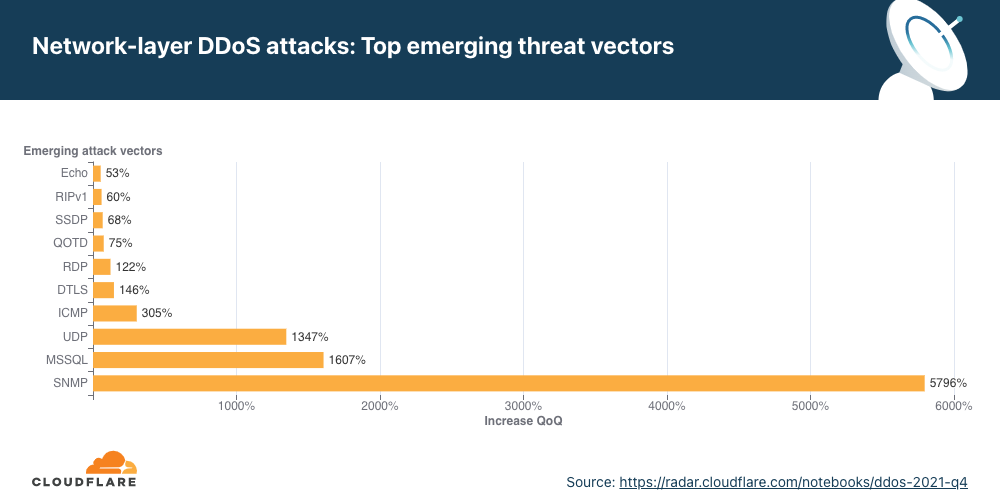
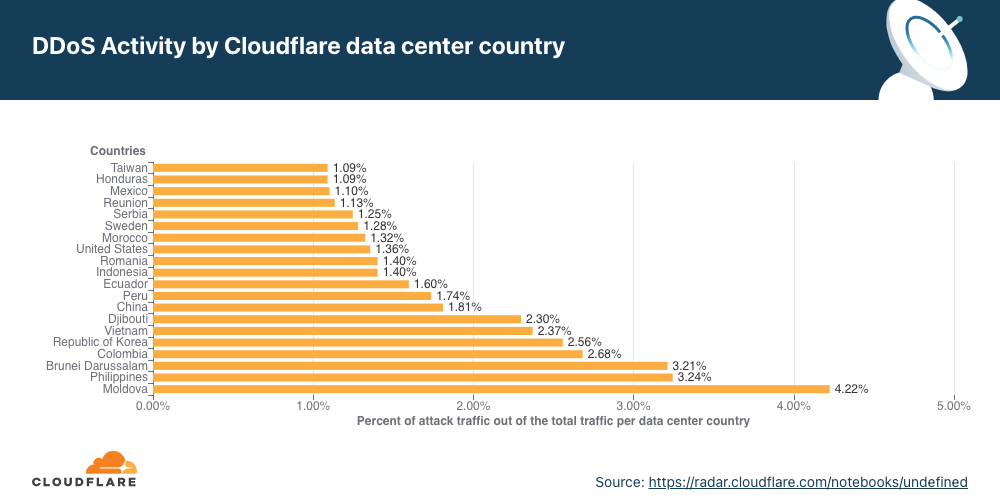
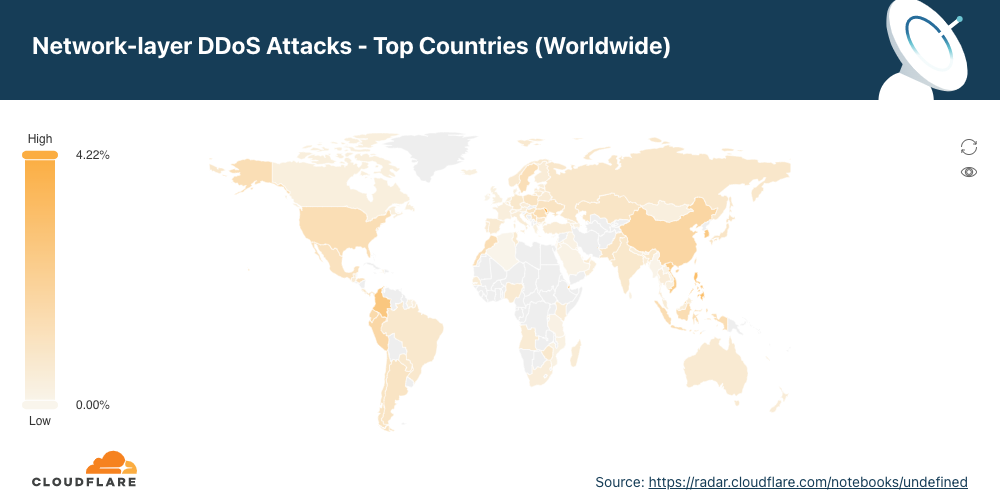

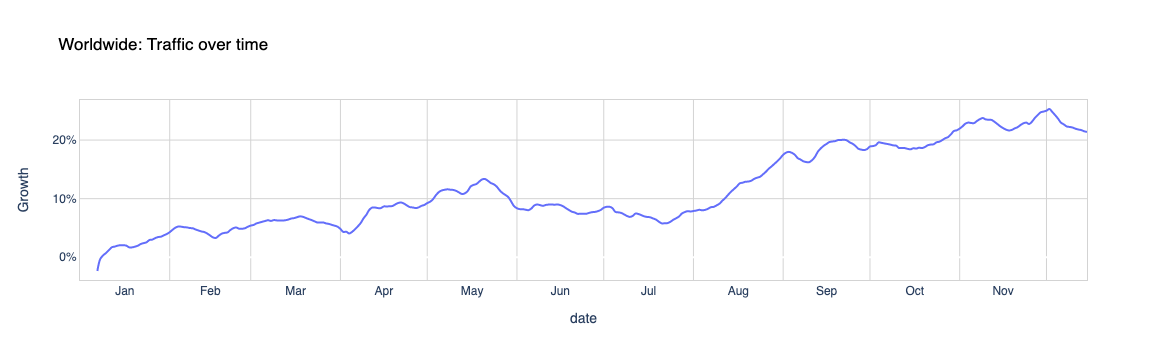
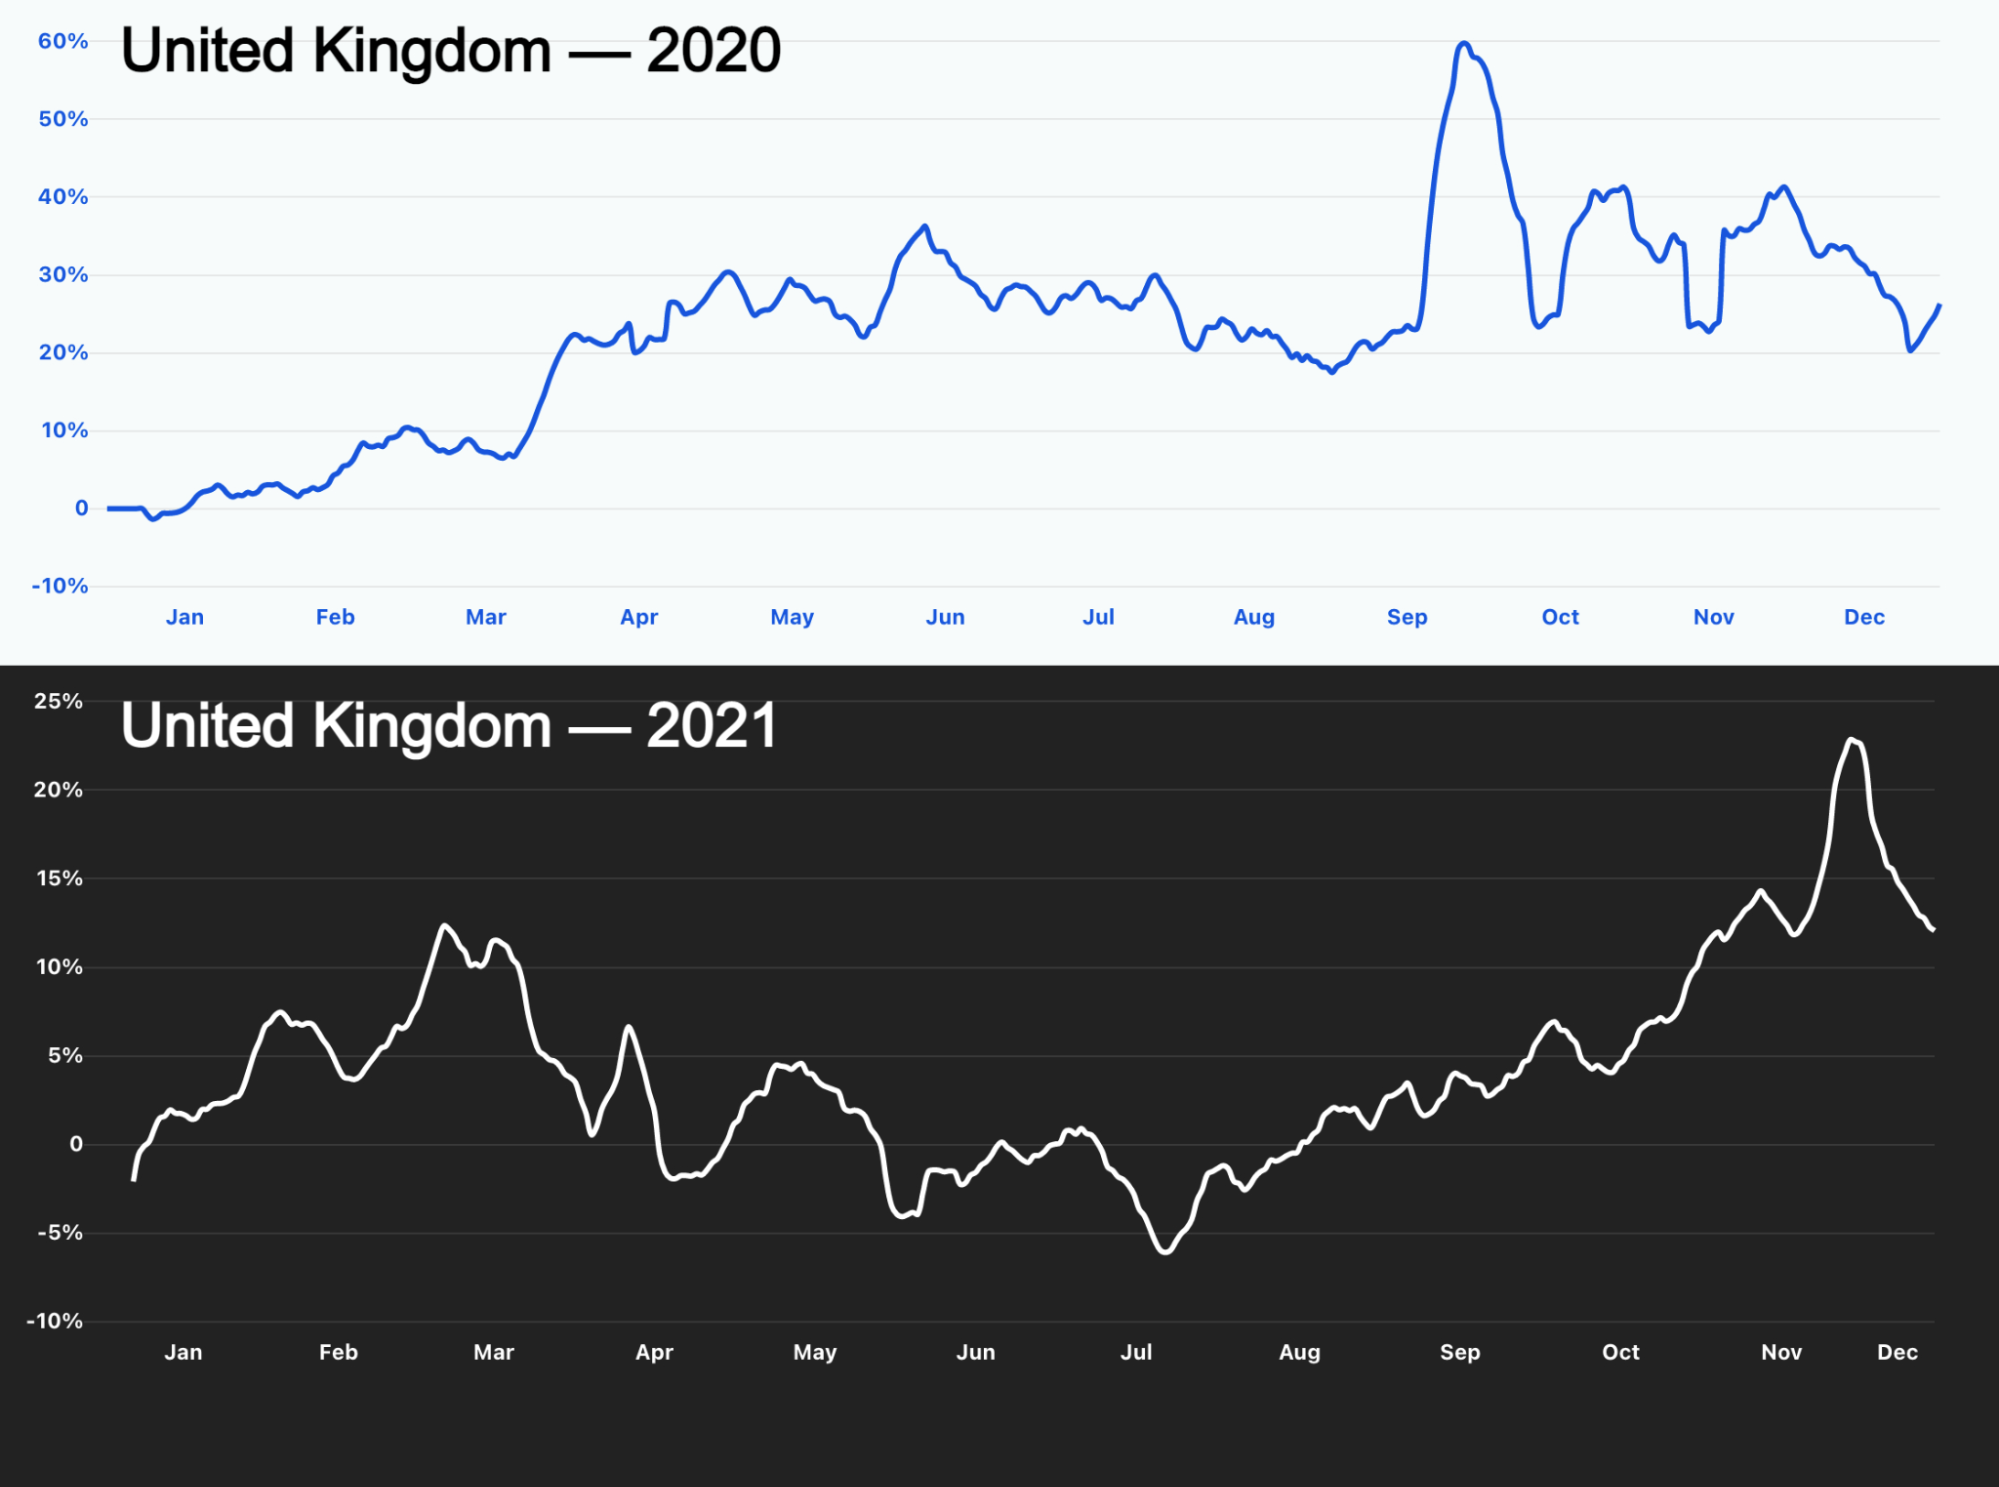
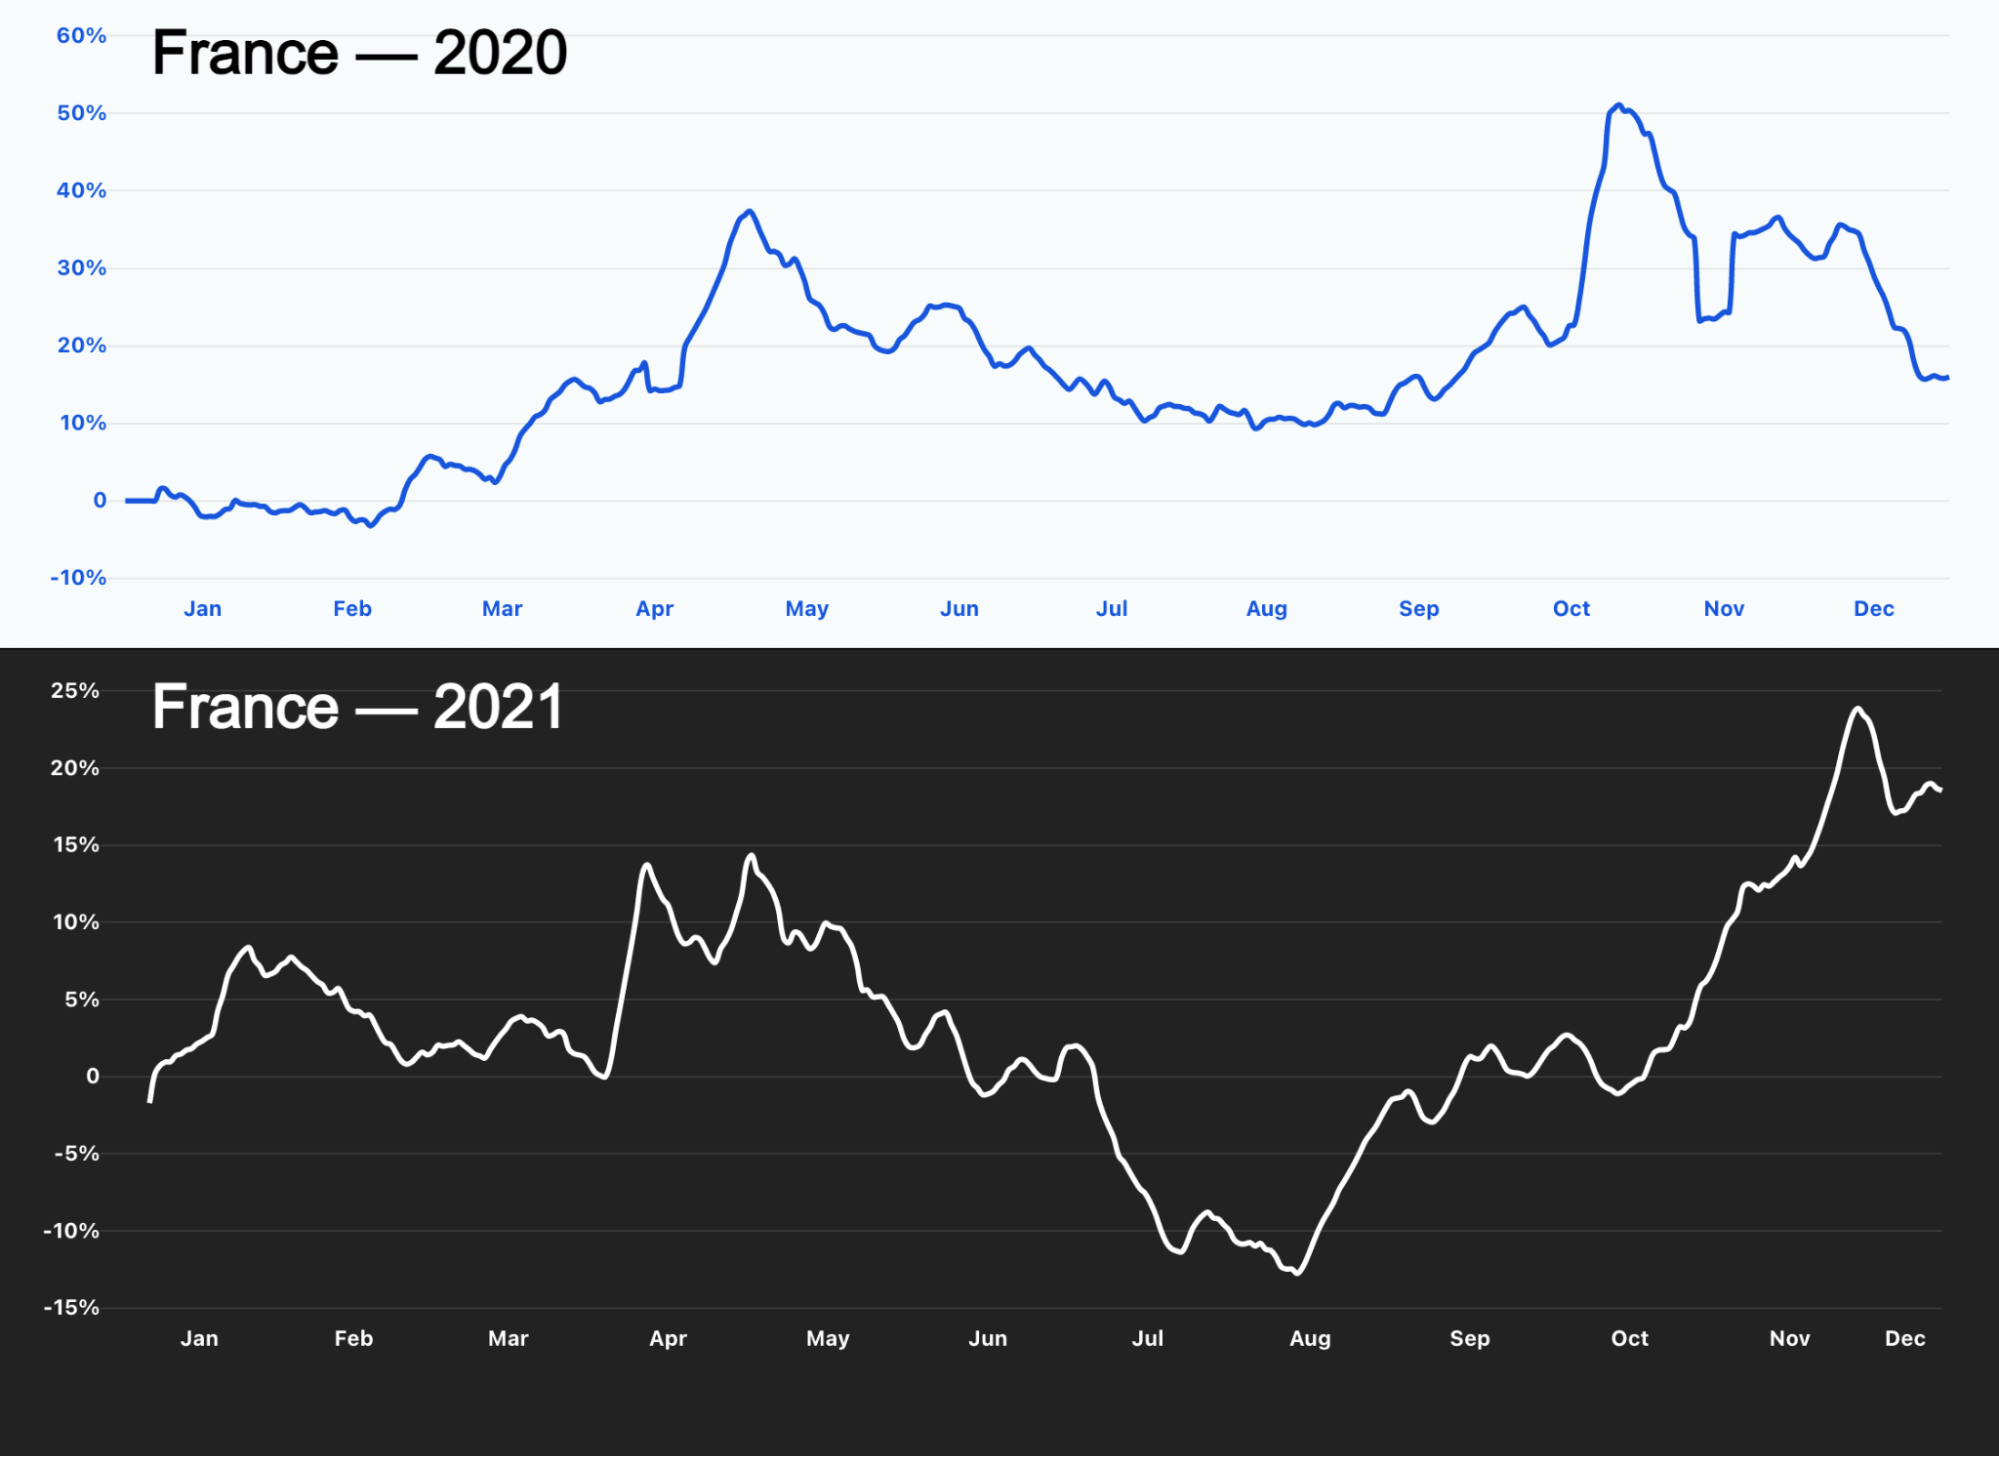
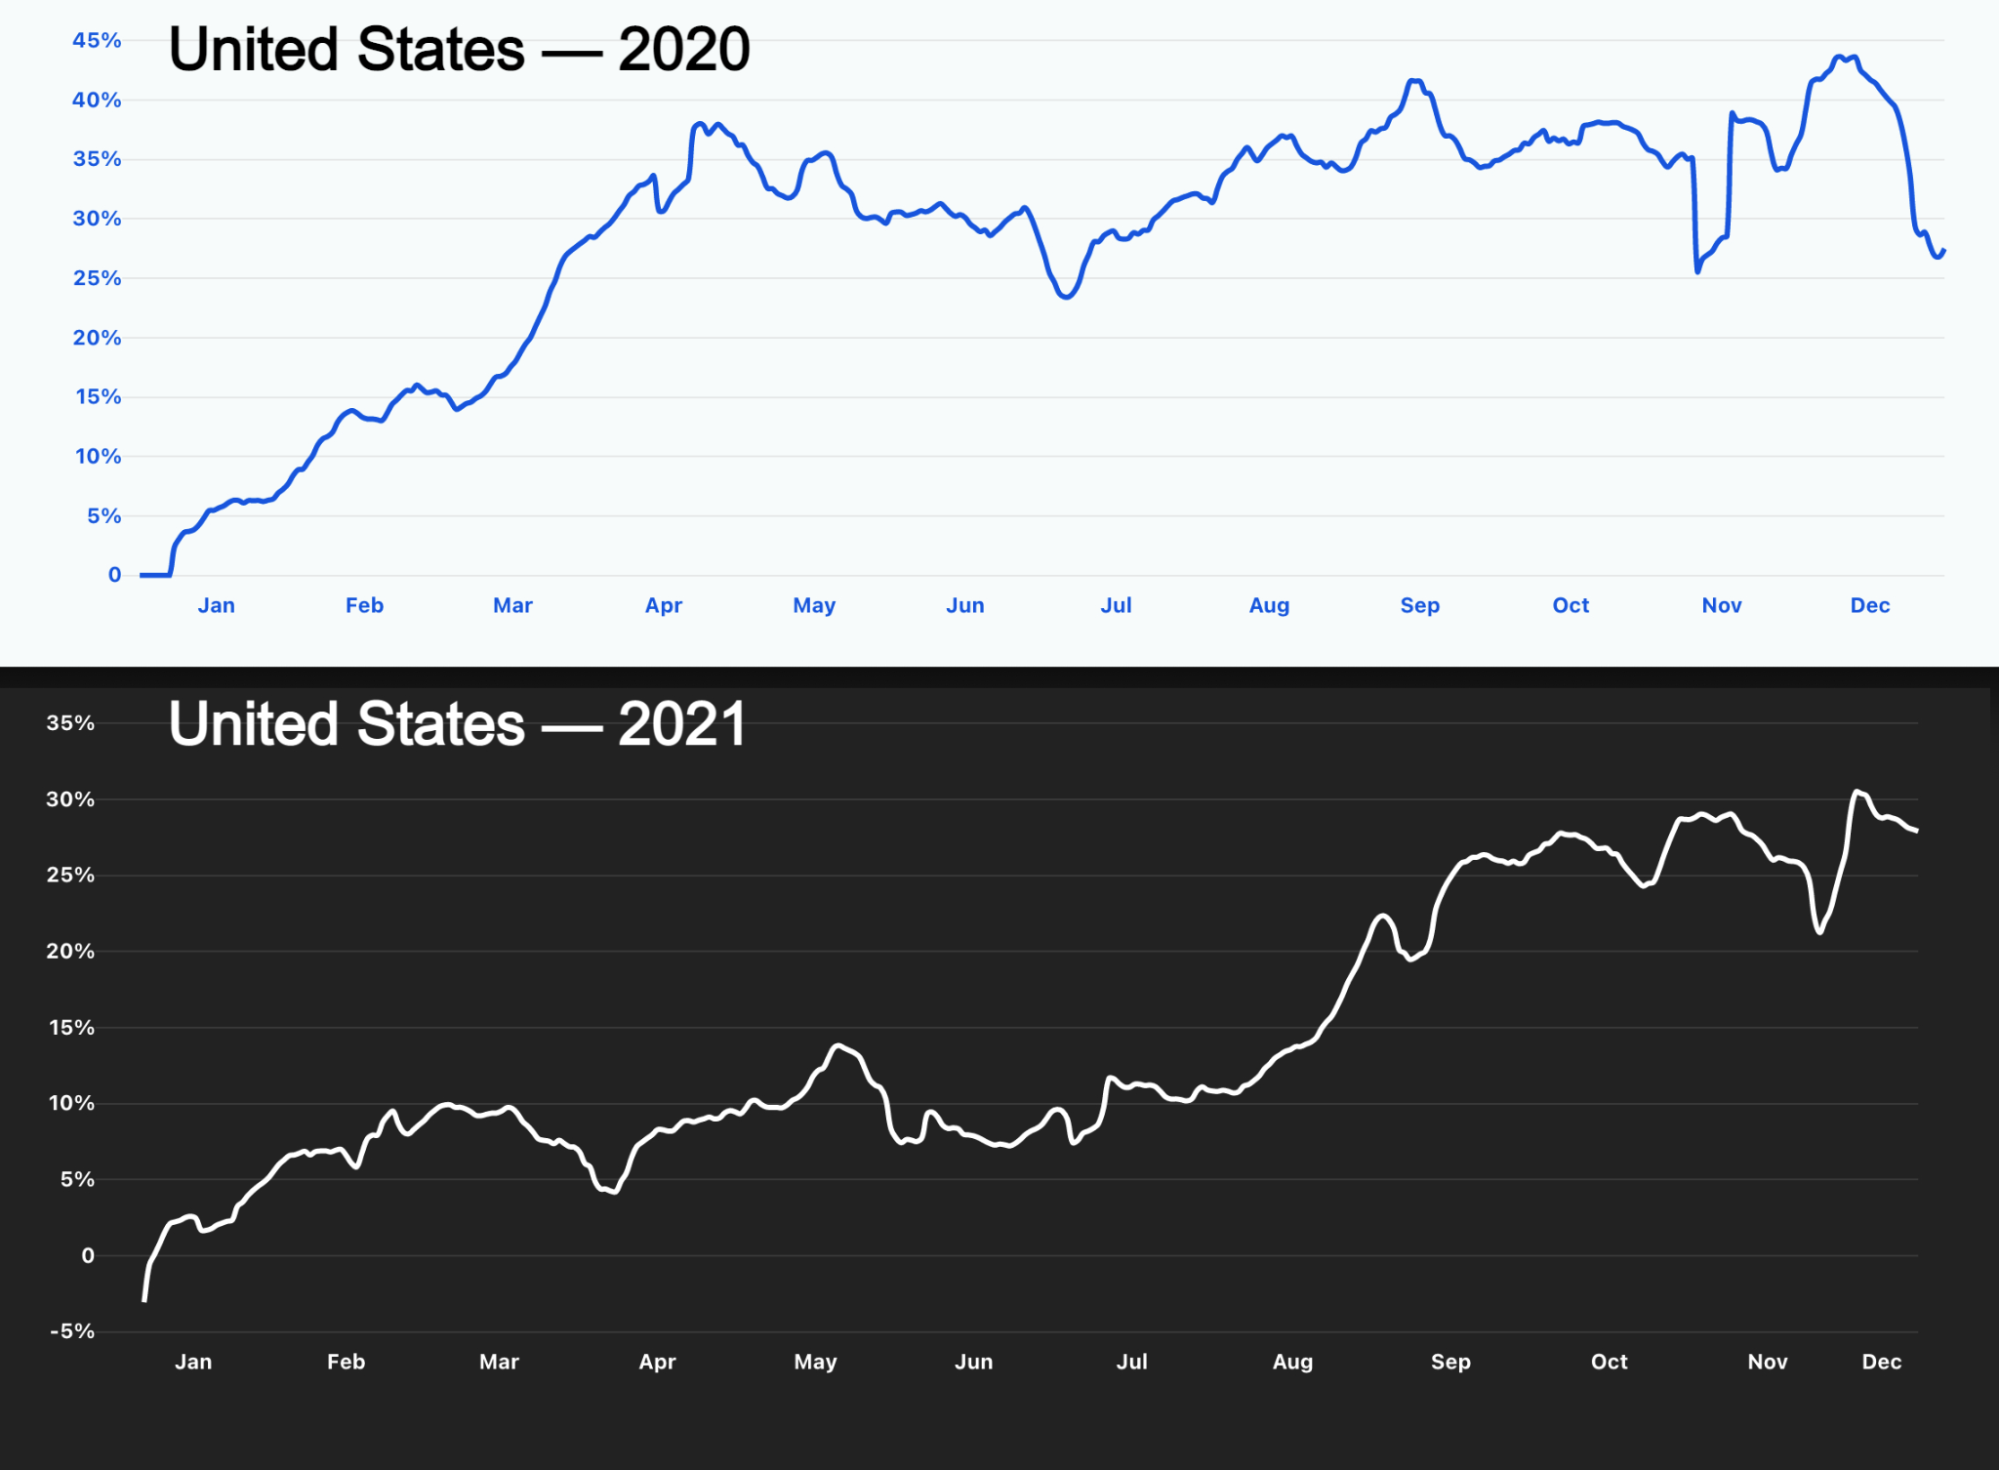
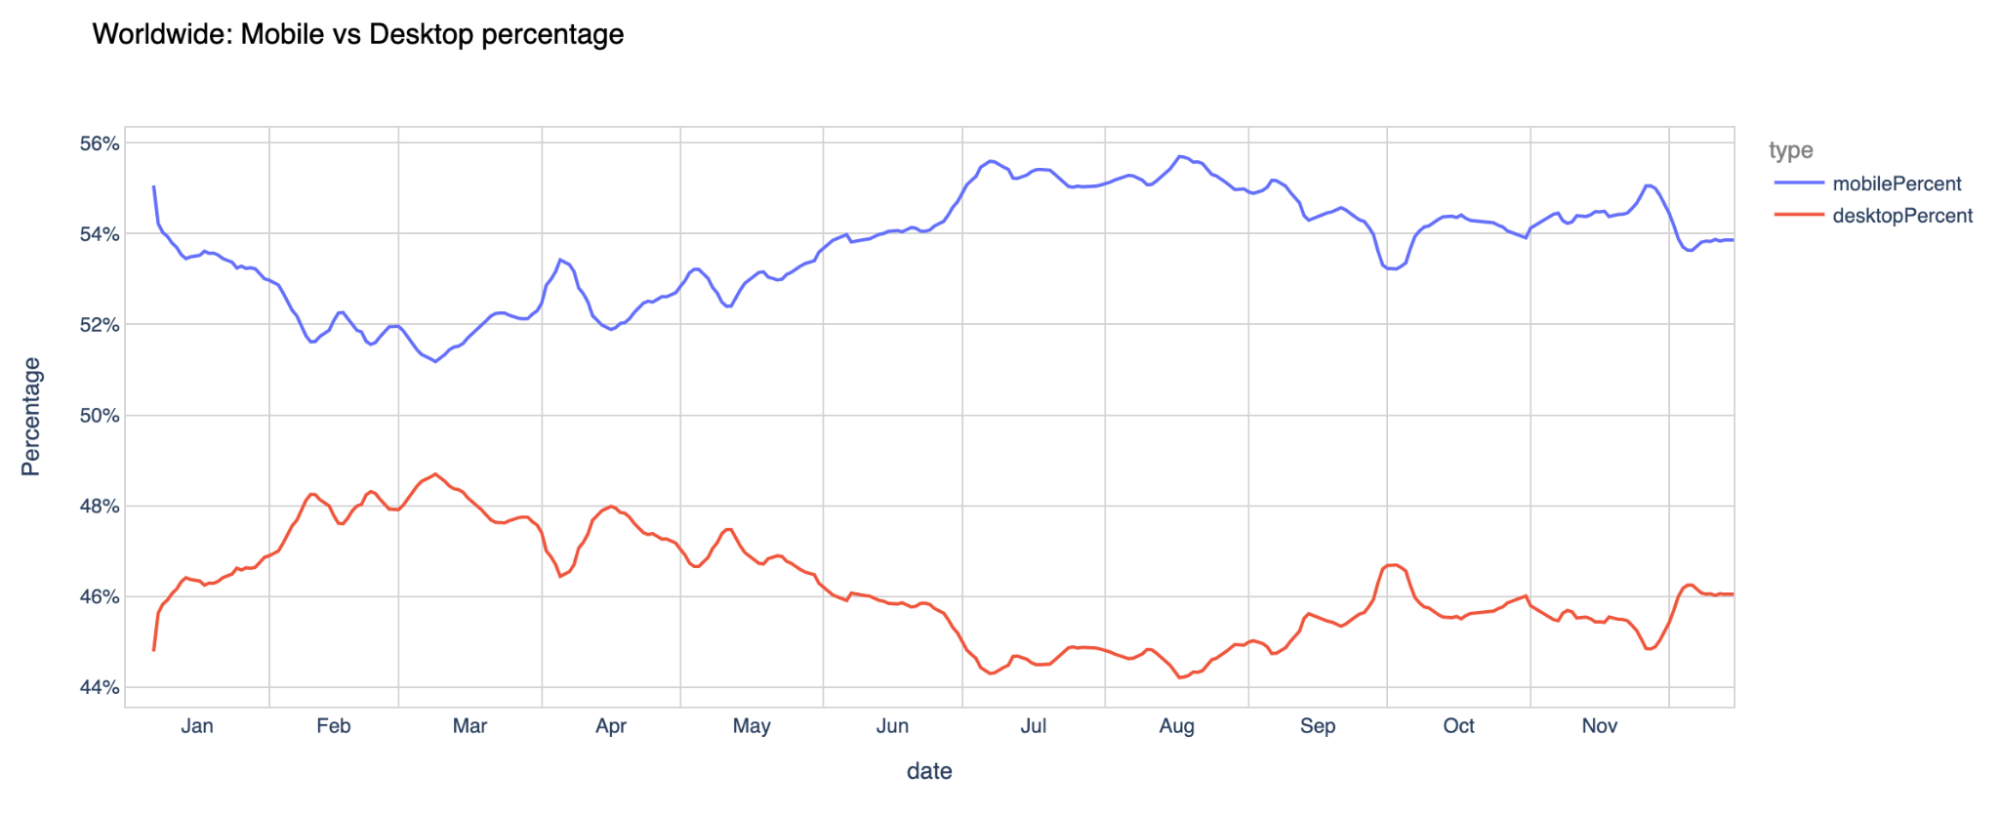
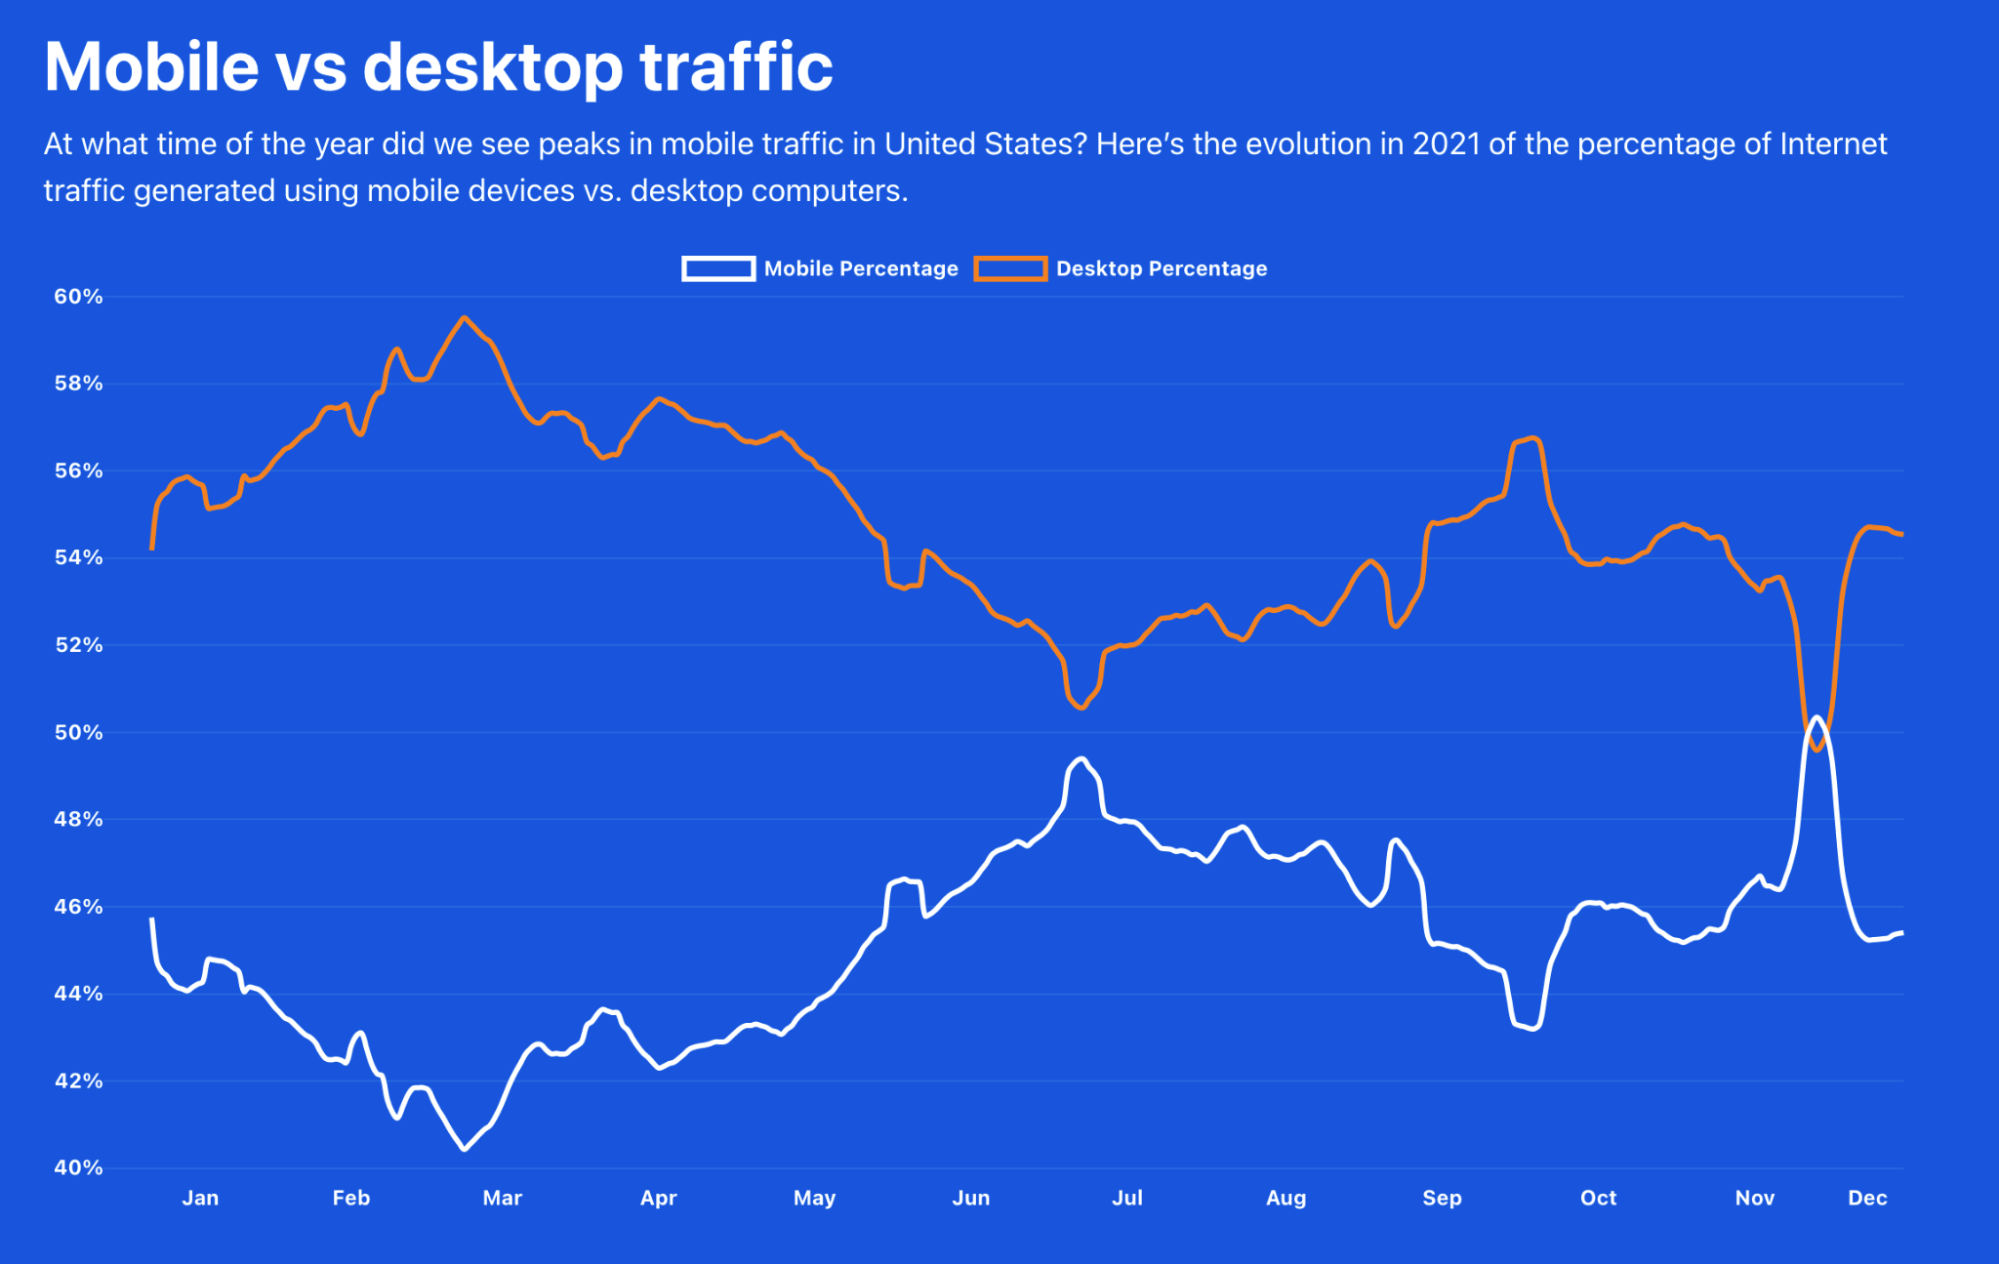
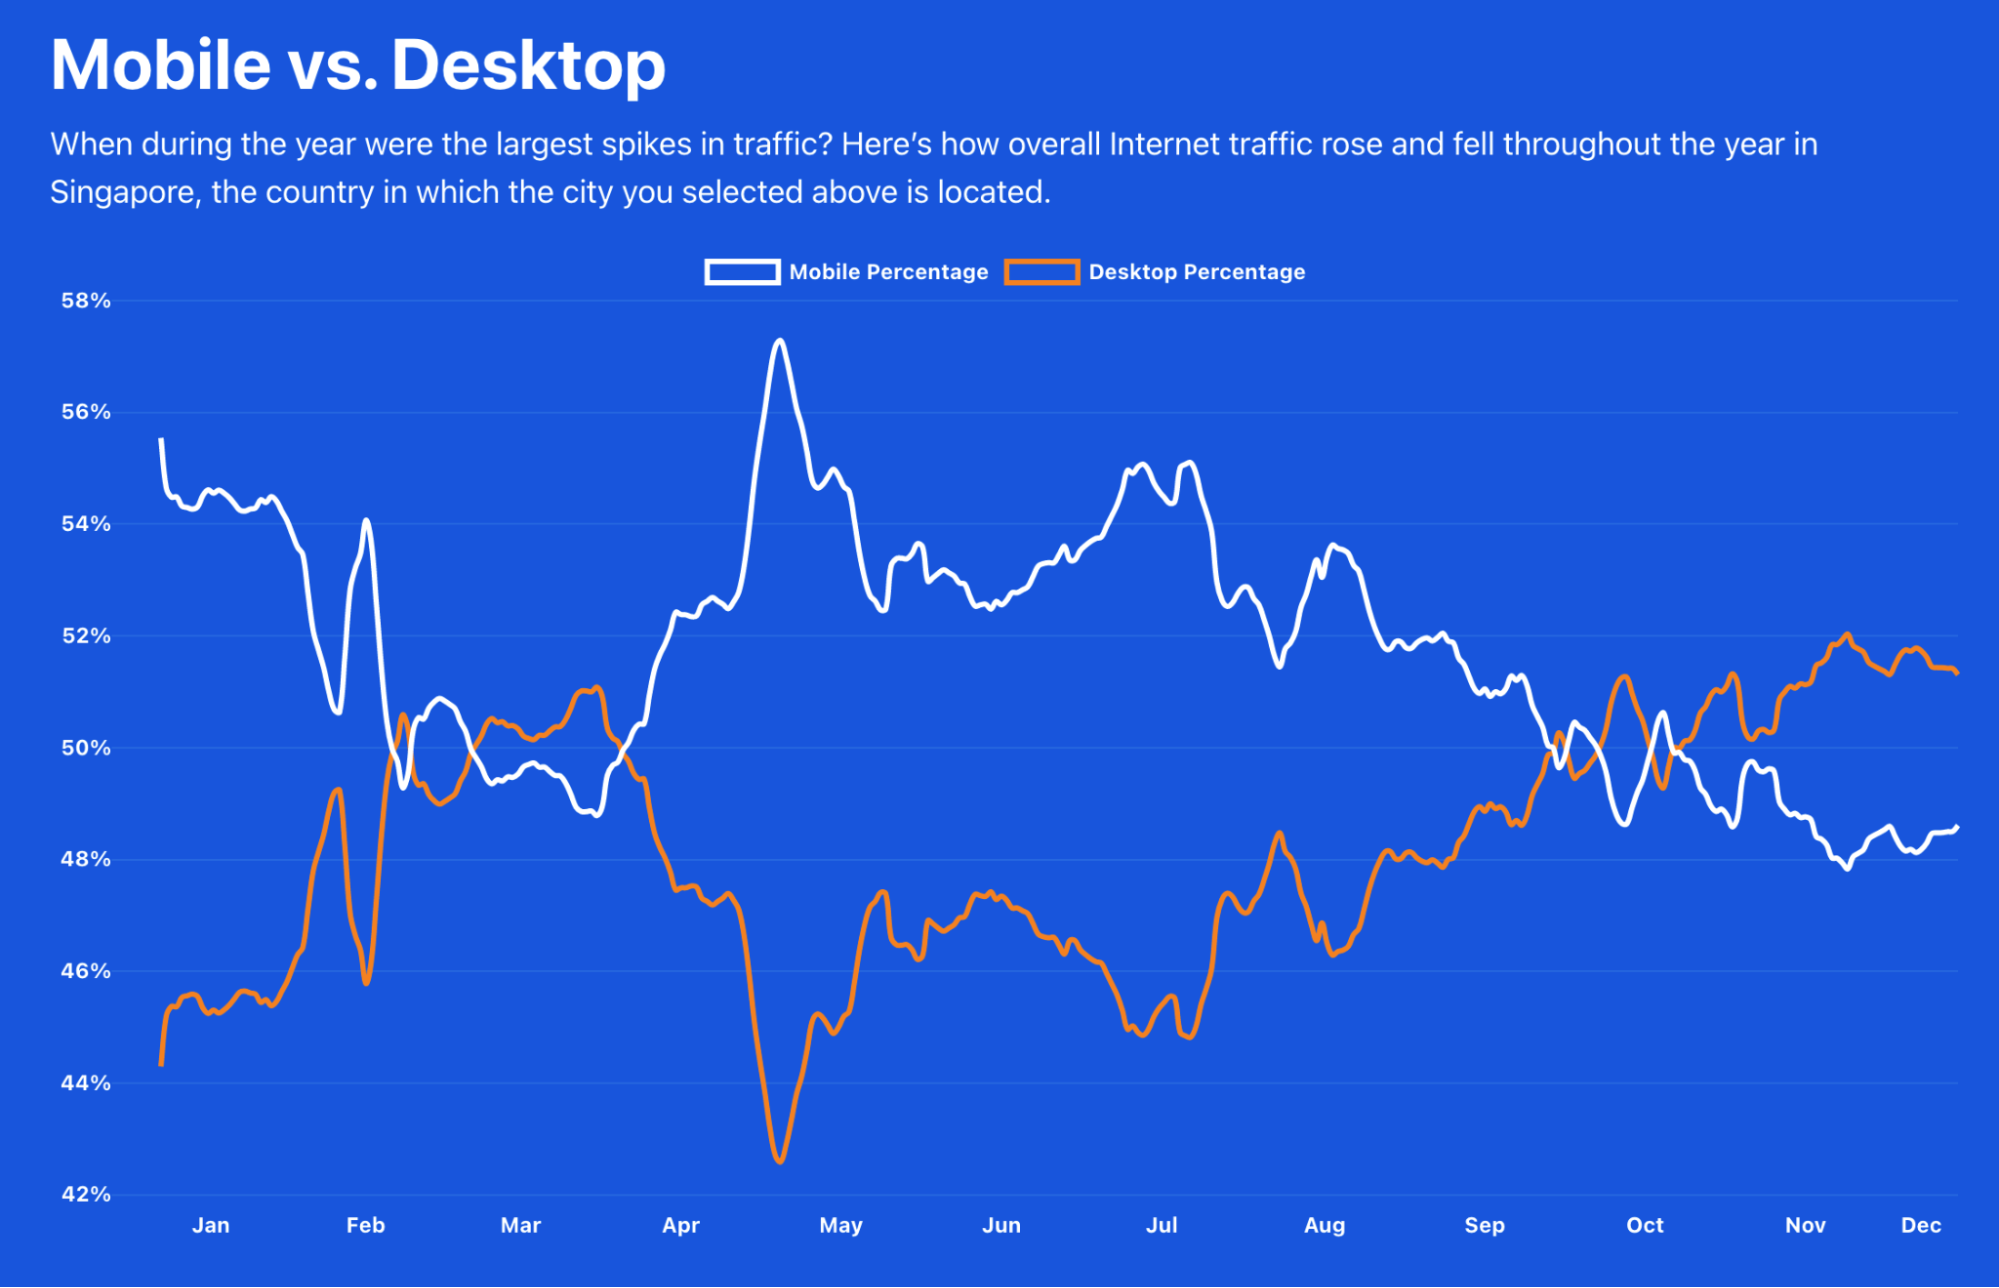
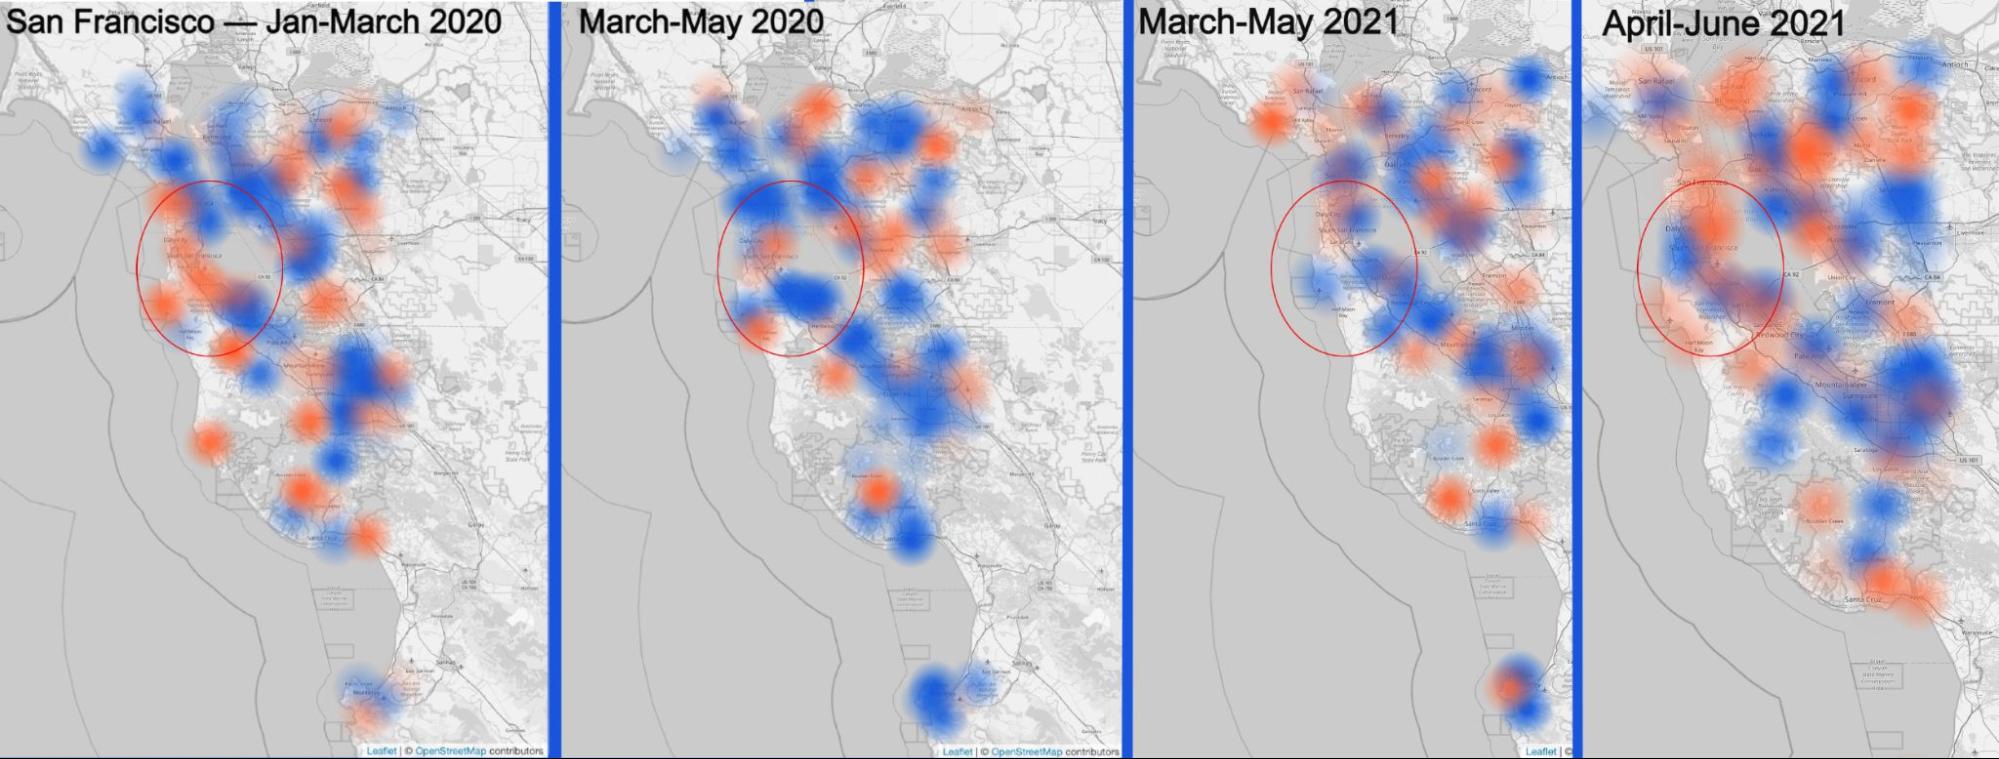

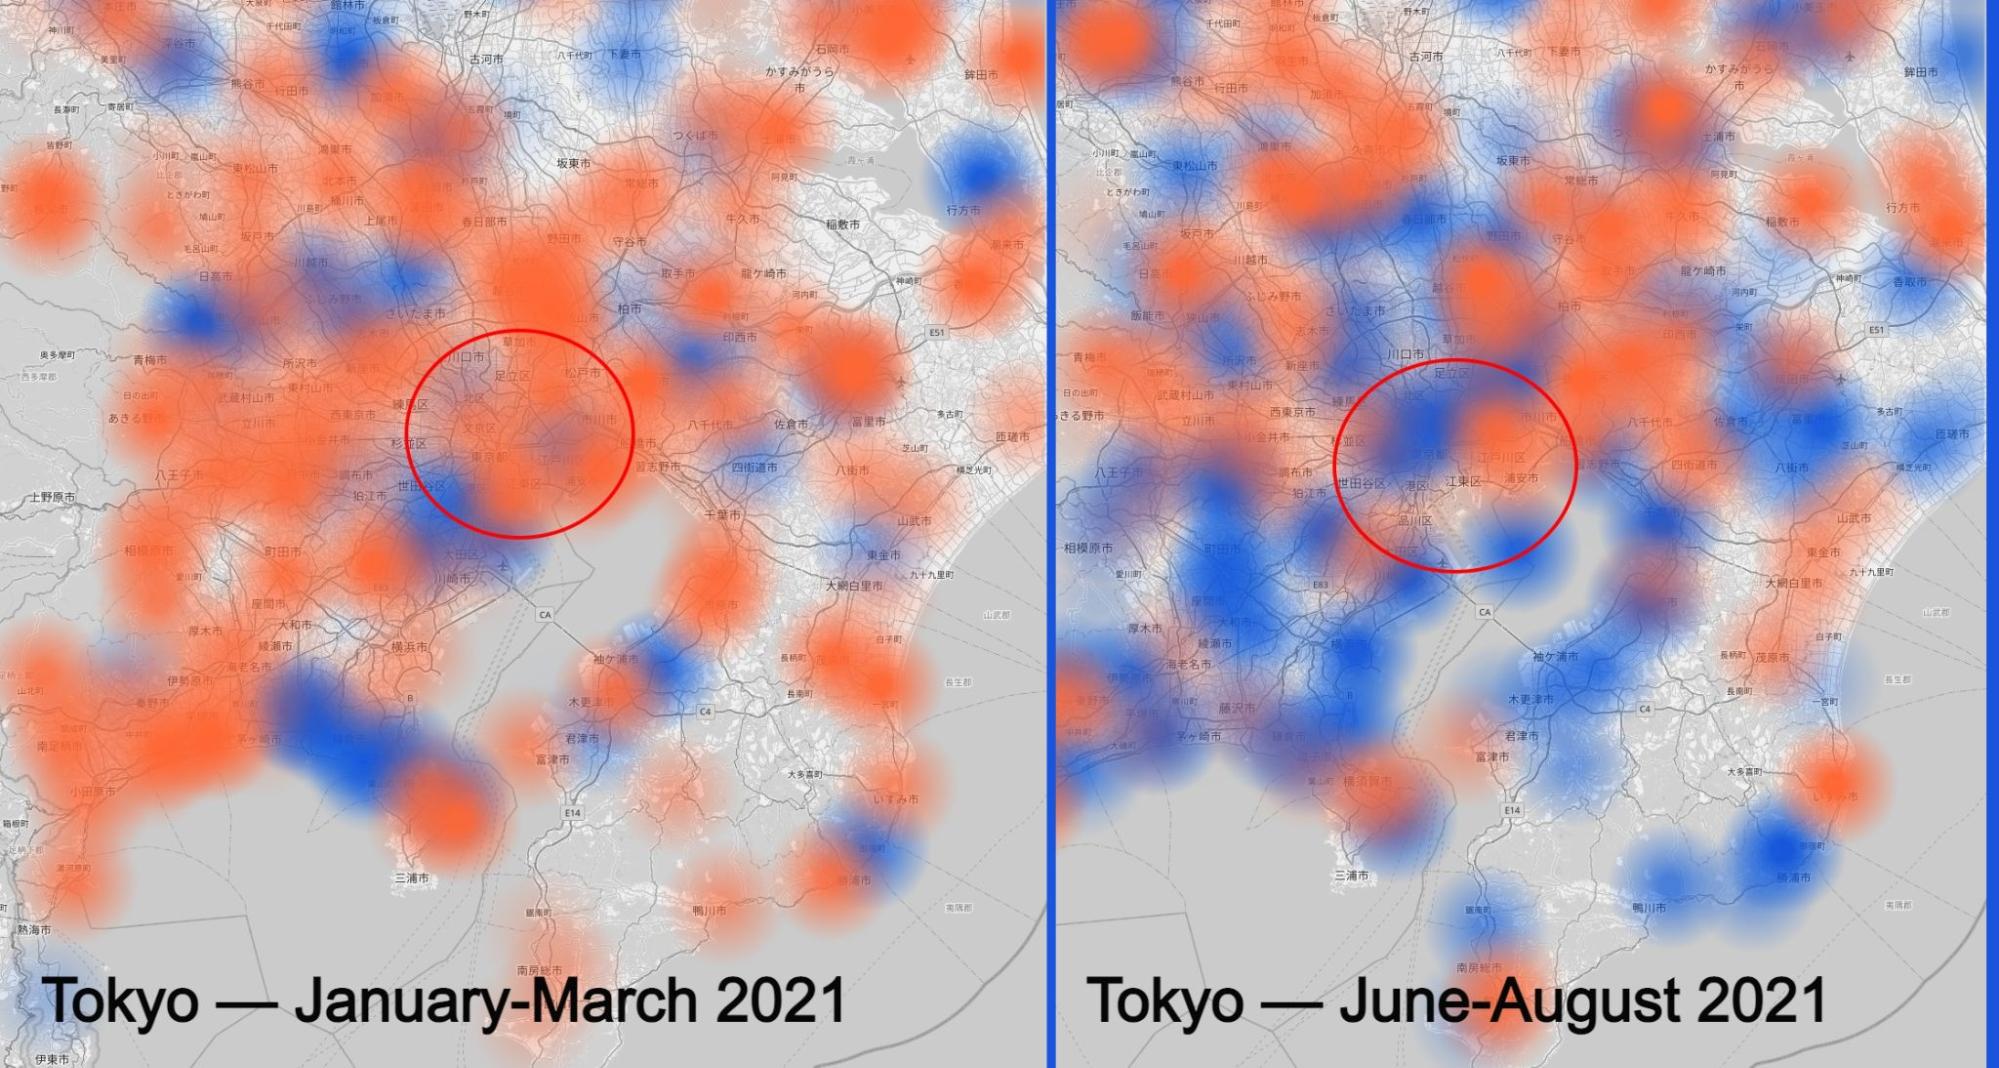

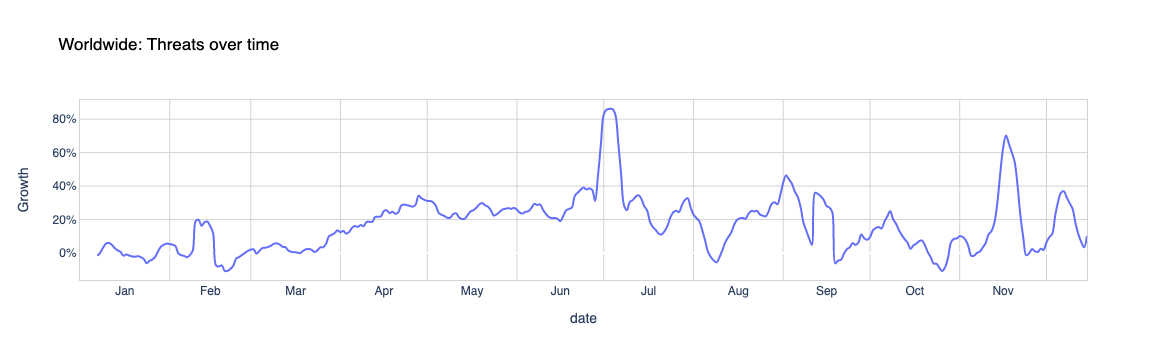
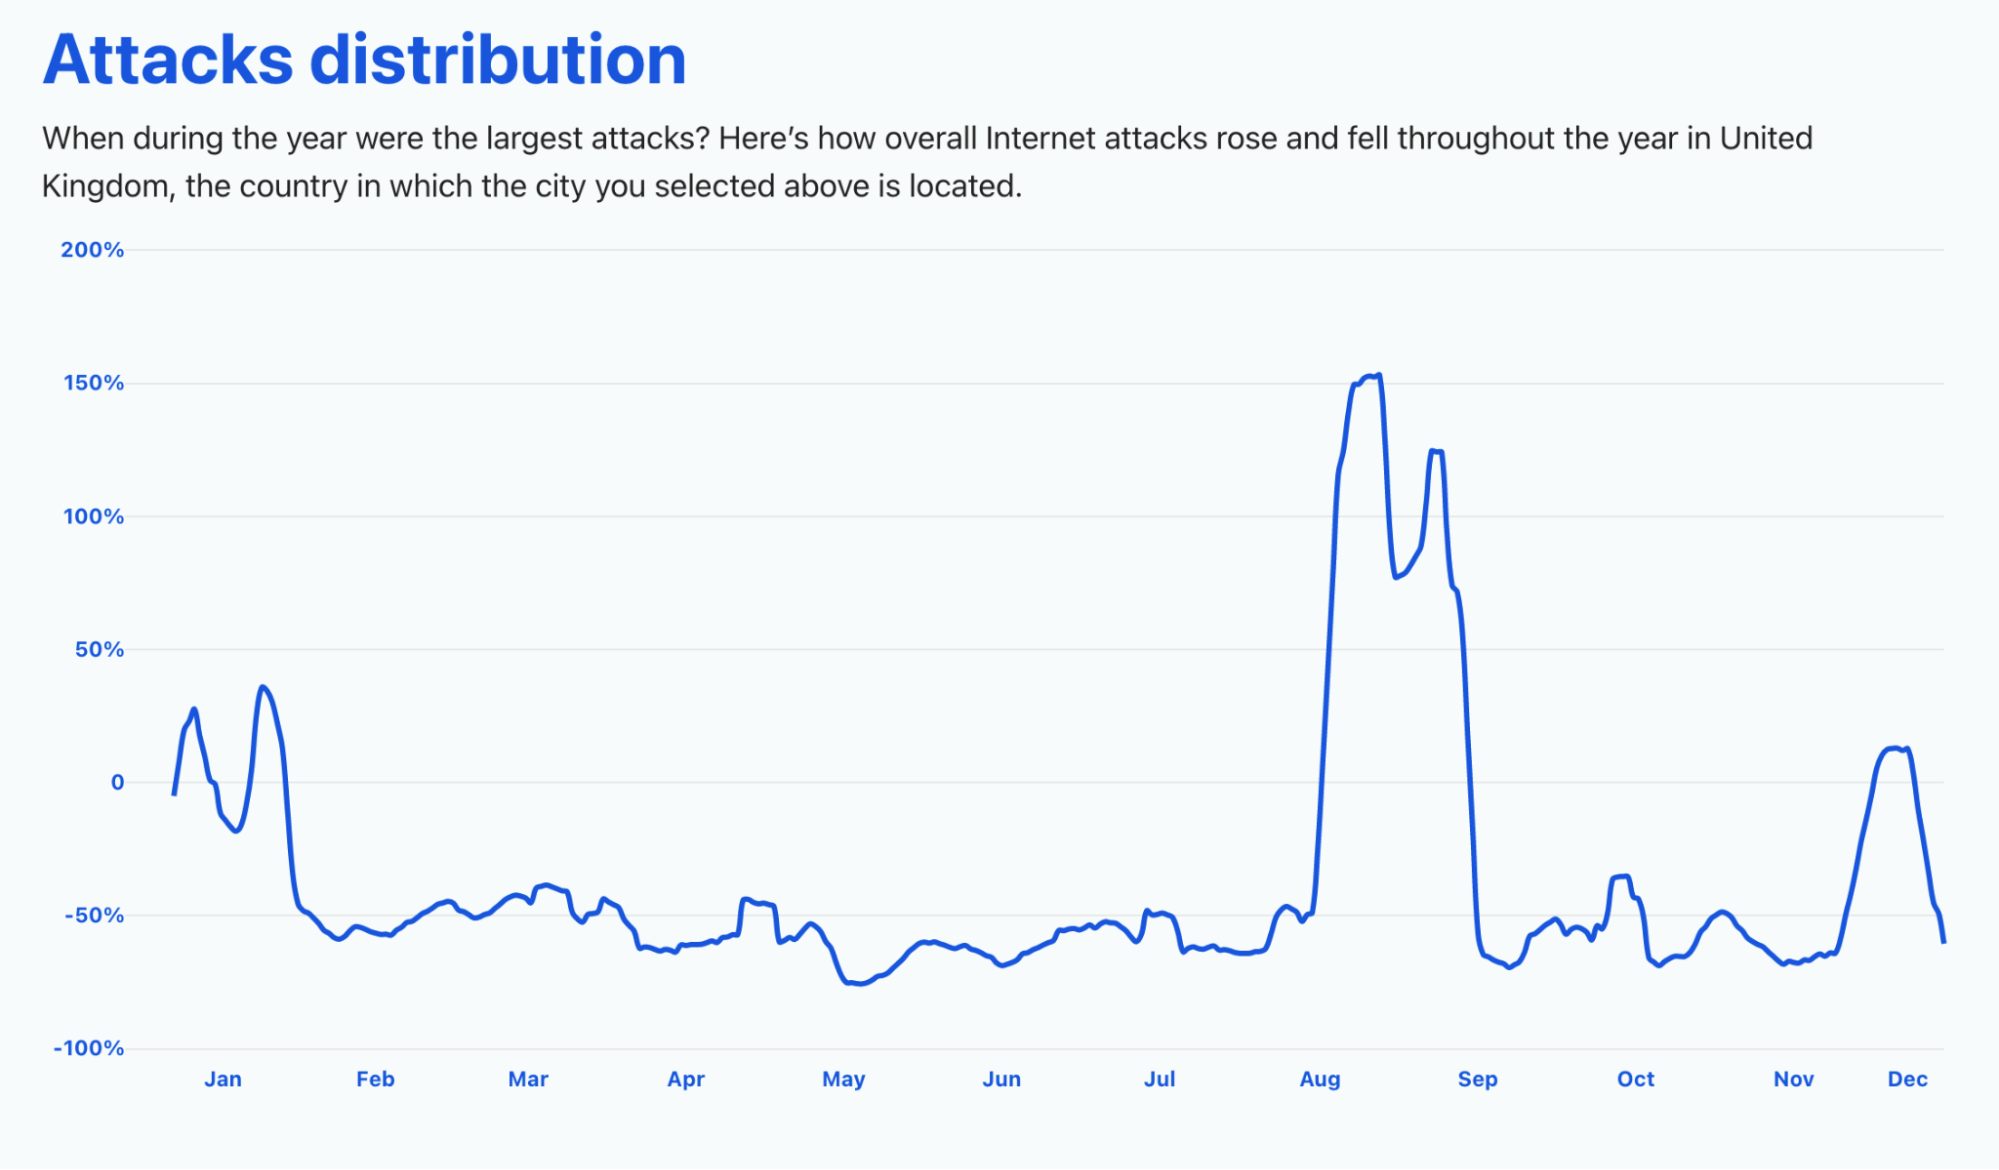
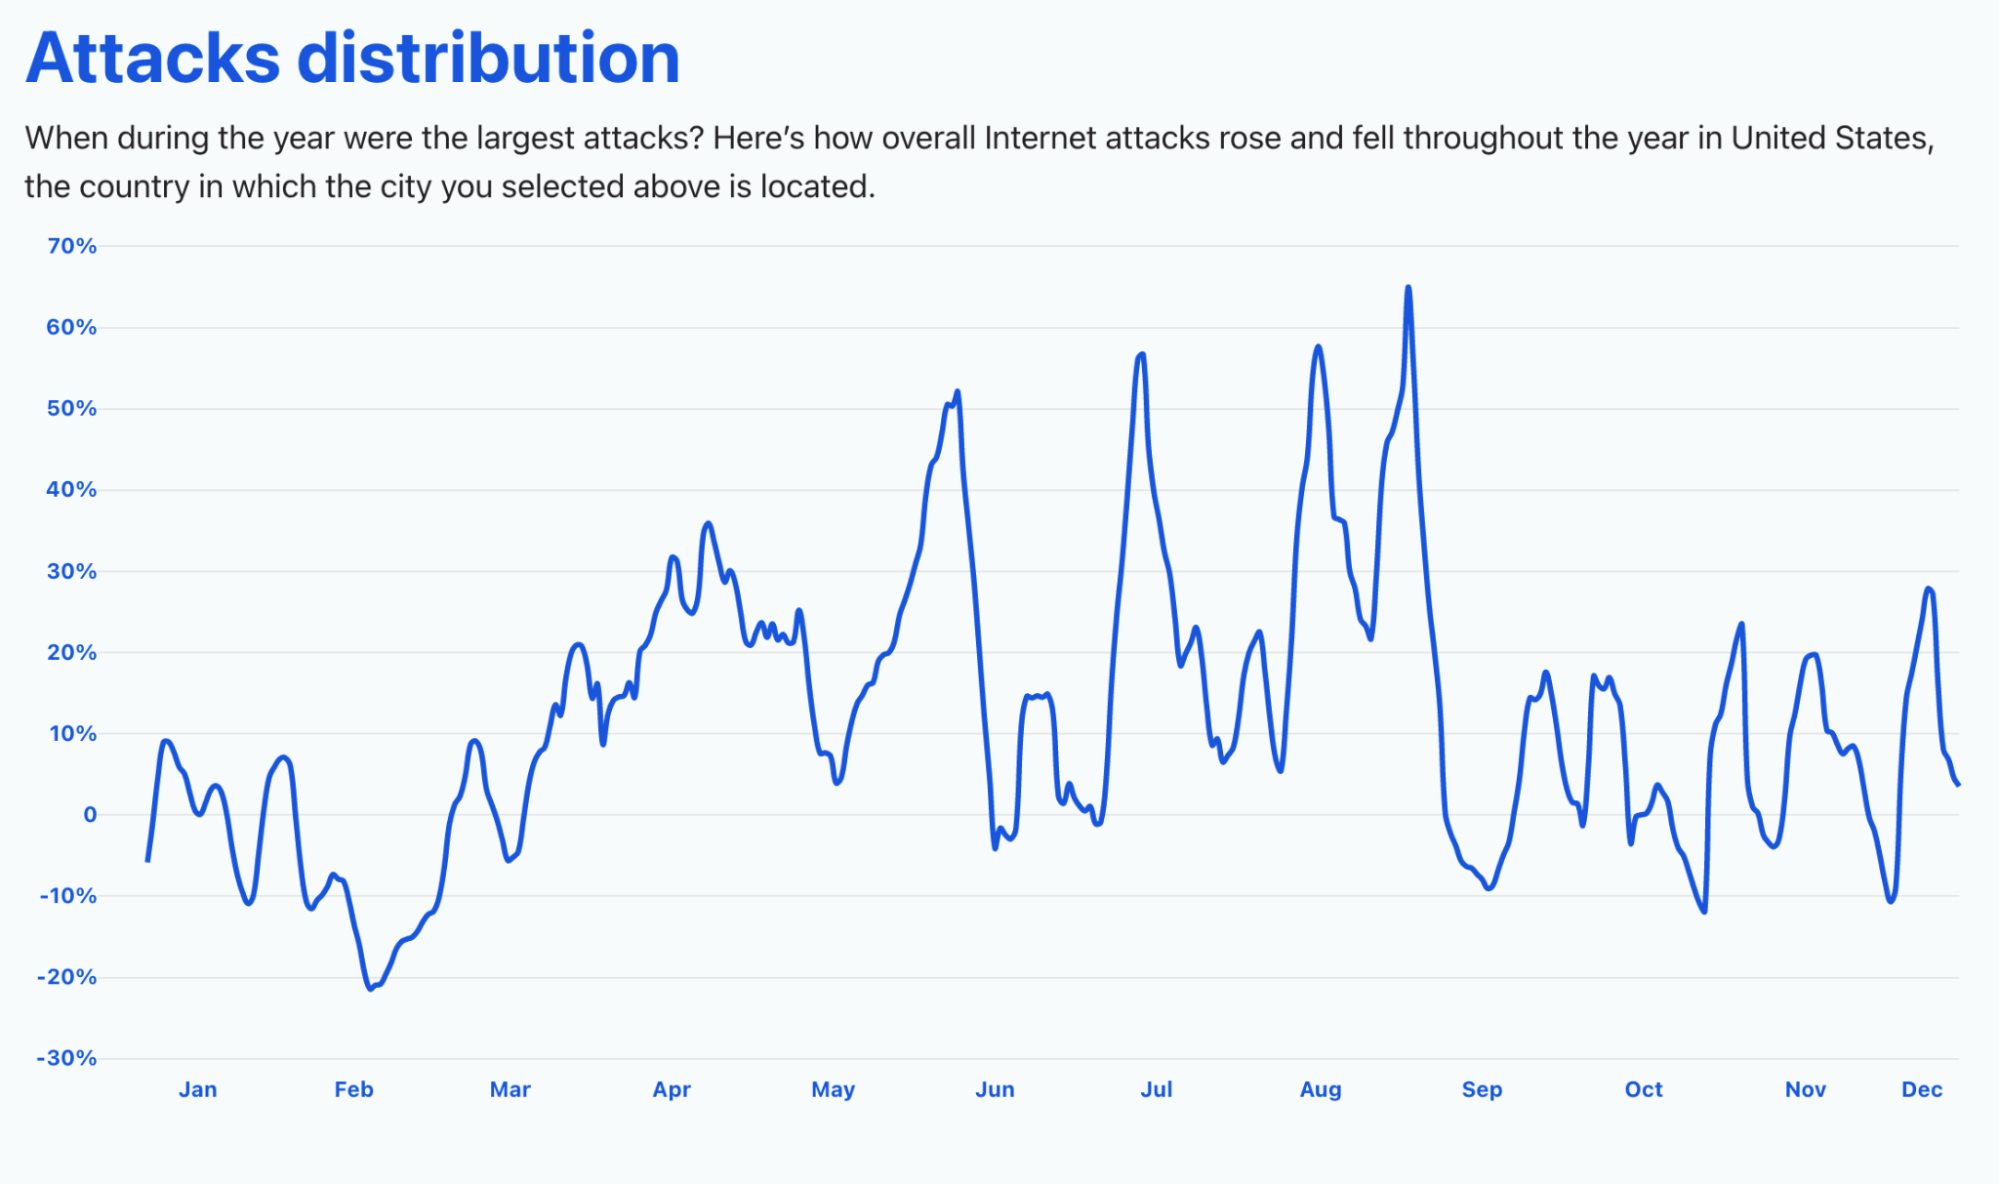
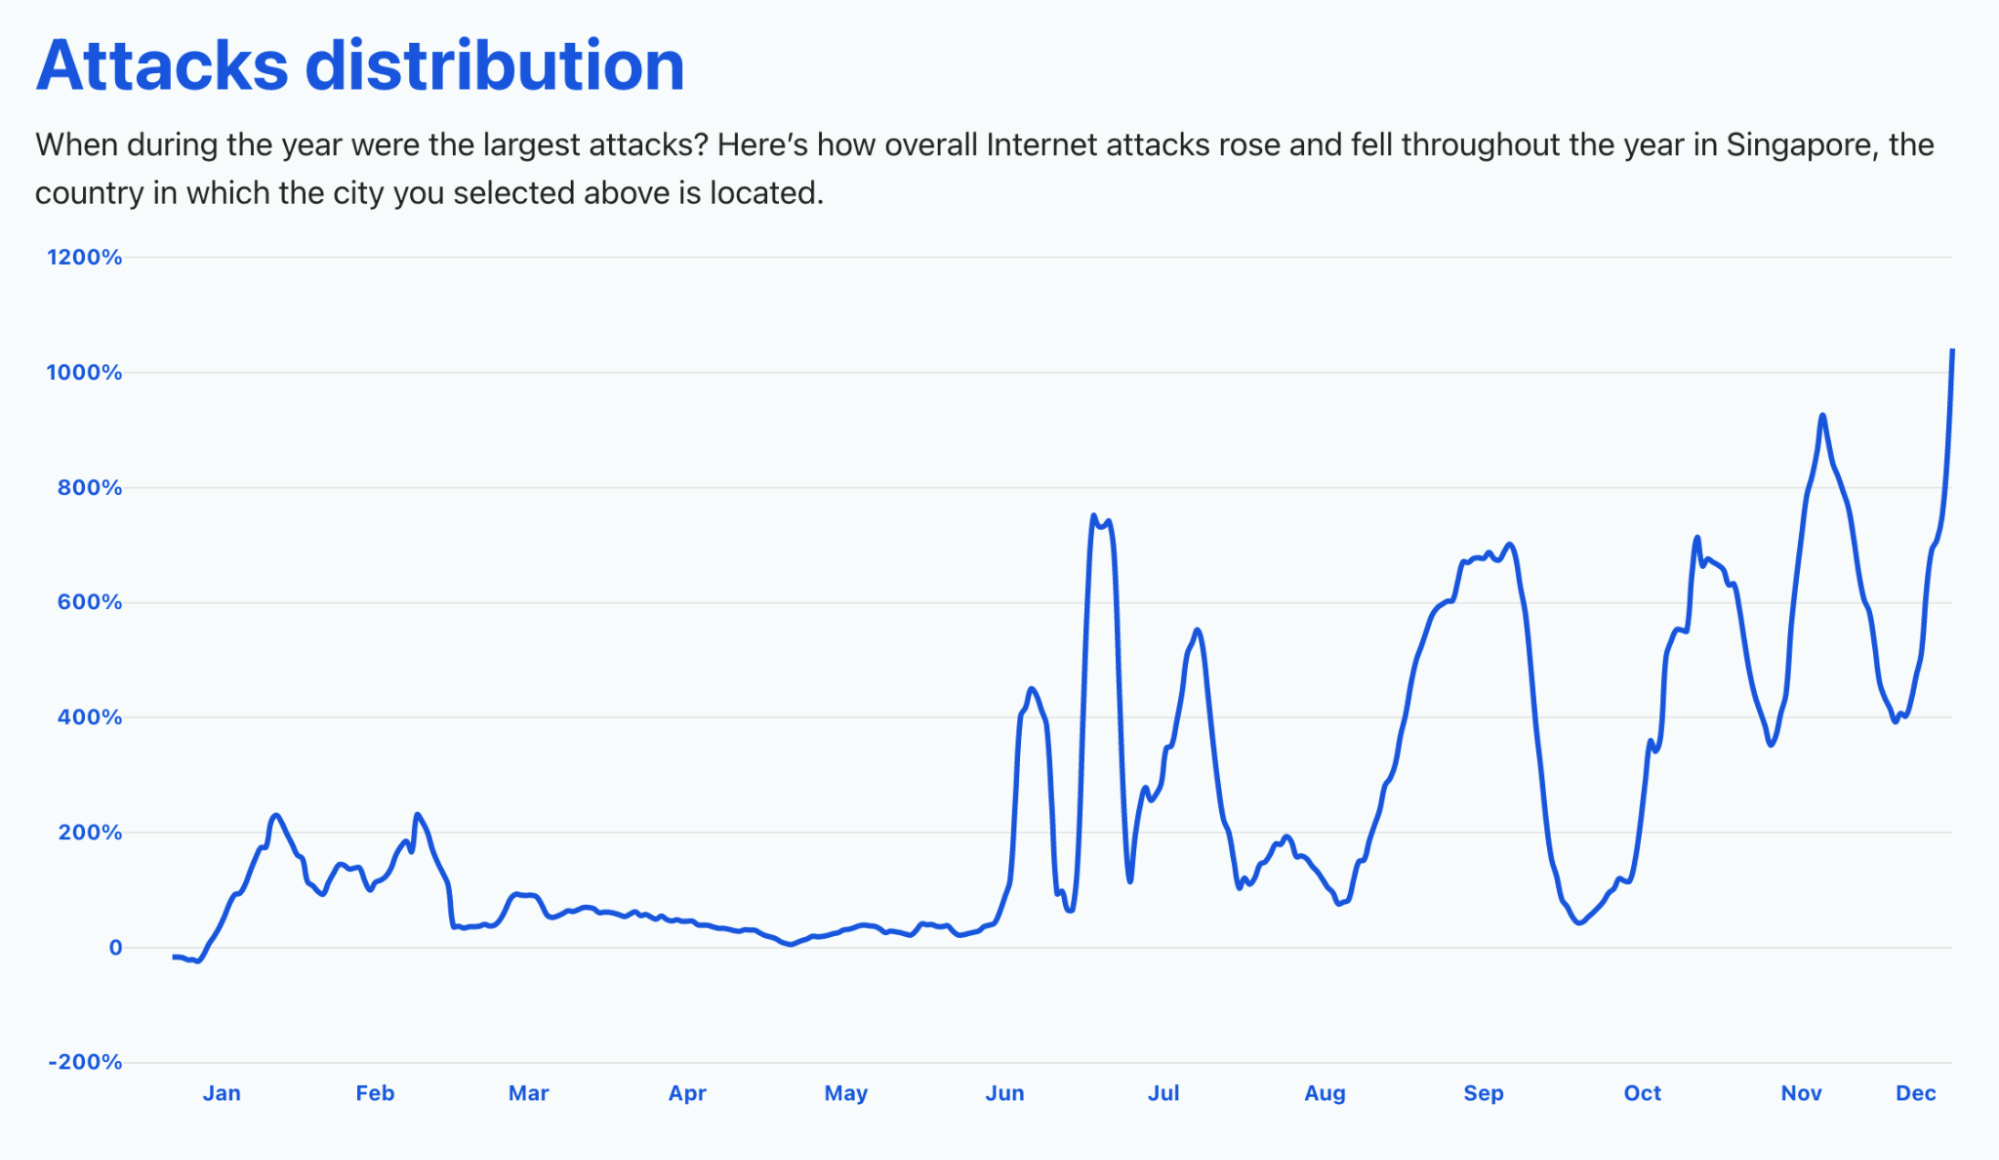
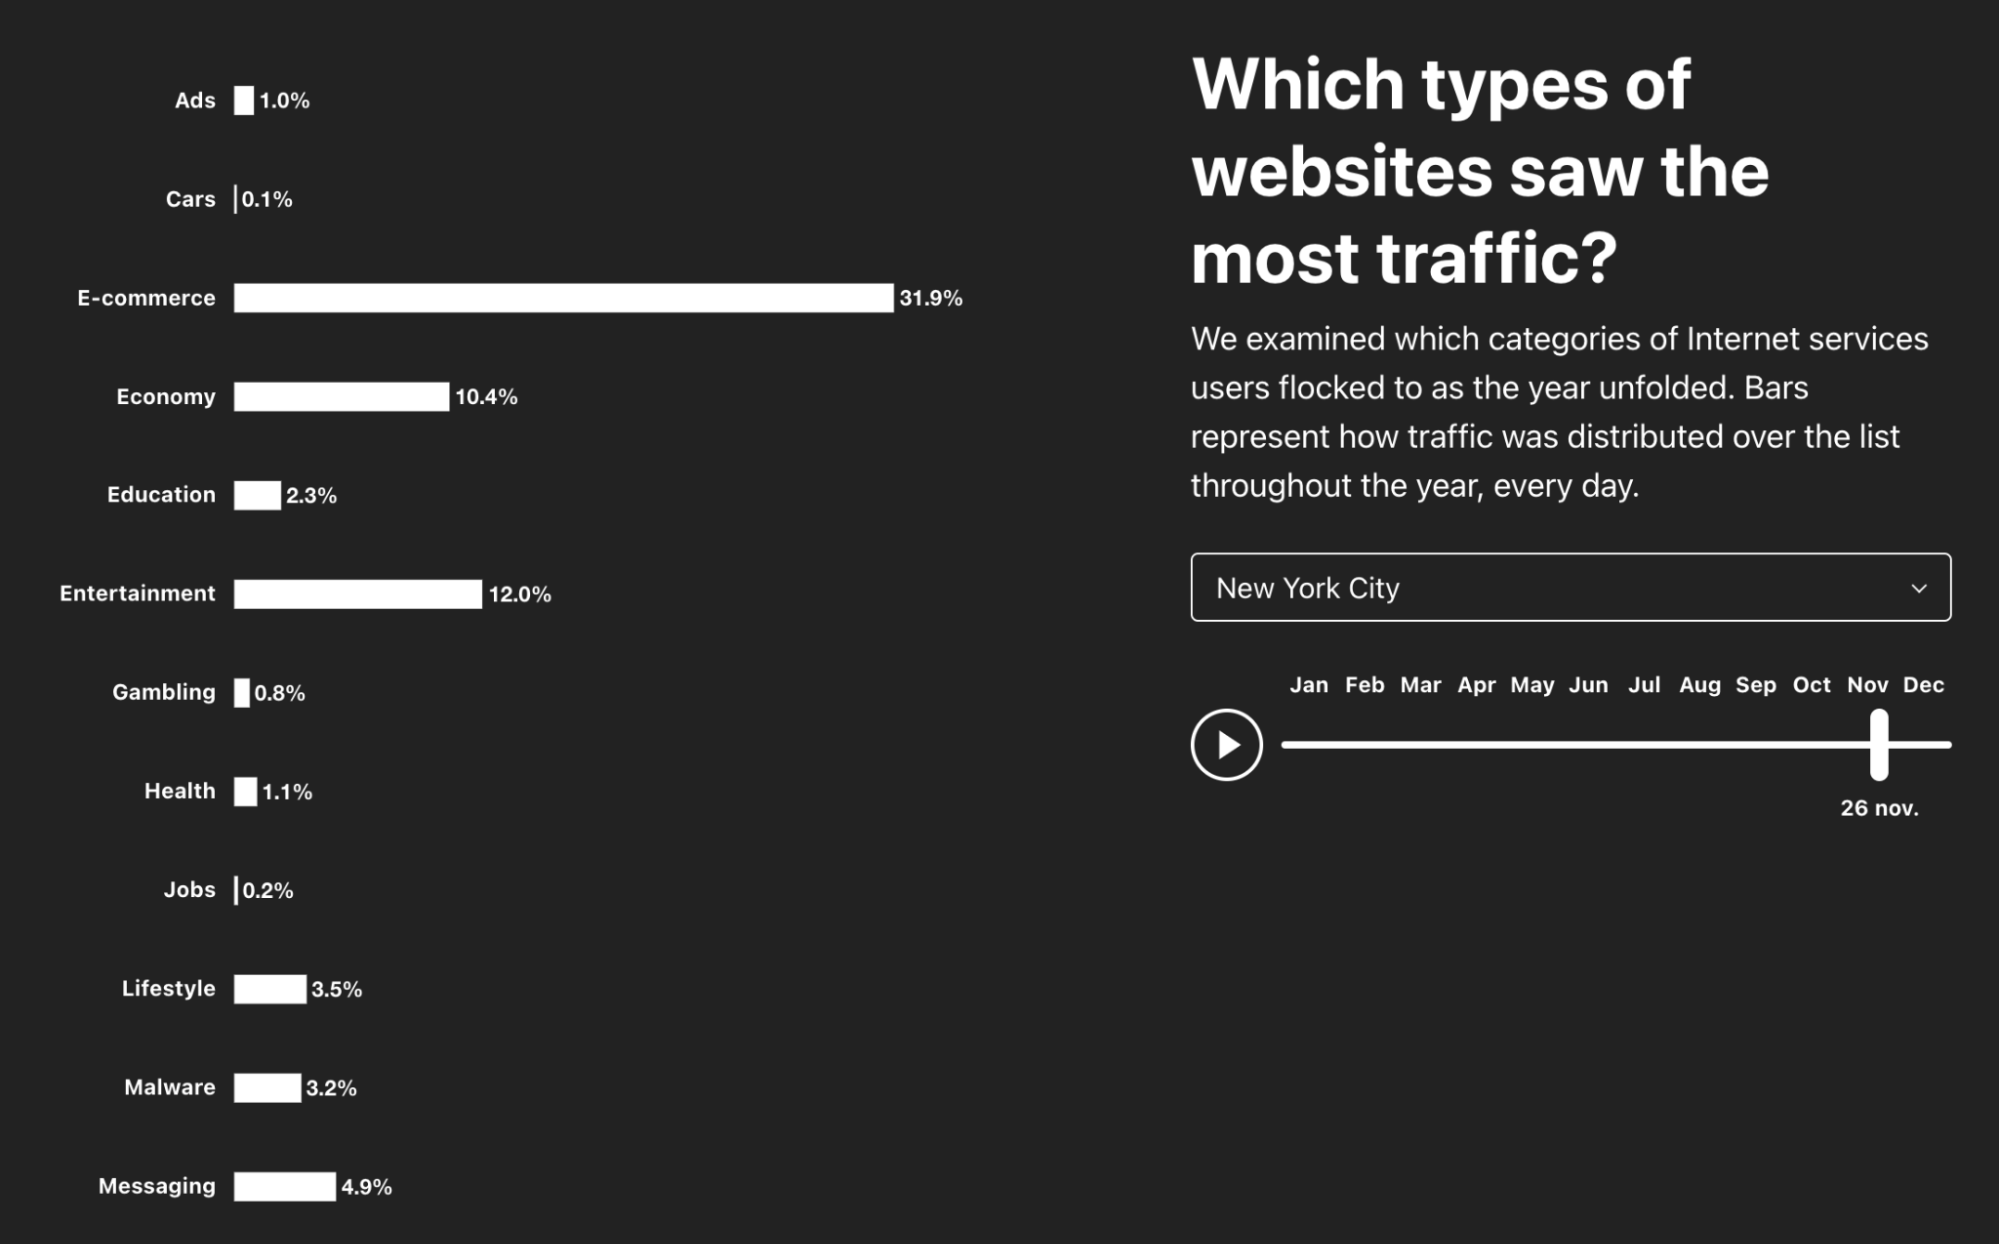
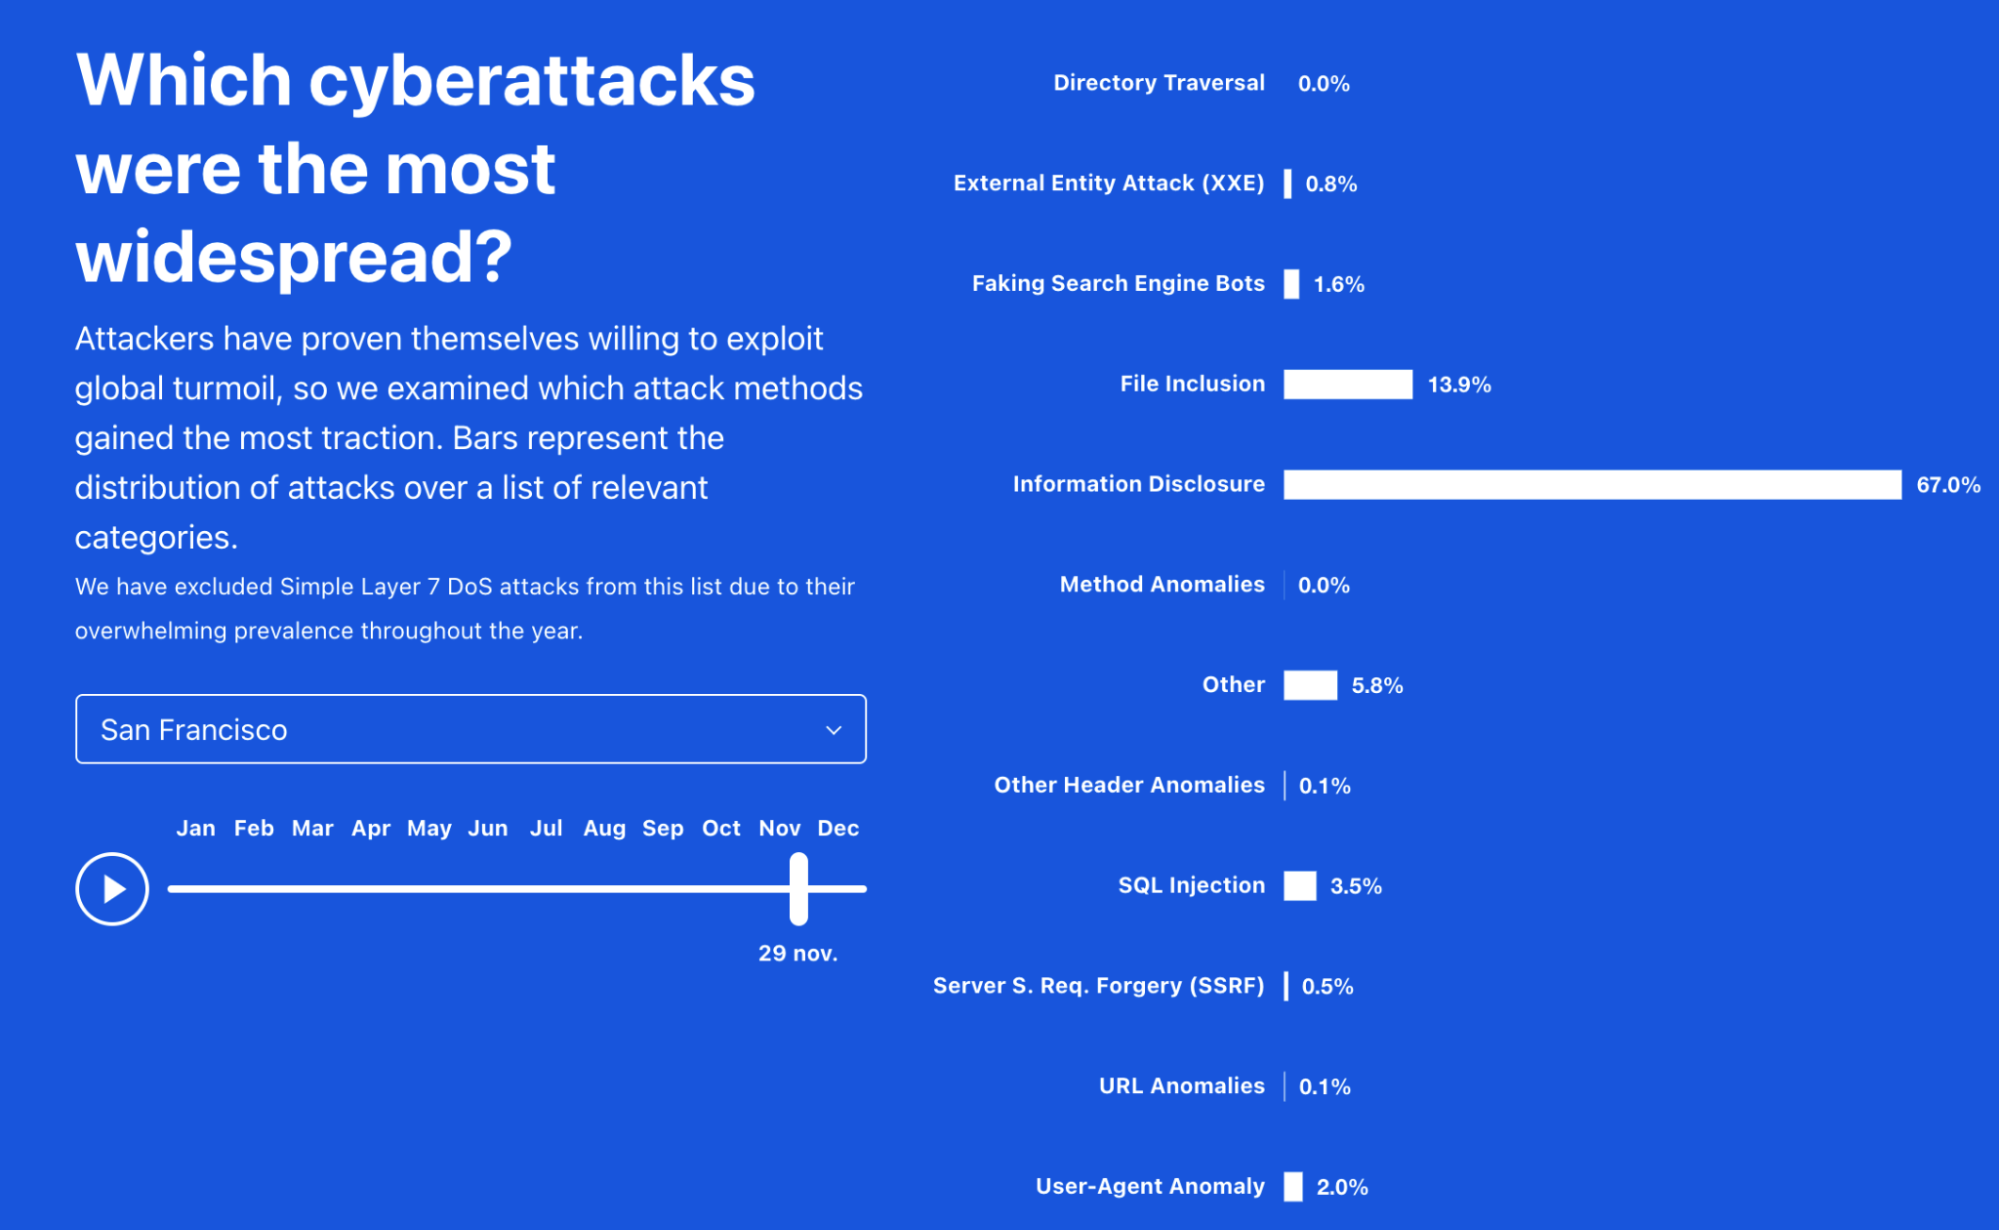


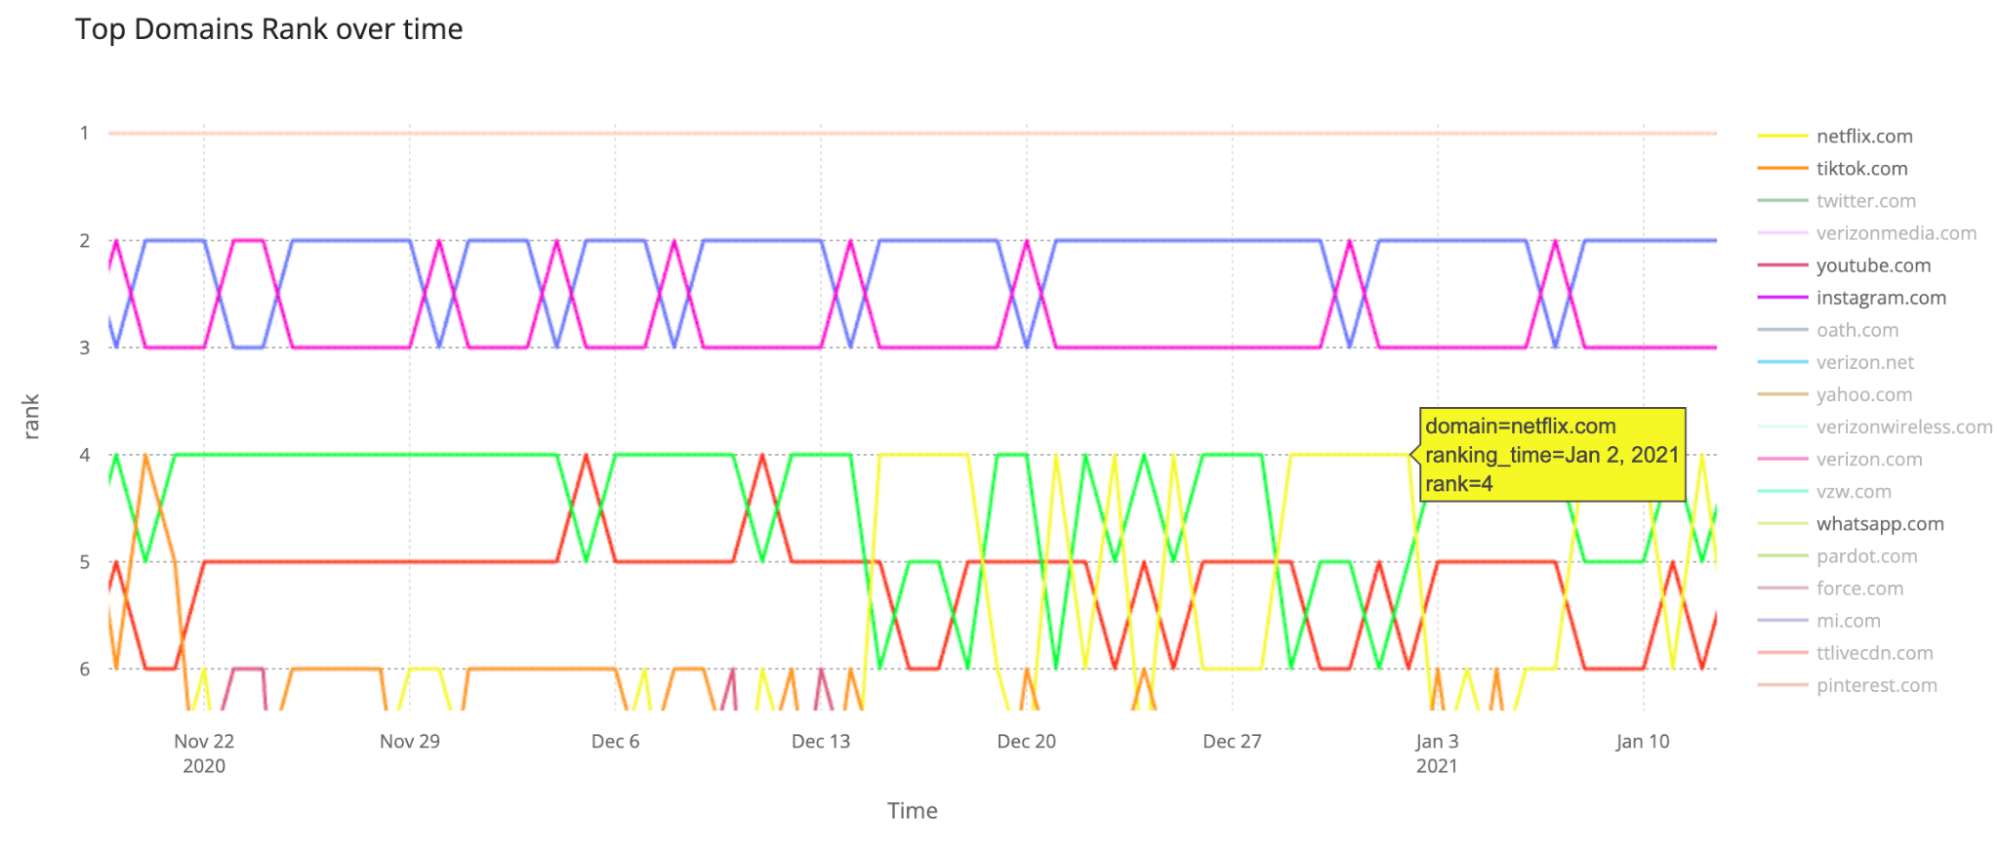

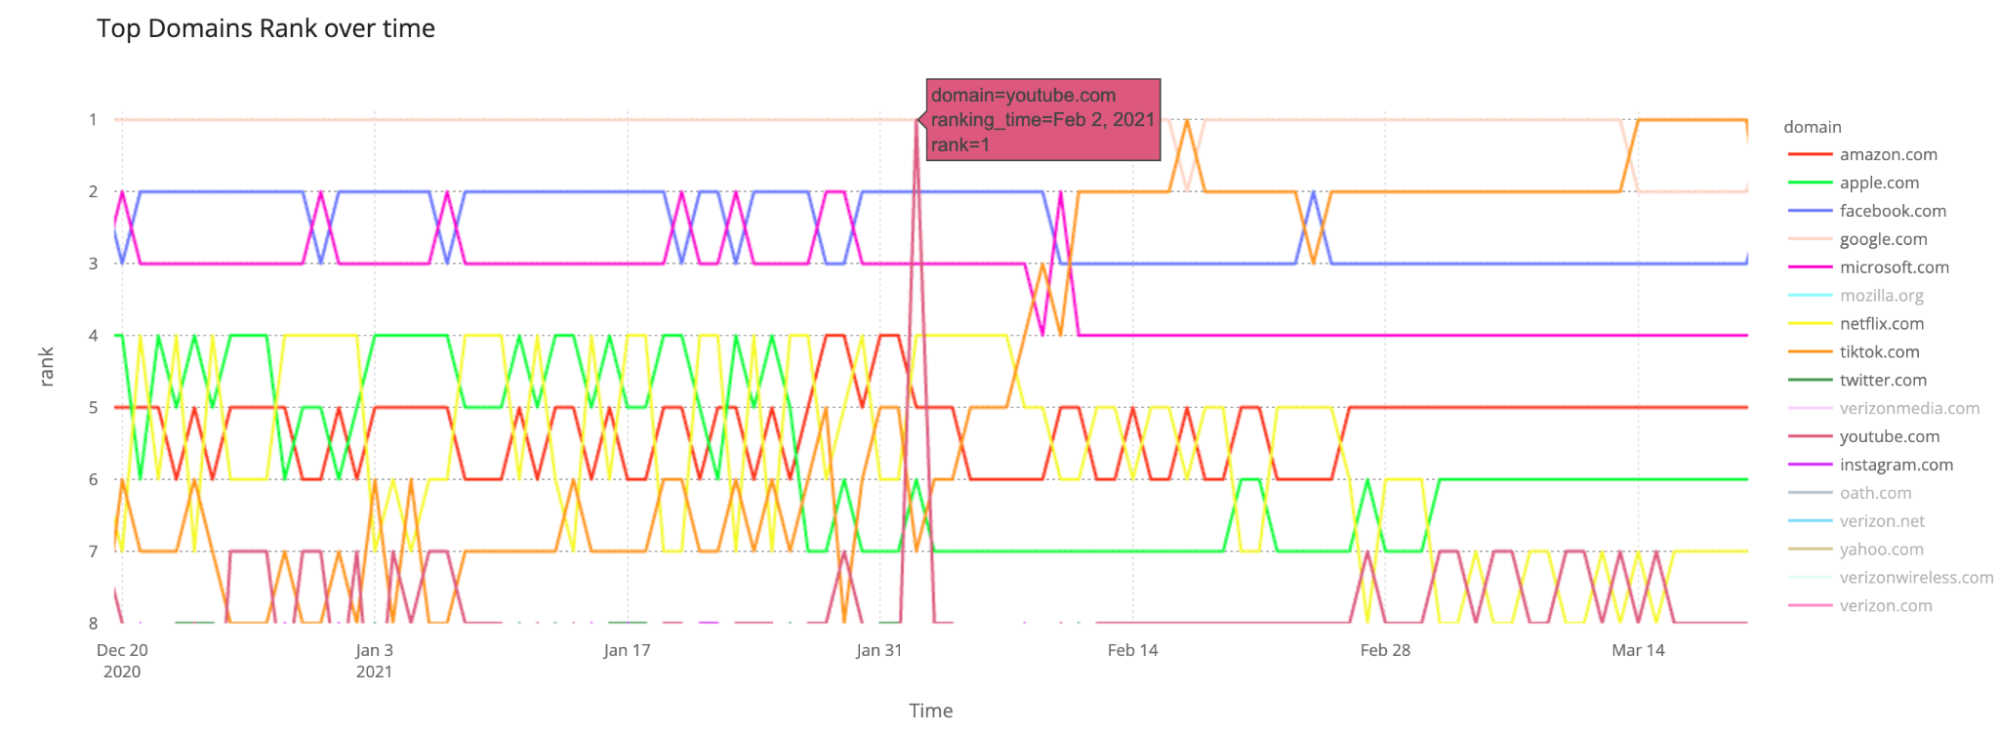
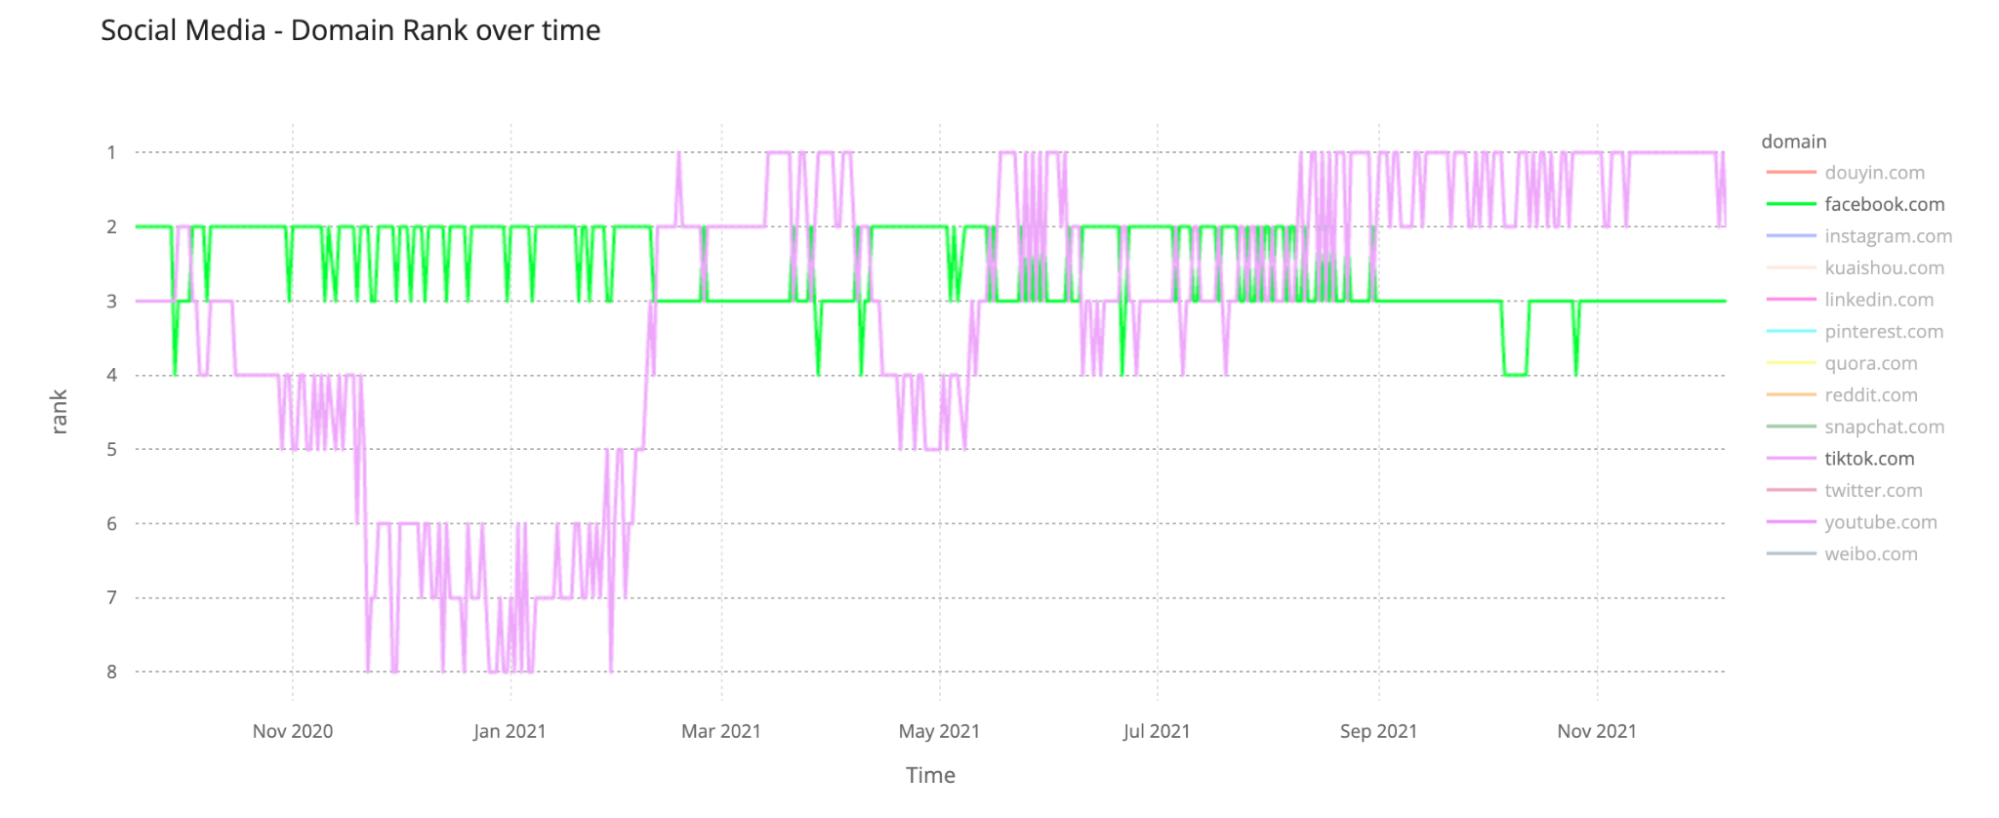
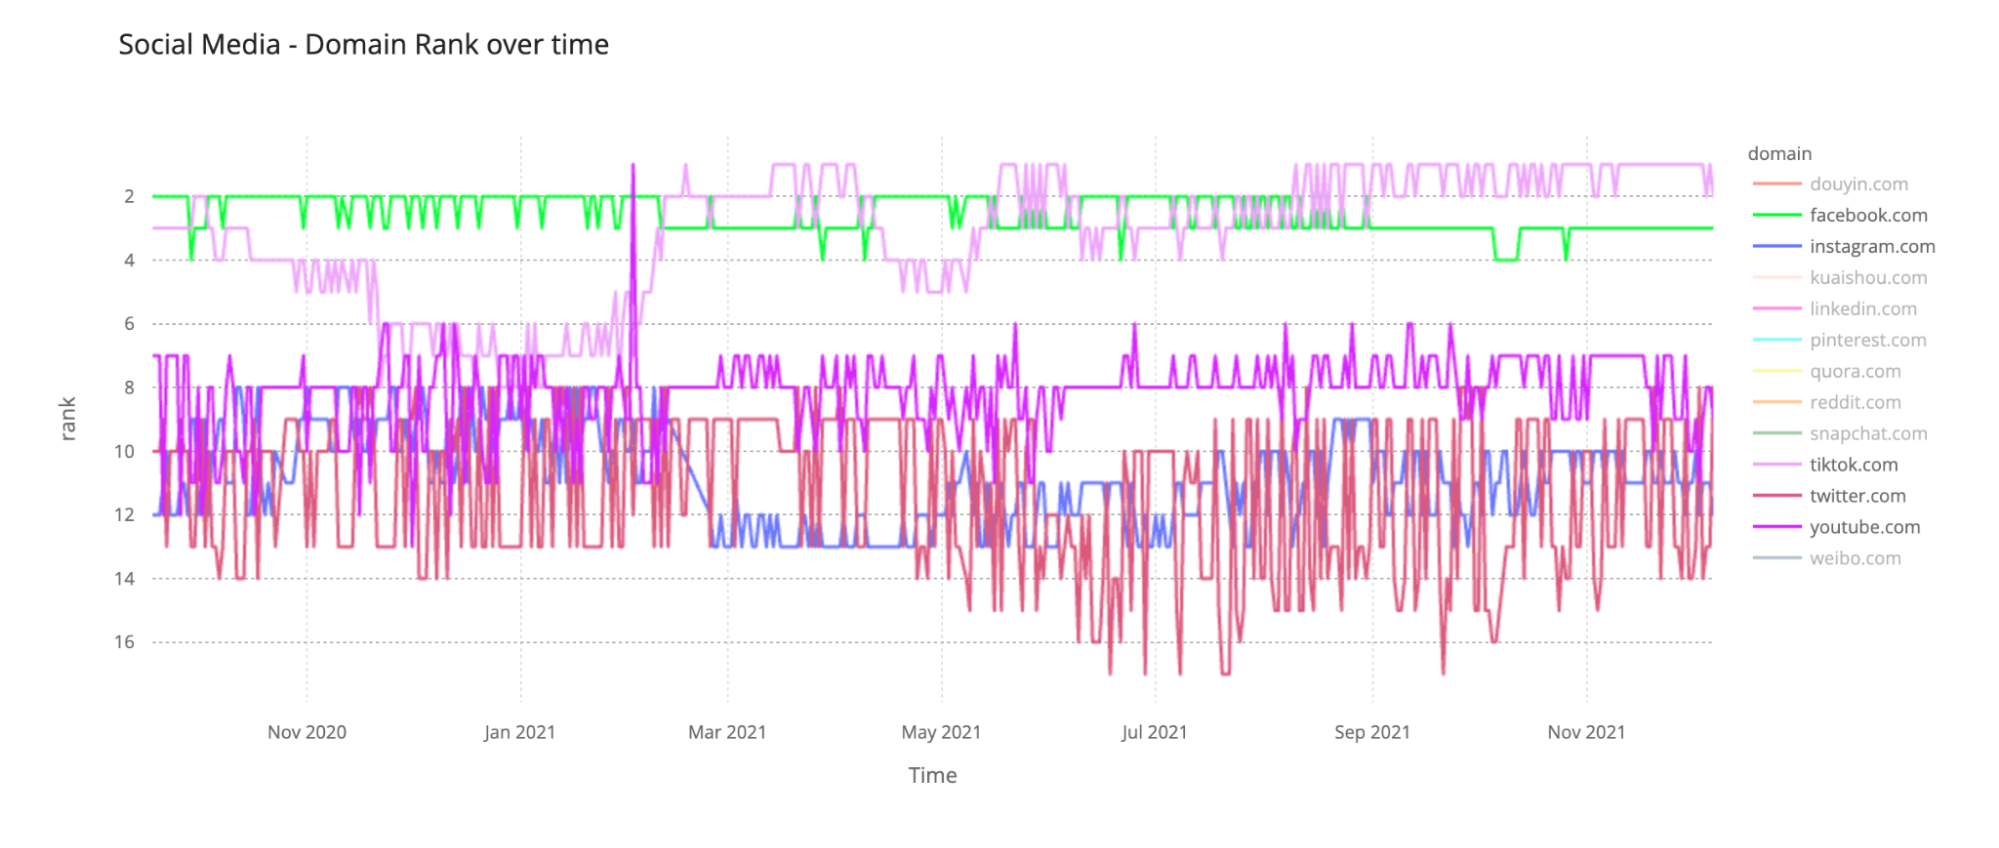
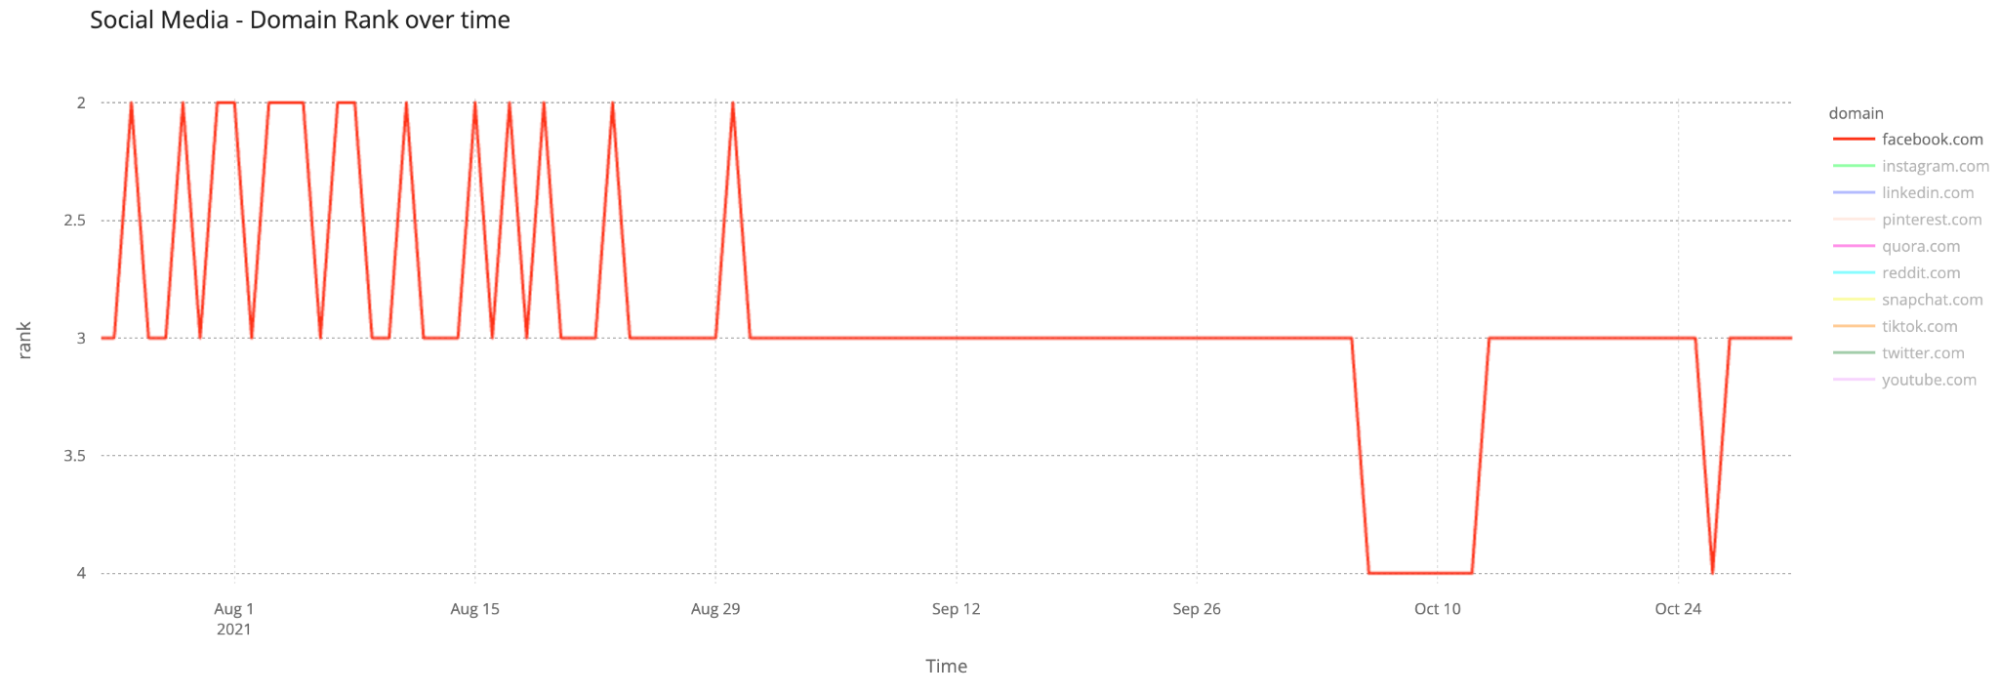

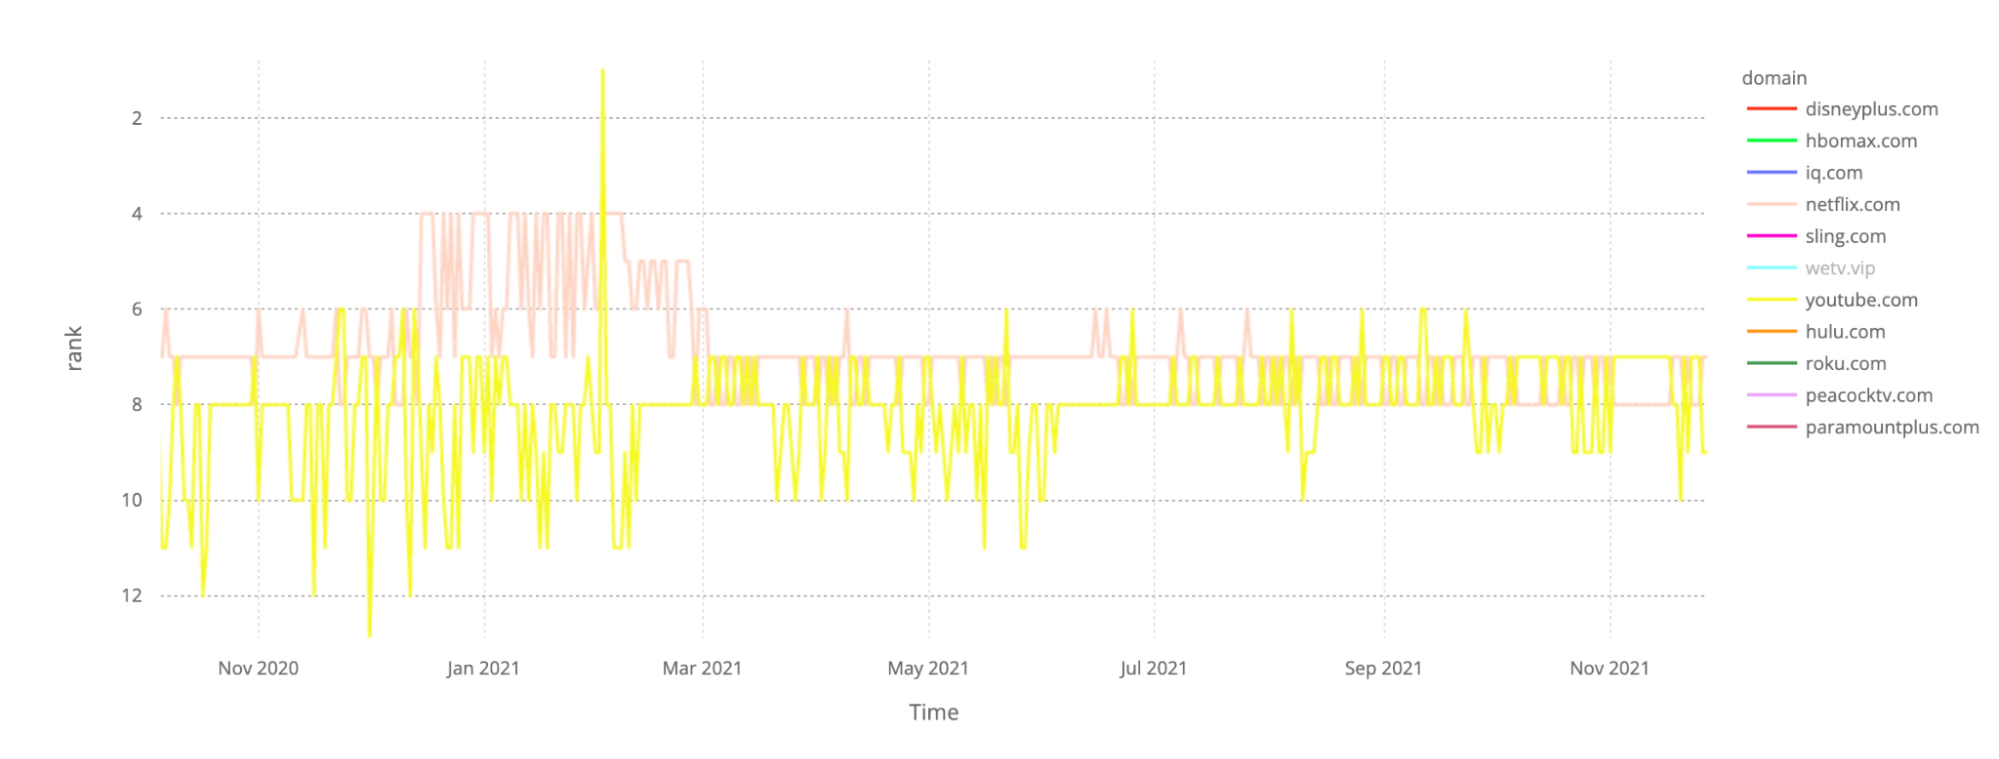
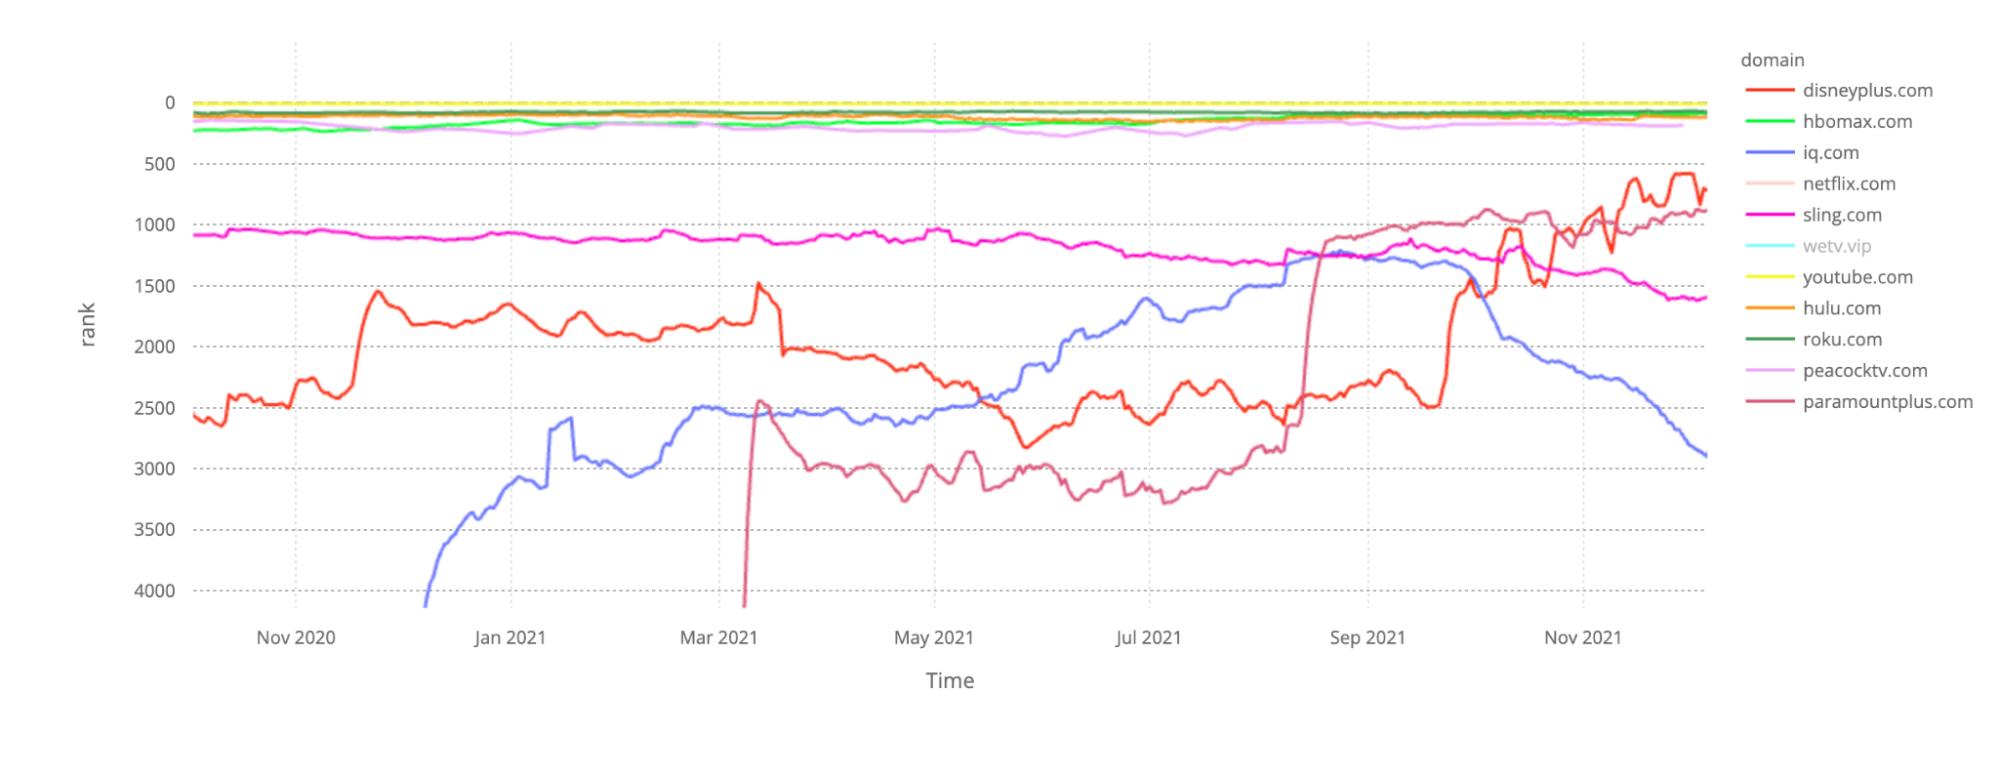
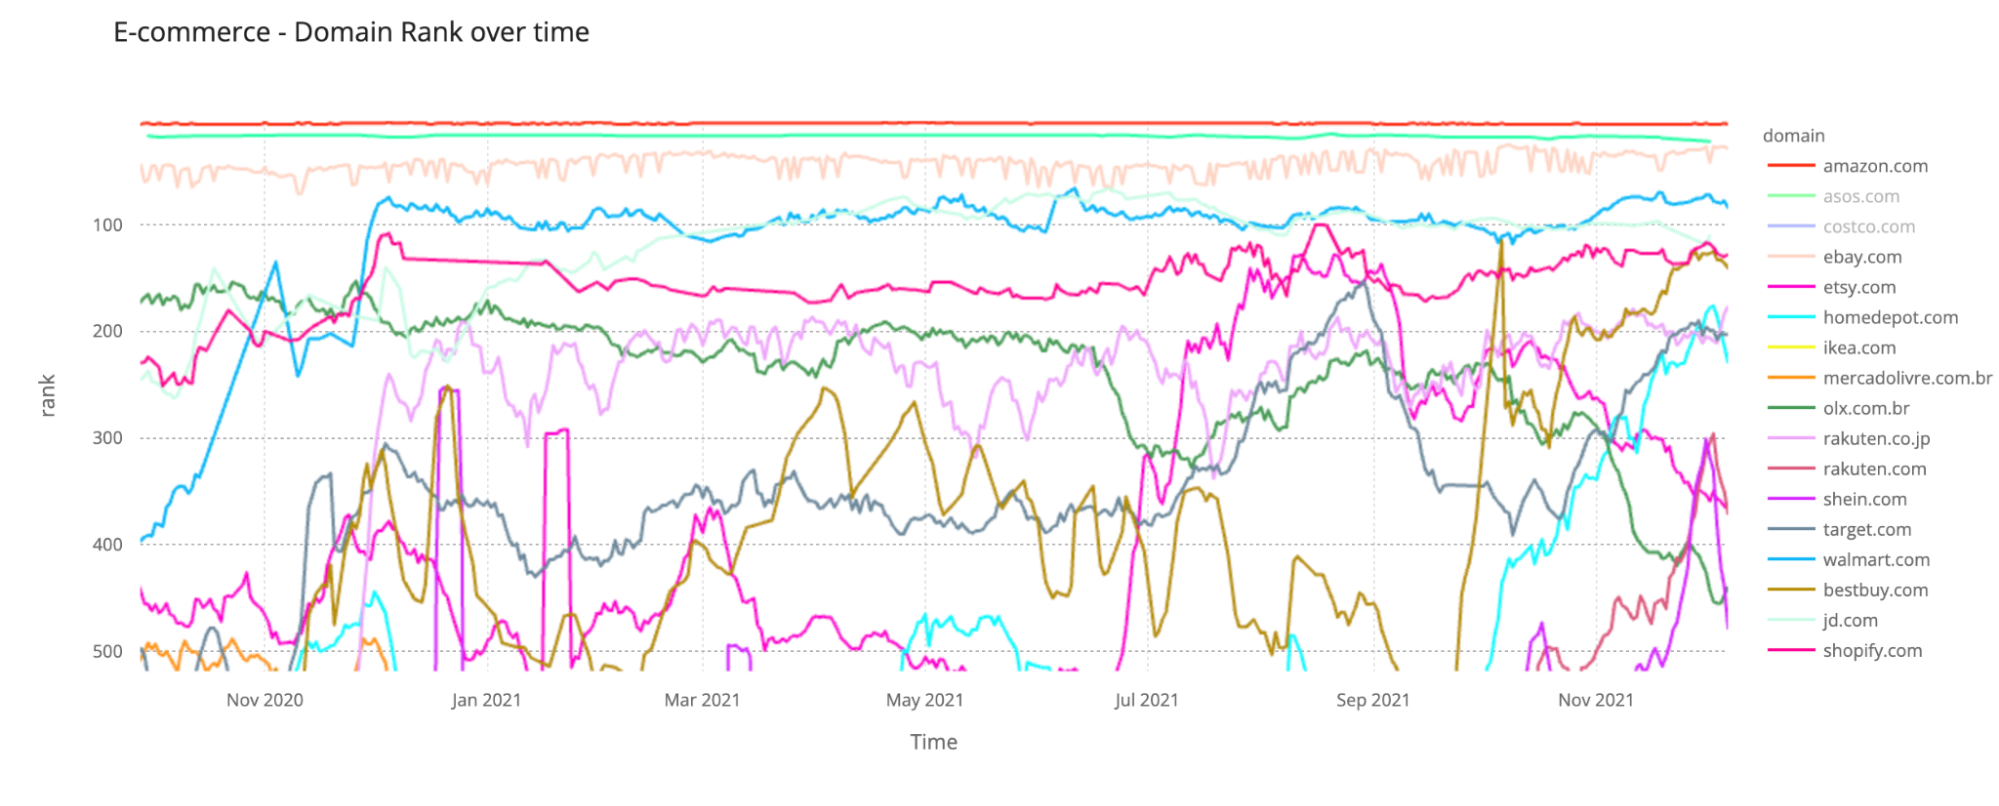


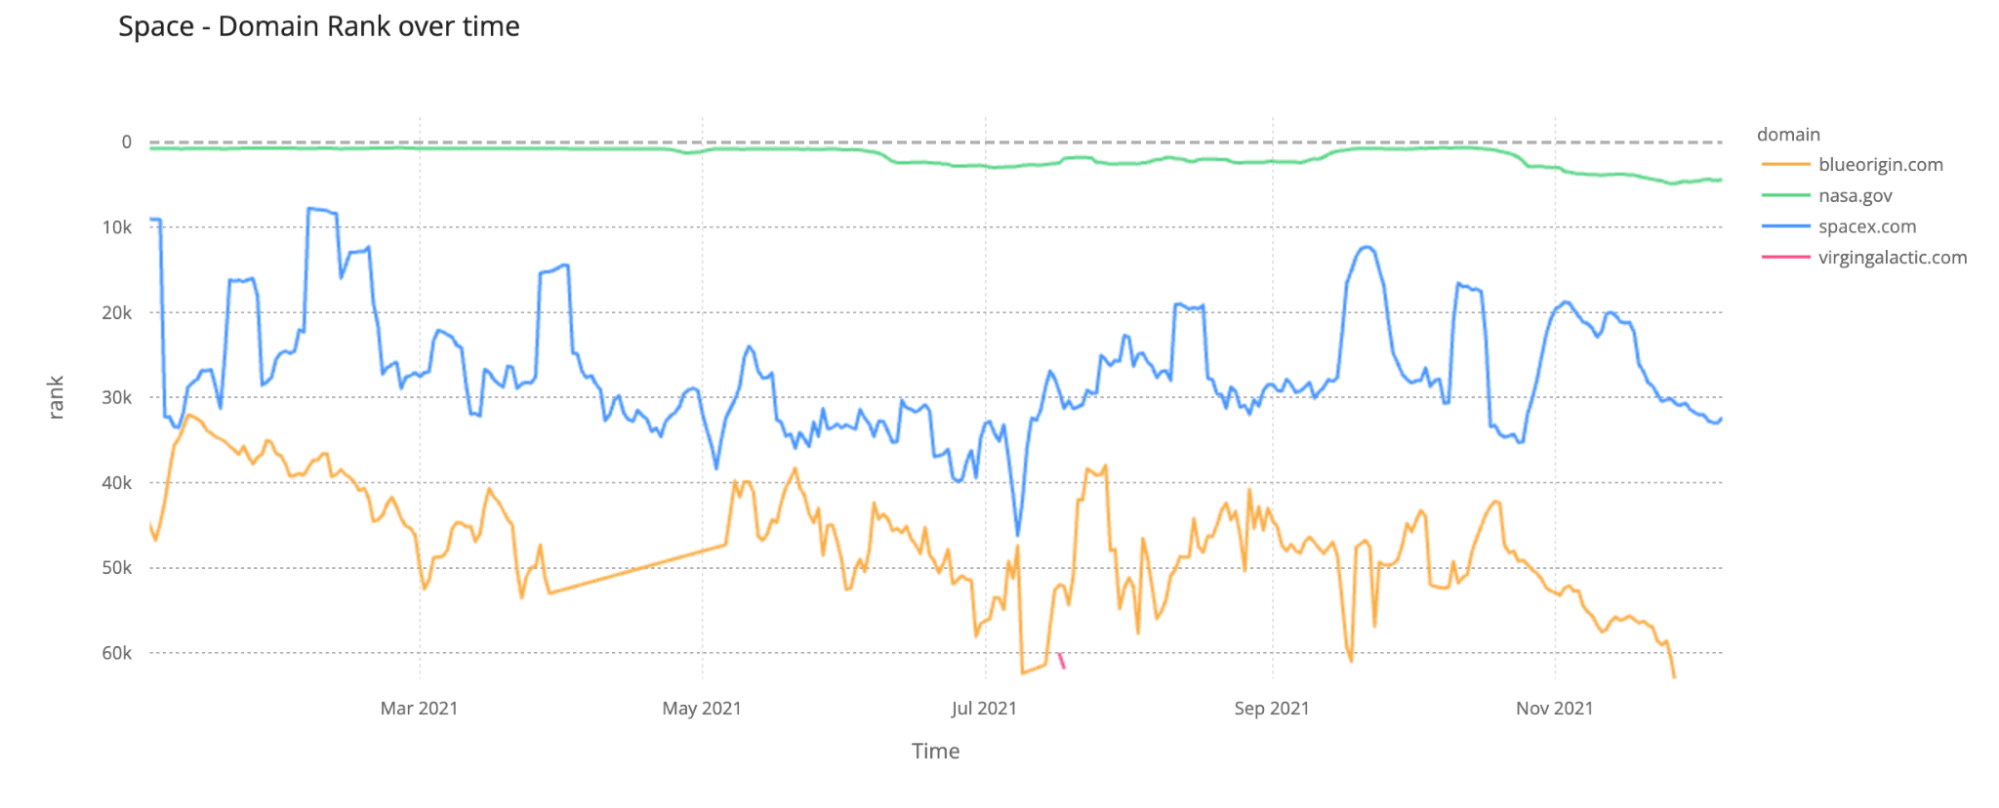
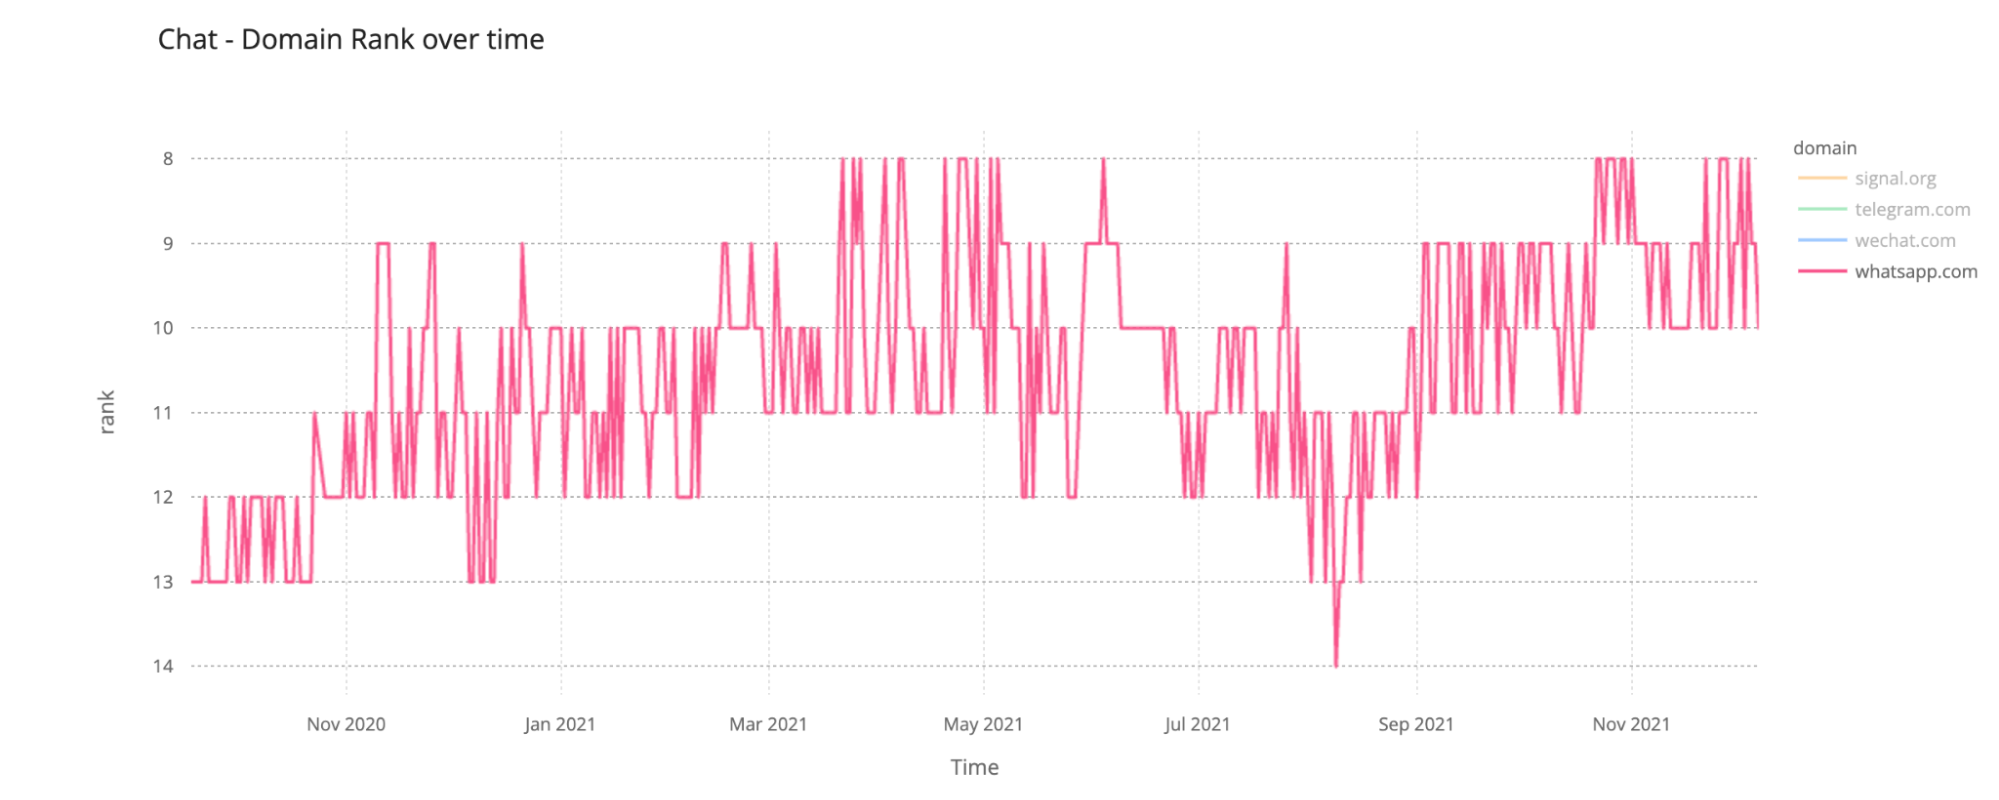


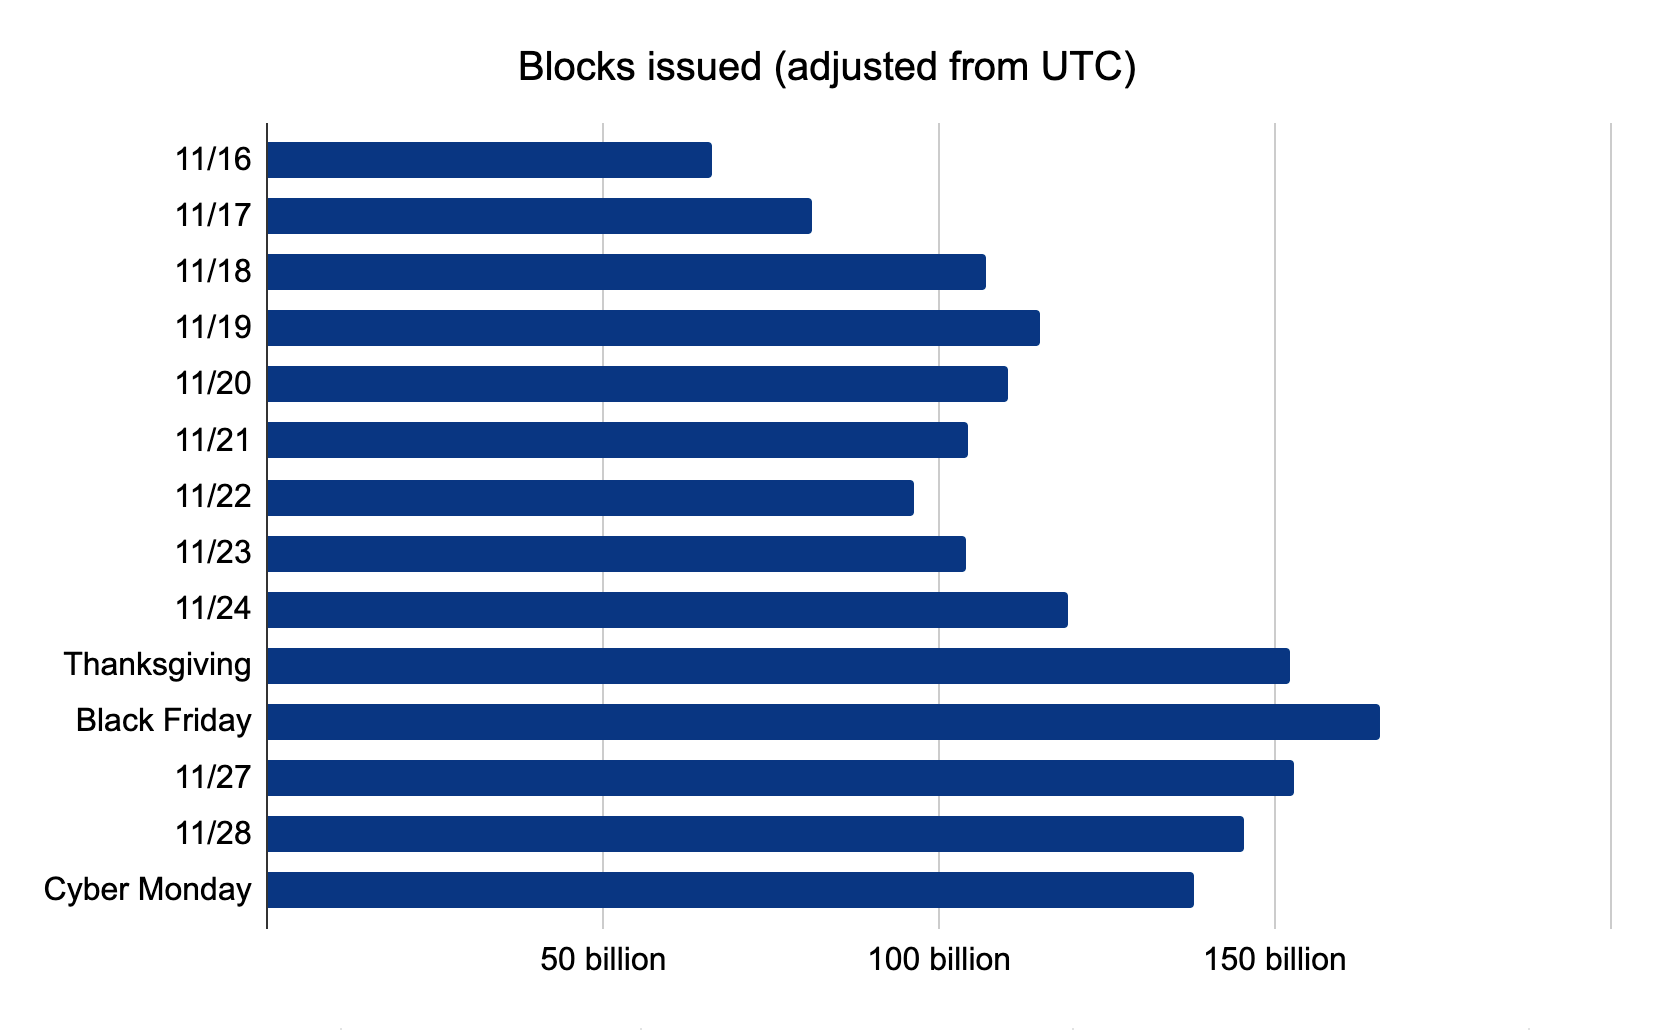
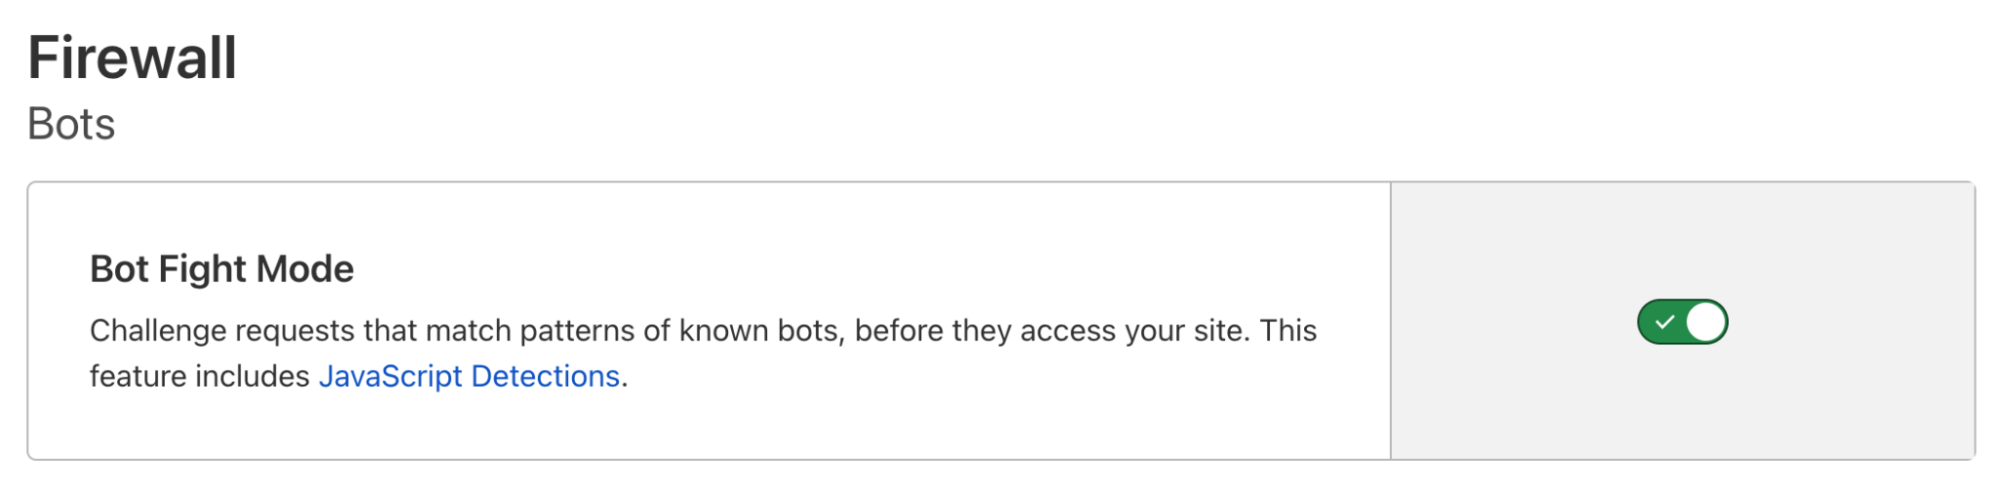


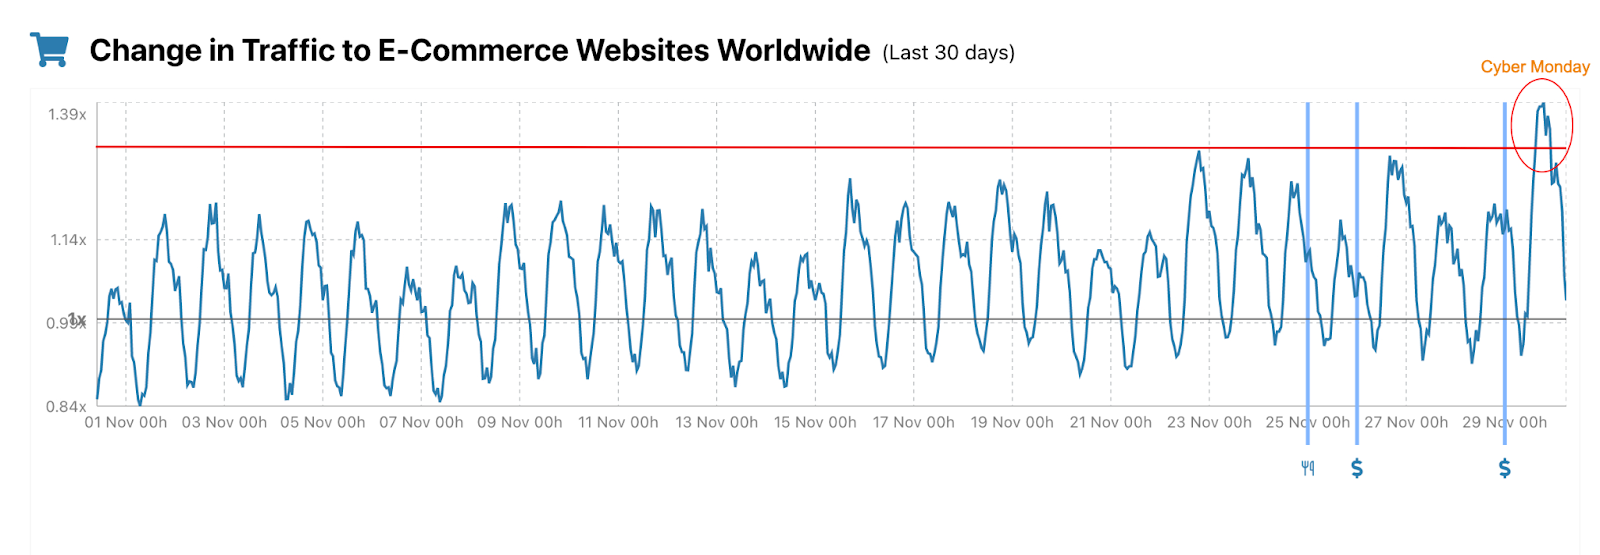
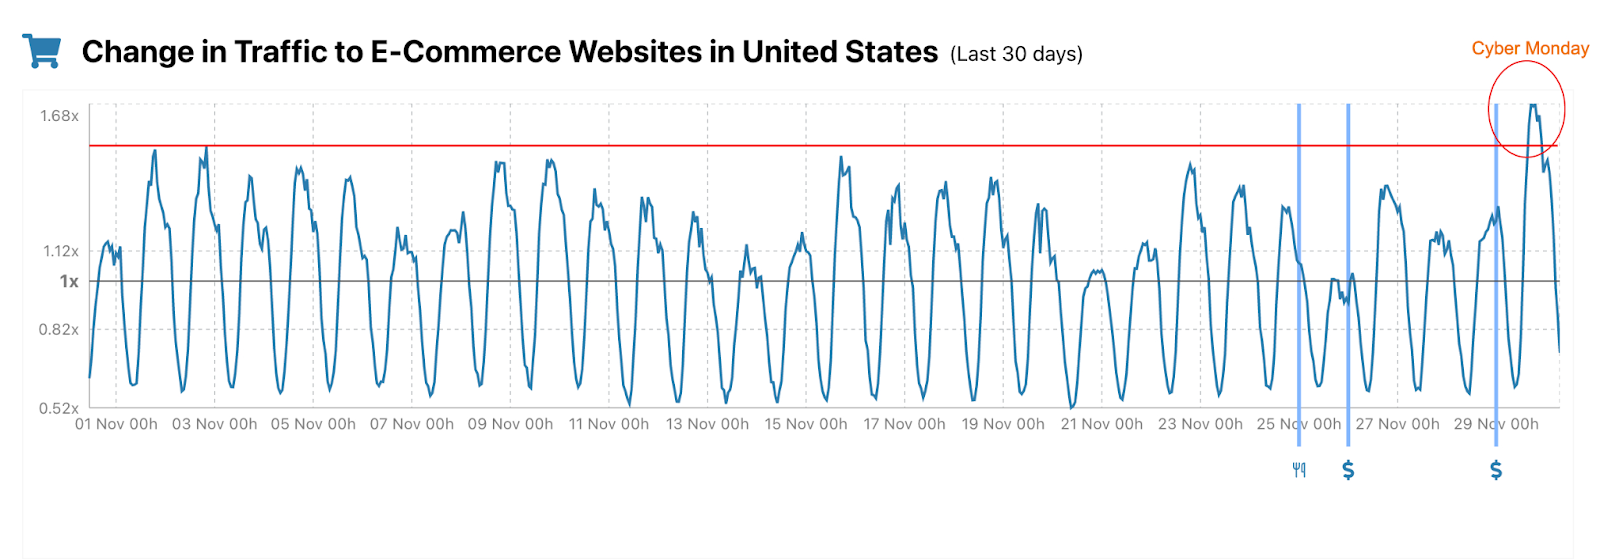
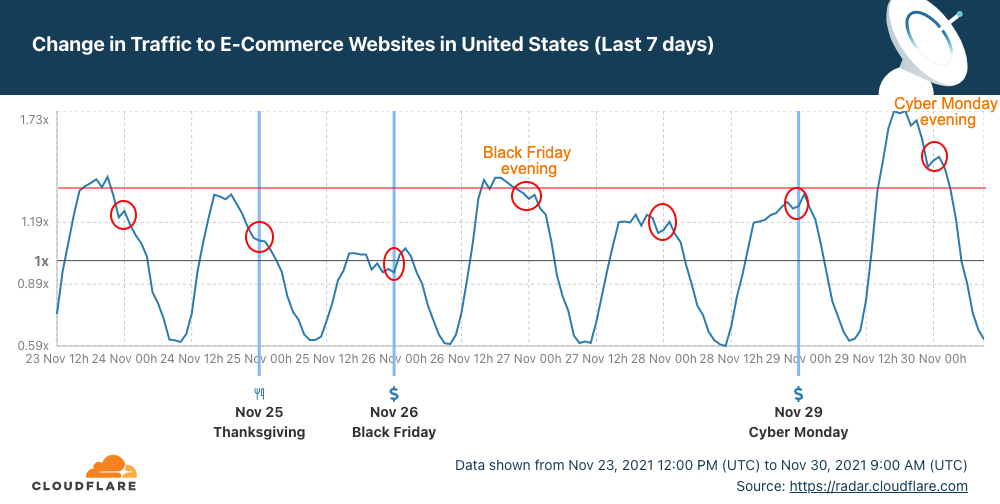
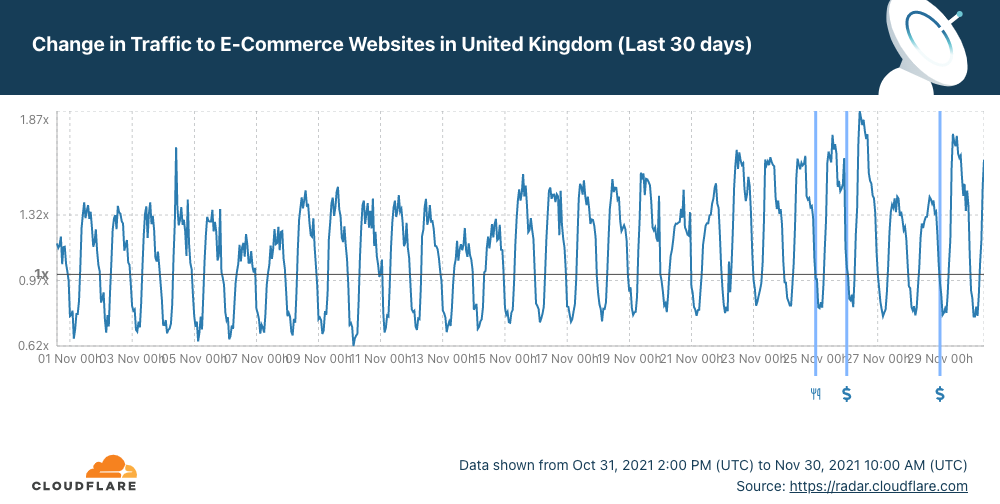
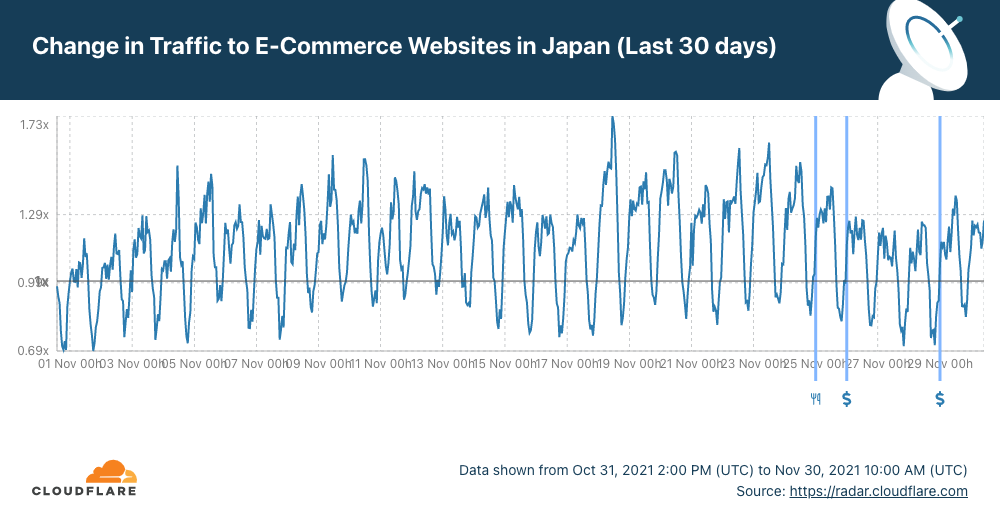
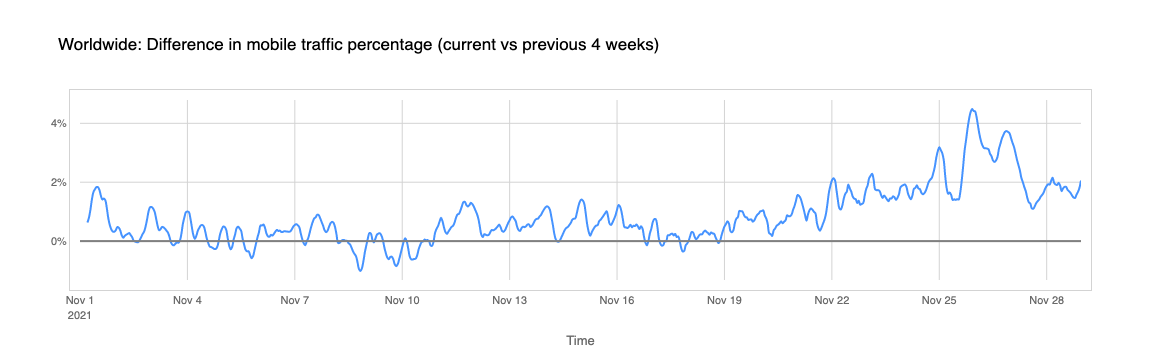
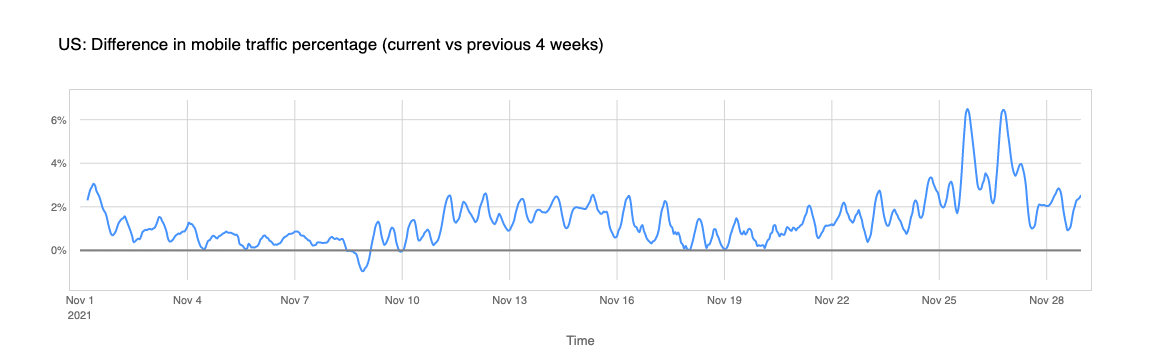

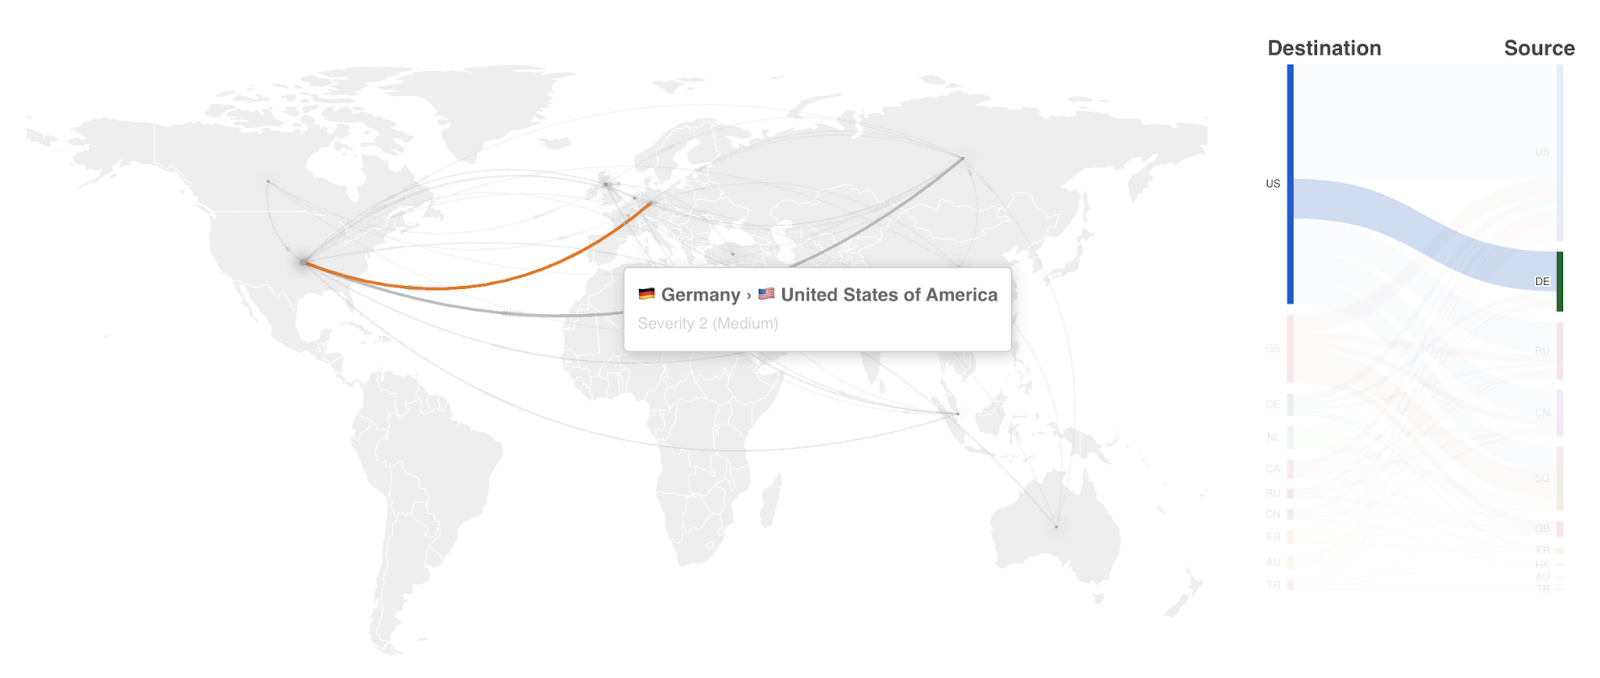
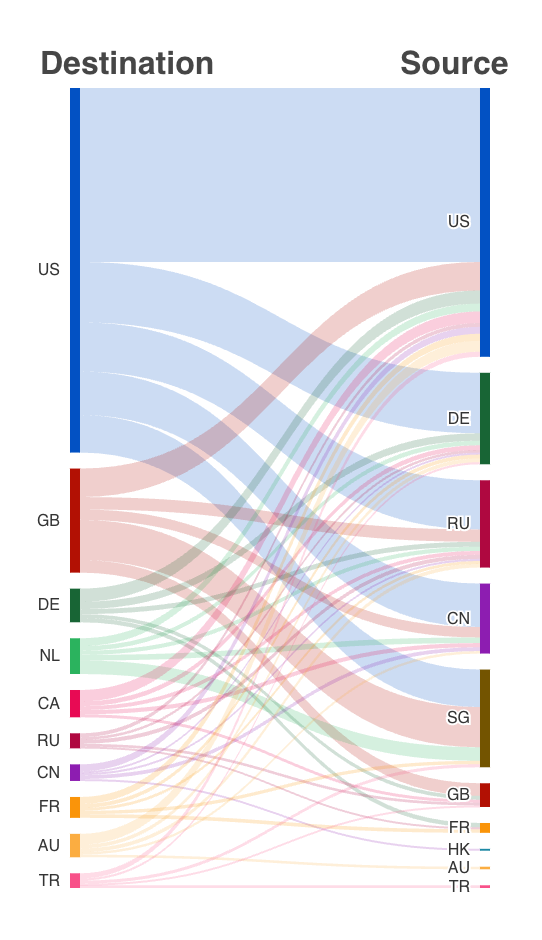


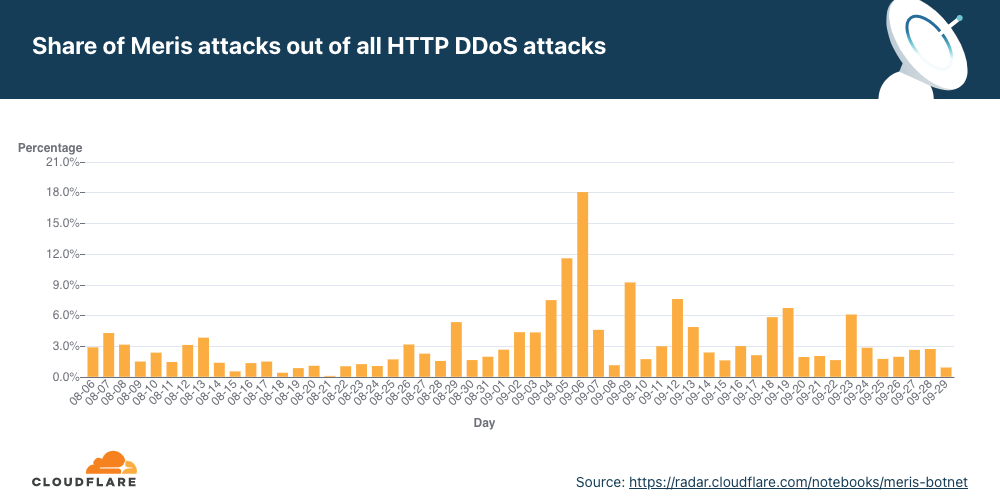

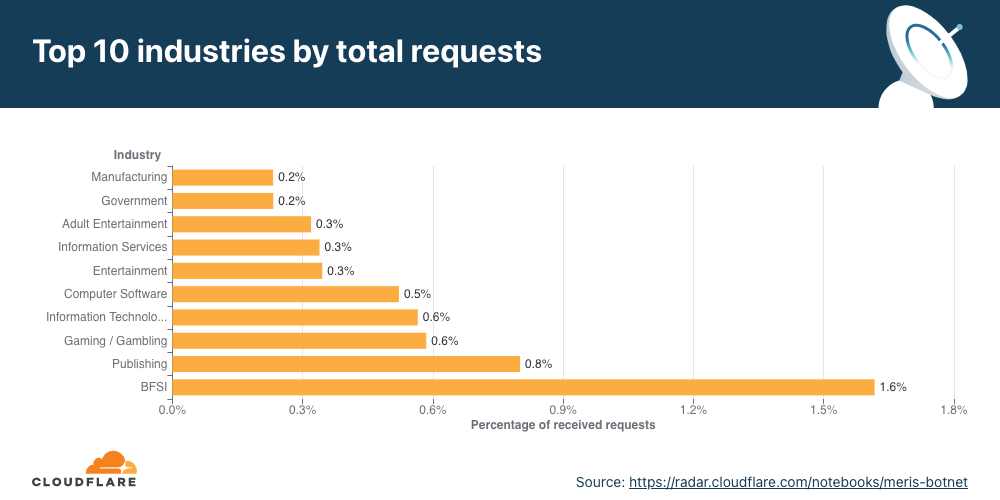
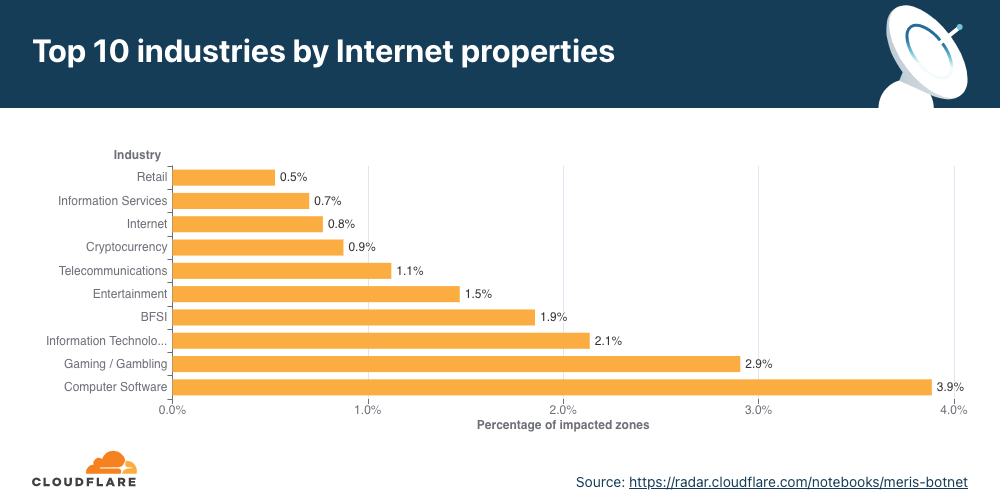
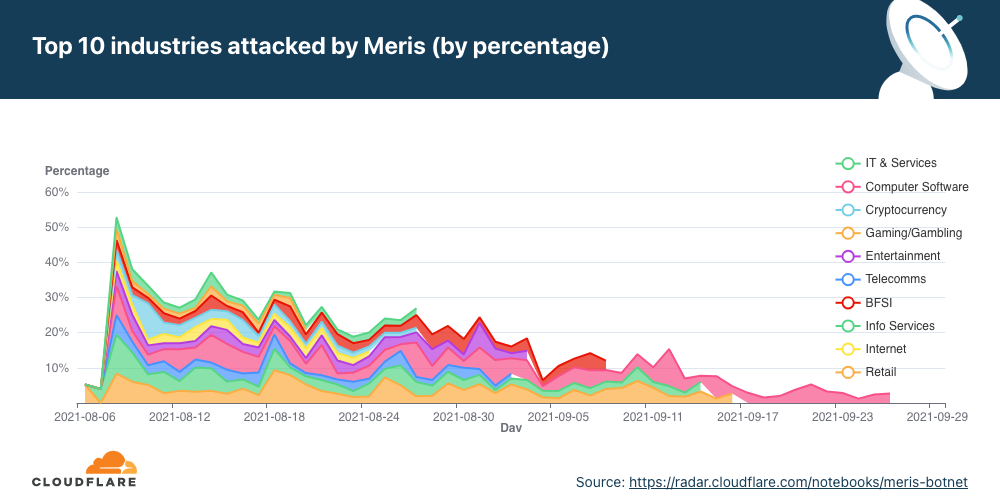
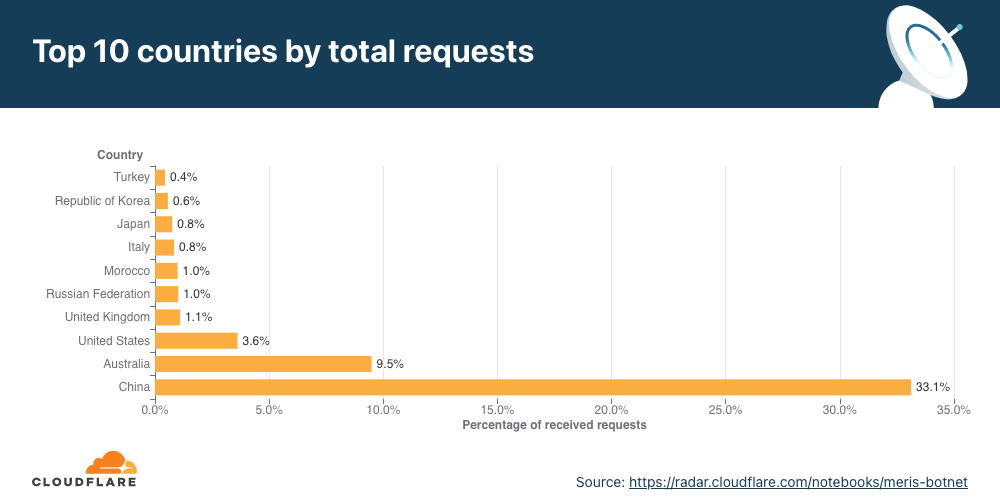
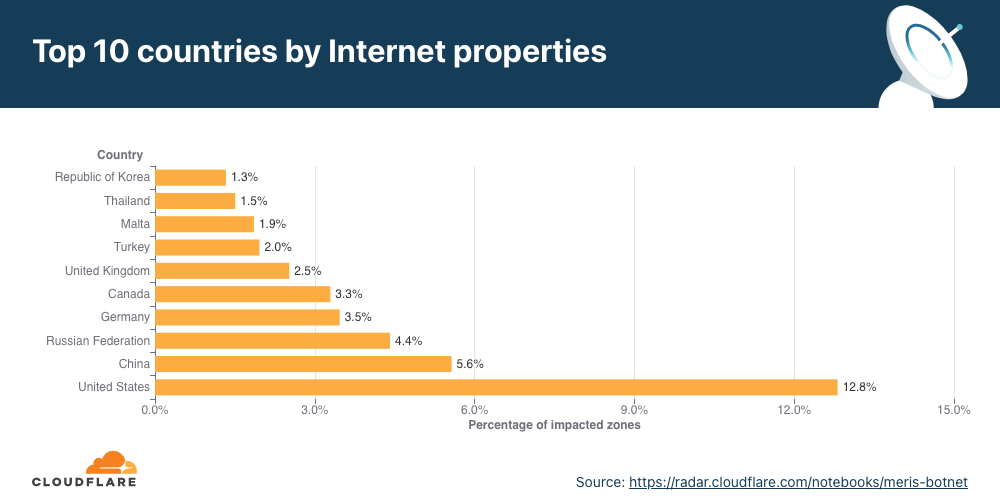
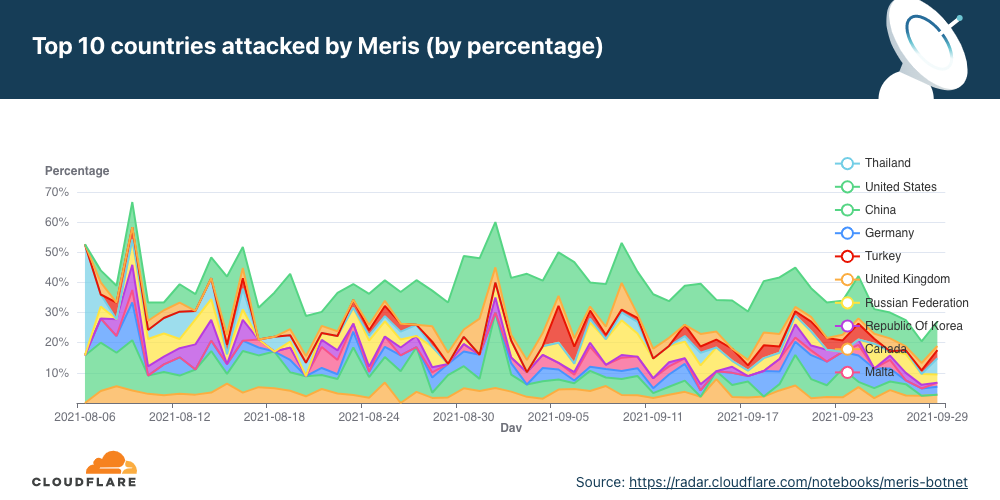
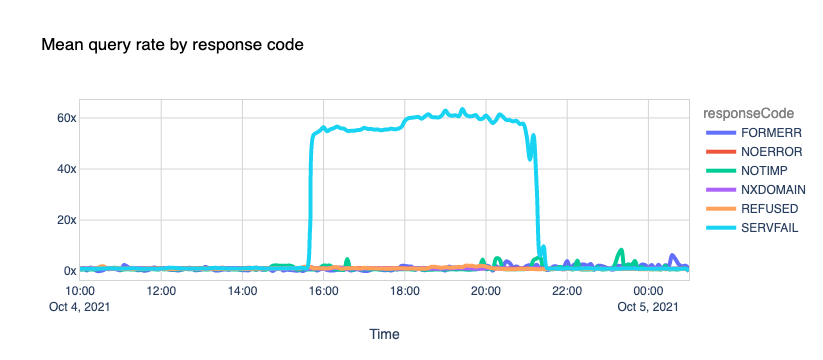

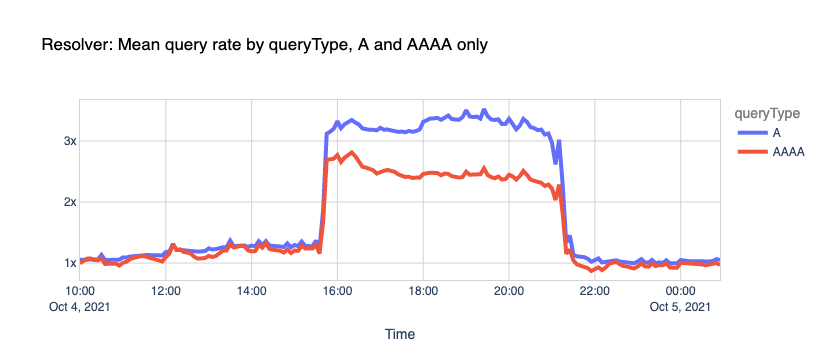
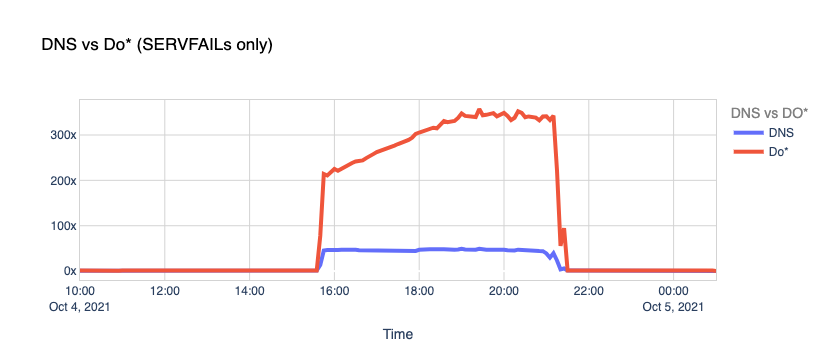
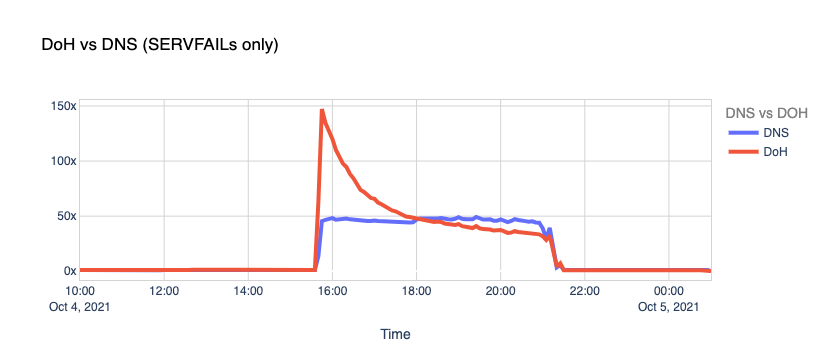
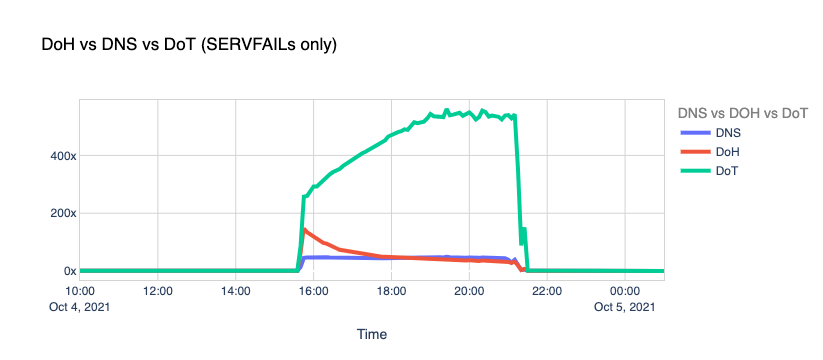
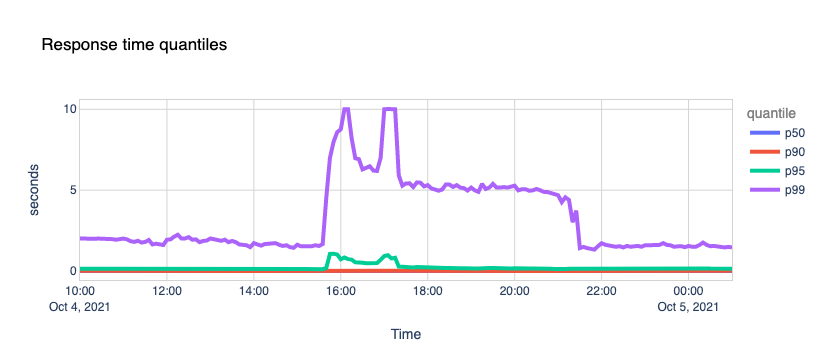
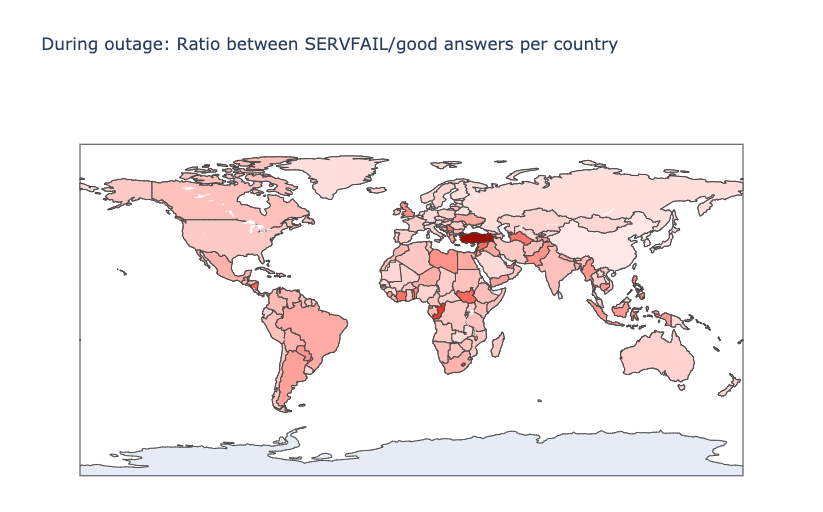
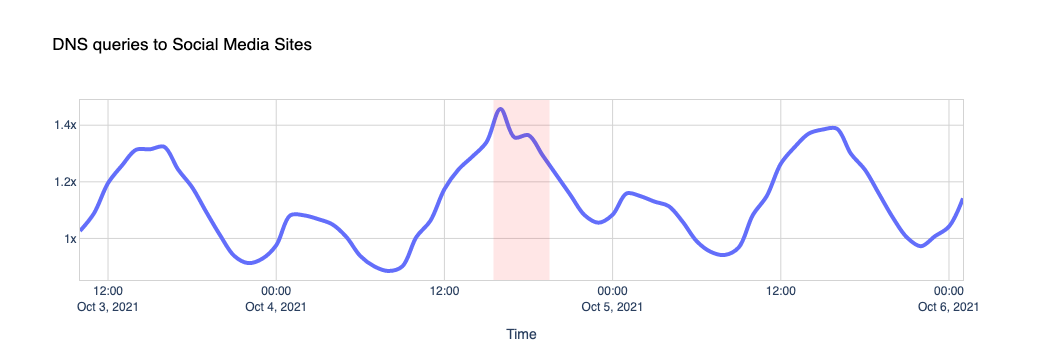
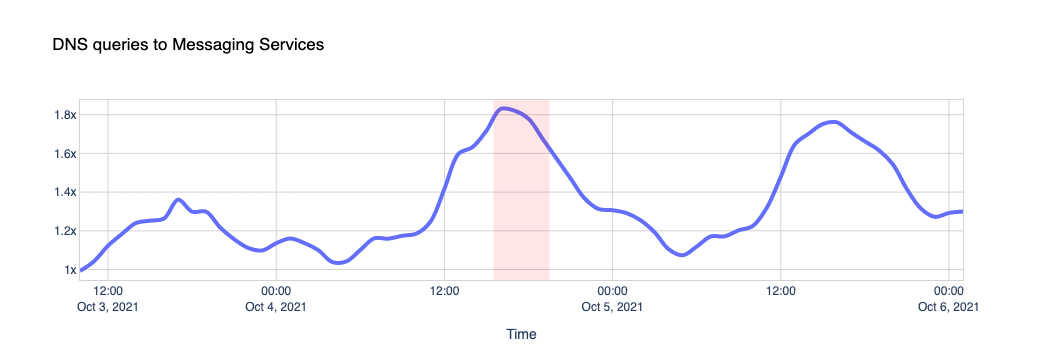
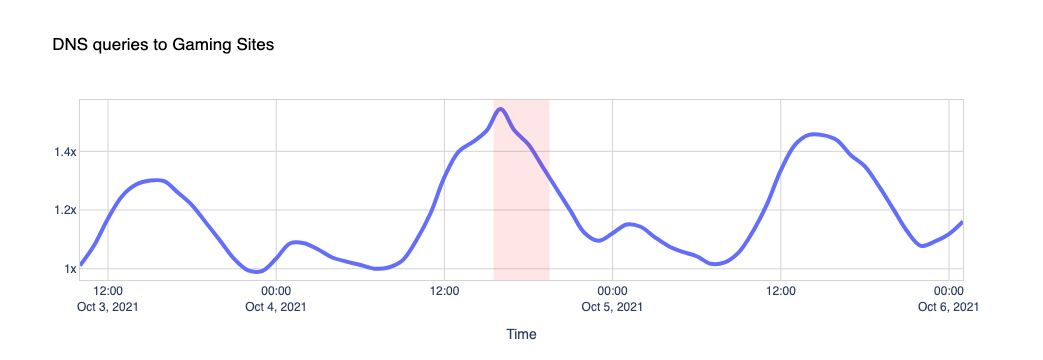
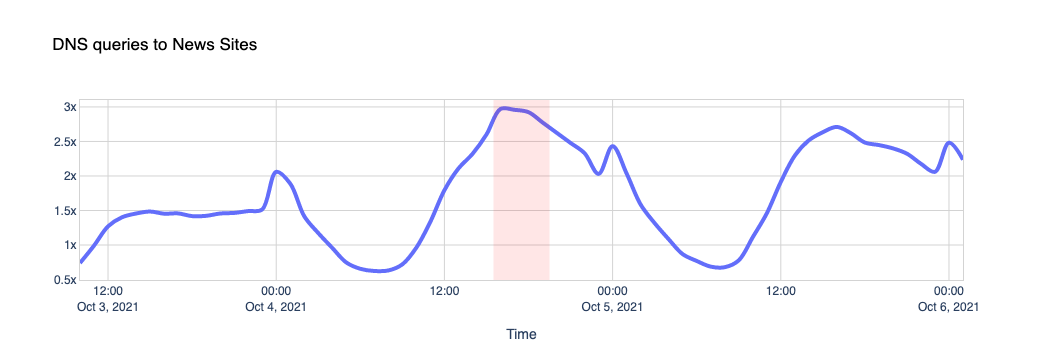
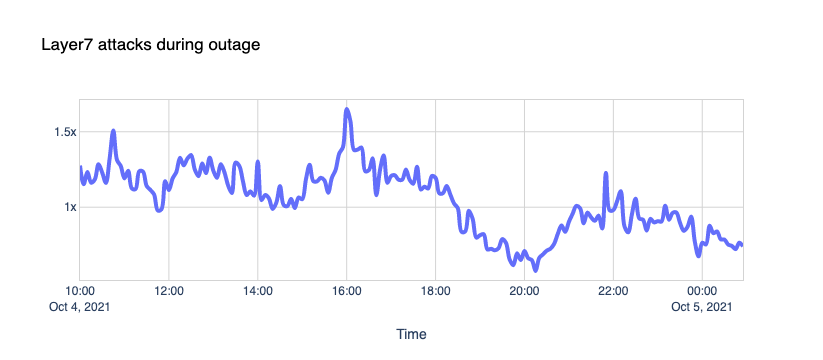
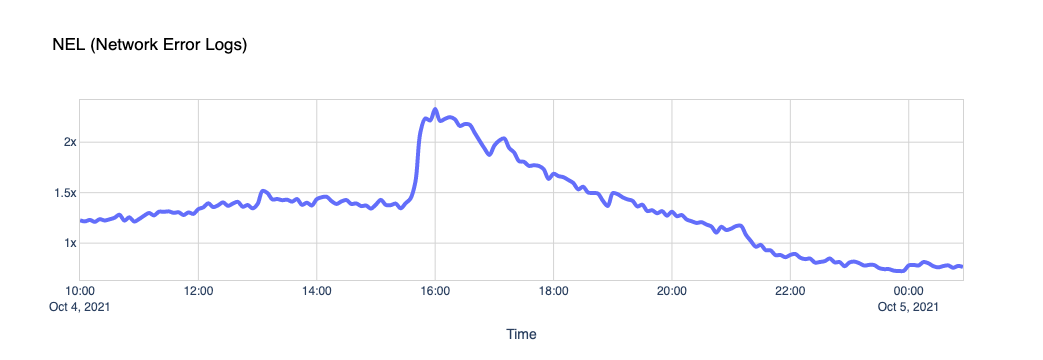
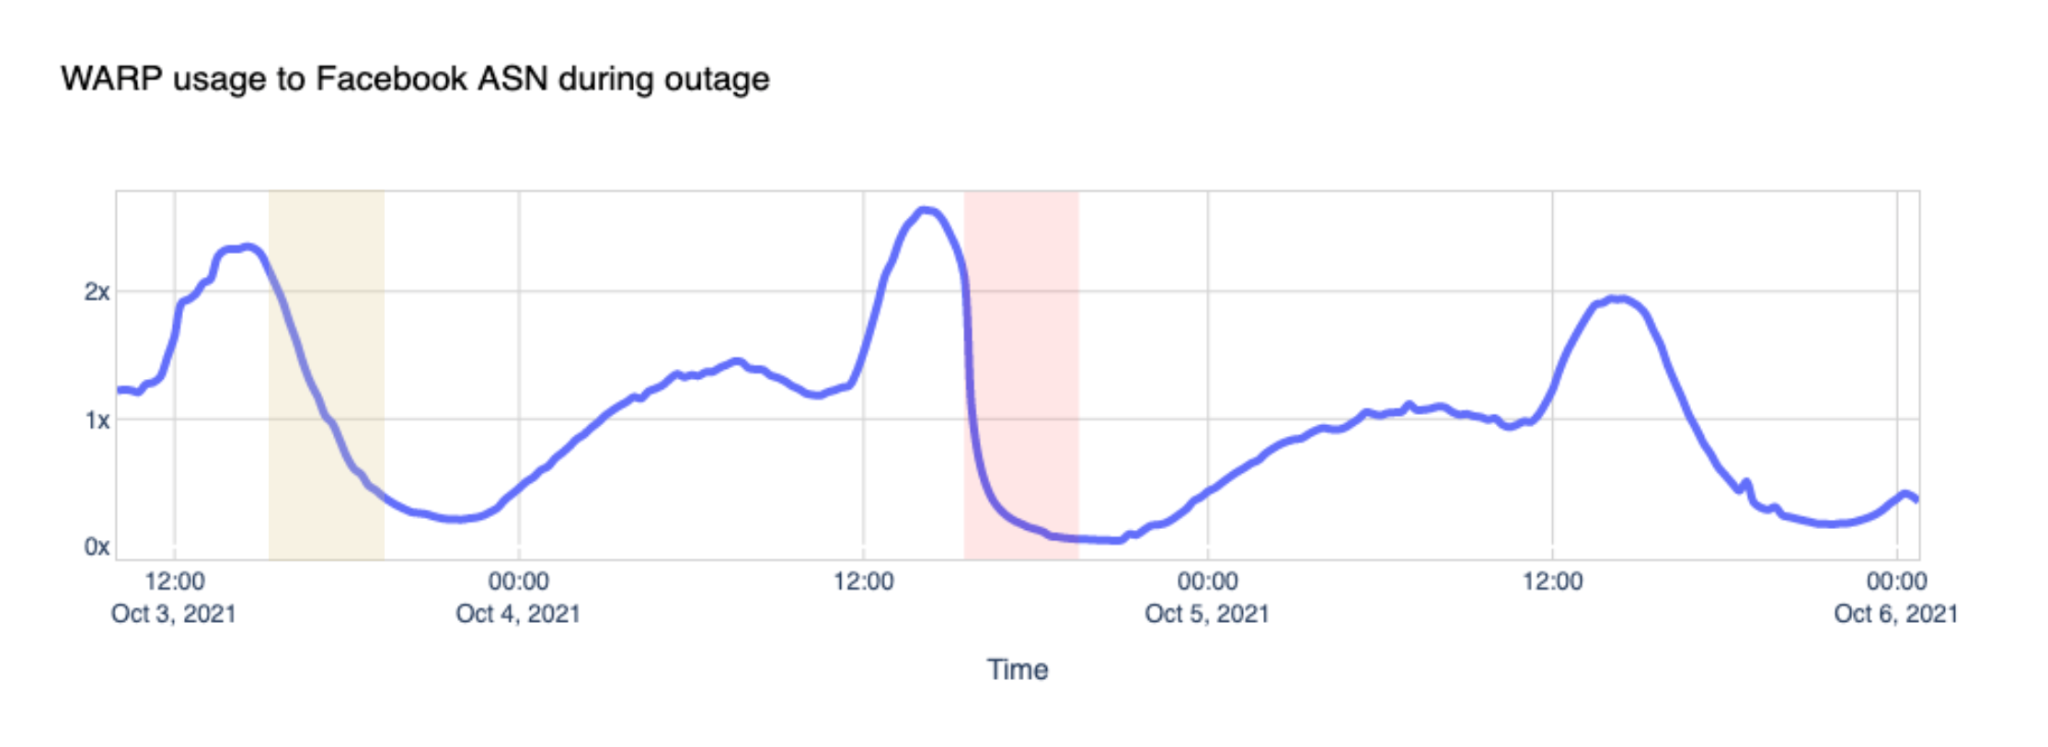
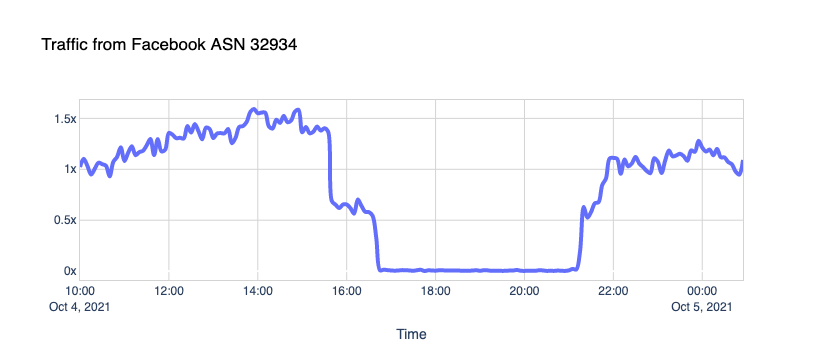
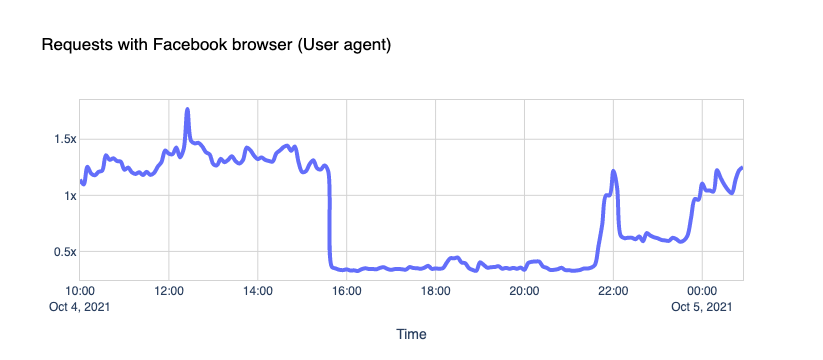
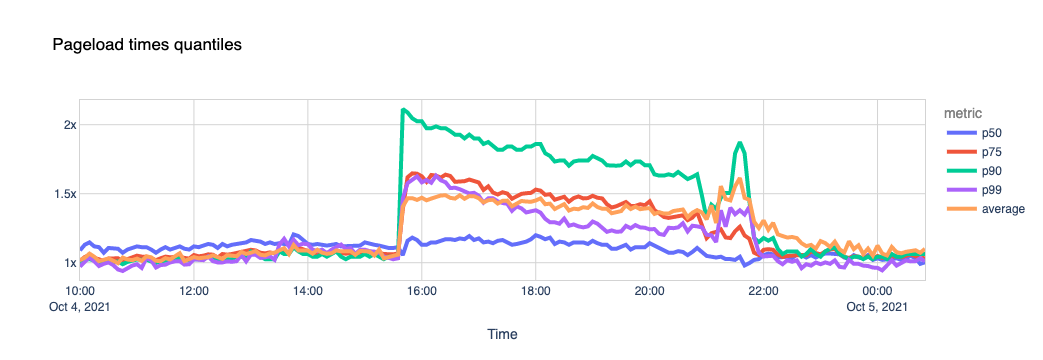
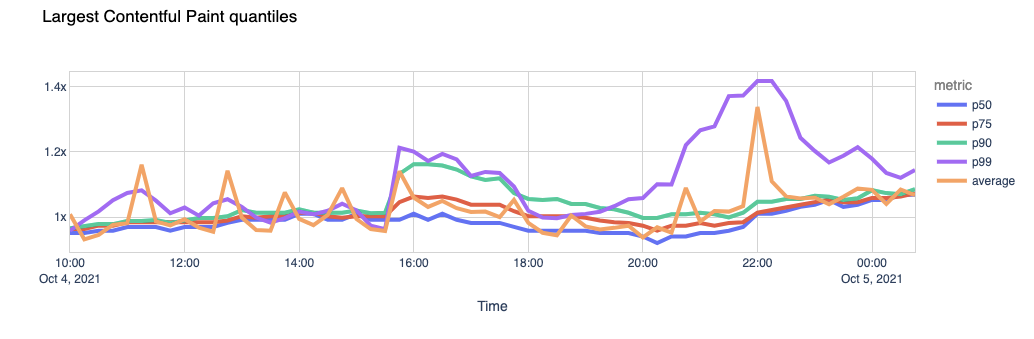


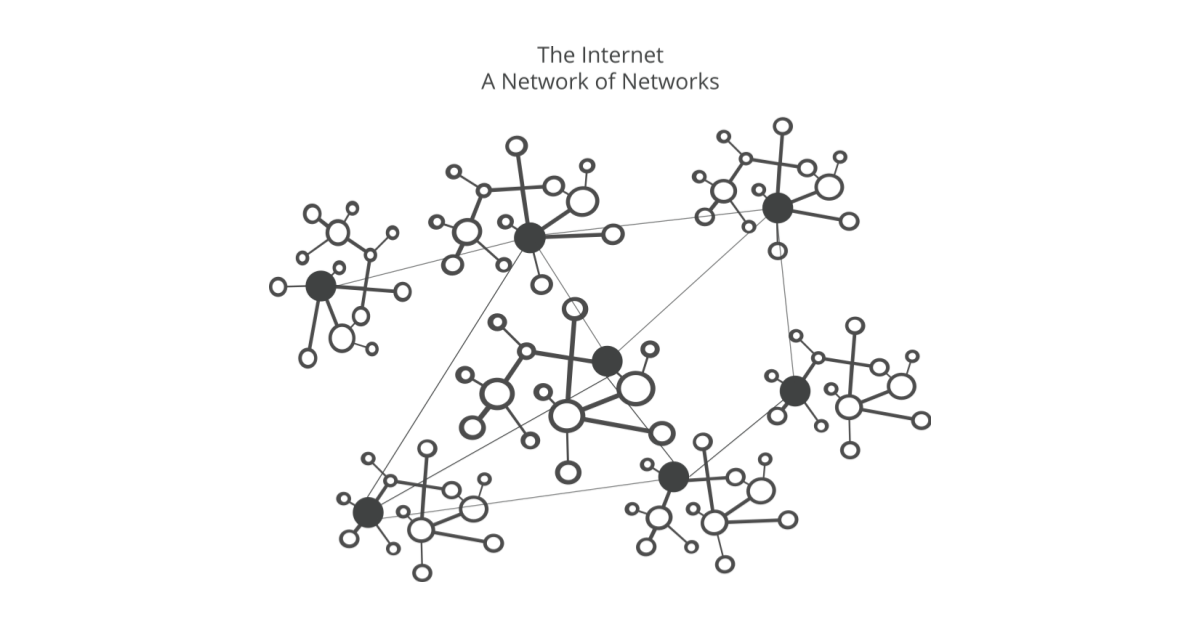
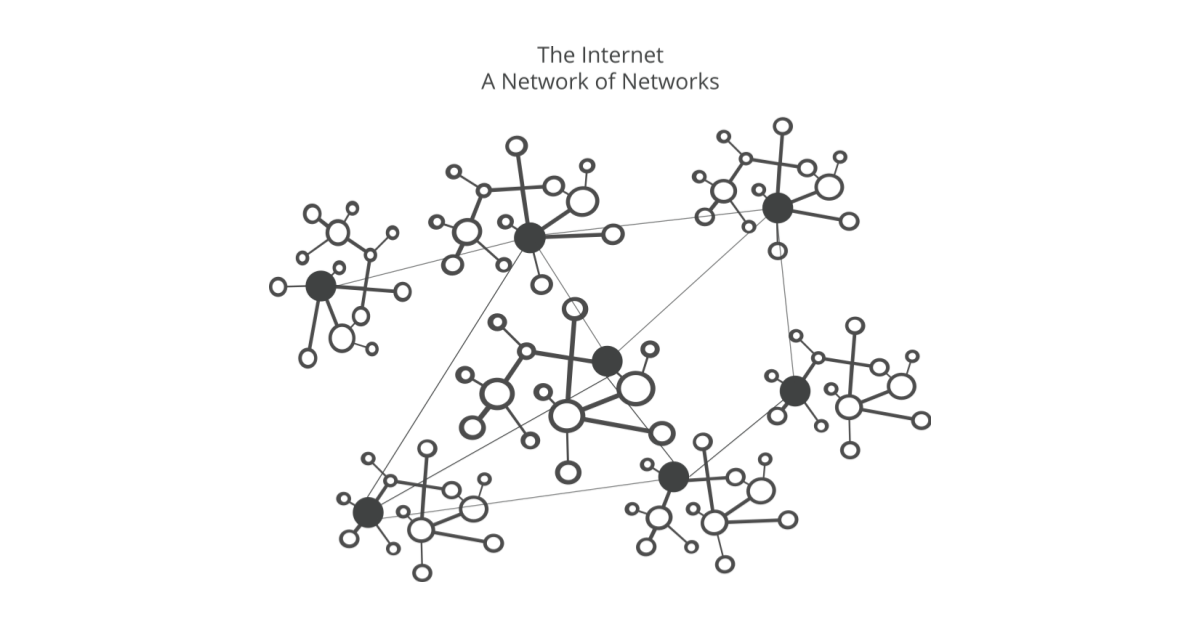
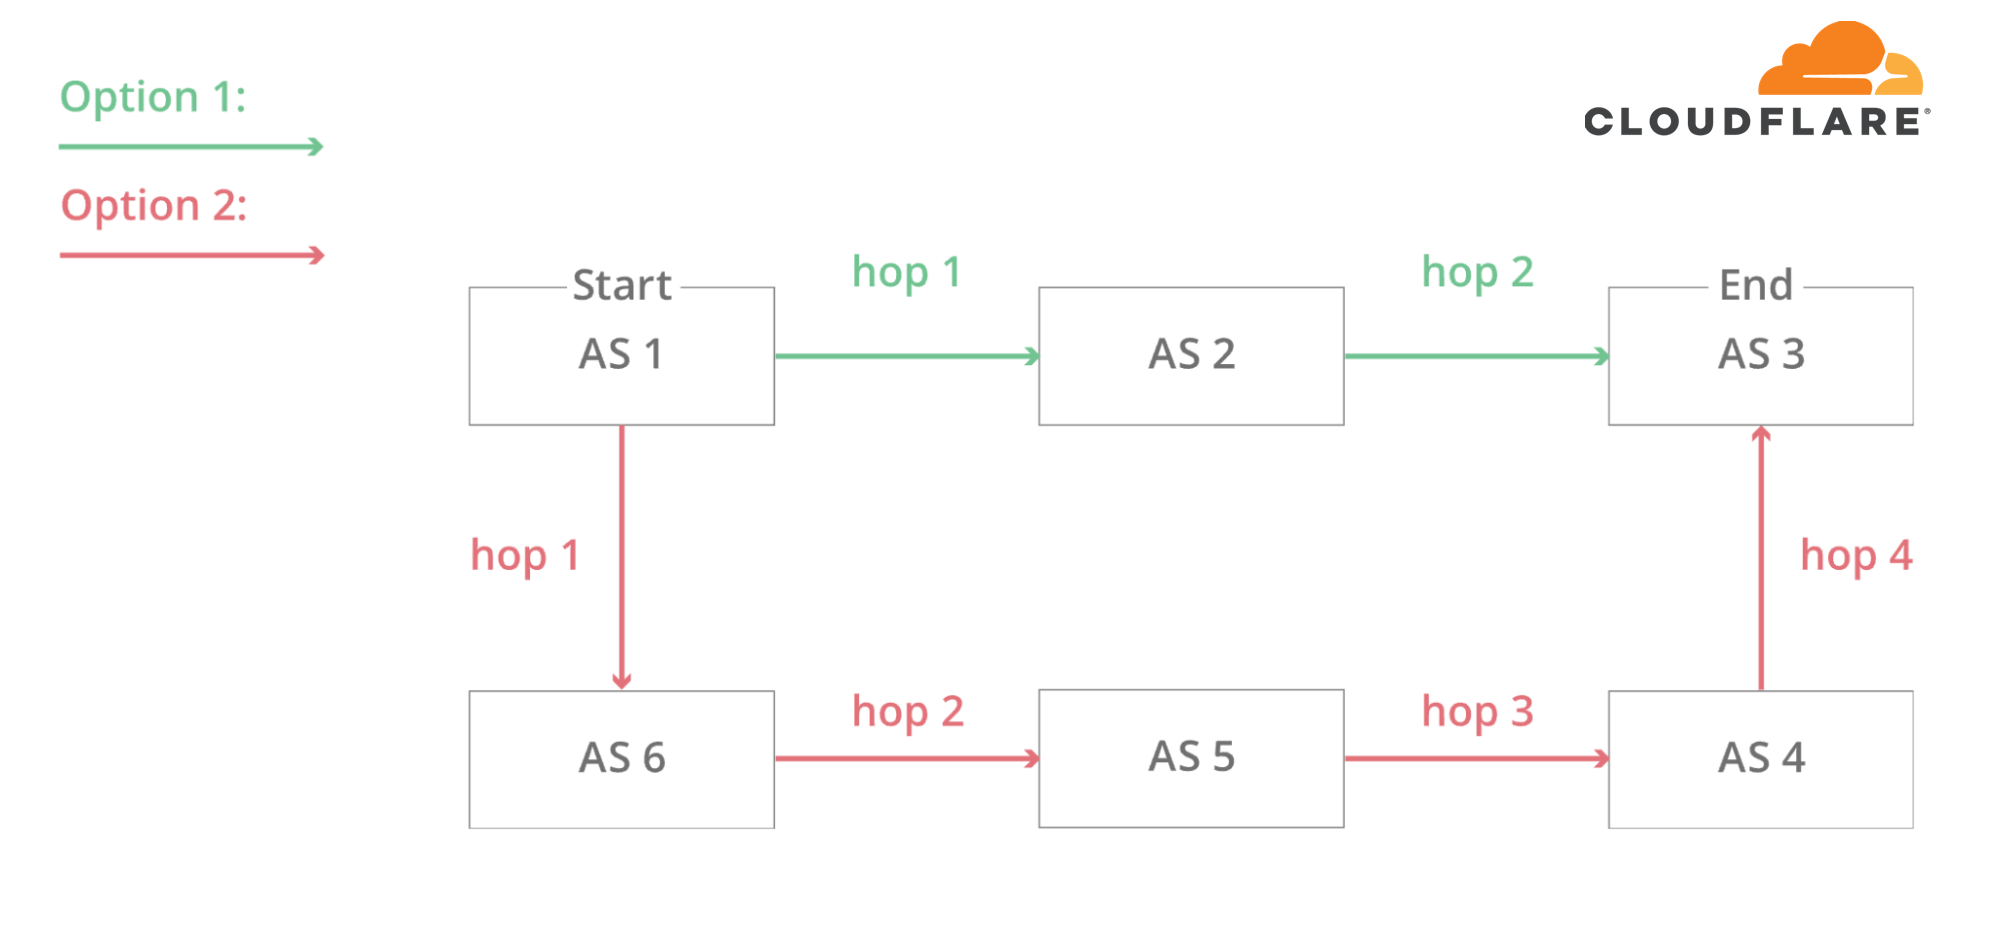
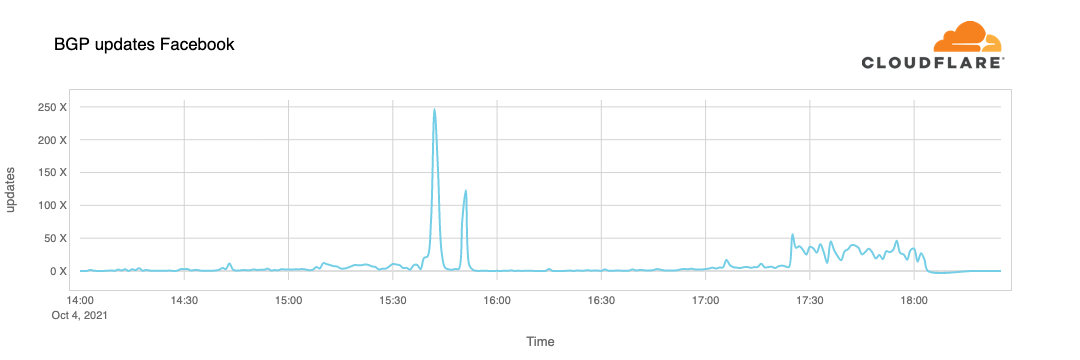
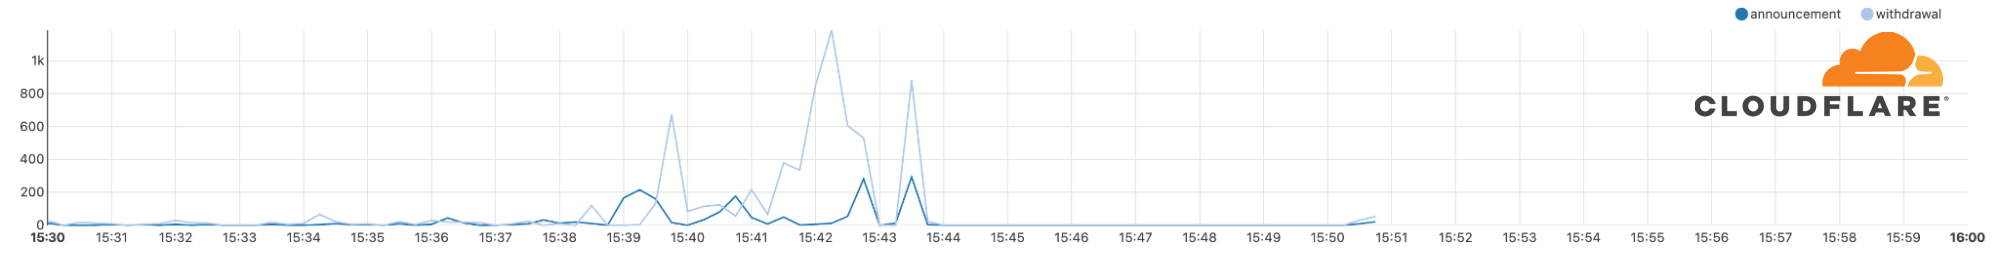
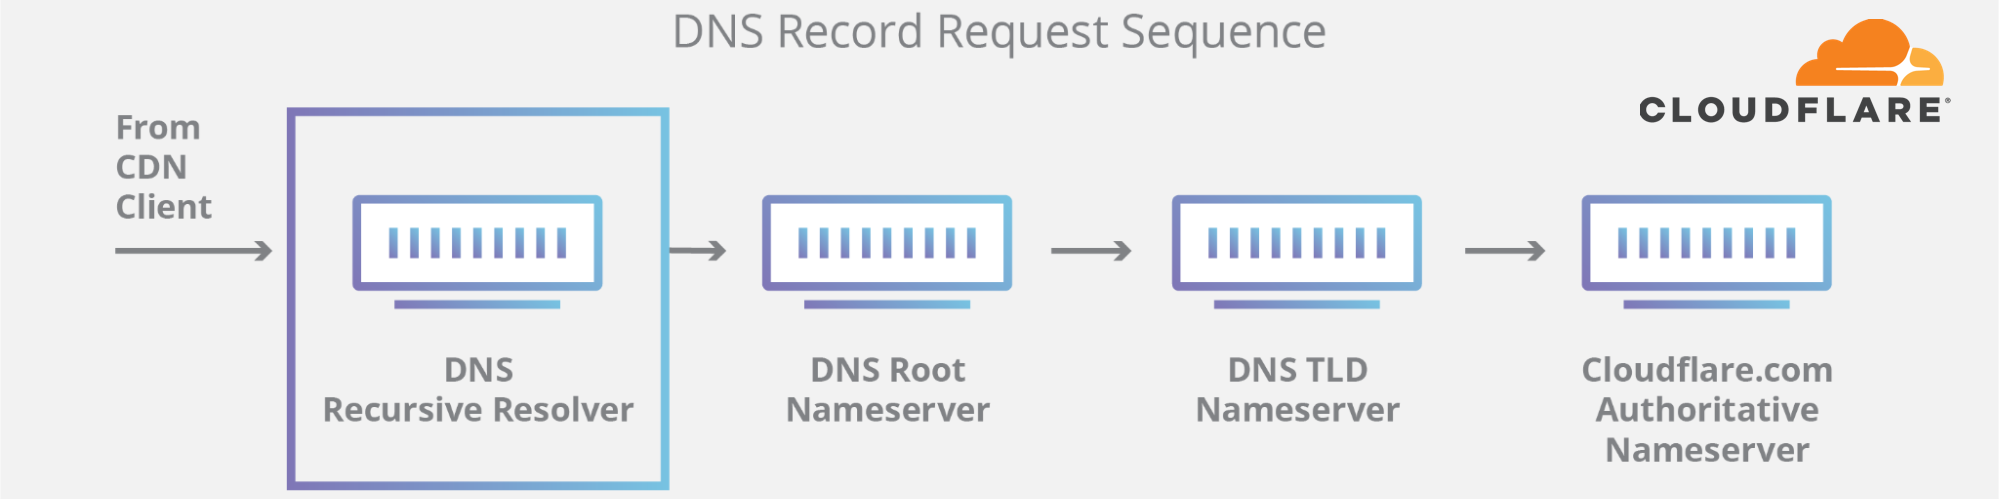
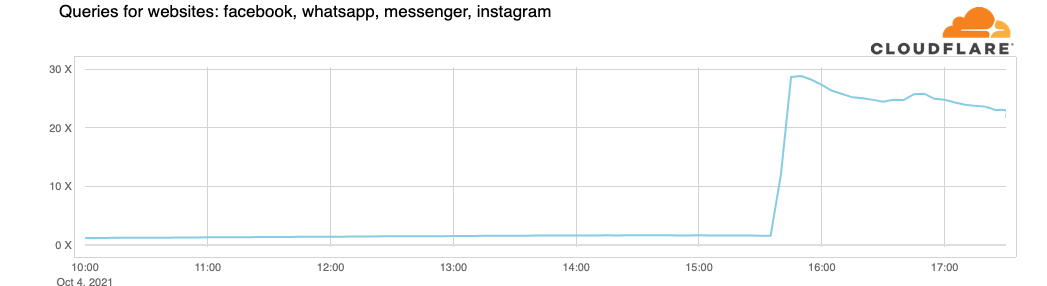
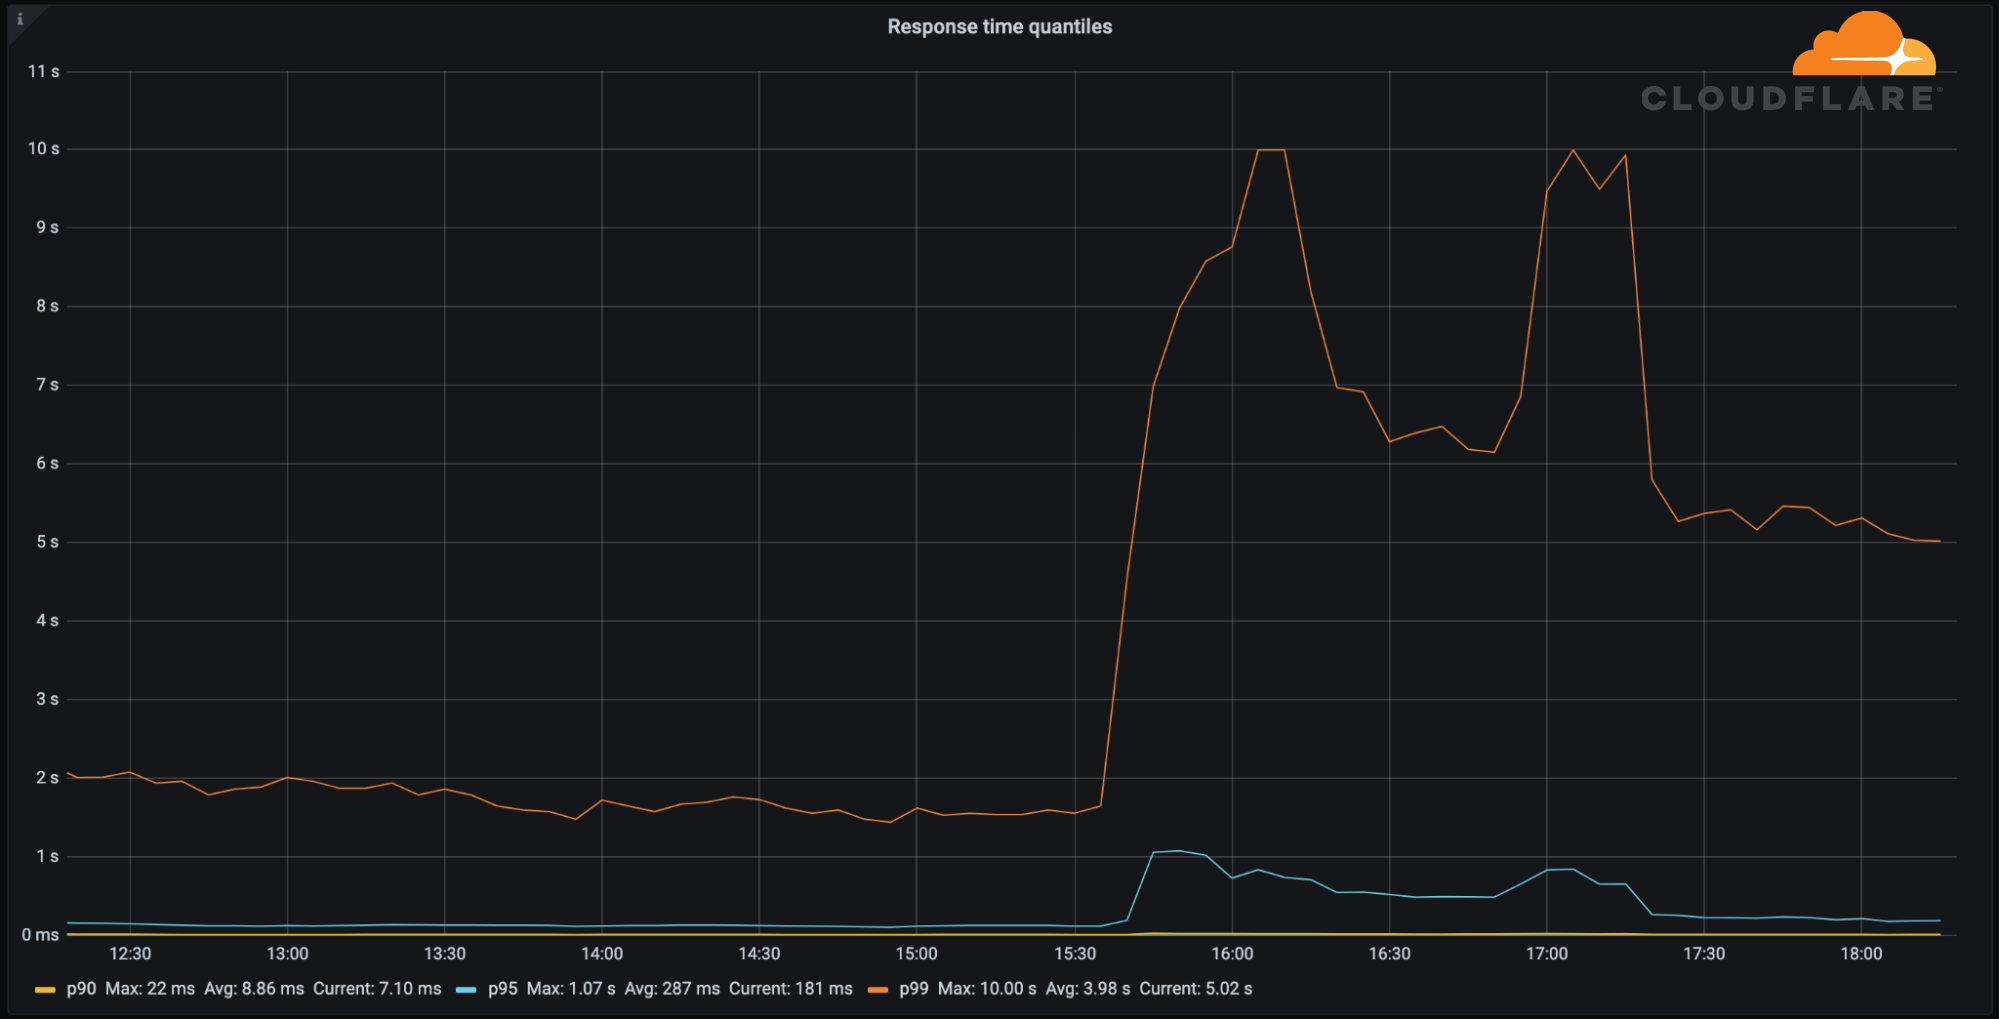
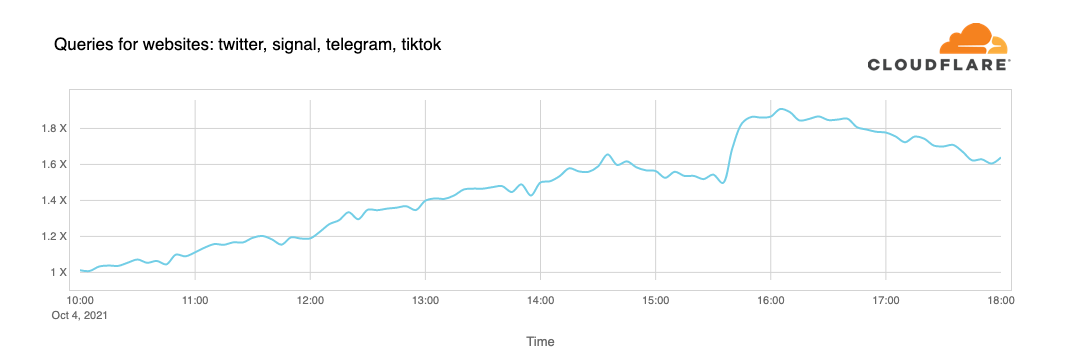
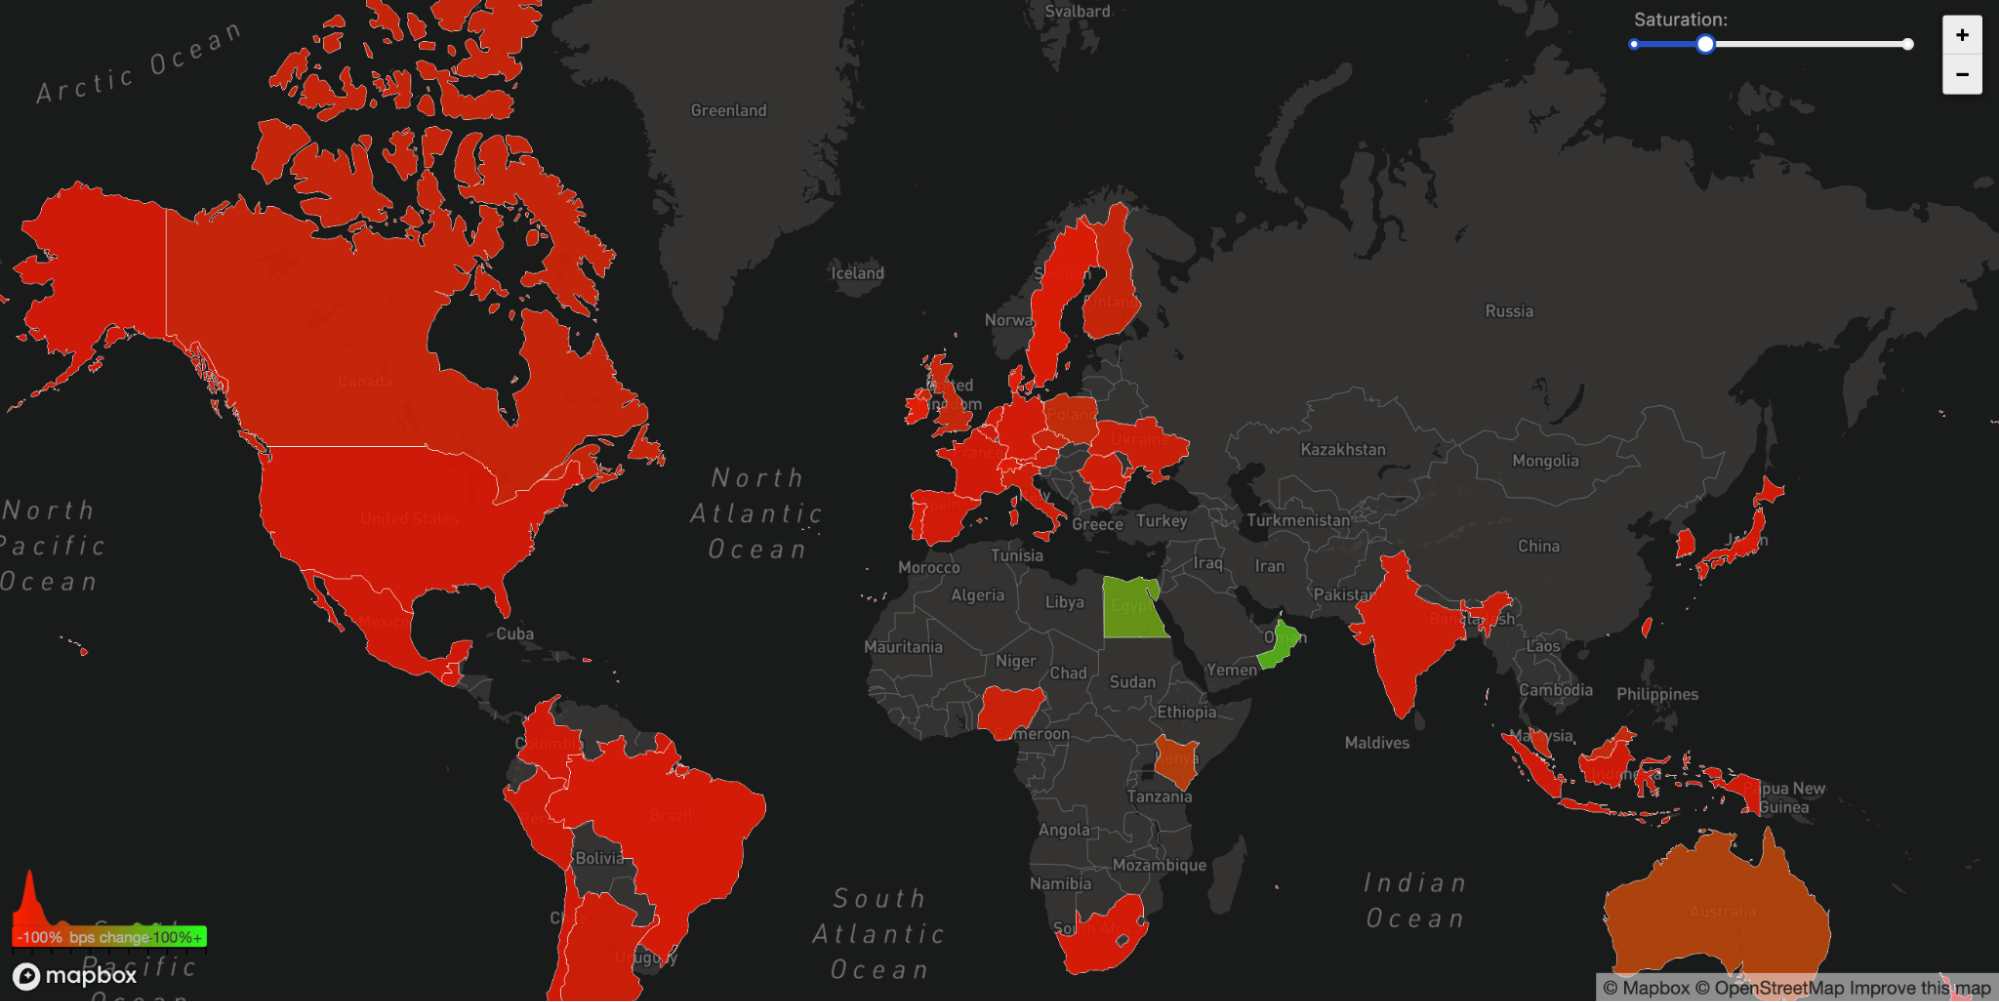
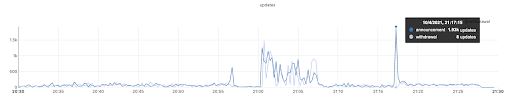
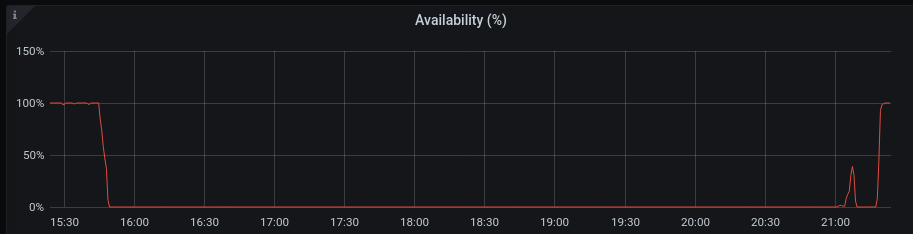
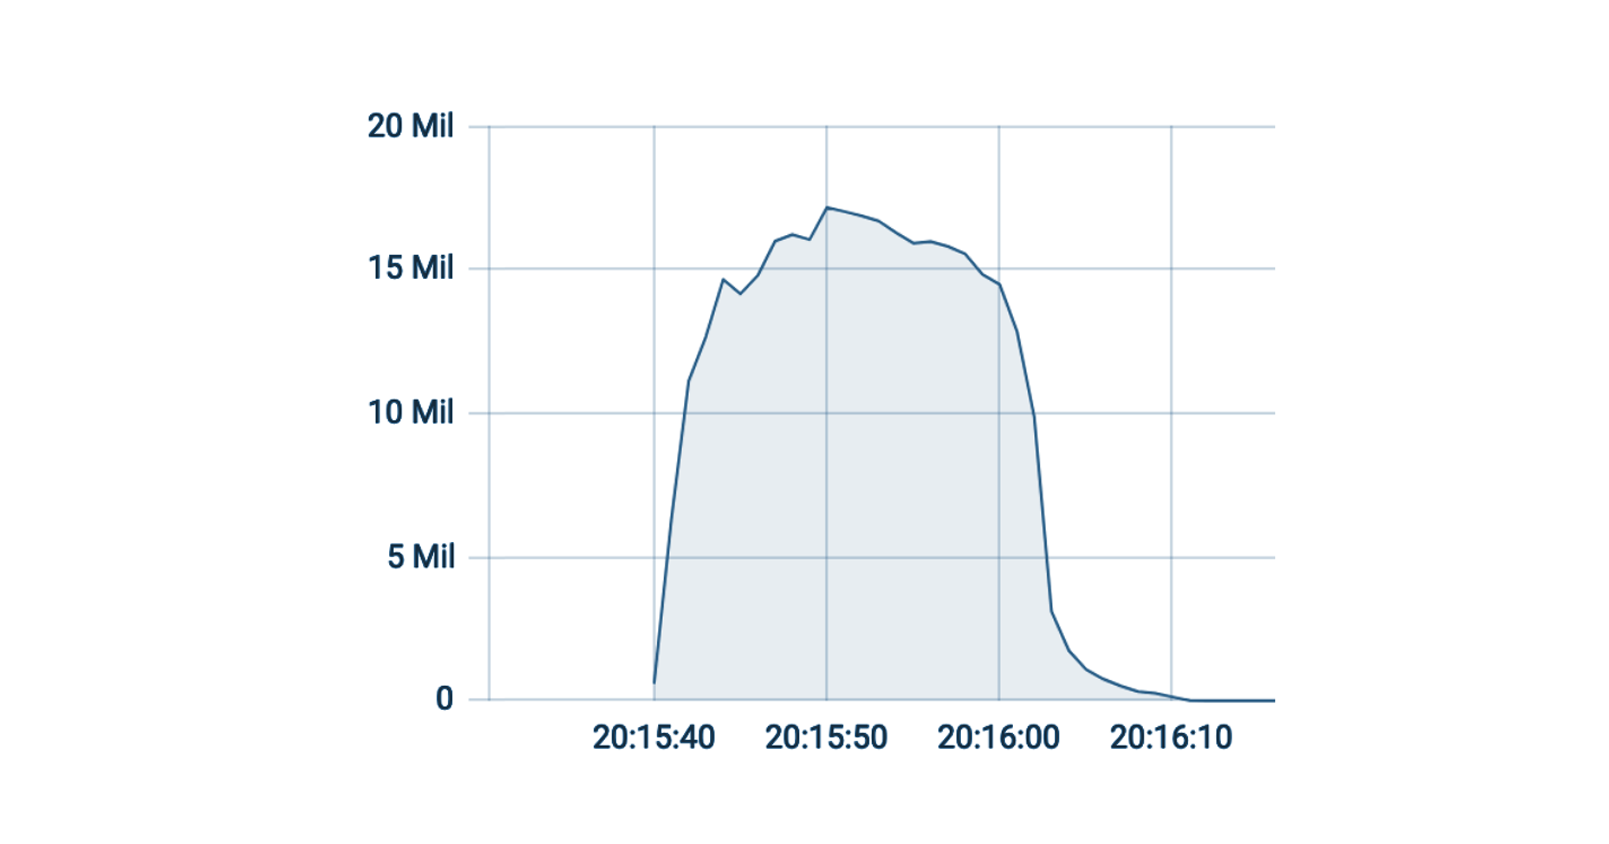

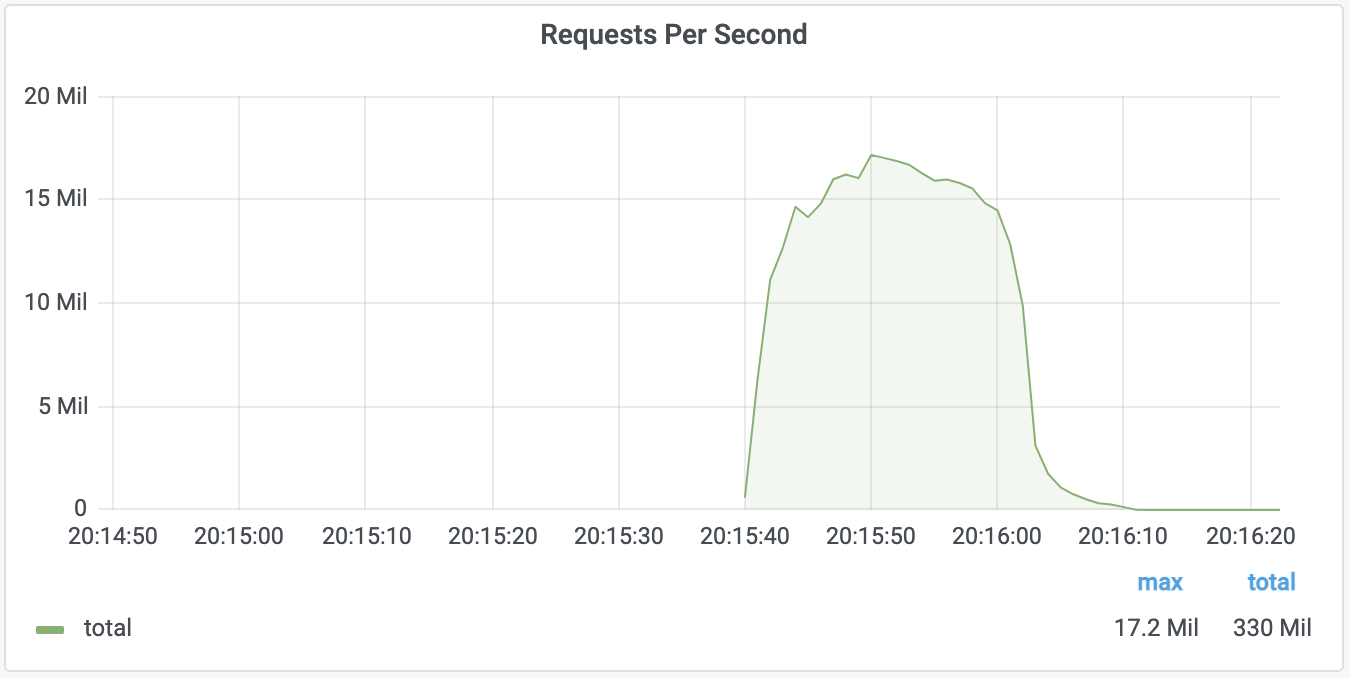
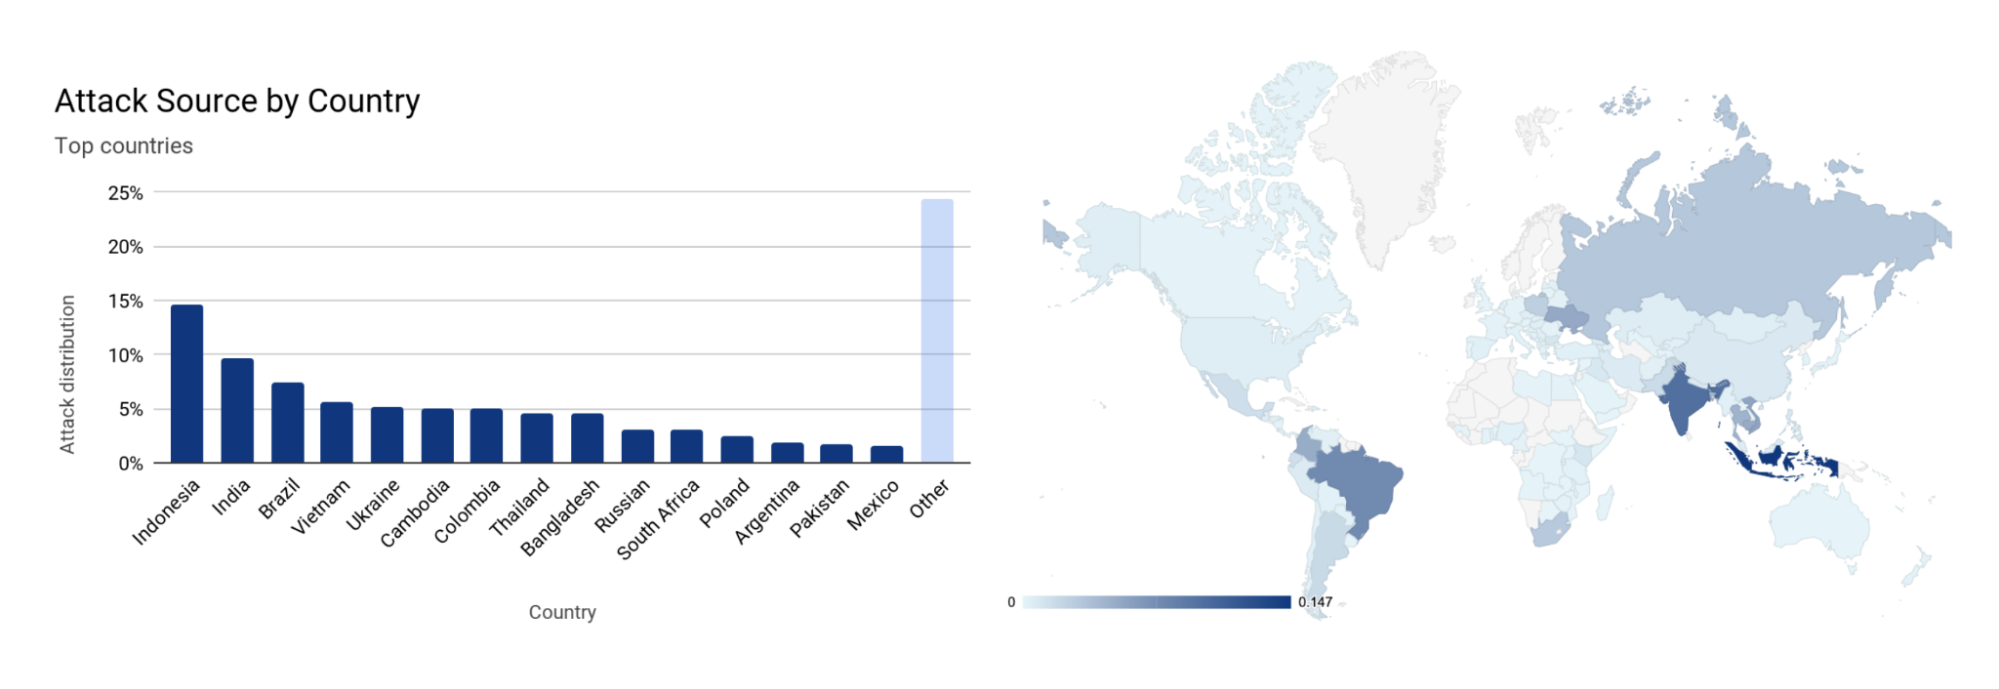
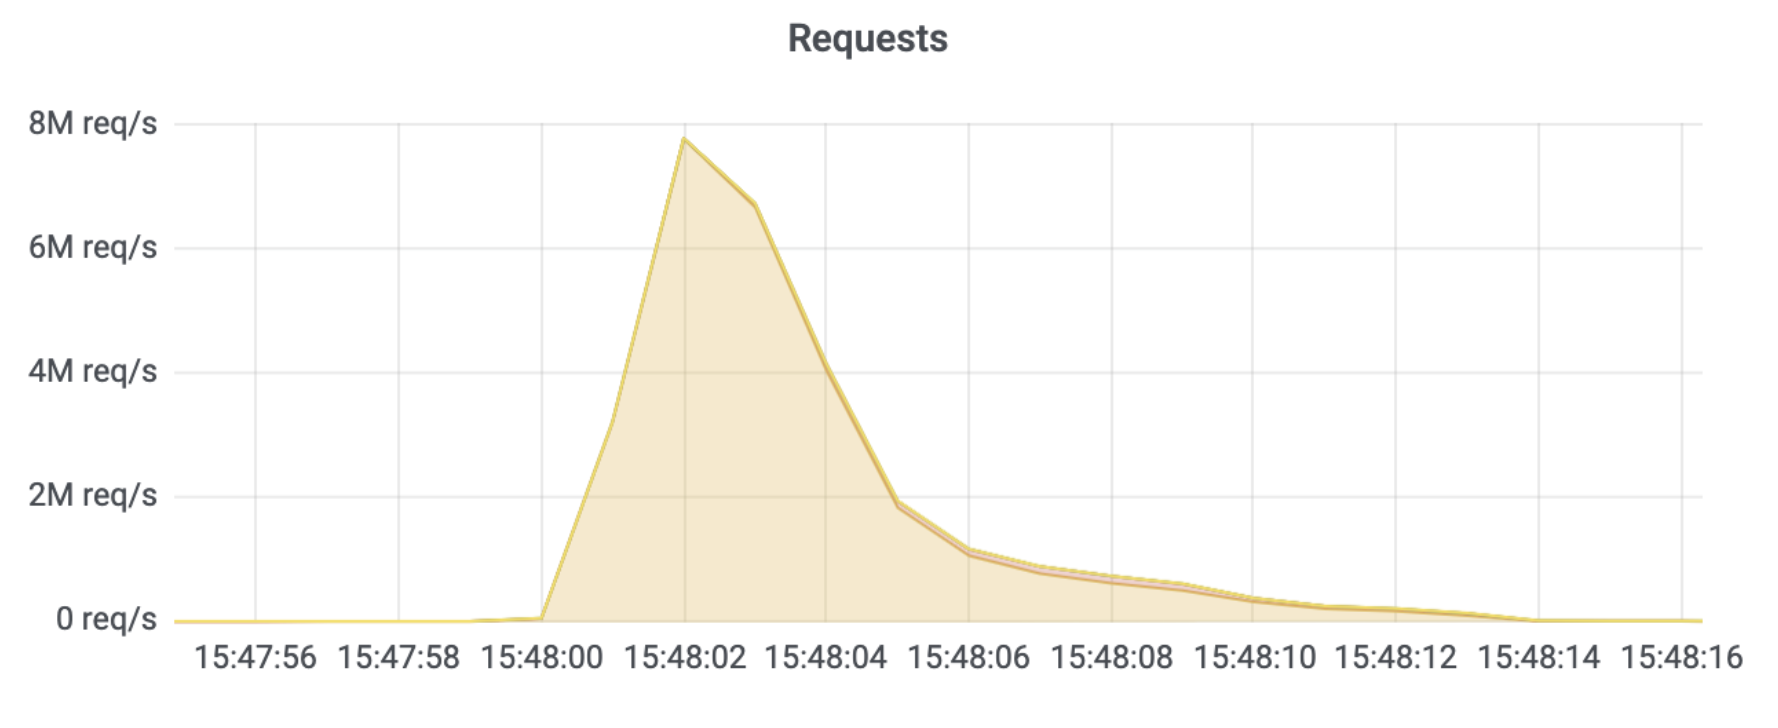
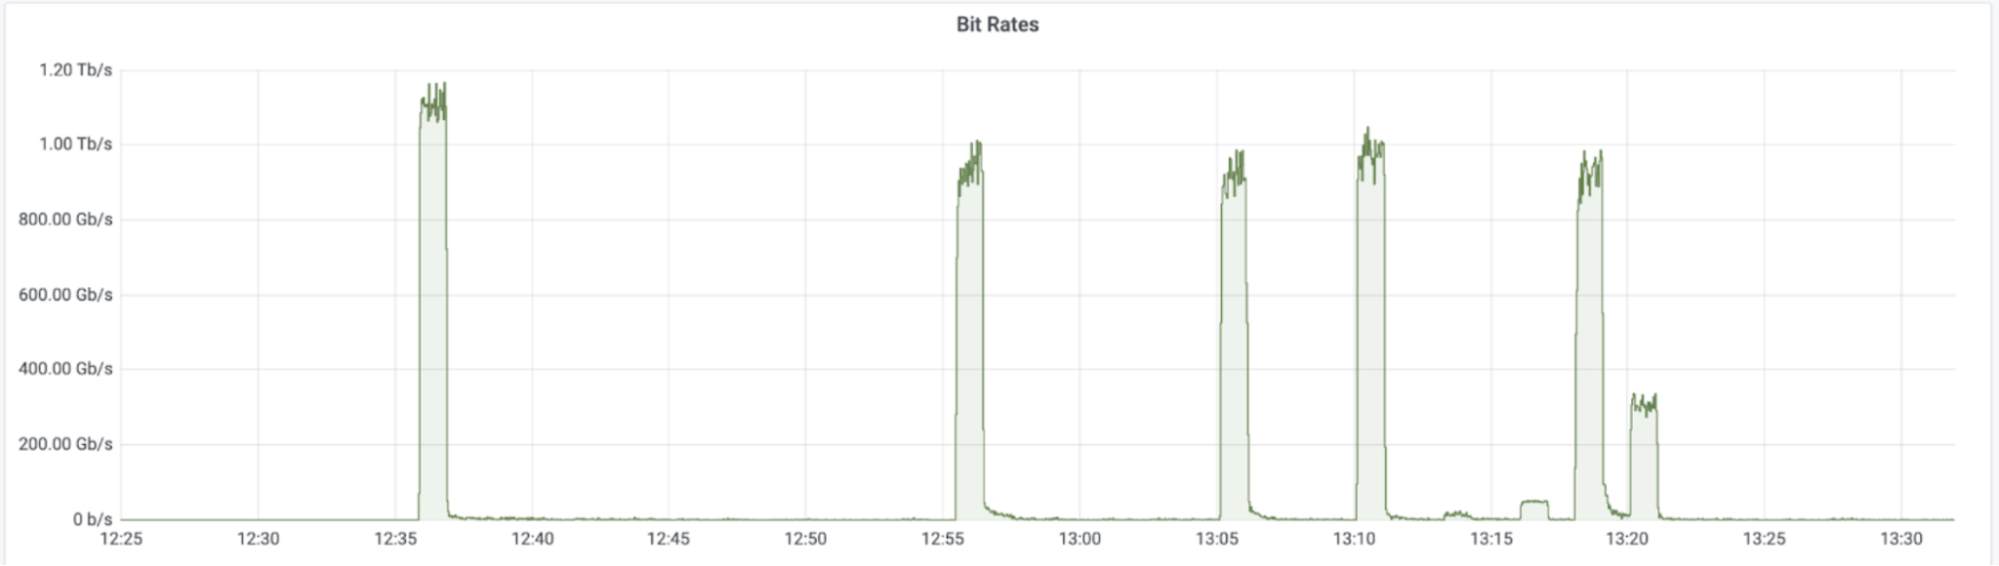

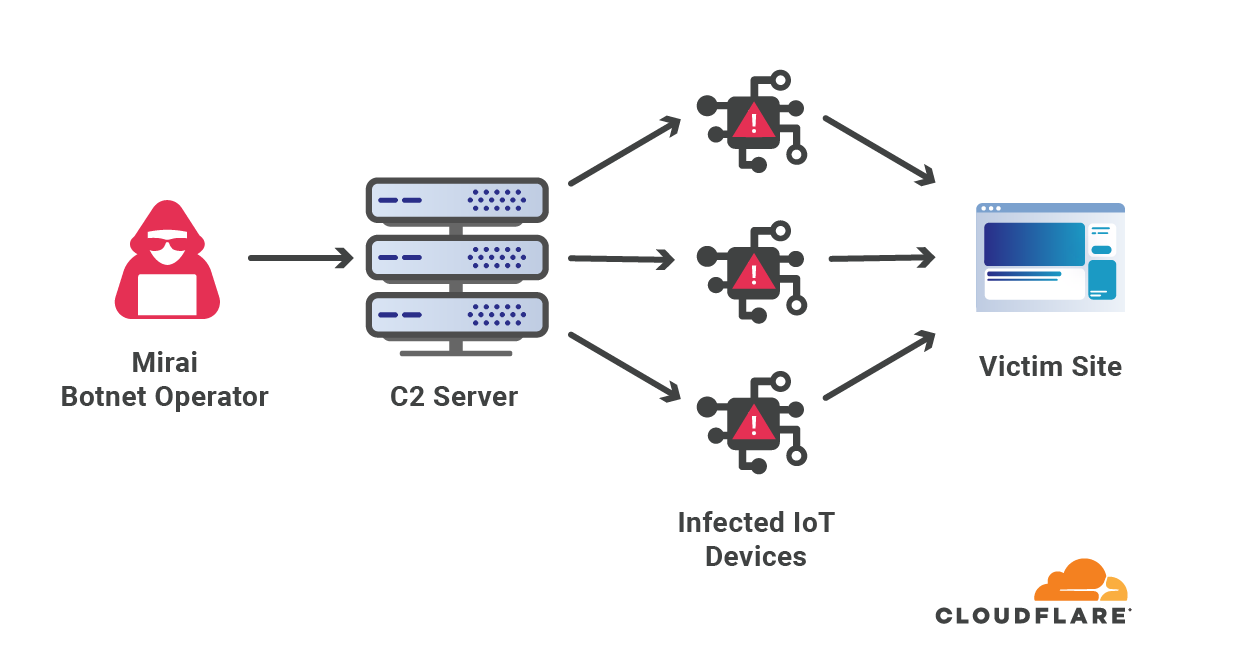


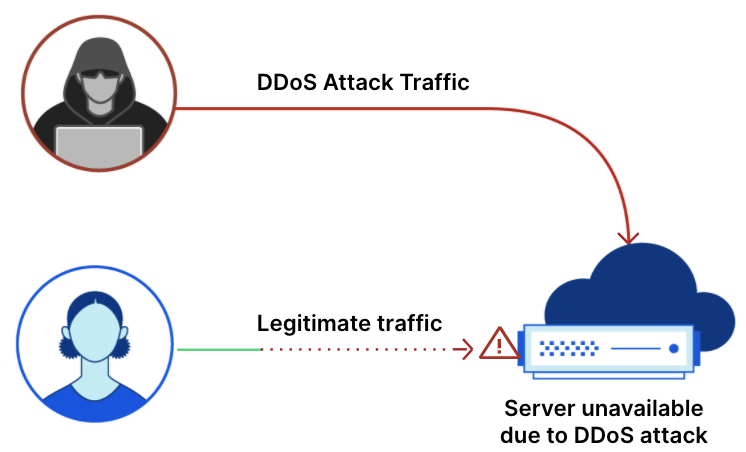
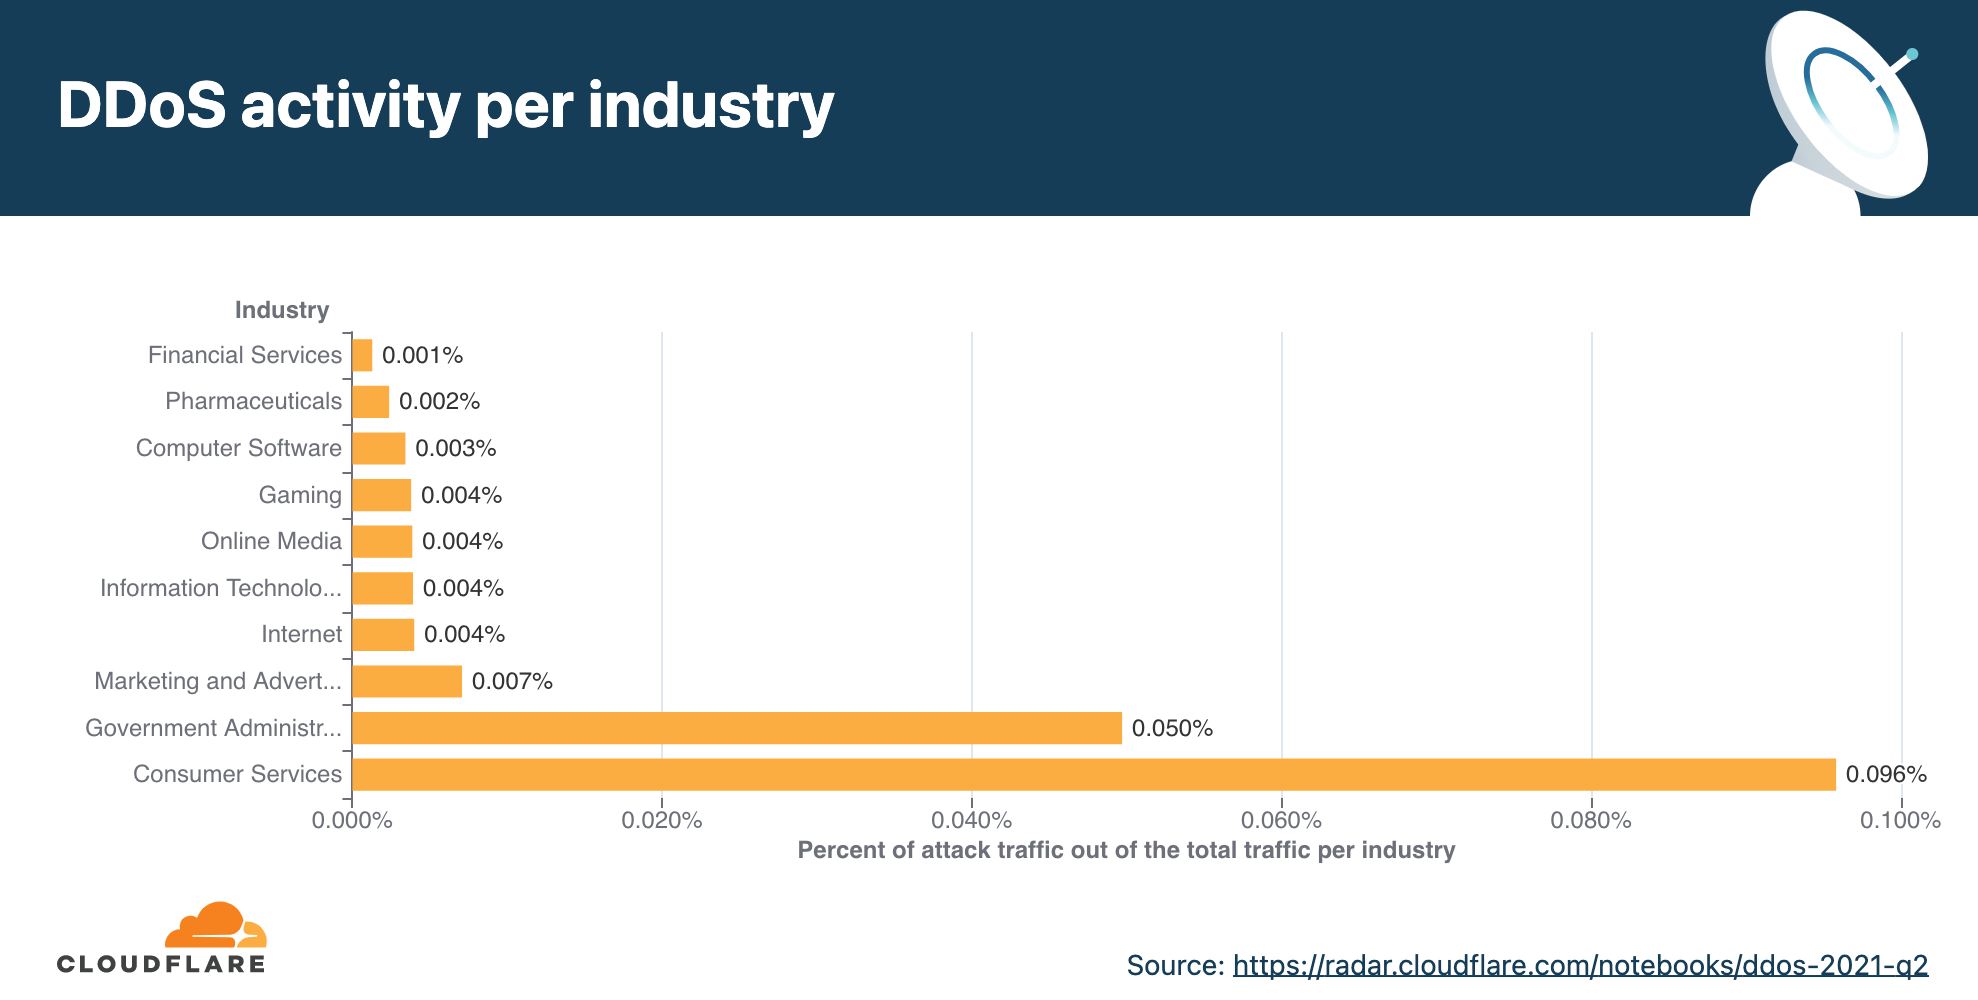
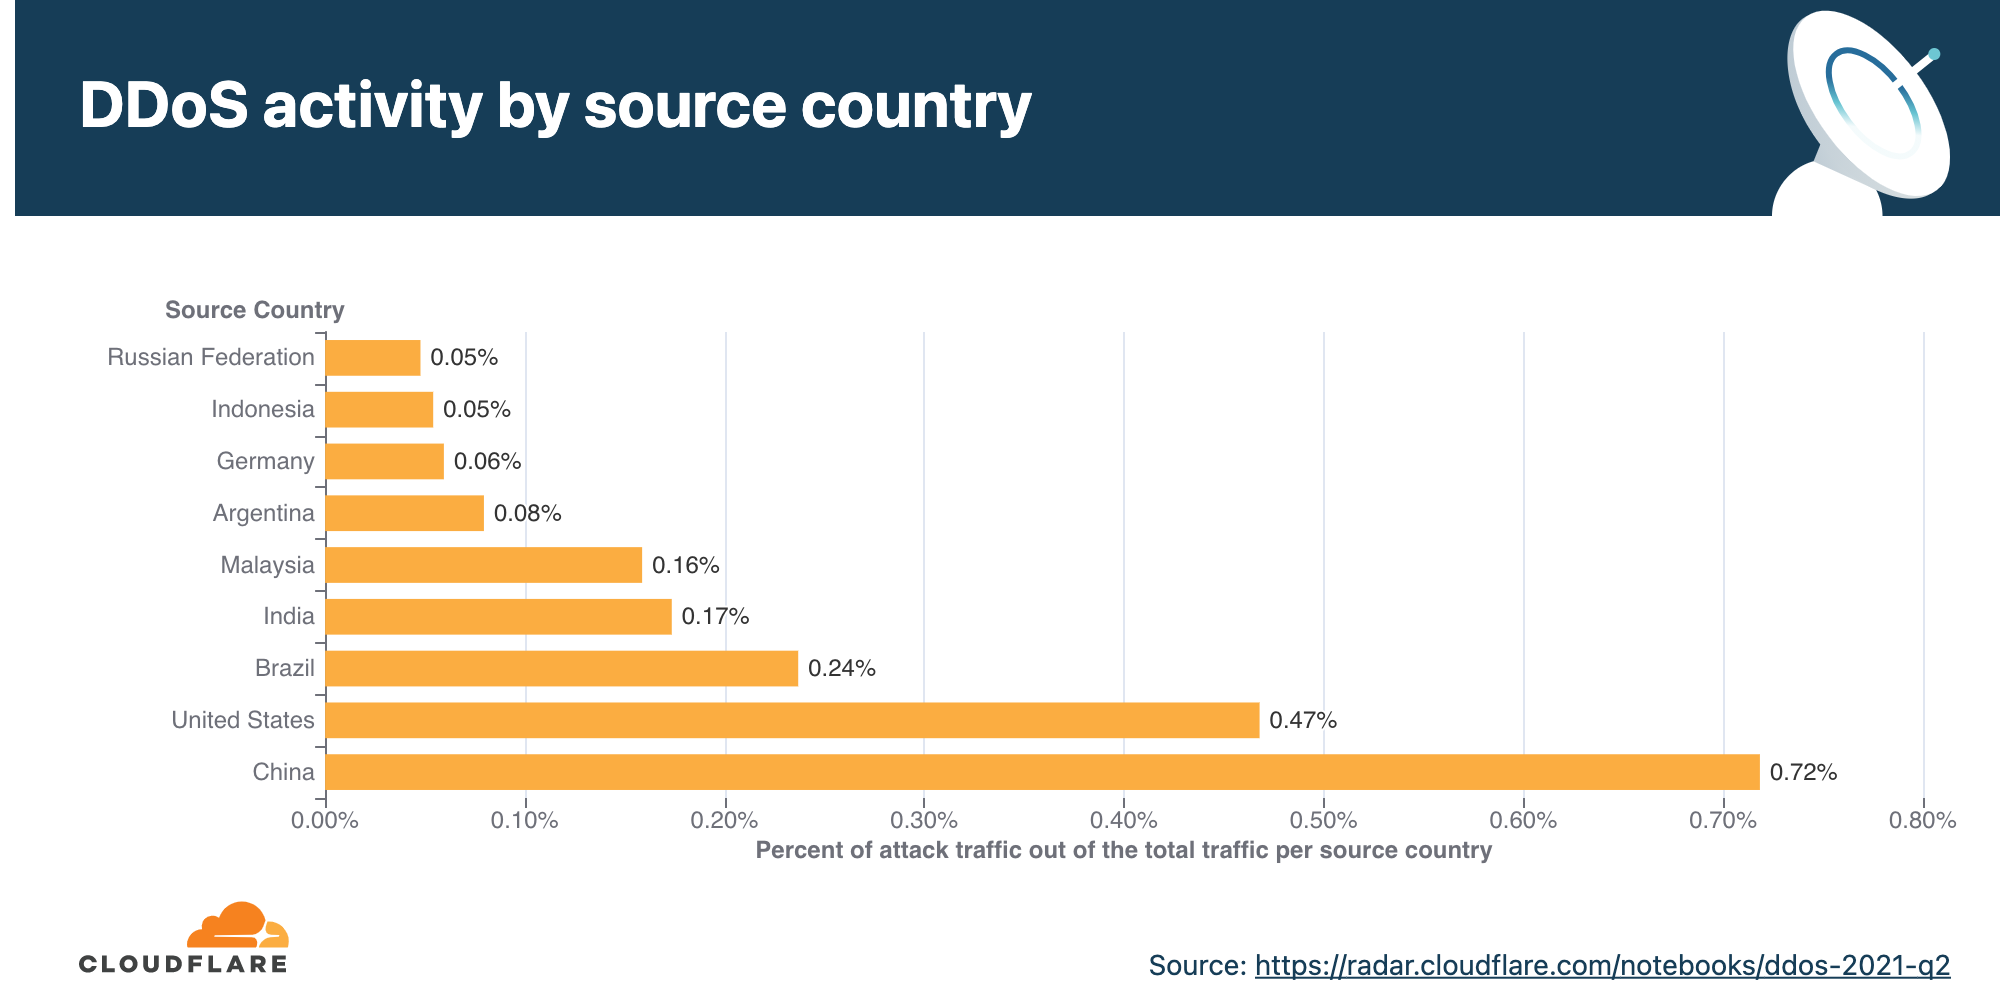
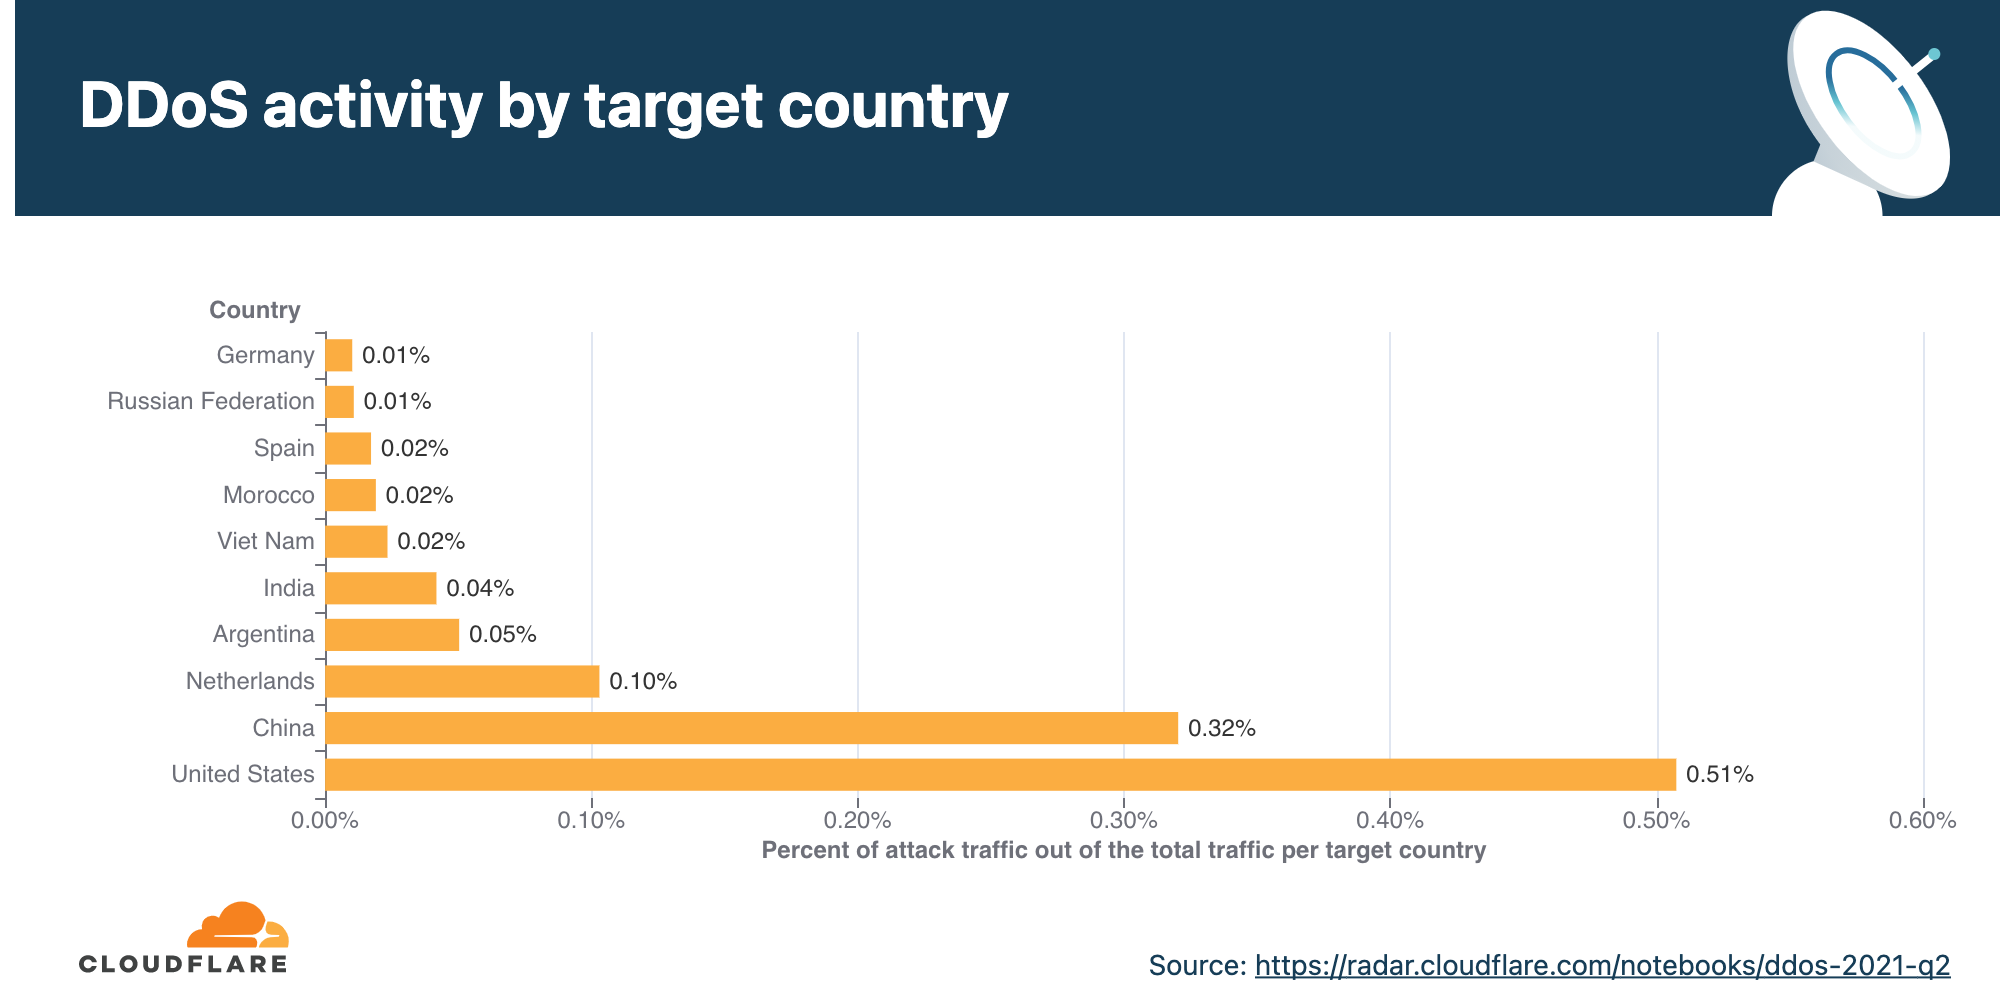
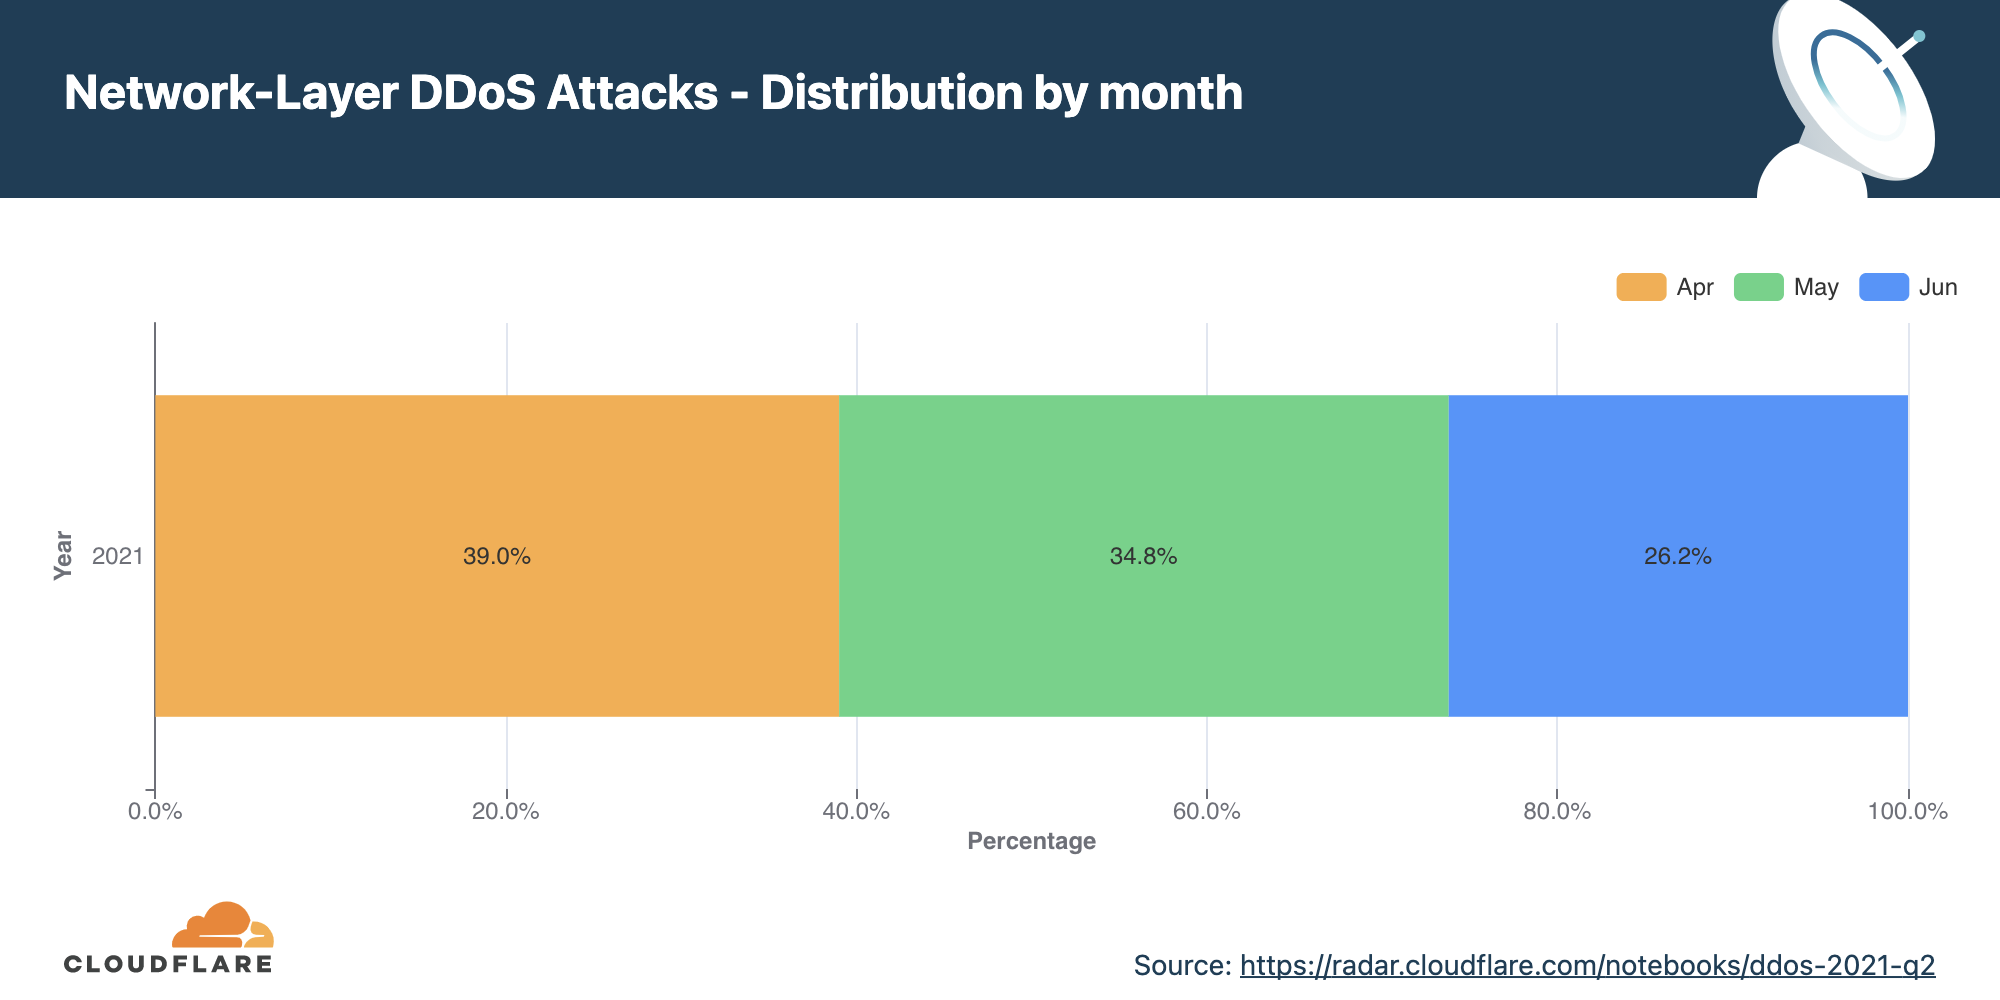
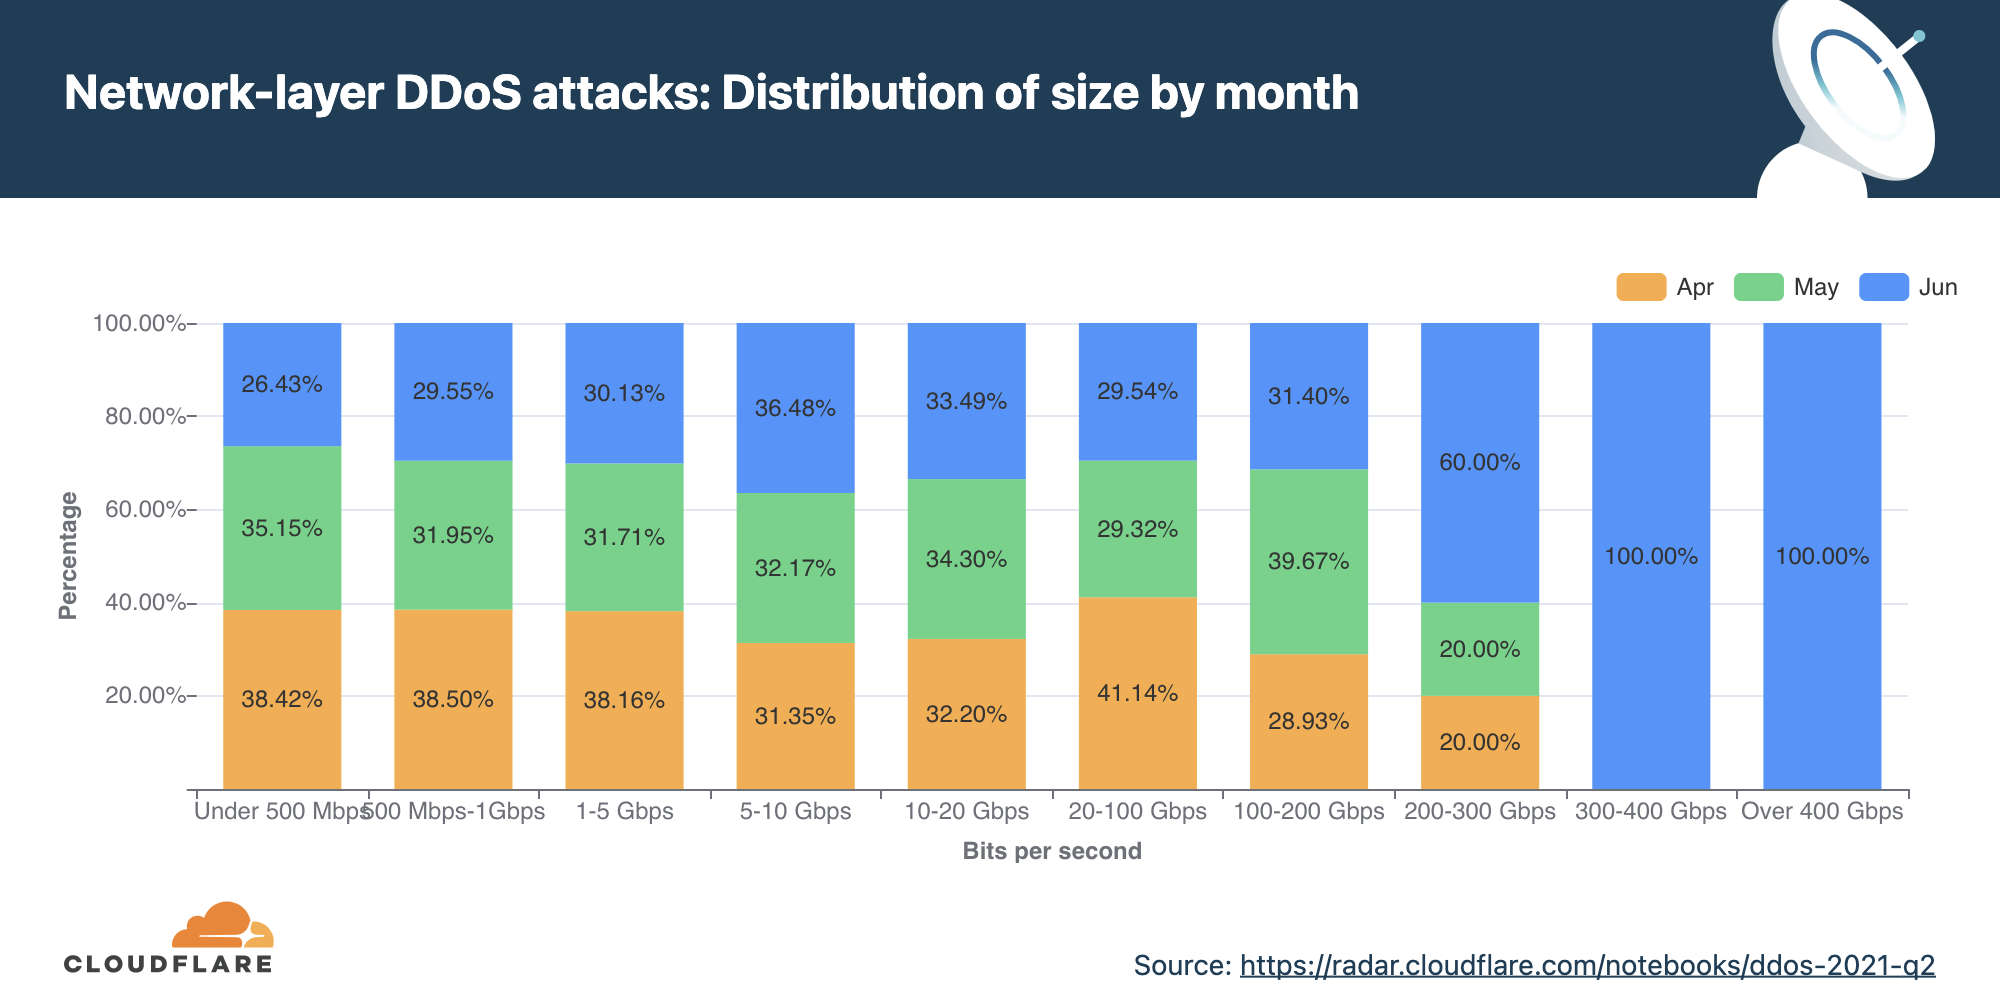

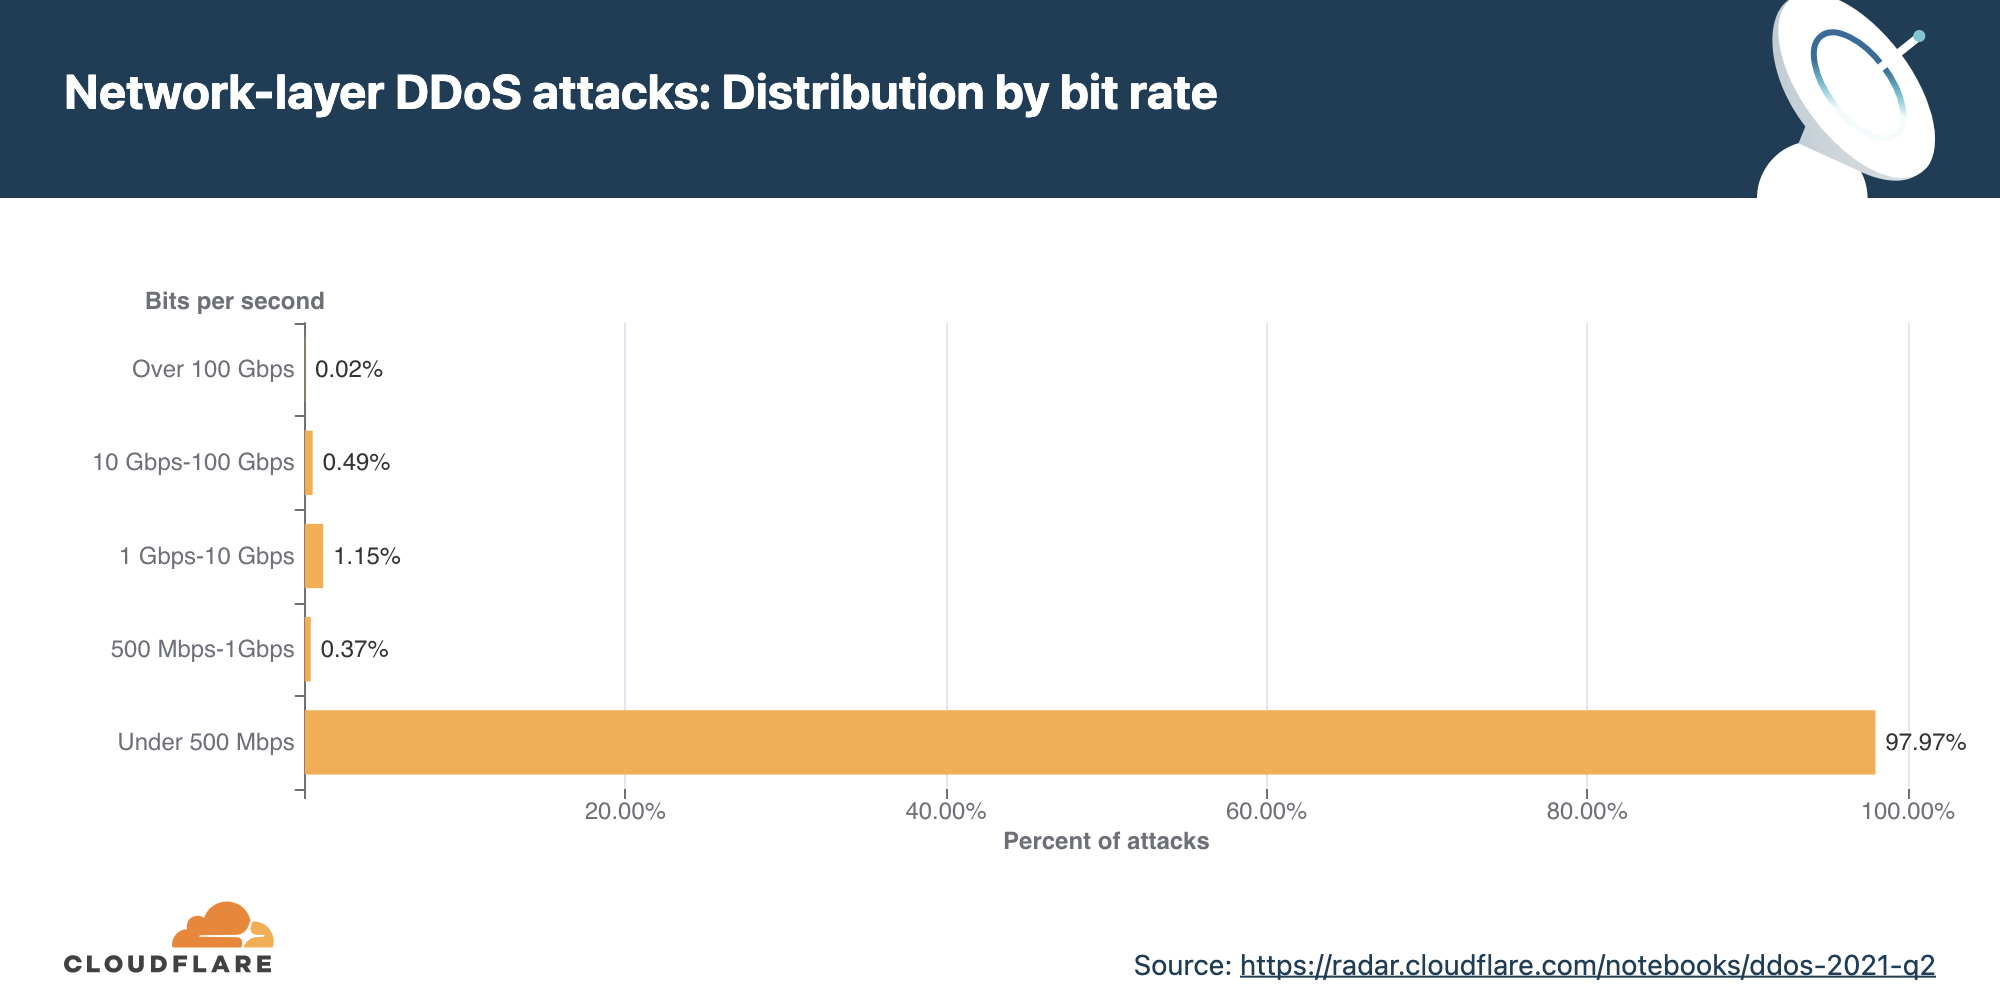
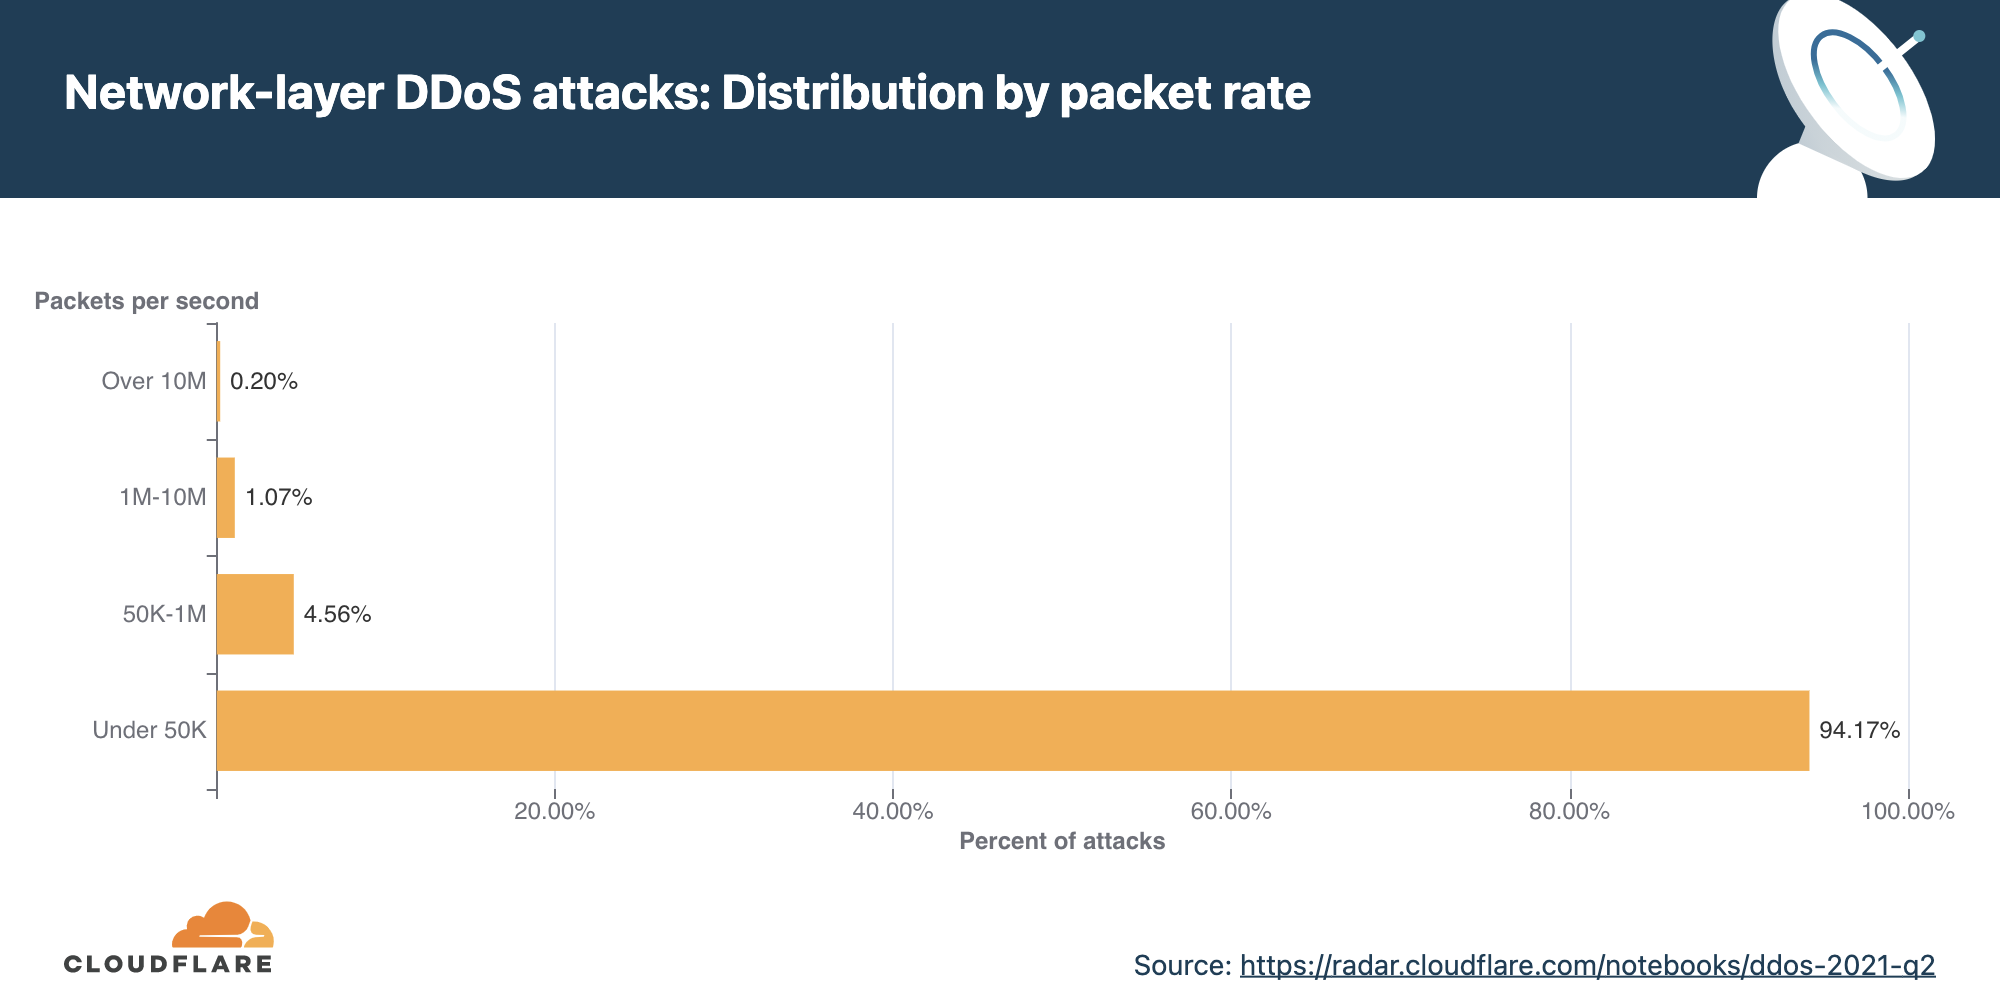
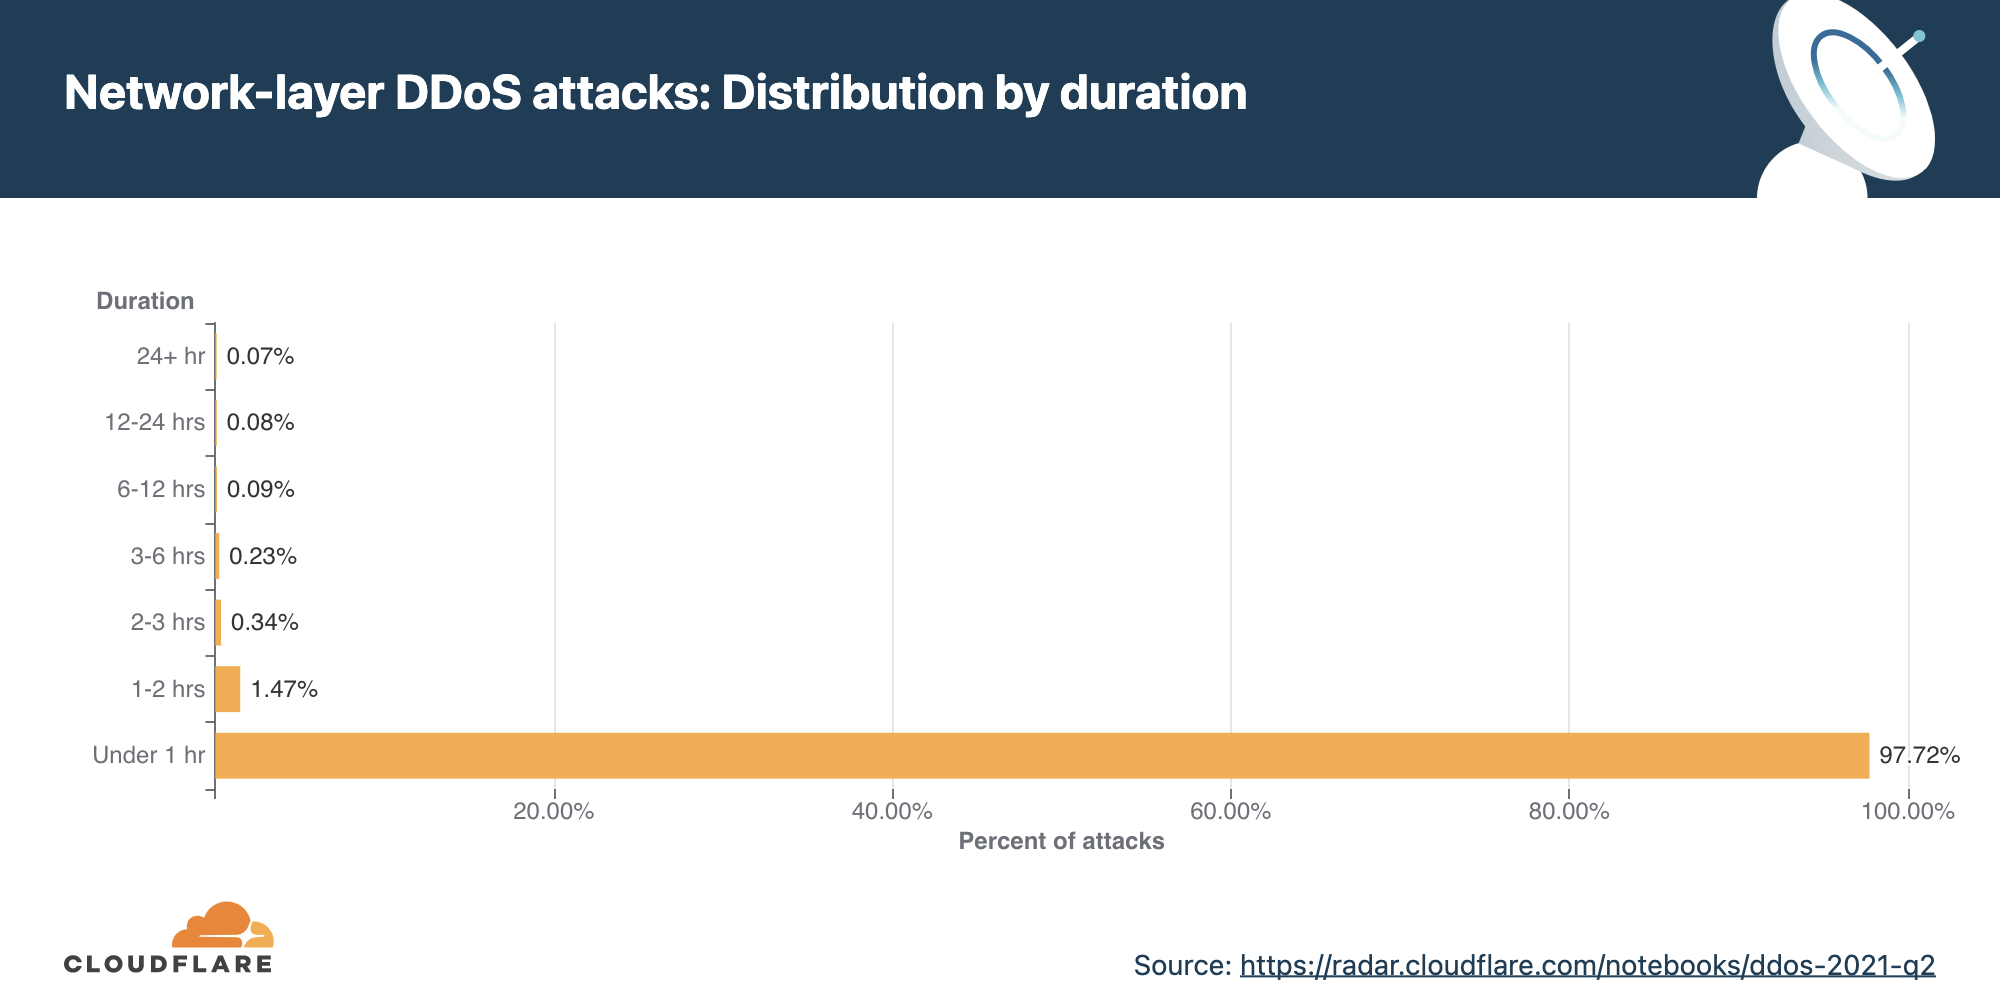
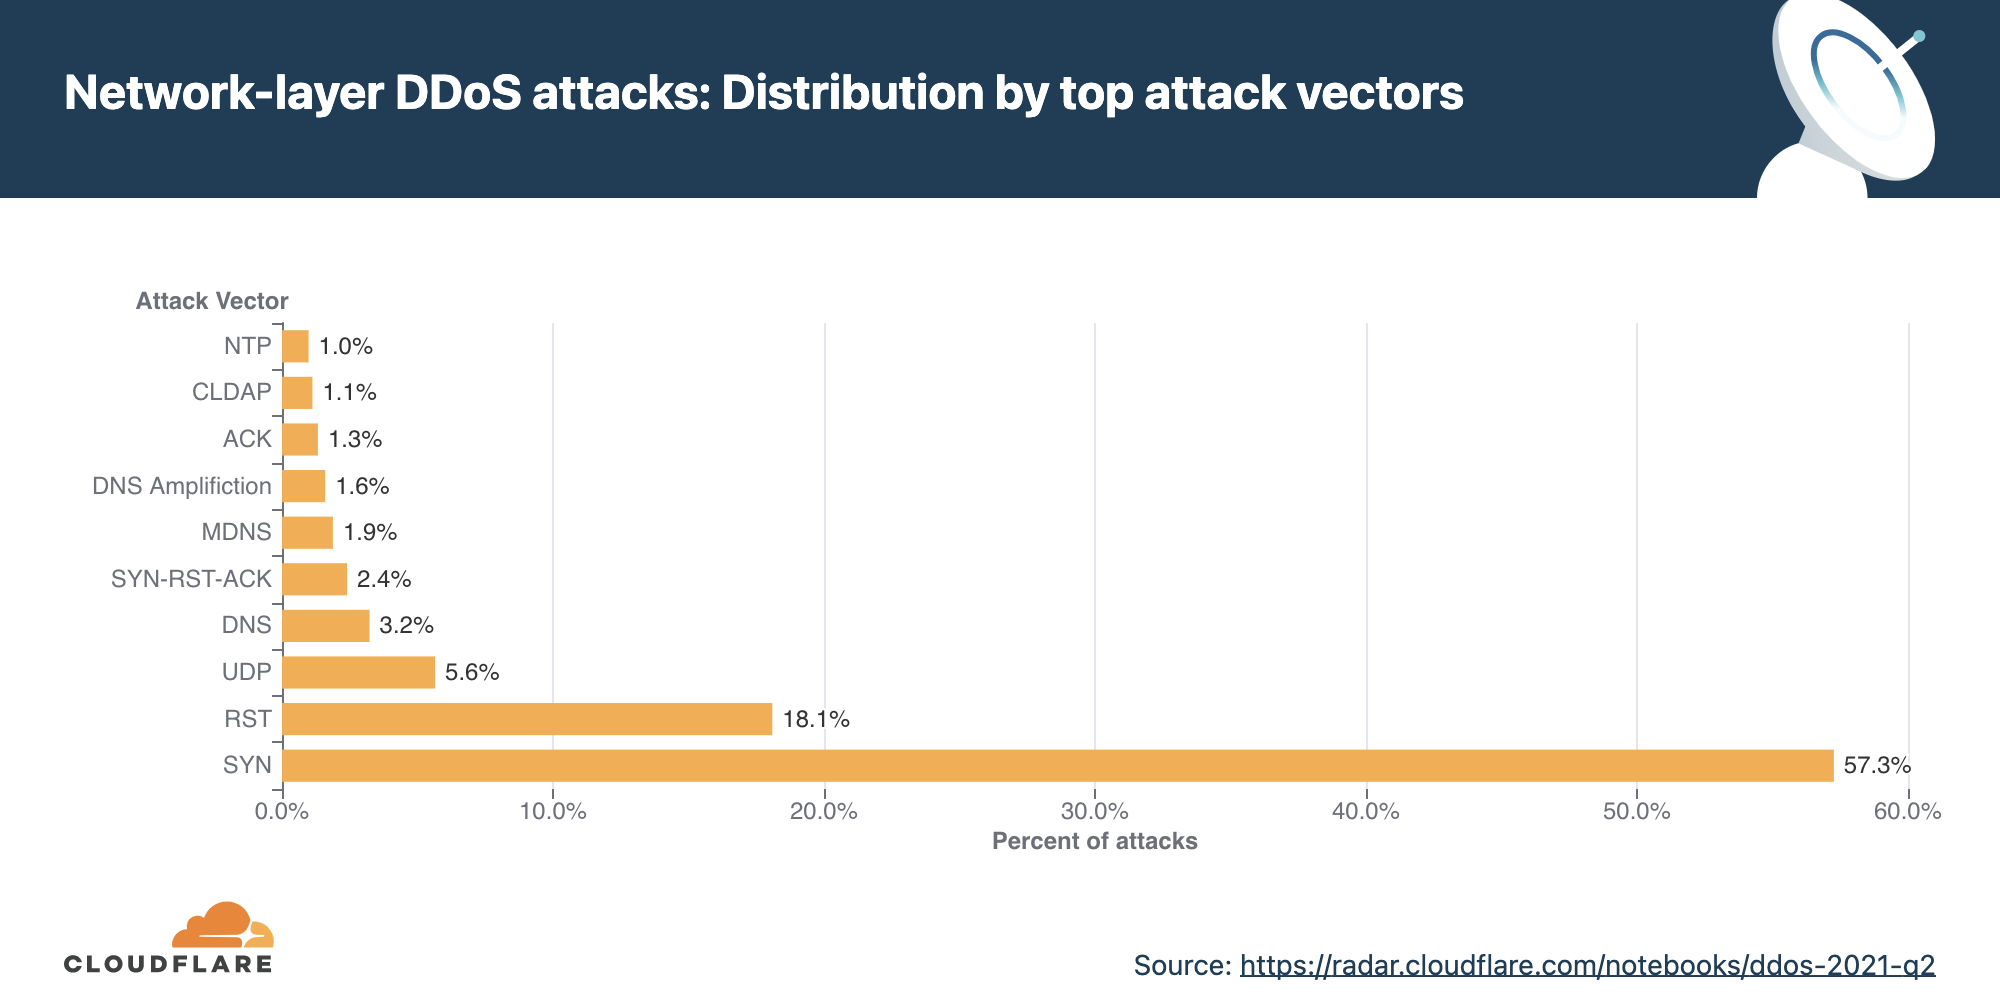
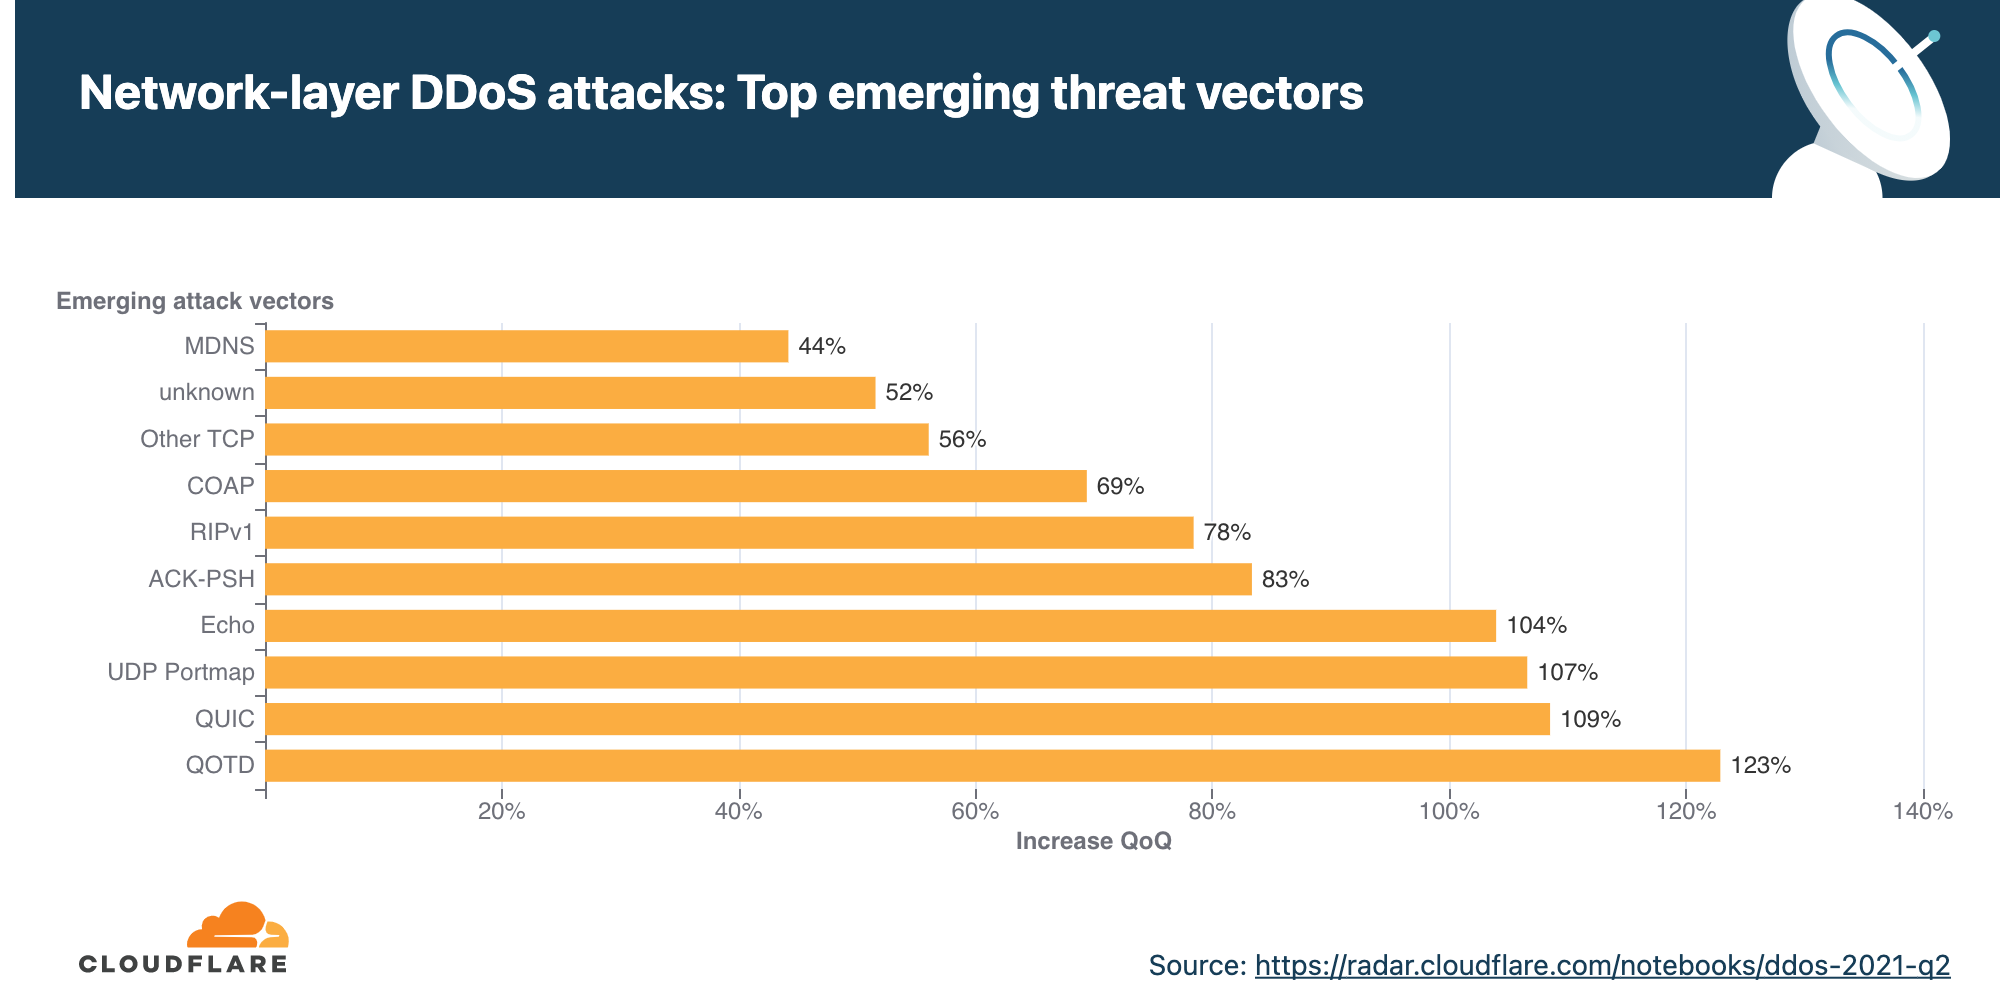
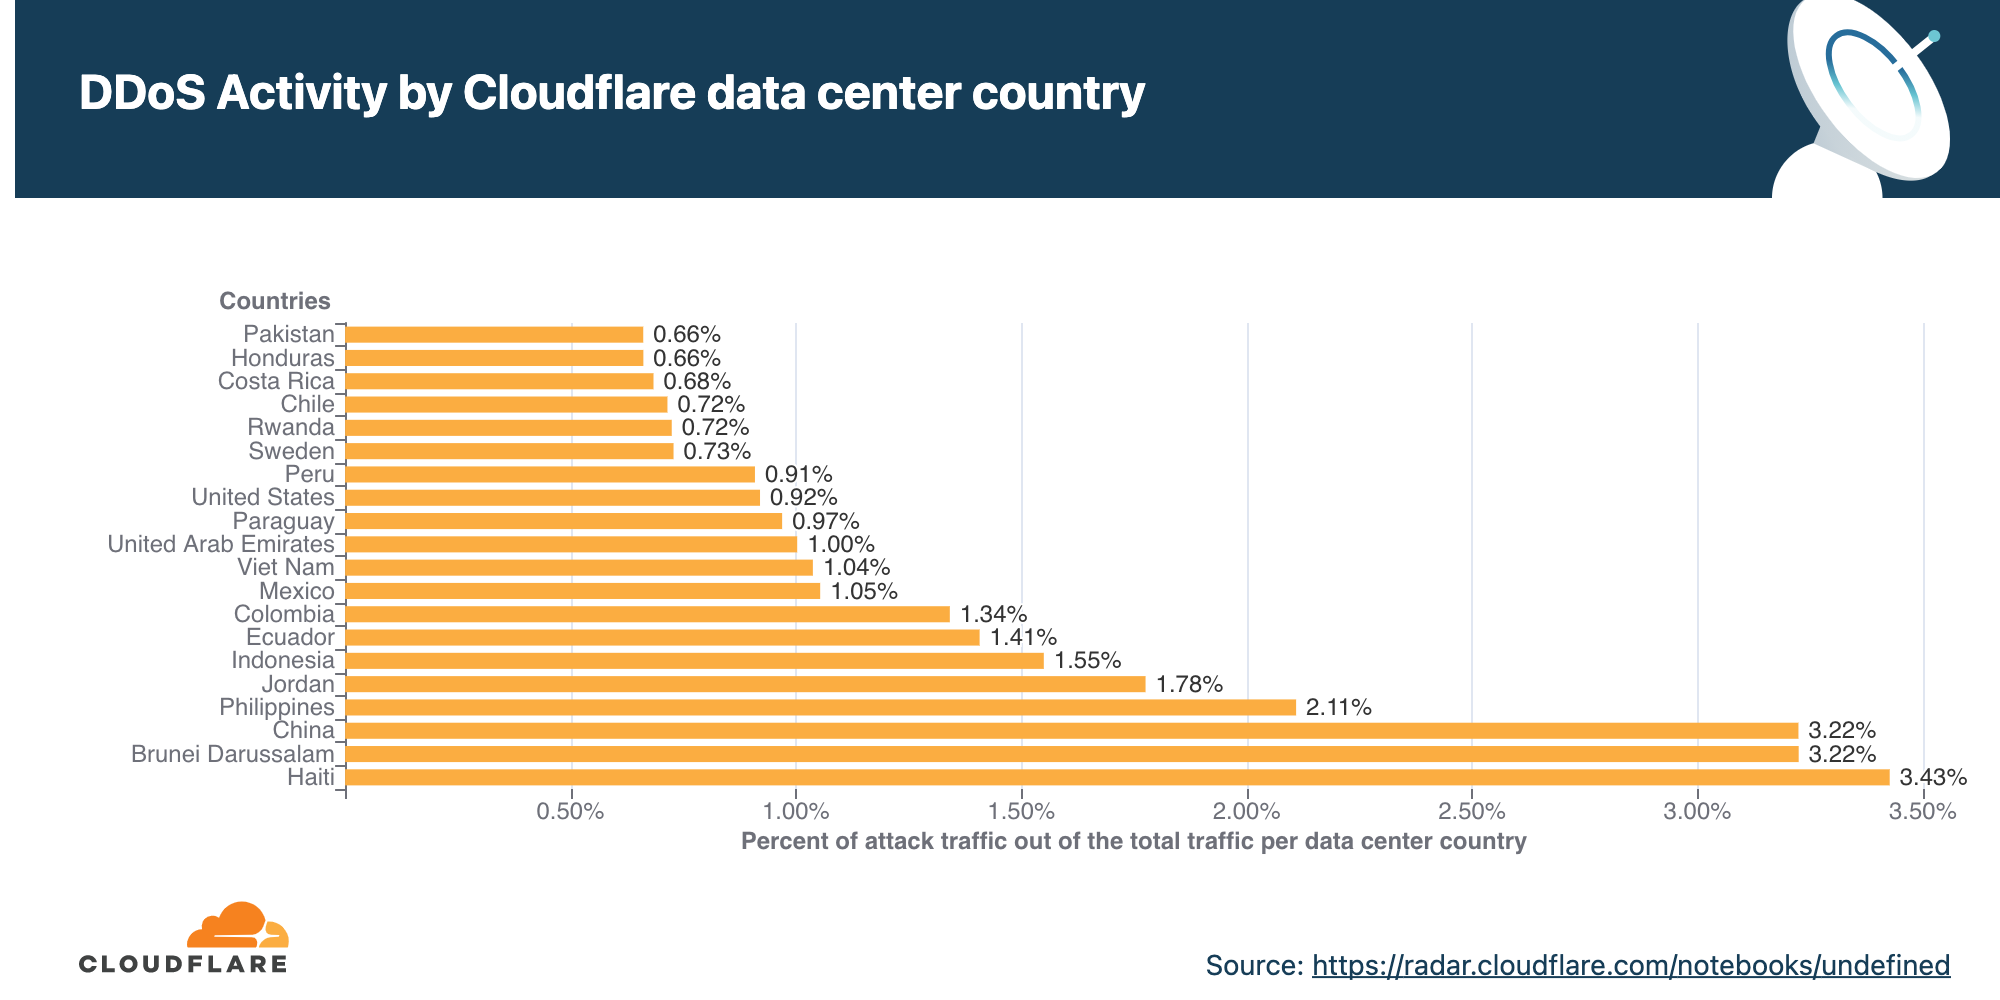
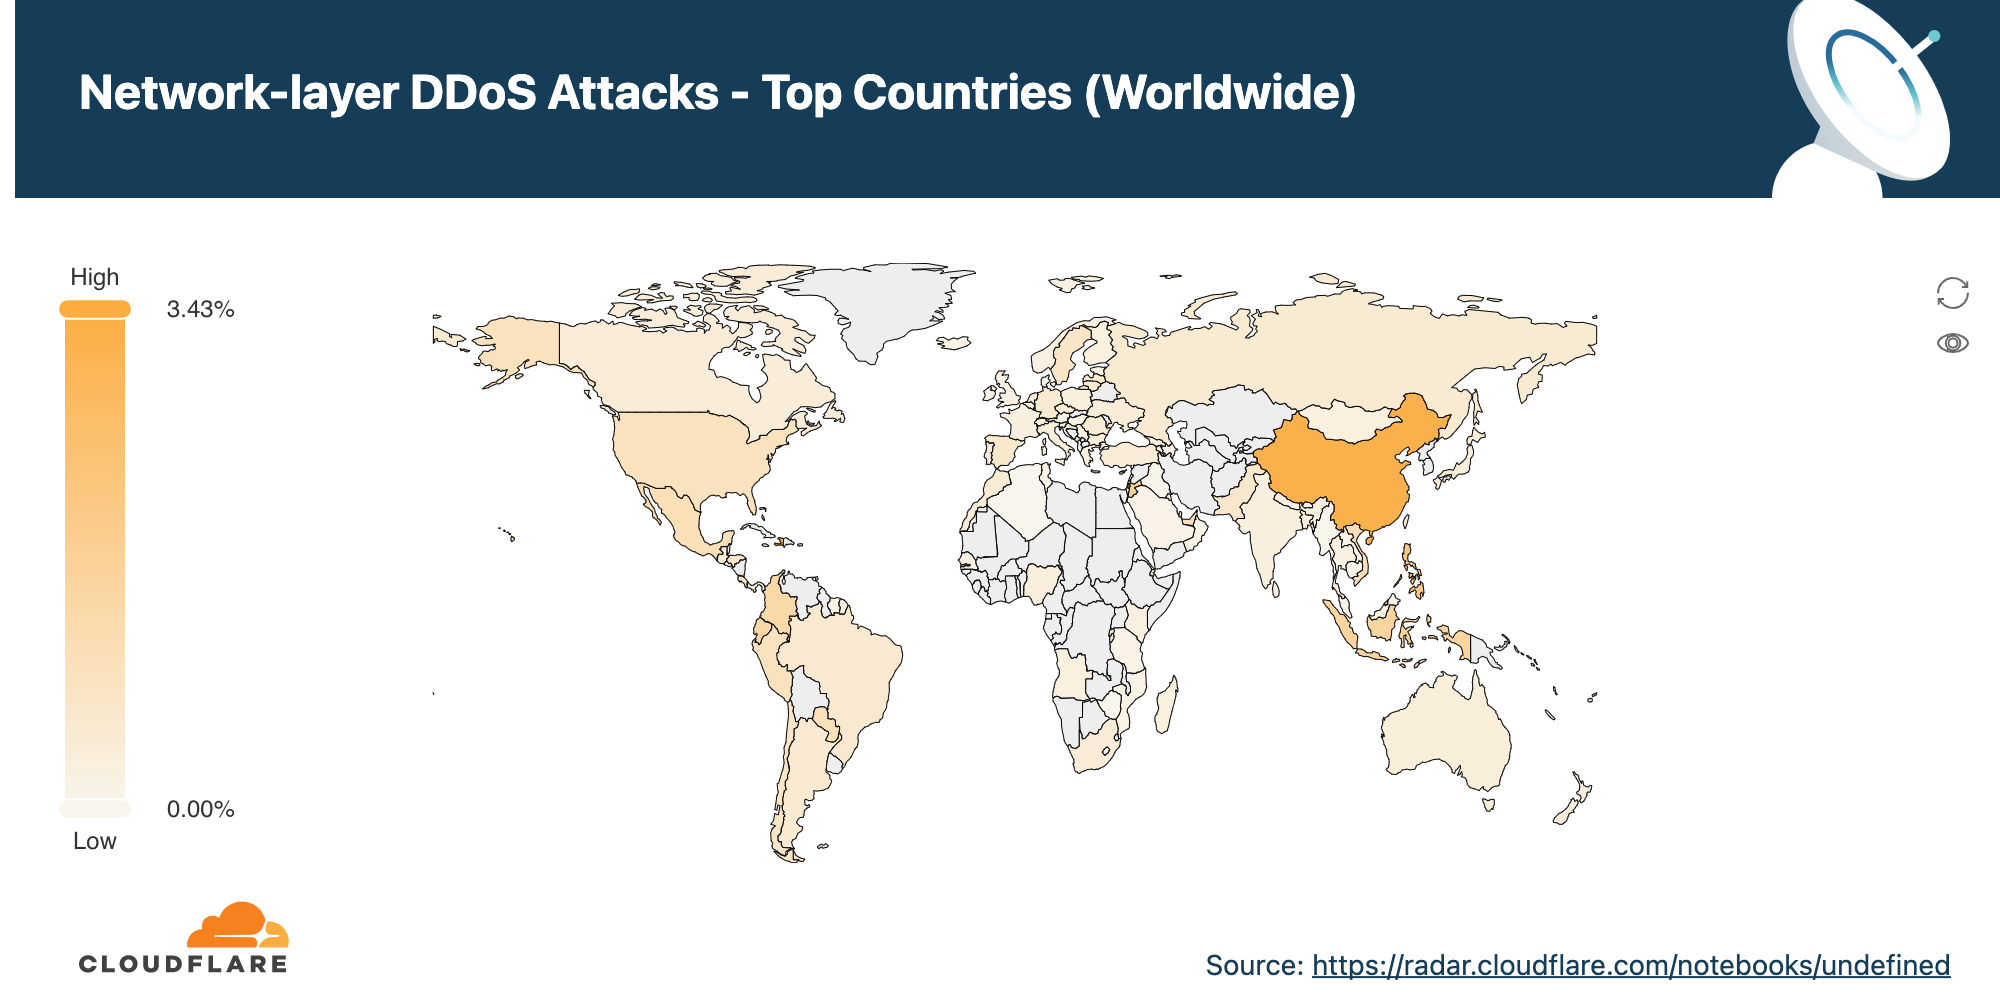
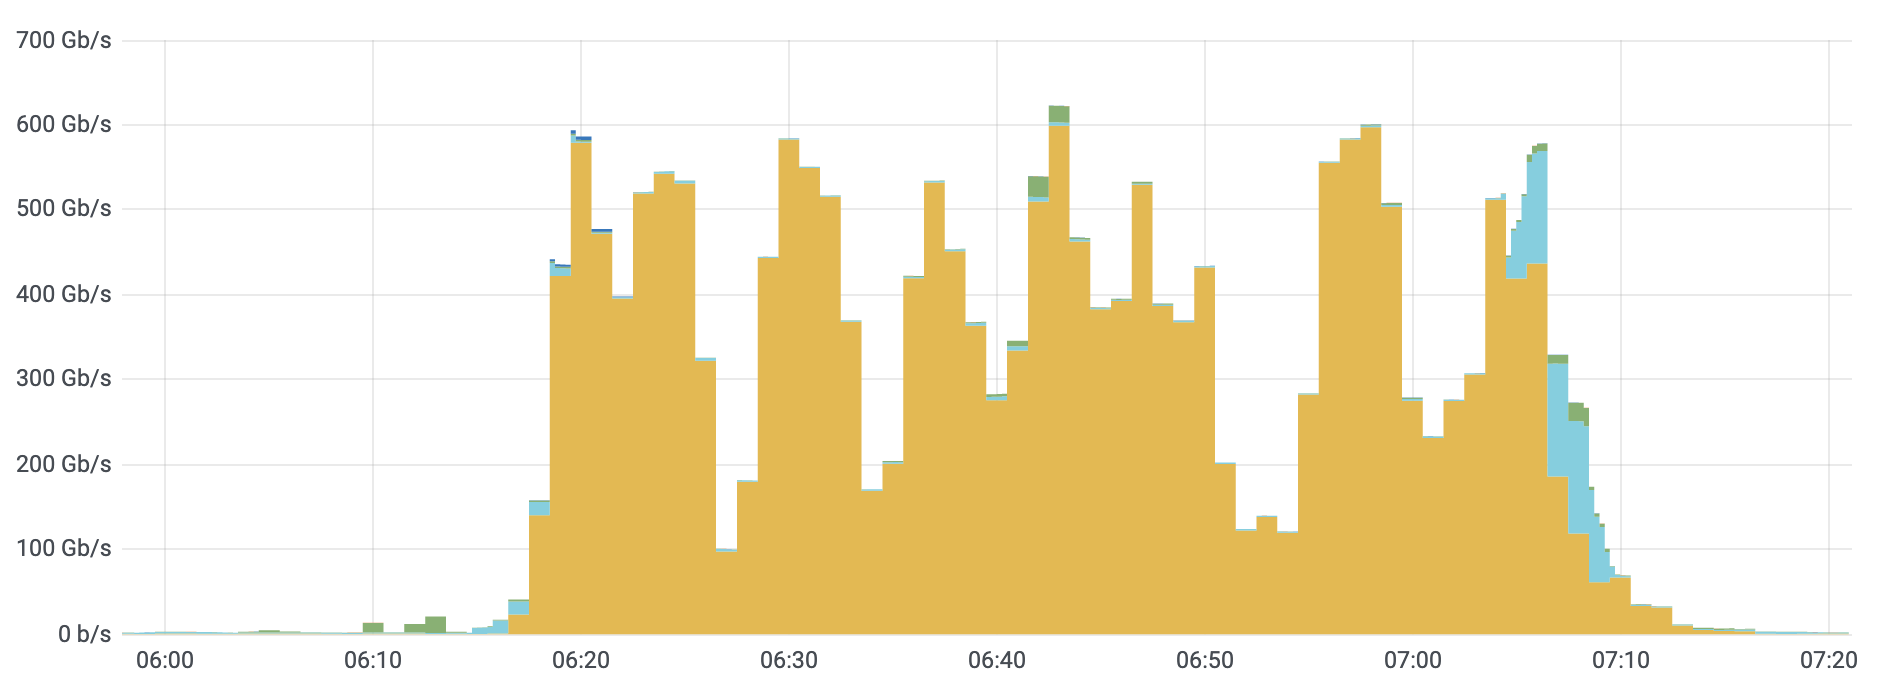
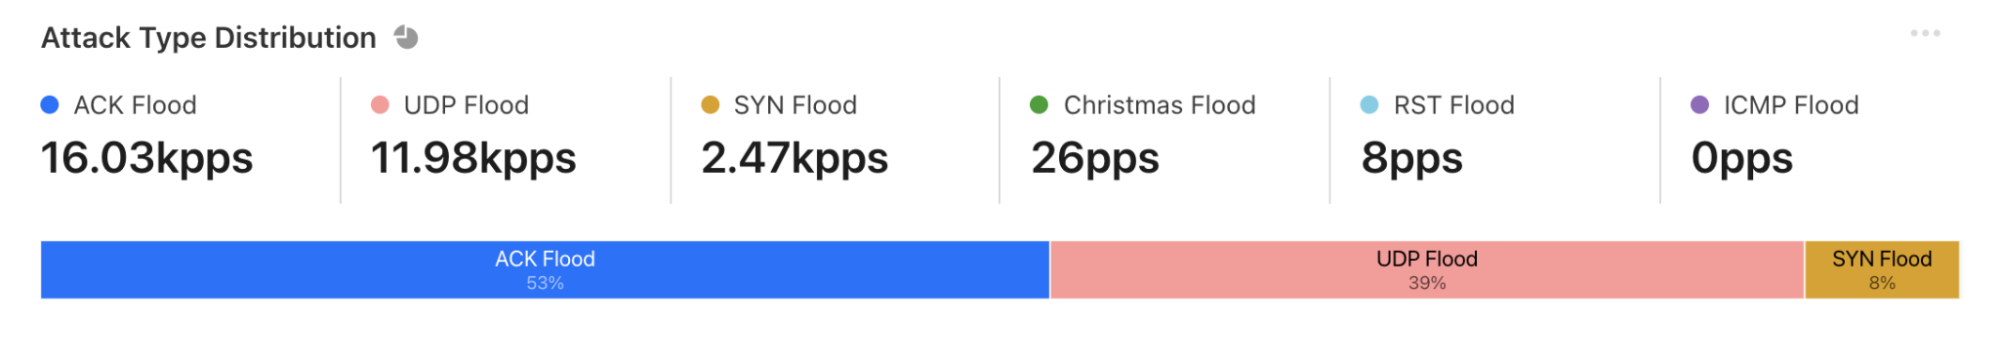