Tag Archives: Visibility

Introducing Requests for Information (RFIs) and Priority Intelligence Requirements (PIRs) for threat intelligence teams

Post Syndicated from Javier Castro original https://blog.cloudflare.com/threat-intel-rfi-pir


Cloudforce One is our threat operations and research team. Its primary objective: track and disrupt threat actors targeting Cloudflare and the customer systems we protect. Cloudforce One customers can engage directly with analysts on the team to help understand and stop the specific threats targeting them.

Today, we are releasing in general availability two new tools that will help Cloudforce One customers get the best value out of the service by helping us prioritize and organize the information that matters most to them: Requests for Information (RFIs) and Priority Intelligence Requirements (PIRs). We’d also like to review how we’ve used the Cloudflare Workers and Pages platform to build our internal pipeline to not only perform investigations on behalf of our customers, but conduct our own internal investigations of the threats and attackers we track.

What are Requests for Information (RFIs)?

RFIs are designed to streamline the process of accessing critical intelligence. They provide an avenue for users to submit specific queries and requests directly into Cloudforce One’s analysis queue. Essentially, they are a well-structured way for you to tell the team what to focus their research on to best support your security posture.

Each RFI filed is routed to an analyst and treated as a targeted call for information on specific threat elements. From malware analysis to DDoS attack analysis, we have a group of seasoned threat analysts who can provide deeper insight into a wide array of attacks. Those who have found RFIs invaluable typically belong to Security Operation Centers, Incident Response Teams, and Threat Research/Intelligence teams dedicated to supporting internal investigations within an organization. This approach proves instrumental in unveiling potential vulnerabilities and enhancing the understanding of the security posture, especially when confronting complex risks.

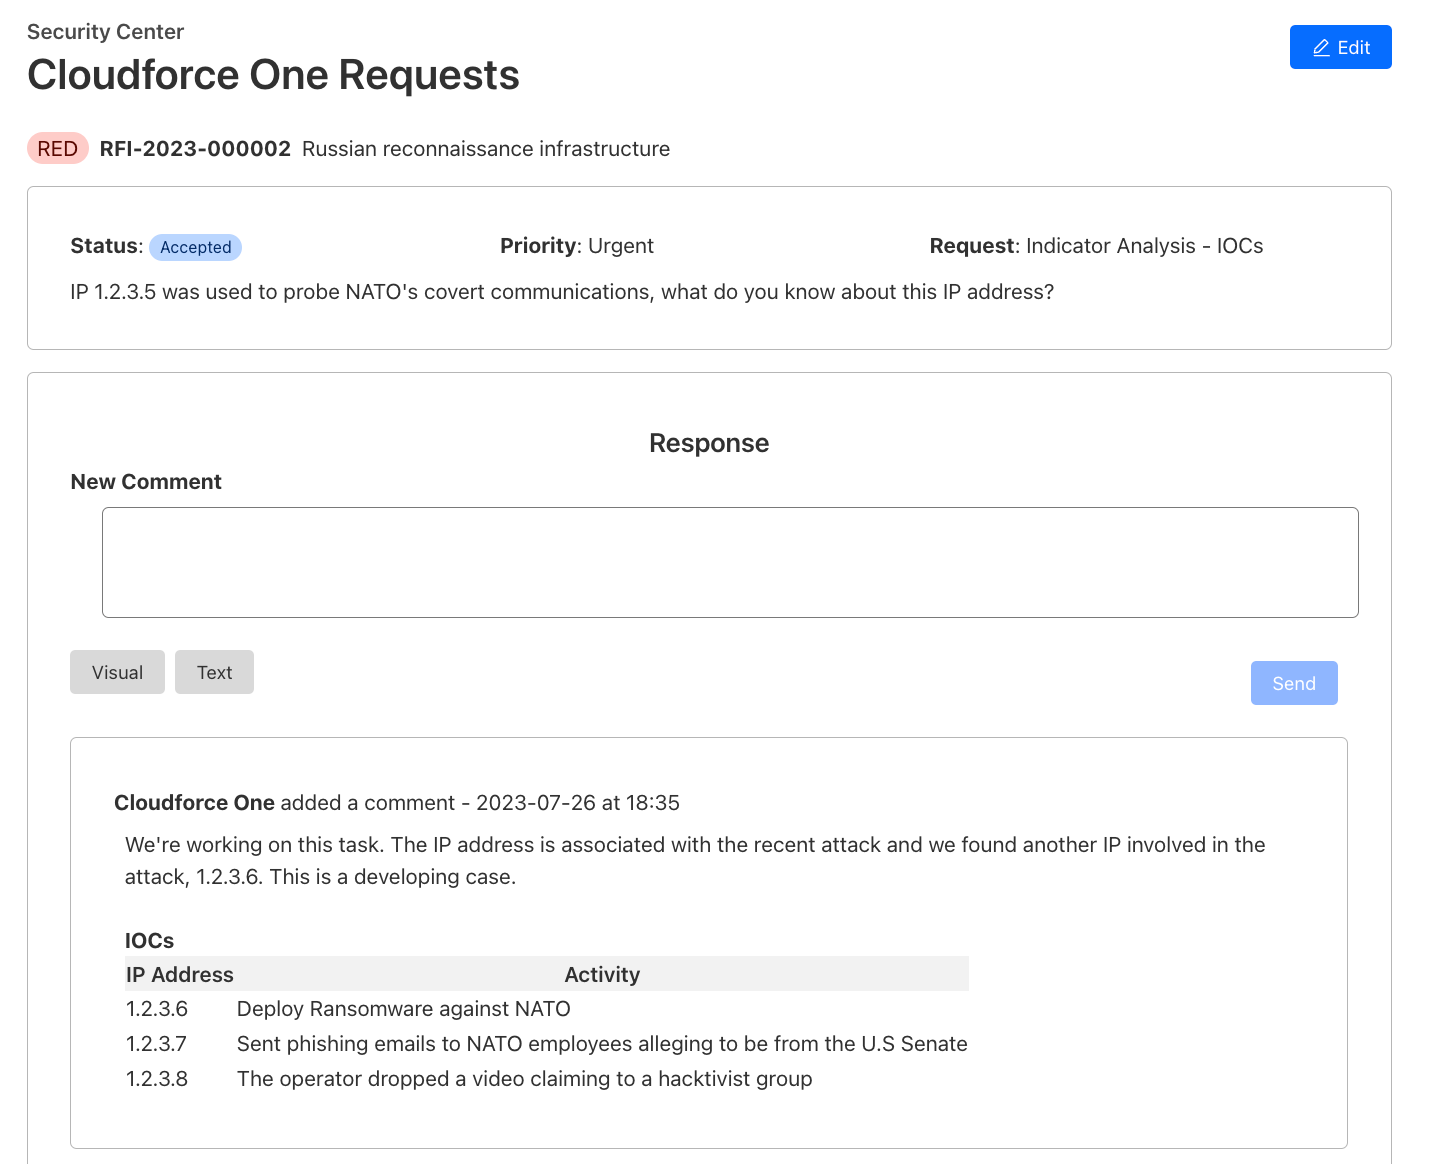
Creating an RFI is straightforward. Through the Security Center dashboard, users can create and track their RFIs:

  1. Submission: Submit requests via Cloudforce One RFI Dashboard:
    a. Threat: The threat or campaign you would like more information on
    b. Priority: routine, high or urgent
    c. Type: Binary Analysis, Indicator Analysis, Traffic Analysis, Threat Detection Signature, Passive DNS Resolution, DDoS Attack or Vulnerability
    d. Output: Malware Analysis Report, Indicators of Compromise, or Threat Research Report
  2. Tracking: Our Threat Research team begins work and the customer can track progress (open, in progress, pending, published, complete) via the RFI Dashboard. Automated alerts are sent to the customer with each status change.
  3. Delivery: Customers can access/download the RFI response via the RFI Dashboard.
Fabricated example of the detailed view of an RFI and communication with the Cloudflare Threat Research Team

Once an RFI is submitted, teams can stay informed about the progress of their requests through automated alerts. These alerts, generated when a Cloudforce One analyst has completed the request, are delivered directly to the user’s email or to a team chat channel via a webhook.

What are Priority Intelligence Requirements (PIRs)?

Priority Intelligence Requirements (PIRs) are a structured approach to identifying intelligence gaps, formulating precise requirements, and organizing them into categories that align with Cloudforce One’s overarching goals. For example, you can create a PIR signaling to the Cloudforce One team what topic you would like more information on.

PIR dashboard with fictitious examples of priority intelligence requirements

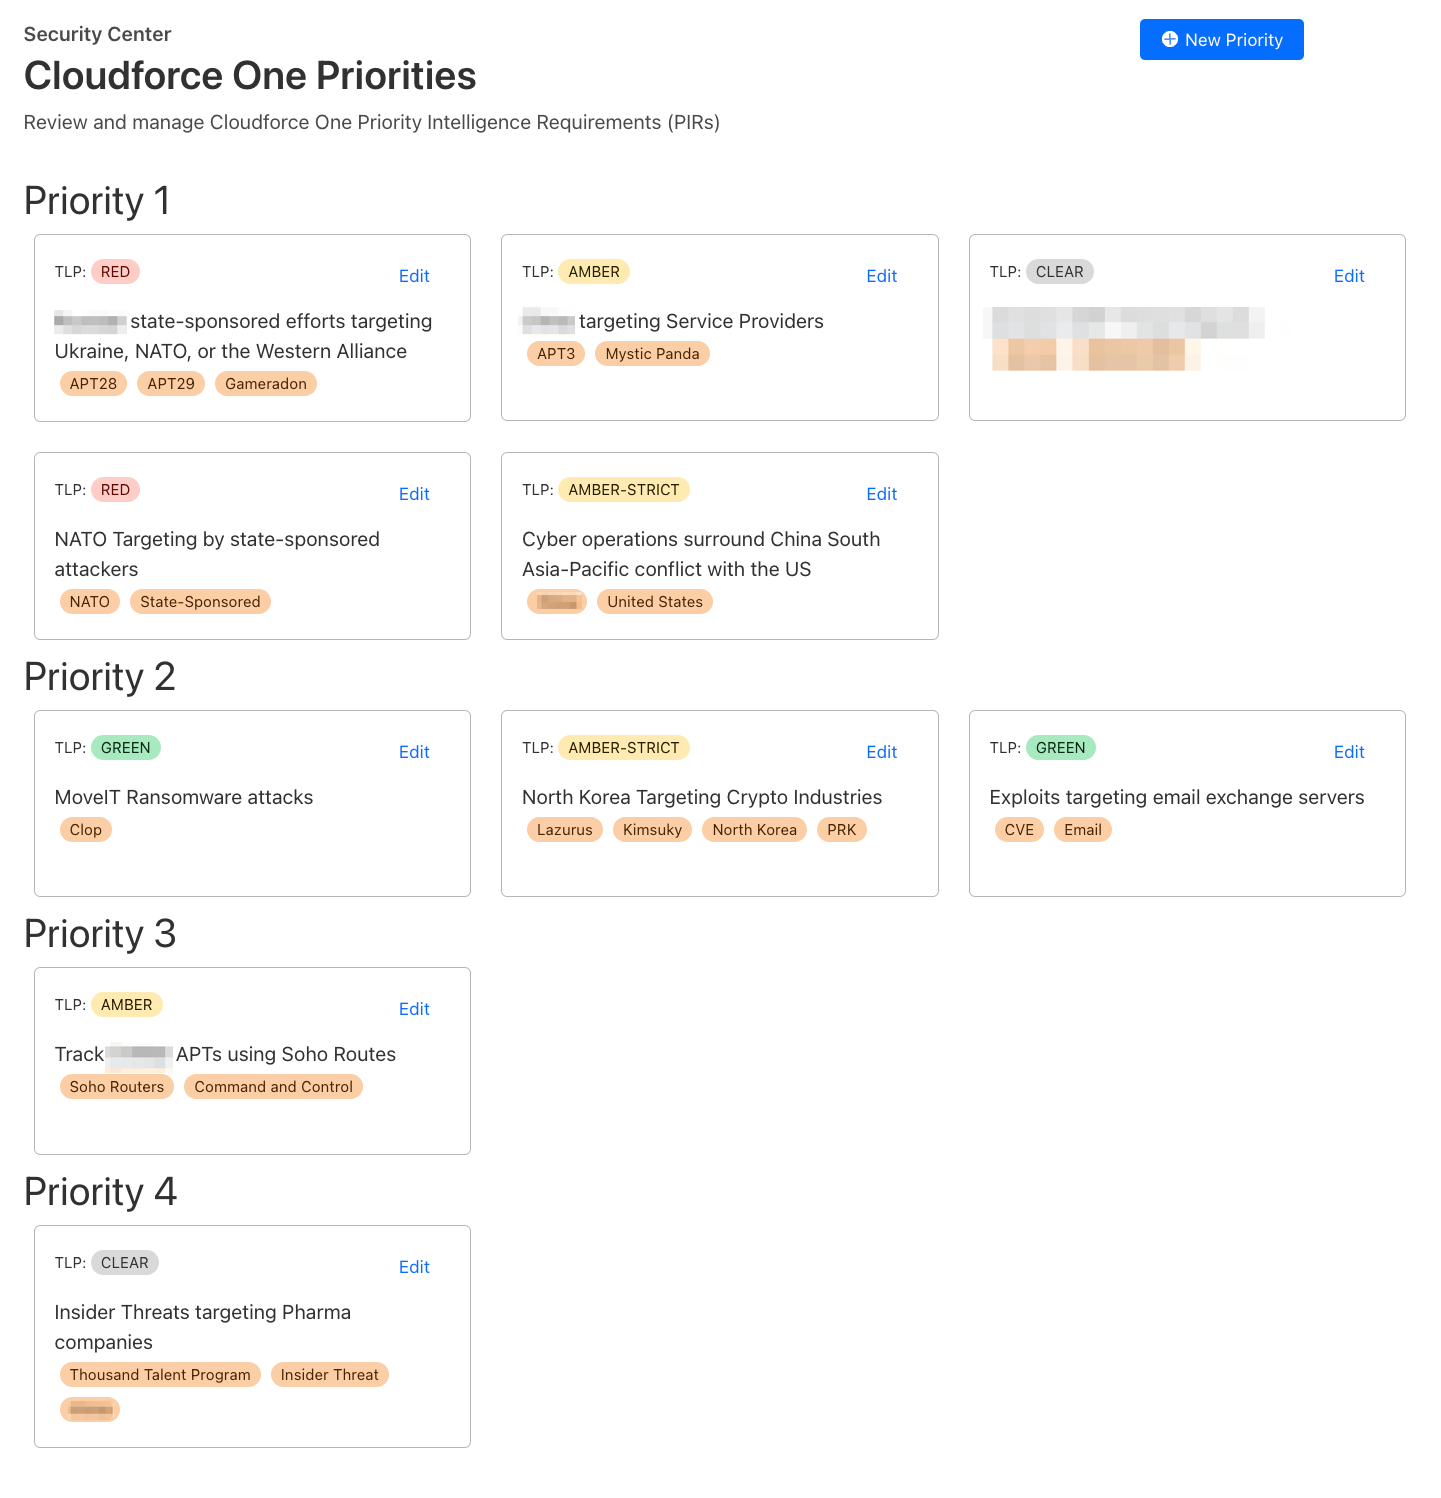
PIRs help target your intelligence collection efforts toward the most relevant insights, enabling you to make informed decisions and strengthen your organization’s cybersecurity posture.

While PIRs currently offer a framework for prioritizing intelligence requirements, our vision extends beyond static requirements. Looking ahead, our plan is to evolve PIRs into dynamic tools that integrate real-time intelligence from Cloudforce One. Enriching PIRs by integrating them with real-time intelligence from Cloudforce One will provide immediate insights into your Cloudflare environment, facilitating a direct and meaningful connection between ongoing threat intelligence and your predefined intelligence needs.

What drives Cloudforce One?

Since our inception, Cloudforce One has been actively collaborating with our Security Incident Response Team (SIRT) and Trust and Safety (T&S) team, aiming to provide valuable insights into attacks targeting Cloudflare and counteract the misuse of Cloudflare services. Throughout these investigations, we recognized the need for a centralized platform to capture insights from Cloudflare’s unique perspective on the Internet, aggregate data, and correlate reports.

In the past, our approach would have involved deploying a frontend UI and backend API in a core data center, leveraging common services like Postgres, Redis, and a Ceph storage solution. This conventional route would have entailed managing Docker deployments, constantly upgrading hosts for vulnerabilities, and dealing with a complex environment where we must juggle secrets, external service configurations, and maintaining availability.

Instead, we welcomed being Customer Zero for Cloudflare and fully embraced Cloudflare’s Workers and Pages platforms to construct a powerful threat investigation tool, and since then, we haven’t looked back. For anyone that has used Workers in the past, much of what we have done is not revolutionary, but almost commonplace given the ease of configuring and implementing the features in Cloudflare Workers. We routinely store file data in R2, metadata in KV, and indexed data in D1. That being said, we do have a few non-standard deployments as well, further outlined below.

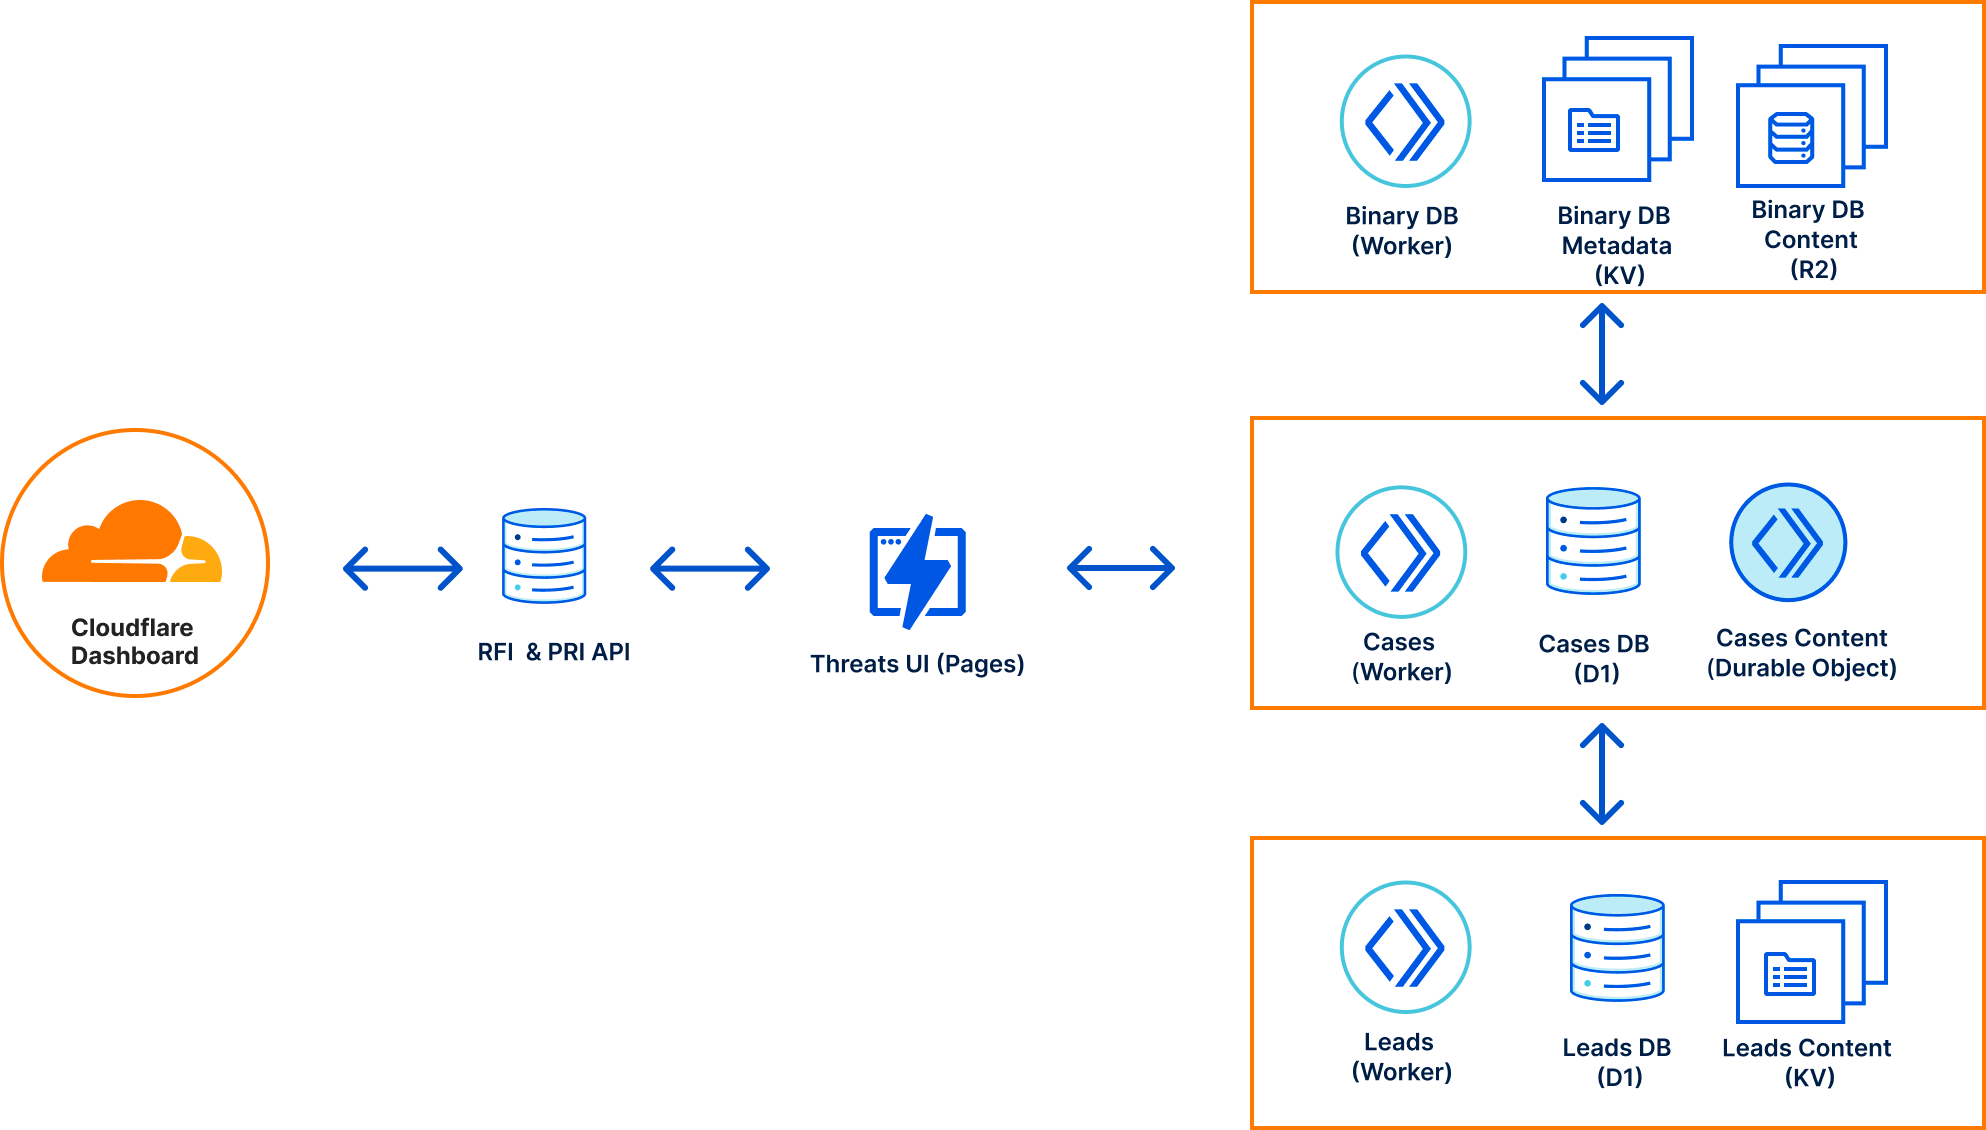
Altogether, our Threats Investigation architecture consists of five services, four of which are deployed at the edge with the other one deployed in our core data centers due to data dependency constraints.

  • RFIs & PIRs: This API manages our formal Cloudforce One requests and customer priorities submitted via the Cloudflare Dashboard.
  • Threats: Our UI, deployed via Pages, serves as the interface for interacting with all of our Cloudforce One services, Cloudflare internal services, and the RFIs and PIRs submitted by our customers.
  • Cases: A case management system that allows analysts to store notes, Indicators of Compromise (IOCs), malware samples, and data analytics related to an attack. The service provides live updates to all analysts viewing the case, facilitating real-time collaboration. Each case is a Durable Object that is connected to via a Websocket that stores “files” and “file content” in the Durable Object’s persistent storage. Metadata for the case is made searchable via D1.
  • Leads: A queue of informal internal and external requests that may be reviewed by Cloudforce One when doing threat hunting discovery. Lead content is stored into KV, while metadata and extracted IOCs are stored in D1.
  • Binary DB: A raw binary file warehouse for any file we come across during our investigation. Binary DB also serves as the repository for malware samples used in some of our machine learning training. Each file is stored in R2, with its associated metadata stored in KV.
Cloudforce One Threat Investigation Architecture

At the heart of our Threats ecosystem is our case management service built on Workers and Durable Objects. We were inspired to build this tool because we often had to jump into collaborative documents that were not designed to store forensic data, organize it, mark sections with Traffic Light Protocol (TLP) releasability codes, and relate analysis to existing RFIs or Leads.

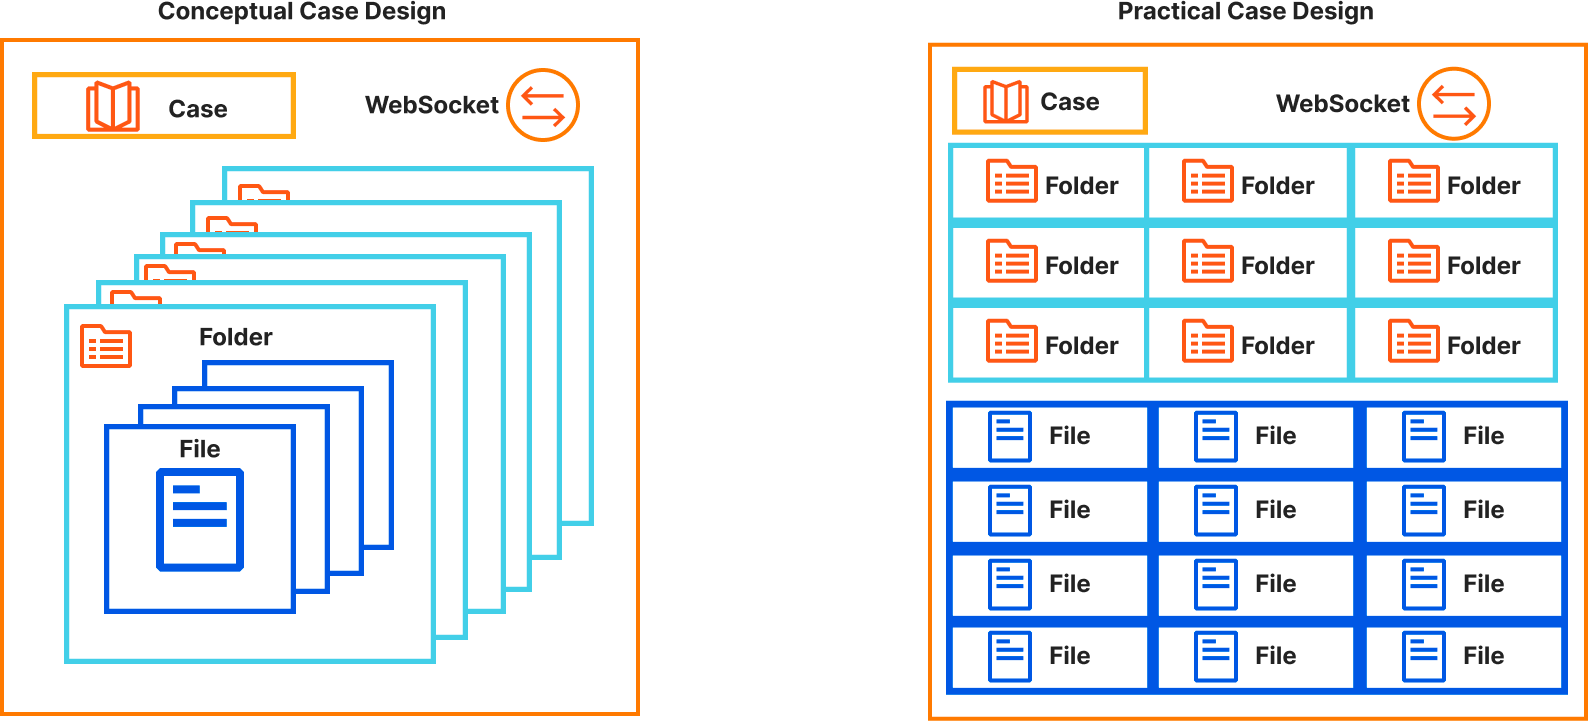
Our concept of cases is straightforward — each case is a Durable Object that can accept HTTP REST API or WebSocket connections. Upon initiating a WebSocket connection, it is seamlessly incorporated into the Durable Object’s in-memory state, allowing us to instantly broadcast real-time events to all users engaged with the case. Each case comprises distinct folders, each housing a collection of files containing content, releasability information, and file metadata.

Practically, our Durable Object leverages its persistent storage with each storage key prefixed with the value type: “case”, “folder”, or “file” followed by the UUID assigned to the file. Each case value has metadata associated with the case and a list of folders that belong to the case. Each folder has the folder’s name and a list of files that belong to it.

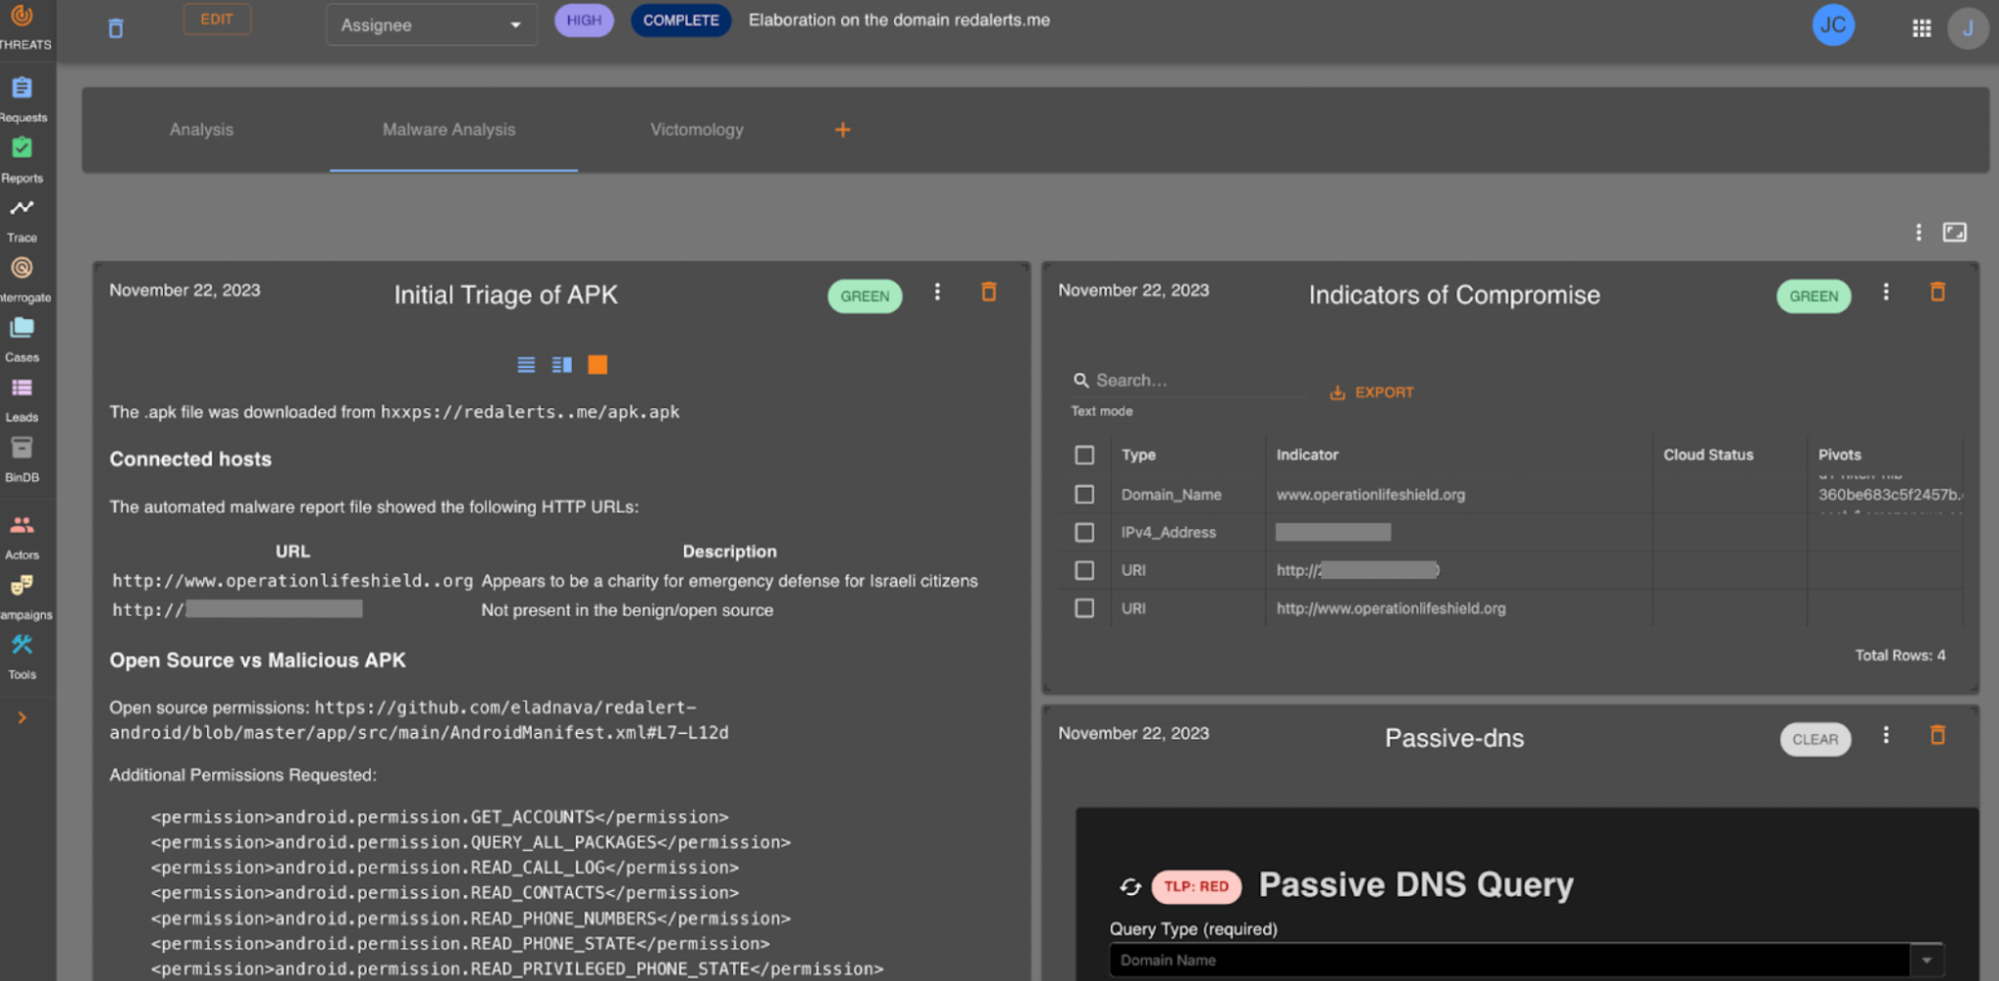
Our internal Threats UI helps us tie together the service integrations with our threat hunting analysis. It is here we do our day-to-day work which allows us to bring our unique insights into Cloudflare attacks. Below is an example of our Case Management in action where we tracked the RedAlerts attack before we formalized our analysis into the blog.

What good is all of this if we can’t search it? The Workers AI team launched Vectorize and enabled inference on the edge, so we decided to go all in on Workers and began indexing all case files as they’re being edited so that they can be searched. As each case file is being updated in the Durable Object, the content of the file is pushed to Cloudflare Queues. This data is consumed by an indexing engine consumer that does two things: extracts and indexes indicators of compromise, and embeds the content into a vector and pushes it into Vectorize. Both of the search mechanisms also pass the reference case and file identifiers so that the case may be found upon searching.

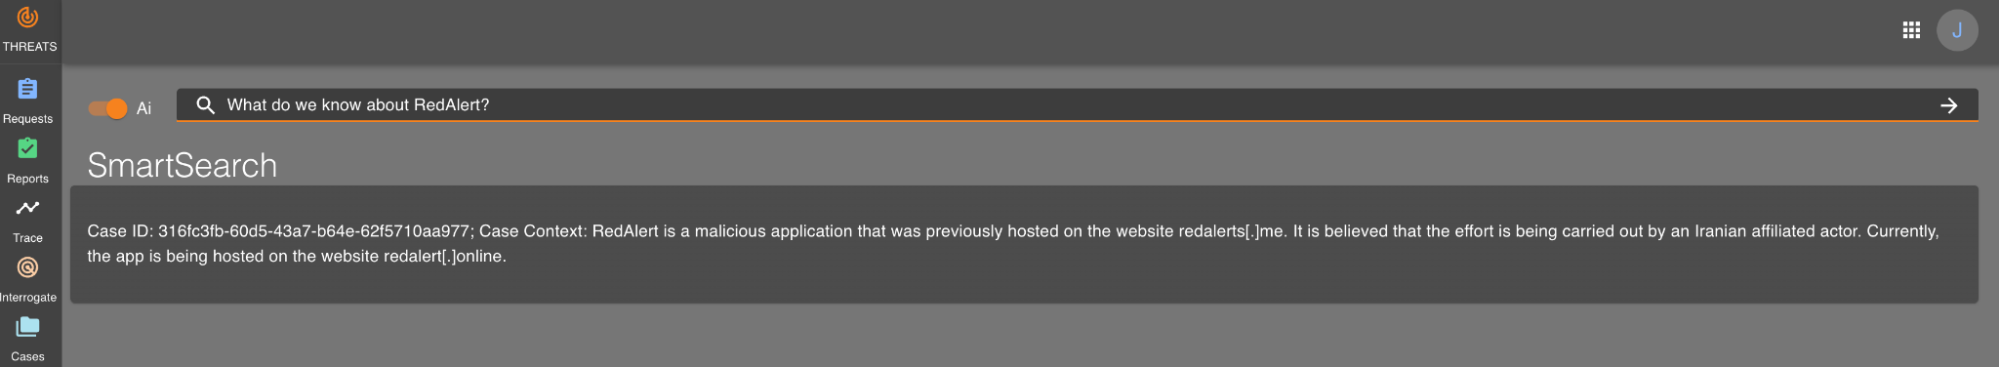
Given how easy it is to set up Workers AI, we took the final step of implementing a full Retrieval Augmented Generation (RAG) AI to allow analysts to ask questions about our previous analysis. Each question undergoes the same process as the content that is indexed. We pull out any indicators of compromise and embed the question into a vector, so we can use both results to search our indexes and Vectorize respectively, and provide the most relevant results for the request. Lastly, we send the vector data to a text-generation model using Workers AI that then returns a response to our analysts.

Using RFIs and PIRs

Imagine submitting an RFI for “Passive DNS Resolution – IOCs” and receiving real-time updates directly within the PIR, guiding your next steps.

Our workflow ensures that the intelligence you need is not only obtained but also used optimally. This approach empowers your team to tailor your intelligence gathering, strengthening your cybersecurity strategy and security posture.

Our mission for Cloudforce One is to equip organizations with the tools they need to stay one step ahead in the rapidly changing world of cybersecurity. The addition of RFIs and PIRs marks another milestone in this journey, empowering users with enhanced threat intelligence capabilities.

Getting started

Cloudforce One customers can already see the PIR and RFI Dashboard in their Security Center, and they can also use the API if they prefer that option. Click to see more documentation about our RFI and our PIR APIs.

If you’re looking to try out the new RFI and PIR capabilities within the Security Center, contact your Cloudflare account team or fill out this form and someone will be in touch. Finally, if you’re interested in joining the Cloudflare team, check out our open job postings here.

Monitor your own network with free network flow analytics from Cloudflare

Post Syndicated from Chris Draper original https://blog.cloudflare.com/free-magic-network-monitoring/

Monitor your own network with free network flow analytics from Cloudflare

Monitor your own network with free network flow analytics from Cloudflare

As a network engineer or manager, answering questions about the traffic flowing across your infrastructure is a key part of your job. Cloudflare built Magic Network Monitoring (previously called Flow Based Monitoring) to give you better visibility into your network and to answer questions like, “What is my network’s peak traffic volume? What are the sources of that traffic? When does my network see that traffic?” Today, Cloudflare is excited to announce early access to a free version of Magic Network Monitoring that will be available to everyone. You can request early access by filling out this form.

Magic Network Monitoring now features a powerful analytics dashboard, self-serve configuration, and a step-by-step onboarding wizard. You’ll have access to a tool that helps you visualize your traffic and filter by packet characteristics including protocols, source IPs, destination IPs, ports, TCP flags, and router IP. Magic Network Monitoring also includes network traffic volume alerts for specific IP addresses or IP prefixes on your network.

Making Network Monitoring easy

Magic Networking Monitoring allows customers to collect network analytics without installing a physical device like a network TAP (Test Access Point) or setting up overly complex remote monitoring systems. Our product works with any hardware that exports network flow data, and customers can quickly configure any router to send flow data to Cloudflare’s network. From there, our network flow analyzer will aggregate your traffic data and display it in Magic Network Monitoring analytics.

Analytics dashboard

In Magic Network Monitoring analytics, customers can take a deep dive into their network traffic data. You can filter traffic data by protocol, source IP, destination IP, TCP flags, and router IP. Customers can combine these filters together to answer questions like, “How much ICMP data was requested from my speed test server over the past 24 hours?” Visibility into traffic analytics is a key part of understanding your network’s operations and proactively improving your security. Let’s walk through some cases where Magic Network Monitoring analytics can answer your network visibility and security questions.

Monitor your own network with free network flow analytics from Cloudflare

Create network volume alert thresholds per IP address or IP prefix

Magic Network Monitoring is incredibly flexible, and it can be customized to meet the needs of any network hobbyist or business. You can monitor your traffic volume trends over time via the analytics dashboard and build an understanding of your network’s traffic profile. After gathering historical network data, you can set custom volumetric threshold alerts for one IP prefix or a group of IP prefixes. As your network traffic changes over time, or their network expands, they can easily update their Magic Network Monitoring configuration to receive data from new routers or destinations within their network.

Monitoring a speed test server in a home lab

Let’s run through an example where you’re running a network home lab. You decide to use Magic Network Monitoring to track the volume of requests a speed test server you’re hosting receives and check for potential bad actors. Your goal is to identify when your speed test server experiences peak traffic, and the volume of that traffic. You set up Magic Network Monitoring and create a rule that analyzes all traffic destined for your speed test server’s IP address. After collecting data for seven days, the analytics dashboard shows that peak traffic occurs on weekdays in the morning, and that during this time, your traffic volume ranges from 450 – 550 Mbps.

As you’re checking over the analytics data, you also notice strange traffic spikes of 300 – 350 Mbps in the middle of the night that occur at the same time. As you investigate further, the analytics dashboard shows the source of this traffic spike is from the same IP prefix. You research some source IPs, and find they’re associated with malicious activity. As a result, you update your firewall to block traffic from this problematic source.

Identifying a network layer DDoS attack

Magic Network Monitoring can also be leveraged to identify a variety of L3, L4, and L7 DDoS attacks. Let’s run through an example of how ACME Corp, a small business using Magic Network Monitoring, can identify a Ping (ICMP) Flood attack on their network. Ping Flood attacks aim to overwhelm the targeted network’s ability to respond to a high number of requests or overload the network connection with bogus traffic.

At the start of a Ping Flood attack, your server’s traffic volume will begin to ramp up. Magic Network Monitoring will analyze traffic across your network, and send an email, webhook, or PagerDuty alert once an unusual volume of traffic is identified. Your network and security team can respond to the volumetric alert by checking the data in Magic Network Monitoring analytics and identifying the attack type. In this case, they’ll notice the following traffic characteristics:

  1. Network traffic volume above your historical traffic averages
  2. An unusually large amount of ICMP traffic
  3. ICMP traffic coming from a specific set of source IPs

Now, your network security team has confirmed the traffic is malicious by identifying the attack type, and can begin taking steps to mitigate the attack.

Magic Network Monitoring and Magic Transit

If your business is impacted by DDoS attacks, Magic Network Monitoring will identify attacks, and Magic Transit can be used to mitigate those DDoS attacks. Magic Transit protects customers’ entire network from DDoS attacks by placing our network in front of theirs. You can use Magic Transit Always On to reduce latency and mitigate attacks all the time, or Magic Transit On Demand to protect your network during active attacks. With Magic Transit, you get DDoS protection, traffic acceleration, and other network functions delivered as a service from every Cloudflare data center. Magic Transit works by allowing Cloudflare to advertise customers’ IP prefixes to the Internet with BGP to route the customer’s traffic through our network for DDoS protection. If you’re interested in protecting your network with Magic Transit, you can visit the Magic Transit product page and request a demo today.

Monitor your own network with free network flow analytics from Cloudflare

Sign up for early access and what’s next

The free version of Magic Network Monitoring (MNM) will be released in the next few weeks. You can request early access by filling out this form.

This is just the beginning for Magic Network Monitoring. In the future, you can look forward to features like advanced DDoS attack identification, network incident history and trends, and volumetric alert threshold recommendations.

How Cloudflare One solves your observability problems

Post Syndicated from Chris Draper original https://blog.cloudflare.com/cloudflare-one-observability/

How Cloudflare One solves your observability problems

How Cloudflare One solves your observability problems

Today, we’re excited to announce Cloudflare One Observability. Cloudflare One Observability will help customers work across Cloudflare One applications to troubleshoot network connectivity, security policies, and performance issues to ensure a consistent experience for employees everywhere. Cloudflare One, our comprehensive SASE platform, already includes visibility for individual products; Cloudflare One Observability is the next step in bringing data together across the Cloudflare One platform.

Network taps and legacy enterprise networks

Traditional enterprise networks operated like a castle protected by a moat. Employees working from a physical office location authenticated themselves at the beginning of their session, they were protected by an extensive office firewall, and the majority of the applications they accessed were on-premise.

Many enterprise networks had a strictly defined number of “entrances” for employees at office locations. Network taps (devices used to measure and report events on a local network) monitored each entrance point, and these devices gave network administrators and engineers complete visibility into their operations.

Learn more about the old castle-and-moat network security model.

Incomplete observability in today’s enterprise network

Today’s enterprise networks have expanded beyond the traditional on-premise model and have become extremely fragmented. Now, employees can work from anywhere. People access enterprise networks from across the Internet, and the applications they use every day are a mix of on-premise and SaaS cloud instances.

SaaS applications are hosted outside the enterprise network, leaving your security teams with limited observability into how users access those applications and move data through them. Without observability on the applications your employees are using, you can’t control how sensitive data is stored, shared, or exposed to third parties.

Now that enterprise networks have become more fragmented, it is increasingly difficult to understand how the various fragments are operating. To even gain limited observability, you have to implement a disorganized combination of network taps, flow data, synthetic probes, and dashboards that fail to share data across one another.

Total observability across an enterprise & cloud network built on Cloudflare One

Cloudflare One Observability is built to solve today’s issue of network fragmentation in a zero trust world. Instead of having data spread across multiple network tools, Cloudflare One Observability will combine data from different Cloudflare One functions into a single experience. Customers will be able to go to one place to troubleshoot any issues they’re experiencing with their enterprise applications and networks.

In today’s world of fragmented enterprise networks, there are some questions that can be difficult to answer. Let’s break down a couple of customer examples and walk through how Cloudflare One Observability will simplify the troubleshooting process.

Troubleshooting bandwidth issues across branch locations

A customer may want to know, “What applications are using up the majority of my bandwidth across multiple office locations?” In a typical enterprise network, a network engineer would need to install a network tap or collect flow data at each office location, aggregate the information across separate networks, then build a custom tool to visualize the bandwidth data.

Instead, for Cloudflare One customers, Cloudflare will automatically do all the upfront data collection and aggregation. Customers will be able to skip straight to troubleshooting and solving their bandwidth problem by using Cloudflare One Observability to visualize bandwidth usage across office locations.

Identifying network vulnerabilities

Another challenging question that customers face is, “What attack trends are popular, and is my network vulnerable?” Assessing a network’s vulnerability is time-consuming as administrators dive into separate applications for VPNs, firewalls, user policies, and endpoints to understand their network’s security posture.

Cloudflare One is built from the ground up to simplify this problem. Observability is straightforward when your network on-ramps, firewalls, user policies, and endpoint protection are all managed within the same platform. Customers will be able to go to the Cloudflare One Observability experience to see security patches that are automatically applied by Cloudflare so that customers don’t have to worry. Cloudflare One lets you know whether you’ve been targeted by an attack and gives you confidence that you’re protected.

Troubleshooting slow network performance

Many people have experienced logging into a slow enterprise network. The general problem of “my network is slow when I access an on-premise or SaaS application” can be tough to solve. If employees are working remotely, a network engineer would need to dig through different applications to troubleshoot latency and jitter between VPNs, firewalls, user policies, and endpoint connections.

Cloudflare One Observability simplifies this time-consuming troubleshooting process. When your on-ramps, firewalls, user policies, and endpoint monitoring are all configured on the same platform, you only need to go to one place to troubleshoot these network functions. Cloudflare One’s architecture is built on the concept of single pass inspection. When a request lands on a Cloudflare server, that request passes through instances of Cloudflare One services all on that same single server. This makes it easy to visualize end-to-end network request handling, so customers can seamlessly analyze traffic and identify a network bottleneck or misconfiguration.

Observability powered by Cloudflare’s network

Cloudflare One Observability is built on Cloudflare’s best-in-class network. We have data centers in 270+ cities and over 100 countries. Since every Cloudflare One product runs on every server, we can provide an unparalleled fast and consistent experience to customers everywhere. Cloudflare built its network and security applications from the ground up on the same infrastructure. Unlike our competitors that have strung together a zero trust platform by building siloed applications or through acquisitions, Cloudflare One applications are seamlessly integrated and designed from day one to share data between one another.

As our applications are all built on the same infrastructure, so are our data pipelines and logging services. When you use Cloudflare One, you get the full benefits of our advanced data tools, like Instant Logs for delivering live network data as it arrives and ABR for analyzing network data at scale.

How Cloudflare One solves your observability problems

Delivering the Zero Trust observability customers need today

Since 2009, Cloudflare has built one of the fastest, most reliable, and most secure networks in the world. We’ve built Cloudflare One and Cloudflare One Observability on top of this network, and we’re extending its power to meet the challenges of any company. The move to Zero Trust is a paradigm shift, and we believe the security benefits of this new paradigm will make it inevitable for every company. We’re proud of how we have helped and continue to help existing and new customers reinvent their corporate networks.

Construction of Cloudflare One Observability is still in progress. If you’re excited about this new product, you can sign up for our wait list now!