All posts by Colin Carson

Create a customizable cross-company log lake, Part II: Build and add Amazon Bedrock

Post Syndicated from Colin Carson original https://aws.amazon.com/blogs/big-data/create-a-customizable-cross-company-log-lake-part-ii-build-and-add-amazon-bedrock/

In Part I, we introduced the business background behind Log Lake. In this post, we describe how to build it, and how to add model invocation logs from Amazon Bedrock.

The original use case of Log Lake was to join AWS CloudTrail logs (with StartSession API calls) with Amazon CloudWatch logs (with session keystrokes from within Session Manager, a capability of AWS Systems Manager), to help a manager review an employee’s use of elevated permissions to determine if the use was appropriate. Because there might be only one event of elevated privileges in millions or billions of rows of log data, finding the right row to review was like looking for a needle in a haystack.

Log Lake is not just for Session Manager, but also general purpose CloudTrail and CloudWatch logs. After adding CloudWatch and CloudTrail logs to raw tables at scale, you can set up AWS Glue jobs to process the many tiny JSON files of raw tables into bigger binary files for “readready” tables. Then, these readready tables could be queried with different filters to answer questions for many use cases, such as legal or regulatory reviews for compliance, deep forensic investigations for security, or auditing. Log Lake is an answer to the question “Are there logs, and if so, how do I get them?”

Solution overview

Log Lake is a data lake for compliance-related use cases, uses CloudTrail and CloudWatch as data sources, has separate tables for writing (original in raw JSON file format) and reading (read-optimized readready in transformed Apache ORC file format), and gives you control over the components so you can customize it for yourself.

The following diagram shows the system architecture.

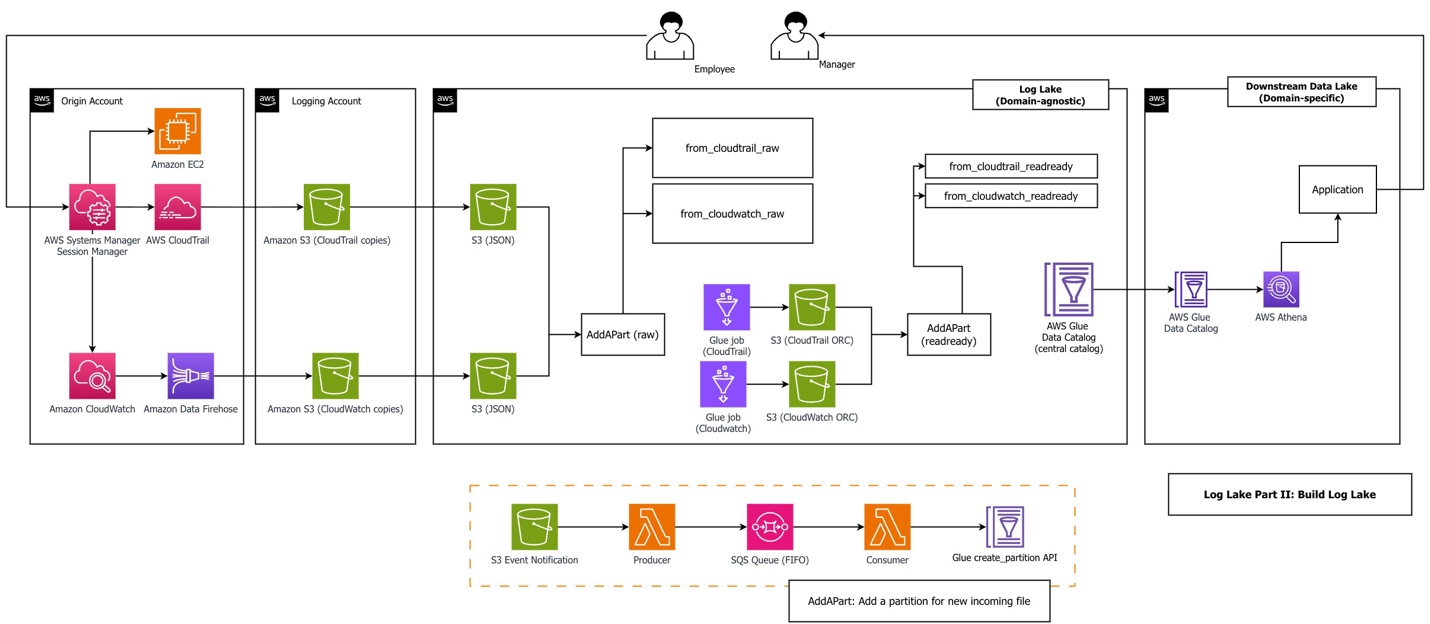
The workflow consists of the following steps:

  1. An employee uses Session Manager to access Amazon Elastic Compute Cloud (Amazon EC2). Sessions might include sessionContext.sourceIdentity if a principal provided it while assuming a role (requires sts:SetSourceIdentity in the role trust policy). Our AWS Glue jobs filtered on this field to reduce cost and improve performance.
  2. Logging in to an EC2 instance using Session Manager and performing actions during a session triggers two kinds of logs: CloudTrail records API activity (StartSession) and CloudWatch records session data from within the service (sessionData). Sample CloudTrail and CloudWatch log files are in the GitHub repository, generated from a real Systems Manager session. We recommend you upload these files in your first deployment, but alternatively, you can generate your own data files.
  3. An Amazon Data Firehose subscription copies logs to Amazon Simple Storage Service (Amazon S3) using a CloudWatch subscription filter. CloudWatch combines multiple log events into one Firehose record when it is sent using subscription filters. This is why Log Lake uses regex serde to process CloudWatch rather than JSON serde. When using Firehose subscription filters, Firehose compresses data with GZIP level 6 compression.
  4. Optionally, replication rules copy files to consolidated S3 buckets.
  5. The AddAPart AWS Lambda function associates many tiny JSON files with raw Hive tables in the Data Catalog using the AWS Glue API, triggered by S3 event notifications.
  6. The AWS Glue job reads raw tables and writes to bigger binary ORC files, a columnar file format suitable for analytics. Amazon Athena needs JSON documents on separate lines for processing. In our benchmarking using CloudWatch and CloudTrail workloads, ORC ZLIB had the fastest (lowest) query duration, and was half the file size of Parquet Snappy (1246 MB ORC ZLIB vs 2.4GB Parquet Snappy). Also, ORC is used by AWS CloudTrail Lake. To test file formats, logs from CloudTrail Systems Manager (eventsource='ssm.amazonaws.com') were copied to generate a total population of JSON files over 500 GB. First, a JSON table was created. Then two additional tables were created using Athena CTAS: one for ORC ZLIB, and one for Parquet Snappy. Tests compared three subsequent query durations for three different workloads across ORC vs. Parquet.
  7. The AddAPart Lambda function associates ORC files with Hive readready tables. AddAPart for readready is created using the same stack as for raw, but different parameters (bucket, table, and so on). Hive table format was used for raw because incoming files were JSON, and readready used Hive (not Iceberg) for consistency and append only operations.
  8. Users can query readready tables using the Athena API.

Log Lake uses multiple services together:

  • CloudTrail logs for StartSession API activity (required for auditing, compliance, legal purposes)
  • CloudWatch logs to extend and add keystrokes from Session Manager, so what happened within a session can be reviewed for appropriate use
  • Lambda and Amazon Simple Queue Service (Amazon SQS) for asynchronous invocation of S3 event notifications, for serverless event-driven processing to associate data files with metadata tables
  • The Data Catalog as a metastore to register table metadata, either standalone or as part of a data mesh architecture
  • AWS Glue Spark jobs to transform data from original raw format to read-optimized tables
  • Athena for one-time queries

The architecture of Log Lake includes the following design choices:

  • Separate tables for writing (raw) and reading (readready).
  • Asynchronous invocation using Lambda and Amazon SQS to add partitions for files (AddAPart).
  • AWS Glue jobs with Spark SQL and views (“many view”).
  • AWS services designed to do one thing well, such as Amazon S3 for storage and Amazon SQS for message queueing. This gives data engineers control over components for cost or customization.

Separate tables for reading (readready) and writing (raw)

The concept of raw and readready tables represents two distinct approaches to data storage and processing, each serving different purposes in a data architecture:

  • Raw tables – Source-aligned and write-optimized. They are backed by many tiny files (KB in size) in original format. For CloudWatch and CloudTrail, this means JSON file format.
  • ReadReady tables – Source-aligned and read-optimized. They are backed by bigger binary files, usually larger than 10 MB, in columnar file format.

Part I contains our comparison of performance, cost, and convenience of both table layers.

Add partition Lambda functions (AddAPart)

Log Lake uses an event-based, asynchronous invocation approach to add partitions to raw tables. We call this approach “AddAPart with LoLLs” (Lots of Little Lambdas). It is optimized for adding new incoming files in text format to existing Hive tables as fast as possible, with the following assumptions:

  • Incoming raw files are in JSON or CSV and must be stored and queried in original format (can’t be changed to Iceberg-compatible formats such as Parquet or ORC). Append only, not merge or update.
  • Partition management must be automatic.
  • File-based, no dependency on a job (files can be landed by different pipelines in different ways, and handled consistently by the same AddAPart function).
  • No dependency on Athena partition projection (Data Catalog only).

The AddAPart function consists of five steps:

  1. An S3 event notification triggers the AddAPart producer Lambda function.
  2. The AddAPart producer sends messages to a first-in-first-out (FIFO) SQS queue.
  3. Amazon SQS helps prevent duplicate messages using MessageDeduplicationId.
  4. The AddAPart consumer processes a message and translates it to a partition placer profile.
  5. The AddAPart consumer uses the AWS Glue API to create a partition if none exists.

The following are some ways we have used AddAPart:

  • Minimizing the time it takes to associate new data (JSON files) with new partitions (table in Hive).
  • Reducing the cost of partition adding (duplicate S3 prefixes are ignored).
  • Altering file names (Data Firehose postprocessing Lambda functions are an alternative).
  • Customization, such as ignoring files with certain regex patterns in the S3 prefix or file name. If you want to exclude a data source or do an emergency power off, you can do it from within AddAPart without modifying other resources.

“Many view” AWS Glue jobs

Both Log Lake jobs are what we call “many view” AWS Glue jobs, which use createOrReplaceTempView from Spark, using code like the following:

from pyspark.sql import DataFrame, SparkSession
# code
def create_view_from_sqlstatement(
    logger: logging.Logger, spark: SparkSession, sqlstatement: str, name_of_view: str
) -> None:
    """
    Create a view from a SQL statement.
    """
    result_as_df = spark.sql(sqlstatement)
    result_as_df.createOrReplaceTempView(name_of_view)
    logger.info(f"created view {name_of_view} from sqlstatement...")
# code
name_of_view = "some_step_as_view"
sql_statement = some_statement_for_step
create_view_from_sqlstatement(
logger,
spark,
sql_statement,
name_of_view,
)
sql_statement_for_job="select * from some_step_as_view"
returned_df = spark.sql(sql_statement_for_job)

We have used this approach to address the following antipatterns:

  • Trying to do everything in one step – Trying to do all operations and relational algebra in a single Spark SQL statement can become too complex to troubleshoot, understand, or maintain. For us, when we see a single statement with at least 200 lines and 2 subqueries, we prefer to break it down into smaller statements.
  • Code that is not standardized (inconsistent APIs and approaches) that is harder to maintain, support, and enhance – We have seen the freedom of Spark to mix API approaches (Spark SQL API, RDD API, DataFrame API) result in inconsistency and complexity in large code bases with many contributors.
  • Mixing business logic with Spark environment (such as session settings) – Business logic should be separate and portable.

AWS Glue jobs with custom bounded execution and tables that support workload partitioning

You can tell AWS Glue jobs to look at a maximum of n days or n rows with custom bounds, which we implement using Spark Data Frames as follows:

name_of_view = "mybounds_as_view"

sql_statement = f"""
SELECT (current_timestamp() - INTERVAL {days_begin} DAY) floor_as_time
,cast((current_timestamp() - INTERVAL {days_begin} DAY) AS date) floor_as_date
,cast((current_timestamp() + INTERVAL  {days_end} DAY) AS date) ceiling_as_date
"""

Also, jobs can prune data using table partitions (and use partition indexes). This helps you prepare routine mechanisms up front that are ready to run and recover from missing data by running relative backfill jobs until data is up to date.

Prerequisites

Complete the following prerequisite steps to implement this solution:

  1. Download the repository:
    git clone https://github.com/aws-samples/sample-log-lake-for-compliance.git

  2. Create or identify an S3 bucket to use during the walkthrough. This will be used for storing the AWS Glue job scripts, Lambda Python files, and AWS CloudFormation stacks.
  3. Copy all files under log_lake to the S3 bucket.
  4. If the S3 bucket is encrypted using an AWS Key Management Service (AWS KMS) key, note the Amazon Resource Name (ARN) of the key.

Build Log Lake

To build Log Lake, follow the deployment steps in the how_to_deploy.md file in the repo.

After deployment is complete, you can upload demo data files and run the AWS Glue jobs to demo how to answer the question, “Who did what in session manager?” For this, switch over to the how_to_demo.md file and follow the steps.

When you are done, you should see the following tables in the Data Catalog:

  • from_cloudtrail_readready – Contains processed CloudTrail session data
  • from_cloudwatch_readready – Contains processed CloudWatch session logs

You can view them on the AWS Glue console or query them directly in Athena. The following is a sample query from the repository that shows how to join both tables to get API activity from CloudTrail and join it to session data (keystrokes) from CloudWatch:

SELECT t.eventsource 
,t.eventname 
,t.eventtime 
,w.logaccountid 
,w.loggroup 
,w.subscriptionfilters 
,w.eventtime as eventtime_from_cloudwatch
,w."session" as session_from_cloudwatch
 FROM loglakeblog.from_cloudwatch_readready w 
 inner join loglakeblog.from_cloudtrail_readready t
on  w.f_sessionid=t.f_sessionid

Add Amazon Bedrock model invocation logs

Adding Bedrock model invocation logs to Log Lake is important to enable human review of agent actions with elevated permissions. Some examples of the need for human oversight are tool use, computer use, agentic misalignment, and high impact AI in federal agencies. If you have not considered this use case and are using LLMs, we urge you to review Amazon Bedrock logs and consider either a managed product or a self-built data lake like Log Lake.

In this post, we use “agentic” and “agent” to refer to a large language model (LLM) using tools with some autonomy to iterate toward a goal.

To generate model invocation logs for this post, we created a custom Lambda function to ask Anthropic’s Claude 4.5 to list files in a bucket using a tool. We used this as a plausible future scenario where a human might need to review an agent’s actions and logs to decide if an agent’s tool use was appropriate.

The following diagram shows the components involved.

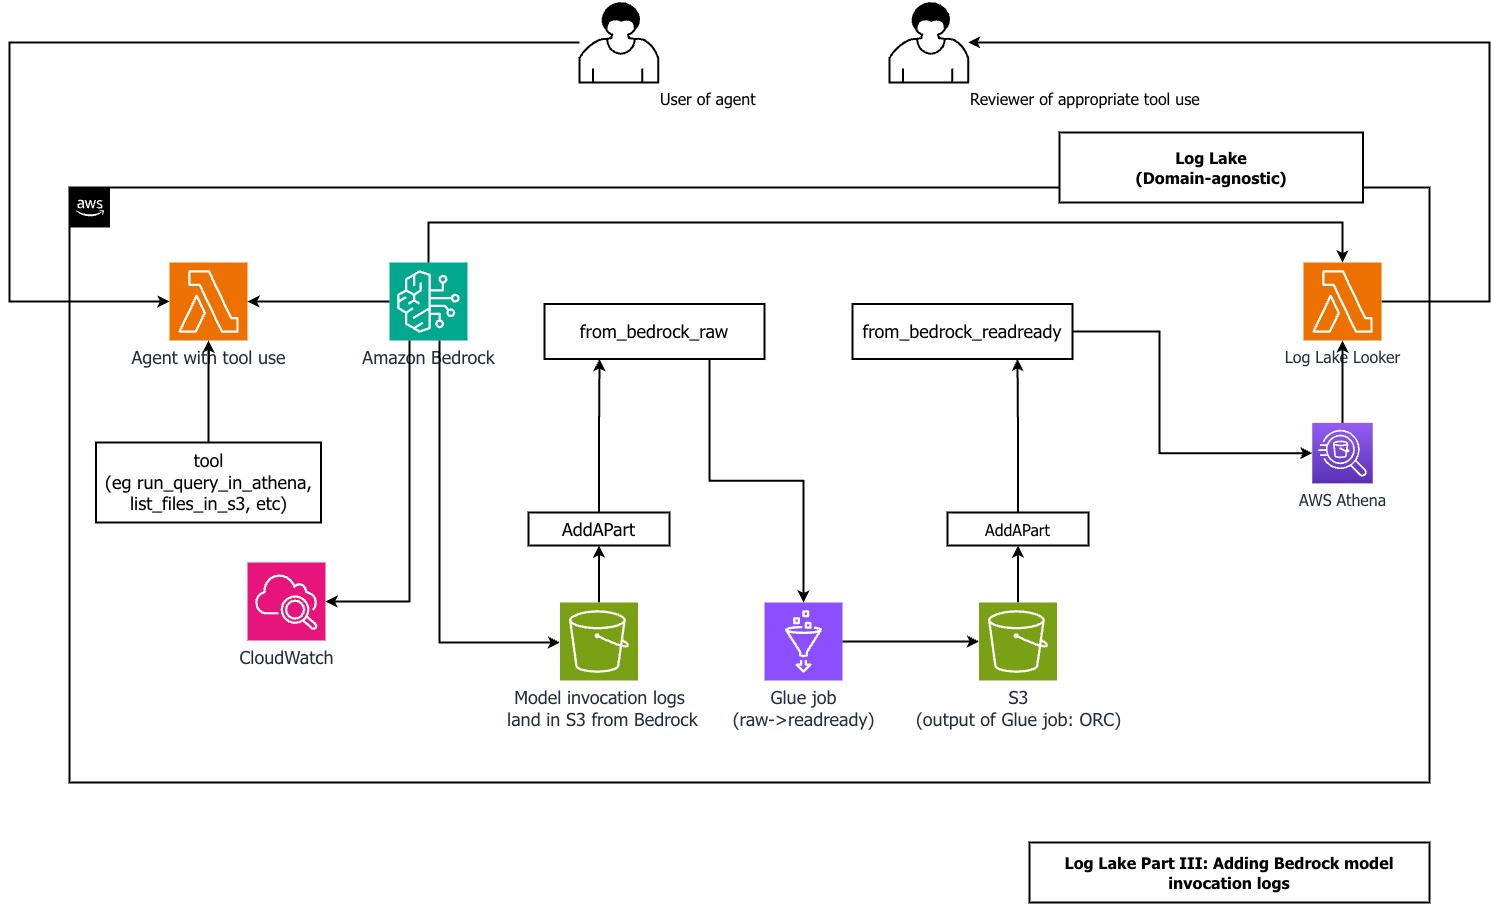
For logging inputs and outputs of LLMs running on Bedrock, refer to Monitor model invocation using CloudWatch Logs and Amazon S3. For simplicity, we avoided CloudWatch logs and set up logging directly to Amazon S3.

For logging API activity for Amazon Bedrock, refer to Monitor Amazon Bedrock API calls using CloudTrail.

We have included examples of the CloudTrail and CloudWatch files from Amazon Bedrock model invocation logs in the repository.

Before you create the model invocation logs, make sure you have created the from_cloudtrail_readready table from the previous steps.

Follow the steps in the GItHub repo to add Amazon Bedrock model invocation logs to Log Lake. When done, you should have the tablereplace_me_with_your_database.from_bedrock_readready.

You can query this table using Athena and join it to from_cloudtrail_readready, using SQL like the following example from the repo:

SELECT 
t.useridentity_arn 
,t.eventtime 
,t.eventsource 
,t.eventname 
,b.request_time 
,b.modelid 
,regexp_extract(b.input_messages, '^(.*)({"input":{.*"type":"tool_use"})(.*)$', 2) as input_message_with_tool_use
,b.input_messages
,b.input_inputtokencount
,b.output_outputbodyjson_content
,b.output_outputtokencount
FROM loglakeblog.from_cloudtrail_readready t
left outer join loglakeblog.from_bedrock_readready b 
on t.requestid = b.requestid 
where t.logcalendarday>20240601

Use an agent to review an agent

The predefined query we used in our demo is what we used when we knew the needle in the haystack (tool_use in input messages), but this approach wouldn’t work for new, unknown patterns that require running SQL queries in multiple steps to understand complex data.

Our solution includes a method for an agent in Amazon Bedrock to review an agent in Amazon Bedrock. In this post’s repository, we include a Log Lake Looker Lambda function, which uses an LLM (Anthropic’s Claude) to talk to a database (the Log Lake AWS Glue database).

This pattern is not new. It has been described in 2024 in the paper DB-GPT: Empowering Database Interactions with Private Large Language Models as “a paradigm shift in database interactions, offering a more natural, efficient, and secure way to engage with data repositories.” This is an extension of an older idea from 1998: an interface to data was described in the Distributed Computing Manifesto as “the client is no longer dependent on the underlying data structure or even where the data is located.”

Using an agent to query Log Lake has multiple benefits:

  • An engineered agent can deliver consistent, reliable, high-quality answers during stressful situations, such as a time-sensitive incident response or high-visibility investigation
  • Users don’t have to write their own queries and can reduce their cognitive load (“What was that long column name?”)
  • It can reduce onboarding and training time (the agent implements the training and specialized knowledge of the data structures)

You can ask Log Lake Looker an open-ended question and get an answer without writing a query. Log Lake Looker performs the following actions for you:

  1. Create a valid SQL query from a natural language user prompt. Log Lake Looker is optimized for the from_bedrock_readready table using a system prompt, like the Anthropic SQL sorcerer example.
  2. Run the query in Athena using a custom tool.
  3. Review tool results (rows) and replies with a simple summary.
    When using input and output that can be verbose, like query results, you might need to manage tokens in your context window. For example, if the sum of input and output tokens exceeds the model’s context window, newer Claude models return a validation error, such as the following error we saw during testing:

    Unexpected ClientError: err=ValidationException('An error occurred (ValidationException) when calling the InvokeModel operation: Input is too long for requested model.') type(err)= error_code='ValidationException' error_message='Input is too long for requested model.'

  4. Compact context by removing tool results. This improves time to answer performance, quality of answer, and reduces proliferation of potentially sensitive data to model invocation logs.
  5. Either run a follow-up query or suggest next steps for the human user.

Log Lake Looker looks at small samples from from_bedrock_readready using more than one try. This means the model reflects on its output and can create a follow-up query based on query results. To learn more about this, we recommend reading about reflection and iterative refinement. We have seen useful responses from agents using iterative approaches, especially when context is managed (for example, a specific system prompt using one table only or a limit on conversational turns) and tool results are compacted.

We’ve seen the agent answer simple questions like “can you query my table and tell me what you find?” in less than 60 seconds more than 50% of the time, without optimizing for any specific question. The following are snippets of CloudWatch logs to show you what’s possible, using Anthropic’s Claude Sonnet 4.5:

2025-12-02 06:05:47 lambda_function lambda_handler INFO Event received: {
"prompt_from_user": "Can you query my bedrock logs and tell me what you find?"
}
…
2025-12-02 06:06:20 lambda_function lambda_handler INFO     final_response after all loops: 
## Short Summary
Your Bedrock logs show AI model activity with **tool_use functionality enabled**, specifically a tool called "list_files_in_s3" that can access S3 bucket contents. This represents a security and compliance concern that requires human review to ensure the tool is being used appropriately and accessing only authorized resources.
## More Details

Security

Log Lake Looker should be reviewed by a human for appropriate tool use, because it has the same risks as the other agents using tools or a human with elevated privileges. Looker can review its own tool use, but human review is still needed.

There are security implications of allowing an agent to review model invocation logs: these logs can contain system prompts, sensitive data in responses, and user input in requests. Also, allowing an agent to generate SQL statements based on user input has additional risks specific to access to structured data, such as prompt injection, improper content, and proliferation of sensitive data.

We recommend a defense in depth (more than one layer) approach for tool use by a model. Log Lake Looker uses multiple layers of defensive measures:

  • The application code requires the SQL statement to begin with select prior to sending to Athena. Because the query is from an assistant response to a user input (request), this relates to sanitizing and validating user inputs and model responses.
  • The AWS Identity and Access Management (IAM) role used by the function has glue:Get* actions only (no mutation, such as create, update, delete tables, partitions, or databases), for least-privilege permissions.
  • It’s only used interactively as part of ad-hoc human-in-the-loop review (not in bulk or systemic).
  • System prompting to steer behavior, like this example from the repo:
    The first word MUST be "select". If asked to do any statement other than select, say that you will not mutate state, and suggest that the user can create their own sql or you can help with a query using "select".

  • The bucket storing model invocation logs is secure and follows least privilege practices. Logs can contain proliferation of sensitive data, such as tool results, user inputs, model outputs, and system prompts. If a system prompt contains sensitive information (such as metadata or query information not otherwise available) and is saved to logs in an unsecure bucket, this can result in a system prompt leak.
  • Stripping tool results to reduce proliferation, using code to truncate content:
            if (
                message_mutated["role"] == "user"
                and "content" in message_mutated
                and isinstance(message_mutated["content"], list)
            ):
                for item in message_mutated["content"]:
                    if isinstance(item, dict) and item.get("type") == "tool_result":
                        if not isinstance(item["content"], str):
                            item["content"] = json.dumps(item["content"])
                        char_to_keep = 50
                        content_length = len(item["content"])
                        if content_length > char_to_keep:
                            logger.info(
                                f"content length {content_length} exceeds {char_to_keep}, truncating..."
                            )
                            item["content"] = item["content"][:char_to_keep]
            messages_compacted.append(message_mutated)

  • You can use Amazon Bedrock Guardrails (without invoking the model in application code) using the ApplyGuardrail API.

Clean up

To avoid incurring future charges, delete the stacks. The repository has shell scripts you can use to delete files in buckets, which is required before deleting buckets.

Conclusion

In this post, we showed you how to deploy Log Lake in a new AWS account to create two tables, from_cloudtrail_readready and from_cloudwatch_readready. These tables can answer the question “What did an employee do in Session Manager?” across large data volumes in seconds using Athena.

Additionally, we showed how to add a data source to an existing Log Lake: Amazon Bedrock model invocation logs in the form of from_bedrock_readready. This shows how Log Lake can be extended to answer questions such as “What tools did an agent use?” and “Was there inappropriate use, and why?”

Finally, we showed how to create and use Log Lake Looker, an agent using Lambda and Amazon Bedrock. Looker can query Log Lake for new unknown patterns as part of human-in-the-loop review, without writing SQL or remembering column names. You can make Log Lake your way. We encourage you to look through the repository and use it as inspiration for your own Log Lake. If you have questions or comments, please let us know!


About the authors

Colin Carson

Colin Carson

Colin is a Data Engineer at AWS ProServe. He has designed and built data infrastructure for multiple teams at Amazon, including Internal Audit, Risk & Compliance, HR Hiring Science, and Security.

Sean O’Sullivan

Sean O’Sullivan

Sean is a Cloud Infrastructure Architect at AWS ProServe. He partners with Global Financial Services customers to drive digital transformation projects, helping them architect, automate, and engineer solutions in AWS.

Create a customizable cross-company log lake for compliance, Part I: Business Background

Post Syndicated from Colin Carson original https://aws.amazon.com/blogs/big-data/create-a-customizable-cross-company-log-lake-for-compliance-part-i-business-background/

As described in a previous postAWS Session Manager, a capability of AWS Systems Manager, can be used to manage access to Amazon Elastic Compute Cloud (Amazon EC2) instances by administrators who need elevated permissions for setup, troubleshooting, or emergency changes. While working for a large global organization with thousands of accounts, we were asked to answer a specific business question: “What did employees with privileged access do in Session Manager?”

This question had an initial answer: use logging and auditing capabilities of Session Manager and integration with other AWS services, including recording connections (StartSession API calls) with AWS CloudTrail, and recording commands (keystrokes) by streaming session data to Amazon CloudWatch Logs.

This was helpful, but only the beginning. We had more requirements and questions:

  • After session activity is logged to CloudWatch Logs, then what?
  • How can we provide useful data structures that minimize work to read out, delivering faster performance, using more data, with more convenience?
  • How do we support a variety of usage patterns, such as ongoing system-to-system bulk transfer, or an ad-hoc query by a human for a single session?
  • How should we share and implement governance?
  • Thinking bigger, what about the same question for a different service or across more than one use case? How do we add what other API activity happened before or after a connection—in other words, context?

We needed more comprehensive functionality, more customization, and more control than a single service or feature could offer. Our journey began where previous customer stories about using Session Manager for privileged access (similar to our situation), least privilege, and guardrails ended. We had to create something new that combined existing approaches and ideas:

  • Low-level primitives such as Amazon Simple Storage Service (Amazon S3).
  • Latest features and approaches of AWS, such as vertical and horizontal scaling in AWS Glue.
  • Our experience working with legal, audit, and compliance in large enterprise environments.
  • Customer feedback.

In this post, we introduce Log Lake, a do-it-yourself data lake based on logs from CloudWatch and AWS CloudTrail. We share our story in three parts:

  • Part 1: Business background – We share why we created Log Lake and AWS alternatives that might be faster or easier for you.
  • Part 2: Build – We describe the architecture and how to set it up using AWS CloudFormation templates.
  • Part 3: Add – We show you how to add invocation logs, model input, and model output from Amazon Bedrock to Log Lake.

Do you really want to do it yourself?

Before you build your own log lake, consider the latest, highest-level options already available in AWS–they can save you a lot of work. Whenever possible, choose AWS services and approaches that abstract away undifferentiated heavy lifting to AWS so you can spend time on adding new business value instead of managing overhead. Know the use cases services were designed for, so you have a sense of what they already can do today and where they’re going tomorrow.

If that doesn’t work, and you don’t see an option that delivers the customer experience you want, then you can mix and match primitives in AWS for more flexibility and freedom, as we did for Log Lake.

Session Manager activity logging

As we mentioned in our introduction, you can save logging data to AmazonS3add a table on top, and query that table using Amazon Athena—this is what we recommend you consider first because it’s straightforward.

This would result in files with the sessionid in the name. If you want, you can process these files into a calendarday, sessionid, sessiondata format using an S3 event notification that invokes a function (and make sure to save it to a different bucket, in a different table, to avoid causing recursive loops). The function could derive the calendarday and sessionid from the S3 key metadata, and sessiondata would be the entire file contents.

Alternatively, you can sign to one log group in CloudWatch logs, have an Amazon Data Firehose subscription filter move that to S3 (this file would have additional metadata in the JSON content and more customization potential from filters). This was used in our situation, but it wasn’t enough by itself.

AWS CloudTrail Lake

CloudTrail Lake is for running queries on events over years of history and with near real-time latency and offers a deeper and more customizable view of events than CloudTrail Event history. CloudTrail Lake enables you to federate an event data store, which lets you view the metadata in the AWS Glue catalog and run Athena queries. For needs involving one organization and ongoing ingesting from a trail (or point-in-time import from Amazon S3, or both), you can consider CloudTrail Lake.

We considered CloudTrail Lake, as either a managed lake option or source for CloudTrail only, but ended up creating our own AWS Glue job instead. This was because of a combination of reasons, including full control over schema and jobs, ability to ingest data from an S3 bucket of our choosing as an ongoing source, fine-grained filtering on account, AWS Region, and eventName (eventName filtering wasn’t supported for management events ), and cost.

The cost of CloudTrail lake based on uncompressed data ingested (data size can be 10 times larger than in Amazon S3) was a factor for our use case. In one test, we found CloudTrail Lake to be 38 times faster to process the same workload as Log Lake, but Log Lake was 10–100 times less costly depending on filters, timing, and account activity. Our test workload was 15.9 GB file size in S3, 199 million events, and 400 thousand files, spread across over 150 accounts and 3 Regions. Filters Log Lake applied were eventname='StartSession', 'AssumeRole', 'AssumeRoleWithSAML', and five arbitrary allow listed accounts. These tests might be different from your use case, so you should do your own testing, gather your own data, and decide for yourself.

Other services

The products mentioned previously are the most relevant to the outcomes we were trying to accomplish, but you should consider security, identity, and compliance products on AWS, too. These products and features can be used either as an alternative to Log Lake or to add functionality.

As an example, Amazon Bedrock can add functionality in three ways:

  • To skip the search and query Log Lake for you
  • To summarize across logs
  • As a source for logs (similar to Session Manager as a source for CloudWatch logs)

Querying means you can have an AI agent query your AWS Glue catalog (such as the Log Lake catalog) for data-based results. Summarizing means you can use generative artificial intelligence (AI) to summarize your text logs from a knowledge base as part of retrieval augmented generation (RAG), to ask questions like “How many log files are exactly the same? Who changed IAM roles last night?” Considerations and limitations apply.

Adding Amazon Bedrock as a source means using invocation logging to collect requests and responses.

Because we wanted to store very large amounts of data frugally (compressed and columnar format, not text) and produce non-generative (data-based) results that can be used for legal compliance and security, we didn’t use Amazon Bedrock in Log Lake—but we will revisit this topic in Part 3 when we detail how to use the approach we used for Session Manager for Amazon Bedrock.

Business background

When we began talking with our business partners, sponsors, and other stakeholders, important questions, problems, opportunities, and requirements emerged.

Why we needed to do this

Legal, security, identity, and compliance authorities of the large enterprise we were working for had created a customer-specific control. To comply with the control objective, use of elevated privileges required a manager to manually review all available data (including any session manager activity) to confirm or deny if use of elevated privileges was justified. This was a compliance use case that, when solved, could be applied to more use cases such as auditing and reporting.

Note on terms:

  • Here, the customer in customer-specific control means a control that is solely the responsibility of a customer, not AWS, as described in the AWS Shared Responsibility Model.
  • In this article, we define auditing broadly as testing information technology (IT) controls to mitigate risk, by anyone, at any cadence (ongoing as part of day-to-day operations, or one time only). We don’t refer to auditing that is financial, only conducted by an independent third-party, or only at certain times. We use self-review and auditing interchangeably.
  • We also define reporting broadly as presenting data for a specific purpose in a specific format to evaluate business performance and facilitate data-driven decisions—such as answering “how many employees had sessions last week?”

The use case

Our first and most important use case was a manager who needed to review activity, such as from an after-hours on-call page the previous night. If the manager needed to have additional discussions with their employee or needed additional time to consider activity, they had up to a week (7 calendar days) before they needed to confirm or deny elevated privileges were needed, based on their team’s procedures. A manager needed to review an entire set of events that all share the same session, regardless of known keywords or specific strings, as part of all available data in AWS. This was the workflow:

  1. Employee uses homegrown application and standardized workflow to access Amazon EC2 with elevated privileges using Session Manager.
  2. API activity in CloudTrail and continuous logging to CloudWatch logs.
  3. The problem space – Data somehow gets procured, processed, and provided (this would become Log Lake later).
  4. Another homegrown system (different from step 1) presents session activity to managers and applies access controls (a manager should only review activity for their own employees, and not be able to peruse data outside their team). This data might be only one StartSession API call and no session details, or might be thousands of lines from cat file
  5. The manager reviews all available activity, makes an informed decision, and confirms or denies if use was justified.

This was an ongoing day-to-day operation, with a narrow scope. First, this meant only data available in AWS; if something couldn’t be captured by AWS, it was out of scope. If something was possible, it should be made available. Second, this meant only certain workflows; using Session Manager with elevated privileges for a specific, documented standard operating procedure.

Avoiding review

The simplest solution would be to block sessions on Amazon EC2 with elevated privileges, and fully automate build and deployment. This was possible for some but not all workloads, because some workloads required initial setup, troubleshooting, or emergency changes of Marketplace AMIs.

Is accurate logging and auditing possible?

We won’t extensively detail ways to bypass controls here, but there are important limitations and considerations we had to consider, and we recommend you do too.

First, logging isn’t available for sessionType Port, which includes SSH. This could be mitigated by ensuring employees can only use a custom application layer to start sessions without SSH. Blocking direct SSH access to EC2 instances using security group policies is another option.

Second, there are many ways to intentionally or accidentally hide or obfuscate activity in a session, making review of a specific command difficult or impossible. This was acceptable for our use case for multiple reasons:

  • A manager would always know if a session started and needed review from CloudTrail (our source signal). We joined to CloudWatch to meet our all available data requirement.
  • Continuous streaming to CloudWatch logs would log activity as it happened. Additionally, streaming to CloudWatch Logs supported interactive shell access, and our use case only used interactive shell access (sessionType Standard_Stream). Streaming isn’t supported for sessionType, InteractiveCommands, or NonInteractiveCommands.
  • The most important workflow to review involved an engineered application with one standard operating procedure (less variety than all the ways Session Manager could be used).
  • Most importantly, the manager was responsible for reviewing the reports and expected to apply their own judgement and interpret what happened. For example, a manager review could result in a follow up conversation with the employee that could improve business processes. A manager might ask their employee, “Can you help me understand why you ran this command? Do we need to update our runbook or automate something in deployment?”

To protect data against tampering, changes, or deletion, AWS provides tools and features such as AWS Identity and Access Management (IAM) policies and permissions and Amazon S3 Object Lock.

Security and compliance are a shared responsibility between AWS and the customer, and customers need to decide what AWS services and features to use for their use case. We recommend customers consider a comprehensive approach that considers overall system design and includes multiple layers of security controls (defense in depth). For more information, see the Security pillar of the AWS Well-Architected Framework.

Avoiding automation

Manual review can be a painful process, but we couldn’t automate review for two reasons: Legal requirements and to add friction to the feedback loop felt by a manager whenever an employee used elevated privileges, to discourage using elevated privileges.

Works with existing

We had to work with existing architecture, spanning thousands of accounts and multiple AWS Organizations. This meant sourcing data from buckets as an edge and point of ingress. Specifically, CloudTrail data was managed and consolidated outside of CloudTrail, across organizations and trails, into S3 buckets. CloudWatch data was also consolidated to S3 buckets, from Session Manager to CloudWatch Logs, with Amazon Data Firehose subscription filters on CloudWatch Logs pointing to S3. To avoid negative side effects on existing business processes, our business partners didn’t want to change settings in CloudTrail, CloudWatch, and Firehose. This meant Log Lake needed features and flexibility that enabled changes without impacting other workstreams using the same sources.

Event filtering is not a data lake

Before we were asked to help, there were attempts to do event filtering. One attempt tried to monitor session activity using Amazon EventBridge. This was limited to AWS API operations recorded by CloudTrail such as StartSession and didn’t include the information from inside the session, which was in CloudWatch Logs. Another attempt tried event filtering CloudWatch in the form of a subscription filter. Also, an attempt was made using EventBridge Event Bus with EventBridge rules, and storage in Amazon DynamoDB. These attempts didn’t deliver the expected results because of a combination of factors:

Size

Couldn’t accept large session log payloads because of the EventBridge PutEvents limit of 256 KB entry size. Saving large entries to Amazon S3 and using the object URL in the PutEvents entry would avoid this limitation in EventBridge, but wouldn’t pass the most important information the manager needed to review (the event’s sessionData element). This meant managing files and physical dependencies, and losing the metastore benefit of working with data as logical sets and objects.

Storage

Event filtering was a way to process data, not storage or a source of truth. We asked, how do we restore data lost in flight or destroyed after landing? If components are deleted or undergoing maintenance, can we still procure, process, and provide data—at all three layers independently? Without storage, no.

Data quality

No source of truth meant data quality checks weren’t possible.  We couldn’t answer questions like: “Did the last job process more than 90 percent of events from CloudTrail in DynamoDB?” or“What percentage are we missing from source to target?”

Anti-patterns

DynamoDB as long-term storage wasn’t the most appropriate data store for large analytical workloads, low I/O, and highly complex many-to-many joins.

Reading out

Deliveries were fast, but work (and time and cost) was needed after delivery. In other words, queries had to do extra work to transform raw data into the needed format at time of read, which had a significant, cumulative effect on performance and cost. Imagine users running a select * from table without any filters on years of data and paying for storage and compute of those queries.

Cost of ownership

Filtering by event contents (sessionData from CloudWatch) required knowledge of session behavior, which was business logic. This meant changes to business logic required changes to event filtering. Imagine being asked to change CloudWatch filters or EventBridge rules based on a business process change, and trying to remember where to make the change, or troubleshoot why expected events weren’t being passed. This meant a higher cost of ownership and slower cycle times at best, and inability to meet SLA and scale at worst.

Accidental coupling

Creates accidental coupling between downstream consumers and low-level events. Consumers who directly integrate against events might get different schemas at different times for the same events, or events they don’t need. There’s no way to manage data at a higher level than event, at the level of sets (like all events for one sessionid), or at the object level (a table designed for dependencies). In other words, there was no metastore layer that separated the schema from the files, like in a data lake.

More sources (data to load in)

There were other, less important use cases that we wanted to expand to later: inventory management and security.

For inventory management, such as identifying EC2 instances running a Systems Manager agent that’s missing a patch, finding IAM users with inline policies, or finding Redshift clusters with nodes that aren’t RA3. This data would come from AWS Config unless it isn’t a supported resource type. We cut inventory management from scope because AWS Config data could be added to an AWS Glue catalog later, and queried from Athena using an approach like the one described in How to query your AWS resource configuration states using AWS Config and Amazon Athena.

For security, Splunk and OpenSearch were already in use for serviceability and operational analysis, sourcing files from Amazon S3. Log Lake is a complementary approach sourcing from the same data, which adds metadata and simplified data structures at the cost of latency. For more information about having different tools analyze the same data, see Solving big data problems on AWS.

More use cases (reasons to read out)

We knew from the first meeting that this was a bigger opportunity than just building a dataset for sessions from Systems Manager for manual manager review. Once we had procured logs from CloudTrail and CloudWatch, set up Glue jobs to process logs into convenient tables, and were able to join across these tables, we could change filters and configuration settings to answer questions about additional services and use cases, too. Similar to how we process data for Session Manager, we could expand the filters on Log Lake’s Glue jobs, and add data for Amazon Bedrock model invocation logging. For other use cases, we could use Log Lake as a source for automation (rules-based or ML), deep forensic investigations, or string-match searches (such as IP addresses or user names).

Additional technical considerations

*How did we define session? We would always know if a session started from StartSession event in CloudTrail API activity. Regarding when a session ended, we did not use TerminateSession because this was not always present and we considered this domain-specific logic. Log Lake enabled downstream customers to decide how to interpret the data. For example, our most important workflow had a Systems Manager timeout of 15 minutes, and our SLA was 90 minutes. This meant managers knew a session with a start time more than 2 hours prior to the current time was already ended.

*CloudWatch data required additional processing compared to CloudTrail, because CloudWatch logs from Firehose were saved in gzip format without gz suffix and had multiple JSON documents in the same line that needed to be processed to be on separate lines. Firehose can transform and convert records, such as invoking a Lambda function to transform, convert JSON to ORC, and decompress data, but our business partners didn’t want to change existing settings.

How to get the data (a deep dive)

To support the dataset needed for a manager to review, we needed to identify API-specific metadata (time, event source, and event name), and then join it to session data. CloudTrail was necessary because it was the most authoritative source for AWS API activity, specifically StartSession and AssumeRole and AssumeRoleWithSAML events, and contained context that didn’t exist in CloudWatch Logs (such as the error code AccessDenied) which could be useful for compliance and investigation. CloudWatch was necessary because it contained the keystrokes in a session, in the CloudWatch log’s sessionData element. We needed to obtain the AWS source of record from CloudTrail, but we recommend you check with your authorities to confirm you really need to join to CloudTrail. We mention this in case you hear this question “why not derive some sort of earliest eventTime from CloudWatch logs, and skip joining to CloudTrail entirely? That would cut size and complexity by half.”

To join CloudTrail (eventTime, eventname, errorCode, errorMessage, and so on) with CloudWatch (sessionData), we had to do the following:

  1. Get the higher level API data from CloudTrail (time, event source, and event name), as the authoritative source for auditing Session Manager. To get this, we needed to look inside all CloudTrail logs and get only the rows with eventname=‘StartSession’ and eventsource=‘ssm.amazonaws.com’ (events from Systems Manager)—our business partners described this as looking for a needle in a haystack, because this could be only one session event across millions or billions of files. After we obtained this metadata, we needed to extract the sessionid to know what session to join it to, and we chose to extract sessionid from responseelements. Alternatively, we could use useridentity.sessioncontext.sourceidentity if a principal provided it while assuming a role (requires sts:SetSourceIdentity in the role trust policy).

Sample of a single record’s responseelements.sessionid value: "sessionid":"theuser-thefederation-0b7c1cc185ccf51a9"

The actual sessionid was the final element of the logstream: 0b7c1cc185ccf51a9.

  1. Next we needed to get all logs for a single session from CloudWatch. Similarly to CloudTrail, we needed to look inside all CloudWatch logs landing in Amazon S3 from Firehose to identify only the needles that contained "logGroup":"/aws/ssm/sessionlogs". Then, we could get sessionid from logstream or sessionId, and get session activity from the message.sessionData.

Sample of a single record’s logStream element: "sessionId": "theuser-thefederation-0b7c1cc185ccf51a9"

Note: Looking inside the log isn’t always necessary. We did it because we had to work with existing logs Firehose put to Amazon S3, which didn’t have the logstream (and sessionid) in the file name. For example, a file from Firehose might have a name like

cloudwatch-logs-otherlogs-3-2024-03-03-22-22-55-55239a3d-622e-40c0-9615-ad4f5d4381fa

If we were able to use the ability of Session Manager to send to S3 directly, the file name in S3 is the loggroup (theuser-thefederation-0b7c1cc185ccf51a9.dms)and could be used to derive sessionid without looking inside the file.

  1. Downstream of Log Lake, consumers could join on sessionid which was derived in the previous step.

What’s different about Log Lake

If you remember one thing about Log Lake, remember this: Log Lake is a data lake for compliance-related use cases, uses CloudTrail and CloudWatch as data sources, has separate tables for writing (original raw) and reading (read-optimized or readready), and gives you control over all components so you can customize it for yourself.

Here are some of the signature qualities of Log Lake:

Legal, identity, or compliance use cases

This includes deep dive forensic investigation, meaning use cases that are large volume, historical, and analytical. Because Log Lake uses Amazon S3, it can meet regulatory requirements that require write-once-read-many (WORM) storage.

AWS Well-Architected Framework

Log Lake applies real-world, time-tested design principles from the AWS Well-Architected Framework. This includes, but is not limited to:

Operational Excellence also meant knowing service quotas, performing workload testing, and defining and documenting runbook processes. If we hadn’t tried to break something to see where the limit is, then we considered it untested and inappropriate for production use. To test, we would determine the highest single day volume we’d seen in the past year, and then run that same volume in an hour to see if (and how) it would break.

High-Performance, Portable Partition Adding (AddAPart)

Log Lake adds partitions to tables using Lambda functions with SQS, a pattern we call AddAPart. This uses Amazon Simple Query Service (SQS) to decouple triggers (files landing in Amazon S3) from actions (associating that file with metastore partition). Think of this as having four F’s:

This means no AWS Glue crawlers, no alter table or msck repair table to add partitions in Athena, and can be reused across sources and buckets. The management of partitions in Log Lake makes using partition-related features available in AWS Glue, including AWS Glue partition indexes and workload partitioning and bounded execution.

File name filtering uses the same central controls for lower cost of ownership, faster changes, troubleshooting from one location, and emergency levers—this means that if you want to avoid log recursion happening from a specific account, or want to exclude a Region because of regulatory compliance, you can do it in one place, managed by your change control process, before you pay for processing in downstream jobs.

If you want to tell a team, “onboard your data source to our log lake, here are the steps you can use to self-serve,” you can use AddAPart to do that. We describe this in Part 2.

Readready Tables

In Log Lake, data structures offer differentiated value to users, and original raw data isn’t directly exposed to downstream users by default. For each source, Log Lake has a corresponding read-optimized readready table.

Instead of this:

from_cloudtrail_raw

from_cloudwatch_raw

Log Lake exposes only these to users:

from_cloudtrail_readready

from_cloudwatch_readready

In Part 2, we describe these tables in detail. Here are our answers to frequently asked questions about readready tables:

Q: Doesn’t this have an up-front cost to process raw into readready? Why not pass the work (and cost) to downstream users?

A: Yes, and for us the cost of processing partitions of raw into readready happened once and was fixed, and was offset by the variable costs of querying, which was from many company-wide callers (systemic and human), with high frequency, and large volume.

Q: How much better are readready tables in terms of performance, cost, and convenience? How do you achieve these gains? How do you measure “convenience”?

A: In most tests, readready tables are 5–10 times faster to query and more than 2 times smaller in Amazon S3. Log Lake applies more than one technique: omitting columns, partition design, AWS Glue partition indexes, data types (readready tables don’t allow any nested complex data types within a column, such as struct<struct>), columnar storage (ORC), and compression (ZLIB). We measure convenience as the amount of operations required to join on a sessionid; using Log Lake’s readready tables this is 0 (zero).

Q: Do raw and readready use the same files or buckets?

A: No, files and buckets are not shared. This decouples writes from reads, improves both write and read performance, and adds resiliency.

This question is important when designing for large sizes and scaling, because a single job or downstream read alone can span millions of files in Amazon S3. S3 scaling doesn’t happen immediately, so queries against raw or original data involving many tiny JSON files can cause S3 503 errors when it exceeds 5,500 GET/HEAD per second. More than one bucket helps avoid resource saturation. There is another option that we didn’t have when we created Log Lake: S3 Express One Zone. For reliability, we still recommend not putting all your files in one bucket. Also, don’t forget to filter your data.

Customization and control

You can customize and control all components (columns or schema, data types, compression, job logic, job schedule, and so on) because Log Lake is built using AWS primitives—such as Amazon SQS and Amazon S3—for the most comprehensive combination of features with the most freedom to customize. If you want to change something, you can.

From mono to many

Rather than one large, monolithic lake that is tightly coupled to other systems, Log Lake is just one node in a larger network of distributed data products across different data domains—this concept is data mesh. Just like the AWS APIs it is built on, Log Lake abstracts away heavy lifting and enables users to move faster, more efficiently, and not wait for centralized teams to make changes. Log Lake does not try to cover all use cases—instead, Log Lake’s data can be accessed and consumed by domain-specific teams, empowering business experts to self-serve.

When you need more flexibility and freedom

As builders, sometimes you want to dissect a customer experience, find problems, and figure out ways to make it better. That means going a layer down to mix and match primitives together to get more comprehensive features and more customization, flexibility, and freedom.

We built Log Lake for our long-term needs, but it would have been easier in the short-term to save Session Manager logs to Amazon S3 and query them with Athena. If you have considered what already exists in AWS, and you’re sure you need more comprehensive abilities or customization, read on to Part 2: Build, which explains Log Lake’s architecture and how you can set it up.

If you have feedback and questions, let us know in the comments section.

References


About the authors

Colin Carson is a Data Engineer at AWS ProServe. He has designed and built data infrastructure for multiple teams at Amazon, including Internal Audit, Risk & Compliance, HR Hiring Science, and Security.

Sean O’Sullivan is a Cloud Infrastructure Architect at AWS ProServe. He has over 8 years industry experience working with customers to drive digital transformation projects, helping architect, automate, and engineer solutions in AWS.