Cloudflare operates in more than 250 cities in over 100 countries, where we interconnect with over 10,000 network providers in order to provide a broad range of services to millions of customers. The breadth of both our network and our customer base provides us with a unique perspective on Internet resilience, enabling us to observe the impact of Internet disruptions.
While Internet disruptions are never convenient, online interest in the 2022 World Cup in mid-November and the growth in online holiday shopping in many areas during November and December meant that connectivity issues could be particularly disruptive. Having said that, the fourth quarter appeared to be a bit quieter from an Internet disruptions perspective, although Iran and Ukraine continued to be hotspots, as we discuss below.
Government directed
Multi-hour Internet shutdowns are frequently used by authoritarian governments in response to widespread protests as a means of limiting communications among protestors, as well preventing protestors from sharing information and video with the outside world. During the fourth quarter Cuba and Sudan again implemented such shutdowns, while Iran continued the series of “Internet curfews” across mobile networks it started in mid-September, in addition to implementing several other regional Internet shutdowns.
Cuba
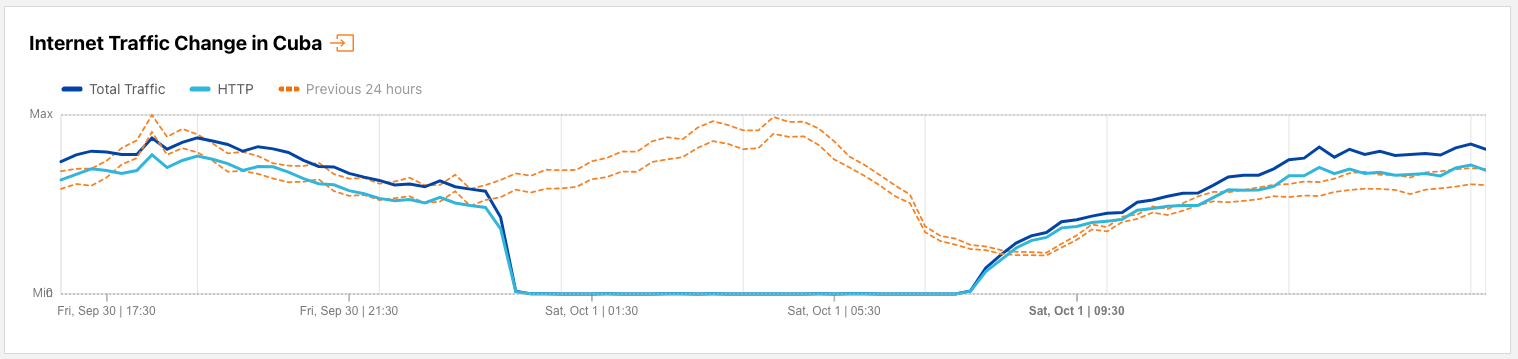
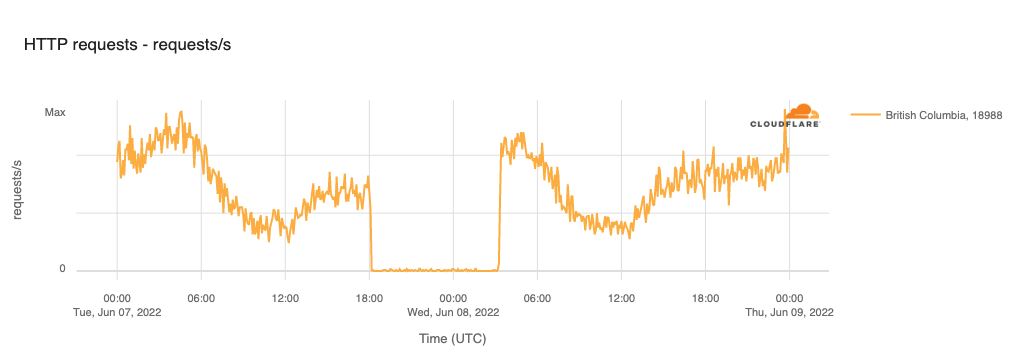
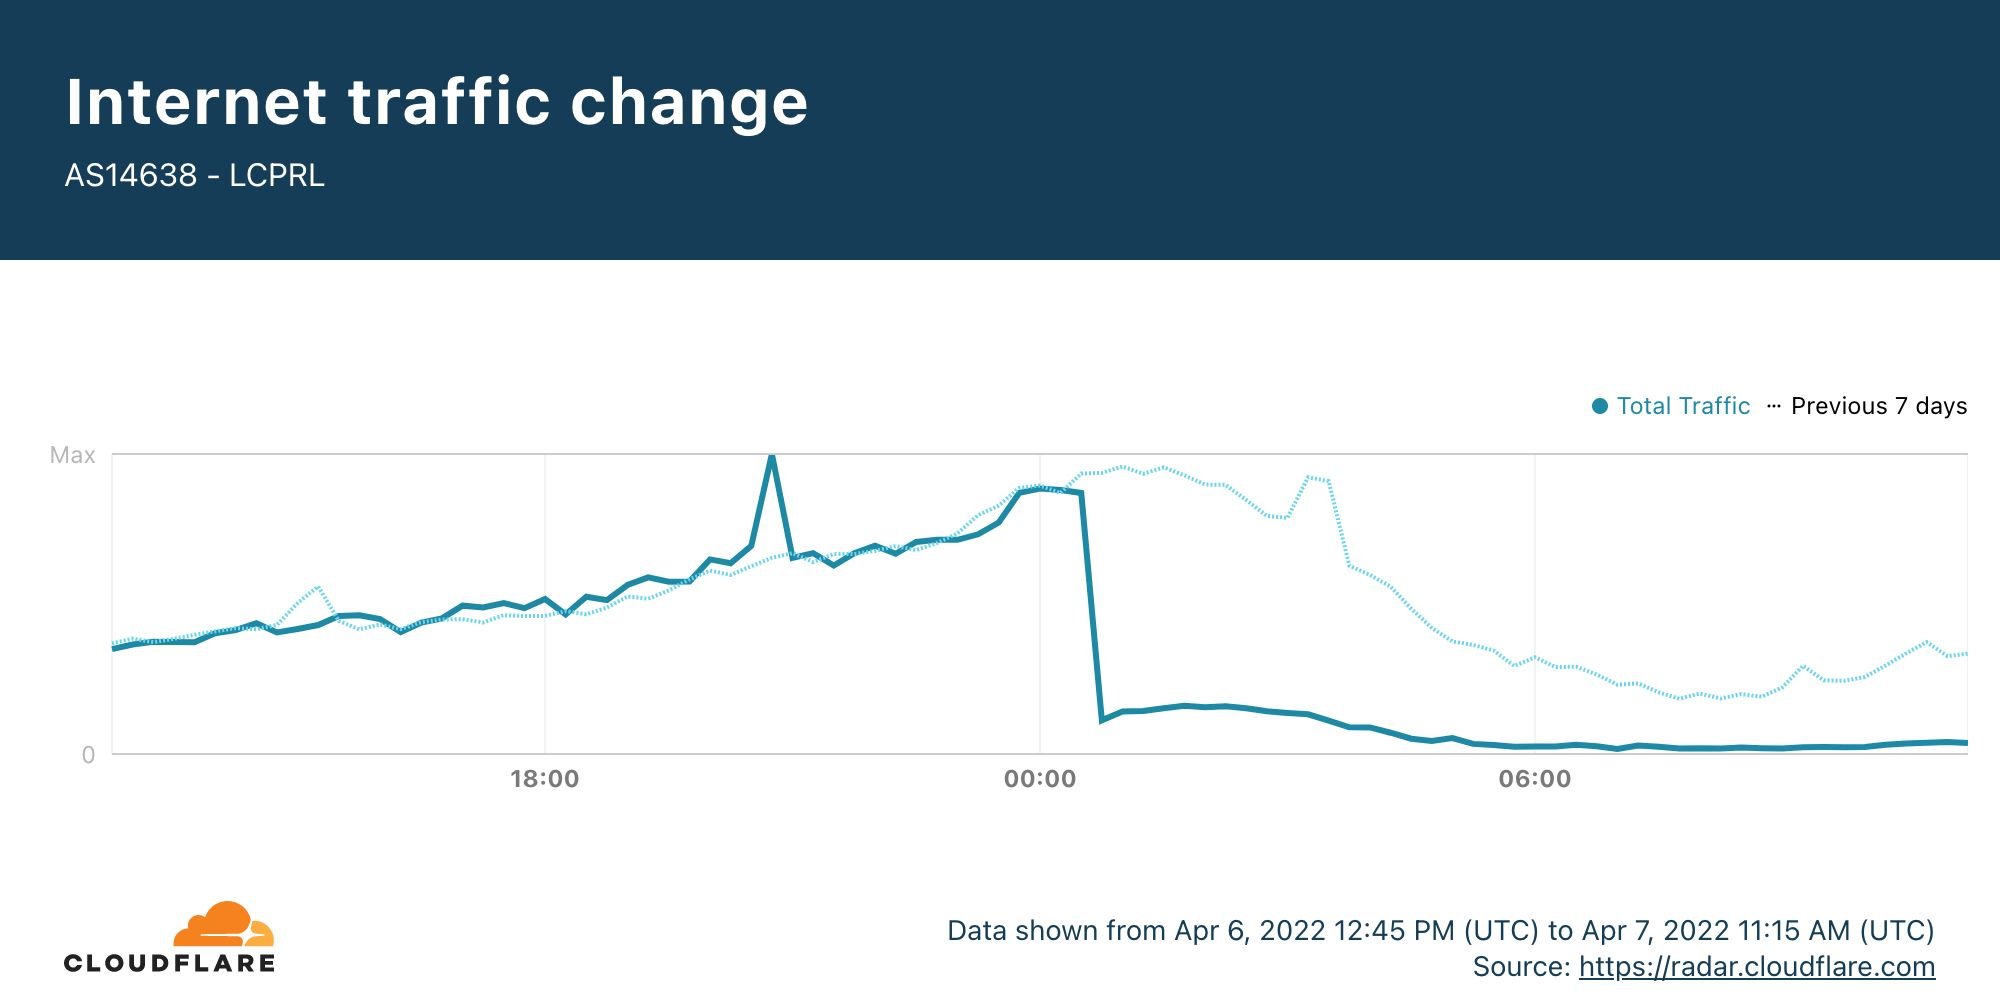
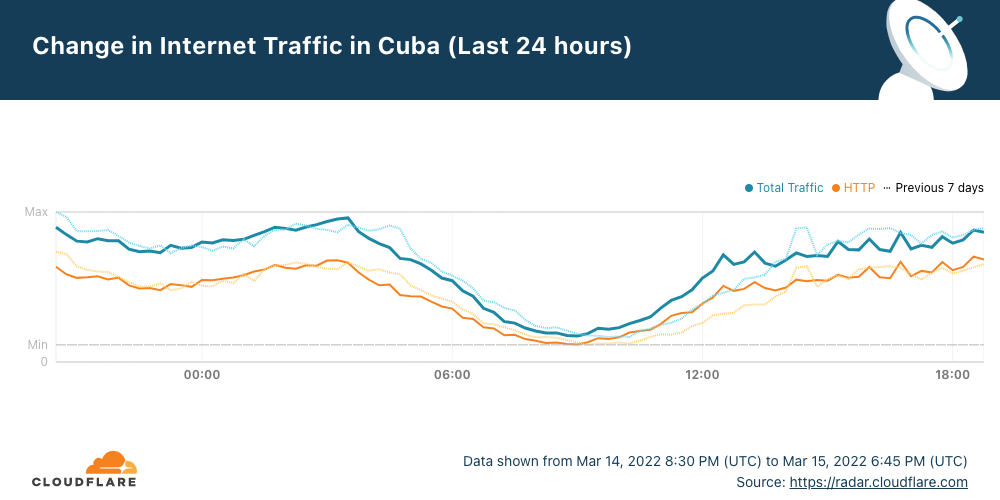
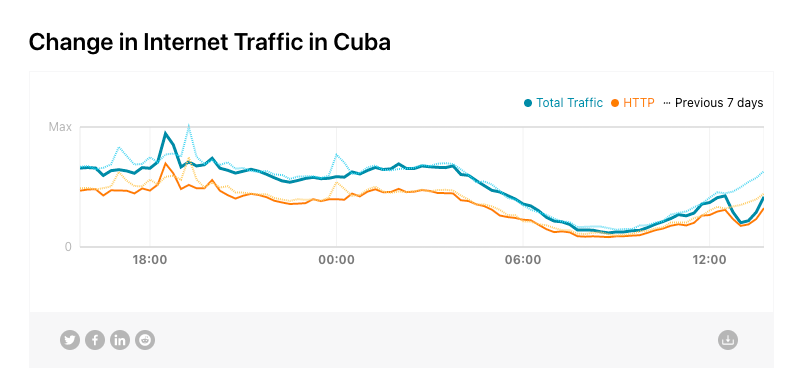
In late September, Hurricane Ian knocked out power across Cuba. While officials worked to restore service as quickly as possible, some citizens responded to perceived delays with protests that were reportedly the largest since anti-government demonstrations over a year earlier. In response to these protests, the Cuban government reportedly cut off Internet access several times. A shutdown on September 29-30 was covered in the Internet disruptions overview for Q3 2022, and the impact of the shutdown that occurred on October 1 (UTC) is shown in the figure below. The timing of this one was similar to the previous one, taking place between 1900 on September 30 and 0245 on October 1 (0000-0745 UTC on October 1).
Sudan
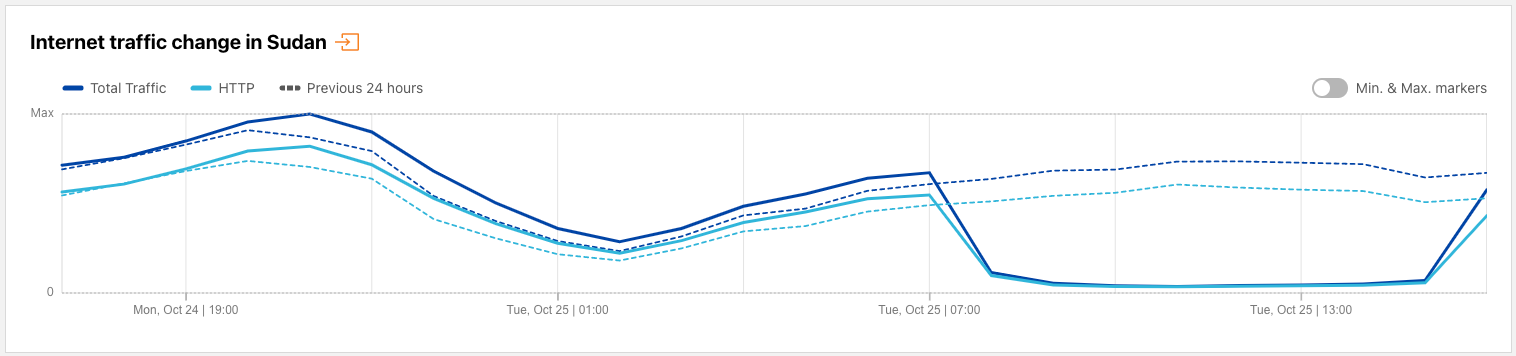
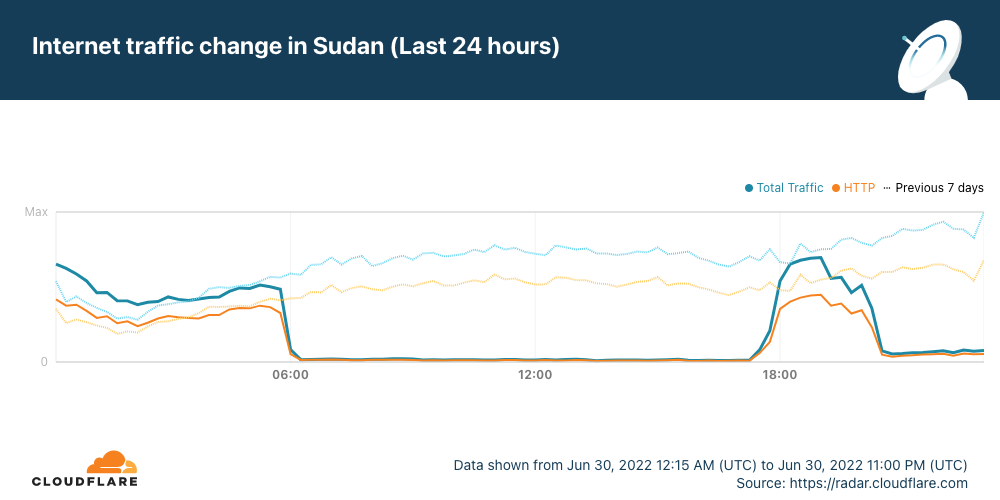
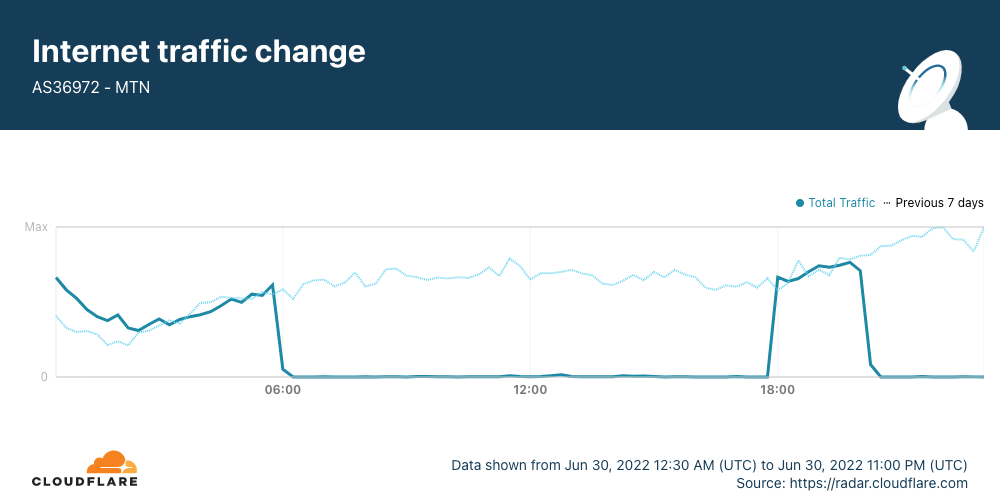
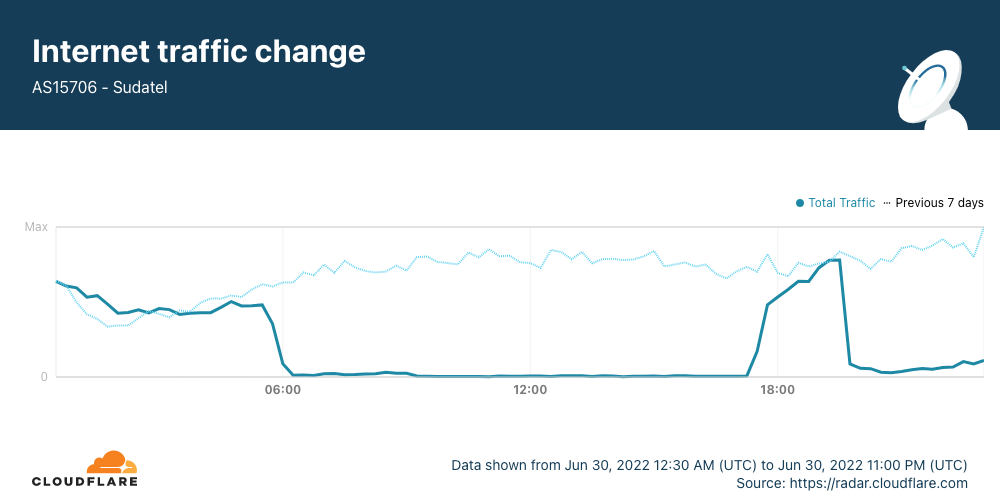
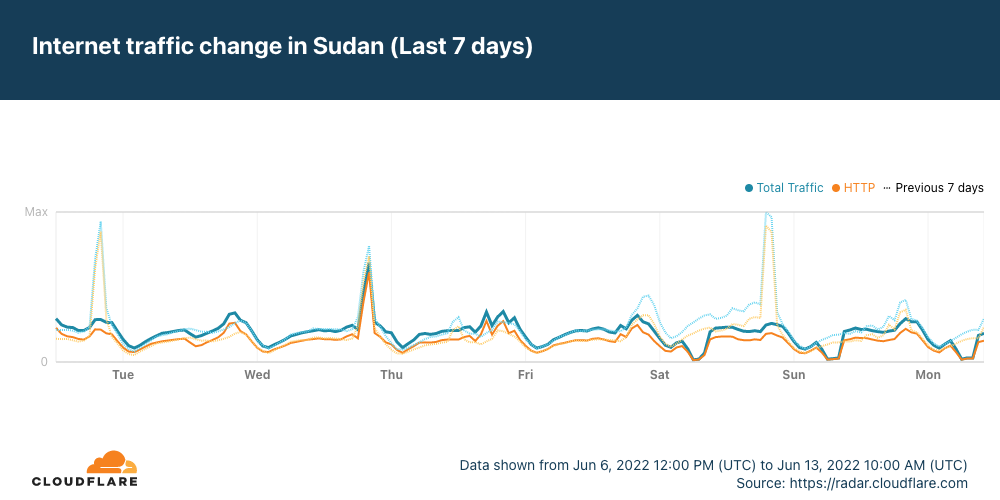
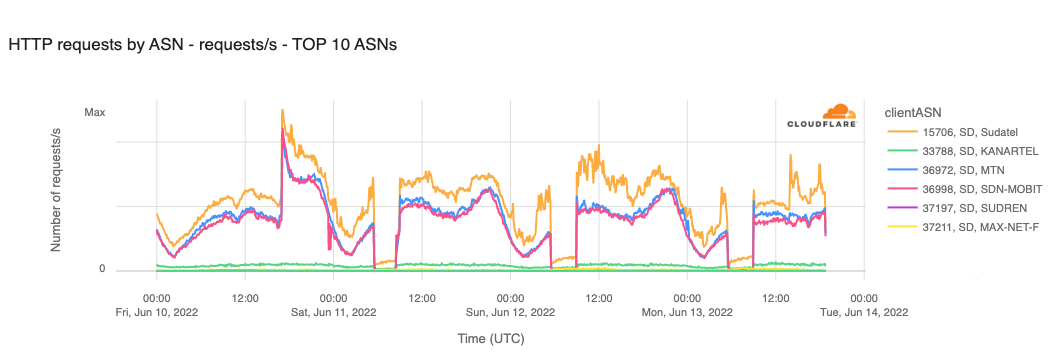
October 25 marked the first anniversary of a coup in Sudan that derailed the country’s transition to civilian rule, and thousands of Sudanese citizens marked the anniversary by taking to the streets in protest. Sudan’s government has a multi-year history of shutting down Internet access during times of civil unrest, and once again implemented an Internet shutdown in response to these protests. The figure below shows a near complete loss of Internet traffic from Sudan on October 25 between 0945-1740 local time (0745 – 1540 UTC).
Iran
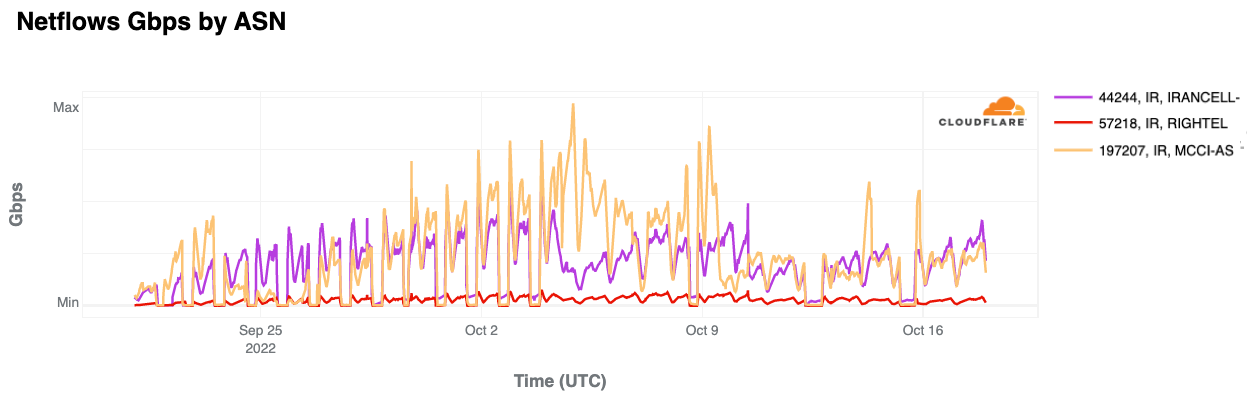
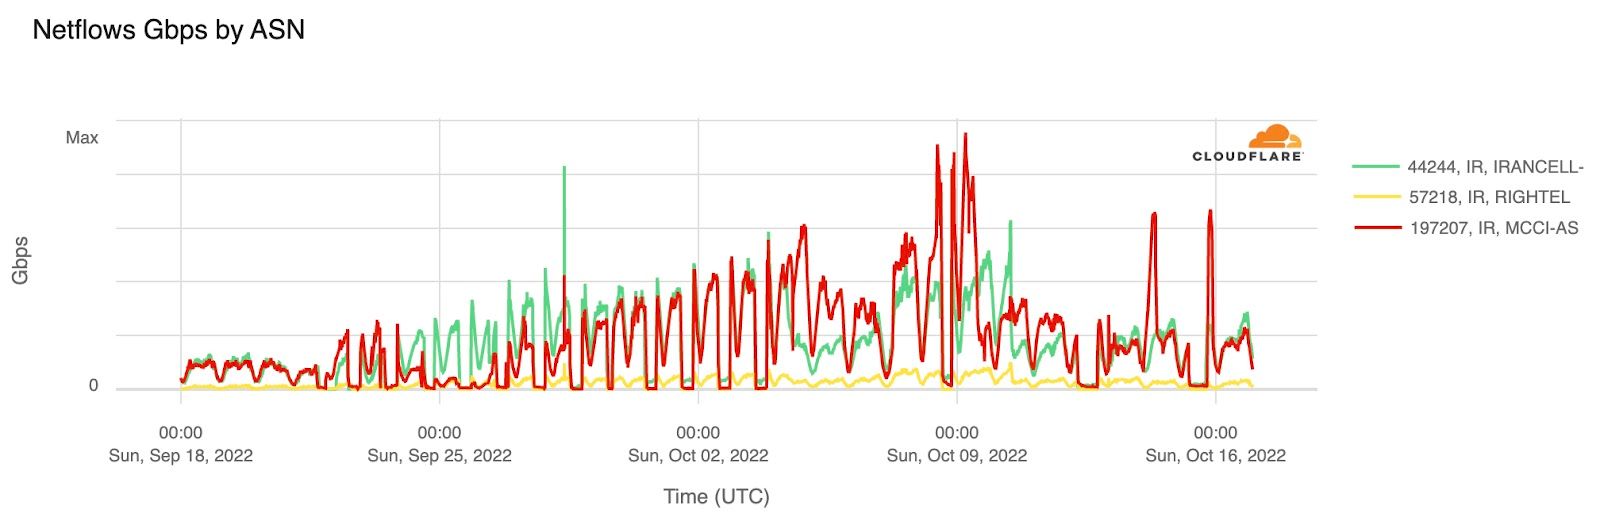
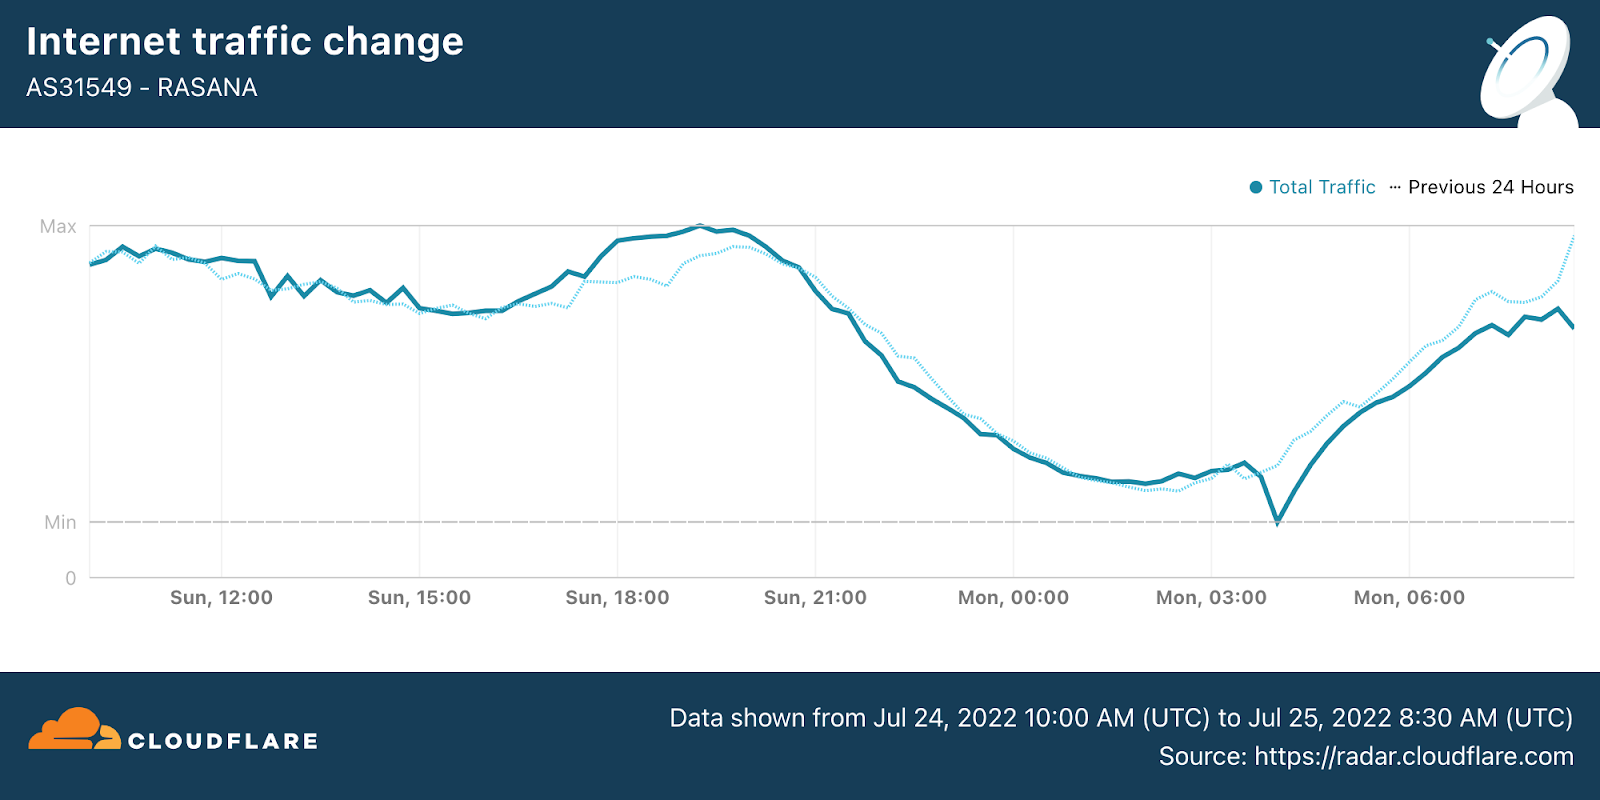
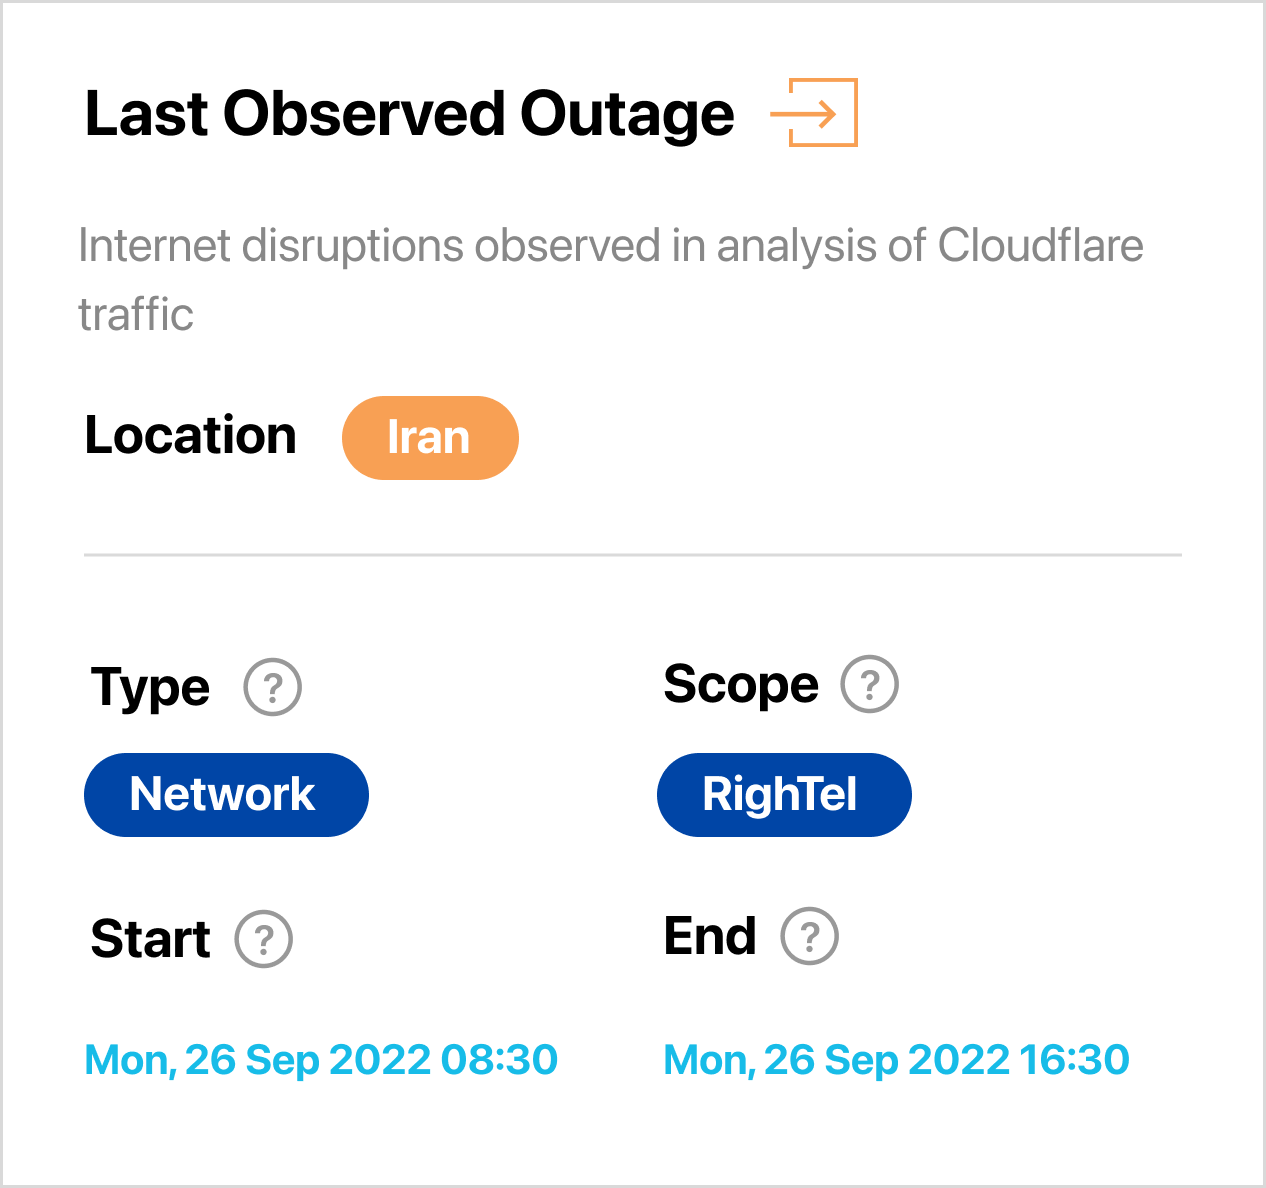
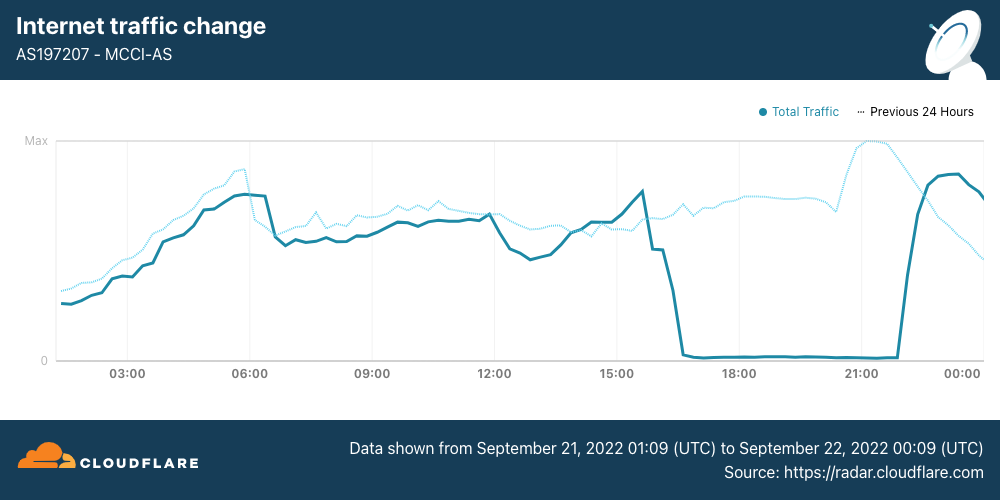
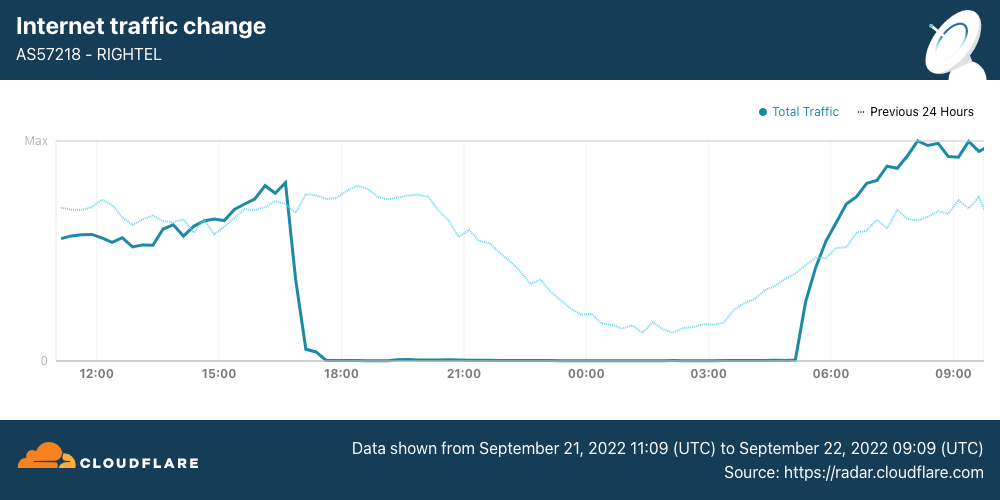
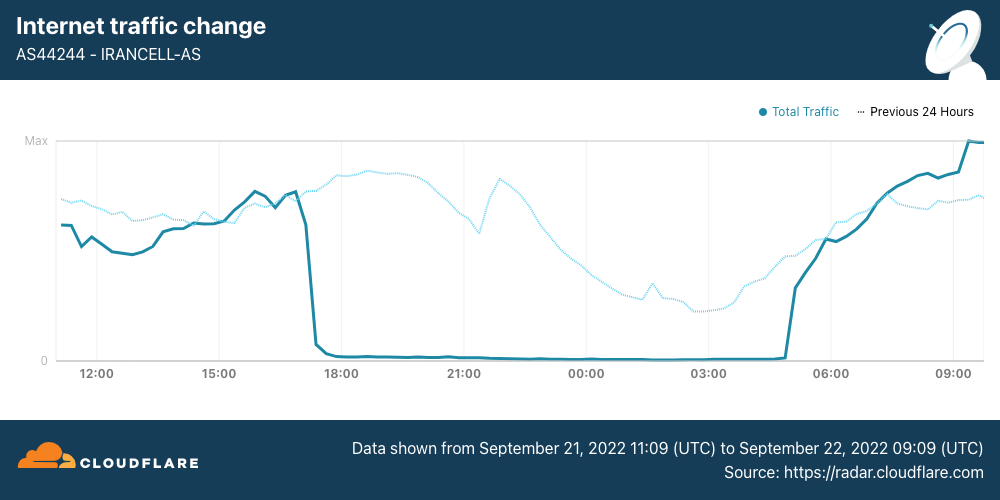
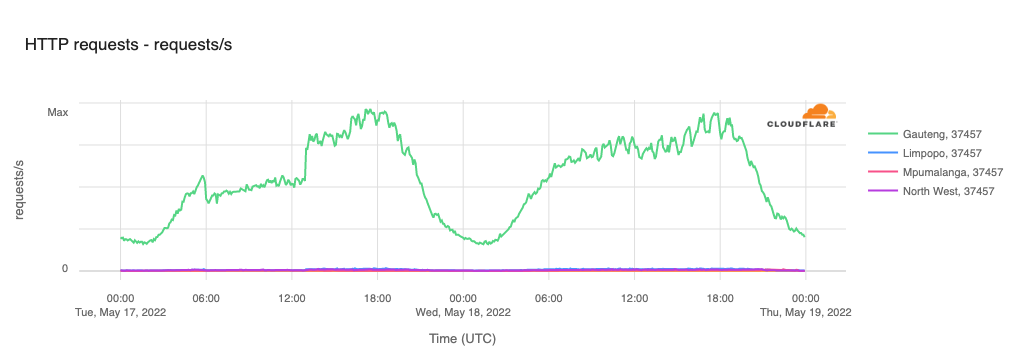
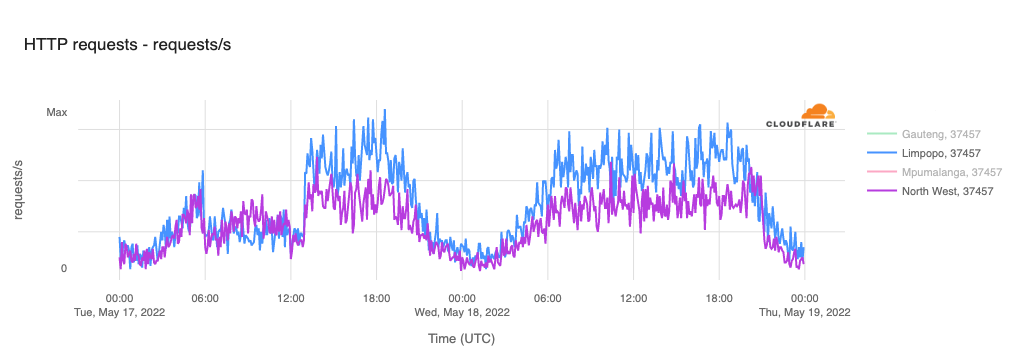
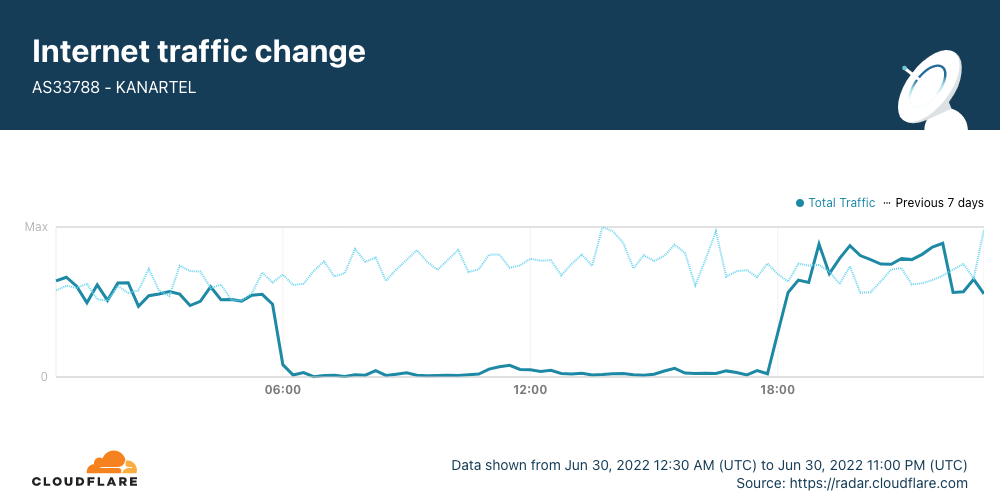
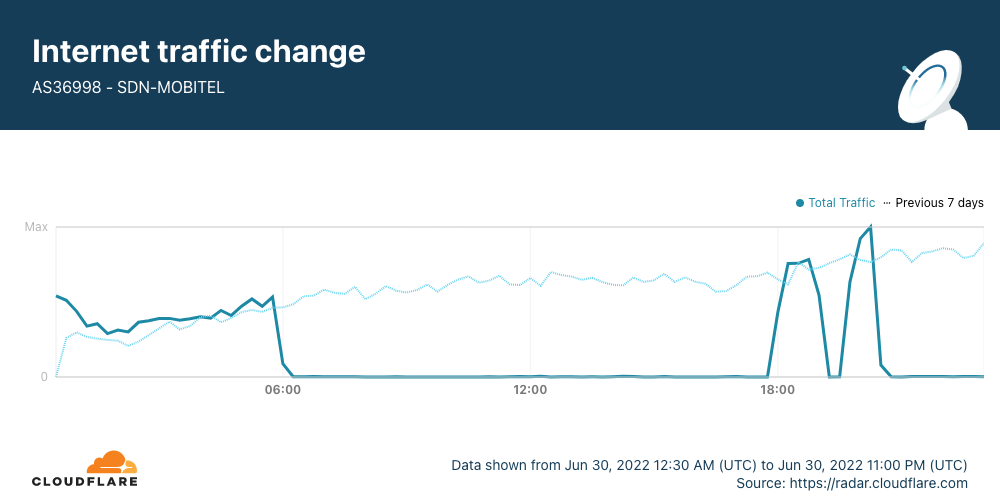
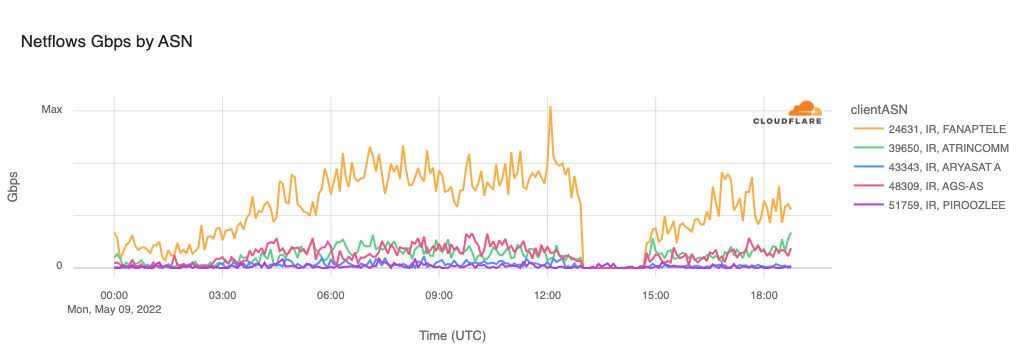
As we covered in last quarter’s blog post, the Iranian government implemented daily Internet “curfews”, generally taking place between 1600 and midnight local time (1230-2030 UTC) across three mobile network providers — AS44244 (Irancell), AS57218 (RighTel), and AS197207 (MCCI) — in response to protests surrounding the death of Mahsa Amini. These multi-hour Internet curfew shutdowns continued into early October, with additional similar outages also observed on October 8, 12 and 15 as seen in the figure below. (The graph’s line for AS57218 (Rightel), the smallest of the three mobile providers, suggests that the shutdowns on this network were not implemented after the end of September.)
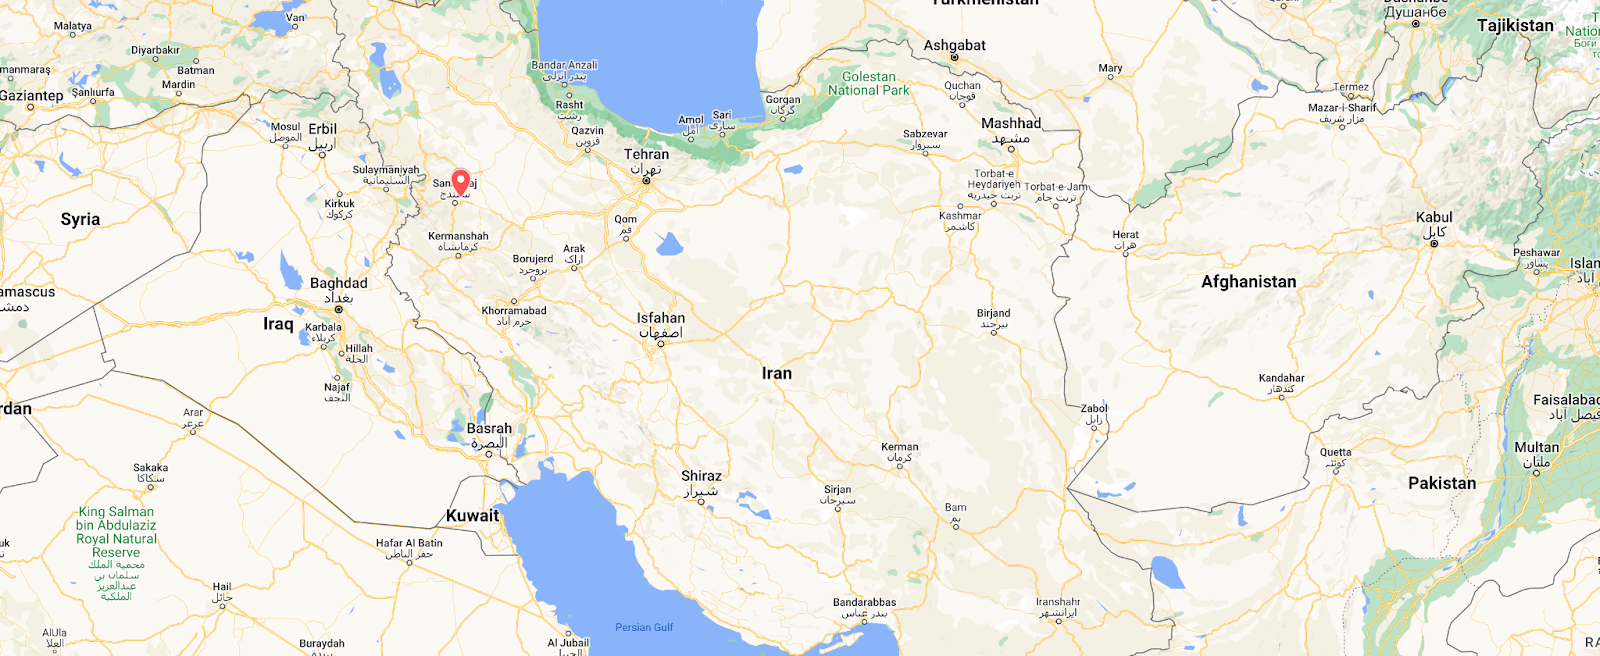
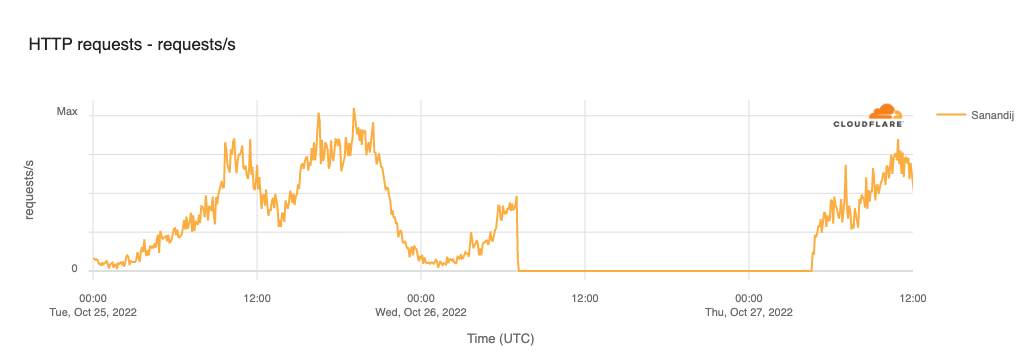
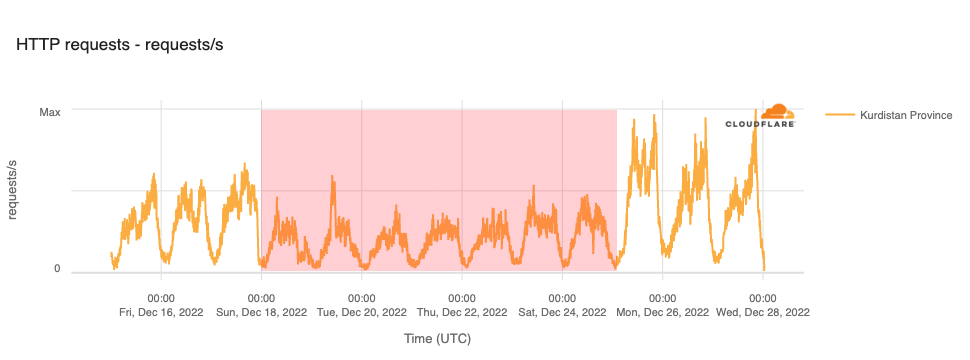
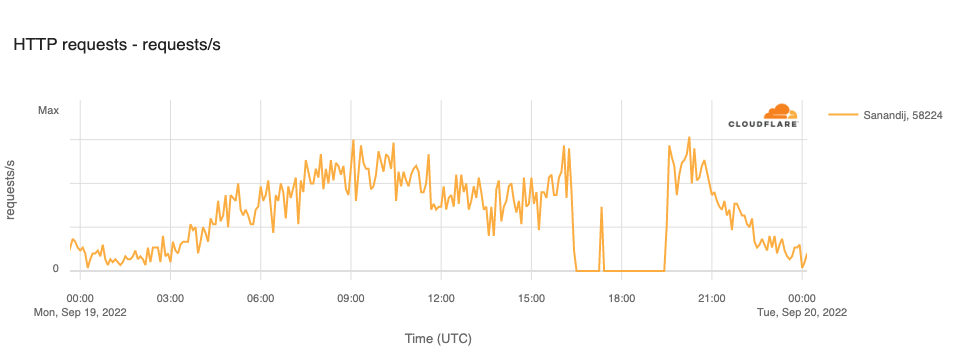
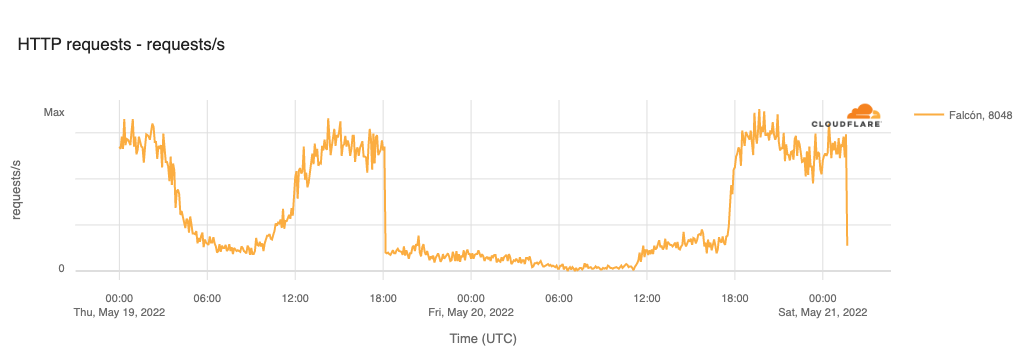
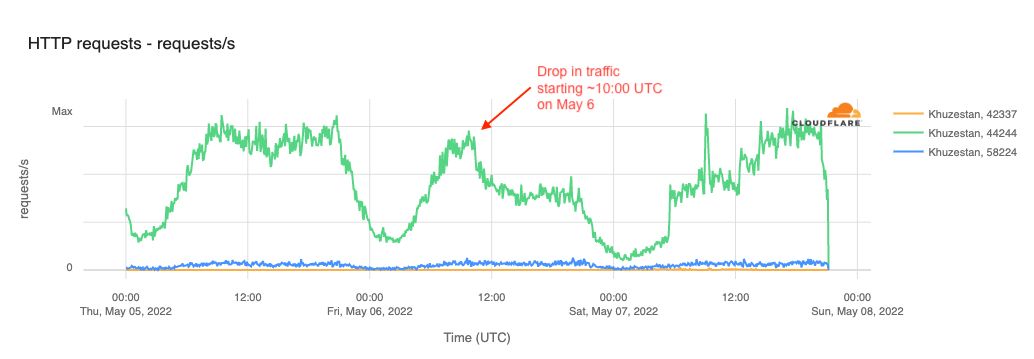
In addition to the mobile network shutdowns, several regional Internet disruptions were also observed in Iran during the fourth quarter, two of which we review below. The first was in Sanandaj, Kurdistan Province on October 26, where a complete Internet shutdown was implemented in response to demonstrations marking the 40th day since the death of Mahsa Amini. The figure below shows a complete loss of traffic starting at 1030 local time (0700 UTC), with the outage lasting until 0805 local time on October 27 (0435 UTC). In December, a province-level Internet disruption was observed starting on December 18, lasting through December 25.
The Internet disruptions that have taken place in Iran over the last several months have had a significant economic impact on the country. A December post from Filterwatch shared concerns stated in a letter from mobile operator Rightel:
The letter, signed by the network’s Managing Director Yasser Rezakhah, states that “during the past few weeks, the company’s resources and income have significantly decreased during Internet shutdowns and other restrictions, such as limiting Internet bandwidth from 21 September. They have also caused a decrease in data use from subscribers, decreasing data traffic by around 50%.” The letter also states that the “continued lack of compensation for losses could lead to bankruptcy.”
The post also highlighted economic concerns shared by Iranian officials:
Some Iranian officials have expressed concern about the cost of Internet shutdowns, including Valiollah Bayati, MP for Tafresh and Ashtian in Markazi province. In a public session in Majles (parliament), he stated that continued Internet shutdowns have led to the closure of many jobs and people are worried, the government and the President must provide necessary measures.
Since the 30th of Shahrivar month and with the beginning of the government disruption in the Internet, the country’s businesses have been damaged daily at least 50 million tomans and at most 500 million tomans. More than 41% of companies have lost 25-50% of their income during this period, and about 47% have had more than 50% reduction in sales. A review of the data of the research assistant of the country’s tax affairs organization shows that the Internet outage in Iran has caused 3000 billion tomans of damage per day. That is, the cost of 3 months of Internet outage in Iran is equal to 43% of one year’s oil revenue of the country ($25 billion).
Power outages
Bangladesh, October 4
Over 140 million people in Bangladesh were left without electricity on October 4 as the result of a reported grid failure caused by a failure by power distribution companies to follow instructions from the National Load Dispatch Centre to shed load. The resultant power outage resulted in an observed drop in Internet traffic from the country, starting at 1405 local time (0805 UTC), as shown in the figure below. The disruption lasted approximately seven hours, with traffic returning to expected levels around 1900 local time (1500 UTC).
Pakistan
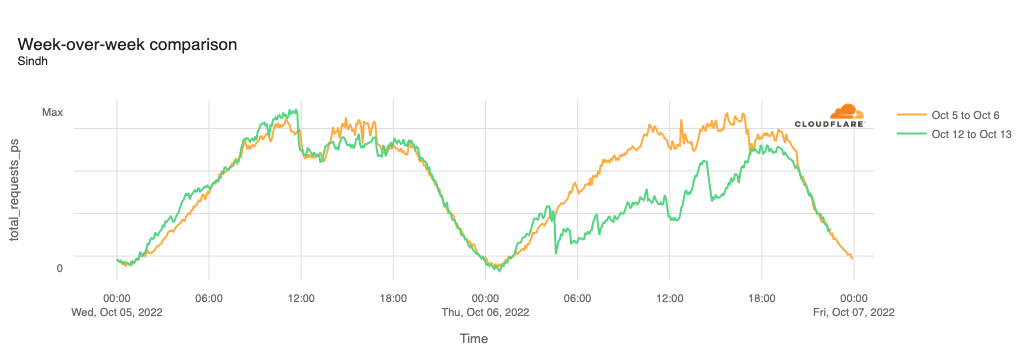
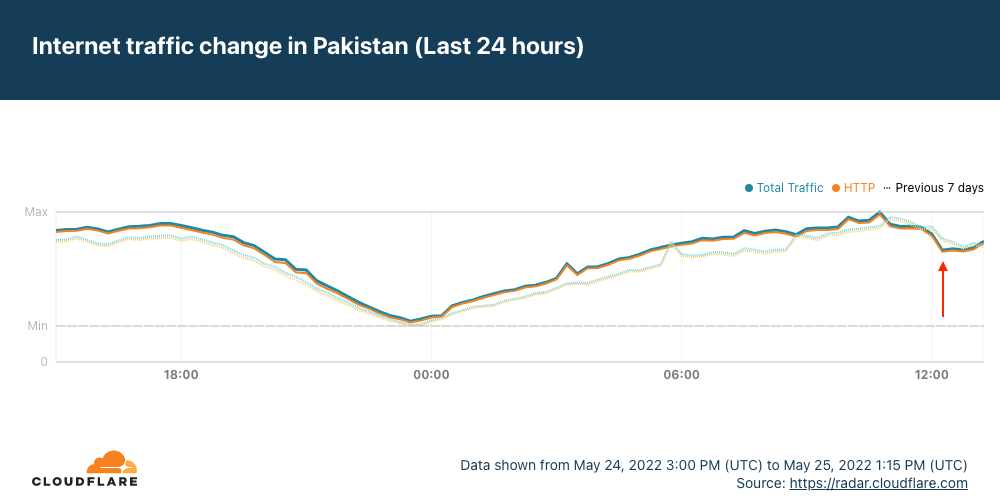
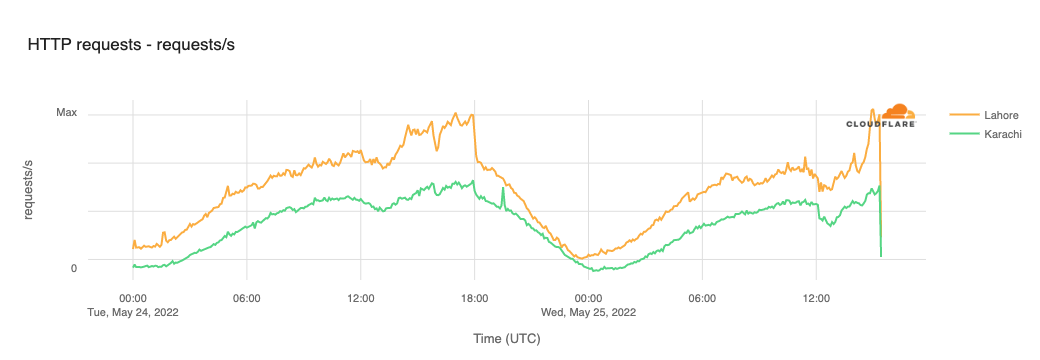
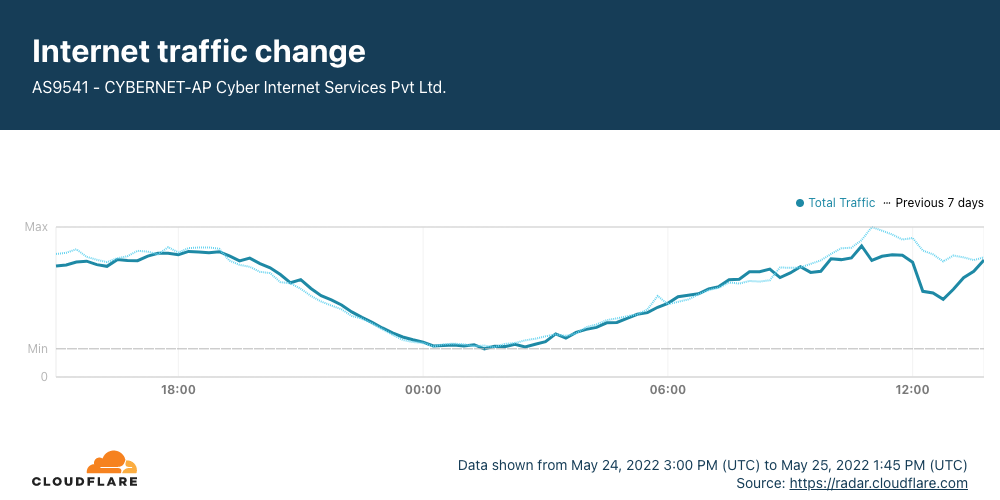
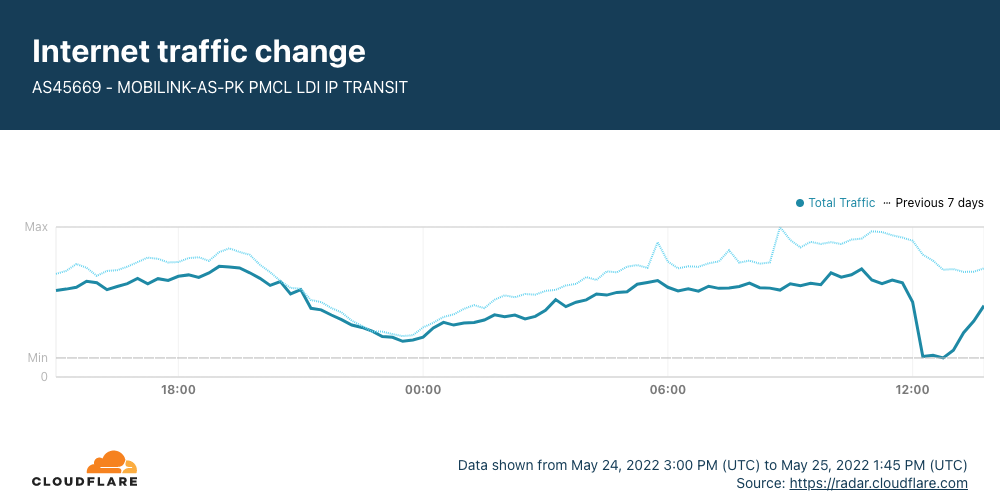
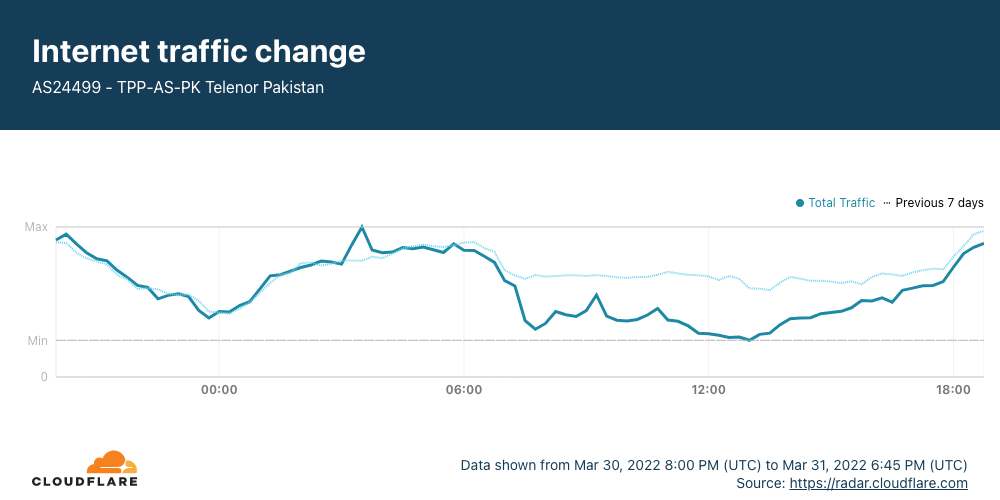
Over a week later, a similar issue in Pakistan caused power outages across the southern part of the country, including Sindh, Punjab, and Balochistan. The power outages were caused by a fault in the national grid’s southern transmission system, reportedly due to faulty equipment and sub-standard maintenance. As expected, the power outages resulted in disruptions to Internet connectivity, and the figure below illustrates the impact observed in Sindh, where traffic dropped nearly 30% as compared to the previous week starting at 0935 local time (0435 UTC) on October 6. The disruption lasted over 15 hours, with traffic returning to expected levels at 0100 on October 7 (2000 UTC on October 6).
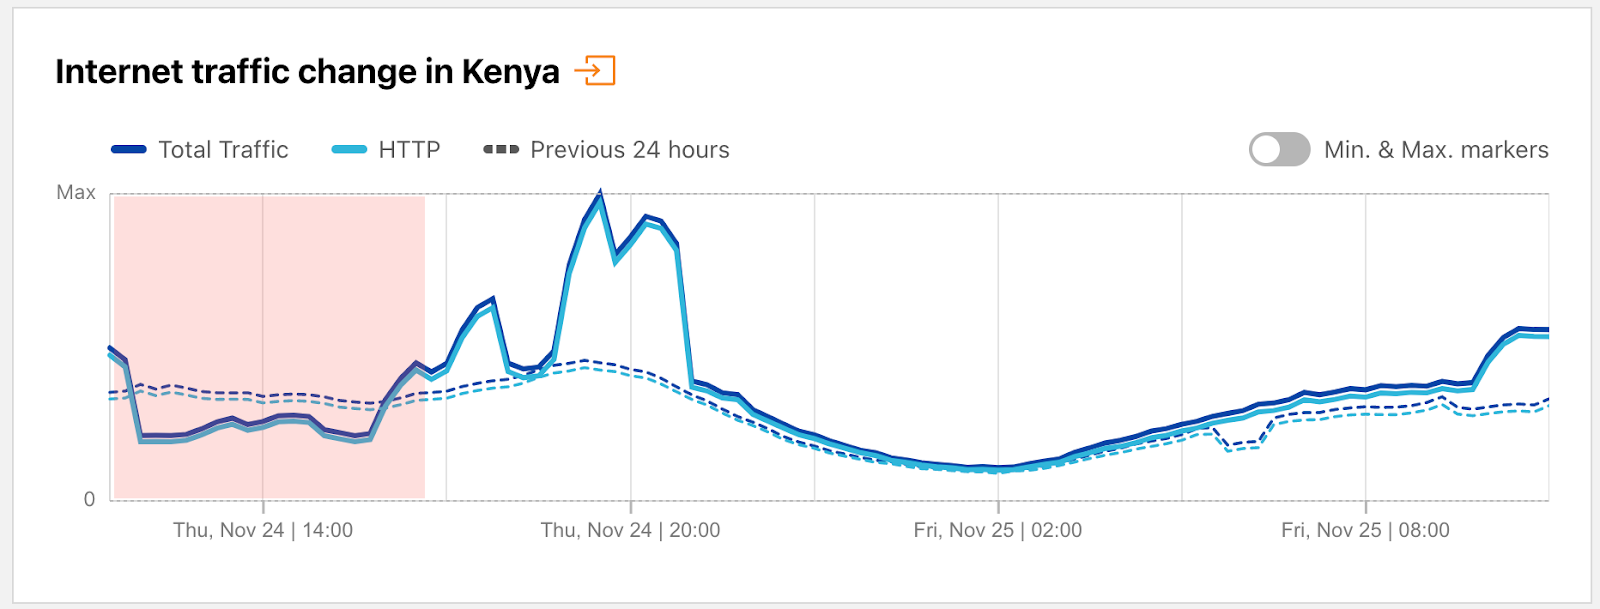
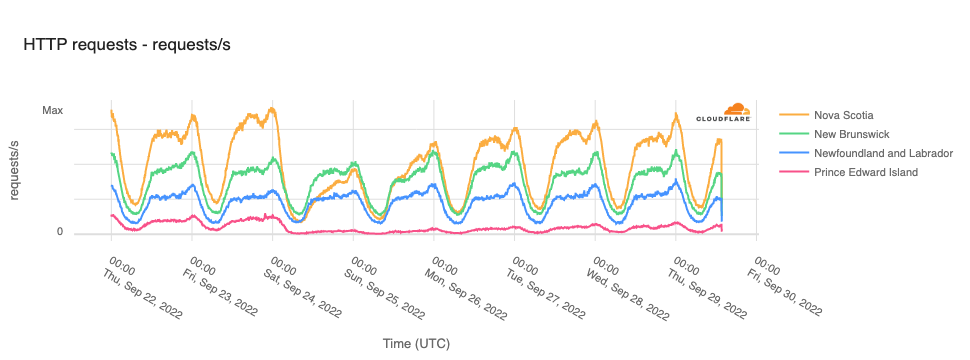
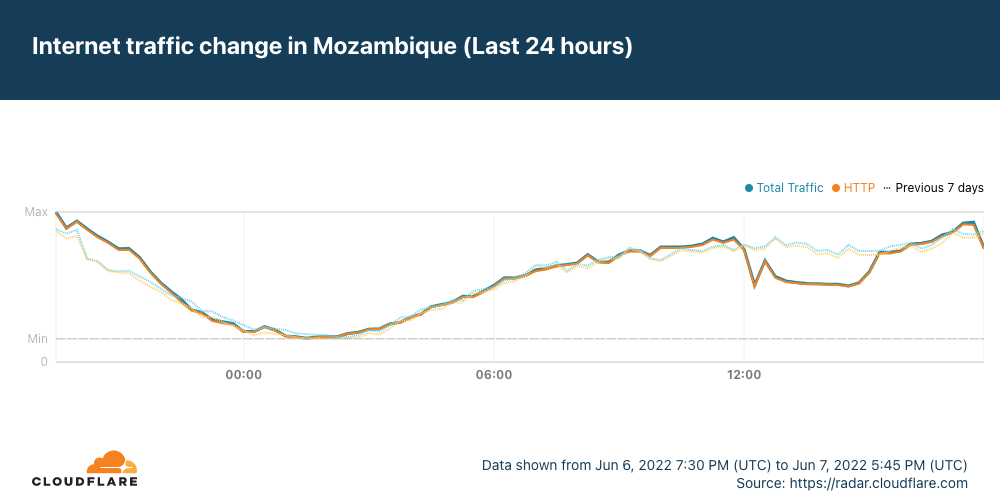
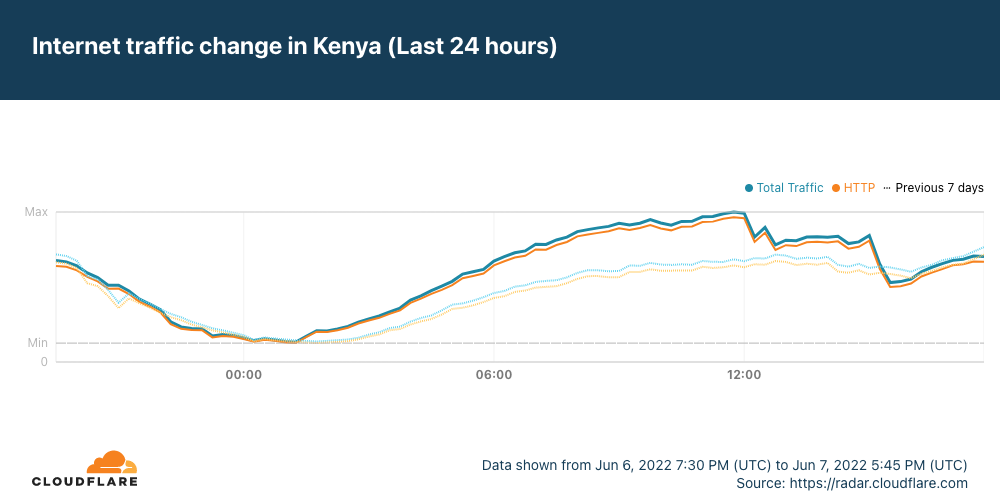
On November 24, a Tweet from Kenya Power at 1525 local time noted that they had “lost bulk power supply to various parts of the country due to a system disturbance”. A subsequent Tweet published just over six hours later at 2150 local time stated that “normal power supply has been restored to all parts of the country.” The time stamps on these notifications align with the loss of Internet traffic visible in the figure below, which lasted between 1500-2050 local time (1200-1750 UTC).
United States (Moore County, North Carolina)
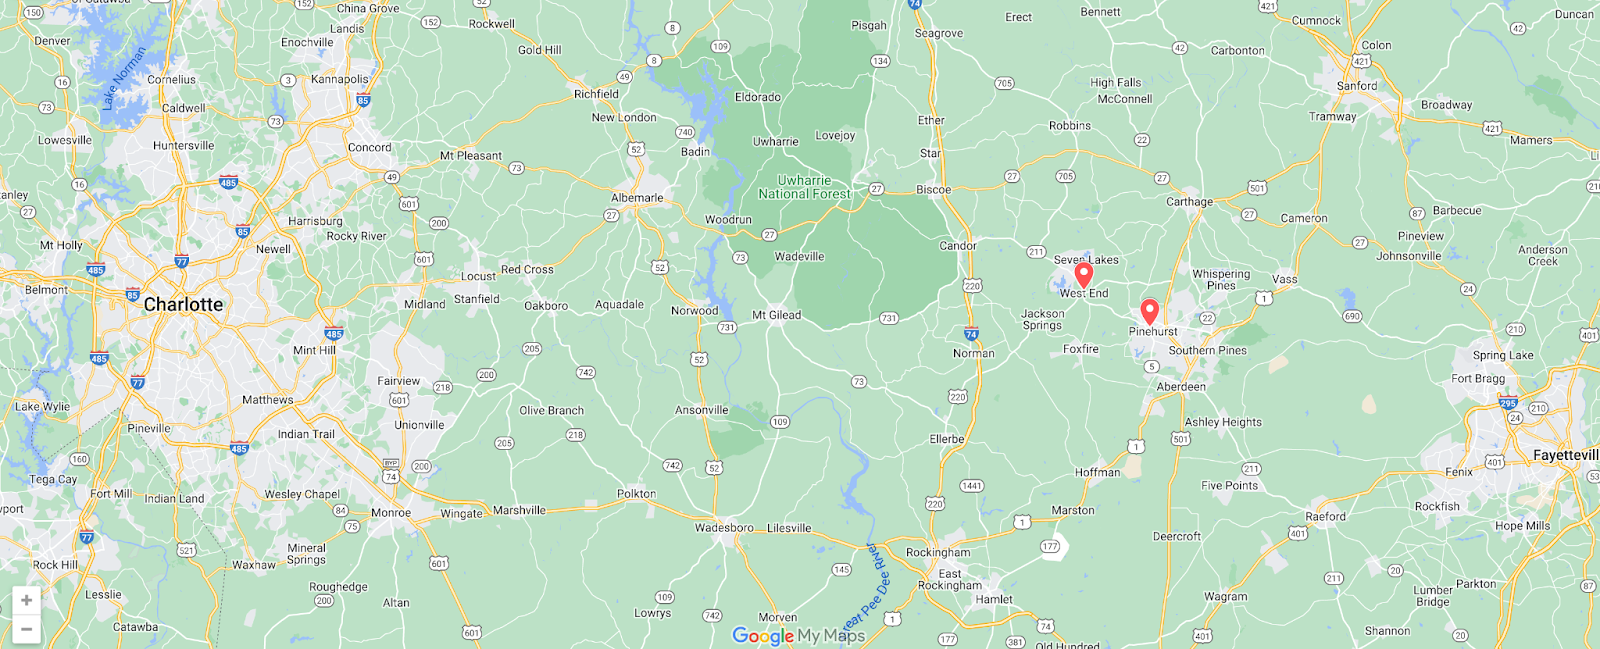
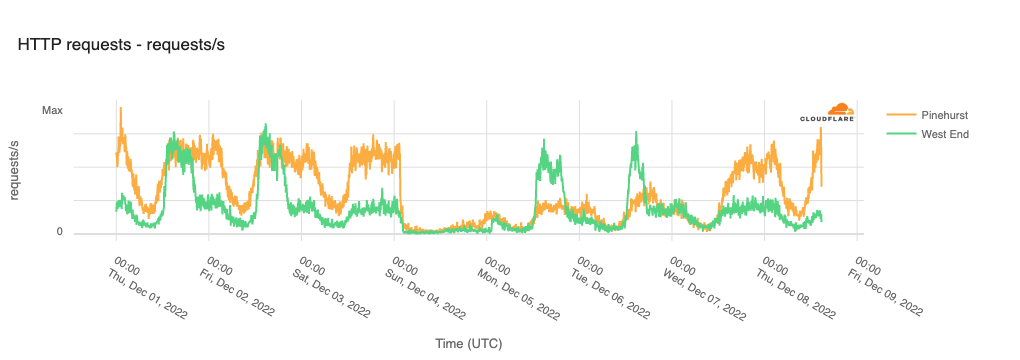
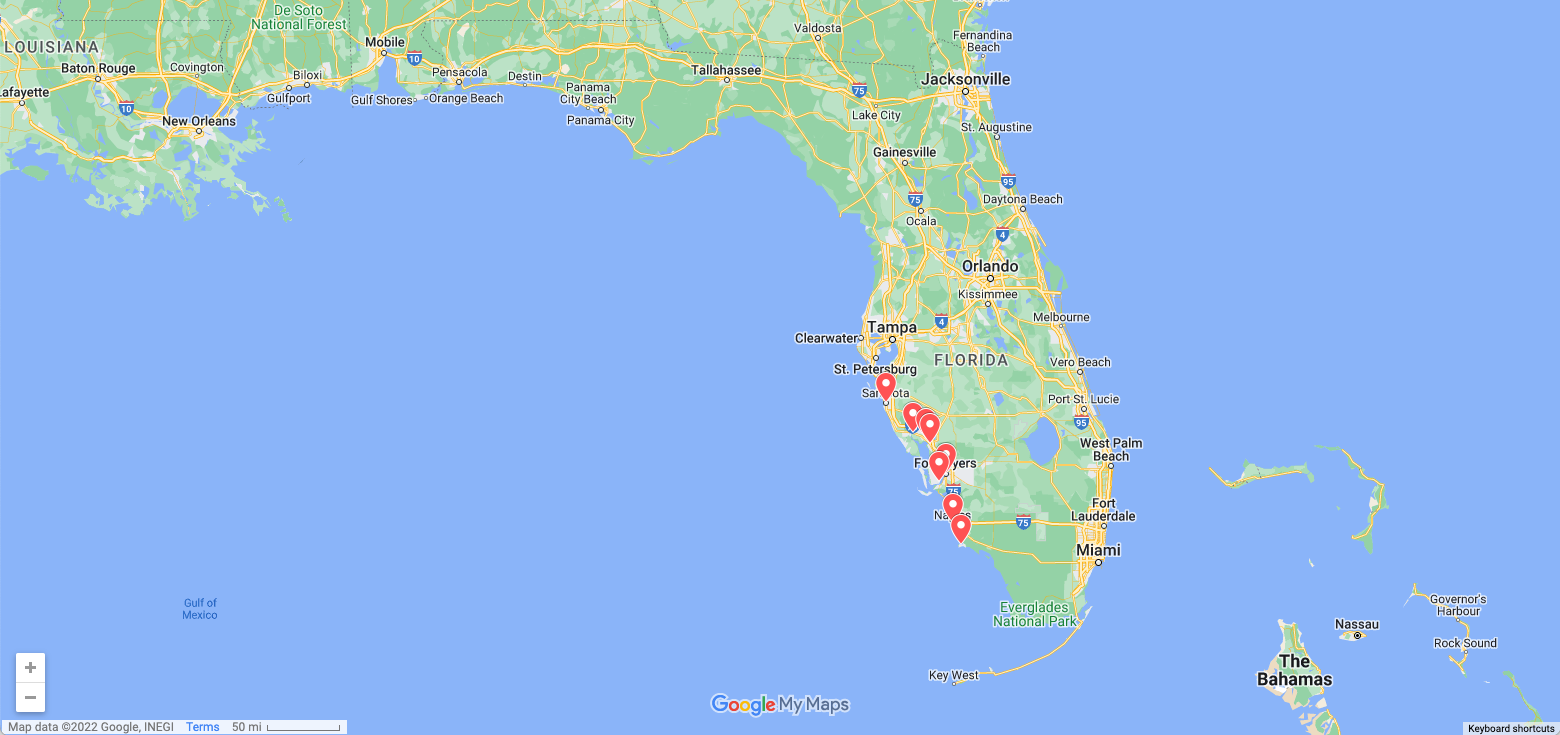
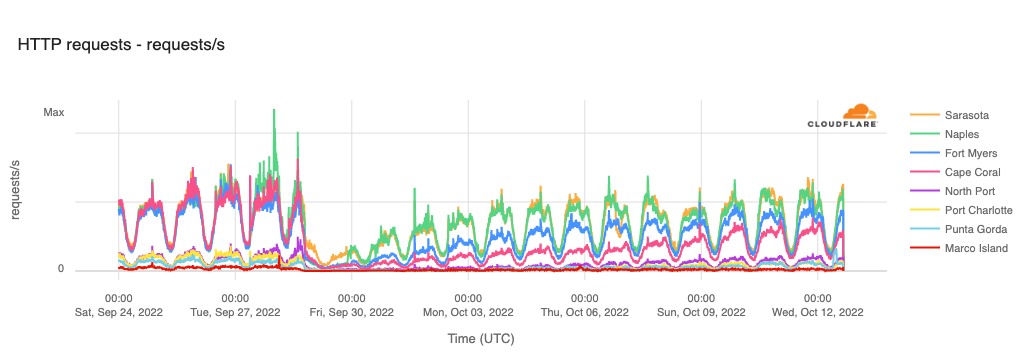
On December 3, two electrical substations in Moore County, North Carolina were targeted by gunfire, with the resultant damage causing localized power outages that took multiple days to resolve. The power outages reportedly began just after 1900 local time (0000 UTC on December 4), resulting in the concurrent loss of Internet traffic from communities within Moore County, as seen in the figure below.
Internet traffic within the community of West End appeared to return midday (UTC) on December 5, but that recovery was apparently short-lived, as it fell again during the afternoon of December 6. In Pinehurst, traffic began to slowly recover after about a day, but returned to more normal levels around 0800 local time (1300 UTC) on December 7.
The war in Ukraine has been going on since February 24, and Cloudflare has covered the impact of the war on the country’s Internet connectivity in a number of blog posts across the year (March, March, April, May, June, July, October, December). Throughout the fourth quarter of 2022, Russian missile strikes causedwidespreaddamage to electrical infrastructure, resulting in power outages and disruptions to Internet connectivity. Below, we highlight several examples of the Internet disruptions observed in Ukraine during the fourth quarter, but they are just a few of the many disruptions that occurred.
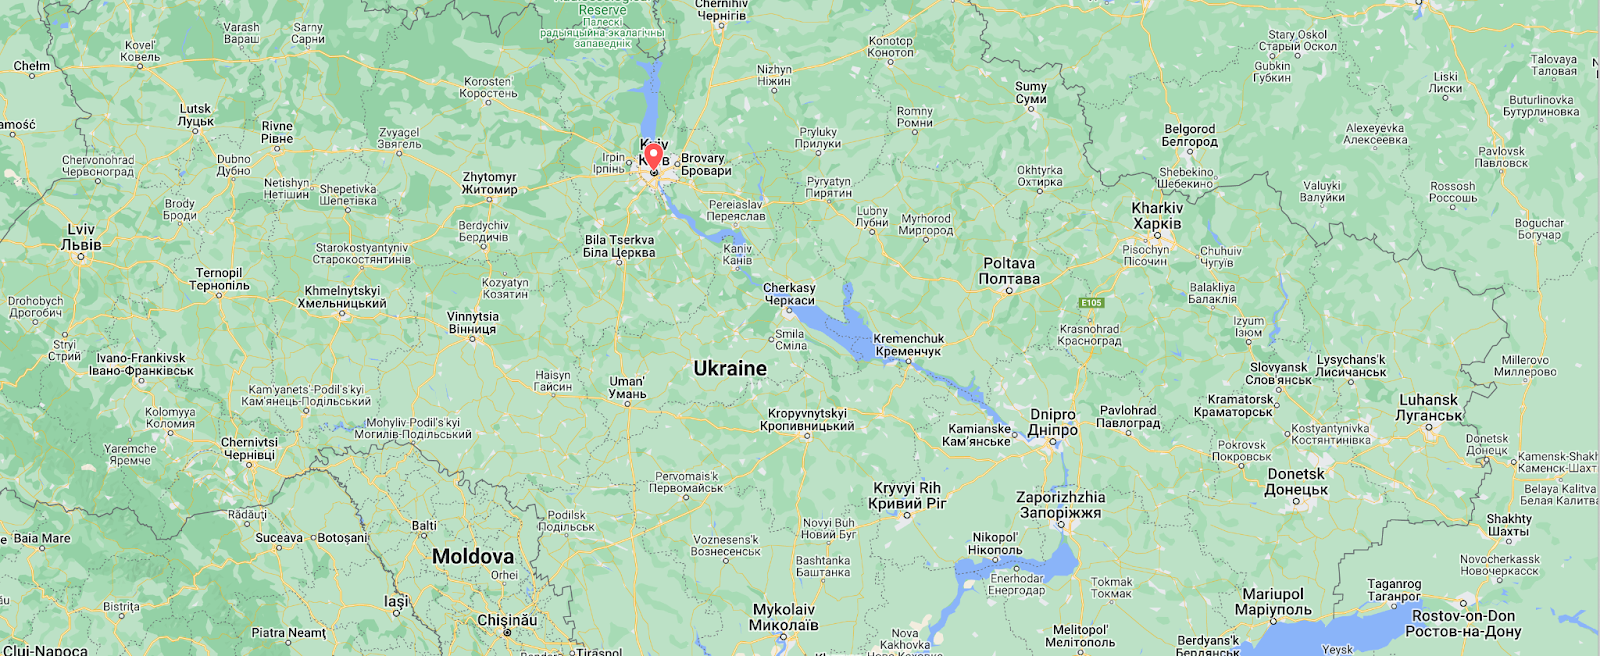
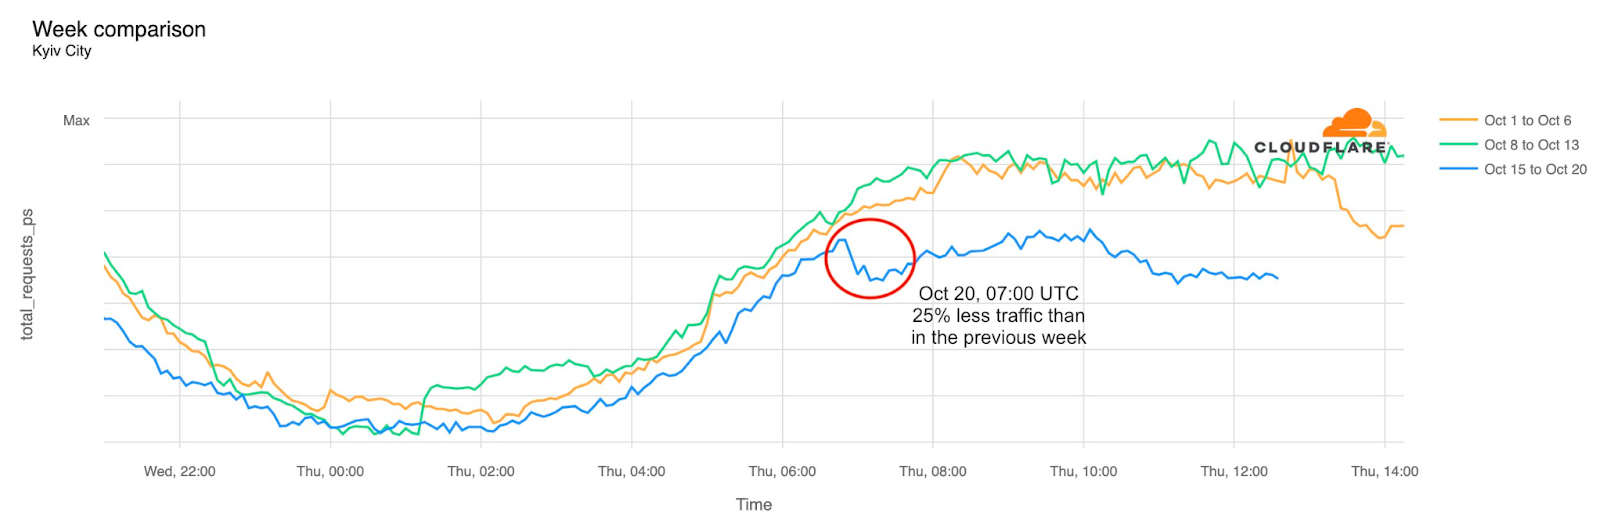
On October 20, the destruction of several power stations in Kyiv resulted in a 25% drop in Internet traffic from Kyiv City as compared to the two previous weeks. The disruption began around 0900 local time (0700 UTC).
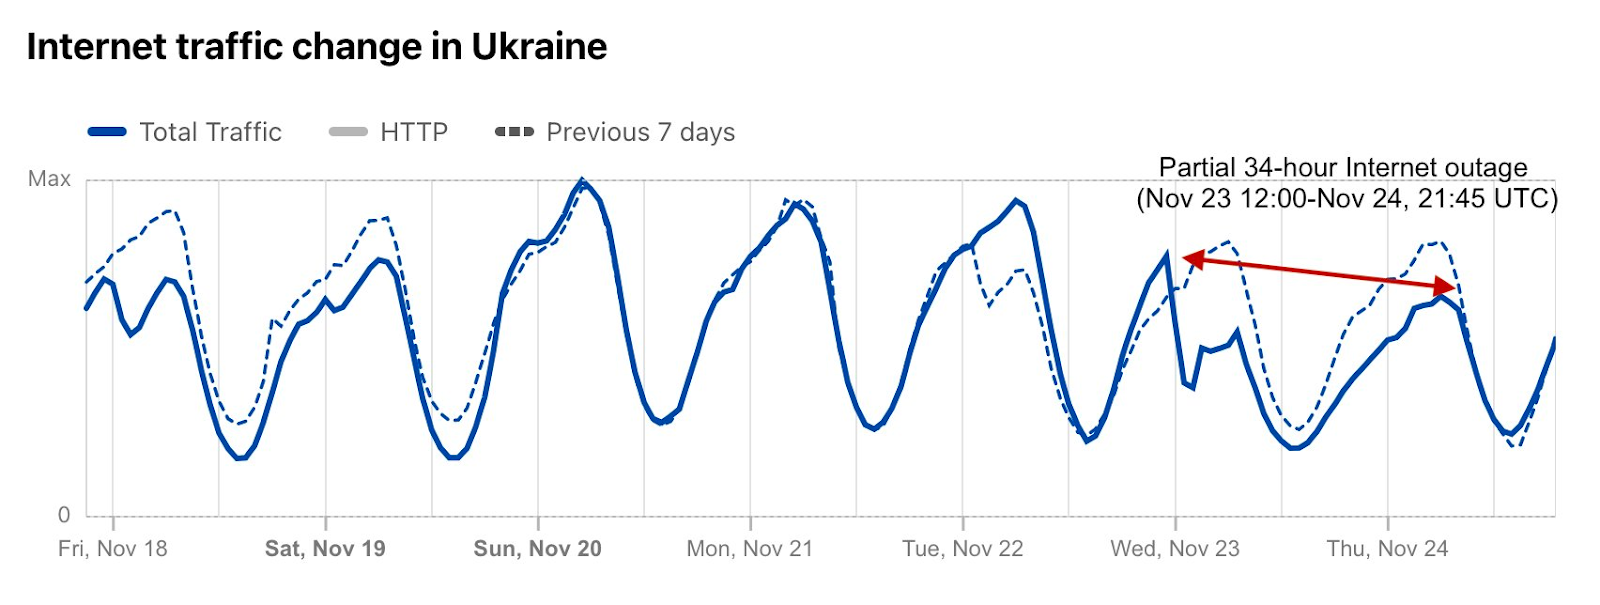
On November 23, widespread power outages after Russian strikes caused a nearly 50% decrease in Internet traffic in Ukraine, starting just after 1400 local time (1200 UTC). This disruption lasted for nearly a day and a half, with traffic returning to expected levels around 2345 local time on November 24 (2145 UTC).
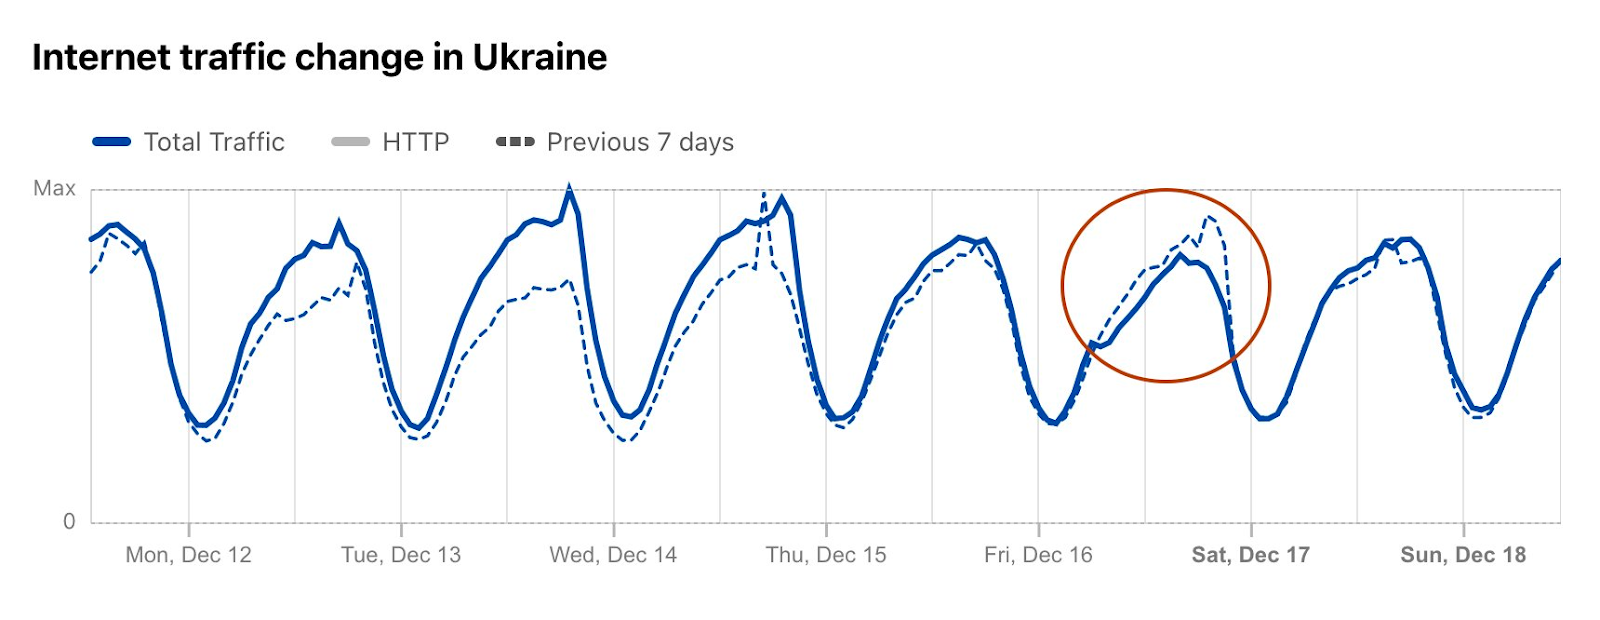
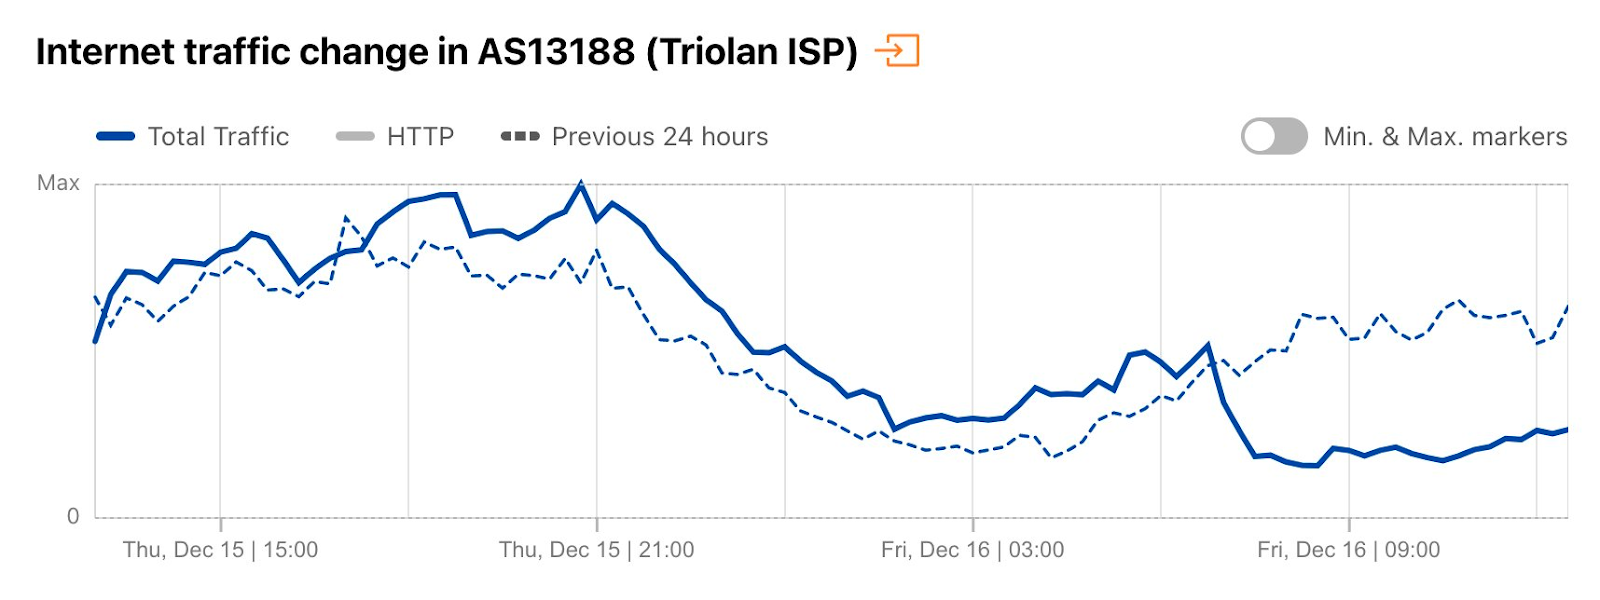
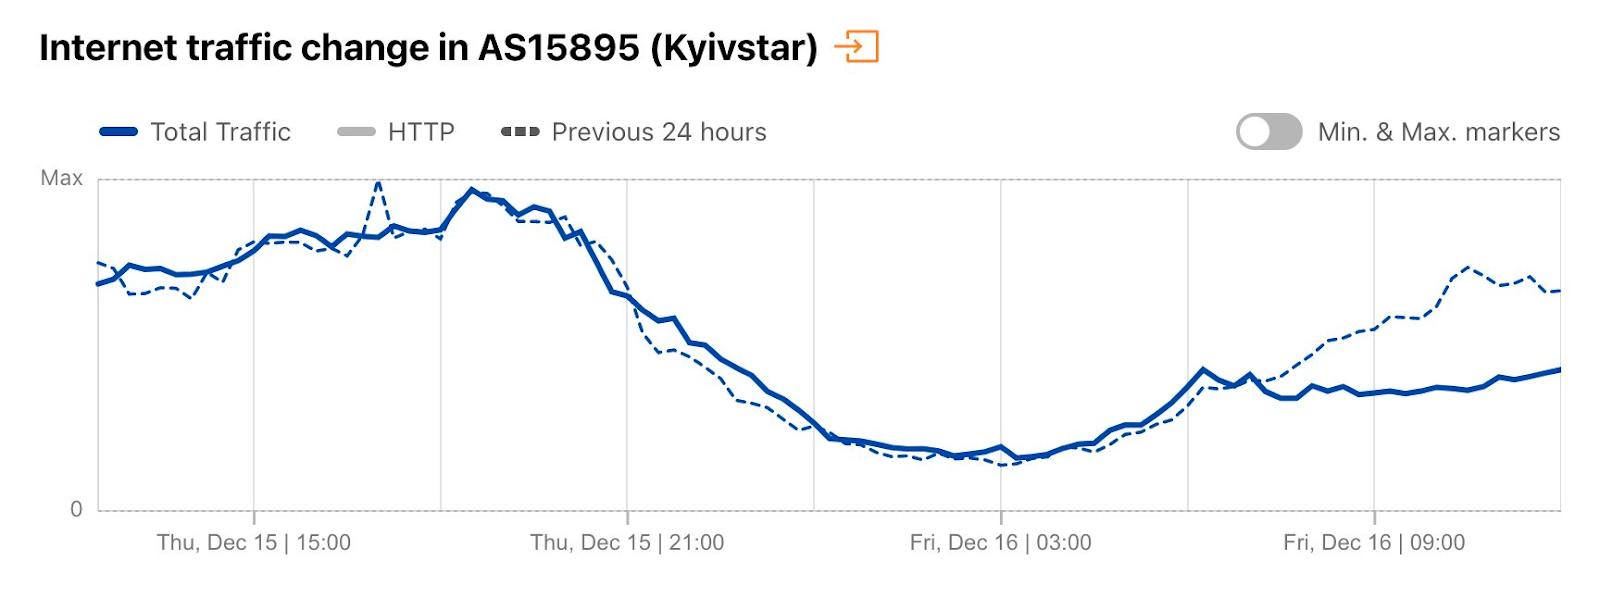
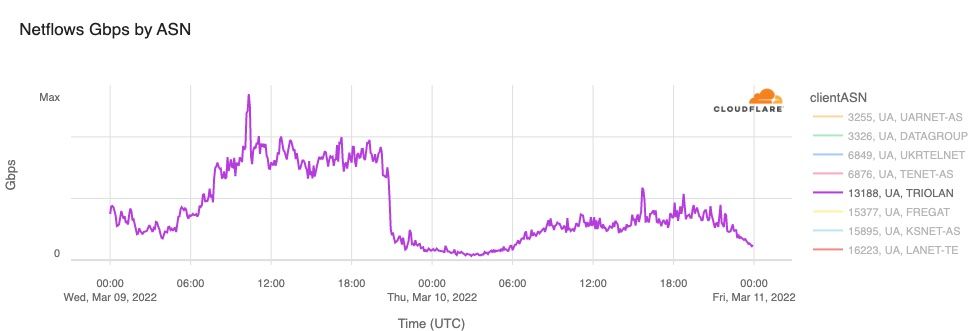
On December 16, power outages resulting from Russian air strikes targeting power infrastructure caused country-level Internet traffic to drop around 13% at 0915 local time (0715 UTC), with the disruption lasting until midnight local time (2200 UTC). However, at a network level, the impact was more significant, with AS13188 (Triolan) seeing a 70% drop in traffic, and AS15895 (Kyivstar) a 40% drop, both shown in the figures below.
Cable cuts
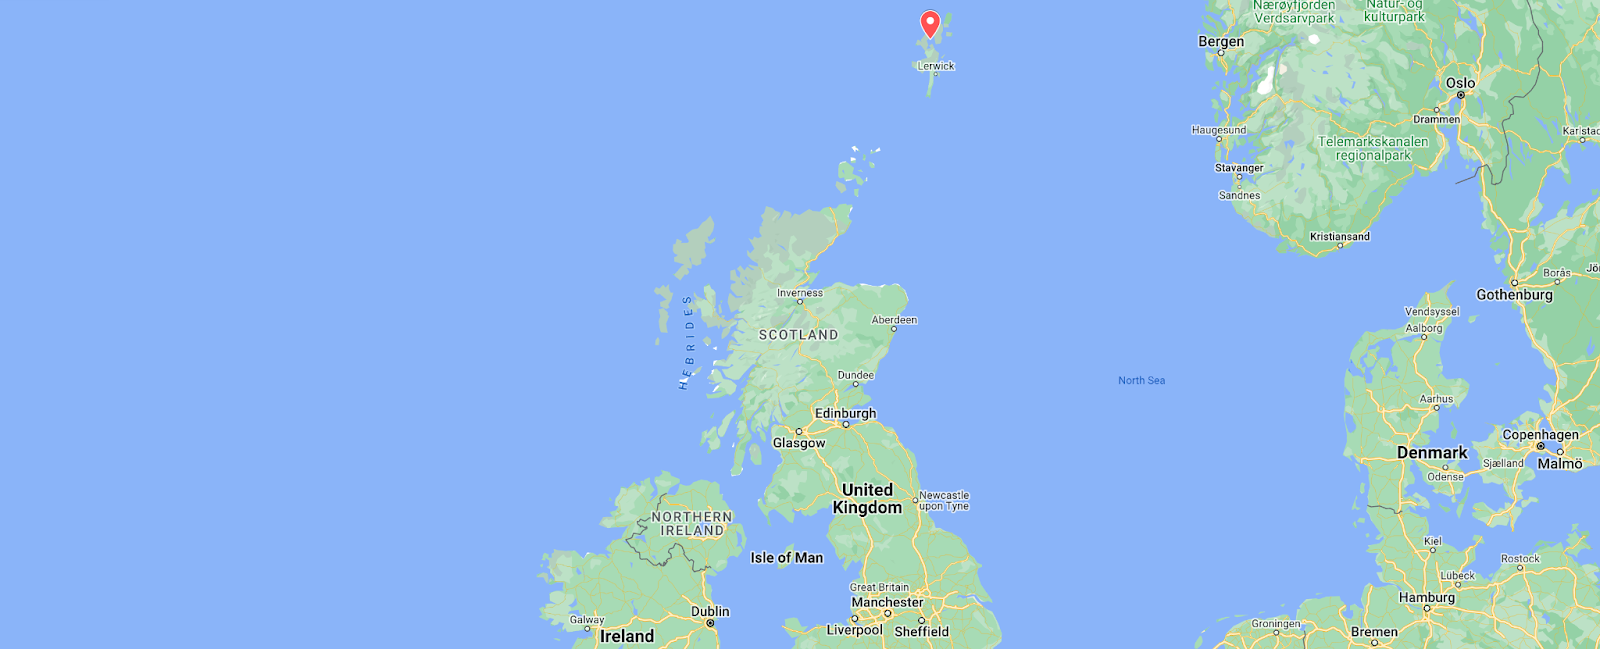
Shetland Islands, United Kingdom
The Shetland Islands are primarily dependent on the SHEFA-2 submarine cable system for Internet connectivity, connecting through the Scottish mainland. Late in the evening of October 19, damage to this cable knocked the Shetland Islands almost completely offline. At the time, there was heightened concern about the potential sabotage of submarine cables due to the reported sabotage of the Nord Stream natural gas pipelines in late September, but authorities believed that this cable damage was due to errant fishing vessels, and not sabotage.
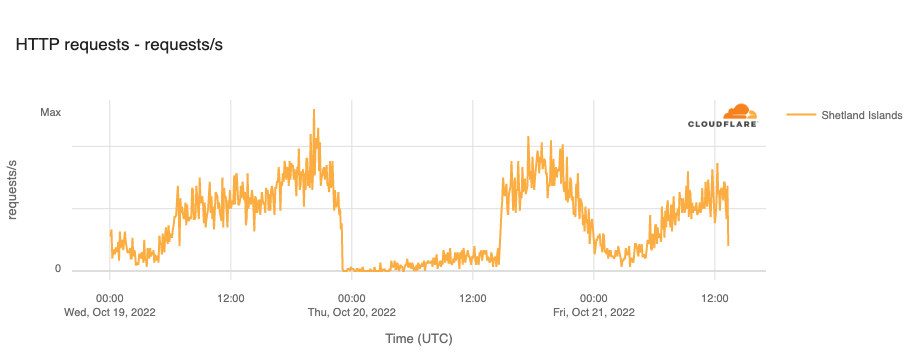
The figure below shows that the impact of the damage to the cable was relatively short-lived, compared to the multi-day Internet disruptions often associated with submarine cable cuts. Traffic dropped just after 2300 local time (2200 UTC) on October 19, and recovered 14.5 hours later, just after 1430 local time (1330 UTC) on October 20.
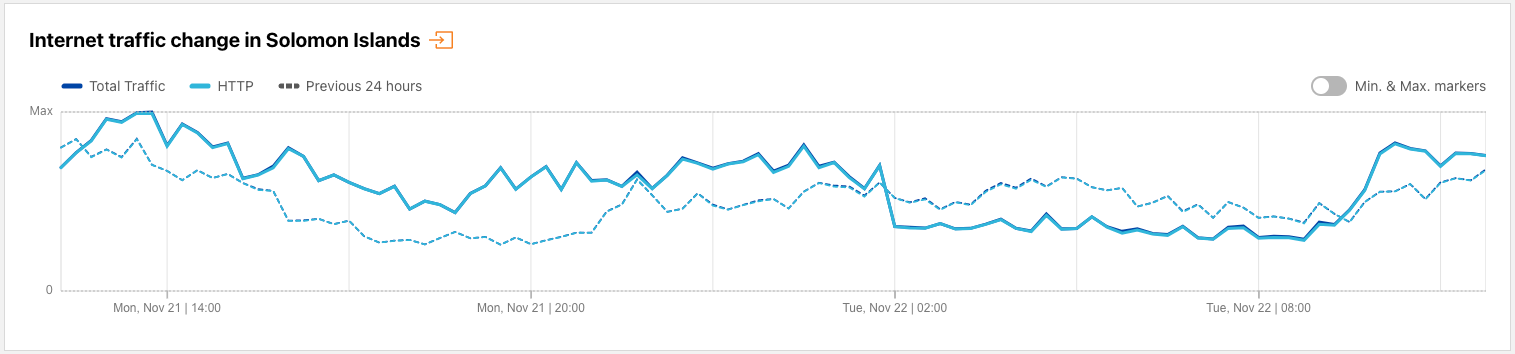
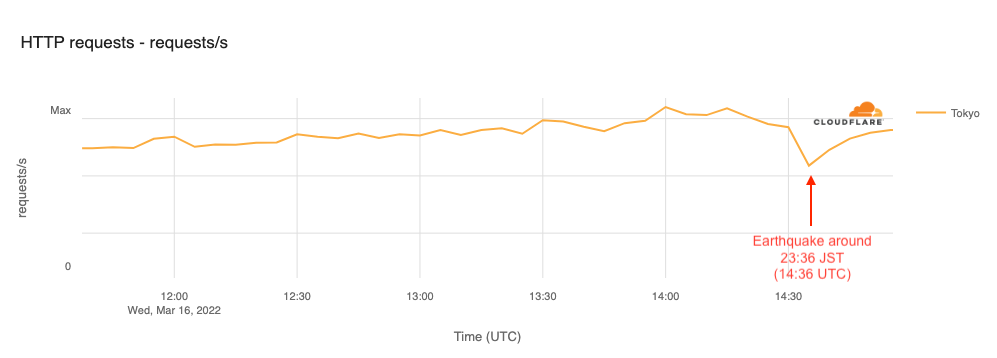
Earthquakes frequently cause infrastructure damage and power outages in affected areas, resulting in disruptions to Internet connectivity. We observed such a disruption in the Solomon Islands after a magnitude 7.0 earthquake occurred near there on November 22. The figure below shows Internet traffic from the country dropping significantly at 1300 local time (0200 UTC), and recovering 11 hours later at around 2000 local time (0900 UTC).
Technical problems
Kyrgyzstan
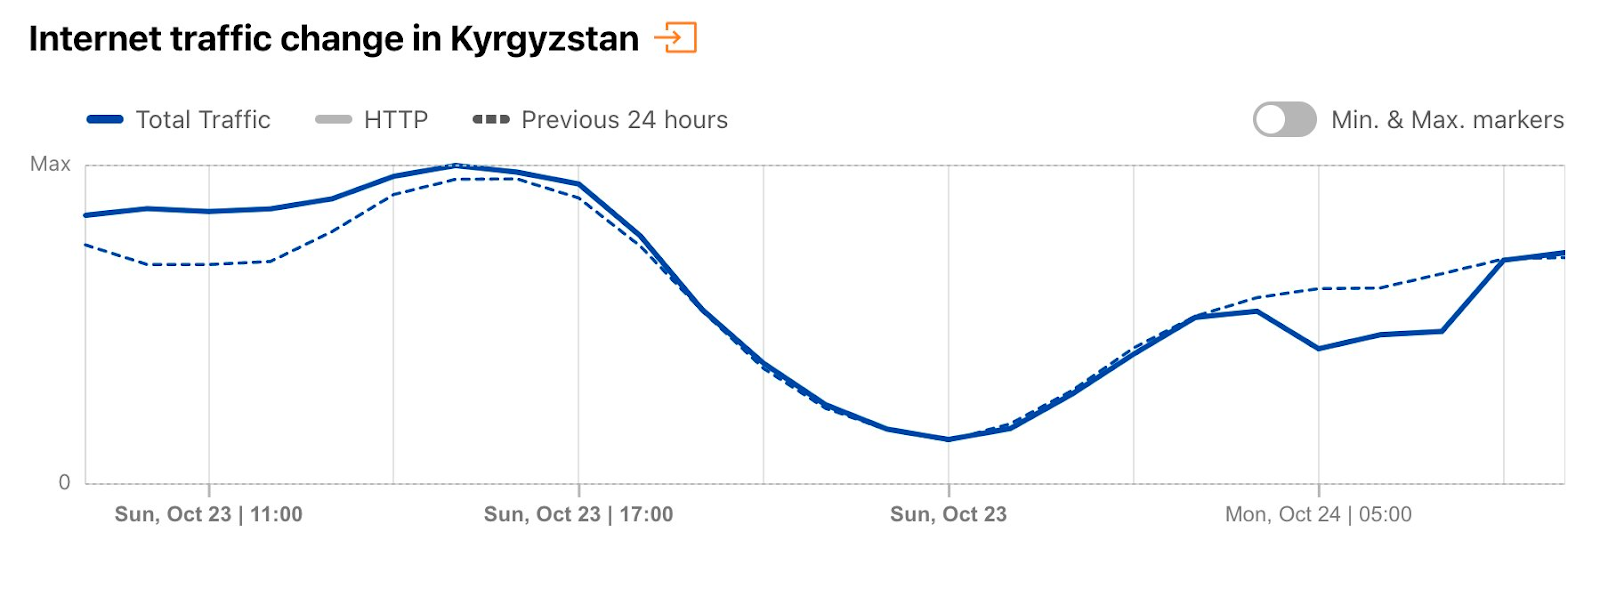
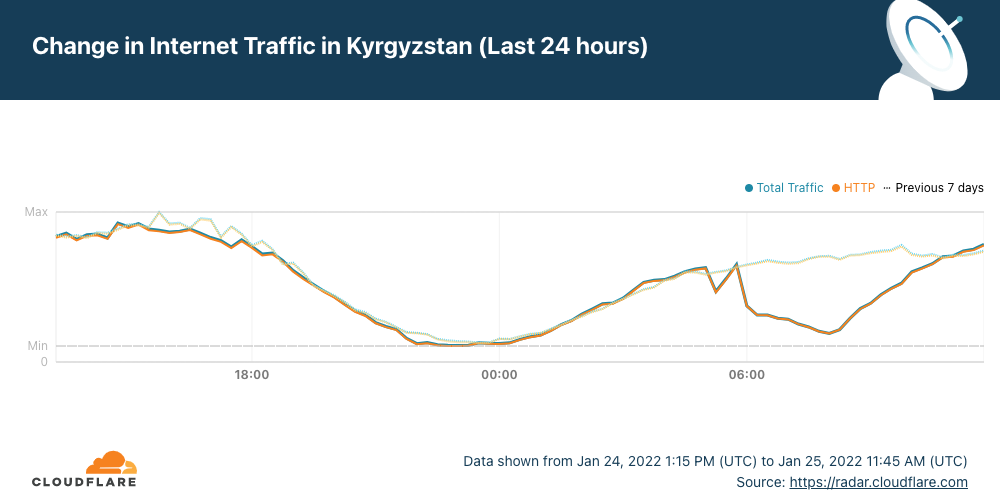
On October 24, a three-hour Internet disruption was observed in Kyrgyzstan lasting between 1100-1400 local time (0500-0800 UTC), as seen in the figure below. According to the country’s Ministry of Digital Development, the issue was caused by “an accident on one of the main lines that supply the Internet”, but no additional details were provided regarding the type of accident or where it had occurred.
Australia (Aussie Broadband)
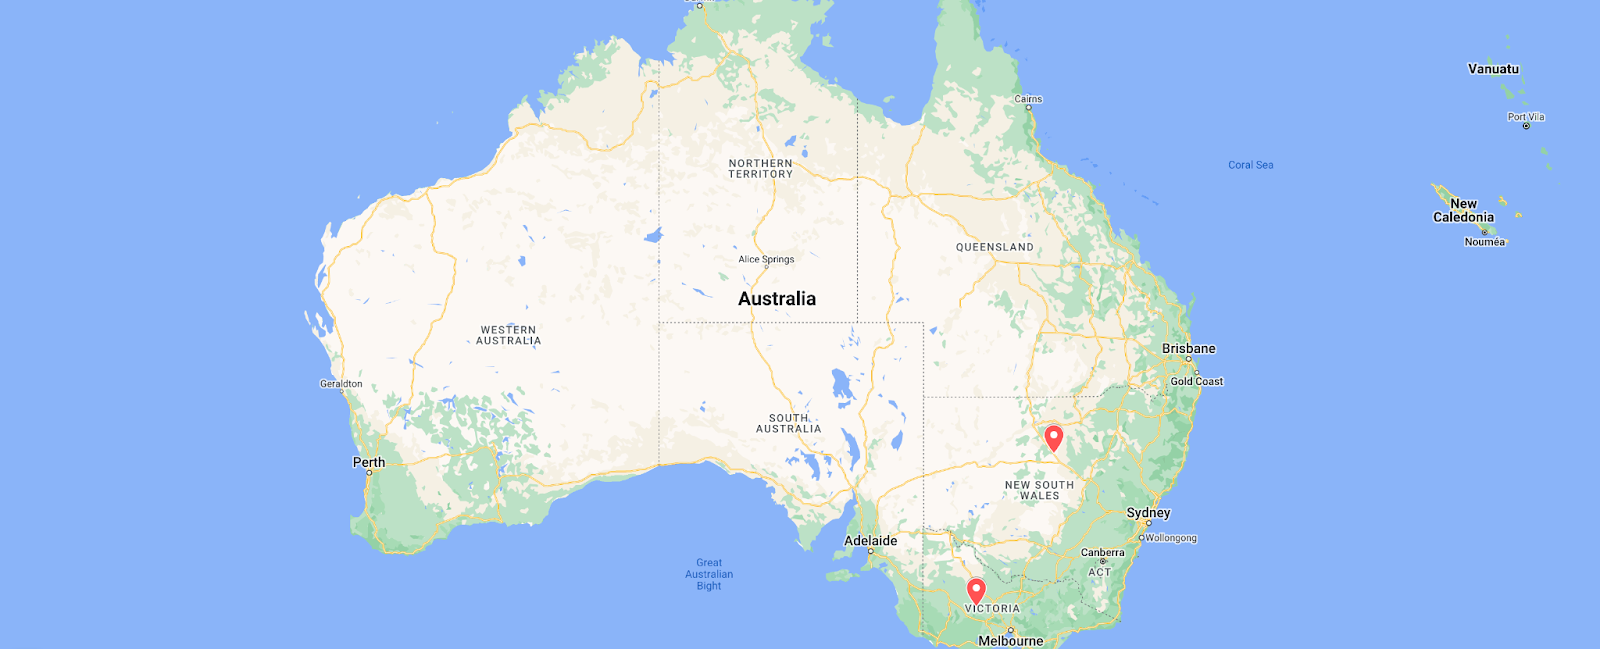
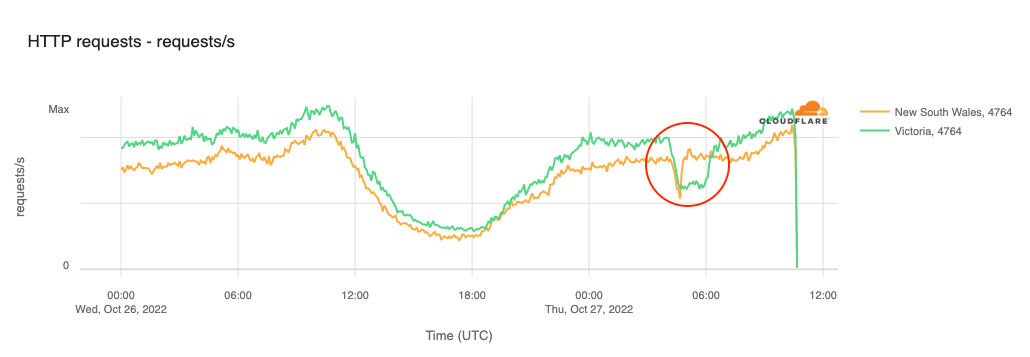
Customers of Australian broadband Internet provider Aussie Broadband in Victoria and New South Wales suffered brief Internet disruptions on October 27. As shown in the figure below, AS4764 (Aussie Broadband) traffic from Victoria dropped by approximately 40% between 1505-1745 local time (0405-0645 UTC). A similar, but briefer, loss of traffic from New South Wales was also observed, lasting between 1515-1550 local time (0415-0450 UTC). A representative of Aussie Broadband provided insight into the underlying cause of the disruption, stating “A config change was made which was pushed out through automation to the DHCP servers in those states. … The change has been rolled back but getting the sessions back online is taking time for VIC, and we are now manually bringing areas up one at a time.”
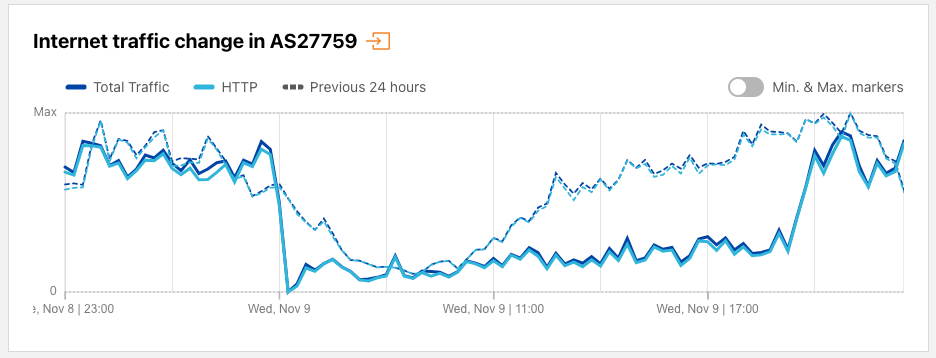
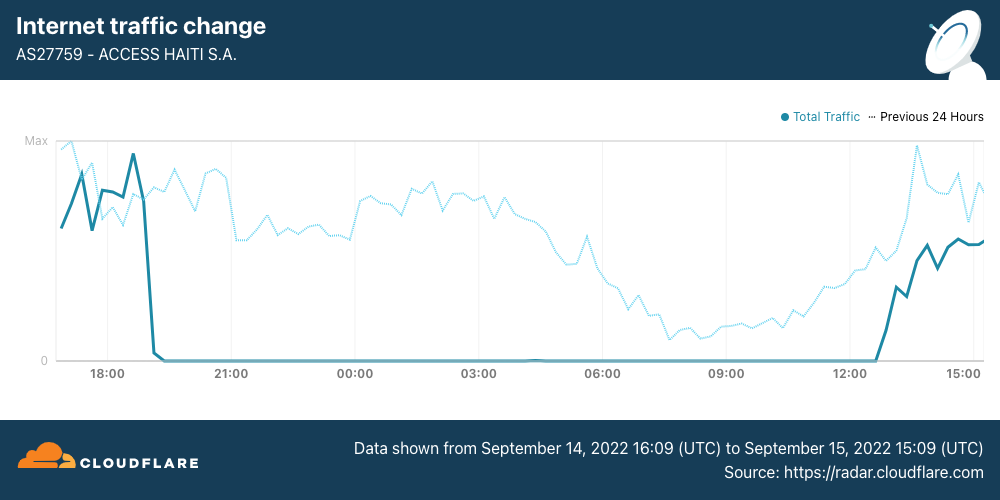
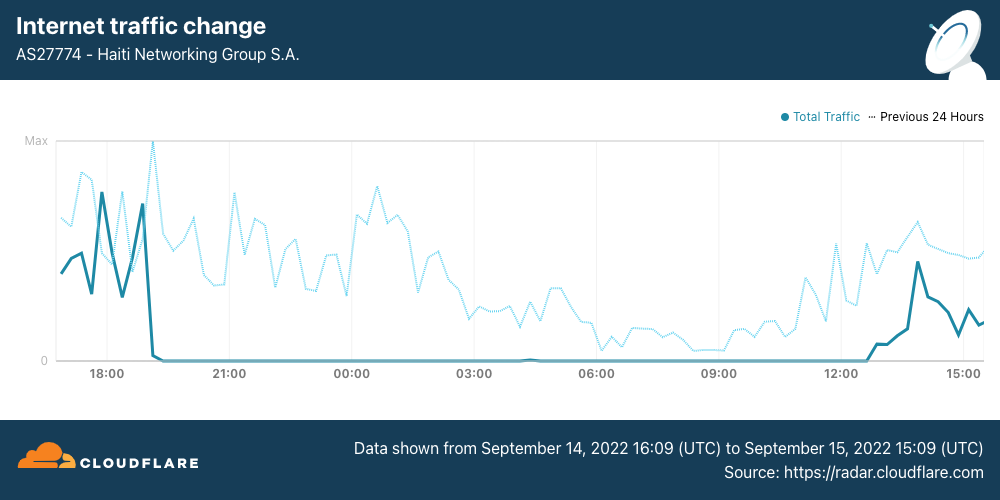
In Haiti, customers of Internet service provider Access Haiti experienced disrupted service for more than half a day on November 9. The figure below shows that Internet traffic for AS27759 (Access Haiti) fell precipitously around midnight local time (0500 UTC), remaining depressed until 1430 local time (1930 UTC), at which time it recovered quickly. A Facebook post from Access Haiti explained to customers that “Due to an intermittent outage on one of our international circuits, our network is experiencing difficulties that cause your Internet service to slow down.” While Access Haiti didn’t provide additional details on which international circuit was experiencing an outage, submarinecablemap.com shows that two submarine cables provide international Internet connectivity to Haiti — the Bahamas Domestic Submarine Network (BDSNi), which connects Haiti to the Bahamas, and Fibralink, which connects Haiti to the Dominican Republic and Jamaica.
Unknown
Many Internet disruptions can be easily tied to an underlying cause, whether through coverage in the press, a concurrent weather or natural disaster event, or communication from an impacted provider. However, the causes of other observed disruptions remain unknown as the impacted providers remain silent about what caused the problem.
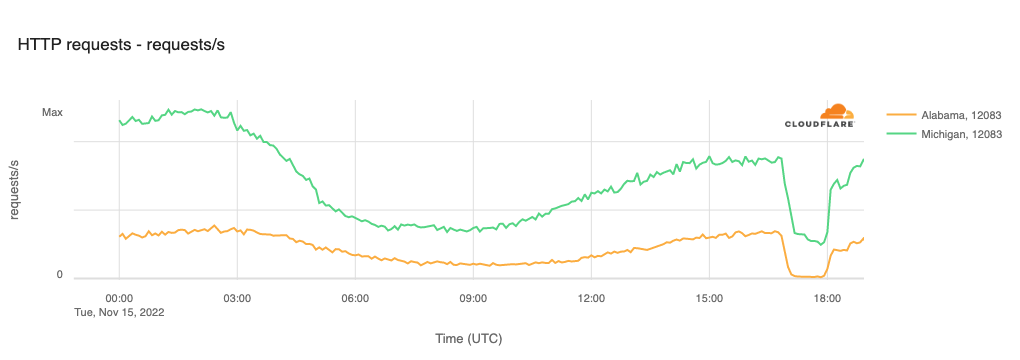
United States (Wide Open West)
On November 15, customers of Wide Open West, an Internet service provider with a multi-state footprint in the United States, experienced an Internet service disruption that lasted a little over an hour. The figure below illustrates the impact of the disruption in Alabama and Michigan on AS12083 (Wide Open West), with traffic dropping at 1150 local time (1650 UTC) and recovering just after 1300 local time (1800 UTC).
Cuba
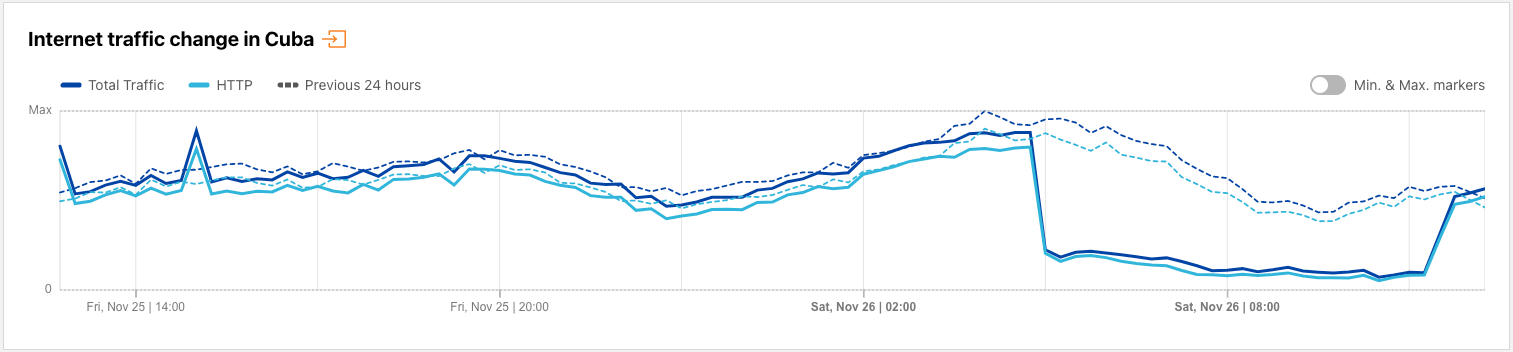
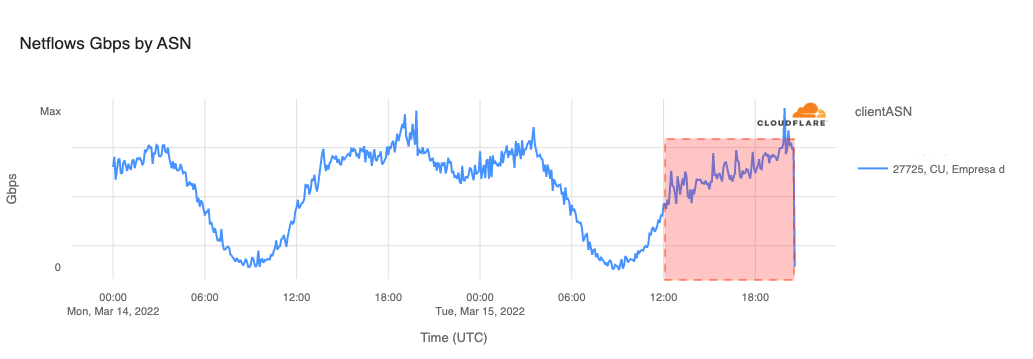
Cuba is no stranger to Internet disruptions, whether due to government-directed shutdowns (such as the one discussed above), fiber cuts, or power outages. However, no underlying cause was ever shared for the seven-hour disruption in the country’s Internet traffic observed between 2345 on November 25 and 0645 on November 26 local time (0445-1145 UTC on November 26). Traffic was down as much as 75% from previous levels during the disruption.
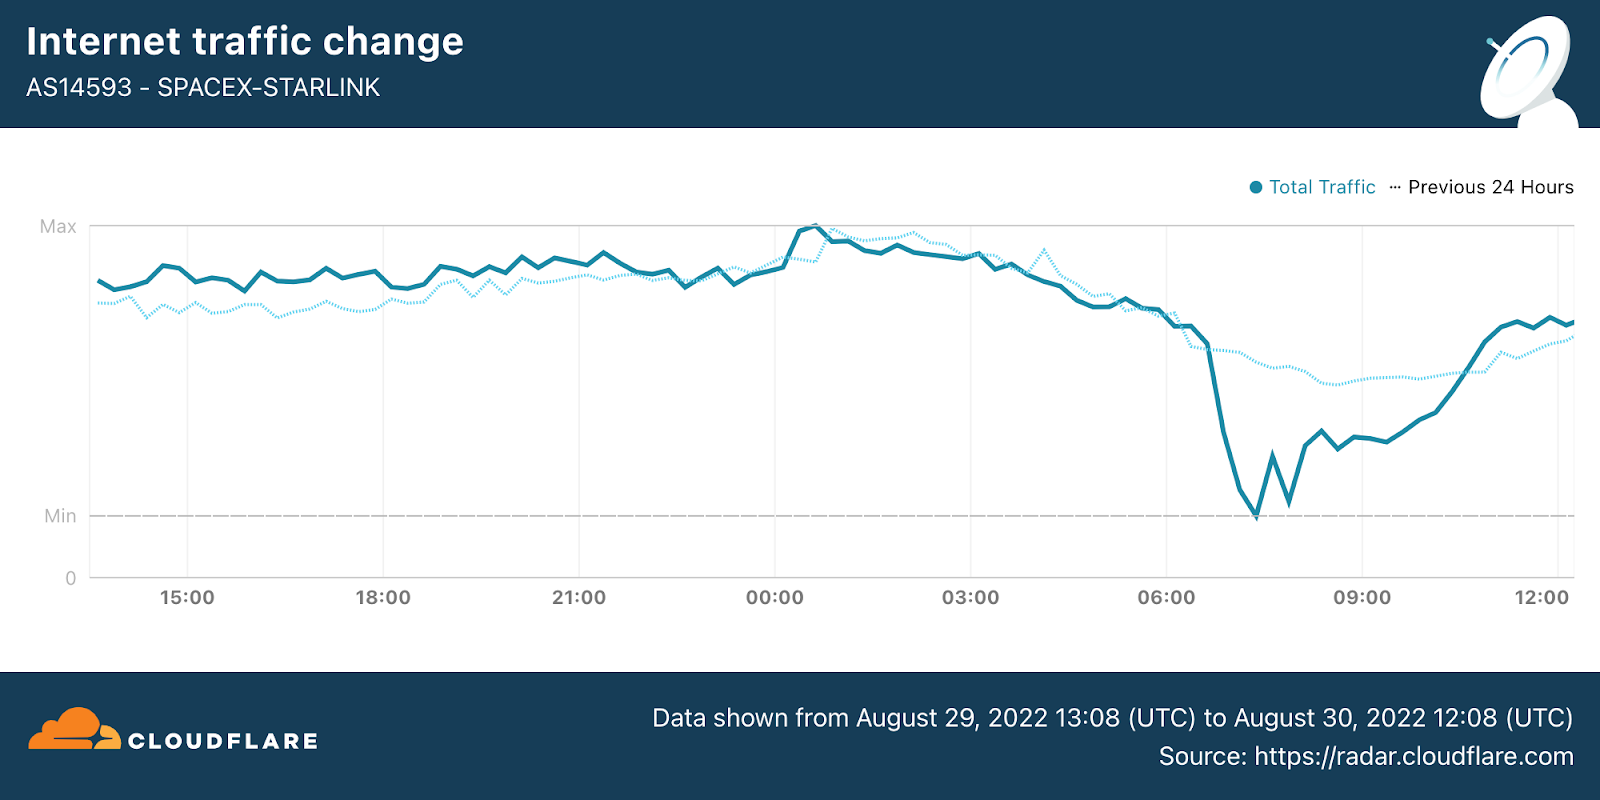
SpaceX Starlink
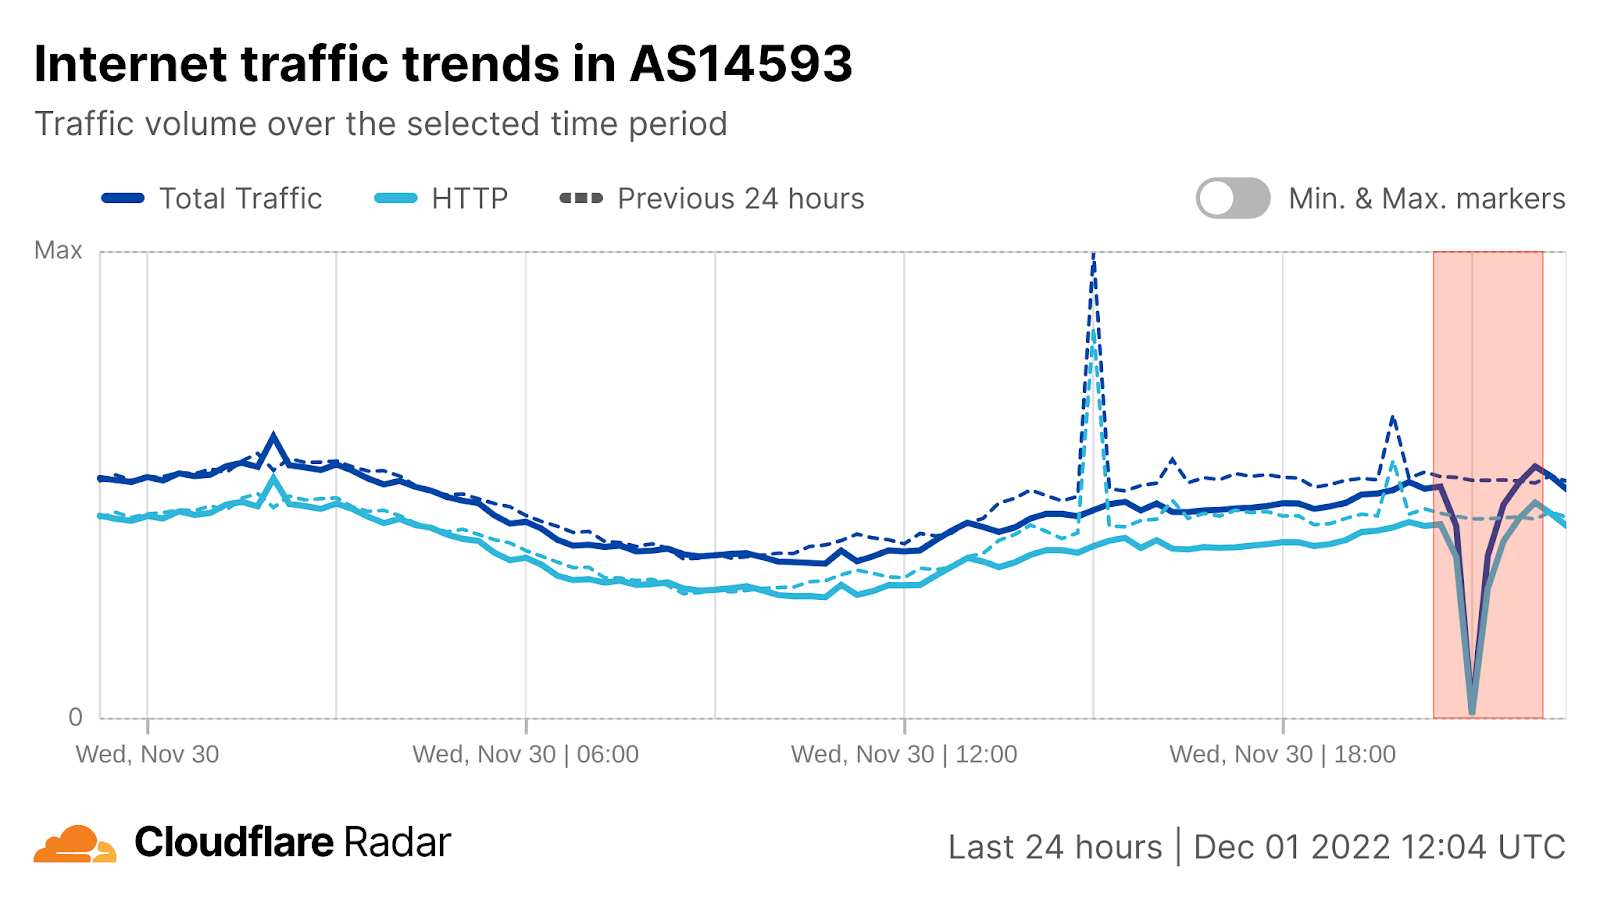
As a provider of low earth orbit (LEO) satellite Internet connectivity services, disruptions to SpaceX Starlink’s service can have a global impact. On November 30, a disruption was observed on AS14593 (SPACEX-STARLINK) between 2050-2130 UTC, with traffic volume briefly dropping to near zero. Unfortunately, Starlink did not acknowledge the incident, nor did they provide any reason for the disruption.
Conclusion
Looking back at the Internet disruptions observed during 2022, a number of common themes can be found. In countries with more authoritarian governments, the Internet is often weaponized as a means of limiting communication within the country and with the outside world through network-level, regional, or national Internet shutdowns. As noted above, this approach was used aggressively in Iran during the last few months of the year.
Internet connectivity quickly became a casualty of war in Ukraine. Early in the conflict, network-level outages were common, and some Ukrainian networks ultimately saw traffic re-routed through upstream Russian Internet service providers. Later in the year, as electrical power infrastructure was increasingly targeted by Russian attacks, widespread power outages resulted in multi-hour disruptions of Internet traffic across the country.
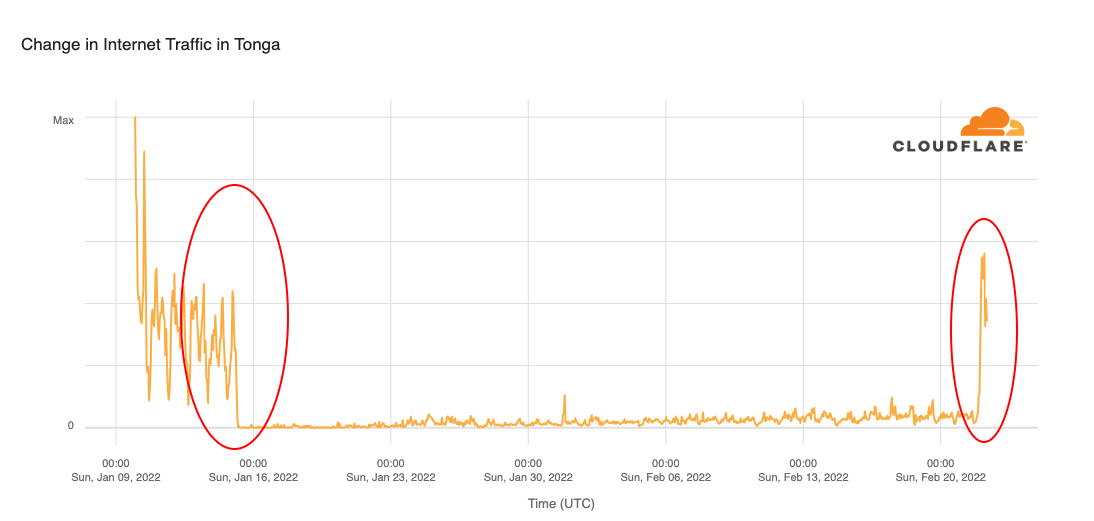
While the volcanic eruption in Tonga took the country offline for over a month due to its reliance on a single submarine cable for Internet connectivity, the damage caused by earthquakes in other countries throughout the year resulted in much shorter and more limited disruptions.
And while submarine cable issues can impact multiple countries along its route, the advent of services with an increasingly global footprint like SpaceX Starlink mean that service disruptions will ultimately have a much broader impact. (Starlink’s subscriber base is comparatively small at the moment, but it currently has a service footprint in over 30 countries around the world.)
In 2022, with nearly five billion people around the world (as well as an untold number of “bots”) using the Internet, analyzing aggregate data about this usage can uncover some very interesting trends. To that end, we’re excited to present the Cloudflare Radar 2022 Year In Review, featuring interactive charts, graphs, and maps you can use to explore notable Internet trends observed throughout this past year. The Year In Review website is part of Cloudflare Radar, which celebrated its second birthday in September with the launch of Radar 2.0.
We have organized the trends we observed around three different topic areas: Traffic, Adoption, and Security. The content covered within each of these areas is described in more detail in their respective sections below. Building on the 2021 Year In Review, we have incorporated several additional metrics this year, and have also improved the underlying methodology. (As such, the charts are not directly comparable to develop insights into year-over-year changes.)
Website visualizations shown at a weekly granularity cover the period from January 2 through November 26, 2022 (the start of the first full week of the year through the end of the last full week of November). We plan to update the underlying data sets through the end of the year in early 2023. Trends for nearly 200 locations are available on the website, with some smaller or less populated locations excluded due to insufficient data.
Before we jump in, we urge anyone who prefers to see the headline stats up front and to explore the data themselves to go ahead and visit the website. Anyone who wants a more lengthy, but curated set of observations should continue reading below. Regardless, we encourage you to consider how the trends presented within this post and the website’s various sections impact your business or organization, and to think about how these insights can inform actions that you can take to improve user experience or enhance your security posture.
Traffic
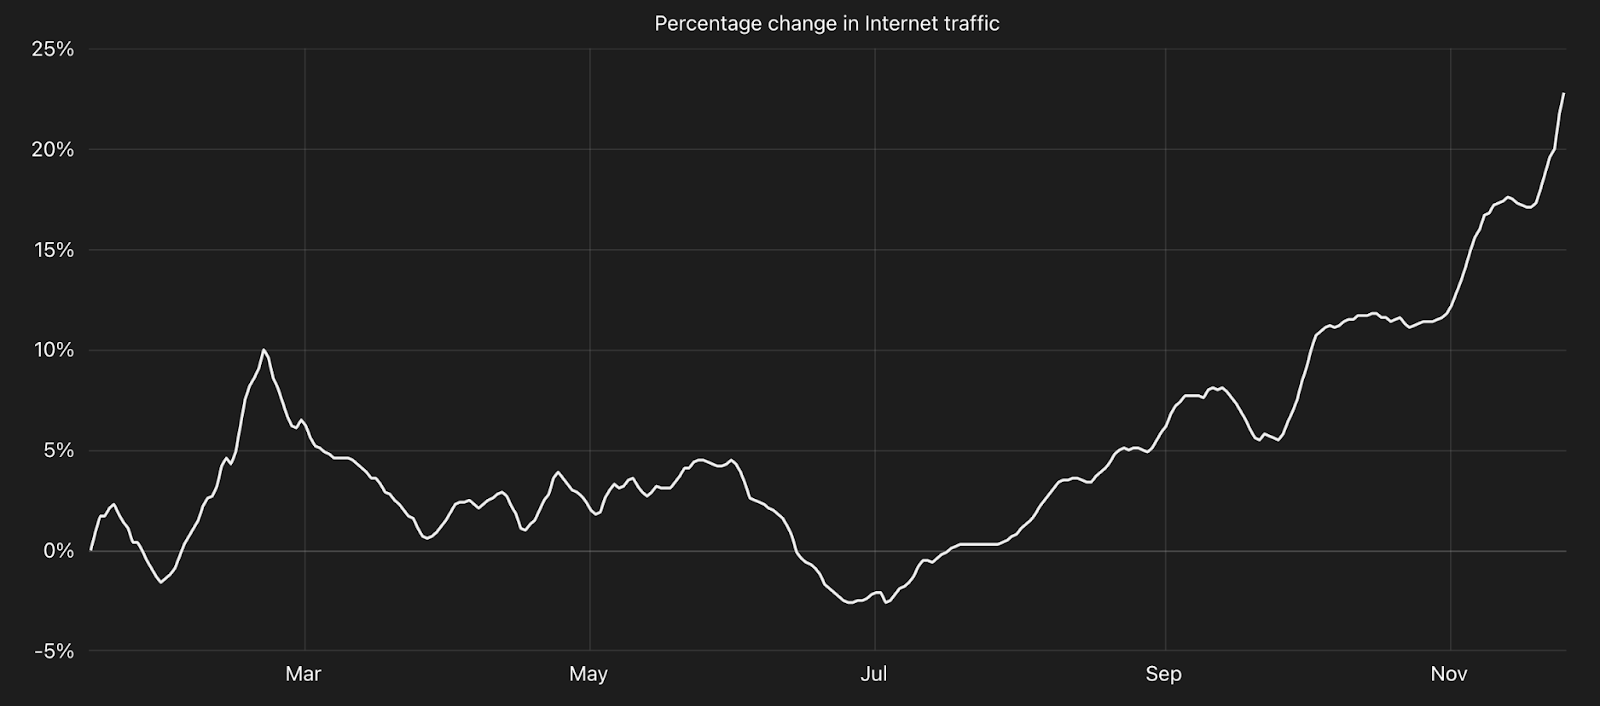
Anyone following recent technology headlines might assume that the Internet’s decades-long trend of incredible growth would have finally begun to falter. In times like these, data is key. Our data indicates that global Internet traffic, which grew at 23% this year, is as robust as ever.
To determine the traffic trends over time, we first established a baseline, calculated as the average daily traffic volume (excluding bot traffic) over the second full calendar week (January 9-15) of 2022. We chose the second calendar week to allow time for people to get back into their “normal” routines (school, work, etc.) after the winter holidays and New Year’s Day. The percent change shown on the trend lines in our charts are calculated relative to the baseline value, and represents a seven-day trailing average — it does not represent absolute traffic volume for a location. The seven-day averaging is done to smooth the sharp changes seen with a daily granularity.
In addition to calculating traffic growth, our 1.1.1.1 public DNS resolver and broad global customer base enables us to have a unique view into online activity. This includes insights into the most popular types of Internet content and the most popular Internet services in general and across specific categories, as well as the impact of bots. Of course, none of this matters if connectivity is unavailable, so we also drill down into major Internet disruptions observed in 2022.
Traffic trends
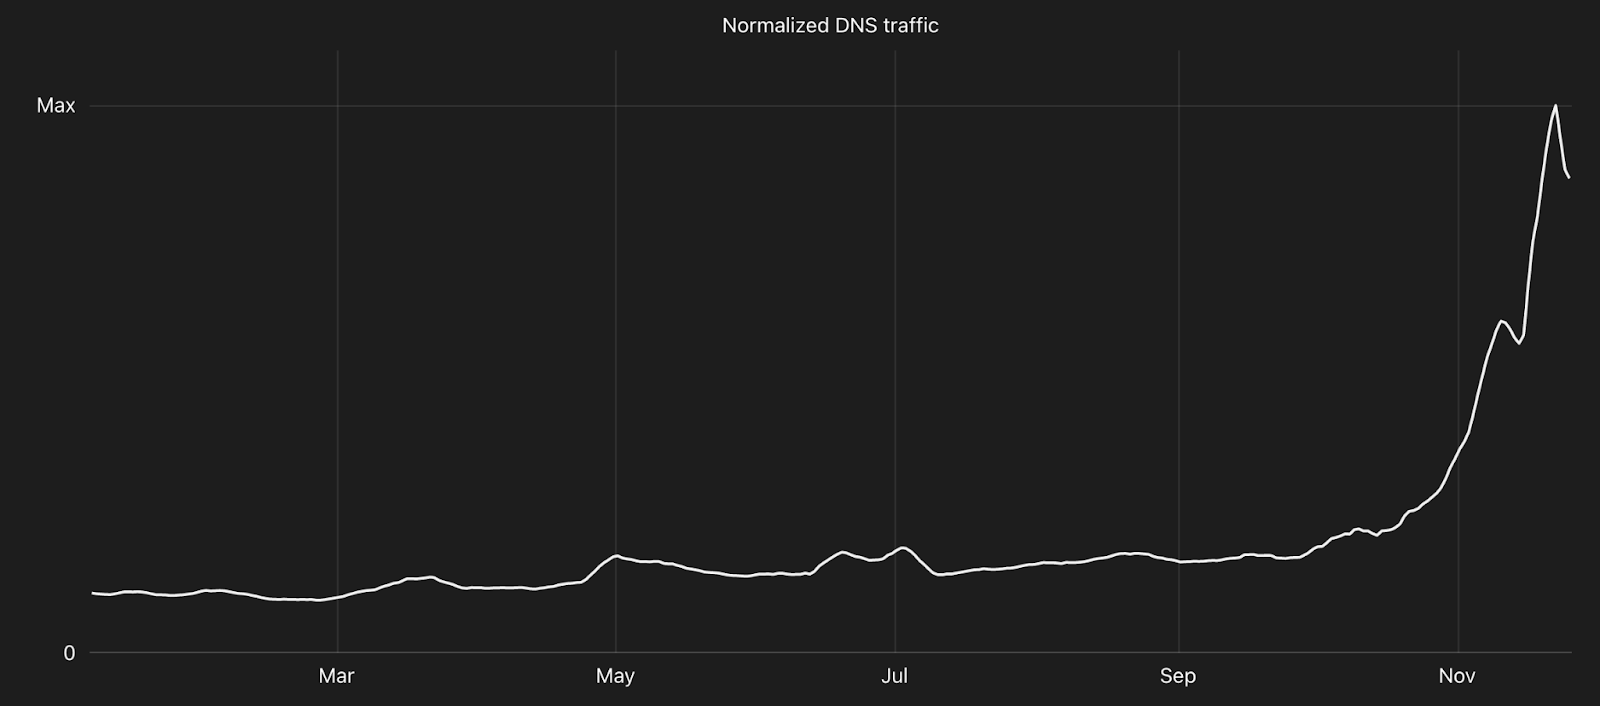
After an initial dip, worldwide Internet traffic saw nominal growth coinciding with the 2022 Olympic Winter Games in Beijing, but slipped again in the weeks after their conclusion. After a couple of months of slight growth, traffic again dipped below baseline heading into July. However, after reaching that nadir, Internet traffic experienced a fairly consistent rate of growth through the back part of the year. An upwards inflection at the end of November is visible in the worldwide traffic graph as well as the traffic graphs of a number of locations. Traffic analysis showed that this increase resulted from the convergence of early holiday shopping traffic (to e-commerce sites) with the run-up to and early days of FIFA World Cup Qatar 2022.
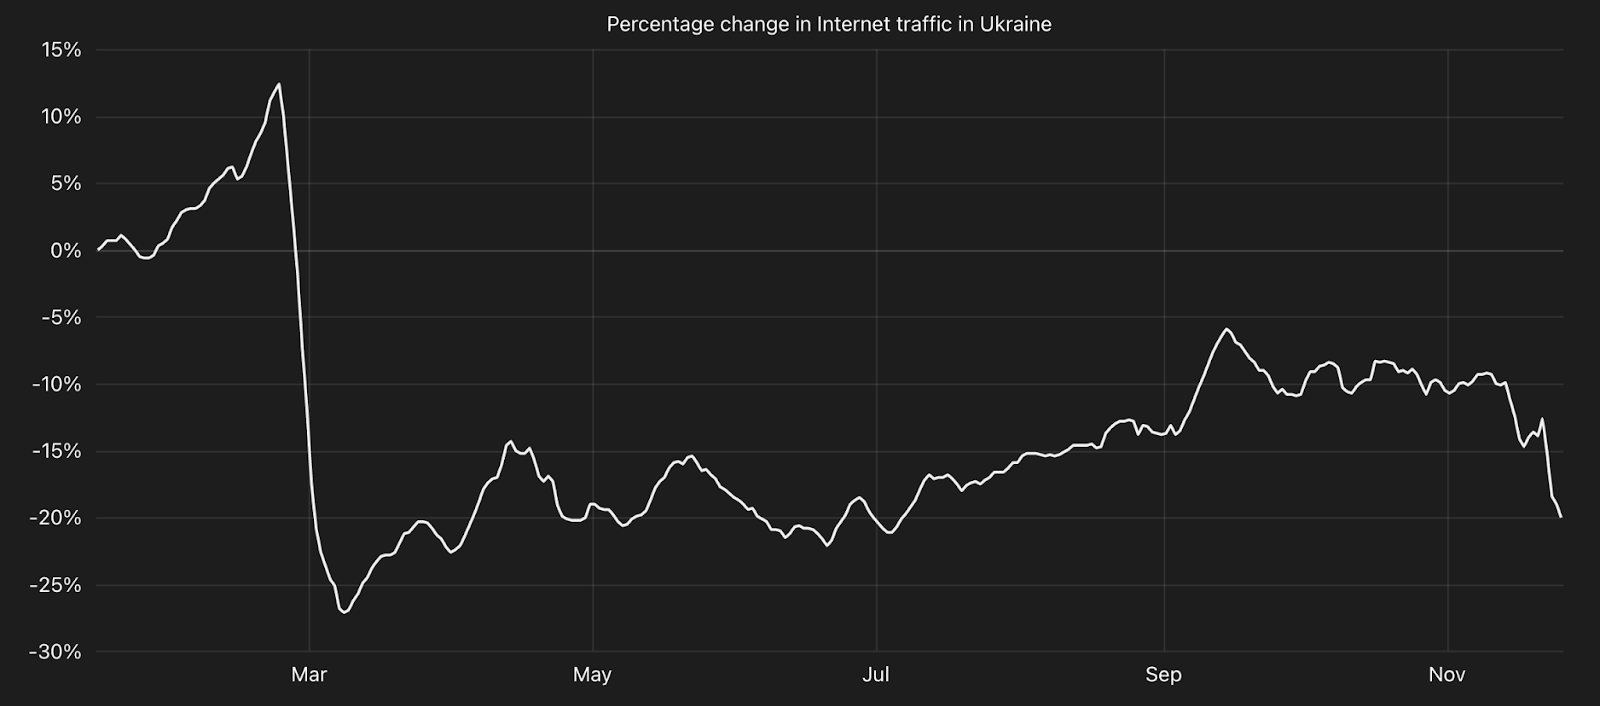
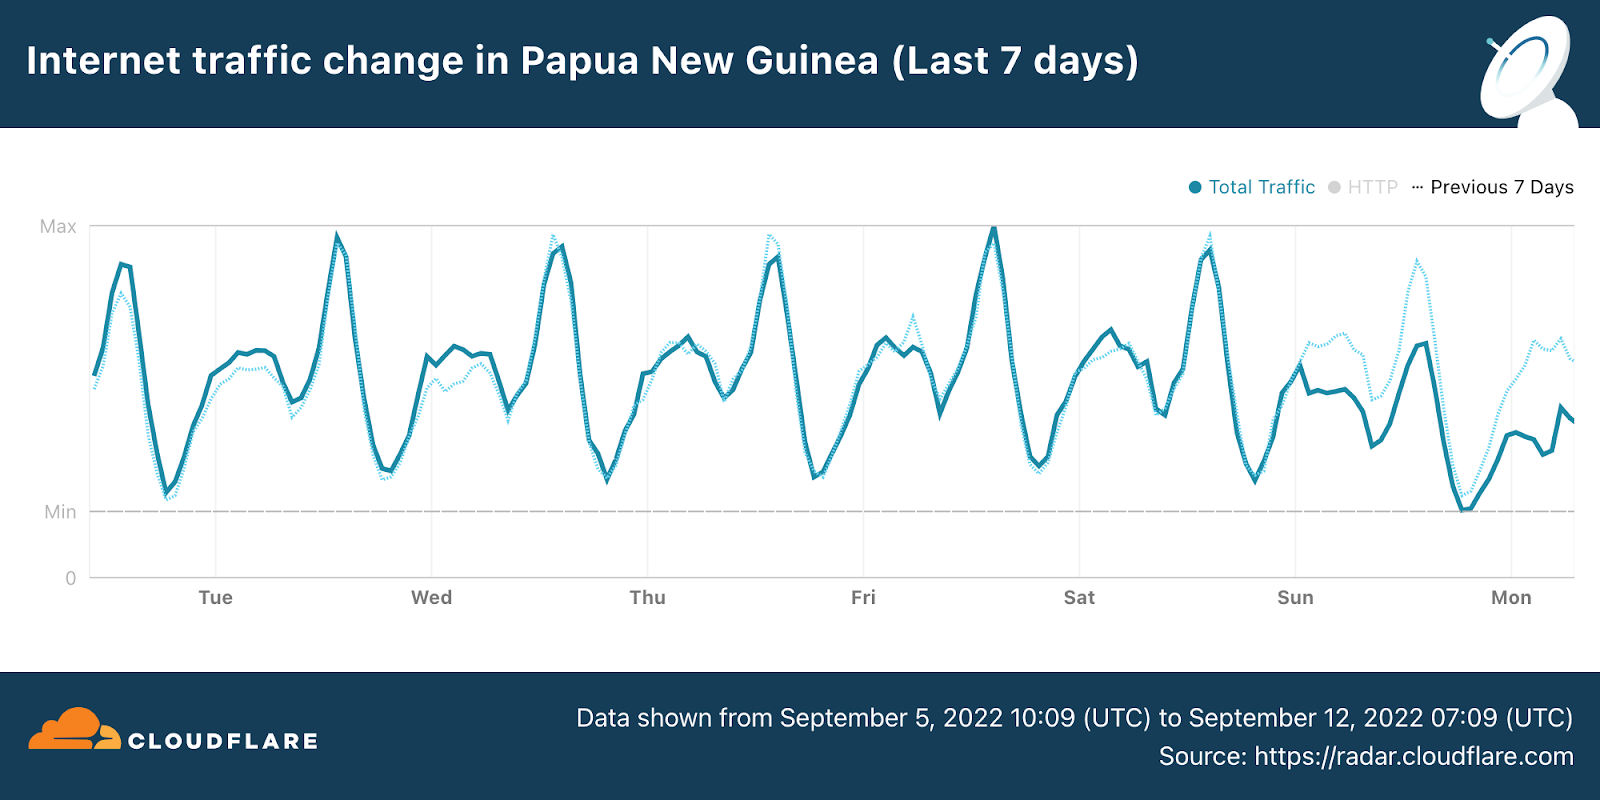
The An Update on Cloudflare’s assistance to Ukraine blog post published during Impact Week looked at the conflict from an attack perspective. Viewing Ukraine through an Internet traffic lens provides unique insights into the impacts of the war’s damage and destruction to Internet connectivity within the country. After starting the year with some nominal traffic growth, that trend was quickly reversed once the Russian invasion began on February 24, with traffic quickly falling as infrastructure was damaged and the populace focused on finding safety and shelter. Although traffic started to grow again after that initial steep decline, drops in May and June appear to be correlated with significant outages observed by Cloudflare. After returning to growth during August, several additional disruptions were visible in September, October, and November coincident with widespread power outages across the country resulting from Russian attacks.
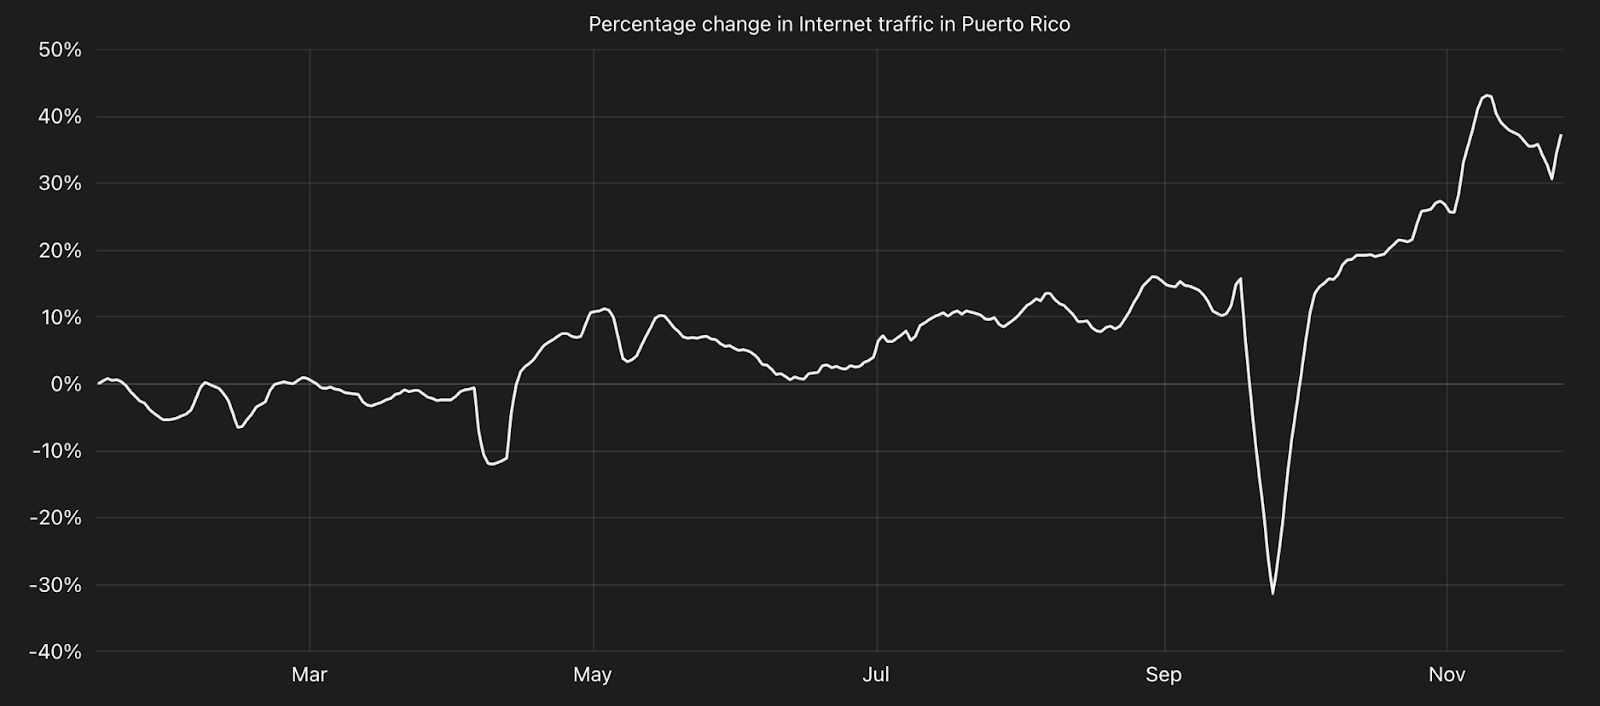
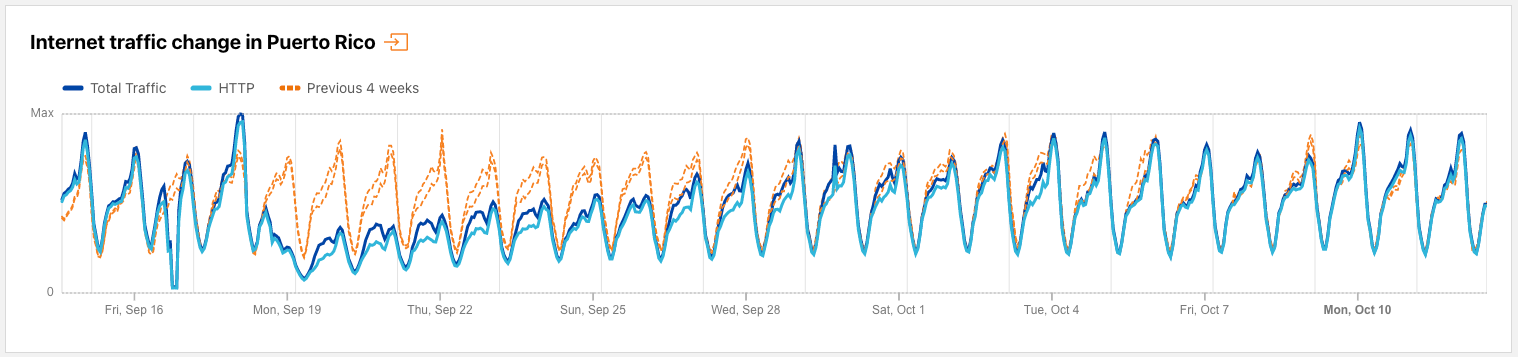
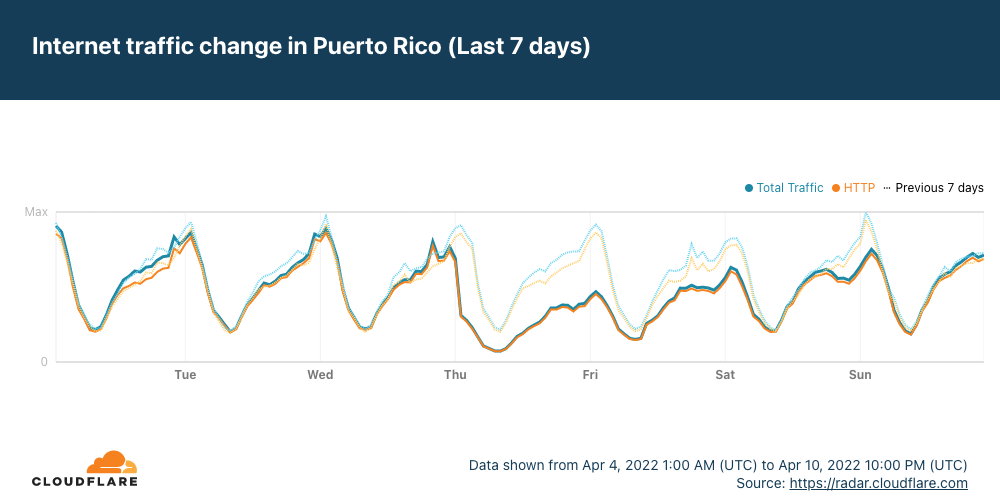
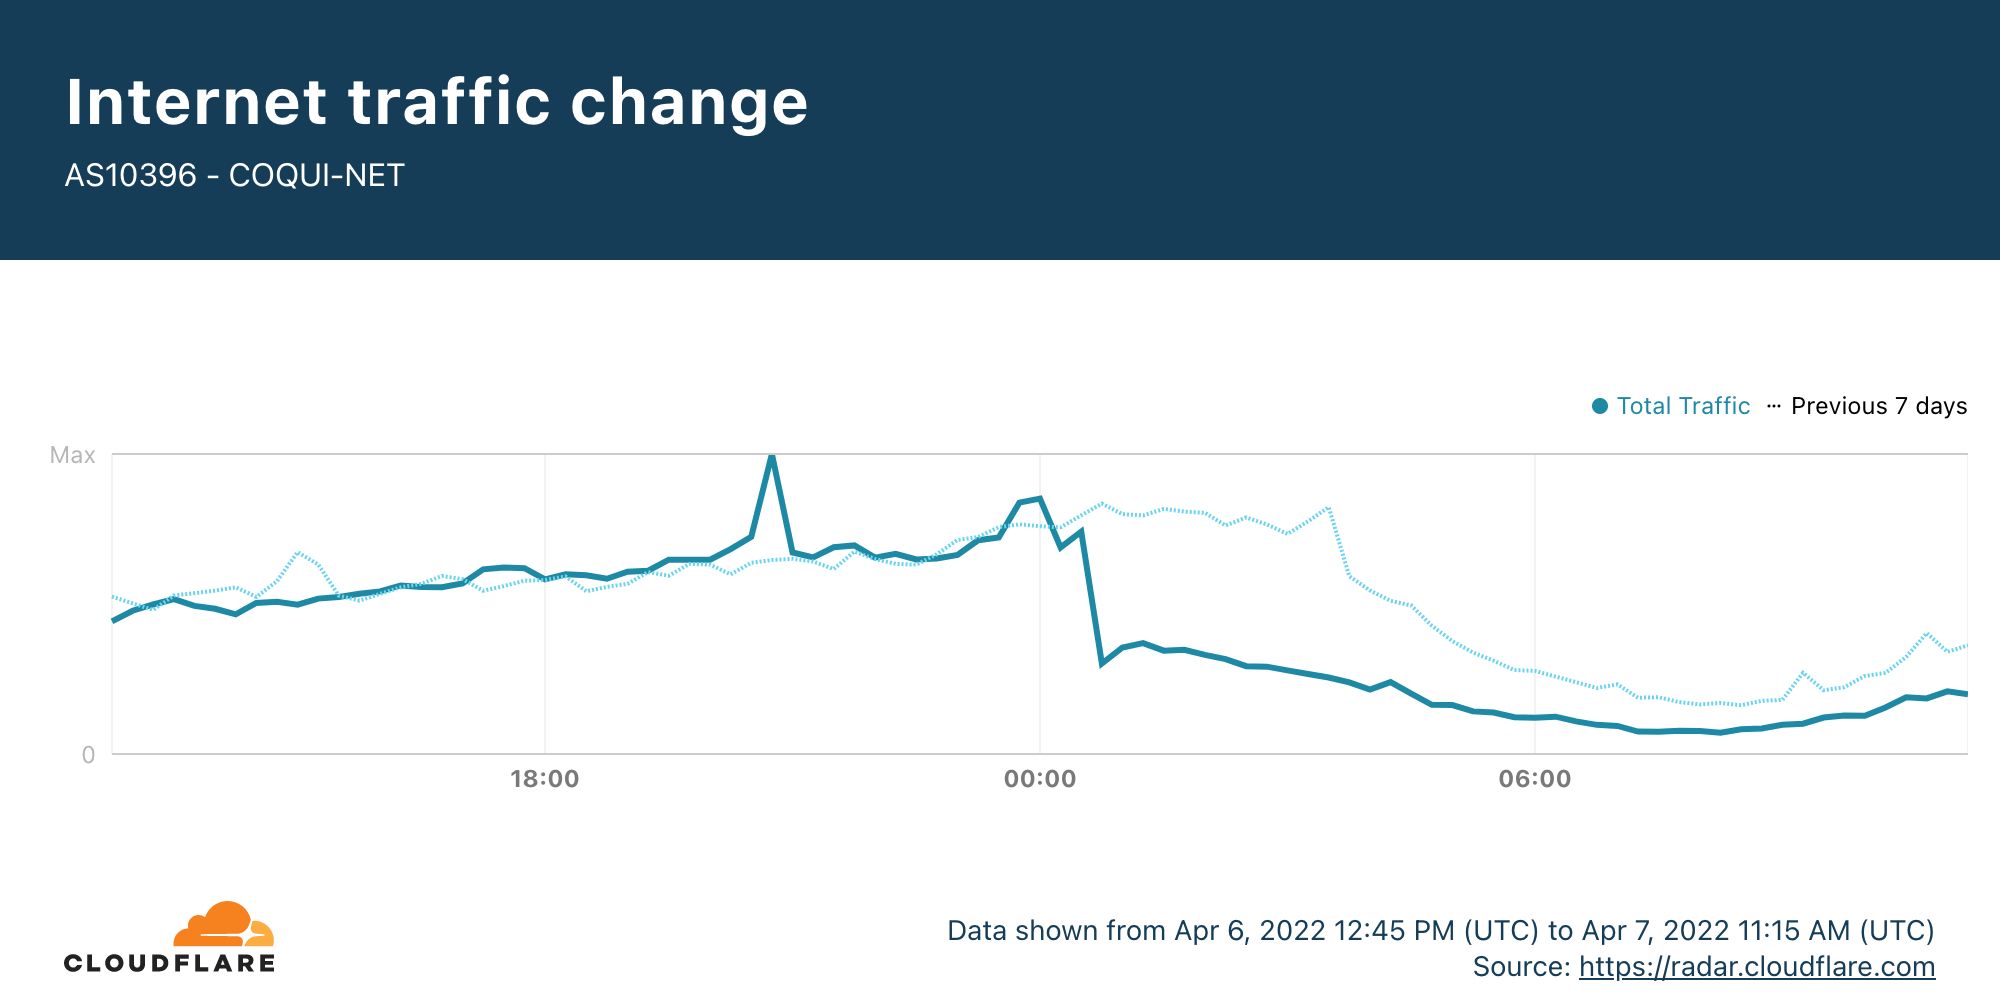
Reliable electric power is critical for reliable Internet connectivity, both for the core network infrastructure in data centers, as well as for last-mile infrastructure like cell towers and Wi-Fi routers, as well as laptops, cellphones, and other devices used to access the Internet. For several years, the residents of Puerto Rico have struggled to contend with an unreliable electric grid, resulting in frequent power outages and slow restoration times. In 2022, the island suffered two multi-day power outages that clearly impacted otherwise strong traffic growth. In April, a fire at a power plant caused an outage that lasted three days, disrupting Internet connectivity during that period. In September, widespread power outages resulting from damage from Hurricane Fiona resulted in a rapid drop in Internet traffic with the disruption lasting over a week until power restoration work and infrastructure repair was completed.
Top categories
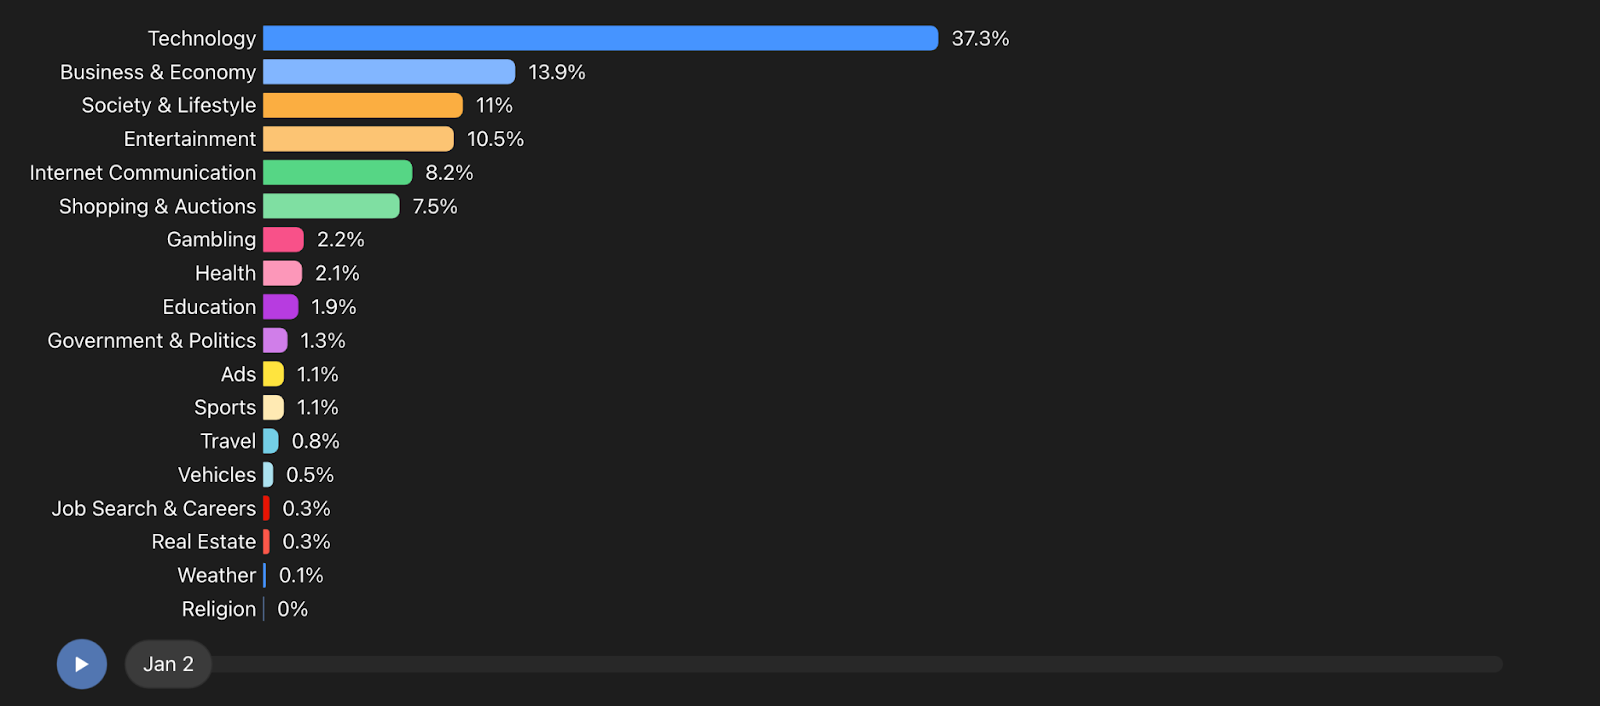
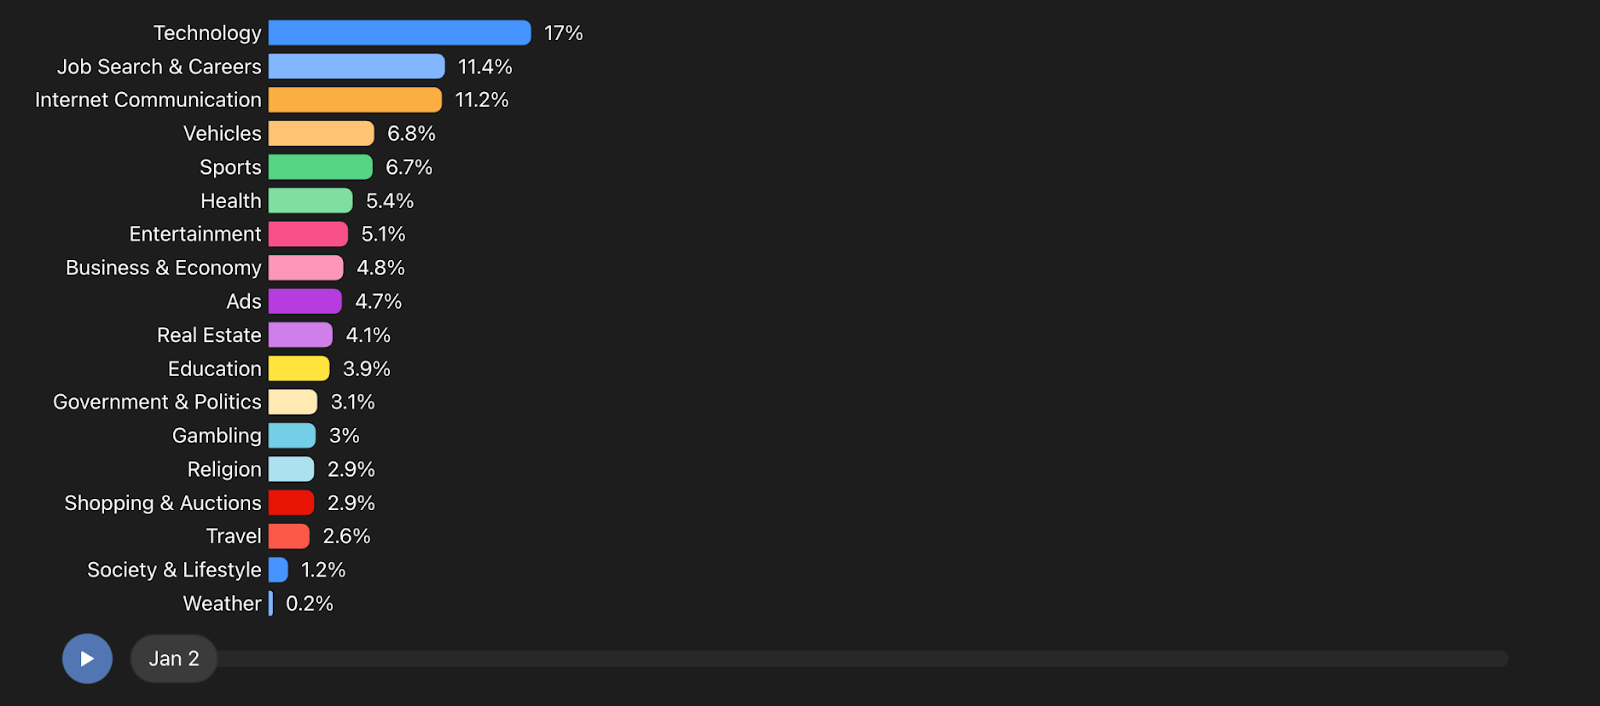
Cloudflare’s global customer base spans a range of industry categories, including technology, e-commerce, and entertainment, among others. Analysis of the traffic to our customers’ websites and applications reveals which categories of content were most popular throughout the year, and can be broken out by user location. The domains associated with each customer zone have one or more associated categories — these can be viewed on Cloudflare Radar. To calculate the distribution of traffic across the set of categories for each location, we divided the number of requests for domains associated with a given category seen over the course of a week by the total number of requests mapped to a category seen over that week, filtering out bot traffic. If a domain is associated with multiple categories, then the associated request was included in the aggregate count for each category. The chart shows how the distribution of requests across the selected categories changes over the course of the year.
Globally, sites in the Technology category were the most popular, accounting for approximately one-third of traffic throughout the year. The next most popular category was Business & Economy, which drove approximately 15% of traffic. Shopping & Auctions also saw a bump in traffic in November, as consumers began their holiday shopping.
In sharp contrast to other Asian countries, in South Korea, Internet Communication was consistently the second most popular category during the year. Elsewhere, Internet Communication was occasionally among the top five, but usually within the top 10. Internet Communication was followed closely by Entertainment and Business & Economy. The former saw multiple periods of increased traffic through the year, in contrast to other categories, which saw traffic share remain fairly consistent over time.
Traffic distribution in Turkey represented a rare departure from most other locations around the world. Although Technology started the year as the most popular category, its popularity waned during the back half of the year, ending below Shopping & Auctions and Society & Lifestyle. These latter two saw gradual growth starting in September, and posted larger increases in November. Business & Economy and Entertainment sites were comparatively less popular here, in contrast to many other locations.
Armenia’s traffic distribution also ran counter to that seen in most other locations. Entertainment was the most popular category for nearly the entire year, except for the final week of November. Technology was generally the second most popular category, although it was surpassed by Gambling several times throughout the year. However, Gambling saw its popularity fall significantly in November, as it was surpassed by the Shopping & Auctions and Business & Economy categories.
Most popular Internet services
The luxury of being a popular Internet service is that the service’s brand becomes very recognizable, so it will be no surprise that Google was #1 in our General ranking.
Top 10 — General, late 2022 ranking 1. Google 2. Facebook 3. Apple, TikTok (tie) 5. YouTube 6. Microsoft 7. Amazon Web Services 8. Instagram 9. Amazon 10. iCloud, Netflix, Twitter, Yahoo (tie)
Last year TikTok was at the top of our ranking. However, the results between the two years aren’t comparable. As part of our launch of Radar 2.0, we introduced improvements to our domain ranking algorithms, and this year’s rankings are based on those new algorithms. In addition, this year we have grouped domains that all belong to a single Internet service. For example, Google operates google.com, google.pt, and mail.google.com among others, so we aggregated the popularity of each domain under a single “Google” Internet service for simplicity. However, while Meta operates both Facebook and Instagram, consumers typically perceive those brands as distinct, so we decided to group domains associated with those services separately.
Zooming out from our General top 10, the anonymized DNS query data from our 1.1.1.1 public DNS resolver reflects traffic from millions of users around the world, enabling us to offer category specific rankings as well. While you can view them all in the “Most popular Internet services” section of our Year in Review website, we’ve decided to highlight a few of our favorite observations below.
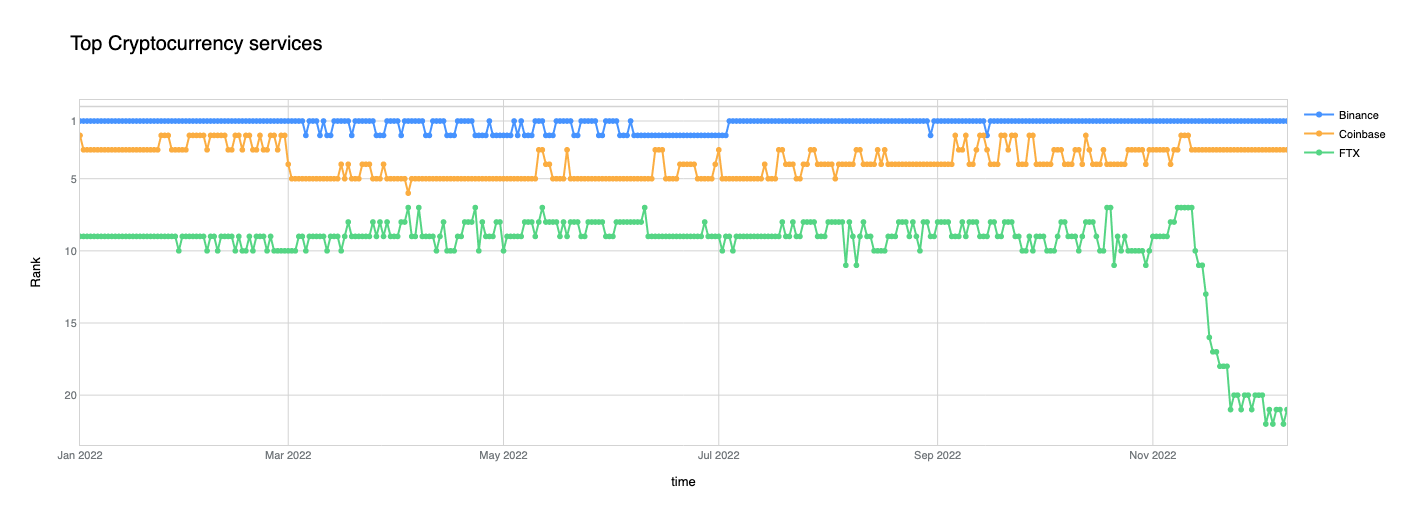
Cryptocurrencies always seem to have as much promise as they have controversy. We couldn’t help but be curious about which cryptocurrency services were the most popular. But before jumping into the Top 10, let’s double-click on one that fell out of the running: FTX. Known as the third largest cryptocurrency exchange in the world, our popularity ranking shows it hovered around 9th place for most of the year. That is, until it filed for bankruptcy in November. At that point, there is a precipitous drop, which also appears to coincide with reports that FTX disabled its users’ ability to make cryptocurrency withdrawals. Moving back to the Top 10, the two other major cryptocurrency exchanges, Binance and Coinbase, ranked #1 and #3 respectively and don’t appear to have been adversely impacted by FTX in our rankings.
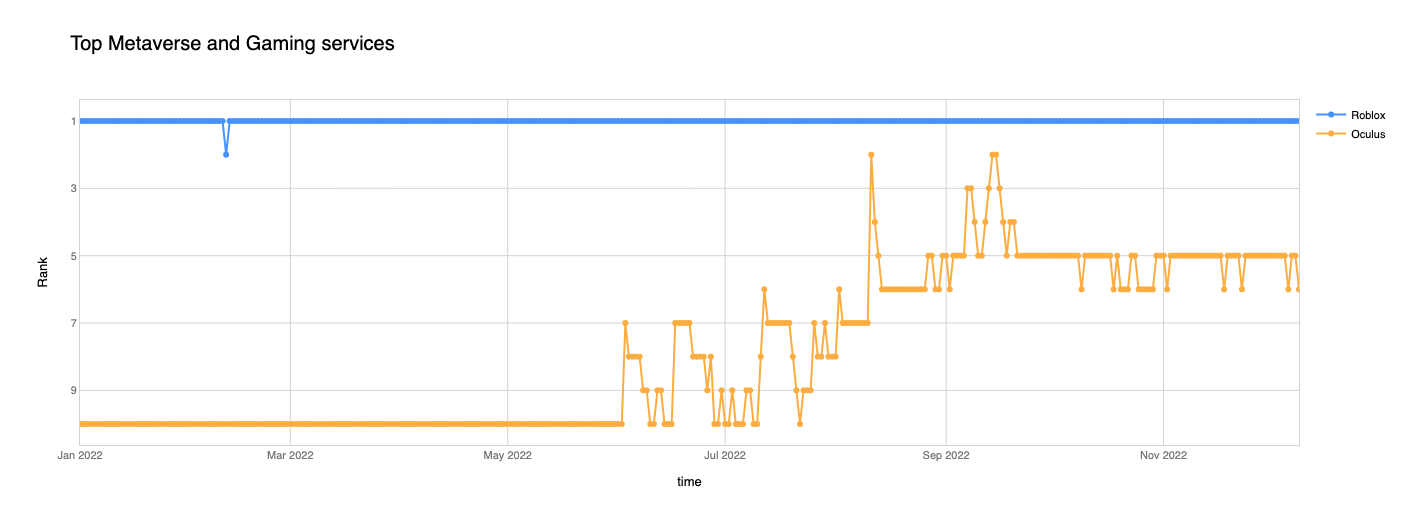
The universe has been the hottest place to be since the beginning of time, but some suggest that we’ll all soon be in the metaverse. If that’s true, then the question becomes “Whose metaverse?”. Last year, Facebook changed its name to Meta as it poured billions of dollars into the space, so we were curious about the impact of their efforts on the metaverse landscape one year later. With Meta’s Oculus offering their initial foray into the metaverse, our data indicates that while its popularity saw tangible improvements, rising from 10th to 5th in the back half of the year, Roblox is clearly the champion of the metaverse arena. It is fascinating to see this smaller challenger dominating Oculus, which is operated by Meta, a company ~18x larger in market capitalization. We are excited to check back at the end of 2023 to see whether Oculus’ ascent of the rankings topples Roblox, or if the smaller player retains the crown.
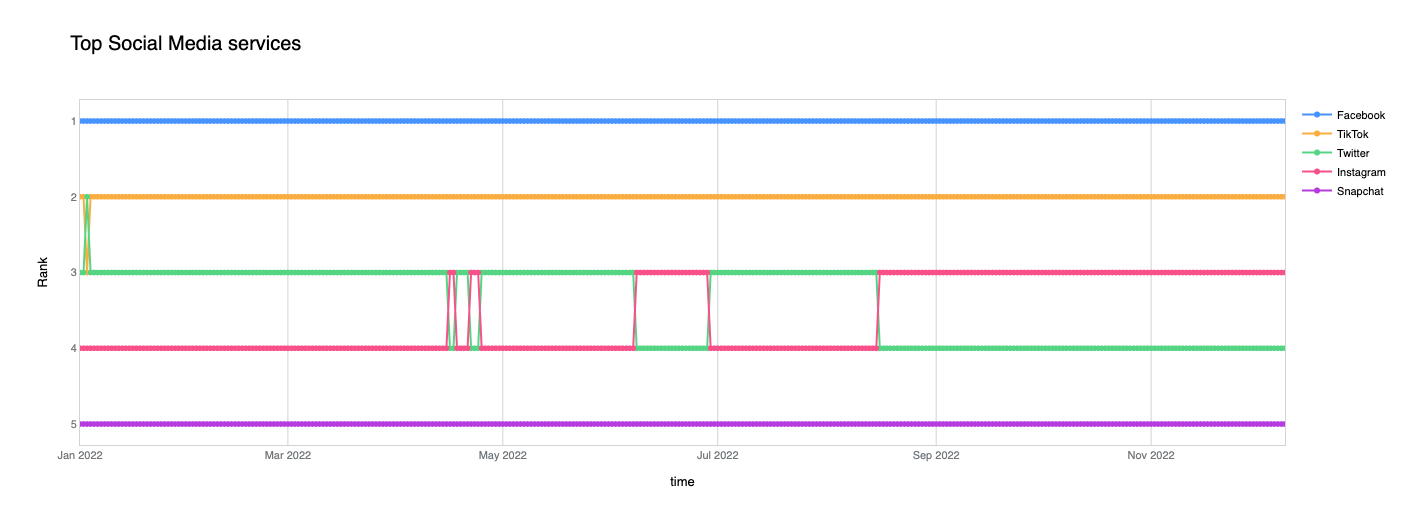
Facebook’s transition to Meta, however, does not appear to have impacted its popularity as a social media platform. Within our ranking of the top social media platforms, Facebook held the top position throughout the year. TikTok and Snapchat also held steady in their places among the top five. Instagram and Twitter traded places several times mid-year, but the photo and video sharing app ultimately knocked Twitter from 3rd place in August. More active volatility was seen in the bottom half of the top 10, as LinkedIn, Discord, and Reddit frequently shifted between sixth, seventh, and eighth position in the rankings.
While those are the most popular sites today, over the last 20+ years, the landscape of social media platforms has been quite dynamic, with new players regularly emerging. Some gained a foothold and became successful, while others became a footnote of Internet history. Although it has actually been around since 2016, Mastodon emerged as the latest potential disruptor in the space. In a landscape where the top social media platforms operate closed-source, centralized platforms, Mastodon offers free, open source software to allow anyone to start their own social networking platform, built around a decentralized architecture, and easily federated with others.
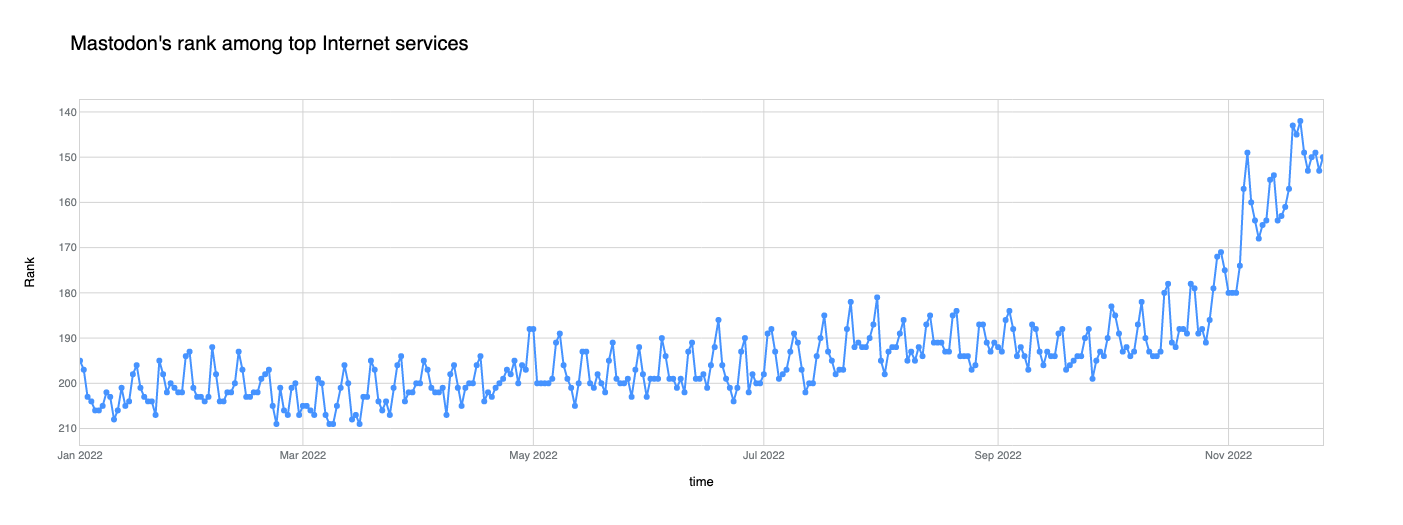
Aggregating the domain names used by 400 top Mastodon instances, this cohort started the year hovering around the #200 rank of most popular services overall. Its position in the overall rankings steadily improved throughout the year, hitting an inflection point in November, moving up about 60 positions. This trend appears to be driven by a spike in interest and usage of Mastodon, which we elaborate on in the Adoption section below.
Bot traffic
Bot traffic describes any non-human traffic to a website or an app. Some bots are useful, such as those that monitor site and application availability or search engine bots that index content for search, and Cloudflare maintains a list of verified bots known to perform such services. However, visibility into other non-verified bot activity is just as, if not more, important as they may be used to perform malicious activities, such as breaking into user accounts or scanning the web for exposed vulnerabilities to exploit. To calculate bot traffic percentages, we used the bot score assigned to each request to identify those made by bots, and then divided the total number of daily requests from these bots by the total number of daily requests. These calculations were done both globally and on a per-location basis. The line shown in the trends graph represents a seven-day trailing average. For the top 10 chart, we calculated the average bot percentage on a monthly basis per location, and then ranked the locations by percentage. The chart illustrates the ranking by month, and how those rankings change across the year.
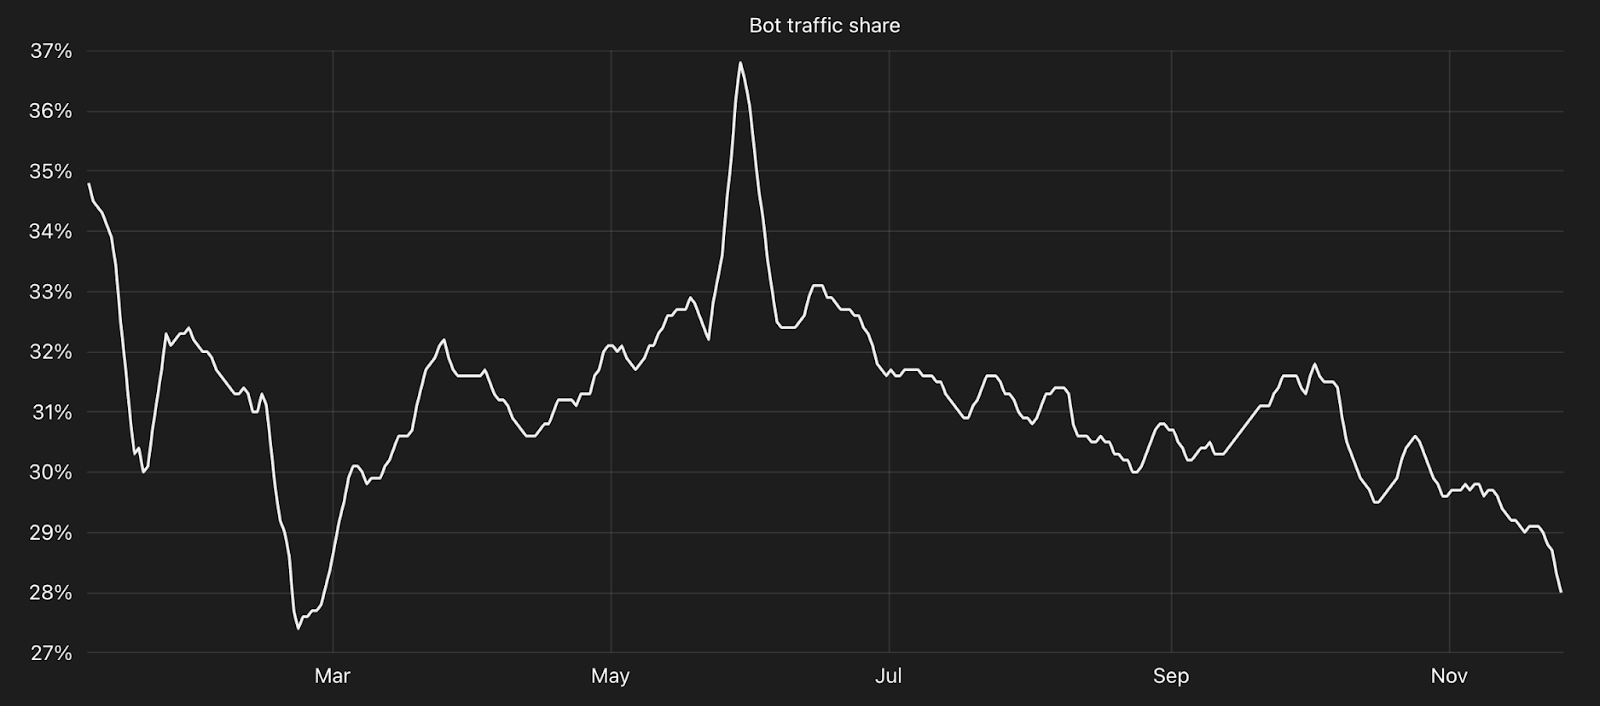
Globally, bots generally accounted for between 30-35% of traffic over the course of the year. Starting January at around 35%, the percentage of bot traffic dropped by nearly a quarter through the end of February, but then reclaimed some of that loss, staying just above 30% through October. A slight downward trend is evident at the start of November, due to human traffic increasing while bot traffic remained fairly consistent. Despite a couple of nominal spikes/drops, the global trend exhibited fairly low volatility overall throughout the year.
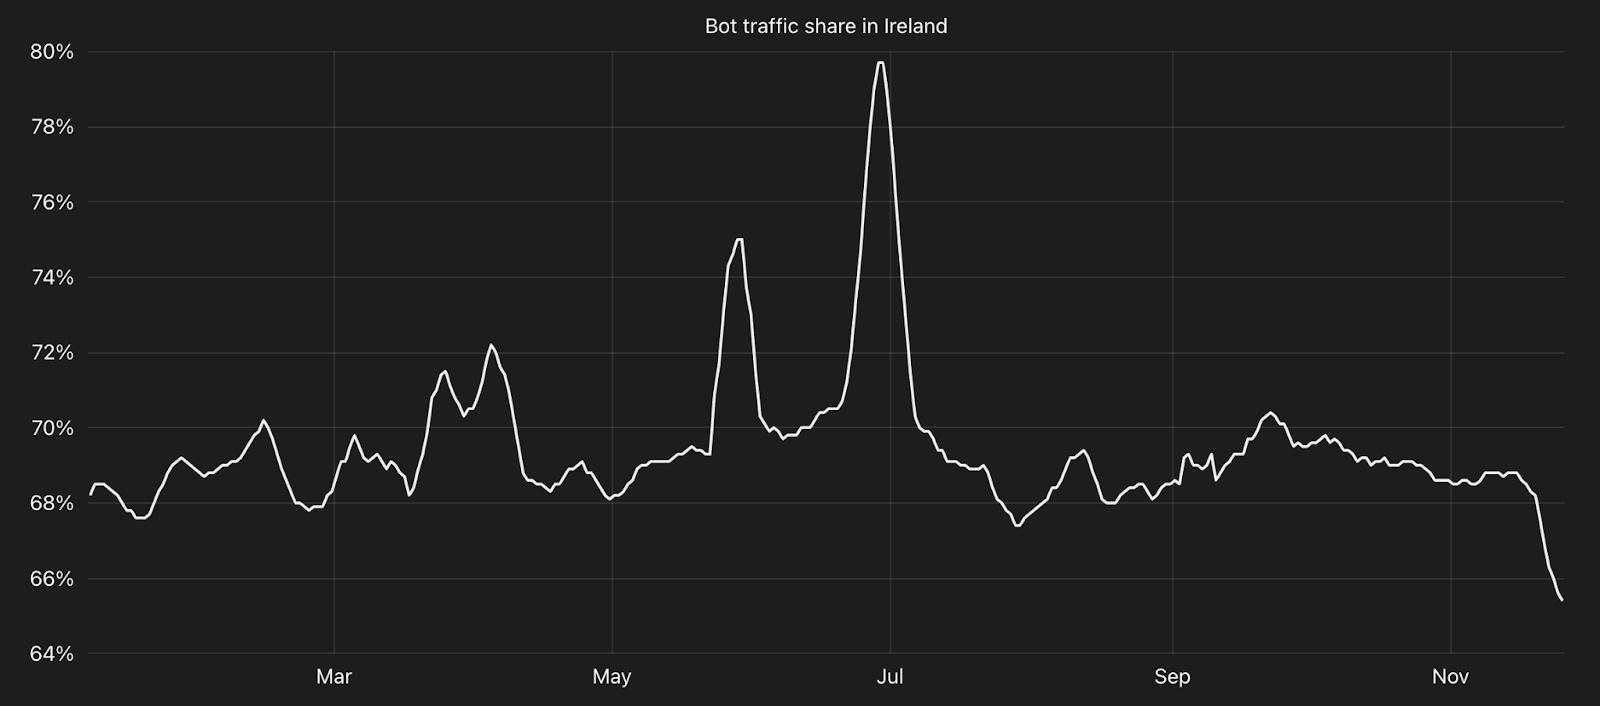
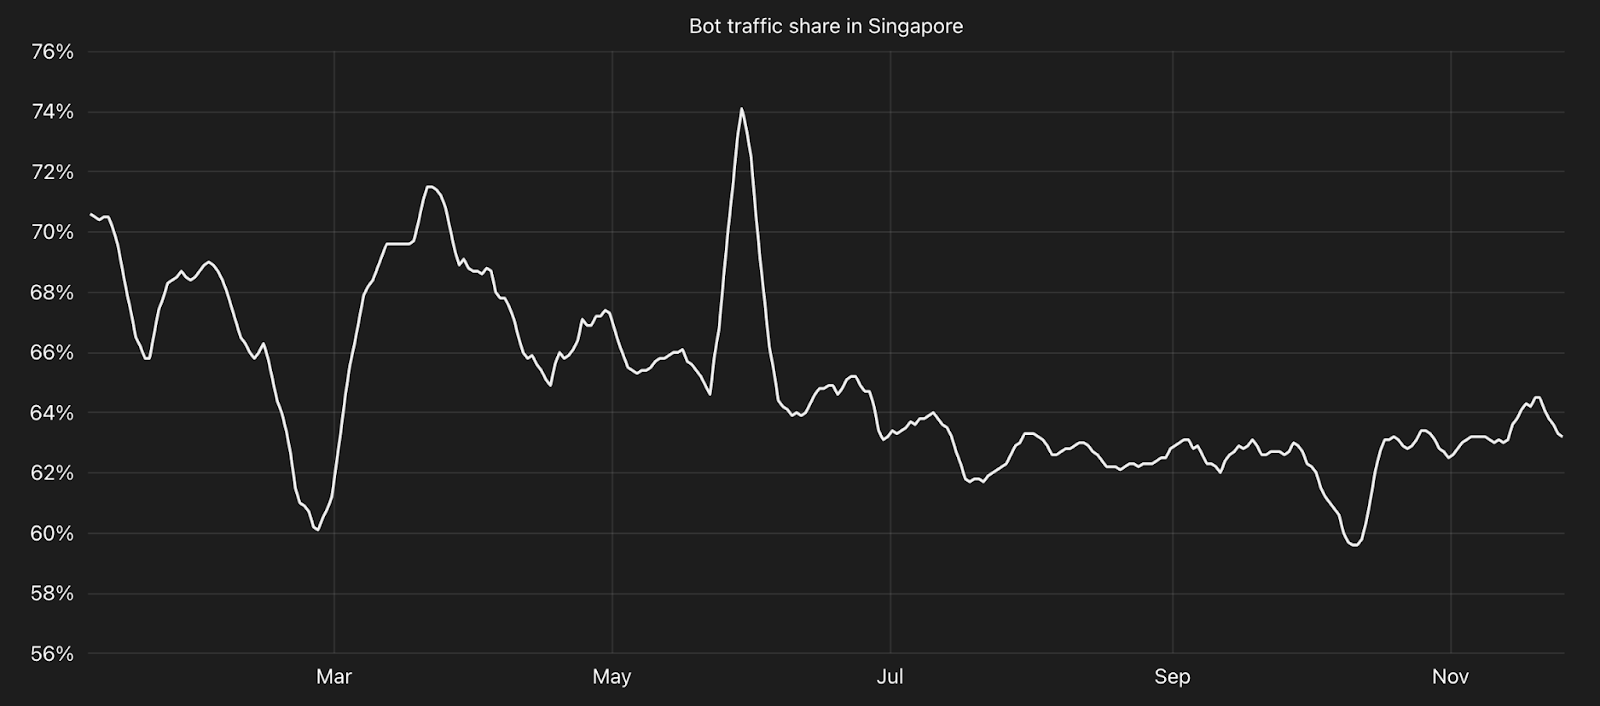
While around one-third of global traffic was from bots, two locations stood out with bot traffic percentages double the global level. Except for two brief mid-year spikes, just under 70% of traffic from Ireland was classified as bot-driven. Similarly, in Singapore, bot traffic consistently ranged between 60-70% across the year. Bots account for the majority share of traffic from these locations due to the presence of local “regions” from multiple cloud platform providers in each. Because doing so is easily automated and free/inexpensive, attackers will frequently spin up ephemeral instances in these clouds in order to launch high volume attacks, such as we saw with the “Mantis” attack in June. (Internal traffic analysis indicates that a significant portion of traffic for these two geographies is from cloud provider networks and that the vast majority of traffic we see from these networks is classified as bot traffic.)
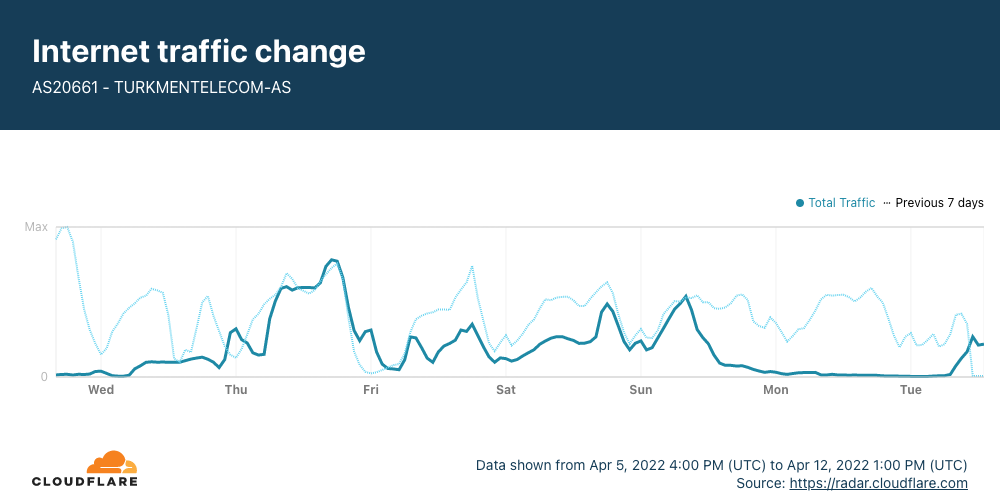
The top 10 list of locations with the highest percentage of bot traffic saw a fair amount of movement throughout the year, with four different locations holding the top slot at some point during the year, although Turkmenistan spent the most time at the top of the list. Overall, 17 locations held a spot among the top 10 at some point during 2022, with greater concentrations in Europe and Asia.
Internet outages
Although the metrics included in the 2022 Year In Review were ultimately driven by Internet traffic to Cloudflare from networks and locations around the world, there are, unfortunately, times when traffic is disrupted. These disruptions can have a number of potential causes, including natural disasters and extreme weather, fiber optic cable cuts, or power outages. However, they can also happen when authoritarian governments order Internet connectivity to be shutdown at a network, regional, or national level.
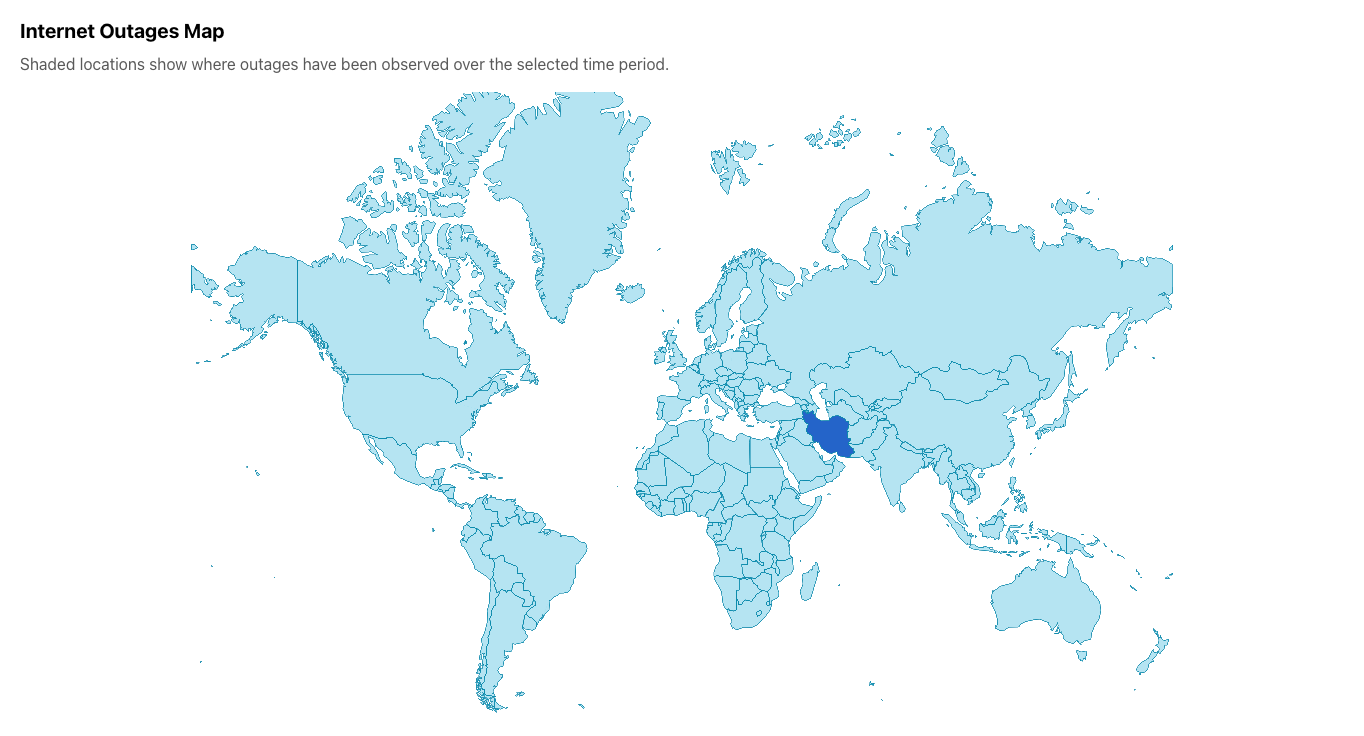
We saw examples of all of these types of Internet disruptions, and more, during 2022, and aggregated coverage of them in quarterly overview blog posts. With the launch of Radar 2.0 in September, we also began to catalog them on the Cloudflare Radar Outage Center. These disruptions are most often visible as drops in Cloudflare traffic from a given network, region, or country. The 2022 Year In Review website illustrates where these disruptions occurred throughout the year. Some notable outages observed during 2022 are highlighted below.
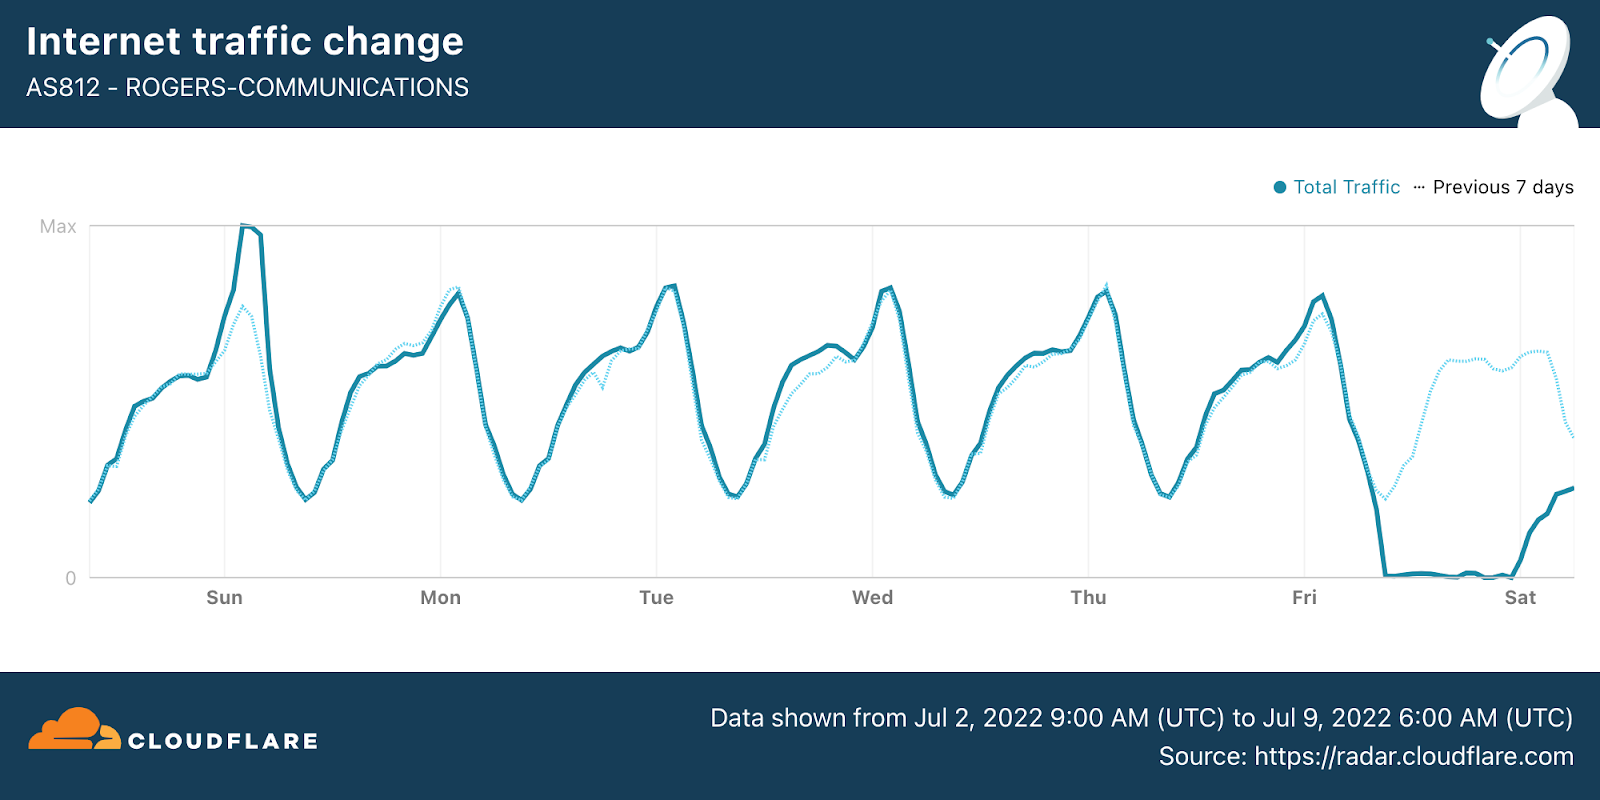
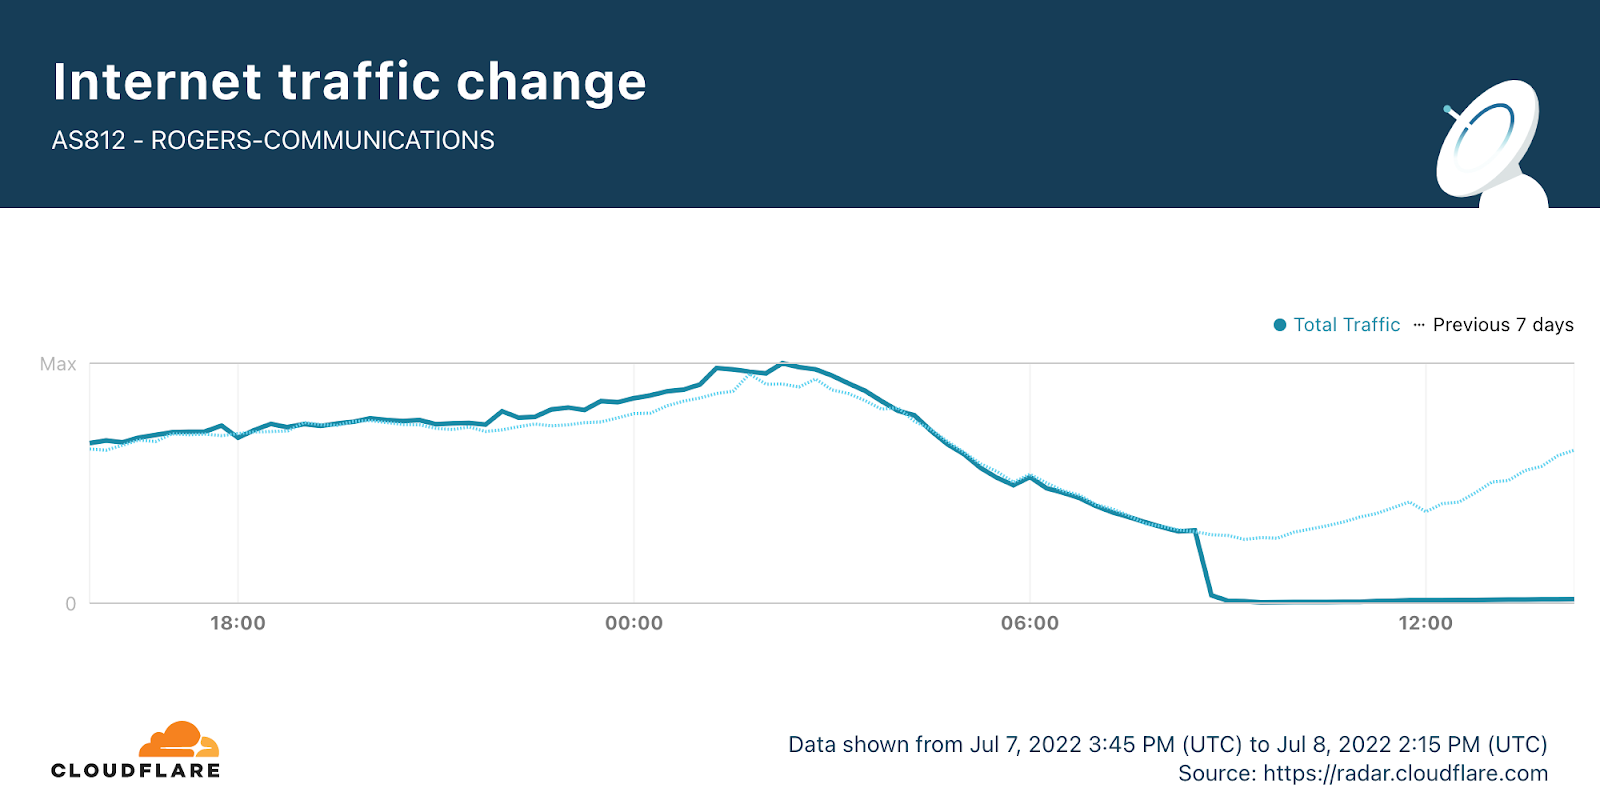
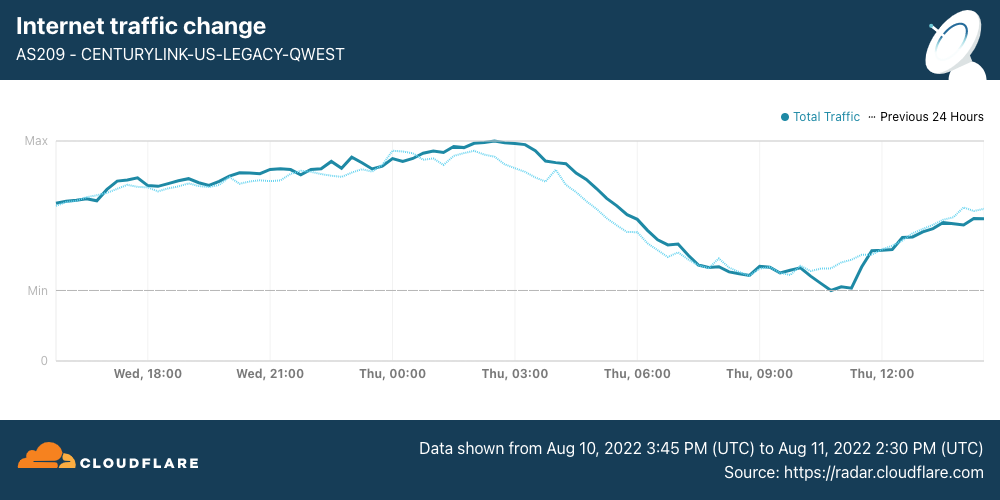
One of the most significant Internet disruptions of the year took place on AS812 (Rogers), one of Canada’s largest Internet service providers. During the morning of July 8, a near complete loss of traffic was observed, and it took nearly 24 hours for traffic volumes to return to normal levels. A Cloudflare blog post covered the Rogers outage in real-time as the provider attempted to restore connectivity. Data from APNIC estimates that as many as five million users were directly affected, while press coverage noted that the outage also impacted phone systems, retail point of sale systems, automatic teller machines, and online banking services. According to a notice posted by the Rogers CEO, the outage was attributed to “a network system failure following a maintenance update in our core network, which caused some of our routers to malfunction”.
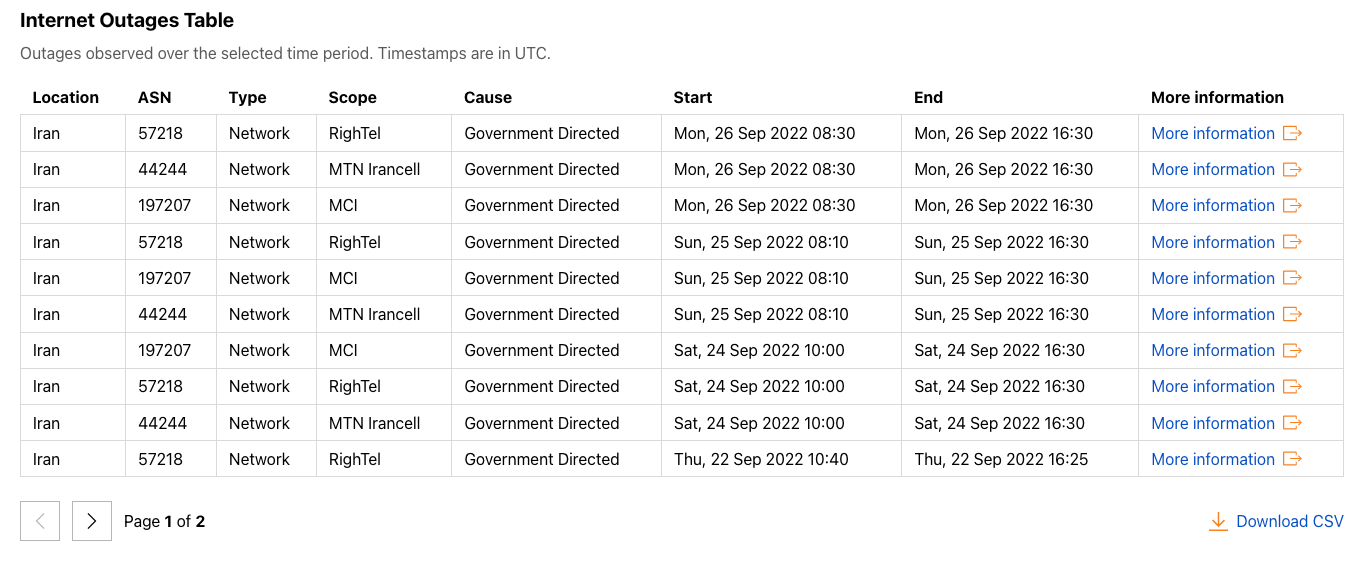
Three of the major mobile network providers — AS44244 (Irancell), AS57218 (RighTel), and AS197207 (MCCI) — started implementing daily Internet “curfews” on September 21, generally taking place between 1600 and midnight local time (1230-2030 UTC), although the start times varied on several days. These regular shutdowns lasted into early October, with several more ad-hoc disruptions taking place through the middle of the month, as well as other more localized shutdowns of Internet connectivity. Over 75 million users were impacted by these shutdowns, based on subscriber figures for MCCI alone.
Cable cuts are also a frequent cause of Internet outages, with an old joke among network engineers that suggested that backhoes were the Internet’s natural enemy. While backhoes may be a threat to terrestrial fiber-optic cable, natural disasters can wreak havoc on submarine cables.
A prime example took Tonga offline earlier this year, when the Hunga Tonga–Hunga Ha’apai volcanic eruption damaged the submarine cable connecting Tonga to Fiji, resulting in a 38-day Internet outage. After the January 14 eruption, only minimal Internet traffic (via limited satellite services) was seen from Tonga. On February 22, Digicel announced that the main island was back online after initial submarine cable repairs were completed, but it was estimated that repairs to the domestic cable, connecting outlying islands, could take an additional six to nine months. We saw rapid growth in traffic from Tonga once the initial cable repairs were completed.
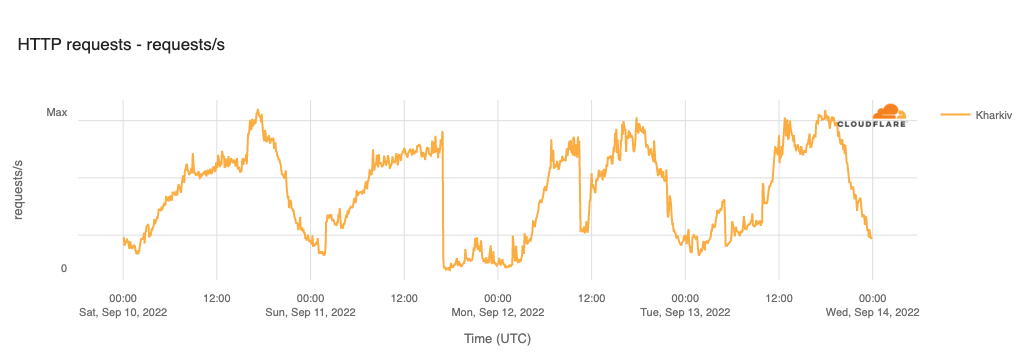
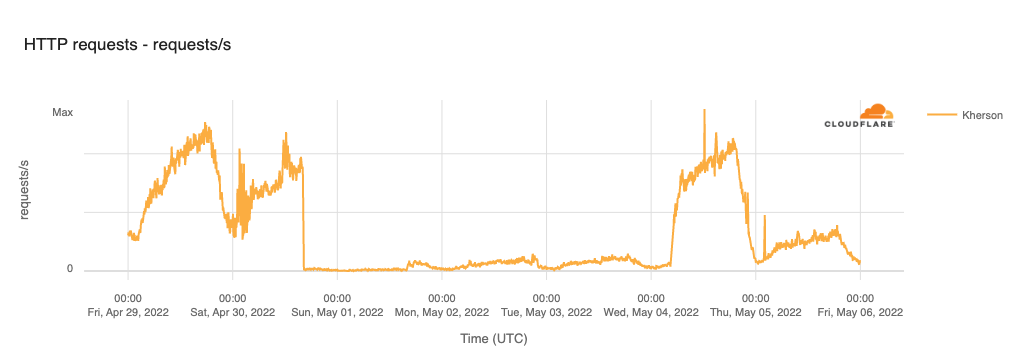
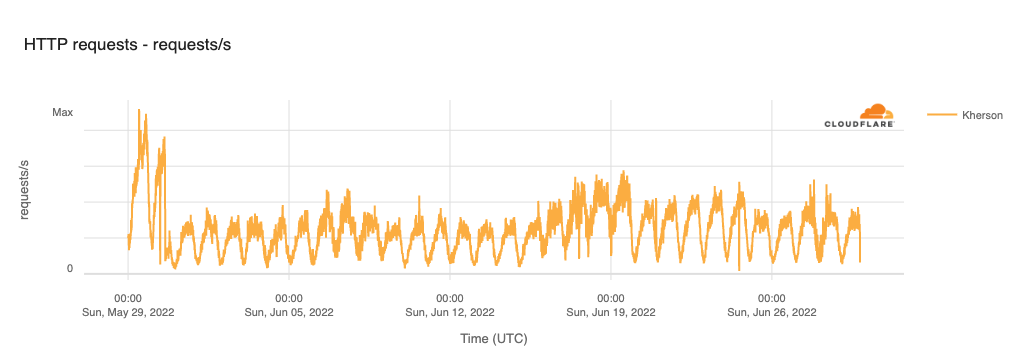
The war in Ukraine is now ten months old, and throughout the time it has been going on, multiple networks across the country have experienced outages. In March, we observed outages in Mariupol and other cities where fighting was taking place. In late May, an extended Internet disruption began in Kherson, coincident with AS47598 (Khersontelecom) starting to route traffic through Russian network provider AS201776 (MIranda), rather than a Ukrainian upstream. And in October, widespread power outages disrupted Internet connectivity in Kharkiv, Lviv, Kyiv, Poltova Oblast, and Zhytomyr. These outages and others were covered in more detail in the quarterly Internet disruption overview blog posts, as well as several other Ukraine-specific blog posts.
Adoption
Working with millions of websites and applications accessed by billions of people as well as providing an industry-leading DNS resolver service gives Cloudflare a unique perspective on the adoption of key technologies and platforms. SpaceX Starlink was frequently in the news this year, and we observed a 15x increase in traffic from the satellite Internet service provider. Social networking platform Mastodon was also in the news this year, and saw significant growth in interest as well.
IPv6 remains increasingly important as connected device growth over the last decade has exhausted available IPv4 address space, but global adoption remained around 35% across the year. And as the Internet-connected population continues to grow, many of those people are using mobile devices as their primary means of access. To that end, we also explore mobile device usage trends across the year.
Starlink adoption
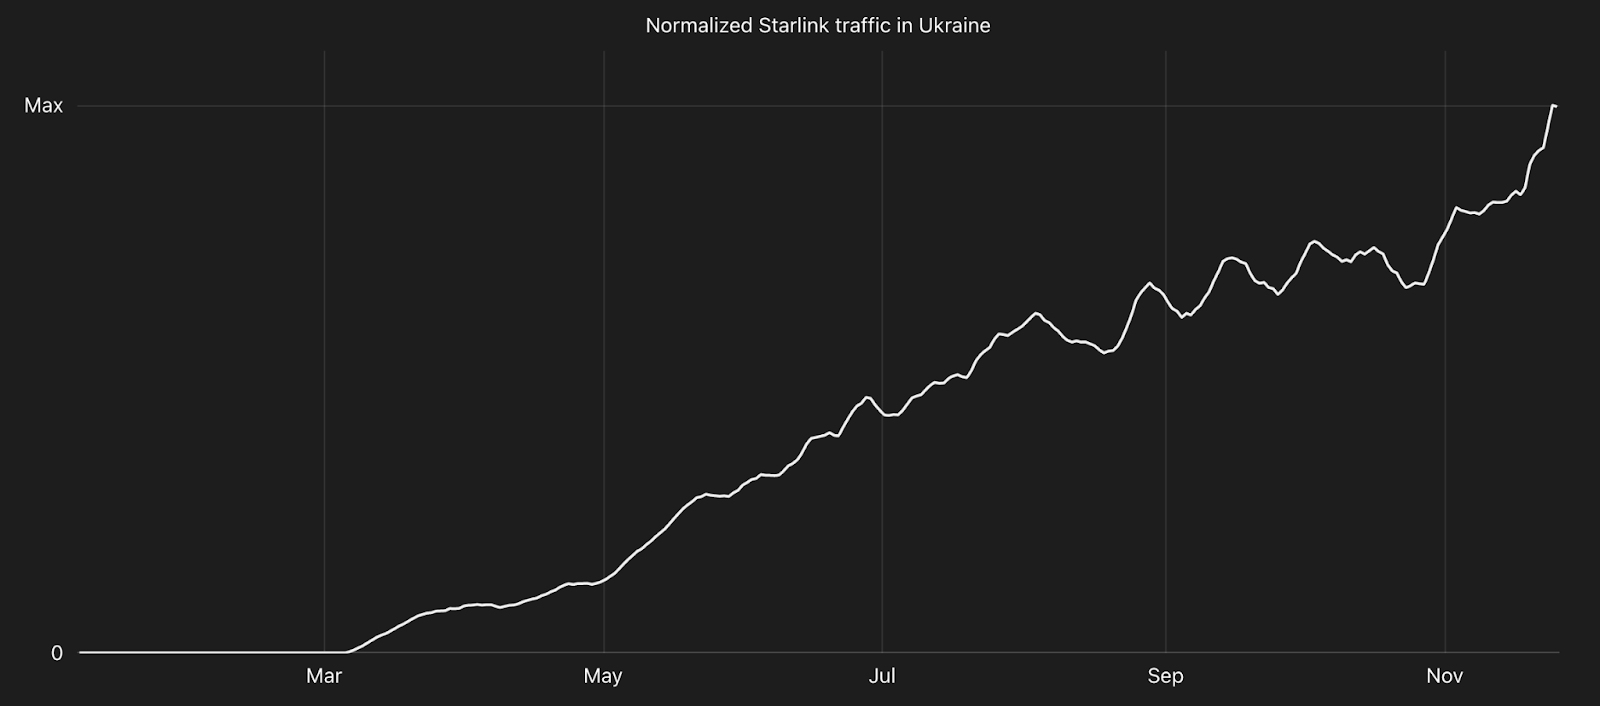
Internet connectivity through satellites in geostationary orbit (GEO) has been around for a number of years, but services have historically been hampered by high latency and slower speeds. However, the launch of SpaceX Starlink’sLow Earth Orbit (LEO) satellite Internet service in 2019 and subsequent expansion of the satellite constellation has made high performance Internet connections available in many locations that were previously unserved or underserved by traditional wired or wireless broadband. To track the growth in usage and availability of Starlink’s service, we analyzed aggregate Cloudflare traffic volumes associated with the service’s autonomous system (AS14593) throughout 2022. Although Starlink is not yet available globally, we did see traffic growth across a number of locations. The request volume shown on the trend line in the chart represents a seven-day trailing average.
Damage from the war in Ukraine has disrupted traditional wired and wireless Internet connectivity since the invasion started in late February. Starlink made headlines that month after the company activated service within the country, and the necessary satellite Internet terminals became more widely available. Within days, Cloudflare began to see Starlink traffic, with volume growing consistently throughout the year.
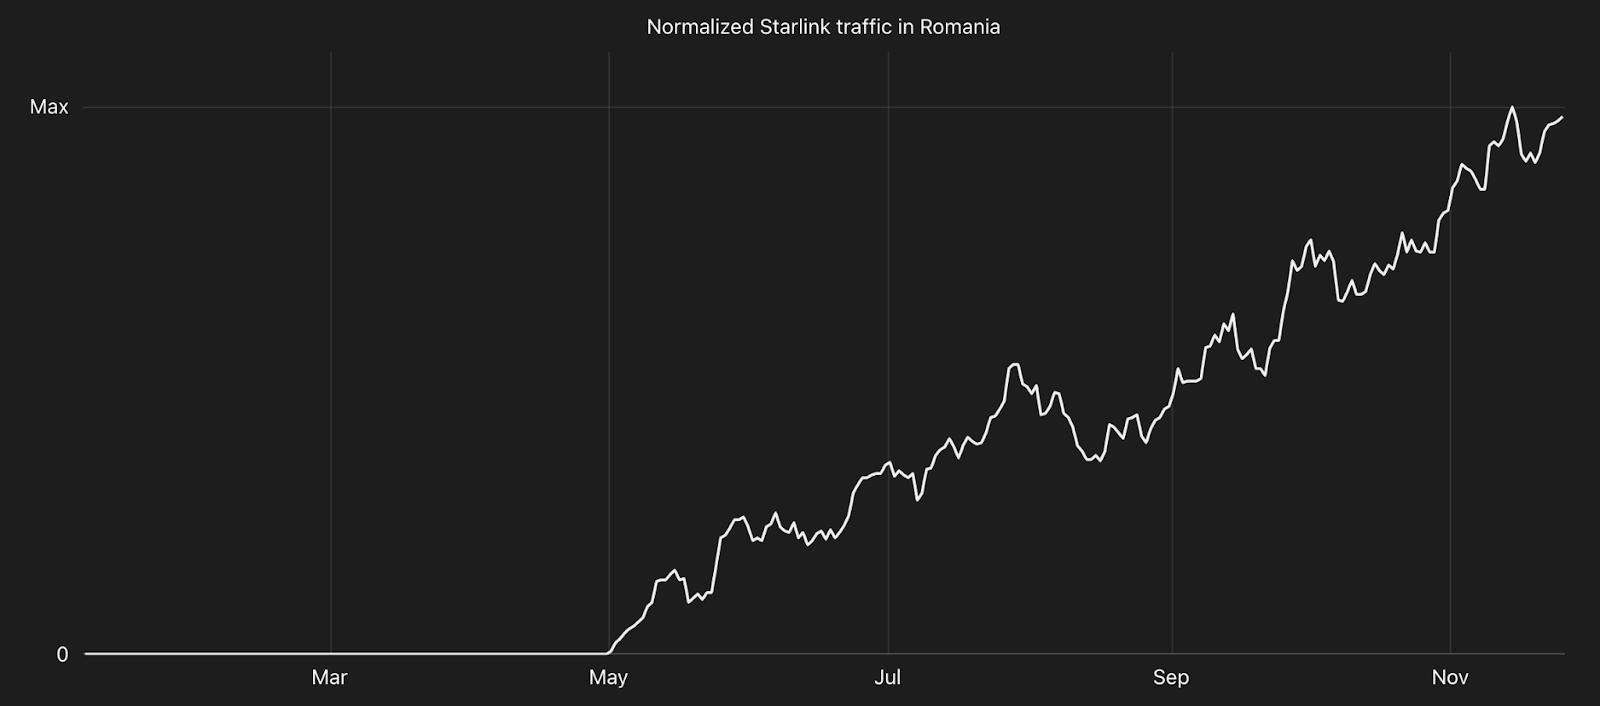
Latent interest in the service was also apparent in a number of locations where traffic grew quickly after Starlink announced availability. One such example is Romania, which was included in Starlink’s May announcement of an expanded service footprint, and which saw rapid traffic growth after the announcement.
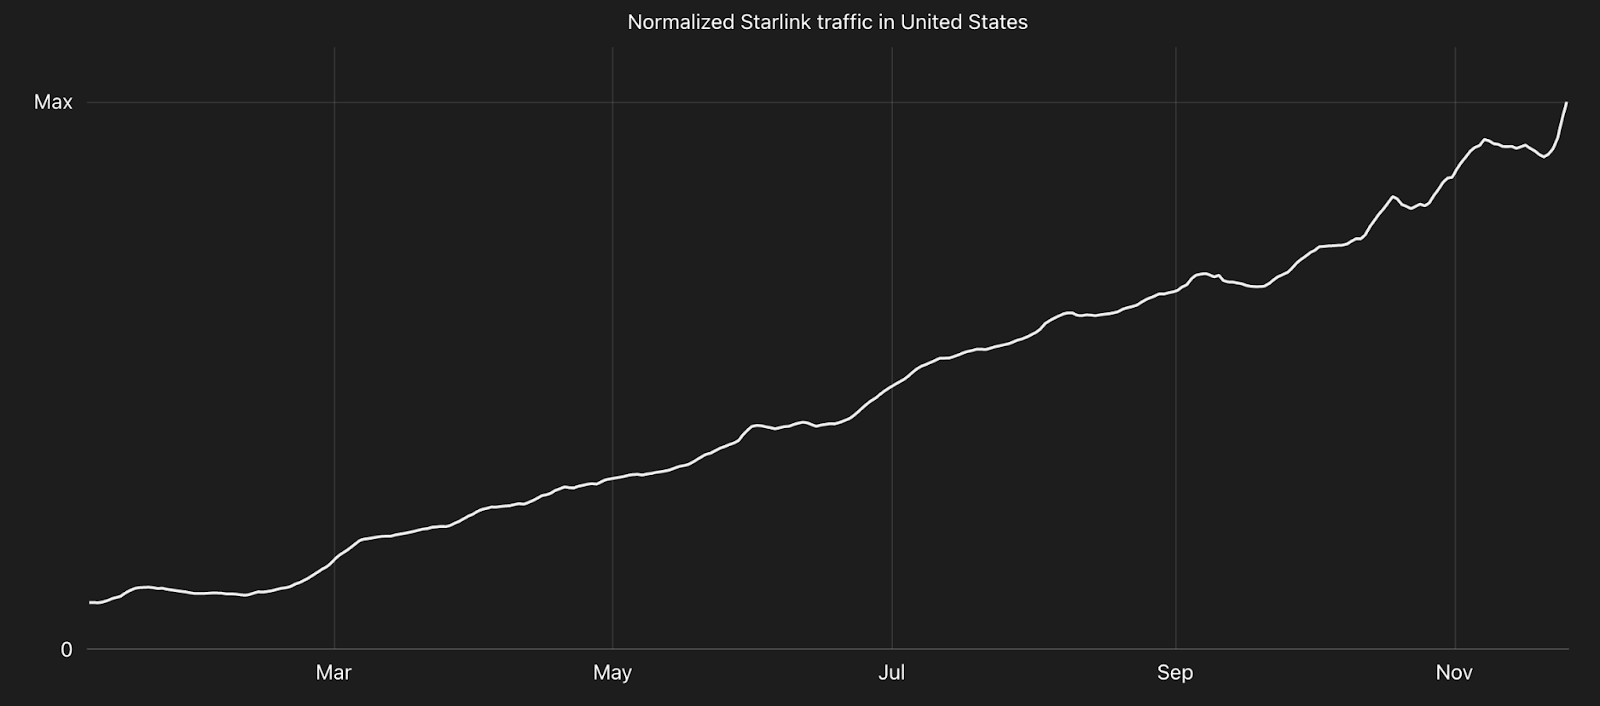
And in the United States, where Starlink has provided service since launch, traffic grew more than 10x through the end of November. Service enhancements announced during the year, like the ability to get Internet connectivity from moving vehicles, boats, and planes will likely drive additional traffic growth in the future.
Mastodon interest
Above, we showed that Mastodon hit an inflection point in its popularity during the last few months of 2022. To better understand how interest in Mastodon evolved during 2022, we analyzed aggregate 1.1.1.1 request volume data for the domain names associated with 400 top Mastodon instances, looking at aggregate request volume by location. The request volume shown on the trend line in the chart represents a seven-day trailing average.
Although interest in Mastodon clearly accelerated over the last few months of the year, this interest was unevenly distributed throughout the world as we saw little to no traffic across many locations. Graphs for those locations are not included within the Year In Review website. However, because Mastodon has been around since 2016, it built a base of early adopters over the last six years before being thrust into the spotlight in 2022.
Those early adopters are visible at a global level, as we see a steady volume of resolver traffic for the analyzed Mastodon instance domain names through the first nine months of the year, with the timing of the increase visible in late April aligning with the announcement that Elon Musk had reached a deal to acquire Twitter for $44 billion. The slope of the graph clearly shifted in October as it became increasingly clear that the acquisition would close shortly, with additional growth into November after the deal was completed. This growth is likely due to a combination of existing but dormant Mastodon accounts once again becoming active, and an influx of new users.
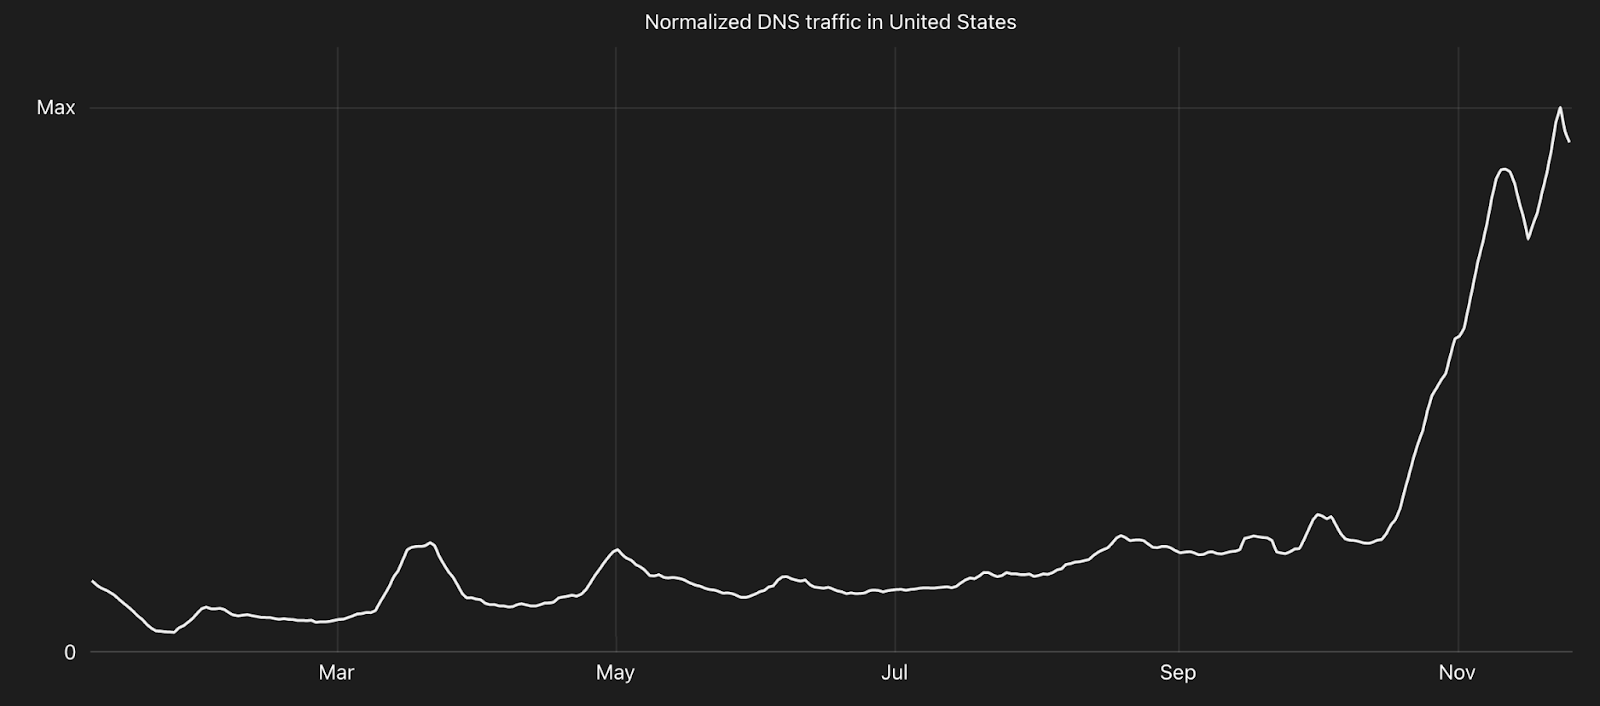
The traffic pattern observed for the United States appears fairly similar to the global pattern, with traffic from an existing set of users seeing massive growth starting in late October as well.
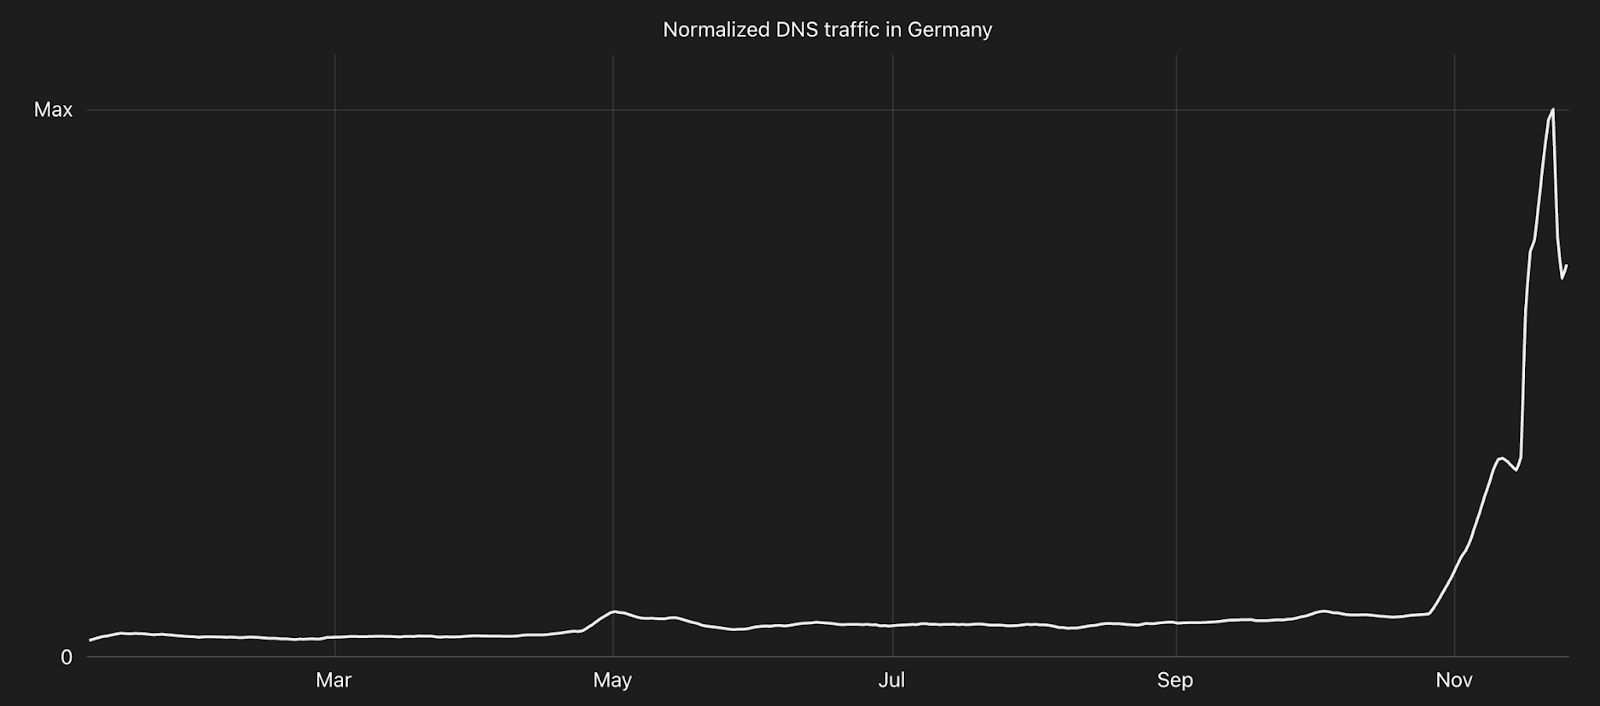
Although the core Mastodon software was developed by a programmer living in Germany, and the associated organization is incorporated as a German not-for-profit, it didn’t appear to have any significant home field advantage. Query volume for Germany was relatively low throughout most of the year, and only started to rapidly increase at the end of October, similar to behavior observed in a number of other countries.
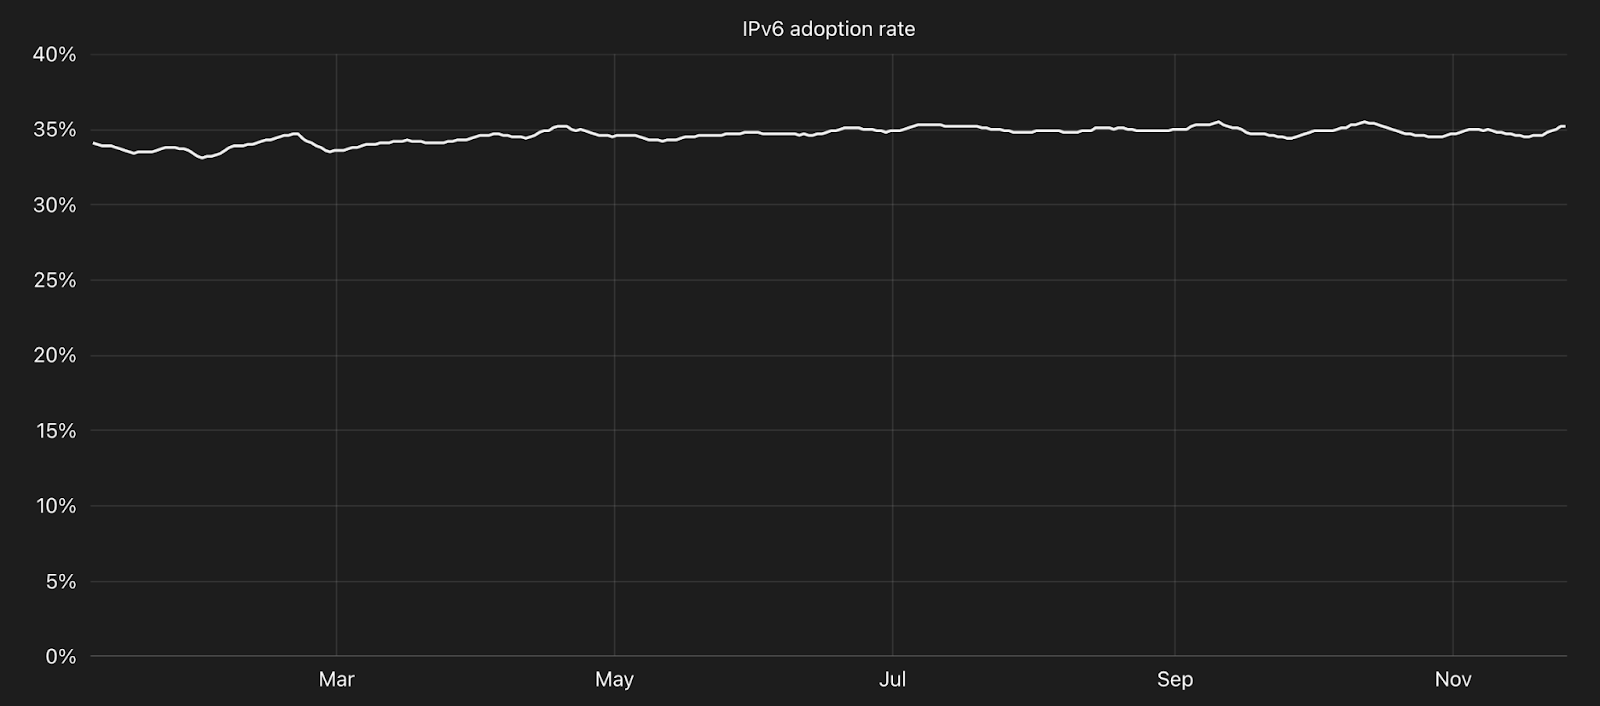
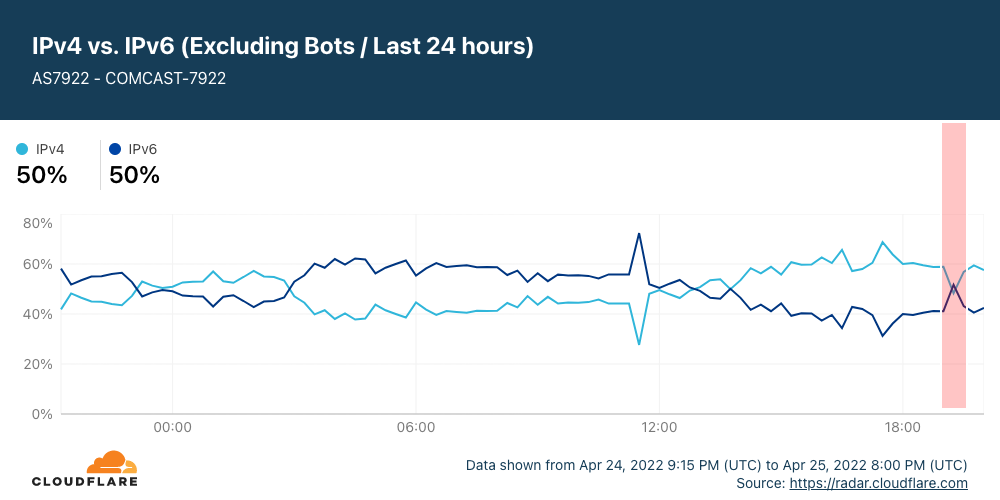
On a global basis, IPv6 adoption hovered around the 35% mark throughout the year, with nominal growth evident in the trend line shown in the graph. While it is encouraging to see one of every three requests for dual stacked content being made over IPv6, this adoption rate demonstrates a clear opportunity for improvement.
To calculate IPv6 adoption for each location, we identified the set of customer zones that had IPv6 enabled (were “dual stacked”) during 2022, and then divided the daily request count for the zones over IPv6 by the daily sum of IPv4 and IPv6 requests for the zones, filtering out bot traffic in both cases. The line shown in the trends graph represents a seven-day trailing average. For the top 10 chart, we calculated the average IPv6 adoption level on a monthly basis per location, and then ranked the locations by percentage. The chart illustrates the ranking by month, and how those rankings change across the year.
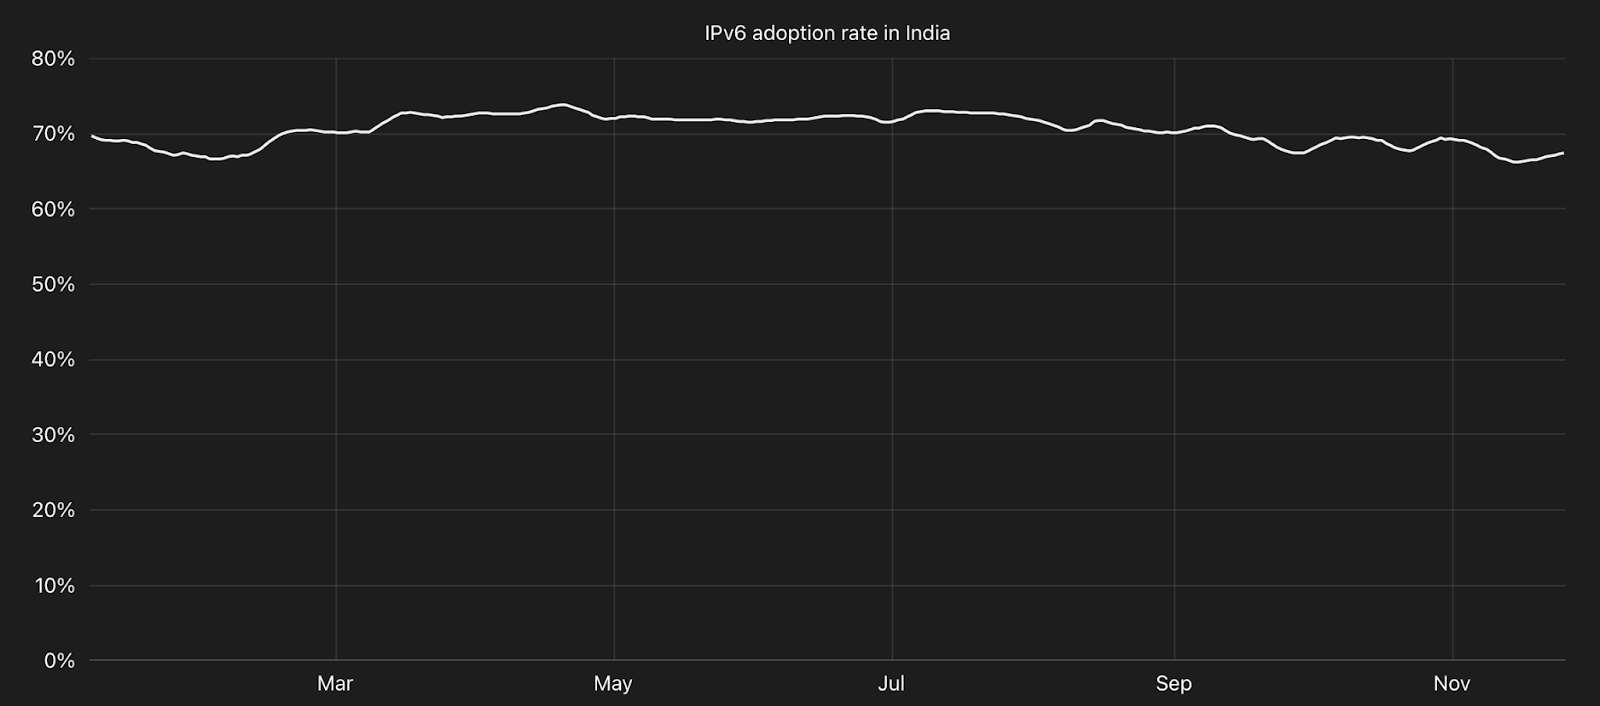
One location that has seized that opportunity is India, which recorded the highest IPv6 adoption rate throughout the year. After seeing more than 70% adoption through July, it began to drop slightly in late summer, losing a couple of percentage points over the subsequent months.
One key driver behind India’s leadership in this area is IPv6 support from Jio, India’s largest mobile network operator, as well as being a provider of fiber-to-the-home broadband connectivity. They aggressively started their IPv6 journey in late 2015, and now much of Jio’s core network infrastructure is IPv6-only, while customer-facing mobile and fiber connections are dual-stacked.
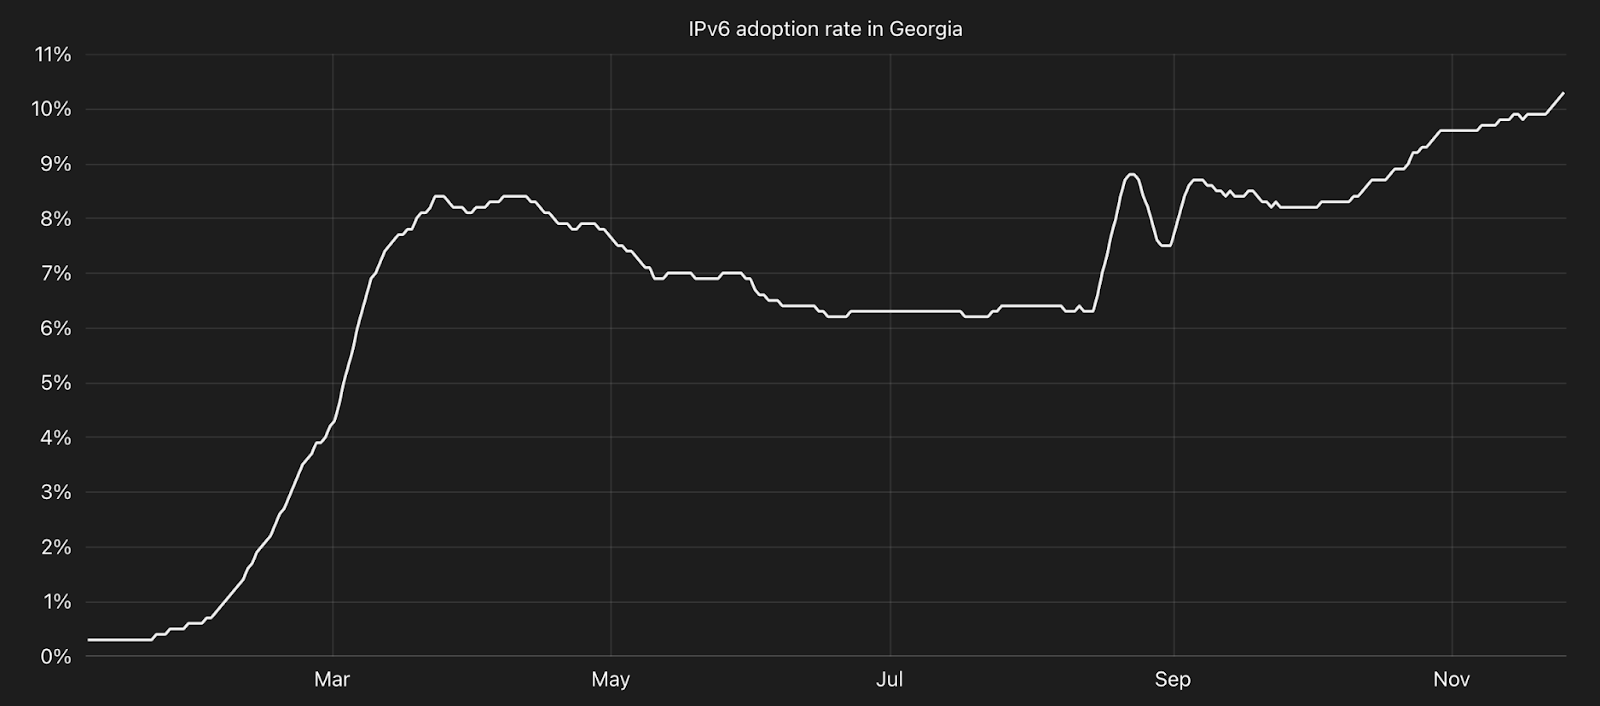
Also heading in the right direction are the more than 60 locations around the world that saw IP adoption rates more than double this year. One of the largest increases was seen in the European country of Georgia, which grew more than 3,500% to close out the year at 10% adoption thanks to rapid growth across February and March at Magticom, a leading Georgian telecommunications provider.
Many of the other locations in this set also experienced large gains over a short period of time, likely due to a local network provider enabling subscriber support for IPv6. While significant gains seen in over a quarter of the total surveyed locations is certainly a positive sign, it must be noted that over 50 are under 10% adoption, with more than half of those remaining well under 1%, even after seeing adoption more than double. Internet service providers around the world continue to add or improve IPv6 support for their subscribers, but many have low to non-existent adoption rates, presenting significant opportunity to improve in the future.
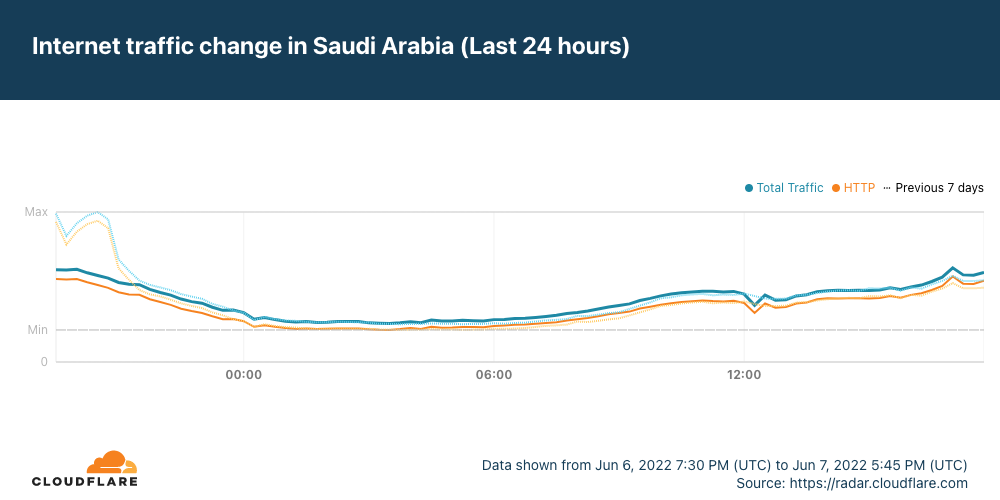
As noted above, India had the highest level of IPv6 adoption through 2022. In looking at the remainder of the top 10 list, Saudi Arabia and Malaysia traded places several times during the year as the locations with the second and third-highest adoption rates, at just under 60% and around 55% respectively. The United States appeared towards the bottom of the top 10 list during the first quarter, but ranked lower for the remainder of the year. Belgium proved to be the most consistent, holding the fourth-place spot from March through November, with around 55% IPv6 adoption. Overall, a total of 14 locations appeared among the top 10 at some point during the year.
Mobile device usage
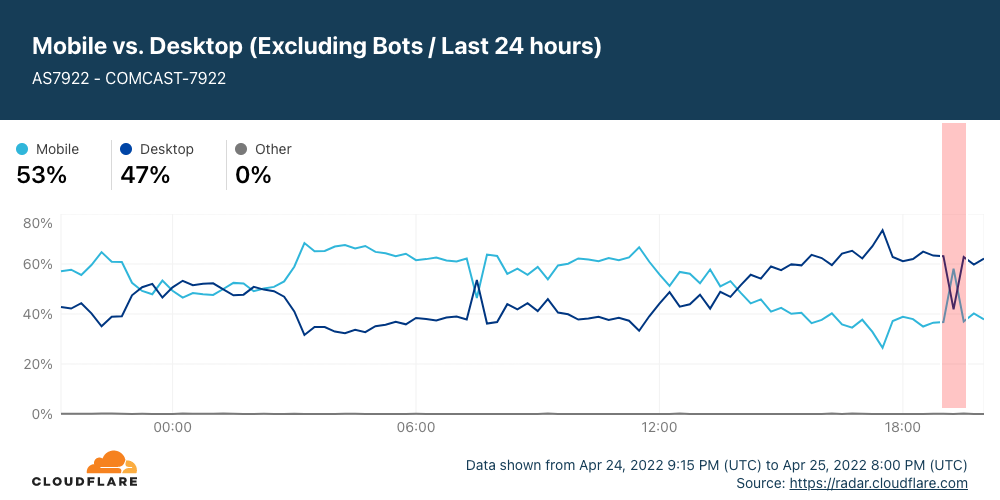
Each year, mobile devices become more and more powerful, and are increasingly being used as the primary onramp to the Internet in many places. In fact, in some parts of the world, so-called “desktop” devices (which includes laptop form factors) are the exception for Internet access, not the rule.
Analysis of the information included with each content request enables us to classify the type of device (mobile or desktop) used to make the request. To calculate the percentage of mobile device usage by location, we divided the number of requests made by mobile devices over the course of a week by the total number of requests seen that week, filtering out bot traffic in both cases. For the top 10 chart, we ranked the locations by the calculated percentage. The chart illustrates the ranking by month, and how those rankings change across the year.
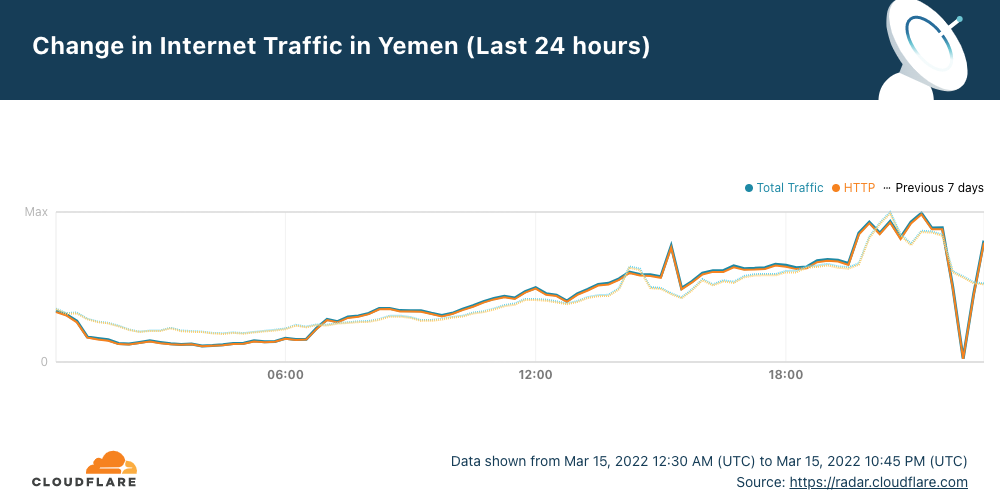
In looking at the top 10 chart, we note that Iran and Sudan held the top two slots for much of the year, bookended by Yemen in January and Mauritania in November. Below the top two spots, however, significant volatility is clear throughout the year within the rest of the top 10. However, this movement was actually concentrated across a relatively small percentage range, with just five to ten percentage points separating the top and bottom ranked locations, depending on the week. The top ranked locations generally saw 80-85% of traffic from mobile devices, while the bottom ranked locations saw 75-80% of traffic from mobile devices.
This analysis reinforces the importance of mobile connectivity in Iran, and underscores why mobile network providers were targeted for Internet shutdowns in September and October, as discussed above. (And the shutdowns subsequently explain why Iran disappears from the top 10 list after September.)
Security
Improving Internet security is a key part of Cloudflare’s drive to help build a better Internet. One way we do that is by protecting customer websites, applications, and network infrastructure from malicious traffic and attacks. Because malicious actors regularly use a variety of techniques and approaches in launching their attacks, we have a number of products within our security solution portfolio that provide customers with flexibility around how they handle these attacks. Below, we explore insights derived from the attack mitigation we do on behalf of customers, including how we are mitigating attacks, what kinds of websites and applications attacks are targeting, and where these attacks appear to be coming from. In addition, with the acquisition of Area 1 earlier in 2022, we are presenting insight into where malicious email originates from. Analysis of this data highlights that there is very much no “one size fits all” security solution, as attackers use a wide variety of techniques, frequently shifting between them. As such, having a broad but flexible portfolio of security solutions at the ready is critical for CISOs and CIOs.
Mitigation sources
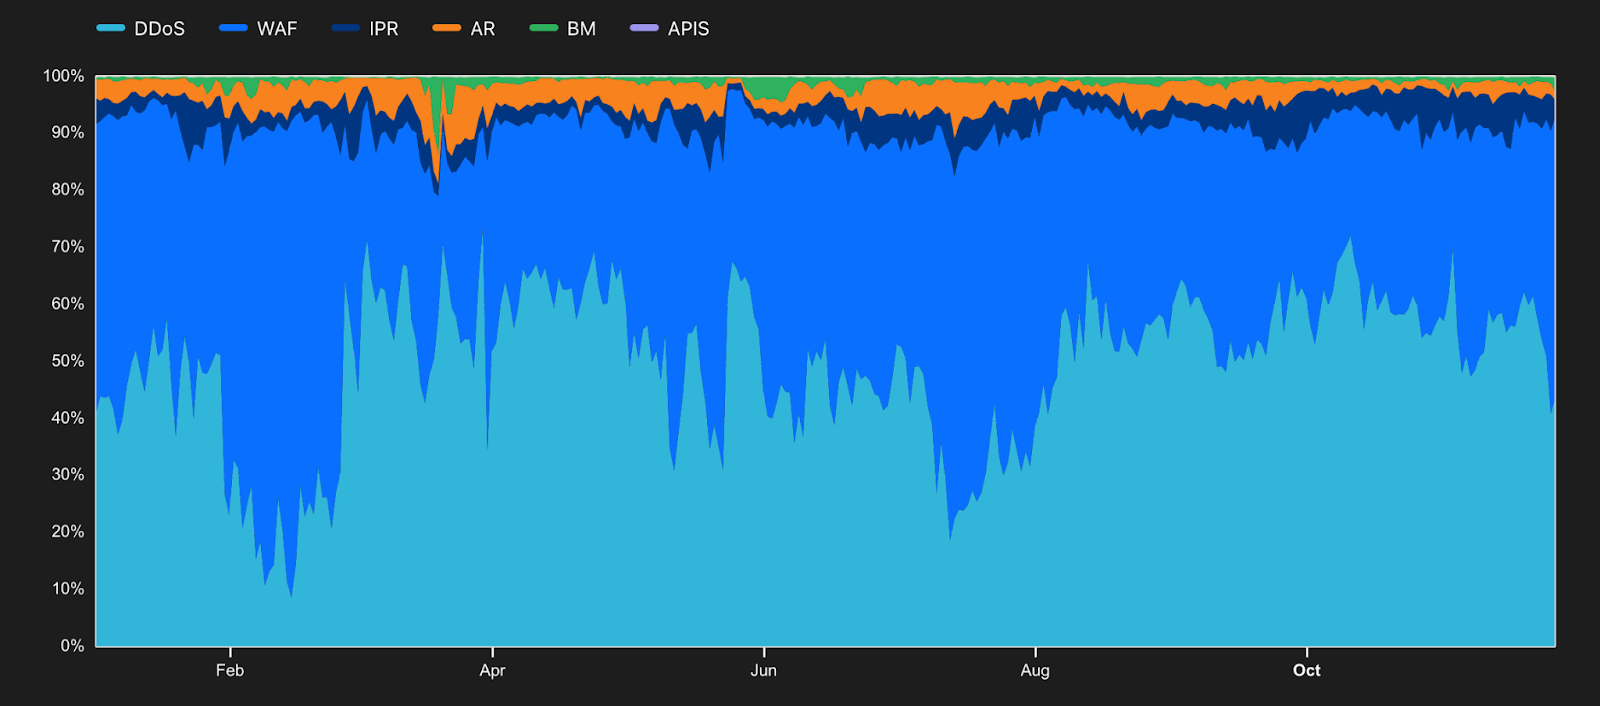
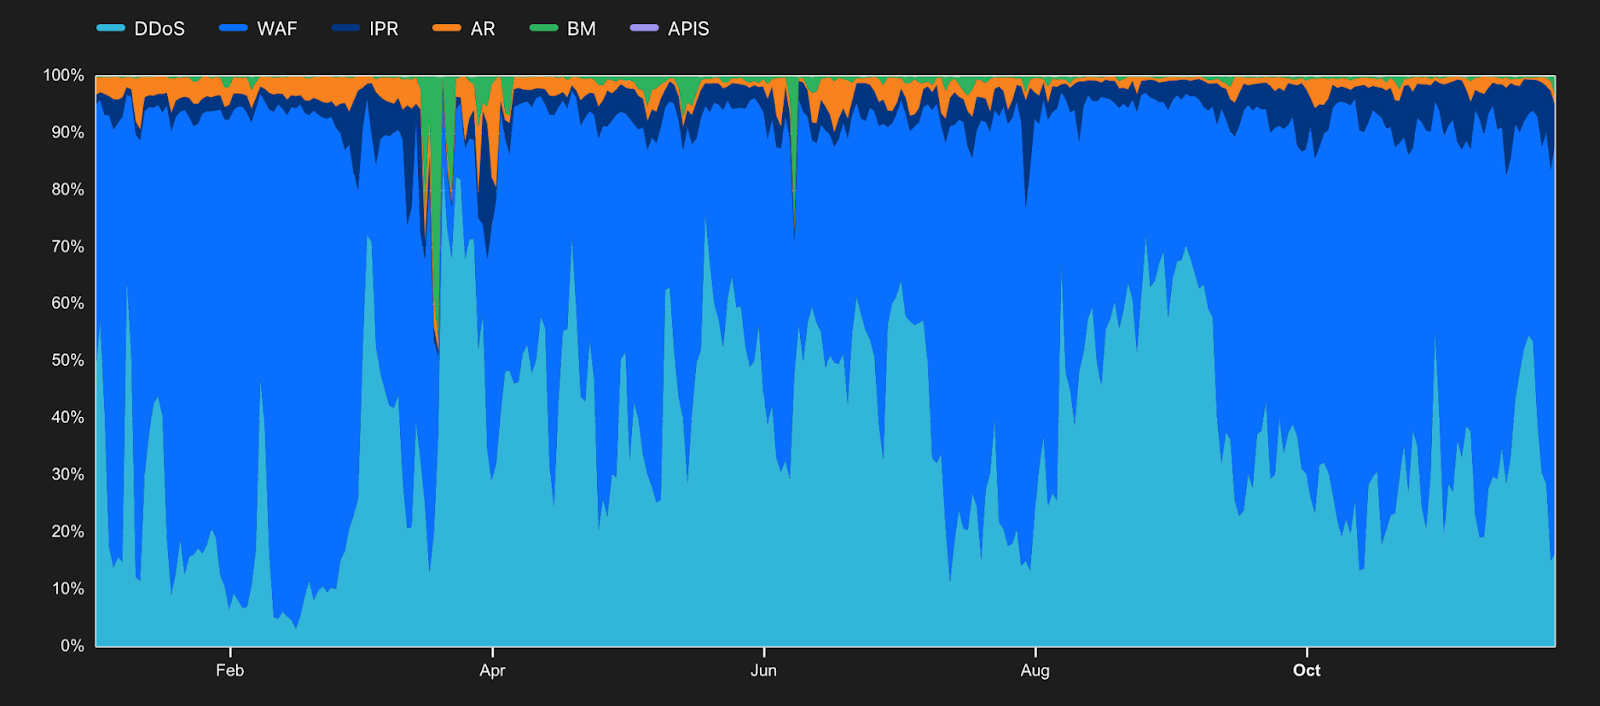
Depending on the approach taken by an attacker, and the type of content being targeted, one attack mitigation technique may be preferable over another. Cloudflare refers to these techniques as “mitigation sources”, and they include popular tools and techniques like Web Application Firewall (WAF) and DDoS Mitigation (DDoS), but also lesser known ones like IP Reputation (IPR), Access Rules (AR), Bot Management (BM), and API Shield (APIS). Examining the distribution of mitigation sources applied by location can help us better understand the types of attacks originating from those locations. To calculate the percentage of mitigated traffic associated with each mitigation source by location, we divided the total number of daily mitigated requests for each source by the total number of mitigated requests seen that day. Bot traffic is included in these calculations, given that many attacks originate from bots. A single request can be mitigated by multiple techniques, and here we consider the last technique that mitigated the request.
Across many locations, IP Reputation, Bot Management, and Access Rules accounted for small amounts of mitigated traffic throughout the year, with the volumes varying by country. However, in other locations, IP Reputation and Access Rules were responsible for larger amounts of mitigated traffic, possibly indicating those places had more of their traffic being blocked outright. A number of countries saw a rapid and significant increase in DDoS mitigated traffic during January to the 80-90% range, followed by a rapid drop to the 10-20% range. In that vein, DDoS Mitigation and WAF percentage shifts were frequently very spiky, with only occasional sustained periods of relatively consistent percentages.
Overall, DDoS Mitigation and WAF were the two most frequently used techniques to address attacks. The former’s share on a global basis was highest in mid-January, growing to nearly 80%, while the latter’s peak was during February, when it accounted for almost 60% of mitigated traffic. A spike in the usage of Access Rules is clearly visible in August, related to similar spikes observed for the United States, United Arab Emirates, and Malaysia.
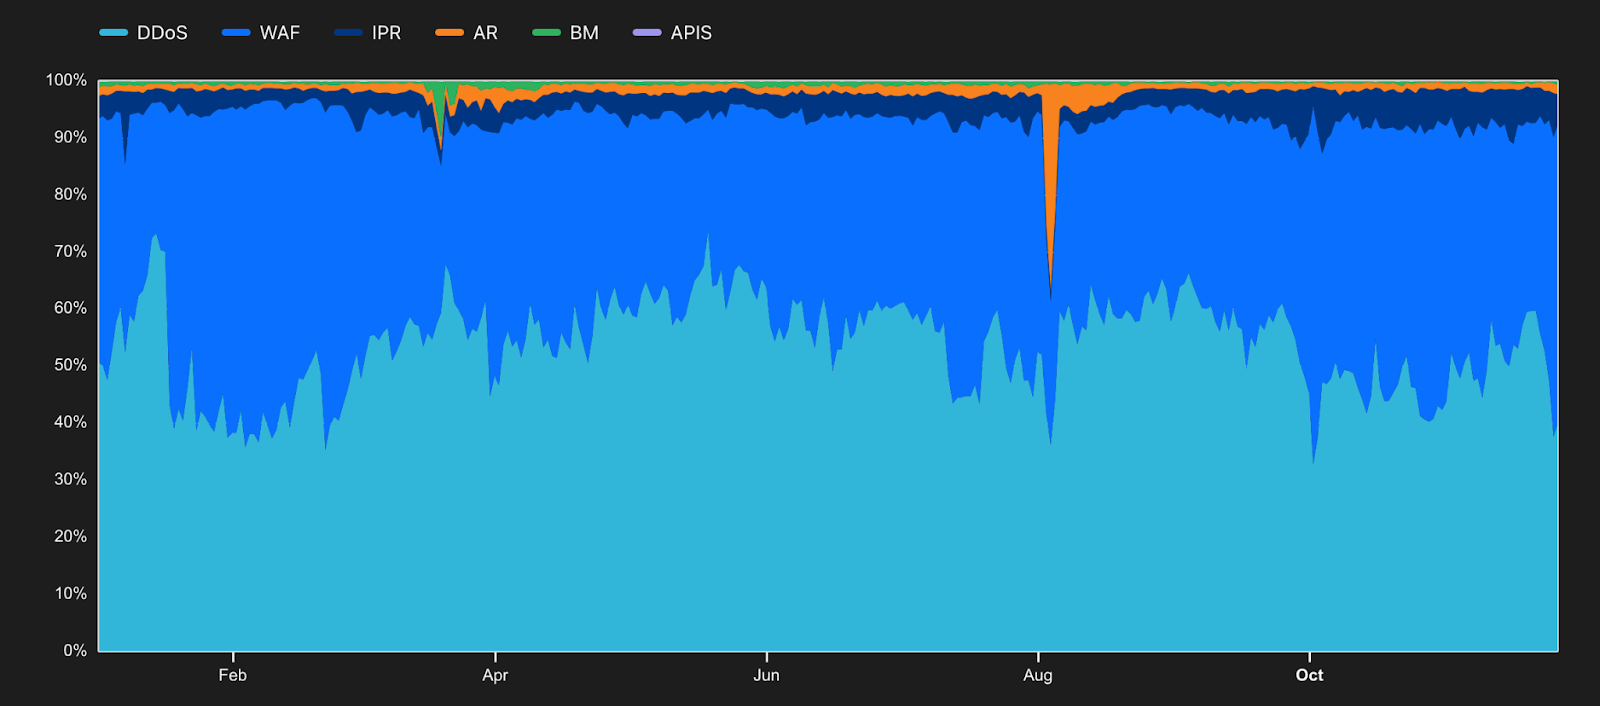
Although Access Rules accounted for as much as 20% of mitigated traffic from the United States in August, it saw much lower usage throughout the balance of the year. DDoS Mitigation was the primary technique used to mitigate attack traffic coming from the United States, responsible for over 80% of such traffic during the first quarter, though it steadily declined through August. In a complimentary fashion, WAF drove only ~20% of mitigated traffic early in the year, but that volume steadily grew and had tripled through August. Interestingly, the growth in Access Rules usage followed rapid growth and then similarly rapid decline in WAF, possibly suggesting that more targeted rules were implemented to augment the managed rules applied by the Web Application Firewall against US-originated attacks.
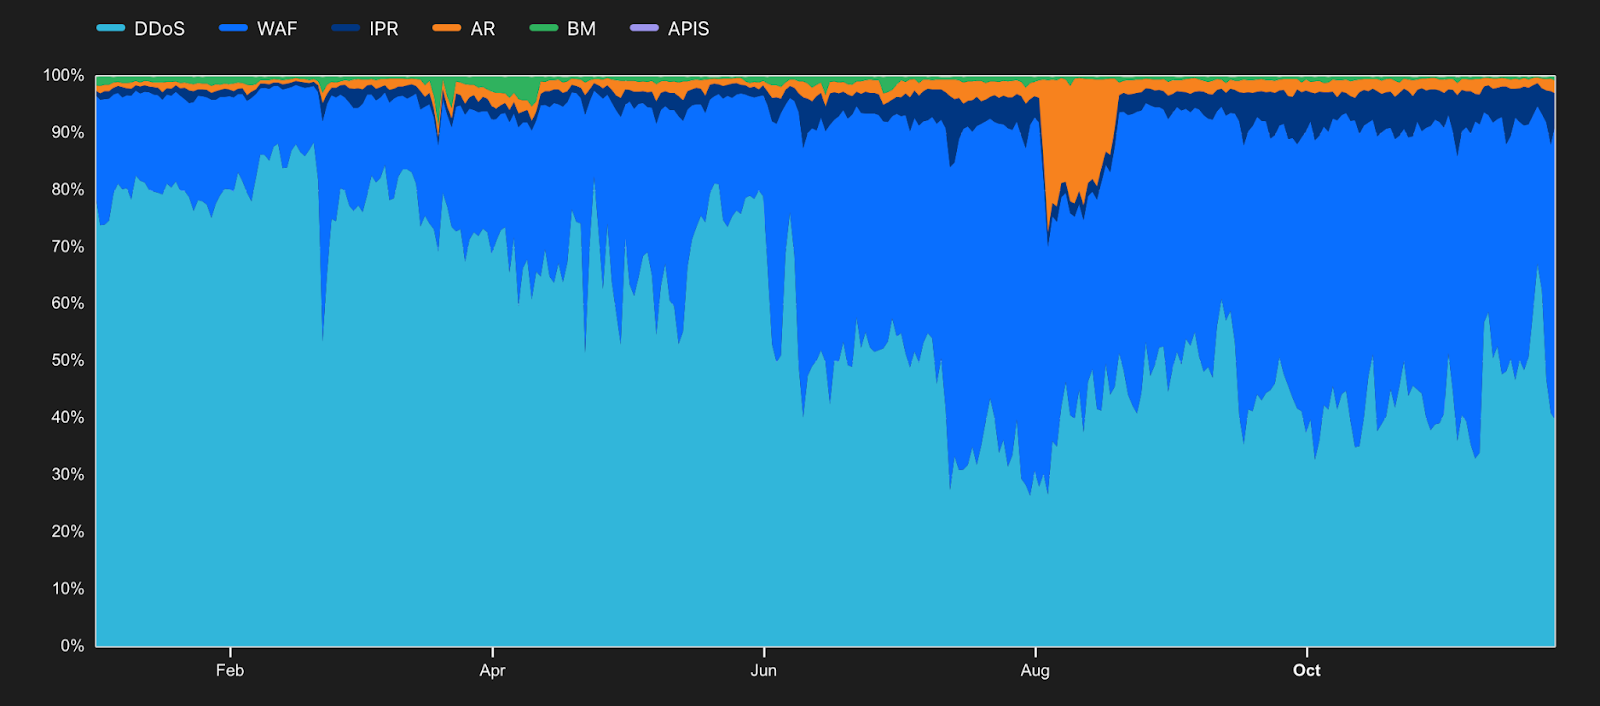
Access Rules and IP Reputation were applied more frequently to mitigate attack traffic coming from Germany, with Bot Management also seeing increased usage in February, March, and June. However, except for periods in February and July, DDoS Mitigation drove the bulk of mitigated traffic, generally ranging between 60-80%. WAF mitigation was clearly most significant during February, with 70-80% of mitigated traffic, and July, at around 60%.
In mitigating attacks coming from Japan, it is interesting to see a couple of notable spikes in Bot Management. In March, it was briefly responsible for upwards of 40% of mitigated traffic, with another spike that was half as big in June. Access Rules also maintained a consistent presence in the graph, with around 5% of mitigated traffic through August, but slightly less in the following months. In dealing with Japanese attack traffic, WAF & DDoS Mitigation frequently traded positions as the largest source of mitigated traffic, although there was no clear pattern or apparent cycle. Both reached as much as 90% of mitigated traffic at times throughout the year – WAF in February and DDoS Mitigation in March. DDoS Mitigation’s periods of “dominance” tended to be more sustained, lasting for several weeks, but were punctuated by brief WAF spikes.
WAF rules
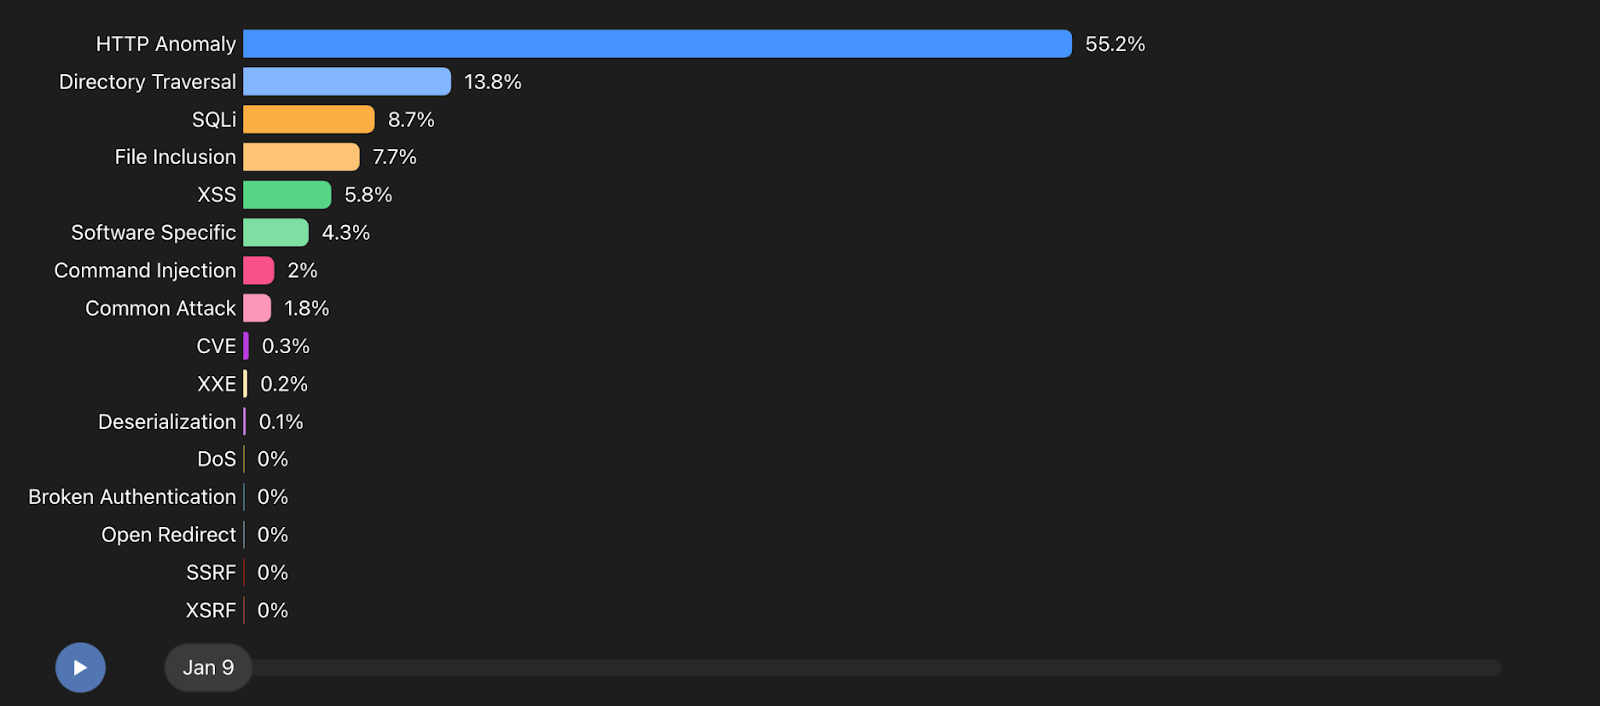
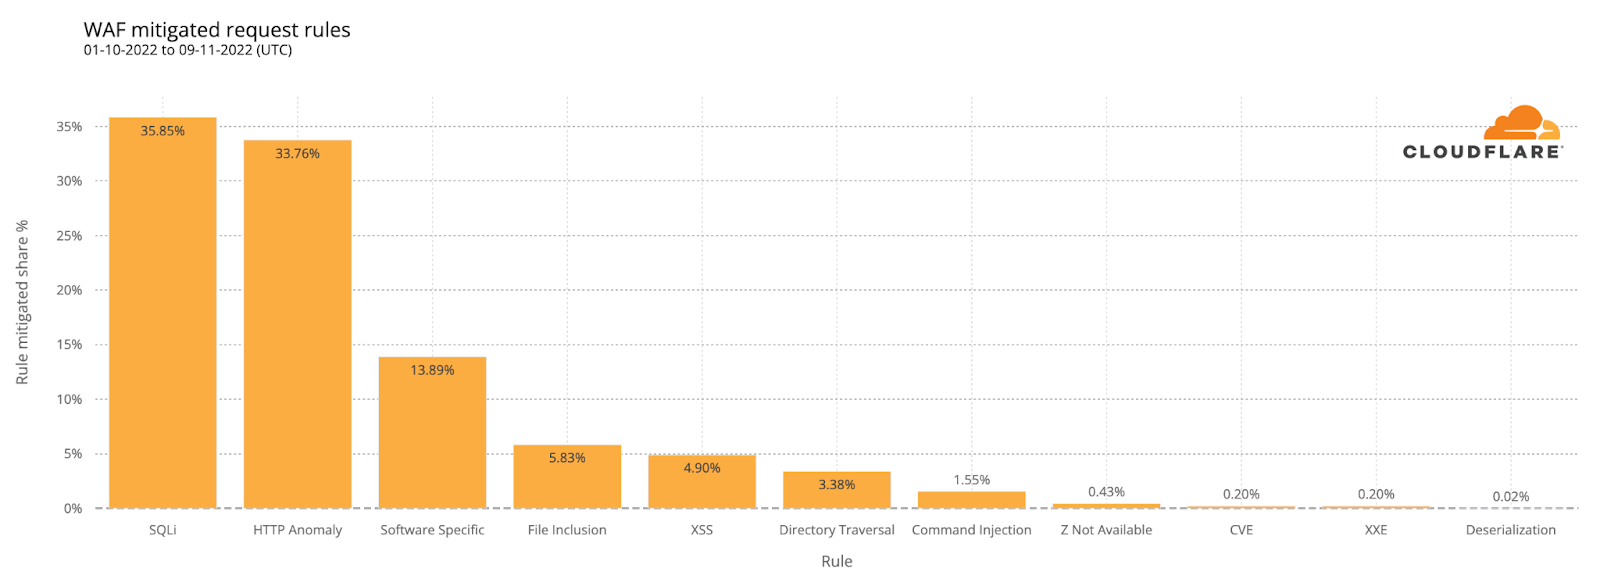
As noted above, Cloudflare’s WAF is frequently used to mitigate application layer attacks. There are hundreds of individually managed rules that can be applied by the WAF depending on the characteristics of the mitigated request, but these rules can be grouped into over a dozen types. Examining the distribution of WAF rules by location can help us better understand the techniques that attacks coming from that location are using. (For example, are attackers trying to inject SQL code into a form field, or exploit a published CVE?) To calculate the distribution of WAF mitigated traffic across the set of rule types for each location, we divided the number of requests mitigated by a particular type of WAF rule seen over the course of a week by the total number of WAF mitigated requests seen over that week. A single request can be mitigated by multiple rules and here we consider the last rule in a sequence that mitigated the request. The chart shows how the distribution of mitigated requests across the selected rule types changes over the course of the year. Bot traffic is included in these calculations.
At a worldwide level, during the first few months of the year, approximately half of HTTP requests blocked by our Managed WAF Rules contained HTTP anomalies, such as malformed method names, null byte characters in headers, non-standard ports, or content length of zero with a POST request. During that period, Directory Traversal and SQL Injection (SQLi) rules both accounted for just over 10% of mitigated requests as well. Attackers began to further vary their approach starting in May, as Cross Site Scripting (XSS) and File Inclusion both grew to over 10% of mitigations, while HTTP anomalies dropped to below 30%. Use of Software Specific rules grew above 10% in July, as attackers apparently ramped their efforts to exploit vendor-specific vulnerabilities. Broken Authentication and Command Injection rulesets also saw some growth in activity during the last several months, suggesting that attackers increased their efforts to find vulnerabilities in login/authentication systems or to execute commands on vulnerable systems in an attempt to gain access.
Although HTTP Anomaly was the most frequently applied rule when mitigations are aggregated at a global level, there were a number of locations where it held the top spot only briefly, if at all, as discussed below.
Attacks originating in Australia were WAF-mitigated using a number of rulesets, with the most applied ruleset changing frequently during the first half of the year. In contrast to the global overview, HTTP Anomaly was the top ruleset for only a single week in February, when it accounted for just over 30% of mitigations. Otherwise, attacks were most frequently mitigated with Software Specific, Directory Traversal, File Inclusion, and SQLi rules, generally accounting for 25-35% of mitigations. This pattern shifted starting in July, though, as Directory Traversal attacks became the most common, staying that way through the balance of the year. After peaking in June, SQLi attacks became significantly less common, rapidly falling and staying below 10% of mitigations.
WAF mitigations of attacks originating in Canada also demonstrated a pattern that differed from the global one. Although the HTTP Anomaly ruleset started the year accounting for approximately two thirds of mitigated requests, it was half that by the end of January, and saw significant volatility throughout the balance of the year. SQLi mitigations of Australian traffic effectively saw an opposite pattern, starting the year below 10% of mitigations but growing rapidly, accounting for 60% or more of mitigated traffic at multiple times throughout the year. Interestingly, SQLi attacks from Canada appeared to come in multi-week waves, becoming the most applied ruleset during those waves, and then receding for a brief period.
For attacks originating in Switzerland, the HTTP Anomaly ruleset was never the most frequently invoked, although it remained among the top five throughout the year. Instead, Directory Traversal and XSS rules were most frequently used, accounting for as much as 40% of mitigations. Directory Traversal most consistently held the top spot, though XSS attacks were the most prevalent during August. SQLi attacks saw peaks in April, July/August, and then again at the end of November. The Software Specific ruleset also breakout growth in September to as much as 20% of mitigated requests.
Target categories
Above, we discussed how traffic distribution across a set of categories provides insights into the types of content that users are most interested in. By performing similar analysis through a mitigation lens, we can gain insights into the types of websites and applications that are being most frequently targeted by attackers. To calculate the distribution of mitigated traffic across the set of categories for each location, we divided the number of mitigated requests for domains associated with a given category seen over the course of a week by the total number of requests mapped to that category during that week. The chart shows how the distribution of mitigated requests across each category changes over the course of the year. (As such, percentages will not sum to 100%). Bot traffic is included in these calculations. The percentage of traffic that was mitigated as an attack varied widely across industries and originating locations. In some places, a nominal percentage of traffic across all categories was mitigated, while in others, multiple categories experienced spikes in mitigated traffic at multiple times during 2022.
When aggregated at a global level, there was significant variance over the course of the year in the industry categories that attracted the most attacks as a fraction of their overall traffic. Through January and February, Technology sites had the largest percentage of mitigated requests, ranging between 20-30%. After that, a variety of categories moved in and out of the top slot, with none holding it for more than a few weeks. The biggest spike in attacks was targeted at Travel sites in mid-April, when more than half of the category’s traffic was mitigated. Coincident with the start of the 2022 World Cup in the last week of November, Gambling and Entertainment sites saw the largest percentages of mitigated traffic.
For attacks coming from the United Kingdom, Technology sites consistently saw around 20% of mitigated traffic through the year. During those times that it was not the most mitigated category, half a dozen other categories topped the list. Travel sites experienced two significant bursts of attacks, with nearly 60% of traffic mitigated in April, and nearly 50% in October. Other categories, including Government & Politics, Real Estate, Religion, and Education had the largest shares of mitigated traffic at various times throughout the year. UK-originated attacks on Entertainment sites jumped significantly in late November, with 40% of traffic mitigated at the end of the month.
Similar to the trends seen at the global level, Technology sites accounted for the largest percentage of mitigated attacks from the United States in January and February, clocking in between 30-40%. After that, attackers shifted their focus to target other industry categories. In mid-April, Travel sites had over 60% of requests mitigated as attacks. However, starting in May, Gambling sites most frequently had the highest percentage of traffic being mitigated, generally ranging between 20-40%, but spiking up to 70% in late October/early November.
In contrast, significantly smaller percentages of traffic across the surveyed categories from Japan was mitigated as attacks throughout 2022. Most categories saw mitigation shares of less than 10%, although there were a number of brief spikes observed at times. In late March, traffic to sites in the Government & Politics category briefly jumped to a nearly 80% mitigation share, while Travel sites spiked to nearly 70% of requests mitigated as attacks, similar to the behavior seen in other locations. In late June, Religion sites had a mitigation share of over 60%, and a couple of months later, Gambling sites experienced a rapid increase in mitigated traffic, reaching just over 40%. These attacks targeting Gambling sites then receded for a few months before starting to aggressively increase again in October.
Phishing email sources
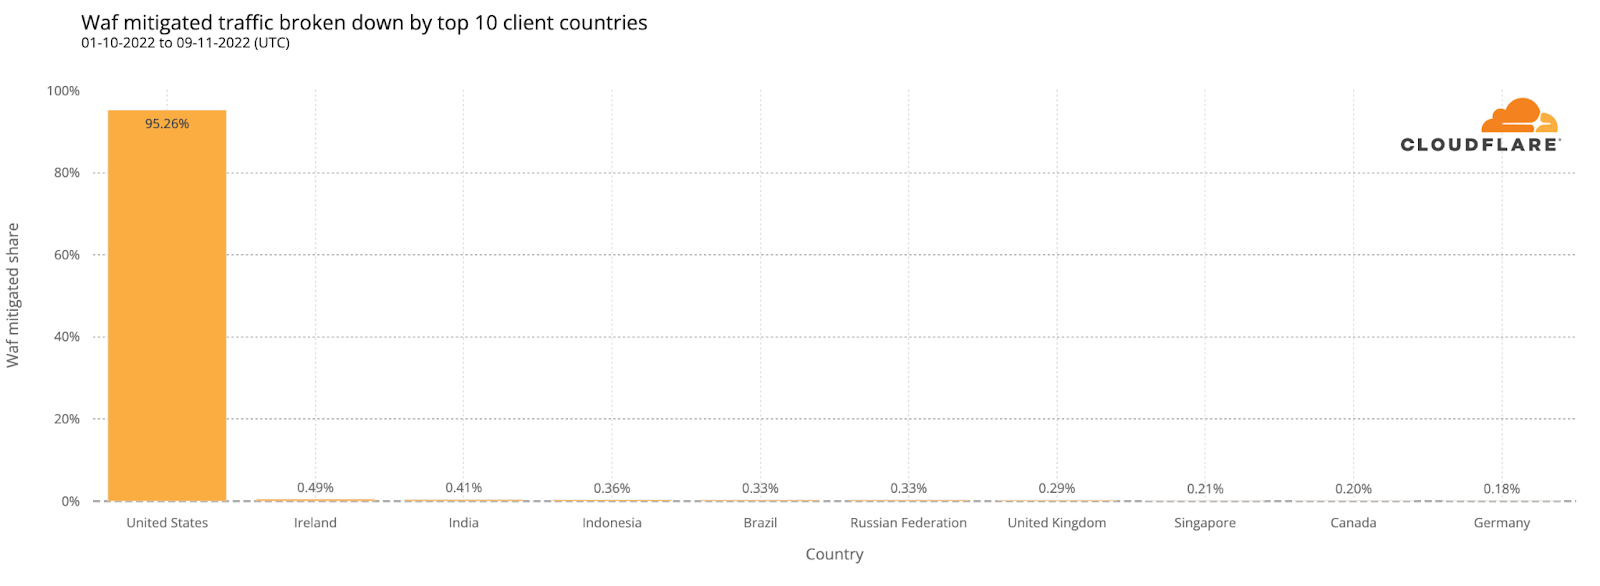
Phishing emails are ultimately intended to trick users into providing attackers with login credentials for important websites and applications. At a consumer level, this could include an e-commerce site or banking application, while for businesses, this could include code repositories or employee information systems. For customers protected by Cloudflare Area 1 Email Security, we can identify the location that these phishing emails are being sent from. IP address geolocation is used to identify origination location, and the aggregate email counts apply to emails processed by Area 1 only. For the top 10 chart, we aggregated the number of phishing emails seen on a weekly basis per location, and then ranked the locations by phishing email volume. The chart illustrates the ranking by week, and how those rankings change across the year.
Reviewing the top 10 list, we find that the United States was the top source of phishing emails observed by Area 1 during 2022. It held the top spot for nearly the entire year, ceding it only once to Germany in November. The balance of the top 10 saw a significant amount of volatility over time, with a total of 23 locations holding a spot in the rankings for at least one month during the year. These locations were well-distributed geographically across the Americas, Europe, and Asia, highlighting that no one region of the world is a greater threat than others. Obviously, distrusting or rejecting all email originating from these locations is not a particularly practical response, but applying additional scrutiny can help keep your organization, and the Internet, safer.
Conclusion
Attempting to concisely summarize our “year in review” observations is challenging, especially as we only looked at trends in this blog post across a small fraction of the nearly 200 locations included in the website’s visualizations. Having said that, we will leave you with the following brief thoughts:
Attack traffic comes from everywhere, with constantly shifting targets, using widely varied techniques. Ensure that your security solutions provider offers a comprehensive portfolio of services to help keep your sites, applications, and infrastructure safe.
Internet service providers around the world need to improve support for IPv6 — it is no longer a “new” technology, and available IPv4 address space will become both increasingly scarce and increasingly expensive. Support for IPv6 needs to become the default going forward.
Internet shutdowns are being increasingly used by governments to limit communications within a country, as well as limiting communications with the rest of the world. As the United Nations stated in a May 2022 report, “Blanket shutdowns in particular inherently impose unacceptable consequences for human rights and should never be imposed.”
As we said in the introduction, we encourage you to visit the full Cloudflare Radar 2022 Year In Review website and explore the trends relevant to locations and industries of interest, and to consider how they impact your organization so that you are appropriately prepared for 2023.
It truly took a village to produce the Cloudflare Radar 2022 Year In Review, and we would be remiss if we didn’t acknowledge the contributions of colleagues that were instrumental in making this project possible. Thank you to: Sabina Zejnilovic, Carlos Azevedo, Jorge Pacheco (Data Science); Ricardo Baeta, Syeef Karim (Design); Nuno Pereira, Tiago Dias, Junior Dias de Oliveira (Front End Development); João Tomé (Most popular Internet services); and Davide Marques, Paula Tavares, Celso Martinho (Project/Engineering Management).
Through Cloudflare’s Impact programs, we provide cyber security products to help protect access to authoritative voting information and the security of sensitive voter data. Two core programs in this space are the Athenian Project, dedicated to protecting state and local governments that run elections, and Cloudflare for Campaigns, a project with a suite of Cloudflare products to secure political campaigns’ and state parties’ websites and internal teams.
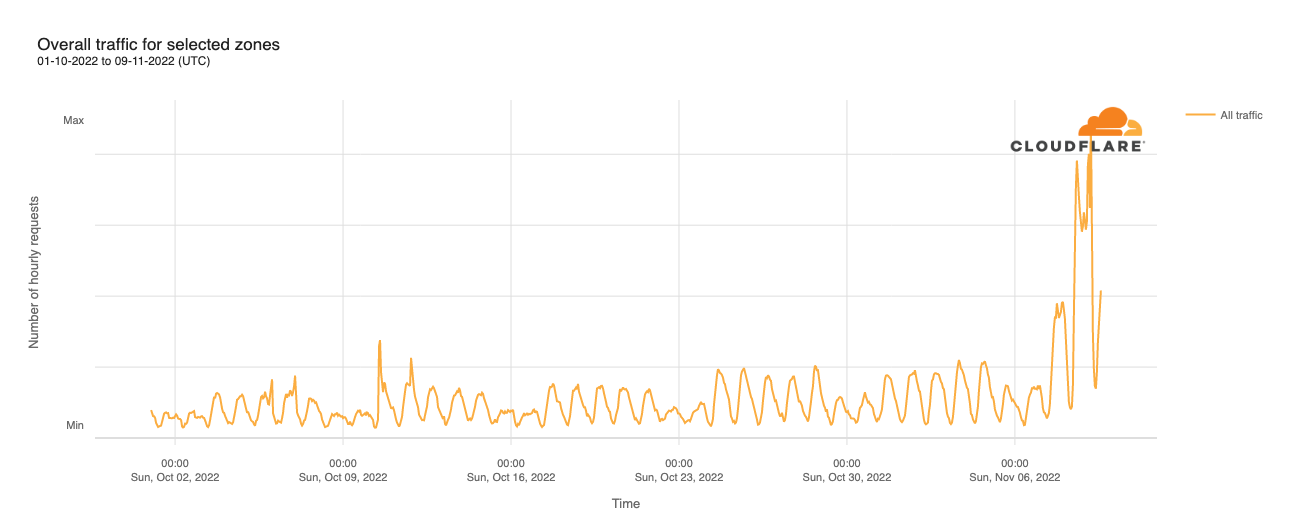
However, the weeks ahead of the elections, and Election Day itself, were not entirely devoid of attacks. Using data from Cloudflare Radar, which showcases global Internet traffic, attack, and technology trends and insights, we can explore traffic patterns, attack types, and top attack sources associated with both Athenian Project and Cloudflare for Campaigns participants.
For both programs, overall traffic volume unsurprisingly ramped up as Election Day approached. SQL Injection (SQLi) and HTTP Anomaly attacks were the two largest categories of attacks mitigated by Cloudflare’s Web Application Firewall (WAF), and the United States was the largest source of observed attacks — see more on this last point below.
Below, we explore the trends seen across both customer sets from October 1, 2022, through Election Day on November 8.
Athenian Project
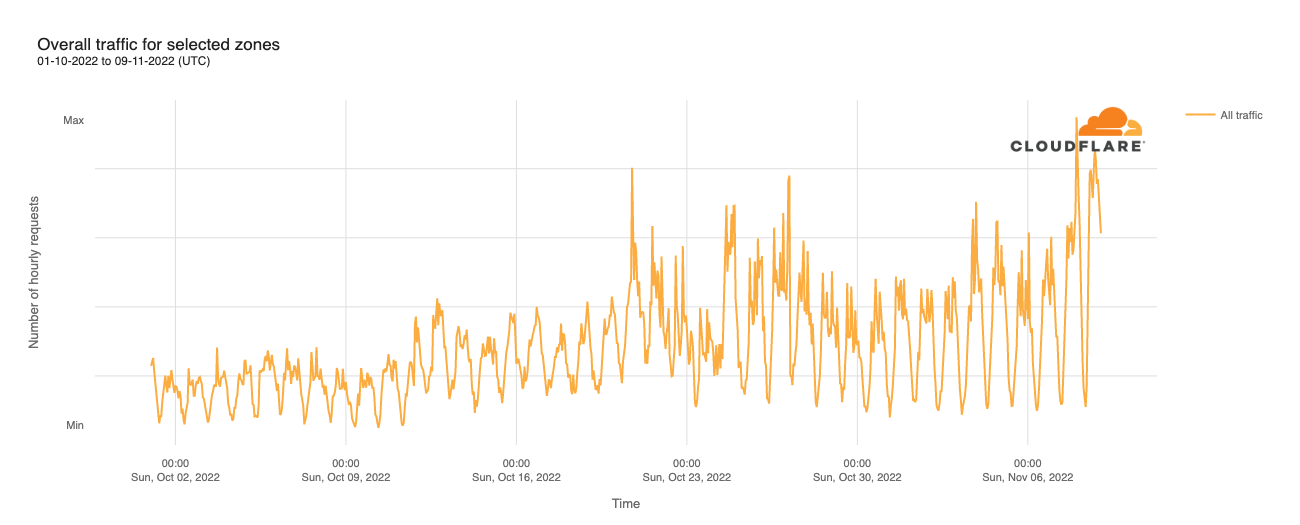
Throughout October, daily peak traffic volumes effectively doubled over the course of the month, with a weekday/weekend pattern also clearly visible. However, significant traffic growth is visible on Monday, November 7, and Tuesday, November 8 (Election Day), with Monday’s peak just under 2x October’s peaks, while Tuesday saw two peaks, one just under 4x higher than October peaks, while the other was just over 4x higher. Zooming in, the first peak was at 1300 UTC (0800 Eastern time, 0500 Pacific time), while the second was at 0400 UTC (2300 Eastern time, 2000 Pacific time). The first one appears to be aligned with the polls opening on the East Coast, while the second appears to be aligned with the time that the polls closed on the West Coast.
However, aggregating the traffic here presents a somewhat misleading picture. While both spikes were due to increased traffic across multiple customer sites, the second one was exacerbated by a massive increase in traffic for a single customer. Regardless, the increased traffic clearly shows that voters turned to local government sites around Election Day.
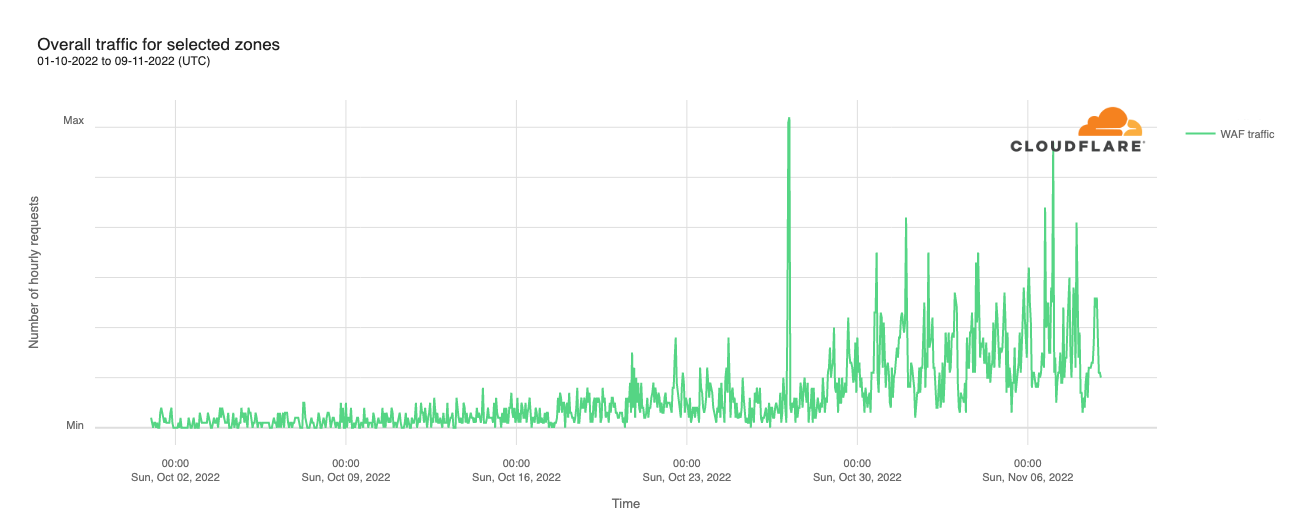
Despite this increase in overall traffic, attack traffic mitigated by Cloudflare’s Web Application Firewall (WAF) remained remarkably consistent throughout October and into November, as seen in the graph below. The obvious exception was an attack that occurred on Monday, October 10. This attack targeted a single Athenian Project participant, and was mitigated by rate limiting the requests.
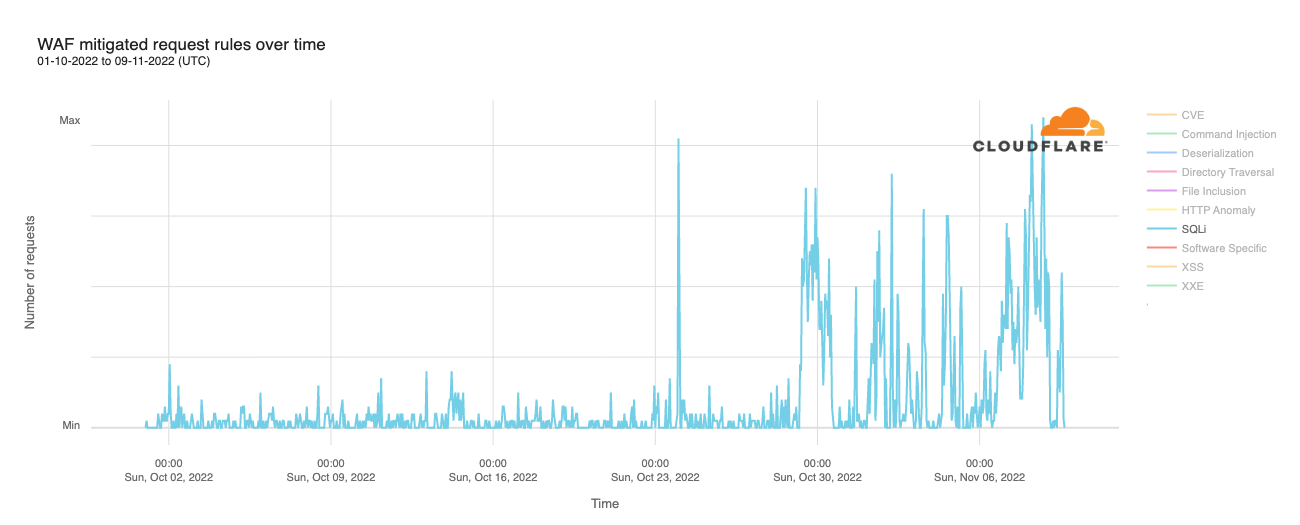
SQL injection (SQLi) attacks saw significant growth in volume in the week and a half ahead of Election Day, along with an earlier significant spike on October 24. While the last weekend in October (October 29 and 30) saw significant SQLi attack activity, the weekend of November 5 and 6 was comparatively quiet. However, those attacks ramped up again heading into and on Election Day, as seen in the graph below.
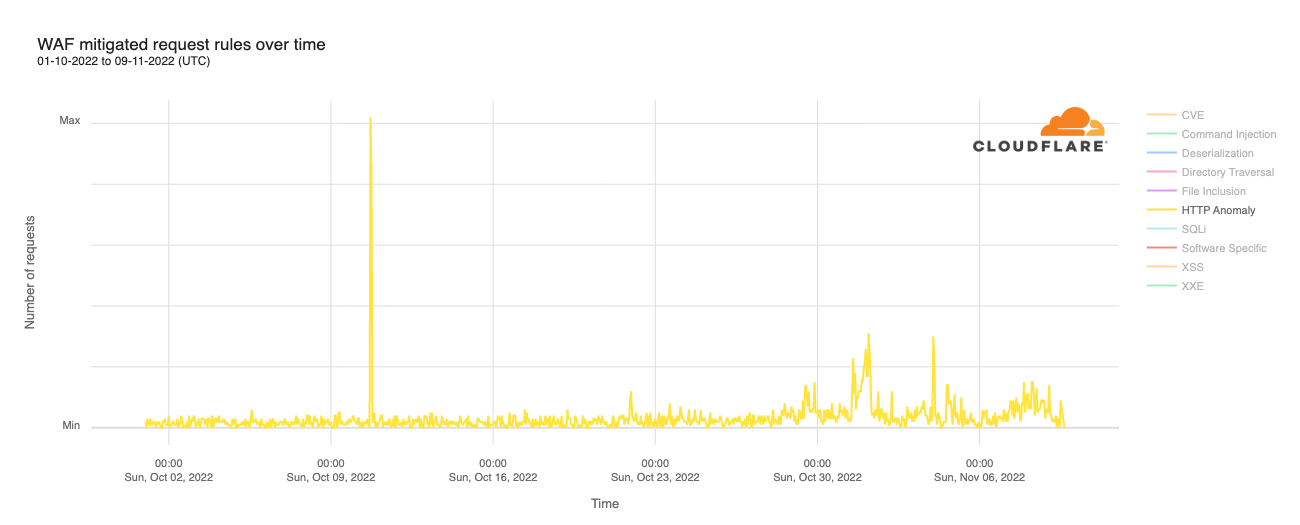
Attempted attacks mitigated with the HTTP Anomaly ruleset also ramped up in the week ahead of Election Day, though to a much lesser extent than SQLi attacks. As the graph below shows, the biggest spikes were seen on October 31/November 1, and just after midnight UTC on November 4 (late afternoon to early evening in the US). Related request volume also grew heading into Election Day, but without significant short-duration spikes. There is also a brief but significant attack clearly visible on the graph on October 10. However, it occurred several hours after the rate limited attack referenced above — it is not clear if the two are related.
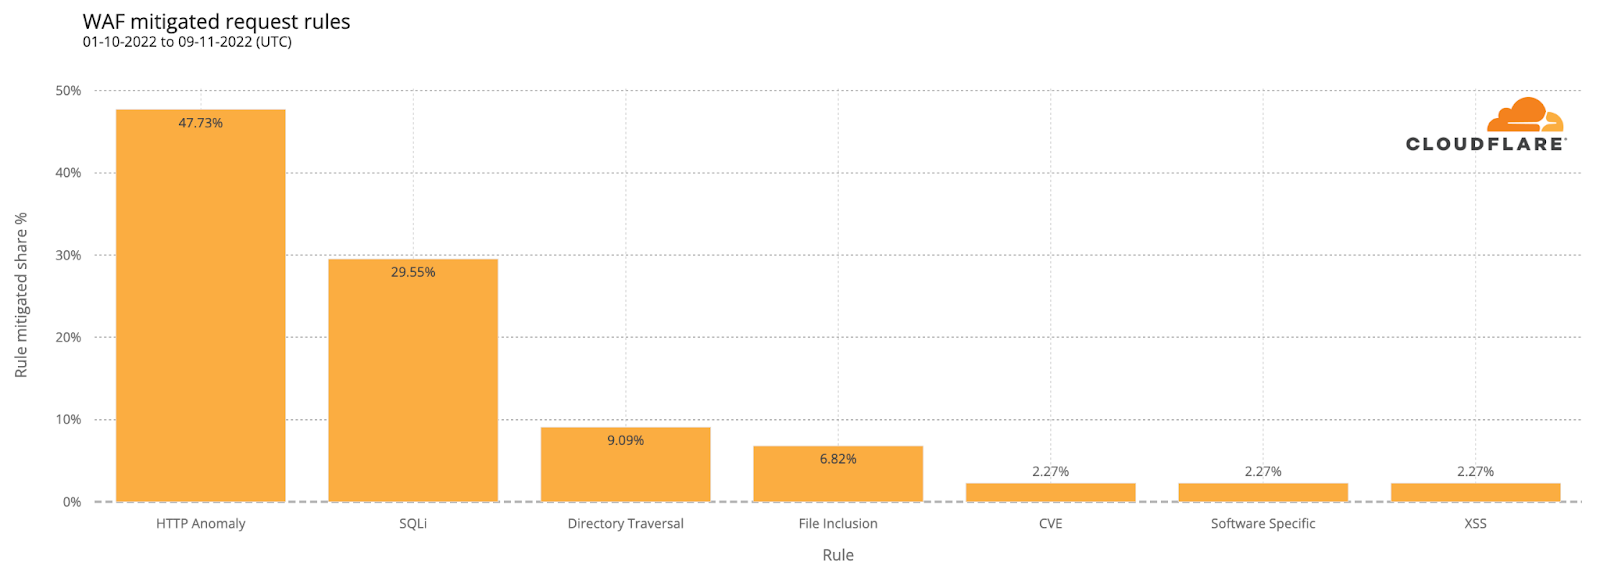
The distribution of attacks over the surveyed period from October 1 through November 9 shows that those categorized as SQLi and HTTP Anomaly were responsible for just over two-thirds of WAF-mitigated requests. Nearly 14% were categorized as “Software Specific,” which includes attacks related to specific CVEs. The balance of the attacks were mitigated by WAF rules in categories including File Inclusion, XSS (Cross Site Scripting), Directory Traversal, and Command Injection.
Media reports suggest that foreign adversaries actively try to interfere with elections in the United States. While this may be the case, analysis of the mitigated attacks targeting Athenian Project customers found that over 95% of the mitigated requests (attacks) came from IP addresses that geolocate to the United States. However, that does not mean that the attackers themselves are necessarily located in the country, but rather that they appear to be using compromised systems and proxies within the United States to launch their attacks against these sites protected by Cloudflare.
Cloudflare for Campaigns
In contrast to Athenian Project participants, traffic to candidate sites that are participants in Cloudflare for Campaigns began to grow several weeks ahead of Election Day. The graph below shows a noticeable increase (~50%) in peak traffic volumes starting on October 12, with an additional growth (50-100%) starting a week later. Traffic to these sites appeared to quiet a bit toward the end of October, but saw significant growth again heading into, and during, Election Day.
However, once again, this aggregate traffic data presents something of a misleading picture, as one candidate site saw multiple times more traffic than the other participating sites. While those other sites saw similar shifts in traffic as well, they were dwarfed by those experienced by the outlier site.
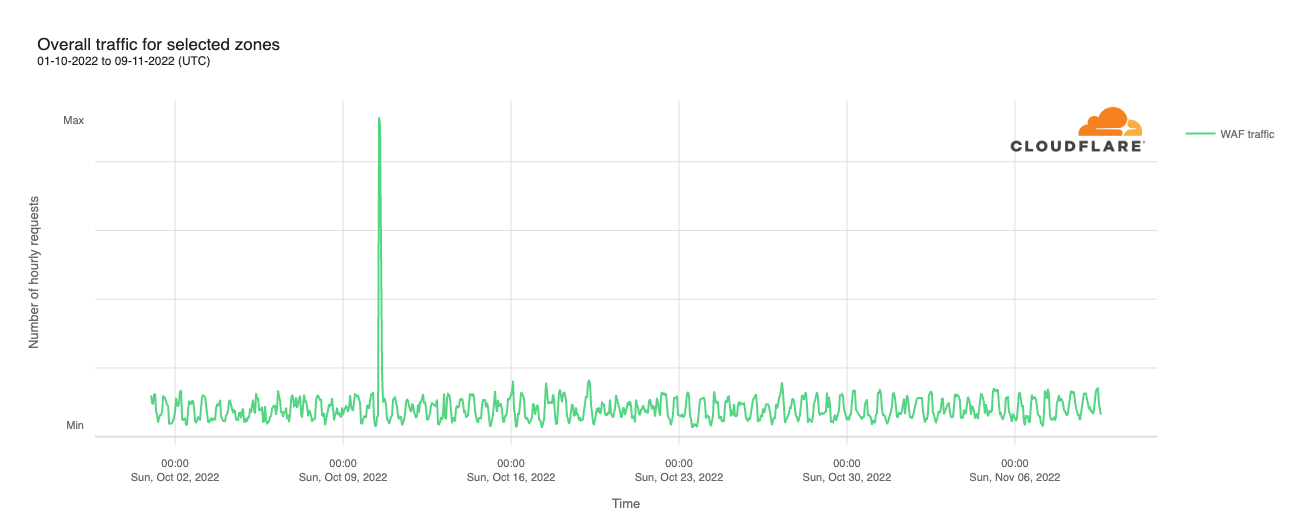
The WAF-mitigated traffic trend for campaign sites followed a similar pattern to the overall traffic. As the graph below shows, attack traffic also began to increase around October 19, with a further ramp near the end of the month. The October 27 spike visible in the graph was due to an attack targeting a single customer’s site, and was addressed using “Security Level” mitigation techniques, which uses IP reputation information to decide if and how to present challenges for incoming requests.
The top two rule categories, HTTP Anomaly and SQLi, together accounted for nearly three-quarters of the mitigated requests, and Directory Traversal attacks were just under 10% of mitigated requests for this customer set. The HTTP Anomaly and Directory Traversal percentages were higher than those for attacks targeting Athenian Project participants, while the SQLi percentage was slightly lower.
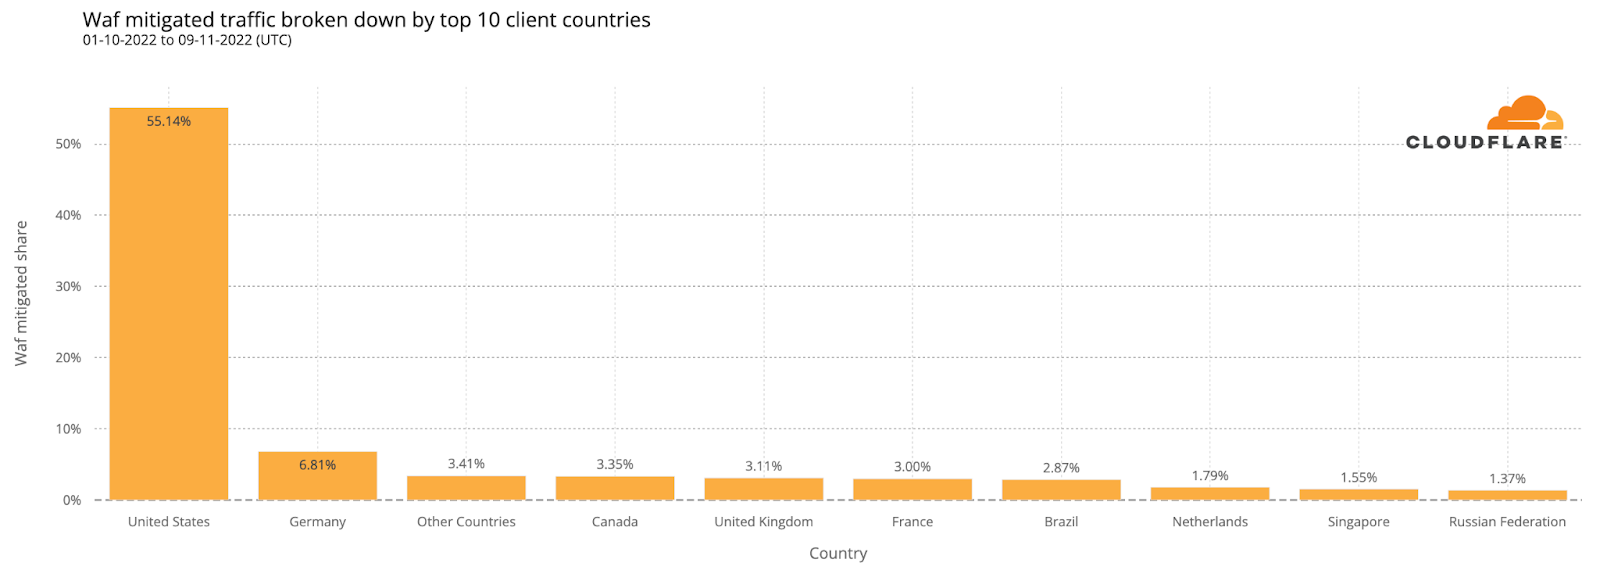
Once again, a majority of the WAF-mitigated attacks came from IP addresses in the United States. However, among Cloudflare for Campaigns participants, the United States only accounted for 55% of attacks, significantly lower than the 95% seen for Athenian Project participants. The balance is spread across a long tail of countries, with allies including Germany, Canada, and the United Kingdom among the top five. As noted above, however, the attackers may be elsewhere, and are using botnets or other compromised systems in these countries to launch attacks.
Improving security with data
We are proud to be trusted by local governments, campaigns, state parties, and voting rights organizations to protect their websites and provide uninterrupted access to information and trusted election results. Sharing information about the threats facing these websites helps us further support their valuable work by enabling them, and other participants in the election space, to take proactive steps to improve site security.
Cloudflare operates in more than 275 cities in over 100 countries, where we interconnect with over 10,000 network providers in order to provide a broad range of services to millions of customers. The breadth of both our network and our customer base provides us with a unique perspective on Internet resilience, enabling us to observe the impact of Internet disruptions. In many cases, these disruptions can be attributed to a physical event, while in other cases, they are due to an intentional government-directed shutdown. In this post, we review selected Internet disruptions observed by Cloudflare during the third quarter of 2022, supported by traffic graphs from Cloudflare Radar and other internal Cloudflare tools, and grouped by associated cause or common geography. The new Cloudflare Radar Outage Center provides additional information on these, and other historical, disruptions.
Government directed shutdowns
Unfortunately, for the last decade, governments around the world have turned to shutting down the Internet as a means of controlling or limiting communication among citizens and with the outside world. In the third quarter, this was an all too popular cause of observed disruptions, impacting countries and regions in Africa, the Middle East, Asia, and the Caribbean.
Iraq
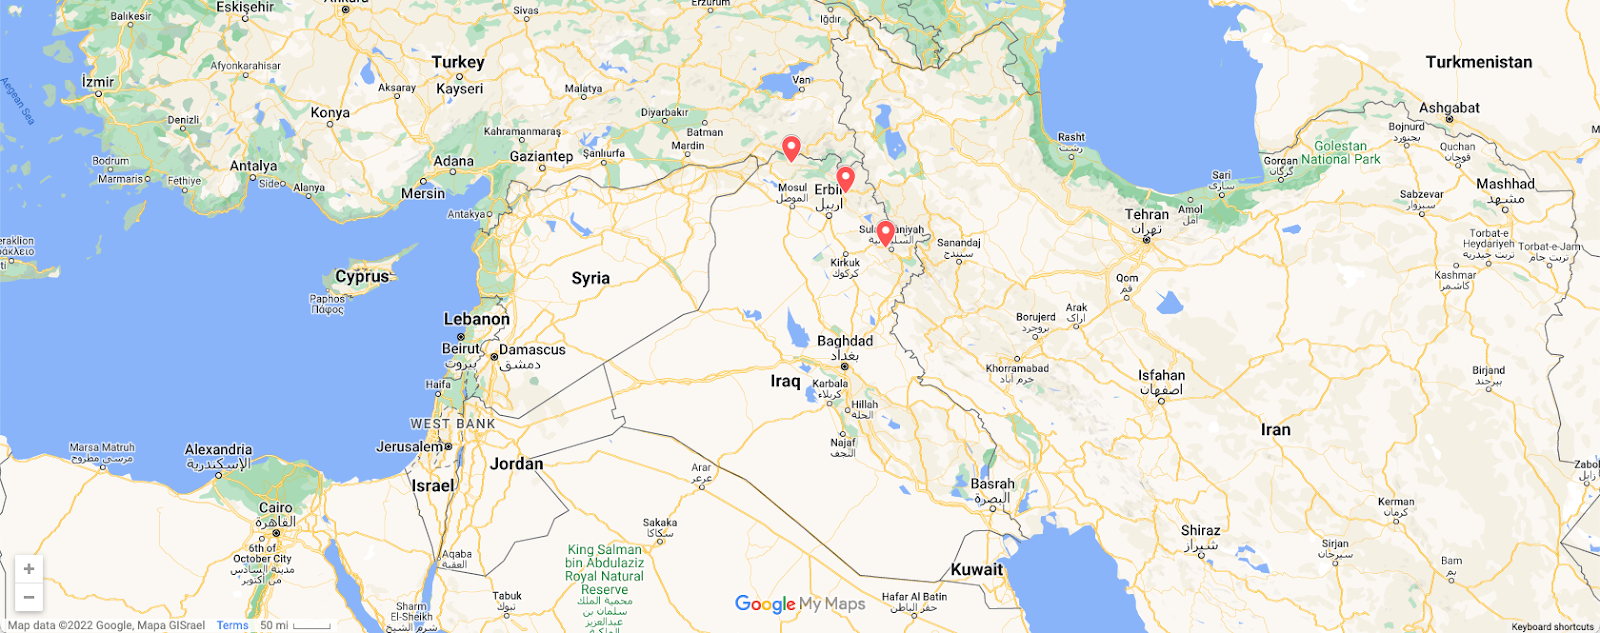
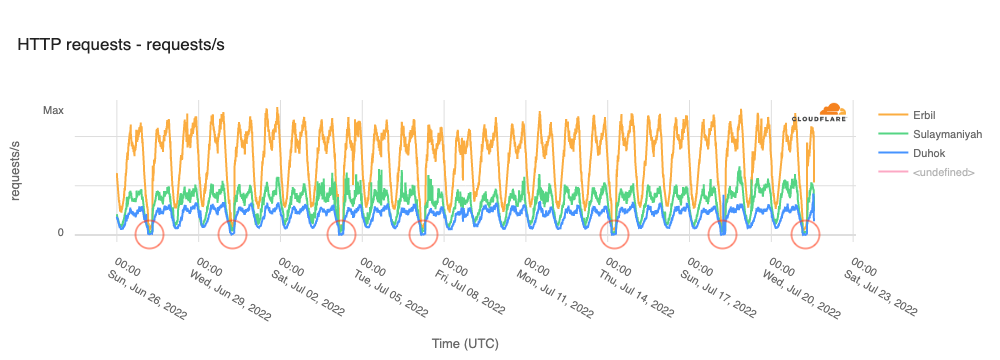
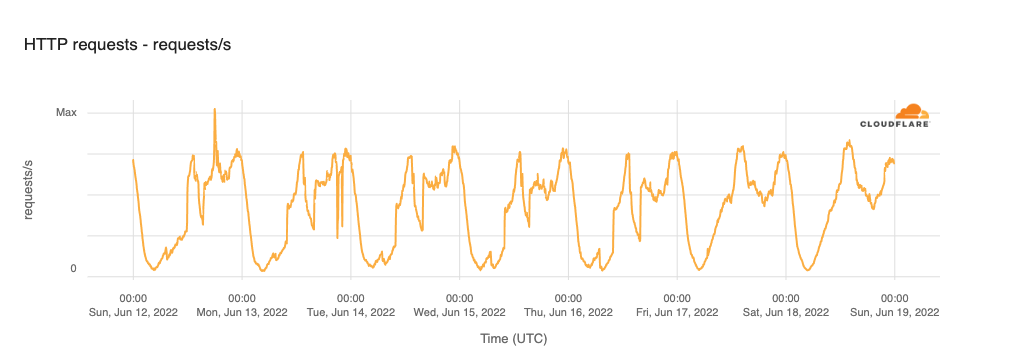
As mentioned in our Q2 summary blog post, on June 27, the Kurdistan Regional Government in Iraq began to implement twice-weekly (Mondays and Thursday) multi-hour regional Internet shutdowns over the following four weeks, intended to prevent cheating on high school final exams. As seen in the figure below, these shutdowns occurred as expected each Monday and Thursday through July 21, with the exception of July 21. They impacted three governorates in Iraq, and lasted from 0630–1030 local time (0330–0730 UTC) each day.
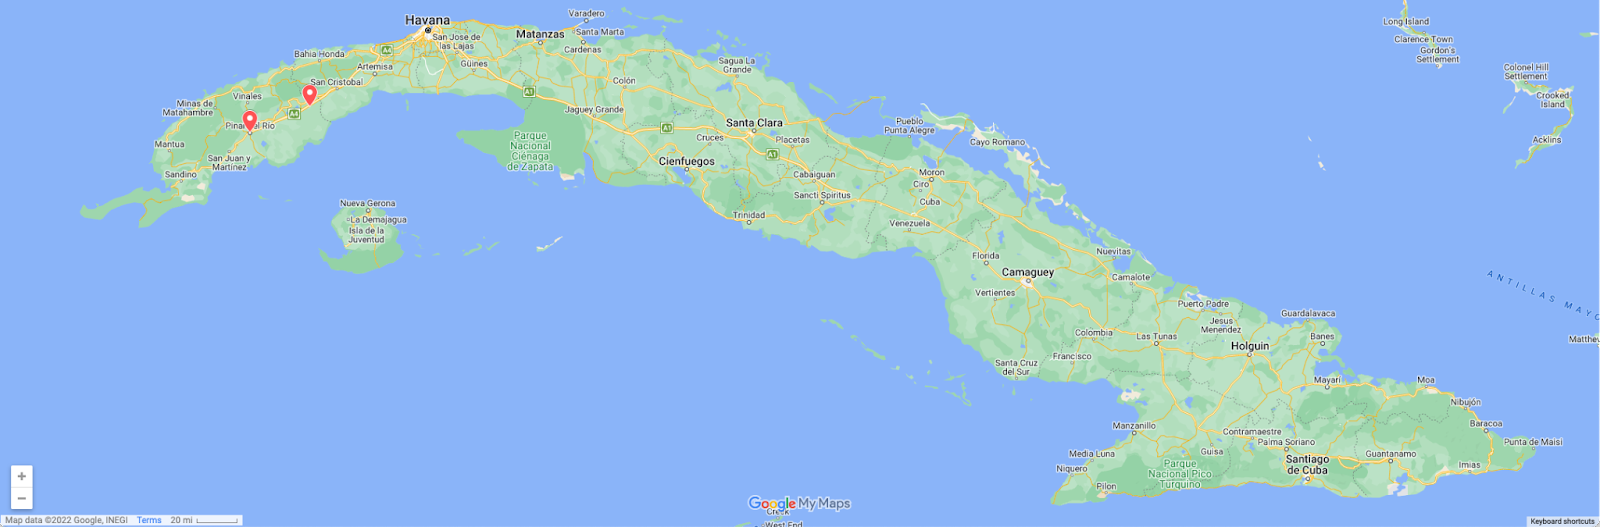
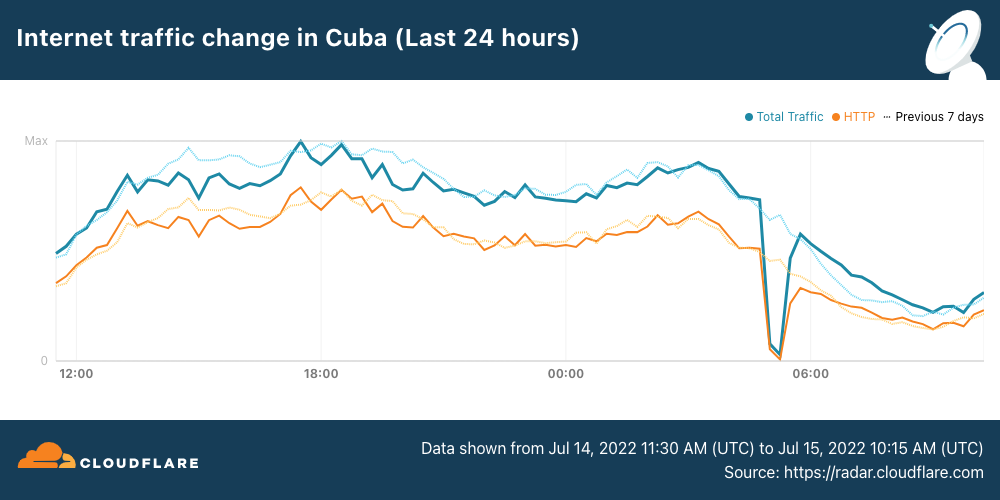
In Cuba, an Internet disruption was observed between 0055-0150 local time (0455-0550 UTC) on July 15 amid reported anti-government protests in Los Palacios and Pinar del Rio.
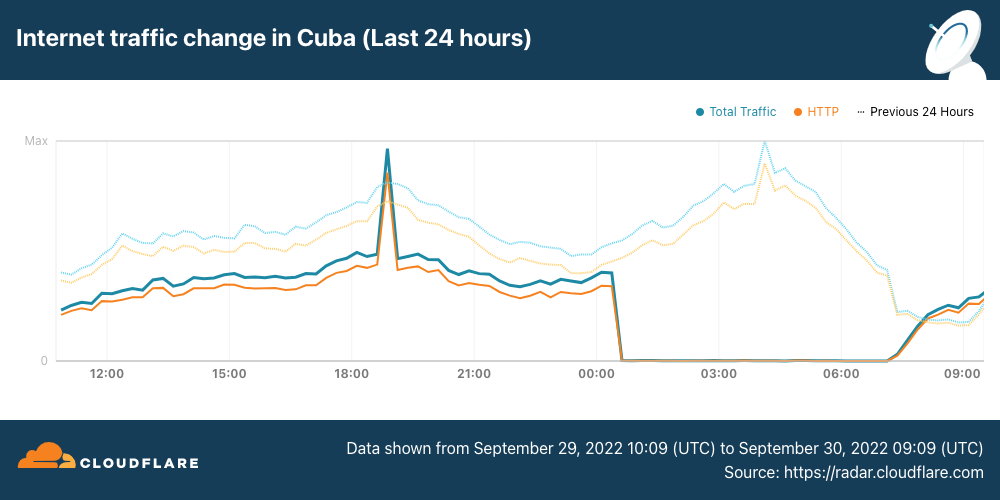
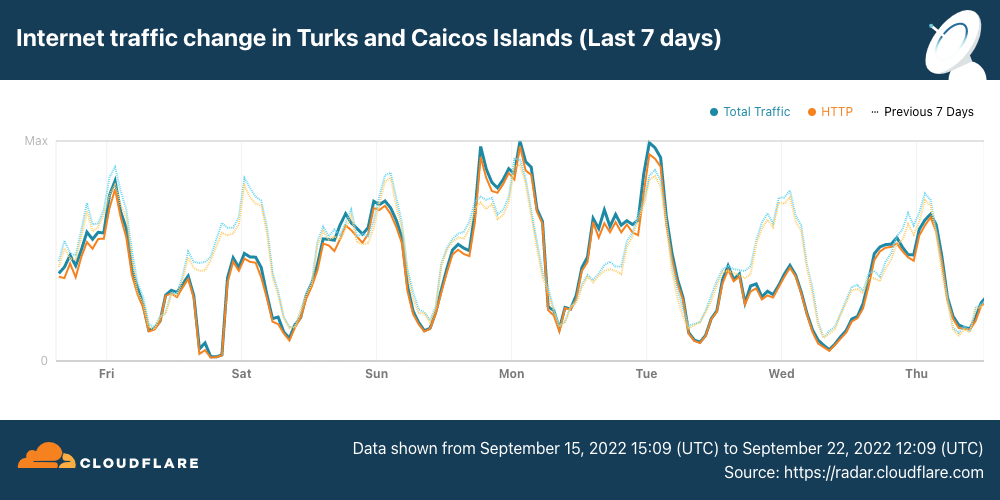
Closing out the quarter, another significant disruption was observed in Cuba, reportedly in response to protests over the lack of electricity in the wake of Hurricane Ian. A complete outage is visible in the figure below between 2030 on September 29 and 0315 on September 30 local time (0030-0715 UTC on September 30).
Afghanistan
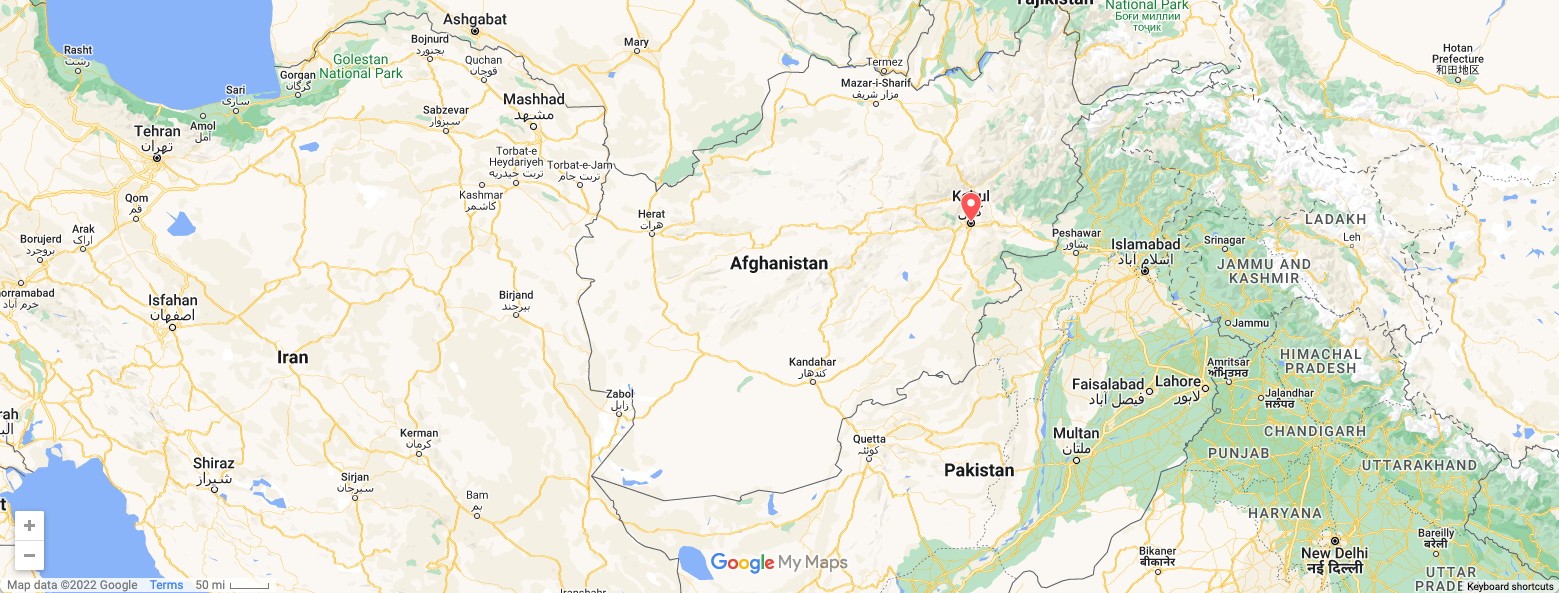
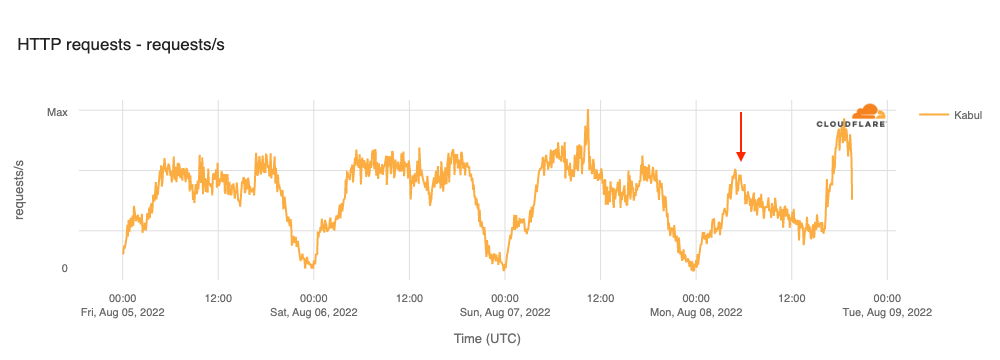
Telecommunications services were reportedly shut down in part of Kabul, Afghanistan on the morning of August 8. The figure below shows traffic dropping starting around 0930 local time (0500 UTC), recovering 11 hours later, around 2030 local time (1600 UTC).
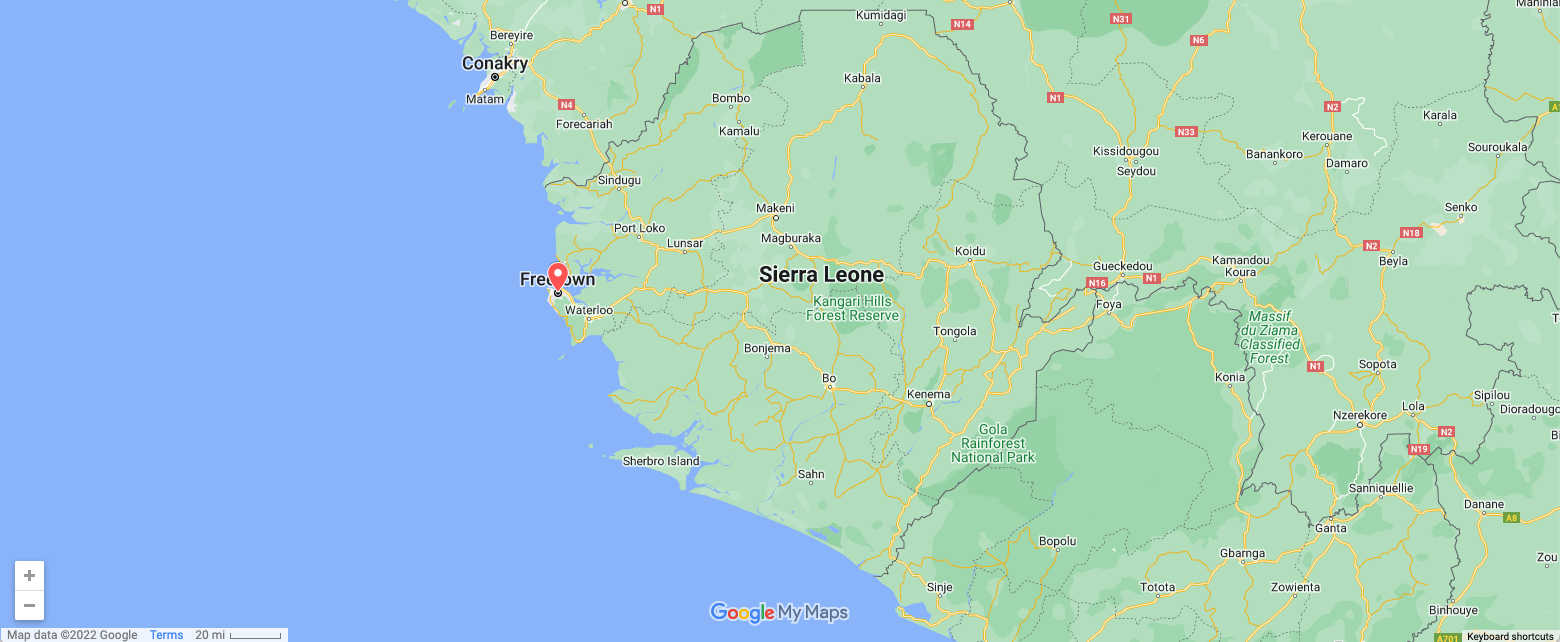
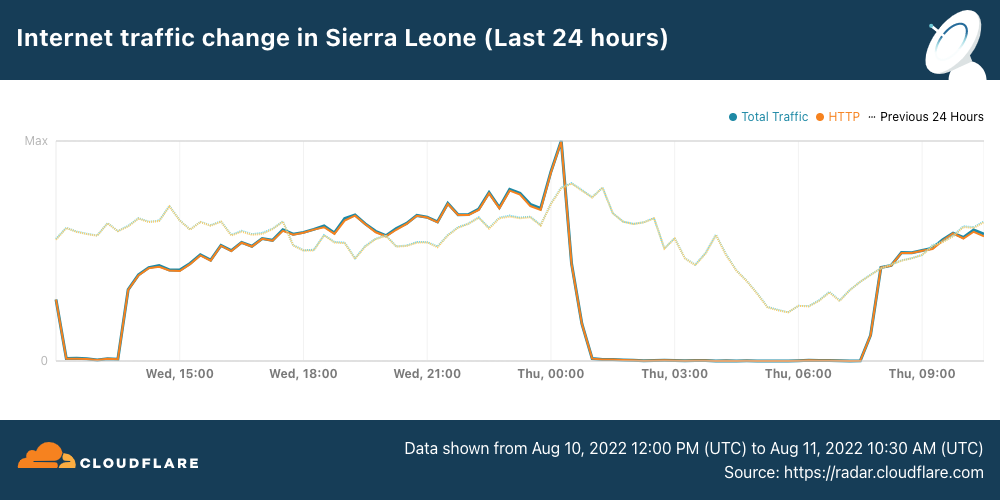
Protests in Freetown, Sierra Leone over the rising cost of living likely drove the Internet disruptions observed within the country on August 10 & 11. The first one occurred between 1200-1400 local time (1200-1400 UTC) on August 10. While this outage is believed to have been government directed as a means of quelling the protests, Zoodlabs, which manages Sierra Leone Cable Limited, claimed that the outage was the result of “emergency technical maintenance on some of our international routes”.
A second longer outage was observed between 0100-0730 local time (0100-0730 UTC) on August 11, as seen in the figure below. These shutdowns follow similar behavior in years past, where Internet connectivity was shut off following elections within the country.
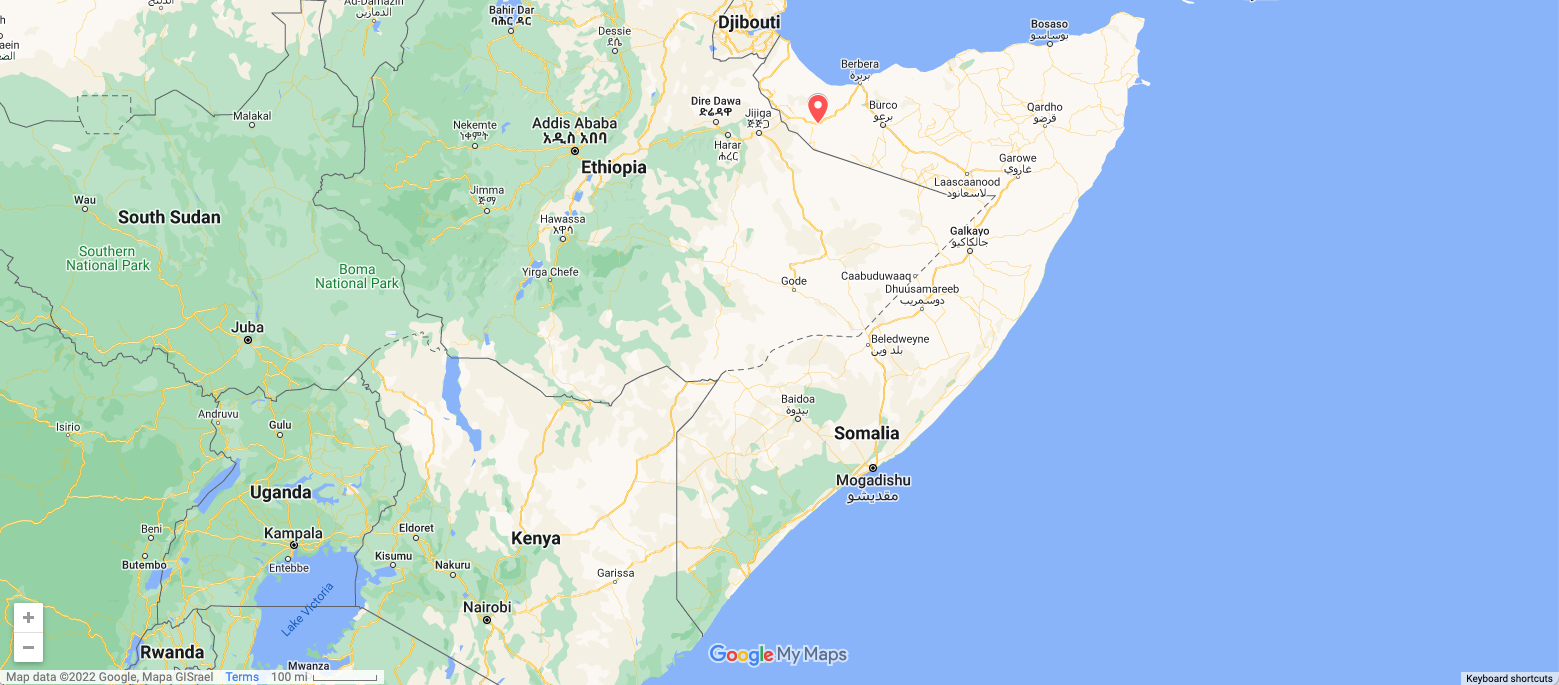
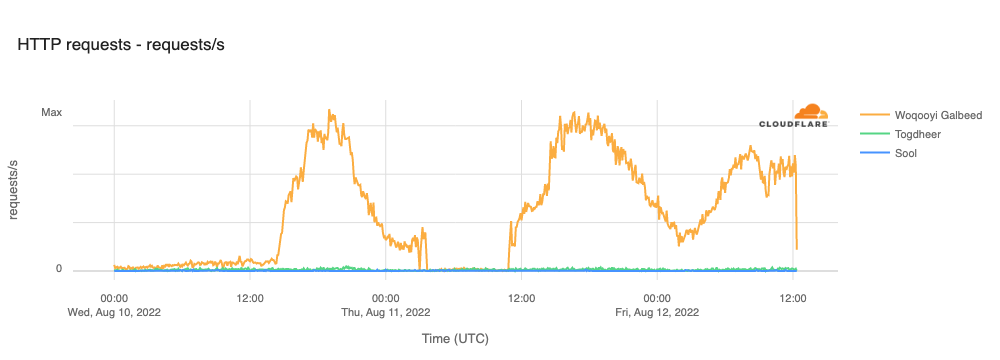
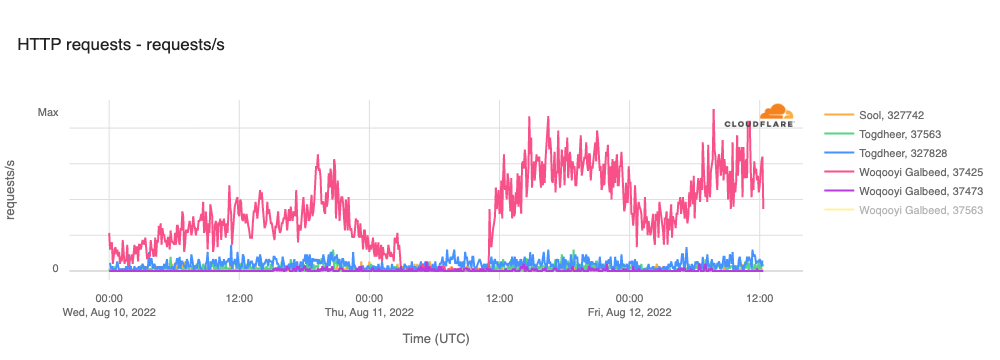
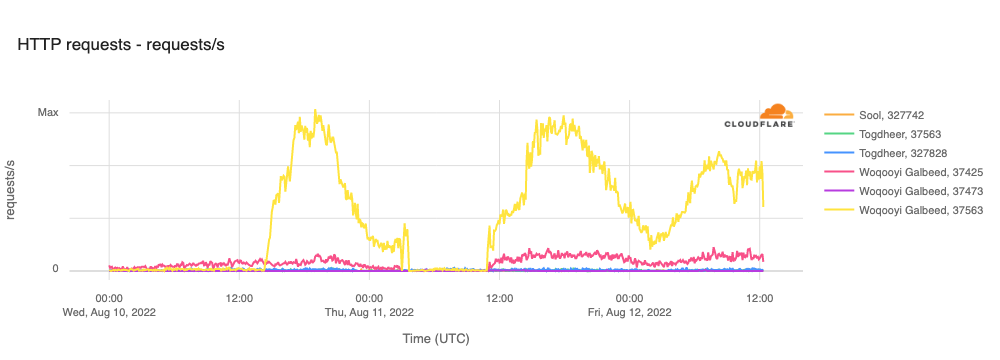
In Somaliland, local authorities reportedly cut off Internet service on August 11 ahead of scheduled opposition demonstrations. The figure below shows a complete Internet outage in Woqooyi Galbeed between 0645-1355 local time (0345-1055 UTC.)
At a network level, the observed outage was due to a loss of traffic from AS37425 (SomCable) and AS37563 (Somtel), as shown in the figures below. Somtel is a mobile services provider, while SomCable is focused on providing wireline Internet access.
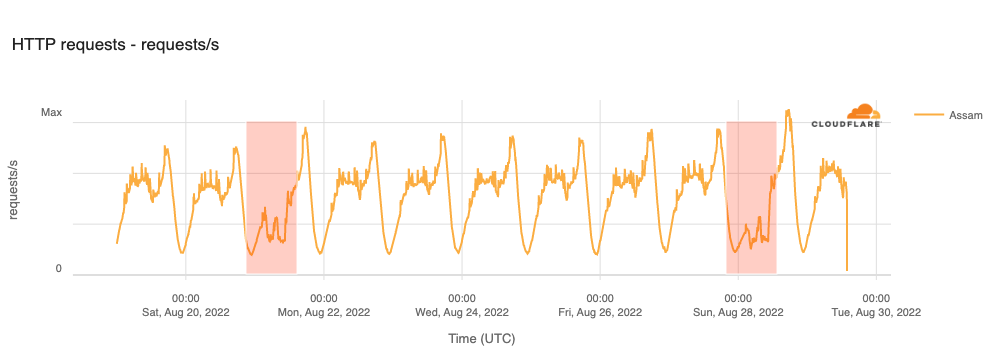
India
India is no stranger to government-directed Internet shutdowns, taking such action hundreds of times over the last decade. This may be changing in the future, however, as the country’s Supreme Court ordered the Ministry of Electronics and Information Technology (MEITY) to reveal the grounds upon which it imposes or approves Internet shutdowns. Until this issue is resolved, we will continue to see regional shutdowns across the country.
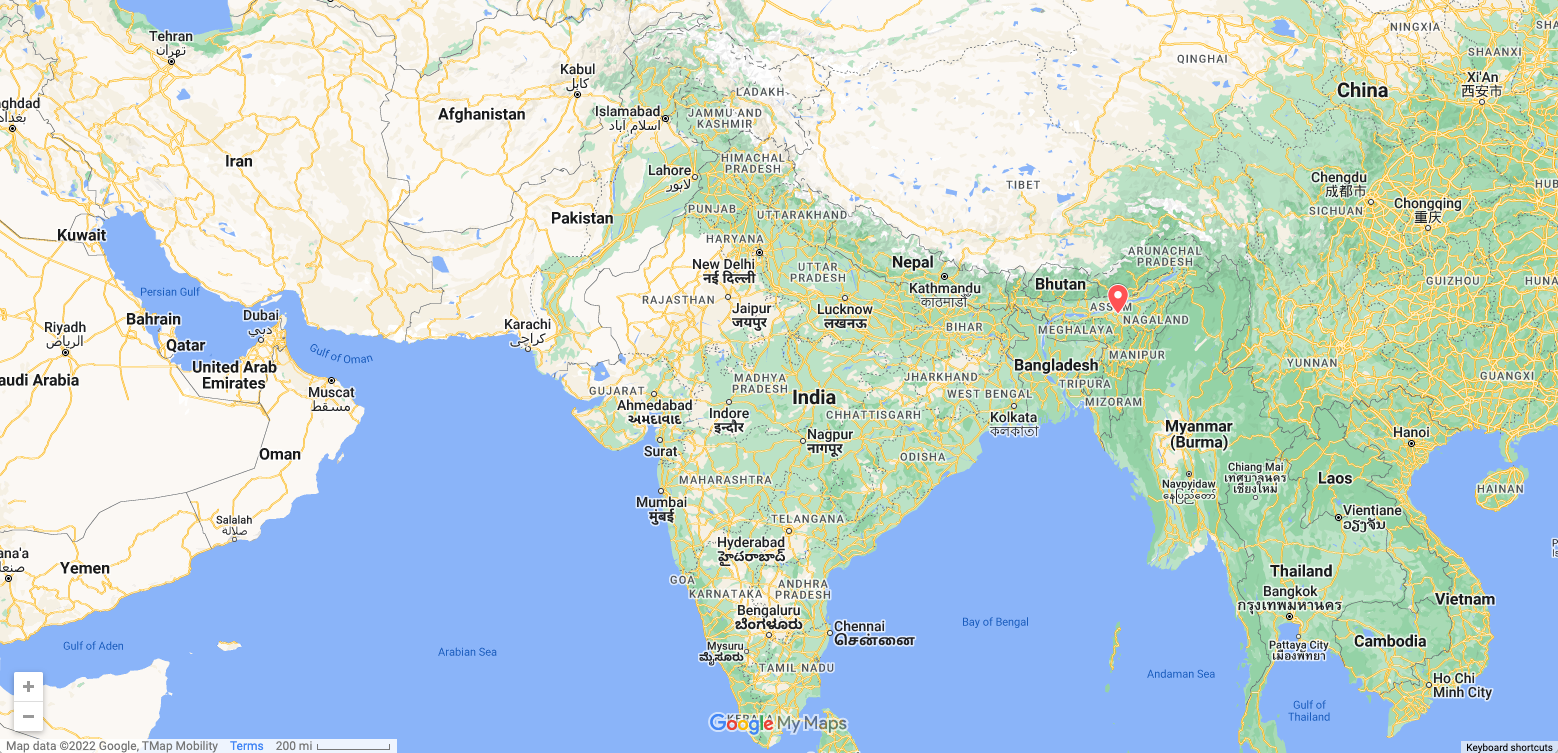
One such example occurred in Assam, where mobile Internet connectivity was shut down to prevent cheating on exams. The figure below shows that these shutdowns were implemented twice daily on August 21 and August 28. While the shutdowns were officially scheduled to take place between 1000-1200 and 1400-1600 local time (0430-0630 and 0830-1030 UTC), some providers reportedly suspended connectivity starting in the early morning.
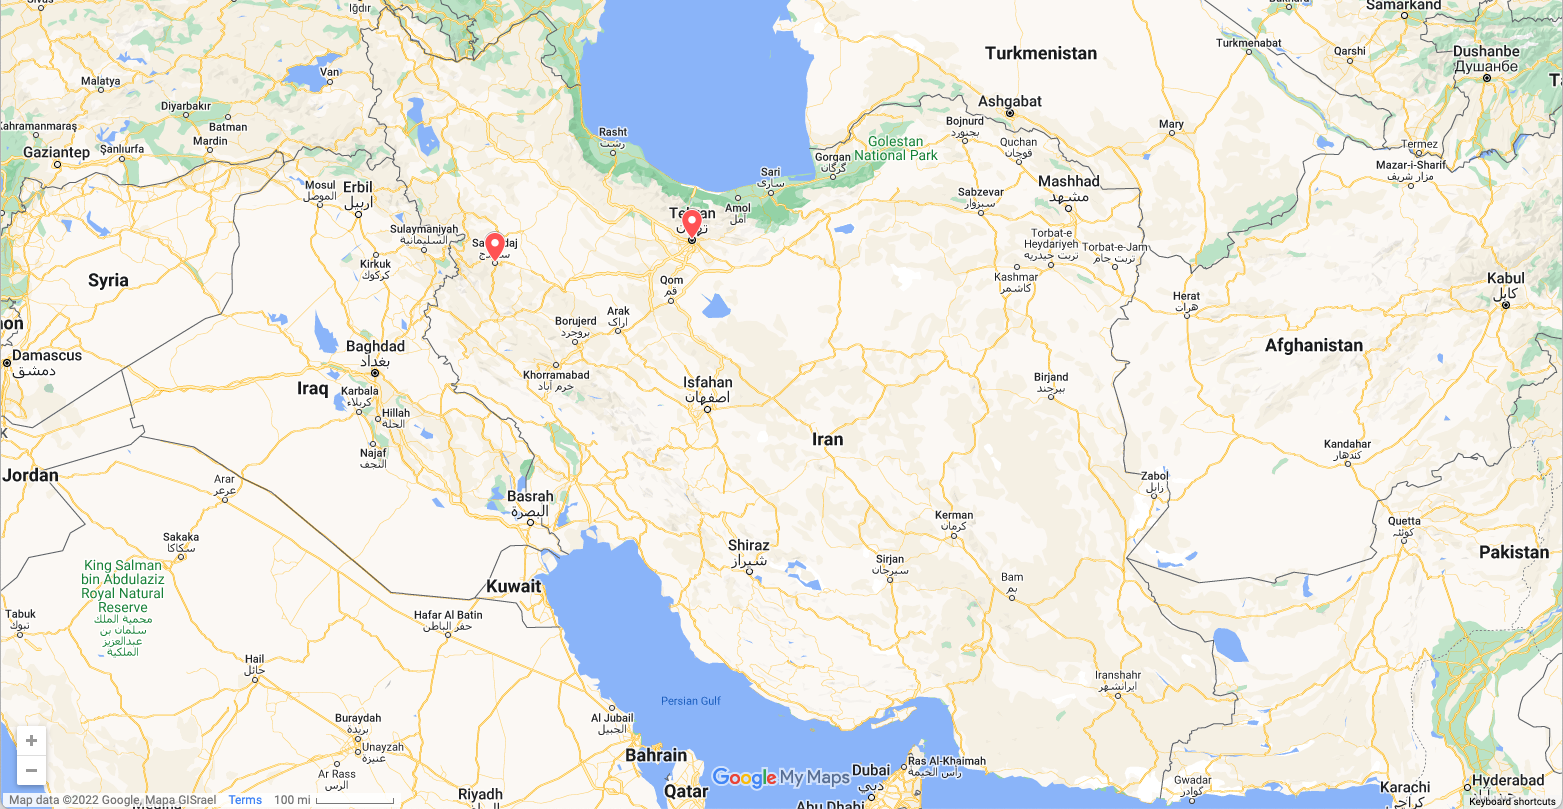
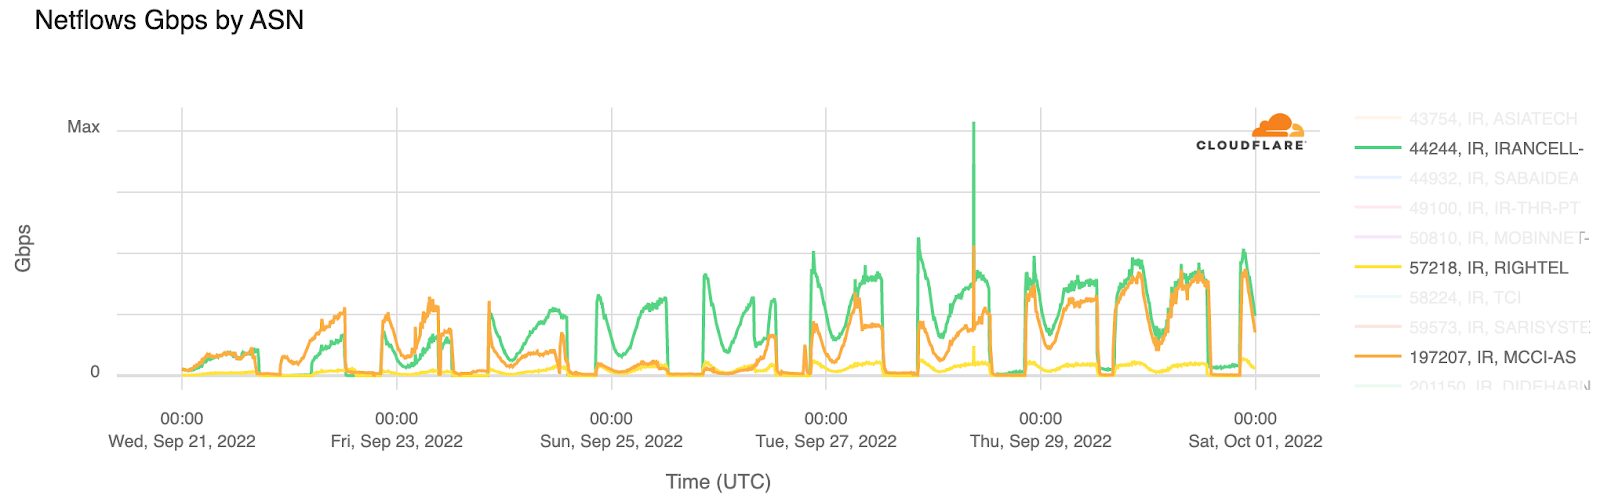
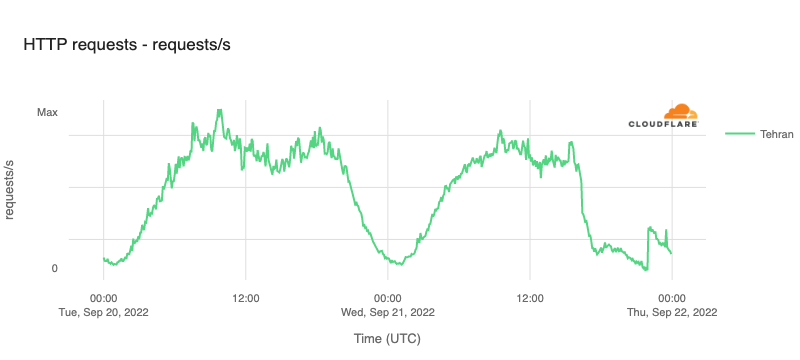
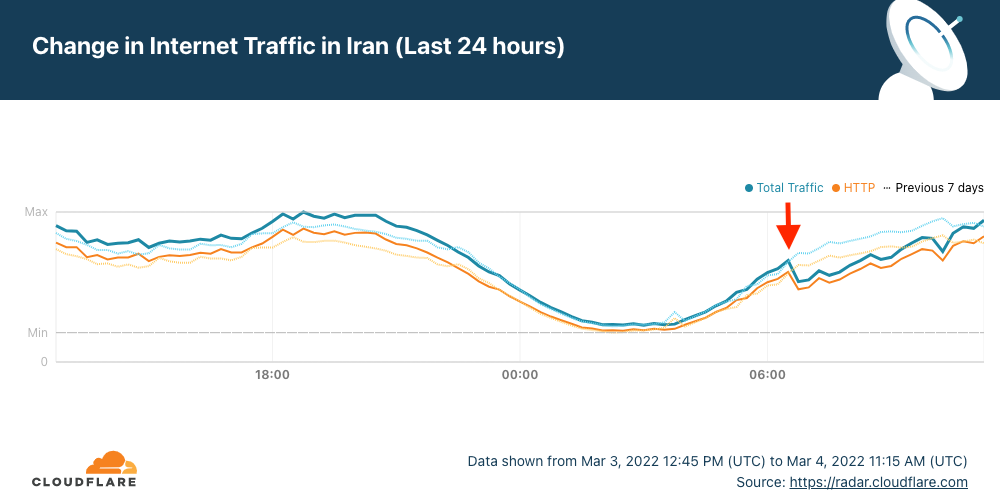
In addition to multi-hour outages in Sanadij and Tehran province on September 19 and 21 that were covered in a blog post, three mobile network providers — AS44244 (Irancell), AS57218 (RighTel), and AS197207 (MCCI) — implemented daily Internet “curfews”, generally taking place between 1600 and midnight local time (1230-2030 UTC), although the start times varied on several days. These regular shutdowns are clearly visible in the figure below, and continued into early October.
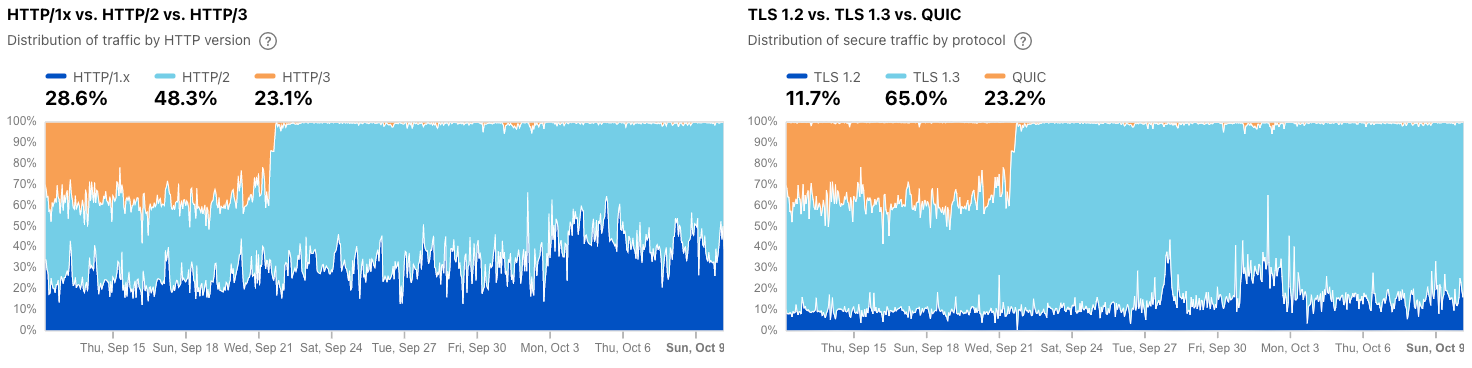
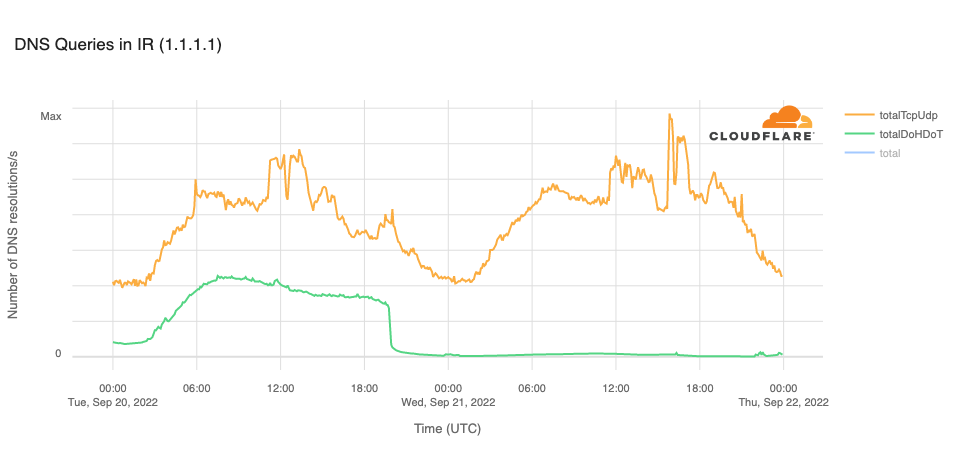
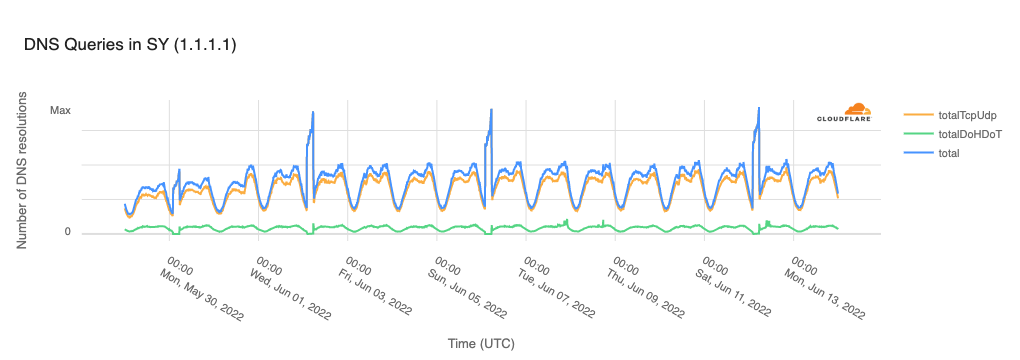
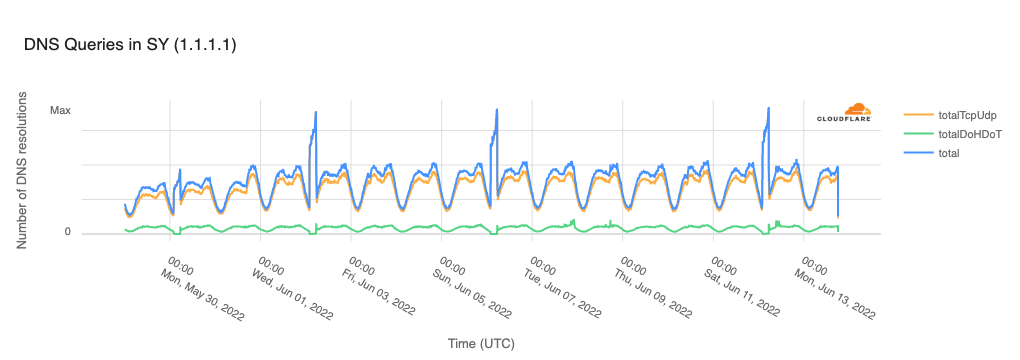
As noted in the blog post, access to DNS-over-HTTPS (DoH) and DNS-over-TLS (DoT) services was also blocked in Iran starting on September 20, and in a move that is likely related, connections over HTTP/3 and QUIC were blocked starting on September 22, as shown in the figure below from Cloudflare Radar.
Natural disasters
Natural disasters such as earthquakes and hurricanes wreak havoc on impacted geographies, often causing loss of life, as well as significant structural damage to buildings of all types. Infrastructure damage is also extremely common, with widespread loss of both electrical power and telecommunications infrastructure.
Papua New Guinea
On September 11, a 7.6 magnitude earthquake struck Papua New Guinea, resulting in landslides, cracked roads, and Internet connectivity disruptions. Traffic to the country dropped by 26% just after 1100 local time (0100 UTC) . The figure below shows that traffic volumes remained lower into the following day as well. An announcement from PNG DataCo, a local provider, noted that the earthquake “has affected the operations of the Kumul Submarine Cable Network (KSCN) Express Link between Port Moresby and Madang and the PPC-1 Cable between Madang and Sydney.” This damage, they stated, resulted in the observed outage and degraded service.
Several major hurricanes plowed their way up the east coast of North America in late September, causing significant damage, resulting in Internet disruptions. On September 18, island-wide power outages caused by Hurricane Fiona disrupted Internet connectivity on Puerto Rico. As the figure below illustrates, it took over 10 days for traffic volumes to return to expected levels. Luma Energy, the local power company, kept customers apprised of repair progress through regular updates to its Twitter feed.
Two days later, Hurricane Fiona slammed the Turks and Caicos islands, causing flooding and significant damage, as well as disrupting Internet connectivity. The figure below shows traffic starting to drop below expected levels around 1245 local time (1645 UTC) on September 20. Recovery took approximately a day, with traffic returning to expected levels around 1100 local time (1500 UTC) on September 21.
Continuing to head north, Hurricane Fiona ultimately made landfall in the Canadian province of Nova Scotia on September 24, causing power outages and disrupting Internet connectivity. The figure below shows that the most significant impact was seen in Nova Scotia. As Nova Scotia Power worked to restore service to customers, traffic volumes gradually increased, as seen in the figure below. By September 29, traffic volumes on the island had returned to normal levels.
Hurricane Ian
On September 28, Hurricane Ian made landfall in Florida, and was the strongest hurricane to hit Florida since Hurricane Michael in 2018. With over four million customers losing power due to damage from the storm, a number of cities experienced associated Internet disruptions. Traffic from impacted cities dropped significantly starting around 1500 local time (1900 UTC), and as the figure below shows, recovery has been slow, with traffic levels still not back to pre-storm volumes more than two weeks later.
In addition to power outages caused by earthquakes and hurricanes, a number of other power outages caused multi-hour Internet disruptions during the third quarter.
Iran
A reported power outage in a key data center building disrupted Internet connectivity for customers of local ISP Shatel in Iran on July 25. As seen in the figure below, traffic dropped significantly at approximately 0715 local time (0345 UTC). Recovery began almost immediately, with traffic nearing expected levels by 0830 local time (0500 UTC).
Venezuela
Electrical issues frequently disrupt Internet connectivity in Venezuela, and the independent @vesinfiltro Twitter account tracks these events closely. One such example occurred on August 9, when electrical issues disrupted connectivity across multiple states, including Mérida, Táchira, Barinas, Portuguesa, and Estado Trujillo. The figure below shows evidence of two disruptions, the first around 1340 local time (1740 UTC) and the second a few hours later, starting at around 1615 local time (2015 UTC). In both cases, traffic volumes appeared to recover fairly quickly.
On September 5, a power outage in Oman impacted energy, aviation, and telecommunications services. The latter is evident in the figure below, which shows the country’s traffic volume dropping nearly 60% when the outage began just before 1515 local time (0915 UTC). Although authorities claimed that “the electricity network would be restored within four hours,” traffic did not fully return to normal levels until 0400 local time on September 6 (2200 UTC on September 5) the following day, approximately 11 hours later.
Ukraine
Over the last seven-plus months of war in Ukraine, we have observed multiple Internet disruptions due to infrastructure damage and power outages related to the fighting. We have covered these disruptions in our first and second quarter summary blog posts, and continue to do so on our @CloudflareRadar Twitter account as they occur. Power outages were behind Internet disruptions observed in Kharkiv on September 11, 12, and 13.
The figure below shows that the first disruption started around 2000 local time (1700 UTC) on September 11. This near-complete outage lasted just over 12 hours, with traffic returning to normal levels around 0830 local time (0530 UTC) on the 12th. However, later that day, another partial outage occurred, with a 50% traffic drop seen at 1330 local time (1030 UTC). This one was much shorter, with recovery starting approximately an hour later. Finally, a nominal disruption is visible at 0800 local time (0500 UTC) on September 13, with lower than expected traffic volumes lasting for around five hours.
Cable damage
Damage to both terrestrial and submarine cables have caused many Internet disruptions over the years. The recent alleged sabotage of the sub-sea Nord Stream natural gas pipelines has brought an increasing level of interest from European media (including Swiss and French publications) around just how important submarine cables are to the Internet, and an increasing level of concern among policymakers about the safety of these cable systems and the potential impact of damage to them. However, the three instances of cable damage reviewed below are all related to terrestrial cable.
Iran
On August 1, a reported “fiber optic cable” problem caused by a fire in a telecommunications manhole disrupted connectivity across multiple network providers, including AS31549 (Aria Shatel), AS58224 (TIC), AS43754 (Asiatech), AS44244 (Irancell), and AS197207 (MCCI). The disruption started around 1215 local time (0845 UTC) and lasted for approximately four hours. Because it impacted a number of major wireless and wireline networks, the impact was visible at a country level as well, as seen in the figure below.
Pakistan
Cable damage due to heavy rains and flooding caused several Internet disruptions in Pakistan in August. The first notable disruption occurred on August 19, starting around 0700 local time (0200 UTC) and lasted just over six and a half hours. On August 22, another significant disruption is also visible, starting at 2250 local time (1750 UTC), with a further drop at 0530 local time (0030 UTC) on the 23rd. The second more significant drop was brief, lasting only 45 minutes, after which traffic began to recover.
Haiti
Amidst protests over fuel price hikes, fiber cuts in Haiti caused Internet outages on multiple network providers. Starting at 1500 local time (1900 UTC) on September 14, traffic on AS27759 (Access Haiti) fell to zero. According to a (translated) Twitter post from the provider, they had several fiber optic cables that were cut in various areas of the country, and blocked roads made it “really difficult” for their technicians to reach the problem areas. Repairs were eventually made, with traffic starting to increase again around 0830 local time (1230 UTC) on September 15, as shown in the figure below.
Access Haiti provides AS27774 (Haiti Networking Group) with Internet connectivity (as an “upstream” provider), so the fiber cut impacted their connectivity as well, causing the outage shown in the figure below.
Technical problems
As a heading, “technical problems” can be a catch-all, referring to multiple types of issues, including misconfigurations and routing problems. However, it is also sometimes the official explanation given by a government or telecommunications company for an observed Internet disruption.
Rogers
Arguably the most significant Internet disruption so far this year took place on AS812 (Rogers), one of Canada’s largest Internet service providers. At around 0845 UTC on July 8, a near complete loss of traffic was observed, as seen in the figure below.
The figure below shows that small amounts of traffic were seen from the network over the course of the outage, but it took nearly 24 hours for traffic to return to normal levels.
A notice posted by the Rogers CEO explained that “We now believe we’ve narrowed the cause to a network system failure following a maintenance update in our core network, which caused some of our routers to malfunction early Friday morning. We disconnected the specific equipment and redirected traffic, which allowed our network and services to come back online over time as we managed traffic volumes returning to normal levels.” A Cloudflare blog post covered the Rogers outage in real-time, highlighting related BGP activity and small increases of traffic.
Chad
A four-hour near-complete Internet outage took place in Chad on August 12, occurring between 1045 and 1300 local time (0945 to 1400 UTC). Authorities in Chad said that the disruption was due to a “technical problem” on connections between Sudachad and networks in Cameroon and Sudan.
Unknown
In many cases, observed Internet disruptions are attributed to underlying causes thanks to statements by service providers, government officials, or media coverage of an associated event. However, for some disruptions, no published explanation or associated event could be found.
On August 11, a multi-hour outage impacted customers of US telecommunications provider Centurylink in states including Colorado, Iowa, Missouri, Montana, New Mexico, Utah, and Wyoming, as shown in the figure below. The outage was also visible in a traffic graph for AS209, the associated autonomous system.
Starlink
On August 30, satellite Internet provider suffered a global service disruption, lasting between 0630-1030 UTC as seen in the figure below.
Conclusion
As part of Cloudflare’s Birthday Week at the end of September, we launched the Cloudflare Radar Outage Center (CROC). The CROC is a section of our new Radar 2.0 site that archives information about observed Internet disruptions. The underlying data that powers the CROC is also available through an API, enabling interested parties to incorporate data into their own tools, sites, and applications. For regular updates on Internet disruptions as they occur and other Internet trends, follow @CloudflareRadar on Twitter.
Historically, Cloudflare has covered large-scale Internet outages with timely blog posts, such as those published for Iran, Sudan, Facebook, and Syria. While we still explore such outages on the Cloudflare blog, throughout 2022 we have ramped up our monitoring of Internet outages around the world, posting timely information about those outages to @CloudflareRadar on Twitter.
Furthermore, this initial release is also laying the groundwork for the CROC to become a first stop and key resource for civil society organizations, journalists/news media, and impacted parties to get information on, or corroboration of, reported or observed Internet outages.
What information does the CROC contain?
At launch, the CROC includes summary information about observed outage events. This information includes:
Location: Where was the outage?
ASN: What autonomous system experienced a disruption in connectivity?
Type: How broad was the outage? Did connectivity fail nationwide, or at a sub-national level? Did just a single network provider have an outage?
Scope: If it was a sub-national/regional outage, what state or city was impacted? If it was a network-level outage, which one?
Cause: Insight into the likely cause of the outage, based on publicly available information. Historically, some have been government directed shutdowns, while others are caused by severe weather or natural disasters, or by infrastructure issues such as cable cuts, power outages, or filtering/blocking.
Start time: When did the outage start?
End time: When did the outage end?
Using the CROC
Radar pages, including the main landing page, include a card displaying information about the most recently observed outage, along with a link to the CROC. The CROC will also be linked from the left-side navigation bar
Within the CROC, we have tried to keep the interface simple and easily understandable. Based on the selected time period, the global map highlights locations where Internet outages have been observed, along with a tooltip showing the number of outages observed during that period. Similarly, the table includes information (as described above) about each observed outage, along with a link to more information. The linked information may be a Twitter post, a blog post, or a custom Radar graph.
As mentioned in the Radar 2.0 launch blog post, we launched an associated API alongside the new site. Outage information is available through this API as well — in fact, the CROC is built on top of this API. Interested parties, including civil society organizations, data journalists, or others, can use the API to integrate the available outage data with their own data sets, build their own related tools, or even develop a custom interface.
Information about the related API endpoint and how to access it can be found in the Cloudflare API documentation.
We recognize that some users may want to download the whole list of observed outages for local consumption and analysis. They can do so by clicking the “Download CSV” link below the table.
The status page the Internet needs (coming soon)
Today’s launch of the Cloudflare Radar Outage Center is just the beginning, as we plan to improve it over time. This includes increased automation of outage detection, enabling us to publish more timely information through both the API and the CROC tool, which is important for members of the community that track and respond to Internet outages. We are also exploring how we can use synthetic monitoring in combination with other network-level performance and availability information to detect outages of popular consumer and business applications/platforms.
And anyone who uses a cloud platform provider (such as AWS) will know that those companies’ status pages take a surprisingly long time to update when there’s an outage. It’s very common to experience difficulty accessing a service, see hundreds of messages on Twitter and message boards about a service being down, only to go to the cloud platform provider’s status page and see everything green and “All systems normal”.
For the last few months we’ve been monitoring the performance of cloud platform providers to see if we can detect when they go down and provide our own, real time status page for them. We believe we can and Cloudflare Radar Outage Center will be extended to include cloud service providers and give the Internet the status page it needs.
If you have questions about the CROC, or suggestions for features that you would like to see, please reach out to us on Twitter at @CloudflareRadar.
Published reports indicate that the growing protests have resulted in at least eight deaths. Iran has a history of restricting Internet connectivity in response to protests, taking such steps in May 2022, February 2021, and November 2019. They have taken a similar approach to the current protests, including disrupting Internet connectivity, blocking social media platforms, and blocking DNS. The impact of these actions, as seen through Cloudflare’s data, are reviewed below.
On September 21, Internet disruptions started to become more widespread, with mobile networks effectively shut down nationwide. (Iran is a heavily mobile-centric country, with Cloudflare Radar reporting that 85% of requests are made from mobile devices.) Internet traffic from Iran Mobile Communications Company (AS197207) started to decline around 1530 UTC, and remained near zero until it started to recover at 2200 UTC, returning to “normal” levels by the end of the day.
Internet traffic from RighTel (AS57218) began to decline around 1630 UTC. After an outage lasting more than 12 hours, traffic returned at 0510 UTC.
Internet traffic from MTN Irancell (AS44244) began to drop just before 1700 UTC. After a 12-hour outage, traffic began recovering at 0450 UTC.
The impact of these disruptions is also visible when looking at traffic at both a regional and national level. In Tehran Province, HTTP request volume declined by approximately 70% around 1600 UTC, and continued to drop for the next several hours before seeing a slight recovery at 2200 UTC, likely related to the recovery also seen at that time on AS197207.
Similarly, Internet traffic volumes across the whole country began to decline just after 1600 UTC, falling approximately 40%. Nominal recovery at 2200 UTC is visible in this view as well, again likely from the increase in traffic from AS197207. More aggressive traffic growth is visible starting around 0500 UTC, after the remaining two mobile network providers came back online.
In analyzing DNS requests to Cloudflare’s resolver for domains associated with leading social media platforms, we observe that requests for instagram.com hostnames drop sharply at 1310 UTC, remaining lower for the rest of the day, except for a significant unexplained spike in requests between 1540 and 1610 UTC. Request volumes for hostnames associated with other leading social media platforms did not appear to be similarly affected.
In addition, it was reported that access to WhatsApp had also been blocked in Iran. This can be seen in resolution requests to Cloudflare’s resolver for whatsapp.com hostnames. The graph below shows a sharp decline in query traffic at 1910 UTC, dropping to near zero.
The Open Observatory for Network Interference (OONI), an organization that measures Internet censorship, reported in a Tweet that the cloudflare-dns.com domain name, used for DNS-over-HTTPS (DoH) and DNS-over-TLS (DoT) connections to Cloudflare’s DNS resolver, was blocked in Iran on September 20. This is clearly evident in the graph below, with resolution volume over DoH and DoT dropping to zero at 1940 UTC. The OONI tweet also noted that the 1.1.1.1 IP address “remains blocked on most networks.” The trend line for resolution over TCP or UDP (on port 53) in the graph below suggests that the IP address is not universally blocked, as there are still resolution requests reaching Cloudflare.
Interested parties can use Cloudflare Radar to monitor the impact of such government-directed Internet disruptions, and can follow @CloudflareRadar on Twitter for updates on Internet disruptions as they occur.
Cloudflare operates in more than 270 cities in over 100 countries, where we interconnect with over 10,000 network providers in order to provide a broad range of services to millions of customers. The breadth of both our network and our customer base provides us with a unique perspective on Internet resilience, enabling us to observe the impact of Internet disruptions. In many cases, these disruptions can be attributed to a physical event, while in other cases, they are due to an intentional government-directed shutdown. In this post, we review selected Internet disruptions observed by Cloudflare during the second quarter of 2022, supported by traffic graphs from Cloudflare Radar and other internal Cloudflare tools, and grouped by associated cause or common geography.
Optic outages
This quarter, we saw the usual complement of damage to both terrestrial and submarine fiber-optic cables, including one that impacted multiple countries across thousands of miles, and another more localized outage that was due to an errant rodent.
Comcast
On April 25, Comcast subscribers in nearly 20 southwestern Florida cities experienced an outage, reportedly due to a fiber cut. The traffic impact of this cut is clearly visible in the graph below, with Cloudflare traffic for these cities dropping to zero between 1915–2050 UTC (1515–1850 local time).
Not only did the fiber cut force a significant number of Comcast subscribers offline, but it also impacted the types of traffic observed across Comcast as a whole. The graphs below illustrate the mix of mobile vs desktop clients, as well as IPv4 vs. IPv6 request volume across AS7922, Comcast’s primary autonomous system. During the brief disruption period, the percentage of Comcast traffic from mobile devices increased, while desktop devices dropped, and the percentage of IPv4 traffic dropped, with a corresponding increase in IPv6 traffic share.
South Africa
On the morning of May 17, Telkom SA, a South African telecommunications provider, tweeted an “important notice” to customers, noting that “Damage to a Fibre cable was detected on the Telkom network around 8:00am on Tuesday, 17 May 2022.” and outlining the impacted services and geographies. The graphs below show the impact to Cloudflare traffic from the Telkom autonomous system in three South African provinces. The top graph shows the impact to traffic in Gauteng, while the lower graph shows the impact in Limpopo and North West. Across all three, traffic falls at 0600 UTC (0800 local time), recovering around 1300 UTC (1500 local time). Telkom SA did not provide any additional information on where the fiber cut occurred or what caused it.
Venezuela
Although unconfirmed, a fiber cut was suspected to be the cause of an Internet disruption experienced by CANTV subscribers in Venezuela on May 19, the latest of several such incidents affecting that provider. Although the fiber cut reportedly impacted subscribers in multiple states, the most significant impact was measured in Falcón, as shown in the graph below. In this state, traffic dropped precipitously at 1800 UTC (1400 local time), finally recovering approximately 24 hours later.
AAE-1 & SMW-5
Just after 1200 UTC on Tuesday, June 7, the Africa-Asia-Europe-1 (AAE-1) and SEA-ME-WE-5 (SMW-5) submarine cables suffered cable cuts, impacting Internet connectivity for millions of Internet users across multiple countries in the Middle East and Africa, as well as thousands of miles away in Asia. Although specific details are sparse, the cable damage reportedly occurred in Egypt – both of the impacted cables land in Abu Talat and Zafarana, which also serve as landing points for a number of other submarine cables.
Finally, on June 13, a beaver was responsible for an outage that impacted Internet users in British Columbia, Canada. According to a published report, a beaver gnawed its way through a tree, causing it to fall on both power lines and a Telus fiber optic cable. The damage to the fiber optic cable affected connectivity customers in over a dozen communities across British Columbia, including those using CityWest (AS18988), a utility company that uses the Telus cable. In the graph below, the impact of the damage to the fiber optic cable is clearly visible, with no traffic to Cloudflare from CityWest subscribers in British Columbia between 1800 UTC on June 7 until 0310 UTC on June 8 (1100–2010 local time).
School’s in, Internet’s out
Nationwide Internet shutdowns have, unfortunately, become a popular approach taken by authoritarian regimes over the past half dozen years to prevent cheating on secondary school exams. It is not clear that this heavy-handed tactic is actually effective in preventing cheating, but the associated damage to the national economies has been estimated to be in the tens to hundreds of millions of US dollars, depending on the duration and frequency of the shutdowns.
This year, governments in Sudan and Syria implemented a number of multi-hour shutdowns in late May into June, while Algeria’s government appears to have resorted to more targeted content blocking. Additional details on these Internet disruptions can be found in the recent “Exam time means Internet disruptions in Syria, Sudan and Algeria” blog post.
Starting on May 30, Syria implemented the first of four nationwide Internet shutdowns, the last of which occurred on June 12, as seen in the graph below. Interestingly, we have observed that these shutdowns tend to be “asymmetric” in nature — that is, inbound traffic (into the country) is disabled, but egress traffic (from the country) remains. One effect of this is visible as spikes in the DNS graph below. During three of the four shutdowns, requests to Cloudflare’s 1.1.1.1 resolver from clients in Syria increased because DNS queries were able to exit the country, but responses couldn’t return, leading to retry floods.
In Sudan, daily shutdowns were implemented 0530-0830 UTC (0730–1030 local time) between June 11 and June 22, except for June 17. (It isn’t clear why that date was skipped.) The graph below shows that these shutdowns were nationwide, but not complete, as traffic from the country did not drop to zero.
In Algeria, exams took place June 12 through June 16. In the past, the country has implemented nationwide shutdowns, but after recognizing the enormous cost to the economy, the government has apparently chosen an alternate tactic this year. The graph below shows nominal drops in country-level traffic during the two times each day that the exams took place—0730–1000 UTC (0830–1100 am local time) and 1330–1600 UTC (1430–1700 local time). These drops in traffic are likely more indicative of a content-blocking approach, instead of a broad Internet shutdown.
On June 27, the Kurdistan Regional Government in Iraq began to implement twice-weekly (Mondays and Thursday) multi-hour regional Internet shutdowns, expected to last for a four-week period. The shutdowns are intended to prevent cheating on high school final exams, according to a published report, and are scheduled for 0630–1030 am local time (0330–0730 UTC). The graph below shows the impact to traffic from three governorates in Kurdistan, with traffic dropping to near zero in all three areas during the duration of the shutdowns.
Government-guided
In addition to shutting down the Internet to prevent cheating on exams, governments have also been known to use shutdowns as a tool to limit or control communication around elections, rallies, protests, etc. During the second quarter, we observed several such shutdowns of note.
A month and a half later, on May 25, an Internet disruption was observed in Pakistan amid protests led by the country’s former Prime Minister. The disruption lasted only two hours, and was limited in scope — it was not a nationwide shutdown. (Telecom providers claimed that it was due to problems with a web filtering system.) At a national level, the impact of the disruption is visible as a slight drop in traffic.
In the cities of Lahore and Karachi, the disruption is visible a little more clearly, as is the rapid recovery in traffic.
The impact of the disruption is most evident at a network level, as seen in the graphs below. Cyber Internet Services (AS9541) saw a modest drop in traffic, while Mobilink (AS45669) experienced a near complete outage.
Closing out the quarter, a communications blackout, including an Internet shutdown, was imposed in Sudan on June 30 as protestors staged rallies against the country’s military leadership. This shutdown follows similar disruptions seen in October 2021 after the military toppled the transitional government and attempted to limit protests, as well the shutdowns seen earlier in June as the government attempted to prevent cheating on exams. The graphs below show that the shutdown started at 0600 UTC (0800 local time) and initially ended almost 12 hours later at 1740 UTC (1940 local time). Connectivity returned for approximately three hours, with traffic again dropping to near-zero levels again around 2040 UTC (2240 local time). This second outage remained active at the end of the day.
In addition to fiber/cable cuts, as discussed above, problems with other infrastructure, whether due to fires, electrical issues, or maintenance, can also disrupt Internet services.
Around 2030 local time on April 6 (0030 UTC on April 7), a fire erupted at the Costa Sur generation plant, one of the largest power plants in Puerto Rico, resulting in a widespread power outage across the island territory. This island-wide outage caused a significant interruption to Internet services, clearly visible in Cloudflare traffic data. The graph below shows that as the power failed, traffic from Puerto Rico immediately fell by more than half. The regular diurnal pattern remained in place, albeit at lower levels, over the next three days, with traffic returning to “normal levels” three days later. By April 10, Luma Energy reported that it had restored electrical power to 99.7% of its 1.5M customers.
The impact of the Internet service disruption is also fairly significant when viewed at a network level. The graphs below show traffic for Datacom Caribe/Claro (AS10396) and Liberty Cablevision of Puerto Rico (AS14638). At Datacom Caribe/Claro, traffic immediately fell by more than half, while Liberty Cablevision traffic declined approximately 85%.
On the evening of May 3, Swiss telecom provider Swisscom tweeted that there had been an interruption to Internet service following maintenance work. A published report noted that the interruption occurred between 2223–2253 local time (2023–2053 UTC), and the graph below shows a complete loss of traffic, but quick recovery, during that 30-minute window. Beyond citing maintenance work, Swisscom did not provide any additional details about the Internet disruption.
On May 6, the government disrupted Internet connectivity in Khuzestan province, reportedly in response to mass protests around shortages of bread and water. It was reported that mobile data had been cut off locally, and that fixed connectivity speeds were significantly reduced. To this end, we observed a drop in traffic for Irancell (AS44244) (a mobile network provider) in Khuzestan starting around 1000 UTC as seen in the graph below.
A similar disruption affecting Irancell, occurring amid reports of ongoing protests in the country, was observed on May 12, with lower peak traffic during the day, and a further drop around 1800 UTC.
Mobile provider Mobinnet (AS50810) experienced a multi-hour Internet disruption on May 14, lasting from 1230–1530 UTC (1700–2000 local time). According to a tweet from Mobinnet, the disruption was due to a “widespread cyber attack of foreign origin”.
Ukraine
Now more than four months into the war in Ukraine, the Internet continues to be an active battlefield, with ongoing Internet outages in multiple cities and across multiple networks. However, we want to highlight here two similar events observed during the second quarter.
The Russian-occupied city of Kherson experienced a near-complete Internet outage between 1600 UTC (1900 local time) on April 30 and 0430 UTC (0730 local time) on May 4. According to social media posts from Ukraine’s vice Prime-Minister Mykhailo Fedorov and the State Service of Special Communications and Information Protection, the outage was caused by “interruptions of fiber-optic trunk lines and disconnection from the power supply of equipment of operators in the region”. The graph below shows effectively no traffic for Kherson for approximately 24 hours after the disruption began, followed by a nominal amount of traffic for the next several days.
Around the time that the nominal amount of traffic returned, we also observed a shift in routing for an IPv4 prefix announced by AS47598 (Khersontelecom). As shown in the table below, prior to the outage, it reached the Internet through several other Ukrainian network providers, including AS12883, AS3326, and AS35213. However, as traffic returned, its routing path now showed a Russian network, AS201776 (Miranda) as the upstream provider. The path through Miranda also includes AS12389 (Rostelecom), which bills itself as “the largest digital services provider in Russia”.
Peer AS
Last Update
AS Path
AS1299 (TWELVE99 Arelion, fka Telia Carrier)
5/1/2022 16:02:26
1299 12389 201776 47598
AS6777 (AMS-IX-RS)
4/28/2022 11:23:33
12883 47598
As the disruption ended on May 4, we observed updates to Khersontelecom’s routing path that enabled it to return to reaching the global Internet through non-Russian upstream providers.
A month later, on May 30, we again observed a significant Internet disruption in Kherson starting at 1435 UTC (1735 local time). And once again, we observed updated routing for Khersontelecom, as it shifted from Ukrainian upstream providers to Russian ones. As of the end of June, the Internet disruption in Kherson and the routing through Russian upstream providers both remain firmly in place, although the loss of traffic has not been nearly as significant as the April/May disruption.
Peer AS
Last Update
AS Path
AS4775 (Globe Telecoms)
5/30/2022 13:56:22
4775 1273 12389 201776 47598
AS9002 (RETN-AS)
5/30/2022 09:58:16
9002 3326 47598
Conclusion
This post is by no means an exhaustive review of the Internet outages, shutdowns, and disruptions that have occurred throughout the second quarter. Some were extremely brief or limited in scope, while others were observed but had no known or publicly conjectured underlying cause. Having said that, it is important to bring increased visibility to these events so that the community can share information on what is happening, why it happened, and what the impact was — human, financial, or otherwise.
Follow @CloudflareRadar on Twitter for updates on Internet disruptions as they occur, and find up-to-date information on Internet trends using Cloudflare Radar.
On May 19, 2021, a Microsoft blog post announced that “The future of Internet Explorer on Windows 10 is in Microsoft Edge” and that “the Internet Explorer 11 desktop application will be retired and go out of support on June 15, 2022, for certain versions of Windows 10.” According to an associated FAQ page, those “certain versions” include Windows 10 client SKUs and Windows 10 IoT. According to data from Statcounter, Windows 10 currently accounts for over 70% of desktop Windows market share on a global basis, so this “retirement” impacts a significant number of Windows systems around the world.
As the retirement date for Internet Explorer 11 has recently passed, we wanted to explore several related usage trends:
Is there a visible indication that use is declining in preparation for its retirement?
Where is Internet Explorer 11 still in the heaviest use?
How does the use of Internet Explorer 11 compare to previous versions?
How much Internet Explorer traffic is “likely human” vs. “likely automated”?
How do Internet Explorer usage patterns compare with those of Microsoft Edge, its replacement?
The long goodbye
Publicly released in January 2020, and automatically rolled out to Windows users starting in June 2020, Chromium-based Microsoft Edge has become the default browser for the Windows platform, intended to replace Internet Explorer. Given the two-year runway, and Microsoft’s May 2021 announcement, we would expect to see Internet Explorer traffic decline over time as users shift to Edge.
Looking at global request traffic to Cloudflare from Internet Explorer versions between January 1 and June 20, 2022, we see in the graph below that peak request volume for Internet Explorer 11 has declined by approximately one-third over that period. The clear weekly usage pattern suggests higher usage in the workplace than at home, and the nominal decline in traffic year-to-date suggests that businesses are not rushing to replace Internet Explorer with Microsoft Edge. However, we expect traffic from Internet Explorer 11 to drop more aggressively as Microsoft rolls out a two-phase plan to redirect users to Microsoft Edge, and then ultimately disable Internet Explorer. Having said that, we do not expect Internet Explorer 11 traffic to ever fully disappear for several reasons, including Microsoft Edge’s “IE Mode” representing itself as Internet Explorer 11, the ongoing usage of Internet Explorer 11 on Windows 8.1 and Windows 7 (which were out of scope for the retirement announcement), and automated (bot) traffic masquerading as Internet Explorer 11.
It is also apparent in the graph above that traffic from earlier versions of Internet Explorer has never fully disappeared. (In fact, we still see several million requests each day from clients purporting to be Internet Explorer 2, which was released in November 1995 — over a quarter-century ago.) After version 11, Internet Explorer 7, first released in October 2006 and last updated in May 2009, generates the next largest volume of requests. Traffic trends for this version have remained relatively consistent. Internet Explorer 9 was the next largest traffic generator through late May, when Internet Explorer 6 seemed to stage a comeback. (Internet Explorer 7 saw a slight bump in traffic at that time as well.)
Where is Internet Explorer 11 used?
Perhaps unsurprisingly, the United States has accounted for the largest volume of Internet Explorer 11 requests year-to-date. Similar to the global observation above, daily peak request traffic has declined by approximately one-third. With request volume approximately one-fourth that seen in the United States, Japan ostensibly has the next largest Internet Explorer 11 user base. (And published reports note that Internet Explorer’s retirement is likely to cause Japan headaches ‘for months’” because local businesses and government agencies didn’t take action in the months ahead of the event.)
However, unusual shifts in Brazil’s request volume, seen in the graph above, are particularly surprising. For several weeks in January, Internet Explorer 11 traffic from the country appears to quadruple, with the same behavior seen from early May through mid-June, as well as a significant spike in March. Classifying the request traffic by bot score, as shown in the graph below, makes it clear that the observed increases are the result of automated (bot) traffic presenting itself as coming from Internet Explorer 11.
Further, analyzing this traffic to see what percentage of requests were mitigated by Cloudflare’s Web Application Firewall, we find that the times when the mitigation percentage increased, as shown in the graph below, align very closely with the periods where we observed the higher levels of automated (bot) traffic. This suggests that the spikes in Internet Explorer 11 traffic coming from Brazil that were seen over the last six months were from a botnet presenting itself as that version of the browser.
Bot or not
Building on the Brazil analysis, breaking out the traffic for each version by associated bot score can help us better understand the residual traffic from long-deprecated versions of Internet Explorer shown above. For requests with a bot score that characterizes the traffic as “likely human”, the graph below shows clear weekly traffic patterns for versions 11 and 7, suggesting that the traffic is primarily driven by systems primarily in use on weekdays, likely by business users. For Internet Explorer 7, that traffic pattern becomes more evident starting in mid-February, after a significant decline in associated request volume.
Interestingly, that decline in “likely human” Internet Explorer 7 request volume aligns with an increase in “likely automated” (bot) request volume for that version, visible in the graph below. Given that the “likely human” traffic didn’t appear to migrate to another version of Internet Explorer, the shift may be related to improvements to the machine learning model that powers bot detection that were rolled out in the January/February time frame. It is also interesting to note that “likely automated” request volume for both Internet Explorer 11 and 7 has been extremely similar since mid-March. It is not immediately clear why this is the case.
We can also use this data to understand what percentage of the traffic from a given version of Internet Explorer is likely to be automated (coming from bots). The graph below highlights the ratios for Internet Explorer 11 and 7. For version 11, we can see that the percentage has grown from around 60% at the start of 2022 to around 80% in June. For version 7, it starts the year in the 40% range, and more than doubles to over 80% in February and remains consistent at that level.
However, when we look at firewall mitigated traffic percentages, we don’t see the same clear alignment of trends as was visible for Brazil, as discussed above. In addition, only a fraction of the “likely automated” traffic was mitigated, suggesting that the automated traffic is split between being generated by bots and other non-malicious tools, such as performance testing.
Internet Explorer versions 6 & 9 were also discussed above, with respect to driving the largest volume of requests. However, when we examine the “likely automated” request ratios for these two browsers, we find that most of their traffic appears to be bot-driven. Internet Explorer 6 started 2022 at around 80%, growing to 95% in June. In contrast, Internet Explorer 9 starts the year around 90%, drops to 60% at the end of January, and then gradually increases back to the 75-80% range.
As Internet Explorer 6’s “likely automated” traffic has increased, the fraction of it that was mitigated has increased as well. The small bumps visible in the graph above align with the larger spikes in the graph below, potentially due to brief bursts of bot activity. In contrast, mitigated Internet Explorer 9 traffic has remained relatively consistent, even as its automated request percentage dropped and then gradually increased.
For the oldest, long-deprecated versions of Internet Explorer, automated traffic frequently comprises more than 80% of request volume, reaching 100% on multiple days year-to-date. Mitigated traffic generally amounted to under 30% of request volume, although Internet Explorer 2 frequently increased to the 50% range, spiking as high as 90%.
Edging into the future
As Microsoft stated, “the future of Internet Explorer on Windows 10 is in Microsoft Edge.” Given that, we wanted to understand the usage patterns of Microsoft Edge. Similar to the analysis above, we looked at request volumes for the last ten versions of the browser year-to-date. The graph below clearly illustrates strong enterprise usage of edge, with weekday peaks, and lower traffic on the weekends. In addition, the four-week major release cycle cadence is clearly evident, with a long tail of usage extending across eight weeks due to enterprise customers who need an extended timeline to manage updates.
Having said that, in analyzing the split by bot score for these Edge versions, we note that only around 80% of requests are classified as “likely human” for about eight weeks after a given version is released, after which it gradually tapers to around 60%. The balance is classified as “likely automated”, suggesting that those who develop bots and other automated processes recognize the value in presenting their user agents as the latest version of Microsoft’s web browser. For Edge, there does not appear to be any meaningful correlation between firewall mitigated traffic percentages and “likely automated” traffic percentages or the traffic cycles visible in the graph above.
Conclusion
Analyzing traffic trends from deprecated versions of Internet Explorer brought to mind the “I’m not dead yet” scene from Monty Python and the Holy Grail with these older versions of the browser claiming to still be alive, at least from a traffic perspective. However, categorizing this traffic to better understand the associated bot/human split showed that the majority of Internet Explorer traffic seen by Cloudflare, including for Internet Explorer 11, is apparently not coming from actual browser clients installed on user systems, but rather from bots and other automated processes. For the automated traffic, analysis of firewall mitigation activity shows that the percentage likely coming from malicious bots varies by version.
As Microsoft executes its planned two-phase approach for actively moving users off of Internet Explorer, it will be interesting to see how both request volumes and bot/human splits for the browser change over time – check back later this year for an updated analysis.
It is once again exam time in Syria, Sudan, and Algeria, and with it, we find these countries disrupting Internet connectivity in an effort to prevent cheating on these exams. As they have done over the past several years, Syria and Sudan are implementing multi-hour nationwide Internet shutdowns. Algeria has also taken a similar approach in the past, but this year appears to be implementing more targeted website/application blocking.
Syria
Syria has been implementing Internet shutdowns across the country since 2011, but exam-related shutdowns have only been in place since 2016. In 2021, exams took place between May 31 and June 22, with multi-hour shutdowns observed on each of the exam days.
This year, the first shutdown was observed on May 30, with subsequent shutdowns (to date) seen on June 2, 6, and 12. In the Cloudflare Radar graph below, traffic for Syria drops to zero while the shutdowns are active. According to Internet Society Pulse, several additional shutdowns are expected through June 21. Each takes place between 02000530 UTC (0500–0830 local time). According to a published report, the current exam cycle covers more than 500,000 students for basic and general secondary education certificates.
Consistent with shutdowns observed in prior years, Syria is once again implementing them in an asymmetric fashion – that is, inbound traffic is disabled, but egress traffic remains. This is clearly visible in request traffic from Syria to Cloudflare’s 1.1.1.1 DNS resolver. As the graph below shows, queries from clients in Syria are able to exit the country and reach Cloudflare, but responses can’t return, leading to retry floods, visible as spikes in the graph.
Last year, the Syrian Minister of Education noted that, for the first time, encryption and surveillance technologies would be used in an effort to curtail cheating, with an apparent promise to suspend Internet shutdowns in the future if these technologies proved successful.
Sudan
Sudan is also no stranger to nationwide Internet shutdowns, with some last lasting for multiple weeks. Over the last several years, Sudan has also implemented Internet shutdowns during secondary school exams in an effort to limit cheating or leaking of exam questions. (We covered the 2021 round of shutdowns in a blog post.)
According to a schedule published by digital rights organization AccessNow, this year’s Secondary Certificate Exams will be taking place in Sudan daily between June 11–22, except June 17. As of this writing, near-complete shutdowns have been observed on June 11, 12, and 13 between 0530-0830 UTC (0730-1030 local time), as seen in the graph below. The timing of these shutdowns aligns with a communication reportedly sent to subscribers of telecommunications services in the country, which stated “In implementation of the decision of the Attorney General, the Internet service will be suspended during the Sudanese certificate exam sessions from 8 in the morning until 11 in the morning.”
It is interesting to note that the shutdown, while nationwide, does not appear to be complete. The graph below shows that Cloudflare continues to see a small volume of HTTP requests from Sudatel during the shutdown periods. This is not completely unusual, as Sudatel may have public sector, financial services, or other types of customers that remain online.
Algeria
Since 2018, Algeria has been shutting down the Internet nationwide during baccalaureate exams, following widespread cheating in 2016 that saw questions leaked online both before and during tests. These shutdowns reportedly cost businesses across the country an estimated 500 million Algerian Dinars (approximately $3.4 million USD) for every hour the Internet was unavailable. In 2021, there were two Internet shutdowns each day that exams took place—the first between 0700–1100 UTC (0800–1200 local time), and the second between 1330–1600 UTC (1430–1700 local time).
Perhaps recognizing the economic damage caused by these Internet shutdowns, this year the Algerian Minister of National Education announced that there would be no Internet shutdowns on exam days.
Thus far, it appears that this has been the case. However, it appears that the Algerian government has shifted to a content blocking-based approach, instead of a wide-scale Internet shutdown. The Cloudflare Radar graph below shows two nominal drops in country-level traffic during the two times on June 13 that the exams took place—0730–1000 UTC (0830–1100 local time) and 1330–1600 UTC (1430–1700 local time), similar to last year’s timing.
The disruptions are also visible in traffic graphs for several major Algerian network providers, as shown below.
Analysis of additional Cloudflare data further supports the hypothesis that Algeria is blocking access to specific websites and applications, rather than shutting down the Internet completely.
As described in a previous blog post, Network Error Logging (NEL) is a browser-based reporting system that allows users’ browsers to report connection failures to an endpoint specified by the webpage that failed to load. Below, a graph of NEL reports from browsers in Algeria shows clear spikes during the times (thus far) that the exams have taken place, with report levels significantly lower and more consistent during other times of the day.
Conclusion
In addition to Syria, Sudan, and Algeria, countries including India, Jordan, Iraq, Uzbekistan, and Ethiopia have shut down or limited access to the Internet as exams took place. It is unclear whether these brute-force methods are truly effective at preventing cheating on these exams. However, it is clear that the impact of these shutdowns goes beyond students, as they impose a significant financial cost on businesses within the affected countries as they lose Internet access for multiple hours a day over the course of several weeks.
If you want to follow the remaining scheduled disruptions for these countries, you can see live data on the Cloudflare Radar pages for Syria, Sudan, and Algeria.
Just after 1200 UTC on Tuesday, June 7, the Africa-Asia-Europe-1 (AAE-1) and SEA-ME-WE-5 (SMW-5) submarine cables suffered cable cuts. The damage reportedly occurred in Egypt, and impacted Internet connectivity for millions of Internet users across multiple countries in the Middle East and Africa, as well as thousands of miles away in Asia. In addition, Google Cloud Platform and OVHcloud reported connectivity issues due to these cable cuts.
The impact
Data from Cloudflare Radar showed significant drops in traffic across the impacted countries as the cable damage occurred, recovering approximately four hours later as the cables were repaired.
It appears that Saudi Arabia may have also been affected by the cable cut(s), but the impact was much less significant, and traffic recovered almost immediately.
In the graphs above, we show that Ethiopia was one of the impacted countries. However, as it is landlocked, there are obviously no submarine cable landing points within the country. The Afterfibre map from the Network Startup Resource Center (NSRC) shows that that fiber in Ethiopia connects to fiber in Somalia, which experienced an impact. In addition, Ethio Telecom also routes traffic through network providers in Kenya and Djibouti. Djibouti Telecom, one of these providers, in turn peers with larger global providers like Telecom Italia (TI) Sparkle, which is one of the owners of SMW5.
In addition to impacting end-user connectivity in the impacted countries, the cable cuts also reportedly impacted cloud providers including Google Cloud Platform and OVHcloud. In their incident report, Google Cloud noted“Google Cloud Networking experienced increased packet loss for egress traffic from Google to the Middle East, and elevated latency between our Europe and Asia Regions as a result, for 3 hours and 12 minutes, affecting several related products including Cloud NAT, Hybrid Connectivity and Virtual Private Cloud (VPC). From preliminary analysis, the root cause of the issue was a capacity shortage following two simultaneous fiber-cuts.” OVHcloud noted that “Backbone links between Marseille and Singapore are currently down” and that “Upon further investigation, our Network OPERATION teams advised that the fault was related to our partner fiber cuts.”
When concurrent disruptions like those highlighted above are observed across multiple countries in one or more geographic areas, the culprit is often a submarine cable that connects the impacted countries to the global Internet. The impact of such cable cuts will vary across countries, largely due to the levels of redundancy that they may have in place. That is, are these countries solely dependent on an impacted cable for global Internet connectivity, or do they have redundant connectivity across other submarine or terrestrial cables? Additionally, the location of the country relative to the cable cut will also impact how connectivity in a given country may be affected. Due to these factors, we didn’t see a similar impact across all of the countries connected to the AAE-1 and SMW5 cables.
What happened?
Specific details are sparse, but as noted above, the cable damage reportedly occurred in Egypt – both of the impacted cables land in Abu Talat and Zafarana, which also serve as landing points for a number of other submarine cables. According to a 2021 article in Middle East Eye, “There are 10 cable landing stations on Egypt’s Mediterranean and Red Sea coastlines, and some 15 terrestrial crossing routes across the country.” Alan Mauldin, research director at telecommunications research firm TeleGeography, notes that routing cables between Europe and the Middle East to India is done via Egypt, because there is the least amount of land to cross. This places the country in a unique position as a choke point for international Internet connectivity, with damage to infrastructure locally impacting the ability of millions of people thousands of miles away to access websites and applications, as well as impacting connectivity for leading cloud platform providers.
As the graphs above show, traffic returned to normal levels within a matter of hours, with tweets from telecommunications authorities in Pakistan and Oman also noting that Internet services had returned to their countries. Such rapid repairs to submarine cable infrastructure are unusual, as repair timeframes are often measured in days or weeks, as we saw with the cables damaged by the volcanic eruption in Tonga earlier this year. This is due to the need to locate the fault, send repair ships to the appropriate location, and then retrieve the cable and repair it. Given this, the damage to these cables likely occurred on land, after they came ashore.
Keeping content available
By deploying in data centers close to end users, Cloudflare helps to keep traffic local, which can mitigate the impact of catastrophic events like cable cuts, while improving performance, availability, and security. Being able to deliver content from our network generally requires first retrieving it from an origin, and with end users around the world, Cloudflare needs to be able to reach origins from multiple points around the world at the same time. However, a customer origin may be reachable from some networks but not from others, due to a cable cut or some other network disruption.
In September 2021, Cloudflare announced Orpheus, which provides reachability benefits for customers by finding unreachable paths on the Internet in real time, and guiding traffic away from those paths, ensuring that Cloudflare will always be able to reach an origin no matter what is happening on the Internet.
Conclusion
Because the Internet is an interconnected network of networks, an event such as a cable cut can have a ripple effect across the whole Internet, impacting connectivity for users thousands of miles away from where the incident occurred. Users may be unable to access content or applications, or the content/applications may suffer from reduced performance. Additionally, the providers of those applications may experience problems within their own network infrastructure due to such an event.
For network providers, the impact of such events can be mitigated through the use of multiple upstream providers/peers, and diverse physical paths for critical infrastructure like submarine cables. Cloudflare’s globally deployed network can help content and application providers ensure that their content and applications remain available and performant in the face of network disruptions.
Cloudflare operates in more than 250 cities in over 100 countries, where we interconnect with over 10,000 network providers in order to provide a broad range of services to millions of customers. The breadth of both our network and our customer base provides us with a unique perspective on Internet resilience, enabling us to observe the impact of Internet disruptions. In many cases, these disruptions can be attributed to a physical event, while in other cases, they are due to an intentional government-directed shutdown. In this post, we review selected Internet disruptions observed by Cloudflare during the first quarter of 2022, supported by traffic graphs from Cloudflare Radar and other internal Cloudflare tools, and grouped by associated cause.
Plate tectonics
Internet outages caused by “earth movers” are more frequently caused by errant backhoes. However, two Internet disruptions in the first quarter were caused by more significant earth movement — a volcanic eruption and an earthquake.
The first impacted connectivity on the island nation of Tonga, when the Hunga Tonga–Hunga Ha’apai volcanic eruption damaged the submarine cable connecting Tonga to Fiji, resulting in a 38 day Internet outage. After the January 14 eruption, only minimal Internet traffic (via satellite services) was seen from Tonga. On February 22, Digicel announced that the main island was back online after initial submarine cable repairs were completed – the immediate return of traffic is clearly visible in the figure below. However, it was estimated that repairs to the domestic cable, connecting outlying islands, could take an additional six to nine months.
The second disruption, caused by a 7.3 magnitude earthquake off the coast of central Japan on March 16, was significantly shorter, and had a significantly smaller impact. The earthquake occurred around 1436 UTC, causing power outages that resulted in a loss of Internet connectivity in cities including Tokyo for several hours, as seen in the figure below. Almost exactly 11 years prior, a magnitude 8.9 earthquake also had a nominal impact on Internet connectivity in Japan, that time apparently due to damage to subsea cable systems.
Infrastructure damage
Internet resilience is, of course, heavily dependent on the resilience of the underlying physical infrastructure, including data centers, terrestrial fiber, and submarine cables. Damage to this infrastructure often disrupts Internet connectivity.
Early in the morning of January 5, the Gambia was completely isolated from the global Internet. As evident in the figure below, the incident lasted over eight hours, between 0117 and 0945 UTC. According to a press release from GAMTEL, after the failure of the primary link (damage to the ACE submarine cable), traffic was routed onto two backup links through Senegal. However, these backup links also failed because they converged in a location that was ultimately identified as a single point of failure.
Around 2130 UTC on January 20, Internet traffic to Yemen dropped to near zero, as shown in the figure below, after ongoing airstrikes reportedly hit a telecommunications building in Al-Hudaydah where the FALCON undersea cable lands. The outage lasted four days, finally recovering around 2100 on January 24. The outage primarily affected YemenNet (Public Telecommunication Corporation), the state-owned telecommunications provider.
According to a published report, one of the cuts was on the Victorian (mainland) end, and the other on the Tasmanian side, with both cuts caused by “third parties”. A significant reduction in traffic between 0130 – 0800 UTC is visible in the figure below.
On March 15, ETECSA, the Cuban state telecommunications company, reported that a fiber optic cable had been cut on a public road in the capital that morning. The impact of this fiber cut on Internet traffic to Cuba and ETECSA is visible in the figures below, starting just after 1200 UTC, lasting for over six hours.
Although initially believed to be the result of a power outage (all too common in Venezuela), a March 24 Internet disruption in the country was ultimately due to a fiber cut. Internet traffic to CANTV customers in multiple Venezuelan states dropped significantly between 1140 and 1740 UTC, as seen in the figure below. In addition to this disruption, VE sin Filtro reported a number of additional multi-hour, multi-state Internet disruptions in Venezuela during the first quarter.
On March 31, Internet traffic to Telenor Pakistan dropped 60% between 0600-0745 UTC, as shown in the figure below. According to Telenor Pakistan responses to hundreds of customer complaints lodged via Twitter, the disruption was due to multiple fiber-optic cable cuts in several locations. Just after 1800 UTC, Telenor Pakistan Tweeted that services had been fully restored.
Power outages
In addition to the physical infrastructure, reliable electrical power is also critical for resilient Internet connectivity. At a provider level, loss of power can take key data centers and routers offline, impacting connectivity for customers and other connected networks. Consumer power outages can take home/business routers and connected devices offline, forcing users onto mobile connectivity, assuming that is/remains available.
The interconnected electrical grids of Kazakhstan, Uzbekistan, and Kyrgyzstan all suffered outages on January 24 after Kazakhstan’s North-South power line was disconnected due to “emergency imbalances”. These power outages caused multi-hour Internet disruptions across all three countries starting around 0600 UTC, as the figures below show. The impact to traffic in Kazakhstan appeared to be fairly minor, while traffic declined significantly in Uzbekistan and Kyrgyzstan and took longer to recover.
A power outage across multiple counties and cities in Taiwan starting around 0100 UTC on March 3 caused a brief #Internet disruption. The figure below shows a nominal initial drop in traffic, though traffic remained lower throughout the next several hours. The power outage was reportedly caused by human negligence during annual repairs of a generator at the Hsinta power plant.
In addition to the fiber cut discussed above, Cuba’s Internet suffered a second disruption on March 24. A Tweet from ETECSA stated that a power failure had caused a disruption to voice service, SMS, and mobile data. Analysis of Internet traffic for both Cuba and ETECSA finds that the disruption started around 1230 UTC, and lasted for approximately 90 minutes, as shown in the figures below.
DDoS attack
Although distributed denial of service (DDoS) attacks often target web or application servers in an attempt to knock a given website or application offline, such attacks that target network infrastructure can have more widespread impact, not only restricting access to sites and applications hosted within that network, but also disrupting connectivity for users attached to the network.
Such a DDoS attack targeted AS8867 (E-Gov – Tehila Project) in Israel on March 14. The figure below shows that Internet traffic to that ASN began to decline just before 1530 UTC. A published report notes that the websites of the interior, health, justice and welfare ministries, as well as that of the Prime Minister’s office, were all taken offline as a result of the attack.
Unspecified technical causes
As discussed above, the underlying technical or physical causes of Internet disruptions are often easily identified, frequently thanks to social media or other communications from the impacted network providers. However, sometimes disruptions are observed that are correlated with a real-world (often political) event with no specified technical or physical cause, while other times disruptions are observed but are both uncorrelated and unattributed.
In Kazakhstan, an Internet disruption began on January 5 amid mass protests against sudden increases in energy prices. Starting around 1030 UTC, traffic from Kazakhstan dropped to near zero. The figure below shows that traffic returned to a regular diurnal pattern on January 11, but several apparent restorations of connectivity are also visible during the six-day disruption. These brief periods of connectivity appeared to align with televised speeches or announcements from the Zazakh president.
In Burkina Faso, heavy gunfire related to an army mutiny was reported early in the morning of January 23. A significant drop in traffic from the country was observed in Cloudflare Radar starting around 0915 UTC, with Orange, FasoNet, and Telecel Faso all seeing lower traffic volumes. As the figure below shows, the disruption lasted for nearly a day and a half, recovering around 2000 UTC on January 24.
Just after 2200 UTC on March 15, Yemen experienced a significant, albeit brief, Internet disruption, lasting just 30 minutes. As the figures below show, the disruption was primarily due to an issue at YemenNet. A published report claims that the disruption was due to a deliberate act by the Houthi coup militia.
Russian invasion of Ukraine
The Russian invasion of Ukraine has now been going on for over a month. In some cases, Internet connectivity has been collateral damage from the kinetic military action, while in other cases, targeted attacks on network providers and power outages have disrupted connectivity. Technicians from Ukrainian service providers have been risking their lives to keep the country online, and have been largely successful – Cloudflare Radar traffic data for Ukraine shows that as of the end of March, peak traffic levels are at 85-90% of pre-invasion peaks. An earlier blog post provides additional details about Internet traffic patterns observed in Ukraine during the first week after the conflict began.
Below we highlight just a few significant disruptions observed on major Ukrainian network providers in March.
Two brief outages were observed at Ukrtelecom during the second week of March, shown in the figure below. The first, on March 8, lasted for just over two hours, while the second one, on March 10, lasted for approximately 40 minutes. No root cause has been reported for these disruptions.
Later in the month, on March 28, Ukrtelecom experienced a ~15 hour outage, lasting from 0800 UTC to approximately 0100 on March 29, as seen in the figure below. A Twitter thread from the State Service of Special Communications and Information Protection of Ukraine explained that the outage was caused by “a powerful cyberattack” against Ukrtelecom’s infrastructure, and that “In order to preserve its network infrastructure and to continue providing services to Ukraine’s Armed Forces and other military formations as well as to the customers, Ukrtelecom has temporarily limited providing its services to the majority of private users and business-clients.” A LinkedIn post from Ukrtelecom also highlights the non-stop work that the company has been doing to re-establish telecommunications services in impacted regions across the country.
The figure below shows that around 2100 UTC on March 9, Ukrainian Internet service provider Triolan suffered a significant disruption, reportedly resulting from a cyber attack. Traffic began to gradually return after approximately 10 hours.
Conclusion
Despite occasional connectivity disruptions, the Internet remains remarkably resilient. This resiliency is increasingly critical as the Internet finds its way into more and more areas of everyday life around the world. In addition to providing a suite of solutions that support that resiliency, we use the data exhaust from these solutions to monitor Internet reliability, availability, security, and performance.
Follow @CloudflareRadar on Twitter for updates on Internet disruptions as they occur, and find up-to-date information on Internet trends using Cloudflare Radar.
On the morning of March 8, a post to Hacker News stated that “All .fj domains have gone offline”, listing several hostnames in domains within the Fiji top level domain (known as a ccTLD) that had become unreachable. Commenters in the associated discussion thread had mixed results in being able to reach .fj hostnames—some were successful, while others saw failures. The fijivillage news site also highlighted the problem, noting that the issue also impacted Vodafone’s M-PAiSA app/service, preventing users from completing financial transactions.
The impact of this issue can be seen in traffic to Cloudflare customer zones in the .com.fj second-level domain. The graph below shows that HTTP traffic to these zones dropped by approximately 40% almost immediately starting around midnight UTC on March 8. Traffic volumes continued to decline throughout the rest of the morning.
Looking at Cloudflare’s 1.1.1.1 resolver data for queries for .com.fj hostnames, we can also see that error volume associated with those queries climbs significantly starting just after midnight as well. This means that our resolvers encountered issues with the answers from .fj servers.
This observation suggests that the problem was strictly DNS related, rather than connectivity related—Cloudflare Radar does not show any indication of an Internet disruption in Fiji coincident with the start of this problem.
It was suggested within the Hacker News comments that the problem could be DNSSEC related. Upon further investigation, it appears that may be the cause. In verifying the DNSSEC record for the .fj ccTLD, shown in the dig output below, we see that it states EDE: 9 (DNSKEY Missing): 'no SEP matching the DS found for fj.'
kdig fj. soa +dnssec @1.1.1.1
;; ->>HEADER<<- opcode: QUERY; status: SERVFAIL; id: 12710
;; Flags: qr rd ra; QUERY: 1; ANSWER: 0; AUTHORITY: 0; ADDITIONAL: 1

;; EDNS PSEUDOSECTION:
;; Version: 0; flags: do; UDP size: 1232 B; ext-rcode: NOERROR
;; EDE: 9 (DNSKEY Missing): 'no SEP matching the DS found for fj.'

;; QUESTION SECTION:
;; fj.                          IN      SOA

;; Received 73 B
;; Time 2022-03-08 08:57:41 EST
;; From 1.1.1.1@53(UDP) in 17.2 ms
Extended DNS Error 9 (EDE: 9) is defined as “A DS record existed at a parent, but no supported matching DNSKEY record could be found for the child.” The Cloudflare Learning Center article on DNSKEY and DS records explains this relationship:
The DS record is used to verify the authenticity of child zones of DNSSEC zones. The DS key record on a parent zone contains a hash of the KSK in a child zone. A DNSSEC resolver can therefore verify the authenticity of the child zone by hashing its KSK record, and comparing that to what is in the parent zone’s DS record.
Ultimately, it appears that around midnight UTC, the .fj zone started to be signed with a key that was not in the root zone DS, possibly as the result of a scheduled rollover that happened without checking that the root zone was updated first by IANA, which updates the root zone. (IANA owns contact with the TLD operators, and instructs the Root Zone Publisher on the changes to make in the next version of the root zone.)
DNSSEC problems as the root cause of the observed issue align with the observation in the Hacker News comments that some were able to access .fj websites, while others were not. Users behind resolvers doing strict DNSSEC validation would have seen an error in their browser, while users behind less strict resolvers would have been able to access the sites without a problem.
Conclusion
Further analysis of Cloudflare resolver metrics indicates that the problem was resolved around 1400 UTC, when the DS was updated. When DNSSEC is improperly configured for a single domain name, it can cause problems accessing websites or applications in that zone. However, when the misconfiguration occurs at a ccTLD level, the impact is much more significant. Unfortunately, this seems to occur all too often.
(Thank you to Ólafur Guðmundsson for his DNSSEC expertise.)
Internet outages are more common than most people think, and may be caused by misconfigurations, power outages, extreme weather, or infrastructure damage. Note that such outages are distinct from state-imposed shutdowns that also happen all too frequently, generally used to deal with situations of unrest, elections or even exams.
On the morning of January 4, 2022, citizens of The Gambia woke up to a country-wide Internet outage. Gamtel (the main state-owned telecommunications company of the West Africa country), announced that it happened due to “technical issues on the backup links” — we elaborate more on this below.
Cloudflare Radar shows that the outage had a significant impact on Internet traffic in the country and started after 01:00 UTC (which is the same local time), lasting until ~09:45 — a disruption of over 8 hours.
Looking at BGP (Border Gateway Protocol) updates from Gambian ASNs around the time of the outage, we see a clear spike at 01:10 UTC. These update messages are BGP signaling that the Gambian ASNs are no longer routable.
It is important to know that BGP is a mechanism to exchange routing information between autonomous systems (networks) on the Internet. The routers that make the Internet work have huge, constantly updated lists of the possible routes that can be used to deliver every network packet to their final destinations. Without BGP, the Internet routers wouldn’t know what to do, and the Internet wouldn’t work. As we saw in our blog post in 2021 about how Facebook disappeared from the Internet, the Internet is literally a network of networks, and it’s bound together by BGP.
The Gambia’s Internet access is solely dependent on a single provider, Gamtel. Because The Gambia’s international Internet connectivity via the ACE submarine cable was unavailable, it was reliant on the “backup links” referenced above – terrestrial connectivity via Senegal and the provider Sonatel. This is visible in BGP data. If we look at the ASNs that are allocated to networks in The Gambia (AS25250, AS37309, AS37503, AS37552, AS37524, AS37323, AS328488, AS328140), and put those into a regular expression on BGP routing tools like route-views as so:
route-views>show ip bgp regexp .*_(25250|37309|37503|37552|37524|37323|328488|328140)
We are able to see all the possible upstream ASN paths from these networks to the rest of the Internet.
Looking at the “Path” results, we see that AS8346 (Sonatel) and AS25250 (Gamtel) are in the path for all the Gambian networks.
Visualized, you can see the dependency on this network path for The Gambia’s Internet access.
No interruptions were seen in Sonatel (AS8346), so this indicates that the single network path between Sonatel and Gamtel (AS25250) is a critical point for connectivity. A failure in either of these networks could result in The Gambia going offline again.
Yesterday’s outage in The Gambia outage illustrates something we frequently reference here in the blog: the Internet is literally a network of networks. A significant amount of Internet traffic is carried by a complex network of undersea fiber-optic cables that connect countries and continents — all the cable systems used have landing points in two or more countries. So a problem in one country can easily affect others.
Going back to The Gambia, Gamtel explained in a January 5, 2022, press release that there was “a primary link failure at ACE” — the cable system that serves 24 countries, from Europe to Africa. “The ACE cable repair is expected to be completed in mid-January, 2022,” explained the company.
The full ACE (Africa Coast to Europe) submarine cable system. From NSRC
The “backup failure” here was “due to a faulty card at Toubakota, in Senegal”. That problem affects “both the Karang and Seleti links [points of cable connections from Senegal to The Gambia] as both North and South links converges there”. “Thus, the reason for the complete isolation on the Sonatel link”, concludes Gamtel.
Recognizing the critical importance of reliable Internet connectivity, The Gambia Public Utilities Regulatory Authority also issued a statement noting “The Authority, operators, MOICI, and the Government are exploring other options of making sure that the Gambia has a second fibre cable backup considering the impact that these failures are having on our national security, economy, and social activities.”
The collective thoughts of the interwebz
Manage Consent
To provide the best experiences, we use technologies like cookies to store and/or access device information. Consenting to these technologies will allow us to process data such as browsing behavior or unique IDs on this site. Not consenting or withdrawing consent, may adversely affect certain features and functions.
Functional
Always active
The technical storage or access is strictly necessary for the legitimate purpose of enabling the use of a specific service explicitly requested by the subscriber or user, or for the sole purpose of carrying out the transmission of a communication over an electronic communications network.
Preferences
The technical storage or access is necessary for the legitimate purpose of storing preferences that are not requested by the subscriber or user.
Statistics
The technical storage or access that is used exclusively for statistical purposes.The technical storage or access that is used exclusively for anonymous statistical purposes. Without a subpoena, voluntary compliance on the part of your Internet Service Provider, or additional records from a third party, information stored or retrieved for this purpose alone cannot usually be used to identify you.
Marketing
The technical storage or access is required to create user profiles to send advertising, or to track the user on a website or across several websites for similar marketing purposes.