All posts by Kaspars Mednis

Decoding Zabbix Proxy Traffic for Faster Troubleshooting

Post Syndicated from Kaspars Mednis original https://blog.zabbix.com/decoding-zabbix-proxy-traffic-for-faster-troubleshooting/31898/

Usually, it is enough to simply look at the Zabbix proxy administration page or proxy health metrics to perform basic proxy troubleshooting. However, there are situations when a deeper look is required.

Today, we will examine the Zabbix server ↔ proxy communication and learn how to interpret the internal communication protocol.

Understanding the protocol

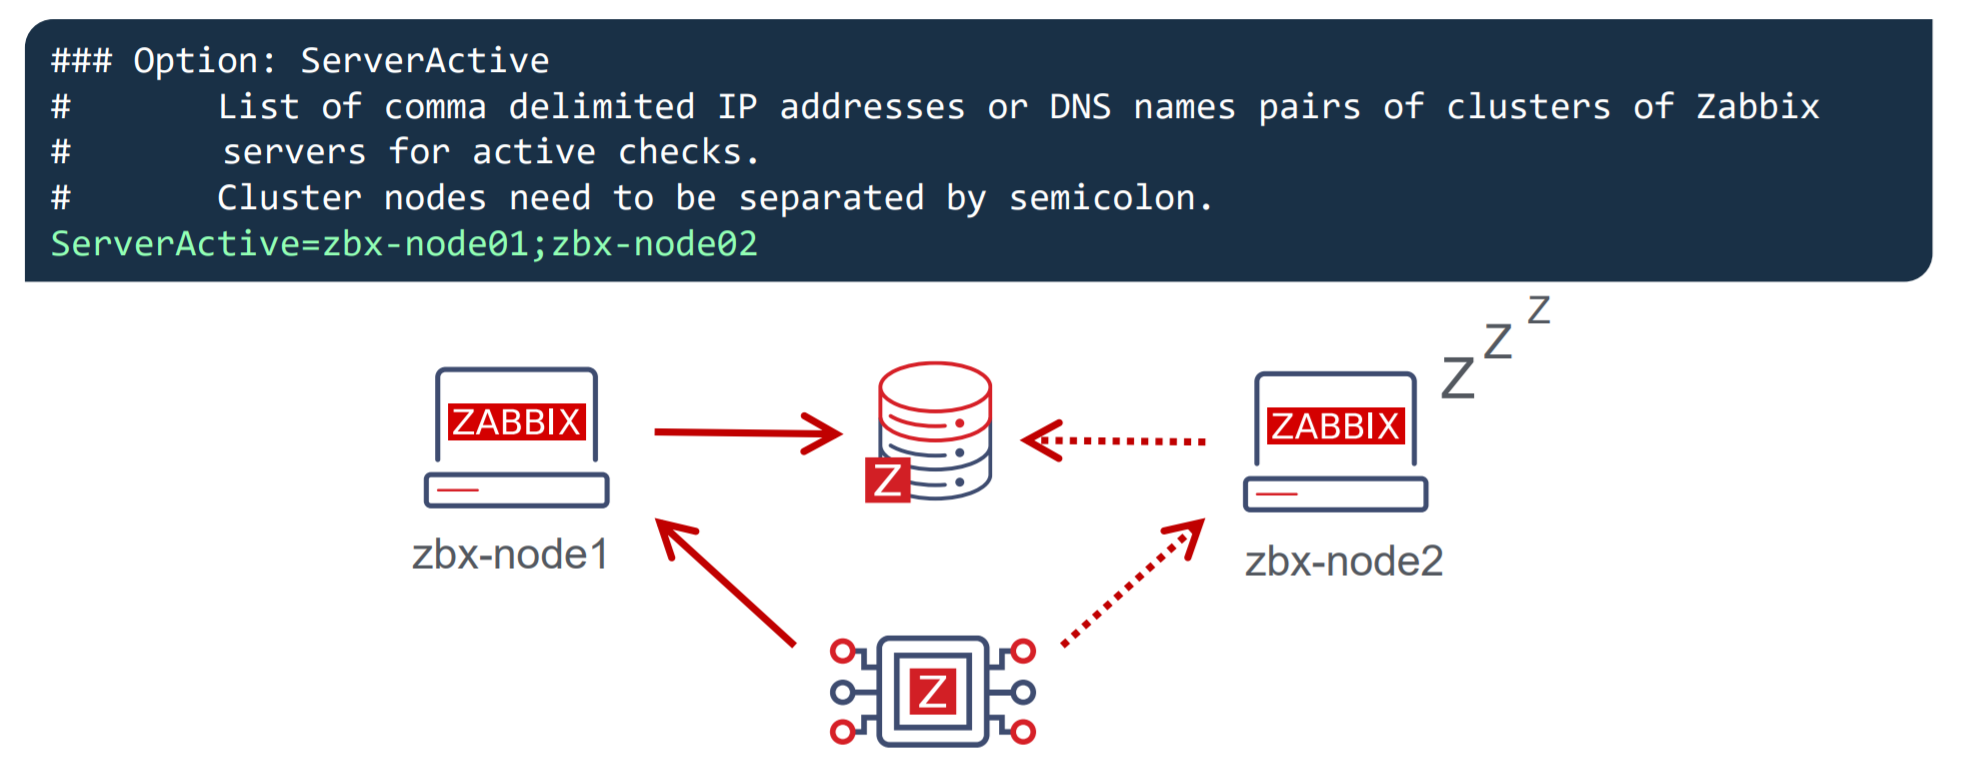
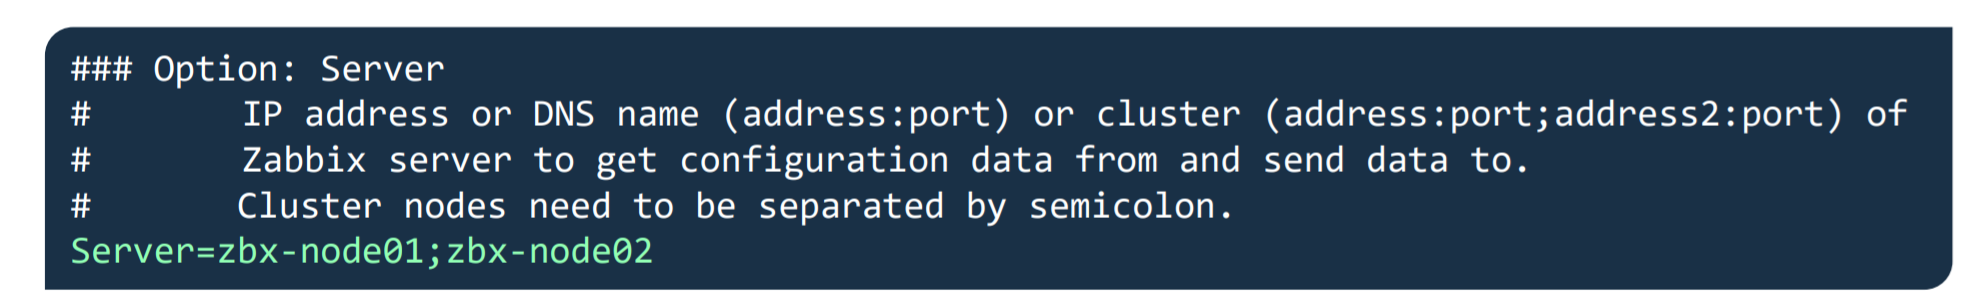
Zabbix communication protocol

Zabbix components use TCP for communication, and information is encoded in JSON. How do you distinguish Zabbix communication packets? There are a few main filters you need to apply:

  • Protocol: TCP

  • Port: 10051 or 10050 (depending on whether components are active or passive)

  • Packet: Starts with ZBXD or 5A 42 58 44 in HEX

On older versions, it was simple to capture and read Zabbix packets in plain text. Starting with Zabbix 4.0.0, mandatory traffic compression was implemented. This greatly reduces network traffic – roughly by 10× with negligible CPU overhead, but it also makes the traffic unreadable to humans.

A modern Zabbix communication packet looks like this:

5a425844038200000097000000789c2dcccb0e83201085e15731b33606b90a8fe20ec631256da4056a6c9abe7be965fb7f27e709996e772a151c5c733a1edde2ab871e4ee9db661f423cba1f79ac71a786854a89696bbe7223e5b2326b75e01c199368510b42cf68f2eaf3b453fe8fcdc0063eb68497846770a3d1c25a698cea612be0b43642a9c9b2d71b6c5d2cfd

Not very human-friendly, right? In the following sections we will capture and decompress this communication packet step by step.

Capturing traffic

There are multiple tools available for this purpose, but we will use Wireshark – one of the most popular and widely used packet analysis tools. It provides a nice graphical interface for Windows and Linux, but we will use the command-line version, since most troubleshooting is performed over an SSH session. The system used in this example is CentOS Stream 9, but the commands should work on other Linux distributions with only minor syntax adjustments.

First, install the tool:

dnf install wireshark-cli

This installs the tshark command-line utility. After that, change your working directory to a location where you can write files. In this example, we will use /tmp:

cd /tmp

Next, let’s capture some traffic between the Zabbix server and an active proxy:

tshark -i eth0 -f "host <ZABBIX SERVER IP> and host <ZABBIX PROXY IP> \
and tcp port 10051" -w zabbix_stream.pcap

Explanation of parameters:

  • -i eth0 – listen on interface eth0 (specify a different interface if needed)

  • <ZABBIX SERVER IP> – replace with the Zabbix server IP address

  • <ZABBIX PROXY IP> – replace with the Zabbix proxy IP address

  • tcp port 10051 – capture TCP packets on port 10051 (Zabbix trapper)

  • -w zabbix_stream.pcap – write captured output to a file

Let this run for a couple of minutes to collect some raw traffic data. Press CTRL + C to stop the capture.

Analyzing capture file

Now we have captured a *.pcap file that contains multiple TCP streams. A TCP stream represents a single TCP connection. Since Zabbix proxies do not keep persistent connections and instead open a new connection whenever needed, a Zabbix active proxy typically produces the following streams:

  • Data sender – sends collected values every second (by default)

  • Configuration syncer – downloads configuration updates every 10 seconds (by default)

To view the contents of the *.pcap file, run:

tshark -r zabbix_stream.pcap -q -z conv,tcp

Example output:

TCP Conversations
Filter:<No Filter>
                                   |      <-    ||      ->    ||     Total   |Relative|
                                   |Frames Bytes||Frames Bytes||Frames Bytes |Start   |       
10.10.0.2:57850 <-> 10.20.0.5:10051 5 2,512bytes  6 547bytes    11 3,059bytes 0.0000   
10.10.0.2:57860 <-> 10.20.0.5:10051 5 399bytes    5 516bytes    10 915bytes   0.4700  
10.10.0.2:57864 <-> 10.20.0.5:10051 5 399bytes    5 521bytes    10 920bytes   1.4768  
10.10.0.2:57876 <-> 10.20.0.5:10051 5 399bytes    5 570bytes    10 969bytes   2.4829   
10.10.0.2:57878 <-> 10.20.0.5:10051 5 399bytes    5 522bytes    10 921bytes   3.4882   
10.10.0.2:46628 <-> 10.20.0.5:10051 5 399bytes    5 527bytes    10 926bytes   4.4935   
10.10.0.2:46642 <-> 10.20.0.5:10051 4 333bytes    6 590bytes    10 923bytes   5.4992   
10.10.0.2:46648 <-> 10.20.0.5:10051 5 399bytes    5 478bytes    10 877bytes   6.5047   
10.10.0.2:46662 <-> 10.20.0.5:10051 5 399bytes    5 480bytes    10 879bytes   7.5097
We can print packets in chronological order, including stream numbers:
tshark -r zabbix_stream.pcap -T fields \
-e tcp.stream -e frame.number -e frame.time_relative -e frame.len
Column meaning in example output:
  1. Stream number

  2. Frame number

  3. Relative timestamp from the start of capture

  4. Frame size in bytes

0 1  0.000000000 76
0 2  0.000005109 76
0 3  0.000078403 68
0 4  0.000079579 68
0 5  0.000280946 209
0 6  0.000283835 209
0 7  0.001188322 68
0 8  0.001189912 68
0 9  0.001421210 68
0 10 0.001422856 68
1 11 1.003582601 76
1 12 1.003588266 76
1 13 1.003646494 68
1 14 1.003647585 68
1 15 1.003741654 256
1 16 1.003758183 256
1 17 1.004531106 68
1 18 1.004532827 68
1 19 1.004973531 68
.....

To include the payload (Zabbix communication), add the -e tcp.payload field:

tshark -r zabbix_stream.pcap -T fields \
-e tcp.stream -e frame.number -e frame.time_relative -e frame.len -e tcp.payload

Example (truncated for readability):

0 1  0.000000000 76
0 2  0.000005109 76
0 3  0.000078403 68
0 4  0.000079579 68
0 5  0.000280946 209 5a425844038000000096000000789c2dca4d0e82301040e1ab90591352fb3703477137d3d6483454692518e3dd6dd4edfbde0bd6747fa4526182db9af76717b932f470cedf76649179ef7ec4a1ce5b6a585229735e9a2bf12aa2481c89299032c2ceb21754a44fda609bb7b4fe671cece05a09d71c2e301dd05b4548daf4b014984667b52734f6fd013eac2c96
0 6  0.000283835 209 5a425844038000000096000000789c2dca4d0e82301040e1ab90591352fb3703477137d3d6483454692518e3dd6dd4edfbde0bd6747fa4526182db9af76717b932f470cedf76649179ef7ec4a1ce5b6a585229735e9a2bf12aa2481c89299032c2ceb21754a44fda609bb7b4fe671cece05a09d71c2e301dd05b4548daf4b014984667b52734f6fd013eac2c96
0 7  0.001188322 68
0 8  0.001189912 68
0 9  0.001421210 68
0 10 0.001422856 68
......

Not all frames contain payload — the empty ones represent TCP handshakes and other control packets. We are interested only in frames containing payload, because this is where Zabbix data lives.

Analyzing payload

If you take a closer look, each payload starts with a sequence of 5a 42 58 44 – or “ZBXD” in ASCII. This is the Zabbix packet signature and confirms that we have captured the correct traffic.

Example:

5a42584403af000000f0000000789c658ecb0e823014447f85dc3521853e6edb4fd1b868a1c646b44a0bc110fedd22ec5cce9ce4cc2c30b8f7e862020daf21cc9fa233c94009b7f0eb4ec65a3f173b326df293cb30ba187d78664eac201d5adb2969642b09b58633232c12d95c1b8a9bc9c7148643accf0bf80e34150d2bc127f7d812278cd312da3eb477d0350a4624ca2657cf081a15e74cd588254ca61f5d9ead61bde4e486e30656ace2f06f60bb417154825056af5fed34456b
The full Zabbix header is the first 13 bytes of each packet: 5a 42 58 44 03 af 00 00 00 f0 00 00 00 
  • 5a 42 58 44 – Zabbix packet signature ZBXD

  • 03 – Flags (0x01 Zabbix protocol + 0x02 compression)

  • af 00 00 00 – Data length

  • f0 00 00 00 – Length of uncompressed data

The next header is: 78 9c  which indicates zlib compression. After this comes the compressed JSON data we are interested in. More information can be found within Zabbix documentation here.

Let’s extract only the payload with command:

tshark -r zabbix_stream.pcap -T fields -e tcp.payload -E occurrence=f \
| grep -v '^$'
  • -T fields: output only selected fields

  • -e tcp.payload: get the payload of each TCP frame

  • -E occurrence=f: include all occurrences per frame

  • grep -v ‘^$’: remove empty lines (frames with no payload)

Output example:

5a425844038000000096000000789c2dca4d0e82301040e1ab90591352fb3703477137d3d6483454692518e3dd6dd4edfbde0bd6747fa4526182db9af76717b932f470cedf76649179ef7ec4a1ce5b6a585229735e9a2bf12aa2481c89299032c2ceb21754a44fda609bb7b4fe671cece05a09d71c2e301dd05b4548daf4b014984667b52734f6fd013eac2c96                                                                                5a425844038000000096000000789c2dca4d0e82301040e1ab90591352fb3703477137d3d6483454692518e3dd6dd4edfbde0bd6747fa4526182db9af76717b932f470cedf76649179ef7ec4a1ce5b6a585229735e9a2bf12aa2481c89299032c2ceb21754a44fda609bb7b4fe671cece05a09d71c2e301dd05b4548daf4b014984667b52734f6fd013eac2c96                                                                                5a42584403af000000f0000000789c658ecb0e823014447f85dc3521853e6edb4fd1b868a1c646b44a0bc110fedd22ec5cce9ce4cc2c30b8f7e862020daf21cc9fa233c94009b7f0eb4ec65a3f173b326df293cb30ba187d78664eac201d5adb2969642b09b58633232c12d95c1b8a9bc9c7148643a

Decompressing payload

First, let’s save the payload to a file:

tshark -r zabbix_stream.pcap -T fields -e tcp.payload -E occurrence=f \
| grep -v '^$'  > zabbix_payload.hex

Next, create a python script named decompress.py.

#!/usr/bin/python3
import zlib

hex_file = "zabbix_payload.hex"
ZBXD_HEADER_LEN = 26 # 13 bytes * 2 hex chars per byte

with open(hex_file, "r") as f:
  for line_number, line in enumerate(f, 1):
    line = line.strip()
    if not line:
      continue

    # Remove Zabbix header
    if line.startswith("5a425844"):
      payload_hex = line[ZBXD_HEADER_LEN:]
    else:
      payload_hex = line

    # Convert hex to bytes
    try:
      payload_bytes = bytes.fromhex(payload_hex)
    except ValueError as e:
      print(f"Line {line_number}: Invalid hex, skipping ({e})")
      continue

    # Decompress using zlib
    try:
      decompressed = zlib.decompress(payload_bytes)
    except zlib.error as e:
      print(f"Line {line_number}: Decompression error ({e})")
      continue
  
    print(f"Line {line_number}: {decompressed}")

Make the file executable:

chmod +x decompress.py

Execute the file:

./decompress.py

The script will output decompressed Zabbix traffic:

Line 59: b'{"request":"proxy data","host":"Zabbix proxy active","session":"fbdb545d8250bb4c9b2341cc8ca055f1","history data":[{"id":13,"itemid":50454,"clock":1764172374,"ns":946257883,"value":"[{\\"{#IFNAME}\\":\\"lo\\"},{\\"{#IFNAME}\\":\\"eth0\\"}]"}],"version":"7.4.5","clock":1764172375,"ns":432069960}'
Line 60: b'{"upload":"enabled","response":"success","tasks":[{"type":6,"clock":1764172373,"ttl":3600,"itemid":50454}]}'
Line 61: b'{"request":"proxy data","host":"Zabbix proxy active","session":"fbdb545d8250bb4c9b2341cc8ca055f1","version":"7.4.5","clock":1764172375,"ns":438122213}'
Line 62: b'{"upload":"enabled","response":"success"}'
Line 63: b'{"request":"proxy config","host":"Zabbix proxy active","version":"7.4.5","session":"fbdb545d8250bb4c9b2341cc8ca055f1", "config_revision":18611,"proxy_secrets_provider":0}'
Line 64: b'{"data":{},"config_revision":18613}'

Here every line represents a request from a Zabbix active proxy or Zabbix server response. It is easy to distinguish two communication types:

  • Request proxy data – Proxy sends collected values
  • Request proxy config – Proxy checks its configuration revision and downloads configuration changes if required
Recap

It is required to run only three commands in this setup to read uncompressed communications:

tshark -i eth0 -f "host <ZABBIX SERVER IP> and host <ZABBIX PROXY IP> \
and tcp port 10051" -w zabbix_stream.pcap

tshark -r zabbix_stream.pcap -T fields -e tcp.payload -E occurrence=f \
| grep -v '^$' > zabbix_payload.hex

./decompress.py

A more human-readable format

Can we improve it? Absolutely! Let’s pair requests with their corresponding responses for easier parsing, and then output the data as formatted JSON. First, capture the data:

tshark -i eth0 -f "host <ZABBIX SERVER IP> and host <ZABBIX PROXY IP> \
and tcp port 10051" -w zabbix_stream.pcap

Next, extract the data into a CSV while keeping the stream number:

tshark -r zabbix_stream.pcap -T fields -e tcp.stream -e tcp.payload \
-E occurrence=f -E separator=, -E quote=d, -Y 'tcp.payload && tcp.payload != ""' \
> zabbix_payload.csv

Now, the CSV contains both the stream number and the payload for each packet.

"2","5a42584403aa000000dd000000789c458d410e83201444af62fe9a1814a896a3b4e9e283df9494480bd4688c772f694dba9d37336f8348af37a50c1a9e312c6b35604660700fdfec82c6b8a5fa21b4d9cd5460a2945c980a1fcd60945443df2a6e8cb467d30ad958db5be44a8d4d29bb29531cd15285333a8fc6799757d0d7ed8fdc005a080647c31368ce80620cb14860bf3198291eceae96b52ac7d607fb00dd7427d974ad506531a5f2c3c599ab9ecbfd038a0944ee" "2","5a425844033000000029000000789cab562a2dc8c94f4c51b2524acd4b4cca494d51d2512a4a2d2ec8cf2b4e050a16972627a716172bd502002b010e61" "3","5a42584403db0000003d010000789c658fdd6ac3300c855f25e8da143bb6f2e317196cecc23f0a33f3e2cd76434be9bbcf4d03bbd89584bea3a3a31b64fa3953a9a0e13ba7cbb5f3a61a60f091f6d9abb1365cba2732ae868d1a2c544a486be38bf51615faa9476ead72b3eda512ce4dce70c4453471582be5c538eacc66423436c450afa0df6e7f2878d05232381491400b069473caed08dcdf5ba0506aca47be7dd9efa250e9ebd12257c819b898dc6703e3a0c4d8cbc7682da06735e1340e02196c269e9b3fbc90ed0ae58df2eedfeaf1d378522784ff56e2692545afe6990fc3fd17684060c8" "3","5a425844033000000029000000789cab562a2dc8c94f4c51b2524acd4b4cca494d51d2512a4a2d2ec8cf2b4e050a16972627a716172bd502002b010e61"

Next, let’s create a slightly modified Python script to display the entries per stream. Name it streams.py:

#!/usr/bin/python3

import csv
import zlib
import json

csv_file = "zabbix_payload.csv"
ZBXD_HEADER_LEN = 26 # 13 bytes * 2 hex chars per byte
streams = {}
with open(csv_file, "r") as f:
  reader = csv.reader(f)
  for row_number, row in enumerate(reader, 1):
    if len(row) < 2:
       continue

    stream_id = row[0].strip().strip('"')
    hexdata = row[1].strip().strip('"')

    if not hexdata:
      continue

    # Remove Zabbix header
    if hexdata.startswith("5a425844"):
      hex_payload = hexdata[ZBXD_HEADER_LEN:]
    else:
      hex_payload = hexdata

    # Convert hex to bytes
    try:
      payload_bytes = bytes.fromhex(hex_payload)
    except ValueError as e:
      print(f"[Line {row_number}] Invalid hex: {e}")
      continue

    # Decompress
    try:
      decompressed = zlib.decompress(payload_bytes)
    except zlib.error as e:
      print(f"[Line {row_number}] Decompression error: {e}")
      continue

    # Store in the stream bucket
    streams.setdefault(stream_id, []).append(decompressed)

# ---- OUTPUT SECTION ----

print("\n===== STREAM PAIRS =====\n")

for stream_id, messages in streams.items():
  print(f"=== Stream {stream_id} ===")
  for i, msg in enumerate(messages):
    label = (
      "Request:" if i == 0
      else "Response:" if i == 1
      else f"Extra message #{i+1}:"
    )
    print(label)
    text = msg.decode("utf-8")

    # Try to pretty-print JSON
    try:
      parsed = json.loads(text)
      pretty_json = json.dumps(parsed, indent=4, ensure_ascii=False)
      print(pretty_json)
    except json.JSONDecodeError:
    # fallback: print raw text
      print(text)
    print()

Make the file executable:

chmod +x streams.py

Execute the file:

./streams.py

The script will output decompressed Zabbix traffic in a parsed JSON format:

=== Stream 0 ===
Request:
{
  "request": "proxy data",
  "host": "Zabbix proxy active",
  "session": "fbdb545d8250bb4c9b2341cc8ca055f1",
  "interface availability": [
    {
      "interfaceid": 33,
      "available": 0,
      "error": ""
    }
  ],
  "version": "7.4.5",
  "clock": 1764172350,
  "ns": 303905804
}
Response:
{
  "upload": "enabled",
  "response": "success"
}

=== Stream 1 ===
Request:
.......

You’ll notice that typical communication produces two entries per stream – one request from the Zabbix proxy and one response from the Zabbix server. With this approach, it’s much easier to understand and troubleshoot the communication – all traffic is now grouped into request-response pairs and presented in a clean, formatted way.

Live data

And finally — can we make all of this run live? Absolutely, with a little help from our third Python script. The previous two examples walked through the workflow step by step: capture → extract payload → decompress. Now everything comes together in a single script that handles the entire process for you.

Create a new file named live.py:

#!/usr/bin/python3

import subprocess
import zlib
import json
from datetime import datetime

ZBXD_HEADER_LEN = 26 # 13 bytes * 2 hex chars

# === Configurable parameters ===
SRC_IP = "161.35.217.186"
DST_IP = "134.209.233.72"
TCP_PORT = "10051"
INTERFACE = "eth0"

tshark_cmd = [
  "tshark",
  "-i", INTERFACE,
  "-l",
  "-f", f"host {SRC_IP} and host {DST_IP} and tcp port {TCP_PORT}",
  "-T", "fields",
  "-e", "tcp.stream",
  "-e", "tcp.payload",
  "-E", "separator=,",
  "-E", "quote=d",
  "-E", "occurrence=f",
  "-Y", "tcp.payload && tcp.payload != \"\""
]

proc = subprocess.Popen(
  tshark_cmd,
  stdout=subprocess.PIPE,
  stderr=subprocess.DEVNULL,
  text=True
)

seen_streams = set() # track streams we've already printed

for line in proc.stdout:
  line = line.strip()
  if not line:
    continue

  # Split CSV (stream_number, payload_hex)
  try:
    stream_num, payload_hex = line.split(",", 1)
    payload_hex = payload_hex.strip('"')
  except ValueError:
    continue

  # Only print timestamp once per stream
  if stream_num not in seen_streams:
    timestamp = datetime.now().strftime("%Y-%m-%d %H:%M:%S.%f")[:-3]
    print(f"\n=== [{timestamp}] Stream {stream_num} ===")
    seen_streams.add(stream_num)

  # Remove Zabbix header
  if payload_hex.startswith("5a425844"):
    payload_hex = payload_hex[ZBXD_HEADER_LEN:]

  # Convert hex to bytes
  try:
    payload_bytes = bytes.fromhex(payload_hex)
  except ValueError:
    continue

  # Decompress
  try:
    decompressed = zlib.decompress(payload_bytes)
  except zlib.error:
    continue

  # Pretty print JSON if possible
  try:
    json_obj = json.loads(decompressed)
    pretty = json.dumps(json_obj, indent=2)
    print(pretty)
  except json.JSONDecodeError:
    print(decompressed)

Make the file executable:

chmod +x live.py

Execute the file:

./live.py

And that’s it – your script now watches live proxy traffic and streams the output as JSON. Pretty cool, right?

=== [2025-11-27 16:59:31.593] Stream "0" ===
{
  "request": "proxy data",
  "host": "Zabbix proxy active",
  "session": "fbdb545d8250bb4c9b2341cc8ca055f1",
  "history data": [
    {
      "id": 73726,
      "itemid": 50459,
      "clock": 1764262769,
      "ns": 947018320,
      "value": "0"
    },
    {
      "id": 73727,
      "itemid": 50450,
      "clock": 1764262770,
      "ns": 947145177
    }
  ],
  "version": "7.4.5",
  "clock": 1764262770,
  "ns": 961735298
}
{
  "upload": "enabled",
"  response": "success"
}
.....

Final notes

The example scripts provided here are for demonstration purposes only, tested in a small demo environment. While the same principles apply to larger setups, keep in mind that proxies in production can handle hundreds or even thousands of new values per second (NVPS), which significantly increases the payload volume. Also, all examples assume a Zabbix proxy running in active mode – passive proxies communicate slightly differently. A similar approach can be used to monitor Zabbix Agent communications.

So, what valuable information can you actually gather from Zabbix proxy ⇄ Zabbix Server communication?

  • The types of data sent from proxy to server

  • Configuration updates and their contents

  • Test and Execute Now tasks

  • Discovery and Autoregistration data

If you’re interested in exploring discovery, autoregistration, encryption, or other aspects of Zabbix’s internal communication, feel free to leave a comment!

The post Decoding Zabbix Proxy Traffic for Faster Troubleshooting appeared first on Zabbix Blog.

Build Zabbix Server HA Cluster in 10 minutes by Kaspars Mednis / Zabbix Summit Online 2021

Post Syndicated from Kaspars Mednis original https://blog.zabbix.com/build-zabbix-server-ha-cluster-in-10-minutes-by-kaspars-mednis-zabbix-summit-online-2021/18155/

With the native Zabbix server HA cluster feature added in Zabbix 6.0 LTS, it is now possible to quickly configure and deploy a multi-node Zabbix Server HA cluster without using any external tools. Let’s take a look at how we can deploy a Zabbix server HA cluster in just 10 minutes.

The full recording of the speech is available on the official Zabbix Youtube channel.

Why Zabbix needs HA

Let’s dive deeper into what high availability is and try to define what the term High availability entails:

  • A system runs in high availability mode if it does not have a single point of failure
  • A single point of failure is a component failure of which halts the whole system
  • Redundancy is a requirement in systems that use high availability. In our case, we need a redundant component to which we can fail-over in case if the currently active component encounters an issue.
  • The failover process needs to be transparent and automated

In the case of the Zabbix components, the single point of failure is our Zabbix server. Even though Zabbix in itself is very stable, you can still encounter scenarios when a crash happens due to OS level issues or something more trivial – like running out of disk space. If your Zabbix server goes down, all of the data collection, problem detection, and alerting is stopped. That’s why it’s important to have some form of high availability and redundancy for this particular Zabbix component.

How to choose HA for Zabbix

Before the addition of native HA cluster support in Zabbix 6.0 LTS it was possible to use 3rd party HA solutions for Zabbix. This caused an ongoing discussion – which 3rd party solution should I use and how should I configure it for Zabbix components? On top of this, you would also have a new layer of software that requires proper expertise to deploy, configure and manage. There are also cloud-based HA options, but most of the time these incur an extra cost.

Not having the required expertise for the 3rd party high availability tools can cause unwanted downtimes or, at worst, can cause inconsistencies in the Zabbix DB backend. Here are some of the potential scenarios that can be caused by a misconfigured high availability solution:

  • The automatic failover may not be configured properly
  • A split-brain scenario with two nodes running concurrently, potentially causing inconsistencies in the Zabbix database backend
  • Misconfigured STONITH (Shoot the other node in the head) scenarios – potentially causing both nodes to go down

Native Zabbix HA solution

Zabbix 6.0 LTS native high availability solution is easy to set up and all of the required steps are documented in the Zabbix documentation. The native solution does not require any additional expertise and will continue to be officially supported, updated, and improved by Zabbix. Native high availability solution doesn’t require any new software components – the high availability solution stores the information about the Zabbix server node status in the Zabbix database backend.

How Zabbix cluster works

To enable the native high availability cluster for our servers, we first need to start the Zabbix server component in the high availability mode. To achieve this, we need to look at the two new parameters in the /etc/zabbix/zabbix_server.conf configuration file:

  • HANodeName – specify an arbitrary name for your Zabbix server cluster node
  • ExternalAddress – specify the address of the cluster node

Once you have made the changes and added these parameters, don’t forget to restart the Zabbix server cluster nodes to apply the changes.

Zabbix HA Node name

Let’s take a look at the HANodeName parameter. This is the most important configuration parameter – it is mandatory to specify it if you wish to run your Zabbix server in the high availability mode.

  • This parameter is used to specify the name of the particular cluster mode
  • If the HANodeName is not specified, Zabbix server will not start in the cluster mode
  • The node name needs to be unique on each of your nodes

In our example, we can observe a two-node cluster, where zbx-node1 is the active node and zbx-node2 is the standby node. Both of these nodes will send their heartbeats to the Zabbix database backend every 5 seconds. If one node stops sending its heartbeat, another node will take over.

Zabbix HA Node External Address

The second parameter that you will also need to specify is the ExternalAddress parameter.

In our example, we are using the address node1.example.com. The purpose of this parameter is to let the Zabbix frontend know the address of the currently active Zabbix server since the Zabbix frontend component also constantly communicates with the Zabbix server component. If this parameter is not specified, the Zabbix frontend might not be able to connect to the active Zabbix server node.

Zabbix frontend setup

Seasoned Zabbix users might know that the Zabbix frontend has its own configuration file, which usually contains the Zabbix server address and the Zabbix server port for establishing connections from the Zabbix frontend to the Zabbix server. If you are using the Zabbix high availability cluster, then you will have to comment these parameters out since instead of being static, now they depend on the currently active Zabbix server node and will be obtained from the Zabbix backend database.

Putting it all together

In the above example, we can see that we have two nodes – zbx-node1, which is currently active and zbx-node2. These nodes can be reachable by using the external addresses – node1.example.com and node2.example.com for zbx-node1 and zbx-node2 respectively. We can see that we also have deployed multiple frontends. Each of these frontend nodes will connect to the Zabbix backend database, read the address of the currently active node and proceed to connect to that node.

Zabbix HA node types

Zabbix server high availability cluster nodes can have one of the following multiple statuses:

  • Active – The currently active node. Only one node can be active at a time
  • Standby – The node is currently running in standby mode. Multiple nodes can have this status
  • Shutdown – The node was previously detected, but it has been gracefully shut down
  • Unreachable – Node was previously detected but was unexpectedly lost without a shutdown. This can be caused by many different reasons, for example – the node crashing or having network issues

In normal circumstances, you will have an active node and one or more standby nodes. Nodes in shutdown mode are also expected if, for example, you’re performing some maintenance tasks on these nodes. On the other hand, if an active node becomes unreachable, this is when one of the standby nodes will take over.

Zabbix HA Manager

How can we check which node is currently active and which nodes are running in standby mode? First off, we can see this in the Zabbix frontend – we will take a look at this a bit later. We can also check the node status from the command line. On every node – no matter active or standby, you will see that the zabbix_server and ha manager processes have been started. The ha manager process is responsible for checking the high availability node status in the database every 5 seconds and is responsible for taking over if the active node fails.

On the other hand, the currently active Zabbix server node will have many other processes – data collector processes such as pollers and trappers, history and configuration syncers, and many other Zabbix child processes.

Zabbix HA node status

The System information widget has received some changes in Zabbix 6.0 LTS. It is now capable of displaying the status of your Zabbix server high availability cluster and its individual nodes.

The widget can display the current cluster mode, which is enabled in our example and provides a list of all cluster nodes. In our example, we can see that we have 3 nodes – 1 active node,1 stopped node, and 1 node running in standby mode. This way we can not only see the status of our nodes but also their names, addresses, and last access times.

Switching Zabbix HA node

The witching between nodes is done manually. Once you stop the currently active Zabbix server node, another node will automatically take over. Of course, you need to have at least one more node running in standby status, so it can take over from the failed active node.

How failover works?

All nodes report their status every 5 seconds. Whenever you shut down a node, it goes into a shutdown state and in 5 seconds another node will take over. But if a node fails the workflow is a bit different. This is where something called a failover delay is taken into account. By default, this failover delay is 1 minute. The standby node will wait for one minute for the failed active node to update its status and if in one minute the active node is still not visible, then the standby node will take over.

Zabbix cluster tuning

It is possible to adjust the failover delay by using the ha_set_failover_delay runtime command. The supported range of the failover delay is from 10 seconds to 15 minutes. In most cases the default value of 1 minute will work just fine, but there could be some exceptions and it very much depends on the specifics of your environment.

We can also remove a node by using the ha_remove_node runtime command. This command requires us to specify the ID of the node that we wish to remove.

Connecting agents and proxies

Connecting Zabbix agents to your cluster

Now let’s talk about how we can connect Zabbix agents and proxies to your Zabbix cluster. First, let’s take a look at the passive Zabbix agent configuration.

  • Passive Zabbix agents require all nodes to be written in the configuration file under the Server parameter
  • Nodes are specified in a comma-separated list

Once you specify the list of all nodes, the passive Zabbix agent will accept connections from all of the specified nodes.

What about the active Zabbix agents?

  • Active Zabbix agents require all nodes to be written in the configuration file under the ServerActive parameter
  • Nodes need to be separated by semicolons

Notice the difference – comma-separated list for passive Zabbix agents and nodes separated by semicolons for active Zabbix agents!

Connecting Zabbix proxies to your cluster

Proxy configuration is very similar to the agent configuration. Once again – we can have a proxy running either in passive mode or active mode.

For the passive Zabbix proxies, we need to list our cluster nodes under the Server parameter in the proxy configuration file. These nodes should be specified in a comma-separated list. This way the proxies will accept connections from any Zabbix server node. As for the active Zabbix proxies – we need once again to list our nodes under the Server parameter, but this time the node names will be separated by semicolons.

Conclusion – Setting up Zabbix HA cluster

Let’s conclude by going through all of the steps that are required to set up a Zabbix server HA cluster.

  • Start Zabbix server in high availability mode on all of your Zabbix server cluster nodes – this can be done by providing the HANodeName parameter in the Zabbix server configuration file
  • Comment out the $ZBX_SERVER and $ZBX_SERVER_PORT in the frontend configuration file
  • List your cluster nodes in the Server and/or ServerActive parameters in the Zabbix agent configuration file for all of the Zabbix agents
  • List your cluster nodes in the Server parameter for all of your Zabbix proxies
  • For other monitoring types, such as SNMP – make sure your endpoints accept connections from all of the Zabbix server cluster nodes
  • And that’s it – Enjoy!

Zabbix HA workshop and training

Wish to learn more about the Zabbix server high availability cluster and get some hands-on experience with the guidance of a Zabbix certified trainer? Take a look at the following options!

  • The Zabbix server high availability workshop will be hosted shortly after the release of Zabbix 6.0 LTS, which is currently planned for January 2022. One of the workshop sessions will be focused specifically on Zabbix server high availability cluster configuration and troubleshooting.
  • Zabbix Certified professional training course covers the Zabbix server HA cluster configuration and troubleshooting. This is also a great opportunity to discuss your own Zabbix use cases and infrastructure with a Zabbix certified trainer. Feel free to check out our Zabbix training page to learn more!

Questions

Q: What about the high availability for the Zabbix frontend? Is it possible to set it up?
A: This is already supported since Zabbix 5.2. All you have to do is deploy as many Zabbix frontend nodes as you require and don’t forget to properly configure the external address so the Zabbix frontends are able to connect to the Zabbix servers and that’s all!

Q: Does high availability cause a performance impact on the network or the Zabbix backend database?
A: No, this should not be the case. The heartbeats that the cluster nodes send to the database backend are extremely small messages that get recorded in one of the smaller Zabbix database tables, so the performance impact should be negligible.

Q: What is the best practice when it comes to migrating from a 3rd party solution such as PCS/Corosync/Pacemaker to the native Zabbix server high availability cluster? Any suggestions on how that can be achieved?
A: The most complex part here is removing the existing high availability solution without breaking anything in the existing environment. Once that is done, all you have to do is upgrade your Zabbix instance to Zabbix 6.0 LTS and follow the configuration steps described in this post. Remember, that if you’re performing an upgrade instead of a fresh install, the configuration files will not have the new configuration parameters so they will have to be added in manually.