Tag Archives: HA

Build Zabbix Server HA Cluster in 10 minutes by Kaspars Mednis / Zabbix Summit Online 2021

Post Syndicated from Kaspars Mednis original https://blog.zabbix.com/build-zabbix-server-ha-cluster-in-10-minutes-by-kaspars-mednis-zabbix-summit-online-2021/18155/

With the native Zabbix server HA cluster feature added in Zabbix 6.0 LTS, it is now possible to quickly configure and deploy a multi-node Zabbix Server HA cluster without using any external tools. Let’s take a look at how we can deploy a Zabbix server HA cluster in just 10 minutes.

The full recording of the speech is available on the official Zabbix Youtube channel.

Why Zabbix needs HA

Let’s dive deeper into what high availability is and try to define what the term High availability entails:

  • A system runs in high availability mode if it does not have a single point of failure
  • A single point of failure is a component failure of which halts the whole system
  • Redundancy is a requirement in systems that use high availability. In our case, we need a redundant component to which we can fail-over in case if the currently active component encounters an issue.
  • The failover process needs to be transparent and automated

In the case of the Zabbix components, the single point of failure is our Zabbix server. Even though Zabbix in itself is very stable, you can still encounter scenarios when a crash happens due to OS level issues or something more trivial – like running out of disk space. If your Zabbix server goes down, all of the data collection, problem detection, and alerting is stopped. That’s why it’s important to have some form of high availability and redundancy for this particular Zabbix component.

How to choose HA for Zabbix

Before the addition of native HA cluster support in Zabbix 6.0 LTS it was possible to use 3rd party HA solutions for Zabbix. This caused an ongoing discussion – which 3rd party solution should I use and how should I configure it for Zabbix components? On top of this, you would also have a new layer of software that requires proper expertise to deploy, configure and manage. There are also cloud-based HA options, but most of the time these incur an extra cost.

Not having the required expertise for the 3rd party high availability tools can cause unwanted downtimes or, at worst, can cause inconsistencies in the Zabbix DB backend. Here are some of the potential scenarios that can be caused by a misconfigured high availability solution:

  • The automatic failover may not be configured properly
  • A split-brain scenario with two nodes running concurrently, potentially causing inconsistencies in the Zabbix database backend
  • Misconfigured STONITH (Shoot the other node in the head) scenarios – potentially causing both nodes to go down

Native Zabbix HA solution

Zabbix 6.0 LTS native high availability solution is easy to set up and all of the required steps are documented in the Zabbix documentation. The native solution does not require any additional expertise and will continue to be officially supported, updated, and improved by Zabbix. Native high availability solution doesn’t require any new software components – the high availability solution stores the information about the Zabbix server node status in the Zabbix database backend.

How Zabbix cluster works

To enable the native high availability cluster for our servers, we first need to start the Zabbix server component in the high availability mode. To achieve this, we need to look at the two new parameters in the /etc/zabbix/zabbix_server.conf configuration file:

  • HANodeName – specify an arbitrary name for your Zabbix server cluster node
  • ExternalAddress – specify the address of the cluster node

Once you have made the changes and added these parameters, don’t forget to restart the Zabbix server cluster nodes to apply the changes.

Zabbix HA Node name

Let’s take a look at the HANodeName parameter. This is the most important configuration parameter – it is mandatory to specify it if you wish to run your Zabbix server in the high availability mode.

  • This parameter is used to specify the name of the particular cluster mode
  • If the HANodeName is not specified, Zabbix server will not start in the cluster mode
  • The node name needs to be unique on each of your nodes

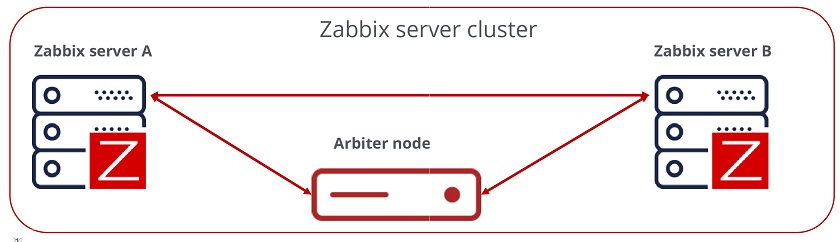
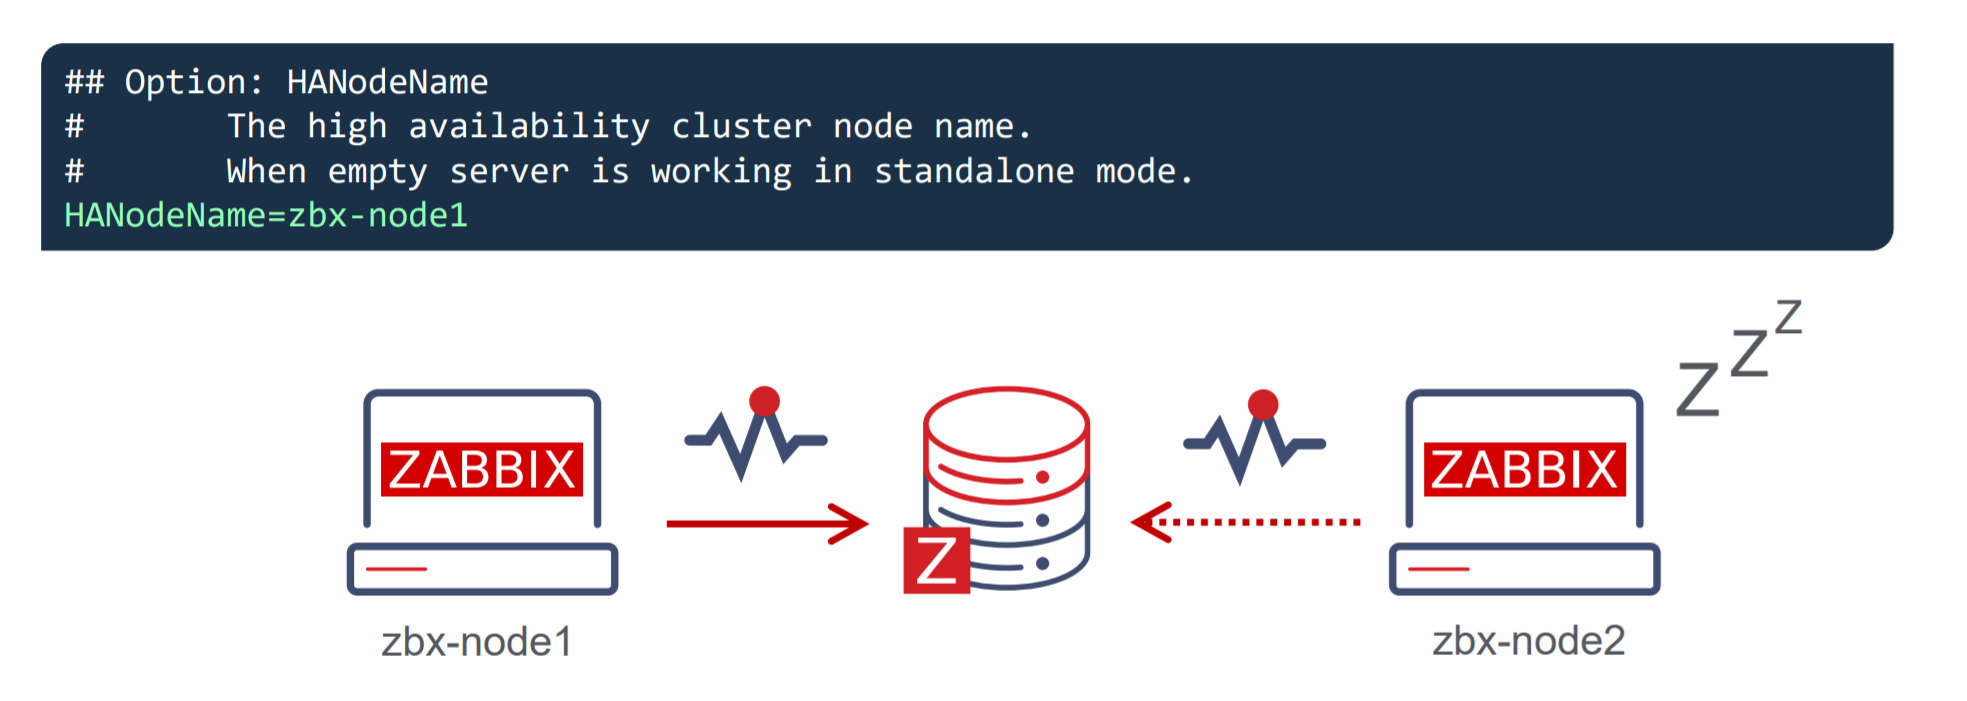
In our example, we can observe a two-node cluster, where zbx-node1 is the active node and zbx-node2 is the standby node. Both of these nodes will send their heartbeats to the Zabbix database backend every 5 seconds. If one node stops sending its heartbeat, another node will take over.

Zabbix HA Node External Address

The second parameter that you will also need to specify is the ExternalAddress parameter.

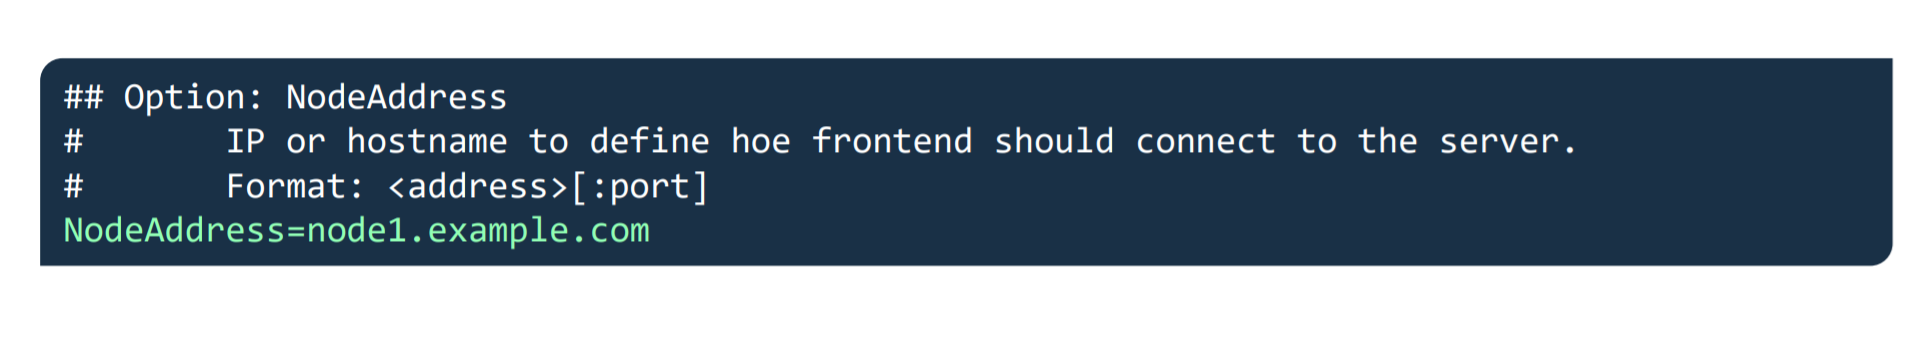
In our example, we are using the address node1.example.com. The purpose of this parameter is to let the Zabbix frontend know the address of the currently active Zabbix server since the Zabbix frontend component also constantly communicates with the Zabbix server component. If this parameter is not specified, the Zabbix frontend might not be able to connect to the active Zabbix server node.

Zabbix frontend setup

Seasoned Zabbix users might know that the Zabbix frontend has its own configuration file, which usually contains the Zabbix server address and the Zabbix server port for establishing connections from the Zabbix frontend to the Zabbix server. 
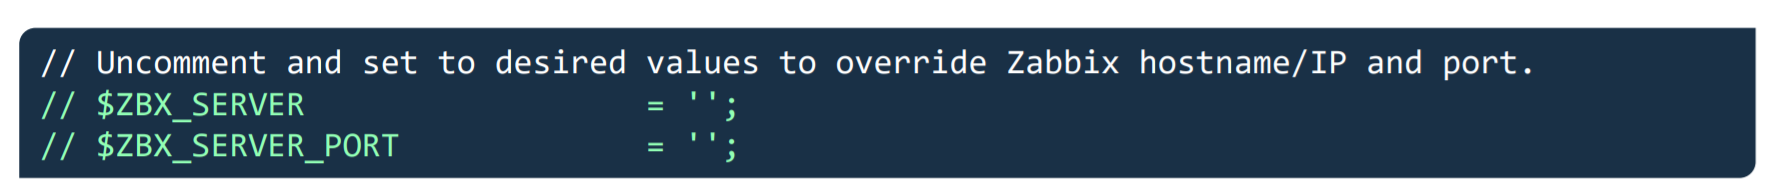
If you are using the Zabbix high availability cluster, then you will have to comment these parameters out since instead of being static, now they depend on the currently active Zabbix server node and will be obtained from the Zabbix backend database.

Putting it all together

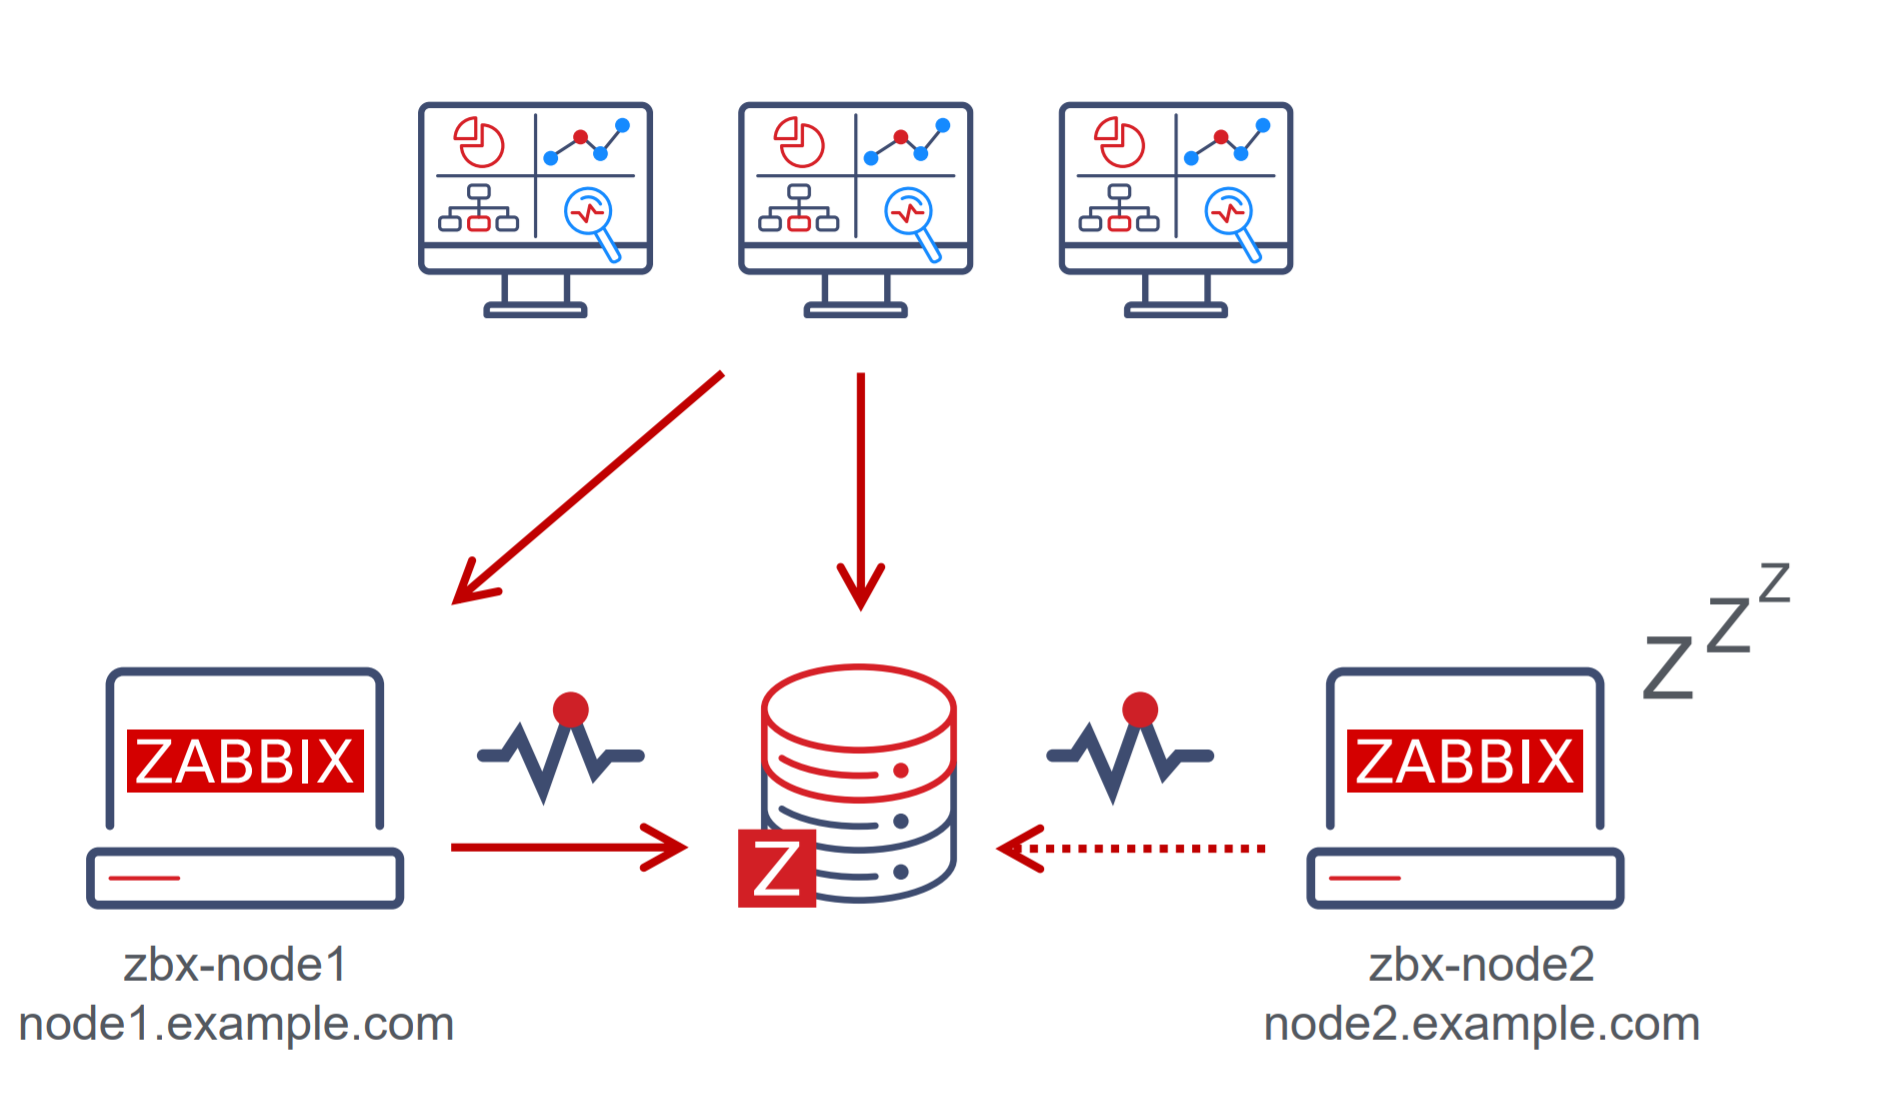
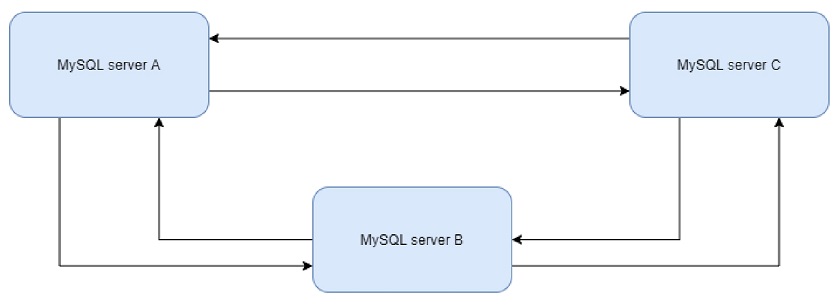
In the above example, we can see that we have two nodes – zbx-node1, which is currently active and zbx-node2. These nodes can be reachable by using the external addresses – node1.example.com and node2.example.com for zbx-node1 and zbx-node2 respectively. We can see that we also have deployed multiple frontends. Each of these frontend nodes will connect to the Zabbix backend database, read the address of the currently active node and proceed to connect to that node.

Zabbix HA node types

Zabbix server high availability cluster nodes can have one of the following multiple statuses:

  • Active – The currently active node. Only one node can be active at a time
  • Standby – The node is currently running in standby mode. Multiple nodes can have this status
  • Shutdown – The node was previously detected, but it has been gracefully shut down
  • Unreachable – Node was previously detected but was unexpectedly lost without a shutdown. This can be caused by many different reasons, for example – the node crashing or having network issues

In normal circumstances, you will have an active node and one or more standby nodes. Nodes in shutdown mode are also expected if, for example, you’re performing some maintenance tasks on these nodes. On the other hand, if an active node becomes unreachable, this is when one of the standby nodes will take over.

Zabbix HA Manager

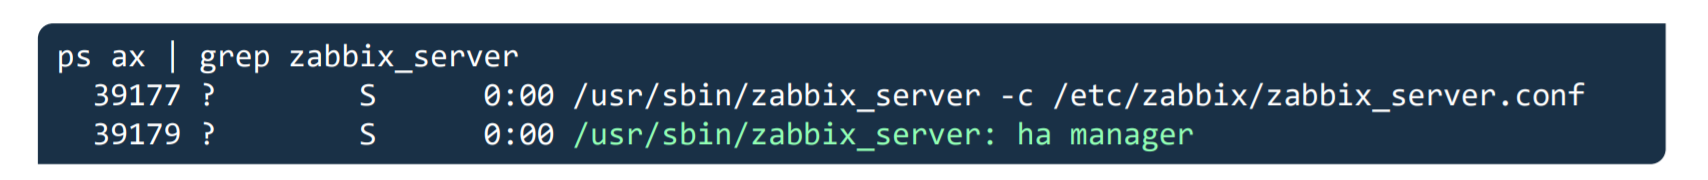
How can we check which node is currently active and which nodes are running in standby mode? First off, we can see this in the Zabbix frontend – we will take a look at this a bit later. We can also check the node status from the command line. On every node – no matter active or standby, you will see that the zabbix_server and ha manager processes have been started. The ha manager process is responsible for checking the high availability node status in the database every 5 seconds and is responsible for taking over if the active node fails.

On the other hand, the currently active Zabbix server node will have many other processes – data collector processes such as pollers and trappers, history and configuration syncers, and many other Zabbix child processes.

Zabbix HA node status

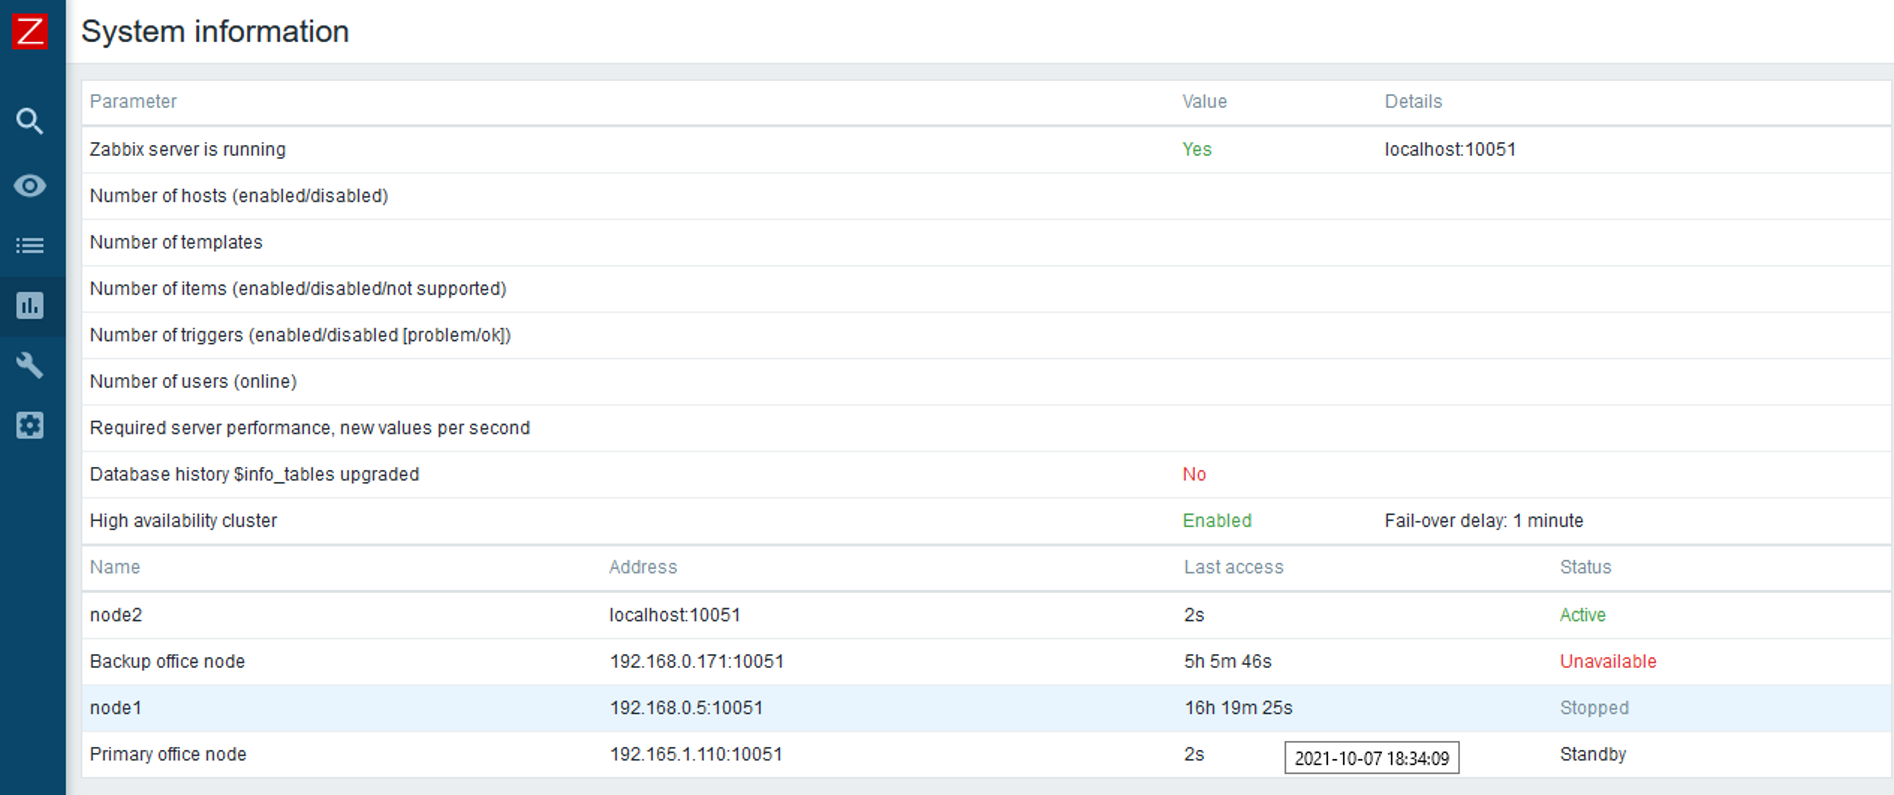
The System information widget has received some changes in Zabbix 6.0 LTS. It is now capable of displaying the status of your Zabbix server high availability cluster and its individual nodes.

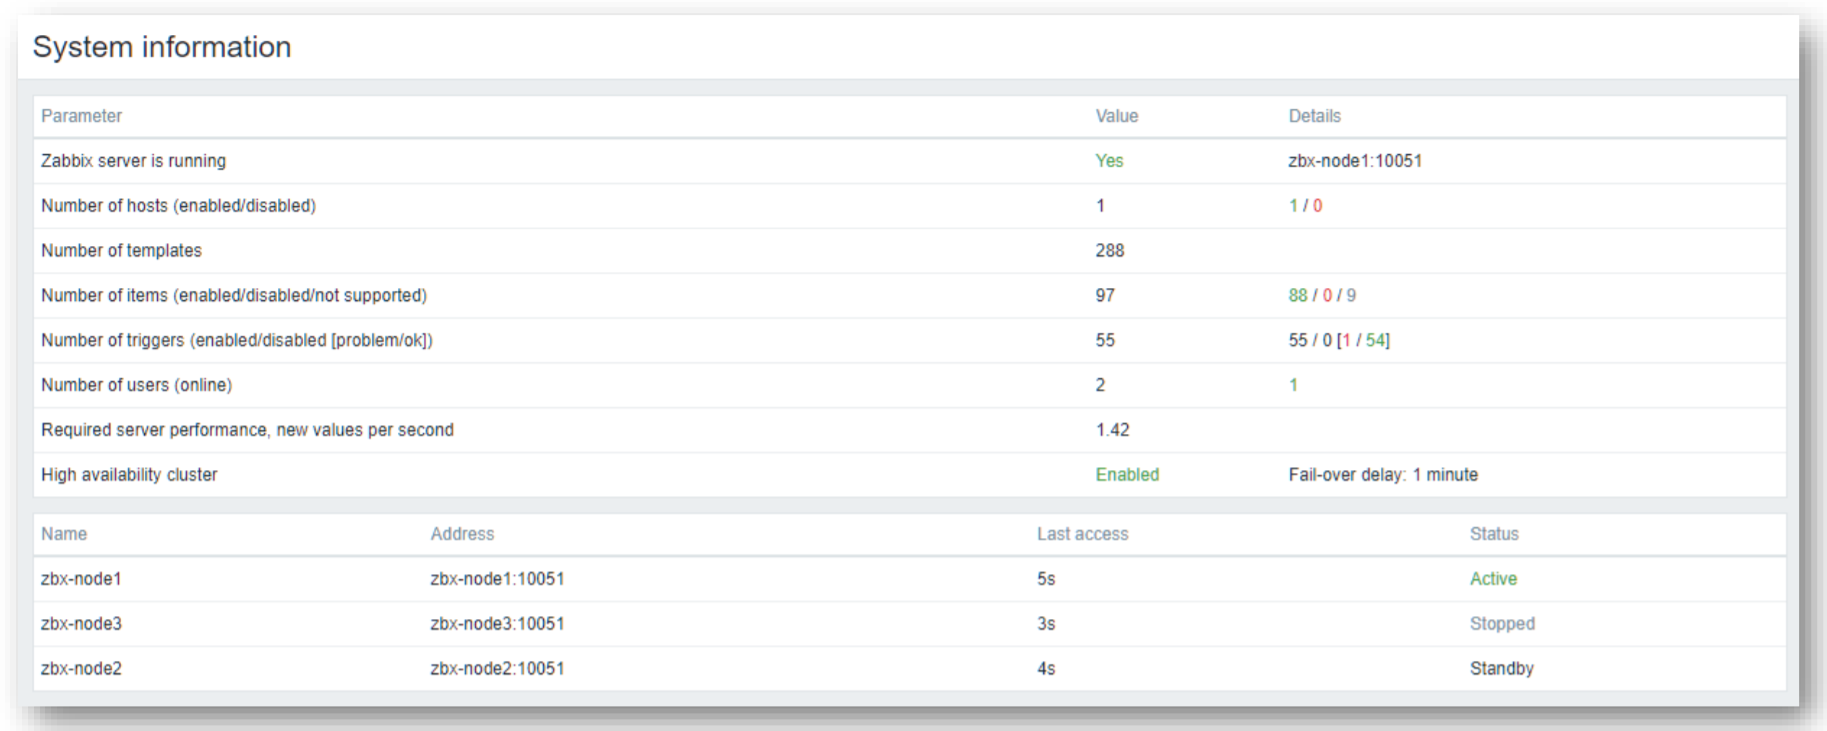
The widget can display the current cluster mode, which is enabled in our example and provides a list of all cluster nodes. In our example, we can see that we have 3 nodes – 1 active node,1 stopped node, and 1 node running in standby mode. This way we can not only see the status of our nodes but also their names, addresses, and last access times.

Switching Zabbix HA node

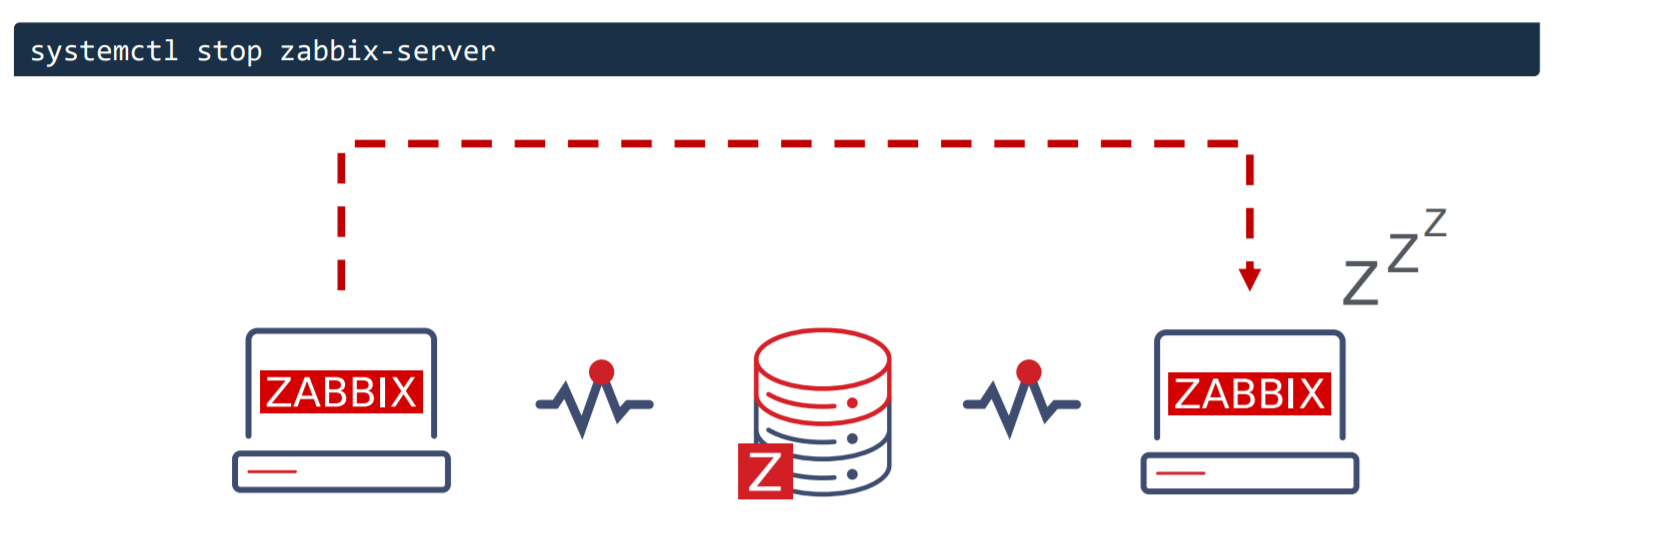
The witching between nodes is done manually. Once you stop the currently active Zabbix server node, another node will automatically take over. Of course, you need to have at least one more node running in standby status, so it can take over from the failed active node.

How failover works?

All nodes report their status every 5 seconds. Whenever you shut down a node, it goes into a shutdown state and in 5 seconds another node will take over. But if a node fails the workflow is a bit different. This is where something called a failover delay is taken into account. By default, this failover delay is 1 minute. The standby node will wait for one minute for the failed active node to update its status and if in one minute the active node is still not visible, then the standby node will take over.

Zabbix cluster tuning

It is possible to adjust the failover delay by using the ha_set_failover_delay runtime command. The supported range of the failover delay is from 10 seconds to 15 minutes. In most cases the default value of 1 minute will work just fine, but there could be some exceptions and it very much depends on the specifics of your environment.

We can also remove a node by using the ha_remove_node runtime command. This command requires us to specify the ID of the node that we wish to remove.

Connecting agents and proxies

Connecting Zabbix agents to your cluster

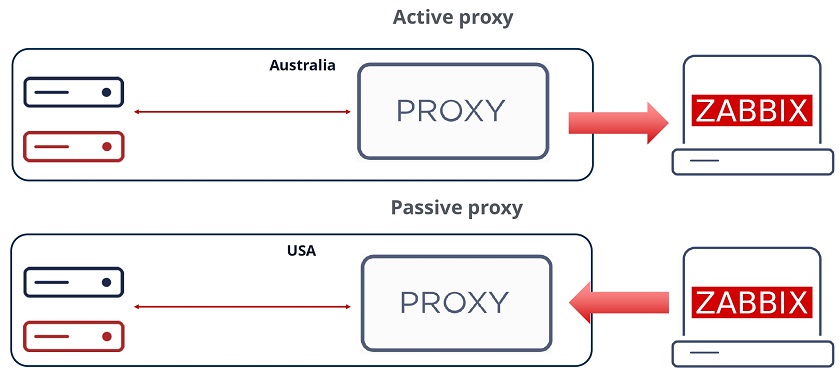
Now let’s talk about how we can connect Zabbix agents and proxies to your Zabbix cluster. First, let’s take a look at the passive Zabbix agent configuration.

  • Passive Zabbix agents require all nodes to be written in the configuration file under the Server parameter
  • Nodes are specified in a comma-separated list

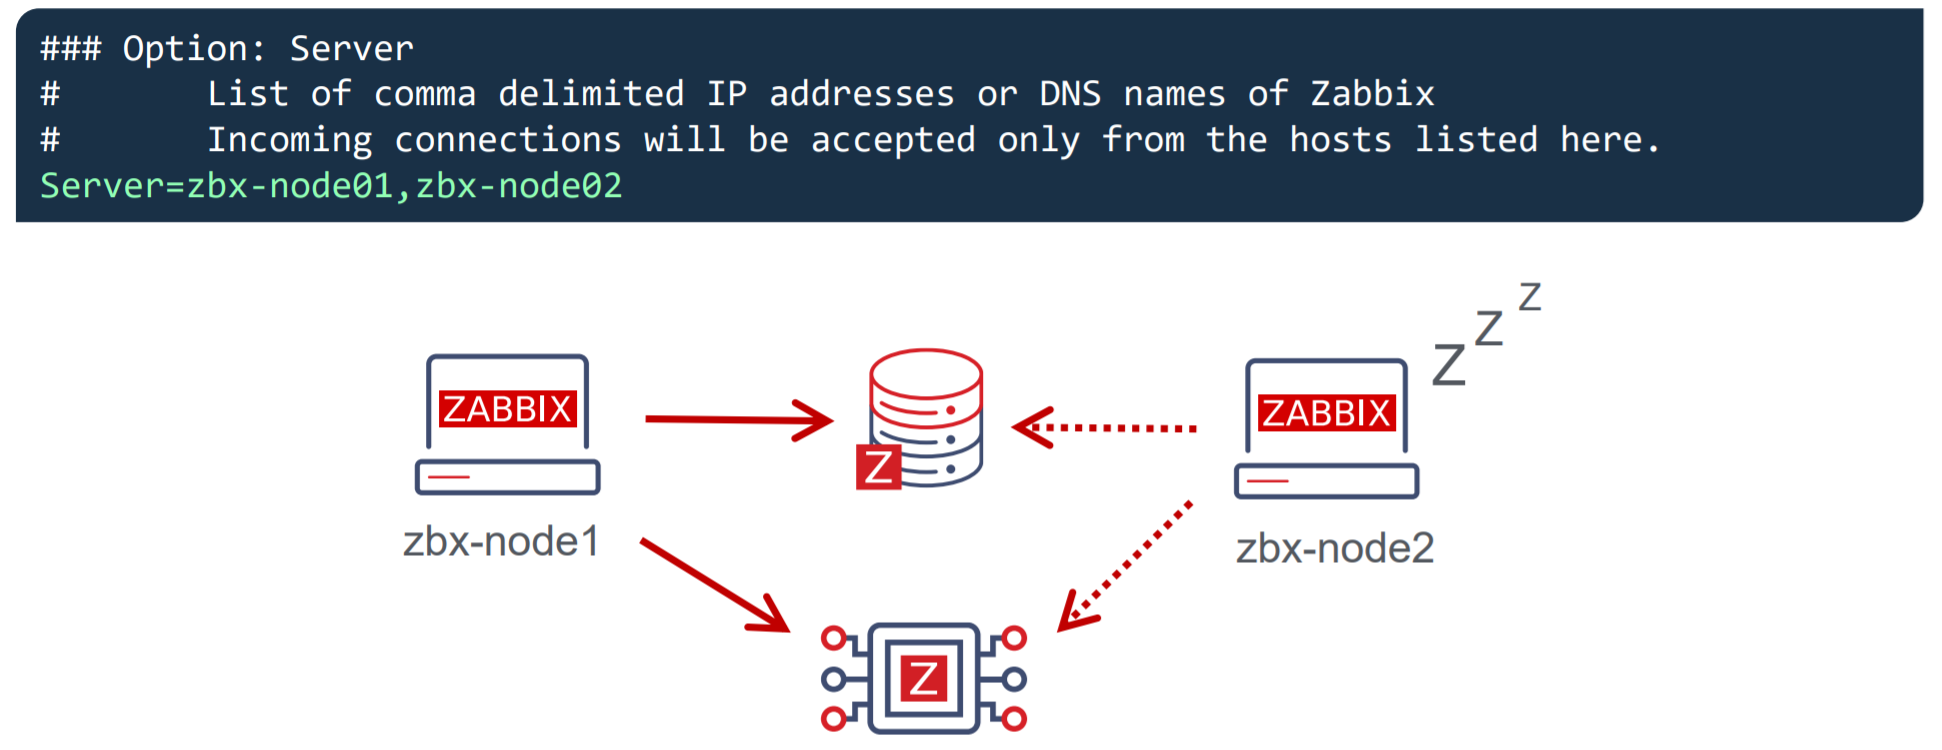
Once you specify the list of all nodes, the passive Zabbix agent will accept connections from all of the specified nodes.

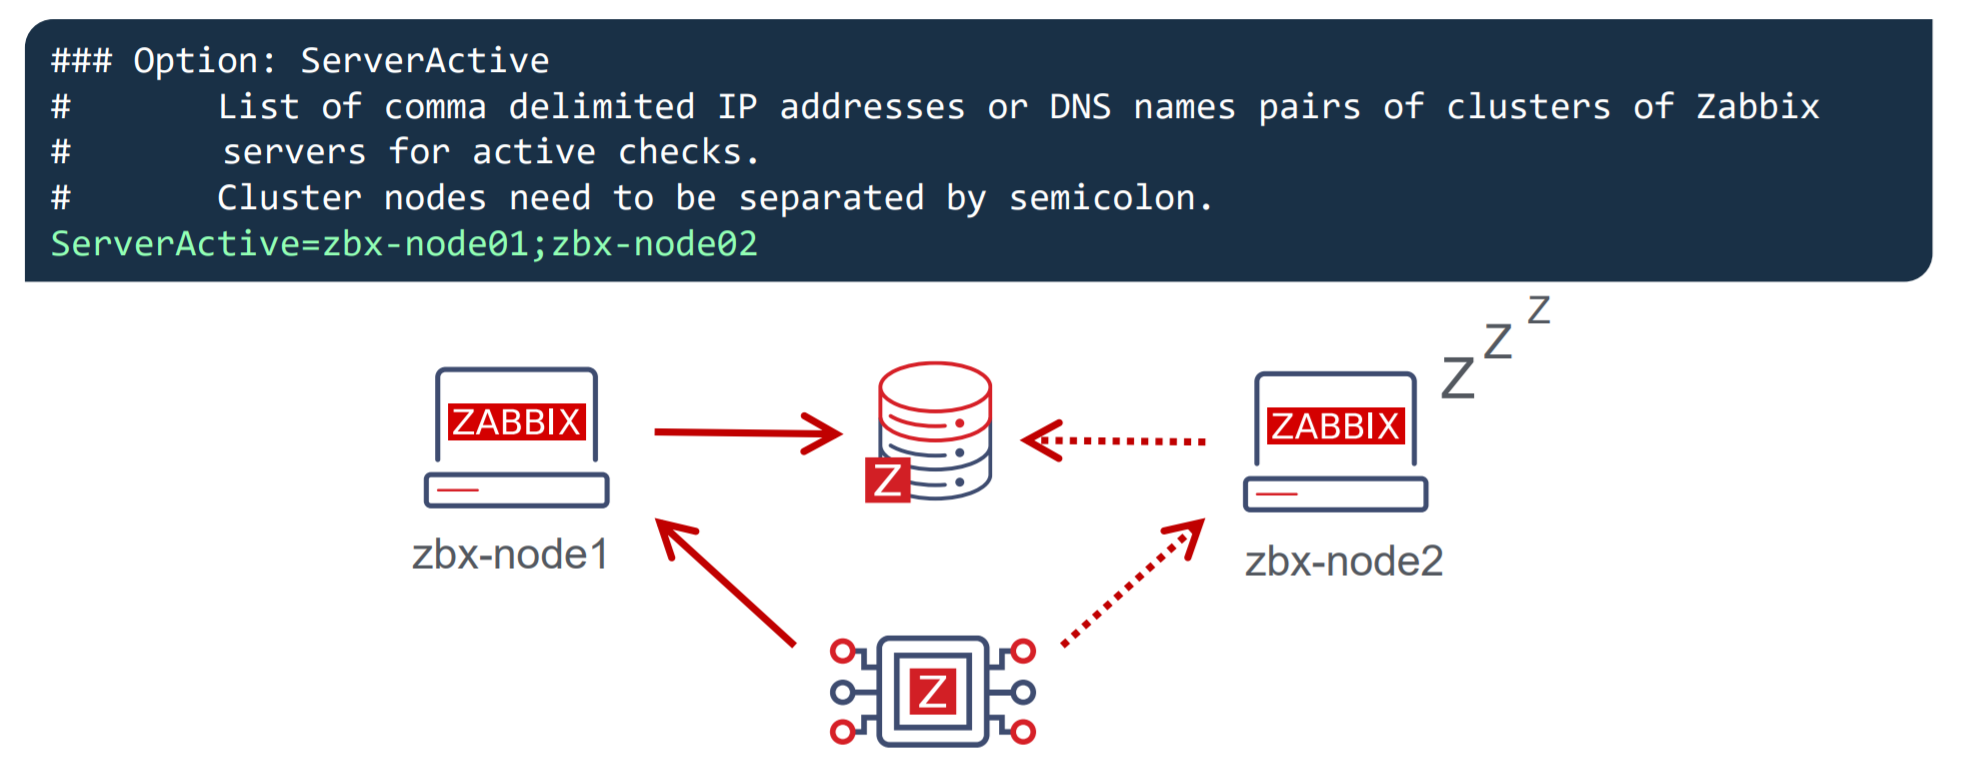
What about the active Zabbix agents?

  • Active Zabbix agents require all nodes to be written in the configuration file under the ServerActive parameter
  • Nodes need to be separated by semicolons

Notice the difference – comma-separated list for passive Zabbix agents and nodes separated by semicolons for active Zabbix agents!

Connecting Zabbix proxies to your cluster

Proxy configuration is very similar to the agent configuration. Once again – we can have a proxy running either in passive mode or active mode.

For the passive Zabbix proxies, we need to list our cluster nodes under the Server parameter in the proxy configuration file. These nodes should be specified in a comma-separated list. This way the proxies will accept connections from any Zabbix server node. As for the active Zabbix proxies – we need once again to list our nodes under the Server parameter, but this time the node names will be separated by semicolons.

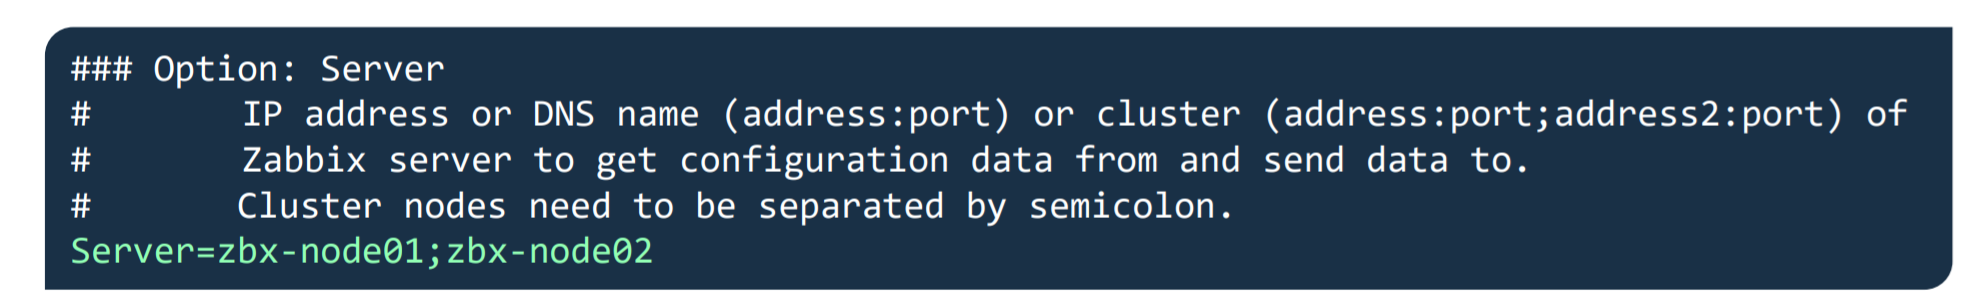
Conclusion – Setting up Zabbix HA cluster

Let’s conclude by going through all of the steps that are required to set up a Zabbix server HA cluster.

  • Start Zabbix server in high availability mode on all of your Zabbix server cluster nodes – this can be done by providing the HANodeName parameter in the Zabbix server configuration file
  • Comment out the $ZBX_SERVER and $ZBX_SERVER_PORT in the frontend configuration file
  • List your cluster nodes in the Server and/or ServerActive parameters in the Zabbix agent configuration file for all of the Zabbix agents
  • List your cluster nodes in the Server parameter for all of your Zabbix proxies
  • For other monitoring types, such as SNMP – make sure your endpoints accept connections from all of the Zabbix server cluster nodes
  • And that’s it – Enjoy!

Zabbix HA workshop and training

Wish to learn more about the Zabbix server high availability cluster and get some hands-on experience with the guidance of a Zabbix certified trainer? Take a look at the following options!

  • The Zabbix server high availability workshop will be hosted shortly after the release of Zabbix 6.0 LTS, which is currently planned for January 2022. One of the workshop sessions will be focused specifically on Zabbix server high availability cluster configuration and troubleshooting.
  • Zabbix Certified professional training course covers the Zabbix server HA cluster configuration and troubleshooting. This is also a great opportunity to discuss your own Zabbix use cases and infrastructure with a Zabbix certified trainer. Feel free to check out our Zabbix training page to learn more!

Questions

Q: What about the high availability for the Zabbix frontend? Is it possible to set it up?
A: This is already supported since Zabbix 5.2. All you have to do is deploy as many Zabbix frontend nodes as you require and don’t forget to properly configure the external address so the Zabbix frontends are able to connect to the Zabbix servers and that’s all!

Q: Does high availability cause a performance impact on the network or the Zabbix backend database?
A: No, this should not be the case. The heartbeats that the cluster nodes send to the database backend are extremely small messages that get recorded in one of the smaller Zabbix database tables, so the performance impact should be negligible.

Q: What is the best practice when it comes to migrating from a 3rd party solution such as PCS/Corosync/Pacemaker to the native Zabbix server high availability cluster? Any suggestions on how that can be achieved?
A: The most complex part here is removing the existing high availability solution without breaking anything in the existing environment. Once that is done, all you have to do is upgrade your Zabbix instance to Zabbix 6.0 LTS and follow the configuration steps described in this post. Remember, that if you’re performing an upgrade instead of a fresh install, the configuration files will not have the new configuration parameters so they will have to be added in manually.

What’s new in Zabbix 6.0 LTS by Artūrs Lontons / Zabbix Summit Online 2021

Post Syndicated from Arturs Lontons original https://blog.zabbix.com/whats-new-in-zabbix-6-0-lts-by-arturs-lontons-zabbix-summit-online-2021/17761/

Zabbix 6.0 LTS comes packed with many new enterprise-level features and improvements. Join Artūrs Lontons and take a look at some of the major features that will be available with the release of Zabbix 6.0 LTS.

The full recording of the speech is available on the official Zabbix Youtube channel.

If we look at the Zabbix roadmap and Zabbix 6.0 LTS release in particular, we can see that one of the main focuses of Zabbix development is releasing features that solve many complex enterprise-grade problems and use cases. Zabbix 6.0 LTS aims to:

  • Solve enterprise-level security and redundancy requirements
  • Improve performance for large Zabbix instances
  • Provide additional value to different types of Zabbix users – DevOPS and ITOps teams, Business process owner, Managers
  • Continue to extend Zabbix monitoring and data collection capabilities
  • Provide continued delivery of official integrations with 3rd party systems

Let’s take a look at the specific Zabbix 6.0 LTS features that can guide us towards achieving these goals.

Zabbix server High Availability cluster

With the release of Zabbix 6.0 LTS, Zabbix administrators will now have the ability to deploy Zabbix server HA cluster out-of-the-box. No additional tools are required to achieve this.

Zabbix server HA cluster supports an unlimited number of Zabbix server nodes. All nodes will use the same database backend – this is where the status of all nodes will be stored in the ha_node table. Nodes will report their status every 5 seconds by updating the corresponding record in the ha_node table.

To enable High availability, you will first have to define a new parameter in the Zabbix server configuration file: HANodeName

  • Empty by default
  • This parameter should contain an arbitrary name of the HA node
  • Providing value to this parameter will enable Zabbix server cluster mode

Standby nodes monitor the last access time of the active node from the ha_node table.

  • If the difference between last access time and current time reaches the failover delay, the cluster fails over to the standby node
  • Failover operation is logged in the Zabbix server log

It is possible to define a custom failover delay – a time window after which an unreachable active node is considered lost and failover to one of the standby nodes takes place.

As for the Zabbix proxies, the Server parameter in the Zabbix proxy configuration file now supports multiple addresses separated by a semicolon. The proxy will attempt to connect to each of the nodes until it succeeds.

Other HA cluster related features:

  • New command-line options to check HA cluster status
  • hanode.get API method to obtain the list of HA nodes
  • The new internal check provides LLD information to discover Zabbix server HA nodes
  • HA Failover event logged in the Zabbix Audit log
  • Zabbix Frontend will automatically switch to the active Zabbix server node

You can find a more detailed look at the Zabbix Server HA cluster feature in the Zabbix Summit Online 2021 speech dedicated to the topic.

Business service monitoring

The Services section has received a complete redesign in Zabbix 6.0 LTS. Business Service Monitoring (BSM) enables Zabbix administrators to define services of varying complexity and monitor their status.

BSM provides added value in a multitude of use cases, where we wish to define and monitor services based on:

  • Server clusters
  • Services that utilize load balancing
  • Services that consist of a complex IT stack
  • Systems with redundant components in place
  • And more

Business Service monitoring has been designed with scalability in mind. Zabbix is capable of monitoring over 100k services on a single Zabbix instance.

For our Business Service example, we used a website, which depends on multiple components such as the network connection, DB backend, Application server, and more. We can see that the service status calculation is done by utilizing tags and deciding if the existing problems will affect the service based on the problem tags.

In Zabbix 6.0 LTS there are many ways how service status calculations can be performed. In case of a problem, the service state can be changed to:

  • The most critical problem severity, based on the child service problem severities
  • The most critical problem severity, based on the child service problem severities, only if all child services are in a problem state
  • The service is set to constantly be in an OK state

Changing the service status to a specific problem severity if:

  • At least N or N% of child services have a specific status
  • Define service weights and calculate the service status based on the service weights

There are many other additional features, all of which are covered in our Zabbix Summit Online 2021 speech dedicated to Business Service monitoring:

  • Ability to define permissions on specific services
  • SLA monitoring
  • Business Service root cause analysis
  • Receive alerts and react on Business Service status change
  • Define Business Service permissions for multi-tenant environments

New Audit log schema

The existing audit log has been redesigned from scratch and now supports detailed logging for both Zabbix server and Zabbix frontend operations:

  • Zabbix 6.0 LTS introduces a new database structure for the Audit log
  • Collision resistant IDs (CUID) will be used for ID generation to prevent audit log row locks
  • Audit log records will be added in bulk SQL requests
  • Introducing Recordset ID column. This will help users recognize which changes have been made in a particular operation

The goal of the Zabbix 6.0 LTS audit log redesign is to provide reliable and detailed audit logging while minimizing the potential performance impact on large Zabbix instances:

  • Detailed logging of both Zabbix frontend and Zabbix server records
  • Designed with minimal performance impact in mind
  • Accessible via Zabbix API

Implementing the new audit log schema is an ongoing effort – further improvements will be done throughout the Zabbix update life cycle.

Machine learning

New trend functions have been added which utilize machine learning to perform anomaly detection and baseline monitoring:

  • New trend function – trendstl, allows you to detect anomalous metric behavior
  • New trend function – baselinewma, returns baseline by averaging data periods in seasons
  • New trend function – baselinedev, returns the number of standard deviations

An in-depth look into Machine learning in Zabbix 6.0 LTS is covered in our Zabbix Summit Online 2021 speech dedicated to machine learning, anomaly detection, and baseline monitoring.

New ways to visualize your data

Collecting and processing metrics is just a part of the monitoring equation. Visualization and the ability to display our infrastructure status in a single pane of glass are also vital to large environments. Zabbix 6.0 LTS adds multiple new visualization options while also improving the existing features.

  • The data table widget allows you to create a summary view for the related metric status on your hosts
  • The Top N and Bottom N functions of the data table widget allow you to have an overview of your highest or lowest item values
  • The single item widget allows you to display values for a single metric
  • Improvements to the existing vector graphs such as the ability to reference individual items and more
  • The SLA report widget displays the current SLA for services filtered by service tags

We are proud to announce that Zabbix 6.0 LTS will provide a native Geomap widget. Now you can take a look at the current status of your IT infrastructure on a geographic map:

  • The host coordinates are provided in the host inventory fields
  • Users will be able to filter the map by host groups and tags
  • Depending on the map zoom level – the hosts will be grouped into a single object
  • Support of multiple Geomap providers, such as OpenStreetMap, OpenTopoMap, Stamen Terrain, USGS US Topo, and others

Zabbix agent – improvements and new items

Zabbix agent and Zabbix agent 2 have also received some improvements. From new items to improved usability – both Zabbix agents are now more flexible than ever. The improvements include such features as:

  • New items to obtain additional file information such as file owner and file permissions
  • New item which can collect agent host metadata as a metric
  • New item with which you can count matching TCP/UDP sockets
  • It is now possible to natively monitor your SSL/TLS certificates with a new Zabbix agent2 item. The item can be used to validate a TLS/SSL certificate and provide you additional certificate details
  • User parameters can now be reloaded without having to restart the Zabbix agent

In addition, a major improvement to introducing new Zabbix agent 2 plugins has been made. Zabbix agent 2 now supports loading stand-alone plugins without having to recompile the Zabbix agent 2.

Custom Zabbix password complexity requirements

One of the main improvements to Zabbix security is the ability to define flexible password complexity requirements. Zabbix Super admins can now define the following password complexity requirements:

  • Set the minimum password length
  • Define password character requirements
  • Mitigate the risk of a dictionary attack by prohibiting the usage of the most common password strings

UI/UX improvements

Improving and simplifying the existing workflows is always a priority for every major Zabbix release. In Zabbix 6.0 LTS we’ve added many seemingly simple improvements, that have major impacts related to the “feel” of the product and can make your day-to-day workflows even smoother:

  • It is now possible to create hosts directly from MonitoringHosts
  • Removed MonitoringOverview section. For improved user experience, the trigger and data overview functionality can now be accessed only via dashboard widgets.
  • The default type of information for items will now be selected automatically depending on the item key.
  • The simple macros in map labels and graph names have been replaced with expression macros to ensure consistency with the new trigger expression syntax

New templates and integrations

Adding new official templates and integrations is an ongoing process and Zabbix 6.0 LTS is no exception here’s a preview for some of the new templates and integrations that you can expect in Zabbix 6.0 LTS:

  • f5 BIG-IP
  • Cisco ASAv
  • HPE ProLiant servers
  • Cloudflare
  • InfluxDB
  • Travis CI
  • Dell PowerEdge

Zabbix 6.0 also brings a new GitHub webhook integration which allows you to generate GitHub issues based on Zabbix events!

Other changes and improvements

But that’s not all! There are more features and improvements that await you in Zabbix 6.0 LTS. From overall performance improvements on specific Zabbix components, to brand new history functions and command-line tool parameters:

  • Detect continuous increase or decrease of values with new monotonic history functions
  • Added utf8mb4 as a supported MySQL character set and collation
  • Added the support of additional HTTP methods for webhooks
  • Timeout settings for Zabbix command-line tools
  • Performance improvements for Zabbix Server, Frontend, and Proxy

Questions and answers

Q: How can you configure geographical maps? Are they similar to regular maps?

A: Geomaps can be used as a Dashboard widget. First, you have to select a Geomap provider in the Administration – General – Geographical maps section. You can either use the pre-defined Geomap providers or define a custom one. Then, you need to make sure that the Location latitude and Location longitude fields are configured in the Inventory section of the hosts which you wish to display on your map. Once that is done, simply deploy a new Geomap widget, filter the required hosts and you’re all set. Geomaps are currently available in the latest alpha release, so you can get some hands-on experience right now.

Q: Any specific performance improvements that we can discuss at this point for Zabbix 6.0 LTS?

A: There have been quite a few. From the frontend side – we have improved the underlying queries that are related to linking new templates, therefore the template linkage performance has increased. This will be very noticeable in large instances, especially when linking or unlinking many templates in a single go.
There have also been improvements to Server – Proxy communication. Specifically – the logic of how proxy frees up uncompressed data. We’ve also introduced improvements on the DB backend side of things – from general improvements to existing queries/logic, to the introduction of primary keys for history tables, which we are still extensively testing at this point.

Q: Will you still be able to change the type of information manually, in case you have some advanced preprocessing rules?

A: In Zabbix 6.0 LTS Zabbix will try and automatically pick the corresponding type of information for your item. This is a great UX improvement since you don’t have to refer to the documentation every time you are defining a new item. And, yes, you will still be able to change the type of information manually – either because of preprocessing rules or if you’re simply doing some troubleshooting.

Deploying and configuring Zabbix 5.4 in a multi-tenant environment

Post Syndicated from Arturs Lontons original https://blog.zabbix.com/deploying-and-configuring-zabbix-5-4-in-a-multi-tenant-environment/15109/

In this post and the video, we will discuss deploying and configuring Zabbix 5.4 in a multi-tenant environment and how Zabbix is finally ready for real multi-tenant use cases thanks to multiple features.

Contents

I. Monitoring requirements of multi-tenant environments (0:30)
II. Supported monitoring approaches (2:32)

III. Zabbix and multi-tenant environment (5:56)

IV. To-do list (21:36)
V. Questions & Answers (23:32)

Monitoring requirements of multi-tenant environments

Before talking Zabbix, let us first analyze the core requirements behind multi-tenant environments. Such environments can be quite complex with a particular set of prerequisites that we have to be sure we can satisfy before continuing further.

  • The core idea behind multi-tenancy is support for multiple customers. Therefore we need to support granular role/permission schema. The ability to define different roles for different customers and limit what they can access is key to success for such deployments.
  • Multiple customers means a lot of data. No matter if we’re talking about a single Zabbix instance or scaling by deploying multiple Zabbix instances (say, for different regions) we need to have the ability to process large amounts of data. 
  • On top of that, we must be able to scale upwards, ideally – both horizontally and vertically. More customers, different requirements, varying amounts of data to process – all of this needs to be accounted for in advance.
  • Redundancy is another key factor for us. As service providers, we absolutely cannot afford any downtime or data loss. While this may be acceptable in our own home labs or classrooms, this is not the case here. Unscheduled downtime could potentially result in a loss of a customer.

Supported monitoring approaches

Now that we have covered the architectural requirements, let’s focus on data collection. No matter the monitoring solution, the easiest approach in most cases would simply be to tell our customer to deploy an agent and be done with it. Unfortunately, this often doesn’t sit will with the end user and their security team. Let us also not forget that it is simply not possible to deploy an agent on some devices or environments – what then? Having a vast selection of monitoring methods is key for successful deployment of a multi-tenant monitoring service.

Let us take a look at this in the context of Zabbix.

Agent

  • With Zabbix agents we can obtain data in two ways – in passive (polling) and active modes (trapping). This is extremely useful while working with multiple customers, since each of them will have different internal network security policies. I have personally seen cases where only one of these approaches is supported, while the other is restricted by the security policies.
  • Agents also support deployment on different platforms (Windows, Unix, etc.), as well as execution of external third-party scripts either by way of User parameters or system.run item key.
  • Active agents are also capable of reading log files and event logs on Windows environments. This can be extremely useful, since many applications, even in-house ones, can provide a lot of monitoring data by logging it.

Agent-supported deployment on various platforms


Since we need to stay flexible, there are many other monitoring approaches supported by Zabbix that we can utilize:

  • SNMP, HTTP, IPMI and SSH agentless monitoring.
  • Simple checks (ICMP pings, port statuses).
  • Database and Java application monitoring.
  • External scripts (executed by the Zabbix server, Zabbix proxy or Zabbix agent).
  • Aggregations and calculations of existing data.
  • VMware monitoring and integration.
  • Web monitoring by creating web scenarios.
  • Synthetic monitoring for simulating real life user transactions.

Latest improvements

Why are we putting emphasis on multi tenancy just now? The reason is a couple of great features added in the last few releases. These features can finally allow us to utilize Zabbix in a truly multitenant environment:

Added in Zabbix 5.2:

  • Ability to create customizable user roles based on user types;
  • Secrets can now be stored in an, highly secure external vault;
  • Improvements in configuring frontend were also added. For example, each user can now select their time zone for frontend data display. This will be relevant for users in different geographical locations.

Added in Zabbix 5.4:

  • Users now have the ability to send scheduled reports. This is extremely useful for customers who may wish to receive scheduled reports about their environments. Now, instead of utilizing third-party scripts to export data and generate reports, you can use the native Zabbix functionality.
  • Major performance improvements have also been added, especially for really large instances with tens of thousands of new incoming values per second.

Zabbix and multi-tenant environment

How do we use Zabbix in a multi-tenant environment? Essentially, we provide Zabbix as a service. We use the Zabbix monitoring tool to monitor our clients (ABC and BCD in the image). We monitor their network traffic, their operating system statistics, application statistics, log files, etc. For each tenant, these monitoring requirements are going to be different.

Multi-tenant environment

Zabbix proxy

Multi-tenancy would not be possible without Zabbix proxies. With Zabbix proxies we can deploy them in customer offices, data centers, organization branches and collect data locally. Since proxies also perform preprocessing, we can even utilize them to transform and normalize metrics or even discard some of the collected metrics before forwarding them to the central Zabbix backend server.

  • Proxies are capable of performing preprocessing ever since Zabbix version 5.0. This allows us to normalize and transform data, for example – change our textual data to numeric data, use throttling and other pre-processing approaches. Even custom JavaScript is supported nowadays to format or normalize the data before we send it to our central Zabbix backend server. So, instead of the server being responsible for all of the preprocessing and having quite a large preprocessing overhead, now the proxy can do it and then forward the data to the server.
  • In addition, on the proxy, the data gets compressed before forwarding to the server thus saving some network traffic overhead.
  • The proxy still continues collecting data and storing it in its own database even in case of a network outage on the customer’s site.
  • Once we collect the data by the proxy, it gets sent to the server via a single connection, which is a lot more feasible from the network security perspective. In this case we need to create only a single firewall rule as opposed to a wide array of rules if we were to monitor the customer’s site directly from the central Zabbix backend server.
  • We can execute remote scripts on the proxy.
  • We can also deploy multiple proxies to improve scalability. If a single proxy cannot handle the amount of data that we are gathering or preprocessing, we can always deploy an extra proxy. They are easy to deploy, and can even use out-of-the-box SQLite databases.

Passive and active proxies

With proxies can also select the direction of the connection. We can deploy passive proxies, which get polled by the Zabbix backend server. In that case, the Zabbix server pulls the data from the proxy. In this scenario the Zabbix server is the one responsible for establishing the connection to the proxy. This adds a minor performance overhead to the Zabbix backend server. On the other hand, we can also deploy active proxies, where we remove that overhead from the server and proxy sends the data autonomously to the server.

At the end of the day, similar to how it goes with agent requirements, the proxy mode will depend on the security policies of the customer. Don’t forget that we aren’t restricted to a single type of proxy –  we can have both of these proxy types running at the same time.

Selecting the connection direction

Data preprocessing — throttling

Preprocessing can help us not only normalize our data, but we can also utilize it to save up on storage and performance overhead, which is vital in large environments.

When monitoring a service or an application state, we are going to be obtaining discrete values such as 1, 2, or 3, or any number. These numbers have a tendency to repeat – if our server stays up, we are going to continue receiving a number which represents “Up”. By using the preprocessing method called throttling, we can decrease the amount of these numbers stored by discarding repeating values. Only status changes are stored, therefore we can potentially save some database space and remove unneeded data processing overhead.

Discarding unchanged values


At this point in time, this feature sees more and more usage in many Zabbix environments, though it was severely underutilized initially when Zabbix 5.0 came out. So, if you aren’t using throttling yet and you’re running on 5.0 or newer, I definitely suggest trying to implement it to some extent. It is available in Preprocessing section of the item configuration.

Permissions

Robust permission design is essential to a multi-tenant environment. Even though permission logic has seen an addition of roles, the user group to host group relations haven’t been abandoned and still play vital role in overall permission schema.

With roles we still have to utilize the three user types – Users, Admin, and Super admins.

User role overview

Here you can see the user role and the UI elements the user has access to together with API restrictions and the actions the user can perform.

Roles grant the ability to configure access to specific UI elements, actions and restrict API calls in a granular fashion. So, when you’re configuring a role, you will see a screen similar to the one below:

Configuring user roles

User roles

Here you can select User type. The user type restrictions still apply. Users can get access only to Monitoring and Inventory, Admins can get access to except the Administration section, and Super admins can get access to every section, including Administration.

With roles we can further restrict these user types. You can have Super admins with some limitations, so that they could only do specific actions and access specific UI sections.

This option has two core benefits. The first one is security as we can limit what our customers can do and what they can access. The other benefit is in the UX, as we can simplify the UI for our users, especially people not experienced with Zabbix. We can restrict the visibility of the sections that the end users don’t have access to, so they will not be concerned with navigating through multiple sections and subsections that they are not familiar with.

User groups

We still have user groups and user groups to host groups relations, which we have to take into consideration. Access to hosts is defined on User groups. So, we have to define our user groups and assign Full/Read only/Deny permissions on particular host groups. This is how we limit what specific customers can access.

User groups

In addition, we can have host groups defined in a hierarchical manner. For instance, if you have two customers each of then having a “Network Devices” subgroup, we can select to include the root group and all of its subgroups when assigning user group to host group permissions. This is a really elegant and quick way to give a User or an Admin on the customer’s side access to all of their hosts or limit a specific organizational unit to only access what they need, e.g.: only permit access to network devices for network administrators.

Using group hierarchy

High availability

The next important decision is the HA implementation. Going without some sort of HA solution is simply too risky and therefore is not an option with such environments.

  • HA can be used to minimize downtime and add redundancy.
  • Zabbix supporst Linux HA tools – PCS, Corosync, Pacemaker, which are used to enable HA. You are also welcome to try and use other third-party tools for HA.
  • Out-of-the-box HA is planned for Zabbix 6.0.

HA setup

To achieve a quorum in our HA environment, we will require an odd number of nodes. For Zabbix backend HA it is very much recommended to have at least three nodes. Does that mean that you have to deploy 3 Zabbix servers? Not really – our third node is going to be a really small arbitration node, which is simply going to be checking connections to the two other Zabbix nodes and giving a vote to achieve quorum in case of issues with one of the nodes.

In the end we will have three nodes:  Zabbix server A, Zabbix server B, and the Arbiter node

  • An odd number of nodes is recommended to achieve quorum.
  • Only Active/Passive cluster architecture is supported.
  • We cannot have two Zabbix nodes active running at the same time and talking to the same database. It is important to use some ‘shoot the other node in the head’ mechanism — STONITH to avoid such split-brain scenarios.

Failure to abide by these requirements can result in issues with database consistency, issues with underlying queries and cleaning up or inserting data. This can cause unexpected Zabbix backend server crashes down the line.

In addition, it is very common to have a requirement for proxies to be deployed with HA. Before implementing HA for proxies, we need to decide if we really do need it. HA adds a significant configuration management overhead. We can have hundreds if not thousands of proxies, and managing HA for each of those can add a significant overhead. Of course, the more comfortable you feel with the HA tools, the easier the deployment and the management of the environment.

Another approach for  Zabbix proxy HA can also be implemented by using Zabbix API scripts. We can essentially have two proxies running without the need to have the HA suite. In this case, if proxy A is down, we can use Zabbix API to move a host from proxy A to proxy B.

Using Zabbix API script to change the proxy

Here, host.massupdate is used to change the proxy on the hosts. Combine this with a robust scripting logic and you end up with a very viable approach to move your hosts between proxies in failover scenarios.

Database replication

We have covered the HA for Zabbix server backend and let’s remember that with frontend servers, we can simply bring up additional frontends, for instance, by utilizing Docker containers. But what about the DB redundancy?

  • Database replication can be used as a form of redundancy for the Zabbix DB. No matter the DB backend – Postgres, MySQL, Oracle, we can deploy multiple DB nodes and utilize the native DB replication or use third-party tools for replication, for instance, Galera Cluster.
  • I personally prefer using native replication tools as it is a bit more simple and you don’t have to concern yourself with another configuration and management layer that could potentially fail and be a bother to troubleshoot. But this will depend on your requirements, design and skillset.

Let’s look at an example with MySQL replication. You can set it up in many different ways as multiple replication approaches are supported: master/slave, master/master, or even have multiple masters replicating to one another. It is completely up to you how to implement replication, especially if you are already experienced with such deployments.

Which approach is best? At the end of the day it will all depend on your company policies, database backend and a compromise between simplicty and extra redundancy. I definitely suggest delving deeper and studying use cases and articles for the DB backend of your choice, before you decide to go with any particular approach.

Database replication

Database performance tuning

Database tuning is vital for the long term stability of your Zabbix instance. The database defaults might be sufficient for your home office, but for large multi-tenant environments with tens of thousands new values per second they will not suffice. The database defaults depend on the database backend and the database version used, but ideally, these should be tuned and tested, preferably during the design stage, before you have deployed your Zabbix instance in production.

After installing the database backend we need to take a look at the hardware resources available. Ideally, you have already estimated the hardware resources required for your instance and ensured that DB hosts have sufficient memory, CPU resources and storage has been selected according to the I/O requirements. Now, you can move on to tuning your database backend.

As an example with Postgres I used PGTune — an online database tuning tool. This is a simple estimate that should still provide you with a somewhat adequate configuration. Though ideally, you should have a DBA on board that is aware of what kind of data loads you will be dealing with to help you with an optimal database configuration.

Database performance tuning

History table partitioning

In such large environments, you will most likely see that housekeeper cannot keep up with the amount of data stored, unable to clean it up in a timely fashion with the housekeeper processes utilization reaching reaching 100 percent for 20-30 minutes at a time. This will have a negative effect on the overall database performance for the duration of housekeeping.

At this point, it is recommended to implement partitioning for history/trend tables. We can use Postgres with TimescaleDB plugin for this. Partitioning is supported out of the box, and you can configure it in Administration > General > Housekeeping.

For MySQL and Oracle backends we would have to rely on custom partitioning scripts or procedures. In addition, community-provided partitioning scripts are publicly available.

As always – don’t forget to test 3rd party scripts in a test environment before deploying it in production!

Community partitioning solution for MySQL

You can always create your own partitioning script, but you should be aware of what you’re doing and how things should be partitioned. We should always be partitioning only history and trend tables.

History table partitioning with TimescaleDB

  • TimescaleDB plugin for PostgreSQL DB backends supports out-of-the-box partitioning. You don’t have to rely on community scripts.
  • On TimescaleDB, we need to specify the chunk_time_interval parameter, which will define the partition chunk size.
  • In addition, we can also add compression of history/trends, which helps to reduce the history table size by 60-80 percent. Again, in such scenarios, your database is going to be huge — terabytes in size with hundreds of customers, each having thousands of metrics per second. So, compression is a really valuable asset.
  • The only thing we have to take into account is that compressed data is read-only and cannot be changed post-compression. So, no more changes or inserts are possible for the compressed chunks.

History and trends compression

To-do list

  • Deploy the latest available Zabbix version. Ideally stick with an LTS version.
  • Deploy proxy servers, define and configure HA/Replication on Zabbix proxies, as well as on Zabbix servers and databases.
  • Implement partitioning to improve database performance.
  • Implement throttling to reduce the volume of the incoming data.
  • Tune your database! Either use online guides or consult with your DBA.

With our to-do list completed, we can have our Zabbix environment with deployed with redundancy in mind, providing monitoring as a service for hundreds of customers, multiple proxies running for each of the customers, HA in place, and Zabbix performing up to our expectations.

Questions & Answers

Question. Will Zabbix have its native HA solution? Will it be the whole package or does it involve installing individual components and maintaining them?

Answer. It’s planned on the roadmap to have a native HA solution in Zabbix 6.0. You should be able to get your hands on it when the 6.0 beta version gets released. Hopefully, you’ll be able to get your hands on it, test it out yourselves and give us feedback. From the looks of it it should be very much plug-and-play and will remove a lot of management overhead when comparing it with current HA implementation. Right now this is being developed only for the Zabbix backend server. As for the frontend – nothing is stopping you from having multiple frontends pointed at the same DB/Zabbix backend server. 

Question. Can I run Zabbix on a single server and sell monitoring service to several customers with fully isolated environments, not just GUI, but also items, triggers, etc.

Answer. Yes, you can. You can have a single Zabbix instance and multiple customers being monitored by this instance. The only extra step that might be required is deploying proxies on the customer’s side. By using permission restrictions, proxy servers, roles, etc., we can then monitor multiple customers from a single Zabbix instance.

Question. When we change proxy, the agent configuration has to be updated. What about HA configuration on the proxy?

Answer. That really depends on the approach. If the agent is getting pointed at the virtual IP address and HA is managed by PCS, Corosync, or Pacemaker, then it should be fine as is and the VIP should just be on the currently active host. So, you’ll be essentially rerouted. With the HA by way of API approach, you can simply allow your agent to accept connections from both proxies. With ServerActive we can also specify multiple endpoints, so agents can actually be prepared for such an environment.

Question. How to merge two different instances into a single monitoring instance?

Answer. This is a complex task. First off, both instances need to have the same major Zabbix backend version. You might simply migrate the history from one instance to another, but then you will have some problems with underlying element IDs. So, in one instance you have your own set of items, triggers, users, etc. with your own set of IDs. These will most likely conflict with the set of IDs on the other instance.

You can do partial migration or use the export function to export your templates, hosts, value maps, network maps. I would try to export as much as I can as migration on SQL level will be a real pain. It is possible if you’re stubborn enough, but it can end up being a really complex task that can take days if not weeks to fully implement and test.

Question. Do subgroups relate to templates as well?

Answer. Subgroups relate to templates in a way where we can also define permissions to reading and modifying templates. For templates, you can also create per-customer templates and assign them to host groups. Users that have access to these host groups can then read or modify the templates.