Tag Archives: high availability

Keeping Remote Teams Connected: The Zabbix Advantage

Post Syndicated from Michael Kammer original https://blog.zabbix.com/keeping-remote-teams-connected-the-zabbix-advantage/27551/

The popularity of remote teams may have exploded in popularity during the COVID-19 pandemic, but it’s not a phenomenon that’s likely to trend downward anytime soon. High-profile organizations like 3M, Dropbox, Shopify, and LinkedIn are continuing to enthusiastically embrace remote working, essentially making it the “default setting” for their employees.

The shift toward remote working is not without its challenges, however. Organizations of all sizes often have little time to set up the kind of networking infrastructure and efficient processes that make sure remote workers are just as connected and productive as their on-site counterparts. In this article, we’ll take a quick look at some of the most important network monitoring challenges that remote teams face and show how Zabbix can help you tackle them as efficiently as possible.

Infrastructure and connectivity issues

A remote network is essentially a grouping of multiple smaller network setups, each with their own set of variables that can affect performance. The differences between network system and infrastructure quality at different remote destinations can often lead to low overall network performance, which in turn makes it a challenge to provide the kind of high-speed communication needed to run the remote automation tools and software applications used by remote employees and teams.

By providing straightforward and easy-to-understand visibility into a network’s connected devices and how data moves between them, Zabbix makes it easy to automatically compare data and identify any drop in network performance.

With Zabbix, you can easily keep an eye on network routers and switches, especially internet provider and uplink ports up/down. You can also monitor network latency, the error rate on ports, the packet loss to important devices, and network utilization on important ports with net.if.in/net.if.out. Here are some example triggers:

High Network Utilization: avg(/Router ABC/net.if.in[eth0],5m)>80MB
High Packet Loss: avg(/Router ABC/icmppingloss,5m)>5
High Latency: avg(/Router ABC/icmppingsec,5m)>0.1

What’s more, Zabbix allows you to create network maps with important network devices and real-time data, as well as dashboards with maps and single item/gauge widgets, all of which makes it far easier to achieve the uninterrupted connectivity that remote teams depend on.

Staying safe

Remote locations aren’t islands that can be completely isolated from external traffic. Staying vigilant and doing everything possible to eliminate data breaches is important, and taking advantage of strong encryption methods, network scanning tools, and firewalls to protect your systems is a good start. However, using a whole suite of tools to protect security can add more difficulty when it comes to integrating and monitoring them.

With Zabbix, you can count on enterprise-grade security, including encrypted communication between components, a flexible user permission schema that can be easily applied to a distributed environment, and custom user roles with a granular set of permissions for different types of users.

Zabbix also provides native support for HTTP, LDAP, and SAML authentication (which gives you an additional layer of security and improves your user experience while working with Zabbix), the ability to restrict access to sensitive information by limiting which metrics can be collected in your environment, and the ability to track changes in your environment by utilizing the Audit log. It’s all designed to make sure that there are no compromises on the security of your data when you decide to go remote.

Scalability

As a remote organization grows and its distributed systems expand, a good monitoring solution needs to be able to grow along with it in order to prevent gaps in coverage while maintaining performance and reliability. Zabbix gives you limitless scalability in the form of Zabbix proxies, which act as independent intermediaries that collect performance and availability data on behalf of a Zabbix server. You can roll out new proxies as fast as you need them, and because Zabbix is free and open source, you don’t have to worry about additional licensing costs.

Zabbix proxies allow you to see at a glance what resources are being used on your network at any given moment, which is especially handy if, like most remote teams, you have tens or even hundreds of servers and network appliances to monitor. You can also execute remote commands in remote locations – either on the proxies themselves or on the agents monitored by the proxy, and multiple frontends can be deployed for load balancing as well as for improved security and connectivity. Proxy docker containers and cloud options are available as well, enhancing flexibility and making Zabbix ideal for any organization that spans the globe (or aspires to).

Managing multiple solutions

The legacy software and systems you use were most likely designed to work in a traditional networking model. Remote working, as we’ve seen, presents a whole new range of challenges when it comes to compatibility and support.

We’ve created Zabbix to be as easy as possible to integrate with existing systems. You can easily monitor any operating system, cloud service, IP telephony service, docker container, or web server/database backend. We provide out-of-the-box monitoring for the world’s leading hardware and software vendors, and our extensively documented API makes it easy to create workflows and integrate with other systems. In addition, you can also integrate Zabbix with the most popular helpdesk, messaging, and ITSM systems, such as Slack, Jira, MS Teams, and many others.

Not only that, Zabbix is designed to serve as the ideal monitoring solution for multi-tenant environments. It serves as a single pane of glass for your entire infrastructure, and it’s easy to visualize everything that’s happening with your network with unique maps, dashboards, and templates.

Conclusion

The days of large teams all working together under the same roof are a thing of the past – the remote working trend will only accelerate as technology improves and employees get more accustomed to working with colleagues across multiple locations. That’s why it’s of paramount importance to make sure your monitoring solution has the built-in flexibility and scalability to grow with your team and your business.

If you want to see for yourself how Zabbix can help you effectively monitor a globally distributed network, contact us.


The post Keeping Remote Teams Connected: The Zabbix Advantage appeared first on Zabbix Blog.

Technical Support: The Zabbix Advantage

Post Syndicated from Michael Kammer original https://blog.zabbix.com/technical-support-the-zabbix-advantage/26709/

If you’ve ever been part of a technical support team (or dealt with technical support as a customer, for that matter) you’re aware that there are as many different types of technical support teams as there are types of businesses.

However, there are a few best practices that all technical support teams share, no matter what industry they’re in. Read on to learn a bit more about them and see how our technical support team at Zabbix embodies each one.

Offer omnichannel technical support

Omnichannel support is the practice of providing support across every touchpoint that a customer uses to interact with your business. It’s not to be confused with multi-channel support, where teams work in silos and have little or no interaction.

Omnichannel support provides a unified experience across different channels, including email, phone, live chat, in-app chat, etc. Customers can start a conversation on any channel, at any time, and pick it up from where they left off on any other channel, any other time. Businesses can keep all customer data in the form of contacts inside a single platform, so that their support representatives can address issues with the proper context.

The goal of our technical support service at Zabbix has always been to provide responsive, dependable, quality support to resolve any issues regarding the installation, operation, and use of Zabbix.

Our specialists also leverage their skills, experience, and proximity to the design and development teams pass along the kind of helpful hints, tips, and tricks that help customers get the most out of their Zabbix installation.

The backbone of our support delivery is the Zabbix Support System. Available to every Zabbix customer, it guarantees swift and easy communication between customers and our technical specialists.

Email and remote sessions can be used to communicate with Zabbix support at any time.  Customers with our Global or Enterprise support tiers can access support services by phone or take advantage of on-site visits anywhere in the world by lead technical engineers.

No matter the channel, there’s no guesswork involved – all information is automatically entered into the support system to keep track of issues and resolutions.

Set realistic SLAs and stick to them

Service level agreements (SLAs) are critical to technical support performance. They help set clear expectations for both the service provider and the customer by outlining what services will be provided, how they will be delivered, and the expected level of performance. This gives everyone involved a clear understanding of what to expect, prevents any misunderstandings, and makes sure that the customer’s needs are being met.

SLAs also provide a way to measure the performance of the service provider. By defining metrics and targets, both parties can track the provider’s performance and make sure that they’re meeting the agreed-upon standards. This can help identify areas for improvement and provide a way to hold the service provider accountable if they don’t meet their obligations.

Here at Zabbix, we don’t just meet our SLAs – we exceed them by getting to the root cause of customer issues and providing extensive documentation with the aim of making sure they don’t happen again.

Our support goes far beyond the support of Zabbix as software – we do our best to support the whole monitoring infrastructure, which in some cases can even mean troubleshooting issues that are only tangentially connected to Zabbix as a monitoring system.

That might involve architecture questions, best practices in gathering data from one or another data source, or helping a customer understand and optimize some third-party scripts. No matter what the case may be, we do our best to help.

Listen to what customers need and communicate effectively

As anyone who’s ever contacted technical support knows, the best support isn’t necessarily provided by someone with genius level knowledge who understands every function of a product in minute detail.

For efficient technical support, communication skills are just as vital as technical knowledge. Specialists need to listen first, ask questions to confirm that they understand the problem, and restate what they’ve heard to give the customer the opportunity to provide more information. Above all, they need to speak to the customer’s level of understanding, avoiding jargon and needless details.

Our technical support team sees itself as a bridge between the customer’s needs and the solutions we provide. A key principle of technical support at Zabbix is the notion that the information our customers are sharing with us is precious. The way we see it, our customers give us valuable insights into what’s working in our product and what isn’t.

Listening carefully to the different support queries that we get allows us to form a complete feedback loop between our users and our solutions. For example, if our support team notices issues with collecting specific types of data or monitoring particular endpoints, they can prevent further queries by including a link to our FAQ section while our developers work to fix the issue.

Help customers help themselves

In technical support as in life, self-help is often the best help. It may seem illogical, but the best technical support is usually when the customer is either not asking for help or is able to help themselves.

Allowing customers to perform self-service saves them the time needed to call in or submit an online ticket, and it also improves turnaround time and serves them in the channel they prefer.

Giving customers the tools to be self-sufficient has been a part of our technical support philosophy at Zabbix from day one, and we’re fortunate to have a dedicated and devoted user community to help us do it.

Our users regularly post troubleshooting articles on our blog, and all official product documentation (including an extensive FAQ section) is available on our website. What’s more, our employees make a habit of sharing their knowledge on community Telegram channels, on-site and virtual meetups, and free webinars.

The official Zabbix forum is also a great place to go for support. Customers can interact with each other and get their problems solved easily. No matter what the issue, there’s a good chance that somebody somewhere has experienced it as well and may have a clever workaround or trick to share.

Self-help has limits, however. Your data and infrastructure are the core of your business, and some things are simply best left to experts. That’s why it’s a good idea to add to your knowledge via our official training sessions and have your most urgent issues taken care of by the skilled professionals on our support team. 

Embrace automation where it makes sense to do so

Not all technical support tasks can or should be automated. Most require complex problem-solving, creativity, and emotional intelligence. Others are repetitive, simple, or predictable. It’s important to identify the best use cases for automation based on what the customer expects, the nature and value of the task, and what resources are available.

Our philosophy at Zabbix has always been that there’s no substitute for the human element when it comes to technical support. Our customers trust us to handle complicated, urgent, and sensitive issues, and there’s no substitute for the hands-on assistance that our support team can provide. It’s why we take great pains to make sure that all our team members display soft skills like interpersonal communication, personality traits, and social awareness.

However, we also harness the power of automation to assist with lower-level and more menial tasks, such as ticket assignment and processing counts. Thanks to automation, our specialists don’t need to manually grab tickets from a pool. Instead, everything is automated based on the calendar and who is working on a particular shift.

The ultimate goal is always the same – choosing the best automation path for the particular task at hand so that the customer’s issue gets resolved as quickly as possible with a minimum of disruption.

Conclusion

At Zabbix, we see our role as solving problems, not questions. 95.7% of our resolved support tickets receive positive reviews, and it’s because of the hard work, dedication, knowledge, and soft skills of our support team, as well as their goal of providing sustainable growth, long-term success, and measurable outcomes.

Our support team is a truly global entity that can provide round-the-clock support, and it’s made up of highly skilled Zabbix professionals, experts, and trainers who can boast years or even decades of Zabbix experience. 

We offer multiple support tiers at a variety of price points, so you can be sure that no matter what the support needs of your organization happen to be, we have a plan that will fit perfectly.
Contact us to learn more and find the support tier that’s right for you.

The post Technical Support: The Zabbix Advantage appeared first on Zabbix Blog.

What is Server Monitoring? Everything You Need to Know

Post Syndicated from Michael Kammer original https://blog.zabbix.com/what-is-server-monitoring-everything-you-need-to-know/26617/

Servers are the foundation of a company’s IT infrastructure, and the cost of server downtime can include anything from days without system access to the loss of important business data. This can lead to operational issues, service outages, and steep repair costs.

Viewed against this backdrop, server monitoring is an investment with massive benefits to any organization. The latest generation of server monitoring tools make it easier to assess server health and deal with any underlying issues as quickly and painlessly as possible.

What are servers, and how do they work?

Servers are computers (or applications) that run software services for other computers or devices on a network. The computer takes requests from the client computers or devices and performs tasks in response to the requests. These tasks can involve processing data, providing content, or performing calculations. Some servers are dedicated to hosting web services, which are software services offered on any computer connected to the internet.

What is server monitoring? Why does it matter?

Servers are some of the most important pieces of any company’s IT infrastructure. If a server is offline, running slowly, or experiencing outages, website performance will be affected and customers may decide to go elsewhere. If an internal file server is generating errors, important business data like accounting files or customer records could be compromised.

A server monitoring system is designed to watch your systems and provide a number of key metrics regarding their operation. In general, server monitoring software tests for accessibility (making sure that the server is alive and can be reached) and response time (guaranteeing that it is running fast enough to keep users happy). What’s more, it sends notifications about missing or corrupt files, security violations, and other issues.

Server monitoring is most often used for processing data in real time, but quality server monitoring is also predictive, letting users know when disks will reach capacity and whether memory or CPU utilization is about to be throttled. By evaluating historical data, it’s possible to find out if a server’s performance is degrading over time and even predict when a complete crash might occur.

How can server monitoring help businesses?

Here are a few of the most important business benefits of server monitoring:

Server monitoring tools give you a bird’s-eye view of your server’s health and performance

A quality server monitoring tool keeps IT administrators aware of metrics like CPU usage, RAM, disk space, and network bandwidth. This helps them to see when servers are slowing down or failing, allowing them to act before users are affected.

Server monitoring simplifies process automation

IT teams have long checklists when it comes to managing servers. They need to monitor hard disk space, keep an eye on infrastructure, schedule system backups, and update antivirus software. They also need to be able to foresee and solve critical events, while managing any disruptions.

A server monitoring tool helps IT professionals by automating all or many aspects of these jobs. It can show whether a backup was successful, if software is patched, and whether a server is in good condition. This allows IT teams to focus on tasks that benefit more from their involvement and expertise.

Server monitoring makes it easier to retain customers as well as employees

Acting quickly when servers develop issues (or even before) makes sure that employee workflows aren’t disrupted, allowing them to perform their duties, see results, and reach their goals. It also guarantees a positive customer experience by providing early notification of any issues.

Server monitoring keeps costs down

By automating processes and tasks (and freeing up time in the process) server monitoring systems make the most of resources and reduce costs. And by solving potential issues before they affect the organization, they help businesses avoid lost revenue from unfinished employee tasks, operational delays, and unfinished purchases.

What should you look for in a server monitoring solution?

Now that you’re sold on the benefits of server monitoring, you’ll want to choose the server monitoring solution that’s right for you. Here are a few capabilities to keep in mind:

Ease of use

Does the solution include an intuitive dashboard that makes it easy to monitor events and react to problems quickly? It should, and it should also allow you to make the most of the data it exports by providing graphs, reports, and integrations.

Customer support

Is it easy to contact support? How quickly do they respond? A quality server monitoring solution will provide a defined SLA and stick to it with no exceptions.

Breadth of coverage

A good solution will support all the server types (hardware, software, on-premises, cloud) that your enterprise uses. It should also be flexible enough to support any server types you may implement in the future.

Alert management

There are a few important questions to ask when it comes to alerts:

  • Does the solution include a dashboard or display that makes it easy to track events and react to problems quickly?
  • Is it easy to set up alerts via the configuration of thresholds that trigger them? How are alerts delivered?
  • Does the solution have a way to help you determine why a problem has occurred, instead of just telling you that something has gone wrong without context?

What are some best practices to keep in mind?

Here are a few best practices that will help you avoid the more common server monitoring pitfalls:

Proactively check for failures

Keep a sharp eye out for any issues that may affect your software or hardware. The tools included with a good monitoring solution can alert you to errors caused by a corrupted database (for example) and let you know if a security incident has left important services disabled.

Don’t forget your historical data

Server problems rarely occur in a vacuum, so look into the context of issues that emerge. You can do that by exploring metrics across a specific period, typically between 30 to 90 days. For example, you may find that CPU temperature has increased within the past week, which may suggest a problem with a server cooling system.

Operate your hardware in line with recommended tolerance levels

File servers are commonly pushed to the limit, rarely getting a break. That’s why it’s important to monitor metrics like CPU utilization, RAM utilization, storage capacity usage, and CPU temperature. Check these metrics regularly to identify issues before it’s too late.

Keep track of alerts

Always monitor your alerts in real time as they occur and explore reliable ways to manage and prioritize them. When escalating an incident, make sure it goes to the right individual as soon as possible.

Use server monitoring data to plan short-term cloud capacity

Server monitoring systems can help you plan the right computing power for specific moments. If services become slower or users experience other problems with performance, an IT manager can assess the situation through the server monitor. They’ll then be able to allocate extra resources to solve the problem.

Take advantage of capacity planning

Data center workloads have almost doubled in the past 5 years, and servers have had to keep up with this ongoing change. Analyzing long-term server utilization trends can prepare you for future server requirements.

Go beyond asset management

With server monitoring, you can discover which systems are approaching the end of their lives and whether any assets have disappeared from your network. You can also let your server monitoring tool handle the heavy lifting for you when it comes to tracking physical hardware.

The Zabbix Advantage

Zabbix is designed to make server monitoring easy. Our solution allows you to track any possible server performance metrics and incidents, including server performance, availability, and configuration changes.

Intuitive dashboards, network graphs, and topology maps allow you to visualize server performance and availability, and our flexible alerting allows for multiple delivery methods and customized message content.

Not only that, our out-of-the-box templates come with preconfigured items, triggers, graphs, applications, screens, low-level discovery rules, and web scenarios – all designed to have you up and running in just a few minutes.

And because Zabbix is open-source, it’s not just affordable, it’s free. Contact us to find out more and enjoy the peace of mind that comes from knowing that your servers are under control.

FAQ

Why do we need server monitoring?

Server monitoring allows IT professionals to:

  • Monitor the responsiveness of a server
  • Know a server’s capacity, user load, and speed
  • Proactively detect and prevent any issues that might affect the server

Why do companies choose to monitor their servers?

Companies monitor servers so that they can:

  • Proactively identify any performance issues before they impact users
  • Understand a server’s system resource usage
  • Analyze a server for its reliability, availability, performance, security, etc.

How is server monitoring done?

Server monitoring tools constantly collect system data across an entire IT infrastructure, giving administrators a clear view of when certain metrics are above or below thresholds. They also automatically notify relevant parties if a critical system error is detected, allowing them to act in a timely manner to resolve issues.

What should you monitor on a server?

Key areas to monitor on a server include:

  • A server’s physical status
  • Server performance, including CPU utilization, memory resources, and disk activity
  • Server uptime
  • Page file usage
  • Context switches
  • Time synchronization
  • Process activity
  • Server capacity, user load, and speed

If I want to monitor a server, how easy is it to set things up?

Setting up a server monitoring tool is easy, provided you’ve taken into account these 5 steps:

  • Assess and create a monitoring plan
  • Discover how data can be collected
  • Define any and all metrics
  • Set up alerts
  • Have an established workflow

The post What is Server Monitoring? Everything You Need to Know appeared first on Zabbix Blog.

Curbing Connection Churn in Zuul

Post Syndicated from Netflix Technology Blog original https://netflixtechblog.com/curbing-connection-churn-in-zuul-2feb273a3598

By Arthur Gonigberg, Argha C

Plaintext Past

When Zuul was designed and developed, there was an inherent assumption that connections were effectively free, given we weren’t using mutual TLS (mTLS). It’s built on top of Netty, using event loops for non-blocking execution of requests, one loop per core. To reduce contention among event loops, we created connection pools for each, keeping them completely independent. The result is that the entire request-response cycle happens on the same thread, significantly reducing context switching.

There is also a significant downside. It means that if each event loop has a connection pool that connects to every origin (our name for backend) server, there would be a multiplication of event loops by servers by Zuul instances. For example, a 16-core box connecting to an 800-server origin would have 12,800 connections. If the Zuul cluster has 100 instances, that’s 1,280,000 connections. That’s a significant amount and certainly more than is necessary relative to the traffic on most clusters.

As streaming has grown over the years, these numbers multiplied with bigger Zuul and origin clusters. More acutely, if a traffic spike occurs and Zuul instances scale up, it exponentially increases connections open to origins. Although this has been a known issue for a long time, it has never been a critical pain point until we moved large streaming applications to mTLS and our Envoy-based service mesh.

Fixing the Flows

The first step in improving connection overhead was implementing HTTP/2 (H2) multiplexing to the origins. Multiplexing allows the reuse of existing connections by creating multiple streams per connection, each able to send a request. Rather than requiring a connection for every request, we could reuse the same connection for many simultaneous requests. The more we reuse connections, the less overhead we have in establishing mTLS sessions with roundtrips, handshaking, and so on.

Although Zuul has had H2 proxying for some time, it never supported multiplexing. It effectively treated H2 connections as HTTP/1 (H1). For backward compatibility with existing H1 functionality, we modified the H2 connection bootstrap to create a stream and immediately release the connection back into the pool. Future requests will then be able to reuse the existing connection without creating a new one. Ideally, the connections to each origin server should converge towards 1 per event loop. It seems like a minor change, but it had to be seamlessly integrated into our existing metrics and connection bookkeeping.

The standard way to initiate H2 connections is, over TLS, via an upgrade with ALPN (Application-Layer Protocol Negotiation). ALPN allows us to gracefully downgrade back to H1 if the origin doesn’t support H2, so we can broadly enable it without impacting customers. Service mesh being available on many services made testing and rolling out this feature very easy because it enables ALPN by default. It meant that no work was required by service owners who were already on service mesh and mTLS.

Sadly, our plan hit a snag when we rolled out multiplexing. Although the feature was stable and functionally there was no impact, we didn’t get a reduction in overall connections. Because some origin clusters were so large, and we were connecting to them from all event loops, there wasn’t enough re-use of existing connections to trigger multiplexing. Even though we were now capable of multiplexing, we weren’t utilizing it.

Divide and Conquer

H2 multiplexing will improve connection spikes under load when there is a large demand for all the existing connections, but it didn’t help in steady-state. Partitioning the whole origin into subsets would allow us to reduce total connection counts while leveraging multiplexing to maintain existing throughput and headroom.

We had discussed subsetting many times over the years, but there was concern about disrupting load balancing with the algorithms available. An even distribution of traffic to origins is critical for accurate canary analysis and preventing hot-spotting of traffic on origin instances.

Subsetting was also top of mind after reading a recent ACM paper published by Google. It describes an improvement on their long-standing Deterministic Subsetting algorithm that they’ve used for many years. The Ringsteady algorithm (figure below) creates an evenly distributed ring of servers (yellow nodes) and then walks the ring to allocate them to each front-end task (blue nodes).

The figure above is from Google’s ACM paper

The algorithm relies on the idea of low-discrepancy numeric sequences to create a naturally balanced distribution ring that is more consistent than one built on a randomness-based consistent hash. The particular sequence used is a binary variant of the Van der Corput sequence. As long as the sequence of added servers is monotonically incrementing, for each additional server, the distribution will be evenly balanced between 0–1. Below is an example of what the binary Van der Corput sequence looks like.

Another big benefit of this distribution is that it provides a consistent expansion of the ring as servers are removed and added over time, evenly spreading new nodes among the subsets. This results in the stability of subsets and no cascading churn based on origin changes over time. Each node added or removed will only affect one subset, and new nodes will be added to a different subset every time.

Here’s a more concrete demonstration of the sequence above, in decimal form, with each number between 0–1 assigned to 4 subsets. In this example, each subset has 0.25 of that range depicted with its own color.

You can see that each new node added is balanced across subsets extremely well. If 50 nodes are added quickly, they will get distributed just as evenly. Similarly, if a large number of nodes are removed, it will affect all subsets equally.

The real killer feature, though, is that if a node is removed or added, it doesn’t require all the subsets to be shuffled and recomputed. Every single change will generally only create or remove one connection. This will hold for bigger changes, too, reducing almost all churn in the subsets.

Zuul’s Take

Our approach to implement this in Zuul was to integrate with Eureka service discovery changes and feed them into a distribution ring, based on the ideas discussed above. When new origins register in Zuul, we load their instances and create a new ring, and from then on, manage it with incremental deltas. We also take the additional step of shuffling the order of nodes before adding them to the ring. This helps prevent accidental hot spotting or overlap among Zuul instances.

The quirk in any load balancing algorithm from Google is that they do their load balancing centrally. Their centralized service creates subsets and load balances across their entire fleet, with a global view of the world. To use this algorithm, the key insight was to apply it to the event loops rather than the instances themselves. This allows us to continue having decentralized, client-side load balancing while also having the benefits of accurate subsetting. Although Zuul continues connecting to all origin servers, each event loop’s connection pool only gets a small subset of the whole. We end up with a singular, global view of the distribution that we can control on each instance — and a single sequence number that we can increment for each origin’s ring.

When a request comes in, Netty assigns it to an event loop, and it remains there for the duration of the request-response lifecycle. After running the inbound filters, we determine the destination and load the connection pool for this event loop. This will pull from a mapping of loop-to-subset, giving us the limited set of nodes we’re looking for. We then load balance using a modified choice-of-2, as discussed before. If this sounds familiar, it’s because there are no fundamental changes to how Zuul works. The only difference is that we provide a loop-bound subset of nodes to the load balancer as a starting point for its decision.

Another insight we had was that we needed to replicate the number of subsets among the event loops. This allows us to maintain low connection counts for large and small origins. At the same time, having a reasonable subset size ensures we can continue providing good balance and resiliency features for the origin. Most origins require this because they are not big enough to create enough instances in each subset.

However, we also don’t want to change this replication factor too often because it would cause a reshuffling of the entire ring and introduce a lot of churn. After a lot of iteration, we ended up implementing this by starting with an “ideal” subset size. We achieve this by computing the subset size that would achieve the ideal replication factor for a given cardinality of origin nodes. We can scale the replication factor across origins by growing our subsets until the desired subset size is achieved, especially as they scale up or down based on traffic patterns. Finally, we work backward to divide the ring into even slices based on the computed subset size.

Our ideal subset side is roughly 25–50 nodes, so an origin with 400 nodes will have 8 subsets of 50 nodes. On a 32-core instance, we’ll have a replication factor of 4. However, that also means that between 200 and 400 nodes, we’re not shuffling the subsets at all. An example of this subset recomputation is in the rollout graphs below.

An interesting challenge here was to satisfy the dual constraints of origin nodes with a range of cardinality, and the number of event loops that hold the subsets. Our goal is to scale the subsets as we run on instances with higher event loops, with a sub-linear increase in overall connections, and sufficient replication for availability guarantees. Scaling the replication factor elastically described above helped us achieve this successfully.

Subsetting Success

The results were outstanding. We saw improvements across all key metrics on Zuul, but most importantly, there was a significant reduction in total connection counts and churn.

Total Connections

This graph (as well as the ones below) shows a week’s worth of data, with the typical diurnal cycle of Netflix usage. Each of the 3 colors represents our deployment regions in AWS, and the blue vertical line shows when we turned on the feature.

Total connections at peak were significantly reduced in all 3 regions by a factor of 10x. This is a huge improvement, and it makes sense if you dig into how subsetting works. For example, a machine running 16 event loops could have 8 subsets — each subset is on 2 event loops. That means we’re dividing an origin by 8, hence an 8x improvement. As to why peak improvement goes up to 10x, it’s probably related to reduced churn (below).

Churn

This graph is a good proxy for churn. It shows how many TCP connections Zuul is opening per second. You can see the before and after very clearly. Looking at the peak-to-peak improvement, there is roughly an 8x improvement.

The decrease in churn is a testament to the stability of the subsets, even as origins scale up, down, and redeploy over time.

Looking specifically at connections created in the pool, the reduction is even more impressive:

The peak-to-peak reduction is massive and clearly shows how stable this distribution is. Although hard to see on the graph, the reduction went from thousands per second at peak down to about 60. There is effectively no churn of connections, even at peak traffic.

Load Balancing

The key constraint to subsetting is ensuring that the load balance on the backends is still consistent and evenly distributed. You’ll notice all the RPS on origin nodes grouped tightly, as expected. The thicker lines represent the subset size and the total origin size.

Balance at deploy
Balance 12 hours after deploy

In the second graph, you’ll note that we recompute the subset size (blue line) because the origin (purple line) became large enough that we could get away with less replication in the subsets. In this case, we went from a subset size of 100 for 400 servers (a division of 4) to 50 (a division of 8).

System Metrics

Given the significant reduction in connections, we saw reduced CPU utilization (~4%), heap usage (~15%), and latency (~3%) on Zuul, as well.

Zuul canary metrics

Rolling it Out

As we rolled this feature out to our largest origins — streaming playback APIs — we saw the pattern above continue, but with scale, it became more impressive. On some Zuul shards, we saw a reduction of as much as 13 million connections at peak, with almost no churn.

Today the feature is rolled out widely. We’re serving the same amount of traffic but with tens of millions fewer connections. Despite the reduction of connections, there is no decrease in resiliency or load balancing. H2 multiplexing allows us to scale up requests separately from connections, and our subsetting algorithm ensures an even traffic balance.

Although challenging to get right, subsetting is a worthwhile investment.

Acknowledgments

We would also like to thank Peter Ward, Paul Wankadia, and Kavita Guliani at Google for developing this algorithm and publishing their work for the benefit of the industry.


Curbing Connection Churn in Zuul was originally published in Netflix TechBlog on Medium, where people are continuing the conversation by highlighting and responding to this story.

What’s Up, Home? – No More Blackouts with Zabbix HA Cluster

Post Syndicated from Janne Pikkarainen original https://blog.zabbix.com/whats-up-home-no-more-blackouts-with-zabbix-ha-cluster/24738/

Can you have a Zabbix HA cluster at home? Of course, you can! By day, I am a monitoring tech lead in a global cyber security company. By night, I monitor my home with Zabbix & Grafana and do some weird experiments with them. Welcome to my blog about this project.

The winter has come, and due to world events, it might bring one to two hours of rolling blackouts here in Finland, too. As I have my home Zabbix running on my Raspberry Pi, without a UPS this would mean my Zabbix possibly could not monitor the actual duration of the outages, as my Zabbix server would be without power, too, right?

No. Thanks to the simplicity of setting up a HA cluster with Zabbix, I now have a two-node Zabbix server setup at home, with the standby node running on my laptop, which of course can run on battery for the duration of the blackout. So, while this post is kind of boring — I’m not introducing anything weird to monitor today — I hope the post encourages you to try out the high-availability features of Zabbix. It’s easy!

Set up the nodes

As written on Zabbix documentation, setting up HA on Zabbix means two additional lines added to your zabbix_server.conf file:

  • HANodeName for the descriptive, unique name of the node
  • NodeAddress, which should be the address Zabbix front-end will then use

That’s it! And, that is what I did. Then make sure your Zabbix servers point to the same database, and that all your Zabbix servers can connect to that database.

But does it work?

Of course, it does! Here’s the status as seen from Zabbix Reports System Information:

And here’s the status as reported by sudo zabbix_server -R ha_status from the command line on my Raspberry Pi:

Out of curiosity, I tried out what happens if I try the same command on my laptop. This happens:

Still to do

As nowadays due to our baby my time is very limited, I do have one remaining task to make this perfect: to set up a database cluster. For now, MariaDB is running on my Raspberry Pi only, so I would need to spread it to run on my laptop, too. I will most likely do this with MariaDB Galera Cluster, but that will be another story.

Winter, you might take out my electricity, but you won’t take down my Zabbix.

I have been working at Forcepoint since 2014 and I won’t let my systems go down. — Janne Pikkarainen

This post was originally published on the author’s LinkedIn account.

Fast Way to Upgrade Your Zabbix Knowledge

Post Syndicated from Nicole Makarova original https://blog.zabbix.com/fast-way-to-upgrade-your-zabbix-knowledge/20267/

Since Zabbix 6.0 LTS has been released with a lot of new features and improvements, it might be tricky for one to figure out how to use these features on their own. Here, Zabbix comes to the rescue with Upgrade Training Courses to boost your knowledge in just one day.

If you previously completed the Zabbix 5.0 core training, the Upgrade Program will be an excellent way to learn about the recent improvements and add-ons of the new version without retaking the entire course. It is akin to a crash course that saves you both time and effort.

Zabbix Upgrade Training Program Overview

The Upgrade Training Program consists of two courses: Zabbix 6.0 Certified Specialist Upgrade Course and Zabbix 6.0 Certified Professional Upgrade Course. Let us tell you more about each upgraded training.

The Certified Specialist Upgrade Course covers the updated and new features of the basics, such as different data collection approaches, problem detection, data preprocessing, different visualization features, and more. Some of the long-awaited features you will get familiar with during the upgrade course are new Dashboard Widgets (e.g.: Item Value Widget), Top Hosts Widget, and the ability to display your monitored infrastructure on the Geomap Widget. Another thing that might serve your interest is the Service Monitoring section, which has been completely redesigned with a focus on flexible business service monitoring, alerting, and root cause analysis.

On the contrary, Certified Professional Upgrade Course focuses on advanced environments, where infrastructure scalability and redundancy are the common requirements. Hence, this course includes six major features, with two of them being High Availability and Advanced Problem Detection. The Zabbix server High Availability feature allows you to deploy multiple Zabbix servers that will remain in standby mode and will be failed over if the currently active server becomes unavailable. The Advanced Problem Detection section focuses on anomaly detection and baseline monitoring features, as Zabbix now supports history functions. This means that Zabbix can semi-automatically detect anomalous values and create alerts if such values are detected. The same approach can be used in baseline monitoring: Zabbix can now calculate baseline values for your metrics and react if your values are outside of this baseline.

As you see, such extensive training wraps up all the meaningful recent improvements of Zabbix 6.0 and delivers them to you in one day, not requiring you to spend a week on the course retake. And besides, it is also cheaper than the entire course.

This is the first time Zabbix is providing a quick and easy way to upgrade existing Zabbix 5.0 Specialist and Zabbix 5.0 Professional certifications to Zabbix 6.0. The course is designed for experienced Zabbix administrators, who are working with Zabbix 5.0 on daily basis. The one-day course featuring all important changes and updates in the most recent Zabbix LTS version is a very cost and time-efficient option.
– Kaspars Mednis, Chief Trainer at Zabbix

Applying for the Right Course

Now it is time to pick the right Upgrade Course to apply for if you are ready to evolve your Zabbix skills. Here are a few hints on how to do it.

If you have already completed our core training and received the Zabbix 5.0 Certified Specialist Certificate, you should apply for the Zabbix 6.0 Certified Specialist Upgrade Course. This one-day course includes 5 hours of training and a one-hour exam that will challenge you to check your knowledge of the whole Zabbix 6.0 LTS version and its new features.

Therefore, if you were certified as a 5.0 Certified Professional, go for the Zabbix 6.0 Certified Specialist + Professional Upgrade Course bundle. This one includes both: Specialist and Professional courses and lasts a little longer. After completing the Specialist course, Professionals will have their additional 1.5-hour training and a 30-minute exam to master their knowledge.

Useful Things to Know

We suggest revising your knowledge of the Zabbix usage, as the exam of the Upgrade Training Program includes questions about both: the entire Zabbix 6.0 LTS release, as well as new features and improvements. Feel free to use your Zabbix 5.0 materials from the previous core training you have completed or explore Zabbix Documentation in case the materials are unavailable to you for some reason.

Please, bear in mind that 6.0 Certified Professional Upgrade training is meant only for the 5.0 Certified Professionals who have previously acquired the 6.0 Certified Specialist level.

The Upgrade Training Program is available online all over the world in different languages and for various time zones. And what’s more, upon successful course completion, you will receive an official Zabbix training certificate stating you have upgraded to the Zabbix 6.0 Certified Specialist or Professional.

Ready for takeoff? Then check out the full schedule and cost of the program on our Upgrade Courses page and pick your training. For even more details, please contact our Sales Team.

Discover more courses and make a solid investment into your Zabbix skills by applying to:
Core Training Courses to become a professional or an expert
Extra Courses to study in depth one specific monitoring topic
Exams to prove your Zabbix knowledge


Top 10 reasons to migrate to Zabbix 6.0 LTS by Dmitry Krupornitsky / Zabbix Summit Online 2021

Post Syndicated from Arturs Lontons original https://blog.zabbix.com/top-10-reasons-to-migrate-to-zabbix-6-0-lts-by-dmitry-krupornitsky-zabbix-summit-online-2021/18445/

Today we will take a look at the top 10 reasons to migrate to Zabbix 6.0 LTS. We will discuss features and changes included not only in Zabbix 6.0 LTS but also in intermediate major versions – Zabbix 5.2 and Zabbix 5.4.

The full recording of the speech is available on the official Zabbix Youtube channel.

High availability

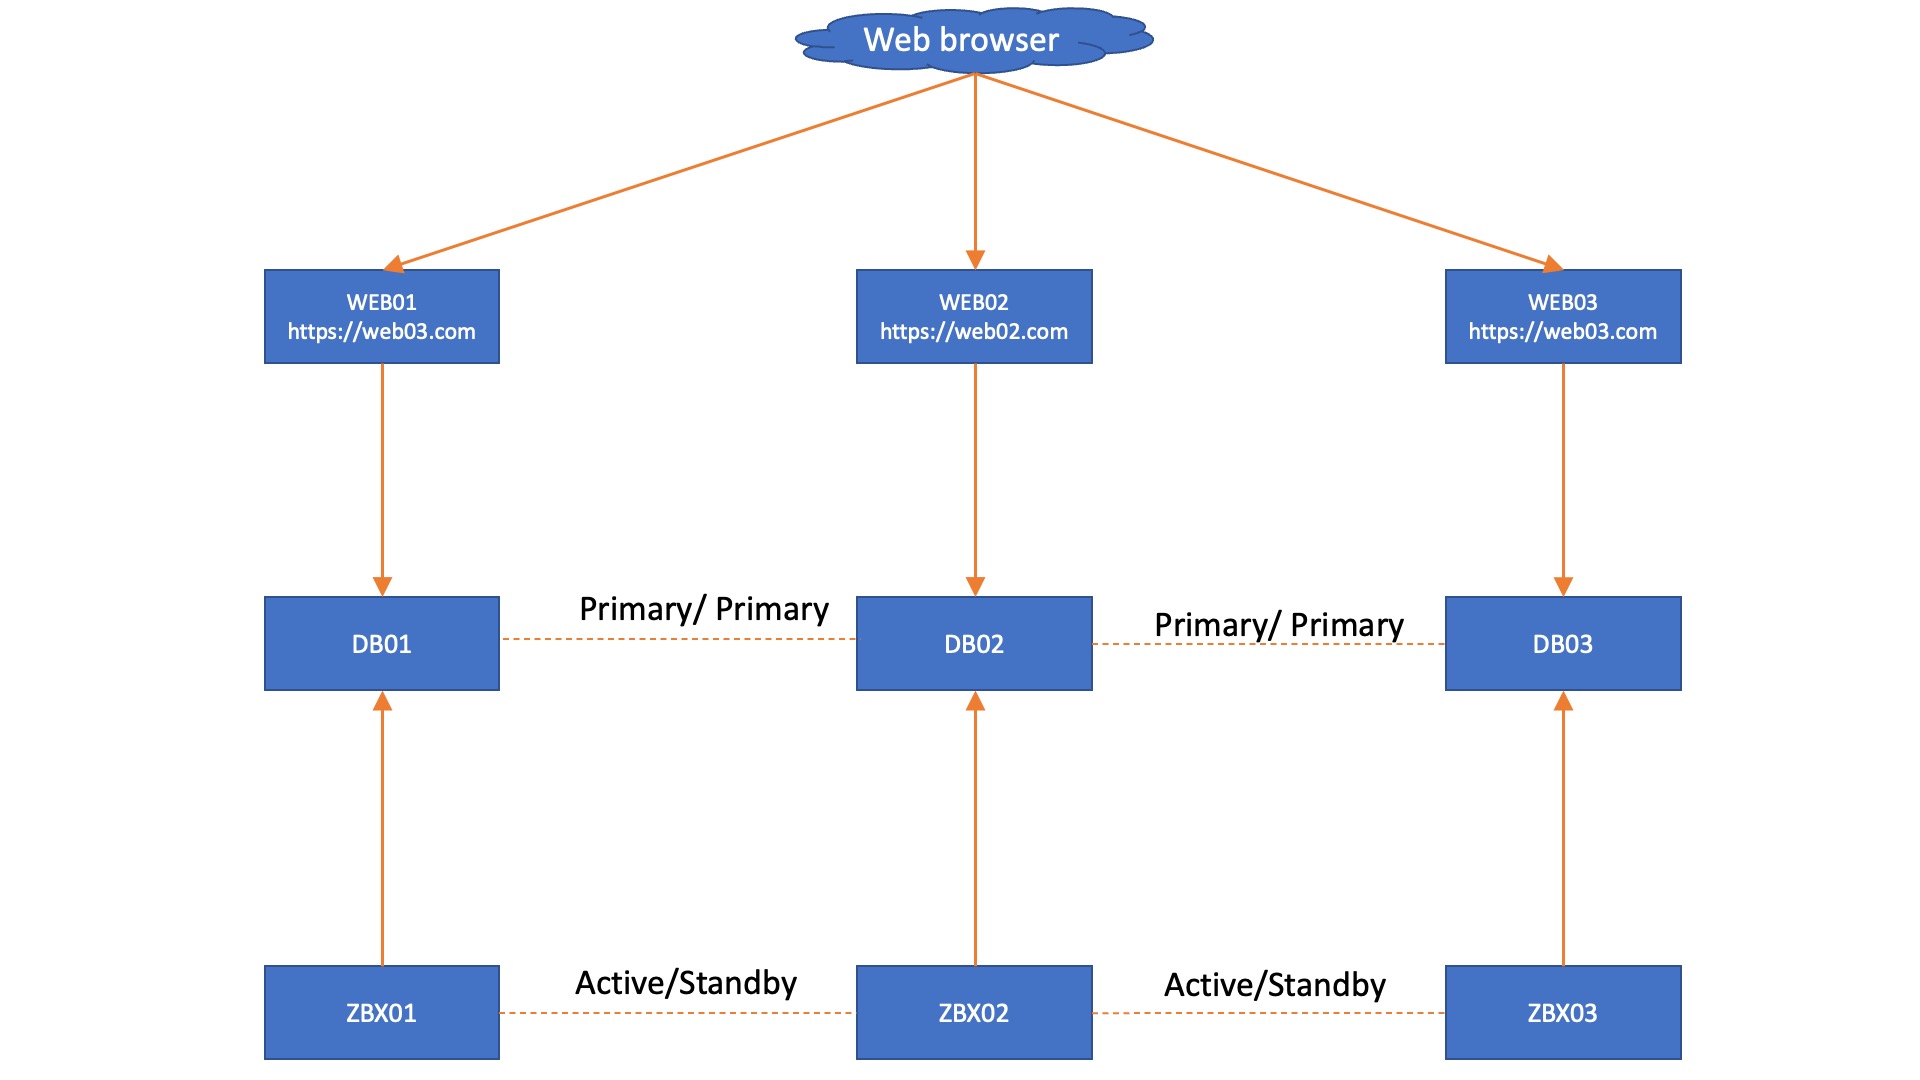
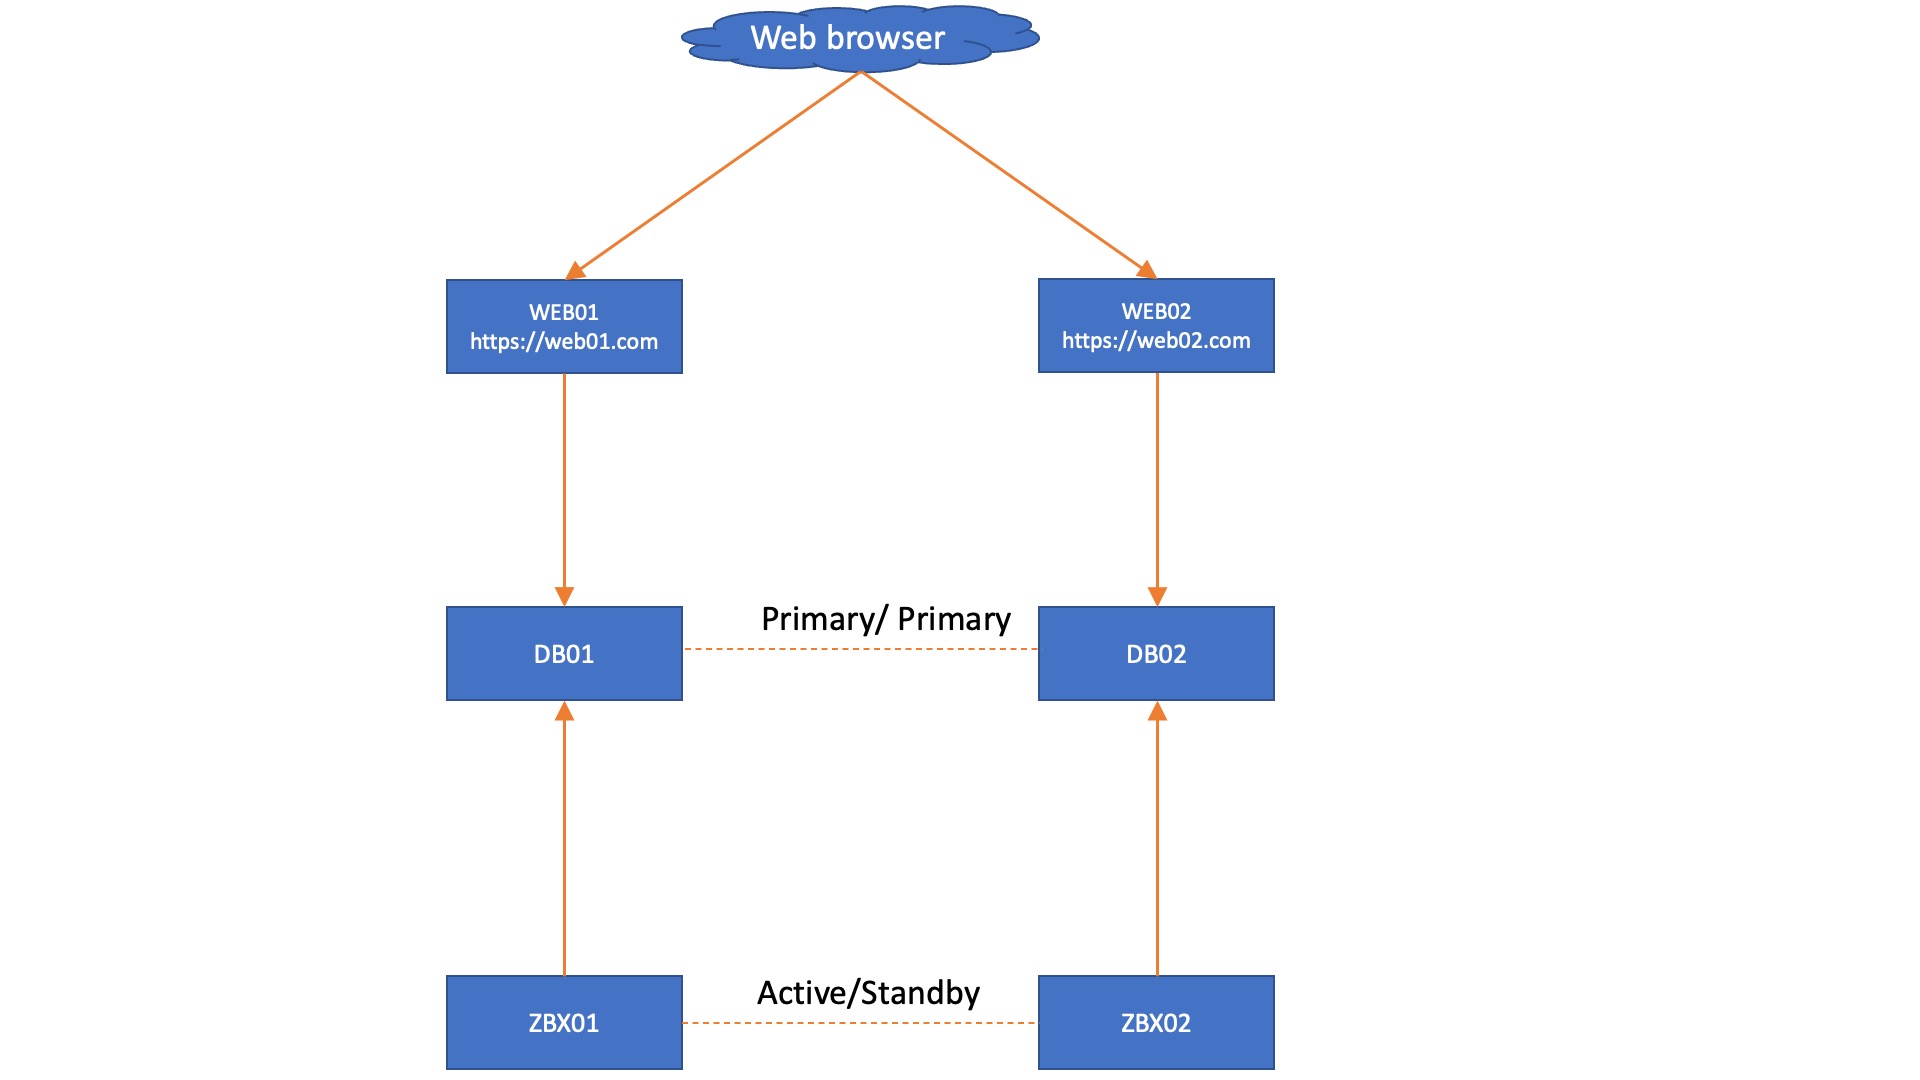
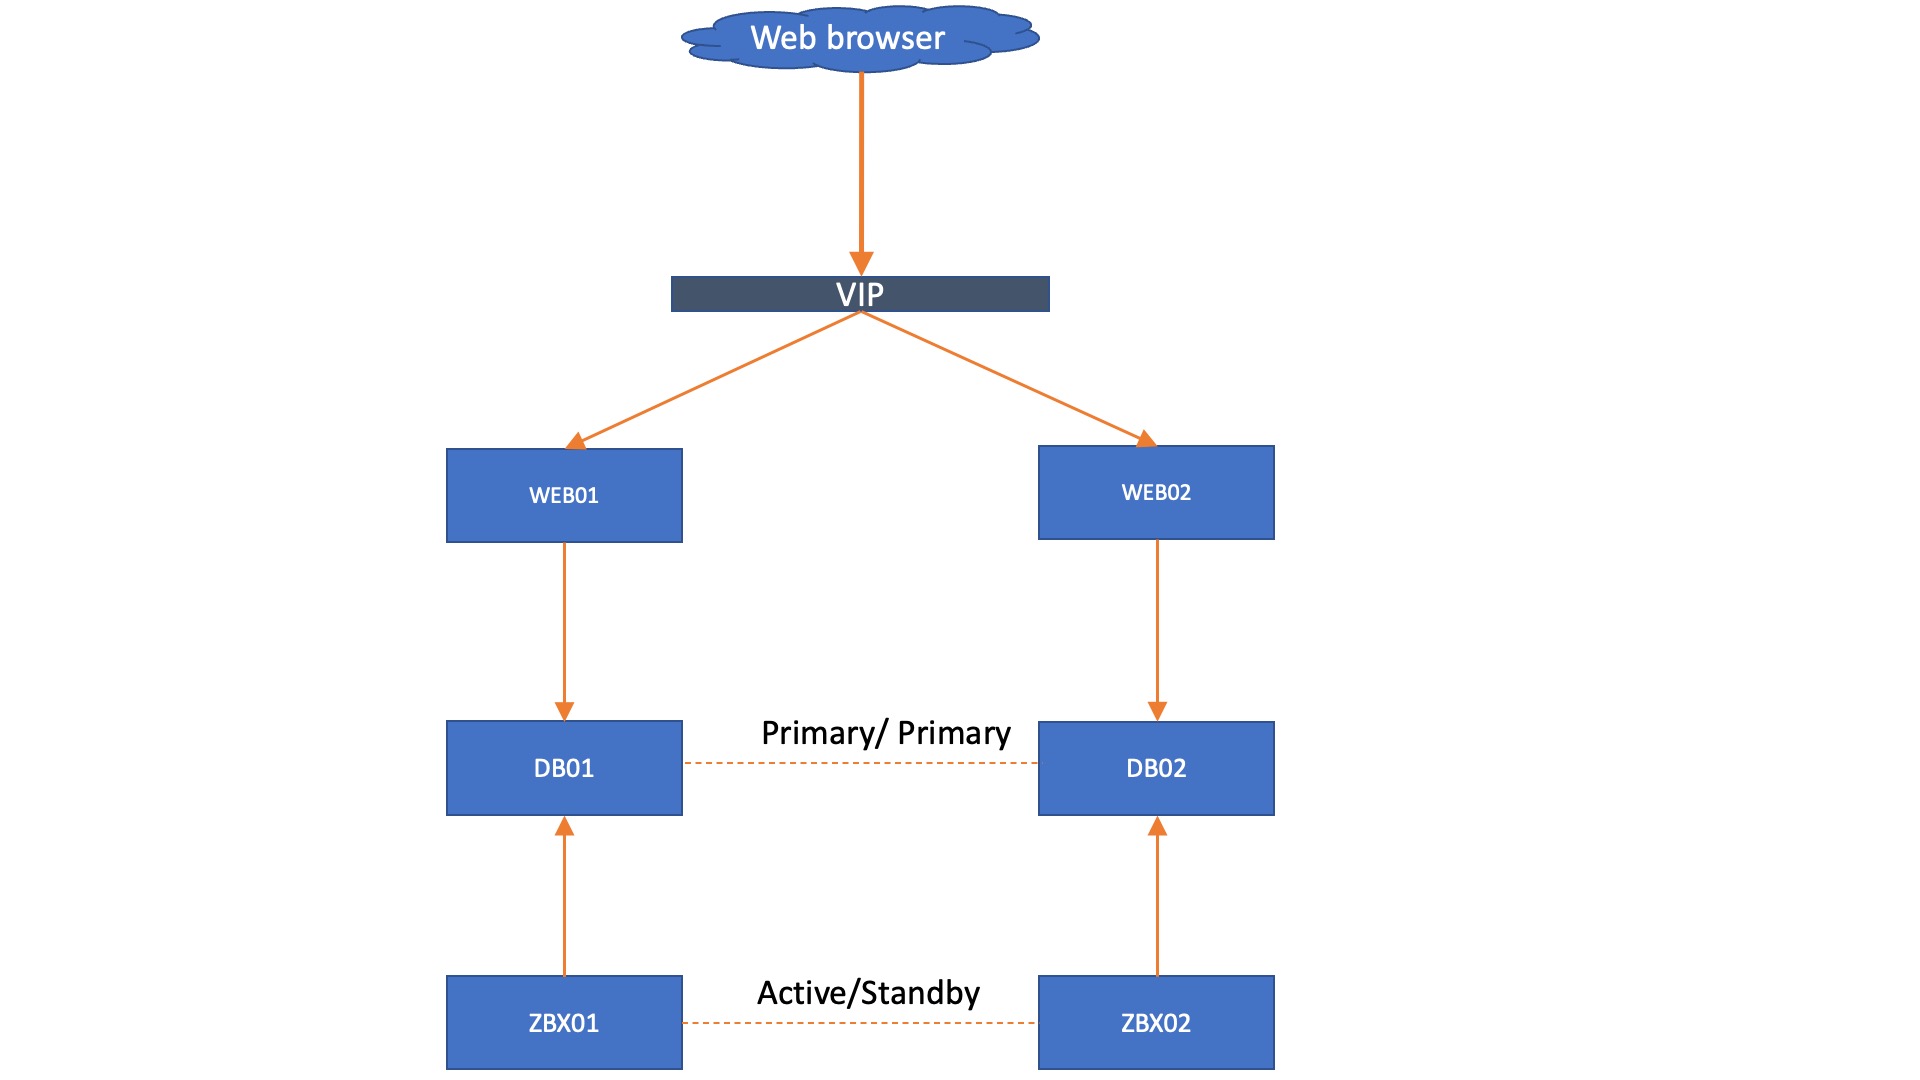
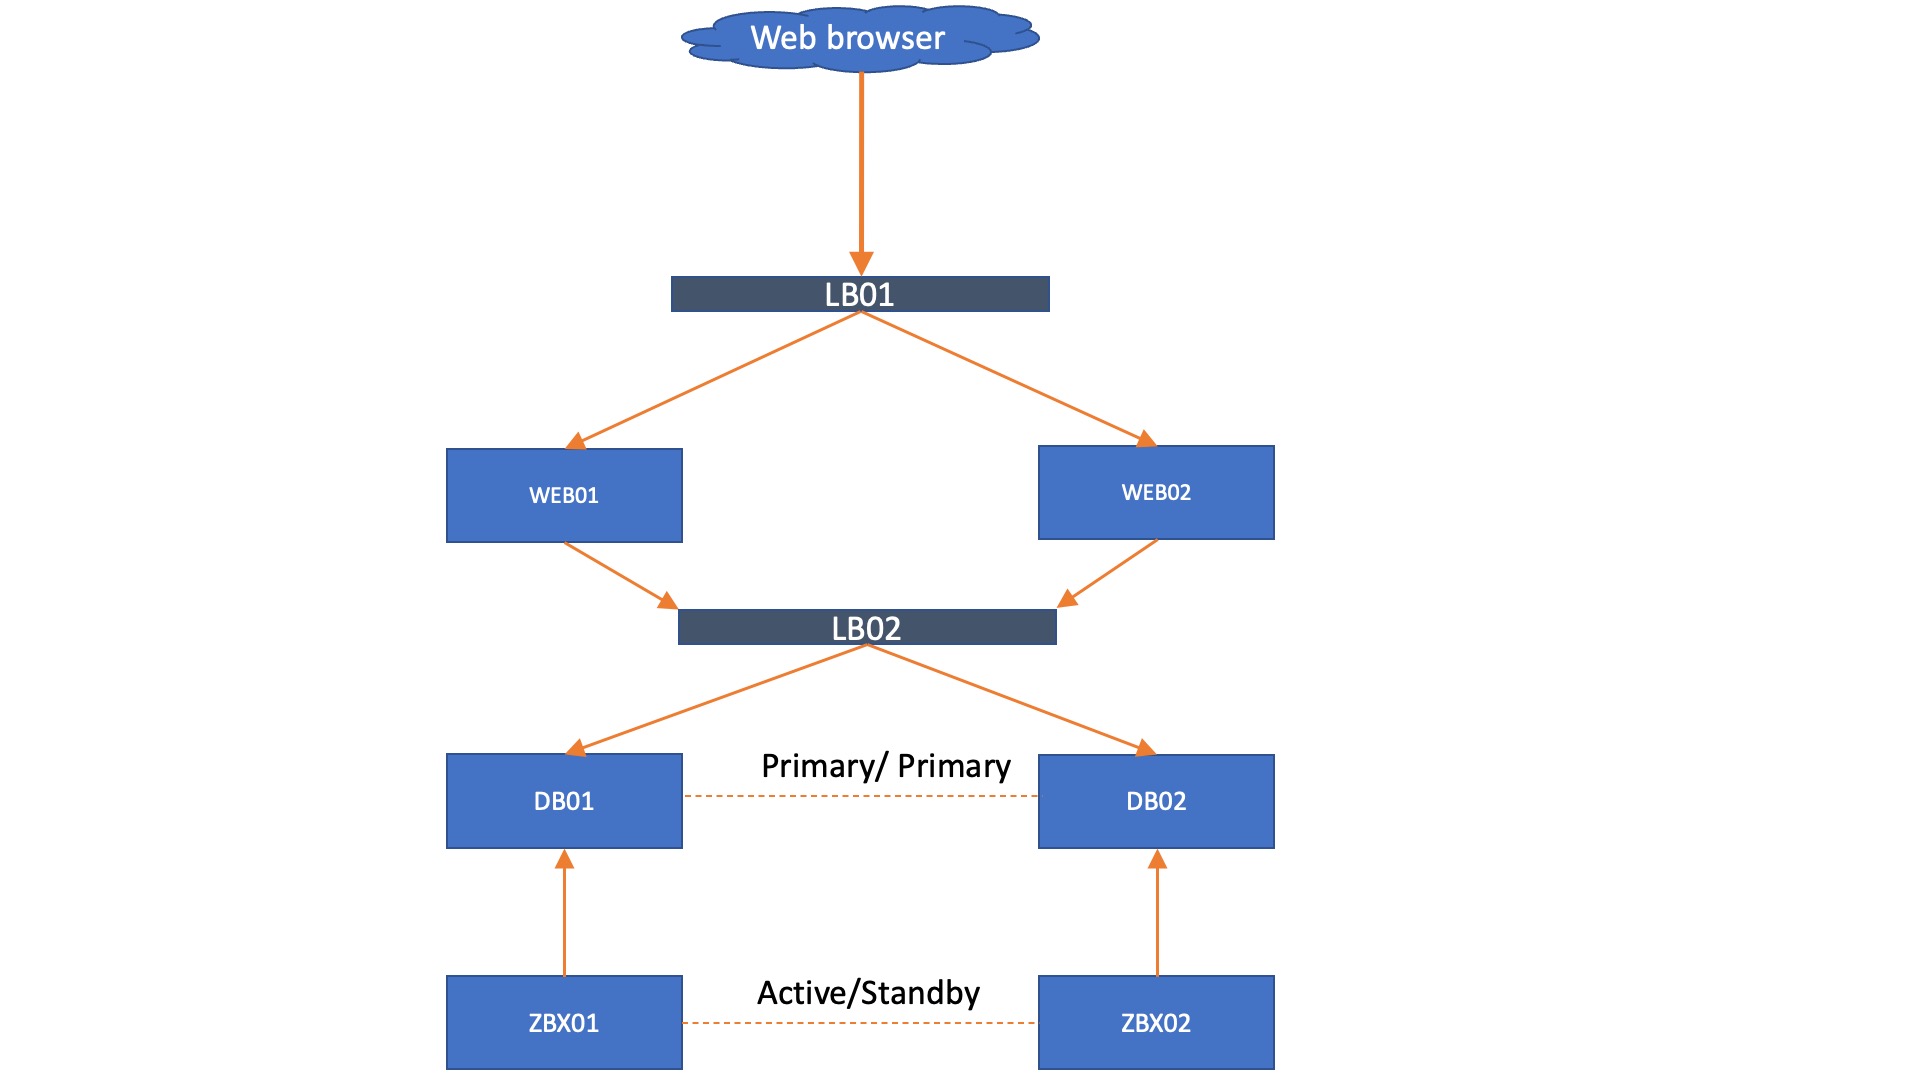
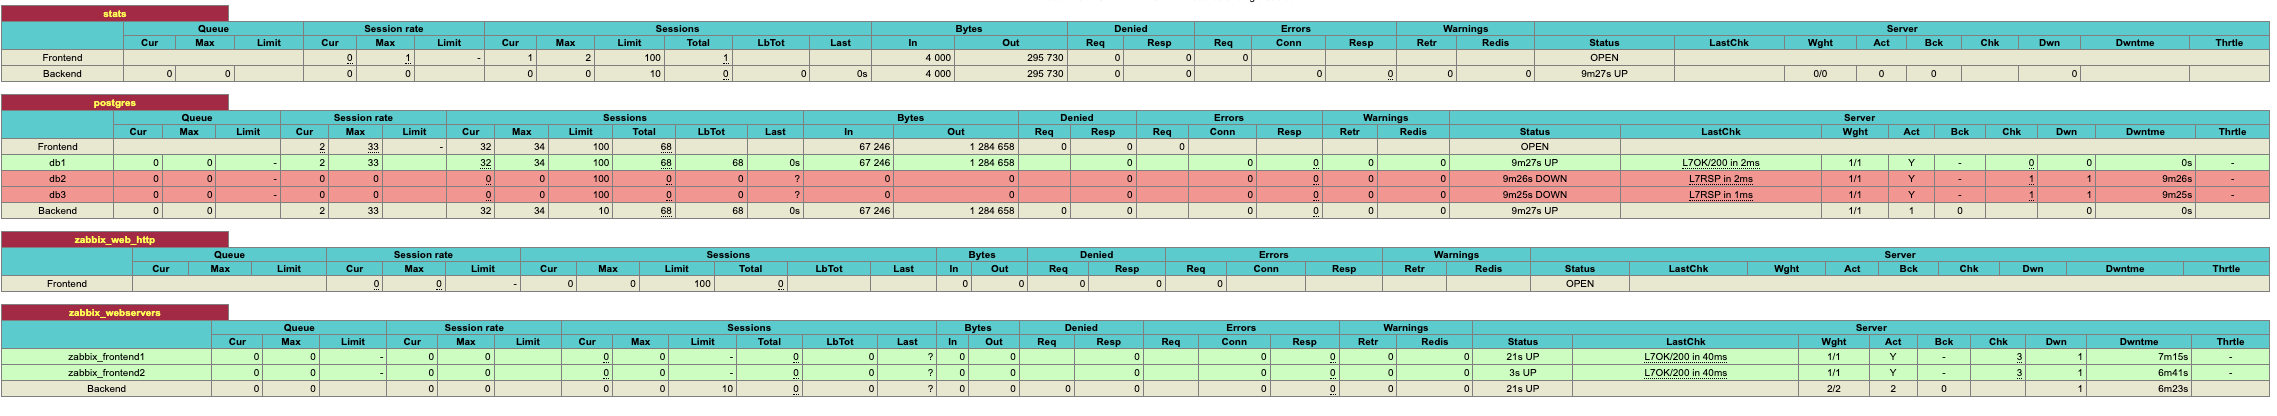
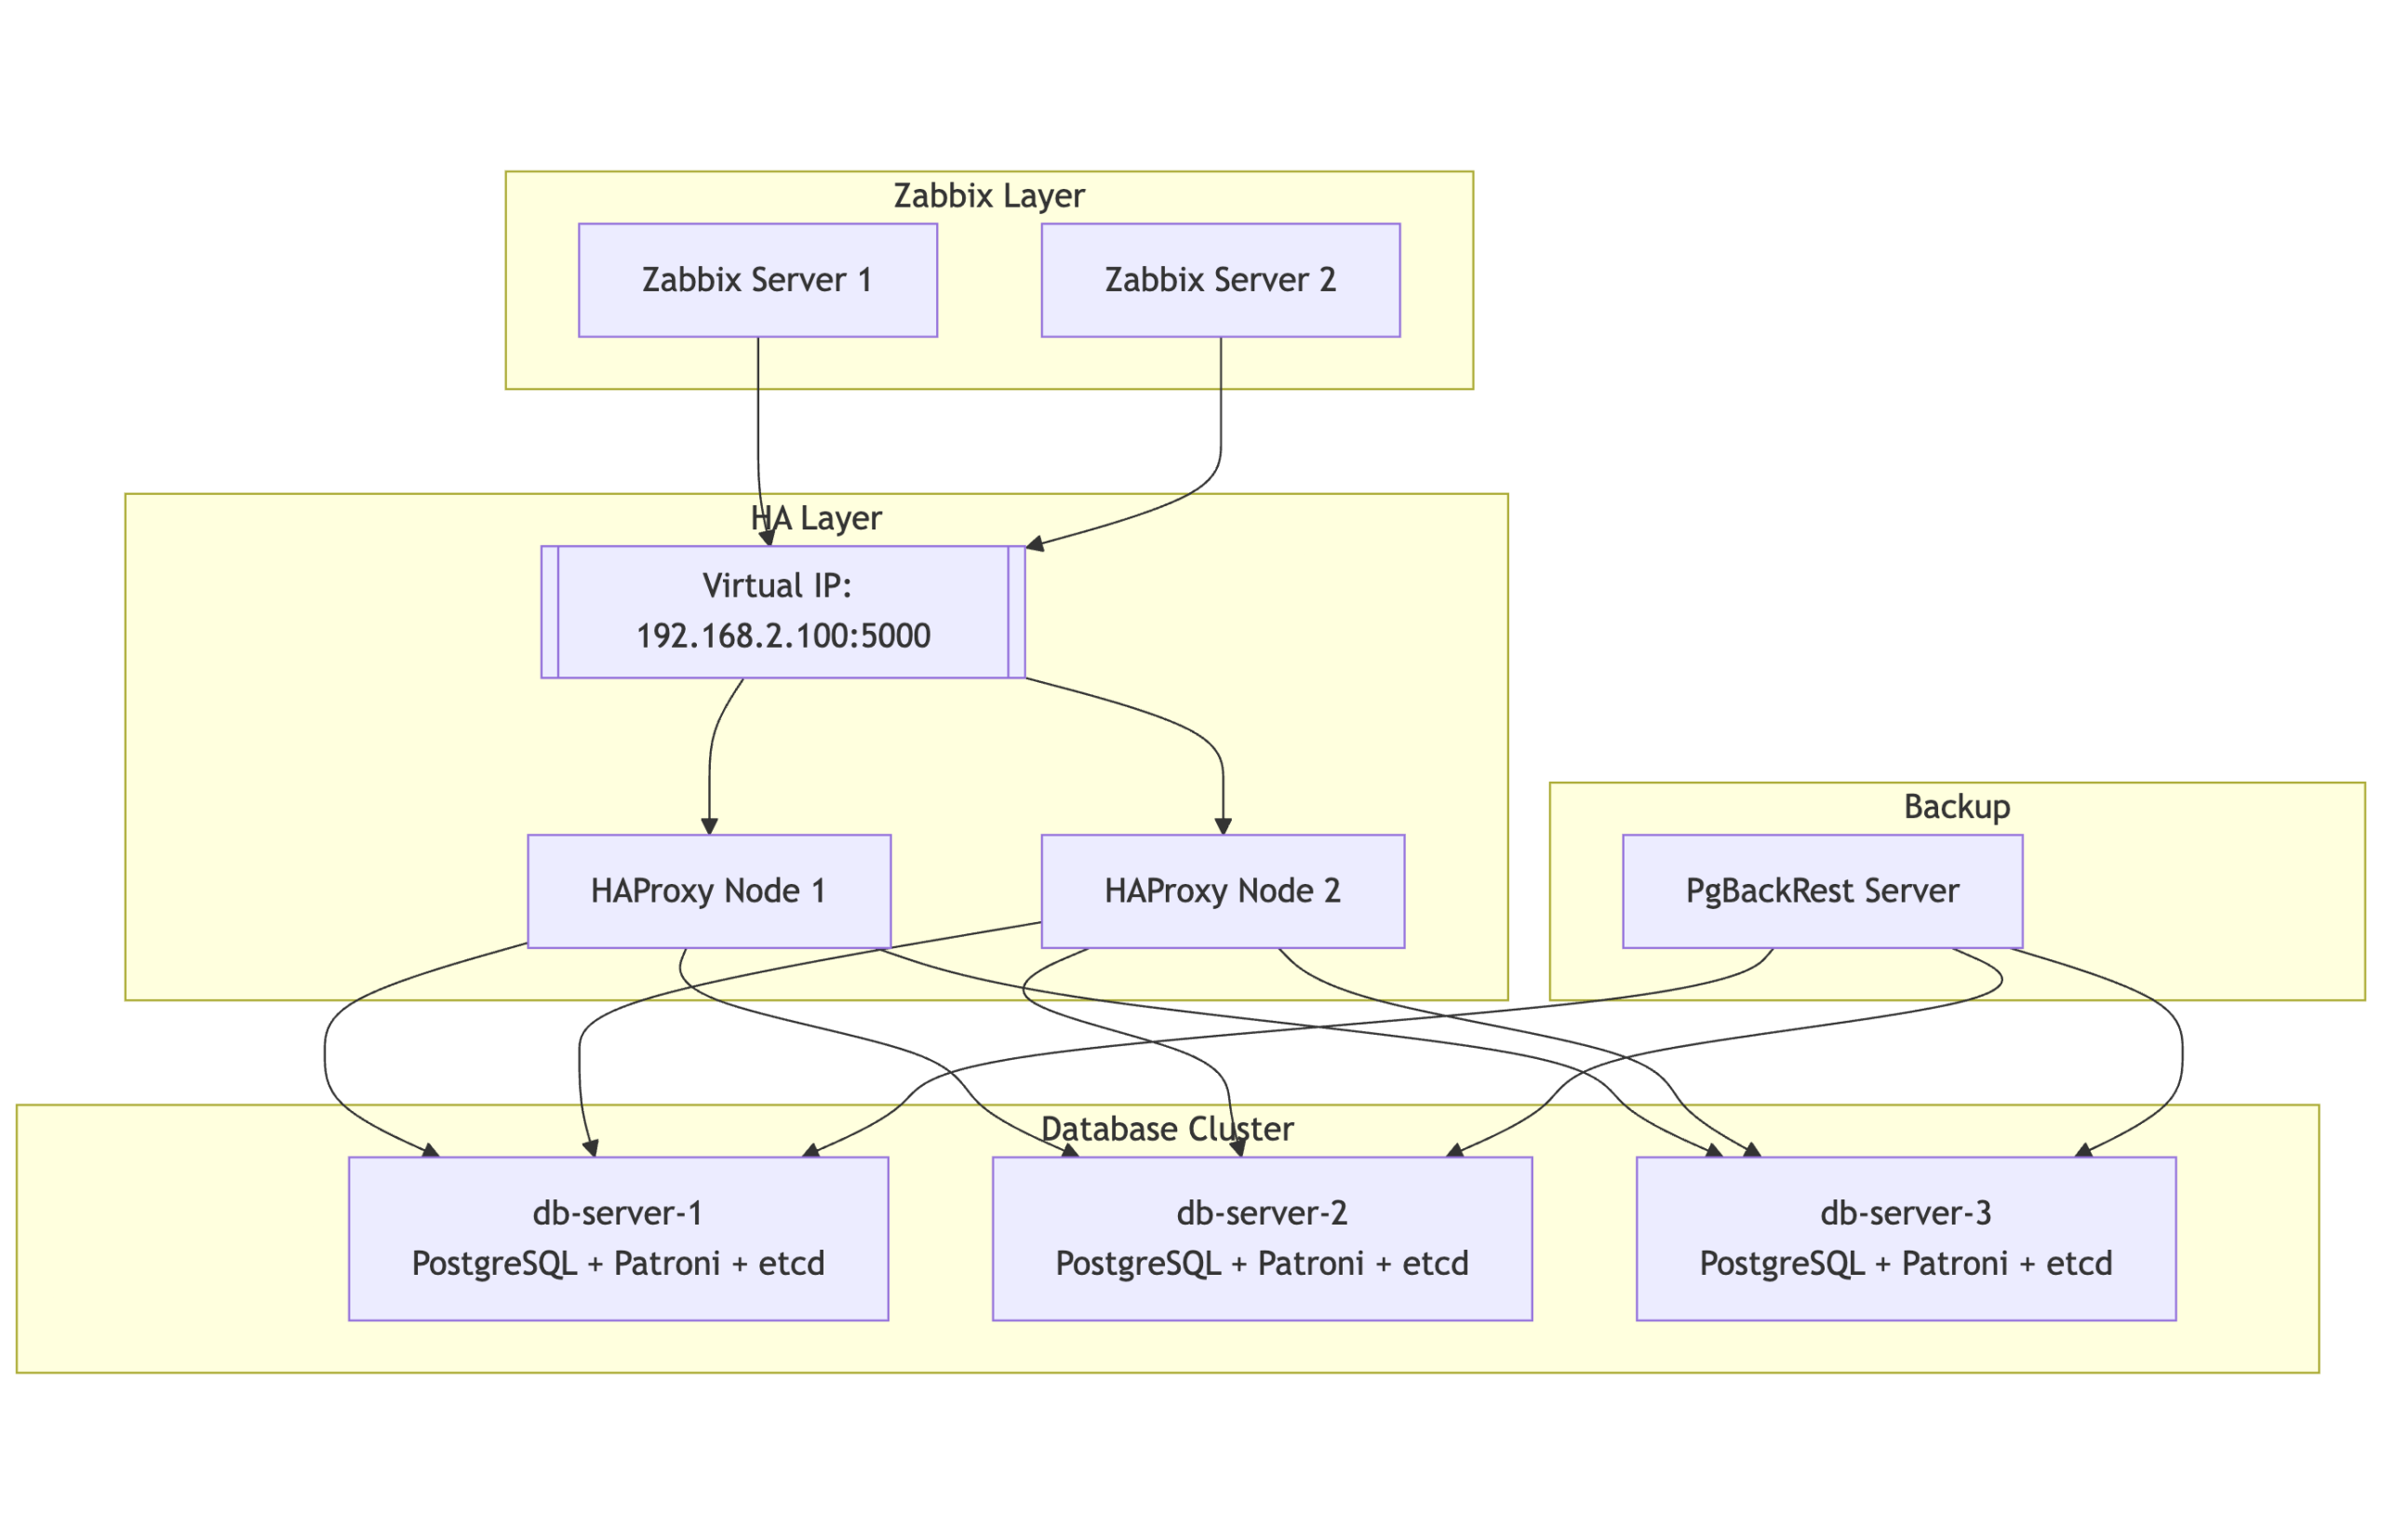
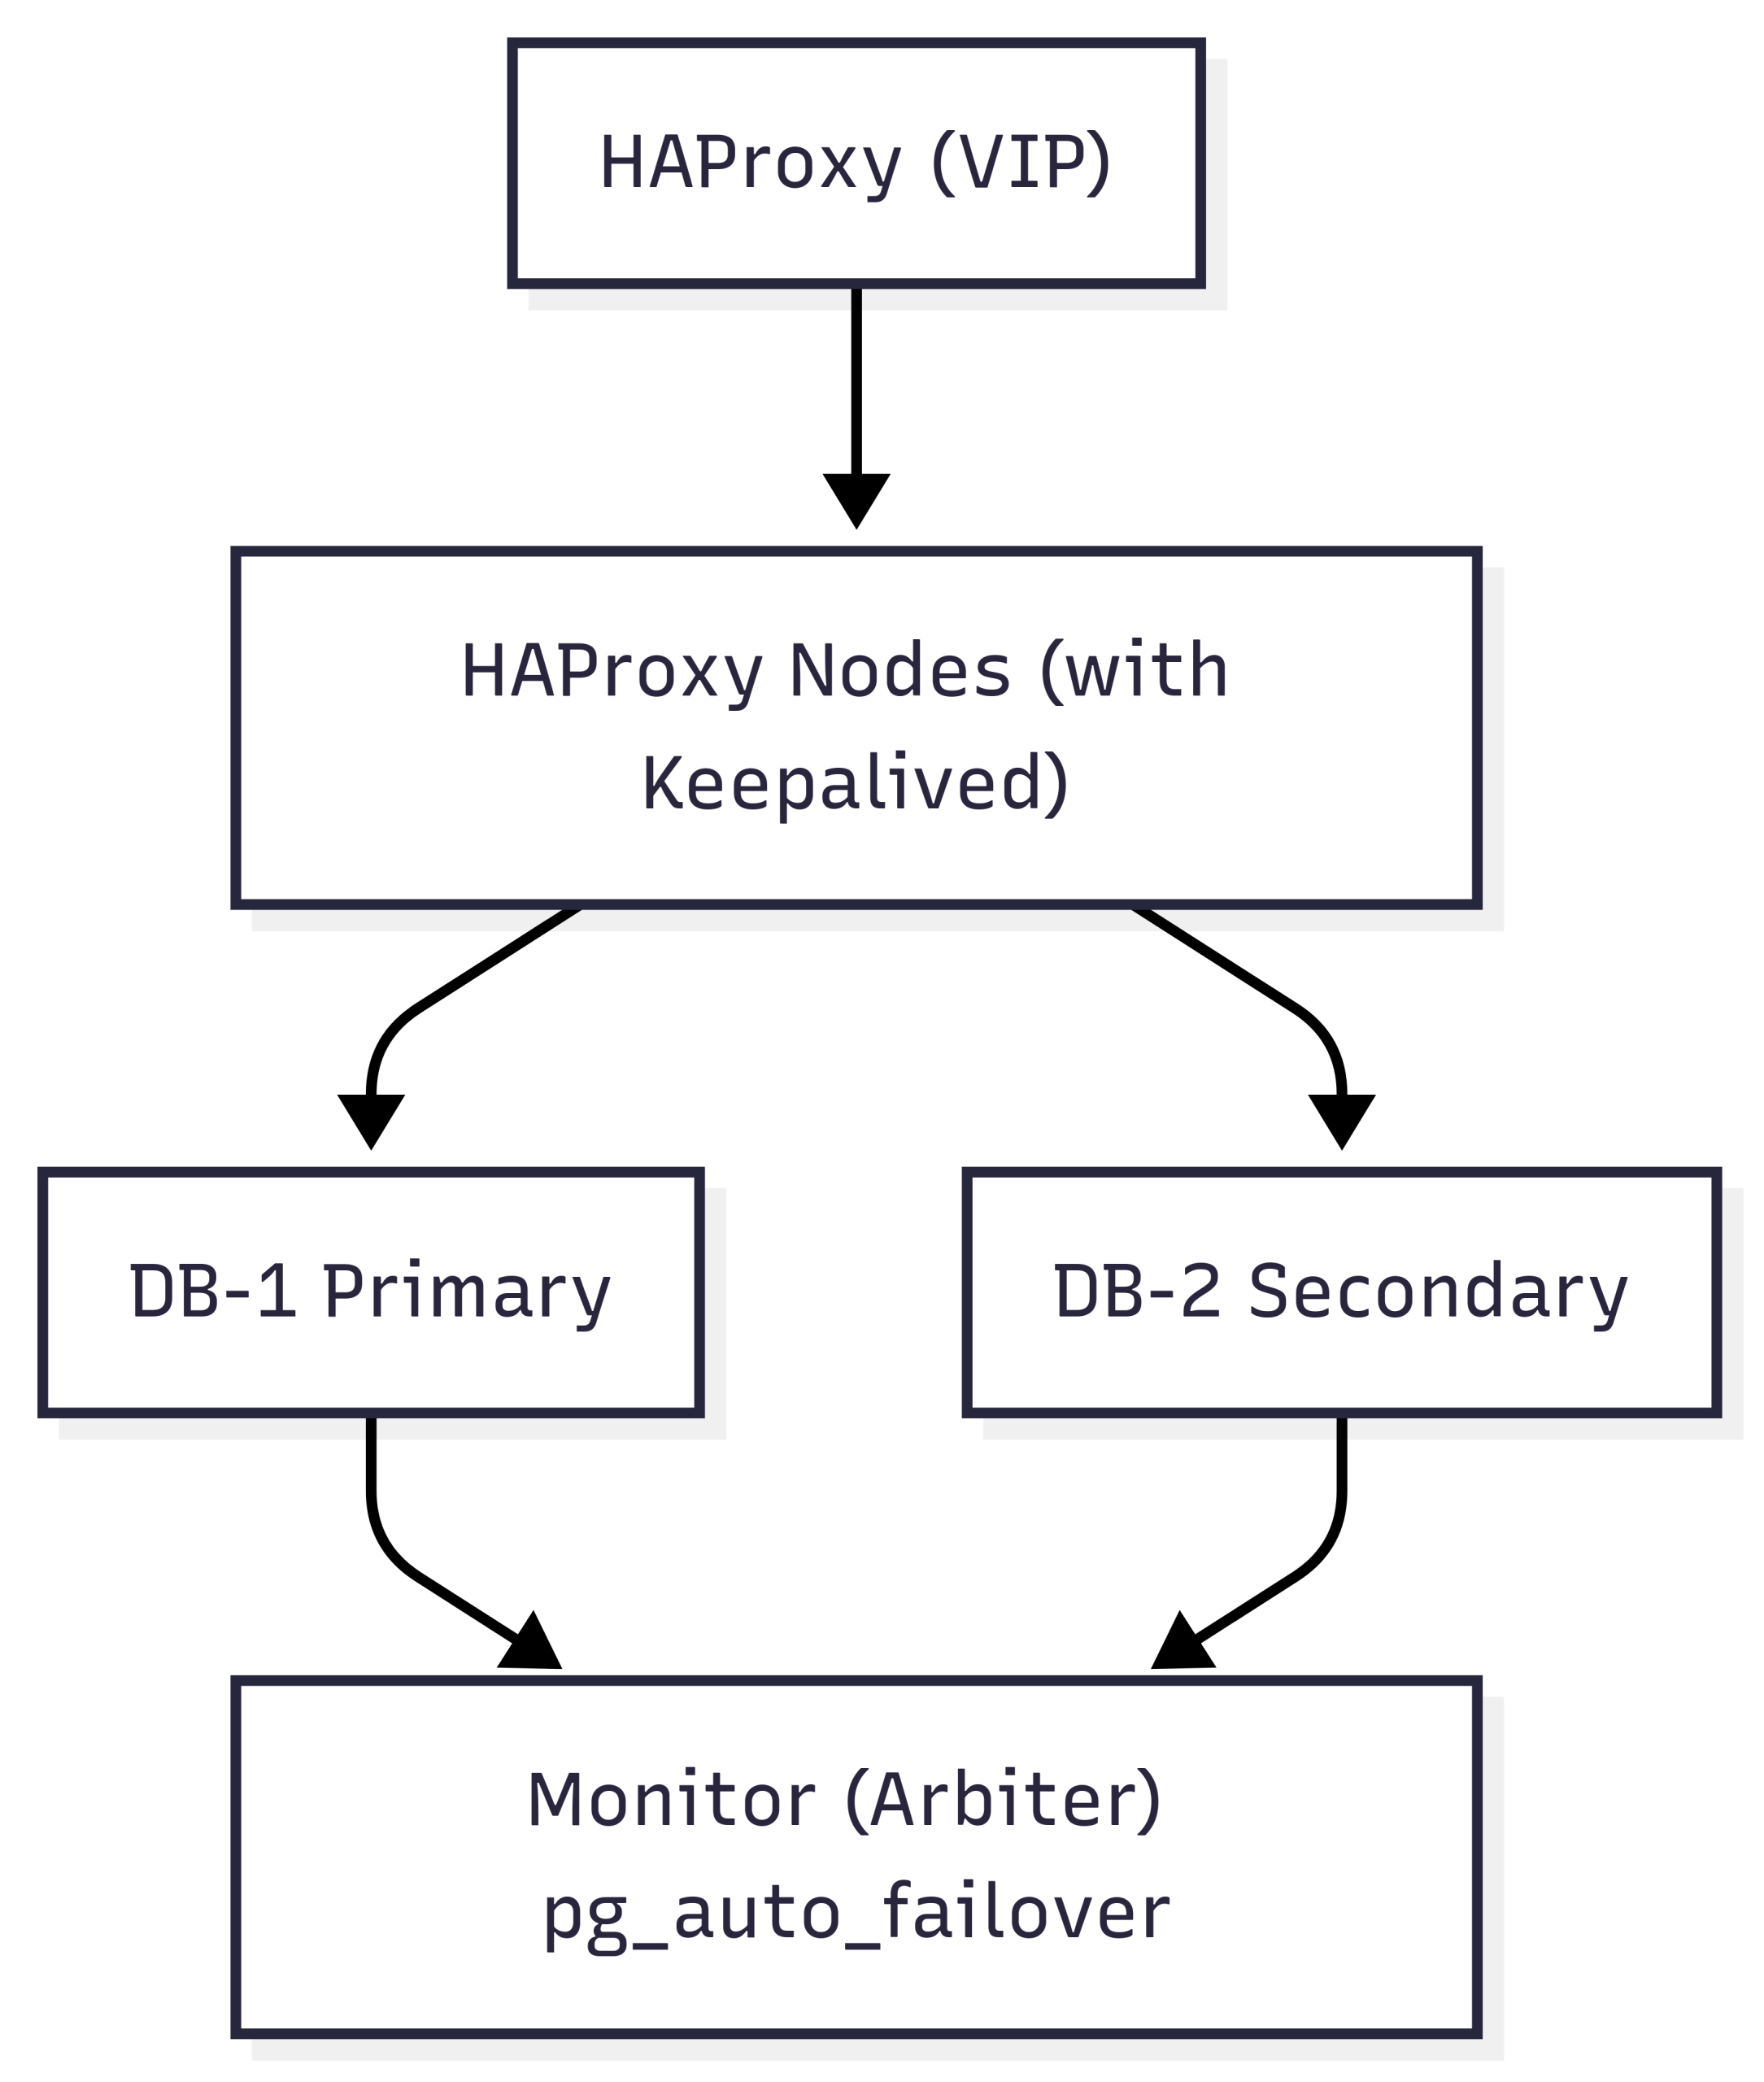
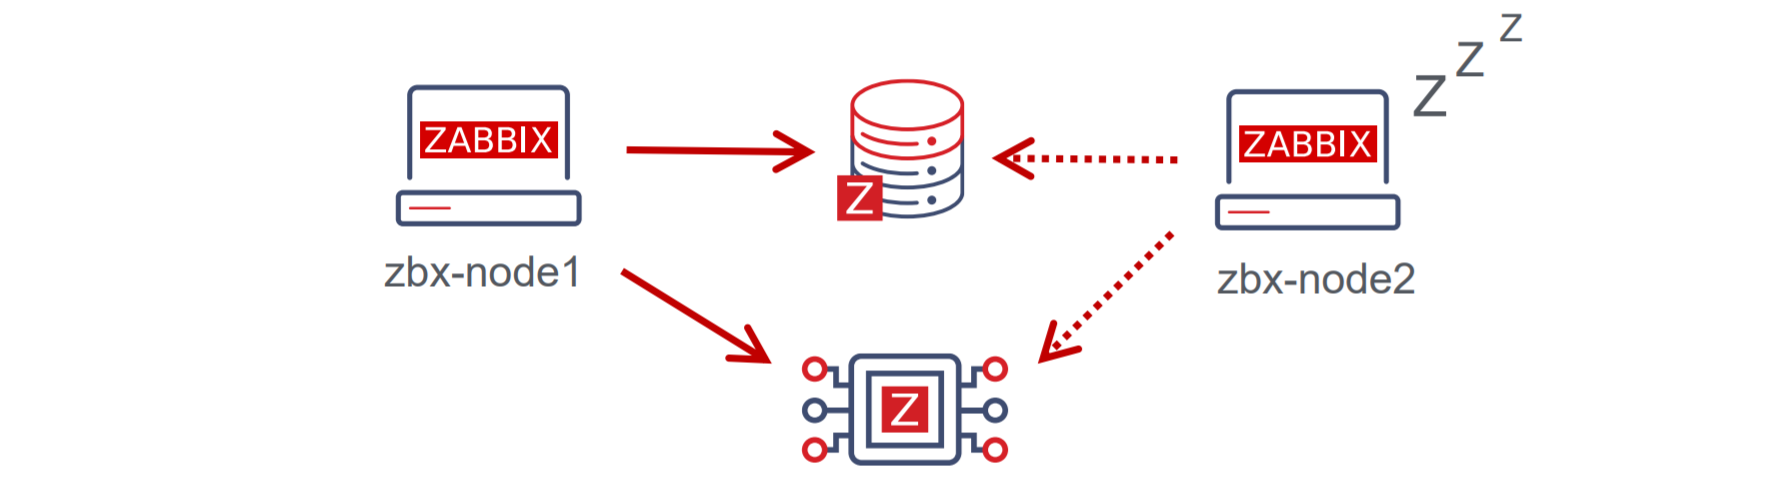
With Zabbix 6.0 LTS, native support for Zabbix server high availability clusters is finally here. High availability setups can protect you from software and hardware failures and allow you to minimize downtime while performing maintenance tasks. Before Zabbix 6.0 LTS, users were required to use a dedicated piece of clustering software to enable high availability. Most users used a combination of Corosync + pacemaker software. This required additional knowledge related to these tools, to ensure a proper high availability cluster setup, configuration, maintenance, and other tasks related to managing your Zabbix high availability cluster. You could also use other 3rd party vendor solutions, but such solutions also require additional knowledge and in many cases incur additional licensing costs.

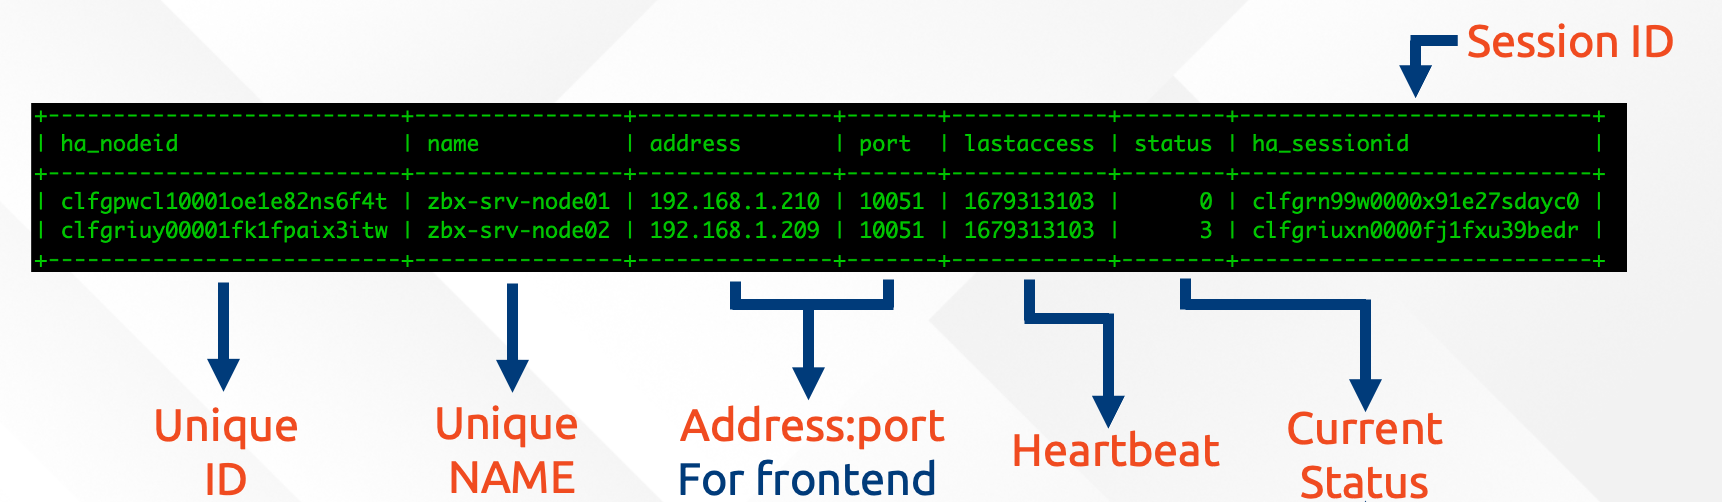
The native Zabbix server high availability cluster is an opt-in solution that provides high availability for the Zabbix server component. This solution consists of multiple Zabbix server instances – nodes, where each node is configured separately and uses the same database. Each node has two modes of operation – active or standby. Only a single node can be active at a time. The standby nodes do not perform any data collection, data processing, or any other Zabbix server activities. The standby nodes do not listen for connection on ports and have a minimal number of connections established to the Zabbix backend database. The high availability nodes are compatible with one another across different minor Zabbix server versions.

Learn how to deploy your own Zabbix server high availability cluster by following the steps provided in our Zabbix Summit blog post dedicated to this topic.

New Zabbix interface options

Zabbix 6.0 LTS provides multiple Zabbix interface improvements. One of the major changes that the users will notice when switching to Zabbix 6.0 LTS is the migration from screens to dashboards. The screens will be migrated to dashboards automatically during the upgrade. Dashboards consist of multiple highly customizable widgets, which can be placed on a dashboard with a click of a button. With Zabbix 6.0 LTS many new widgets will be available for different purposes – more flexible views of your metrics with the Single item value widget, a Geomap widget for a better overview of your infrastructure state, Top N/Bottom N views provide a whole new way to look at your metrics and more.

Now you will be able to save your favorite problem filters and access your filters in tabs for more simple filtering of the commonly accessed problem views.

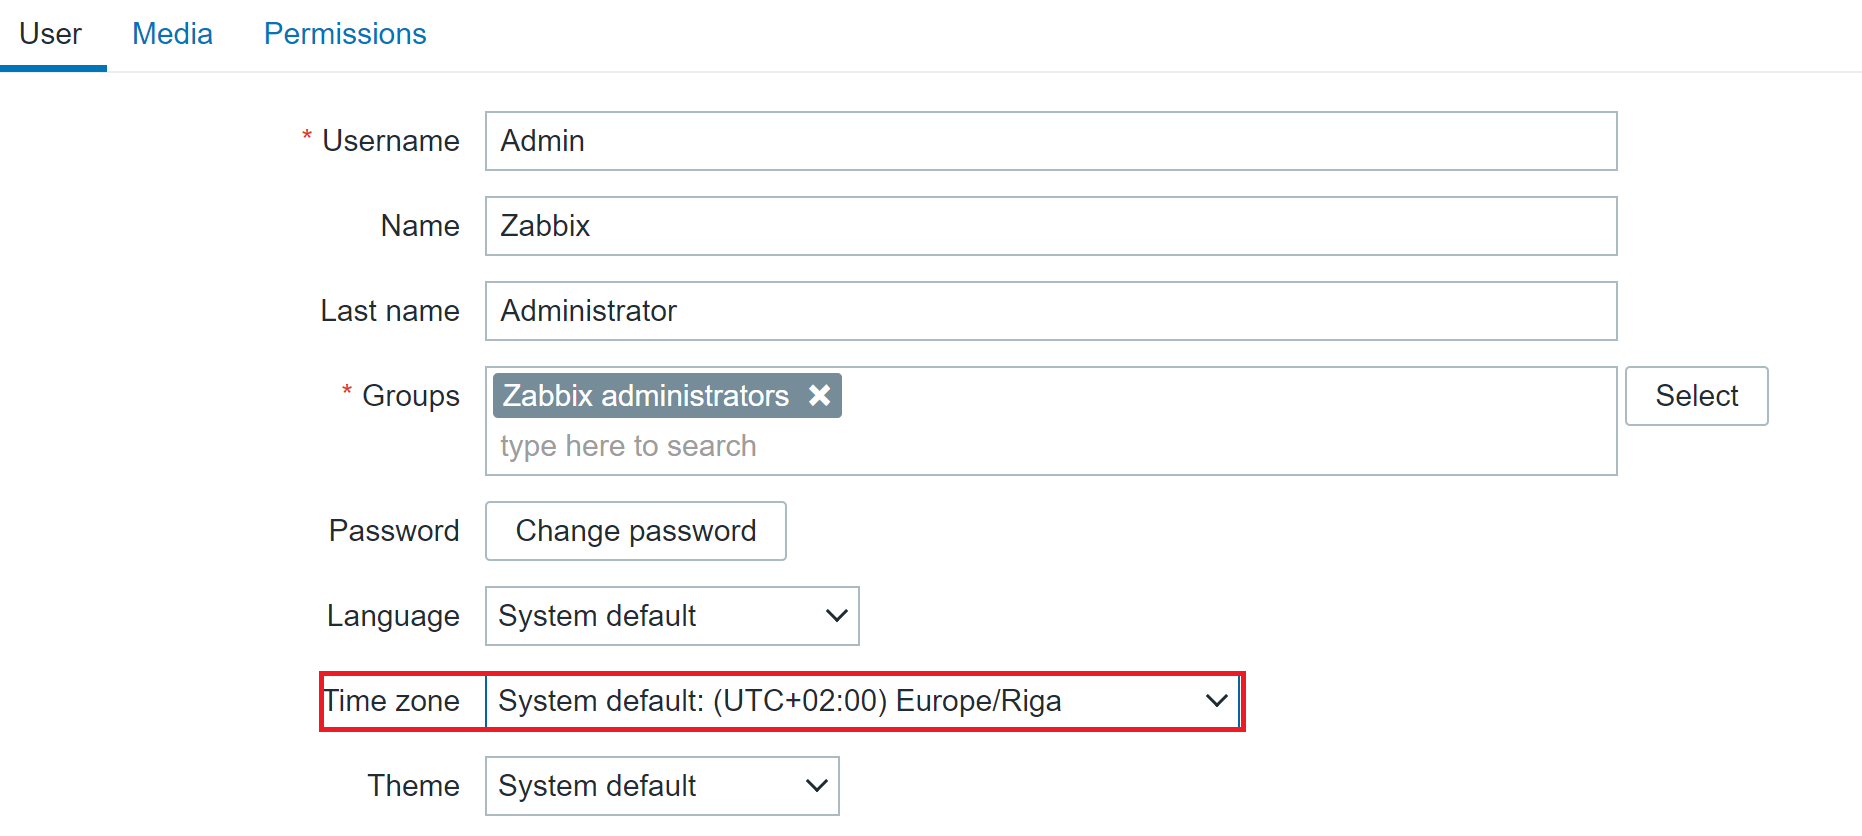
Zabbix 6.0 LTS introduces timezone configuration on a per-user basis. Users can now have their preferred timezone configured via the user settings in the Zabbix frontend. The same is also true for language – this can also now be configured individually for each user.

The Zabbix frontend is now more customizable than ever. There are several ways in which you can customize your Zabbix frontend:

  • Replace the Zabbix logo with your company’s branding
  • Hide links to Zabbix support/integration pages
  • Set a custom help page link
  • Change the copyright notice in the footer of the frontend.

Implementing these changes requires customizing the underlying PHP code – we tried to make this as simple and accessible as possible, so you can quickly make the necessary changes yourself.

There are also many other Interface improvements, such as multi-page dashboards, third-level menus, graph improvements, and many others.

Improved security

Security is always something that we focus on when developing Zabbix. Zabbix 6.0 LTS brings many new security-related improvements and features:

  • User roles allow you to define roles with granular permissions related to the frontend access and the actions that each user role is permitted to perform
    • Roles are still based on user types – Zabbix User, Admin, Super admin, and user type restrictions still apply, but can be further customized per each role
    • User group to host group permissions (Read, Read/Write, Deny) still need to be used in combination with roles to ensure granular access to your data
    • For example, now we can define users that have access to host configuration but restrict access to other configuration sections.

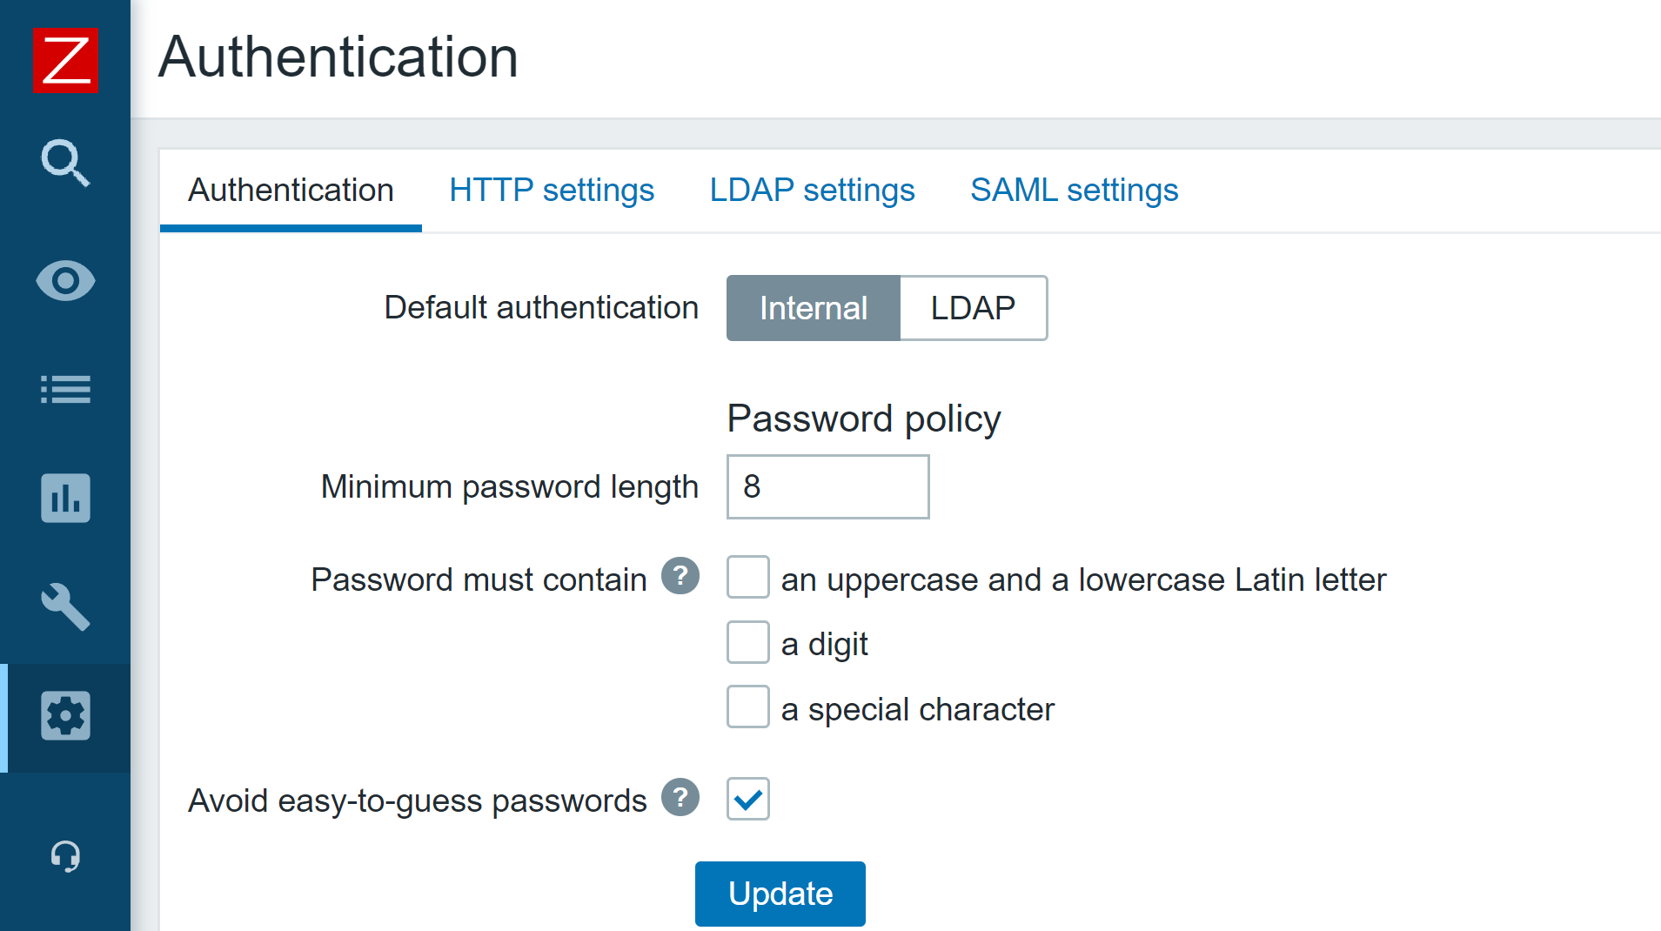
In Zabbix 6.0 LTS it is possible to define custom password complexity requirements for Zabbix frontend logins. We can define password length/complexity policies and prohibit the usage of easy to guess common passwords.

The Zabbix API has also seen some security improvements. Now it is possible to generate a persistent API token for a particular user, define an expiration date and use the token in your API calls, without the need to regularly re-issue a new API token.

Zabbix 5.2 release also added the ability to store sensitive information in an external vault. As of the release of Zabbix 6.0 LTS, only HashiCorp Vault is supported, but CyberArk Vault support is also coming in Zabbix 6.2 release.

A set of architectural and structural measures have been taken to completely restructure the Zabbix Audit log. The updated Audit log entry contains records of all configuration changes made by the Zabbix server and Zabbix frontend. The new Audit log also contains additional filtering options, such as filtering Audit log entries based on the operation during which the changes were performed. The new Audit log is not only more detailed but also reworked with minimum performance impact in mind.

Scalability improvements

Many scalability improvements have been introduced between the Zabbix 5.0 LTS release and Zabbix 6.0 LTS release. These improvements not only improve the performance of existing Zabbix instances but also lay the groundwork for the design of upcoming features in later releases.

Previously, trend-based trigger functions would always use database queries to obtain the required data. Starting from Zabbix 5.4, a new type of cache – Trend function cache, has been introduced. This cache stores the results of calculated trend functions. When processing the trend functions, the Zabbix server will check the Trend function cache for the cached results. In case of failure, the Zabbix server will read the data from the database and cache the results.

The scalability improvements allow for better parallel data processing on Zabbix servers with heavy loads. Zabbix Instances with tens of thousands or more new values per second will greatly benefit from the improved performance.

The introduction of the graceful startup of the Zabbix server can help you improve performance and prevent unwanted downtimes, especially with large distributed environments. Whenever a Zabbix server gets started up after downtime, the existing Zabbix proxies start sending the data backlog to the Zabbix server. it is extremely important to maintain the stability and performance of the Zabbix server during this time window. Graceful startup improves the Zabbix server data backlog handling logic during such situations.

To prevent unwanted delays and other issues when using zabbix_get and zabbix_sender command-line tools, it is now possible to define a custom Timeout parameter for these tools.

Advanced business service monitoring

The new Busines service monitoring features allow Zabbix users to not only define complex service trees but also receive alerts in situations where the status of a business service has been changed. This is valuable to every user that wishes to monitor their business services, no matter how simple or complex the service is.

Combined with a large number of new and improved service status calculation rules. By defining custom service weights and advanced service status propagation rules, the business services can be defined in an extremely flexible fashion. Services are also not linked to individual triggers anymore, instead, we use tag-based service mapping to map our services to problem events.

The service functionality has also received scalability improvements. Zabbix can support the monitoring of over 100 000 business services. The scalability improvements have been implemented from both the UI/UX and the performance perspectives.

The old all-or-nothing business service permission approach has been redesigned to a granular read/write permissions for individual business services. This is not only an improvement from the security perspective, but also adds the ability to define services in a multi-tenant fashion, where each tenant has access only to the services that they own.

With the redesign of the business services, we have added the support for root cause analysis, allowing users to see the underlying problem which caused a particular service to change its state.

You can read more about Business service monitoring in our Zabbix Summit blog post dedicated to this topic.

Tag and template improvements

Item applications have been replaced with tags. This design decision adds consistency to filtering, mapping, grouping, and other tag-related functions when it comes to different Zabbix entities. Tags can also be used to provide additional information related to your entities in a manner that is much more flexible than it was with applications.

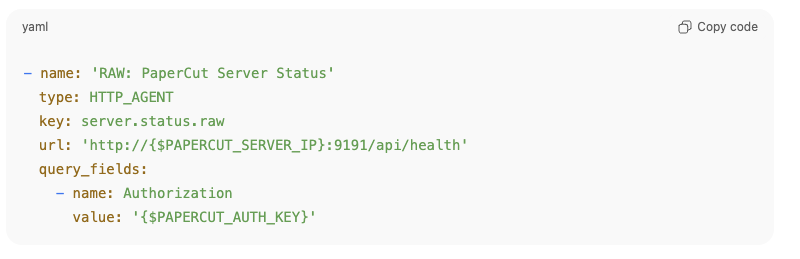
Universal template IDs introduced for each of the template elements allow you to define much more robust template management workflows, especially when you combine this with a CI/CD template management approach. These IDs are unique and can be used to match a particular template entity, such as item, trigger, graph, and so on. By utilizing the Universal template IDs, Zabbix now understands which entity we are trying to update, which entity no longer exists, whether it is a new entity or we are adjusting an existing entity. The default template export format is now YAML, though JSON and XML formats are still supported. This was done to improve the template management usability since the YAML format is more user-friendly and easier to edit manually. All of the official Zabbix templates available on the Zabbix git page have already been converted to the YAML format.

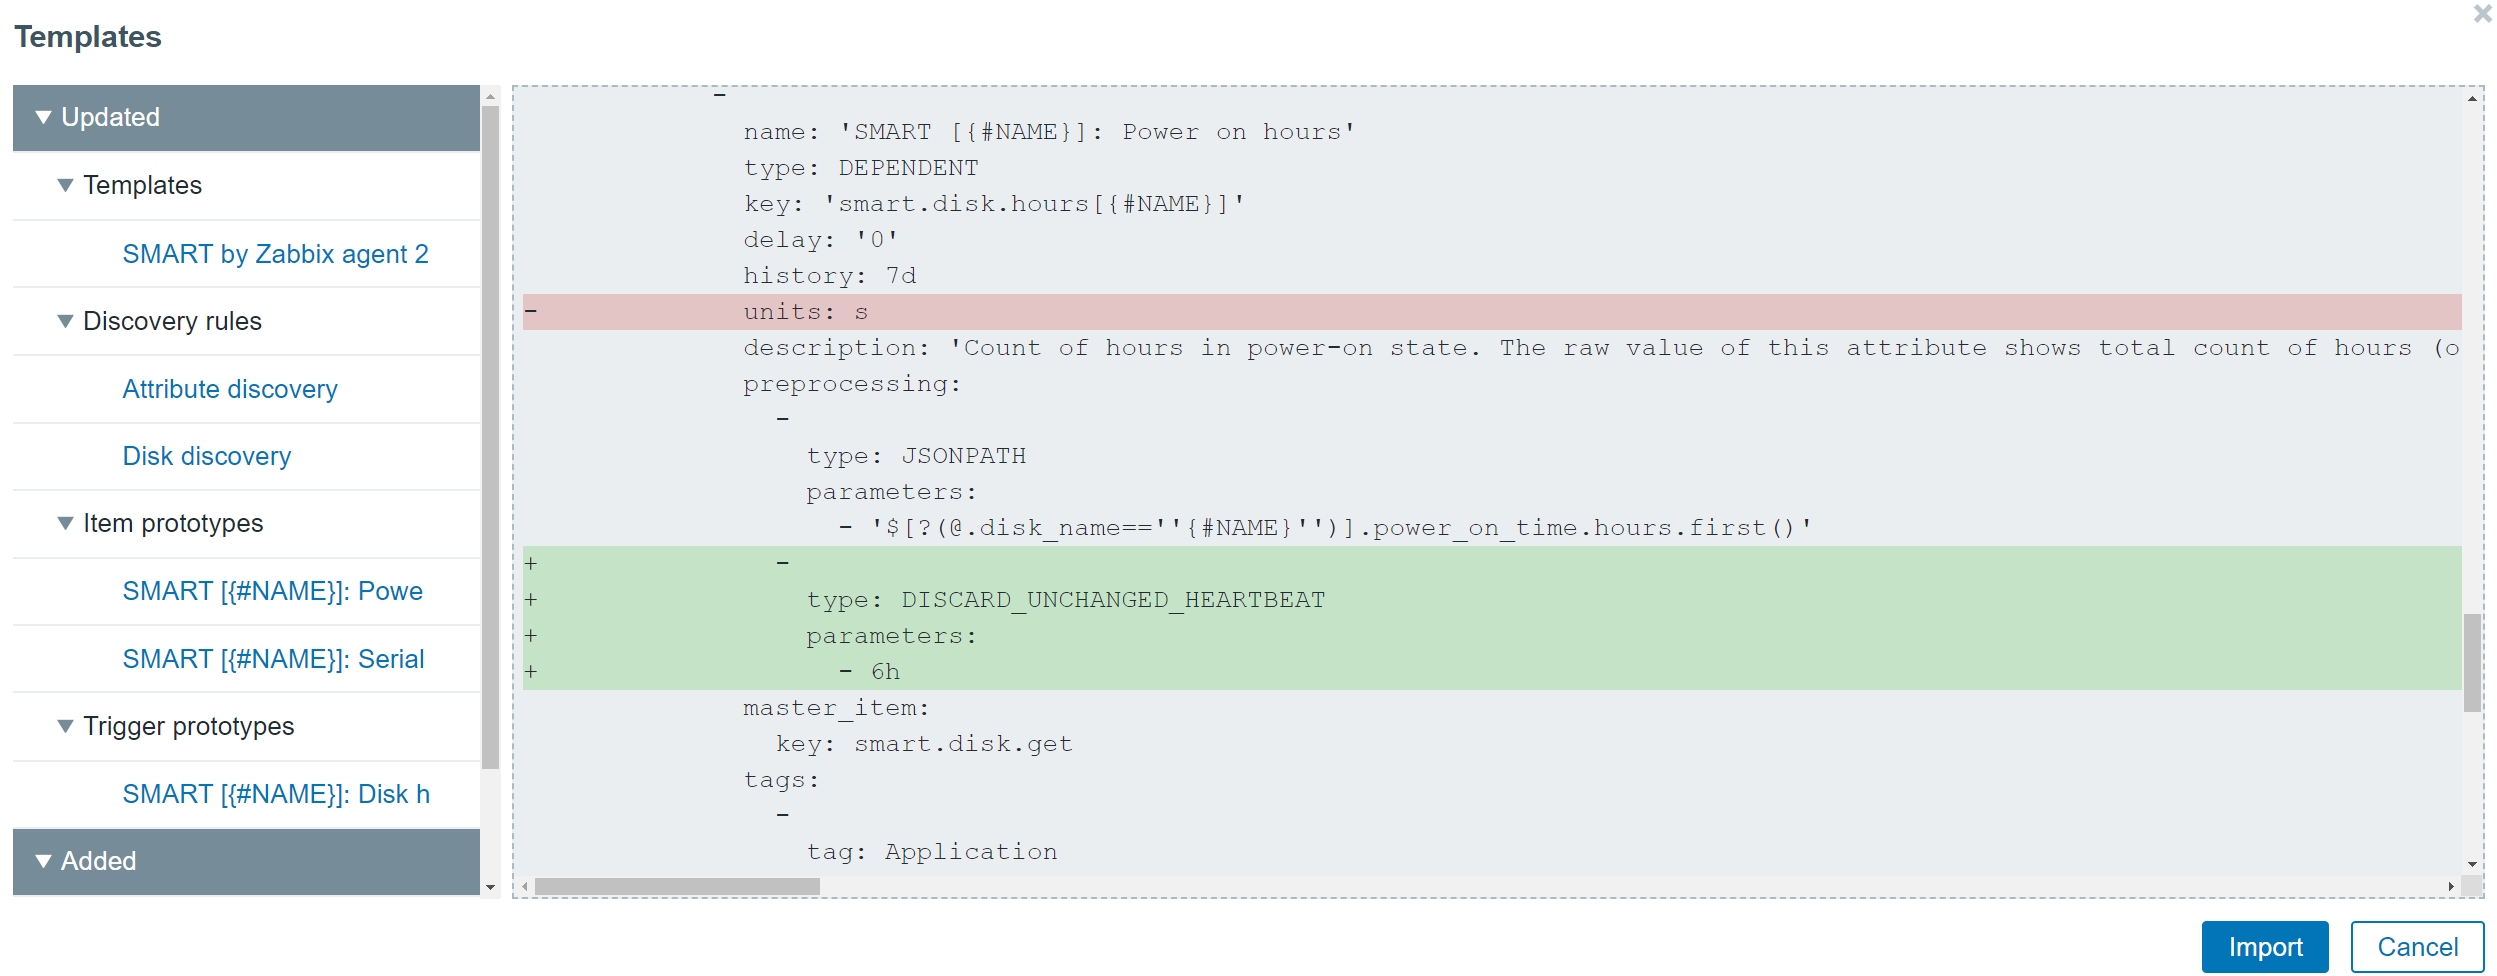
The redesign of the templates has also allowed us to improve the visualization of the changes made when importing a template. Now users can see the list of changes in a diff-like display and understand the impact that the template import will have on the  Zabbix entities.

Value maps have been moved to host and template levels. This is another design decision that we made to enable support for fully self-contained templates, that are easy to manage and deploy, and can be easily imported into different Zabbix environments. While global value maps might be easy to manage in small environments, this is not the case in larger environments, where different teams are working with a single or between multiple Zabbix instances. Therefore, the global value maps have been removed.

Reporting and visualization

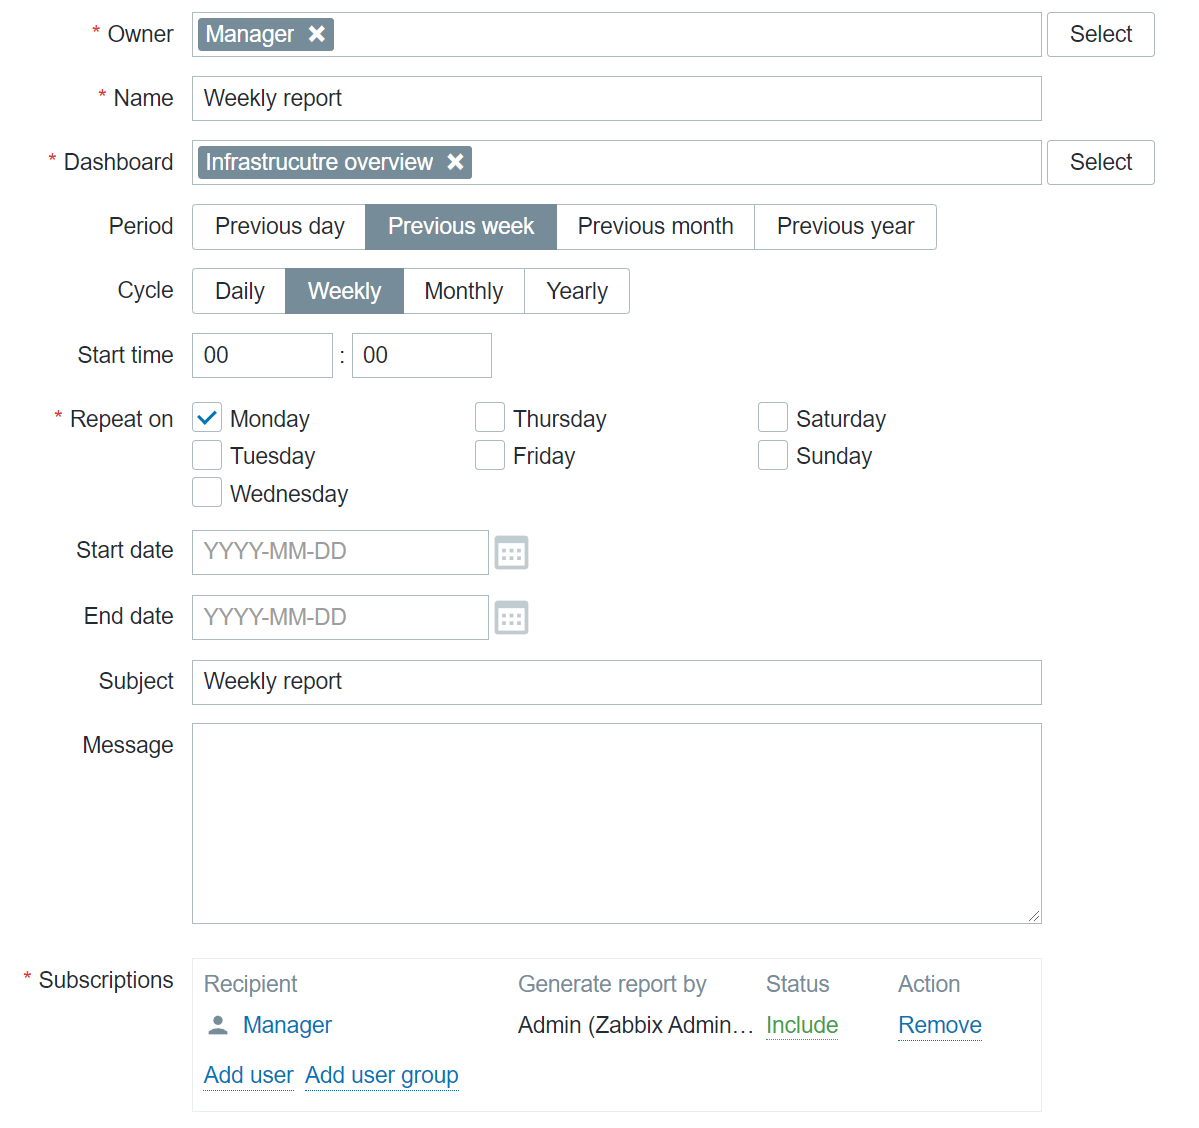
With the addition of Scheduled reports functionality, any dashboard can now be converted into a scheduled report. While this feature was originally added in Zabbix 5.4, with the release of Zabbix 6.0 LTS and a set of new widgets, the reporting functionality has gained a lot of additional value that these widgets grant specifically from the reporting perspective. Users can create scheduled reports and receive them in their mailbox at a specific time either on a daily, weekly, monthly, or yearly basis. The time period for which the report will provide the information can also be selected.

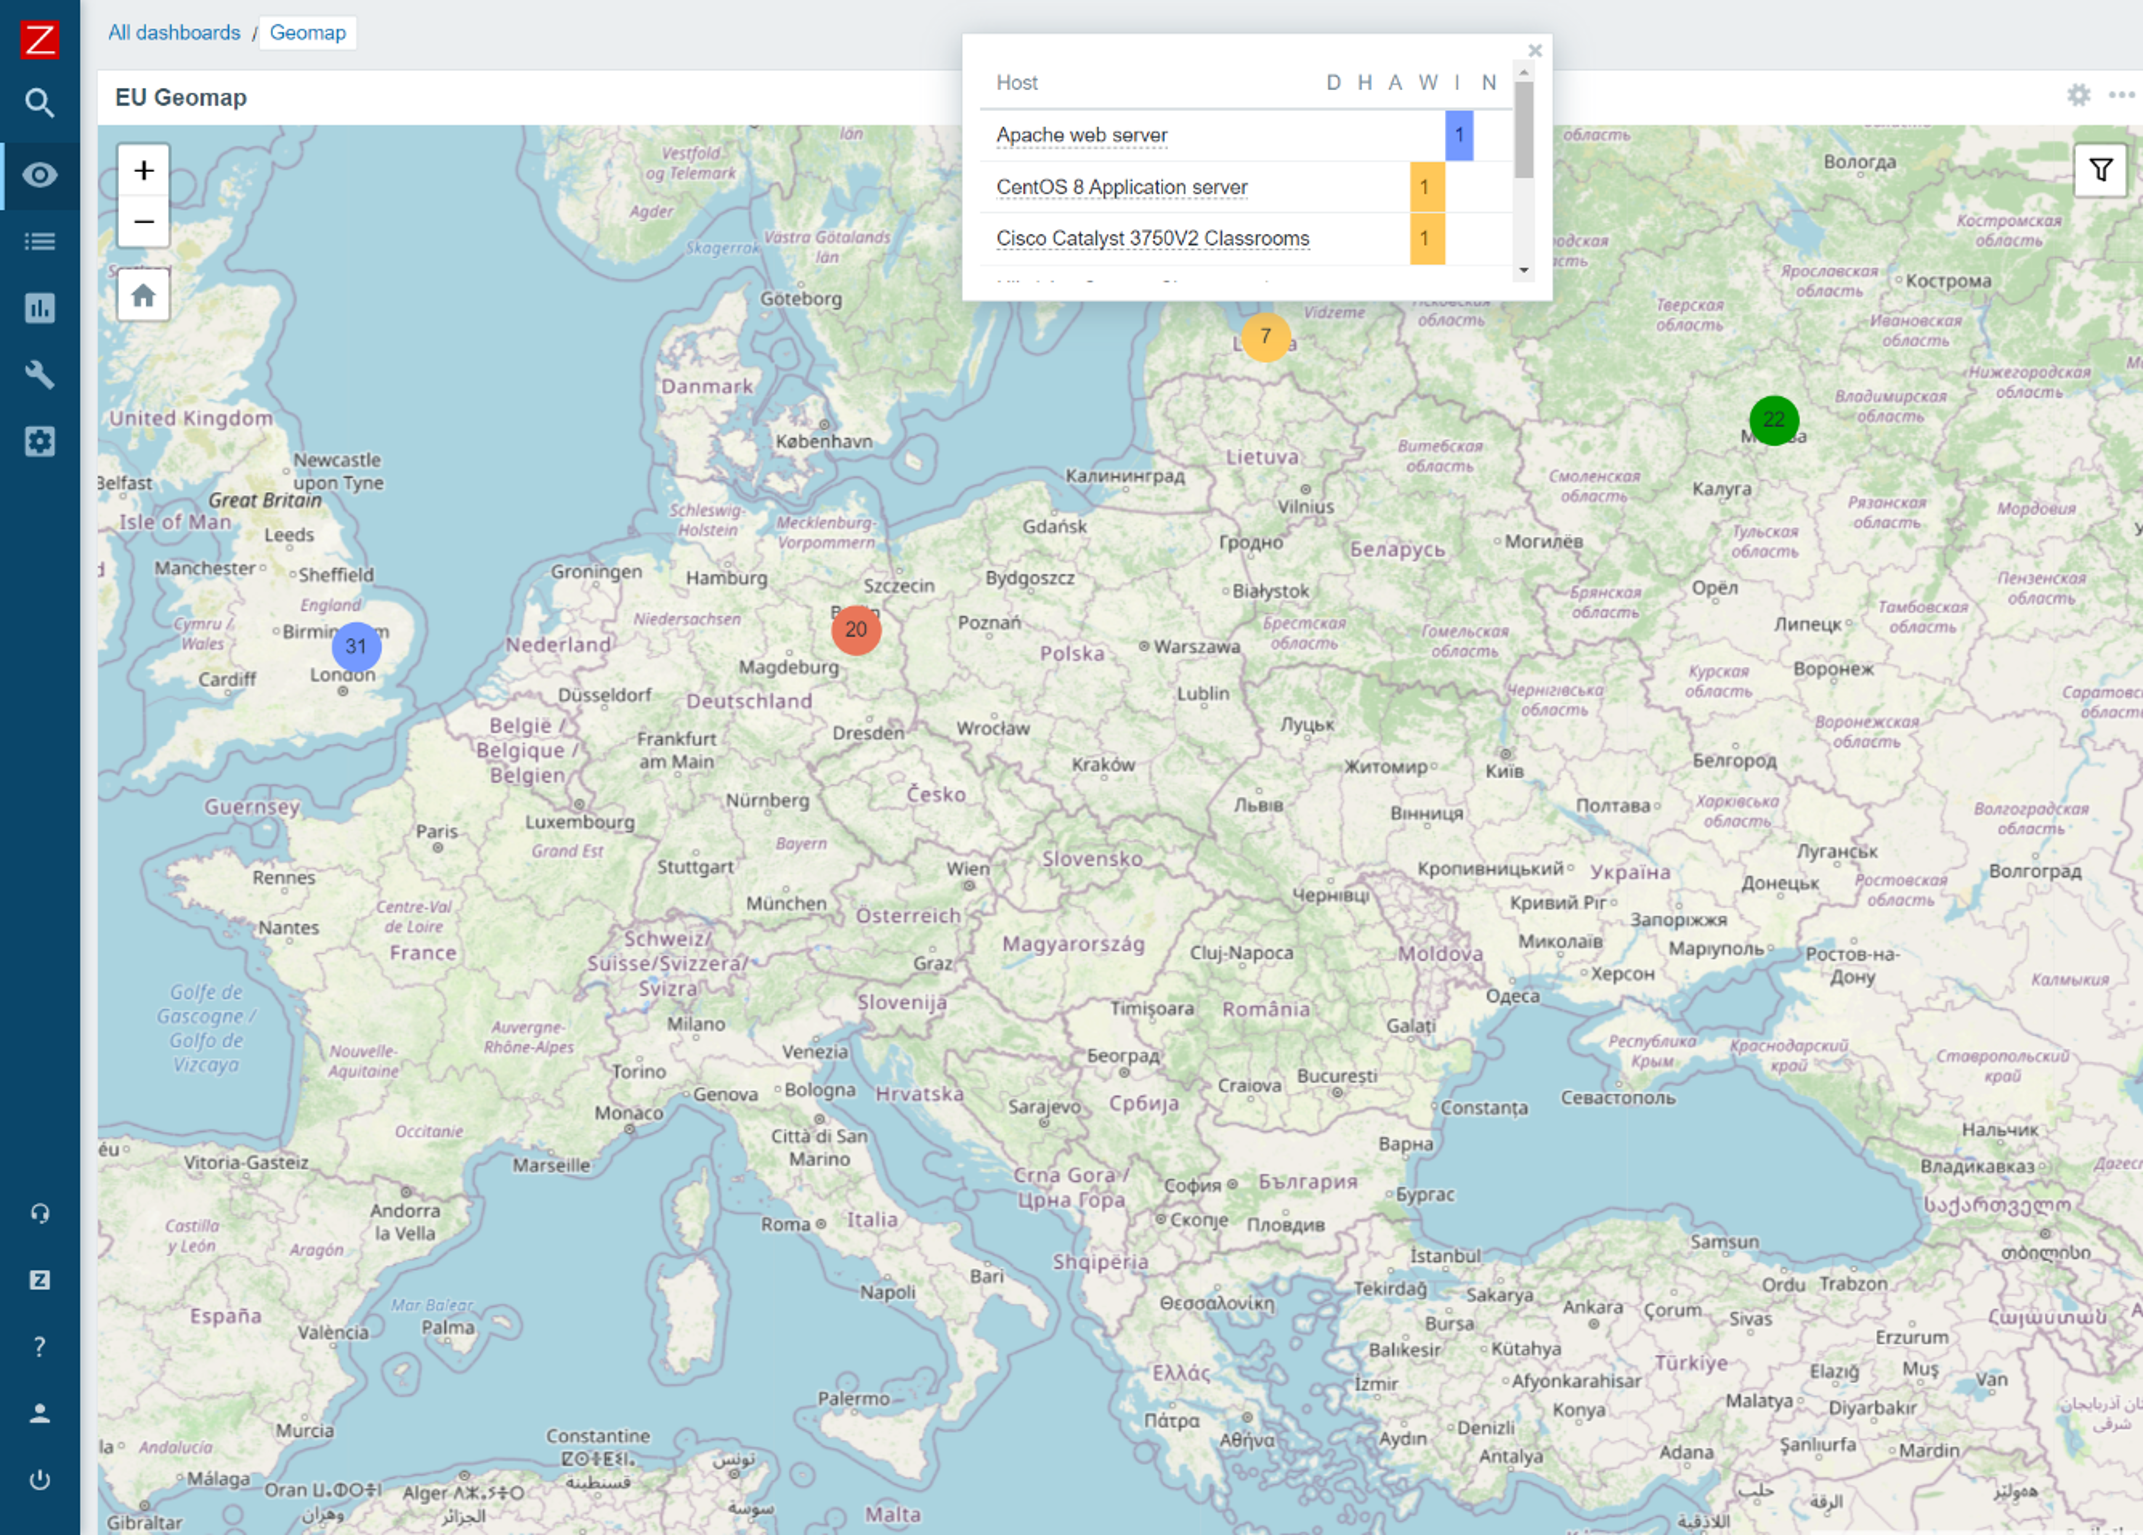
The new Geographical map widget allows you to quickly deploy a geomap with an overview of the state of your infrastructure. The geomap widget supports filters, so we can display only a particular part of your infrastructure. Zabbix uses an open-source Javascript interactive maps library called Leaflet and supports multiple map providers such as OpenStreetMap, OpenTopoMap, USGS US Topo, and more. Users also have the ability to define and use a custom map tile provider. The map will display your infrastructure and also highlight any detected problems as well as display problem counters. This is a major step forward from the old approach, which required users to use the regular map functionality together with Zabbix API scripting, to provide information on a geographical map.

Advanced problem detection

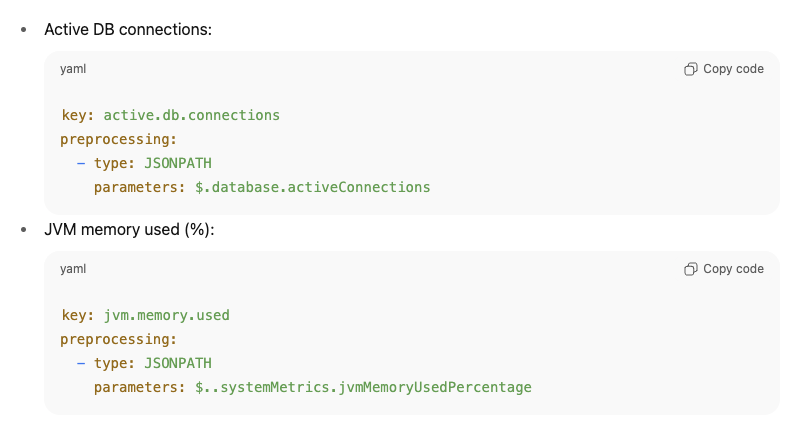
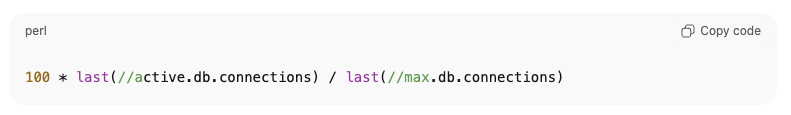
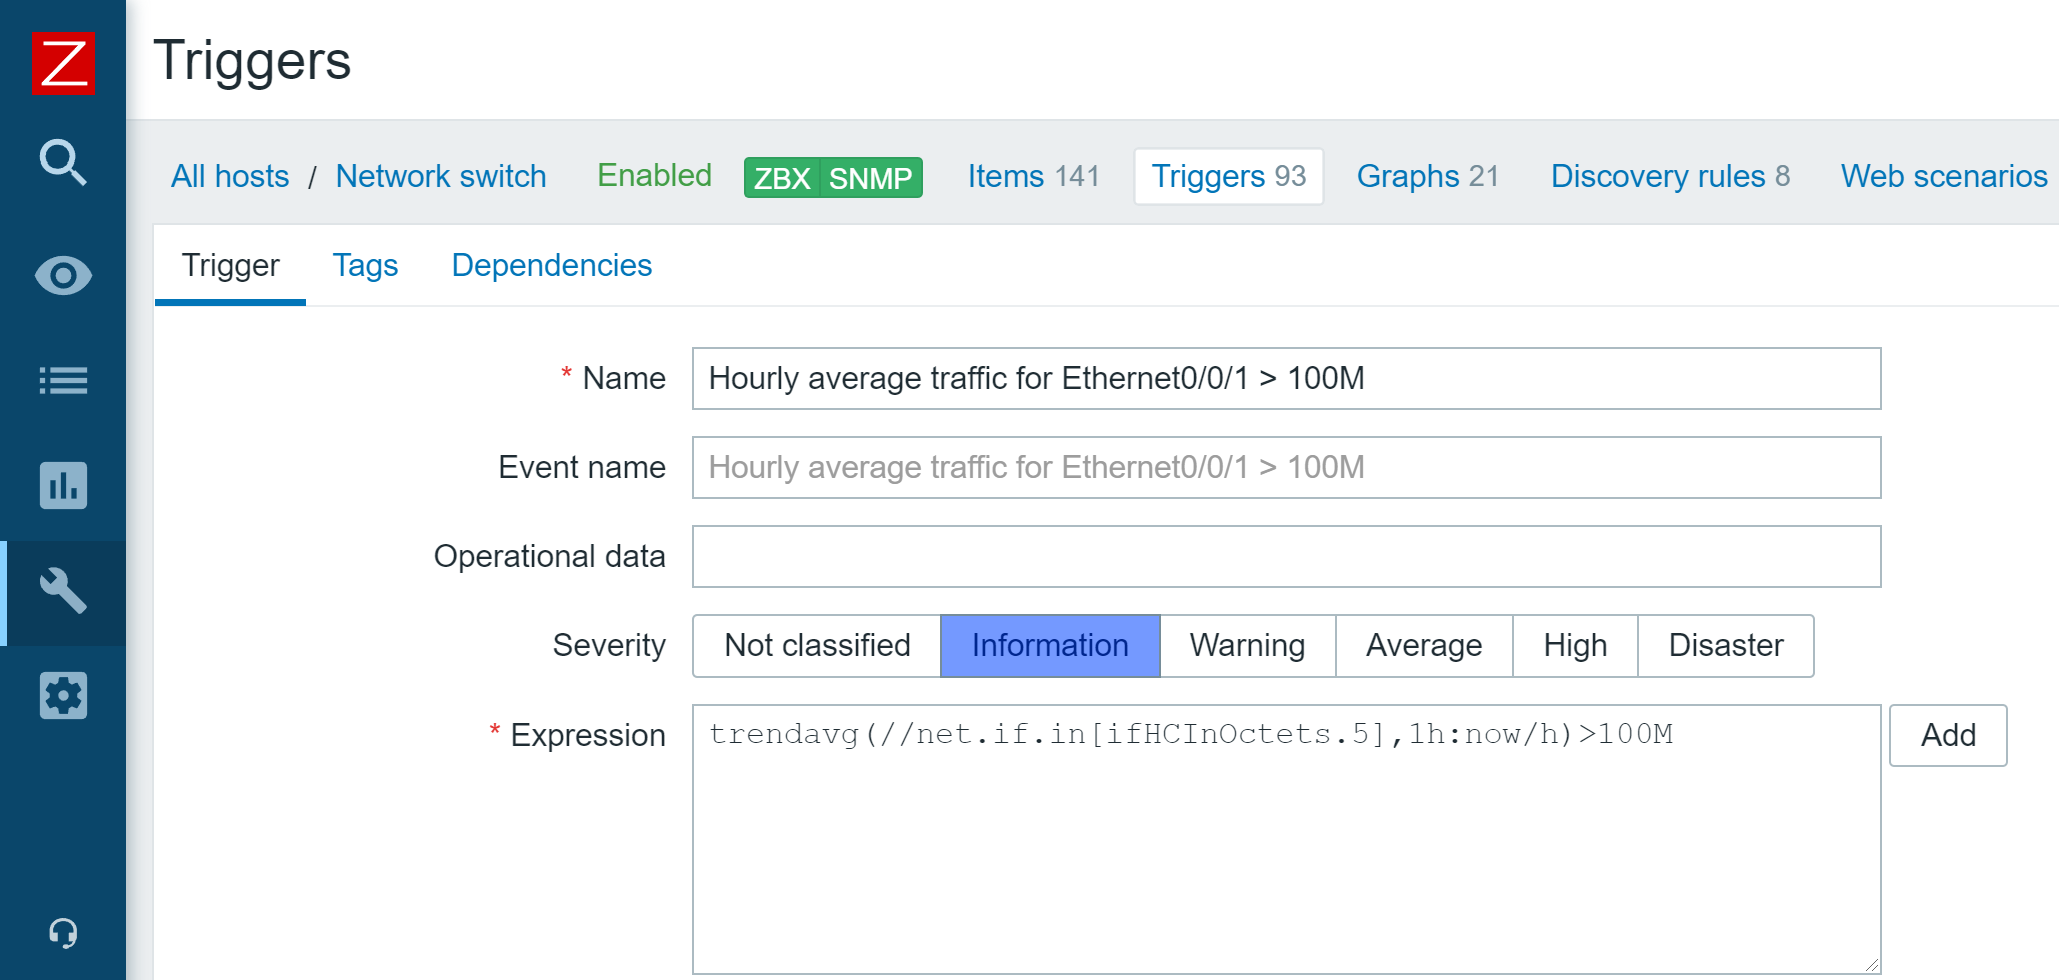
Zabbix 5.4 release introduced a new unified syntax for defining trigger expressions, calculated, and aggregated items. There are multiple benefits that come with the new trigger syntax. First off – the syntax is now unified and can be used for defining triggers, calculated items, and providing values in maps or graph names. The syntax also has a more functional approach, instead of being object-oriented. This allows us to solve many complex use cases, for example dynamically calculate or aggregate a value from all hosts tagged with a specific tag or belonging to a specific host group. Aggregated item type has also been removed and users can now define aggregate checks under the calculated item type.

New monitoring functionality and integrations

As with every major release, Zabbix 6.0 LTS comes with a set of new items and improves the functionality of already existing items:

  • It is now possible to monitor SSL certificate validity and expiration data, such as the expiry date, issuer, version, subject, and more
  • New Zabbix Agent 2 metrics allow you to collect file owner information, file properties, extended interface info, extended TCP info, SHA2 hashes for files, and more
  • New templates for NGINX+, HPE/Dell servers, CISCO ASAv, Cloudflare

Finally – Zabbix 6.0 LTS

Many of our users and customers prefer sticking with the LTS releases instead of upgrading between each major version. As with every LTS release, there are major benefits to sticking with Zabbix 6.0 LTS:

  • LTS release receive thorough testing and full long term support
    • 3 years of full support – general, critical, and security fixes/improvements
    • 5 years of limited support – critical and security fixes

Questions

Q: Which of the current versions are still supported and for how long are they going to remain supported? What updates can we expect these versions to receive?

A: Currently we have three supported major versions available. Zabbix 5.4, which will not be supported after the release of Zabbix 6.0 LTS. We also still provide support for Zabbix 5.0 LTS and Zabbix 4.0 LTS. Zabbix 5.0 LTS will continue receiving full support until the middle of 2023 and limited support until the middle of 2025, while Zabbix 4.0 LTS will receive limited support until November 2023.


Q: Could you elaborate on how tags are more flexible than applications and are there any other benefits to using tags?

A: Zabbix already supports tags for most of the essential Zabbix objects, such as triggers, hosts, host prototypes, and templates. With the introduction of tags for items, tags can now be found everywhere. This way you can have tags that provide different additional information and assign values for your objects. Tags have several usages – for example, we can use them to mark events. If we have an item with a tag, this tag will mark any problem related to this item. Problem events will inherit tags from the whole tag chain – hosts, templates, triggers, items, and more. Further down the line, we can use our actions to react to specific tags. If you recall, Business services are also mapped to problems based on the tag mapping. Of course, tags can also be used for filtering and grouping different Zabbix objects.


Q: Is there a guideline to the migration process from an older version to Zabbix 6.0 LTS? Is there a change list that I can look at to see what other features have received an overhaul?

A: Regarding the upgrade itself – our documentation contains guidelines for both upgrading from packages and upgrading from sources. The documentation may also contain upgrade notes regarding any extra steps or precautions required when upgrading to a particular version. Regarding the feature changes – we recommend reading through the major version release notes. For example, if you’re upgrading from Zabbix 5.0 LTS to Zabbix 6.0 LTS, make sure to familiarize yourself not only with the Zabbix 6.0 LTS release notes, but also read through the Zabbix 5.2 and Zabbix 5.4 release notes, since changes introduced in these versions will also be a part of Zabbix 6.0 LTS.

The post Top 10 reasons to migrate to Zabbix 6.0 LTS by Dmitry Krupornitsky / Zabbix Summit Online 2021 appeared first on Zabbix Blog.

Build Zabbix Server HA Cluster in 10 minutes by Kaspars Mednis / Zabbix Summit Online 2021

Post Syndicated from Kaspars Mednis original https://blog.zabbix.com/build-zabbix-server-ha-cluster-in-10-minutes-by-kaspars-mednis-zabbix-summit-online-2021/18155/

With the native Zabbix server HA cluster feature added in Zabbix 6.0 LTS, it is now possible to quickly configure and deploy a multi-node Zabbix Server HA cluster without using any external tools. Let’s take a look at how we can deploy a Zabbix server HA cluster in just 10 minutes.

The full recording of the speech is available on the official Zabbix Youtube channel.

Why Zabbix needs HA

Let’s dive deeper into what high availability is and try to define what the term High availability entails:

  • A system runs in high availability mode if it does not have a single point of failure
  • A single point of failure is a component failure of which halts the whole system
  • Redundancy is a requirement in systems that use high availability. In our case, we need a redundant component to which we can fail-over in case if the currently active component encounters an issue.
  • The failover process needs to be transparent and automated

In the case of the Zabbix components, the single point of failure is our Zabbix server. Even though Zabbix in itself is very stable, you can still encounter scenarios when a crash happens due to OS level issues or something more trivial – like running out of disk space. If your Zabbix server goes down, all of the data collection, problem detection, and alerting is stopped. That’s why it’s important to have some form of high availability and redundancy for this particular Zabbix component.

How to choose HA for Zabbix

Before the addition of native HA cluster support in Zabbix 6.0 LTS it was possible to use 3rd party HA solutions for Zabbix. This caused an ongoing discussion – which 3rd party solution should I use and how should I configure it for Zabbix components? On top of this, you would also have a new layer of software that requires proper expertise to deploy, configure and manage. There are also cloud-based HA options, but most of the time these incur an extra cost.

Not having the required expertise for the 3rd party high availability tools can cause unwanted downtimes or, at worst, can cause inconsistencies in the Zabbix DB backend. Here are some of the potential scenarios that can be caused by a misconfigured high availability solution:

  • The automatic failover may not be configured properly
  • A split-brain scenario with two nodes running concurrently, potentially causing inconsistencies in the Zabbix database backend
  • Misconfigured STONITH (Shoot the other node in the head) scenarios – potentially causing both nodes to go down

Native Zabbix HA solution

Zabbix 6.0 LTS native high availability solution is easy to set up and all of the required steps are documented in the Zabbix documentation. The native solution does not require any additional expertise and will continue to be officially supported, updated, and improved by Zabbix. Native high availability solution doesn’t require any new software components – the high availability solution stores the information about the Zabbix server node status in the Zabbix database backend.

How Zabbix cluster works

To enable the native high availability cluster for our servers, we first need to start the Zabbix server component in the high availability mode. To achieve this, we need to look at the two new parameters in the /etc/zabbix/zabbix_server.conf configuration file:

  • HANodeName – specify an arbitrary name for your Zabbix server cluster node
  • ExternalAddress – specify the address of the cluster node

Once you have made the changes and added these parameters, don’t forget to restart the Zabbix server cluster nodes to apply the changes.

Zabbix HA Node name

Let’s take a look at the HANodeName parameter. This is the most important configuration parameter – it is mandatory to specify it if you wish to run your Zabbix server in the high availability mode.

  • This parameter is used to specify the name of the particular cluster mode
  • If the HANodeName is not specified, Zabbix server will not start in the cluster mode
  • The node name needs to be unique on each of your nodes

In our example, we can observe a two-node cluster, where zbx-node1 is the active node and zbx-node2 is the standby node. Both of these nodes will send their heartbeats to the Zabbix database backend every 5 seconds. If one node stops sending its heartbeat, another node will take over.

Zabbix HA Node External Address

The second parameter that you will also need to specify is the ExternalAddress parameter.

In our example, we are using the address node1.example.com. The purpose of this parameter is to let the Zabbix frontend know the address of the currently active Zabbix server since the Zabbix frontend component also constantly communicates with the Zabbix server component. If this parameter is not specified, the Zabbix frontend might not be able to connect to the active Zabbix server node.

Zabbix frontend setup

Seasoned Zabbix users might know that the Zabbix frontend has its own configuration file, which usually contains the Zabbix server address and the Zabbix server port for establishing connections from the Zabbix frontend to the Zabbix server. If you are using the Zabbix high availability cluster, then you will have to comment these parameters out since instead of being static, now they depend on the currently active Zabbix server node and will be obtained from the Zabbix backend database.

Putting it all together

In the above example, we can see that we have two nodes – zbx-node1, which is currently active and zbx-node2. These nodes can be reachable by using the external addresses – node1.example.com and node2.example.com for zbx-node1 and zbx-node2 respectively. We can see that we also have deployed multiple frontends. Each of these frontend nodes will connect to the Zabbix backend database, read the address of the currently active node and proceed to connect to that node.

Zabbix HA node types

Zabbix server high availability cluster nodes can have one of the following multiple statuses:

  • Active – The currently active node. Only one node can be active at a time
  • Standby – The node is currently running in standby mode. Multiple nodes can have this status
  • Shutdown – The node was previously detected, but it has been gracefully shut down
  • Unreachable – Node was previously detected but was unexpectedly lost without a shutdown. This can be caused by many different reasons, for example – the node crashing or having network issues

In normal circumstances, you will have an active node and one or more standby nodes. Nodes in shutdown mode are also expected if, for example, you’re performing some maintenance tasks on these nodes. On the other hand, if an active node becomes unreachable, this is when one of the standby nodes will take over.

Zabbix HA Manager

How can we check which node is currently active and which nodes are running in standby mode? First off, we can see this in the Zabbix frontend – we will take a look at this a bit later. We can also check the node status from the command line. On every node – no matter active or standby, you will see that the zabbix_server and ha manager processes have been started. The ha manager process is responsible for checking the high availability node status in the database every 5 seconds and is responsible for taking over if the active node fails.

On the other hand, the currently active Zabbix server node will have many other processes – data collector processes such as pollers and trappers, history and configuration syncers, and many other Zabbix child processes.

Zabbix HA node status

The System information widget has received some changes in Zabbix 6.0 LTS. It is now capable of displaying the status of your Zabbix server high availability cluster and its individual nodes.

The widget can display the current cluster mode, which is enabled in our example and provides a list of all cluster nodes. In our example, we can see that we have 3 nodes – 1 active node,1 stopped node, and 1 node running in standby mode. This way we can not only see the status of our nodes but also their names, addresses, and last access times.

Switching Zabbix HA node

The witching between nodes is done manually. Once you stop the currently active Zabbix server node, another node will automatically take over. Of course, you need to have at least one more node running in standby status, so it can take over from the failed active node.

How failover works?

All nodes report their status every 5 seconds. Whenever you shut down a node, it goes into a shutdown state and in 5 seconds another node will take over. But if a node fails the workflow is a bit different. This is where something called a failover delay is taken into account. By default, this failover delay is 1 minute. The standby node will wait for one minute for the failed active node to update its status and if in one minute the active node is still not visible, then the standby node will take over.

Zabbix cluster tuning

It is possible to adjust the failover delay by using the ha_set_failover_delay runtime command. The supported range of the failover delay is from 10 seconds to 15 minutes. In most cases the default value of 1 minute will work just fine, but there could be some exceptions and it very much depends on the specifics of your environment.

We can also remove a node by using the ha_remove_node runtime command. This command requires us to specify the ID of the node that we wish to remove.

Connecting agents and proxies

Connecting Zabbix agents to your cluster

Now let’s talk about how we can connect Zabbix agents and proxies to your Zabbix cluster. First, let’s take a look at the passive Zabbix agent configuration.

  • Passive Zabbix agents require all nodes to be written in the configuration file under the Server parameter
  • Nodes are specified in a comma-separated list

Once you specify the list of all nodes, the passive Zabbix agent will accept connections from all of the specified nodes.

What about the active Zabbix agents?

  • Active Zabbix agents require all nodes to be written in the configuration file under the ServerActive parameter
  • Nodes need to be separated by semicolons

Notice the difference – comma-separated list for passive Zabbix agents and nodes separated by semicolons for active Zabbix agents!

Connecting Zabbix proxies to your cluster

Proxy configuration is very similar to the agent configuration. Once again – we can have a proxy running either in passive mode or active mode.

For the passive Zabbix proxies, we need to list our cluster nodes under the Server parameter in the proxy configuration file. These nodes should be specified in a comma-separated list. This way the proxies will accept connections from any Zabbix server node. As for the active Zabbix proxies – we need once again to list our nodes under the Server parameter, but this time the node names will be separated by semicolons.

Conclusion – Setting up Zabbix HA cluster

Let’s conclude by going through all of the steps that are required to set up a Zabbix server HA cluster.

  • Start Zabbix server in high availability mode on all of your Zabbix server cluster nodes – this can be done by providing the HANodeName parameter in the Zabbix server configuration file
  • Comment out the $ZBX_SERVER and $ZBX_SERVER_PORT in the frontend configuration file
  • List your cluster nodes in the Server and/or ServerActive parameters in the Zabbix agent configuration file for all of the Zabbix agents
  • List your cluster nodes in the Server parameter for all of your Zabbix proxies
  • For other monitoring types, such as SNMP – make sure your endpoints accept connections from all of the Zabbix server cluster nodes
  • And that’s it – Enjoy!

Zabbix HA workshop and training

Wish to learn more about the Zabbix server high availability cluster and get some hands-on experience with the guidance of a Zabbix certified trainer? Take a look at the following options!

  • The Zabbix server high availability workshop will be hosted shortly after the release of Zabbix 6.0 LTS, which is currently planned for January 2022. One of the workshop sessions will be focused specifically on Zabbix server high availability cluster configuration and troubleshooting.
  • Zabbix Certified professional training course covers the Zabbix server HA cluster configuration and troubleshooting. This is also a great opportunity to discuss your own Zabbix use cases and infrastructure with a Zabbix certified trainer. Feel free to check out our Zabbix training page to learn more!

Questions

Q: What about the high availability for the Zabbix frontend? Is it possible to set it up?
A: This is already supported since Zabbix 5.2. All you have to do is deploy as many Zabbix frontend nodes as you require and don’t forget to properly configure the external address so the Zabbix frontends are able to connect to the Zabbix servers and that’s all!

Q: Does high availability cause a performance impact on the network or the Zabbix backend database?
A: No, this should not be the case. The heartbeats that the cluster nodes send to the database backend are extremely small messages that get recorded in one of the smaller Zabbix database tables, so the performance impact should be negligible.

Q: What is the best practice when it comes to migrating from a 3rd party solution such as PCS/Corosync/Pacemaker to the native Zabbix server high availability cluster? Any suggestions on how that can be achieved?
A: The most complex part here is removing the existing high availability solution without breaking anything in the existing environment. Once that is done, all you have to do is upgrade your Zabbix instance to Zabbix 6.0 LTS and follow the configuration steps described in this post. Remember, that if you’re performing an upgrade instead of a fresh install, the configuration files will not have the new configuration parameters so they will have to be added in manually.

What’s new in Zabbix 6.0 LTS by Artūrs Lontons / Zabbix Summit Online 2021

Post Syndicated from Arturs Lontons original https://blog.zabbix.com/whats-new-in-zabbix-6-0-lts-by-arturs-lontons-zabbix-summit-online-2021/17761/

Zabbix 6.0 LTS comes packed with many new enterprise-level features and improvements. Join Artūrs Lontons and take a look at some of the major features that will be available with the release of Zabbix 6.0 LTS.

The full recording of the speech is available on the official Zabbix Youtube channel.

If we look at the Zabbix roadmap and Zabbix 6.0 LTS release in particular, we can see that one of the main focuses of Zabbix development is releasing features that solve many complex enterprise-grade problems and use cases. Zabbix 6.0 LTS aims to:

  • Solve enterprise-level security and redundancy requirements
  • Improve performance for large Zabbix instances
  • Provide additional value to different types of Zabbix users – DevOPS and ITOps teams, Business process owner, Managers
  • Continue to extend Zabbix monitoring and data collection capabilities
  • Provide continued delivery of official integrations with 3rd party systems

Let’s take a look at the specific Zabbix 6.0 LTS features that can guide us towards achieving these goals.

Zabbix server High Availability cluster

With the release of Zabbix 6.0 LTS, Zabbix administrators will now have the ability to deploy Zabbix server HA cluster out-of-the-box. No additional tools are required to achieve this.

Zabbix server HA cluster supports an unlimited number of Zabbix server nodes. All nodes will use the same database backend – this is where the status of all nodes will be stored in the ha_node table. Nodes will report their status every 5 seconds by updating the corresponding record in the ha_node table.

To enable High availability, you will first have to define a new parameter in the Zabbix server configuration file: HANodeName

  • Empty by default
  • This parameter should contain an arbitrary name of the HA node
  • Providing value to this parameter will enable Zabbix server cluster mode

Standby nodes monitor the last access time of the active node from the ha_node table.

  • If the difference between last access time and current time reaches the failover delay, the cluster fails over to the standby node
  • Failover operation is logged in the Zabbix server log

It is possible to define a custom failover delay – a time window after which an unreachable active node is considered lost and failover to one of the standby nodes takes place.

As for the Zabbix proxies, the Server parameter in the Zabbix proxy configuration file now supports multiple addresses separated by a semicolon. The proxy will attempt to connect to each of the nodes until it succeeds.

Other HA cluster related features:

  • New command-line options to check HA cluster status
  • hanode.get API method to obtain the list of HA nodes
  • The new internal check provides LLD information to discover Zabbix server HA nodes
  • HA Failover event logged in the Zabbix Audit log
  • Zabbix Frontend will automatically switch to the active Zabbix server node

You can find a more detailed look at the Zabbix Server HA cluster feature in the Zabbix Summit Online 2021 speech dedicated to the topic.

Business service monitoring

The Services section has received a complete redesign in Zabbix 6.0 LTS. Business Service Monitoring (BSM) enables Zabbix administrators to define services of varying complexity and monitor their status.

BSM provides added value in a multitude of use cases, where we wish to define and monitor services based on:

  • Server clusters
  • Services that utilize load balancing
  • Services that consist of a complex IT stack
  • Systems with redundant components in place
  • And more

Business Service monitoring has been designed with scalability in mind. Zabbix is capable of monitoring over 100k services on a single Zabbix instance.

For our Business Service example, we used a website, which depends on multiple components such as the network connection, DB backend, Application server, and more. We can see that the service status calculation is done by utilizing tags and deciding if the existing problems will affect the service based on the problem tags.

In Zabbix 6.0 LTS there are many ways how service status calculations can be performed. In case of a problem, the service state can be changed to:

  • The most critical problem severity, based on the child service problem severities
  • The most critical problem severity, based on the child service problem severities, only if all child services are in a problem state
  • The service is set to constantly be in an OK state

Changing the service status to a specific problem severity if:

  • At least N or N% of child services have a specific status
  • Define service weights and calculate the service status based on the service weights

There are many other additional features, all of which are covered in our Zabbix Summit Online 2021 speech dedicated to Business Service monitoring:

  • Ability to define permissions on specific services
  • SLA monitoring
  • Business Service root cause analysis
  • Receive alerts and react on Business Service status change
  • Define Business Service permissions for multi-tenant environments

New Audit log schema

The existing audit log has been redesigned from scratch and now supports detailed logging for both Zabbix server and Zabbix frontend operations:

  • Zabbix 6.0 LTS introduces a new database structure for the Audit log
  • Collision resistant IDs (CUID) will be used for ID generation to prevent audit log row locks
  • Audit log records will be added in bulk SQL requests
  • Introducing Recordset ID column. This will help users recognize which changes have been made in a particular operation

The goal of the Zabbix 6.0 LTS audit log redesign is to provide reliable and detailed audit logging while minimizing the potential performance impact on large Zabbix instances:

  • Detailed logging of both Zabbix frontend and Zabbix server records
  • Designed with minimal performance impact in mind
  • Accessible via Zabbix API

Implementing the new audit log schema is an ongoing effort – further improvements will be done throughout the Zabbix update life cycle.

Machine learning

New trend functions have been added which utilize machine learning to perform anomaly detection and baseline monitoring:

  • New trend function – trendstl, allows you to detect anomalous metric behavior
  • New trend function – baselinewma, returns baseline by averaging data periods in seasons
  • New trend function – baselinedev, returns the number of standard deviations

An in-depth look into Machine learning in Zabbix 6.0 LTS is covered in our Zabbix Summit Online 2021 speech dedicated to machine learning, anomaly detection, and baseline monitoring.

New ways to visualize your data

Collecting and processing metrics is just a part of the monitoring equation. Visualization and the ability to display our infrastructure status in a single pane of glass are also vital to large environments. Zabbix 6.0 LTS adds multiple new visualization options while also improving the existing features.

  • The data table widget allows you to create a summary view for the related metric status on your hosts
  • The Top N and Bottom N functions of the data table widget allow you to have an overview of your highest or lowest item values
  • The single item widget allows you to display values for a single metric
  • Improvements to the existing vector graphs such as the ability to reference individual items and more
  • The SLA report widget displays the current SLA for services filtered by service tags

We are proud to announce that Zabbix 6.0 LTS will provide a native Geomap widget. Now you can take a look at the current status of your IT infrastructure on a geographic map:

  • The host coordinates are provided in the host inventory fields
  • Users will be able to filter the map by host groups and tags
  • Depending on the map zoom level – the hosts will be grouped into a single object
  • Support of multiple Geomap providers, such as OpenStreetMap, OpenTopoMap, Stamen Terrain, USGS US Topo, and others

Zabbix agent – improvements and new items

Zabbix agent and Zabbix agent 2 have also received some improvements. From new items to improved usability – both Zabbix agents are now more flexible than ever. The improvements include such features as:

  • New items to obtain additional file information such as file owner and file permissions
  • New item which can collect agent host metadata as a metric
  • New item with which you can count matching TCP/UDP sockets
  • It is now possible to natively monitor your SSL/TLS certificates with a new Zabbix agent2 item. The item can be used to validate a TLS/SSL certificate and provide you additional certificate details
  • User parameters can now be reloaded without having to restart the Zabbix agent

In addition, a major improvement to introducing new Zabbix agent 2 plugins has been made. Zabbix agent 2 now supports loading stand-alone plugins without having to recompile the Zabbix agent 2.

Custom Zabbix password complexity requirements

One of the main improvements to Zabbix security is the ability to define flexible password complexity requirements. Zabbix Super admins can now define the following password complexity requirements:

  • Set the minimum password length
  • Define password character requirements
  • Mitigate the risk of a dictionary attack by prohibiting the usage of the most common password strings

UI/UX improvements

Improving and simplifying the existing workflows is always a priority for every major Zabbix release. In Zabbix 6.0 LTS we’ve added many seemingly simple improvements, that have major impacts related to the “feel” of the product and can make your day-to-day workflows even smoother:

  • It is now possible to create hosts directly from MonitoringHosts
  • Removed MonitoringOverview section. For improved user experience, the trigger and data overview functionality can now be accessed only via dashboard widgets.
  • The default type of information for items will now be selected automatically depending on the item key.
  • The simple macros in map labels and graph names have been replaced with expression macros to ensure consistency with the new trigger expression syntax

New templates and integrations

Adding new official templates and integrations is an ongoing process and Zabbix 6.0 LTS is no exception here’s a preview for some of the new templates and integrations that you can expect in Zabbix 6.0 LTS:

  • f5 BIG-IP
  • Cisco ASAv
  • HPE ProLiant servers
  • Cloudflare
  • InfluxDB
  • Travis CI
  • Dell PowerEdge

Zabbix 6.0 also brings a new GitHub webhook integration which allows you to generate GitHub issues based on Zabbix events!

Other changes and improvements

But that’s not all! There are more features and improvements that await you in Zabbix 6.0 LTS. From overall performance improvements on specific Zabbix components, to brand new history functions and command-line tool parameters:

  • Detect continuous increase or decrease of values with new monotonic history functions
  • Added utf8mb4 as a supported MySQL character set and collation
  • Added the support of additional HTTP methods for webhooks
  • Timeout settings for Zabbix command-line tools
  • Performance improvements for Zabbix Server, Frontend, and Proxy

Questions and answers

Q: How can you configure geographical maps? Are they similar to regular maps?

A: Geomaps can be used as a Dashboard widget. First, you have to select a Geomap provider in the Administration – General – Geographical maps section. You can either use the pre-defined Geomap providers or define a custom one. Then, you need to make sure that the Location latitude and Location longitude fields are configured in the Inventory section of the hosts which you wish to display on your map. Once that is done, simply deploy a new Geomap widget, filter the required hosts and you’re all set. Geomaps are currently available in the latest alpha release, so you can get some hands-on experience right now.

Q: Any specific performance improvements that we can discuss at this point for Zabbix 6.0 LTS?

A: There have been quite a few. From the frontend side – we have improved the underlying queries that are related to linking new templates, therefore the template linkage performance has increased. This will be very noticeable in large instances, especially when linking or unlinking many templates in a single go.
There have also been improvements to Server – Proxy communication. Specifically – the logic of how proxy frees up uncompressed data. We’ve also introduced improvements on the DB backend side of things – from general improvements to existing queries/logic, to the introduction of primary keys for history tables, which we are still extensively testing at this point.

Q: Will you still be able to change the type of information manually, in case you have some advanced preprocessing rules?

A: In Zabbix 6.0 LTS Zabbix will try and automatically pick the corresponding type of information for your item. This is a great UX improvement since you don’t have to refer to the documentation every time you are defining a new item. And, yes, you will still be able to change the type of information manually – either because of preprocessing rules or if you’re simply doing some troubleshooting.

Zabbix 6.0 LTS – The next great leap in monitoring by Alexei Vladishev / Zabbix Summit Online 2021

Post Syndicated from Alexei Vladishev original https://blog.zabbix.com/zabbix-6-0-lts-the-next-great-leap-in-monitoring-by-alexei-vladishev-zabbix-summit-online-2021/17683/

The Zabbix Summit Online 2021 keynote speech by Zabbix founder and CEO Alexei Vladishev focuses on the role of Zabbix in modern, dynamic IT infrastructures. The keynote speech also highlights the major milestones leading up to Zabbix 6.0 LTS and together we take a look at the future of Zabbix.

The full recording of the speech is available on the official Zabbix Youtube channel.

Digital transformation journey
Infrastructure monitoring challenges
Zabbix – Universal Open Source enterprise-level monitoring solution
Cost-Effectiveness
Deploy Anywhere
Monitor Anything
Monitoring of Kubernetes and Hybrid Clouds
Data collection and Aggregation
Security on all levels
Powerful Solution for MSPs
Scalability and High Availability
Machine learning and Statistical analysis
More value to users
New visualization capabilities
IoT monitoring
Infrastructure as a code
Tags for classification
What’s next?
Advanced event correlation engine
Multi DC Monitoring
Zabbix Release Schedule
Zabbix Roadmap
Questions

Digital transformation journey

First, let’s talk about how Zabbix plays a role as a part of the Digital Transformation journey for many companies.

As IT infrastructures evolve, there are many ongoing challenges. Most larger companies for example have a set of legacy systems that require to be integrated with more modern systems. This results in a mix of legacy and new technologies and protocols. This means that most management and monitoring tools need to support all of these technologies – Zabbix is no exception here.

Hybrid clouds, containers, and container orchestration systems such as K8S and OpenShift have also played an immense part in the digital transformation of enterprises. It has been a very major paradigm shift – from physical machines to virtual machines, to containers and hybrid parts. We certainly must provide the required set of technologies to monitor such environments and the monitoring endpoints unique to them.

The rapid increase in the complexity of IT infrastructures caused by the two previous points requires our tools to be a lot more scalable than before. We have many more moving parts, likely located in different locations that we need to stay aware of. This also means that any downtime is not acceptable – this is why the high availability of our tools is also vital to us.

Let’s not forget that with increased complexity, many new potential security attack vectors arise and our tools need to support features that can help us with minimizing the security risks.

But making our infrastructures more agile usually comes at a very real financial cost. We must not forget that most of the time we are working with a dedicated budget for our tools and procedures.

Infrastructure monitoring challenges

The increase in the complexity of IT infrastructures also poses multiple monitoring challenges that we have to strive to overcome:

  • Requirements for scalability and high availability for our tools
    • The growing number of devices and networks as well as the increased complexity of IT infrastructures
  • Increasingly complex infrastructures often force us to utilize multiple tools to obtain the required metrics
    • This leads to a requirement for a single pane of glass to enable centralized monitoring
  • Collecting values is often not enough – we need to be able to leverage the collected data to gain the most value out of it
  • We need a solution that can deliver centralized visualization and reporting based on the obtained data
  • Our tools need to be hand-picked so that they can deliver the best ROI in an already complex infrastructure

Zabbix – Universal Open Source enterprise-level monitoring solution

Zabbix is a Universal free and Open Source enterprise-level monitoring solution. The tool comes at absolutely no cost and is available for everyone to try out and use. Zabbix provides the monitoring of modern IT infrastructures on multiple levels.

Universal is the term that we are focusing on. Given the open-source nature of the product, Zabbix can be used in infrastructures of different sizes – from small and medium organizations to large, globe-spanning enterprises. Zabbix is also capable of delivering monitoring of the whole IT stack – from hardware and network monitoring to high-level monitoring such as Business Service monitoring and more.

Cost-Effectiveness

Zabbix delivers a large set of enterprise-grade features at no cost! Features such as 2FA, Single sign-on solutions, no restrictions when it comes to data collection methods, number of monitored devices and services, or database size.

  • Exceptionally low total cost of ownership
    • Free and Open Source solution with quality and security in mind
    • Backed by reliable vendors, a global partner network, and commercial services, such as the 24/7 support
    • No limitations regarding how you use the software
    • Free and readily available documentation, HOWTOs, community resources, videos, and more.
    • Zabbix engineers are easy to find and hire for your organization
    • Cost is fully under your control – Zabbix Commercial services are under fixed-price agreements

Deploy Anywhere

Our users always have the choice of where and how they wish to deploy Zabbix. With official packages for the most popular operating systems such as RHEL, Oracle Linux, Ubuntu, Raspberry Pi OS, and more. With official Helm charts, you can quickly also deploy Zabbix in a Kubernetes cluster or in your OpenShift instance. We also provide official Docker container images with pre-installed Zabbix components that you can deploy in your environment.

We also provide one-click deployment options for multiple cloud service providers, such as Amazon AWS, Microsoft Azure, Google Cloud, Openstack, and many other cloud service providers.

Monitor Anything

With Zabbix, you can monitor anything – from legacy solutions to modern systems. With a large selection of official solutions and substantial community backing our users can be sure that they can find a suitable approach to monitor their IT infrastructure components. There are hundreds of ready-to-use monitoring solutions by Zabbix.

Whenever you deploy a new IT solution in your enterprise, you will want to tie it together with the existing toolset. Zabbix provides many out of the box integrations for the most popular ticketing and alerting systems

Recently we have introduced advanced search capabilities for the Zabbix integrations page, which allows you to quickly lookup the integrations that currently exist on the market. If you visit the Zabbix integrations page and look up a specific vendor or tool, you will see a list of both the official solutions supported by Zabbix and also a long list of community solutions backed by our users, partners, and customers.

Monitoring of Kubernetes and Hybrid Clouds

Nowadays many existing companies are considering migrating their existing infrastructure to either solutions such as Kubernetes or OpenShift, or utilizing cloud service providers such as Amazon AWS or Microsoft Azure.

I am proud to announce, that with the release of Zabbix 6.0 LTS, Zabbix will officially support out-of-the-box monitoring of OpenShfit and Kubernetes clusters.

Data collection and Aggregation

Let’s cover a few recent features that improve the out-of-the-box flexibility of Zabbix by a large margin.

Synthetic monitoring is a feature that was introduced a year ago in Zabbix version 5.2 and it has already become quite popular with our user base. The feature enables monitoring of different devices and solutions over the HTTP protocol. By using synthetic monitoring Zabbix can connect to your HTTP endpoints, such as cloud APIs, Kubernetes, and OpenShift APIs, and other HTTP endpoints, collect the metrics and then process them to extract the required information. Synthetic monitoring is extremely transparent and flexible – it can be fine-tuned to communicate with any HTTP endpoints.

Another major feature introduced in Zabbix 5.4 is the new trigger syntax. This enables our users to define much more flexible trigger expressions, supporting many new problem detection use cases. In addition, we can use this syntax to perform flexible data aggregation operations. For example, now we can aggregate data filtered by wildcards, tags, and host groups, instead of specifying individual items. This is extremely valuable for monitoring complex infrastructures, such as Kubernetes or cloud environments. At the same time, the new syntax is a lot more simple to learn and understand when compared to the old trigger syntax.

Security on all levels

Many companies are concerned about security and data protection when it comes to the tools that they are using in their day-to-day tasks. I’m happy to tell you that Zabbix follows the highest security standards when it comes to the development and usage of the product.

Zabbix is secure by design. In the diagram below you can see all of the Zabbix components, all of which are interconnected, like Zabbix Agent, Server, Proxy, Database, and Frontend. All of the communication between different Zabbix components can be encrypted by using strong encryption protocols like TLS.

If you’re using Zabbix Agent, the agent does not require root privileges. You can run Zabbix Agent under a normal user with all of the necessary user level restrictions in place. Zabbix agent can also be restricted with metric allow and deny lists, so it has access only to the metrics which are permitted for collection by your company policies.

The connections between the Zabbix database backend and the Zabbix Frontend and Zabbix Server also support encryption as of version 5.0 LTS.

As for the frontend component – users can add an additional security layer for their Zabbix frontends by configuring 2FA and SSO logins. Zabbix 6.0 LTS also introduces flexible login password complexity requirements, which can reduce the security breach risk if your frontend is exposed to the internet. To ensure that Zabbix meets the highest standards of the company security compliance, the new Audit log, introduced in Zabbix 6.0 LTS, is capable of logging all of the Zabbix Frontend and Zabbix Server operations.

For an additional security layer – sensitive information like Usernames, Passwords, API keys can be stored in an external vault. Currently, Zabbix supports secret storage in the HashiCorp Vault. Support for the CyberArk vault will be added in the Zabbix 6.2 release.

Another Zabbix feature – the Zabbix API, is often used for the automation of day-to-day configuration workflows, as well as custom integrations and data migration tasks. Zabbix 5.4 added the ability to create API tokens for particular frontend users with pre-defined token expiration dates.

In Zabbix 5.2 we added another layer for the Zabbix Frontend user permissions – User Roles. Now it is possible to define granular user roles with different types of rights and privileges, assigned to specific types of users in your organization. With User Roles, we can define which parts of the Zabbix UI the specific user role has access to and which UI actions the members of this role can perform. This can be combined with API method restrictions which can also be defined for a particular role.

Powerful Solution for MSPs

When we combine all of these features, we can see how Zabbix becomes a powerful solution for MSP customers. MSPs can use Zabbix as an added value service. This way they can provide a monitoring service for their customers and get additional revenue out of it. It is possible to build a customer portal which is a combination of User Roles for read-only access to dashboards and customized UI, rebranding option – which was just introduced in Zabbix 6.0 LTS, and a combination of SLA reporting together with scheduled PDF reports, so the customers can receive reports on a weekly, daily or monthly basis.

Scalability and High Availability

With a growing number of devices and ever-increasing network complexity, Scalability and High availability are extremely important requirements.

Zabbix provides Load balancing options for Zabbix UI and Zabbix API. In order to scale the Zabbix Frontend and Zabbix API, we can simply deploy additional Zabbix Frontend nodes, thus introducing redundancy and high availability.

Zabbix 6.0 LTS comes with out-of-the-box support for the Zabbix Server High Availability cluster. If one of the Zabbix Server nodes goes down, Zabbix will automatically switch to one of the standby nodes. And the best thing about the Zabbix Server High Availability cluster – it takes only 5 minutes to get it up and running. the HA cluster is very easy to configure and use.

One of the features in our future roadmap is introducing support for the History API to work with different time-series DB backends for extra efficiency and scalability. Another feature that we would like to implement in the future is load balancing for Zabbix Servers and Zabbix Proxies. Combining all of these features would truly make Zabbix a cloud-native application with unlimited horizontal scalability.

Machine learning and Statistical analysis

Defining static trigger thresholds is a relatively simple task, but it doesn’t scale too well in dynamic environments. With Machine Learning and Statistical Analysis, we can analyze our data trends and perform anomaly detection. This has been greatly extended in Zabbix 6.0 LTS with Anomaly Detection and Baseline Monitoring functionality.

Zabbix 6.0 Adds an extended set of functions for trend analysis and trend prediction. These support multiple flexible parameters, such as the ability to define seasonality for your data analysis. This is another way how to get additional insights out of the data collected by Zabbix

More value to users

When I think about the direction that Zabbix is headed in, and look at the Zabbix roadmap, one of the main questions I ask is “How can we deliver more value to our enterprise users?”

In Zabbix 6.0 LTS we made some major steps to make Zabbix fit not only for infrastructure monitoring but also fit for Business Service monitoring – the monitoring of services that we provide for our end-users or internal company users. Zabbix 6.0 LTS comes with complex service level object definitions, real-time SLA reporting, multi-tenancy options, Business Service alerting options, and root cause and Impact analysis.

New visualization capabilities

It is important to present the collected data in a human-readable way. That’s why we invest a lot of time and effort in order to improve the native visualization capabilities. In Zabbix 6.0 LTS we have introduced Geographical Maps together with additional widgets for TOP N reporting and templated and multi-page dashboards.

The introduction of reports in Zabbix 5.2 allowed our users to leverage their Zabbix Dashboards to generate scheduled PDF reports with respect to user permissions. Our users can generate daily, weekly, monthly or yearly reports and send them to their infrastructure administrators or customers.

IoT monitoring

With the introduction of support for Modbus and MQTT protocols, Zabbix can be used to monitor IoT devices and obtain environmental information from different sensors such as temperature, humidity, and more. In addition, Zabbix can now be used to monitor factory equipment, building management systems, IoT gateways, and more.

Infrastructure as a code

With IT infrastructures growing in scale, automation is more important than ever. For this reason, many companies prefer preserving and deploying their infrastructure as code. With the support of YAML format for our templates, you can now keep them in a git repository and by utilizing CI/CD tools you can now deploy your templates automatically.

This enables our users to manage their templates in a central location – the git repository, which helps users to perform change management and versioning and then deploy the template to Zabbix by using CI/CD tools.

Tags for classification

Over the past few versions, we have made a major push to support tags for most Zabbix entities. The switch from applications to tags in Zabbix 5.4 made the tool much more flexible. Tags can now be used for the classification of items, triggers, hosts, business services. The tags that the users define can also be used in alerting, filtering, and reporting.

What’s next?

You’re probably wondering – what’s coming next? What are the main vectors for the future development of Zabbix?

First off – we will continue to invest in usability. While the tool is made by professionals for professionals, it is important for us to make using the tool as easy as possible. Improvements to the Zabbix Frontend, general usability, and UX can be expected very soon.

We plan to continue to invest in the visualization and reporting capabilities of Zabbix. We want all data collected by our monitoring tool to provide information in a single pane of glass. This way our users can see the full picture of their environment while also seeing the root cause analysis for the ongoing problems that we face. This way we can get most of the data that Zabbix collects.

Extending the scope of monitoring is an ongoing process for us. We would like to implement additional features for compliance monitoring. I think that we will be able to introduce a solution for application performance monitoring very soon. We’d like to make log monitoring more powerful and comprehensive. monitoring of public and private clouds is also very important for us, given the current IT paradigms.

We’d like to make sure that Zabbix is absolutely extendable on all levels. While we can already extend Zabbix with different types of plugins, webhooks, and UI modules there’s more to come in the near future.

The topic of high availability, scalability, and load balancing is extremely important to us. We will continue building on the existing foundations to make Zabbix a truly cloud-native solution.

Advanced event correlation engine

Advanced event processing is a really important topic. When we talk about a monitoring solution, we pay very much attention to the number of metrics that we are collecting. We mustn’t forget, that for large-scale environments the number of events that we generate based on those metrics is also extremely important. We need to keep control and manage the ever-growing number of different events coming from different sources. This is why we would like to focus on noise reduction, specifically – root cause analysis.

For this reason, we can expect Zabbix to introduce an advanced event correlation model in the future. This model should have the ability to filter and deduplicate the events as well as perform event enrichment, thus leading to a much better root cause analysis.

Multi DC Monitoring

Currently, Multi DC monitoring can be done with Zabbix by deploying a distributed Zabbix instance that utilizes Zabbix proxies. But there are use cases, where it would be more beneficial to have multiple Zabbix servers deployed across different datacenters – all reporting to a single location for centralized event processing, centralized visualization, and reporting as well as centralized dashboards. This is something that is coming soon to Zabbix.

Zabbix Release Schedule

Of course, the burning question is – when is Zabbix 6.0 LTS going to be released? And we are very close to finalizing the next LTS release. I would expect Zabbix 6.0 LTS to be officially released in January 2022.

As for Zabbix 6.2 and 6.4 – these releases are still planned for Q2 and Q4, 2022. The next LTS release – Zabbix 7.0 LTS is planned to be released in Q2, 2023.

Zabbix Roadmap

If you want to follow the development of Zabbix – we have a special page just for that – the Zabbix Roadmap. Here you can find up-to-date information about the development plans for Zabbix 6.2, 6.4, and 7.0 LTS. The Roadmap also represents the current development status of Zabbix 6.0 LTS.

Questions

Q: What would you say is the main benefit of why users should migrate from Zabbix 5.0/4.0 or older versions to 6.0 LTS?

A: I think that Zabbix 6.0 LTS is a very different product – even when you compare it with the relatively recent Zabbix 5.0 LTS. It comes with many improvements, some of which I mentioned here in my keynote. For example, Business Service monitoring provides huge added value to enterprise customers.

With the new trigger syntax and the new functions related to anomaly detection and baseline monitoring our users can get much more out of the data that they already have in their monitoring tool.

The new visualization options – multiple new widgets, geographical maps, scheduled PDF reporting provide a lot of added value to our end-users and to their customers as well.

Q: Any plans to make changes on the Zabbix DB backend level – make it more scaleable or completely redesign it?

A: Right now we keep all of our information in a relational database such as MySQL or PostgreSQL. We have added the support for TimescaleDB which brings some huge advantages to our users, thanks to improved data storage and performance efficiency.

But we still have users that wish to connect different storage engines to Zabbix – maybe specifically optimized to keep time-series data. Actually, this is already on our roadmap. Our plan is to introduce a unified API for historical data so that if you wish to attach your own storage, we just have to deploy a plugin that will communicate both with our historical API and also talk to the storage engine of your choosing. This feature is coming and is already on our Roadmap.

Q: What is your personal favorite feature? Something that you 100% wanted to see implemented in Zabbix 6.0 LTS?

A: I see Zabbix 6.0 LTS as a combination of Zabbix 5.2, 5.4, and finally the features introduced directly in Zabbix 6.0 LTS. Personally, I think that my favorite features in Zabbix 6.0 LTS are features that make up the latest implementation of Anomaly detection.

We could be at the very beginning of exploring more advanced machine learning and statistical analysis capabilities, but I’m pretty sure that with every new release of Zabbix there will be new features related to machine learning, anomaly detection, and trend prediction.

This could provide a way for Zabbix to generate and share insights with our users. Analysis of what’s happening with your system, with your metrics – how the metrics in your system behave.

Summary of Zabbix Summit Online 2021, Zabbix 6.0 LTS release date and Zabbix Workshops

Post Syndicated from Arturs Lontons original https://blog.zabbix.com/summary-of-zabbix-summit-online-2021-zabbix-6-0-lts-release-date-and-zabbix-workshops/17155/

Now that the Zabbix Summit Online 2021 has concluded, we are thrilled to report we hosted attendees from over 3000 organizations from more than 130 countries all across the globe.

This year, the main focus of the speeches was the upcoming Zabbix 6.0 LTS release, as well as speeches focused on automating Zabbix data collection and configuration, Integrating Zabbix within existing company infrastructures, and migrating from legacy tools to Zabbix. 21 speakers in total presented their use cases and talked about new Zabbix features during the Summit with over 8 hours of content.

In case you missed the Summit or wish to come back to some of the speeches – both the presentations (in PDF format) and the videos of the speeches are available on the Zabbix Summit Online 2021 Event page.

Zabbix 6.0 LTS release date

As for Zabbix 6.0 LTS – as per our statement during the event, you can expect Zabbix 6.0 LTS to release in early 2022. At the time of this post, the latest pre-release version is Zabbix 6.0 Alpha 7, with the first Beta version scheduled for release VERY soon. Feel free to deploy the latest pre-release version and take a look at features such as Geomaps, Business Service monitoring, improved Audit log, UX improvements, Anomaly detection with Machine Learning, and more! The list of the latest released Zabbix 6.0 versions as well as the improvements and fixes they contain is available in the Release notes section of our website.

Zabbix 6.0 LTS Workshops

The workshops will focus on particular Zabbix 6.0 LTS features and will be available once the Zabbix 6.0 LTS is released. The workshops will provide a unique chance to learn and practice the configuration of specific Zabbix 6.0 LTS features under the guidance of a certified Zabbix trainer at absolutely no cost! Some of the topics covered in the workshops will include – Deploying Zabbix server HA cluster, Creating triggers for Baseline monitoring and Anomaly detection, Displaying your infrastructure status on Geomaps, Deploying Business Service monitoring with root cause analysis, and more!

Upcoming events

But there’s more! On December 9 2021 Zabbix will host PostgreSQL Monitoring Day with Zabbix & Postgres Pro. The speeches will focus on monitoring PostgreSQL databases, running Zabbix on PostgreSQL DB backends with TimescaleDB, and securing your Zabbix + PostgreSQL instances. If you’re currently using PostgreSQL DB backends r plan to do so in the future – you definitely don’t want to miss out!

As for 2022 – you can expect multiple meetups regarding Zabbix 6.0 LTS features and use cases, as well as events focused on specific monitoring use cases. More information will be publicly available with the release of Zabbix 6.0 LTS.

Zabbix 6.0 LTS at Zabbix Summit Online 2021

Post Syndicated from Arturs Lontons original https://blog.zabbix.com/zabbix-6-0-lts-at-zabbix-summit-online-2021/16115/

With Zabbix Summit Online 2021 just around the corner, it’s time to have a quick overview of the 6.0 LTS features that we can expect to see featured during the event. The Zabbix 6.0 LTS release aims to deliver some of the long-awaited enterprise-level features while also improving the general user experience, performance, scalability, and many other aspects of Zabbix.

Native Zabbix server cluster

Many of you will be extremely happy to hear that Zabbix 6.0 LTS release comes with out-of-the-box High availability for Zabbix Server. This means that HA will now be supported natively, without having to use external tools to create Zabbix Server clusters.

The native Zabbix Server cluster will have a speech dedicated to it during the Zabbix Summit Online 2021. You can expect to learn both the inner workings of the HA solution, the configuration and of course the main benefits of using the native HA solution. You can also take a look at the in-development version of the native Zabbix server cluster in the latest Zabbix 6.0 LTS alpha release.

Business service monitoring and root cause analysis

Service monitoring is also about to go through a significant redesign, focusing on delivering additional value by providing robust Business service monitoring (BSM) features. This is achieved by delivering significant additions to the existing service status calculation logic. With features such as service weights, service status analysis based on child problem severities, ability to calculate service status based on the number or percentage of children in a problem state, users will be able to implement BSM on a whole new level. BSM will also support root cause analysis – users will be informed about the root cause problem of the service status change.

All of this and more, together with examples and use cases will be covered during a separate speech dedicated to BSM. In addition, some of the BSM features are available in the latest Zabbix 6.0 LTS alpha release – with more to come as we continue working on the Zabbix 6.0 release.

Audit log redesign

The Audit log is another existing feature that has received a complete redesign. With the ability to log each and every change performed both by the Zabbix Server and Zabbix Frontend, the Audit log will become an invaluable source of audit information. Of course, the redesign also takes performance into consideration – the redesign was developed with the least possible performance impact in mind.

The audit log is constantly in development and the current Zabbix 6.0 LTS alpha release offers you an early look at the feature. We will also be covering the technical details of the new audit log implementation during the Summit and will explain how we are able to achieve minimal performance impact with major improvements to Zabbix audit logging.

Geographical maps

With Geographical maps, our users can finally display their entities on a geographical map based on the coordinates of the entity. Geographical maps can be used with multiple geographical map providers and display your hosts with their most severe problems. In addition, geographical maps will react dynamically to Zoom levels and support filtering.

The latest Zabbix 6.0 Alpha release includes the Geomap widget – feel free to deploy it in your QA environment, check out the different map providers, filter options and other great features that come with this widget.

Machine learning

When it comes to problem detection, Zabbix 6.0 LTS will deliver multiple trend new functions. A specific set of functions provides machine learning functionality for Anomaly detection and Baseline monitoring.

The topic will be covered in-depth during the Zabbix Summit Online 2021. We will look at the configuration of the new functions and also take a deeper dive at the logic and algorithms used under the hood.

During the Zabbix Summit Online 2021, we will also cover many other new features, such as:

  • New Dashboard widgets
  • New items for Zabbix Agent
  • New templates and integrations
  • Zabbix login password complexity settings
  • Performance improvements for Zabbix Server, Zabbix Proxy, and Zabbix Frontend
  • UI and UX improvements
  • Zabbix login password complexity requirements
  • New history and trend functions
  • And more!

Not only will you get the chance to have an early look at many new features not yet available in the latest alpha release, but also you will have a great chance to learn the inner workings of the new features, the upgrade and migration process to Zabbix 6.0 LTS and much more!

We are extremely excited to share all of the new features with our community, so don’t miss out – take a look at the full Zabbix Summit online 2021 agenda and register for the event by visiting our Zabbix Summit page, and we will see you at the Zabbix Summit Online 2021 on November 25!