Post Syndicated from Michael Kammer original https://blog.zabbix.com/expand-your-knowledge-at-zabbix-summit-2025/31168/
October is just around the corner, and that annual shift into Q4 can mean only one thing – it’s almost Summit time! Zabbix Summit 2025 will take place on October 8-10 in Riga, Latvia at the Radisson Blu Hotel Latvija, and it’s shaping up to be the perfect blend of established traditions and fresh approaches – we’ve been at this for a (very lucky) 13 years now, and we’d like to think we’ve kept the aspects of the Summit experience that everyone knows and loves while adding a few twists! Here’s what you can expect for the price of admission:
Table of Contents
Top-tier presentations from Zabbix leaders and experts

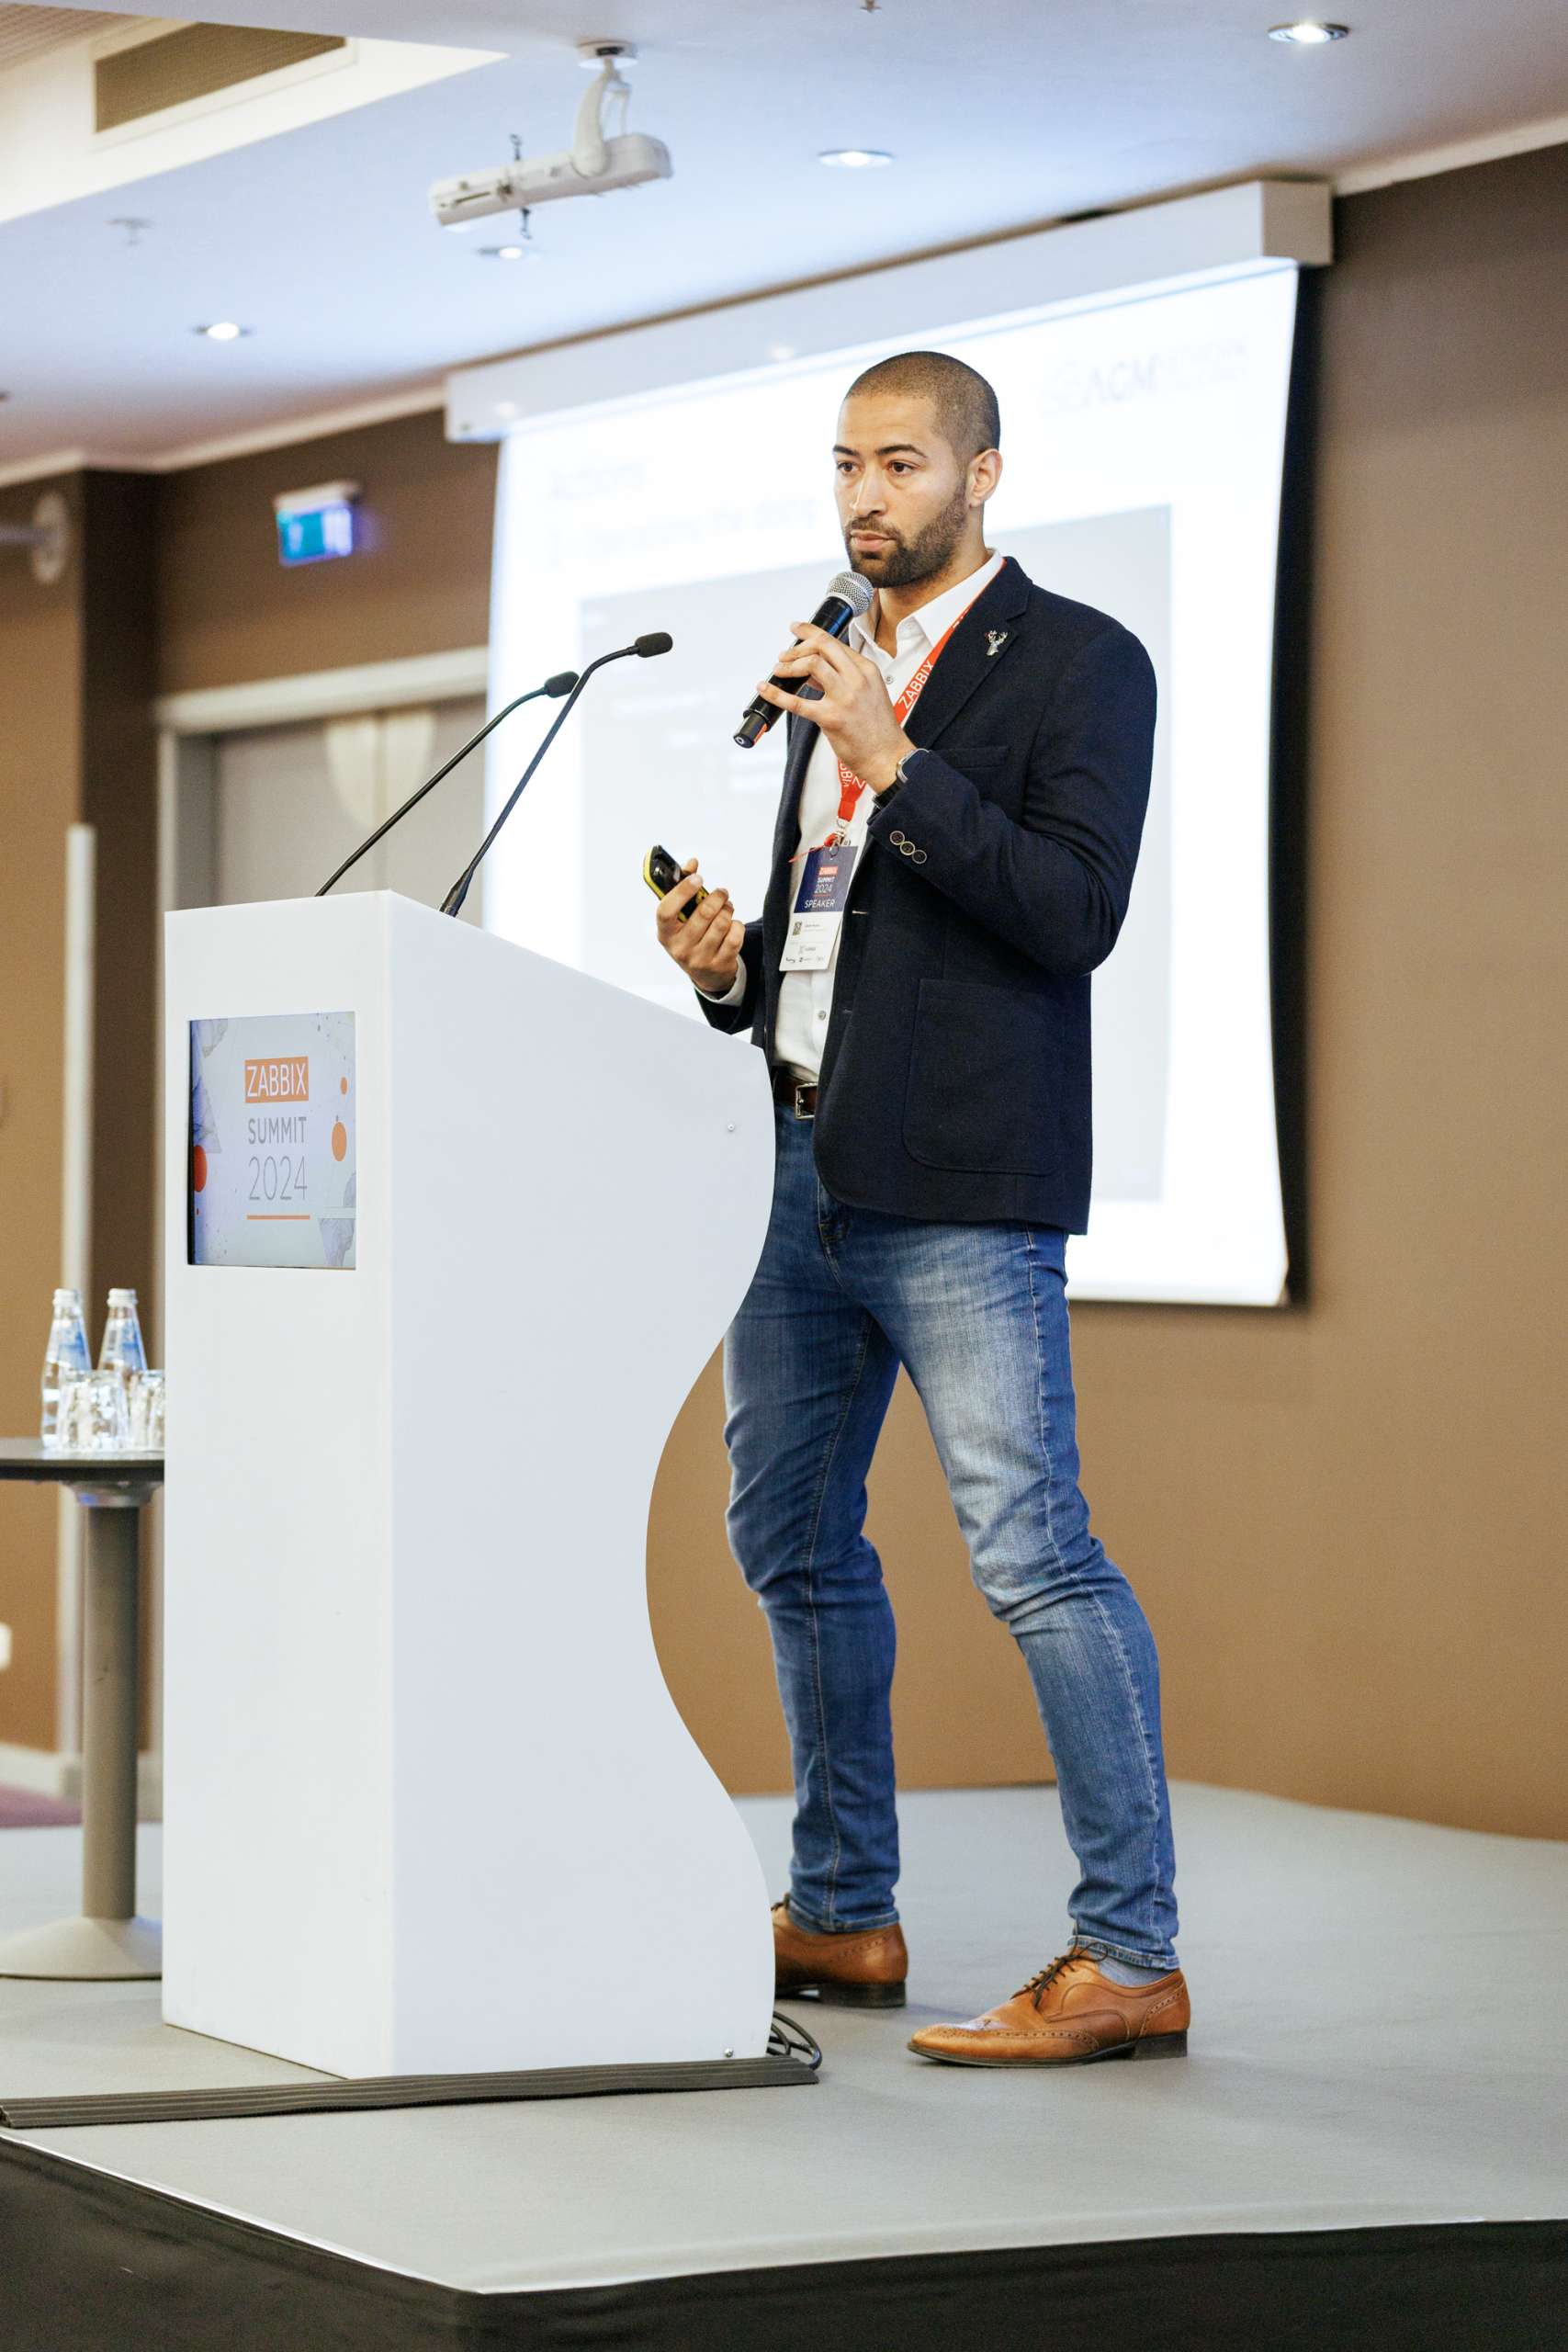
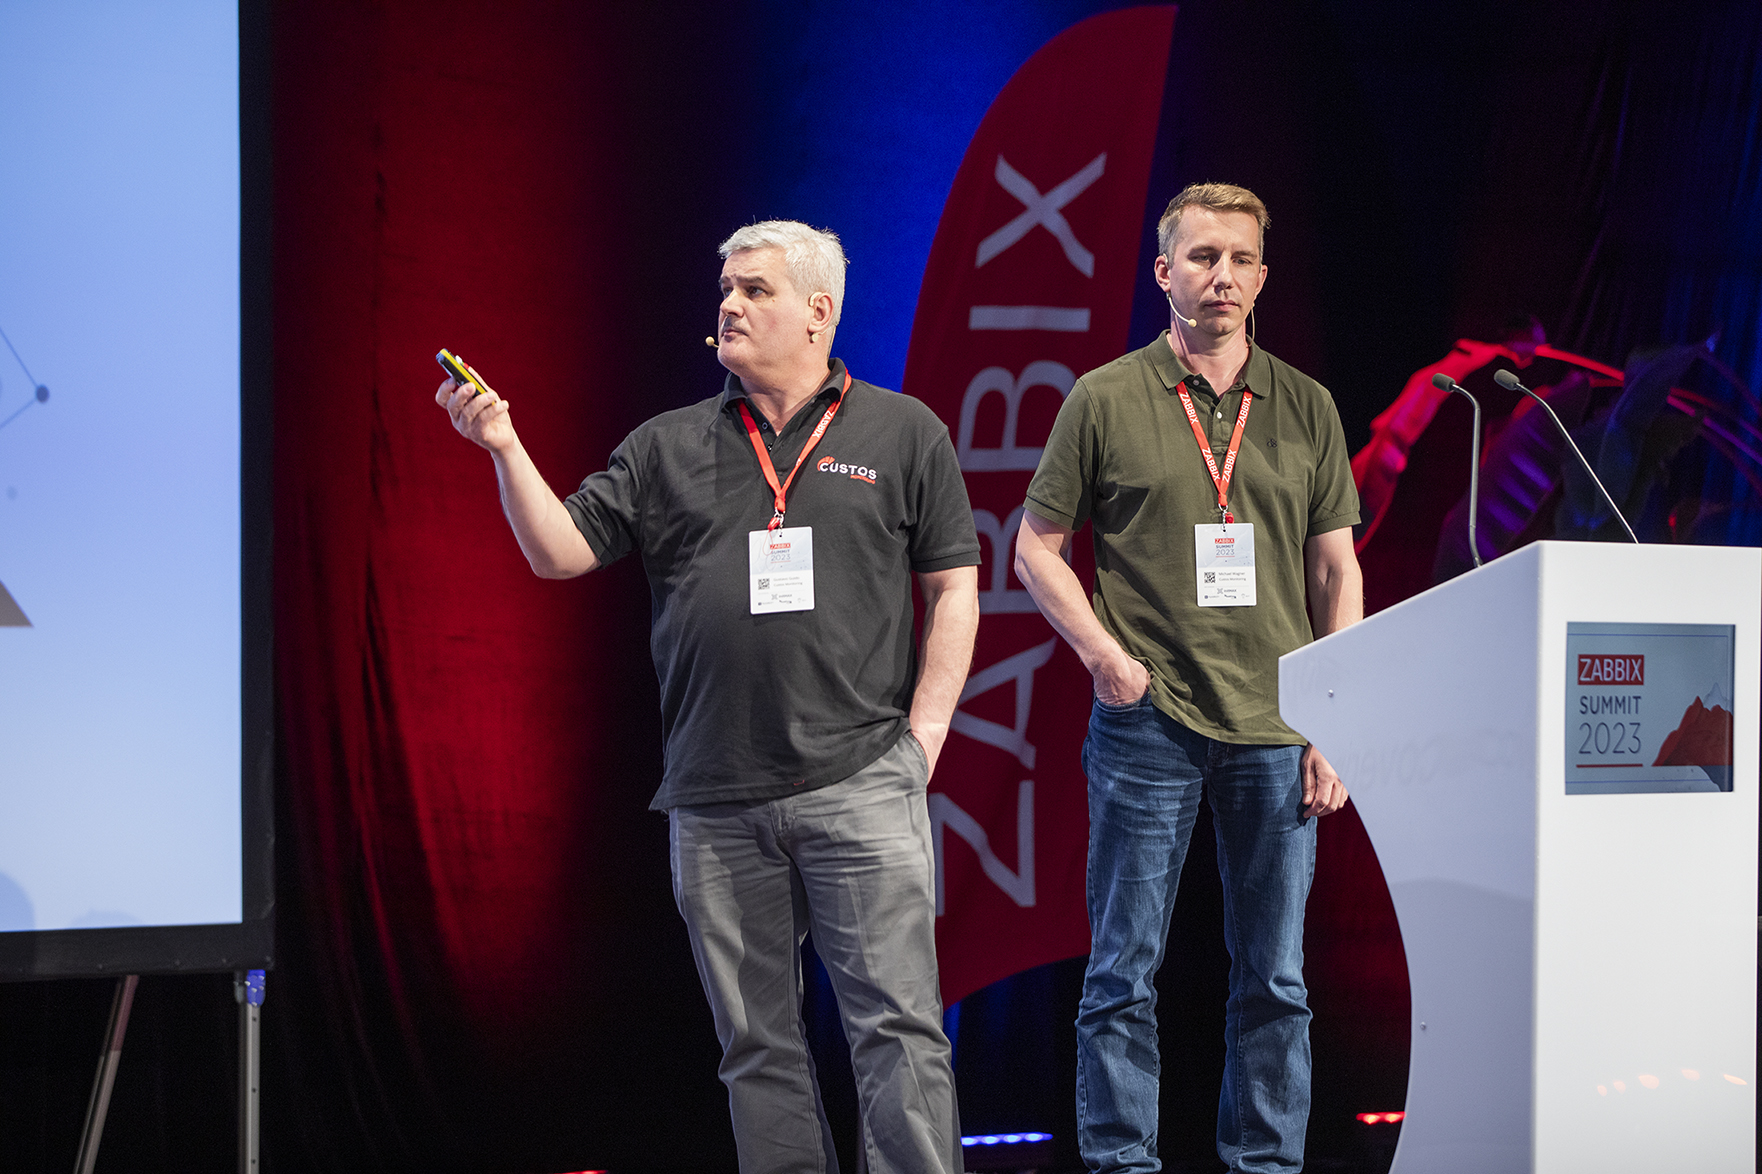
The learning begins with Zabbix Founder and CEO Alexei Vladishev’s keynote speech, which promises to be an “info drop” full of details about upcoming releases, new features, and what Alexei sees on the horizon for Zabbix. From there, it will be time for over 30 main stage speakers spread across two days of conference action. Some of the highlights include:
Presentations from Zabbix experts on topics like:
- Turning playbooks into automated action plans
- Streaming metrics for multiple tenants without chaos
- Syncing systems painlessly
- Maintaining control over massive amounts of Zabbix data
- Detecting and responding to security threats before they escalate
Deep dives that will show you how to:
- Spot the blind spots in large-scale networks (and fix them)
- Keep tabs on Zabbix itself (after all, even monitoring needs monitoring)
- Take full control of tag management
- Use Zabbix Proxy to scale without breaking a sweat
Practical case studies, including:
- Turning sensor data into insights with AI
- Keeping SAP environments and multisite clusters in check
- Transforming enterprise-level monitoring
- Supercharging operations via migration projects
- Making discovery, correlation, and AI work together for smart monitoring in action
Expect all this, plus inside information from the Zabbix team on the path to becoming a Zabbix partner and how Zabbix services can help you scale efficiently. As if that weren’t enough, this year’s Summit will also feature special guest Dylan Beattie! A Software Development Consultant and Founder of Ursatile, Dylan is an international keynote speaker, and a long-time contributor to the open-source community.
At the Summit, Dylan will give a talk titled “Open Source, Open Minds. The Cost of Free Software.” Expect stories about why developers choose to give their code away, what happens when they change their minds, the quirks of licenses and legalities, and the big question of whether open source can ever be truly sustainable.
Dedicated Dev and Community tracks

Created by developers and for developers, the Dev Track makes its debut this year and brings together some of the top minds on the Zabbix development team to cover topics as diverse as extending Zabbix Agent 2 with custom plugins, enhanced widget development, and template design best practices.
For attendees of a slightly less technical persuasion, the Community Track is there to facilitate author led discussions about community-driven content and resources, like the Zabbix Book. Assembled by longtime Zabbix enthusiasts Patrik Uytterhoeven, Brian van Baekel, and Nathan Liefting, the Zabbix Book will get its own breakout room, where Summit attendees can brainstorm in small groups about how to improve the book via new ideas and topics.
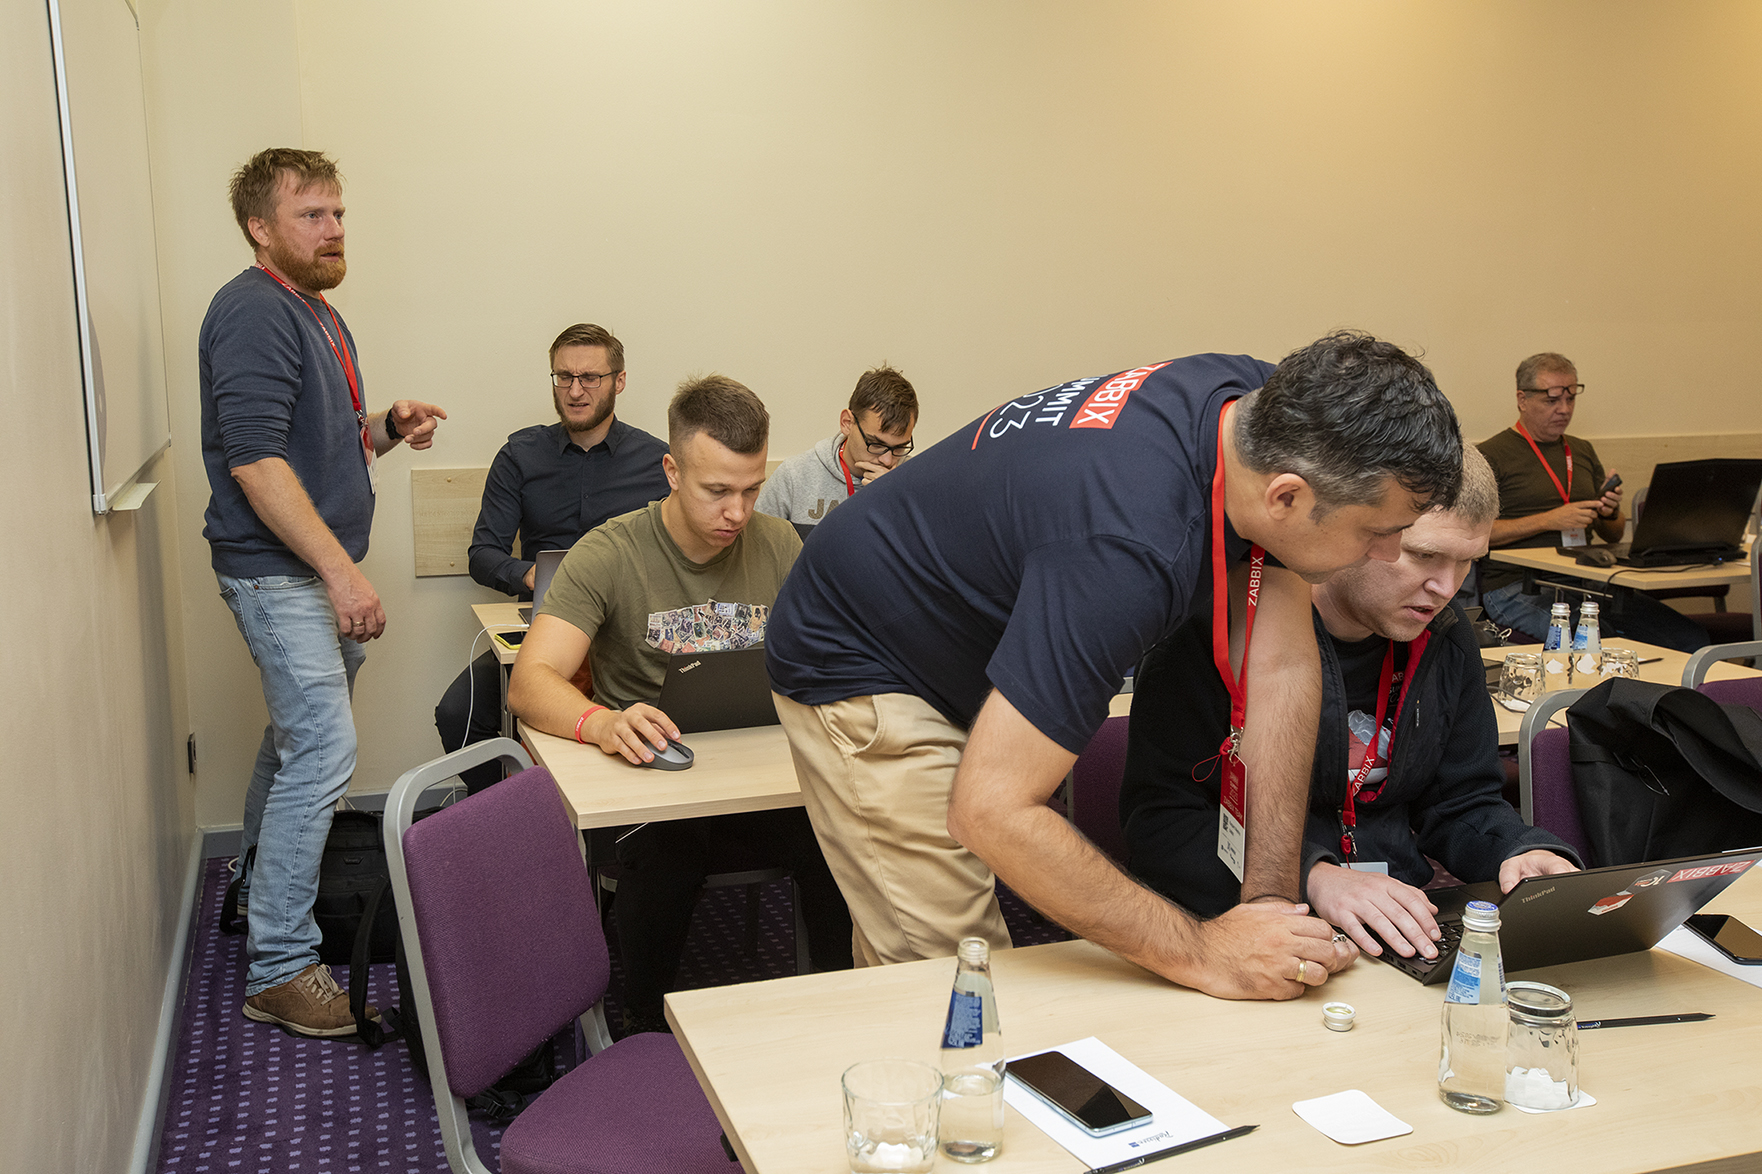
Hands-on workshops

The Summit experience has always been about finding opportunities to put theory into practice, and this year’s workshops showcase the latest features and use cases in action. Attendees will be able to dive into workshops on AI powered monitoring with Zabbix and ESP32, nested LLDs (low-level discovery), reducing alert noise, diagnosing performance issues with Diaginfo, and using Netflow integration via H5 Network. It’s a rare opportunity to confirm your knowledge retention by performing real-world tasks under the guidance of workshop hosts and their assistants.
Training and certification (yes, with discounts!)

A Zabbix Summit is the perfect place to get recognized as a Zabbix specialist or professional by taking part in Zabbix Certified Training sessions and exams at bargain prices. These one-day courses will be held from October 6 through October 13:
- Automation and Integration with Zabbix API
- Advanced Zabbix Database Monitoring
- Advanced Zabbix SNMP Monitoring
- Zabbix Certified Specialist Upgrade
- Zabbix Certified Professional Upgrade
If you find yourself in Riga after the Summit, it’s worth your time to take part in the full Zabbix Certified Specialist course scheduled for October 13-17. Please remember that you can choose more than one training course and also keep in mind that you can attend the courses (without the 50% Summit discount) even if you’re not joining us at the Summit. You can register for all training sessions and exams here.
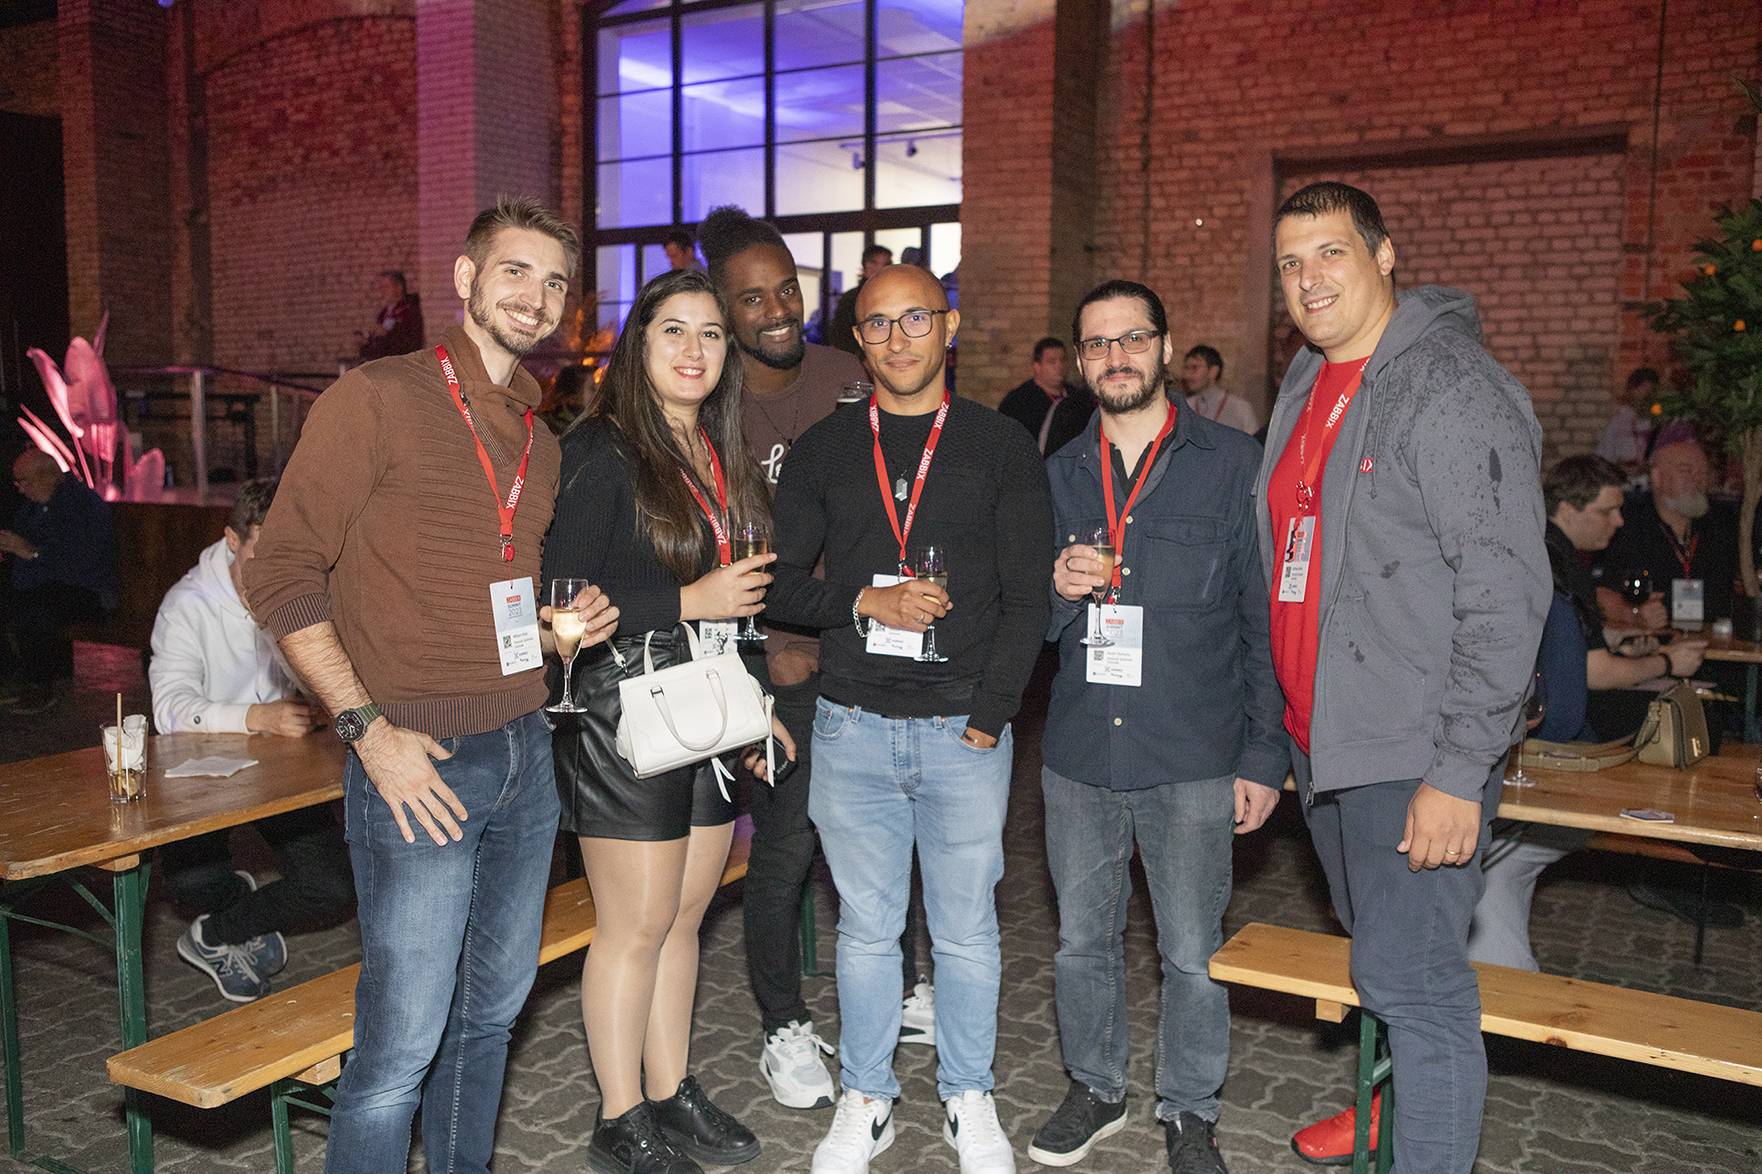
Networking and community building

A big part of what makes a Zabbix Summit a Zabbix Summit is the vibe – a big, global community coming together to catch up with old friends, welcome new members, and celebrate a certain open-source monitoring solution that brings us all together. That atmosphere of conviviality is exactly what makes a Summit such a one-of-a-kind networking opportunity. We’ve put together an open house visit and three evening events that are the ideal places to connect with like-minded monitoring enthusiasts, show off your skills, or get your company’s name in front of industry decision-makers.
This year’s Zabbix Open House on October 8 is your chance to see where the magic happens – drop by our offices and chat with our team members, grab yourself a coffee in our kitchen, and take part in a quiz that will teach even the most seasoned Zabbix fans a few new fun facts.
No summit would be complete without its events, and the opening event of Zabbix Summit 2025 on October 8 will take place at Riga’s renowned Monkey Club, with delicious fusion cuisine, a broad selection of cocktails and beverages, and a chance to unwind in style with your fellow Summit attendees.
The main event on October 9 is hosted by the Tallinn Quarter Hangar, which boasts a concert hall as well as a modern, open-plan street food kitchen and bar that are guaranteed to offer something for everyone.
On October 10, Zabbix Summit 2025 will wrap up at downtown Riga’s Burzma food hall, which offers 10 restaurants and a bar serving up a broad range of flavors from every corner of the globe. It’s the perfect location to relive Summit highlights in the company of your fellow Zabbix enthusiasts, and we’re looking forward to seeing you there!

Can’t make it? There’s always YouTube
A Zabbix Summit is one of those “you had to be there” events, but if you can’t make it to Riga, no worries – as in previous years, we’re going to be livestreaming all the speeches on our YouTube channel! Find out more and subscribe to the livestream here.
The post Expand your Knowledge at Zabbix Summit 2025 appeared first on Zabbix Blog.