Tag Archives: proxy

Data Buffering in Zabbix Proxy

Post Syndicated from Markku Leiniö original https://blog.zabbix.com/data-buffering-in-zabbix-proxy/25410/

One of the features of Zabbix proxy is that it can buffer the collected monitoring data if connectivity to Zabbix server is lost. In this post I will show it happening, using packet capture, or packet analysis.

Zabbix setup and capturing Zabbix proxy traffic

This is the setup in this demo:

  • One Zabbix server in the central site (IPv6 address 2001:db8:1234::bebe and DNS name zabbixtest.lein.io)
  • One Zabbix proxy “Proxy-1” in a remote site (IPv6 address 2001:db8:9876::fafa and IPv4 address 10.0.41.65)
  • One Zabbix agent “Testhost” on a server in the remote site, sending data via the proxy

For simplicity, the agent only monitors one item: the system uptime (item key system.uptime using Zabbix active agent), with 20 seconds interval. So that’s the data that we are expecting to arrive to the server, every 20 seconds.

The proxy is an active proxy using SQLite database, with these non-default configurations in the configuration file:

Server=zabbixtest.lein.io
Hostname=Proxy-1
DBName=/var/lib/zabbix/zabbix_proxy

The proxy “Proxy-1” has also been added in Zabbix server using the frontend.

I’m using Zabbix server and proxy version 6.4.0beta5 here. Agents are normally compatible with newer servers and proxies, so I happened to use an existing agent that was version 4.0.44.

With this setup successfully running, I started packet capture on the Zabbix server, capturing only packets for the proxy communication:

sudo tcpdump host 2001:db8:9876::fafa -v -w proxybuffer.pcap

After having it running for a couple of minutes, I introduced a “network outage” by dropping the packets from the proxy in the server:

sudo ip6tables -A INPUT -s 2001:db8:9876::fafa -j DROP

I kept that drop rule in use for a few minutes and then deleted it with a suitable ip6tables command (sudo ip6tables -D INPUT 1 in this case), and stopped the capture some time after that.

Analyzing the captured Zabbix traffic with Wireshark

I downloaded the capture file (proxybuffer.pcap) to my workstation where I already had Wireshark installed. I also had the Zabbix dissector for Wireshark installed. Without this specific dissector the Zabbix packet contents are just unreadable binary data because the proxy communication is compressed since Zabbix version 4.0.

You can download the same capture file here if you want to follow along:

After opening the capture file in Wireshark I first entered zabbix in the display filter, expanded the Zabbix fields in the protocol tree a bit, and this is what I got:

(Your Wireshark view will probably look different. If you are interested in changing it, see my post about customizing Wireshark settings.)

Since this is an active proxy communicating with the server, there is always first a packet from the proxy (config request or data to be sent) and then the response from the server.

Let’s look at the packets from the proxy only. We get that by adding the proxy source IP address in the filter (by typing it to the field as an ipv6.src filter, or by dragging the IP address from the Source column to the display filter like I did):

Basically there are two types of packets shown:

  • Proxy data
  • Request proxy config

The configuration requests are easier to explain: in Zabbix proxy 6.4 there is a configuration parameter ProxyConfigFrequency (in earlier Zabbix versions the same was called ConfigFrequency):

How often proxy retrieves configuration data from Zabbix server in seconds. Active proxy parameter. Ignored for passive proxies (see ProxyMode parameter). https://www.zabbix.com/documentation/devel/en/manual/appendix/config/zabbix_proxy

It defaults to 10 seconds. What basically happens in each config request is that the proxy says “my current configuration revision is 1234”, and then the server responds to that.

Note: The configuration request concept has been changed in Zabbix 6.4 to use incremental configurations when possible, so the proxy is allowed to get the updated configuration much faster compared to earlier default of 3600 seconds or one hour in Zabbix 6.2 and earlier. See What’s new in Zabbix 6.4.0 for more information.

The other packet type shown above is the proxy data packet. It is actually also used for other than data. In proxy configuration there is a parameter DataSenderFrequency:

Proxy will send collected data to the server every N seconds. Note that active proxy will still poll Zabbix server every second for remote command tasks. Active proxy parameter. Ignored for passive proxies (see ProxyMode parameter). https://www.zabbix.com/documentation/devel/en/manual/appendix/config/zabbix_proxy

The default value for it is one second. But as mentioned in the quote above, even if you increase the configuration value (= actually decrease the frequency… but it is what it is), the proxy will connect to the server every second anyway.

Note: There is a feature request ZBXNEXT-4998 about making the task update interval configurable. Vote and watch that issue if you are interested in that for example for battery-powered Zabbix use cases.

The first packet shown above is (JSON reformatted for better readability):

{
    "request": "proxy data",
    "host": "Proxy-1",
    "session": "38cca0391f7427d0ad487f75755e7166",
    "version": "6.4.0beta5",
    "clock": 1673190378,
    "ns": 360076308
}

There is no “data” in the packet, that’s just the proxy basically saying “hey I’m still here!” to the server so that the server has an opportunity to talk back to the proxy if it has something to say, like a remote command to run on the proxy or on any hosts monitored by the proxy.

As mentioned earlier, the test setup consisted of only one collected item, and that is being collected every 20 seconds, so it is natural that not all data packets contain monitoring data.

I’m further filtering the packets to show only the proxy data packets by adding zabbix.proxy.data in the display filter (by dragging the “Proxy Data: True” field to the filter):

(Yes yes, the topic of this post is data buffering in Zabbix proxy, and we are getting there soon)

Now, there is about 20 seconds worth of packets shown, so we should have one actual data packet there, and there it is, the packet number 176: it is about 50 bytes larger than other packets so there must be something. Here is the Data field contents of that packet:

{
    "request": "proxy data",
    "host": "Proxy-1",
    "session": "38cca0391f7427d0ad487f75755e7166",
    "history data": [
        {
            "id": 31,
            "itemid": 44592,
            "clock": 1673190392,
            "ns": 299338333,
            "value": "1686"
        }
    ],
    "version": "6.4.0beta5",
    "clock": 1673190393,
    "ns": 429562969
}

In addition to the earlier fields there is now a list called history data containing one object. That object has fields like itemid and value. The itemid field has the actual item ID for the monitored item, it can be seen in the URL address in the browser when editing the item in Zabbix frontend. The value 1686 is the actual value of the monitored item (the system uptime in seconds, the host was rebooted about 28 minutes ago).

Let’s develop the display filter even more. Now that we are quite confident that packets that have TCP length of about 136-138 bytes are just the empty data packets without item data, we can get the interesting data packets by adding tcp.len > 140 in the display filter:

When looking at the packet timestamps there is the 20-second interval observed until about 17:08:30. Then there is about 3.5 minutes gap, next send at 17:11:53, and then the data was flowing again with the 20-second interval. The 3.5 minutes gap corresponds to the network outage that was manually caused in the test. The data packet immediately after the outage is larger than others, so let’s see that:

{
    "request": "proxy data",
    "host": "Proxy-1",
    "session": "38cca0391f7427d0ad487f75755e7166",
    "history data": [
        {
            "id": 37,
            "itemid": 44592,
            "clock": 1673190512,
            "ns": 316923947,
            "value": "1806"
        },
        {
            "id": 38,
            "itemid": 44592,
            "clock": 1673190532,
            "ns": 319597379,
            "value": "1826"
        },
--- JSON truncated ---
        {
            "id": 45,
            "itemid": 44592,
            "clock": 1673190672,
            "ns": 345132325,
            "value": "1966"
        },
        {
            "id": 46,
            "itemid": 44592,
            "clock": 1673190692,
            "ns": 348345312,
            "value": "1986"
        }
    ],
    "auto registration": [
        {
            "clock": 1673190592,
            "host": "Testhost",
            "ip": "10.0.41.66",
            "port": "10050",
            "tls_accepted": 1
        }
    ],
    "version": "6.4.0beta5",
    "clock": 1673190708,
    "ns": 108126335
}

What we see here is that there are several history data objects in the same data packet from the proxy. The itemid field is still the same as earlier (44592), and the value field is increasing in 20-second steps. Also the timestamps (clock and nanoseconds) are increasing correspondingly, so we see when the values were actually collected, even though they were sent to the server only a few minutes later, having been buffered by the proxy.

That is also confirmed by looking at the Latest data graph in Zabbix frontend for that item during the time of the test:

There is a nice increasing graph with no gaps or jagged edges.

By the way, this is how the outage looked like in the Zabbix proxy log (/var/log/zabbix/zabbix_proxy.log on the proxy):

   738:20230108:170835.557 Unable to connect to [zabbixtest.lein.io]:10051 [cannot connect to [[zabbixtest.lein.io]:10051]: [4] Interrupted system call]
   738:20230108:170835.558 Will try to reconnect every 120 second(s)
   748:20230108:170835.970 Unable to connect to [zabbixtest.lein.io]:10051 [cannot connect to [[zabbixtest.lein.io]:10051]: [4] Interrupted system call]
   748:20230108:170835.970 Will try to reconnect every 1 second(s)
   748:20230108:170939.993 Still unable to connect...
   748:20230108:171040.015 Still unable to connect...
   738:20230108:171043.561 Still unable to connect...
   748:20230108:171140.068 Still unable to connect...
   748:20230108:171147.105 Connection restored.
   738:20230108:171243.563 Connection restored.

The log looks confusing at first because it shows the messages twice. Also, the second “Connection restored” message arrived almost one minute after the data sending was already restored, as proved in the packet list earlier. The explanation is (as far as I understand it) that the configuration syncer and data sender are separate processes in the proxy, as described in https://www.zabbix.com/documentation/devel/en/manual/concepts/proxy#proxy-process-types. When looking at the packets we see that at 17:12:43 (when the second “Connection restored” message arrived) the proxy sent a proxy config request to the server, so apparently the data sender tries to reconnect every second (to facilitate fast recovery for monitoring data), while the config syncer only tries every two minutes (based on the “Will try to reconnect every 120 second(s)” message, and that corresponds to the outage start time 17:08:35 plus 2 x 2 minutes, plus some extra seconds, presumably because of TCP timeouts).

There were no messages on the Zabbix server log (/var/log/zabbix/zabbix_server.log) for this outage as the outage did not happen in the middle of the TCP session and the proxy was in active mode (= connections are always initiated by the proxy, not by the server), so there was nothing special to log in the Zabbix server process log.

Configurations for the proxy data buffering

In the configuration file for Zabbix proxy 6.4 there are two configuration parameters that control the buffering: ProxyLocalBuffer

Proxy will keep data locally for N hours, even if the data have already been synced with the server. This parameter may be used if local data will be used by third-party applications. (Default = 0) https://www.zabbix.com/documentation/devel/en/manual/appendix/config/zabbix_proxy

ProxyOfflineBuffer

Proxy will keep data for N hours in case of no connectivity with Zabbix server. Older data will be lost. (Default = 1) https://www.zabbix.com/documentation/devel/en/manual/appendix/config/zabbix_proxy

The ProxyOfflineBuffer parameter is the important one. If you need to tolerate longer outages than one hour between the proxy and the Zabbix server (and you have enough disk storage on the proxy), you can increase the value. There is no separate filename or path to configure because proxy uses the dedicated database (configured when installed the proxy) for storing the buffered data.

The ProxyLocalBuffer parameter is uninteresting for most (and disabled by default) because that’s only useful if you plan to fetch the collected data directly from the proxy database into some other external application, and you need to have some flexibility for scheduling the data retrievals from the database.

This post was originally published on the author’s blog.

Using Amazon Aurora Global Database for Low Latency without Application Changes

Post Syndicated from Roneel Kumar original https://aws.amazon.com/blogs/architecture/using-amazon-aurora-global-database-for-low-latency-without-application-changes/

Deploying global applications has many challenges, especially when accessing a database to build custom pages for end users. One example is an application using AWS Lambda@Edge. Two main challenges include performance and availability.

This blog explains how you can optimally deploy a global application with fast response times and without application changes.

The Amazon Aurora Global Database enables a single database cluster to span multiple AWS Regions by asynchronously replicating your data within subsecond timing. This provides fast, low-latency local reads in each Region. It also enables disaster recovery from Region-wide outages using multi-Region writer failover. These capabilities minimize the recovery time objective (RTO) of cluster failure, thus reducing data loss during failure. You will then be able to achieve your recovery point objective (RPO).

However, there are some implementation challenges. Most applications are designed to connect to a single hostname with atomic, consistent, isolated, and durable (ACID) consistency. But Global Aurora clusters provide reader hostname endpoints in each Region. In the primary Region, there are two endpoints, one for writes, and one for reads. To achieve strong  data consistency, a global application requires the ability to:

  • Choose the optimal reader endpoints
  • Change writer endpoints on a database failover
  • Intelligently select the reader with the most up-to-date, freshest data

These capabilities typically require additional development.

The Heimdall Proxy coupled with Amazon Route 53 allows edge-based applications to access the Aurora Global Database seamlessly, without  application changes. Features include automated Read/Write split with ACID compliance and edge results caching.

Figure 1. Heimdall Proxy architecture

Figure 1. Heimdall Proxy architecture

The architecture in Figure 1 shows Aurora Global Databases primary Region in AP-SOUTHEAST-2, and secondary Regions in AP-SOUTH-1 and US-WEST-2. The Heimdall Proxy uses latency-based routing to determine the closest Reader Instance for read traffic, and redirects all write traffic to the Writer Instance. The Heimdall Configuration stores the Amazon Resource Name (ARN) of the global cluster. It automatically detects failover and cross-Region on the cluster, and directs traffic accordingly.

With an Aurora Global Database, there are two approaches to failover:

  • Managed planned failover. To relocate your primary database cluster to one of the secondary Regions in your Aurora global database, see Managed planned failovers with Amazon Aurora Global Database. With this feature, RPO is 0 (no data loss) and it synchronizes secondary DB clusters with the primary before making any other changes. RTO for this automated process is typically less than that of the manual failover.
  • Manual unplanned failover. To recover from an unplanned outage, you can manually perform a cross-Region failover to one of the secondaries in your Aurora Global Database. The RTO for this manual process depends on how quickly you can manually recover an Aurora global database from an unplanned outage. The RPO is typically measured in seconds, but this is dependent on the Aurora storage replication lag across the network at the time of the failure.

The Heimdall Proxy automatically detects Amazon Relational Database Service (RDS) / Amazon Aurora configuration changes based on the ARN of the Aurora Global cluster. Therefore, both managed planned and manual unplanned failovers are supported.

Solution benefits for global applications

Implementing the Heimdall Proxy has many benefits for global applications:

  1. An Aurora Global Database has a primary DB cluster in one Region and up to five secondary DB clusters in different Regions. But the Heimdall Proxy deployment does not have this limitation. This allows for a larger number of endpoints to be globally deployed. Combined with Amazon Route 53 latency-based routing, new connections have a shorter establishment time. They can use connection pooling to connect to the database, which reduces overall connection latency.
  2. SQL results are cached to the application for faster response times.
  3. The proxy intelligently routes non-cached queries. When safe to do so, the closest (lowest latency) reader will be used. When not safe to access the reader, the query will be routed to the global writer. Proxy nodes globally synchronize their state to ensure that volatile tables are locked to provide ACID compliance.

For more information on configuring the Heimdall Proxy and Amazon Route 53 for a global database, read the Heimdall Proxy for Aurora Global Database Solution Guide.

Download a free trial from the AWS Marketplace.

Resources:

Heimdall Data, based in the San Francisco Bay Area, is an AWS Advanced ISV partner. They have AWS Service Ready designations for Amazon RDS and Amazon Redshift. Heimdall Data offers a database proxy that offloads SQL improving database scale. Deployment does not require code changes.

How to configure an incoming email security gateway with Amazon WorkMail

Post Syndicated from Jesse Thompson original https://aws.amazon.com/blogs/security/how-to-configure-an-incoming-email-security-gateway-with-amazon-workmail/

This blog post will walk you through the steps needed to integrate Amazon WorkMail with an email security gateway. Configuring WorkMail this way can provide a versatile defense strategy for inbound email threats.

Amazon WorkMail is a secure, managed business email and calendar service. WorkMail leverages the email receiving capabilities of Amazon Simple Email Service (Amazon SES) to scan all incoming and outgoing email for spam, malware, and viruses to help protect your users from harmful email. AWS Lambda for Amazon WorkMail functions can tap into the capabilities of other AWS services to accomplish additional business objectives, such as controlling message delivery or message modification.

For many organizations, existing features and integrations with Amazon SES are sufficient for their spam, malware, and virus detection. Other organizations may need either a dedicated on-premise security solution, or have other reasons to use an additional inspection point in the overall mail flow. A number of commercial and community-supported tools include features like special encryption capabilities, data loss prevention (DLP) content inspection engines, and embedded-hyperlink transformation features to protect end-user mailboxes.

Prerequisites

To implement this solution, you need:

  • A domain name and permission to alter domain name system (DNS) records in Amazon Route 53 or your existing DNS provider. This could be your organization’s existing domain (such as example.org), a new domain (such as example.net), or a subdomain (such as sub.example.org).
  • Access to an AWS account so you can configure WorkMail and Amazon SES. Optionally, you may also need the ability to create AWS Lambda functions to integrate with WorkMail.
  • Access to configure the email security gateway of your choosing.

How email flows with an email security gateway

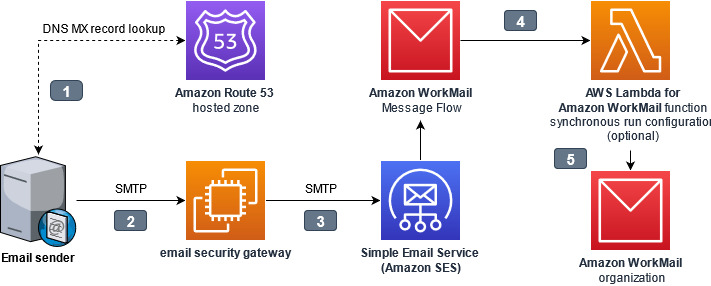
Email security gateways function by handling the initial ingress of email via the Simple Mail Transport Protocol (SMTP). When email servers send messages to your domain’s email addresses, they look at your domain’s mail exchange (MX) record in the DNS. After processing an email message, the email security gateway delivers it to the downstream mailbox hosting service, such as WorkMail, by means of Amazon SES via SMTP. You can also optionally configure an AWS Lambda for Amazon WorkMail function to synchronously deliver messages into end-user junk email folders, or to take other actions. 

Figure 1. Interaction points while architecting an email security gateway

Figure 1. Interaction points while architecting an email security gateway

The interaction points are as follows:

  1. The email sender looks up the mail exchange (MX) record for the domain hosted by WorkMail. The domain name system (DNS) domain may be hosted in Route 53, or by another DNS hosting provider. The value of the MX record contains the internet protocol (IP) address of the email security gateway.
  2. The email sender connects to the email security gateway, and sends the message using the Simple Mail Transfer Protocol (SMTP)
  3. The email security gateway accepts, processes, and then delivers the message to the ingress SMTP endpoint for WorkMail. Amazon Simple Email Service (Amazon SES) handles inbound email receiving for WorkMail.
  4. Optionally, an AWS Lambda for Amazon WorkMail function can synchronously process messages before delivery to WorkMail.
  5. WorkMail receives the message for final delivery to the end-user.

The gateway assumes responsibility for inspecting incoming email, because the initial point of ingress is an important component of a multi-layer defense strategy against email-borne threats. The gateway could refuse or quarantine risky messages, it could modify the email subjects and body to add warnings visible to recipients, or it could append metadata to the email headers for downstream processing by an AWS Lambda function.

Why point of ingress email authentication is important

What is email authentication

SMTP was built at a time when networking was less reliable than it is today, and consequently, it was designed to be able to allow any domain to store and later forward messages on behalf of other domains to mitigate connection problems. While that helped at the time, today it presents real problems in authenticating who truly sent a message: the owner of the domain, or just someone else claiming to be the owner? To overcome this issue, the messaging industry has adopted three protocols to help verify the authenticity of a message: SPF, DKIM, and DMARC. These protocols aren’t perfect, but understanding how to use them is important when adding new steps to your message processing workflow, because they can affect how you receive inbound mail.

Sender Policy Framework

Sender Policy Framework (SPF) permits domain owners to declare which SMTP servers are allowed to send email messages claiming to be from their domain. This establishes an identity relationship between the owner of the domain and the authorized party that controls the SMTP server. When SPF is used, a message can only be handed off directly from an authorized SMTP server; it cannot be relayed through a second, unauthorized server without changing the originating address.

DomainKeys Identified Mail (DKIM)

DomainKeys Identified Mail (DKIM) permits domain owners to advertise a public key that a mail recipient’s system can use to verify the sender’s digital signature. This allows SMTP servers and other downstream applications to check the validity of the digital signature against the public key of the domain which had the matching private key to create the signature. DKIM signatures attached to messages can remain intact through intermediary SMTP servers, but if message contents (email body or email headers) are modified by intermediary servers, the final destination will find that the signature is no longer valid.

Domain-based Message Authentication, Reporting and Conformance (DMARC)

Domain-based Message Authentication, Reporting and Conformance (DMARC) permits domain owners to publish a policy telling receiving servers what to do when SPF or DKIM are not valid, such as if a message originated from an unauthorized server, or if it was tampered with after being sent. DMARC checks if a message matches what it knows about the sender via SPF and DKIM, a process known as alignment. The recipient’s server can then enforce the DMARC policy, for example by rejecting or quarantining non-aligned messages.

Tying it all together

Amazon WorkMail normally performs DMARC enforcement for inbound messages, based on their alignment when they were received by Amazon SES. But when an email security gateway acts as an intermediary SMTP server between the original sender and WorkMail, that breaks the relationship with the SMTP servers authorized by SPF, and if the gateway modifies the message, that invalidates the DKIM signature. This is why it’s necessary for the SMTP server at the point of ingress to perform the evaluation of SPF, DKIM, and DMARC. The email security gateway at the border should be made responsible for enforcing DMARC on messages that don’t align, and WorkMail DMARC enforcement should be disabled.

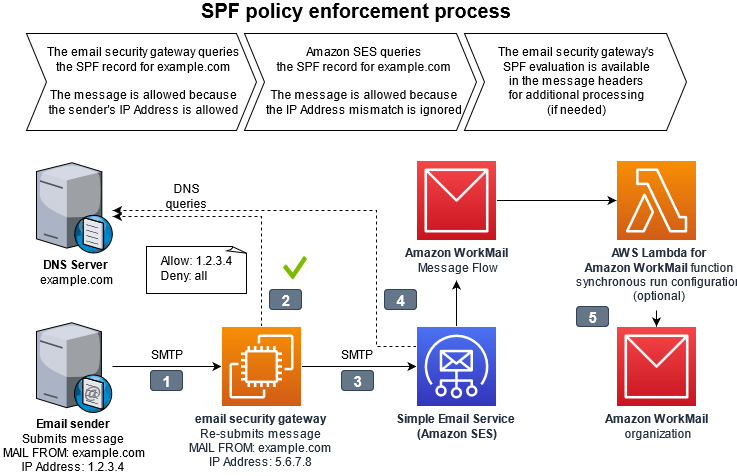
Figure 2. Diagram of SPF policy enforcement process. The full details of the interaction points are outlined below.

Figure 2. Diagram of SPF policy enforcement process. The full details of the interaction points are outlined below.

The interaction points for SPF policy enforcement are as follows:

  1. The email sender delivers the message to the email security gateway with a MAIL FROM address within a domain the sender owns.
  2. The email security gateway looks up the sender’s domain’s Sender Permitted From (SPF) policy in DNS to determine if the sending mail server’s IP address is authorized.
  3. The email security gateway delivers the message to Amazon SES with the same MAIL FROM address. The email security gateway has a different IP address than the original sending email server.
  4. When Amazon SES looks up the MAIL FROM domain’s SPF, it will not find the email security gateway’s IP address as authorized. From the perspective of Amazon SES, and the resulting logs in Amazon Cloudwatch, the message will appear to be unauthorized by the SPF policy. This result is ignored by disabling DMARC checks in the WorkMail organization configuration.
  5. The message continues delivery to WorkMail with an optional integration with AWS Lambda for Amazon WorkMail synchronous run configuration, which can analyze message headers to get a more complete picture of the message’s authenticity.

Choosing an email security gateway

Many email security vendors offer software as a service (SaaS) solutions. This offloads all management responsibilities to the software vendor’s platform. These solutions work as long as they support the email gateway features necessary for this solution as depicted in Figure 2 and described in the Why point of ingress email authentication is important section above.

If you wish to build and maintain your own email security gateway, you may deploy one available from the AWS Marketplace or add an open source application into your Amazon Virtual Private Cloud (Amazon VPC). You will need to remove port 25 restriction from your EC2 instance for the email security gateway within your Amazon VPC to send email to Amazon WorkMail.

How to configure Amazon WorkMail

Follow this procedure to configure your WorkMail organization and Amazon SES IP address filters to allow the email security gateway to process inbound email receiving.

To configure Amazon WorkMail

  1. From the WorkMail console, select your organization, navigate to Organization settings, and select Advanced. Edit the Inbound DMARC Settings and set Enforcement enabled to Off. This ensures that WorkMail does not re-evaluate DMARC.

    Figure 3. Picture of the AWS WorkMail console showing the advanced configuration depicting Inbound DMARC enforcement disabled

    Figure 3. Picture of the AWS WorkMail console showing the advanced configuration depicting Inbound DMARC enforcement disabled

  2. From the Amazon SES console, navigate to Email receiving and create IP address filters to allow the IP address or IP address range of the gateway(s).
  3. Add another rule to block 0.0.0.0/0. This prevents malicious actors from bypassing your email security gateway.

    Figure 4. Picture of the Amazon SES console showing example IP address filters to allow the email security gateway IP addresses and blocking every other IP Address

    Figure 4. Picture of the Amazon SES console showing example IP address filters to allow the email security gateway IP addresses and blocking every other IP Address

  4. From the Route 53 console, navigate to Hosted zones, select the domain and edit the MX record to the IP address or hostname of the gateway. This causes all email senders to deliver to your gateway, instead of delivering directly to WorkMail.
    Follow the instructions of your DNS provider if the domain’s DNS is hosted elsewhere.

    Figure 5. Picture of the Amazon Route 53 console showing that the DMS MX record for the domain needs to be configured with the IP address of the email security gateway

    Figure 5. Picture of the Amazon Route 53 console showing that the DMS MX record for the domain needs to be configured with the IP address of the email security gateway

  5. From the WorkMail console, navigate to Domains, select your domain to show the Domain verification status page.
  6. Copy the host name from the value of the MX record type as depicted in Figure 6.

    Figure 6. Picture showing the section of the MX record value to copy from the WorkMail console.

    Figure 6. Picture showing the section of the MX record value to copy from the WorkMail console.

  7. Configure your email security gateway with the value that you just copied (e.g. inbound-smtp.us-east-1.amazonaws.com) to send inbound messages to your WorkMail organization. Instructions for doing this will vary depending on which email security gateway you are using.

Some specifics of this configuration depend on which gateway you are using, how it is designed for high availability, and the type of features configured. Test your WorkMail integration with a non-production domain before changing your production domain.

It is normal for Amazon CloudWatch logs for WorkMail, as well as the individual message headers, to show that SPF fails for all messages which traverse the gateway. Configure the email security gateway to record its SPF evaluation in the message headers so that it remains available for troubleshooting and further processing.

Junk E-Mail folder integration

WorkMail normally moves spam messages into the Junk E-mail folder within each recipient’s mailbox. To replicate this behavior for spam messages identified by the email security gateway, use AWS Lambda for Amazon WorkMail with a synchronous run configuration to run a function for every inbound message to a group of recipients.

To configure an AWS Lambda function for every inbound message (optional)

  1. Configure the email security gateway to include a spam verdict in the message headers for all incoming mail.
  2. Create a synchronous run configuration using AWS Lambda for Amazon WorkMail  to interpret the message headers and return a response to WorkMail with type: BYPASS_SPAM_CHECK or MOVE_TO_JUNK. A sample Amazon WorkMail Upstream Gateway Filter solution is available in the AWS Serverless Application Repository.

Conclusion

By integrating an email security gateway and leveraging AWS Lambda for Amazon WorkMail, you will gain additional security and management control over your organization’s inbound email. To learn more, read the Amazon WorkMail FAQs and Amazon WorkMail documentation.

 
If you have feedback about this post, submit comments in the Comments section below.

Want more AWS Security news? Follow us on Twitter.

Jesse Thompson

Jesse Thompson

Jesse is a worldwide public sector senior solutions architect at AWS. His background is in public sector enterprise IT development and operations, with a focus on abuse mitigation and encouragement of authenticity practices with open standard protocols.

Offloading SQL for Amazon RDS using the Heimdall Proxy

Post Syndicated from Antony Prasad Thevaraj original https://aws.amazon.com/blogs/architecture/offloading-sql-for-amazon-rds-using-the-heimdall-proxy/

Getting the maximum scale from your database often requires fine-tuning the application. This can increase time and incur cost – effort that could be used towards other strategic initiatives. The Heimdall Proxy was designed to intelligently manage SQL connections to help you get the most out of your database.

In this blog post, we demonstrate two SQL offload features offered by this proxy:

  1. Automated query caching
  2. Read/Write split for improved database scale

By leveraging the solution shown in Figure 1, you can save on development costs and accelerate the onboarding of applications into production.

Figure 1. Heimdall Proxy distributed, auto-scaling architecture

Figure 1. Heimdall Proxy distributed, auto-scaling architecture

Why query caching?

For ecommerce websites with high read calls and infrequent data changes, query caching can drastically improve your Amazon Relational Database Sevice (RDS) scale. You can use Amazon ElastiCache to serve results. Retrieving data from cache has a shorter access time, which reduces latency and improves I/O operations.

It can take developers considerable effort to create, maintain, and adjust TTLs for cache subsystems. The proxy technology covered in this article has features that allow for automated results caching in grid-caching chosen by the user, without code changes. What makes this solution unique is the distributed, scalable architecture. As your traffic grows, scaling is supported by simply adding proxies. Multiple proxies work together as a cohesive unit for caching and invalidation.

View video: Heimdall Data: Query Caching Without Code Changes

Why Read/Write splitting?

It can be fairly straightforward to configure a primary and read replica instance on the AWS Management Console. But it may be challenging for the developer to implement such a scale-out architecture.

Some of the issues they might encounter include:

  • Replication lag. A query read-after-write may result in data inconsistency due to replication lag. Many applications require strong consistency.
  • DNS dependencies. Due to the DNS cache, many connections can be routed to a single replica, creating uneven load distribution across replicas.
  • Network latency. When deploying Amazon RDS globally using the Amazon Aurora Global Database, it’s difficult to determine how the application intelligently chooses the optimal reader.

The Heimdall Proxy streamlines the ability to elastically scale out read-heavy database workloads. The Read/Write splitting supports:

  • ACID compliance. Determines the replication lag and know when it is safe to access a database table, ensuring data consistency.
  • Database load balancing. Tracks the status of each DB instance for its health and evenly distribute connections without relying on DNS.
  • Intelligent routing. Chooses the optimal reader to access based on the lowest latency to create local-like response times. Check out our Aurora Global Database blog.

View video: Heimdall Data: Scale-Out Amazon RDS with Strong Consistency

Customer use case: Tornado

Hayden Cacace, Director of Engineering at Tornado

Tornado is a modern web and mobile brokerage that empowers anyone who aspires to become a better investor.

Our engineering team was tasked to upgrade our backend such that it could handle a massive surge in traffic. With a 3-month timeline, we decided to use read replicas to reduce the load on the main database instance.

First, we migrated from Amazon RDS for PostgreSQL to Aurora for Postgres since it provided better data replication speed. But we still faced a problem – the amount of time it would take to update server code to use the read replicas would be significant. We wanted the team to stay focused on user-facing enhancements rather than server refactoring.

Enter the Heimdall Proxy: We evaluated a handful of options for a database proxy that could automatically do Read/Write splits for us with no code changes, and it became clear that Heimdall was our best option. It had the Read/Write splitting “out of the box” with zero application changes required. And it also came with database query caching built-in (integrated with Amazon ElastiCache), which promised to take additional load off the database.

Before the Tornado launch date, our load testing showed the new system handling several times more load than we were able to previously. We were using a primary Aurora Postgres instance and read replicas behind the Heimdall proxy. When the Tornado launch date arrived, the system performed well, with some background jobs averaging around a 50% hit rate on the Heimdall cache. This has really helped reduce the database load and improve the runtime of those jobs.

Using this solution, we now have a data architecture with additional room to scale. This allows us to continue to focus on enhancing the product for all our customers.

Download a free trial from the AWS Marketplace.

Resources

Heimdall Data, based in the San Francisco Bay Area, is an AWS Advanced Tier ISV partner. They have Amazon Service Ready designations for Amazon RDS and Amazon Redshift. Heimdall Data offers a database proxy that offloads SQL improving database scale. Deployment does not require code changes. For other proxy options, consider the Amazon RDS Proxy, PgBouncer, PgPool-II, or ProxySQL.

Zabbix proxy performance tuning and troubleshooting

Post Syndicated from Arturs Lontons original https://blog.zabbix.com/zabbix-proxy-performance-tuning-and-troubleshooting/14013/

Most Zabbix users use proxies, and those running medium to large instances might have encountered some performance issues. From this post and the video, you will learn more about the most common troubleshooting steps to resolve any proxy issues and to detect them as sometimes you might be unaware of an ongoing issue, as well as basic performance tuning to prevent such issues in the future.

Contents

I. Zabbix proxy (1:36)
II. Proxy performance issues (5:35)
III. Selecting and tuning the DB backend (13:27)
VI. General performance tuning (16:59)
V. Proxy network connectivity troubleshooting (20:43)

Zabbix proxy

Zabbix proxy can be deployed and most of the time is used to monitor distributed IT infrastructures, for instance, on a remote location to prevent data loss in case of network outages as the proxy collects the data locally and it is then pushed/pulled to/from Zabbix server.

Zabbix proxy supports active and passive modes, so we can push the data to the Zabbix server or have the Zabbix server pull the data from the proxy. Even if we don’t have any remote locations and have a single data center, it is still a good practice to delegate most of your data collection to a proxy running next to your server, especially in medium-sized and large instances. This allows for offloading our data collection and preprocessing performance overhead from the server to the proxy.

Active vs. passive

Whether an active or a passive mode is better for your company at the end of the day will depend on your security policies. We can use passive mode with the server pulling the data from the proxy or active mode with the proxy establishing the connection to the Zabbix server and pushing the data.

  • Active mode is the default configuration parameter as it is a bit more simple to configure — almost all of the configuration can be done only on the proxy side. Then, we need to add the proxy on the frontend and we’re good to go.
### Option: ProxyMode
#   Proxy operating mode.
#   0 - proxy in the active mode
#   1 - proxy in the passive mode
#
# Mandatory: no
# Default:
# ProxyMode=0
  • In the case of a passive proxy, we have to make some changes in the Zabbix server configuration file, which would involve a restart of the Zabbix server and, as a consequence, downtime.

Finally, it is all going to boil down to our networking team and the network and security policies, for instance, allowing for passive or active mode only. If both modes are supported, then the active mode is a bit more elegant.

Proxy versions

Another common question is about the proxy version to install and the database backend to use.

  • The main point here is that the major proxy version  should match the major version of the Zabbix server, while minor versions can differ. For instance, Proxy 5.0.4 can be used with Server 5.0.3 and Web 5.0.9 (in this example, the first and the second number should match). Otherwise, the proxy won’t be able to send the data to the server and you will see some error messages in your log files about version mismatch and data formatting not fitting your server requirements.
  • Proxies support: SQLite / MySQL/ PostgreSQL/ Oracle backends. To install the proxy, we need to select the proper package for either SQLite3, MySQL, PostgreSQL, or just compile proxy with Oracle database backend support.

— SQLite proxy package:

# yum install zabbix-proxy-sqlite3

— MySQL proxy package:

# yum install zabbix-proxy-mysql

— PostgreSQL proxy package:

# yum install zabbix-proxy-pgsql

For instance, if we do # yum install zabbix-proxy-sqlite3 or copy and paste the instructions from the Zabbix website for SQLite, we will later wonder why it is not working for MySQL as there are some unique dependencies for each of these packages.

NOTE. Don’t forget to select the proper package in relation to the proxy DB backend

Proxy performance issues

After we have installed everything and covered the basics of what needs to be done and how to set things up, we can start tuning or proxy and try to detect any potential  performance issues.

Detecting proxy performance issues

How can we find out what the root cause of performance issues is or if we are having them at all?

  1. First, we need to make sure that we are actually monitoring our proxy. So, we need to:
  • Create a host in Zabbix,
  • Assign this host to be monitored by the proxy. If the host is monitored by the server, it will report the wrong metrics — the Zabbix server metrics, not the Zabbix proxy metrics.

So, we need to create a host and configure it to be monitored by the proxy itself. Then we can use an out-of-the-box proxy monitoring template — Template Apps Zabbix Proxy.

Template App Zabbix Proxy

NOTE. Template Apps Zabbix Proxy gets updated on the git.zabbix page, when we add new components to Zabbix, new internal processes, new gathering processes, and so on, to support these new components.

If you are running an older version of Zabbix, for example, all the way back from version 2.0, make sure that you download the newer template from our git page not to stay in the blind about the newer internal component performance.

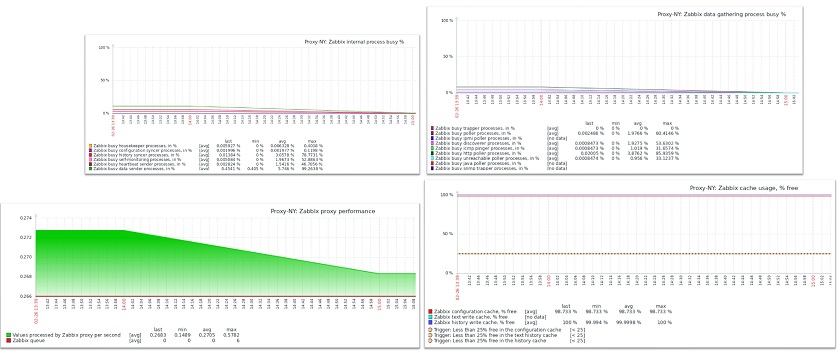
Once we have applied the template, we will see performance graphs with information about gathering processes, internal processes, cache usage, and proxy performance, and both the queue and the new values received per second. So, we can actually react to predefined triggers provided by the template, if there is an issue.

Performance graphs

  1. Then, we need to have a look at the administration queue. A large or growing proxy-specific queue can be a sign of performance issues or a misconfiguration. We might have failed to allow our agents to communicate with our proxies or we might have some network issue on our proxy preventing us from collecting data from the proxy.

An issue on the proxy

In this case:

  • Check the proxy status, graphs, and log files. In the example above, the proxy has been down for over a year, so it should be decommissioned and removed from the Zabbix environment.
  • Check the agent logs for issues related to connecting to the proxy. For instance, the proxy might be trying to pull the data but have no rights to do so due to no permissions in the agent configuration file.

Lack of server resources

In some cases, we might simply try to monitor way too much on a really small server, for instance, an older version of a Raspberry Pi device. So, we should use tools such as sar or top to identify resource bottlenecks on the proxy server  coming, for example, from the storage performance.

sar -wdp 3 5 > disk.perf.txt

sar is a part of a sysstat package, and this command can provide us with information about our storage performance, serialization, wait times, queues, input/output operations per second, and so on. sar can tell us when something might be overloaded especially if we have longer wait times.

NOTE. Don’t get confused by high %util, which is relevant on hard drives, but on an SSD or a RAID setup the utilization is normally very high. While hard drives can handle only one operation at a time, SSD disks or RAID setups support parallel operations. This can cause SSD or RAID util% to skyrocket, which might not necessarily be a sign of an issue.

Proxy queue

Another useful, though a bit hackish, indicator of the proxy performance is the proxy queue on the proxy database — the count of the metrics pending but not yet sent to the server.

  • We can observe this in real-time by queueing the proxy DB.
  • A constantly growing number means that we cannot catch up with our backlog — the network is down or there are some performance issues on the server or the proxy, so more data is getting backlogged than sent.
  • The list of unsent metrics is stored in proxy_history table.
  • The last sent metric is marked in the IDs table.
select count(*) from proxy_history where id>(select nextid from ids where
table_name="proxy_history");

This value will keep growing if the proxy is unable to send the data at all or due to performance issues. If the network is down, this is to be expected between the proxy and the server. However, if everything is working but the count still keeps growing, we need to investigate for any spamming items, thousands of log lines coming per second, or other performance issues with our storage and/or our database. There might be performance problems on the server due to the server being unable to ingest all of this data in time after a restart, a long downtime, etc. Such a problem should get resolved over time on its own. Otherwise, if there are no significant factors regarding the performance or any recent changes, we need to investigate deeper.

If this value is steadily decreasing, the proxy is actually catching up with the backlog and the incoming data, and is sending data to the server faster than it is collecting new metrics. So, this backlog will get resolved over time.

Configuration frequency

Don’t forget about the configuration frequency. Any configuration changes will be applied on the proxy after ConfigFrequency interval. By default, these changes get applied once an hour, so ConfigFrequency is 3600.

### Option: ConfigFrequency
#   How often proxy retrieves configuration data from Zabbix Server in seconds.
#   For a proxy in the passive mode this parameter will be ignored.
#
# Mandatory: no
# Range: 1-3600*24*7
# Default:
# ConfigFrequency=3600

On active proxies, we can force configuration cache reload by executing config_cache_reload for Zabbix proxy.

#zabbix_proxy -R config_cache_reload
#zabbix_proxy [1972]: command sent successfully

This is another good reason to use active proxies to pick up all of the configuration changes from the server. However, on passive proxies, the only thing we can do is a proxy restart to force a reload of the configuration changes, which is not a good idea. Otherwise, we have to wait for an hour or some other configuration interval until the changes are picked up by the proxy.

Selecting and tuning the DB backend

The next important step is a selection of the database.

SQLite

A common question, which has no clear answer is when to use SQLite and when should we switch to a more robust DB backend.

  • SQLite is perfect for small instances as it supports embedded hardware. So, if I were to run a proxy on Raspberry or an older desktop machine, I might use SQLite. Even embedded hardware aside, on smaller instances with fewer than 1,000 new values per second, SQLite backend should feel quite comfortable, though a lot will depend on the underlying hardware.
### Option: ConfigFrequency
#   How often proxy retrieves configuration data from Zabbix Server in seconds.
#   For a proxy in the passive mode this parameter will be ignored.
#
# Mandatory: no
# Range: 1-3600*24*7
# Default:
# ConfigFrequency=3600
  • So, in most cases, when proxies collect less than 1,000 NVPS per second, SQLite proxy DB backends are sufficient. With SQLite, you don’t need to additionally configure the database.
#zabbix_proxy -R config_cache_reload
#zabbix_proxy [1972]: command sent successfully
  • With SQLite, there’s no need to have additional database configuration, preparation, or tuning. In the proxy configuration file, we just point at the location of the SQLite file.
  • A single file is created at the proxy startup, which can be deleted if data cleanup is necessary.
### Option: DBName
#   Database name.
#   For SQLite3 path to database file must be provided. DBUser and DBPassword are ignored.
#   Warning: do not attempt to use the same database Zabbix server is using.
#
# Mandatory: yes
# Default:
# DBName=
DBName=/tmp/zabbix_proxy

All in all the SQLite backend comparatively easy to manage However, it comes with a set of negatives. If we need something more robust that we can tune and tweak, then SQLite won’t do. Essentially, if we reach over 1,000 new values per second, I would consider deploying something more robust — MySQL, PostgreSQL, or Oracle.

Other proxy DB backends

  • Any of the supported DB backends can be used for a proxy. In addition, the Zabbix server and Zabbix proxy can use different DB backends. The DB configuration parameters are very similar in Zabbix server and Zabbix proxy configuration files, so users should feel right at home with configuring the proxy DB backend.
  • DB and DB user should be created beforehand with the proper collation and permissions.
shell> mysql -uroot -p<password>
mysql> create database zabbix_proxy character set utf8 collate utf8_bin; 
mysql> create user 'zabbix'@'localhost' identified by '<password>'; 
mysql> grant all privileges on zabbix_proxy.* to 'zabbix'@'localhost'; 
mysql> quit;
  • DB schema import is also a prerequisite. The command for proxy schema import is very similar to the server import.
zcat /usr/share/doc/zabbix-proxy-mysql*/schema.sql.gz | mysql -uzabbix -p zabbix_proxy

DB Tuning

  • Make sure to use the DB backend you are most familiar with.
  • The same tuning rules apply to the Zabbix proxy DB as to the Zabbix server DB.
  • Default configuration parameters of the backend will depend on the version of the backend used. For instance, different MySQL versions will have different default parameters, so we need to have a look at MySQL documentation, the default parameters, and the way to tune them.
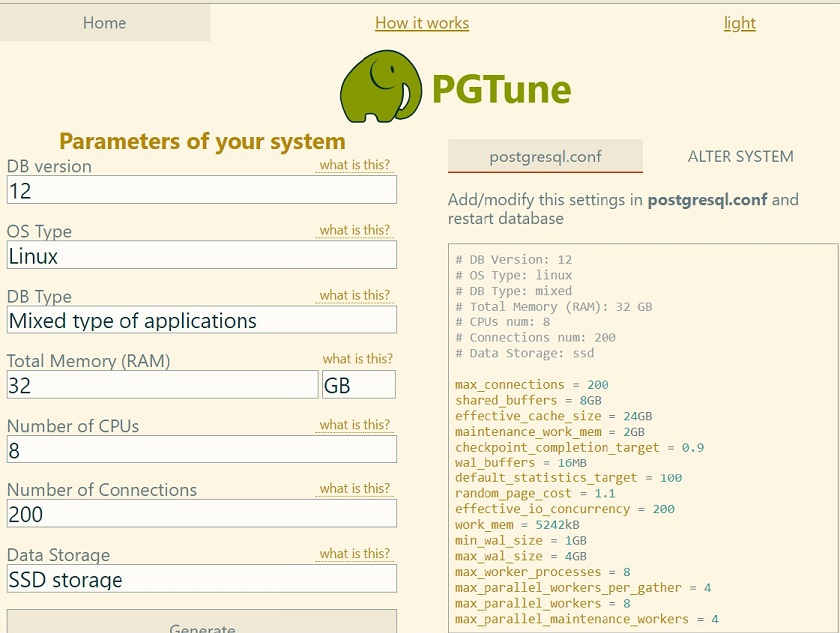
  • For PostgreSQL, it is possible to use the online tuner — PGTune. Though it is not an ideal instrument, it is a good starting point not to leave the proxy hanging without any tuning as we might encounter issues sooner rather than later. With tuning, the database will be more robust and will last longer before we will have to add any resources and rescale the database config.

PGTune

General performance tuning

Proxy configuration tuning

Database aside, how we can tune the proxy itself?

Proxy configuration is similar to the configuration of the Zabbix server: we still need to take into account and tune our gathering processes, internal processes, such as preprocessors, and our cache sizes. So, we need to have a look at our gathering graphs, internal process graphs, and our cache graphs to see how busy the processes and how full the graphs are and adjust accordingly. This is a lot easier to do on the proxy than on the server since proxy restart is usually quicker and a lot less critical, and less impactful than the server downtime.

In addition, these will differ on each of the proxy servers depending on the proxy size and types of items. For instance, if on proxy A we are capturing SNMP traps, we need to enable the SNMP trapper process and configure our trap handler — Perl, snmptrapd, etc.  If we are doing a lot of ICMP pings for another proxy, we’ll require many ICMP pingers. A really large proxy will need to have its History Syncers increased. So, each proxy will be different, and there is no one-fit-all configuration.

  • Since most of the time proxies handle fewer values since they are distributed and scaled out, we will have a lesser number of History Syncers on proxies in comparison with Zabbix server. In the vast majority of cases, the default number of History Syncers is more than sufficient. Though sometimes we might need to change the count of History Syncers on the proxy.
### Option: StartDBSyncers
#             Number of pre-forked instances of DB Syncers.
#
# Mandatory: no
# Range: 1-100
# Default:
# StartDBSyncers=4

There are always exceptions to the rule. For instance, we might want to have a single large-scale and robust proxy collecting the data from some very critical or very large location with many data points – such an infrastructure layout will still be supported.

  • If DB syncers do underperform on a seemingly small instance, chances are it is due to lack of hardware resources or, for SQLite, DB backend limitations

We need to monitor the resource usage via sar, or top, or any other tool to make sure that hardware resources aren’t overloaded.

Proxy data buffers

We also have the option to store the data on our proxies if the server is offline or store them even if the Zabbix server is reachable and the data has been sent to the server. we may want to keep our data in the proxy database and utilize it by other third-party tools or integrations.

On our proxies, we have a local buffer and an offline buffer, which determine for how long we can store the data. The size of Local and Offline buffers will affect the size and the performance of your database. The larger the time window for which we store the data, the larger the database is. So, the fewer resources we utilize, the better the performance is, the easier it is to scale up, etc.

  • Local buffer
### Option: ProxyLocalBuffer
#   Proxy will keep data locally for N hours, even if the data have already been synced with the server.
#
# Mandatory: no
# Range: 0-720
# Default:
# ProxyLocalBuffer=0
  • Offline buffer
### Option: ProxyOfflineBuffer
#   Proxy will keep data for N hours in case if no connectivity with Zabbix Server.
#   Older data will be lost.
#
# Mandatory: no
# Range: 1-720
# Default:
# ProxyOfflineBuffer=1

Proxy network connectivity troubleshooting

Detecting network issues

Sometimes we have network issues between proxies and the server: either the server cannot talk to proxies or proxies cannot talk to the server.

  • A good first step would be to test telnet connectivity to/from a proxy.
time telnet 192.168.1.101 10051
  • Another great method is to time your pings to see how long pinging takes or how long it takes to establish a telnet connection. This could point you towards network latency issues: slow networks, network outages, and so on.
  • Log file can help you figure out proxy connectivity issues.
125209:20210214:073505.803 cannot send proxy data to server at "192.168.1.101": ZBX_TCP_WRITE() timed out
  • Load balancers, Traffic inspectors, and other IDS/Firewall tools can hinder proxy traffic. Sometimes it can take hours troubleshooting an issue to find out that it boils down to a load balancer, a traffic inspector, or IDS/firewall tool.

Troubleshooting network issues

  • A great way to troubleshoot this would be to deploy a test proxy with a different firewall/load balancing configuration. From time to time, network connectivity drops seemingly for no reason. We can bring up another proxy with no load balancers or no traffic inspectors, and ideally, in the same network as the problematic proxies. We need to find out if the new proxy is experiencing the same problems, or if the issue is resolved after we remove the load balancers, IDS/firewall tools. If the problem gets resolved, then this might be a case of misconfigured firewall/IDS.
  • Another great approach of detecting networking issues due to transport problems, for instance, IDS/Firewalls cutting up our packets, is to perform a tcpdump on proxy and server to correlate network traffic with error messages in the log.

tcpdump on the proxy:

tcpdump -ni any host -w /tmp/proxytoserver

tcpdump on the server:

tcpdump -ni any host -w /tmp/servertoproxy

— Correlating retransmissions with errors in logs could signify a network issue.

Many retransmissions may be a sign of network issues. If there are a few of them, if we open Wireshark to find just a couple of retransmits, it might not be the root cause. However, if the majority of our packet capture result is read with duplicate packets, retransmits, acknowledges without data packets being received, etc., that can be a sign of an ongoing network issue.

Ideally, we could take a look at this packet capture and correlate it with our proxy log file to figure out if these error messages in our proxy logfile or server logfile (depending on the type of communication — active or passive) correlate with packet capture issues. If so, we can be quite sure that the networking issue is at fault and then we need to figure out what is causing it — IDS, load balancers, a shoddy network, or anything else.