All posts by Purna Sanyal

How Aigen transformed agricultural robotics for sustainable farming with Amazon SageMaker AI

Post Syndicated from Purna Sanyal original https://aws.amazon.com/blogs/architecture/how-aigen-transformed-agricultural-robotics-for-sustainable-farming-with-amazon-sagemaker-ai/

This post is cowritten with Yuri Brigance, and Usman M. Khan from Aigen.

Aigen builds autonomous robots designed to help farmers remove herbicide-resistant weeds and improve crop yield through AI-driven technology. These robots operate without chemicals, using renewable energy, and provide real-time, field-level data to enhance decision-making. Using advanced computer vision AI, Aigen’s robots autonomously identify and remove weeds without harming crops, giving farmers an eco-friendly, cost-effective solution to traditional weed management and efficient farming. As its robotic fleet expanded, Aigen’s on-premises infrastructure became a bottleneck in scaling its model-building pipeline.

In this post, you will learn how Aigen modernized its machine learning (ML) pipeline with Amazon SageMaker AI to overcome industry-wide agricultural robotics challenges and scale sustainable farming. This post focuses on the strategies and architecture patterns that enabled Aigen to modernize its pipeline across hundreds of distributed edge solar robots and showcase the significant business outcomes unlocked through this transformation. By adopting automated data labeling and human-in-the-loop validation, Aigen increased image labeling throughput by 20x while reducing image labeling costs by 22.5x.

Key challenges of scaling field agricultural robots

Aigen’s initial ML pipeline was designed to build task-specific edge models for its field robots. Robot data was uploaded to Amazon Simple Storage Service (Amazon S3) for manual labeling. The annotated datasets were then used to train new task-specific edge models on Aigen’s on-premises infrastructure. However, this ML pipeline introduced several limitations:

  • Connectivity Constraints: Inconsistent internet in rural areas hampered communication between robots and cloud.
  • High Data Labeling Cost: Manual data labeling of thousands of new samples data per day proved prohibitively expensive and time-consuming.
  • Limited Computational Power: Training specialized edge models and fine-tuning foundation models (FMs) for specific tasks using on-premises hardware was a bottleneck due to limited parallelism and GPU compute power with on-premises RTX 3090 machines.
  • Scalability Issues: Model Training and data labeling batch Inference had to compete for the same RTX 3090 machines, causing delays either for the data science team for model training or the data labeling team for batch inference.

Solution

Aigen addresses these challenges by adopting an AWS AI-driven, cloud-native approach that enables scalable and automated operations:

  • Edge Computing: Robots use AWS IoT Core and cloud utilities to safely offload data to Amazon S3, even in low-connectivity regimes.
  • Automated Data Pipeline: Data collected by the robots flows through an Extract, Transform, and Load (ETL) pipeline for preprocessing. Data labeling is accelerated using an ensemble of vision foundation models (Grounding DINO, Owl-ViT, SAM2, CLIPSeg) along with custom expert vision models to automatically annotate large volumes of field imagery. Through active learning, the pipeline selects and down-samples the most informative samples, which are then reviewed and refined by human annotators before being passed downstream into the model training workflow.
  • Cloud native ML Pipeline: Aigen accelerates model training on Amazon SageMaker AI, using Distributed Data Parallel (DDP) across multi-GPU clusters to achieve faster iteration cycles and efficient hyperparameter tuning. By scaling training in the cloud, Aigen removes resource contention between model training and data labeling batch inference. This results in improved throughput, reduced wait times, and a more predictable ML workflow for data science and labeling teams.

Let’s take a closer look at how Aigen’s solution architecture is designed to meet diverse machine learning needs, from data labeling to real-time inference on autonomous field robots, starting with its model architecture.

Model architecture

Aigen’s models are classified in four hierarchical categories that form a progression from broad, general-purpose models to highly specialized models tailored for edge computing. Foundation Models (L1) are the starting point, with each subsequent category building on the previous model, adding specificity or performance enhancements.
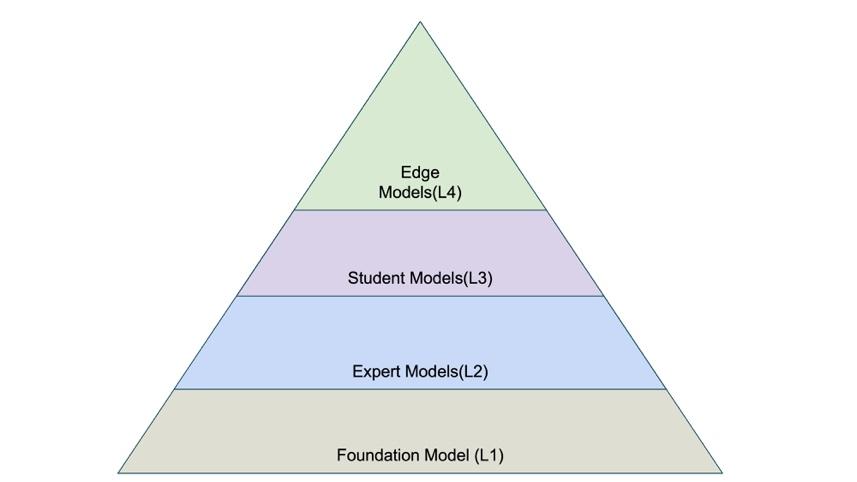
Figure 1: Aigen Model Architecture

Figure 1: Aigen Model Architecture

  1. Foundation models use a combination of Aigen’s proprietary and open source foundation vision models to support plant detection, wheel detection, general object recognition, and segmentation. SAM2 is the primary model for generating segmentation masks, while Grounding DINO provides prompt-based annotation for objects like cars and people. Aigen employs a leading image generation model with ControlNet + Depth to create synthetic data with an option to fine-tune LoRA adapters to produce samples like field data. Aigen’s large vision models, trained on extensive field datasets, serve as robust foundations for crop identification and as high-quality starting points for building specialized pre-labeling models.
  2. Expert models are distilled from FMs and trained on annotated field images to perform precise, task-specific vision workloads. They generate high-quality pre-labels, bounding boxes, segmentation masks, and keypoint detections, which are then validated and refined by human annotators. Segmentation combined with key points allows the system to identify fine-grained plant anatomy, such as stems and other structural features. These models use both Vision Transformer and CNN-based architectures, and contain 10s of millions of parameters.
  3. Student models are compact, full-precision (FP32) models designed for ultra-low latency and minimal memory usage and are continuously fine-tuned on the latest data. Distilled from expert models, they remain extremely small, typically under 1.5M parameters, and are further improved through quantization-aware training (QAT), pruning, and other compression techniques. These optimizations enable efficient edge deployment, requiring as little as 2 Tera Operations Per Second (TOPS) while achieving real-time, double-digit frames per second (FPS) within the robot’s perception stack. Each student model is task-specific, tailored to individual crops (for example, tomato, cotton, sugar beets, soybeans) and various view angles such as top-down or intra-row.
  4. Edge models are built by further improving the full-precision student models for inference on the robot’s Neural Processing Unit (NPU). It undergoes QAT, followed by conversion to TFLite and INT8 quantization to reduce model size, lower power consumption, and increase inference throughput on the robot’s NPU. Purpose built for ultra-efficient edge inference, these models run on a 2.3-TOPS NPU using roughly 1.5W of power while sustaining real-time, double-digit FPS performance. These models contain 1M–1.2M parameters and occupy about 2 MB of memory.

This hybrid multi model ecosystem approach works well to balance model accuracy with edge computing constraints.

Modernized cloud native architecture for continuous model improvement

The modernized architecture forms a closed loop of nearly continuous model improvement, connecting field data collection from the robot to iterative training and rapid redeployment of updated models back onto the robot. This end-to-end cycle enables faster refinement, higher accuracy, and ongoing adaptation to real-world conditions.
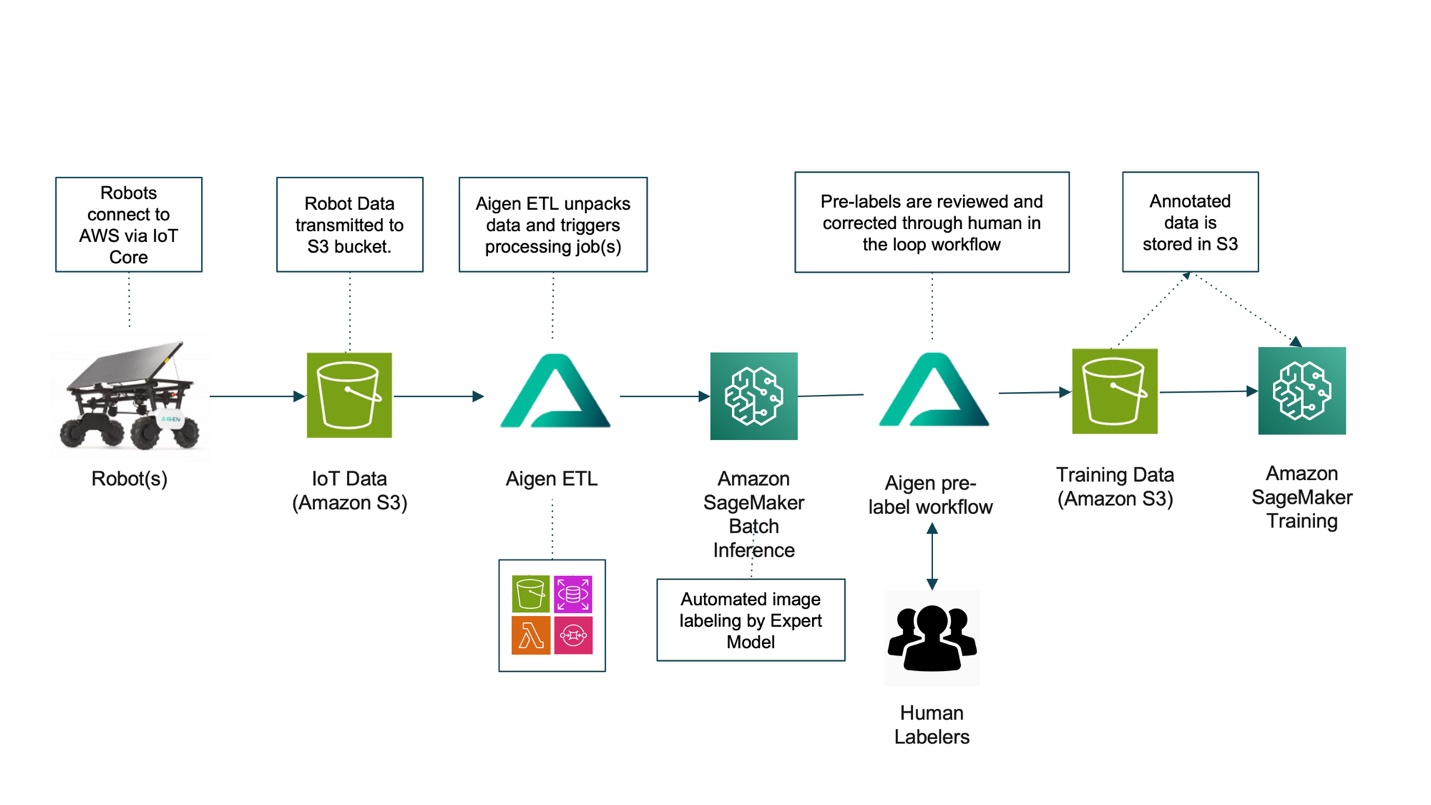
Figure 2: Aigen modernized architecture

Figure 2: Aigen modernized architecture

The following sections describe the end-to-end process illustrated in the architecture diagram, from field data ingestion into AWS to continuous model delivery back to the robotic fleet. The workflow is organized into three key stages:

  1. Data Collection and Data Ingestion: Field Robots connect to AWS services using AWS IoT Core. Raw data, including navigation and crop-camera video (RGB + Depth), robot telemetry (odometry, frame timestamps), camera intrinsics/extrinsic, and job metadata, is continuously transmitted from the robots to Amazon S3 buckets. These data provide centralized storage for field, crop, and task specific downstream processing.
  2. Data Processing and Data Labeling: Aigen ETL unpacks the raw data, catalogs it, and stores it in Amazon S3. SageMaker AI processing jobs perform batch inference on this data and label the images using an ensemble of expert models running on the G5/G6 family of GPU instances. Aigen’s active learning process down-selects pre-labeled images and sends them for human review, where annotators validate and correct identified errors. Active learning analyzes images, embeddings, predictions, and other signals to identify the most informative samples for training. This approach removes the need to annotate every data point, often millions per field per season, by prioritizing images where the model struggles or those that add diversity. With multiple selection criteria, active learning helps keep dataset size manageable, control labeling effort, and verify only the most relevant samples are used to improve model performance.
  3. Model Training: The final annotated data is stored back in Amazon S3. SageMaker AI Training jobs pull this data from Amazon S3 and use multi-GPU instances to train expert, student and edge models. Edge-optimized models are deployed to the robots, while the newly finetuned expert models are used for the next cycle of data labeling.

Built on a cloud-native architecture, the workflow uses AWS services to deliver reliability, and robust performance, while effectively addressing the key challenges of scaling Aigen’s robotic fleet. The automated process collects data from field robot and use that in model training in the cloud, minimizing manual intervention while maintaining efficiency. Human-in-the-loop validation ensures high-quality training data by having annotators review and correct AI-generated pre-labels. Finally, active learning creates a positive feedback loop that continuously improves models by prioritizing the most relevant training data, enhancing robotic performance in real-world conditions.

Business benefits

This AI-powered solution delivered the following benefits:

  • Cost Efficiency: Reduced labeling costs from ~$2.00 to $0.089 per image, achieving a 22.5× cost reduction
  • Faster Annotation Pipeline: Reduced average annotation time from 14 minutes 57 seconds with manual labeling to just 41 seconds with SageMaker batch inference. This acceleration shortens model delivery for new crops from months to weeks, enabling quicker deployment and unlocking new business opportunities.
  • Rapid Scaling Gains: Experiment capacity increased from five per week on on-premises infrastructure to hundreds per week using Amazon SageMaker AI, achieving a 20× increase in throughput over previous hardware.
  • Innovation
    • The powerful GPU instances of Amazon SageMaker AI enabled the training and fine-tuning of advanced Vision Transformers models, which were not feasible on limited on-premises hardware. This access to state-of-the-art (SOTA) GPUs accelerates model innovation.
    • Scalable training infrastructure removes GPU bottlenecks by enabling parallel experimentation. This allows faster testing of new architectures and hyperparameters tuning, significantly speeding up model innovation compared to the slow, sequential workflow imposed by limited on-premises GPU capacity.

Key learnings

Amazon SageMaker AI has been instrumental in Aigen’s robotics system transformation, delivering significant benefits across the machine learning pipeline:

  • Self-Managed AI Infrastructure: SageMaker AI removes the need for Aigen to build and maintain auto scaling GPU compute infrastructure. This reduction in development costs allows Aigen to focus more on model development rather than infrastructure management, accelerating the production of deployment-ready models.
  • Streamlined ML Workflow: SageMaker AI streamlines the entire ML lifecycle, from data preparation to model deployment. Its flexibility supports the use of various built-in features and custom processes such as pre-labeling that cut down the time required to produce high-quality training data.
  • Efficient Resource Utilization: The managed infrastructure of SageMaker AI lowers operational overhead, supports continuous model updates, such as daily fine-tuning as plants grow, without resource bottlenecks. For example, when moving to a new customer’s cotton field with different soil, lighting, or crop varieties, the base cotton model may underperform. With SageMaker AI, Aigen can rapidly ingest new data and fine-tune models on this new condition to improve performance. Over multiple seasons and fields, this process builds a diverse, high-quality dataset that steadily strengthens the model family.

To achieve similar results in your organization, start by evaluating your current data labeling costs and consider implementing active learning techniques to reduce manual annotation overhead.

Conclusion

By using AWS services, particularly SageMaker AI, Aigen moved beyond the limitations of its on-premises infrastructure and established a foundation for continued growth and innovation. The new architecture delivers the scalability, efficiency, and intelligence needed to expand its fleet of eco-friendly agricultural robots, bringing sustainable farming practices to more fields worldwide. Aigen’s journey illustrates how generative AI can modernize machine learning pipelines for robotics, enabling more productive and environmentally sustainable agriculture. You can implement a similar architecture pattern to improve the machine learning pipeline.

Get started with model training and model inference by visiting Amazon SageMaker AI Studio. Creating your first Serverless ML flow pipeline is also supported in SageMaker AI Studio for additional workflow flexibility.


About the Authors

Journey to adopt Cloud-Native DevOps platform Series #2: Progressive delivery on Amazon EKS with Flagger and Gloo Edge Ingress Controller

Post Syndicated from Purna Sanyal original https://aws.amazon.com/blogs/devops/journey-to-adopt-cloud-native-devops-platform-series-2-progressive-delivery-on-amazon-eks-with-flagger-and-gloo-edge-ingress-controller/

In the last post, OfferUp modernized its DevOps platform with Amazon EKS and Flagger to accelerate time to market, we talked about hypergrowth and the technical challenges encountered by OfferUp in its existing DevOps platform. As a reminder, we presented how OfferUp modernized its DevOps platform with Amazon Elastic Kubernetes Service (Amazon EKS) and Flagger to gain developer’s velocity, automate faster deployment, and achieve lower cost of ownership.

In this post, we discuss the technical steps to build a DevOps platform that enables the progressive deployment of microservices on Amazon Managed Amazon EKS. Progressive delivery exposes a new version of the software incrementally to ingress traffic and continuously measures the success rate of the metrics before allowing all of the new traffics to a newer version of the software. Flagger is the Graduate project of Cloud Native Computing Foundations (CNCF) that enables progressive canary delivery, along with bule/green and A/B Testing, while measuring metrics like HTTP/gRPC request success rate and latency. Flagger shifts and routes traffic between app versions using a service mesh or an Ingress controller

We leverage Gloo Ingress Controller for traffic routing, Prometheus, Datadog, and Amazon CloudWatch for application metrics analysis and Slack to send notification. Flagger will post messages to slack when a deployment has been initialized, when a new revision has been detected, and if the canary analysis failed or succeeded.

Prerequisite steps to build the modern DevOps platform

You need an AWS Account and AWS Identity and Access Management (IAM) user to build the DevOps platform. If you don’t have an AWS account with Administrator access, then create one now by clicking here. Create an IAM user and assign admin role. You can build this platform in any AWS region however, I will you us-west-1 region throughout this post. You can use a laptop (Mac or Windows) or an Amazon Elastic Compute Cloud (AmazonEC2) instance as a client machine to install all of the necessary software to build the GitOps platform. For this post, I launched an Amazon EC2 instance (with Amazon Linux2 AMI) as the client and install all of the prerequisite software. You need the awscli, git, eksctl, kubectl, and helm applications to build the GitOps platform. Here are the prerequisite steps,

  1. Create a named profile(eks-devops)  with the config and credentials file:

aws configure --profile eks-devops

AWS Access Key ID [None]: xxxxxxxxxxxxxxxxxxxxxx

AWS Secret Access Key [None]: xxxxxxxxxxxxxxxxxx

Default region name [None]: us-west-1

Default output format [None]:

View and verify your current IAM profile:

export AWS_PROFILE=eks-devops

aws sts get-caller-identity

  1. If the Amazon EC2 instance doesn’t have git preinstalled, then install git in your Amazon EC2 instance:

sudo yum update -y

sudo yum install git -y

Check git version

git version

Git clone the repo and download all of the prerequisite software in the home directory.

git clone https://github.com/aws-samples/aws-gloo-flux.git

  1. Download all of the prerequisite software from install.sh which includes awscli, eksctl, kubectl, helm, and docker:

cd aws-gloo-flux/eks-flagger/

ls -lt

chmod 700 install.sh ecr-setup.sh

. install.sh

Check the version of the software installed:

aws --version

eksctl version

kubectl version -o json

helm version

docker --version

docker info

If the docker info shows an error like “permission denied”, then reboot the Amazon EC2 instance or re-log in to the instance again.

  1. Create an Amazon Elastic Container Repository (Amazon ECR) and push application images.

Amazon ECR is a fully-managed container registry that makes it easy for developers to share and deploy container images and artifacts. ecr setup.sh script will create a new Amazon ECR repository and also push the podinfo images (6.0.0, 6.0.1, 6.0.2, 6.1.0, 6.1.5 and 6.1.6) to the Amazon ECR. Run ecr-setup.sh script with the parameter, “ECR repository name” (e.g. ps-flagger-repository) and region (e.g. us-west-1)

./ecr-setup.sh <ps-flagger-repository> <us-west-1>

You’ll see output like the following (truncated).

###########################################################

Successfully created ECR repository and pushed podinfo images to ECR #

Please note down the ECR repository URI          

xxxxxx.dkr.ecr.us-west-1.amazonaws.com/ps-flagger-repository                                                   

Technical steps to build the modern DevOps platform

This post shows you how to use the Gloo Edge ingress controller and Flagger to automate canary releases for progressive deployment on the Amazon EKS cluster. Flagger requires a Kubernetes cluster v1.16 or newer and Gloo Edge ingress 1.6.0 or newer. This post will provide a step-by-step approach to install the Amazon EKS cluster with managed node group, Gloo Edge ingress controller, and Flagger for Gloo in the Amazon EKS cluster. Now that the cluster, metrics infrastructure, and Flagger are installed, we can install the sample application itself. We’ll use the standard Podinfo application used in the Flagger project and the accompanying loadtester tool. The Flagger “podinfo” backend service will be called by Gloo’s “VirtualService”, which is the root routing object for the Gloo Gateway. A virtual service describes the set of routes to match for a set of domains. We’ll automate the canary promotion, with the new image of the “podinfo” service, from version 6.0.0 to version 6.0.1. We’ll also create a scenario by injecting an error for automated canary rollback while deploying version 6.0.2.

  1. Use myeks-cluster.yaml to create your Amazon EKS cluster with managed nodegroup. myeks-cluster.yaml deployment file has “cluster name” value as ps-eks-66, region value as us-west-1, availabilityZones as [us-west-1a, us-west-1b], Kubernetes version as 1.24, and nodegroup Amazon EC2 instance type as m5.2xlarge. You can change this value if you want to build the cluster in a separate region or availability zone.

eksctl create cluster -f myeks-cluster.yaml

Check the Amazon EKS Cluster details:

kubectl cluster-info

kubectl version -o json

kubectl get nodes -o wide

kubectl get pods -A -o wide

Deploy the Metrics Server:

kubectl apply -f https://github.com/kubernetes-sigs/metrics-server/releases/latest/download/components.yaml

kubectl get deployment metrics-server -n kube-system

Update the kubeconfig file to interact with you cluster:

# aws eks update-kubeconfig --name <ekscluster-name> --region <AWS_REGION>

kubectl config view

cat $HOME/.kube/config

  1. Create a namespace “gloo-system” and Install Gloo with Helm Chart. Gloo Edge is an Envoy-based Kubernetes-native ingress controller to facilitate and secure application traffic.

helm repo add gloo https://storage.googleapis.com/solo-public-helm

kubectl create ns gloo-system

helm upgrade -i gloo gloo/gloo --namespace gloo-system

  1. Install Flagger and the Prometheus add-on in the same gloo-system namespace. Flagger is a Cloud Native Computing Foundation project and part of Flux family of GitOps tools.

helm repo add flagger https://flagger.app

helm upgrade -i flagger flagger/flagger \

--namespace gloo-system \

--set prometheus.install=true \

--set meshProvider=gloo

  1. [Optional] If you’re using Datadog as a monitoring tool, then deploy Datadog agents as a DaemonSet using the Datadog Helm chart. Replace RELEASE_NAME and DATADOG_API_KEY accordingly. If you aren’t using Datadog, then skip this step. For this post, we leverage the Prometheus open-source monitoring tool.

helm repo add datadog https://helm.datadoghq.com

helm repo update

helm install <RELEASE_NAME> \

    --set datadog.apiKey=<DATADOG_API_KEY> datadog/datadog

Integrate Amazon EKS/ K8s Cluster with the Datadog Dashboard – go to the Datadog Console and add the Kubernetes integration.

  1. [Optional] If you’re using Slack communication tool and have admin access, then Flagger can be configured to send alerts to the Slack chat platform by integrating the Slack alerting system with Flagger. If you don’t have admin access in Slack, then skip this step.

helm upgrade -i flagger flagger/flagger \

--set slack.url=https://hooks.slack.com/services/YOUR/SLACK/WEBHOOK \

--set slack.channel=general \

--set slack.user=flagger \

--set clusterName=<my-cluster>

  1. Create a namespace “apps”, and applications and load testing service will be deployed into this namespace.

kubectl create ns apps

Create a deployment and a horizontal pod autoscaler for your custom application or service for which canary deployment will be done.

kubectl -n apps apply -k app

kubectl get deployment -A

kubectl get hpa -n apps

Deploy the load testing service to generate traffic during the canary analysis.

kubectl -n apps apply -k tester

kubectl get deployment -A

kubectl get svc -n apps

  1. Use apps-vs.yaml to create a Gloo virtual service definition that references a route table that will be generated by Flagger.

kubectl apply -f ./apps-vs.yaml

kubectl get vs -n apps

[Optional] If you have your own domain name, then open apps-vs.yaml in vi editor and replace podinfo.example.com with your own domain name to run the app in that domain.

  1. Use canary.yaml to create a canary custom resource. Review the service, analysis, and metrics sections of the canary.yaml file.

kubectl apply -f ./canary.yaml

After a couple of seconds, Flagger will create the canary objects. When the bootstrap finishes, Flagger will set the canary status to “Initialized”.

kubectl -n apps get canary podinfo

NAME      STATUS        WEIGHT   LASTTRANSITIONTIME

podinfo   Initialized   0        2023-xx-xxTxx:xx:xxZ

Gloo automatically creates an ELB. Once the load balancer is provisioned and health checks pass, we can find the sample application at the load balancer’s public address. Note down the ELB’s Public address:

kubectl get svc -n gloo-system --field-selector 'metadata.name==gateway-proxy'   -o=jsonpath='{.items[0].status.loadBalancer.ingress[0].hostname}{"\n"}'

Validate if your application is running, and you’ll see an output with version 6.0.0.

curl <load balancer’s public address> -H "Host:podinfo.example.com"

Trigger progressive deployments and monitor the status

You can Trigger a canary deployment by updating the application container image from 6.0.0 to 6.01.

kubectl -n apps set image deployment/podinfo  podinfod=<ECR URI>:6.0.1

Flagger detects that the deployment revision changed and starts a new rollout.

kubectl -n apps describe canary/podinfo

Monitor all canaries, as the promoted status condition can have one of the following statuses: initialized, Waiting, Progressing, Promoting, Finalizing, Succeeded, and Failed.

watch kubectl get canaries --all-namespaces

curl < load balancer’s public address> -H "Host:podinfo.example.com"

Once canary is completed, validate your application. You can see that the version of the application is changed from 6.0.0 to 6.0.1.

{

  "hostname": "podinfo-primary-658c9f9695-4pqbl",

  "version": "6.0.1",

  "revision": "",

  "color": "#34577c",

  "logo": "https://raw.githubusercontent.com/stefanprodan/podinfo/gh-pages/cuddle_clap.gif",

  "message": "greetings from podinfo v6.0.1",

}

[Optional] Open podinfo application from the laptop browser

Find out both of the IP addresses associated with load balancer.

dig < load balancer’s public address >

Open /etc/hosts file in the laptop and add both of the IPs of load balancer in the host file.

sudo vi /etc/hosts

<Public IP address of LB Target node> podinfo.example.com

e.g.

xx.xx.xxx.xxx podinfo.example.com

xx.xx.xxx.xxx podinfo.example.com

Type “podinfo.example.com” in your browser and you’ll find the application in form similar to this:

Figure 1: Greetings from podinfo v6.0.1

Automated rollback

While doing the canary analysis, you’ll generate HTTP 500 errors and high latency to check if Flagger pauses and rolls back the faulted version. Flagger performs automatic Rollback in the case of failure.

Introduce another canary deployment with podinfo image version 6.0.2 and monitor the status of the canary.

kubectl -n apps set image deployment/podinfo podinfod=<ECR URI>:6.0.2

Run HTTP 500 errors or a high-latency error from a separate terminal window.

Generate HTTP 500 errors:

watch curl -H 'Host:podinfo.example.com' <load balancer’s public address>/status/500

Generate high latency:

watch curl -H 'Host:podinfo.example.com' < load balancer’s public address >/delay/2

When the number of failed checks reaches the canary analysis threshold, the traffic is routed back to the primary, the canary is scaled to zero, and the rollout is marked as failed.

kubectl get canaries --all-namespaces

kubectl -n apps describe canary/podinfo

Cleanup

When you’re done experimenting, you can delete all of the resources created during this series to avoid any additional charges. Let’s walk through deleting all of the resources used.

Delete Flagger resources and apps namespace
kubectl delete canary podinfo -n  apps

kubectl delete HorizontalPodAutoscaler podinfo -n apps

kubectl delete deployment podinfo -n   apps

helm -n gloo-system delete flagger

helm -n gloo-system delete gloo

kubectl delete namespace apps

Delete Amazon EKS Cluster
After you’ve finished with the cluster and nodes that you created for this tutorial, you should clean up by deleting the cluster and nodes with the following command:

eksctl delete cluster --name <cluster name> --region <region code>

Delete Amazon ECR

aws ecr delete-repository --repository-name ps-flagger-repository  --force

Conclusion

This post explained the process for setting up Amazon EKS cluster and how to leverage Flagger for progressive deployments along with Prometheus and Gloo Ingress Controller. You can enhance the deployments by integrating Flagger with Slack, Datadog, and webhook notifications for progressive deployments. Amazon EKS removes the undifferentiated heavy lifting of managing and updating the Kubernetes cluster. Managed node groups automate the provisioning and lifecycle management of worker nodes in an Amazon EKS cluster, which greatly simplifies operational activities such as new Kubernetes version deployments.

We encourage you to look into modernizing your DevOps platform from monolithic architecture to microservice-based architecture with Amazon EKS, and leverage Flagger with the right Ingress controller for secured and automated service releases.

Further Reading

Journey to adopt Cloud-Native DevOps platform Series #1: OfferUp modernized DevOps platform with Amazon EKS and Flagger to accelerate time to market

About the authors:

Purna Sanyal

Purna Sanyal is a technology enthusiast and an architect at AWS, helping digital native customers solve their business problems with successful adoption of cloud native architecture. He provides technical thought leadership, architecture guidance, and conducts PoCs to enable customers’ digital transformation. He is also passionate about building innovative solutions around Kubernetes, database, analytics, and machine learning.

Journey to adopt Cloud-Native DevOps platform Series #1: OfferUp modernized DevOps platform with Amazon EKS and Flagger to accelerate time to market

Post Syndicated from Purna Sanyal original https://aws.amazon.com/blogs/devops/journey-to-adopt-cloud-native-devops-platform-series-1-offerup-modernized-devops-platform-with-amazon-eks-and-flagger-to-accelerate-time-to-market/

In this two part series, we discuss the challenges faced by OfferUp, a Digital Native customer, to meet business growth and time-to-market. Their journey involved modernizing their existing DevOps platform, from the traditional monolith virtual machine (VM) based architecture to modern containerized architecture and running cloud-native applications for secured progressive delivery to accelerate time to market. This series will provide strategies, architecture patterns, and technical steps you can adopt to become more agile and innovative like OfferUp has.

OfferUp engineers were using the homegrown DevOps platform to build and release new services on the marketplace platform. In this first post, we discuss the key challenges encountered by OfferUp engineers with the existing DevOps platform, as well as how OfferUp modernized its DevOps platform with Amazon Elastic Kubernetes Service (Amazon EKS) and Flagger, automating production releases with progressive delivery techniques for faster time-to-market with new products and services. Amazon EKS is a managed container service to run and scale Kubernetes applications in the cloud or on-premises.

Previous DevOps architecture

OfferUp is a leading online and mobile customer to customer (C2C) marketplace where users can both buy and sell goods on the platform. Users can browse and purchase products from a broad range of categories, including furniture, clothing, sports equipment, toys, and many more. As a mobile-first company, OfferUp puts a great deal of emphasis on in-person communication between buyers and sellers.

OfferUp built a home grown, self-managed DevOps platform. This platform used a set of manual processes and third-party applications that allows both developers and operations engineers to build and deploy code to a production environment. The DevOps pipeline included topic areas such as source code control, continuous integration/continuous delivery (CI/CD), microservices, as well as development and test Methodologies. The following diagram depicts the previous architecture of OfferUp’s DevOps platform, which was self-managed on Amazon Elastic Compute Cloud (Amazon EC2).

Figure 1: Previous DevOps architecture of OfferUp

OfferUp used GitHub for code repositories. Once the source code was committed in the code repository, Jenkins pulled the source code from code repositories on a scheduled or on-demand basis and built Amazon Machine Images (AMI). The built image was deployed in production by a  custom built deployment tool, Vanaheim, which supports one-box canary deployment and full roll-out deployment strategies. The DevOps engineers used to manually create a deployment job in the Vanaheim portal and then manually monitor the test success rate and service metrics to detect any impact from the deployment. Once the success rate was reached, a full production roll out was performed from the Vanaheim portal.

Key challenges with previous DevOps pipeline

In 2020, OfferUp experienced significant transaction volume growth on its Marketplace platform with the increase of its user base. With OfferUp’s acquisition of LetGo in 2020, there was a need to build a scalable DevOps platform to support future integration and organic growth. The previous DevOps platform, designed and deployed over seven years ago, had reached the limits of its scalability, and could no longer keep up with the platform’s growth. The previous architecture was expensive to run and had a complex infrastructure that made it difficult to upgrade and add new features.

The following key factors drove the push for modernization:

  • Manual verification was required to check if the code was correctly deployed in one of the servers in production, and if the deployment was right in one server, then it was rolled out to other production servers. Full Rollout to production wasn’t automated due to frequent failures requiring manual rollbacks.
  • The previous platform required a longer deployment time (1–2 hours) due to the authoritative batch process, which sometimes caused delays in releasing and testing of new features.
  • The self-managed nature of the Jenkins and Vanaheim clusters was consuming far too much engineering time. Most of the institutional knowledge of this legacy platform was lost over the years and it didn’t align with OfferUp’s philosophy of small DevOps engineering teams. Innovation had stalled partly due to the difficulty of simultaneously upgrading the DevOps platform and releasing new features.

DevOps platform automation with Flagger and Gloo Ingress Controller on Amazon EKS

A key requirement for the next-generation system was that the new architecture would reduce the operational burden on engineering teams, deployment lifecycle, and total cost of ownership. OfferUp evaluated multiple managed container orchestration platforms for its DevOps Platform. It finally selected Amazon EKS for high availability, reducing the average time to deploy a change to the stack from hours to just a few minutes and reducing the complexity in managing and upgrading the Kubernetes cluster. On the Amazon EKS platform, OfferUp uses Flagger, a progressive delivery tool that automates the release process for applications running on Kubernetes. Flagger implements several deployment strategies (Canary releases, A/B testing, and Blue/Green mirroring) using the Gloo Edge ingress controller for traffic routing. Datadog is used as an observability service for monitoring the health of the deployments and effectively managing the canary to progressive delivery. For release analysis, Flagger runs a query on Datadog logs and uses Slack for alerting and notifications. The cloud native technology components of the architecture are described as follows:

Kubernetes and Amazon EKS – Kubernetes is an open-source system for automating the deployment, scaling, and management of containerized applications. Kubernetes is a graduate project in the CNCF. Amazon EKS is a fully-managed, certified Kubernetes conformant service that simplifies the process of building, securing, operating, and maintaining Kubernetes clusters on AWS. Amazon EKS integrates with core AWS services, such as Amazon CloudWatch, Auto Scaling Groups, and AWS Identity and Access Management (IAM) to provide a seamless experience for monitoring, scaling, and load balancing your containerized applications.

Helm – Helm manage Kubernetes applications. Helm Charts define, install, and upgrade even the most complex Kubernetes application. Charts are easy to create, version, share, and publish. If Kubernetes were an operating system, then Helm would be the package manager. Helm is a graduate project in the CNCF and is maintained by the Helm community.

Flagger – Flagger is a progressive delivery tool that automates the release process for applications running on Kubernetes. Flagger implements a control loop that gradually shifts traffic to the canary while measuring key performance indicators such as HTTP requests success rate, requests average duration, and pods health. Based on the set thresholds, a canary is either promoted or aborted and its analysis is pushed to a Slack channel. Flagger became a CNCF project – part of the Flux family of GitOps tools.

Gloo EdgeGloo Edge is a feature-rich, Kubernetes-native ingress controller. Gloo Edge is exceptional in its function-level routing; its support for legacy apps, microservices, and serverless; its discovery capabilities; and its tight integration with leading open-source projects. Gloo Edge is uniquely designed to support hybrid applications, in which multiple technologies, architectures, protocols, and clouds can coexist.

Observability platformDatadog’s integrations with Kubernetes, Docker, and AWS will let you track the full range of Amazon EKS metrics, as well as logs and performance data from your cluster and applications. Datadog gives you comprehensive coverage of your dynamic infrastructure and applications with features like auto discovery to track services across containers, sophisticated graphing, and alerting options.

Modernized DevOps architecture

In the new architecture, OfferUp uses Github as a version control tool and Github actions as their CI/CD tool. On every Pull request, tests are run, artifacts are built and stored in the JFrog Artifactory, and docker Images are stored in the Amazon Elastic Container Registry (Amazon ECR). Separate deployment pipelines are triggered based on the environment (dev, staging, and production) of choice. Flagger detects any changes in the version of the application and gradually shifts production traffic to the canary. It measures the requests success rate and average response duration metrics from Datadog to decide full rollout in production. For an application deployment, a canary promotion can be defined using Flagger’s custom resource. Flagger rolls back the deployment when the success rate falls below the defined desired success rate metrics.

Figure 2: Modernized DevOps architecture of OfferUp

With the modernized DevOps platform, OfferUp moved from monolithic to microservice architecture where  front-end applications and GraphQL runs on the Amazon EKS cluster. The production cluster runs 110 services and 650+ pods on 60 nodes. The cluster scales up to 100 nodes with Amazon Auto Scaling group based on the traffic pattern. On the networking front, the cluster has a private endpoint and uses both VPC CNI plugin, and the CoreDNS add-on. There are four Amazon EKS clusters, one each for the production, test, utility, and the staging environments. OfferUp has a plan to explore Karpenter open-source autoscaling project, and it will move new applications to the Amazon EKS cluster, allowing the total node counts to scale up to 200.

Benefits of modernized architecture

The new architecture helped OfferUp make  automated decisions to deploy new releases and improve the time to market while reducing unplanned production downtime

  • Faster deployments and Quicker rollbacks – The new architecture reduces the Service Deployment time from one hour down to five minutes, and automates rollback time to five minutes from the manual rollback time of one hour.
  • Automate deployment of new releases – The lack of canary deployment processes in the previous architecture required OfferUp engineers to manually intervene to validate the deployment status, which led to administrative overhead and production outages. The canary deployments take care of the traffic shifting by automatically measuring the requests’ success rate and latency metrics from Datadog and subsequently release the service to production. Deployments are automatically rolled back when the success rate falls below the defined success rate metric thresholds.
  • Simplified Configuration – Configuration has been simplified drastically and integrated within the CI/CD pipeline in the new architecture, thereby reducing configuration complexity, eliminating manual processes, and saving Developers time.
  • More time to Focus on Innovation – With fully automated progressive delivery, the developers no longer need to spend time testing and releasing source code in production. Similarly, migrating from a Self-managed DevOps platform to the Managed Amazon EKS services lowered the DevOps platform’s infrastructure management burden on the engineering team. This helps developers spend more time focusing on building and testing new features and innovations.
  • Cost reduction – Moving from self-managed Amazon EC2-based architecture to the Amazon EKS cluster reduced the cost of operations through shared nodes and improved pod density. The previous architecture was using 200 nodes of Amazon EC2 instances. The same workload was moved to a 50 nodes Amazon EKS cluster. Furthermore, custom applications (Vanaheim and Jenkins) were retired, further reducing the costs.

Conclusion

In this post, you see how OfferUp embarked on the journey to modernize its DevOps platform to support its growth and developers’ velocity. The key factors that drove the modernization decisions were the ability to scale the platform to support the automated testing of features in production, the faster release of new features, cost reduction, and to facilitate future innovation. The modernized DevOps platform on Amazon EKS also decreased the ongoing operational support burden for engineers, and the scalability of the design opens up a lot of headroom for growth.

We encourage you to look into modernizing your existing CI/CD pipeline on Amazon EKS with the Flagger progressive delivery mechanism. Amazon EKS removes the undifferentiated heavy lifting of managing and updating the Kubernetes cluster. Managed node groups automate the provisioning and lifecycle management of worker nodes in an Amazon EKS cluster, which greatly simplifies operational activities, such as new Kubernetes version deployments.

In the next part of the series, you’ll discover how to implement Flagger and Gloo Edge Ingress Controller on Amazon EKS to automate the release process for applications running on Kubernetes.

Further Reading

Journey to adopt Cloud-Native DevOps platform Series #2: Progressive delivery on Amazon EKS with Flagger and Gloo Edge Ingress Controller

About the authors:

Purna Sanyal

Purna Sanyal is a technology enthusiast and an architect at AWS, helping digital native customers solve their business problems with successful adoption of cloud native architecture. He provides technical thought leadership, architecture guidance, and conducts PoCs to enable customers’ digital transformation. He is also passionate about building innovative solutions around Kubernetes, database, analytics, and machine learning.

Alan Liu

Alan Liu is Sr Director of Engineering at OfferUp. He is a technology enthusiast and he worked across a wide variety of industry. He is highly effective, adaptable, scalable, experienced leader with a proven record.