Because security is our top priority at Amazon Web Services (AWS), we designed an operational architecture to meet the data privacy posture our regulated and most stringent customers want in a managed Kubernetes service, giving them continued confidence to run their most critical and data-sensitive workloads on AWS services. Our services are designed to prevent AWS personnel from having technical pathways to read, copy, extract, modify, or otherwise access customer content in the management of Amazon EKS.
At AWS, earning trust isn’t only a goal, it’s one of the core Leadership Principles that guides every decision we make. Customers choose AWS because they trust us to provide the most secure global cloud infrastructure on which to build, migrate, and run their workloads, and to store their data. To build on this trust, we launched the AWS Trust Center to make information about how we secure our customers’ assets in the AWS Cloud more accessible. Along with this launch, we’re describing how we approach operator access to demonstrate an industry leading data privacy posture, and how we fulfill our part of the AWS Shared Responsibility Model in the AWS Cloud.
Many of the AWS core systems and services are designed with zero operator access, meaning they operate based on an architecture and model that, at the minimum, prevents any form of access to customer content in the management of the service. Instead, their systems and services are administered through automation and secure APIs that protect customer content from inadvertent or even coerced disclosure. Some of these services are AWS Key Management Service (AWS KMS), Amazon Elastic Compute Cloud (Amazon EC2) (through the AWS Nitro System), AWS Lambda, Amazon EKS, and AWS Wickr.
When AWS made its Digital Sovereignty Pledge, we committed to providing greater transparency and assurance to customers about how AWS services are designed and operated, especially when it comes to handling customer content. As part of that increased transparency, we engaged NCC Group, a leading cybersecurity consulting firm based in the United Kingdom, to conduct an independent architecture review of Amazon EKS, and the security assurances we provide to our customers. NCC Group has now issued its report and affirmed our claims. The report states:
“NCC Group found no architectural gaps that would directly compromise the security claims asserted by AWS.”
Specifically, the report validates the following statements about the Amazon EKS security posture:
There are no technical means for AWS personnel to gain interactive access to a managed Kubernetes control plane instance.
There are no technical means available to AWS personnel to read, copy, extract, modify, or otherwise access customer content in a managed Kubernetes control plane instance.
Internal administrative APIs used by AWS personnel to manage the Kubernetes control plane instances cannot access customer content in the Kubernetes data plane.
Changes to internal administrative APIs used to manage the Kubernetes control plane always requires multi-party review and approval.
There are no technical means available to AWS personnel to access customer content in backup storage for the etcd database. No AWS personnel can access any plaintext encryption keys used for securing data in the etcd database.
AWS personnel can only interact with the Kubernetes cluster API endpoint using internal administrative APIs without access to customer content in the managed Kubernetes control plane or the Kubernetes data plane. All actions performed on the Kubernetes cluster API endpoint by AWS personnel are visible to customers through customer enabled audit logs.
Access to internal administrative APIs always requires authentication and authorization. All operational actions performed by internal administrative APIs are logged and audited.
A managed Kubernetes control plane instance can only run tested software that has been deployed by a trusted pipeline. No AWS personnel can deploy software to a managed Kubernetes control plane instance outside of this pipeline.
The detailed NCC Group report examines each of these claims, including the scope, methodology, and steps that NCC Group used to evaluate the claims.
How Amazon EKS is designed for zero operator access
AWS has always used a least privilege model to minimize the number of humans that have access to systems processing customer content. This means that we design our products and services to provide each Amazonian access to only the minimum set of systems required to do their assigned task or responsibility and limit that access to when it’s needed. Any ccess to systems that store or process customer data is logged, monitored for anomalies, and audited. AWS designs all of its systems to prevent access by AWS personnel to customer content for unauthorized purposes. We commit to that in our AWS Customer Agreement and AWS Service Terms. AWS operations never require us to access, copy, or move a customer’s content without that customer’s knowledge and authorization.
Our operational architecture includes the exclusive use of AWS Nitro System-based instances to provide a confidential compute baseline for the managed Kubernetes control plane.
We use a set of restricted administrative APIs to enable precise control of access so our operators can conduct precise, allow-listed actions for troubleshooting and diagnostics without requiring direct or interactive access to the Kubernetes control plane instances. These APIs have been purposefully engineered without technical means to access customer content in the Kubernetes control plane or the customer’s Kubernetes data plane.
Following our standard change management mechanisms, we enforce a built-in, multi-party review and approval process for modifications to these restricted administrative APIs, and the accompanied policies that further strengthen the guardrails of how we operate the service. This model is implemented consistently across Amazon EKS clusters, regardless of the customer’s chosen launch mode for the Kubernetes data plane.
Additionally, every interaction with these restricted administrative APIs generates logs, with mandatory authentication and authorization, following the least privilege principle. By enabling their cluster’s audit logs, customers can maintain visibility into all actions performed by AWS personnel on the cluster’s API endpoint.
By default, we envelope encrypt all Kubernetes API data before it is stored at rest in the etcddatabase, and further secure backup storage of the etcd databaseto add multi-layered protection to prevent access to customer content in cluster snapshots. Furthermore, our system is designed so that no AWS personnel can access any of the plaintext encryption keys used to secure data in the etcd database and its backups.
These operator access controls apply uniformly to the Amazon EKS control plane, regardless of how you run your worker nodes—whether self-managed, through Amazon EKS Auto Mode, or with AWS Fargate. As stated in the AWS Shared Responsibility Model, customers remain responsible for securing the configurations of the Kubernetes worker nodes, with the exception of Amazon EKS Auto Mode and Fargate launch modes. For more information about the security of these AWS managed data plane launch modes in Amazon EKS, see the relevant links in the Learn more section.
Conclusion
Amazon EKS is designed and built to make sure that no AWS employee can read, copy, modify, or otherwise access customer content in Amazon EKS. By using AWS Nitro System‑based confidential compute, tightly‑scoped administrative APIs, multi‑party change‑approval processes, and end‑to‑end encryption, AWS avoids technical pathways for operator access. Independent validation from the NCC Group found no architectural gaps that would undermine these guarantees. In short, Amazon EKS delivers a zero operator access model that can meet the strictest regulatory and sovereignty requirements, giving organizations the confidence to run their most sensitive, mission‑critical workloads on AWS.
AWS Secrets Manager is a service that you can use to manage, retrieve, and rotate database credentials, application credentials, API keys, and other secrets throughout their lifecycles. You can also use Secrets Manager to replace hard-coded credentials in application source code with runtime calls to retrieve credentials dynamically when needed.
Managing secrets in Amazon Elastic Kubernetes Service (Amazon EKS) environments creates three main challenges: dependency on language-specific AWS SDKs, network dependencies from direct API calls, and complex secret rotation across multiple pods.
The AWS Secrets Manager Agent addresses these challenges by providing a language-agnostic HTTP interface that runs locally within your compute environment. In this post, we show you how to deploy the Secrets Manager Agent as a sidecar container in Amazon EKS to retrieve secrets through HTTP calls.
New approach: Secrets Manager Agent
The Secrets Manager Agent is a client-side agent that you can use to standardize consumption of secrets from Secrets Manager across your AWS compute environments. The agent pulls and caches secrets in your compute environment and allows your applications to consume secrets directly from the in-memory cache through a local HTTP endpoint (localhost:2773).
Instead of making network calls to Secrets Manager, you fetch secret values from the local agent, improving application availability while reducing API calls. Because the Secrets Manager Agent is language agnostic, you can use it across different programming languages without requiring AWS SDK dependencies.
Post-quantum cryptography protection
The Secrets Manager Agent implements ML-KEM (Machine Learning-based Key Encapsulation Mechanism) key exchange, which provides additional cryptographic protection for secret retrieval operations. This feature is enabled by default and requires no additional configuration.
Authentication and access control
This solution uses Amazon EKS Pod Identity for secure authentication to AWS services. Pod Identity provides a simplified way to associate AWS Identity and Access Management (IAM) roles with Kubernetes service accounts, avoiding the need for OpenID Connect (OIDC) provider configuration. IAM principals need GetSecretValue and DescribeSecret permissions to retrieve secrets through the agent.
The Secrets Manager Agent offers protection against server-side request forgery (SSRF). When you install the agent, it generates a random SSRF token and stores it in /var/run/awssmatoken. The agent actively blocks requests that don’t include this token in the X-Aws-Parameters-Secrets-Token header.
Solution overview
In this solution, you deploy the Secrets Manager Agent as a sidecar container in an Amazon EKS pod alongside an NGINX application. The sidecar pattern helps make sure that each pod has its own agent instance, providing isolation and fine-grained security boundaries.
This post demonstrates the Secrets Manager Agent sidecar approach, complementing the AWS Secrets and Configuration Provider (ASCP) guidance covered in Announcing ASCP integration with Pod Identity.
Amazon EKS supports multiple patterns for consuming Secrets Manager secrets. The ASCP for the Kubernetes Secrets Store CSI Driver works well when you want secrets mounted as files and prefer Kubernetes-native secret management. Use the Secrets Manager Agent when you need HTTP-based secret access, want to avoid pod restarts during secret rotation, or need granular refresh control via the refreshNow parameter.
Choosing between Secrets Manager Agent and CSI Driver:
Kubernetes-native secret management and file-based secret consumption
Each secret management approach has specific advantages for different use cases. The Secrets Manager Agent works well for applications requiring HTTP-based access and dynamic secret updates, while the ASCP with CSI Driver is ideal for applications that need file-based secret mounting. Consider your application’s specific requirements, operational patterns, and security needs when choosing between these approaches.
To deploy the solution, you build the agent binary, containerize it, and deploy it to Amazon EKS using Kubernetes manifests with Amazon EKS Pod Identity for secure access to Secrets Manager.
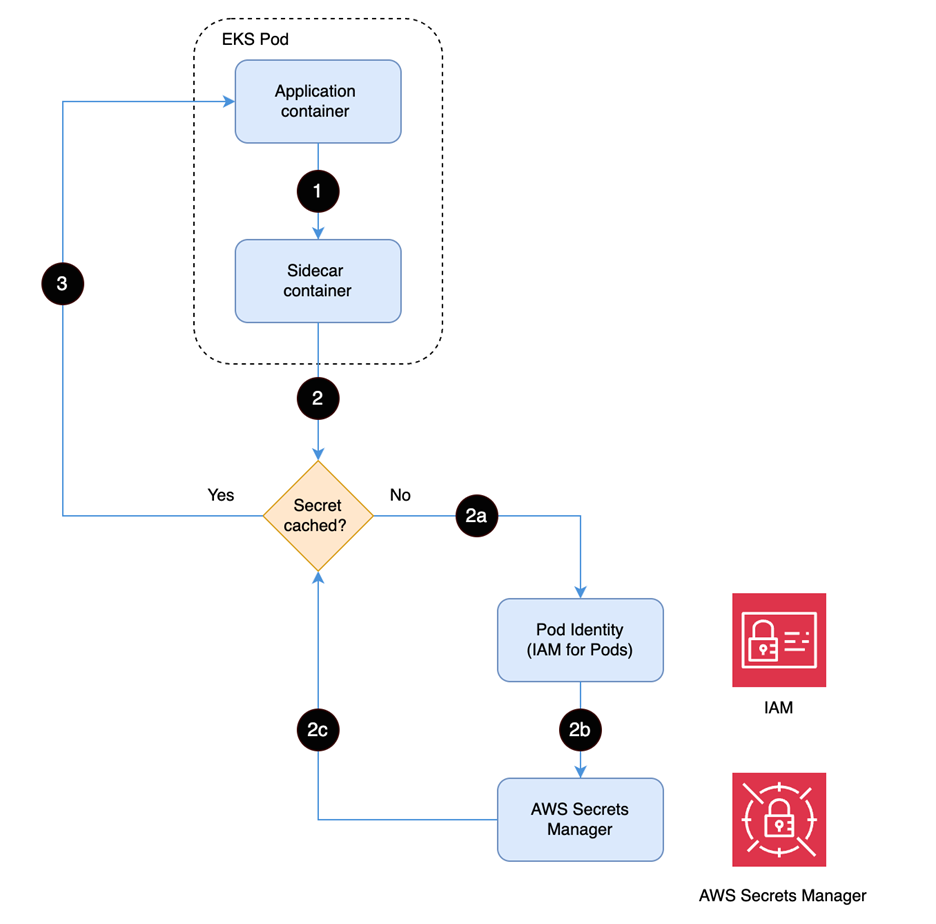
Figure 1: Solution workflow
The workflow of the solution is shown in Figure 1 and includes the following steps:
The application container sends GET /secretsmanager/get (localhost:2773) to retrieve secret
Secrets Manager Agent checks the local cache to determine if the secret is already stored in memory
If not cached, authenticate using Pod Identity to establish secure access to AWS Secrets Manager
Assume the IAM role to retrieve the secret from AWS Secrets Manager
Return the secret to the sidecar container for caching
Return the secret to the application container to fulfill the original request
Prerequisites
To build the solution in this post, you must have the following:
Please note, the AWS Secrets Manager Agent supports the versions of Amazon EKS and Kubernetes available since its initial launch, providing universal compatibility for secure secrets management across cluster versions.
In this section, you install the Secrets Manager Agent. With the agent installed, you then create the Pod Identity association, Secrets Manager binary image, push the binary image to Amazon Elastic Container Registry (Amazon ECR), and create a secret in Secrets Manager.
Verify the Pod Identity Agent installation:
kubectl get daemonset eks-pod-identity-agent -n kube-system
Create the Pod Identity association using the following commands:
Create a file named install and add the following content:
#!/bin/bash -e
PATH=/bin:/usr/bin:/sbin:/usr/sbin # Use a safe path
AGENTTARGETDIR=/opt/aws/secretsmanageragent
AGENTSOURCEDIR=/etc/aws_secretsmanager_agent/configuration
AGENTBIN=aws_secretsmanager_agent
TOKENGROUP=awssmatokenreader
AGENTUSER=awssmauser
TOKENSCRIPT=/etc/aws_secretsmanager_agent/configuration/awssmaseedtoken
AGENTSCRIPT=awssmastartup
if [ `id -u` -ne 0 ]; then
	echo "This script must be run as root" >&2
	exit 1
fi
if [ ! -r ${TOKENSCRIPT} ]; then
	echo "Can not read ${TOKENSCRIPT}" >&2
	exit 1
fi
if [ ! -r ${AGENTSOURCEDIR}/${AGENTBIN} ]; then
	echo "Can not read ${AGENTBIN}" >&2
	exit 1
fi
groupadd -f ${TOKENGROUP}
useradd -r -m -g ${TOKENGROUP} -d ${AGENTTARGETDIR} ${AGENTUSER} || true
chmod 755 ${AGENTTARGETDIR}
install -D -T -m 755
${AGENTSOURCEDIR}/${AGENTBIN} ${AGENTTARGETDIR}/bin/${AGENTBIN}
chown -R ${AGENTUSER} ${AGENTTARGETDIR}
exit 0
Build the agent binary on a Linux based instance using the following commands:
#!/bin/bash -e
# Here we are building the Secrets Manager Agent Binary for Linux x86_64 architecture
sudo yum -y groupinstall "Development Tools"
sudo yum install -y git
curl --proto '=https' --tlsv1.2 -sSf https://sh.rustup.rs | sh -s -- -y
source $HOME/.cargo/env
git clone https://github.com/aws/aws-secretsmanager-agent
cd aws-secretsmanager-agent
mv ../install aws_secretsmanager_agent/configuration
cargo build --release --target x86_64-unknown-linux-gnu
Create a file named startup.sh for the entry point and add the following content:
#!/bin/bash
set -e

echo "Starting AWS Secrets Manager Agent initialization..."

# Step 1: Run the install script (equivalent to install-agent init container)
echo "Running agent installation..."
/etc/aws_secretsmanager_agent/configuration/install

# Step 2: Initialize the token (equivalent to token-init init container)
echo "Starting token initialization..."
chmod +x
/etc/aws_secretsmanager_agent/configuration/awssmaseedtoken /etc/aws_secretsmanager_agent/configuration/awssmaseedtoken start

# Step 3: Start the main secrets manager agent
echo "Starting secrets manager agent..."
exec
/etc/aws_secretsmanager_agent/configuration/aws_secretsmanager_agent
Create a file named Docker-eks and add the following content:
FROM public.ecr.aws/amazonlinux/amazonlinux:2023

# Install required dependencies
RUN yum install -y ca-certificates bash shadow-utils && yum clean all
RUN mkdir -p /opt/aws/secretsmanageragent /var/run

# Copy in the agent binary and configuration scripts
COPY aws_secretsmanager_agent/configuration/
/etc/aws_secretsmanager_agent/configuration
COPY target/x86_64-unknown-linux-
gnu/release/aws_secretsmanager_agent
/etc/aws_secretsmanager_agent/configuration

# Make binaries and scripts executable
RUN chmod -R +x /etc/aws_secretsmanager_agent/configuration

# Copy and setup startup script
COPY startup.sh /startup.sh
RUN chmod +x /startup.sh

WORKDIR /
# Use the startup script as entrypoint
ENTRYPOINT ["/startup.sh"]
Build and publish the image using the following commands:
#!/bin/bash -e

#Create the ECR Repo ( us-west-2 region)
aws ecr create-repository --repository-name secrets-manager-agent --image-tag-mutability MUTABLE

#Build the image
docker build -f Dockerfile-eks -t secrets-manager-agent:eks .

#Tag the image
docker tag secrets-manager-agent:eks <ACCOUNT_ID>.dkr.ecr.us-west-2.amazonaws.com/secrets-manager-agent:eks

# Login into ECR
aws ecr get-login-password --region us-west-2 | docker login --username AWS --password-stdin <ACCOUNT_ID>.dkr.ecr.us-west-2.amazonaws.com

#Push the image
docker push  <ACCOUNT_ID>.dkr.ecr.us-west-2.amazonaws.com/secrets-manager-agent:eks
When successful, your private Amazon ECR repo will display the published image.
Create the secret
With the image successfully published, you’re ready to create the secret.
Create a secret in Secrets Manager by using the AWS CLI to enter the following command in a terminal.
2. Enter the following command in a terminal to create the IAM role: aws iam create-role --role-name eks-secrets-manager-role\ --assume-role-policy-document file://eks_iam_policy.json 3. Create a file named iam_permission.json with the following content, replacing <SECRET_ARN> with the secret ARN you noted earlier:
4. Enter the following command to create a policy: aws iam create-policy \ --policy-name get-secret-policy \ --policy-document file://iam_permission.json 5. Record the policy ARN to use in the next step.
6. Enter the following command to add this policy to the IAM role, replacing <POLICY_ARN> with the value you just noted: aws iam attach-role-policy \ --role-name eks-secrets-manager-role \ --policy-arn <POLICY_ARN>
Configure the application and deploy Secrets Manager Agent to Amazon EKS
Here is the sample Kubernetes deployment YAML for installing the Secrets Manager Agent as a sidecar container along with an application container. Replace <ACCOUNT_ID> with your AWS account number and run the code to deploy the NGINX application to the Amazon EKS cluster.
If successful, the pod will run with two active containers.
Retrieve the secret
Now you can run the following command to use the local web server to retrieve the agent. kubectl exec into the app container to retrieve the secret with a REST API call from the web server. kubectl exec -it nginx-with-secrets-c7945f8dc-7hrzr -c nginx -- sh curl -v -H “X-Aws-Parameters-Secrets-Token: $(cat /var/run/awssmatoken)” ‘http://localhost:2773/secretsmanager/get?secretId=<SecretID>'
You should see a Success 200 message and the secret value if IAM permissions are configured correctly.
Clean up
Run the following cleanup script to delete the resources created for the solution: bash chmod +x cleanup.sh ./cleanup.sh
When done, you can check the file named cleanup.sh in the repo to verify that the cleanup was successful:
bash
#!/bin/bash
set -e

echo "Cleaning up EKS resources..."
kubectl delete deployment nginx-with-secrets-simplified --ignore-not-found=true
kubectl delete service nginx-service --ignore-not-found=true
kubectl delete serviceaccount secrets-manager-sa --ignore-not-found=true

echo "Cleaning up Pod Identity association..."
# Replace with your actual cluster name
read -p "Enter your CLUSTER_NAME: " CLUSTER_NAME

if [ -n "$CLUSTER_NAME" ]; then
	ASSOCIATION_ID=$(aws eks list-pod-identity-associations \
                     --cluster-name $CLUSTER_NAME \
                     --query 'associations[?serviceAccount==`secrets-manager-sa`].associationId' \
                     --output text)

if [ -n "$ASSOCIATION_ID" ] && [ "$ASSOCIATION_ID" !=
"None" ]; then
		aws eks delete-pod-identity-association \
			--cluster-name $CLUSTER_NAME \
			--association-id $ASSOCIATION_ID || echo "Pod Identity
association already deleted"
		echo "Pod Identity association deleted"
	else
		eiifcbfhcfglkdirgljchvkildrknntukkidjtldeekk
echo "No Pod Identity association found"
	fi
fi

echo "Cleaning up IAM resources..."
# Replace with your actual policy ARN from the create-policy
output
read -p "Enter your POLICY_ARN: " POLICY_ARN

if [ -n "$POLICY_ARN" ]; then
		aws iam detach-role-policy \
			--role-name eks-secrets-manager-role \
			--policy-arn $POLICY_ARN || echo "Policy already detached"

		aws iam delete-policy --policy-arn $POLICY_ARN || echo
"Policy already deleted"
fi
aws iam delete-role --role-name eks-secrets-manager-role || echo
"Role already deleted"

echo "Cleaning up secret..."
aws secretsmanager delete-secret --secret-id MySecret || echo
"Secret already deleted"

echo "Cleaning up container image..."
aws ecr delete-repository \
	--repository-name secrets-manager-agent \
	--force || echo "Repository already deleted"

echo "Cleanup complete!"
Conclusion
In this post, we showed you how to deploy the AWS Secrets Manager Agent as a sidecar container in Amazon EKS. This approach provides a language-agnostic way to retrieve secrets through HTTP calls, reducing SDK dependencies while maintaining security through SSRF protection and IAM-based access controls.
The Secrets Manager Agent can be deployed as either a sidecar container or DaemonSet. Use sidecar deployment for isolated secrets and fine-grained security boundaries and use DaemonSet deployment for shared secrets across multiple applications with optimized resource utilization.
This approach complements existing secret management patterns and provides teams with HTTP-based secret access, immediate refresh control, and consistent interfaces across AWS compute environments.
Containerization offers organizations significant benefits such as portability, scalability, and efficient resource utilization. However, managing access control and authorization for containerized workloads across diverse environments—from on-premises to multi-cloud setups—can be challenging.
This blog post explores four architectural patterns that use Amazon Verified Permissions for application authorization in Kubernetes environments. Verified Permissions is a scalable permissions management and fine-grained authorization service for your applications.
In this blog post, we cover the following patterns and discuss their trade-offs:
Calling Verified Permissions from an Amazon API Gateway API fronting your application in Kubernetes
Calling Verified Permissions from a Kubernetes Ingress controller component
Calling Verified Permissions from a sidecar container running in the same pod as the application container
Calling Verified Permissions from the application container
Understanding these patterns and their implications can help you implement secure and consistent authorization mechanisms across your entire infrastructure without compromising the scalability, portability, and resource efficiency of your containerized workloads.
Consistent authorization through centralized policy management
Access to application resources can be secured more effectively with a centralized and consistent approach to authorization. Especially in containerized environments with distributed architectures and shared resources, traditional access control methods, like embedding authorization logic within individual application code or relying on local access control policies, can become difficult to manage and prone to errors. This becomes even more challenging when you have a combination of on-premises and cloud setups.
A centralized authorization solution empowers developers to implement consistent access control across individual components of an application efficiently. Benefits include reduced duplicate work, an improved security posture, and lower complexity in managing and enforcing access control policies.
Verified Permissions benefits in a containerized environment
Amazon Verified Permissions provides several key benefits as an external authorization service:
Benefits for the platform engineering team – Centralized authorization enables platform engineering teams to implement, maintain, and govern authorization policies across the organization without requiring changes to individual applications. This aligns with modern platform engineering practices, where platform engineering teams can provide authorization as a service to application teams, promoting consistent security standards while reducing the operational burden on development teams.
Consistent authorization across environments – With Verified Permissions, you can define and manage access control policies in a centralized location. This makes it easier to apply consistent authorization rules across your entire infrastructure, including on-premises deployments and different cloud environments.
Simplified application development – Externalizing authorization logic from applications reduces development complexity. Developers can focus on core application functionality without having to implement and maintain authorization mechanisms within each service or component. This separation of concerns promotes code modularity, reusability, and faster iteration cycles.
Scalable and highly available – Verified Permissions is a managed service, designed to be scalable and highly available out of the box. As your containerized workloads grow in scale and complexity, Verified Permissions can handle increasing authorization request volumes while maintaining performance and availability.
Fine-grained access control – Verified Permissions supports attribute-based access control (ABAC) and role-based access control (RBAC). This allows you to define granular policies in the open source Cedar language based on various attributes like user roles, resource properties, environmental factors, and more.
Integration patterns for authorization
Kubernetes provides many options for architecting applications. Therefore, there are multiple locations in a typical architecture where authorization decisions can be enforced, as shown in Figure 1.
Figure 1: Integration points for authorization in containerized workloads
The workflow is as follows:
API Gateway. Organizations can use entry points to the application outside of the Kubernetes cluster, such as an API gateway, to obtain an authorization decision. In AWS, Amazon API Gateway enables customers to use authorizer Lambda functions to send an authorization request to Verified Permissions.
Ingress controller. The Kubernetes API defines Ingress objects, which provide load balancing and routing functions on layer 7. Common Ingress controllers like Traefik offer the option to integrate external authorization services.
Sidecar proxy container. You can intercept every request routed to the application by using a sidecar container running in the same pod as the application container. This sidecar container calls Verified Permissions for authorization decisions.
Application container. Developers can use the Amazon SDK to communicate with Verified Permissions from inside the application when an authorization decision is needed.
In the following sections, we explore each of these patterns in detail, examining their implementation, use cases, and specific considerations. At the end of our discussion, we provide a comprehensive comparison table to help you choose the most appropriate pattern based on factors such as scalability, performance, maintenance overhead, and specific use case requirements. This will help you make an informed decision about which pattern best suits your application’s needs.
Authorization workflow
Independent of which of the four mentioned options for authorization you choose, the overall authorization workflow, shown in Figure 2, will stay the same.
Figure 2: Authorization workflow with Amazon Verified Permissions
The workflow is as follows:
Authentication. The user first authenticates with an identity provider to obtain a JSON Web Token (JWT). You can configure the identity provider to write relevant information like user roles, tenant ID, or other needed user attributes into the JWT. You can then use this information later to make an authorization decision.
API request. The user makes a request to your application that includes the JWT.
Authorization information. Your application extracts the relevant information that is needed to make an authorization decision from the request. This can include principal information from the JWT, information about the resource that the user requests, and what action the user wants to perform.
(Optional) Policy information point lookup. Depending on your policies, you might need additional information in order for Verified Permissions to make an authorization decision. For example, you can query ownership details for a document from a database.
Authorization decision. You then send the relevant information to Verified Permissions, which returns a decision stating whether the request is permitted or forbidden.
Authorization enforcement. You then enforce the decision from Verified Permissions in your application by allowing or denying an action. For a REST API, this would result in sending back an HTTP 403 forbidden status if the request was denied, or processing the request if it was allowed and sending an HTTP 200 OK status.
Authorization outside of the cluster by using Amazon API Gateway
In this pattern, authorization decisions are made at the API gateway layer before requests reach the Kubernetes cluster. When a request arrives at the API gateway, it triggers an authorization check with Verified Permissions to evaluate the request against defined policies. Based on the Verified Permissions response, the gateway either forwards the request to the containerized application or denies access.
This pattern excels in scenarios where you need coarse-grained access control that can be enforced with information accessible at the API level (such as an HTTP header or ID or access token) and that supports RBAC and ABAC. Consider a document management application where different users have access to different documents based on group membership or identity attribute.
This approach to authorization works consistently regardless of whether your application runs in containers, virtual machines, or serverless environments. The API gateway acts as a unified control point for enforcing access policies across backend services.
For implementations that use Amazon API Gateway specifically, you can use Lambda authorizers to integrate with Verified Permissions. For each incoming API request, API Gateway invokes the authorizer Lambda function, which makes a call to Verified Permissions to evaluate the request against the defined authorization policies, as shown in Figure 3.
Figure 3: Integration of Amazon Verified Permissions in Amazon API Gateway
Another option to implement coarse-grained access control in use cases as described in the previous section is to use a Kubernetes Ingress layer. Some customers prefer Kubernetes-native solutions, especially if they need to run Kubernetes clusters within and outside of AWS.
Kubernetes provides an API to create and maintain Ingress objects, operating at layer 7 (the application layer), which enables routing decisions based on HTTP attributes. This layer 7 capability makes Ingress controllers ideal for implementing authorization checks.
One Kubernetes Ingress controller that supports external authorization is Traefik Proxy. With this feature, you can delegate authorization decisions to an external service like Verified Permissions before routing requests to the application container.
Assuming that the authorization endpoint is backed by a service in the same Kubernetes cluster, the architecture looks as shown in Figure 4.
Figure 4: Integration of Amazon Verified Permissions in a Kubernetes Ingress
The workflow is as follows:
Authenticated users access the service through an Elastic Load Balancer of type Network Load Balancer (NLB).
The NLB—operating at layer 4—exposes a Kubernetes Ingress inside the cluster that provides layer 7 capabilities. The Ingress object is implemented by an Ingress controller that supports external authorization, as described earlier.
The Ingress forwards the request—or parts of it—that needs authorization to a local authorization service in the cluster. We use a dedicated authorization service in this architecture because the Ingress backend service allows an external endpoint to be called for authorization.
The authorization service is deployed into its own Kubernetes namespace with a dedicated Kubernetes service account. EKS Pod Identity provides the ability to link the service account in this namespace to an AWS Identity and Access Management (IAM) role that grants access to Verified Permissions by injecting temporary AWS access credentials into the pod at runtime.
The authorization service extracts relevant information from the request and sends it to Verified Permissions for an authorization decision.
The Ingress for the backend service awaits the response of the authorization service and forwards it to the backend service, if access is granted. The Ingress expects the authorization service to respond with HTTP status code 200 for authorized requests. If the Ingress receives HTTP status code 403, the requester is not allowed to access the requested resource, and the Ingress will block the request at this stage.
Only authorized requests are forwarded to registered backend pods.
Because integration with external authorization services is not part of the Kubernetes Ingress API, you need to consult the documentation of the Ingress controller that you decide to use to determine the availability of this feature and its implementation details. Forward authentication of the Traefik Kubernetes Ingress supports this pattern and can be configured with the vendor-specific annotations described in the Traefik documentation.
Authorization in sidecar containers
Not all Ingress controllers support integration with an external authorization service. Amazon Elastic Kubernetes Service (Amazon EKS) customers might prefer the AWS Load Balancer Controller to manage the lifecycle of NLBs and ALBs for their services. Customers can continue using their existing Ingress controller, even if it does not support calling external authorization services today. You can move the authorization of requests behind the Ingress layer with the sidecar container pattern.
Sidecar containers are a common pattern for extending an application’s functionality in Kubernetes. A sidecar is a container running in the same pod as the application it relates to. This means that the sidecar and application follow the same lifecycle and share resources, such as the network ID. This pattern is a good fit when the authorization logic is service-specific. Because the authorization service is deployed alongside the application, this pattern also provides better support in situations where changes to the application demand changes in the authorization logic.
Consider a document management system where access control depends on document metadata and team structures. When a user attempts to edit a document, the sidecar queries the document’s metadata, such as the classification level, tags, and department ownership. The sidecar can also check the organizational team hierarchy to understand reporting relationships and access privileges. This context enables fine-grained authorization decisions that consider not just who the user is, but also, for example, their organizational context or the individual document’s metadata.
Although it’s possible to configure sidecar proxies such as Envoy for individual pods manually, the more convenient option is to introduce a service mesh. A service mesh provides a control plane to manage proxies, including centralized configuration, automated injection of sidecars, and an Ingress layer for traffic routing. Istio is a popular option for a service mesh in Kubernetes.
The diagram in Figure 5 shows the deployment architecture to implement authorization with Verified Permissions in a service mesh.
Figure 5: Integration of Amazon Verified Permissions in a Kubernetes Ingress
The workflow is as follows:
Authenticated users access the application through an NLB.
The request is routed through an Ingress in the Kubernetes cluster.
The Ingress forwards the request directly to the backend service.
Pods of the backend service consist of multiple containers. Each request is routed through an Envoy proxy first.
The Envoy proxy forwards the request to a co-located container running the authorization service.
Pod Identity is used to map an IAM role to a Kubernetes service account bound to the pod, which enables the authorization sidecar to invoke Verified Permissions for an authorization decision. Note that each container in this pod has access to the IAM credentials that are mapped to the service account.
The Envoy proxy awaits the response of the authorization sidecar and blocks or forwards the request to the backend container, depending on the Verified Permissions authorization decision.
When Istio is deployed into a Kubernetes cluster, it introduces Custom Resource Definitions (CRDs) for managing the service mesh. The authorization workflow can be implemented using the ServiceEntry CRD and an Istio Authorization Policy. The authorization service running as a local container in the application pod becomes a registered service entry in the mesh. This service entry can then be configured in an authorization policy as the target for request authorization in the proxy. For more details, see the External Authorization section in the Istio documentation.
Application container
When it comes to integrating Verified Permissions directly within your application container, you have the advantage of fine-grained control over authorization decisions at the application level. This approach allows for more context-aware authorization checks and can be useful when you need to make authorization decisions based on application-specific data that you can query from a policy information point.
Unlike the sidecar pattern, where authorization happens before the request reaches your application code, this approach lets you gather the necessary context from your application state, databases, or other services before making the authorization call. This is particularly valuable when the authorization logic is deeply intertwined with business logic or requires data that’s only available within the application context. This pattern also supports minimizing the number of authorization requests, if, for example, only a subset of requests processed by a monolithic service require authorization.
However, it’s important to note that this tight coupling between authorization and business logic makes the system more brittle and susceptible to breakage when functional or business logic changes occur. This means that modifications to your application code might require careful consideration of their impact on the authorization logic, potentially increasing maintenance complexity.
The architecture for authorization requests from the application container is shown in Figure 6.
Figure 6: Integration of Amazon Verified Permissions in the application container
The workflow is as follows:
Authenticated users access the application through an Elastic Load Balancer—either Application Load Balancer (ALB) or NLB depending on workload requirements.
The Kubernetes service or Ingress for the backend application is directly registered at the ALB or NLB by the AWS Load Balancer Controller.
Requests are directly routed to a pod that is backing the service.
The backend application’s logic is responsible for identifying whether a request needs authorization. The backend uses an IAM role injected at runtime through Pod Identity, when an authorization decision from Verified Permission is needed. The backend application returns HTTP status code 403 if the decision is a deny; otherwise it will continue processing the request.
You now have a set of patterns to introduce authorization into your containerized workloads. You need to consider multiple factors and understand the trade-offs that come with each pattern to identify the best option for a given scenario. In the following table, we list certain areas with influence on your architectural decisions.
Granularity of authorization decisions
API gateway
Authorization on API or service level
Decision based on information from HTTP request
Suitable for consistent coarse-grained authorization
Ingress controller
Authorization on API or service level
Decision based on information from HTTP request
Suitable for consistent coarse-grained authorization
Sidecar proxy
Authorization on service level
Decision based on information from HTTP request and service domain (such as policy information point or static service-specific rules)
Suitable for service-specific authorization with low or mid-level complexity for decisions
Application container
Authorization on code level
Decision based on information from HTTP request and arbitrary business logic
Unauthorized requests don’t consume application pod resources
Sidecar proxy
Authorization services increases resource demand of each pod in the cluster
Unauthorized requests consume application pod resources
Application container
Authorization service consumes resources only when authorization is performed
Unauthorized requests consume CPU cycles of application logic until the authorization logic is triggered
Scalability
API gateway
Fully managed serverless service
Ingress controller
Scaling of Ingress pods needs to be defined
Cluster auto-scaling or capacity planning for compute resources in cluster needed
Sidecar proxy
Existing scaling policies can be leveraged
Application container
Existing scaling policies can be leveraged
Performance
API gateway
Invokes Verified Permission in AWS for each request that needs authorization
Supports caching to reduce number of requests to Verified Permission out of the box
Ingress controller
Invokes Verified Permission in AWS for each request that needs authorization
(Optional) Integration of avp-local-agent to minimize number of requests to Verified Permissions
Sidecar proxy
Invokes Verified Permissions in AWS for each request that needs authorization
(Optional) Integration of avp-local-agent to minimize number of requests to Verified Permissions
Application container
Invokes Verified Permissions in AWS only if the business logic processing a request requires authorization
(Optional) Integration of avp-local-agent to minimize number of requests to Verified Permissions
Cost
API gateway
Consumption-based costs depending on requests received and data transferred out, and optionally cache size
Consumption-based costs to invoke Verified Permissions
Enabling a cache potentially reduces costs per requests
Ingress controller
Adds to infrastructure costs depending on the underlying compute resources needed to run the fleet of pods for Ingress and authorization service
Consumption-based costs to invoke Verified Permissions, which can be minimized by integrating avp-local-agent
Sidecar proxy
Adds to infrastructure costs depending on the underlying compute resources needed to run the sidecar containers for the proxy and authorization service in each pod
Consumption-based costs to invoke Verified Permissions, which can be minimized by integrating avp-local-agent
Application container
Typically minimal additional costs, since authorization code shares the application’s resources
Consumption-based costs to invoke Verified Permissions, which can be minimized by integrating avp-local-agent
Portability
API gateway
Portability is limited and depends on API Gateway with functionality for custom authorization
Ingress controller
Portable across Kubernetes environments with Ingress controller supporting external authorization
Sidecar proxy
Portable across Kubernetes environments
Application container
Highly portable without dependencies to underlying components
Complexity
API gateway
Offered as central component by platform engineering team to offload complexity of authorization from product teams
Changes in authorization service impact product teams
Ingress controller
Offered as central component by platform engineering team to offload complexity of authorization from product teams
Changes in authorization service impact product teams
Sidecar proxy
Platform engineering teams provide standardized patterns (and optionally implementation) for authorization that can be integrated and implemented by product teams
Increases autonomy of individual teams
Application container
Full responsibility for authorization lies with the product teams
Increases autonomy of individual teams
Not all services have the same requirements for authorization. You can also combine the patterns discussed in this post. You can, for example, put a basic authorization workflow with coarse-grained access control in front of the majority of your services. You can then rely on sidecar proxies with policy information points to inject additional, dynamic context into authorization decisions for specific services. Lastly, if certain use cases of a service demand complex authorization decisions, you can fall back to application-level authorization for specific parts of your code base.
Conclusion
In this blog post, we explored four patterns for integrating Verified Permissions into a containerized environment. We discussed the benefits and considerations of implementing Verified Permissions at different levels: from an API gateway outside of Kubernetes clusters, by means of Ingress controllers and sidecar proxies as network components inside the Kubernetes cluster, to authorization within the application itself. We saw how each pattern offers unique advantages. We also discussed considerations for finding a suitable option for your situation and when to combine patterns.
By using Verified Permissions, organizations can implement consistent, fine-grained authorization across their containerized workloads, whether they’re running on-premises, in the cloud, or in hybrid environments. This centralized approach to authorization can enhance security and simplify policy management and application development.
AWS offers regulated customers tools, guidance and third-party audit reports to help meet compliance requirements. Regulated industry customers often require a service-by-service approval process when adopting cloud services to make sure that each adopted service aligns with their regulatory obligations and risk tolerance. How financial institutions can approve AWS services for highly confidential data walks through the key considerations that customers should focus on to help streamline the approval of cloud services. In this post we cover how regulated customers, especially FSI customers, can approach secrets management on Amazon Elastic Kubernetes Service (Amazon EKS) to help meet data protection and operational security requirements. Amazon EKS gives you the flexibility to start, run, and scale Kubernetes applications in the AWS Cloud or on-premises.
Applications often require sensitive information such as passwords, API keys, and tokens to connect to external services or systems. Kubernetes has secrets objects for managing these types of sensitive information. Additional tools and approaches have evolved to supplement the Kubernetes Secrets to help meet the compliance requirements of regulated organizations. One of the driving forces behind the evolution of these tools for regulated customers is that the native Kubernetes Secrets values aren’t encrypted but encoded as base64 strings; meaning that their values can be decoded by a threat actor with either API access or authorization to create a pod in a namespace containing the secret. There are options such as GoDaddy Kubernetes External Secrets, AWS Secrets and Configuration Provider (ASCP) for the Kubernetes Secrets Store CSI Driver, Hashicorp Vault, and Bitnami Sealed secrets that you can use to can help to improve the security, management, and audibility of your secrets usage.
Security and compliance is a shared responsibility between AWS and the customer. The AWS Shared Responsibility Model describes this as security of the cloud and security in the cloud:
AWS responsibility – Security of the cloud: AWS is responsible for protecting the infrastructure that runs the services offered in the AWS Cloud. For Amazon EKS, AWS is responsible for the Kubernetes control plane, which includes the control plane nodes and etcd database. Amazon EKS is certified by multiple compliance programs for regulated and sensitive applications. The effectiveness of the security controls are regularly tested and verified by third-party auditors as part of the AWS compliance programs.
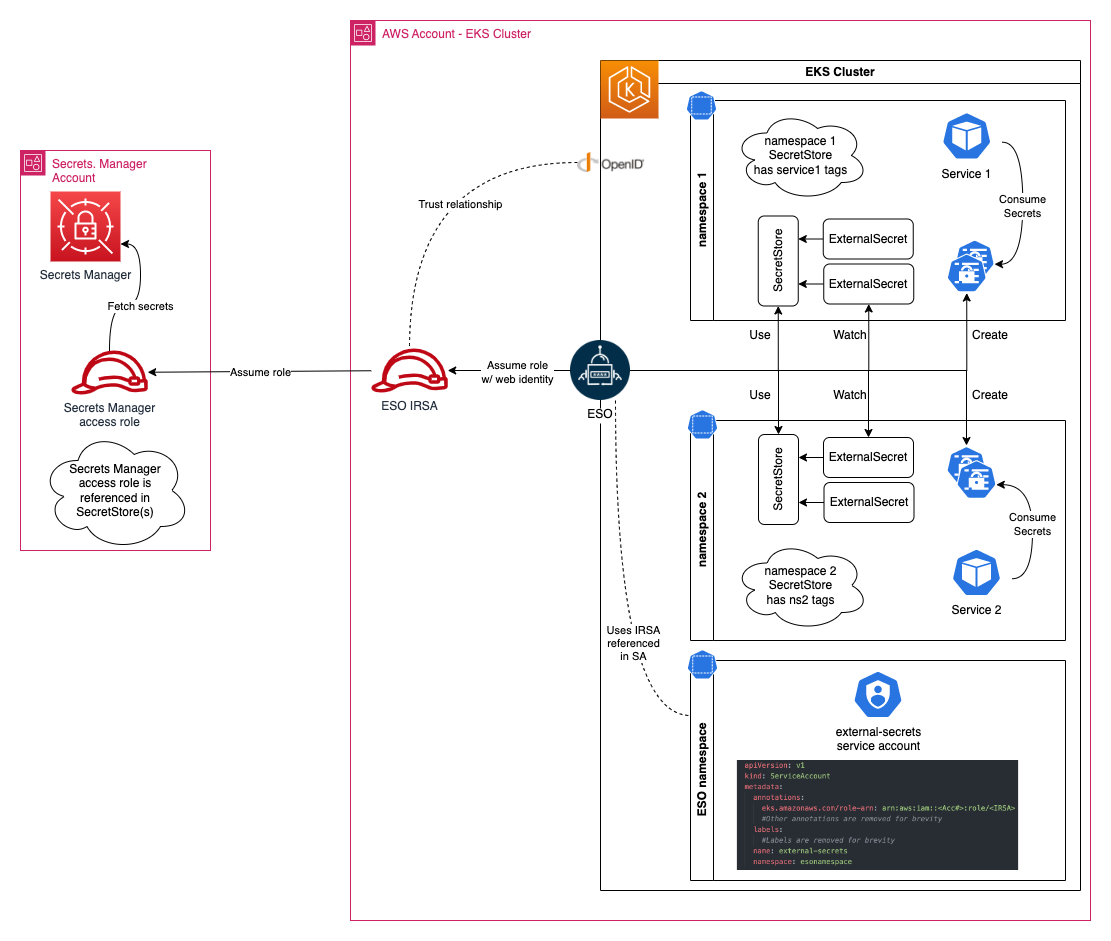
Customer responsibility – Security in the cloud: Customers are responsible for the security and compliance of customer configured systems and services deployed on AWS. This includes responsibility for securely deploying, configuring and managing ESO within their Amazon EKS cluster. For Amazon EKS, the customer responsibility depends upon the worker nodes you pick to run your workloads and cluster configuration as shown in Figure 1. In the case of Amazon EKS deployment using Amazon Elastic Compute Cloud (Amazon EC2) hosts, the customer responsibility includes the following areas:
The security configuration of the data plane, including the configuration of the security groups that allow traffic to pass from the Amazon EKS control plane into the customer virtual private cloud (VPC).
The configuration of the nodes and the containers themselves.
The nodes’ operating system, including updates and security patches.
Other associated application software:
Setting up and managing network controls, such as firewall rules.
The sensitivity of your data, such as personally identifiable information (PII), keys, passwords, and tokens
Customers are responsible for enforcing access controls to protect their data and secrets.
Customers are responsible for monitoring and logging activities related to secrets management including auditing access, detecting anomalies and responding to security incidents.
Your company’s requirements, applicable laws and regulations
When using AWS Fargate, the operational overhead for customers is reduced in the following areas:
The customer is not responsible for updating or patching the host system.
Fargate manages the placement and scaling of containers.
Figure 1: AWS Shared Responsibility Model with Fargate and Amazon EC2 based workflows
As an example of the Shared Responsibility Model in action, consider a typical FSI workload accepting or processing payments cards and subject to PCI DSS requirements. PCI DSS v4.0 requirement 3 focuses on guidelines to secure cardholder data while at rest and in transit:
Control ID
Control description
3.6
Cryptographic keys used to protect stored account data are secured.
3.6.1.2
Store secret and private keys used to encrypt and decrypt cardholder data in one (or more) of the following forms:
Encrypted with a key-encrypting key that is at least as strong as the data-encrypting key, and that is stored separately from the data-encrypting key.
Stored within a secure cryptographic device (SCD), such as a hardware security module (HSM) or PTS-approved point-of-interaction device.
Has at least two full-length key components or key shares, in accordance with an industry-accepted method. Note: It is not required that public keys be stored in one of these forms.
3.6.1.3
Access to cleartext cryptographic key components is restricted to the fewest number of custodians necessary.
NIST frameworks and controls are also broadly adopted by FSI customers. NIST Cyber Security Framework (NIST CSF) and NIST SP 800-53 (Security and Privacy Controls for Information Systems and Organizations) include the following controls that apply to secrets:
Regulation or framework
Control ID
Control description
NIST CSF
PR.AC-1
Identities and credentials are issued, managed, verified, revoked, and audited for authorized devices, users and processes.
NIST CSF
PR.DS-1
Data-at-rest is protected.
NIST 800-53.r5
AC-2(1) AC-3(15)
Secrets should have automatic rotation enabled. Delete unused secrets.
Based on the preceding objectives, the management of secrets can be categorized into two broad areas:
Identity and access management ensures separation of duties and least privileged access.
Strong encryption, using a dedicated cryptographic device, introduces a secure boundary between the secrets data and keys, while maintaining appropriate management over the cryptographic keys.
Choosing your secrets management provider
To help choose a secrets management provider and apply compensating controls effectively, in this section we evaluate three different options based on the key objectives derived from the PCI DSS and NIST controls described above and other considerations such as operational overhead, high availability, resiliency, and developer or operator experience.
Architecture and workflow
The following architecture and component descriptions highlight the different architectural approaches and responsibilities of each solution’s components, ranging from controllers and operators, command-line interface (CLI) tools, custom resources, and CSI drivers working together to facilitate secure secrets management within Kubernetes environments.
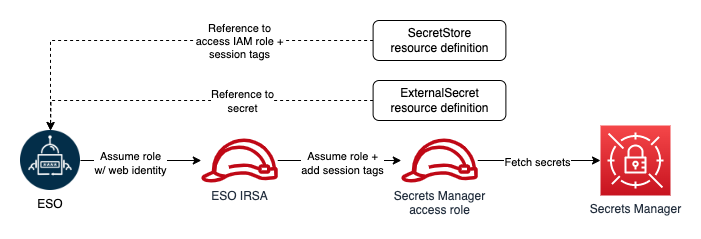
External Secrets Operator (ESO) extends the Kubernetes API using a custom resource definition (CRD) for secret retrieval. ESO enables integration with external secrets management systems such as AWS Secrets Manager, HashiCorp Vault, Google Secrets Manager, Azure Key Vault, IBM Cloud Secrets Manager, and various other systems. ESO watches for changes to an external secret store and keeps Kubernetes secrets in sync. These services offer features that aren’t available with native Kubernetes Secrets, such as fine-grained access controls, strong encryption, and automatic rotation of secrets. By using these purpose-built tools outside of a Kubernetes cluster, you can better manage risk and benefit from central management of secrets across multiple Amazon EKS clusters. For more information, see the detailed walkthrough of using ESO to synchronize secrets from Secrets Manager to your Amazon EKS Fargate cluster.
ESO is comprised of a cluster-side controller that automatically reconciles the state within the Kubernetes cluster and updates the related secrets anytime the external API’s secret undergoes a change.
Figure 2: ESO workflow
Sealed Secrets is an open source project by Bitnami comprised of a Kubernetes controller coupled with a client-side CLI tool with the objective to store secrets in Git in a secure fashion. Sealed Secrets encrypts your Kubernetes secret into a SealedSecret, which can also be deployed to a Kubernetes cluster using kubectl. For more information, see the detailed walkthough of using tools from the Sealed Secrets open source project to manage secrets in your Amazon EKS clusters.
Sealed Secrets comprises of three main components: First, there is an operator or a controller which is deployed onto a Kubernetes cluster. The controller is responsible for decrypting your secrets. Second, you have a CLI tool called Kubeseal that takes your secret and encrypts it. Third, you have a CRD. Instead of creating regular secrets, you create SealedSecrets, which is a CRD defined within Kubernetes. That is how the operator knows when to perform the decryption process within your Kubernetes cluster.
Upon startup, the controller looks for a cluster-wide private-public key pair and generates a new 4096-bit RSA public-private key pair if one doesn’t exist. The private key is persisted in a secret object in the same namespace as the controller. The public key portion of this is made publicly available to anyone wanting to use Sealed Secrets with this cluster.
Figure 3: Sealed Secrets workflow
The AWS Secrets Manager and Config Provider (ASCP) for Secret Store CSI driver is an open source tool from AWS that allows secrets from Secrets Manager and Parameter Store, a capability of AWS Systems Manager, to be mounted as files inside Amazon EKS pods. It uses a CRD called SecretProviderClass to specify which secrets or parameters to mount. Upon a pod start or restart, the CSI driver retrieves the secrets or parameters from AWS and writes them to a tmpfs volume mounted in the pod. The volume is automatically cleaned up when the pod is deleted, making sure that secrets aren’t persisted. For more information, see the detailed walkthrough on how to set up and configure the ASCP to work with Amazon EKS.
ASCP comprises of a cluster-side controller acting as the provider, allowing secrets from Secrets Manager, and parameters from Parameter Store to appear as files mounted in Kubernetes pods. Secrets Store CSI Driver is a DaemonSet with three containers: node-driver-registrar, which registers the CSI driver with Kubelet; secrets-store, which implements the CSI Node service gRPC services for mounting and unmounting volumes during pod creation and deletion; and liveness-probe, which monitors the health of the CSI driver and reports to Kubernetes for automatic issue detection and pod restart.
Figure 4: AWS Secrets Manager and configuration provider
In the next section, we cover some of the key decisions involved in choosing whether to use ESO, Sealed Secrets, or ASCP for regulated customers to help meet their regulatory and compliance needs.
Comparing ESO, Sealed Secrets, and ASCP objectives
All three solutions address different aspects of secure secrets management and aim to help FSI customers meet their regulatory compliance requirements while upholding the protection of sensitive data in Kubernetes environments.
ESO synchronizes secrets from external APIs into Kubernetes, targeting the cluster operator and application developer personas. The cluster operator is responsible for setting up ESO and managing access policies. The application developer is responsible for defining external secrets and the application configuration.
Sealed Secrets encrypts your Kubernetes secrets before storing them in version control systems such as public Git repositories. This is the case if you decide to check in your Kubernetes manifest to a Git repository granting access to your sensitive secrets to anyone who has access to the Git repository. This is ultimately the reason why Sealed Secrets was created and the sealed secret can be decrypted only by the controller running in the target cluster.
Using ASCP, you can securely store and manage your secrets in Secrets Manager and retrieve them through your applications running on Kubernetes without having to write custom code. Secrets Manager provides features such as rotation, auditing, and access control that can help FSI customers meet regulatory compliance requirements and maintain a robust security posture.
Installation
The deployment and configuration details that follow highlight the different approaches and resources used by each solution to integrate with Kubernetes and external secret stores, catering to the specific requirements of secure secrets management in containerized environments.
ESO provides Helm charts for ease of operator deployment. External Secrets provides custom resources like SecretStore and ExternalSecret for configuring the required operator functionality to synchronize external secrets to your cluster. For instance, SecretStore can be used by the cluster operator to be able to connect to AWS Secrets Manager using appropriate credentials to pull in the secrets.
To install Sealed Secrets, you can deploy the Sealed Secrets Controller onto the Kubernetes cluster. You can deploy the manifest by itself or you can use a Helm chart to deploy the Sealed Secrets Controller for you. After the controller is installed, you use the Kubeseal client-side utility to encrypt secrets using asymmetric cryptography. If you don’t already have the Kubeseal CLI installed, see the installation instructions.
ASCP provides Helm charts to assist in operator deployment. The ASCP operator provides custom resources such as SecretProviderClass to provide provider-specific parameters to the CSI driver. During pod start and restart, the CSI driver will communicate with the provider using gRPC to retrieve the secret content from the external secret store you specified in the SecretProviderClass custom resource. Then the volume is mounted in the pod as tmpfs and the secret contents are written to the volume.
Encryption and key management
These solutions use robust encryption mechanisms and key management practices provided by external secret stores and AWS services such as AWS Key Management Service (AWS KMS) and Secrets Manager. However, additional considerations and configurations might be required to meet specific regulatory requirements, such as PCI DSS compliance for handling sensitive data.
ESO relies on encryption features within the external secrets management system. For instance, Secrets Manager supports envelope encryption with AWS KMS which is FIPS 140-2 Level 3 certified. Secrets Manager has several compliance certifications making it a great fit for regulated workloads. FIPS 140-2 Level 3 ensures only strong encryption algorithms approved by NIST can be used to protect data. It also defines security requirements for the cryptographic module, creating logical and physical boundaries.
Both AWS KMS and Secrets Manager help you to manage key lifecycle and to integrate with other AWS Services. In terms of key rotation, both provide automatic rotation of secrets that runs on a schedule (which you define), and abstract the complexity of managing different versions of keys. For AWS managed keys, the key rotation happens automatically once every year by default. With customer managed keys (CMKs), automatic key rotation is available but not enabled by default.
When using SealedSecrets, you use the Kubeseal tool to convert a standard Kubernetes Secret into a Sealed Secrets resource. The contents of the Sealed Secrets are encrypted with the public key served by the Sealed Secrets Controller as described in the Sealed Secrets project homepage.
In the absence of cloud native secrets management integration, you might have to add compensating controls to achieve the regulatory standards required by your organization. In cases where the underlying SealedSecrets data is sensitive in nature, such as cardholder PII, PCI requires that you store sensitive secrets in a cryptographic device such as a hardware security module (HSM). You can use Secrets Manager to store the master key generated to seal the secrets. However, this you will have to enable additional integration with Amazon EKS APIs to fetch the master key securely from the EKS cluster. You will also have to modify your deployment process to use a master key from Secrets Manager. The applications running in the EKS cluster must have permissions to fetch the SealedSecret and master key from Secrets Manager. This might involve configuring the application to interact with Amazon EKS APIs and Secrets Manager. For non-sensitive data, Kubeseal can be used directly within the EKS cluster to manage secrets and sealing keys.
For key rotation, you can store the controller generated private key in Parameter Store as a SecureString. You can use the advanced tier in Parameter Store if the file containing the private keys exceeds the Standard tier limit of up to 4,096 characters. In addition, if you want to add key rotation, you can use AWS KMS.
The ASCP relies on encryption features within the chosen secret store, such as Secrets Manager. Secrets Manager supports integration with AWS KMS for an additional layer of security by storing encryption keys separately. The Secrets Store CSI Driver facilitates secure interaction with the secret store, but doesn’t directly encrypt secrets. Encrypting mounted content can provide further protection, but introduces operational overhead related to key management.
ASCP relies on Secrets Manager and AWS KMS for encryption and decryption capabilities. As a recommendation, you can encrypt mounted content to further protect the secrets. However, this introduces the additional operational overhead of managing encryption keys and addressing key rotation.
Additional considerations
These solutions address various aspects of secure secrets management, ranging from centralized management, compliance, high availability, performance, developer experience, and integration with existing investments, catering to the specific needs of FSI customers in their Kubernetes environments.
ESO can be particularly useful when you need to manage an identical set of secrets across multiple Kubernetes clusters. Instead of configuring, managing, and rotating secrets at each cluster level individually, you can synchronize your secrets across your clusters. This simplifies secrets management by providing a single interface to manage secrets across multiple clusters and environments.
External secrets management systems typically offer advanced security features such as encryption at rest, access controls, audit logs, and integration with identity providers. This helps FSI customers ensure that sensitive information is stored and managed securely in accordance with regulatory requirements.
FSI customers usually have existing investments in their on-premises or cloud infrastructure, including secrets management solutions. ESO integrates seamlessly with existing secrets management systems and infrastructure, allowing FSI customers to use their investment in these systems without requiring significant changes to their workflow or tooling. This makes it easier for FSI customers to adopt and integrate ESO into their existing Kubernetes environments.
ESO provides capabilities for enforcing policies and governance controls around secrets management such as access control, rotation policies, and audit logging when using services like Secrets Manager. For FSI customers, audits and compliance are critical and ESO verifies that access to secrets is tracked and audit trails are maintained, thereby simplifying the process of demonstrating adherence to regulatory standards. For instance, secrets stored inside Secrets Manager can be audited for compliance with AWS Config and AWS Audit Manager. Additionally, ESO uses role-based access control (RBAC) to help prevent unauthorized access to Kubernetes secrets as documented in the ESO security best practices guide.
High availability and resilience are critical considerations for mission critical FSI applications such as online banking, payment processing, and trading services. By using external secrets management systems designed for high availability and disaster recovery, ESO helps FSI customers ensure secrets are available and accessible in the event of infrastructure failure or outages, thereby minimizing service disruption and downtime.
FSI workloads often experience spikes in transaction volumes, especially during peak days or hours. ESO is designed to efficiently managed a large volume of secrets by using external secrets management that’s optimized for performance and scalability.
In terms of monitoring, ESO provides Prometheus metrics to enable fine-grained monitoring of access to secrets. Amazon EKS pods offer diverse methods to grant access to secrets present on external secrets management solutions. For example, in non-production environments, access can be granted through IAM instance profiles assigned to the Amazon EKS worker nodes. For production, using IAM roles for service accounts (IRSA) is recommended. Furthermore, you can achieve namespace level fine-grained access control by using annotations.
ESO also provides options to configure operators to use a VPC endpoint to comply with FIPS requirements.
Additional developer productivity benefits provided by ESO include support for JSON objects (Secret key/value in the AWS Management console) or strings (Plaintext in the console). With JSON objects, developers can programmatically update multiple values atomically when rotating a client certificate and private key.
The benefit of Sealed Secrets, as discussed previously, is when you upload your manifest to a Git repository. The manifest will contain the encrypted SealedSecrets and not the regular secrets. This assures that no one has access to your sensitive secrets even when they have access to your Git repository. Sealed Secrets offer a few benefits to developers in terms of developer experience. Sealed Secrets gives you access to manage your secrets, making them more readily available to developers. Sealed Secrets offers VSCode extension to assist in integrating it into the software development lifecycle (SDLC). Using Sealed Secrets, you can store the encrypted secrets in the version control systems such as Gitlab and GitHub. Sealed Secrets can reduce operational overhead related to updating dependent objects because whenever a secret resource is updated, the same update is applied to the dependent objects.
ASCP integration with the Kubernetes Secrets Store CSI Driver on Amazon EKS offers enhanced security through seamless integration with Secrets Manager and Parameter Store, ensuring encryption, access control, and auditing. It centralizes management of sensitive data, simplifying operations and reducing the risk of exposure. The dynamic secrets injection capability facilitates secure retrieval and injection of secrets into Kubernetes pods, while automatic rotation provides up-to-date credentials without manual intervention. This combined solution streamlines deployment and management, providing a secure, scalable, and efficient approach to handling secrets and configuration settings in Kubernetes applications.
Consolidated threat model
We created a threat model based on the architecture of the three solution offerings. The threat model provides a comprehensive view of the potential threats and corresponding mitigations for each solution, allowing organizations to proactively address security risks and ensure the secure management of secrets in their Kubernetes environments.
X = Mitigations applicable to the solution
Threat
Mitigations
ESO
Sealed Secrets
ASCP
Unauthorized access or modification of secrets
Implement least privilege access principles
Rotate and manage credentials securely
Enable RBAC and auditing in Kubernetes
X
X
X
Insider threat (for example, a rogue administrator who has legitimate access)
Implement least privilege access principles
Enable auditing and monitoring
Enforce separation of duties and job rotation
X
X
Compromise of the deployment process
Secure and harden the deployment pipeline
Implement secure coding practices
Enable auditing and monitoring
X
Unauthorized access or tampering of secrets during transit
Enable encryption in transit using TLS
Implement mutual TLS authentication between components
Use private networking or VPN for secure communication
X
X
X
Compromise of the Kubernetes API server because of vulnerabilities or misconfiguration
Secure and harden the Kubernetes API server
Enable authentication and authorization mechanisms (for example, mutual TLS and RBAC)
Keep Kubernetes components up-to-date and patched
Enable Kubernetes audit logging and monitoring
X
Vulnerability in the external secrets controller leading to privilege escalation or data exposure
Keep the external secrets controller up-to-date and patched
Regularly monitor for and apply security updates
Implement least privilege access principles
Enable auditing and monitoring
X
Compromise of the Secrets Store CSI Driver, node-driver-registrar, Secrets Store CSI Provider, kubelet, or Pod could lead to unauthorized access or exposure of secrets
Implement least privilege principles and role-based access controls
Regularly patch and update the components
Monitor and audit the component activities
X
Unauthorized access or data breach in Secrets Manager could expose sensitive secrets
Implement strong access controls and access logging for Secrets Manager
Encrypt secrets at rest and in transit
Regularly rotate and update secrets
X
X
Shortcomings and limitations
The following limitations and drawbacks highlight the importance of carefully evaluating the specific requirements and constraints of your organization before adopting any of these solutions. You should consider factors such as team expertise, deployment environments, integration needs, and compliance requirements to promote a secure and efficient secrets management solution that aligns with your organization’s needs.
ESO doesn’t include a default way to restrict network traffic to and from ESO using network policies or similar network or firewall mechanisms. The application team is responsible for properly configuring network policies to improve the overall security posture of ESO within your Kubernetes cluster.
Any time an external secret associated with ESO is rotated, you must restart the deployment that uses that particular external secret. Given the inherent risks associated with integrating an external entity or third-party solution into your system, including ESO, it’s crucial to implement a comprehensive threat model similar to the Kubernetes Admission Control Threat Model.
Also, ESO set up is complicated and the controller must be installed on the Kubernetes cluster.
SealedSecrets cannot be reused across namespaces unless they’re re-encrypted or made cluster-wide, which makes it challenging to manage secrets across multiple namespaces consistently. The need to manually rotate and re-encrypt SealedSecrets with new keys can introduce operational overhead, especially in large-scale environments with numerous secrets. The old sealing keys pose a potential risk of misuse by unauthorized users, which increases the risk. To mitigate both risks (high overhead and old secrets), you should implement additional controls such as deleting older keys as part of the key rotation process or periodically rotate sealing keys and make sure that old sealed secret resources are re-encrypted with the new keys. Sealed Secrets doesn’t support external secret stores such as HashiCorp Vault, or cloud provider services such as Secrets Manager, Parameter Store, or Azure Key Vault. Sealed Secrets requires a Kubeseal client-side binary to encrypt secrets. This can be a concern in FSI environments where client-side tools are restricted by security policies.
While ASCP provides seamless integration with Secrets Manager and Parameter Store, teams unfamiliar with these AWS services might need to invest some additional effort to fully realize the benefits. This additional effort is justified by the long-term benefits of centralized secrets management and access control provided by these services. Additionally, relying primarily on AWS services for secrets management can potentially limit flexibility in deploying to alternative cloud providers or on-premises environments in the future. These factors should be carefully evaluated based on the specific needs and constraints of the application and deployment environment.
Conclusion
We have provided a summary of three options for managing secrets in Amazon EKS, ESO, Sealed Secrets, and AWS Secrets and Configuration Provider (ASCP), and the key considerations for FSI customers when choosing between them. The choice depends on several factors including existing investments in secrets management systems, specific security needs and compliance requirements, preference for a Kubernetes native solution or willingness to accept vendor lock-in.
The guidance provided here covers the strengths, limitations, and trade-offs of each option, allowing regulated institutions to make an informed decision based on their unique requirements and constraints. This guidance can be adapted and tailored to fit the specific needs of an organization, providing a secure and efficient secrets management solution for their Amazon EKS workloads, while aligning with the stringent security and compliance standards of the regulated institutions.
If you have feedback about this post, submit comments in the Comments section below. If you have questions about this post, contact AWS Support.
Security experts develop CIS Amazon Linux Benchmarks collaboratively, providing guidelines to enhance the security of Amazon Linux-based images. Through a consensus-based process that includes input from a global community of security professionals, these benchmarks are comprehensive and reflective of current cybersecurity challenges and best practices.
When running your container workloads on Amazon EKS, it’s essential to understand the shared responsibility model to clearly know which components fall under your purview to secure. This awareness is essential because it delineates the security responsibilities between you and AWS; although AWS secures the infrastructure, you are responsible for protecting your applications and data. Applying CIS benchmarks to Amazon EKS nodes represents a strategic approach to security enhancements, operational optimizations, and considerations for container host security. This strategy includes updating systems, adhering to modern cryptographic policies, configuring secure filesystems, and disabling unnecessary kernel modules among other recommendations.
Before implementing these benchmarks, I recommend conducting a thorough threat analysis to identify security risks within your environment. This proactive step makes sure that the application of CIS benchmarks is targeted and effective, addressing specific vulnerabilities and threats. Understanding the unique risks in your environment allows you to use the benchmarks strategically to mitigate these risks. This approach helps you to not blindly implement the benchmarks, but to interpret and use them intelligently, tailoring your application to best suit their specific needs. CIS benchmarks should be viewed as a critical tool in your security toolbox, intended for use alongside a broader understanding of your cybersecurity landscape. This balanced and informed application verifies an effective security posture, emphasizing that while CIS benchmarks are an excellent starting point, understanding your environment’s specific security risks is equally important for a comprehensive security strategy.
The benchmarks are widely available, enabling organizations of any size to adopt security measures without significant financial outlays. Furthermore, applying the CIS benchmarks aids in aligning with various security and privacy regulations such as National Institute of Standards and Technology (NIST), Health Insurance Portability and Accountability Act (HIPAA), and Payment Card Industry Data Security Standard (PCI DSS), simplifying compliance efforts.
In this solution, you’ll be implementing the recommendations outlined in the CIS Amazon Linux 2 Benchmark v2.0.0 or Amazon Linux 2023 v1.0.0. To apply the Benchmark’s guidance, you’ll use the Ansible role for the Amazon Linux 2 CIS Baseline, and the Ansible role for Amazon2023 CIS Baseline provided by Ansible Lockdown.
Solution overview
EC2 Image Builder is a fully managed AWS service designed to automate the creation, management and deployment of secure, up-to-date base images. In this solution, we’ll use Image Builder to apply the CIS Amazon Linux Benchmark to an Amazon EKS-optimized Amazon Machine Image (AMI). The resulting AMI will then be used to update your EKS clusters’ node groups. This approach is customizable, allowing you to choose specific security controls to harden your base AMI. However, it’s advisable to review the specific controls offered by this solution and consider how they may interact with your existing workloads and applications to maintain seamless integration and uninterrupted functionality.
Therefore, it’s crucial to understand each security control thoroughly and select those that align with your operational needs and compliance requirements without causing interference.
Additionally, you can specify cluster tags during the deployment of the AWS CloudFormation template. These tags help filter EKS clusters included in the node group update process. I have provided an CloudFormation template to facilitate the provisioning of the necessary resources.
Figure 1: Amazon EKS node group update workflow
As shown in Figure 1, the solution involves the following steps:
Image Builder
The AMI image pipeline clones the Ansible role from the GitHub base on the parent image you specify in the CloudFormation template and applies the controls to the base image.
The pipeline publishes the hardened AMI.
The pipeline validates the benchmarks applied to the base image and publishes the results to an Amazon Simple Storage Service (Amazon S3) bucket. It also invokes Amazon Inspector to run a vulnerability scan on the published image.
The State machine initiation Lambda function extracts the image ID of the published AMI and uses it as the input to initiate the state machine.
State machine
The first state gathers information related to Amazon EKS clusters’ node groups. It creates a new launch template version with the hardened AMI image ID for the node groups that are launched with custom launch template.
The second state uses the new launch template to initiate a node group update on EKS clusters’ node groups.
Image update reminder
A weekly scheduled rule invokes the Image update reminder Lambda function.
The Image update reminder Lambda function retrieves the value for LatestEKSOptimizedAMI from the CloudFormation template and extracts the last modified date of the Amazon EKS-optimized AMI used as the parent image in the Image Builder pipeline. It compares the last modified date of the AMI with the creation date of the latest AMI published by the pipeline. If a new base image is available, it publishes a message to the Image update reminder SNS topic.
The Image update reminder SNS topic sends a message to subscribers notifying them of a new base image. You need to create a new version of your image recipe to update it with the new AMI.
Prerequisites
To follow along with this walkthrough, make sure that you have the following prerequisites in place or the CloudFormation deployment might fail:
In this step, deploy the solution’s resources by creating a CloudFormation stack using the provided CloudFormation template. Sign in to your account and choose an AWS Region where you want to create the stack. Make sure that the Region you choose supports the services used by this solution. To create the stack, follow the steps in Creating a stack on the AWS CloudFormation console. Note that you need to provide values for the parameters defined in the template to deploy the stack. The following table lists the parameters that you need to provide.
Note: To make sure that the AWS Task Orchestrator and Executor (AWSTOE) application functions correctly within Image Builder, and to enable updated nodes with the hardened image to join your EKS cluster, it’s necessary to pass the following minimum Ansible parameters:
Amazon Simple Notification Service (Amazon SNS) is a web service that coordinates and manages the sending and delivery of messages to subscribing endpoints or clients. An SNS topic is a logical access point that acts as a communication channel.
The solution in this post creates two Amazon SNS topics to keep you informed of each step of the process. The following is a list of the topics that the solution creates and their purpose.
AMI status topic – a message is published to this topic upon successful creation of an AMI.
Image update reminder topic – a message is published to this topic if a newer version of the base Amazon EKS-optimized AMI is published by AWS.
You need to manually modify the subscriptions for each topic to receive messages published to that topic.
To modify the subscriptions for the topics created by the CloudFormation template
In the left navigation pane, choose Subscriptions.
On the Subscriptions page, choose Create subscription.
On the Create subscription page, in the Details section, do the following:
For Topic ARN, choose the Amazon Resource Name (ARN) of one of the topics that the CloudFormation topic created.
For Protocol, choose Email.
For Endpoint, enter the endpoint value. In this example, the endpoint is an email address, such as the email address of a distribution list.
Choose Create subscription.
Repeat the preceding steps for the other topic.
Step 4: Run the pipeline
The Image Builder pipeline that the solution creates consists of an image recipe with one component, an infrastructure configuration, and a distribution configuration. I’ve set up the image recipe to create an AMI, select a parent image, and choose components. There’s only one component where building and testing steps are defined. For the building step, the solution applies the CIS Amazon Linux 2 Benchmark Ansible playbook and cleans up the unnecessary files and folders. In the test step, the solution runs Amazon Inspector, a continuous assessment service that scans your AWS workloads for software vulnerabilities and unintended network exposure, and Audit configuration for Amazon Linux 2 CIS. Optionally, you can create your own components and associate them with the image recipe to make further modifications to the base image.
The following is a process overview of the image hardening and instance refresh:
Image hardening – when you start the pipeline, Image Builder creates the required infrastructure to build your AMI, applies the Ansible role (CIS Amazon Linux 2 or Amazon Linux 2023 Benchmark) to the base AMI, and publishes the hardened AMI. A message is published to the AMI status topic as well.
Image testing – after publishing the AMI, Image Builder scans the newly created AMI with Amazon Inspector and reports the findings back. For Amazon Linux 2 parent images, It also runs Audit configuration for Amazon Linux 2 CIS to verify the changes that the Ansible role made to the base AMI and publishes the results to an S3 bucket.
State machine initiation – after a new AMI is successfully published, the AMI status topic invokes the State machine initiation Lambda function. The Lambda function invokes the EKS node group update state machine and passes on the AMI info.
Update node groups – the EKS update node group state machine has two steps:
Gathering node group information – a Lambda function gathers information regarding EKS clusters and their associated Amazon EC2 managed node groups. It only selects and processes node groups launched with custom launch templates that are in Active state. For each node group, the Lambda function creates a new launch template version including the hardened AMI ID published by the pipeline, and user data including bootstrap.sh arguments required for bootstrapping. View Customizing managed nodes with launch templates to learn more about requirements of specifying an AMI ID in the imageId field of EKS node group’s launch template. When you create the CloudFormation stack, if you pass a tag or a list of tags, only clusters with matching tags are processed in this step.
Node group update – the state machine uses the output of the first Lambda function (first state) and starts updating node groups in parallel (second state).
This solution also creates an EventBridge rule that’s invoked weekly. This rule invokes the Image update reminder Lambda function and notifies you if a new version of your base AMI has been published by AWS so that you can run the pipeline and update your hardened AMI. You can check this EventBridge rule by getting it’s Physical ID on the CloudFormation Resources output, identified by ImageUpdateReminderEventBridgeRule.
After the build is finished the Image status will transition to Available in the EC2 Image Builder console, and you will be able to check the new AMI details by choosing the version link, and validate the security findings. The image will then be ready to be distributed across your environment.
Conclusion
In this blog post, I showed you how to create a workflow to harden Amazon EKS-optimized AMIs by using the CIS Amazon Linux 2 or Amazon Linux 2023 Benchmark and to automate the update of EKS node groups. This automated workflow has several advantages. First, it helps ensure a consistent and standardized process for image hardening, reducing potential human errors and inconsistencies. By automating the entire process, you can apply security and compliance standards across your instances. Second, the tight integration with AWS Step Functions enables smooth, orchestrated updates to the EKS node groups, enhancing the reliability and predictability of deployments. This automation also reduces manual intervention, helping you save time so that your teams can focus on more value-driven tasks. Moreover, this systematic approach helps to enhance the security posture of your Amazon EKS workloads because you can address vulnerabilities rapidly and systematically, helping to keep the environment resilient against potential threats.
If you have feedback about this post, submit comments in the Comments section below. If you have questions about this post, contact AWS Support.
Using Kubernetes policy-as-code (PaC) solutions, administrators and security professionals can enforce organization policies to Kubernetes resources. There are several publicly available PAC solutions that are available for Kubernetes, such as Gatekeeper, Polaris, and Kyverno.
PaC solutions usually implement two features:
Use Kubernetes admission controllers to validate or modify objects before they’re created to help enforce configuration best practices for your clusters.
Provide a way for you to scan your resources created before policies were deployed or against new policies being evaluated.
This post presents a solution to send policy violations from PaC solutions using Kubernetes policy report format (for example, using Kyverno) or from Gatekeeper’s constraints status directly to AWS Security Hub. With this solution, you can visualize Kubernetes security misconfigurations across your Amazon Elastic Kubernetes Service (Amazon EKS) clusters and your organizations in AWS Organizations. This can also help you implement standard security use cases—such as unified security reporting, escalation through a ticketing system, or automated remediation—on top of Security Hub to help improve your overall Kubernetes security posture and reduce manual efforts.
Solution overview
The solution uses the approach described in A Container-Free Way to Configure Kubernetes Using AWS Lambda to deploy an AWS Lambda function that periodically synchronizes the security status of a Kubernetes cluster from a Kubernetes or Gatekeeper policy report with Security Hub. Figure 1 shows the architecture diagram for the solution.
Figure 1: Diagram of solution
This solution works using the following resources and configurations:
A scheduled event which invokes a Lambda function on a 10-minute interval.
For each running cluster, the Lambda function retrieves the selected Kubernetes policy reports (or the Gatekeeper constraint status, depending on the policy selected) and sends active violations, if present, to Security Hub. With Gatekeeper, if more violations exist than those reported in the constraint, an additional INFORMATIONAL finding is generated in Security Hub to let security teams know of the missing findings.
Optional: EKS cluster administrators can raise the limit of reported policy violations by using the –constraint-violations-limit flag in their Gatekeeper audit operation.
For each running cluster, the Lambda function archives archive previously raised and resolved findings in Security Hub.
In the walkthrough, I show you how to deploy a Kubernetes policy-as-code solution and forward the findings to Security Hub. We’ll configure Kyverno and a Kubernetes demo environment with findings in an existing EKS cluster to Security Hub.
The code provided includes an example constraint and noncompliant resource to test against.
Prerequisites
An EKS cluster is required to set up this solution within your AWS environments. The cluster should be configured with either aws-auth ConfigMap or access entries. Optional: You can use eksctl to create a cluster.
The following resources need to be installed on your computer:
Open the parameters.json file and configure the following values:
Policy – Name of the product that you want to enable, in this case policyreport, which is supported by tools such as Kyverno.
ClusterNames – List of EKS clusters. When AccessEntryEnabled is enabled, this solution deploys an access entry for the integration to access your EKS clusters.
SubnetIds – (Optional) A comma-separated list of your subnets. If you’ve configured the API endpoints of your EKS clusters as private only, then you need to configure this parameter. If your EKS clusters have public endpoints enabled, you can remove this parameter.
SecurityGroupId – (Optional) A security group ID that allows connectivity to the EKS clusters. This parameter is only required if you’re running private API endpoints; otherwise, you can remove it. This security group should be allowed ingress from the security group of the EKS control plane.
AccessEntryEnabled – (Optional) If you’re using EKS access entries, the solution automatically deploys the access entries with read-only-group permissions deployed in the next step. This parameter is True by default.
Save the changes and close the parameters file.
Set up your AWS_REGION (for example, export AWS_REGION=eu-west-1) and make sure that your credentials are configured for the delegated administrator account.
Enter the following command to deploy:
./deploy.sh
You should see the following output:
Waiting for changeset to be created..
Waiting for stack create/update to complete
Successfully created/updated stack - aws-securityhub-k8s-policy-integration
Step 3: Set up EKS cluster access
You need to create the Kubernetes Group read-only-group to allow read-only permissions to the IAM role of the Lambda function. If you aren’t using access entries, you will also need to modify the aws-auth ConfigMap of the Kubernetes clusters.
To configure access to EKS clusters
For each cluster that’s running in your account, run the kube-setup.sh script to create the Kubernetes read-only cluster role and cluster role binding.
(Optional) Configure aws-auth ConfigMap using eksctl if you aren’t using access entries.
Step 4: Verify AWS service integration
The next step is to verify that the Lambda integration to Security Hub is running.
To verify the integration is running
Open the Lambda console, and navigate to the aws-securityhub-k8s-policy-integration-<region> function.
Start a test to import your cluster’s noncompliant findings to Security Hub.
The final step is to clean up the resources that you created for this walkthrough.
To destroy the stack
Use the command line terminal in your laptop to run the following command:
./cleanup.sh
Conclusion
In this post, you learned how to integrate Kubernetes policy report findings with Security Hub and tested this setup by using the Kyverno policy engine. If you want to test the integration of this solution with Gatekeeper, you can find alternative commands for step 1 of this post in the GitHub repository’s README file.
Using this integration, you can gain visibility into your Kubernetes security posture across EKS clusters and join it with a centralized view, together with other security findings such as those from AWS Config, Amazon Inspector, and more across your organization. You can also try this solution with other tools, such as kube-bench or Gatekeeper. You can extend this setup to notify security teams of critical misconfigurations or implement automated remediation actions by using AWS Security Hub.
It’s common to manage numerous workloads in an EKS cluster, each necessitating access to a distinct set of secrets. You can verify adherence to the principle of least privilege by creating separate permission policies for each workload to restrict their access. To scale and reduce overhead, Amazon Web Services (AWS) recommends using ABAC to manage workloads’ access to secrets. ABAC helps reduce the number of permission policies needed to scale with your environment.
What is ABAC?
In IAM, a traditional authorization approach is known as role-based access control (RBAC). RBAC sets permissions based on a person’s job function, commonly known as IAM roles. To enforce RBAC in IAM, distinct policies for various job roles are created. As a best practice, only the minimum permissions required for a specific role are granted (principle of least privilege), which is achieved by specifying the resources that the role can access. A limitation of the RBAC model is its lack of flexibility. Whenever new resources are introduced, you must modify policies to permit access to the newly added resources.
Attribute-based access control (ABAC) is an approach to authorization that assigns permissions in accordance with attributes, which in the context of AWS are referred to as tags. You create and add tags to your IAM resources. You then create and configure ABAC policies to permit operations requested by a principal when there’s a match between the tags of the principal and the resource. When a principal uses temporary credentials to make a request, its associated tags come from session tags, incoming transitive sessions tags, and IAM tags. The principal’s IAM tags are persistent, but session tags, and incoming transitive session tags are temporary and set when the principal assumes an IAM role. Note that AWS tags are attached to AWS resources, whereas session tags are only valid for the current session and expire with the session.
How External Secrets Operator works
External Secrets Operator (ESO) is a Kubernetes operator that integrates external secret management systems including Secrets Manager with Kubernetes. ESO provides Kubernetes custom resources to extend Kubernetes and integrate it with Secrets Manager. It fetches secrets and makes them available to other Kubernetes resources by creating Kubernetes Secrets. At a basic level, you need to create an ESO SecretStore resource and one or more ESO ExternalSecret resources. The SecretStore resource specifies how to access the external secret management system (Secrets Manager) and allows you to define ABAC related properties (for example, session tags and transitive tags).
You declare what data (secret) to fetch and how the data should be transformed and saved as a Kubernetes Secret in the ExternalSecret resource. The following figure shows an overview of the process for creating Kubernetes Secrets. Later in this post, we review the steps in more detail.
Figure 1: ESO process
How to use ESO for ABAC
Before creating any ESO resources, you must make sure that the operator has sufficient permissions to access Secrets Manager. ESO offers multiple ways to authenticate to AWS. For the purpose of this solution, you will use the controller’s pod identity. To implement this method, you configure the ESO service account to assume an IAM role for service accounts (IRSA), which is used by ESO to make requests to AWS.
To adhere to the principle of least privilege and verify that each Kubernetes workload can access only its designated secrets, you will use ABAC policies. As we mentioned, tags are the attributes used for ABAC in the context of AWS. For example, principal and secret tags can be compared to create ABAC policies to deny or allow access to secrets. Secret tags are static tags assigned to secrets symbolizing the workload consuming the secret. On the other hand, principal (requester) tags are dynamically modified, incorporating workload specific tags. The only viable option to dynamically modifying principal tags is to use session tags and incoming transitive session tags. However, as of this writing, there is no way to add session and transitive tags when assuming an IRSA. The workaround for this issue is role chaining and passing session tags when assuming downstream roles. ESO offers role chaining, meaning that you can refer to one or more IAM roles with access to Secrets Manager in the SecretStore resource definition, and ESO will chain them with its IRSA to access secrets. It also allows you to define session tags and transitive tags to be passed when ESO assumes the IAM roles with its primary IRSA. The ability to pass session tags allows you to implement ABAC and compare principal tags (including session tags) with secret tags every time ESO sends a request to Secrets Manager to fetch a secret. The following figure shows ESO authentication process with role chaining in one Kubernetes namespace.
Figure 2: ESO AWS authentication process with role chaining (single namespace)
Architecture overview
Let’s review implementing ABAC with a real-world example. When you have multiple workloads and services in your Amazon EKS cluster, each service is deployed in its own unique namespace, and service secrets are stored in Secrets Manager and tagged with a service name (key=service, value=service name). The following figure shows the required resources to implement ABAC with EKS and Secrets Manager.
Create an IAM role to access Secrets Manager secrets
You must create an IAM role with access to Secrets Manager secrets. Start by creating a customer managed policy to attach to your role. Your policy should allow reading secrets from Secrets Manager. The following example shows a policy that you can create for your role:
Secrets Manager uses an AWS managed key for Secrets Manager by default to encrypt your secrets. It’s recommended to specify another encryption key during secret creation and have separate keys for separate workloads. Modify the resource element of the second policy statement and replace <KMS Key ARN> with the KMS key ARNs used to encrypt your secrets. If you use the default key to encrypt your secrets, you can remove this statement.
The policy statement conditionally allows access to all secrets. The condition element permits access only when the value of the principal tag, identified by the key service, matches the value of the secret tag with the same key. You can include multiple conditions (in separate statements) to match multiple tags.
After you create your policy, follow the guide for Creating IAM roles to create your role, attaching the policy you created. Use the default value for your role’s trust relationship for now, you will update the trust relationship in the next step. Note the role’s ARN after creation.
Create an IAM role for the ESO service account
Use eksctl to create the IAM role for the ESO service account (IRSA). Before creating the role, you must create an IAM policy. ESO IRSA only needs permission to assume the Secrets Manager access role that you created in the previous step.
Use the following example of an IAM policy that you can create. Replace <Secrets Manager Access Role ARN> with the ARN of the role you created in the previous step and follow creating a customer managed policy to create the policy. After creating the policy, note the policy ARN.
Next, run the following command to get the account name of the ESO service. You will see a list of service accounts, pick the one that has the same name as your helm release, in this example, the service account is external-secrets.
kubectl get serviceaccounts -n external-secrets
Next, create an IRSA and configure an ESO service account to assume the role. Run the following command to create a new role and associate it with the ESO service account. Replace the variables in brackets (<example>) with your specific information:
eksctl create iamserviceaccount --name <ESO service account> \
--namespace <ESO namespace> --cluster <cluster name> \
--role-name <IRSA name> --override-existing-serviceaccounts \
--attach-policy-arn <policy arn you created earlier> --approve
You can validate the operation by following the steps listed in Configuring a Kubernetes service account to assume an IAM role. Note that you had to pass the ‑‑override-existing-serviceaccounts argument because the ESO service account was already created.
After you’ve validated the operation, run the following command to retrieve the IRSA ARN (replace <IRSA name> with the name you used in the previous step):
aws iam get-role --role-name <IRSA name> --query Role.Arn
Modify the trust relationship of the role you created previously and limit it to your newly created IRSA. The following should resemble your trust relationship. Replace <IRSA Arn> with the IRSA ARN returned in the previous step:
Note that you will be using session tags to implement ABAC. When using session tags, trust policies for all roles connected to the identity provider (IdP) passing the tags must have the sts:TagSession permission. For roles without this permission in the trust policy, the AssumeRole operation fails.
Moreover, the condition block of the second statement limits ESO’s ability to pass session tags with the key name ekssecret. We’re using this condition to verify that the ESO role can only create session tags used for accessing secrets manager, and doesn’t gain the ability to set principal tags that might be used for any other purpose. This way, you’re creating a namespace to help prevent further privilege escalations or escapes.
Create secrets in Secrets Manager
You can create two secrets in Secrets Manager and tag them.
Follow the steps in Create an AWS Secrets Manager secret to create two secrets named service1_secret and service2_secret. Add the following tags to your secrets:
service1_secret:
key=ekssecret, value=service1
service2_secret:
key=ekssecret, value=service2
Run the following command to verify both secrets are created and tagged properly:
Assume that service1-ns hosts service1 and service2-ns hosts service2. After creating the namespaces for your services, verify that each service is restricted to accessing secrets that are tagged with a specific key-value pair. In this example the key should be ekssecret and the value should match the name of the corresponding service. This means that service1 should only have access to service1_secret, while service2 should only have access to service2_secret. Next, declare session tags in SecretStore object definitions.
Edit the following command snippet using the text editor of your choice and replace every instance of <Secrets Manager Access Role ARN> with the ARN of the IAM role you created earlier to access Secrets Manager secrets. Copy and paste the edited command in your terminal and run it to create a .yaml file in your working directory that contains the SecretStore definitions. Make sure to change the AWS Region to reflect the Region of your Secrets Manager.
Create SecretStore objects by running the following command:
kubectl apply -f secretstore.yml
Validate object creation by running the following command:
kubectl describe secretstores.external-secrets.io -A
Check the status and events section for each object and make sure the store is validated.
Next, create two ExternalSecret objects requesting service1_secret and service2_secret. Copy and paste the following command in your terminal and run it. The command will create a .yaml file in your working directory that contains ExternalSecret definitions.
Verify the objects are created by running following command:
kubectl get externalsecrets.external-secrets.io -A
Each ExternalSecret object should create a Kubernetes secret in the same namespace it was created in. Kubernetes secrets are accessible to services in the same namespace. To demonstrate that both Service A and Service B has access to their secrets, run the following command.
kubectl get secrets -A
You should see service1-ns-secret1 created in service1-ns namespace which is accessible to Service 1, and service1-ns-secret2 created in service2-ns which is accessible to Service2.
Try creating an ExternalSecrets object in service1-ns referencing service2_secret. Notice that your object shows SecretSyncedError status. This is the expected behavior, because ESO passes different session tags for ExternalSecret objects in each namespace, and when the tag where key is ekssecret doesn’t match the secret tag with the same key, the request will be rejected.
What about AWS Secrets and Configuration Provider (ASCP)?
Today, customers who use AWS Fargate with Amazon EKS can’t use the ASCP method due to the incompatibility of daemonsets on Fargate. Kubernetes also doesn’t provide a mechanism to add specific claims to JSON web tokens (JWT) used to assume IAM roles. Today, when using ASCP in Kubernetes, which assumes IAM roles through IAM roles for service accounts (IRSA), there’s a constraint in appending session tags during the IRSA assumption due to JWT claim restrictions, limiting the ability to implement ABAC.
With ESO, you can create Kubernetes Secrets and have your pods retrieve secrets from them instead of directly mounting secrets as volumes in your pods. ESO is also capable of using its controller pod’s IRSA to retrieve secrets, so you don’t need to set up IRSA for each pod. You can also role chain and specify secondary roles to be assumed by ESO IRSA and pass session tags to be used with ABAC policies. ESO’s role chaining and ABAC capabilities help decrease the number of IAM roles required for secrets retrieval. See Leverage AWS secrets stores from EKS Fargate with External Secrets Operator on the AWS Containers blog to learn how to use ESO on an EKS Fargate cluster to consume secrets stored in Secrets Manager.
Conclusion
In this blog post, we walked you through how to implement ABAC with Amazon EKS and Secrets Manager using External Secrets Operator. Implementing ABAC allows you to create a single IAM role for accessing Secrets Manager secrets while implementing granular permissions. ABAC also decreases your team’s overhead and reduces the risk of misconfigurations. With ABAC, you require fewer policies and don’t need to update existing policies to allow access to new services and workloads.
If you have feedback about this post, submit comments in the Comments section below.
AWS Signer is a fully managed code-signing service to help ensure the trust and integrity of your code. It helps you verify that the code comes from a trusted source and that an unauthorized party has not accessed it. AWS Signer manages code signing certificates and public and private keys, which can reduce the overhead of your public key infrastructure (PKI) management. It also provides a set of features to simplify lifecycle management of your keys and certificates so that you can focus on signing and verifying your code.
Containers and AWS Lambda functions are popular serverless compute solutions for applications built on the cloud. By using AWS Signer, you can verify that the software running in these workloads originates from a trusted source.
In this blog post, you will learn about the benefits of code signing for software security, governance, and compliance needs. Flexible continuous integration and continuous delivery (CI/CD) integration, management of signing identities, and native integration with other AWS services can help you simplify code security through automation.
Background
Code signing is an important part of the software supply chain. It helps ensure that the code is unaltered and comes from an approved source.
To automate software development workflows, organizations often implement a CI/CD pipeline to push, test, and deploy code effectively. You can integrate code signing into the workflow to help prevent untrusted code from being deployed, as shown in Figure 1. Code signing in the pipeline can provide you with different types of information, depending on how you decide to use the functionality. For example, you can integrate code signing into the build stage to attest that the code was scanned for vulnerabilities, had its software bill of materials (SBOM) approved internally, and underwent unit and integration testing. You can also use code signing to verify who has pushed or published the code, such as a developer, team, or organization. You can verify each of these steps separately by including multiple signing stages in the pipeline. For more information on the value provided by container image signing, see Cryptographic Signing for Containers.
Figure 1: Security IN the pipeline
In the following section, we will walk you through a simple implementation of image signing and its verification for Amazon Elastic Kubernetes Service (Amazon EKS) deployment. The signature attests that the container image went through the pipeline and came from a trusted source. You can use this process in more complex scenarios by adding multiple AWS CodeBuild code signing stages that make use of various AWS Signer signing profiles.
Services and tools
In this section, we discuss the various AWS services and third-party tools that you need for this solution.
CI/CD services
For the CI/CD pipeline, you will use the following AWS services:
AWS CodePipeline — a fully managed continuous delivery service that you can use to automate your release pipelines for fast and reliable application and infrastructure updates.
AWS Signer — a fully managed code-signing service that you can use to help ensure the trust and integrity of your code.
AWS CodeBuild — A fully managed continuous integration service that compiles source code, runs tests, and produces software packages that are ready to deploy.
Container services
You will use the following AWS services for containers for this walkthrough:
Amazon EKS — a managed Kubernetes service to run Kubernetes in the AWS Cloud and on-premises data centers.
Amazon ECR — a fully managed container registry for high-performance hosting, so that you can reliably deploy application images and artifacts anywhere.
Verification tools
The following are publicly available sign verification tools that we integrated into the pipeline for this post, but you could integrate other tools that meet your specific requirements.
Notation — A publicly available Notary project within the Cloud Native Computing Foundation (CNCF). With contributions from AWS and others, Notary is an open standard and client implementation that allows for vendor-specific plugins for key management and other integrations. AWS Signer manages signing keys, key rotation, and PKI management for you, and is integrated with Notation through a curated plugin that provides a simple client-based workflow.
Kyverno — A publicly available policy engine that is designed for Kubernetes.
Solution overview
Figure 2: Solution architecture
Here’s how the solution works, as shown in Figure 2:
Developers push Dockerfiles and application code to CodeCommit. Each push to CodeCommit starts a pipeline hosted on CodePipeline.
CodeBuild packages the build, containerizes the application, and stores the image in the ECR registry.
CodeBuild retrieves a specific version of the image that was previously pushed to Amazon ECR. AWS Signer and Notation sign the image by using the signing profile established previously, as shown in more detail in Figure 3.
Figure 3: Signing images described
AWS Signer and Notation verify the signed image version and then deploy it to an Amazon EKS cluster.
If the image has not previously been signed correctly, the CodeBuild log displays an output similar to the following:
Error: signature verification failed: no signature is associated with "<AWS_ACCOUNT_ID>.dkr.ecr.<AWS_REGION>.amazonaws.com/hello-server@<DIGEST>" , make sure the artifact was signed successfully
If there is a signature mismatch, the CodeBuild log displays an output similar to the following:
Error: signature verification failed for all the signatures associated with <AWS_ACCOUNT_ID>.dkr.ecr.<AWS_REGION>.amazonaws.com/hello-server@<DIGEST>
Kyverno verifies the container image signature for use in the Amazon EKS cluster.
Figure 4 shows steps 4 and 5 in more detail.
Figure 4: Verification of image signature for Kubernetes
Prerequisites
Before getting started, make sure that you have the following prerequisites in place:
A CodePipeline pipeline deployed with the CodeCommit repository as the code source and four CodeBuild stages: Build, ApplicationSigning, ApplicationDeployment, and VerifyContainerSign. The CI/CD pipeline should look like that in Figure 5.
The commands in the buildspec.yaml configuration file do the following:
Sign you in to Amazon ECR to work with the Docker images.
Reference the specific image that will be signed by using the commit hash (or another versioning strategy that your organization uses). This gets the digest.
Sign the container image by using the notation sign command. This command uses the container image digest, instead of the image tag.
Install the Notation CLI. In this example, you use the installer for Linux. For a list of installers for various operating systems, see the AWS Signer Developer Guide,
Sign the image by using the notation sign command.
Inspect the signed image to make sure that it was signed successfully by using the notation inspect command.
To verify the signed image, use the notation verify command. The output should look similar to the following:
Successfully verified signature for <AWS_ACCOUNT_ID>.dkr.ecr.<AWS_REGION>.amazonaws.com/hello-server@<DIGEST>
(Optional) For troubleshooting, print the notation policy from the pipeline itself to check that it’s working as expected by running the notation policy show command:
notation policy show
For this, include the command in the pre_build phase after the notation version command in the buildspec.yaml configuration file.
After the notation policy show command runs, CodeBuild logs should display an output similar to the following:
To verify the image in Kubernetes, set up both Kyverno and the Kyverno-notation-AWS Signer in your EKS cluster. To get started with Kyverno and the Kyverno-notation-AWS Signer solution, see the installation instructions.
After you install Kyverno and Kyverno-notation-AWS Signer, verify that the controller is running—the STATUS should show Running:
$ kubectl get pods -n kyverno-notation-aws -w

NAME                                    READY   STATUS    RESTARTS   AGE
kyverno-notation-aws-75b7ddbcfc-kxwjh   1/1     Running   0          6h58m
Configure the CodeBuild buildspec.yaml configuration file to verify that the images deployed in the cluster have been previously signed. You can use the following code to configure the buildspec.yaml file.
The commands in the buildspec.yaml configuration file do the following:
Set up the environment variables, such as the ECR repository URI and the Commit hash, to build the image tag. The kubectl tool will use this later to reference the container image that will be deployed with the Kubernetes objects.
Use kubectl to connect to the EKS cluster and insert the container image reference in the deployment.yaml file.
After the container is deployed, you can observe the kyverno-notation-aws controller and access its logs. You can check if the deployed image is signed. If the logs contain an error, stop the pipeline run with an error code, do a rollback to a previous version, or delete the deployment if you detect that the image isn’t signed.
Decommission the AWS resources
If you no longer need the resources that you provisioned for this post, complete the following steps to delete them.
Delete the IAM roles and policies that you used for the configuration of IAM roles for service accounts.
Revoke the AWS Signer signing profile that you created and used for the signing process by running the following command in the AWS CLI:
$ aws signer revoke-signing-profile
Delete signatures from the Amazon ECR repository. Make sure to replace <AWS_ACCOUNT_ID> and <AWS_REGION> with your own information.
# Use oras CLI, with Amazon ECR Docker Credential Helper, to delete signature
$ oras manifest delete <AWS_ACCOUNT_ID>.dkr.ecr.<AWS_REGION>.amazonaws.com/pause@sha256:ca78e5f730f9a789ef8c63bb55275ac12dfb9e8099e6a0a64375d8a95ed501c4
Note: Using the ORAS project’s oras client, you can delete signatures and other reference type artifacts. It implements deletion by first removing the reference from an index, and then deleting the manifest.
Conclusion
In this post, you learned how to implement container image signing in a CI/CD pipeline by using AWS services such as CodePipeline, CodeBuild, Amazon ECR, and AWS Signer along with publicly available tools such as Notary and Kyverno. By implementing mandatory image signing in your pipelines, you can confirm that only validated and authorized container images are deployed to production. Automating the signing process and signature verification is vital to help securely deploy containers at scale. You also learned how to verify signed images both during deployment and at runtime in Kubernetes. This post provides valuable insights for anyone looking to add image signing capabilities to their CI/CD pipelines on AWS to provide supply chain security assurances. The combination of AWS managed services and publicly available tools provides a robust implementation.
If you have feedback about this post, submit comments in the Comments section below. If you have questions about this post, contact AWS Support.
Want more AWS Security news? Follow us on Twitter.
This post is written by Yahav Biran, Principal SA, and Yuval Dovrat, Israel Head Compute SA.
This post shows you how to integrate AWS Graviton-based Amazon EC2 instances into an existing Amazon Elastic Kubernetes Service (Amazon EKS) environment running on x86-based Amazon EC2 instances. Customers use mixed-CPU architectures to enable their application to utilize a wide selection of Amazon EC2 instance types and improve overall application resilience. In order to successfully run a mixed-CPU application, it is strongly recommended that you test application performance in a test environment before running production applications on Graviton-based instances. You can follow AWS’ transition guide to learn more about porting your application to AWS Graviton.
This example shows how you can use KEDA for controlling application capacity across CPU types in EKS. KEDA will trigger a deployment based on the application’s response latency as measured by the Application Load Balancer (ALB). To simplify resource provisioning, Karpenter, an open-source Kubernetes node provisioning software, and AWS Load Balancer Controller, are shown as well.
Solution Overview
There are two solutions that this post covers to test a mixed-CPU application. The first configuration (shown in Figure 1 below) is the “A/B Configuration”. It uses an Application Load Balancer (ALB)-based Ingress to control traffic flowing to x86-based and Graviton-based node pools. You use this configuration to gradually migrate a live application from x86-based instances to Graviton-based instances, while validating the response time with Amazon CloudWatch.
Figure 1, config 1: A/B Configuration
In the second configuration, the “Karpenter Controlled Configuration” (shown in Figure 2 below as Config 2), Karpenter automatically controls the instance blend. Karpenter is configured to use weighted provisioners with values that prioritize AWS Graviton-based Amazon EC2 instances over x86-based Amazon EC2 instances.
It is recommended that you start with the “A/B” configuration to measure the response time of live requests. Once your workload is validated on Graviton-based instances, you can build the second configuration to simplify the deployment configuration and increase resiliency. This enables your application to automatically utilize x86-based instances if needed, for example, during an unplanned large-scale event.
You can find the step-by-step guide on GitHub to help you to examine and try the example app deployment described in this post. The following provides an overview of the step-by-step guide.
After making any required changes, you might need to recompile your application for the Arm64 architecture. This is necessary if your application is written in a language that compiles to machine code, such as Golang and C/C++, or if you need to rebuild native-code libraries for interpreted/JIT compiled languages such as the Python/C API or Java Native Interface (JNI).
To allow your containerized application to run on both x86 and Graviton-based nodes, you must build OCI images for both the x86 and Arm64 architectures, push them to your image repository (such as Amazon ECR), and stitch them together by creating and pushing an OCI multi-architecture manifest list. You can find an overview of these steps in this AWS blog post. You can also find the AWS Cloud Development Kit (CDK) construct on GitHub to help get you started.
To simplify the process, you can use a Linux distribution package manager that supports cross-platform packages and avoid platform-specific software package names in the Linux distribution wherever possible. For example, use:
RUN pip install httpd
instead of:
ARG ARCH=aarch64 or amd64 RUN yum install httpd.${ARCH}
This blog post shows you how to automate multi-arch OCI image building in greater depth.
Application Deployment
Config 1 – A/B controlled topology
This topology allows you to migrate to Graviton while validating the application’s response time (approximately 300ms) on both x86 and Graviton-based instances. As shown in Figure 1, this design has a single Listener that forwards incoming requests to two Target Groups. One Target Group is associated with Graviton-based instances, while the other Target Group is associated with x86-based instances. The traffic ratio associated with each target group is defined in the Ingress configuration.
Here are the steps to create Config 1:
Create two KEDA ScaledObjects that scale the number of pods based on the latency metric (AWS/ApplicationELB-TargetResponseTime) that matches the target group (triggers.metadata.dimensionValue). Declare the maximum acceptable latency in targetMetricValue:0.3. Below is the Graviton deployment scaledObject (spec.scaleTargetRef), note the comments that denote the value of the x86 deployment scaledObject
To simplify testing and control for potential performance differences in instance generations, create two dedicated Karpenter provisioners and Kubernetes Deployments (replica sets) and specify the instance generation, CPU count, and CPU architecture for each one. This example uses c7g (Graviton3) and c6i (Intel) . You will remove these constraints in the next topology to allow more allocation flexibility.
Create an Application Load Balancer using the AWS Load Balancer Controller to distribute incoming requests among the different pods. Control the traffic routing in the ingress by adding an ingress.kubernetes.io/actions.weighted-routing annotation. You can adjust the weight in the example below to meet your needs. This migration example started with a 100%-to-0% x86-to-Graviton ratio, adjusting over time by 10% increments until it reached a 0%-to-100% x86-to-Graviton ratio.
You can simulate live user requests to an example application ALB endpoint. Amazon CloudWatch populates ALB Target Group request/second metrics, dimensioned by HTTP response code, to help assess the application throughput and CPU usage.
During the simulation, you will need to verify the following:
Both Graviton-based instances and x86-based instances pods process a variable amount of traffic.
The application response time (p99) meets the performance requirements (300ms).
The orange (Graviton) and blue (x86) curves of HTTP 2xx responses (figure 4) show the application throughput (HTTP requests/seconds) for each CPU architecture during the migration.
Figure 3 HTTP 2XX per CPU architecture
Figure 4 shows an example of application response time during the transition from x86-based instances to Graviton-based instances. The latency associated with each instance family grows and shrinks as the live request simulation changes the load on the application. In this example, the latency on x86 instances (until 07:00) grew up to 300ms because most of the request load was directed at to x86-based pods. It began to converge at around 08:00 when more pods were powered by Graviton-based instances. Finally, after 15:00, the request load was processed by Graviton-based instances entirely.
Figure 4: Target Response Time p99
Config 2 – Karpenter Controlled Configuration
After fully testing the application on Graviton-based EC2 instances, you are ready to simplify the deployment topology with weighted provisioners while preserving the ability to launch x86-based instances as needed.
Here are the steps to create Config 2:
Reuse the CPU-based provisioners from the previous topology, but assign a higher .spec.weight to Graviton-based instances provisioner. The x86 provisioner is still deployed in case x86-based instances are required. The karpenter.k8s.aws/instance-family can be expanded beyond those set in Config 1 or excluded by switching the operator to NotIn.
The x86-based Amazon EC2 instances Karpenter provisioner:
Next, merge the two Kubernetes deployments into one deployment similar to the original before migration (i.e., no specific nodeSelector that points to a CPU-specific provisioner).
The two services are also combined into a single Kubernetes service and the actions.weighted-routing annotation is removed from the ingress resources:
Unite the two KEDA ScaledObject resources from the first configuration and point them to a single deployment, e.g., simplemultiarchapp. The new KEDA ScaledObject will be:
A synthetic limit on Graviton CPU capacity is set to illustrate the scaling to x86_64 CPUs (Provisioner.limits.resources.cpu). The total application throughput (figure 6) is shown by aarch64_200 (blue) and x86_64_200 (orange). Mixing CPUs did not impact the target response time (Figure 6). Karpenter behaved as expected: prioritizing Graviton-based instances, and bursting to x86-based Amazon EC2 instances when CPU limits were crossed.
Figure 6 Config 2 -HTTP response time p99 with mixed-CPU provisioner
Conclusion
The use of a mixed-CPU architecture enables your application to utilize a wide selection of Amazon EC2 instance types and improves your applications’ resilience while meeting your service-level objectives. Application metrics can be used to control the migration with AWS ALB Ingress, Karpenter, and KEDA. Moreover, AWS Graviton-based Amazon EC2 instances can deliver up to 40% better price performance than x86-based Amazon EC2 instances. Learn more about this example on GitHub and more announcements about Gravtion.
The threat detection and incident response track showcased how AWS customers can get the visibility they need to help improve their security posture, identify issues before they impact business, and investigate and respond quickly to security incidents across their environment.
With dozens of service and feature announcements—and innumerable best practices shared by AWS experts, customers, and partners—distilling highlights is a challenge. From an incident response perspective, three key themes emerged.
Proactively detect, contextualize, and visualize security events
When it comes to effectively responding to security events, rapid detection is key. Among the launches announced during the keynote was the expansion of Amazon Detective finding groups to include Amazon Inspector findings in addition to Amazon GuardDuty findings.
Detective, GuardDuty, and Inspector are part of a broad set of fully managed AWS security services that help you identify potential security risks, so that you can respond quickly and confidently.
Using machine learning, Detective finding groups can help you conduct faster investigations, identify the root cause of events, and map to the MITRE ATT&CK framework to quickly run security issues to ground. The finding group visualization panel shown in the following figure displays findings and entities involved in a finding group. This interactive visualization can help you analyze, understand, and triage the impact of finding groups.
Figure 1: Detective finding groups visualization panel
With the expanded threat and vulnerability findings announced at re:Inforce, you can prioritize where to focus your time by answering questions such as “was this EC2 instance compromised because of a software vulnerability?” or “did this GuardDuty finding occur because of unintended network exposure?”
In the session Streamline security analysis with Amazon Detective, AWS Principal Product Manager Rich Vorwaller, AWS Senior Security Engineer Rima Tanash, and AWS Program Manager Jordan Kramer demonstrated how to use graph analysis techniques and machine learning in Detective to identify related findings and resources, and investigate them together to accelerate incident analysis.
In addition to Detective, you can also use Amazon Security Lake to contextualize and visualize security events. Security Lake became generally available on May 30, 2023, and several re:Inforce sessions focused on how you can use this new service to assist with investigations and incident response.
As detailed in the following figure, Security Lake automatically centralizes security data from AWS environments, SaaS providers, on-premises environments, and cloud sources into a purpose-built data lake stored in your account. Security Lake makes it simpler to analyze security data, gain a more comprehensive understanding of security across an entire organization, and improve the protection of workloads, applications, and data. Security Lake automates the collection and management of security data from multiple accounts and AWS Regions, so you can use your preferred analytics tools while retaining complete control and ownership over your security data. Security Lake has adopted the Open Cybersecurity Schema Framework (OCSF), an open standard. With OCSF support, the service normalizes and combines security data from AWS and a broad range of enterprise security data sources.
Figure 2: How Security Lake works
To date, 57 AWS security partners have announced integrations with Security Lake, and we now have more than 70 third-party sources, 16 analytics subscribers, and 13 service partners.
In Gaining insights from Amazon Security Lake, AWS Principal Solutions Architect Mark Keating and AWS Security Engineering Manager Keith Gilbert detailed how to get the most out of Security Lake. Addressing questions such as, “How do I get access to the data?” and “What tools can I use?,” they demonstrated how analytics services and security information and event management (SIEM) solutions can connect to and use data stored within Security Lake to investigate security events and identify trends across an organization. They emphasized how bringing together logs in multiple formats and normalizing them into a single format empowers security teams to gain valuable context from security data, and more effectively respond to events. Data can be queried with Amazon Athena, or pulled by Amazon OpenSearch Service or your SIEM system directly from Security Lake.
Build your security data lake with Amazon Security Lake featured AWS Product Manager Jonathan Garzon, AWS Product Solutions Architect Ross Warren, and Global CISO of Interpublic Group (IPG) Troy Wilkinson demonstrating how Security Lake helps address common challenges associated with analyzing enterprise security data, and detailing how IPG is using the service. Wilkinson noted that IPG’s objective is to bring security data together in one place, improve searches, and gain insights from their data that they haven’t been able to before.
“With Security Lake, we found that it was super simple to bring data in. Not just the third-party data and Amazon data, but also our on-premises data from custom apps that we built.” — Troy Wilkinson, global CISO, Interpublic Group
Use automation and machine learning to reduce mean time to response
Incident response automation can help free security analysts from repetitive tasks, so they can spend their time identifying and addressing high-priority security issues.
LLA operates in over 20 countries across Latin America and the Caribbean. After completing multiple acquisitions, LLA needed a centralized security operations team to handle incidents and notify the teams responsible for each AWS account. They used GuardDuty, Security Hub, and Systems Manager Incident Manager to automate and streamline detection and response, and they configured the services to initiate alerts whenever there was an issue requiring attention.
Speaking alongside AWS Principal Solutions Architect Jesus Federico and AWS Principal Product Manager Sarah Holberg, LLA Senior Manager of Cloud Services Joaquin Cameselle noted that when GuardDuty identifies a critical issue, it generates a new finding in Security Hub. This finding is then forwarded to Systems Manager Incident Manager through an Amazon EventBridge rule. This configuration helps ensure the involvement of the appropriate individuals associated with each account.
“We have deployed a security framework in Liberty Latin America to identify security issues and streamline incident response across over 180 AWS accounts. The framework that leverages AWS Systems Manager Incident Manager, Amazon GuardDuty, and AWS Security Hub enabled us to detect and respond to incidents with greater efficiency. As a result, we have reduced our reaction time by 90%, ensuring prompt engagement of the appropriate teams for each AWS account and facilitating visibility of issues for the central security team.” — Joaquin Cameselle, senior manager, cloud services, Liberty Latin America
After describing the four phases of the incident response process — preparation and prevention; detection and analysis; containment, eradication, and recovery; and post-incident activity—AWS ProServe Global Financial Services Senior Engagement Manager Harikumar Subramonion noted that, to fully benefit from the cloud, you need to embrace automation. Automation benefits the third phase of the incident response process by speeding up containment, and reducing mean time to response.
Citibank Head of Cloud Security Operations Elvis Velez and Vice President of Cloud Security Damien Burks described how Citi built the Cloud Containment Automation Framework (CCAF) from the ground up by using AWS Step Functions and AWS Lambda, enabling them to respond to events 24/7 without human error, and reduce the time it takes to contain resources from 4 hours to 15 minutes. Velez described how Citi uses adversary emulation exercises that use the MITRE ATT&CK Cloud Matrix to simulate realistic attacks on AWS environments, and continuously validate their ability to effectively contain incidents.
Innovate and do more with less
Security operations teams are often understaffed, making it difficult to keep up with alerts. According to data from CyberSeek, there are currently 69 workers available for every 100 cybersecurity job openings.
Effectively evaluating security and compliance posture is critical, despite resource constraints. In Centralizing security at scale with Security Hub and Intuit’s experience, AWS Senior Solutions Architect Craig Simon, AWS Senior Security Hub Product Manager Dora Karali, and Intuit Principal Software Engineer Matt Gravlin discussed how to ease security management with Security Hub. Fortune 500 financial software provider Intuit has approximately 2,000 AWS accounts, 10 million AWS resources, and receives 20 million findings a day from AWS services through Security Hub. Gravlin detailed Intuit’s Automated Compliance Platform (ACP), which combines Security Hub and AWS Config with an internal compliance solution to help Intuit reduce audit timelines, effectively manage remediation, and make compliance more consistent.
“By using Security Hub, we leveraged AWS expertise with their regulatory controls and best practice controls. It helped us keep up to date as new controls are released on a regular basis. We like Security Hub’s aggregation features that consolidate findings from other AWS services and third-party providers. I personally call it the super aggregator. A key component is the Security Hub to Amazon EventBridge integration. This allowed us to stream millions of findings on a daily basis to be inserted into our ACP database.” — Matt Gravlin, principal software engineer, Intuit
At AWS re:Inforce, we launched a new Security Hub capability for automating actions to update findings. You can now use rules to automatically update various fields in findings that match defined criteria. This allows you to automatically suppress findings, update the severity of findings according to organizational policies, change the workflow status of findings, and add notes. With automation rules, Security Hub provides you a simplified way to build automations directly from the Security Hub console and API. This reduces repetitive work for cloud security and DevOps engineers and can reduce mean time to response.
In Continuous innovation in AWS detection and response services, AWS Worldwide Security Specialist Senior Manager Himanshu Verma and GuardDuty Senior Manager Ryan Holland highlighted new features that can help you gain actionable insights that you can use to enhance your overall security posture. After mapping AWS security capabilities to the core functions of the NIST Cybersecurity Framework, Verma and Holland provided an overview of AWS threat detection and response services that included a technical demonstration.
Bolstering incident response with AWS Wickr enterprise integrations highlighted how incident responders can collaborate securely during a security event, even on a compromised network. AWS Senior Security Specialist Solutions Architect Wes Wood demonstrated an innovative approach to incident response communications by detailing how you can integrate the end-to-end encrypted collaboration service AWS Wickr Enterprise with GuardDuty and AWS WAF. Using Wickr Bots, you can build integrated workflows that incorporate GuardDuty and third-party findings into a more secure, out-of-band communication channel for dedicated teams.
Many AWS customers are using GitLab for their DevOps needs, including source control, and continuous integration and continuous delivery (CI/CD). Many of our customers are using GitLab SaaS (the hosted edition), while others are using GitLab Self-managed to meet their security and compliance requirements.
Customers can easily add runners to their GitLab instance to perform various CI/CD jobs. These jobs include compiling source code, building software packages or container images, performing unit and integration testing, etc.—even all the way to production deployment. For the SaaS edition, GitLab offers hosted runners, and customers can provide their own runners as well. Customers who run GitLab Self-managed must provide their own runners.
In this post, we’ll discuss how customers can maximize their CI/CD capabilities by managing their GitLab runner and executor fleet with Amazon Elastic Kubernetes Service (Amazon EKS). We’ll leverage both x86 and Graviton runners, allowing customers for the first time to build and test their applications both on x86 and on AWS Graviton, our most powerful, cost-effective, and sustainable instance family. In keeping with AWS’s philosophy of “pay only for what you use,” we’ll keep our Amazon Elastic Compute Cloud (Amazon EC2) instances as small as possible, and launch ephemeral runners on Spot instances. We’ll demonstrate building and testing a simple demo application on both architectures. Finally, we’ll build and deliver a multi-architecture container image that can run on Amazon EC2 instances or AWS Fargate, both on x86 and Graviton.
A runner is an application to which GitLab sends jobs that are defined in a CI/CD pipeline. The runner receives jobs from GitLab and executes them—either by itself, or by passing it to an executor (we’ll visit the executor in the next section).
In our design, we’ll be using a pair of self-hosted runners. One runner will accept jobs for the x86 CPU architecture, and the other will accept jobs for the arm64 (Graviton) CPU architecture. To help us route our jobs to the proper runner, we’ll apply some tags to each runner indicating the architecture for which it will be responsible. We’ll tag the x86 runner with x86, x86-64, and amd64, thereby reflecting the most common nicknames for the architecture, and we’ll tag the arm64 runner with arm64.
Currently, these runners must always be running so that they can receive jobs as they are created. Our runners only require a small amount of memory and CPU, so that we can run them on small EC2 instances to minimize cost. These include t4g.micro for Graviton builds, or t3.micro or t3a.micro for x86 builds.
To save money on these runners, consider purchasing a Savings Plan or Reserved Instances for them. Savings Plans and Reserved Instances can save you up to 72% over on-demand pricing, and there’s no minimum spend required to use them.
Kubernetes executors
In GitLab CI/CD, the executor’s job is to perform the actual build. The runner can create hundreds or thousands of executors as needed to meet current demand, subject to the concurrency limits that you specify. Executors are created only when needed, and they are ephemeral: once a job has finished running on an executor, the runner will terminate it.
In our design, we’ll use the Kubernetes executor that’s built into the GitLab runner. The Kubernetes executor simply schedules a new pod to run each job. Once the job completes, the pod terminates, thereby freeing the node to run other jobs.
The Kubernetes executor is highly customizable. We’ll configure each runner with a nodeSelector that makes sure that the jobs are scheduled only onto nodes that are running the specified CPU architecture. Other possible customizations include CPU and memory reservations, node and pod tolerations, service accounts, volume mounts, and much more.
Scaling worker nodes
For most customers, CI/CD jobs aren’t likely to be running all of the time. To save cost, we only want to run worker nodes when there’s a job to run.
To make this happen, we’ll turn to Karpenter. Karpenter provisions EC2 instances as soon as needed to fit newly-scheduled pods. If a new executor pod is scheduled, and there isn’t a qualified instance with enough capacity remaining on it, then Karpenter will quickly and automatically launch a new instance to fit the pod. Karpenter will also periodically scan the cluster and terminate idle nodes, thereby saving on costs. Karpenter can terminate a vacant node in as little as 30 seconds.
Karpenter can launch either Amazon EC2 on-demand or Spot instances depending on your needs. With Spot instances, you can save up to 90% over on-demand instance prices. Since CI/CD jobs often aren’t time-sensitive, Spot instances can be an excellent choice for GitLab execution pods. Karpenter will even automatically find the best Spot instance type to speed up the time it takes to launch an instance and minimize the likelihood of job interruption.
Deploying our solution
To deploy our solution, we’ll write a small application using the AWS Cloud Development Kit (AWS CDK) and the EKS Blueprints library. AWS CDK is an open-source software development framework to define your cloud application resources using familiar programming languages. EKS Blueprints is a library designed to make it simple to deploy complex Kubernetes resources to an Amazon EKS cluster with minimum coding.
The high-level infrastructure code – which can be found in our GitLab repo – is very simple. I’ve included comments to explain how it works.
// All CDK applications start with a new cdk.App object.
const app = new cdk.App();

// Create a new EKS cluster at v1.23. Run all non-DaemonSet pods in the
// `kube-system` (coredns, etc.) and `karpenter` namespaces in Fargate
// so that we don't have to maintain EC2 instances for them.
const clusterProvider = new blueprints.GenericClusterProvider({
  version: KubernetesVersion.V1_23,
  fargateProfiles: {
    main: {
      selectors: [
        { namespace: 'kube-system' },
        { namespace: 'karpenter' },
      ]
    }
  },
  clusterLogging: [
    ClusterLoggingTypes.API,
    ClusterLoggingTypes.AUDIT,
    ClusterLoggingTypes.AUTHENTICATOR,
    ClusterLoggingTypes.CONTROLLER_MANAGER,
    ClusterLoggingTypes.SCHEDULER
  ]
});

// EKS Blueprints uses a Builder pattern.
blueprints.EksBlueprint.builder()
  .clusterProvider(clusterProvider) // start with the Cluster Provider
  .addOns(
    // Use the EKS add-ons that manage coredns and the VPC CNI plugin
    new blueprints.addons.CoreDnsAddOn('v1.8.7-eksbuild.3'),
    new blueprints.addons.VpcCniAddOn('v1.12.0-eksbuild.1'),
    // Install Karpenter
    new blueprints.addons.KarpenterAddOn({
      provisionerSpecs: {
        // Karpenter examines scheduled pods for the following labels
        // in their `nodeSelector` or `nodeAffinity` rules and routes
        // the pods to the node with the best fit, provisioning a new
        // node if necessary to meet the requirements.
        //
        // Allow either amd64 or arm64 nodes to be provisioned
        'kubernetes.io/arch': ['amd64', 'arm64'],
        // Allow either Spot or On-Demand nodes to be provisioned
        'karpenter.sh/capacity-type': ['spot', 'on-demand']
      },
      // Launch instances in the VPC private subnets
      subnetTags: {
        Name: 'gitlab-runner-eks-demo/gitlab-runner-eks-demo-vpc/PrivateSubnet*'
      },
      // Apply security groups that match the following tags to the launched instances
      securityGroupTags: {
        'kubernetes.io/cluster/gitlab-runner-eks-demo': 'owned'
      }
    }),
    // Create a pair of a new GitLab runner deployments, one running on
    // arm64 (Graviton) instance, the other on an x86_64 instance.
    // We'll show the definition of the GitLabRunner class below.
    new GitLabRunner({
      arch: CpuArch.ARM_64,
      // If you're using an on-premise GitLab installation, you'll want
      // to change the URL below.
      gitlabUrl: 'https://gitlab.com',
      // Kubernetes Secret containing the runner registration token
      // (discussed later)
      secretName: 'gitlab-runner-secret'
    }),
    new GitLabRunner({
      arch: CpuArch.X86_64,
      gitlabUrl: 'https://gitlab.com',
      secretName: 'gitlab-runner-secret'
    }),
  )
  .build(app,
         // Stack name
         'gitlab-runner-eks-demo');
The GitLabRunner class is a HelmAddOn subclass that takes a few parameters from the top-level application:
// The location and name of the GitLab Runner Helm chart
const CHART_REPO = 'https://charts.gitlab.io';
const HELM_CHART = 'gitlab-runner';

// The default namespace for the runner
const DEFAULT_NAMESPACE = 'gitlab';

// The default Helm chart version
const DEFAULT_VERSION = '0.40.1';

export enum CpuArch {
    ARM_64 = 'arm64',
    X86_64 = 'amd64'
}

// Configuration parameters
interface GitLabRunnerProps {
    // The CPU architecture of the node on which the runner pod will reside
    arch: CpuArch
    // The GitLab API URL
    gitlabUrl: string
    // Kubernetes Secret containing the runner registration token (discussed later)
    secretName: string
    // Optional tags for the runner. These will be added to the default list
    // corresponding to the runner's CPU architecture.
    tags?: string[]
    // Optional Kubernetes namespace in which the runner will be installed
    namespace?: string
    // Optional Helm chart version
    chartVersion?: string
}

export class GitLabRunner extends HelmAddOn {
    private arch: CpuArch;
    private gitlabUrl: string;
    private secretName: string;
    private tags: string[] = [];

    constructor(props: GitLabRunnerProps) {
        // Invoke the superclass (HelmAddOn) constructor
        super({
            name: `gitlab-runner-${props.arch}`,
            chart: HELM_CHART,
            repository: CHART_REPO,
            namespace: props.namespace || DEFAULT_NAMESPACE,
            version: props.chartVersion || DEFAULT_VERSION,
            release: `gitlab-runner-${props.arch}`,
        });

        this.arch = props.arch;
        this.gitlabUrl = props.gitlabUrl;
        this.secretName = props.secretName;

        // Set default runner tags
        switch (this.arch) {
            case CpuArch.X86_64:
                this.tags.push('amd64', 'x86', 'x86-64', 'x86_64');
                break;
            case CpuArch.ARM_64:
                this.tags.push('arm64');
                break;
        }
        this.tags.push(...props.tags || []); // Add any custom tags
    };

    // `deploy` method required by the abstract class definition. Our implementation
    // simply installs a Helm chart to the cluster with the proper values.
    deploy(clusterInfo: ClusterInfo): void | Promise<Construct> {
        const chart = this.addHelmChart(clusterInfo, this.getValues(), true);
        return Promise.resolve(chart);
    }

    // Returns the values for the GitLab Runner Helm chart
    private getValues(): Values {
        return {
            gitlabUrl: this.gitlabUrl,
            runners: {
                config: this.runnerConfig(), // runner config.toml file, from below
                name: `demo-runner-${this.arch}`, // name as seen in GitLab UI
                tags: uniq(this.tags).join(','),
                secret: this.secretName, // see below
            },
            // Labels to constrain the nodes where this runner can be placed
            nodeSelector: {
                'kubernetes.io/arch': this.arch,
                'karpenter.sh/capacity-type': 'on-demand'
            },
            // Default pod label
            podLabels: {
                'gitlab-role': 'manager'
            },
            // Create all the necessary RBAC resources including the ServiceAccount
            rbac: {
                create: true
            },
            // Required resources (memory/CPU) for the runner pod. The runner
            // is fairly lightweight as it's a self-contained Golang app.
            resources: {
                requests: {
                    memory: '128Mi',
                    cpu: '256m'
                }
            }
        };
    }

    // This string contains the runner's `config.toml` file including the
    // Kubernetes executor's configuration. Note the nodeSelector constraints
    // (including the use of Spot capacity and the CPU architecture).
    private runnerConfig(): string {
        return `
  [[runners]]
    [runners.kubernetes]
      namespace = "{{.Release.Namespace}}"
      image = "ubuntu:16.04"
    [runners.kubernetes.node_selector]
      "kubernetes.io/arch" = "${this.arch}"
      "kubernetes.io/os" = "linux"
      "karpenter.sh/capacity-type" = "spot"
    [runners.kubernetes.pod_labels]
      gitlab-role = "runner"
      `.trim();
    }
}
# These two values must match the parameters supplied to the GitLabRunner constructor
NAMESPACE=gitlab
SECRET_NAME=gitlab-runner-secret
# The value of the registration token.
TOKEN=GRxxxxxxxxxxxxxxxxxxxxxx

kubectl -n $NAMESPACE create secret generic $SECRET_NAME \
        --from-literal="runner-registration-token=$TOKEN" \
        --from-literal="runner-token="
Building a multi-architecture container image
Now that we’ve launched our GitLab runners and configured the executors, we can build and test a simple multi-architecture container image. If the tests pass, we can then upload it to our project’s GitLab container registry. Our application will be pretty simple: we’ll create a web server in Go that simply prints out “Hello World” and prints out the current architecture.
Find the source code of our sample app in our GitLab repo.
In GitLab, the CI/CD configuration lives in the .gitlab-ci.yml file at the root of the source repository. In this file, we declare a list of ordered build stages, and then we declare the specific jobs associated with each stage.
Our stages are:
The build stage, in which we compile our code, produce our architecture-specific images, and upload these images to the GitLab container registry. These uploaded images are tagged with a suffix indicating the architecture on which they were built. This job uses a matrix variable to run it in parallel against two different runners – one for each supported architecture. Furthermore, rather than using docker build to produce our images, we use Kaniko to build them. This lets us build our images in an unprivileged container environment and improve the security posture considerably.
The test stage, in which we test the code. As with the build stage, we use a matrix variable to run the tests in parallel in separate pods on each supported architecture.
The assemblystage, in which we create a multi-architecture image manifest from the two architecture-specific images. Then, we push the manifest into the image registry so that we can refer to it in future deployments.
Figure 2. Example CI/CD pipeline for multi-architecture images.
Here’s what our top-level configuration looks like:
variables:
  # These are used by the runner to configure the Kubernetes executor, and define
  # the values of spec.containers[].resources.limits.{memory,cpu} for the Pod(s).
  KUBERNETES_MEMORY_REQUEST: 1Gi
  KUBERNETES_CPU_REQUEST: 1

# List of stages for jobs, and their order of execution
stages:
  - build
  - test
  - create-multiarch-manifest
Here’s what our build stage job looks like. Note the matrix of variables which are set in BUILD_ARCH as the two jobs are run in parallel:
build-job:
  stage: build
  parallel:
    matrix:              # This job is run twice, once on amd64 (x86), once on arm64
    - BUILD_ARCH: amd64
    - BUILD_ARCH: arm64
  tags: [$BUILD_ARCH]    # Associate the job with the appropriate runner
  image:
    name: gcr.io/kaniko-project/executor:debug
    entrypoint: [""]
  script:
    - mkdir -p /kaniko/.docker
    # Configure authentication data for Kaniko so it can push to the
    # GitLab container registry
    - echo "{\"auths\":{\"${CI_REGISTRY}\":{\"auth\":\"$(printf "%s:%s" "${CI_REGISTRY_USER}" "${CI_REGISTRY_PASSWORD}" | base64 | tr -d '\n')\"}}}" > /kaniko/.docker/config.json
    # Build the image and push to the registry. In this stage, we append the build
    # architecture as a tag suffix.
    - >-
      /kaniko/executor
      --context "${CI_PROJECT_DIR}"
      --dockerfile "${CI_PROJECT_DIR}/Dockerfile"
      --destination "${CI_REGISTRY_IMAGE}:${CI_COMMIT_SHORT_SHA}-${BUILD_ARCH}"
Here’s what our test stage job looks like. This time we use the image that we just produced. Our source code is copied into the application container. Then, we can run make test-api to execute the server test suite.
build-job:
  stage: build
  parallel:
    matrix:              # This job is run twice, once on amd64 (x86), once on arm64
    - BUILD_ARCH: amd64
    - BUILD_ARCH: arm64
  tags: [$BUILD_ARCH]    # Associate the job with the appropriate runner
  image:
    # Use the image we just built
    name: "${CI_REGISTRY_IMAGE}:${CI_COMMIT_SHORT_SHA}-${BUILD_ARCH}"
  script:
    - make test-container
Finally, here’s what our assembly stage looks like. We use Podman to build the multi-architecture manifest and push it into the image registry. Traditionally we might have used docker buildx to do this, but using Podman lets us do this work in an unprivileged container for additional security.
create-manifest-job:
  stage: create-multiarch-manifest
  tags: [arm64]
  image: public.ecr.aws/docker/library/fedora:36
  script:
    - yum -y install podman
    - echo "${CI_REGISTRY_PASSWORD}" | podman login -u "${CI_REGISTRY_USER}" --password-stdin "${CI_REGISTRY}"
    - COMPOSITE_IMAGE=${CI_REGISTRY_IMAGE}:${CI_COMMIT_SHORT_SHA}
    - podman manifest create ${COMPOSITE_IMAGE}
    - >-
      for arch in arm64 amd64; do
        podman manifest add ${COMPOSITE_IMAGE} docker://${COMPOSITE_IMAGE}-${arch};
      done
    - podman manifest inspect ${COMPOSITE_IMAGE}
    # The composite image manifest omits the architecture from the tag suffix.
    - podman manifest push ${COMPOSITE_IMAGE} docker://${COMPOSITE_IMAGE}
Trying it out
I’ve created a public test GitLab project containing the sample source code, and attached the runners to the project. We can see them at Settings > CI/CD > Runners:
Figure 3. GitLab runner configurations.
Here we can also see some pipeline executions, where some have succeeded, and others have failed.
Figure 4. GitLab sample pipeline executions.
We can also see the specific jobs associated with a pipeline execution:
Figure 5. GitLab sample job executions.
Finally, here are our container images:
Figure 6. GitLab sample container registry.
Conclusion
In this post, we’ve illustrated how you can quickly and easily construct multi-architecture container images with GitLab, Amazon EKS, Karpenter, and Amazon EC2, using both x86 and Graviton instance families. We indexed on using as many managed services as possible, maximizing security, and minimizing complexity and TCO. We dove deep on multiple facets of the process, and discussed how to save up to 90% of the solution’s cost by using Spot instances for CI/CD executions.
Find the sample code, including everything shown here today, in our GitLab repository.
Building multi-architecture images will unlock the value and performance of running your applications on AWS Graviton and give you increased flexibility over compute choice. We encourage you to get started today.
In this two part series, we discuss the challenges faced by OfferUp, a Digital Native customer, to meet business growth and time-to-market. Their journey involved modernizing their existing DevOps platform, from the traditional monolith virtual machine (VM) based architecture to modern containerized architecture and running cloud-native applications for secured progressive delivery to accelerate time to market. This series will provide strategies, architecture patterns, and technical steps you can adopt to become more agile and innovative like OfferUp has.
OfferUp engineers were using the homegrown DevOps platform to build and release new services on the marketplace platform. In this first post, we discuss the key challenges encountered by OfferUp engineers with the existing DevOps platform, as well as how OfferUp modernized its DevOps platform with Amazon Elastic Kubernetes Service (Amazon EKS) and Flagger, automating production releases with progressive delivery techniques for faster time-to-market with new products and services. Amazon EKS is a managed container service to run and scale Kubernetes applications in the cloud or on-premises.
Previous DevOps architecture
OfferUp is a leading online and mobile customer to customer (C2C) marketplace where users can both buy and sell goods on the platform. Users can browse and purchase products from a broad range of categories, including furniture, clothing, sports equipment, toys, and many more. As a mobile-first company, OfferUp puts a great deal of emphasis on in-person communication between buyers and sellers.
OfferUp built a home grown, self-managed DevOps platform. This platform used a set of manual processes and third-party applications that allows both developers and operations engineers to build and deploy code to a production environment. The DevOps pipeline included topic areas such as source code control, continuous integration/continuous delivery (CI/CD), microservices, as well as development and test Methodologies. The following diagram depicts the previous architecture of OfferUp’s DevOps platform, which was self-managed on Amazon Elastic Compute Cloud (Amazon EC2).
Figure 1: Previous DevOps architecture of OfferUp
OfferUp used GitHub for code repositories. Once the source code was committed in the code repository, Jenkins pulled the source code from code repositories on a scheduled or on-demand basis and built Amazon Machine Images (AMI). The built image was deployed in production by a custom built deployment tool, Vanaheim, which supports one-box canary deployment and full roll-out deployment strategies. The DevOps engineers used to manually create a deployment job in the Vanaheim portal and then manually monitor the test success rate and service metrics to detect any impact from the deployment. Once the success rate was reached, a full production roll out was performed from the Vanaheim portal.
Key challenges with previous DevOps pipeline
In 2020, OfferUp experienced significant transaction volume growth on its Marketplace platform with the increase of its user base. With OfferUp’s acquisition of LetGo in 2020, there was a need to build a scalable DevOps platform to support future integration and organic growth. The previous DevOps platform, designed and deployed over seven years ago, had reached the limits of its scalability, and could no longer keep up with the platform’s growth. The previous architecture was expensive to run and had a complex infrastructure that made it difficult to upgrade and add new features.
The following key factors drove the push for modernization:
Manual verification was required to check if the code was correctly deployed in one of the servers in production, and if the deployment was right in one server, then it was rolled out to other production servers. Full Rollout to production wasn’t automated due to frequent failures requiring manual rollbacks.
The previous platform required a longer deployment time (1–2 hours) due to the authoritative batch process, which sometimes caused delays in releasing and testing of new features.
The self-managed nature of the Jenkins and Vanaheim clusters was consuming far too much engineering time. Most of the institutional knowledge of this legacy platform was lost over the years and it didn’t align with OfferUp’s philosophy of small DevOps engineering teams. Innovation had stalled partly due to the difficulty of simultaneously upgrading the DevOps platform and releasing new features.
DevOps platform automation with Flagger and Gloo Ingress Controller on Amazon EKS
A key requirement for the next-generation system was that the new architecture would reduce the operational burden on engineering teams, deployment lifecycle, and total cost of ownership. OfferUp evaluated multiple managed container orchestration platforms for its DevOps Platform. It finally selected Amazon EKS for high availability, reducing the average time to deploy a change to the stack from hours to just a few minutes and reducing the complexity in managing and upgrading the Kubernetes cluster. On the Amazon EKS platform, OfferUp uses Flagger, a progressive delivery tool that automates the release process for applications running on Kubernetes. Flagger implements several deployment strategies (Canary releases, A/B testing, and Blue/Green mirroring) using the Gloo Edge ingress controller for traffic routing. Datadog is used as an observability service for monitoring the health of the deployments and effectively managing the canary to progressive delivery. For release analysis, Flagger runs a query on Datadog logs and uses Slack for alerting and notifications. The cloud native technology components of the architecture are described as follows:
Kubernetes and Amazon EKS – Kubernetes is an open-source system for automating the deployment, scaling, and management of containerized applications. Kubernetes is a graduate project in the CNCF. Amazon EKS is a fully-managed, certified Kubernetes conformant service that simplifies the process of building, securing, operating, and maintaining Kubernetes clusters on AWS. Amazon EKS integrates with core AWS services, such as Amazon CloudWatch,Auto Scaling Groups, and AWS Identity and Access Management (IAM) to provide a seamless experience for monitoring, scaling, and load balancing your containerized applications.
Helm – Helm manage Kubernetes applications. Helm Charts define, install, and upgrade even the most complex Kubernetes application. Charts are easy to create, version, share, and publish. If Kubernetes were an operating system, then Helm would be the package manager. Helm is a graduate project in the CNCF and is maintained by the Helm community.
Flagger – Flagger is a progressive delivery tool that automates the release process for applications running on Kubernetes. Flagger implements a control loop that gradually shifts traffic to the canary while measuring key performance indicators such as HTTP requests success rate, requests average duration, and pods health. Based on the set thresholds, a canary is either promoted or aborted and its analysis is pushed to a Slack channel. Flagger became a CNCF project – part of the Flux family of GitOps tools.
Gloo Edge – Gloo Edge is a feature-rich, Kubernetes-native ingress controller. Gloo Edge is exceptional in its function-level routing; its support for legacy apps, microservices, and serverless; its discovery capabilities; and its tight integration with leading open-source projects. Gloo Edge is uniquely designed to support hybrid applications, in which multiple technologies, architectures, protocols, and clouds can coexist.
Observability platform – Datadog’s integrations with Kubernetes, Docker, and AWS will let you track the full range of Amazon EKS metrics, as well as logs and performance data from your cluster and applications. Datadog gives you comprehensive coverage of your dynamic infrastructure and applications with features like auto discovery to track services across containers, sophisticated graphing, and alerting options.
Modernized DevOps architecture
In the new architecture, OfferUp uses Github as a version control tool and Github actions as their CI/CD tool. On every Pull request, tests are run, artifacts are built and stored in the JFrog Artifactory, and docker Images are stored in the Amazon Elastic Container Registry (Amazon ECR). Separate deployment pipelines are triggered based on the environment (dev, staging, and production) of choice. Flagger detects any changes in the version of the application and gradually shifts production traffic to the canary. It measures the requests success rate and average response duration metrics from Datadog to decide full rollout in production. For an application deployment, a canary promotion can be defined using Flagger’s custom resource. Flagger rolls back the deployment when the success rate falls below the defined desired success rate metrics.
Figure 2: Modernized DevOps architecture of OfferUp
With the modernized DevOps platform, OfferUp moved from monolithic to microservice architecture where front-end applications and GraphQL runs on the Amazon EKS cluster. The production cluster runs 110 services and 650+ pods on 60 nodes. The cluster scales up to 100 nodes with Amazon Auto Scaling group based on the traffic pattern. On the networking front, the cluster has a private endpoint and uses both VPC CNI plugin, and the CoreDNS add-on. There are four Amazon EKS clusters, one each for the production, test, utility, and the staging environments. OfferUp has a plan to explore Karpenter open-source autoscaling project, and it will move new applications to the Amazon EKS cluster, allowing the total node counts to scale up to 200.
Benefits of modernized architecture
The new architecture helped OfferUp make automated decisions to deploy new releases and improve the time to market while reducing unplanned production downtime
Faster deployments and Quicker rollbacks – The new architecture reduces the Service Deployment time from one hour down to five minutes, and automates rollback time to five minutes from the manual rollback time of one hour.
Automate deployment of new releases – The lack of canary deployment processes in the previous architecture required OfferUp engineers to manually intervene to validate the deployment status, which led to administrative overhead and production outages. The canary deployments take care of the traffic shifting by automatically measuring the requests’ success rate and latency metrics from Datadog and subsequently release the service to production. Deployments are automatically rolled back when the success rate falls below the defined success rate metric thresholds.
Simplified Configuration – Configuration has been simplified drastically and integrated within the CI/CD pipeline in the new architecture, thereby reducing configuration complexity, eliminating manual processes, and saving Developers time.
More time to Focus on Innovation – With fully automated progressive delivery, the developers no longer need to spend time testing and releasing source code in production. Similarly, migrating from a Self-managed DevOps platform to the Managed Amazon EKS services lowered the DevOps platform’s infrastructure management burden on the engineering team. This helps developers spend more time focusing on building and testing new features and innovations.
Cost reduction – Moving from self-managed Amazon EC2-based architecture to the Amazon EKS cluster reduced the cost of operations through shared nodes and improved pod density. The previous architecture was using 200 nodes of Amazon EC2 instances. The same workload was moved to a 50 nodes Amazon EKS cluster. Furthermore, custom applications (Vanaheim and Jenkins) were retired, further reducing the costs.
Conclusion
In this post, you see how OfferUp embarked on the journey to modernize its DevOps platform to support its growth and developers’ velocity. The key factors that drove the modernization decisions were the ability to scale the platform to support the automated testing of features in production, the faster release of new features, cost reduction, and to facilitate future innovation. The modernized DevOps platform on Amazon EKS also decreased the ongoing operational support burden for engineers, and the scalability of the design opens up a lot of headroom for growth.
We encourage you to look into modernizing your existing CI/CD pipeline on Amazon EKS with the Flagger progressive delivery mechanism. Amazon EKS removes the undifferentiated heavy lifting of managing and updating the Kubernetes cluster. Managed node groups automate the provisioning and lifecycle management of worker nodes in an Amazon EKS cluster, which greatly simplifies operational activities, such as new Kubernetes version deployments.
In the next part of the series, you’ll discover how to implement Flagger and Gloo Edge Ingress Controller on Amazon EKS to automate the release process for applications running on Kubernetes.
Further Reading
Journey to adopt Cloud-Native DevOps platform Series #2: Progressive delivery on Amazon EKS with Flagger and Gloo Edge Ingress Controller
This blog is written by Rajesh Kesaraju, Sr. Solution Architect, EC2-Flexible Compute and Peter Manastyrny, Sr. Product Manager, EC2.
Today AWS is adding two new attributes for the attribute-based instance type selection (ABS) feature to make it even easier to create and manage instance type flexible configurations on Amazon EC2. The new network bandwidth attribute allows customers to request instances based on the network requirements of their workload. The new allowed instance types attribute is useful for workloads that have some instance type flexibility but still need more granular control over which instance types to run on.
Before exploring the new attributes in detail, let us review the core ABS capability.
ABS refresher
ABS lets you express your instance type requirements as a set of attributes, such as vCPU, memory, and storage when provisioning EC2 instances with ASG, EC2 Fleet, or Spot Fleet. Your requirements are translated by ABS to all matching EC2 instance types, simplifying the creation and maintenance of instance type flexible configurations. ABS identifies the instance types based on attributes that you set in ASG, EC2 Fleet, or Spot Fleet configurations. When Amazon EC2 releases new instance types, ABS will automatically consider them for provisioning if they match the selected attributes, removing the need to update configurations to include new instance types.
ABS helps you to shift from an infrastructure-first to an application-first paradigm. ABS is ideal for workloads that need generic compute resources and do not necessarily require the hardware differentiation that the Amazon EC2 instance type portfolio delivers. By defining a set of compute attributes instead of specific instance types, you allow ABS to always consider the broadest and newest set of instance types that qualify for your workload. When you use EC2 Spot Instances to optimize your costs and save up to 90% compared to On-Demand prices, instance type diversification is the key to access the highest amount of Spot capacity. ABS provides an easy way to configure and maintain instance type flexible configurations to run fault-tolerant workloads on Spot Instances.
We recommend ABS as the default compute provisioning method for instance type flexible workloads including containerized apps, microservices, web applications, big data, and CI/CD.
Now, let us dive deep on the two new attributes: network bandwidth and allowed instance types.
How network bandwidth attribute for ABS works
Network bandwidth attribute allows customers with network-sensitive workloads to specify their network bandwidth requirements for compute infrastructure. Some of the workloads that depend on network bandwidth include video streaming, networking appliances (e.g., firewalls), and data processing workloads that require faster inter-node communication and high-volume data handling.
The network bandwidth attribute uses the same min/max format as other ABS attributes (e.g., vCPU count or memory) that assume a numeric value or range (e.g., min: ‘10’ or min: ‘15’; max: ‘40’). Note that setting the minimum network bandwidth does not guarantee that your instance will achieve that network bandwidth. ABS will identify instance types that support the specified minimum bandwidth, but the actual bandwidth of your instance might go below the specified minimum at times.
Two important things to remember when using the network bandwidth attribute are:
ABS will only take burst bandwidth values into account when evaluating maximum values. When evaluating minimum values, only the baseline bandwidth will be considered.
For example, if you specify the minimum bandwidth as 10 Gbps, instances that have burst bandwidth of “up to 10 Gbps” will not be considered, as their baseline bandwidth is lower than the minimum requested value (e.g., m5.4xlarge is burstable up to 10 Gbps with a baseline bandwidth of 5 Gbps).
Alternatively, c5n.2xlarge, which is burstable up to 25 Gbps with a baseline bandwidth of 10 Gbps will be considered because its baseline bandwidth meets the minimum requested value.
Our recommendation is to only set a value for maximum network bandwidth if you have specific requirements to restrict instances with higher bandwidth. That would help to ensure that ABS considers the broadest possible set of instance types to choose from.
Using the network bandwidth attribute in ASG
In this example, let us look at a high-performance computing (HPC) workload or similar network bandwidth sensitive workload that requires a high volume of inter-node communications. We use ABS to select instances that have at minimum 10 Gpbs of network bandwidth and at least 32 vCPUs and 64 GiB of memory.
To get started, you can create or update an ASG or EC2 Fleet set up with ABS configuration and specify the network bandwidth attribute.
The following example shows an ABS configuration with network bandwidth attribute set to a minimum of 10 Gbps. In this example, we do not set a maximum limit for network bandwidth. This is done to remain flexible and avoid restricting available instance type choices that meet our minimum network bandwidth requirement.
Create the following configuration file and name it: my_asg_network_bandwidth_configuration.json
As a result, you have created an ASG that may include instance types m5.8xlarge, m5.12xlarge, m5.16xlarge, m5n.8xlarge, and c5.9xlarge, among others. The actual selection at the time of the request is made by capacity optimized Spot allocation strategy. If EC2 releases an instance type in the future that would satisfy the attributes provided in the request, that instance will also be automatically considered for provisioning.
Considered Instances (not an exhaustive list)
Instance Type Network Bandwidth m5.8xlarge “10 Gbps”
m5.12xlarge “12 Gbps”
m5.16xlarge “20 Gbps”
m5n.8xlarge “25 Gbps”
c5.9xlarge “10 Gbps”
c5.12xlarge “12 Gbps”
c5.18xlarge “25 Gbps”
c5n.9xlarge “50 Gbps”
c5n.18xlarge “100 Gbps”
…
Now let us focus our attention on another new attribute – allowed instance types.
How allowed instance types attribute works in ABS
As discussed earlier, ABS lets us provision compute infrastructure based on our application requirements instead of selecting specific EC2 instance types. Although this infrastructure agnostic approach is suitable for many workloads, some workloads, while having some instance type flexibility, still need to limit the selection to specific instance families, and/or generations due to reasons like licensing or compliance requirements, application performance benchmarking, and others. Furthermore, customers have asked us to provide the ability to restrict the auto-consideration of newly released instances types in their ABS configurations to meet their specific hardware qualification requirements before considering them for their workload. To provide this functionality, we added a new allowed instance types attribute to ABS.
The allowed instance types attribute allows ABS customers to narrow down the list of instance types that ABS considers for selection to a specific list of instances, families, or generations. It takes a comma separated list of specific instance types, instance families, and wildcard (*) patterns. Please note, that it does not use the full regular expression syntax.
For example, consider container-based web application that can only run on any 5th generation instances from compute optimized (c), general purpose (m), or memory optimized (r) families. It can be specified as “AllowedInstanceTypes”: [“c5*”, “m5*”,”r5*”].
Another example could be to limit the ABS selection to only memory-optimized instances for big data Spark workloads. It can be specified as “AllowedInstanceTypes”: [“r6*”, “r5*”, “r4*”].
Note that you cannot use both the existing exclude instance types and the new allowed instance types attributes together, because it would lead to a validation error.
Using allowed instance types attribute in ASG
Let us look at the InstanceRequirements section of an ASG configuration file for a sample web application. The AllowedInstanceTypes attribute is configured as [“c5.*”, “m5.*”,”c4.*”, “m4.*”] which means that ABS will limit the instance type consideration set to any instance from 4th and 5th generation of c or m families. Additional attributes are defined to a minimum of 4 vCPUs and 16 GiB RAM and allow both Intel and AMD processors.
Create the following configuration file and name it: my_asg_allow_instance_types_configuration.json
As a result, you have created an ASG that may include instance types like m5.xlarge, m5.2xlarge, c5.xlarge, and c5.2xlarge, among others. The actual selection at the time of the request is made by capacity optimized Spot allocation strategy. Please note that if EC2 will in the future release a new instance type which will satisfy the other attributes provided in the request, but will not be a member of 4th or 5th generation of m or c families specified in the allowed instance types attribute, the instance type will not be considered for provisioning.
Selected Instances (not an exhaustive list)
m5.xlarge
m5.2xlarge
m5.4xlarge
…
c5.xlarge
c5.2xlarge
…
m4.xlarge
m4.2xlarge
m4.4xlarge
…
c4.xlarge
c4.2xlarge
…
As you can see, ABS considers a broad set of instance types for provisioning, however they all meet the compute attributes that are required for your workload.
Cleanup
To delete both ASGs and terminate all the instances, execute the following commands:
In this post, we explored the two new ABS attributes – network bandwidth and allowed instance types. Customers can use these attributes to select instances based on network bandwidth and to limit the set of instances that ABS selects from. The two new attributes, as well as the existing set of ABS attributes enable you to save time on creating and maintaining instance type flexible configurations and make it even easier to express the compute requirements of your workload.
ABS represents the paradigm shift in the way that our customers interact with compute, making it easier than ever to request diversified compute resources at scale. We recommend ABS as a tool to help you identify and access the largest amount of EC2 compute capacity for your instance type flexible workloads.
We often hear from customers about their challenges architecting Jenkins for scale and high availability (HA). Jenkins was originally built as a continuous integration (CI) system to test software before it was committed to a repository. Since its beginning, Jenkins has grown out of necessity versus grand master plan. Developers who extended Jenkins favored speed of creating functionality over performance or scalability of the entire system. This is not to say that it’s impossible to scale Jenkins, it’s only mentioned here to highlight the challenges and technical debt that has accumulated because of the prioritization of features versus developing towards a specific architecture. In this post, we discuss these challenges and our proposed solution.
Challenges with Jenkins at scale and HA
Business and customer demand are forcing organizations to increase the speed and agility at which they release features and functionality. As organizations make this transition, the usage of continuous integration and continuous delivery (CI/CD) increases, which drives the need to scale Jenkins. Overlay this with an organization that commits hundreds of changes per day and works around the clock, with developers dispersed globally, and you end up with an operational situation where there is no room for downtime. To mitigate the risk of impacting an organization’s ability to release when they need it, developers require a system that not only scales but is also highly available.
The ability to scale Jenkins and provide HA comes down to two problems. One is the ability to scale compute to handle additional jobs, and the second is storage. To scale compute, we typically do it in one of two ways, horizontally or vertically. Horizontally means we scale Jenkins to add additional compute nodes. Scaling vertically means we scale Jenkins by adding more resources to the compute node.
Let’s start with the storage problem. Jenkins is designed around the local file system. Anyone who has spent time around Jenkins is aware that logs, cloned repos, plugins, and build artifacts are stored into JENKINS_HOME. Local file systems, while good for single-server designs, tend to be a challenge when HA comes into the picture. In on-premises designs, administrators have often used Network File System (NFS) and Storage Area Networks (SAN) to achieve some scale and resiliency. This type of design comes with a trade-off of performance and doesn’t provide the true HA and inherent disaster recovery (DR) required to meet the demands of the business.
Because of the local file system constraint, there are two native families of storage available in AWS: Amazon Elastic Block Store (Amazon EBS) and Amazon Elastic File System (Amazon EFS). Amazon EBS is great for a single-server design in a single Availability Zone. The challenge is trying to scale a single-server design to support HA. Because of the requirement to assign an EBS volume to a specific Availability Zone, you can’t automatically transition the EBS volume to another Availability Zone and attach it to a Jenkins instance. If you don’t mind having an impact on Recovery Time Objective (RTO) and Recovery Point Objective (RPO), a solution using Amazon EBS snapshots copied to additional Availability Zones might work. Although EBS snapshot copy is possible, it’s not a recommended solution because it doesn’t scale and has complexities in building and maintaining this type of solution.
Amazon EFS as an alternative has worked well for customers that don’t have high usage patterns of Jenkins. All Jenkins instances within the Region can access the Amazon EFS file system and data durably stored in multiple Availability Zones. If a single Availability Zone experiences an outage, the Jenkins file system is still accessible from other Availability Zones providing HA for the storage layer. This solution is not recommended for high-usage systems due to the way that Jenkins reads and writes data. Jenkins’s access pattern is skewed towards writing data such as logs, cloned repos, and building artifacts versus reading data. Amazon EFS, on the other hand, is designed for workloads that read more than they write. On high-usage workloads, customers have experienced Jenkins build slowness and Jenkins page load latency. This is why Amazon EFS isn’t recommended for high-usage Jenkins systems.
Solution for Jenkins at scale and HA
Solving the compute problem is relatively straightforward by using Amazon Elastic Kubernetes Service (Amazon EKS). In the context of Jenkins, an organization would run Jenkins in an Amazon EKS cluster that spans multiple Availability Zones, as shown in the following diagram.
Figure 1 –Jenkins deployment in Amazon EKS with multiple availability zones.
Jenkins Controller and Agent would run in an Availability Zone as a Kubernetes pod. Amazon EKS is designed around Desired State Configuration (DSC), which means that it continuously make sure that the running environment matches the configuration that has been applied to Amazon EKS. In practice, when Amazon EKS is told that you want a single pod of Jenkins running, it monitors and makes sure that pod is always running. If an Availability Zone is unavailable, Amazon EKS launches a new node in another Availability Zone and deploys all pods to meet any necessary constraints defined in Amazon EKS. With this option, we still need to have the data in other Availability Zones, which we cover later in this post.
The only option of scaling Jenkins controllers is vertical. Scaling Jenkins horizontally could lead to an undesirable state because the system wasn’t designed to have multiple instances of Jenkins attached to the same storage layer. There is no exclusive file locking mechanism to ensure data consistency. For organizations that have exhausted the limits with vertical scaling, the recommendation is to run multiple independent Jenkins controllers and separate them per team or group. Vertical scaling of Jenkins is simpler in Amazon EKS. Node sizes and container memory are controlled by configuration. Increasing memory size is as simple as changing a container’s memory setting. Due to the ease of changing configuration, it’s best to start with a lower memory setting, monitor performance, and increase as necessary. You want to find a good balance between price and performance.
For Jenkins agents, there are many options to scale the compute. In the context of scale and HA, the best options are to use AWS CodeBuild, AWS Fargate for Amazon EKS, or Amazon EKS managed node groups. With CodeBuild, you don’t need to provision, manage, or scale your build servers. CodeBuild scales continuously and processes multiple builds concurrently. You can use the Jenkins plugin for CodeBuild to integrate CodeBuild with Jenkins. Fargate is a good option but has some challenges if you’re trying to build container images within a container due to permissions necessary that aren’t exposed in Fargate. For additional information on how to overcome this challenge with Jenkins, refer to How to build container images with Amazon EKS on Fargate.
Now let’s look at the storage layer and see how LINBIT is helping organizations solve this problem with LINSTOR. LINBIT’s LINSTOR is an open-source management tool designed to manage block storage devices. Its primary use case is to provide Linux block storage for Kubernetes and other public and private cloud platforms. LINBIT also provides enterprise subscription for LINSTOR, which include technical support with SLA.
The following diagram illustrates a LINSTOR storage solution running on Amazon EKS using multiple Availability Zones and Amazon Simple Storage Service (Amazon S3) for snapshots.
Figure 2. LINSTOR storage solution running on Amazon EKS using multiple availability zones and S3 for snapshot.
LINSTOR is composed of a control plane and a data plane. The control plane consists of a set of containers deployed into Amazon EKS and is responsible for managing the data plane. The data plane consists of a collection of open-source block storage software, most importantly LINBIT’s Distributed Replicated Storage System (DRBD) software. DRBD is responsible for provisioning and synchronously replicating storage between Amazon EKS worker instances in different Availability Zones.
LINSTOR is deployed via Helm into Amazon EKS, and the LINSTOR cluster is initialized by the LINSTOR Operator. Once deployed, LINSTOR volumes and volume snapshots are managed via Kubernetes Storage Classes and Snapshot Classes in a Kubernetes native fashion. LINSTOR volumes are backed by LINSTOR objects known as storage pools, which are composed of one or more EBS volumes attached to each Amazon EKS worker instance.
LINSTOR volumes layer DRBD on top of the worker’s attached EBS volume to enable synchronous replication between peers in the Amazon EKS cluster. This ensures that you have an identical copy of your persistent volume on the EBS volumes in each Availability Zone. In the event of an Availability Zone outage or planned migration, Amazon EKS moves the Jenkins deployment to another Availability Zone where the persistent volume copy is available. In terms of scaling, LINBIT DRDB supports up to 32 replicas per volume, with a maximum size of 1 PiB per volume. LINSTOR node itself can scale beyond hundreds of nodes, as shown in this case study.
LINSTOR also provides an HA Controller component in its control plane to speed up failover times during outages. LINSTOR’s HA Controller looks for pods with a specific label, and if LINSTOR’s persistent volumes replication network becomes interrupted (like during an Availability Zone outage), LINSTOR reschedules the pod sooner than the default Kubernetes pod-eviction-timeout.
LINBIT provides a detailed full installation for Jenkins HA in AWS. A sample of LINSTOR’s helm values supporting these features is as follows:
To protect against entire AWS Region outages and provide disaster recovery, LINSTOR takes volume snapshots and replicates it cross-Region using Amazon S3. LINSTOR requires read and write access to the target S3 bucket using AWS credentials provided as Kubernetes secrets:
The target S3 bucket is referenced as a snapshot shipping target using a LINSTOR S3 VolumeSnapshotClass. The following example shows a VolumeSnapshotClass referencing the S3 bucket’s secret and additional configuration for the target S3 bucket:
Jenkins deployment persistent volume claim (PVC) is stored as a snapshot in Amazon S3 by using a standard Kubernetes volumeSnapshot definition with LINSTOR’s snapshot class for Amazon S3:
In this post, we explained the challenges to scale Jenkins for HA and DR. We also reviewed Jenkins storage architecture with Amazon EBS and Amazon EFS and where to apply these. We demonstrated how you can use Amazon EKS to scale Jenkins compute for HA and how AWS partner solutions such as LINBIT LINSTOR can help scale Jenkins storage for HA and DR. Combining both solutions can help organizations maintain their ability to deploy software with speed and agility. We hope you found this post useful as you think through building your CI/CD infrastructure in AWS. To learn more about running Jenkins in Amazon EKS, check out Orchestrate Jenkins Workloads using Dynamic Pod Autoscaling with Amazon EKS. To find out more information about LINBIT’s LINSTOR, check the Jenkins technical guide.
This post is written by Carlos Manzanedo Rueda, WW SA Leader for EC2 Spot, and Brandon Wagner, Senior Software Development Engineer for EC2.
This post focuses on how you can leverage recently released tools to optimize your usage of Amazon EC2 Spot Instances on Kubernetes Operations (kOps) clusters. Spot Instances let you utilize unused capacity in the AWS cloud for up to 90% off compared to On-Demand prices, and they are a great fit for fault-tolerant, containerized applications. kOps is an open source project providing a cohesive toolset for provisioning, operating, and deleting Kubernetes clusters in the cloud.
Even with customers such as Snap Inc., Babylon Health, and Fidelity Investments telling us how Amazon Elastic Kubernetes Service (EKS) is essential for running their containerized workloads, we appreciate that there are scenarios where using Amazon EC2 instances and kOps are a viable alternative. At AWS, we understand “one size does not fit all.” While we encourage Kubernetes users to contribute their feedback to the AWS container roadmap so that we can improve our services, we also would like to reduce heavy lifting and simplify Spot best practices integration in kOps clusters.
To simplify the integration of Spot Instances in kOps clusters, in January of 2021 we introduced a new kops toolbox command: kops toolbox instance-selector. The utility is distributed as part of the standard kOps distribution. Moreover, it simplifies the creation of kOps Instance Groups by configuring them with full adherence to Spot Instances best practices.
Handling Spot interruption notifications in Kubernetes
Let’s quickly recap Spot best practices. Spot Instances perform exactly like any other EC2 Instances, except that in exchange for their discounted price, they can be interrupted with a two-minute warning when EC2 must reclaim capacity. Applications running on Spot can typically recover from transient interruptions by simply starting a new instance. Spot best practices involve measures such as diversifying into as many Spot capacity pools as possible, choosing the right Spot allocation strategy, and utilizing Spot integrated services. These handle the Spot Instances lifecycles for you. This blog post on handling Spot interruptions dives deeper into AWS’s EC2 Spot best practices.
The kOps managed addon will let you configure the Node Termination Handler within your kOps cluster spec and, more importantly, manage provisioning the necessary infrastructure for you.
To deploy the AWS Node Termination Handler, we start by editing our cluster spec:
kops edit cluster --name ${KOPS_CLUSTER_NAME}
We append the nodeTerminationHandler configuration to the spec node:
${KOPS_CLUSTER_NAME} refers to the environment variable containing the cluster name, and ${KOPS_STATE_STORE} indicates the Amazon Simple Storage Service (S3) bucket – or kOps State Store – where kOps configuration is stored.
To check that your Node Termination Handler deployment was successful, you can execute:
kops get deployment aws-node-termination-handler -n kube-system
Instance Flexibility and Diversification
Diversification and selection of multiple instances types is essential to acquire and maintain Spot capacity, as well as to successfully replace interrupted instances with others from different pools. When running kOps on AWS, this is implemented by utilizing Amazon EC2 Auto Scaling. Amazon Auto Scaling group’s capacity-optimized allocation strategy ensures that Spot capacity is provisioned from the optimal pools, thereby reducing the chances of Spot terminations.
Simplifying adoption of Spot Best practices on kOps
Before the kops toolbox instance-selector, you would have to setup Spot best practices on kOps manually. This involved writing a stub file following the InstanceGroup specification and examples, and then implementing every best practice, including finding every pool that qualifies for our workload.
The new functionality in kops toolbox instance-selector simplifies InstanceGroup creation by moving the focus of kOps users and administrators from this manual configuration over to simply selecting the vCPUs and Memory requirements for their application (or a base instance type), and then letting kops toolbox instance-selector define the right configuration. Behind the scenes, it utilizes a library allowing it to plug into the feature-set of Amazon EC2 instance selector. At its core, ec2 instance selector helps you select compatible instance types for your application to run on. Utilize ec2 instance selector CLI or library when automating your configurations. In the case of kOps, the integration already comes in the kops toolbox.
For example, let’s say your cluster runs stateless, fault tolerant applications that are CPU/Memory bound and have a ratio of vCPU to Memory requiring at least 1vCPU : 4GB of RAM. You can run the following command in order to acquire cluster spot capacity:
Let’s focus first on the command, and later cover its output. You can get a list of parameters and default values by running: kops toolbox instance-selector –help. A few default parameters weren’t passed in the command above, but they will be set to sane defaults, such as the maximum and minimum number of instances in the Instance Group. The parameter –flexible refers to our request to provide a group of flexible instance types spanning multiple generations.
Once you’ve defined the InstanceGroups, start them up by using the command:
The two commands above define and create a request for spot capacity from a flexible and diversified pool set, which meet the criteria to provide at least 4GB of RAM for each vCPU. The command creates not just one, but two node groups named “spot-group-1” and “spot-group-2” (–ig-count 2).
Now, let’s check the contents of the configuration file generated by kops toolbox instance-selector. To preview a configuration without making changes, add –dry-run –output yaml.
The configuration above lists one of the groups created by kops toolbox instance-selector in the previous example. The second group will have a very similar make-up and format, except that it will refer to instances such as: r3.xlarge, r4.xlarge, r5.xlarge, and r5a.xlarge in the mixedInstancesPolicy section. By defining the parameter –usage-class to Spot, the configuration created by kops toolbox instance-selector will add the tags identifying this Auto Scaling group as a Spot group. When the nodes are initialized, kOps controller will identify the nodes as Spot and add the label node-role.kubernetes.io/spot-worker=true. Therefore, at a later stage, we can apply placement logic to our cluster by using nodeSelector and affinity. The configuration above adheres to the definition of kOps support for mixed Instance Groups in AWS, and adds all of the right cloudLabels in order to integrate and implement not only with Spot best practices, but also with Cluster Autoscaler Auto-Discovery configuration best practices.
Kubernetes Cluster Autoscaler is a Kubernetes controller that dynamically adjusts the cluster size. According to a 2020 survey by Cloud Native Computing Foundation (CNCF), 70% of Kubernetes workloads plan to autoscale their stateless applications. Dynamically scaling applications and clusters is also a great practice for optimizing your system costs in situations where capacity is unnecessary, as well as for scaling out accordingly in order to meet business demands. If there are Pods that can’t be scheduled due to insufficient resources, then Cluster Autoscaler will issue a Scale-out action. When there are nodes in the cluster that have been under-utilized for a configurable period of time, Cluster Autoscaler will Scale-in the cluster, and even down-scale to 0 instances when applications don’t need to be run.
On Scale-out operations, Cluster Autoscaler evaluates a set of node groups. When Cluster Autoscaler runs on AWS, node groups are implemented by using Auto Scaling groups (referring to the same instance group as a kOps Instance Group). Therefore, to calculate the number of nodes to scale-out, Cluster Autoscaler assumes that every instance in a node group has the same number of vCPUs and memory size.
By creating two node groups, you apply two diversification levels. You diversify within each node group by using an Auto Scaling group with Mixed Instance Policies and capacity-optimized allocation strategy. Then, to increase the pool range you can leverage, you add more than one node group, while still adhering to the best practices required by Cluster Autoscaler.
While we’ve been focusing on Spot Instances, the parameter –usage-class can be utilized to get OnDemand instances instead of Spot. In the next example, let’s say we would like to get On-Demand capacity in order to train complex deep learning models that will take hours to run. To train our models, we need instances that have at least one GPU with 16GB of RAM on instances that have at least 32GB Ram and 8 vCPUs.
The command above, followed by kops update cluster –state=${KOPS_STATE_STORE} –name=${KOPS_CLUSTER_NAME} –yes can be utilized to produce a configuration and create a nodegroup with the right requirements. This could be created at the start of the training procedure, and then – once the training is done and the capacity is no longer needed – you could automate the nodegroup removal with the following command:
We believe the best way to run Kubernetes on AWS is by using Amazon EKS. However, scenarios may exist where kOps is utilized in AWS. By using the kOps managed add-on to install aws-node-termination-handler and kops toolbox instance-selector, it is easier than ever to apply Spot best practices to Kubernetes workloads on kOps, and cost-optimize fault-tolerant, stateless applications. These tools let kOps workloads gracefully terminate applications, as well as proactively handle the replacement of instances that are at an elevated risk of termination. kops toolbox instance-selector leverages Amazon ec2-instance-selector in order to simplify the creation of Instance Group configurations adhering to Spot Instances best practices, implementing instance type flexibility, and utilizing capacity-optimized allocation strategy.
By adhering to these best practices to reduce the frequency of Spot interruptions, we will optimize not only the cost, but also our Spot Instances selection. This will enable us to acquire capacity at a massive scale if necessary.
To start using the tools we have described, follow along this step-by-step tutorial. Also, head over to the kops toolbox documentation to learn more about the ways in which you can use it.
Customers want a single and comprehensive view of the security posture of their workloads. Runtime security event monitoring is important to building secure, operationally excellent, and reliable workloads, especially in environments that run containers and container orchestration platforms. In this blog post, we show you how to use services such as AWS Security Hub and Falco, a Cloud Native Computing Foundation project, to build a continuous runtime security monitoring solution.
With the solution in place, you can collect runtime security findings from multiple AWS accounts running one or more workloads on AWS container orchestration platforms, such as Amazon Elastic Kubernetes Service (Amazon EKS) or Amazon Elastic Container Service (Amazon ECS). The solution collates the findings across those accounts into a designated account where you can view the security posture across accounts and workloads.
Solution overview
Security Hub collects security findings from other AWS services using a standardized AWS Security Findings Format (ASFF). Falco provides the ability to detect security events at runtime for containers. Partner integrations like Falco are also available on Security Hub and use ASFF. Security Hub provides a custom integrations feature using ASFF to enable collection and aggregation of findings that are generated by custom security products.
Figure 1: Architecture diagram of continuous runtime security monitoring
Here’s how the solution works, as shown in Figure 1:
An AWS account is running a workload on Amazon EKS.
Runtime security events detected by Falco for that workload are sent to CloudWatch logs using AWS FireLens.
CloudWatch logs act as the source for FireLens and a trigger for the Lambda function in the next step.
The Lambda function transforms the logs into the ASFF. These findings can now be imported into Security Hub.
The Security Hub instance that is running in the same account as the workload running on Amazon EKS stores and processes the findings provided by Lambda and provides the security posture to users of the account. This instance also acts as a member account for Security Hub.
Another AWS account is running a workload on Amazon ECS.
Runtime security events detected by Falco for that workload are sent to CloudWatch logs using AWS FireLens.
CloudWatch logs acts as the source for FireLens and a trigger for the Lambda function in the next step.
The Lambda function transforms the logs into the ASFF. These findings can now be imported into Security Hub.
The Security Hub instance that is running in the same account as the workload running on Amazon ECS stores and processes the findings provided by Lambda and provides the security posture to users of the account. This instance also acts as another member account for Security Hub.
The designated Security Hub administrator account combines the findings generated by the two member accounts, and then provides a comprehensive view of security alerts and security posture across AWS accounts. If your workloads span multiple regions, Security Hub supports aggregating findings across Regions.
Prerequisites
For this walkthrough, you should have the following in place:
Three AWS accounts.
Note: We recommend three accounts so you can experience Security Hub’s support for a multi-account setup. However, you can use a single AWS account instead to host the Amazon ECS and Amazon EKS workloads, and send findings to Security Hub in the same account. If you are using a single account, skip the following account specific-guidance. If you are integrated with AWS Organizations, the designated Security Hub administrator account will automatically have access to the member accounts.
Security Hub set up with an administrator account on one account.
Security Hub set up with member accounts on two accounts: one account to host the Amazon EKS workload, and one account to host the Amazon ECS workload.
Falco set up on the Amazon EKS and Amazon ECS clusters, with logs routed to CloudWatch Logs using FireLens. For instructions on how to do this, see:
Important: Take note of the names of the CloudWatch Logs groups, as you will need them in the next section.
AWS Cloud Development Kit (CDK) installed on the member accounts to deploy the solution that provides the custom integration between Falco and Security Hub.
Deploying the solution
In this section, you will learn how to deploy the solution and enable the CloudWatch Logs group. Enabling the CloudWatch Logs group is the trigger for running the Lambda function in both member accounts.
To deploy this solution in your own account
Clone the aws-securityhub-falco-ecs-eks-integration GitHub repository by running the following command. $git clone https://github.com/aws-samples/aws-securityhub-falco-ecs-eks-integration
Follow the instructions in the README file provided on GitHub to build and deploy the solution. Make sure that you deploy the solution to the accounts hosting the Amazon EKS and Amazon ECS clusters.
Navigate to the AWS Lambda console and confirm that you see the newly created Lambda function. You will use this function in the next section.
Figure 2: Lambda function for Falco integration with Security Hub
To enable the CloudWatch Logs group
In the AWS Management Console, select the Lambda function shown in Figure 2—AwsSecurityhubFalcoEcsEksln-lambdafunction—and then, on the Function overview screen, select + Add trigger.
On the Add trigger screen, provide the following information and then select Add, as shown in Figure 3.
Trigger configuration – From the drop-down, select CloudWatch logs.
Log group – Choose the Log group you noted in Step 4 of the Prerequisites. In our setup, the log group for the Amazon ECS and Amazon EKS clusters, deployed in separate AWS accounts, was set with the same value (falco).
Filter name – Provide a name for the filter. In our example, we used the name falco.
Filter pattern – optional – Leave this field blank.
Figure 3: Lambda function trigger – CloudWatch Log group
Repeat these steps (as applicable) to set up the trigger for the Lambda function deployed in other accounts.
Testing the deployment
Now that you’ve deployed the solution, you will verify that it’s working.
With the default rules, Falco generates alerts for activities such as:
An attempt to write to a file below the /etc folder. The /etc folder contains important system configuration files.
An attempt to open a sensitive file (such as /etc/shadow) for reading.
To test your deployment, you will attempt to perform these activities to generate Falco alerts that are reported as Security Hub findings in the same account. Then you will review the findings.
To test the deployment in member account 1
Run the following commands to trigger an alert in member account 1, which is running an Amazon EKS cluster. Replace <container_name> with your own value. kubectl exec -it <container_name> /bin/bash touch /etc/5 cat /etc/shadow > /dev/null
To see the list of findings, log in to your Security Hub admin account and navigate to Security Hub > Findings. As shown in Figure 4, you will see the alerts generated by Falco, including the Falco-generated title, and the instance where the alert was triggered.
Figure 4: Findings in Security Hub
To see more detail about a finding, check the box next to the finding. Figure 5 shows some of the details for the finding Read sensitive file untrusted.
Figure 6 shows the Resources section of this finding, that includes the instance ID of the Amazon EKS cluster node. In our example this is the Amazon Elastic Compute Cloud (Amazon EC2) instance.
To test the deployment in member account 2
Run the following commands to trigger a Falco alert in member account 2, which is running an Amazon ECS cluster. Replace <<container_id> with your own value. docker exec -it <container_id> bash touch /etc/5 cat /etc/shadow > /dev/null
As in the preceding example with member account 1, to view the findings related to this alert, navigate to your Security Hub admin account and select Findings.
To view the collated findings from both member accounts in Security Hub
In the designated Security Hub administrator account, navigate to Security Hub> Findings. The findings from both member accounts are collated in the designated Security Hub administrator account. You can use this centralized account to view the security posture across accounts and workloads. Figure 7 shows two findings, one from each member account, viewable in the Single Pane of Glass administrator account.
Figure 7: Write below /etc findings in a single view
To see more information and a link to the corresponding member account where the finding was generated, check the box next to the finding. Figure 8 shows the account detail associated with a specific finding in member account 1.
Figure 8: Write under /etc detail view in Security Hub admin account
By centralizing and enriching the findings from Falco, you can take action more quickly or perform automated remediation on the impacted resources.
Delete the Amazon EKS and Amazon ECS clusters created as part of the Prerequisites.
Conclusion
In this post, you learned how to achieve multi-account continuous runtime security monitoring for container-based workloads running on Amazon EKS and Amazon ECS. This is achieved by creating a custom integration between Falco and Security Hub.
You can extend this solution in a number of ways. For example:
You can forward findings across accounts using a single source to security information and event management (SIEM) tools such as Splunk.
You can perform automated remediation activities based on the findings generated, using Lambda.
This post is written by Brad Kirby, Principal Outposts Specialist, and Chris Lunsford, Senior Outposts SA.
Customers are modernizing applications by deconstructing monolithic architectures and migrating application components into container–based, service-oriented, and microservices architectures. Modern applications improve scalability, reliability, and development efficiency by allowing services to be owned by smaller, more focused teams.
This post shows how you can combine Amazon Elastic Kubernetes Service (Amazon EKS) with AWS Outposts to deploy managed Kubernetes application environments on-premises alongside your existing data and applications.
For a brief introduction to the subject matter, the watch this video, which demonstrates:
The benefits of application modernization
How containers are an ideal enabling technology for microservices architectures
How AWS Outposts combined with Amazon container services enables you to unwind complex service interdependencies and modernize on-premises applications with low latency, local data processing, and data residency requirements
Understanding the Amazon EKS on AWS Outposts architecture
Amazon EKS
Many organizations chose Kubernetes as their container orchestration platform because of its openness, flexibility, and a growing pool of Kubernetes literate IT professionals. Amazon EKS enables you to run Kubernetes clusters on AWS without needing to install and manage the Kubernetes control plane. The control plane, including the API servers, scheduler, and cluster store services, runs within a managed environment in the AWS Region. Kubernetes clients (like kubectl) and cluster worker nodes communicate with the managed control plane via public and private EKS service endpoints.
AWS Outposts
The AWS Outposts service delivers AWS infrastructure and services to on-premises locations from the AWS Global Cloud Infrastructure. An Outpost functions as an extension of the Availability Zone (AZ) where it is anchored. AWS operates, monitors, and manages AWS Outposts infrastructure as part of its parent Region. Each Outpost connects back to its anchor AZ via a Service Link connection (a set of encrypted VPN tunnels). AWS Outposts extend Virtual Private Cloud (VPC) environments from the Region to on-premises locations and enables you to deploy VPC subnets to Outposts in your data center and co-location spaces. The Outposts Local Gateway (LGW) routes traffic between Outpost VPC subnets and the on-premises network.
Amazon EKS on AWS Outposts
You deploy Amazon EKS worker nodes to Outposts using self-managed node groups. The worker nodes run on Outposts and register with the Kubernetes control plane in the AWS Region. The worker nodes, and containers running on the nodes, can communicate with AWS services and resources running on the Outpost and in the region (via the Service Link) and with on-premises networks (via the Local Gateway).
You use the same AWS and Kubernetes tools and APIs to work with EKS on Outposts nodes that you use to work with EKS nodes in the Region. You can use eksctl, the AWS Management Console, AWS CLI, or infrastructure as code (IaC) tools like AWS CloudFormation or HashiCorp Terraform to create self-managed node groups on AWS Outposts.
Amazon EKS self-managed node groups on AWS Outposts
Like many customers, you might use managed node groups when you deploy EKS worker nodes in your Region, and you may be wondering, “what are self-managed node groups?”
Self-managed node groups, like managed node groups, use standard Amazon Elastic Compute Cloud (Amazon EC2) instances in EC2 Auto Scaling groups to deploy, scale-up, and scale-down EKS worker nodes using Amazon EKS optimized Amazon Machine Images (AMIs). Amazon configures the EKS optimized AMIs to work with the EKS service. The images include Docker, kubelet, and the AWS IAM Authenticator. The AMIs also contain a specialized bootstrap script /etc/eks/bootstrap.sh that allows worker nodes to discover and connect to your cluster control plane and add Kubernetes labels that identify the nodes in the cluster.
What makes the node groups self-managed? Managed node groups have additional features that simplify updating nodes in the node group. With self-managed nodes, you must implement a process to update or replace your node group when you want to update the nodes to use a new Amazon EKS optimized AMI.
You create self-managed node groups on AWS Outposts using the same process and resources that you use to deploy EC2 instances using EC2 Auto Scaling groups. All instances in a self-managed node group must:
Be tagged with the io/cluster/<cluster-name>=owned tag
Additionally, to deploy on AWS Outposts, instances must:
Use encrypted EBS volumes
Launch in Outposts subnets
Kubernetes authenticates all API requests to a cluster. You must configure an EKS cluster to allow nodes from a self-managed node group to join the cluster. Self-managed nodes use the node IAM role to authenticate with an EKS cluster. Amazon EKS clusters use the AWS IAM Authenticator for Kubernetes to authenticate requests and Kubernetes native Role Based Access Control (RBAC) to authorize requests. To enable self-managed nodes to register with a cluster, configure the AWS IAM Authenticator to recognize the node IAM role and assign the role to the system:bootstrappers and system:nodes RBAC groups.
In the following tutorial, we take you through the steps required to deploy EKS worker nodes on an Outpost and register those nodes with an Amazon EKS cluster running in the Region. We created a sample Terraform module aws-eks-self-managed-node-group to help you get started quickly. If you are interested, you can dive into the module sample code to see the detailed configurations for self-managed node groups.
Deploying Amazon EKS on AWS Outposts (Terraform)
To deploy Amazon EKS nodes on an AWS Outposts deployment, you must complete two high-level steps:
Step 1: Create a self-managed node group
Step 2: Configure Kubernetes to allow the nodes to register
We use Terraform in this tutorial to provide visibility (through the sample code) into the details of the configurations required to deploy self-managed node groups on AWS Outposts.
Prerequisites
To follow along with this tutorial, you should have the following prerequisites:
An AWS account.
An operational AWS Outposts deployment (Outpost) associated with your AWS account.
Familiarity with Terraform HashiCorp Configuration Language (HCL) syntax and experience using Terraform to deploy AWS resources.
An existing VPC that meets the requirements for an Amazon EKS cluster. For more information, see Cluster VPC considerations. You can use the Getting started with Amazon EKS guide to walk you through creating a VPC that meets the requirements.
An existing Amazon EKS cluster. You can use the Creating an Amazon EKS cluster guide to walk you through creating the cluster.
Tip: We recommend creating and using a new VPC and Amazon EKS cluster to complete this tutorial. Procedures like modifying the aws-auth ConfigMap on the cluster may impact other nodes, users, and workloads on the cluster. Using a new VPC and Amazon EKS cluster will help minimize the risk of impacting other applications as you complete the tutorial.
Note: Do not reference subnets deployed on AWS Outposts when creating Amazon EKS clusters in the Region. The Amazon EKS cluster control plane runs in the Region and attaches to VPC subnets in the Region availability zones.
A symmetric KMS key to encrypt the EBS volumes of the EKS worker nodes. You can use the alias/aws/ebs AWS managed key for this prerequisite.
Using the sample code
The source code for the amazon-eks-self-managed-node-group Terraform module is available in AWS-Samples on GitHub.
Setup
To follow along with this tutorial, complete the following steps to setup your workstation:
Open your terminal.
Make a new directory to hold your EKS on Outposts Terraform configurations.
Change to the new directory.
Create a new file named providers.tf with the following contents:
Keep your terminal open and do all the work in this tutorial from this directory.
Step 1: Create a self-managed node group
To create a self-managed node group on your Outpost
Create a new Terraform configuration file named self-managed-node-group.tf.
Configure the aws Terraform provider with your AWS CLI profile and Outpost parent Region:
provider "aws" {
  region  = "us-west-2"
  profile = "default"
}
Configure the aws-eks-self-managed-node-group module with the following (minimum) arguments:
eks_cluster_name the name of your EKS cluster
instance_type an instance type supported on your AWS Outposts deployment
desired_capacity, min_size, and max_size as desired to control the number of nodes in your node group (ensure that your Outpost has sufficient resources available to run the desired number nodes of the specified instance type)
subnets the subnet IDs of the Outpost subnets where you want the nodes deployed
(Optional) Kubernetes node_labels to apply to the nodes
Allowebs_encrypted and configure the ebs_kms_key_arn with KMS key you want to use to encrypt the nodes’ EBS volumes (required for Outposts deployments)
You may configure other optional arguments as appropriate for your use case – see the module README for details.
Step 2: Configure Kubernetes to allow the nodes to register
Use the following procedures to configure Terraform to manage the AWS IAM Authenticator (aws-auth) ConfigMap on the cluster. This adds the node-group IAM role to the IAM authenticator and Kubernetes RBAC groups.
Note: If you add a node group to a cluster with existing node groups, mapped IAM roles, or mapped IAM users, the aws-auth ConfigMap may already be configured on your cluster. If the ConfigMap exists, you must download, edit, and replace the ConfigMap on the cluster using kubectl. We do not provide a procedure for this operation as it may affect workloads running on your cluster. Please see the section Managing users or IAM roles for your cluster in the Amazon EKS User Guide for more information.
To check if your cluster has the aws-auth ConfigMap configured
Run the aws eks --region <region> update-kubeconfig --name <cluster-name> command to update your workstation’s ~/.kube/config with the information needed to connect to your cluster, substituting your <region> and <cluster-name>.
Run the kubectl describe configmap -n kube-system aws-auth
If you receive an error stating, Error from server (NotFound): configmaps "aws-auth" not found, then proceed with the following procedures to use Terraform to apply the ConfigMap.
❯ kubectl describe configmap -n kube-system aws-auth
Error from server (NotFound): configmaps "aws-auth" not found
If you do not receive the preceding error, and kubectl returns an aws-auth ConfigMap, then you should not use Terraform to manage the ConfigMap.
To configure the Terraform Kubernetes provider
Create a new Terraform configuration file named aws-auth-config-map.tf.
Add the aws_eks_cluster Terraform data source, and configure it to look up your cluster by name.
data "aws_eks_cluster" "selected" {
  name = "cmluns-eks-cluster"
}
Add the aws_eks_cluster_auth Terraform data source, and configure it to look up your cluster by name.
data "aws_eks_cluster_auth" "selected" {
  name = "cmluns-eks-cluster"
}
Configure the kubernetes provider with your cluster host (endpoint address), cluster_ca_certificate, and the token from the aws_eks_cluster and aws_eks_cluster_auth data sources.
Apply the configuration and verify node registration
You have created the Terraform configurations to deploy an EKS self-managed node group to your Outpost and configure Kubernetes to authenticate the nodes. Now you apply the configurations and verify that the nodes register with your Kubernetes cluster.
To apply the Terraform configurations
Run the terraform init command to download the providers, self-managed node group module, and prepare the directory for use.
Run the terraform apply
Review the resources that will be created.
Enter yes to confirm that you want to create the resources.
❯ terraform apply

Terraform used the selected providers to generate the following execution plan. Resource actions are indicated with the following symbols:
  + create

Terraform will perform the following actions:

<-- Output omitted for brevity -->

Plan: 9 to add, 0 to change, 0 to destroy.

Do you want to perform these actions?
  Terraform will perform the actions described above.
  Only 'yes' will be accepted to approve.

  Enter a value: yes
Run the aws eks --region <region> update-kubeconfig --name <cluster-name> command to update your workstation’s ~/.kube/config with the information required to connect to your cluster – substituting your <region> and <cluster-name>.
Run the kubectl get nodes command to view the status of your cluster nodes.
Verify your new nodes show up in the list with a STATUS of Ready.
❯ kubectl get nodes
NAME                                          STATUS   ROLES    AGE   VERSION
ip-10-253-46-119.us-west-2.compute.internal   Ready    <none>   37s   v1.18.9-eks-d1db3c
(Optional) If your nodes are registering, and their STATUS does not show Ready, run the kubectl get nodes --watch command to watch them come online.
(Optional) Run the kubectl get nodes --show-labels command to view the node list with the labels assigned to each node. The nodes created by your AWS Outposts node group will have the labels you assigned in Step 1.
To verify the Kubernetes system pods deploy on the worker nodes
Run the kubectl get pods --namespace kube-system
Verify that each pod shows READY 1/1 with a STATUS of Running.
❯ kubectl get pods --namespace kube-system
NAME                       READY   STATUS    RESTARTS   AGE
aws-node-84xlc             1/1     Running   0          2m16s
coredns-559b5db75d-jxqbp   1/1     Running   0          5m36s
coredns-559b5db75d-vdccc   1/1     Running   0          5m36s
kube-proxy-fspw4           1/1     Running   0          2m16s
The nodes in your AWS Outposts node group should be registered with the EKS control plane in the Region and the Kubernetes system pods should successfully deploy on the new nodes.
Clean up
One of the nice things about using infrastructure as code tools like Terraform is that they automate stack creation and deletion. Use the following procedure to remove the resources you created in this tutorial.
To clean up the resources created in this tutorial
Run the terraform destroy
Review the resources that will be destroyed.
Enter yes to confirm that you want to destroy the resources.
❯ terraform destroy

An execution plan has been generated and is shown below.
Resource actions are indicated with the following symbols:
  - destroy

Terraform will perform the following actions:

Plan: 0 to add, 0 to change, 9 to destroy.

Do you really want to destroy all resources?
  Terraform will destroy all your managed infrastructure, as shown above.
  There is no undo. Only 'yes' will be accepted to confirm.

  Enter a value: yes
Press Enter.
Destroy complete! Resources: 9 destroyed.
Clean up any resources you created for the prerequisites.
Conclusion
In this post, we discussed how containers sit at the heart of the application modernization process, making it easy to adopt microservices architectures that improve application scalability, availability, and performance. We also outlined the challenges associated with modernizing on-premises applications with low latency, local data processing, and data residency requirements. In these cases, AWS Outposts brings cloud services, like Amazon EKS, close to the workloads being refactored. We also walked you through deploying Amazon EKS worker nodes on-premises on AWS Outposts.
Now that you have deployed Amazon EKS worker nodes on in a test VPC using Terraform, you should adapt the Terraform module(s) and resources to prepare and deploy your production Kubernetes clusters on-premises on Outposts. If you don’t have an Outpost and you want to get started modernizing your on-premises applications with Amazon EKS and AWS Outposts, contact your local AWS account Solutions Architect (SA) to help you get started.
I’m pleased to announce that the Defense Information Systems Agency (DISA) has authorized 17 additional Amazon Web Services (AWS) services and features in the AWS GovCloud (US) Regions, bringing the total to 105 services and major features that are authorized for use by the U.S. Department of Defense (DoD). AWS now offers additional services to DoD mission owners in these categories: business applications; computing; containers; cost management; developer tools; management and governance; media services; security, identity, and compliance; and storage.
Why does authorization matter?
DISA authorization of 17 new cloud services enables mission owners to build secure innovative solutions to include systems that process unclassified national security data (for example, Impact Level 5). DISA’s authorization demonstrates that AWS effectively implemented more than 421 security controls by using applicable criteria from NIST SP 800-53 Revision 4, the US General Services Administration’s FedRAMP High baseline, and the DoD Cloud Computing Security Requirements Guide.
Recently authorized AWS services at DoD Impact Levels (IL) 4 and 5 include the following:
AWS Marketplace – A digital catalog with thousands of software listings from independent software vendors that you can use to find, test, buy, and deploy software that runs on AWS
Amazon Textract – Extract printed text, handwriting, and data from virtually any document
Security, Identity & Compliance
Amazon Cognito – Secure user sign-up, sign-in, and access control
AWS Security Hub – Centrally view and manage security alerts and automate security checks
Storage
AWS Backup – Centrally manage and automate backups across AWS services
Figure 1 shows the IL 4 and IL 5 AWS services that are now authorized for DoD workloads, broken out into functional categories.
Figure 1: The AWS services newly authorized by DISA
To learn more about AWS solutions for the DoD, see our AWS solution offerings. Follow the AWS Security Blog for updates on our Services in Scope by Compliance Program. If you have feedback about this blog post, let us know in the Comments section below.
Want more AWS Security how-to content, news, and feature announcements? Follow us on Twitter.
This blog post will demonstrate how to leverage Jenkins with Amazon Elastic Kubernetes Service (EKS) by running a Jenkins Manager within an EKS pod. In doing so, we can run Jenkins workloads by allowing Amazon EKS to spawn dynamic Jenkins Agent(s) in order to perform application and infrastructure deployment. Traditionally, customers will setup a Jenkins Manager-Agent architecture that contains a set of manually added nodes with no autoscaling capabilities. Implementing this strategy will ensure that a robust approach optimizes the performance with the right-sized compute capacity and work needed to successfully perform the build tasks.
In setting up our Amazon EKS cluster with Jenkins, we’ll utilize the eksctl simple CLI tool for creating clusters on EKS. Then, we’ll build both the Jenkins Manager and Jenkins Agent image. Afterward, we’ll run a container deployment on our cluster to access the Jenkins application and utilize the dynamic Jenkins Agent pods to run pipelines and jobs.
Solution Overview
The architecture below illustrates the execution steps.
Figure 1. Solution overview diagram
Disclaimer(s):(Note: This Jenkins application is not configured with a persistent volume storage. Therefore, you must establish and configure this template to fit that requirement).
To accomplish this deployment workflow, we will do the following:
Centralized Shared Services account
Deploy the Amazon EKS Cluster into a Centralized Shared Services Account.
Create the Amazon ECR Repository for the Jenkins Manager and Jenkins Agent to store docker images.
Deploy the kubernetes manifest file for the Jenkins Manager.
Target Account(s)
Establish a set of AWS Identity and Access Management (IAM) roles with permissions for cross-across access from the Share Services account into the Target account(s).
Jenkins Application UI
Jenkins Plugins – Install and configure the Kubernetes Plugin and CloudBees AWS Credentials Plugin from Manage Plugins (you will not have to manually install this since it will be packaged and installed as part of the Jenkins image build).
Jenkins Pipeline Example—Fetch the Jenkinsfile to deploy an S3 Bucket with CloudFormation in the Target account using a Jenkins parameterized pipeline.
Prerequisites
The following is the minimum requirements for ensuring this solution will work.
Account Prerequisites
Shared Services Account: The location of the Amazon EKS Cluster.
Target Account: The destination of the CI/CD pipeline deployments.
This blog provides a high-level overview of the best practices for cross-account deployment and isolation maintenance between the applications. We evaluated the cross-account application deployment permissions and will describe the current state as well as what to avoid. As part of the security best practices, we will maintain isolation among multiple apps deployed in these environments, e.g., Pipeline 1 does not deploy to the Pipeline 2 infrastructure.
Requirement
A Jenkins manager is running as a container in an EC2 compute instance that resides within a Shared AWS account. This Jenkins application represents individual pipelines deploying unique microservices that build and deploy to multiple environments in separate AWS accounts. The cross-account deployment utilizes the target AWS account admin credentials in order to do the deployment.
This methodology means that it is not good practice to share the account credentials externally. Additionally, the deployment errors risk should be eliminated and application isolation should be maintained within the same account.
Note that the deployment steps are being run using AWS CLIs, thus our solution will be focused on AWS CLI usage.
The risk is much lower when utilizing CloudFormation / CDK to conduct deployments because the AWS CLIs executed from the build jobs will specify stack names as parametrized inputs and the very low probability of stack-name error. However, it remains inadvisable to utilize admin credentials of the target account.
Best Practice — Current Approach
We utilized cross-account roles that can restrict unauthorized access across build jobs. Behind this approach, we will utilize the assume-role concept that will enable the requesting role to obtain temporary credentials (from the STS service) of the target role and execute actions permitted by the target role. This is safer than utilizing hard-coded credentials. The requesting role could be either the inherited EC2 instance role OR specific user credentials. However, in our case, we are utilizing the inherited EC2 instance role.
For ease of understanding, we will refer the target-role as execution-role below.
Figure 2. Current approach
As per the security best practice of assigning minimum privileges, we must first create execution role in IAM in the target account that has deployment permissions (either via CloudFormation OR via CLI’s), e.g., app-dev-role in Dev account and app-prod-role in Prod account.
For each of those roles, we configure a trust relationship with the parent account ID (Shared Services account). This enables any roles in the Shared Services account (with assume-role permission) to assume the execution-role and deploy it on respective hosting infrastructure, e.g., the app-dev-role in Dev account will be a common execution role that will deploy various apps across infrastructure.
Then, we create a local role in the Shared Services account and configure credentials within Jenkins to be utilized by the Build Jobs. Provide the job with the assume-role permissions and specify the list of ARNs across every account. Alternatively, the inherited EC2 instance role can also be utilized to assume the execution-role.
Create Cross-Account IAM Roles
Cross-account IAM roles allow users to securely access AWS resources in a target account while maintaining the observability of that AWS account. The cross-account IAM role includes a trust policy allowing AWS identities in another AWS account to assume the given role. This allows us to create a role in one AWS account that delegates specific permissions to another AWS account.
Create an IAM role with a common name in each target account. The role name we’ve created is AWSCloudFormationStackExecutionRole. The role must have permissions to perform CloudFormation actions and any actions regarding the resources that will be created. In our case, we will be creating an S3 Bucket utilizing CloudFormation.
This IAM role must also have an established trust relationship to the Shared Services account. In this case, the Jenkins Agent will be granted the ability to assume the role of the particular target account from the Shared Services account.
In our case, the IAM entity that will assume the AWSCloudFormationStackExecutionRole is the EKS Node Instance Role that associated with the EKS Cluster Nodes.
Build the custom docker images for the Jenkins Manager and the Jenkins Agent, and then push the images to AWS ECR Repository. Navigate to the docker/ directory, then execute the command according to the required parameters with the AWS account ID, repository name, region, and the build folder name jenkins-manager/ or jenkins-agent/ that resides in the current docker directory. The custom docker images will contain a set of starter package installations.
After building both images, navigate to the k8s/ directory, modify the manifest file for the Jenkins image, and then execute the Jenkins manifest.yaml template to setup the Jenkins application. (Note: This Jenkins application is not configured with a persistent volume storage. Therefore, you will need to establish and configure this template to fit that requirement).
# Fetch the Application URL or navigate to the AWS Console for the Load Balancer
kubectl get svc -n jenkins

# Verify that jenkins deployment/pods are up running
kubectl get pods -n jenkins

# Replace with jenkins manager pod name and fetch Jenkins login password
kubectl exec -it pod/<JENKINS-MANAGER-POD-NAME> -n jenkins -- cat /var/jenkins_home/secrets/initialAdminPassword
Click: Add a new cloud → select Kubernetes from the drop menus
Figure 4a. Jenkins Configure Nodes and Clouds
Note: Before proceeding, please ensure that you can access your Amazon EKS cluster information, whether it is through Console or CLI.
Enter a Name in the Kubernetes Cloud configuration field.
Enter the Kubernetes URL which can be found via AWS Console by navigating to the Amazon EKS service and locating the API server endpoint of the cluster, or run the command kubectl cluster-info.
Enter the namespace that will be utilized in the Kubernetes Namespace field. This will determine where the dynamic kubernetes pods will spawn. In our case, the name of the namespace is jenkins.
During the initial setup of Jenkins Manager on kubernetes, there is an environment variable JENKINS_URL that automatically utilizes the Load Balancer URL to resolve requests. However, we will resolve our requests locally to the cluster IP address.
The format is as follows: https://<service-name>.<namespace>.svc.cluster.local
Figure 4b. Configure Kubernetes Cloud
Set AWS Credentials
Security concerns are a key reason why we’re utilizing an IAM role instead of access keys. For any given approach involving IAM, it is the best practice to utilize temporary credentials.
You must have the AWS Credentials Binding Plugin installed before this step. Enter the unique ID name as shown in the example below.
Enter the IAM Role ARN you created earlier for both the ID and IAM Role to use in the field as shown below.
Figure 5. AWS Credentials Binding
Figure 6. Managed Credentials
Create a pipeline
Navigate to the Jenkins main menu and select new item
Create a Pipeline
Figure 7. Create a pipeline
Configure Jenkins Agent
Setup a Kubernetes YAML template after you’ve built the agent image. In this example, we will be using the k8sPodTemplate.yaml file stored in the k8s/ folder.
This deploy-stack.sh file can accept four different parameters and conduct several types of CloudFormation stack executions such as deploy, create-changeset, and execute-changeset. This is also reflected in the stages of this Jenkinsfile pipeline. As for the delete-stack.sh file, two parameters are accepted, and, when executed, it will delete a CloudFormation stack based on the given stack name and region.
In this Jenkinsfile, the individual pipeline build jobs will deploy individual microservices. The k8sPodTemplate.yaml is utilized to specify the kubernetes pod details and the inbound-agent that will be utilized to run the pipeline.
Click Build with Parameters and then select a build action.
Figure 8a. Build with Parameters
Examine the pipeline stages even further for the choice you selected. Also, view more details of the stages below and verify in your AWS account that the CloudFormation stack was executed.
Figure 8b. Pipeline Stage View
The Final Step is to execute your pipeline and watch the pods spin up dynamically in your terminal. As is shown below, the Jenkins agent pod spawned and then terminated after the work completed. Watch this task on your own by executing the following command:
# Watch the pods spawn in the "jenkins" namespace
kubectl get pods -n jenkins -w
In order to avoid incurring future charges, delete the resources utilized in the walkthrough.
Delete the EKS cluster. You can utilize the eksctl to delete the cluster.
Delete any remaining AWS resources created by EKS such as AWS LoadBalancer, Target Groups, etc.
Delete any related IAM entities.
Conclusion
This post walked you through the process of building out Amazon EKS based infrastructure and integrating Jenkins to orchestrate workloads. We demonstrated how you can utilize this to deploy securely across multiple accounts with dynamic Jenkins agents and create alignment to your business with similar use cases. To learn more about Amazon EKS, see our documentation pages or explore our console.
About the Authors
Vladimir P. Toussaint
Vladimir is a DevOps Cloud Architect at Amazon Web Services. He works with GovCloud customers to build solutions and capabilities as they move to the cloud. Previous to Amazon Web Services, Vladimir has leveraged container orchestration tools such as Kubernetes to securely manage microservice applications for large enterprises.
Matt Noyce
Matt is a Sr. Cloud Application Architect at Amazon Web Services. He works primarily with health care and life sciences customers to help them architect and build applications, data lakes, and DevOps pipelines that solve their business needs. In his spare time Matt likes to run and hike along with enjoying time with friends and family.
Nikunj Vaidya
Nikunj is a DevOps Tech Leader at Amazon Web Services. He offers technical guidance to the customers on AWS DevOps solutions and services that would streamline the application development process, accelerate application delivery, and enable maintaining a high bar of software quality. Prior to AWS, Nikunj has worked in software engineering roles, leading transformation projects, driving releases and improvements in the software quality and customer experience.
In this blog post, I demonstrate how to implement service-to-service authorization using OAuth 2.0 access tokens for microservice APIs hosted on Amazon Elastic Kubernetes Service (Amazon EKS). A common use case for OAuth 2.0 access tokens is to facilitate user authorization to a public facing application. Access tokens can also be used to identify and authorize programmatic access to services with a system identity instead of a user identity. In service-to-service authorization, OAuth 2.0 access tokens can be used to help protect your microservice API for the entire development lifecycle and for every application layer. AWS Well Architected recommends that you validate security at all layers, and by incorporating access tokens validated by the microservice, you can minimize the potential impact if your application gateway allows unintended access. The solution sample application in this post includes access token security at the outset. Access tokens are validated in unit tests, local deployment, and remote cluster deployment on Amazon EKS. Amazon Cognito is used as the OAuth 2.0 token issuer.
Benefits of using access token security with microservice APIs
Some of the reasons you should consider using access token security with microservices include the following:
Access tokens provide production grade security for microservices in non-production environments, and are designed to ensure consistent authentication and authorization and protect the application developer from changes to security controls at a cluster level.
They enable service-to-service applications to identify the caller and their permissions.
Access tokens are short-lived credentials that expire, which makes them preferable to traditional API gateway long-lived API keys.
You get better system integration with a web or mobile interface, or application gateway, when you include token validation in the microservice at the outset.
Overview of solution
In the solution described in this post, the sample microservice API is deployed to Amazon EKS, with an Application Load Balancer (ALB) for incoming traffic. Figure 1 shows the application architecture on Amazon Web Services (AWS).
Figure 1: Application architecture
The application client shown in Figure 1 represents a service-to-service workflow on Amazon EKS, and shows the following three steps:
The application client requests an access token from the Amazon Cognito user pool token endpoint.
The access token is forwarded to the ALB endpoint over HTTPS when requesting the microservice API, in the bearer token authorization header. The ALB is configured to use IP Classless Inter-Domain Routing (CIDR) range filtering.
The microservice deployed to Amazon EKS validates the access token using JSON Web Key Sets (JWKS), and enforces the authorization claims.
Walkthrough
The walkthrough in this post has the following steps:
Amazon EKS cluster setup
Amazon Cognito configuration
Microservice OAuth 2.0 integration
Unit test the access token claims
Deployment of microservice on Amazon EKS
Integration tests for local and remote deployments
Prerequisites
For this walkthrough, you should have the following prerequisites in place:
A basic familiarity with Kotlin or Java, and frameworks such as Quarkus or Spring
A Unix terminal
Set up
Amazon EKS is the target for your microservices deployment in the sample application. Use the following steps to create an EKS cluster. If you already have an EKS cluster, you can skip to the next section: To set up the AWS Load Balancer Controller. The following example creates an EKS cluster in the Asia Pacific (Singapore) ap-southeast-1 AWS Region. Be sure to update the Region to use your value.
To create an EKS cluster with eksctl
In your Unix editor, create a file named eks-cluster-config.yaml, with the following cluster configuration:
Create the cluster by using the following eksctl command:
eksctl create cluster -f eks-cluster-config.yaml
Allow 10–15 minutes for the EKS control plane and managed nodes creation. eksctl will automatically add the cluster details in your kubeconfig for use with kubectl.
Validate your cluster node status as “ready” with the following command
kubectl get nodes
Create the demo namespace to host the sample application by using the following command:
kubectl create namespace demo
With the EKS cluster now up and running, there is one final setup step. The ALB for inbound HTTPS traffic is created by the AWS Load Balancer Controller directly from the EKS cluster using a Kubernetes Ingress resource.
To set up the AWS Load Balancer Controller
Follow the installation steps to deploy the AWS Load Balancer Controller to Amazon EKS.
An Ingress resource defines the ALB configuration. You customize the ALB by using annotations. Create a file named alb.yml, and add resource definition as follows, replacing the inbound IP CIDR with your values:
Deploy the Ingress resource with kubectl to create the ALB by using the following command:
kubectl apply -f alb.yml
After a few moments, you should see the ALB move from status provisioning to active, with an auto-generated public DNS name.
Validate the ALB DNS name and the ALB is in active status by using the following command:
kubectl -n demo describe ingress alb-ingress
To alias your host, in this case gateway.example.com with the ALB, create a Route 53 alias record. The remote API is now accessible using your Route 53 alias, for example: https://gateway.example.com/api/demo/*
The ALB that you created will only allow incoming HTTPS traffic on port 443, and restricts incoming traffic to known source IP addresses. If you want to share the ALB across multiple microservices, you can add the alb.ingress.kubernetes.io/group.name annotation. To help protect the application from common exploits, you should add an annotation to bind AWS Web Application Firewall (WAFv2) ACLs, including rate-limiting options for the microservice.
Configure the Amazon Cognito user pool
To manage the OAuth 2.0 client credential flow, you create an Amazon Cognito user pool. Use the following procedure to create the Amazon Cognito user pool in the console.
In the top-right corner of the page, choose Create a user pool.
Provide a name for your user pool, and choose Review defaults to save the name.
Review the user pool information and make any necessary changes. Scroll down and choose Create pool.
Note down your created Pool Id, because you will need this for the microservice configuration.
Next, to simulate the client in subsequent tests, you will create three app clients: one for read permission, one for write permission, and one for the microservice.
To create Amazon Cognito app clients
In the left navigation pane, under General settings, choose App clients.
On the right pane, choose Add an app client.
Enter the App client name as readClient.
Leave all other options unchanged.
Choose Create app client to save.
Choose Add another app client, and add an app client with the name writeClient, then repeat step 5 to save.
Choose Add another app client, and add an app client with the name microService. Clear Generate Client Secret, as this isn’t required for the microservice. Leave all other options unchanged. Repeat step 5 to save.
Note down the App client id created for the microService app client, because you will need it to configure the microservice.
You now have three app clients: readClient, writeClient, and microService.
With the read and write clients created, the next step is to create the permission scope (role), which will be subsequently assigned.
To create read and write permission scopes (roles) for use with the app clients
In the left navigation pane, under App integration, choose Resource servers.
On the right pane, choose Add a resource server.
Enter the name Gateway for the resource server.
For the Identifier enter your host name, in this case https://gateway.example.com.Figure 2 shows the resource identifier and custom scopes for read and write role permission.
Figure 2: Resource identifier and custom scopes
In the first row under Scopes, for Name enter demo.read, and for Description enter Demo Read role.
In the second row under Scopes, for Name enter demo.write, and for Description enter Demo Write role.
Choose Save changes.
You have now completed configuring the custom role scopes that will be bound to the app clients. To complete the app client configuration, you will now bind the role scopes and configure the OAuth2.0 flow.
To configure app clients for client credential flow
In the left navigation pane, under App Integration, select App client settings.
On the right pane, the first of three app clients will be visible.
Scroll to the readClient app client and make the following selections:
For Enabled Identity Providers, select Cognito User Pool.
Under OAuth 2.0, for Allowed OAuth Flows, select Client credentials.
Under OAuth 2.0, under Allowed Custom Scopes, select the demo.read scope.
Leave all other options blank.
Scroll to the writeClient app client and make the following selections:
For Enabled Identity Providers, select Cognito User Pool.
Under OAuth 2.0, for Allowed OAuth Flows, select Client credentials.
Under OAuth 2.0, under Allowed Custom Scopes, select the demo.write scope.
Leave all other options blank.
Scroll to the microService app client and make the following selections:
For Enabled Identity Providers, select Cognito User Pool.
Under OAuth 2.0, for Allowed OAuth Flows, select Client credentials.
Under OAuth 2.0, under Allowed Custom Scopes, select the demo.read scope.
Leave all other options blank.
Figure 3 shows the app client configured with the client credentials flow and custom scope—all other options remain blank
Figure 3: App client configuration
Your Amazon Cognito configuration is now complete. Next you will integrate the microservice with OAuth 2.0.
Microservice OAuth 2.0 integration
For the server-side microservice, you will use Quarkus with Kotlin. Quarkus is a cloud-native microservice framework with strong Kubernetes and AWS integration, for the Java Virtual Machine (JVM) and GraalVM. GraalVM native-image can be used to create native executables, for fast startup and low memory usage, which is important for microservice applications.
On the top left, you can modify the Group, Artifact and Build Tool to your preference, or accept the defaults.
In the Pick your extensions search box, select each of the following extensions:
RESTEasy JAX-RS
RESTEasy Jackson
Kubernetes
Container Image Jib
OpenID Connect
Choose Generate your application to download your application as a .zip file.
Quarkus permits low-code integration with an identity provider such as Amazon Cognito, and is configured by the project application.properties file.
To configure application properties to use the Amazon Cognito IDP
Edit the application.properties file in your quick start project:
src/main/resources/application.properties
Add the following properties, replacing the variables with your values. Use the cognito-pool-id and microservice App client id that you noted down when creating these Amazon Cognito resources in the previous sections, along with your Region.
The Kotlin code sample that follows verifies the authenticated principle by using the @Authenticated annotation filter, which performs JSON Web Key Set (JWKS) token validation. The JWKS details are cached, adding nominal latency to the application performance.
The access token claims are auto-filtered by the @RolesAllowed annotation for the custom scopes, read and write. The protected methods are illustrations of a microservice API and how to integrate this with one to two lines of code.
import io.quarkus.security.Authenticated
import javax.annotation.security.RolesAllowed
import javax.enterprise.context.RequestScoped
import javax.ws.rs.*

@Authenticated
@RequestScoped
@Path("/api/demo")
class DemoResource {

    @GET
    @Path("protectedRole/{name}")
    @RolesAllowed("https://gateway.example.com/demo.read")
    fun protectedRole(@PathParam(value = "name") name: String) = mapOf("protectedAPI" to "true", "paramName" to name)


    @POST
    @Path("protectedUpload")
    @RolesAllowed("https://gateway.example.com/demo.write")
    fun protectedDataUpload(values: Map<String, String>) = "Received: $values"

}
Unit test the access token claims
For the unit tests you will test three scenarios: unauthorized, forbidden, and ok. The @TestSecurity annotation injects an access token with the specified role claim using the Quarkus test security library. To include access token security in your unit test only requires one line of code, the @TestSecurity annotation, which is a strong reason to include access token security validation upfront in your development. The unit test code in the following example maps to the protectedRole method for the microservice via the uri /api/demo/protectedRole, with an additional path parameter sample-username to be returned by the method for confirmation.
Deploying the microservice to Amazon EKS is the same as deploying to any upstream Kubernetes-compliant installation. You declare your application resources in a manifest file, and you deploy a container image of your application to your container registry. You can do this in a similar low-code manner with the Quarkus Kubernetes extension, which automatically generates the Kubernetes deployment and service resources at build time. The Quarkus Container Image Jib extension to automatically build the container image and deploys the container image to Amazon Elastic Container Registry (ECR), without the need for a Dockerfile.
Amazon ECR setup
Your microservice container image created during the build process will be published to Amazon Elastic Container Registry (Amazon ECR) in the same Region as the target Amazon EKS cluster deployment. Container images are stored in a repository in Amazon ECR, and in the following example uses a convention for the repository name of project name and microservice name. The first command that follows creates the Amazon ECR repository to host the microservice container image, and the second command obtains login credentials to publish the container image to Amazon ECR.
To set up the application for Amazon ECR integration
In the AWS CLI, create an Amazon ECR repository by using the following command. Replace the project name variable with your parent project name, and replace the microservice name with the microservice name.
Obtain an ECR authorization token, by using your IAM principal with the following command. Replace the variables with your values for the AWS account ID and Region.
After the application re-build, you should now have a container image deployed to Amazon ECR in your region with the following name [project-group]/[project-name]. The Quarkus build will give an error if the push to Amazon ECR failed.
Now, you can deploy your application to Amazon EKS, with kubectl from the following build path:
kubectl apply -f build/kubernetes/kubernetes.yml
Integration tests for local and remote deployments
The following environment assumes a Unix shell: either MacOS, Linux, or Windows Subsystem for Linux (WSL 2).
How to obtain the access token from the token endpoint
Obtain the access token for the application client by using the Amazon Cognito OAuth 2.0 token endpoint, and export an environment variable for re-use. Replace the variables with your Amazon Cognito pool name, and AWS Region respectively.
To generate the client credentials in the required format, you need the Base64 representation of the app client client-id:client-secret. There are many tools online to help you generate a Base64 encoded string. Export the following environment variables, to avoid hard-coding in configuration or scripts.
You can use curl to post to the token endpoint, and obtain an access token for the read and write app client respectively. You can pass grant_type=client_credentials and the custom scopes as appropriate. If you pass an incorrect scope, you will receive an invalid_grant error. The Unix jq tool extracts the access token from the JSON string. If you do not have the jq tool installed, you can use your relevant package manager (such as apt-get, yum, or brew), to install using sudo [package manager] install jq.
The following shell commands obtain the access token associated with the read or write scope. The client credentials are used to authorize the generation of the access token. An environment variable stores the read or write access token for future use. Update the scope URL to your host, in this case gateway.example.com.
If the curl commands are successful, you should see the access tokens in the environment variables by using the following echo commands:
echo $access_token_read
echo $access_token_write
For more information or troubleshooting, see TOKEN Endpoint in the Amazon Cognito Developer Guide.
Test scope with automation script
Now that you have saved the read and write access tokens, you can test the API. The endpoint can be local or on a remote cluster. The process is the same, all that changes is the target URL. The simplicity of toggling the target URL between local and remote is one of the reasons why access token security can be integrated into the full development lifecycle.
To perform integration tests in bulk, use a shell script that validates the response code. The example script that follows validates the API call under three test scenarios, the same as the unit tests:
If no valid access token is passed: 401 (unauthorized) response is expected.
A valid access token is passed, but with an incorrect role claim: 403 (forbidden) response is expected.
A valid access token and valid role-claim is passed: 200 (ok) response with content-type of application/json expected.
Name the following script, demo-api.sh. For each API method in the microservice, you duplicate these three tests, but for the sake of brevity in this post, I’m only showing you one API method here, protectedRole.
Test the microservice API against the access token claims
Run the script for a local host deployment on http://localhost:8080, and on the remote EKS cluster, in this case https://gateway.example.com.
If everything works as expected, you will have demonstrated the same test process for local and remote deployments of your microservice. Another advantage of creating a security test automation process like the one demonstrated, is that you can also include it as part of your continuous integration/continuous delivery (CI/CD) test automation.
The test automation script accepts the microservice host URL as a parameter (the default is local), referencing the stored access tokens from the environment variables. Upon error, the script will exit with the error code. To test the remote EKS cluster, use the following command, with your host URL, in this case gateway.example.com.
./demo-api.sh https://<gateway.example.com>
Expected output:
Test 401-unauthorized: No access token for /api/demo/protectedRole/{name}
Test 403-forbidden: Incorrect role/custom-scope for /api/demo/protectedRole/{name}
Test 200-ok: Correct role for /api/demo/protectedRole/{name}
  Output: {"protectedAPI":"true","paramName":"sample-username"}!200!application/json
Best practices for a well architected production service-to-service client
For elevated security in alignment with AWS Well Architected, it is recommend to use AWS Secrets Manager to hold the client credentials. Separating your credentials from the application permits credential rotation without the requirement to release a new version of the application or modify environment variables used by the service. Access to secrets must be tightly controlled because the secrets contain extremely sensitive information. Secrets Manager uses AWS Identity and Access Management (IAM) to secure access to the secrets. By using the permissions capabilities of IAM permissions policies, you can control which users or services have access to your secrets. Secrets Manager uses envelope encryption with AWS KMS customer master keys (CMKs) and data key to protect each secret value. When you create a secret, you can choose any symmetric customer managed CMK in the AWS account and Region, or you can use the AWS managed CMK for Secrets Manager aws/secretsmanager.
Access tokens can be configured on Amazon Cognito to expire in as little as 5 minutes or as long as 24 hours. To avoid unnecessary calls to the token endpoint, the application client should cache the access token and refresh close to expiry. In the Quarkus framework used for the microservice, this can be automatically performed for a client service by adding the quarkus-oidc-client extension to the application.
Cleaning up
To avoid incurring future charges, delete all the resources created.
To delete the EKS cluster, and the associated Application Load Balancer, follow the steps described in Deleting a cluster in the Amazon EKS User Guide.
This post has focused on the last line of defense, the microservice, and the importance of a layered security approach throughout the development lifecycle. Access token security should be validated both at the application gateway and microservice for end-to-end API protection.
As an additional layer of security at the application gateway, you should consider using Amazon API Gateway, and the inbuilt JWT authorizer to perform the same API access token validation for public facing APIs. For more advanced business-to-business solutions, Amazon API Gateway provides integrated mutual TLS authentication.
If you have feedback about this post, submit comments in the Comments section below. If you have questions about this post, start a new thread on the Amazon Cognito forum or contact AWS Support.
Want more AWS Security how-to content, news, and feature announcements? Follow us on Twitter.
The collective thoughts of the interwebz
Manage Consent
To provide the best experiences, we use technologies like cookies to store and/or access device information. Consenting to these technologies will allow us to process data such as browsing behavior or unique IDs on this site. Not consenting or withdrawing consent, may adversely affect certain features and functions.
Functional
Always active
The technical storage or access is strictly necessary for the legitimate purpose of enabling the use of a specific service explicitly requested by the subscriber or user, or for the sole purpose of carrying out the transmission of a communication over an electronic communications network.
Preferences
The technical storage or access is necessary for the legitimate purpose of storing preferences that are not requested by the subscriber or user.
Statistics
The technical storage or access that is used exclusively for statistical purposes.The technical storage or access that is used exclusively for anonymous statistical purposes. Without a subpoena, voluntary compliance on the part of your Internet Service Provider, or additional records from a third party, information stored or retrieved for this purpose alone cannot usually be used to identify you.
Marketing
The technical storage or access is required to create user profiles to send advertising, or to track the user on a website or across several websites for similar marketing purposes.