Tag Archives: Remote Work

RDP without the risk: Cloudflare’s browser-based solution for secure third-party access

Post Syndicated from Ann Ming Samborski original https://blog.cloudflare.com/browser-based-rdp/

Short-lived SSH access made its debut on Cloudflare’s SASE platform in October 2024. Leveraging the knowledge gained through the BastionZero acquisition, short-lived SSH access enables organizations to apply Zero Trust controls in front of their Linux servers. That was just the beginning, however, as we are thrilled to announce the release of a long-requested feature: clientless, browser-based support for the Remote Desktop Protocol (RDP). Built on top of Cloudflare’s modern proxy architecture, our RDP proxy offers a secure and performant solution that, critically, is also easy to set up, maintain, and use.

Security challenges of RDP 

Remote Desktop Protocol (RDP) was born in 1998 with Windows NT 4.0 Terminal Server Edition. If you have never heard of that Windows version, it’s because, well, there’s been 16 major Windows releases since then. Regardless, RDP is still used across thousands of organizations to enable remote access to Windows servers. It’s a bit of a strange protocol that relies on a graphical user interface to display screen captures taken in very close succession in order to emulate the interactions on the remote Windows server. (There’s more happening here beyond the screen captures, including drawing commands, bitmap updates, and even video streams. Like we said — it’s a bit strange.) Because of this complexity, RDP can be computationally demanding and poses a challenge for running at high performance over traditional VPNs.

Beyond its quirks, RDP has also had a rather unsavory reputation in the security industry due to early vulnerabilities with the protocol. The two main offenders are weak user sign-in credentials and unrestricted port access. Windows servers are commonly protected by passwords, which often have inadequate security to start, and worse still, may be shared across multiple accounts. This leaves these RDP servers open to brute force or credential stuffing attacks. 

Bad actors have abused RDP’s default port, 3389, to carry out on-path attacks. One of the most severe RDP vulnerabilities discovered is called BlueKeep. Officially known as CVE-2019-0708, BlueKeep is a vulnerability that allows remote code execution (RCE) without authentication, as long as the request adheres to a specific format and is sent to a port running RDP. Worse still, it is wormable, meaning that BlueKeep can spread to other machines within the network with no user action. Because bad actors can compromise RDP to gain unauthorized access, attackers can then move laterally within the network, escalating privileges, and installing malware. RDP has also been used to deploy ransomware such as Ryuk, Conti, and DoppelPaymer, earning it the nickname “Ransomware Delivery Protocol.” 

This is a subset of vulnerabilities in RDP’s history, but we don’t mean to be discouraging. Thankfully, due to newer versions of Windows, CVE patches, improved password hygiene, and better awareness of privileged access, many organizations have reduced their attack surface. However, for as many secured Windows servers that exist, there are still countless unpatched or poorly configured systems online, making them easy targets for ransomware and botnets. 

The need for a browser-based RDP solution

Despite its security risks, RDP remains essential for many organizations, particularly those with distributed workforces and third-party contractors. It provides value for compute-intensive tasks that require high-powered Windows servers with CPU/GPU resources greater than users’ machines can offer. For security-focused organizations, RDP grants better visibility into who is accessing Windows servers and what actions are taken during those sessions. 

Because issuing corporate devices to contractors is costly and cumbersome, many organizations adopt a bring-your-own-device (BYOD) policy. This decision instead requires organizations to provide contractors with a means to RDP to a Windows server with the necessary corporate resources to fulfill their role.

Traditional RDP requires client software on user devices, so this is not an appropriate solution for contractors (or any employees) using personal machines or unmanaged devices. Previously, Cloudflare customers had to rely on self-hosted third-party tools like Apache Guacamole or Devolutions Gateway to enable browser-based RDP access. This created several operational pain points:

  • Infrastructure complexity: Deploying and maintaining RDP gateways increases operational overhead.

  • Maintenance burden: Commercial and open-source tools may require frequent updates and patches, sometimes even necessitating custom forks.

  • Compliance challenges: Third-party software requires additional security audits and risk management assessments, particularly for regulated industries.

  • Redundancy, but not the good kind – Customers come to Cloudflare to reduce the complexity of maintaining their infrastructure, not add to it.

We’ve been listening. Cloudflare has architectured a high-performance RDP proxy that leverages the modern security controls already part of our Zero Trust Network Access (ZTNA) service. We feel that the “security/performance tradeoff” the industry commonly touts is a dated mindset. With the right underlying network architecture, we can help mitigate RDP’s most infamous challenges.

Introducing browser-based RDP with Access

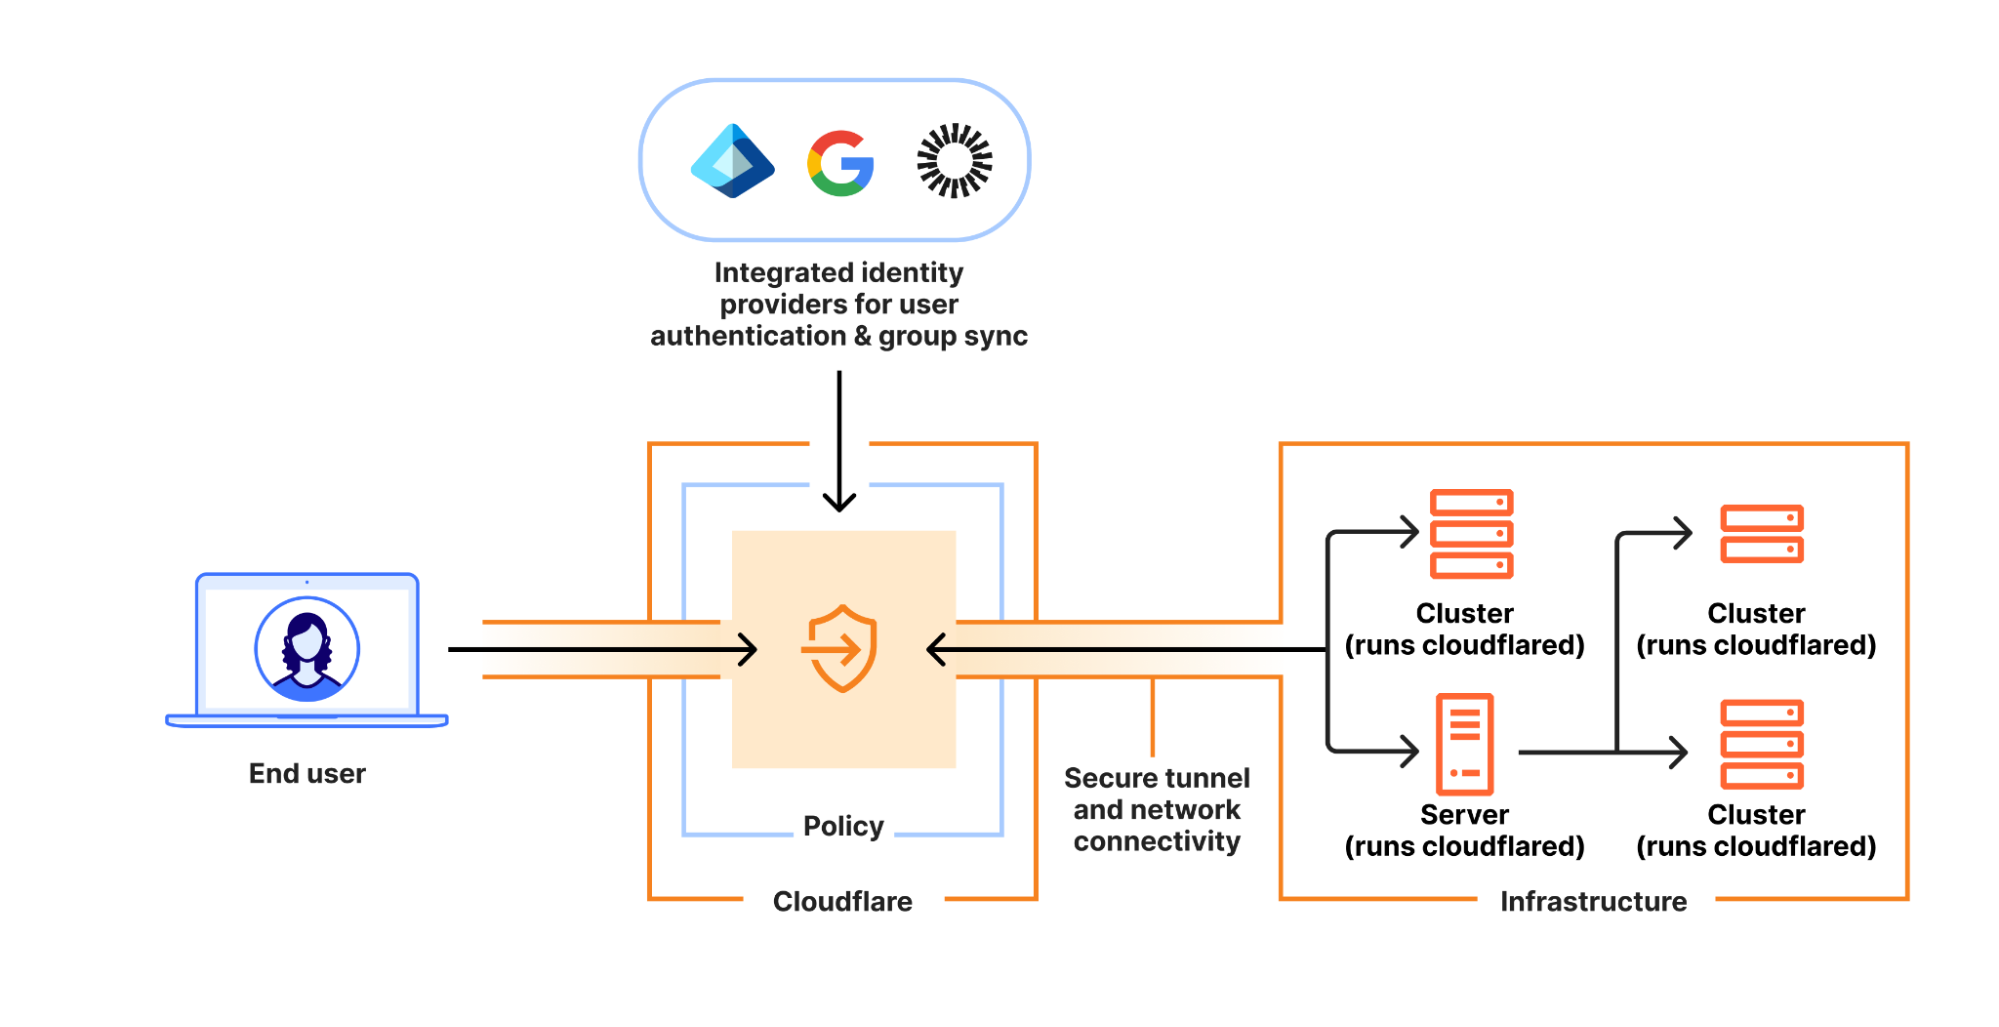
Cloudflare’s browser-based RDP solution is the newest addition to Cloudflare Access alongside existing clientless SSH and VNC offerings, enabling secure, remote Windows server access without VPNs or RDP clients. Built natively within Cloudflare’s global network, it requires no additional infrastructure.

Our browser-based RDP access combines the power of self-hosted Access applications with the additional flexibility of targets, introduced with Access for Infrastructure. Administrators can enforce:

  • Authentication: Control how users authenticate to your internal RDP resources with SSO, MFA, and device posture.

  • Authorization: Use policy-based access control to determine who can access what target and when. 

  • Auditing: Provide Access logs to support regulatory compliance and visibility in the event of a security breach.

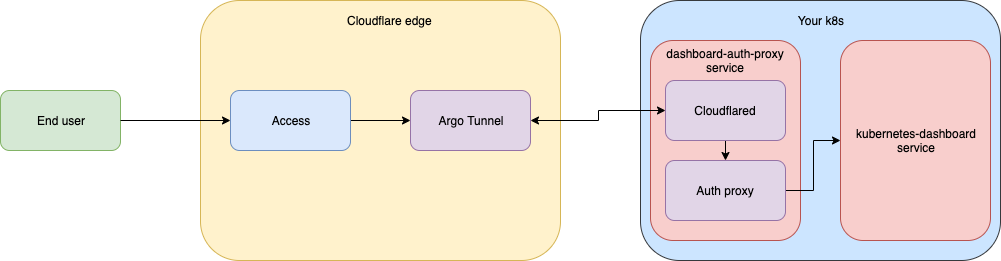
Users only need a web browser — no native RDP client is necessary! RDP servers are accessed through our app connector, Cloudflare Tunnel, using a common deployment model of existing Access customers. There is no need to provision user devices to access particular RDP servers, making for minimal setup to adopt this new functionality.


How it works

The client

Cloudflare’s implementation leverages IronRDP, a high-performance RDP client that runs in the browser. It was selected because it is a modern, well-maintained, RDP client implementation that offers an efficient and responsive experience. Unlike Java-based Apache Guacamole, another popular RDP client implementation, IronRDP is built with Rust and integrates very well with Cloudflare’s development ecosystem.

While selecting the right tools can make all the difference, using a browser to facilitate an RDP session faces some challenges. From a practical perspective, browsers just can’t send RDP messages. RDP relies directly on the Layer 4 Transmission Control Protocol (TCP) for communication, and while browsers can use TCP as the underlying protocol, they do not expose APIs that would let apps build protocol support directly on raw TCP sockets.

Another challenge is rooted in a security consideration: the username and password authentication mechanism that is native to RDP leaves a lot to be desired in the modern world of Zero Trust.

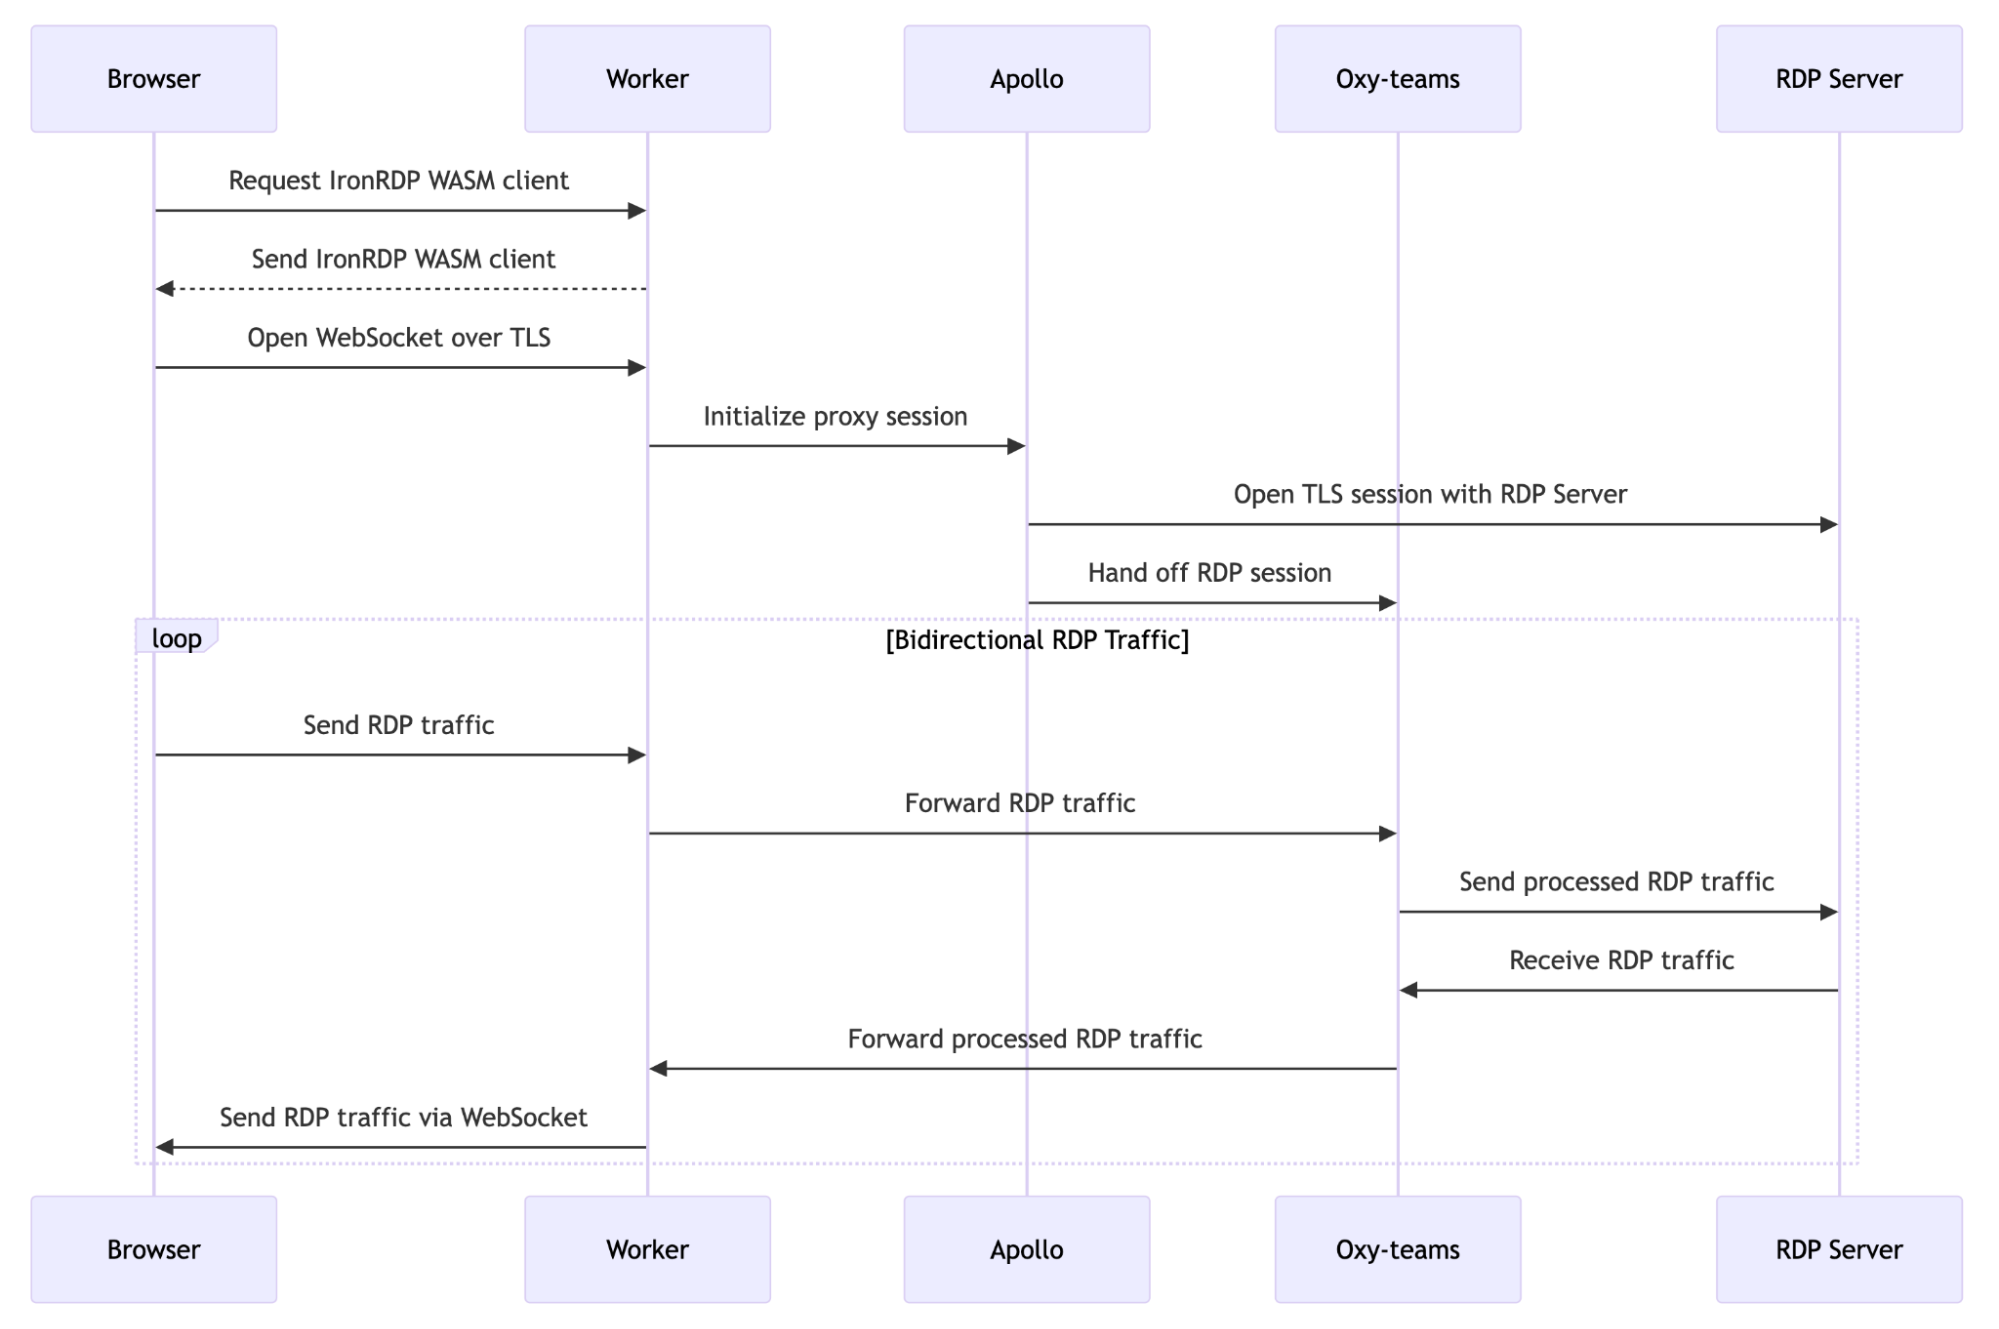
In order to tackle both of these challenges, the IronRDP client encapsulates the RDP session in a WebSocket connection. Wrapping the Layer 4 TCP traffic in HTTPS enables the client to use native browser APIs to communicate with Cloudflare’s RDP proxy. Additionally, it enables Cloudflare Access to secure the entire session using identity-aware policies. By attaching a Cloudflare Access authorization JSON Web Token (JWT) via cookie to the WebSocket connection, every inter-service hop of the RDP session is verified to be coming from the authenticated user.  

A brief aside into how security and performance is optimized: in conventional client-based RDP traffic, the client and server negotiate a TLS connection to secure and verify the session. However, because the browser WebSocket connection is already secured with TLS to Cloudflare, we employ IronRDP’s RDCleanPath protocol extension to eliminate this second encapsulation of traffic. Removing this redundancy avoids unnecessary performance degradation and increased complexity during session handshakes.

The server

The IronRDP client initiates a WebSocket connection to a dedicated WebSocket proxy, which is responsible for authenticating the client, terminating the WebSocket connection, and proxying tunneled RDP traffic deeper into Cloudflare’s infrastructure to facilitate connectivity. The seemingly simple task of determining how this WebSocket proxy should be built turned out to be the most challenging decision in the development process. 

Our initial proposal was to develop a new service that would run on every server within our network. While this was feasible, operating a new service would introduce a non-trivial maintenance burden, which ultimately turned out to be more overhead than value-add in this case. The next proposal was to build it into Front Line (FL), one of Cloudflare’s oldest services that is responsible for handling tens of millions of HTTP requests per second. This approach would have sidestepped the need to expose new IP addresses and benefitted from the existing scaffolding to let the team move quickly. Despite being promising at first, this approach was decided against because FL is undergoing significant investment, and the team didn’t want to build on shifting sands.

Finally, we identified a solution that implements the proxy service using Cloudflare Workers! Fortunately, Workers automatically scales to massive request rates, which eliminates some of the groundwork we’d lay if we had chosen to build a new service. Candidly, this approach was not initially preferred due to some ambiguities around how Workers communicates with internal Cloudflare services, but with support from the Workers team, we found a path forward. 

From the WebSocket proxy Worker, the tunneled RDP connection is sent to the Apollo service, which is responsible for routing traffic between on-ramps and off-ramps for Cloudflare Zero Trust. Apollo centralizes and abstracts these complexities to let other services focus on application-specific functionality. Apollo determines which Cloudflare colo is closest to the target Cloudflare Tunnel and establishes a connection to an identical Apollo instance running in that colo. The egressing Apollo instance can then facilitate the final connection to the Cloudflare Tunnel. By using Cloudflare’s global network to traverse the distance between the ingress colo and the target Cloudflare Tunnel, network disruptions and congestion is managed.

Apollo connects to the RDP server and passes the ingress and egress connections to Oxy-teams, the service responsible for inspecting and proxying the RDP traffic. It functions as a pass-through (strictly enabling traffic connectivity) as the web client authenticates to the RDP server. Our initial release makes use of NT Lan Manager (NTLM) authentication, a challenge-response authentication protocol requiring username and password entry. Once the client has authenticated with the server, Oxy-teams is able to proxy all subsequent RDP traffic!

This may sound like a lot of hops, but every server in our network runs every service. So believe it or not, this complex dance takes place on a single server and by using UNIX domain sockets for communication, we also minimize any performance impact. If any of these servers become overloaded, experience a network fault, or have a hardware problem, the load is automatically shifted to a neighboring server with the help of Unimog, Cloudflare’s L4 load balancer.

Putting it all together

  1. User initiation: The user selects an RDP server from Cloudflare’s App Launcher (or accesses it via a direct URL). Each RDP server is associated with a public hostname secured by Cloudflare. 

  2. Ingress: This request is received by the closest data center within Cloudflare’s network

  3. Authentication: Cloudflare Access authenticates the session by validating that the request contains a valid JWT. This token certifies that the user is authorized to access the selected RDP server through the specified domain.

  4. Web client delivery: Cloudflare Workers serves the IronRDP web client to the user’s browser.

  5. Secure tunneling: The client tunnels RDP traffic from the user’s browser over a TLS-secured WebSocket to another Cloudflare Worker. 

  6. Traffic routing: The Worker that receives the IronRDP connection terminates the WebSocket and initiates a connection to Apollo. From there, Apollo creates a connection to the RDP server.

  7. Authentication relay: With a connection established, Apollo relays RDP authentication messages between the web client and the RDP server. 

  8. Connection establishment: Upon successful authentication, Cloudflare serves as an RDP proxy between the web browser and the RDP server, connecting the user to the RDP server with free-flowing traffic. 

  9. Policy enforcement: Cloudflare’s secure web gateway, Oxy-teams, applies Layer 4 policy enforcement and logging of the RDP traffic.


Key benefits of this architecture:

  • No additional software: Access Windows servers directly from a browser.

  • Low latency: Cloudflare’s global network minimizes performance overhead.

  • Enhanced security: RDP access is protected by Access policies, preventing lateral movement.

  • Integrated logging and monitoring: Administrators can observe and control RDP traffic.

To learn more about Cloudflare’s proxy capabilities, take a look at our related blog post explaining our proxy framework.

Selective, modern RDP authentication

Cloudflare’s browser-based RDP solution exclusively supports modern RDP authentication mechanisms, enforcing best practices for secure access. Our architecture ensures that RDP traffic using outdated or weak legacy security features from older versions of the RDP standard, such as unsecured password-based authentication or RC4 encryption, are never allowed to reach customer endpoints.

Cloudflare supports secure session negotiation using the following principles:

  1. TLS-based WebSocket connection for transport security.

  2. Fine-grained policies that enforce single sign on (SSO), multi-factor authentication (MFA), and dynamic authorization.

  3. Integration with enterprise identity providers via SAML (Security Assertion Markup Language) and OIDC (OpenID Connect).

Every RDP session that passes through Cloudflare’s network is encrypted and authenticated.

What’s next? 

This is only the beginning for our browser-based RDP solution! We have already identified a few areas for continued focus:

  • Enhanced visibility and control for administrators: Because RDP traffic passes through Cloudflare Workers and proxy services, browser-based RDP will expand to include session monitoring. We are also evaluating data loss prevention (DLP) support, such as restricting actions like file transfers and clipboard use, to prevent unauthorized data exfiltration without compromising performance. 

  • Advanced authentication: Long-lived credentials are a thing of the past. Future iterations of browser-based RDP will include passwordless functionality, eliminating the need for end users to remember passwords and administrators from having to manage them. To that end, we are evaluating methods such as client certificate authentication, passkeys and smart cards, and integration with third-party authentication providers via Access.

Compliance and FedRAMP High certification

We plan to include browser-based RDP in our FedRAMP High offering for enterprise and government organizations, a high-priority initiative we announced in early February. This certification will validate that our solution meets the highest standards for:

  • Data protection

  • Identity and access management

  • Continuous monitoring

  • Incident response

Seeking FedRAMP High compliance demonstrates Cloudflare’s commitment to securing sensitive environments, such as those in the federal government, healthcare, and financial sectors.

By enforcing a modern, opinionated, and secure implementation of RDP, Cloudflare provides a secure, scalable, and compliant solution tailored to the needs of organizations with critical security and compliance mandates.

Get started today

At Cloudflare, we are committed to providing the most comprehensive solution for ZTNA, which now also includes privileged access to sensitive infrastructure like Windows servers over browser-based RDP. Cloudflare’s browser-based RDP solution is in closed beta with new customers being onboarded each week. You can request access here to try out this exciting new feature.

In the meantime, check out our Access for Infrastructure documentation to learn more about how Cloudflare protects privileged access to sensitive infrastructure. Access for Infrastructure is currently available free to teams of under 50 users, and at no extra cost to existing pay-as-you-go and Contract plan customers through an Access or Zero Trust subscription. Stay tuned as we continue to natively rebuild BastionZero’s technology into Cloudflare’s Access for Infrastructure service!

How GitHub does take home technical interviews

Post Syndicated from Andy McKay original https://github.blog/2022-03-31-how-github-does-take-home-technical-interviews/

There are many ways to evaluate an engineering candidate’s skills. One way is to ask them to solve a problem or write some code. We have been striving for a while to make this experience better at GitHub. This blog post talks about how candidates at GitHub do the “take home” portion of their interview—a technical challenge done independently—and how we improved on that process.

We believe the technical interview should be as similar as possible to the way we work at GitHub. That means:

  • Writing code on GitHub and submitting a pull request.
  • Using your preferred editor, operating system, and tools.
  • Using the internet for documentation and help.
  • Respecting time limits.

In order to make this process seamless for candidates, we automate with a GitHub app called Interview-bot. This app uses the GitHub API and existing GitHub features.

First, candidates get to choose the programming language they’ll use to take the interview. They’ll get an email asking them to take the interview at their convenience by signing into Interview-bot.

Each interview is aimed at being similar to the day-to-day problems that we solve at GitHub. These aren’t problems to trick or test obscure knowledge. Interviews come with a clear set of instructions and a time limit. We place this time limit because we respect your time and want to ensure that we don’t bias toward candidates who have more time to invest in the solution.

The exercise is contained in a repository in a separate organization on GitHub. When the candidate signs in, we make a new repository, grab a copy of the exercise and copy the files, issues, and pull requests into the repository. This is done as a copy and not a fork or clone because we can alter the files in the process to fix things up. It also allows us to remove any Git history that might hide embarrassing clues on how to complete the exercise. 😉

Diagram showing that the candidate exercise is copied from "based repository" to "candidate repositor"

The candidate is given access to the repository, and a timer starts. They can now clone the exercise to their local machine, or use GitHub Codespaces. They are able to use whatever editor, tooling, and operating system they want. Again, we hope to make this as close as possible to how the candidate will be working in a day to day environment at GitHub.

When the candidate is satisfied with their pull request, they can submit it for review. The application will listen for the pull request via webhooks and will confirm that the pull request has been submitted.

Screenshot of pull request confirmation that candidate will receive

At this point, we anonymize the pull request and copy it back to the base repository.

Diagram that shows how the anonymized candidate response is sent back to the base repository

The pull request contains the code changes and comments from the candidate. To further reduce bias, the system anonymizes the submission (as best as it can) by removing the title. The Git commits and pull request will display Interview-bot as the author. To the reviewer, the pull request comes from Interview-bot and not the candidate.

Sample pull request from interview-bot, showing anonymized ID rather than candidate name

The pull request includes automated tests and a rubric so that interviewers know how to mark it and each submission is evaluated objectively and consistently. The tests run through GitHub Actions and provide a base level for the reviewer.

For each language, we’ve got teams of engineers who review the exercise. Using GitHub’s code review team feature, an engineer at GitHub is assigned to review the code. To mark the code, we provide a clear scorecard on the pull request as a comment. This clear set of marking criteria helps limit any personal bias the interviewer might have. They’ll mark the review based on given technical criteria and apply an “Approve” or “Request changes” status to give the candidate a pass or fail, respectively.

Finally, Interview-bot tracks for changes on the pull request review and then informs the assigned staff member so they can follow up with the candidate, who hopefully moves on to the next stage of the GitHub interview process. At the start of the interview process, Interview-bot associates each candidate with an issue in an internal repository. This means that staff can track candidates and their progress all within GitHub.

Sample status update from Interview-bot

Using the existing GitHub APIs and tooling, we created an interview process that mirrors as closely as possible how you’ll work at GitHub, focused on reducing bias and improving the candidate’s experience.

If you’re interested in applying at GitHub, please check out our careers page!

Technical interviews via Codespaces

Post Syndicated from Ian Olsen original https://github.blog/2021-12-16-technical-interviews-via-codespaces/

Technical interviews are the worst. Getting meaningful signal from candidates without wasting their time is notoriously hard. Thankfully, the industry has come a long way from brainteaser-style questions and interviews requiring candidates to balance a binary tree with dry erase markers in front of a group of strangers. There are more valuable ways to spend time today, and in this post, I’ll share how our team at GitHub adopted Codespaces to streamline the interview process.

Technical interviews: looking back

My team at GitHub found itself in hiring mode in early 2021. Most of the work we do is in Rails, and we opted to leverage an existing exercise for our technical screen. We asked candidates to make some API improvements to a simple Rails application. It’s been around for many years and has had most of its sharp edges sanded smooth. There is some CI magic to get us started in evaluating a new submission. We perform a manual evaluation using a rubric that is far from perfect but at least well-understood. So we deployed it and started looking through the submissions, a task we expected to be routine.

Despite all the deliberately straightforward decisions to this point, we had some surprises right away. It turned out this exercise hadn’t been touched in a couple of years and was running outdated versions of Ruby and Rails. For some candidates, the experienced engineers already writing Rails apps for a living, this wasn’t much of an obstacle. But a significant number of candidates were bogged down just getting their local development environment up and running. A team looking only for senior engineers might even do something like this deliberately, but that wasn’t true for my team. The goal of the exercise was to mirror the job, and this wasn’t it. Flailing for half your alotted time on environment set-up issues tells us virtually nothing about how successful candidates would be at the technical work we do.

Enter Codespaces

We immediately did the obvious work of updating Ruby, Rails, and all of the app’s dependencies. This was necessary but felt insufficient. How could we prevent a future team from making the same mistake? How could we help other growing teams (or even future us) fall into the proverbial pit of success? It was around this time that the Codespaces Computer Club started gaining traction internally. I don’t tend to be the first person to jump into a newfangled cloud-based dev environment. Many years have gone into this .vimrc and I like it just how it is, thank you very much. Don’t move my cheese, particuarly not to The Cloud. But even I had to admit that Codespaces is an excellent tool, aimed squarely at solving these kinds of problems, and we gave it a look.

So what is Codespaces? In short: a cloud-based development environment. Built atop Visual Studio Code’s Remote Containers, Codespaces allow you to spin up a remote development environment directly from a GitHub repository. The Visual Studio Code web interface is instantly available, as is Visual Studio Code on the desktop. Dotfiles and ssh are supported, so the terminal-oriented folks (🖐) need not abandon their precious .vimrc!

Screenshot of UI to launch a new codespace

The containerized development environmentment is perfectly predictable, frozen in time like Han Solo in Carbonite. We can prebuild all of the dependencies, and they remain at that version for as long as the codespace configuration is unchanged. This removes an entire class of meaningless problems from the candidate’s experience. Experienced developers who have a finely tuned local environment can still use it; enabling Codespaces has no impact on the ability to do it locally. Clone the repository and do your thing. But the experience of being quickly dropped into a development environment that’s perfectly tuned for the task at hand is pretty cool!
 
codespace ready

Returning signal

Dropping the candidate into a finely honed environment, suited to the task at hand, has myriad benefits. It eliminates the random starting point, leveling the playing field for candidates of varying backgrounds all over the world. No assumptions need be made about the hardware or software they have access to. With internet access and a browser, you have everything you need!

The advantages extend to pairing exercises, too. There’s good reason for a candidate to have anxiety pairing in an interviewing context. Perhaps the best way to fray nerves is to start with a broken dev environment. Maybe the candidate is using a work machine, and the app they maintain at work is on an older version of Rails. Maybe this is a personal machine, but their bird watching hobby yields terabytes of video and bundle install just ran out of disk space. Even if it’s a quick fix, a nervous candidate isn’t performing at the level they would in their normal work. Working in a codespace lets us virtually eliminate this pitfall and focus on the pairing task, yielding higher signal about the skills we really intend to measure.

This has turned out to be a terrific improvement in our hiring process, appreciated by both candidates and interviewers. Visual Studio Code has great tooling for adding Codespaces support to an existing project, and you can probably have something that works in a single afternoon. Check it out!

A Virtual Product Management Internship Experience

Post Syndicated from Selina Cho original https://blog.cloudflare.com/a-virtual-product-management-internship-experience/

A Virtual Product Management Internship Experience

A Virtual Product Management Internship Experience

In July 2020, I joined Cloudflare as a Product Management Intern on the DDoS (Distributed Denial of Service) team to enhance the benefits that Network Analytics brings to our customers. In the following, I am excited to share with you my experience with remote working as an intern, and how I acclimatized into Cloudflare. I also give details about what my work entailed and how we approached the process of Product Management.

Onboarding to Cloudflare during COVID19

As a long-time user of Cloudflare’s Free CDN plan myself, I was thrilled to join the company and learn what was happening behind the scenes while making its products. The entering internship class consisted of students and recent graduates from various backgrounds around the world – all with a mutual passion in helping build a better Internet.

The catch here was that 2020 would make the experience of being an intern very different. As it was the case with many other fellow interns, it was the first time I had taken up work remotely from scratch. The initial challenge was to integrate into the working environment without ever meeting colleagues in a physical office. Because everything took place online, it was much harder to pick up non-verbal cues that play a key role in communication, such as eye contact and body language.

To face this challenge, Cloudflare introduced creative and active ways in which we could better interact with one another. From the very first day, I was welcomed to an abundance of knowledge sharing talks and coffee chats with new and existing colleagues in different offices across the world. Whether it was data protection from the Legal team or going serverless with Workers, we were welcomed to afternoon seminars every week on a new area that was being pursued within Cloudflare.

Cloudflare not only retained the summer internship scheme, but in fact doubled the size of the class; this reinforced an optimistic mood within the entering class and a sense of personal responsibility. I was paired up with a mentor, a buddy, and a manager who helped me find my way quickly within Cloudflare, and without which my experience would not have been the same. Thanks to Omer, Pat, Val and countless others for all your incredible support!

Social interactions took various forms and were scheduled for all global time zones. I was invited to weekly virtual yoga sessions and intern meetups to network and discover what other interns across the world were working on. We got to virtually mingle at an “Intern Mixer” where we shared answers to philosophical prompts – what’s more, this was accompanied by an UberEats coupon for us to enjoy refreshments in our work-from-home setting. We also had Pub Quizzes with colleagues in the EMEA region to brush up on our trivia skills. At this uncertain time of the year, part of which I spent in complete self-isolation, these gatherings helped create a sense of belonging within the community, as well as an affinity towards the colleagues I interacted with.

Product Management at Cloudflare

My internship also offered a unique learning experience from the Product Management perspective. I took on the task of increasing the value of Network Analytics by giving customers and internal stakeholders improved  transparency in the traffic patterns and attacks taking place. Network Analytics is Cloudflare’s packet- and bit-oriented dashboard that provides visibility into network- and transport-layer attacks which are mitigated across the world. Among various updates I led in visibility features is the new trends insights. During this time the dashboard was also extended to Enterprise customers on the Spectrum service, Cloudflare’s L4 reverse-proxy that provides DDoS protection against attacks and facilitates network performance.

I was at the intersection of multiple teams that contributed to Network Analytics from different angles, including user interface, UX research, product design, product content and backend engineering, among many others. The key to a successful delivery of Network Analytics as a product, given its interdisciplinary nature, meant that I actively facilitated communication and collaboration across experts in these teams as well as reflected the needs of the users.

I spent the first month of the internship approaching internal stakeholders, namely Customer Support engineers, Solutions Engineers, Customer Success Managers, and Product Managers, to better understand the common pain points. Given their past experience with customers, their insights revealed how Network Analytics could both leverage the existing visibility features to reduce overhead costs on the internal support side and empower users with actionable insights. This process also helped ensure that I didn’t reinvent wheels that had already been explored by existing Product Managers.

I then approached customers to enquire about desired areas for improvements. An example of such a desired improvement was that the display of data in the dashboard was not helping users infer any meaning regarding next steps. It did not answer questions like: What do these numbers represent in retrospect, and should I be concerned? Discussing these aspects helped validate the needs, and we subsequently came up with rough solutions to address them, such as dynamic trends view. Over the calls, we confirmed that – especially from those who rarely accessed the dashboard – having an overview of these numbers in the form of a trends card would incentivize users to log in more often and get more value from the product.

A Virtual Product Management Internship Experience
Trends Insights

The 1:1 dialogues were incredibly helpful in understanding how Network Analytics could be more effectively utilized, and guided ways for us to better surface the performance of our DDoS mitigation tools to our customers. In the first few weeks of the internship, I shadowed customer calls of other products; this helped me gain the confidence, knowledge, and language appropriate in Cloudflare’s user research. I did a run-through of the interview questions with a UX Researcher, and was informed on the procedure for getting in touch with appropriate customers. We even had bilingual calls where the Customer Success Manager helped translate the dialogues real-time.

In the following weeks, I synthesized these findings into a Product Requirements Document and lined up the features according to quarterly goals that could now be addressed in collaboration with other teams. After a formal review and discussion with Product Managers, engineers, and designers, we developed and rolled out each feature to the customers on a bi-weekly basis. We always welcomed feedback before and after the feature releases, as the goal wasn’t to have an ultimate final product, but to deliver incremental enhancements to meet the evolving needs of our customers.

Of course, all my interactions, including customer and internal stakeholder calls, were all held remotely. We all embraced video conferencing and instant chat messengers to make it feel as though we were physically close. I had weekly check-ins with various colleagues including my managers, Network Analytics team, DDoS engineering team, and DDoS reports team, to ensure that things were on track. For me, the key to working remotely was the instant chat function, which was not as intrusive as a fully fledged meeting, but a quick and considerate way to communicate in a tightly-knit team.

Looking Back

Product Management is a growth process – both for the corresponding individual and the product. As an individual, you grow fast through creative thinking, problem solving and incessant curiosity to better understand a product in the shoes of a customer. At the same time, the product continues to evolve and grow as a result of synergy between experts from diverse fields and customer feedback. Products are used and experienced by people, so it is a no-brainer that maintaining constant and direct feedback from our customers and internal stakeholders are what bolsters their quality.

It was an incredible opportunity to have been a part of an organization that represents one of the largest networks. Network Analytics is a window into the efforts led by Cloudflare engineers and technicians to help secure the Internet, and we are ambitious to scale the transparency across further mitigation systems in the future.

The internship was a successful immersive experience into the world of Network Analytics and Product Management, even in the face of a pandemic. Owing to Cloudflare’s flexibility and ready access to resources for remote work, I was able to adapt to the work environment from the first day onwards and gain an authentic learning experience into how products work. As I now return to university, I look back on an internship that significantly added to my personal and professional growth. I am happy to leave behind the latest evolution of Network Analytics dashboard with hopefully many more to come. Thanks to Cloudflare and all my colleagues for making this possible!

How Argo Tunnel engineering uses Argo Tunnel

Post Syndicated from Chung-Ting Huang original https://blog.cloudflare.com/how-argo-tunnel-engineering-uses-argo-tunnel/

How Argo Tunnel engineering uses Argo Tunnel

Whether you are managing a fleet of machines or sharing a private site from your localhost, Argo Tunnel is here to help. On the Argo Tunnel team we help make origins accessible from the Internet in a secure and seamless manner. We also care deeply about productivity and developer experience for the team, so naturally we want to make sure we have a development environment that is reliable, easy to set up and fast to iterate on.

A brief history of our development environment (dev-stack)

Docker compose

When our development team was still small, we used a docker-compose file to orchestrate the services needed to develop Argo Tunnel. There was no native support for hot reload, so every time an engineer made a change, they had to restart their dev-stack.

We could hack around it to hot reload with docker-compose, but when that failed, we had to waste time debugging the internals of Docker. As the team grew, we realized we needed to invest in improving our dev stack.

At the same time Cloudflare was in the process of migrating from Marathon to kubernetes (k8s). We set out to find a tool that could detect changes in source code and automatically upgrade pods with new images.

Skaffold + Minikube

Initially Skaffold seemed to match the criteria. It watches for change in source code, builds new images and deploys applications onto any k8s. Following Skaffold’s tutorial, we picked minikube as the local k8s, but together they didn’t meet our expectations. Port forwarding wasn’t stable, we got frequent connections refused or timeout.

In addition, iteration time didn’t improve, because spinning up minikube takes a long time and it doesn’t use the host’s docker registry and so it can’t take advantage of caching. At this point we considered reverting back to using docker compose, but the k8s ecosystem is booming, so we did some more research.

Tilt + Docker for mac k8s

Eventually we found a great blog post from Tilt comparing different options for local k8s, and they seem to be solving the exact problem we are having. Tilt is a tool that makes local development on k8s easier. It detects changes in local sources and updates your deployment accordingly.

In addition, it supports live updates without having to rebuild containers, a process that used to take around 20 minutes. With live updates, we can copy the newest source into the container, run cargo build within the container, and restart the service without building a new image. Following Tilt’s blog post, we switched to Docker for Mac’s built-in k8s. Combining Tilt and Docker for Mac k8s, we finally have a development environment that meets our needs.

Rust services that could take 20 minutes to rebuild now take less than a minute.

Collaborating with a distributed team

We reached a much happier state with our dev-stack, but one problem remained: we needed a way to share it. As our teams became distributed with people in Austin, Lisbon and Seattle, we needed better ways to help each other.

One day, I was helping our newest member understand an error observed in cloudflared, Argo Tunnel’s command line interface (CLI) client. I knew the error could either originate from the backend service or a mock API gateway service, but I couldn’t tell for sure without looking at logs.

To get them, I had to ask our new teammate to manually send me the logs of the two services. By the time I discovered the source of the error, reviewed the deployment manifest, and determined the error was caused by a secret set as an empty string, two full hours had elapsed!

I could have solved this in minutes if I had remote access to her development environment. That’s exactly what Argo Tunnel can do! Argo Tunnel provides remote access to development environments by creating secure outbound-only connections to Cloudflare’s edge network from a resource exposing it to the Internet. That model helps protect servers and resources from being vulnerable to attack by an exposed IP address.

I can use Argo Tunnel to expose a remote dev environment, but the information stored is sensitive. Once exposed, we needed a way to prevent users from reaching it unless they are an authenticated member of my team. Cloudflare Access solves that challenge. Access sits in front of the hostname powered by Argo Tunnel and checks for identity on every request. I can combine both services to share the dev-stack details with the rest of the team in a secure deployment.

The built-in k8s dashboard gives a great overview of the dev-stack, with the list of pods, deployments, services, config maps, secrets, etc. It also allows us to inspect pod logs and exec into a container. By default, it is secured by a token that changes every time the service restarts. To avoid the hassle of distributing the service token to everyone on the team, we wrote a simple reverse proxy that injects the service token in the authorization header before forwarding requests to the dashboard service.

Then we run Argo Tunnel as a sidecar to this reverse proxy, so it is accessible from the Internet. Finally, to make sure no random person can see our dashboard, we put an Access policy that only allows team members to access the hostname.

The request flow is eyeball -> Access -> Argo Tunnel -> reverse proxy -> dashboard service

How Argo Tunnel engineering uses Argo Tunnel

Working example

Your team can use the same model to develop remotely. Here’s how to get started.

  1. Start a local k8s cluster. https://docs.tilt.dev/choosing_clusters.html offers great advice in choosing a local cluster based on your OS and experience with k8s
How Argo Tunnel engineering uses Argo Tunnel

2. Enable dashboard service:

How Argo Tunnel engineering uses Argo Tunnel

3. Create a reverse proxy that will inject the service token of the kubernetes-dashboard service account in the Authorization header before forwarding requests to kubernetes dashboard service

package main
 
import (
   "crypto/tls"
   "fmt"
   "net/http"
   "net/http/httputil"
   "net/url"
   "os"
)
 
func main() {
   config, err := loadConfigFromEnv()
   if err != nil {
       panic(err)
   }
   reverseProxy := httputil.NewSingleHostReverseProxy(config.proxyURL)
   // The default Director builds the request URL. We want our custom Director to add Authorization, in
   // addition to building the URL
   singleHostDirector := reverseProxy.Director
   reverseProxy.Director = func(r *http.Request) {
       singleHostDirector(r)
       r.Header.Add("Authorization", fmt.Sprintf("Bearer %s", config.token))
       fmt.Println("request header", r.Header)
       fmt.Println("request host", r.Host)
       fmt.Println("request ULR", r.URL)
   }
   reverseProxy.Transport = &http.Transport{
       TLSClientConfig: &tls.Config{
           InsecureSkipVerify: true,
       },
   }
   server := http.Server{
       Addr:    config.listenAddr,
       Handler: reverseProxy,
   }
   server.ListenAndServe()
}
 
type config struct {
   listenAddr string
   proxyURL   *url.URL
   token      string
}
 
func loadConfigFromEnv() (*config, error) {
   listenAddr, err := requireEnv("LISTEN_ADDRESS")
   if err != nil {
       return nil, err
   }
   proxyURLStr, err := requireEnv("DASHBOARD_PROXY_URL")
   if err != nil {
       return nil, err
   }
   proxyURL, err := url.Parse(proxyURLStr)
   if err != nil {
       return nil, err
   }
   token, err := requireEnv("DASHBOARD_TOKEN")
   if err != nil {
       return nil, err
   }
   return &config{
       listenAddr: listenAddr,
       proxyURL:   proxyURL,
       token:      token,
   }, nil
}
 
func requireEnv(key string) (string, error) {
   result := os.Getenv(key)
   if result == "" {
       return "", fmt.Errorf("%v not provided", key)
   }
   return result, nil
}

4. Create an Argo Tunnel sidecar to expose this reverse proxy

apiVersion: apps/v1
kind: Deployment
metadata:
 name: dashboard-auth-proxy
 namespace: kubernetes-dashboard
 labels:
   app: dashboard-auth-proxy
spec:
 replicas: 1
 selector:
   matchLabels:
     app: dashboard-auth-proxy
 template:
   metadata:
     labels:
       app: dashboard-auth-proxy
   spec:
     containers:
       - name: dashboard-tunnel
         # Image from https://hub.docker.com/r/cloudflare/cloudflared
         image: cloudflare/cloudflared:2020.8.0
         command: ["cloudflared", "tunnel"]
         ports:
           - containerPort: 5000
         env:
           - name: TUNNEL_URL
             value: "http://localhost:8000"
           - name: NO_AUTOUPDATE
             value: "true"
           - name: TUNNEL_METRICS
             value: "localhost:5000"
       # dashboard-proxy is a proxy that injects the dashboard token into Authorization header before forwarding
       # the request to dashboard_proxy service
       - name: dashboard-auth-proxy
         image: dashboard-auth-proxy
         ports:
           - containerPort: 8000
         env:
           - name: LISTEN_ADDRESS
             value: localhost:8000
           - name: DASHBOARD_PROXY_URL
             value: https://kubernetes-dashboard
           - name: DASHBOARD_TOKEN
             valueFrom:
               secretKeyRef:
                 name: ${TOKEN_NAME}
                 key: token

5. Find out the URL to access your dashboard from Tilt’s UI

How Argo Tunnel engineering uses Argo Tunnel

6. Share the URL with your collaborators so they can access your dashboard anywhere they are through the tunnel!

How Argo Tunnel engineering uses Argo Tunnel

You can find the source code for the example in https://github.com/cloudflare/argo-tunnel-examples/tree/master/sharing-k8s-dashboard

If this sounds like a team you want to be on, we are hiring!