All posts by Zabbix LatAm

Optimizing Incident Management with Zabbix and PagerDuty

Post Syndicated from Zabbix LatAm original https://blog.zabbix.com/optimizing-incident-management-with-zabbix-and-pagerduty/30114/

When monitoring environments, we sometimes need to rely on third-party tools to better manage functionality and optimize responses to alerts. Let’s explore how to integrate Zabbix with PagerDuty, a real-time incident management solution designed to improve the reliability of digital services, including best practices and configuration details.

What is PagerDuty?

PagerDuty is a real-time incident management platform designed to help IT teams react quickly to critical events. The tool helps organizations automate and manage incident response through a system of alerts, escalation, and coordination between teams. When a problem is detected in the system, PagerDuty notifies the responsible individuals and ensures that corrective action is taken quickly. This reduces downtime and improves operational efficiency. Integration with monitoring tools such as Zabbix makes it easy to identify issues before they impact users.

Some of PagerDuty’s key features include:

• Integration with monitoring tools (such as Zabbix)
• Notifications in multiple channels (email, SMS, calls)
• Automatic escalation of incidents to ensure agile responses
• Event analysis to improve the detection of recurring problems

How to integrate PagerDuty with Zabbix

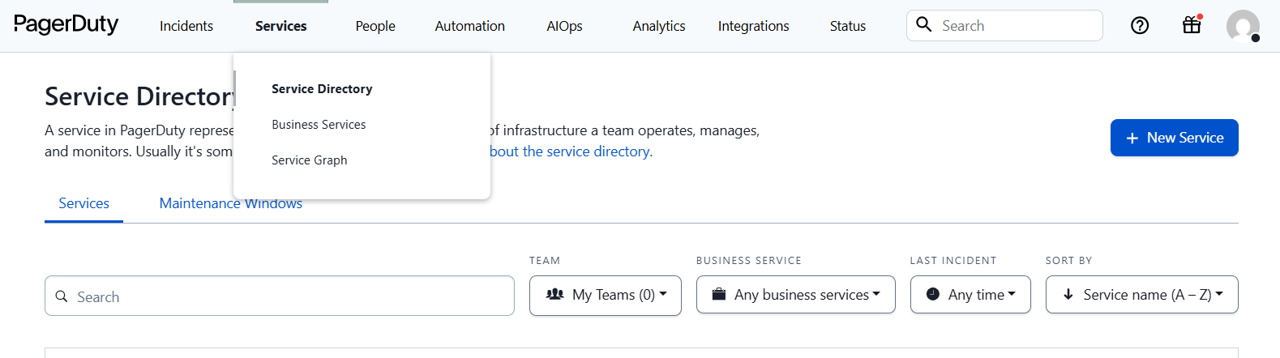
In PagerDuty, go to “Services” and click on “Service Directory.” Create a new service.

Give it a proper name and description.

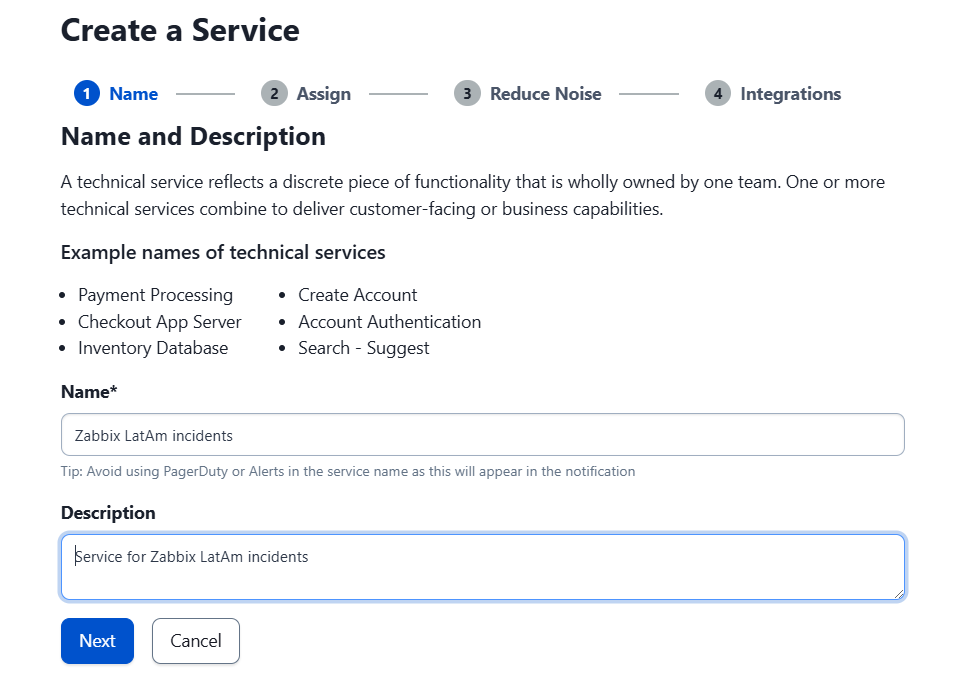
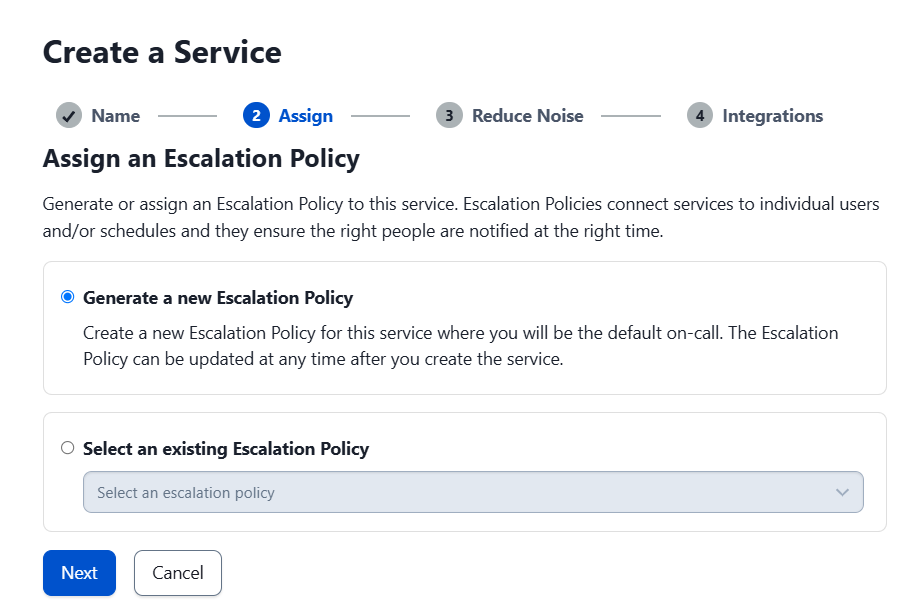
Accept the escalation terms and click “Next.”

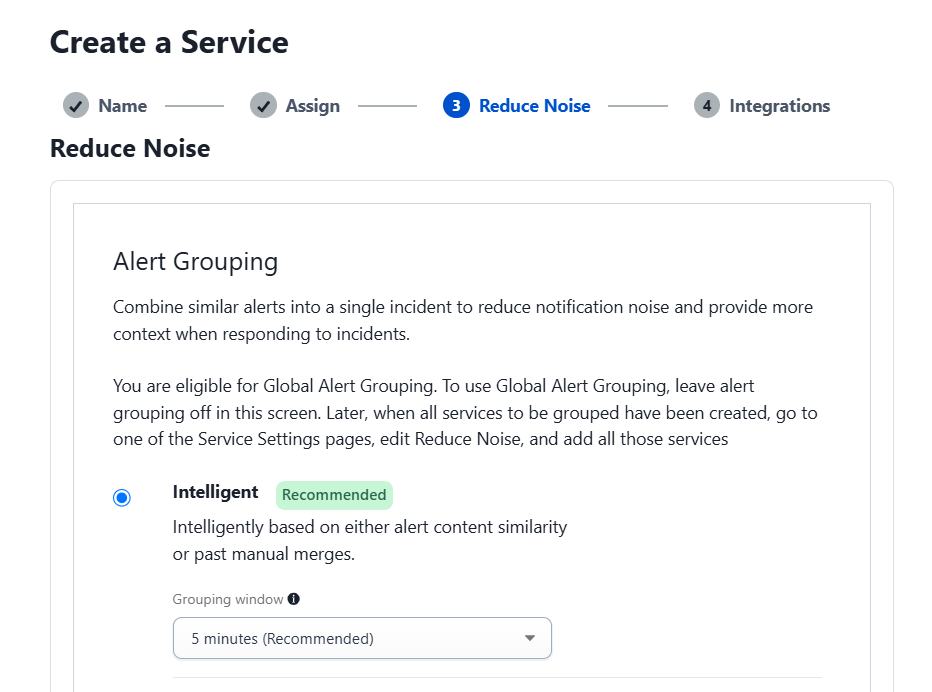
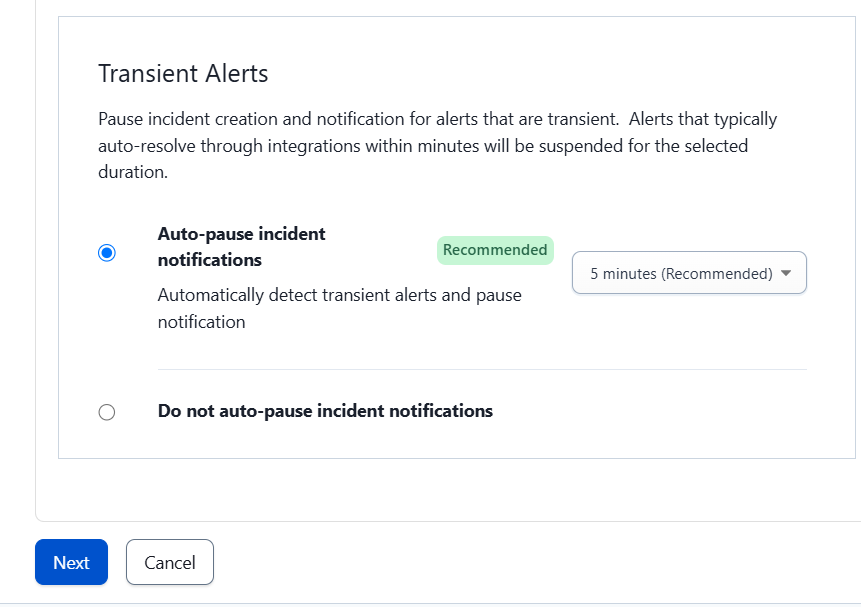
On the next screen, select “Intelligent” and the “Auto-pause incident notifications” option, then click “Next.”

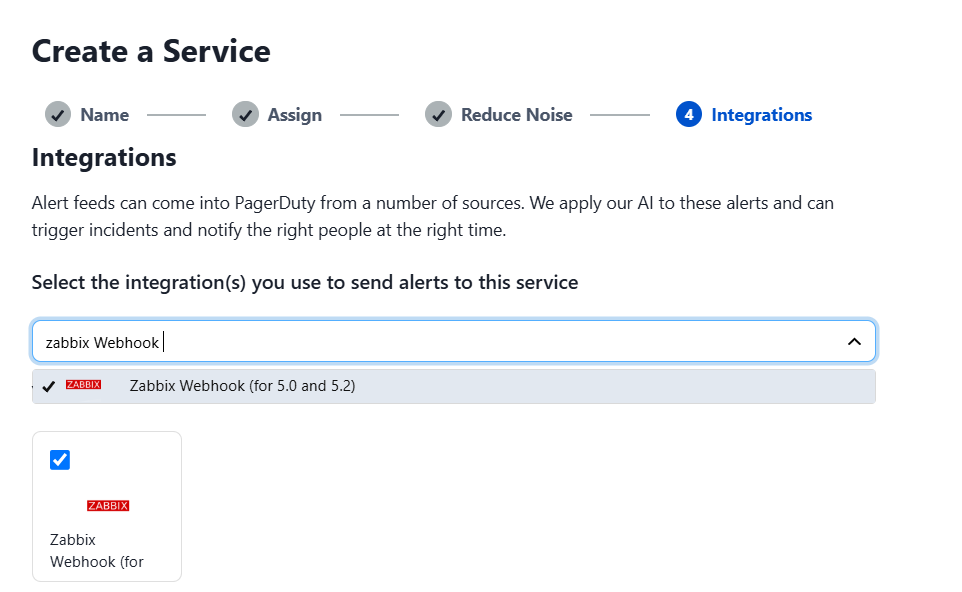
The next step is to add the Zabbix Webhook service, which will allow integration with Zabbix, and then click “Next.”

In Services > Service Directory, select the name of the service. In the “Integrations” tab, copy the integration token that is generated.

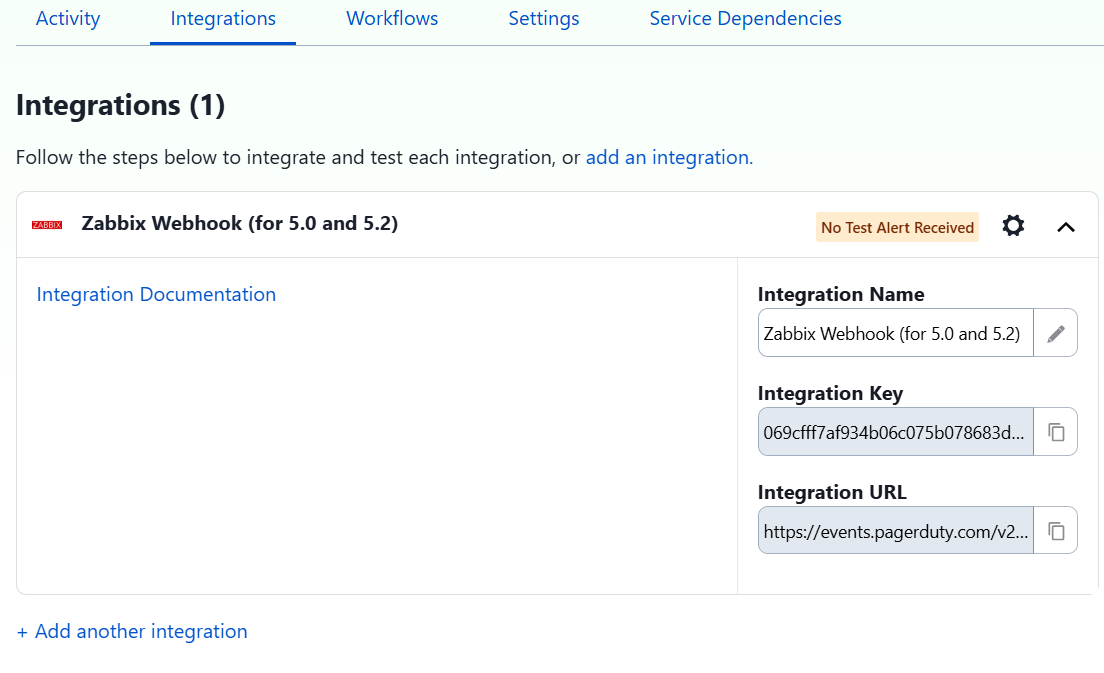
It is important to note that the PagerDuty webhook only shows the option of Zabbix versions 5.0 to 5.2, but it works correctly in later versions such as Zabbix 7.2, which was tested without any issues.

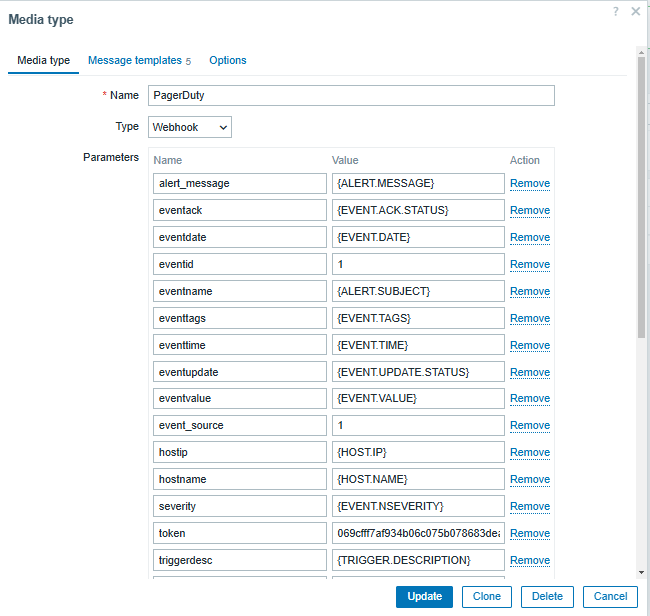
On Zabbix Server, go to Alerts > Media types > PagerDuty. Enter the integration token, the Zabbix URL, and select “Update.”

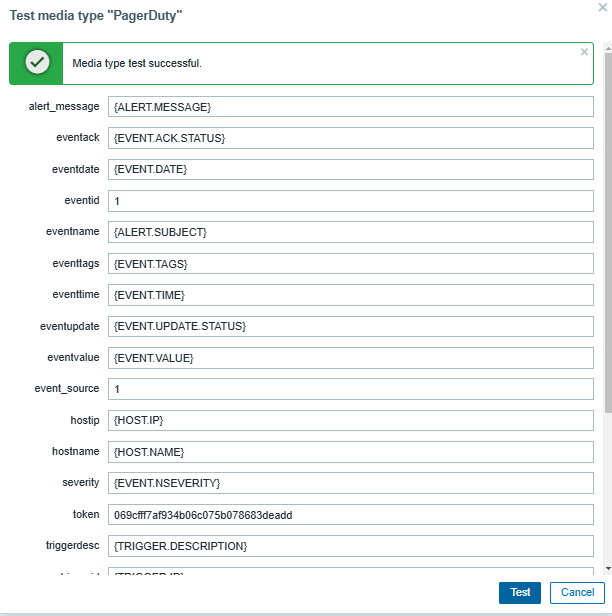
Send a test message to confirm that the integration is working correctly.

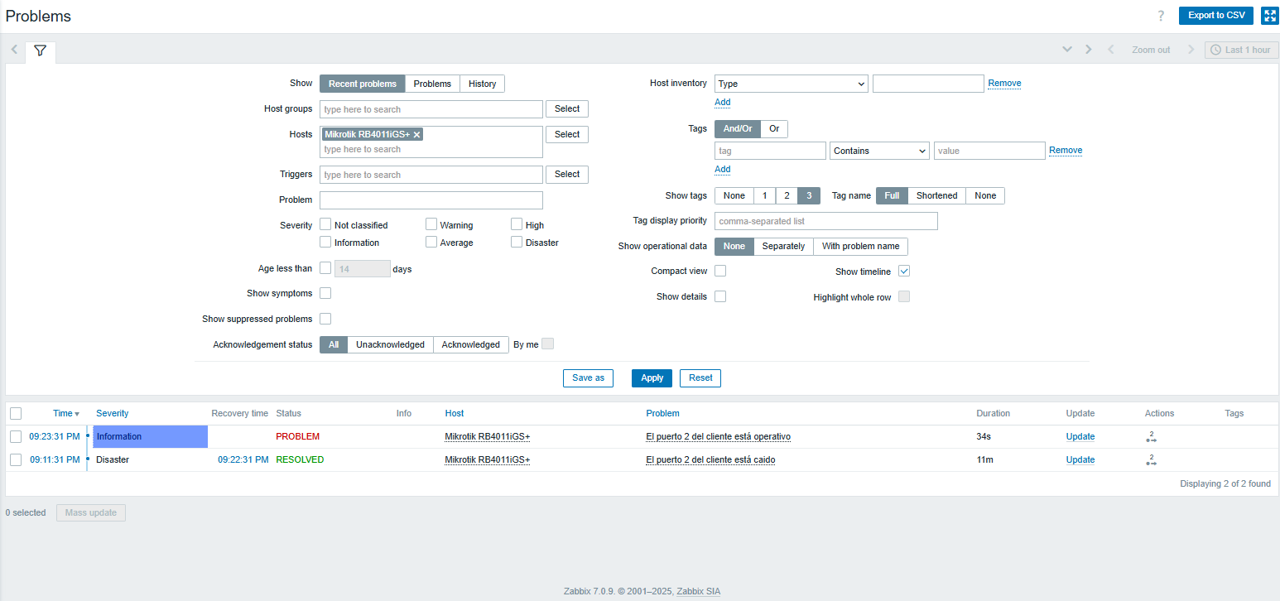
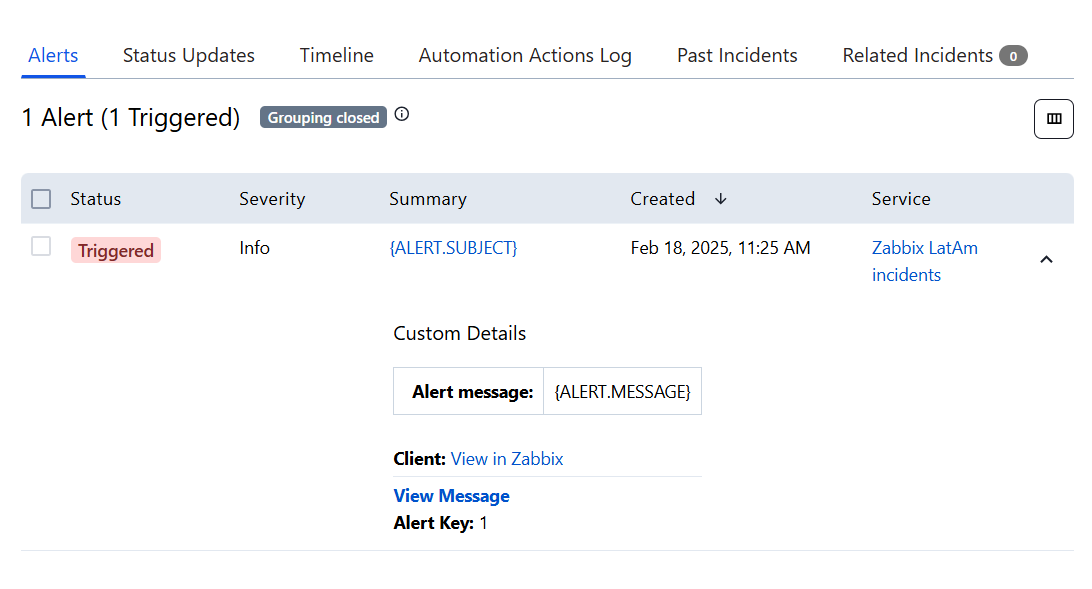
In the PagerDuty application, verify that the test alert was received.

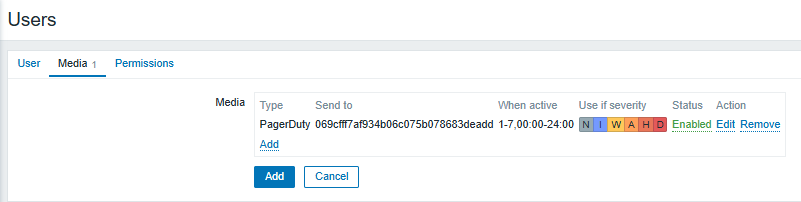
To send notifications, you need to grant permissions to a user in Zabbix. Go to Users > Create User. In the “Media” tab, select PagerDuty as the notification method. Set the severity of the alerts you want to receive.

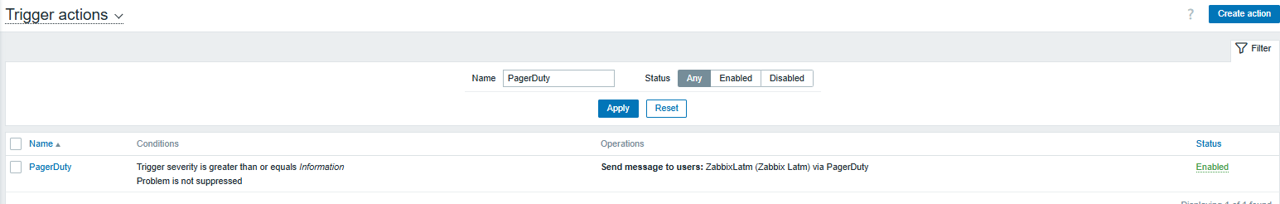
Subsequently, set up a Trigger Action in Alerts > Actions > Trigger Actions to define what types of alerts will be received (either by item or trigger) according to the needs of your team.

Best practices for integrating Zabbix and PagerDuty

Customize notifications: Set rules to send only truly critical alerts, avoiding unnecessary notifications.
Optimize escalations: Set up escalation rules so that alerts reach the right people at the right time.
Monitor key metrics: Measure incident response times and adjust workflows as needed.
Automate incident responses: Use PagerDuty’s capabilities to perform automated tasks in response to specific events.
Notify about service failures: Use PagerDuty to start running recovery scripts, send notifications to the responsible teams, or even escalate the problem to a higher level if there is no solution in a stipulated length of time.

Conclusion

Zabbix’s integration with PagerDuty allows you to monitor the status of critical services in real time, even outside of working hours. This facilitates rapid incident response and improves your IT team’s ability to react.

This combination not only optimizes incident management but also helps minimize downtime, improve operational efficiency, and ensure the reliability of monitored systems.

With proper configuration and best practices, integrating Zabbix with PagerDuty can become essential for the proactive management of your technological infrastructure.


The post Optimizing Incident Management with Zabbix and PagerDuty appeared first on Zabbix Blog.

Installing and Configuring Zabbix Server and Agent on Windows

Post Syndicated from Zabbix LatAm original https://blog.zabbix.com/installing-and-configuring-zabbix-server-and-agent-on-windows/29945/

Monitoring a Windows server helps verify and keep track of reboots, disk space, memory, CPU, communication loss, and high bandwidth consumption within the server – in fact, anything unusual that may require attention. In this post, we’ll see how to install and configure the Zabbix server and Zabbix agent on Windows, highlighting the key points that will keep your system running smoothly.

Check Zabbix server version

First, check which version of Zabbix server you’re using. This can be verified from the frontend in Reports > System information. In this example, we use version 7.0.9.

Before you begin, head over to your Windows server and verify the name and type of architecture.

This is critical to selecting the right agent during deployment.

Download the Zabbix agent

From the official Zabbix website, download the corresponding agent, taking into account the operating system (in this case, Windows), the hardware architecture (64 bits), the version of Zabbix server (ensuring compatibility with the version used), encryption (using OpenSSL as an encryption method), and the installation format (selecting the MSI file).

Select the current version of the release and download.

Install the Zabbix agent

Start installing the Zabbix Agent on the Windows server.

Accept the terms and conditions.

Check the components to be installed. You’ll need at least 8.70 MB of disk space.
The default installation path is C:\Program Files\Zabbix Agent\.

By default, the installer detects the name of the server. Enter the IP of your Zabbix Server. You can also use pre-shared keys.

Start the installation and wait for it to finish.

Configure host in Zabbix Server

To set up a host on Zabbix Server, go to the Zabbix frontend and go to Data collection > Hosts.

Then, click Create host (located in the top right) and configure the following details:

• The hostname (DESKTOP-D75R1IG)
• An identifying display name (such as ‘Windows Server’)
• The template (select ‘Windows by Zabbix Agent’)
• The group (assigns the server to an appropriate group)
• The interface (choose the agent monitoring option and enter the IP of the server)

Monitoring and visualization

Once the host is configured, you will start receiving data from the server in Zabbix, including:

• Overall performance: CPU, memory, and disk status.

• Windows services and detailed host information.

• Bandwidth consumption

Conclusion

Zabbix provides an ideal template for a productive environments on Windows, making it a key tool for global monitoring of your servers.

In addition, you can extend and adapt the monitoring according to your needs, such as monitoring logs, ports, or specific events, while also checking for login failures or other critical issues in your systems.


The post Installing and Configuring Zabbix Server and Agent on Windows appeared first on Zabbix Blog.

The First Steps Toward Monitoring with Zabbix and SNMP

Post Syndicated from Zabbix LatAm original https://blog.zabbix.com/the-first-steps-toward-monitoring-with-zabbix-and-snmp/29784/

In this article, we’ll explore how to use Zabbix to monitor a MikroTik device via SNMP, using specific templates that allow you to visualize the status of interfaces and their performance. Read on to understand how to use network monitoring to ensure the correct operation and performance of devices in an infrastructure employing the SNMP protocol.

Verifying SNMP communication

Before you begin, make sure that SNMP communication is configured correctly on your MikroTik device. Also, set up an appropriate SNMP community for your equipment.

Create a host in Zabbix

Once SNMP is configured, go to Data Collection > Hosts > Create Host.

Here you will need to enter the basic details of the device, such as the name, IP, and the group it belongs to. If you are working with multiple MikroTik devices, organize the hosts into groups according to their characteristics.

Apply a template

Zabbix offers a wide variety of default templates that fit different device models. By selecting the appropriate template for your MikroTik device, you will be able to view all its resources efficiently.

Configure SNMP macros

In the Macros section, specify the SNMP community you previously configured on your MikroTik.

Then, click “Update” to save the changes. This configuration will allow Zabbix to access the device data.

If you are monitoring multiple devices using the same SNMP community, it is best to configure a global macro in the path Administration > Macros.

This will allow you to efficiently manage a network of devices without having to configure them individually.


Visualization and monitoring

After completing the above steps, you will be able to start viewing device information directly in Zabbix, including:

Overall device performance:

Connected interfaces:

Items

Zabbix can capture a new interface automatically at defined intervals. This makes it easy to monitor a new interface without the need to include it manually, thanks to the Network Interfaces Discovery functionality.

To analyze the status, we can go to Data Collection > Hosts, find our MikroTik device, and select Items.

In this section, we can observe interface 2 of our client, which appears as a dependent item. This means that there is a master item that collects data through MIBs, which are network information databases. These items in the description section provide much more detailed and technical information about their functionality.

Configuration of specific items for interfaces

If we want to create a specific item, we must access Data Collection > Hosts > Create Item.

We must also assign a name that identifies SNMP Agent, specify the key that identifies the parameter to be monitored, analyze the corresponding MIB to capture the OID, and define the metrics capture interval according to our monitoring needs.

To validate the OID using snmpwalk, it returns the information of the MIB IF-MIB::ifOperStatus.2, which represents the interface status.

Configuration of custom triggers

To configure a trigger to alert us about the status of the interface, we go to Data Collection > Hosts > Triggers > Create Trigger.

Then, we assign a descriptive name to the trigger (either manually or by using macros), define the event that will trigger the alert, set the appropriate severity, and create a logical expression that determines the status.

State 2 → The interface is down.

Status 1 → The interface is operational.

To correctly interpret SNMP values in Zabbix, we go to Data Collection > Templates > MikroTik RB4011iGS+RM by SNMP > Value Mapping.

From here, we can observe the values returned by SNMP and configure our triggers based on them.

Finally, we can test our configuration in Monitoring > Problems, where we can see the triggers running.

Advantages of using SNMP with Zabbix

Using Zabbix as a monitoring tool not only facilitates network management, but also allows you to monitor third-party applications that use the SNMP protocol.

Its flexibility, together with the wide range of templates and configurations, make it the best choice for optimizing resources and ensuring stable performance in your infrastructure.


The post The First Steps Toward Monitoring with Zabbix and SNMP appeared first on Zabbix Blog.