The new Zabbix proxy groups provide us with a method to provide both redundancy and load balancing in our Zabbix proxy setups. However, one major limitation arises when we want to use SNMP traps with these new proxy groups – it isn’t natively supported at the moment. One of our customers asked me to find a solution to that problem, so here’s how I went about it.
Getting to grips with the problem
As mentioned, many of us are now facing a problem. Either we use proxy groups and we don’t use SNMP traps, or we use proxy groups and move SNMP traps to a single proxy. Unfortunately, this is unacceptable for many environments where SNMP traps might be an essential part of monitoring. The problem, however, stems from how snmptrapd works in combination with Zabbix reading the trapper file. Improvements have already been made to provide for more room when creating our own solutions like this.
Other Zabbix users have also been proposing solutions and I’m sure Zabbix is looking into improvements. Here’s an example case to vote on.
However, that doesn’t solve many of our issues now. The problem starts when we are sending SNMP traps to a single proxy (Proxy 1 for example) and a Zabbix host (let’s say Zabbix host 2) is assigned to another proxy in the proxy group (Proxy 2 for example). In this situation, the trap is coming in on an incorrect monitoring proxy and Zabbix won’t be able to read the trap. It will simply not add it to the Zabbix database and ignore it.
The solution here is simple – we can configure our monitoring target like a switch or a router to send the SNMP trap to multiple sources. However, this will cause our trap to be sent over the network multiple times, increasing the load on our network. This is acceptable for smaller setups, but we were dealing with a setup that is sending hundreds of traps every second.
Finding a solution
With the problem laid out for us, we came up with a simple duplication setup that included these requirements:
Simple and easy to maintain/troubleshoot
Traps could only be sent over the network once
Works fast between failovers
Works with both redundancy and load balancing
Minimal extra packages
No easily corruptible shared file systems
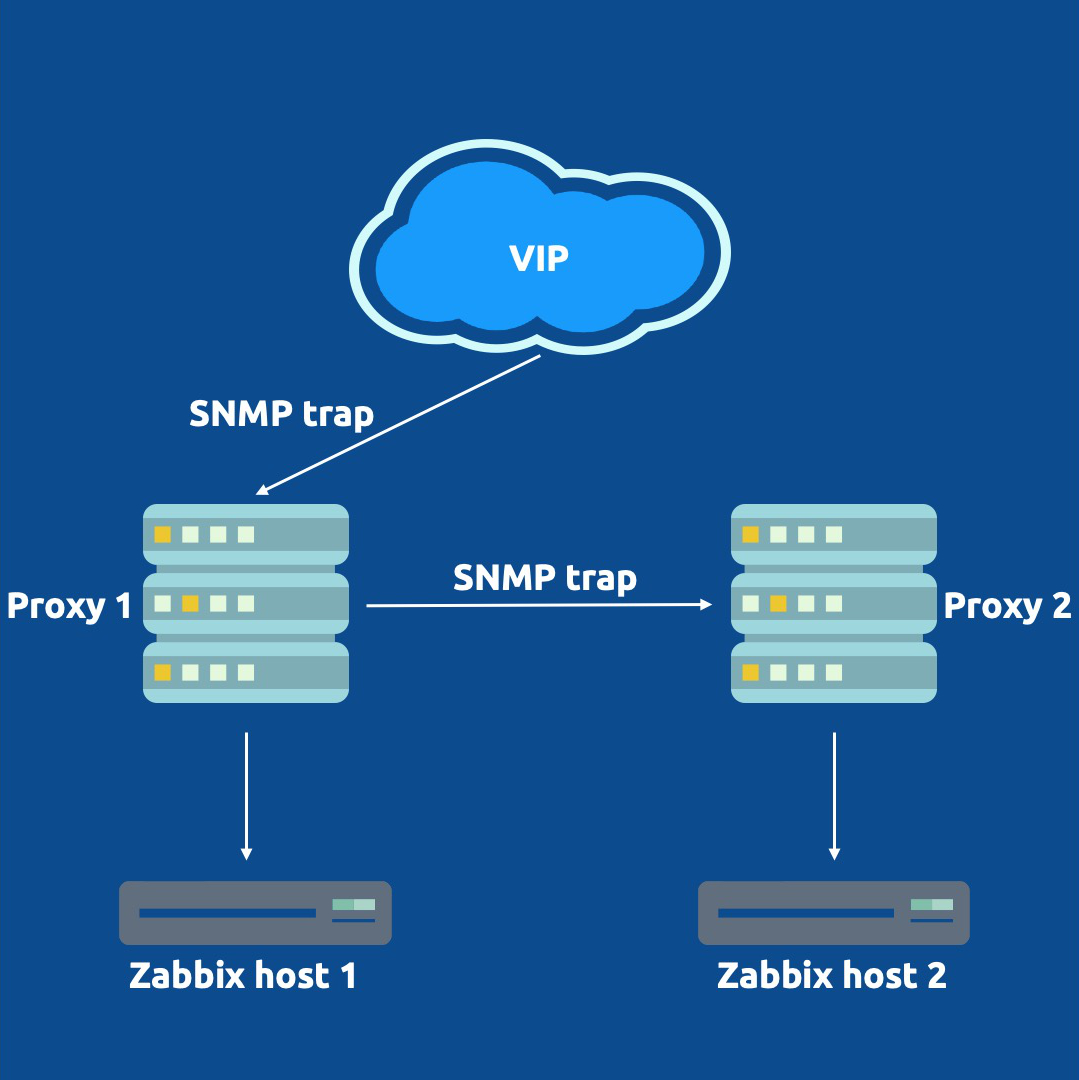
What we came up with in the end is visible in the image below:
It’s a simple setup that requires us to install 2 extra packages and a container.
First, we added a VIP to our proxy setup using keepalived, to provide our monitoring targets with a single SNMP trap destination. The VIP will be available on one proxy at the time, regardless of whether there are 2, 10 or more proxies in the proxy group. Our switches, routers, or any other SNMP trap host can now be configured to send traps to this VIP.
Second, we needed a way to duplicate our traps. Since only one proxy is going to be receiving traps, the other proxies still need to be able to receive the traps. Without the duplication and the VIP being present on Proxy 1, Zabbix host 2 still would not receive its trap. We installed Docker and created a tiny, lightweight container on our hosts to duplicate the SNMP trap from one proxy to all other proxies in the group. Admittedly this does slightly go against requirement number 2, as we are now sending the trap over the network between proxies. This is, however, all within our own more localized infrastructure instead of over a longer network.
That’s it! Whenever Proxy 1 receives a trap, it will now duplicate it to Proxy 2. The proxy with the host being monitoring will parse the trap correctly to Zabbix and the other proxies will ignore the trap. Even if the proxy restarts, fails over, or suddenly goes down, it will not read the trap twice.
The only thing to keep in mind is that it can take some time for keepalived to fail over the VIP. With SNMP traps being UDP-based, this means that any traps sent to the VIP while snmptrapd is down won’t be parsed. However, it’s definitely better to lose some in case of failover, than to lose all upon outage!
In this article, we’ll explore how to use Zabbix to monitor a MikroTik device via SNMP, using specific templates that allow you to visualize the status of interfaces and their performance. Read on to understand how to use network monitoring to ensure the correct operation and performance of devices in an infrastructure employing the SNMP protocol.
Table of Contents
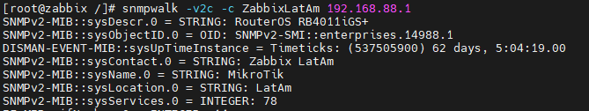
Verifying SNMP communication
Before you begin, make sure that SNMP communication is configured correctly on your MikroTik device. Also, set up an appropriate SNMP community for your equipment.
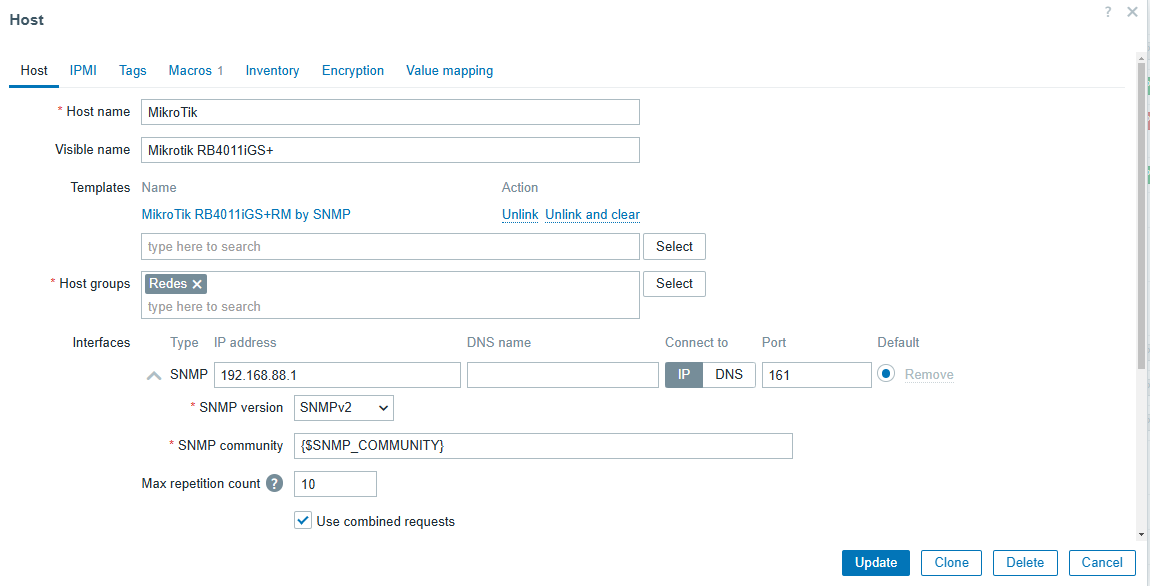
Create a host in Zabbix
Once SNMP is configured, go to Data Collection > Hosts > Create Host.
Here you will need to enter the basic details of the device, such as the name, IP, and the group it belongs to. If you are working with multiple MikroTik devices, organize the hosts into groups according to their characteristics.
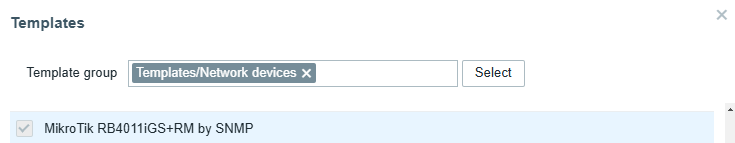
Apply a template
Zabbix offers a wide variety of default templates that fit different device models. By selecting the appropriate template for your MikroTik device, you will be able to view all its resources efficiently.
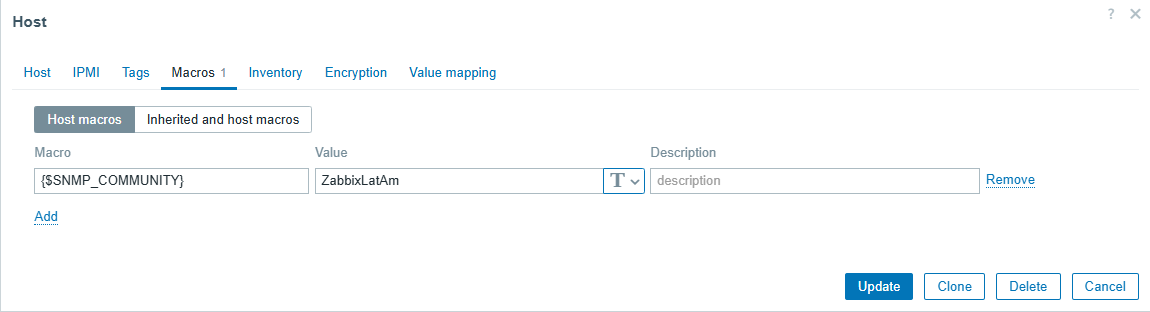
Configure SNMP macros
In the Macros section, specify the SNMP community you previously configured on your MikroTik.
Then, click “Update” to save the changes. This configuration will allow Zabbix to access the device data.
If you are monitoring multiple devices using the same SNMP community, it is best to configure a global macro in the path Administration > Macros.
This will allow you to efficiently manage a network of devices without having to configure them individually.
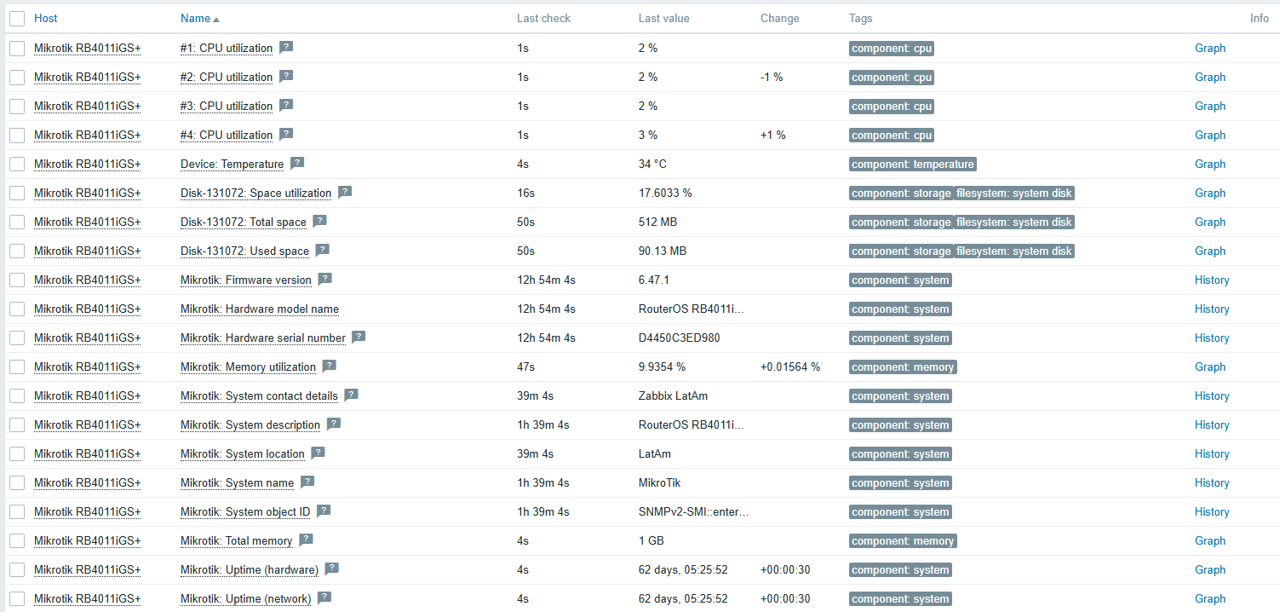
Visualization and monitoring
After completing the above steps, you will be able to start viewing device information directly in Zabbix, including:
Overall device performance:
Connected interfaces:
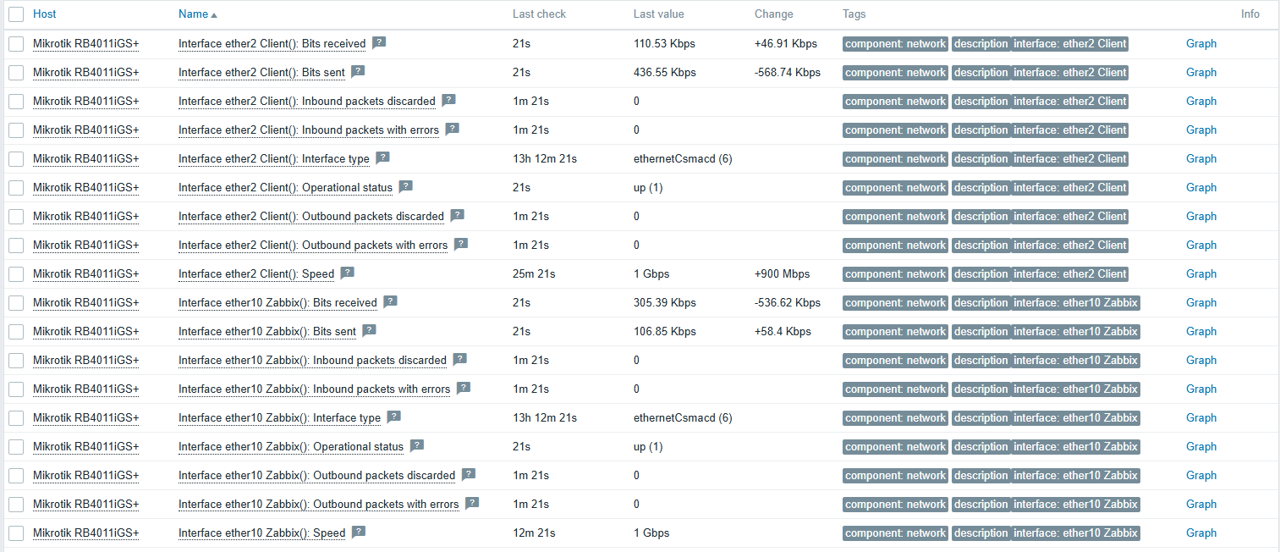
Items
Zabbix can capture a new interface automatically at defined intervals. This makes it easy to monitor a new interface without the need to include it manually, thanks to the Network Interfaces Discovery functionality.
To analyze the status, we can go to Data Collection > Hosts, find our MikroTik device, and select Items.
In this section, we can observe interface 2 of our client, which appears as a dependent item. This means that there is a master item that collects data through MIBs, which are network information databases. These items in the description section provide much more detailed and technical information about their functionality.
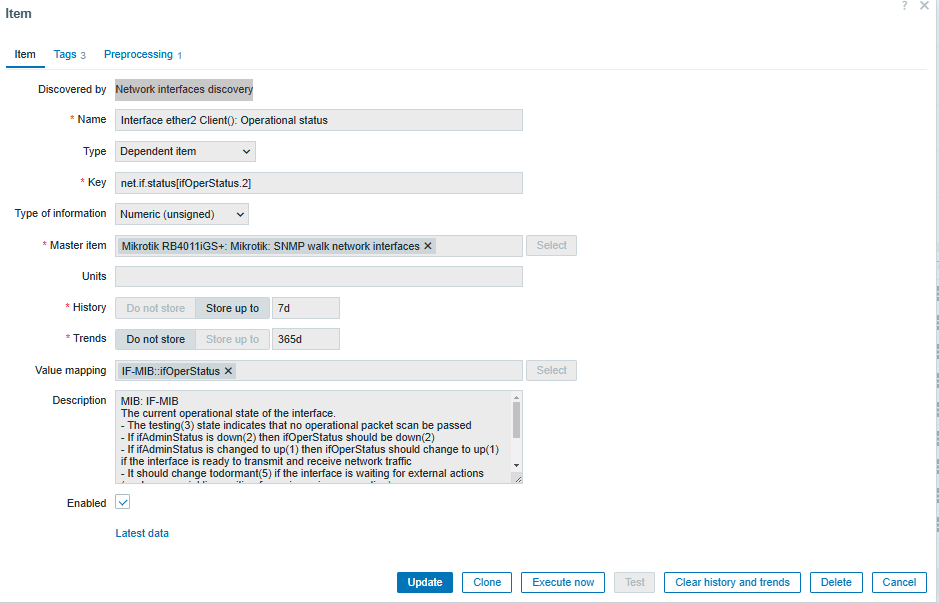
Configuration of specific items for interfaces
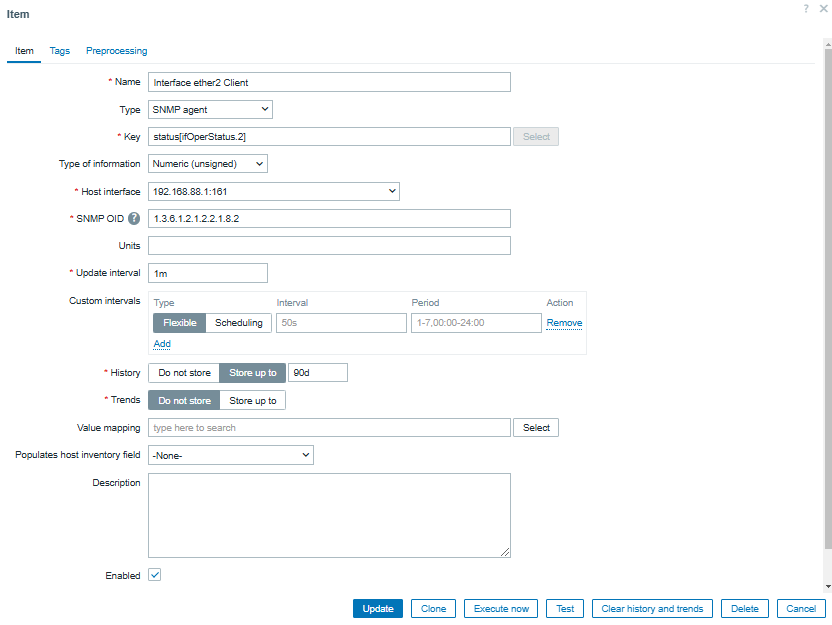
If we want to create a specific item, we must access Data Collection > Hosts > Create Item.
We must also assign a name that identifies SNMP Agent, specify the key that identifies the parameter to be monitored, analyze the corresponding MIB to capture the OID, and define the metrics capture interval according to our monitoring needs.
To validate the OID using snmpwalk, it returns the information of the MIB IF-MIB::ifOperStatus.2, which represents the interface status.
Configuration of custom triggers
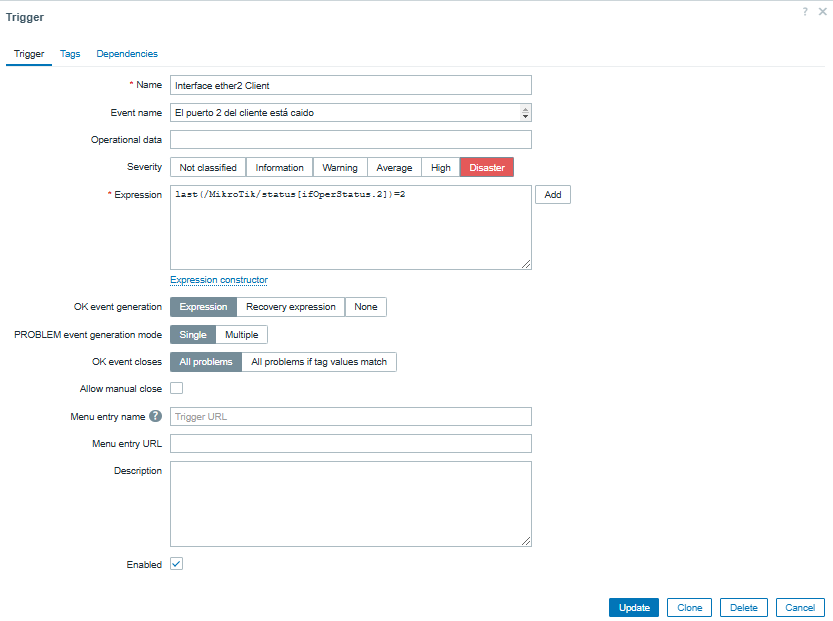
To configure a trigger to alert us about the status of the interface, we go to Data Collection > Hosts > Triggers > Create Trigger.
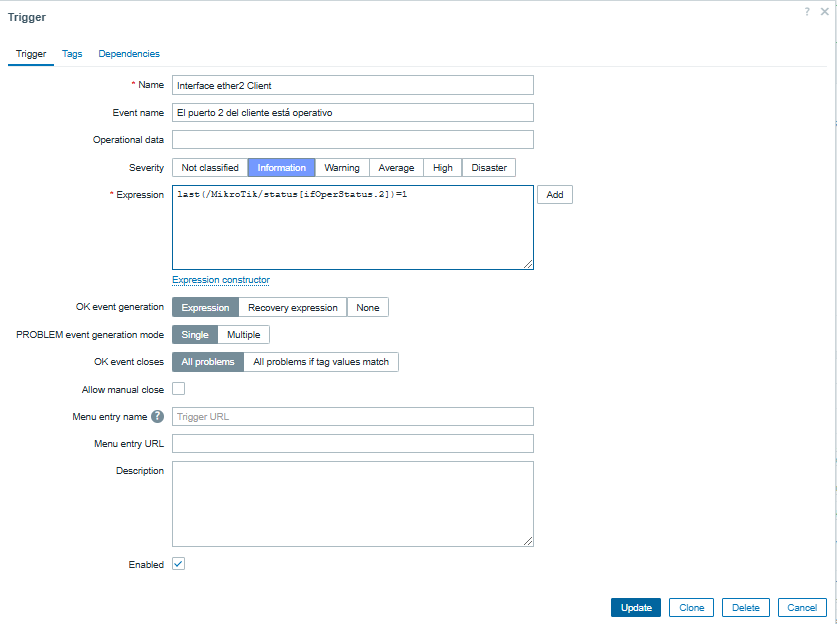
Then, we assign a descriptive name to the trigger (either manually or by using macros), define the event that will trigger the alert, set the appropriate severity, and create a logical expression that determines the status.
State 2 → The interface is down.
Status 1 → The interface is operational.
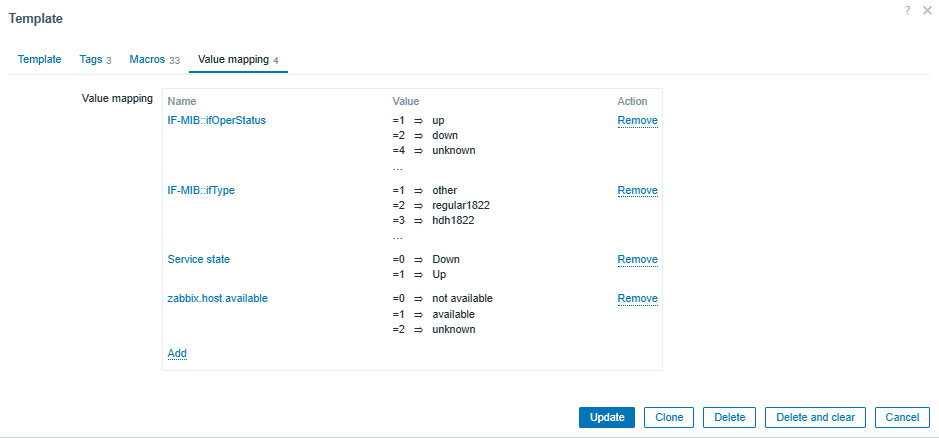
To correctly interpret SNMP values in Zabbix, we go to Data Collection > Templates > MikroTik RB4011iGS+RM by SNMP > Value Mapping.
From here, we can observe the values returned by SNMP and configure our triggers based on them.
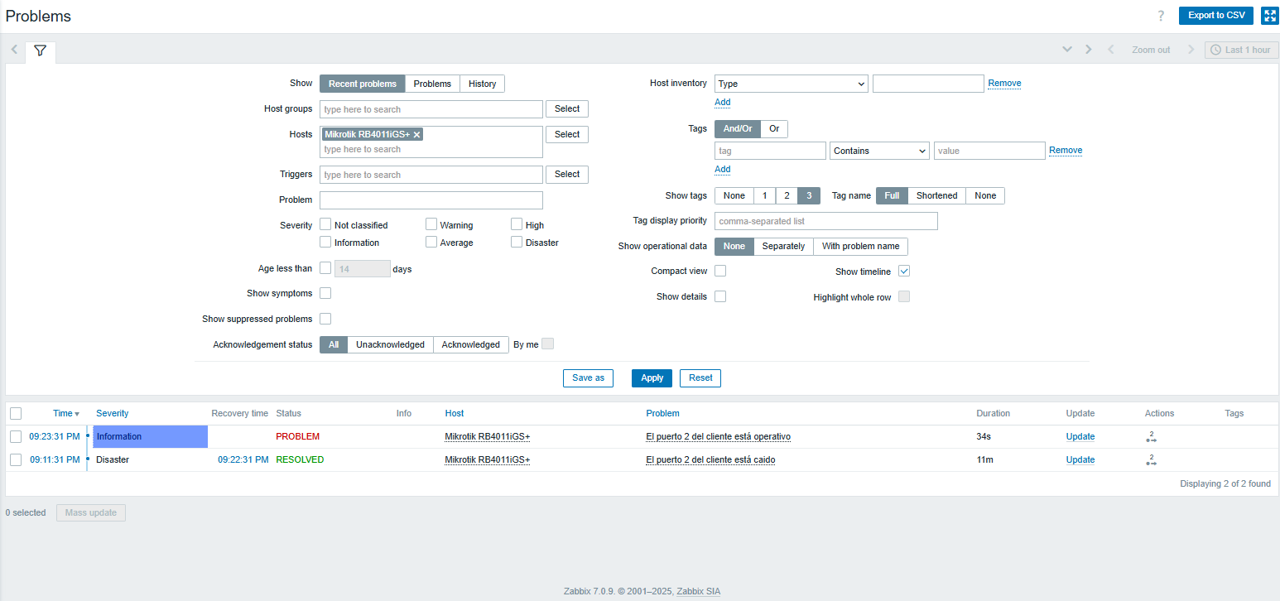
Finally, we can test our configuration in Monitoring > Problems, where we can see the triggers running.
Advantages of using SNMP with Zabbix
Using Zabbix as a monitoring tool not only facilitates network management, but also allows you to monitor third-party applications that use the SNMP protocol.
Its flexibility, together with the wide range of templates and configurations, make it the best choice for optimizing resources and ensuring stable performance in your infrastructure.
Zabbix 6.4 introduced major improvements to SNMP monitoring, especially when it comes to collecting large numbers of metrics from a single device. This is done by utilizing master-dependent item logic and combining it with low-level discovery and newly introduced preprocessing rules. This blog post will cover the drawbacks of the legacy SNMP monitoring approach, the benefits of the new approach, and the steps required to deploy bulk SNMP metric collection.
The legacy SNMP monitoring approach – potential pitfalls
Let’s take a look at the SNMP monitoring logic that all of us are used to. For our example here, we will look at network interface discovery on a network switch.
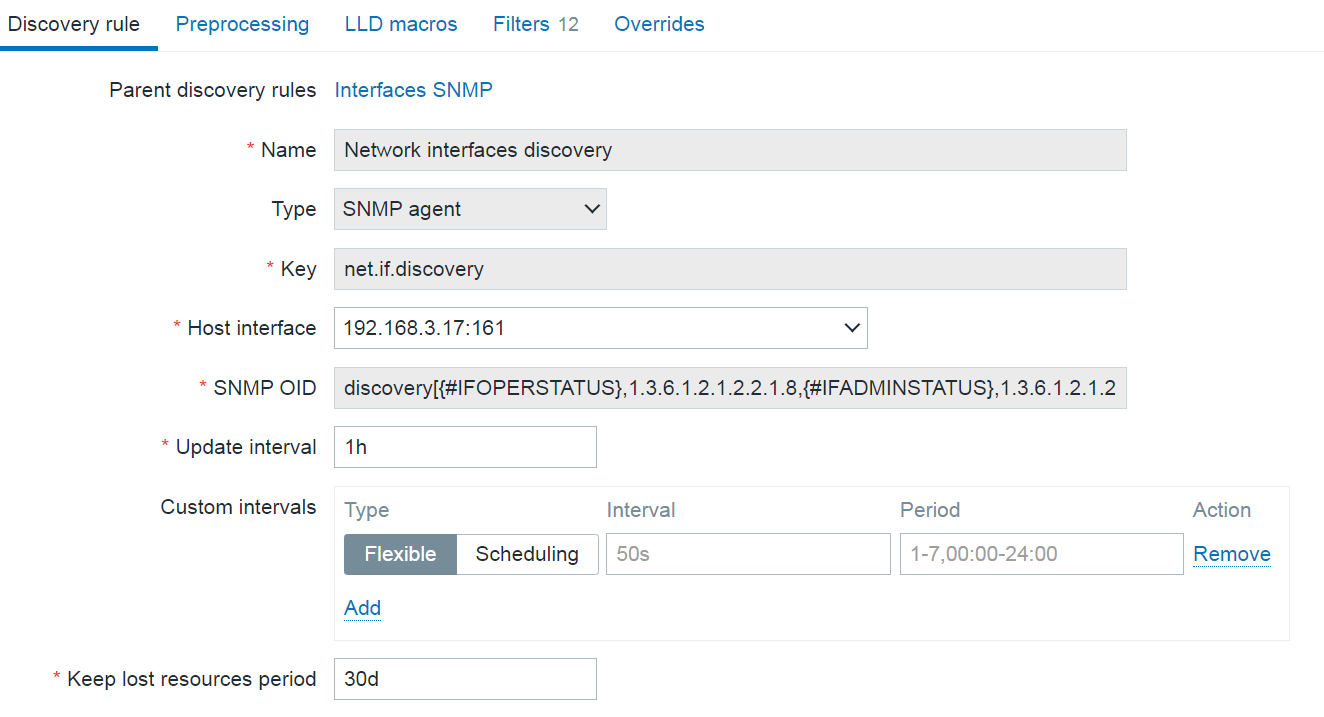
To start off, we create a low-level discovery rule. In the discovery rule, we specify which low-level discovery macros are collected from which OIDs. This way, we create multiple low-level discovery macro and OID pairs. Zabbix then goes through the list of indexes at the end of the specified OIDs and matches the collected values to low-level discovery macros. Zabbix also collects the list of discovered indexes for the specified OIDs and automatically matches them with the {#SNMPINDEX} low-level discovery macros.
Once the low-level discovery rule is created, we move on to creating item prototypes.
Items created based on this item prototype will collect metrics from the OIDs specified in the SNMP OID field and will create an item per index ( {#SNMPINDEX} macro) collected by the low-level discovery rule. Note that the item type is SNMP agent – each discovered and created item will be a regular SNMP item, polling the device and collecting metrics based on the item OID.
Now, imagine we have hundreds of interfaces and we’re polling a variety of metrics at a rapid interval for each interface. If our device has older or slower hardware, this can cause an issue where the device simply cannot process that many requests. To resolve this, a better way to collect SNMP metrics is required.
Bulk data collection with master – dependent items
Before we move on to the improved SNMP metric collection approach, we need to first take a look at how master-dependent item bulk metric collection and low-level discovery logic are implemented in Zabbix.
First, we create a master item, which collects both the metrics and low-level discovery information in a single go.
Next, we create a low-level discovery rule of type dependent item and point at the master item created in the previous step. At this point, we need to either ensure that the data collected by the master item is formatted in JSON or convert the data to JSON by using preprocessing.
Once we have ensured that our data is JSON-formatted, we can use the LLD macros tab to populate our low-level discovery macro values via JSONPath. Note: Here the SNMP low-level discovery with bulk metric collection uses a DIFFERENT APPROACH, designed specifically for SNMP checks.
Finally, we create item prototypes of type dependent item and once again point them at the master item created in the first step (Remember – our master item contains not only low-level discovery information, but also all of the required metrics). Here we use JSONPath preprocessing together with low-level discovery macros to specify which values should be collected. Remember that low-level discovery macros will be resolved to their values for each of the items created from the item prototype.
Improving SNMP monitoring performance with bulk metric collection
The SNMP bulk metric collection and discovery logic is very similar to what is discussed in the previous section, but it is more tailored to SNMP nuances.
Here, to avoid excessive polling, a new walk[] item has been introduced. The item utilizes GetBulk requests with SNMPv2 and v3 interfaces and GetNext for SNMPv1 interfaces to collect SNMP data. GetBulk requests perform much better by design. A GetBulk request retrieves values of all instances at the end of the OID tree in a single go, instead of issuing individual Get requests per each instance.
To utilize this in Zabbix, first we have to create a walk[] master item, specifying the list of OIDs from which to collect values. The retrieved values will be used in both low-level discovery (e.g.: interface names) and items created from low-level discovery item prototypes (e.g.: incoming and outgoing traffic).
Two new preprocessing steps have been introduced to facilitate SNMP bulk data collection:
SNMP walk to JSON is used to specify the OIDs from which the low-level discovery macros will be populated with their values
SNMP walk value is used in the item prototypes to specify the OID from which the item value will be collected
The workflow for SNMP bulk data collection can be described in the following steps:
Create a master walk[] item containing the required OIDs
Create a low-level discovery rule of type dependent item which depends on the walk[] master item
Define low-level discovery macros by using the SNMP walk to JSON preprocessing step
Create item prototypes of type dependent item which depend on the walk[] master item, and use the SNMP walk value preprocessing step to specify which OID should be used for value collection
Monitoring interface traffic with bulk SNMP data collection
Let’s take a look at a simple example which you can use as a starting point for implementing bulk SNMP metric collection for your devices. In the following example we will create a master walk[] item, a dependent low-level discovery rule to discover network interfaces, and dependent item prototypes for incoming and outgoing traffic.
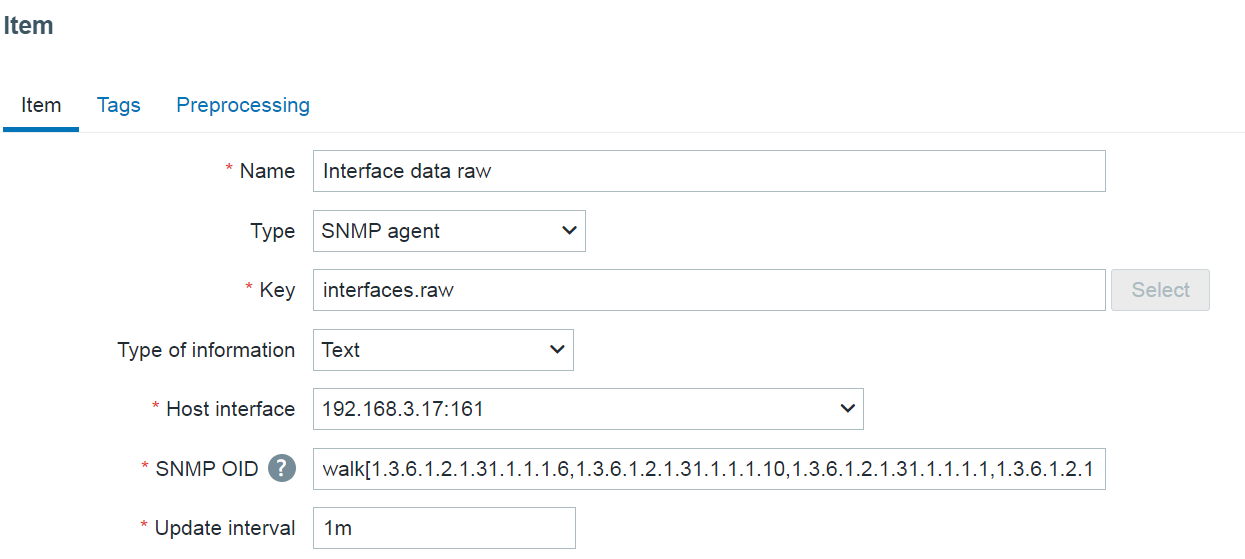
Creating the master item
We will start by creating the walk[] SNMP agent master item. The name and the key of the item can be specified arbitrarily. What’s important here is the OID field, where we will specify the list of comma separated OIDs from which their instance values will be collected.
By looking at these values we can confirm that the item collects values required for both the low-level discovery rule (interface name, type, and description) and the items created from item prototypes (incoming/outgoing traffic).
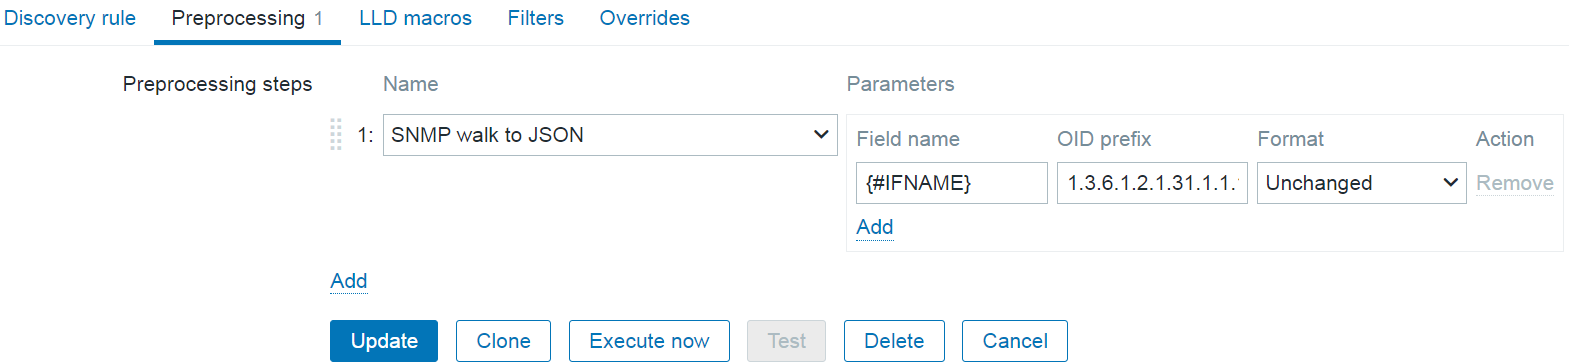
Creating the low-level discovery rule
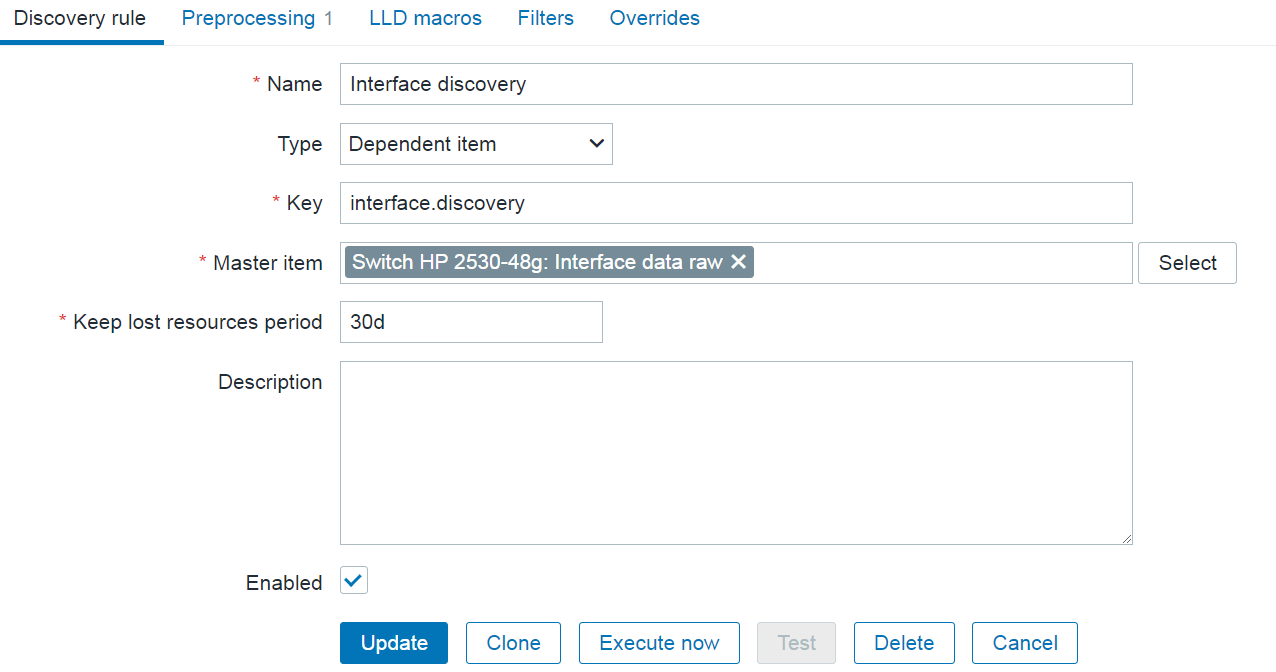
As our next step, we will create a dependent low-level discovery rule which will discover interfaces based on the data from the master walk[] item.
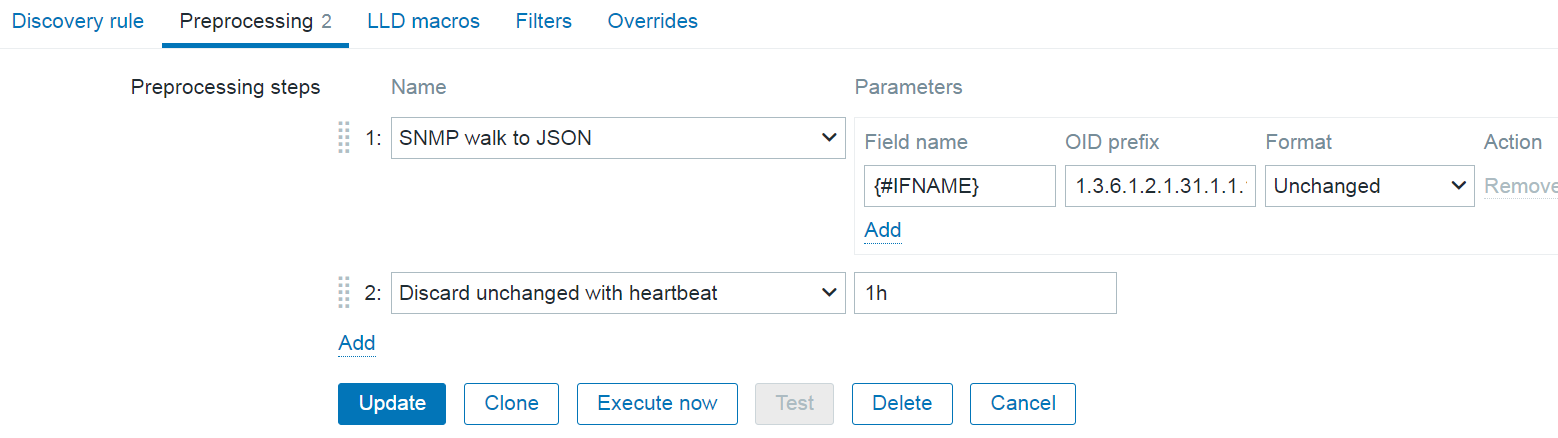
The most important part of configuring the low-level discovery rule lies in defining the SNMP walk to JSON preprocessing step. Here we can assign low-level discovery macros to OIDs. For our example, we will assign the {#IFNAME} macro to the OID containig the values of interface names:
The name and the key of the dependent item can be specified arbitrarily.
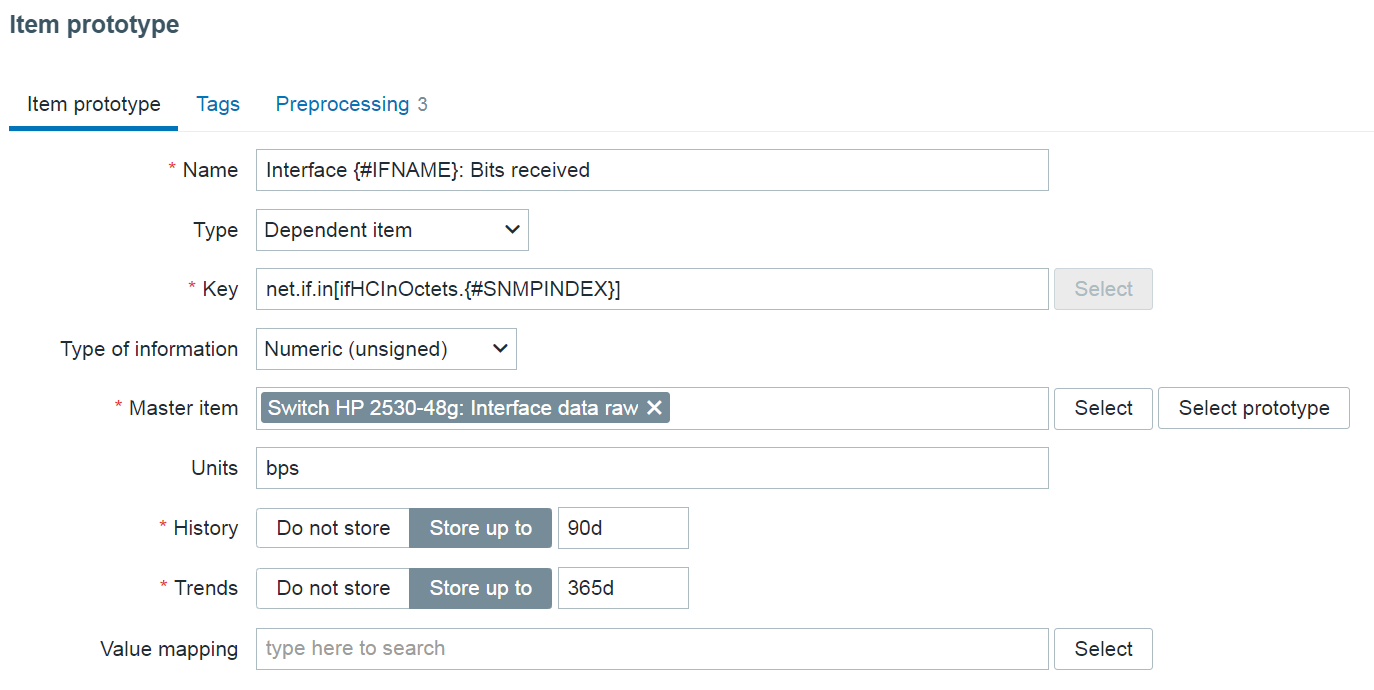
Creating item prototypes
Finally, let’s create two dependent item prototypes to collect traffic data from our master item.
Here we will provide an arbitrary name and key containing low-level discovery macros. On items created from the item prototypes, the macros will resolve as our OID values, thus giving each item a unique name and key.
Note: The {#SNMPINDEX} macro is automatically collected by the low-level discovery rule and contains the indexes from the OIDs specified in the SNMP walk to JSON preprocessing step.
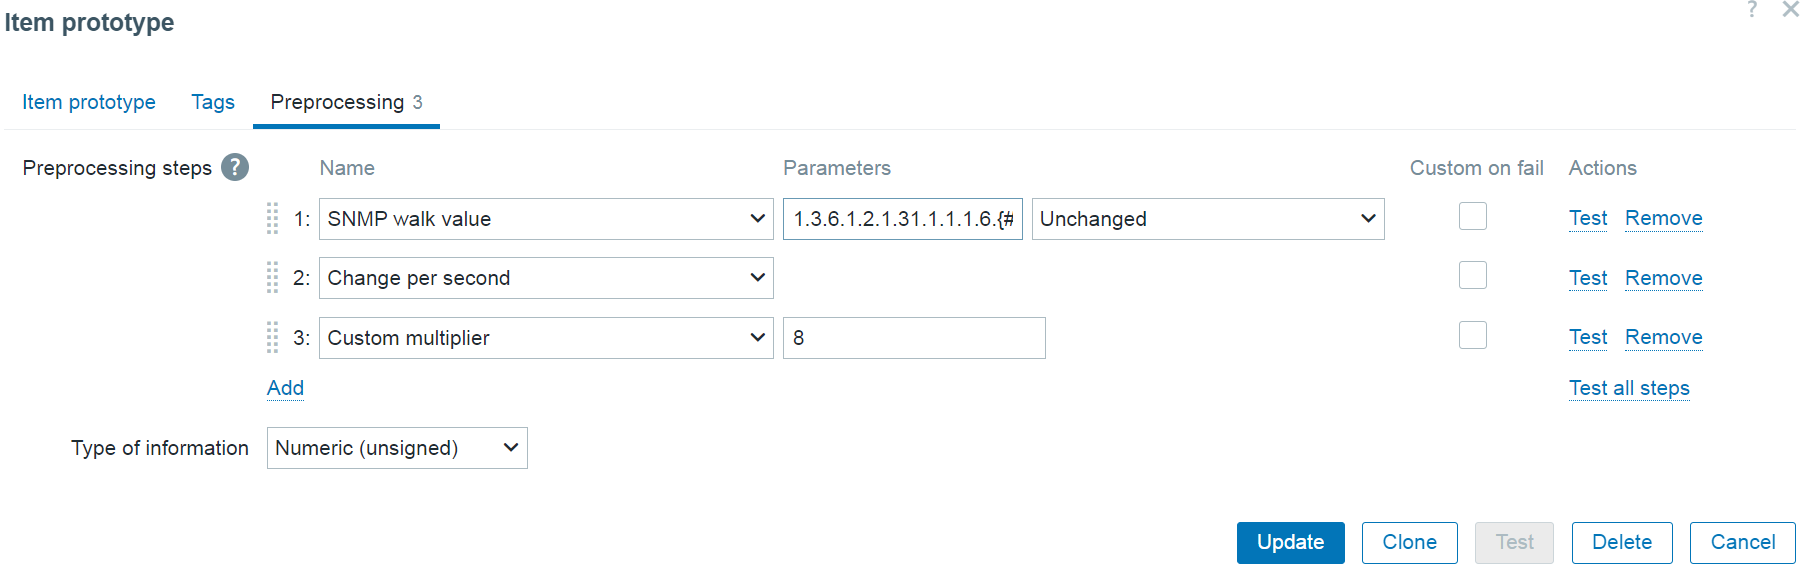
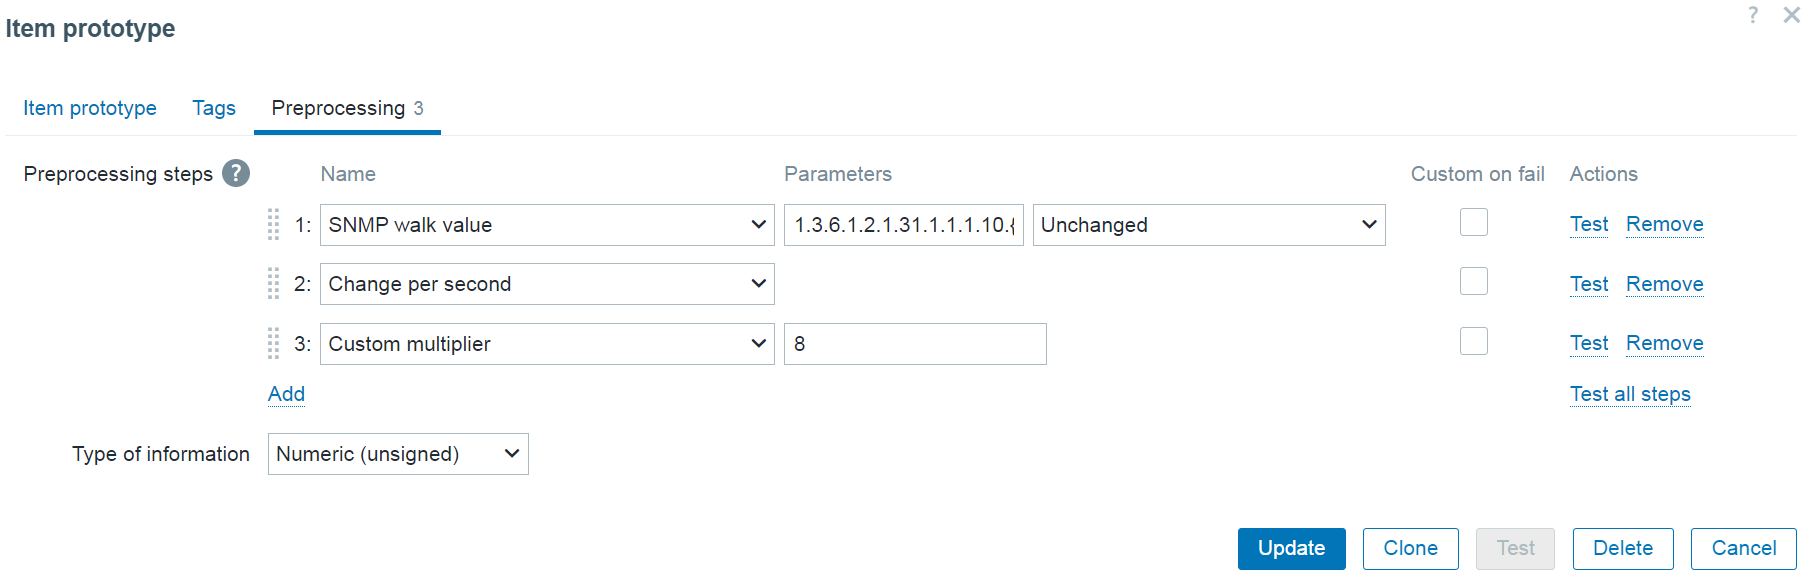
The final step in creating the item prototype is using the SNMP walk value preprocessing step to define which value will be collected by the item. We will also append the {#SNMPINDEX}macro at the end of the OID. This way, each item created from the prototype will collect data from a unique OID corresponding to the correct object instance.
SNMP walk value: 1.3.6.1.2.1.31.1.1.1.10.{#SNMPINDEX}
Outgoing traffic item preprocessing steps
Note: Since the collected traffic values are counter values (always increasing), the Change per second preprocessing step is required to collect the traffic per second values.
Note: Since the values are collected in bytes, we will use the Custom multiplier preprocessing step to convert bytes to bits.
Final notes
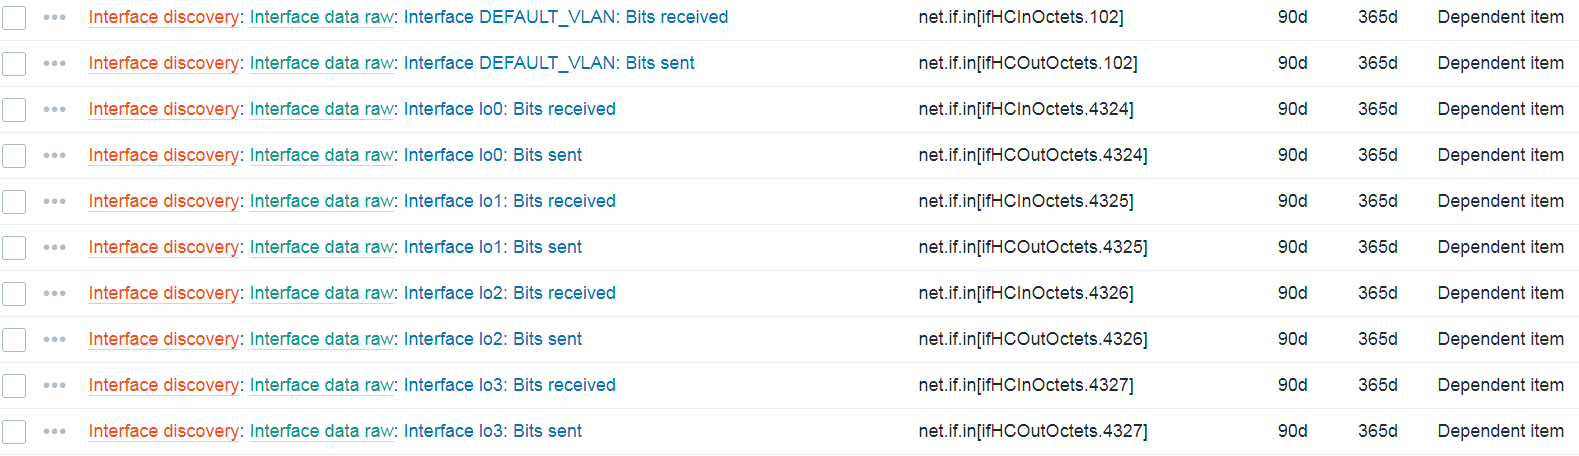
And we’re done! Now all we have to do is wait until the master item update interval kicks in and we should see our items getting discovered by the low-level discovery rule.
Items created from the item prototypes
After we have confirmed that our interfaces are getting discovered and the items are collecting metrics from the master item, we should also implement the Discard unchanged with heartbeat preprocessing step on our low-level discovery rule. This way, the low-level discovery rule will not try and discover new entities in situations where we’re getting the same set of interfaces over and over again from our master item. This in turn improves the overall performance of internal low-level discovery processes.
Discard unchanged with heartbeat preprocessing on the low-level discovery rule
Note that we discovered other interface parameters than just the interface name – interface description and type are also collected in the master item. To use this data, we would have to add additional fields in the low-level discovery rule SNMP walk to JSON preprocessing step and assign low-level discovery macros to the corresponding OIDs containing this information. Once that is done, we can use the new macros in the item prototype to provide additional information in item name or key, or filter the discovered interfaces based on this information (e.g.: only discover interfaces of a particular type).
If you have any questions, comments, or suggestions regarding a topic you wish to see covered next in our blog, don’t hesitate to leave a comment below!
With just a few days remaining until Zabbix Summit 2023, our series of speaker interviews draws to a close as we talk to Opensource ICT Solutions trainer and consultant Nathan Liefting about how he worked with Adan Mohamed of Boldyn Networks to monitor the London Underground with Zabbix.
Please tell us a bit about yourself and your work.
I’m a Zabbix trainer and consultant for Opensource ICT Solutions. You might also know me from the books Brian van Baekel and I wrote called “Zabbix IT Infrastructure Monitoring.”
How long have you been using Zabbix? What kind of daily Zabbix tasks are you involved in at your company?
My tasks are easy to explain – Zabbix, Zabbix, and some more Zabbix! Opensource ICT Solutions is one of the few companies that focus solely on Zabbix, so I get to work full time with the product, 40 hours a week. I build new environments, integrations, automations, and anything that you might need for your Zabbix environment.
Can you give us a sneak peek at what we can expect to hear during your Zabbix Summit speech?
Definitely! Adan from Boldyn Networks and I will be presenting you with a real use case for Zabbix monitoring. We’ll have a look at how Boldyn has brought broadband network connectivity to the London Underground tunnels and why it’s so important to monitor the equipment that makes that all possible. Of course, since this is THE Zabbix summit, we’ll also look at what the Zabbix setup looks like and share a pretty interesting use case for SNMP traps.
How and why did you come to the decision to use Zabbix as the monitoring solution for your use case?
Boldyn was looking for the best network monitoring solution for their project. Since we offer exactly that, we got to talking and we decided that our favorite open-source network monitoring tool was the way to go. Since then, we’ve been building amazing custom monitoring implementations together. The rest is history.
Can you mention some other noteworthy non-standard Zabbix monitoring use cases that you’ve worked on?
Definitely! Since I get to work on monitoring all day long, we’ve got a lot to choose from. I do most of my work in the Netherlands, the United Kingdom, and the United States, and all those markets are super exciting. We’re monitoring infrastructure that keeps planes flying safely and makes sure power grids are up and running, and now we’re also helping to keep people connected to the internet even when they go underground. If you ask me, it doesn’t get a lot more exciting than that – and that’s just the tip of the iceberg.
SNMP – Simple network management protocol is a networking protocol that is extremely prevalent in network hardware such as switches and routers, as well as a variety of other devices such as printers, power supplies and even regular server hosts. Depending on the device, a wide array of metrics can be retrieved by using SNMP without the need to deploy any additional software on the target device. Our newly introduced Zabbix SNMP monitoring one-day extra course will teach you all you need to know about SNMP and how to use Zabbix to get the most out of your SNMP devices with the most optimal data collection approach.
Course contents
The goal of the course is to introduce the core concepts behind SNMP and provide the attendees with the skills necessary to extract the required metrics from SNMP endpoints. The course covers topics such as:
SNMP core concepts
SNMP command line utilities
Differences between SNMP versions
SNMP resource discovery with Zabbix Low-level discovery feature
Optimizing SNMP data collection with the SNMP walk[*] item introduced in Zabbix 6.4
Configuring and monitoring SNMP traps
The course will be hosted by a Zabbix Certified Trainer with thorough experience in SNMP monitoring and Zabbix configuration. The courses are designed with open Q&A sessions in mind, where attendees can discuss their current and potential use cases and how the course contents can be applied to their own real-life scenarios.
Zabbix Certified Specialist on-site training
SNMP monitoring in Zabbix 6.4 and newer versions
Zabbix 6.4 introduces a whole new approach to bulk SNMP monitoring – the walk[*] item. During the course, attendees will learn how the new bulk data collection approach greatly increases the metric collection speed and reduces the potential performance impact on the monitoring endpoint. The course covers the main differences between the old and new approaches and demonstrates how the new SNMP items can be configured in the correct manner. Trainers will also demonstrate and provide the opportunity to practice SNMP resource discovery with the new walk[*] item and Zabbix low-level discovery (LLD) features.
Practical tasks
Depending on the device and vendor, configuring SNMP monitoring can be both very simple or it may require understanding the underlying OID structure to find the data that you’re looking for. To guide our students through real-life scenarios in understanding how SNMP monitoring may differ across devices and vendors, the course includes practical tasks, during which the participants will get the opportunity to configure Zabbix SNMP monitoring for an array of network devices belonging to a selection of the most popular vendors, such as Cisco, HP and Mikrotik. By the end of the course, students will have both a theoretical and practical understanding of SNMP as a protocol and how it can be used by Zabbix for metric collection and problem detection.
At the end of the course, every attendee will receive the course attendance certificate.
Sign up for the SNMP monitoring Zabbix training course and check our other one-day extra courses by visiting the Zabbix Training Extra Courses page.
Can you monitor your mobile data usage with Zabbix? Of course, you can! By day, I am a Lead Site Reliability Engineer in a global cyber security company Forcepoint. By night, I monitor my home with Zabbix & Grafana Labs and do some weird experiments with them. Welcome to my blog about this project.
As it is Easter (the original blog post was published two months ago), this entry is a bit short but as I was remoting into my home systems over VPN and my phone, I got this blog post idea.
When on the go, I tend to stay connected to my home network over VPN. Or rather, an iOS Shortcut pretty much runs OpenVPN home profile for me whenever I exit my home.
My Zabbix collects statistics from my home router over SNMP, and as usual, the data includes per-port traffic statistics. VPN clients are shown as tunnel interfaces so Zabbix LLD picks them up nicely.
So, as a result, I get to see how much traffic my phone consumes whenever I’m using a mobile VPN. Here are seven-day example screenshots from ZBX Viewer mobile app.
VPN connection bits sent.
VPN connection bits received
So, from this data I could get all the statistics I need. And, using my ElastiFlow setup, could likely see to where my phone has been connecting to most.
This post was originally published on the author’s page.
Zabbix team is pleased to announce the release of the latest Zabbix major version – Zabbix 6.4. The release delivers many long-awaited improvements, such as Just-in-time LDAP and SAML user provisioning; support of older Zabbix proxy versions for simplified proxy management and zero–downtime Zabbix upgrades; near-instant configuration sync across Zabbix agents and proxies, and much more!
New features and improvements
Just-in-time (JIT) user provisioning
Zabbix 6.4 adds support of JIT user provisioning for LDAP and SAML authentication.
JIT user provisioning can be enabled in LDAP/SAML authentication settings
Zabbix administrators can now configure user provisioning by selecting the LDAP group pattern for matching and automatically assign User groups and User roles to the discovered users. Media types can also be mapped based on LDAP/SAML attributes.
A media can be assigned to the provisioned users based on their LDAP/SAML attributesA group and role is assigned to the provisioned users
Cause and symptom events
Zabbix 6.4 adds the ability to mark events as Cause or Symptom events. This allows us to filter events in a way, where we can see only root cause problems instead of being overwhelmed by symptom events. It is also possible to pause action operations for symptom events as to avoid unnecessary noise.
Multiple symptom events can be linked to a single cause eventAny event can be marked as a symptom or converted to a cause eventAction operations can be paused for symptom problems
Instant propagation of configuration changes
Continuing to build on changes introduced in Zabbix 6.2 (Collecting only configuration change deltas), Zabbix 6.4 introduces instant configuration synchronization across passive and active agents and proxies.
Instead of receiving the full configuration copy every 2 minutes (old behavior), in Zabbix 6.4 active agent receives the configuration copy only when changes have been performed
RefreshActiveChecks parameter now supports a range 1-86400 (old range: 60-3600)
The ProxyConfigFrequency parameter is now used in both Zabbix server (for passive mode) and Zabbix proxy (for active mode) configuration files
ConfigFrequency parameter in Zabbix proxy configuration is now deprecated
Default ProxyConfigFrequency parameter is 10 seconds (down from 1 hour)
This also improves the performance of Zabbix servers and proxies, since only configuration deltas are synced. As for active agents – the active agent receives a full configuration copy only when any changes are detected in the configuration instead of receiving it every RefreshActiveChecks interval (old behavior)
New SNMP walk item for bulk collection and discovery of SNMP metrics
A new SNMP agent walk item has been introduced. The item looks at a specified OID or OIDs and polls their indexes by suing the SNMP GetBulk requests. An SNMP GetBulk request can provide better performance and more rapid metric collection and discovery from enterprise-tier SNMP devices.
Once the data is converted to JSON, we can use SNMP walk value preprocessing step together with LLD macros, to create dependent item prototypes:
SNMP walk value preprocessing step can be used to specify value for extraction in item prototypes
Support of data collection for outdated proxies
To improve the Zabbix component upgrade workflows (especially for large environments), outdated proxies can still perform data collection with a newer Zabbix server version:
Proxy is fully supported if it has the same major version as the Zabbix server
Proxy is marked as outdated if its major version is older than the Zabbix server but not older than the previous LTS release
Outdated proxies still support data collection and remote command execution
In other scenarios, the proxy becomes not supported
Deployed proxy compatibility can be seen in Zabbix frontend
Server version
Current proxy version
Outdated proxy version
Unsupported proxy version
6.4
6.4
6.0, 6.2
Older than 6.0; newer than 6.4
7.0
7.0
6.0, 6.2, 6.4
Older than 6.0; newer than 7.0
7.2
7.2
7.0
Older than 7.0; newer than 7.2
New menu layout
Zabbix menu layout has been redesigned. The goal of the new menu layout is to provide logical and consistent access to main Zabbix features.
The new menu provides a more consistent and logical layout to Zabbix features
Real-time streaming of metrics and events over HTTP
In addition to streaming collected metrics and events to files, Zabbix 6.4 adds the option to stream metrics and events over HTTP. Zabbix administrators have the option to filter the data for streaming by using tag filters. A new Connectors section has been introduced under Administration – General. Here Zabbix administrators can define an external system where item values and events should be pushed to.
Define a new connector to stream metrics and events over HTTP
Zabbix 6.4 can be used as a source of information for other applications, analytics reports, and AI engines by streaming metrics and events over HTTP in real time. Metrics and events can be streamed to message brokers like Kafka, RabbitMQ, or Amazon Kinesis to adapt the behavior of external systemsin real time.
Template versioning
Template versioning has been introduced to improve template management and ease of use. Templates are now marked with vendor ar version fields, which are visible in Zabbix frontend; these fields can also be added when writing a custom template.
Template version and vendor fields are visible in the frontend
Development framework for Zabbix widget creation
Zabbix has a large developer community creating their own custom frontend modules, widgets and Go plugins. In Zabbix 6.4, our goal was to streamline this process by creating a development framework for widget creation. To achieve this, the following changes have been introduced:
Widgets have been converted to modules
Modules are now fully self-contained and modular
Built-in widgets reside in ui/widgets
Custom widgets reside in ui/modules/<widget>
Adding new widgets is as simple as adding new files without changing the existing files
In addition to these changes, we have also added a new Developer Center section to our documentation. The section contains guides, tutorials and code examples to guide our community in developing Frontend modules and widgets, as well as help with Zabbix agent 2 custom Go plugin development.
The Developer Center section contains guides, tutorials, and code examples for extending Zabbix
Other features and improvements
The release includes many other changes:
Simple check, External check, SSH agent, Telnet agent item types now do not require an interface to be present on the host
Pre-configured email media type settings for Gmail and O365 email providers
Dynamic item value widget thresholds
Option to define custom labeled links for hosts and events
Ability to label trigger URLs
Improved preprocessing performance and thread-based preprocessing workers
Ability to label aggregated datasets in Graph widget
SQLite3 Zabbix proxies now automatically recreate the SQLite3 database file during an upgrade
A host status filter (enabled/disabled) has been added under Data collection – Hosts
Additional filtering options have been added to the Action log
Action log now supports import to CSV
Multiple context menu improvements to Host, Item and Event context menus
Old password verification is now required when changing your internal Zabbix user password
Value cache performance improvements when working with metrics that get updated less frequently than once per day
Added commands to enable profiling of rwlocks/mutexes (for debugging)
Zabbix 6.4 comes pre-packaged with many new templates and integrations for the most popular vendors and cloud providers. Multiple existing templates have also received improvements:
Microsoft Azure MySQL servers
Microsoft Azure PostgreSQL servers
Microsoft Azure virtual machines
Low-level discovery improvements in AWS by HTTP template
Veeam Backup Enterprise Manager
Veeam Backup and Replication
Cisco Nexus 9000 Series
BMC Control-M
Cisco Meraki dashboard
OS processes by Zabbix agent
Improvements to filesystem discovery in official Zabbix OS templates
Zabbix 6.4 introduces a webhook integration for the Line messaging app, allowing Zabbix events to be forwarded to the Line messenger.
Zabbix 6.4 adds a variety of new templates and integrations
Zabbix 6.4 packages and images
Official Zabbix packages and images are available for:
Linux distributions for different hardware platforms on RHEL, CentOS, Oracle Linux, Debian, SUSE, Ubuntu, Raspbian
Virtualization platforms based on VMWare, VirtualBox, Hyper-V, XEN
Docker
Packages and pre-compiled agents for the most popular platforms, including macOS and MSI packages for Microsoft Windows
You can find the download instructions and download the new version on the Download page.
One-click deployments for the following cloud platforms are coming soon:
AWS, Azure, Google Cloud Platform, Digital Ocean
Upgrading to Zabbix 6.4
In order to upgrade to Zabbix 6.4 you need to upgrade your repository package and download and install the new Zabbix component packages (Zabbix server, proxy, frontend, and other Zabbix components). When you start the Zabbix server, an automatic database schema upgrade will be performed. Zabbix agents are backward compatible; therefore, it is not required to install the new agent versions. You can perform the agent upgrade at a later time.
If you’re using the official Docker container images – simply deploy a new set of containers for your Zabbix components. Once the Zabbix server container connects to the backend database, the database upgrade will be performed automatically.
You can find detailed step-by-step upgrade instructions on our Upgrade procedure page.
Join the webinar
If you wish to learn more about the Zabbix 6.4 features and improvements, we invite you to join our What’s new in Zabbix 6.4 public webinar.
During the webinar, you will get the opportunity to:
Learn about Zabbix 6.4 features and improvements
See the latest Zabbix templates and integrations
Participate in a Q&A session with Zabbix founder and CEO Alexei Vladishev
Discuss the latest Zabbix version with Zabbix community and Zabbix team members
This is a public webinar – anyone can sign up, attend and have their questions answered by the Zabbix team!
Streamline your data collection, problem detection and low-level discovery by defining global regular expressions.
Pattern matching within unstructured data is mostly done by using regular expressions. Defining a regular expression can be a lengthy task, that can be simplified by predefining a set of regular expressions which can be quickly referenced down the line.
Simplify pattern matching by defining global regular expressions:
Reference global regular expressions in log monitoring and snmp trap items
Simplify pattern matching in trigger functions and calculated items
Global regular expressions can be referenced in low-level discovery filters
Combine multiple subexpressions into a single global regular expression
Check out the video to learn how to define and use global regular expressions.
Define and use global regular expressions:
Navigate to Administration → General → Regular expressions
Type in your global regular expression name
Select the regular expression type and provide subexpressions
Press Add and provide multiple subexpressions
Navigate to the Test tab and enter the test string
Click on Test expressions and observe the result
Press Add to save and add the global regular expression
Navigate to Configuration → Hosts
Find the host on which you will test the global regular expression
Click on either the Items, Triggers or Discovery button to open the corresponding section
Find your item, trigger or LLD rule and open it
Insert the global regular expression
Use the @ symbol to reference a global regular expression by its name
Update the element to save the changes
Tips and best practices
Each subexpressions and the total combined result can be tested in Zabbix frontend
Zabbix uses AND logic if several subexpressions are defined
Global regular expressions can be referenced by referring to their name, prefixed with the @ symbol
Zabbix documentation contains the list of locations supporting the usage of global regular expression.
Sign up for the official Zabbix Certified Specialist course and learn how to optimize your data collection, enrich your alerts with useful information, and minimize the amount of noise and false alarms. During the course, you will perform a variety of practical tasks under the guidance of a Zabbix certified trainer, where you will get the chance to discuss how the current use cases apply to your own unique infrastructure.
Let Zabbix automatically discover and start monitoring your SNMP data points.
Creating items manually for each network interface, fan, temperature sensor, and other SNMP data points can be a very time-consuming task. To save time, Zabbix administrators need to automate item, trigger, and graph creation as much as possible.
Automate item, trigger and graph creation with SNMP low-level discovery rules:
An entity will be created for each of the discovered indexes
Specify multiple OIDs to discover additional information about an entity
Filter entities based on any of the discovered OID values
Low-level discovery can be used with SNMP v1, v2c and v3
Check out the video to learn how to use Zabbix low-level discovery to discover SNMP entities.
How to use Zabbix low-level discovery to discover SNMP entities:
Navigate to Configuration → Hosts and find your SNMP host
Open the Discovery section and create a discovery rule
Provide a name, a key, and select the Type – SNMP agent
Populate the SNMP OID field with the following LLD syntax
Navigate to the Filters section and provide the LLD filters
Press Add to create the LLD rule
Open the Item prototypes section and create an item prototype
Provide the Item prototype name and key
Populate the OID field ending it with the {#SNMPINDEX} LLD macro
Configure the required tags and preprocessing rules
Press Add to create the item prototype
Wait for the LLD rule to execute and observe the discovered items
Tips and best practices
snmpwalk tool can be used to list the OIDs provided by the monitored device
If a particular entity does not have the specified OID, the corresponding macro will be omitted for it
OIDs can be added to your LLD rule for usage in filters and tags
The {#SNMPINDEX} LLD macro is discovered automatically based on the indexes listed for each OID in the LLD rule
Learn how Zabbix low-level discovery rules can be used to automate the creation of your Zabbix entities by attending our Zabbix Certified Professional course. During the course, you will learn the many use cases of low-level discovery by performing a variety of practical tasks under the guidance of a Zabbix certified trainer.
To provide the best experiences, we use technologies like cookies to store and/or access device information. Consenting to these technologies will allow us to process data such as browsing behavior or unique IDs on this site. Not consenting or withdrawing consent, may adversely affect certain features and functions.
Functional
Always active
The technical storage or access is strictly necessary for the legitimate purpose of enabling the use of a specific service explicitly requested by the subscriber or user, or for the sole purpose of carrying out the transmission of a communication over an electronic communications network.
Preferences
The technical storage or access is necessary for the legitimate purpose of storing preferences that are not requested by the subscriber or user.
Statistics
The technical storage or access that is used exclusively for statistical purposes.The technical storage or access that is used exclusively for anonymous statistical purposes. Without a subpoena, voluntary compliance on the part of your Internet Service Provider, or additional records from a third party, information stored or retrieved for this purpose alone cannot usually be used to identify you.
Marketing
The technical storage or access is required to create user profiles to send advertising, or to track the user on a website or across several websites for similar marketing purposes.