Post Syndicated from The Atlantic original https://www.youtube.com/watch?v=76AxiUif3Po
America’s Gun Crisis (With Senator Chris Murphy) | The Atlantic Festival 2022
Post Syndicated from The Atlantic original https://www.youtube.com/watch?v=eSRjgvwtK2A
Raye Zaragoza Performs Modern Folk Music | The Atlantic Festival 2022
Post Syndicated from The Atlantic original https://www.youtube.com/watch?v=Osezl7HNtoY
Amazon Personalize customer outreach on your ecommerce platform
Post Syndicated from Sridhar Chevendra original https://aws.amazon.com/blogs/architecture/amazon-personalize-customer-outreach-on-your-ecommerce-platform/
In the past, brick-and-mortar retailers leveraged native marketing and advertisement channels to engage with consumers. They have promoted their products and services through TV commercials, and magazine and newspaper ads. Many of them have started using social media and digital advertisements. Although marketing approaches are beginning to modernize and expand to digital channels, businesses still depend on expensive marketing agencies and inefficient manual processes to measure campaign effectiveness and understand buyer behavior. The recent pandemic has forced many retailers to take their businesses online. Those who are ready to embrace these changes have embarked on a technological and digital transformation to connect to their customers. As a result, they have begun to see greater business success compared to their peers.
Digitizing a business can be a daunting task, due to lack of expertise and high infrastructure costs. By using Amazon Web Services (AWS), retailers are able to quickly deploy their products and services online with minimal overhead. They don’t have to manage their own infrastructure. With AWS, retailers have no upfront costs, have minimal operational overhead, and have access to enterprise-level capabilities that scale elastically, based on their customers’ demands. Retailers can gain a greater understanding of customers’ shopping behaviors and personal preferences. Then, they are able to conduct effective marketing and advertisement campaigns, and develop and measure customer outreach. This results in increased satisfaction, higher retention, and greater customer loyalty. With AWS you can manage your supply chain and directly influence your bottom line.
Building a personalized shopping experience
Let’s dive into the components involved in building this experience. The first step in a retailer’s digital transformation journey is to create an ecommerce platform for their customers. This platform enables the organization to capture their customers’ actions, also referred to as ‘events’. Some examples of events are clicking on the shopping site to browse product categories, searching for a particular product, adding an item to the shopping cart, and purchasing a product. Each of these events gives the organization information about their customer’s intent, which is invaluable in creating a personalized experience for that customer. For instance, if a customer is browsing the “baby products” category, it indicates their interest in that category even if a purchase is not made. These insights are typically difficult to capture in an in-store experience. Online shopping makes gaining this knowledge much more straightforward and scalable.
The proposed solution outlines the use of AWS services to create a digital experience for a retailer and consumers. The three key areas are: 1) capturing customer interactions, 2) making real-time recommendations using AWS managed Artificial Intelligence/Machine Learning (AI/ML) services, and 3) creating an analytics platform to detect patterns and adjust customer outreach campaigns. Figure 1 illustrates the solution architecture.
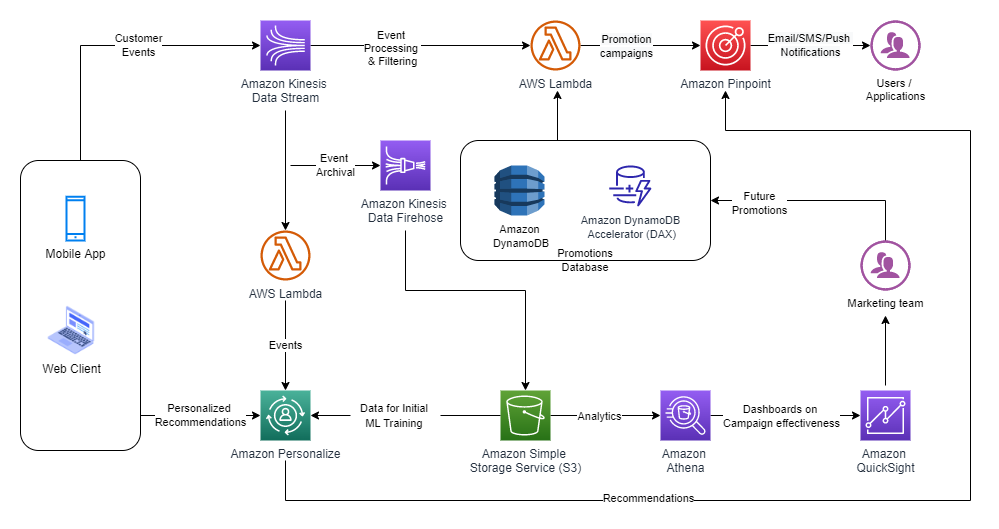
Figure 1. Digital shopping experience architecture
For this use case, let’s assume that you are the owner of a local pizzeria, and you manage deliveries through an ecommerce platform like Shopify or WooCommerce. We will walk you through how to best serve your customer with a personalized experience based on their preferences.
The proposed solution consists of the following components:
- Data collection
- Promotion campaigns
- Recommendation engine
- Data analytics
- Customer reachability
Let’s explore each of these components separately.
Data collection with Amazon Kinesis Data Streams
When a customer uses your web/mobile application to order a pizza, the application captures their activity as click-stream ‘events’. These events provide valuable insights about your customers’ behavior. You can use these insights to understand the trends and browsing pattern of prospects who visited your web/mobile app, and use the data collected for creating promotion campaigns. As your business scales, you’ll need a durable system to preserve these events against system failures, and scale based on unpredictable traffic on your platform.
Amazon Kinesis is a Multi-AZ, managed streaming service that provides resiliency, scalability, and durability to capture an unlimited number of events without any additional operational overhead. Using Kinesis producers (Kinesis Agent, Kinesis Producer Library, and the Kinesis API), you can configure applications to capture your customer activity. You can ingest these events from the frontend, and then publish them to Amazon Kinesis Data Streams.
Let us start by setting up Amazon Kinesis Data Streams to capture the real-time sales transactions from the online channels like a portal or mobile app. For this blog post, we have used the Kaggle’s public data set as a reference. Figure 2 illustrates a snapshot of sample data to build personalized recommendations for a customer.
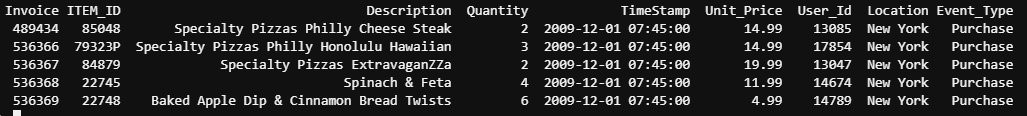
Figure 2. Sample sales transaction data
Promotion campaigns with AWS Lambda
One way to increase customer conversion is by offering discounts. When the customer adds a pizza to their cart, you want to make sure they are receiving the best deal. Let’s assume that by adding an additional item, your customer will receive the best possible discount. Just by knowing the total cost of added items to the cart, you can provide these relevant promotions to this customer.
For this scenario, the AWS Lambda service polls the Amazon Kinesis Data Streams to read all the events in the stream. It then matches the events based on your criteria of items in the cart. In turn, these events will be processed by the Lambda function. The Lambda function will read your up-to-date promotions stored in Amazon DynamoDB. As an option, caching recent or most popular promotions will improve your application response time, as well as improve the customer experience on your platform. Amazon DynamoDB DAX is an integrated caching for DynamoDB that caches the most recent or popular promotions or items.
For example, when the customer added the items to their shopping cart, Lambda will send promotion details to them based on the purchase amount. This can be for free shipping or discount of a certain percentage. Figure 3 illustrates the snapshot of sample promotions.
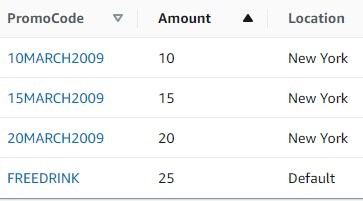
Figure 3. Promotions table in DynamoDB
Recommendations engine with Amazon Personalize
In addition to sharing these promotions with your customer, you may also want to share the recommended add-ons. In order to understand your customer preferences, you must gather historical datasets to determine patterns and generate relevant recommendations. Since web activity consists of millions of events, this would be a daunting task for humans to review, determine the patterns, and make recommendations. And since user preferences change, you need a system that can use all this volume of data and provide accurate predictions.
Amazon Personalize is a managed AI/ML service that will help you to train an ML model based on datasets. It provides an inference point for real-time recommendations prior to having ML experience. Based on the datasets, Amazon Personalize also provides recipes to generate recommendations. As your customers interact on the ecommerce platform, your frontend application calls Amazon Personalize inference endpoints. It then retrieves a set of personalized recommendations based on your customer preferences.
Here is the sample Python code to display the list of available recommenders, and associated recommendations.
import boto3
import json
client = boto3.client('personalize')
# Connect to the personalize runtime for the customer recommendations
recomm_endpoint = boto3.client('personalize-runtime')
response = recomm_endpoint.get_recommendations(itemId='79323P',
recommenderArn='arn:aws:personalize:us-east-1::recommender/my-items',
numResults=5)
print(json.dumps(response['itemList'], indent=2))
[
{
"itemId": "79323W"
},
{
"itemId": "79323GR"
},
{
"itemId": "79323LP"
},
{
"itemId": "79323B"
},
{
"itemId": "79323G"
}
]
You can use Amazon Kinesis Data Firehose to read the data near real time from the Amazon Kinesis Data Streams collected the data from the front-end applications. Then you can store this data in Amazon Simple Storage Service (S3). Amazon S3 is peta-byte scale storage help you scale and acts as a repository and single source of truth. We use S3 data as seed data to build a personalized recommendation engine using Amazon Personalize. As your customers interact on the ecommerce platform, call the Amazon Personalize inference endpoint to make personalized recommendations based on user preferences.
Customer reachability with Amazon Pinpoint
If a customer adds products to their cart but never checks out, you may want to send them a reminder. You can set up an email to suggest they re-order after a period of time after their first order. Or you may want to send them promotions based on their preferences. And as your customers’ behavior changes, you probably want to adapt your messaging accordingly.
Your customer may have a communication preference, such as phone, email, SMS, or in-app notifications. If an order has an issue, you can inform the customer as soon as possible using their preferred method of communication, and perhaps follow it up with a discount.
Amazon Pinpoint is a flexible and scalable outbound and inbound marketing communications service. You can add users to Audience Segments, create reusable content templates integrated with Amazon Personalize, and run scheduled campaigns. With Amazon Pinpoint journeys, you can send action or time-based notifications to your users.
The following workflow shown in Figure 4, illustrates customer communication workflow for promotion. A journey is created for a cohort of college students: a “Free Drink” promotion is offered with a new order. You can send this promotion over email. If the student opens the email, you can immediately send them a push notification reminding them to place an order. But if they didn’t open this email, you could wait three days, and follow up with a text message.
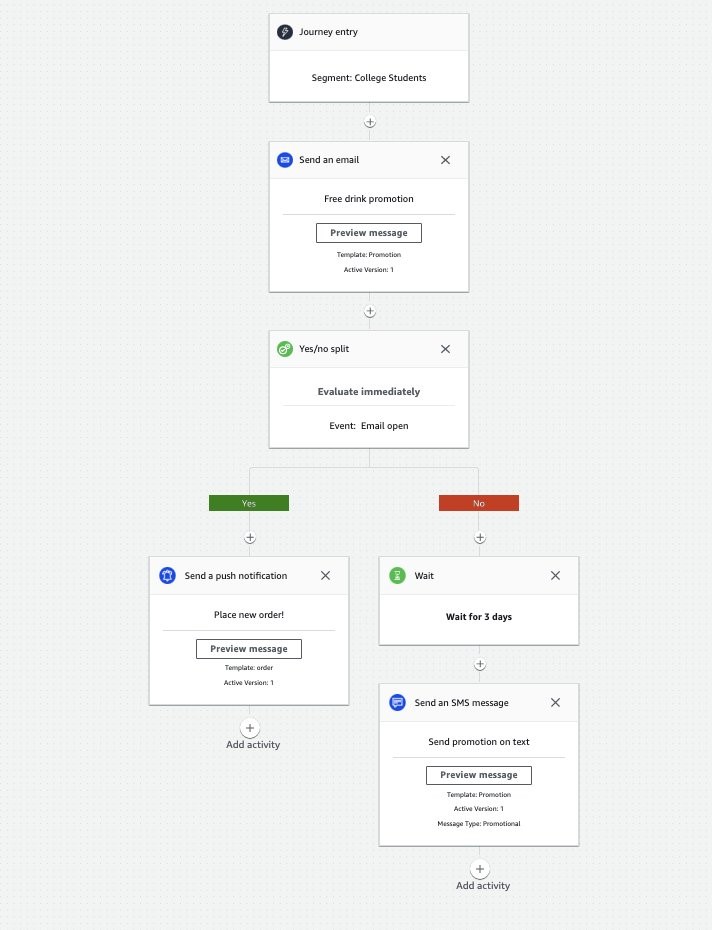
Figure 4. Promotion workflow in Amazon Pinpoint
Data analytics with Amazon Athena and Amazon QuickSight
To understand the effectiveness of your campaigns, you can use S3 data as a source for Amazon Athena. Athena is an interactive query service that analyzes data in Amazon S3 using standard SQL. Athena is serverless, so there is no infrastructure to manage, and you pay only for the queries that you run.
There are different ways to create visualizations in Amazon QuickSight. For instance, you can use Amazon S3 as a data lake. One option is to import your data into SPICE (Super-fast, Parallel, In-memory Calculation Engine) to provide high performance and concurrency. You can also create a direct connection to the underlying data source. For this use case, we choose to import to SPICE, which provides faster visualization in a production setup. Schedule consistent refreshes to help ensure that dashboards are referring to the most current data.
Once your data is imported to your SPICE, review QuickSight’s visualization dashboard. Here, you’ll be able to choose from a wide variety of charts and tables, while adding interactive features like drill downs and filters.
The process following illustrates how to create a customer outreach strategy using ZIP codes, and allocate budgets to the marketing campaigns accordingly. First, we use this sample SQL command that we ran in Athena to query for top 10 pizza providers. The results are shown in Figure 5.
SELECT name, count(*) as total_count FROM "analyticsdemodb"."fooddatauswest2"
group by name
order by total_count desc
limit 10
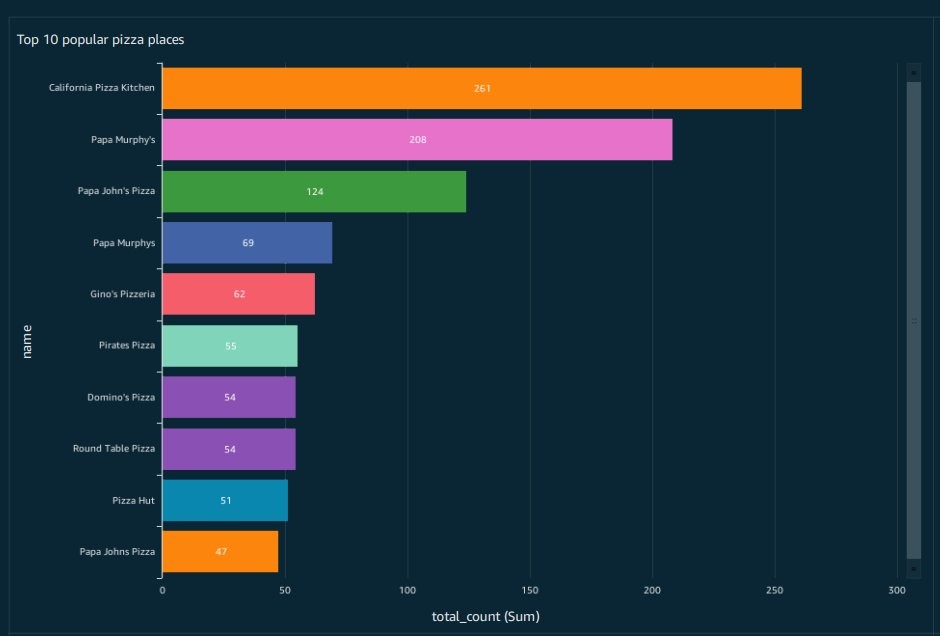
Figure 5. Athena query results for top 10 pizza providers
Second, here is the sample SQL command that we ran in Athena to find Total pizza counts by postal code (ZIP code). Figure 6 shows a visualization to help create customer outreach strategy per ZIP codes and budget the marketing campaigns accordingly.
SELECT postalcode, count(*) as total_count FROM "analyticsdemodb"."fooddatauswest2"
where postalcode is not null
group by postalcode
order by total_count desc limit 50;

Figure 6. QuickSight visualization showing pizza orders by zip codes
Conclusion
AWS enables you to build an ecommerce platform and scale your existing business with minimal operational overhead and no upfront costs. You can augment your ecommerce platform by building personalized recommendations and effective marketing campaigns based on your customer needs. The solution approach provided in the blog will help organizations build re-usable architecture pattern and personalization using AWS managed services.
Лозето на социалистите не ще Станишев, а мотика
Post Syndicated from Емилия Милчева original https://toest.bg/lozeto-na-sotsiyalistite-ne-shte-stanishev-a-motika/
Днешните български социалисти не могат да откъснат и една чепка грозде от лозето на Габровски*. Електоратът няма сили да копае, ръководството – не желае. Класовата същност на Българската социалистическа партия е от абсолютно несъвместими съставни части – „Позитано“ 20 е от източноевропейската „хайверена левица“, а базата се чуди как да си купи дърва за огрев и кога пак ще ѝ вдигат пенсиите. (Същото е и при ДПС, където надстройката и избирателите са на двата социални полюса, а органичната им връзка е етническата принадлежност.)
Това съвсем не е дилемата от зората на българския социализъм за яйцето и кокошката – пролетариат, обединен в синдикати (тогава се е формирала българската работническа класа), или социалистическа интелигенция. В настоящата дихотомия въпросът е кой да се настани в партийния мезонет и да се възползва от гаснещата електорална мощ. БСП не разширява електоралната си база, не привлича млади и икономически активни хора; единствените движения се извършват по върховете ѝ, където се сменят лидерите и кръговете около тях. На пръв поглед демократично – в другите партии водачите изглеждат циментирани и дори не се избират пряко като в БСП. Но си е боричкане за власт.
Но всички обичат Москва
Никой не очаква от номинално социалистическа партия да бъде носител на присъщи на лявото прогресивни идеи и реформи. Не е тайна, че БСП не е лява, но не е и дясна. Карашик е, но несъмнено олигархична като ГЕРБ и ДПС. Козметични данъчни облекчения и искания за повишаване на пенсиите – за какво друго се бори БСП?! За шестте месеца управление дори забрави за прогресивното данъчно облагане – неин рефрен, докато беше в опозиция. Не би могла например да иска силно и независимо финансово разузнаване – нали ще се зарови и в незнайно как забогателите висши партийни „другари“ и техните офшорни сметки. Няма как да иска и ефективна и подложена на демократична отчетност прокуратура – поради същата причина върховенството на правото не е кауза на БСП.
Забраната на Истанбулската конвенция е залъгалка за избирателите. Но виж, русофилството, или по-скоро путинофилията, е друга работа – единствената топла връзка между БСП и членовете и симпатизантите ѝ. Независимо че в съвременна Русия няма нищо ляво, още по-малко социализъм. И докато за електората водещи са носталгията, силовата пропаганда от времената на соца и разочарованието от Прехода, за което голяма вина носи и БСП, при партийното „началство“ движещите сили са онези, които произтичат от руските (енергийни) зависимости. На „Позитано“ 20 никога не са имали скрупули да подарят газовата инфраструктура на „Газпром“ по времето на Виденов, да смачкат европейска България под тежестта на „Големия шлем“ при Първанов и Станишев – и да вкарат българската енергетика и държава в тежка подчиненост на КТБ, чиято политика беше диктувана от руската ВТБ, респективно Кремъл.
Така верноподаничеството към авторитарен и кървав режим като кремълския, а не национално отговорни каузи стана най-характерната черта на БСП, независимо кой е начело – Сергей Станишев или Корнелия Нинова. (Което я прави трудно различима от „Възраждане“ например.) Макар и на различни позиции за Истанбулската конвенция, и евродепутатите на БСП защитават проруски позиции при различни гласувания в Европарламента, както и БСП в българското Народно събрание, дори понякога различни от тези на останалите евродепутати от групата на Партията на европейските социалисти.
През март българските евродепутати от БСП начело с лидера на ПЕС Сергей Станишев гласуваха против редица санкции срещу Русия – и срещу позицията на групата си в ЕП. Станишев, Иво Христов, Елена Йончева, Цветелина Петкова и Петър Витанов са били против част от текстовете, които предвиждат санкции. Само те от групата на ПЕС гласуваха срещу отнемане на лицензите на руските пропагандни телевизионни канали и бяха против прекратяването на софтуерните лицензи за военния и гражданския сектор на Русия и Беларус, а и срещу намаляването на руските дипломати в ЕС.
В края на юли по „Нова телевизия“ Станишев дори критикува Нинова, че не се борила достатъчно, за да не се прекратява договорът с „Газпром“ през април:
БСП каза: Бяхме против спирането на договора с „Газпром“. Това обаче се случи март, сега сме юли. Какво направи БСП в правителството, за да се коригира това нещо? Нищо. От ПП налагаха политики, без да се съобразяват с чувствителността и мнението и на БСП, и на избирателите.
(Самата Нинова многократно настояваше да се подновят преговорите, тъй като бизнесът иска евтин газ.)
Завръщането на една легенда – обречено на провал
Сергей Станишев обяви наскоро, че няма да се кандидатира за четвърти мандат като лидер на ПЕС. Официалният му мотив е, че няма силна партия зад гърба си, сиреч Нинова е пречката. Но БСП начело с Нинова и досега не е била зад гърба му, конфликтът им е публично известен от дълго време и подобно основание не звучи сериозно.
Причините са по-дълбоки. Руската война в Украйна доведе до рязко разграничаване и осъждане на политиката на Москва от страна на ЕС. Санкциите предизвикаха сериозни проблеми за ЕС – страните членки се борят с високите енергийни цени и висока инфлация. Изглежда, меко казано, неуместно лидерът на втората след ЕНП политическа сила в Общността да има различно поведение не само от Брюксел, но и от мнозинството партии в ПЕС. Въпросът опира до позициите не на европейската социалдемокрация, а на Европейския съюз като цяло. Станишев става пето колело – затова и няма да се кандидатира. Така след десет години като председател на ПЕС той се завръща в България в опит да си върне и първото място в БСП.
„Една легенда се завръща!“ – ако вземем повод от имиджовата фраза, охотно разпространявана и приписвана на 9-годишния му син Георги, който разказал в училище за баща си: „Един ден, като умре, ще отиде при легендите.“ В БСП легендите никога не са успявали – нито при завръщането си, нито при напускането на БСП. Опитите на Георги Първанов, Мая Манолова, Татяна Дончева, Александър Томов го потвърждават.
За разлика от тях обаче, Сергей Станишев вероятно няма да пробва с нова лява партия – така ще се маргинализира. Рискът е твърде голям, а резултатът – предвидим. Независимо че Станишев разчита на ситуативни предимства – вътрешната опозиция в БСП е ясно оформена, но разпокъсана на лагери и недотам силна, че да победи Нинова на преки избори със свой кандидат. Освен ако не бъде променен уставът на партията, който да върне избора на лидер от конгреса, но до момента опозицията не е успяла да прокара такава промяна.
Вероятно отново ще поискат оставката ѝ след изборите на 2 октомври, но какво от това? Зависи дали БСП отново ще се включи като партньор в управляваща коалиция, както беше в предишната – опозицията поиска оставката на Нинова и през януари т.г., но удари на камък. Лидерката на БСП като добър политически брокер уреди своята преторианска гвардия с назначения. Те пък знаят как да се отблагодаряват – и на нея, и на определени бизнес лобита.
Но ако останалите в коалицията нямат нищо против и не само са преглътнали русофилството на БСП, но твърдят, че отново ще я вземат за партньор в коалицията, значи няма значение кой е председателят. На пръв поглед Станишев дори подхожда повече – проевропейски, редом до лидерите на „Продължаваме промяната“ и „Демократична България“. А как би стоял до някого от ГЕРБ…
За Нинова ситуацията се усложнява. Трябва да отбива президентските атаки и разкритията на служебния кабинет и да прави кампания, която вътрешната опозиция неглижира, за да я провали и после да ѝ потърси отговорност. А ето че се появява Станишев, който винаги е декларирал подкрепа за действията на президента Радев.
Както и след 10 ноември, така и сега не става въпрос нито за реанимацията на българската левица, нито за създаване на нормално ляво, а за борба на икономически интереси. Независимо от реториката за социалните неравенства, управителите на БСП никога не са проявявали особена чувствителност на дело. Социалистическата номенклатура и нейните наследници не са много по-различни от la gauche caviar.
Когато Станишев напусна България, за да отиде в Брюксел, теренът под краката му беше разкалян. Ненаказаната по време на тройната коалиция корупция и връзките с Делян Пеевски, добили най-голяма публичност по време на кратко просъществувалото правителство на Пламен Орешарски, не са забравени. Да не би да се канят да конструират нова тройна коалиция – този път от ГЕРБ, БСП и ДПС?
Презареждане на лявото? Невъзможно
Левицата в Европа е в упадък от началото на века и остана някак встрани от дълбоките промени в европейското общество въпреки идеологическата конвергенция към „центъра“ на големи леви партии в Западна Европа. Нямаше промяна по време на десетилетието, в което Сергей Станишев оглавяваше ПЕС, и това личи не само по факта, че партии в ПЕС управляват или са в коалиция в по-малко от една трета от държавите в Съюза.
Социалната цена, която европейските общества плащат за следковидното възстановяване на Европа и настоящата енергийна война, извадиха на терена на популизма много съперници на левите. Те са по-кресливи от тях, не така умерени и понякога левите изглеждат като бледо копие.
Изследвайки лявото, мнозина анализатори установиха, че то не успя да се пренастрои към технологичните промени, въпреки че левите електорати – някогашната работническа класа, са на изчезване като социална група и се върви от „пролетариат към прекариат“ (хибрид между „пролетариат“ и precarious, жизнен статус без сигурност).
В анализа си „Какво се случи с лявото в Европа?“ Ян Ровни, професор по политически науки, проучва този процес и илюстрира с пример промяната – срещата си със съвременния пролетариат във фабрика на „Волво“ в Гьотеборг, Швеция. Той разказва за роботизираната техника при производството на автомобили и работническата класа, представена предимно от „млади жени, седнали на удобни столове, заобиколени от компютърни екрани и клавиатури, слушащи своите айподи“, допълвайки, че „тези работници печелят колкото професорите в шведските университети (което означава много)“. Ровни отбелязва, че повечето от работниците във „Волво“ със своето над средно заплащане, комфорт и сигурност на труда трудно могат да се смятат за работническа класа.
Днешната работническа класа са масите от неквалифицирани обслужващи работници, които предимно готвят, чистят или шофират. Често работата им е краткосрочна или на непълен работен ден и нископлатена. Тези хора не влизат в контакт помежду си както традиционните работници във фабрика. Те често са от различен малцинствен произход и по този начин са разделени от културни граници. Накратко, тези хора имат значително намалена способност за организиране и не го правят.
В България, когато Преходът изличаваше някогашната социндустрия, а с нея и работническата класа, БСП беше от другата страна – на приватизаторите и кредитните милионери. Опортюнисткото поведение на лидерите ѝ и неспособността да се трансформира в модерна лява партия стопи избирателите. А в най-бедната държава в ЕС лявото има за лица консервативни десни капиталисти и лозето на Габровски изобщо не им е по вкуса.
*Според исторически източници на лозето на Никола Габровски във Велико Търново през май 1891 г. се е състояла първата социалистическа сбирка, на която присъстват привърженици от Велико Търново, Севлиево, Казанлък, Дряново и Габрово. Габровски организира сбирката заедно със съратника си Димитър Благоев. Сега мястото е превърнато в парк.
Заглавна снимка: Бузлуджа 2018 © Венелина Попова
Historical Dates
Post Syndicated from original https://xkcd.com/2676/

Banned Books’ Impact on Freedom of Expression (With Ibram X. Kendi) | The Atlantic Festival 2022
Post Syndicated from The Atlantic original https://www.youtube.com/watch?v=FzxNKgXvwQA
How Will the Workplace Evolve Post-COVID (With Derek Thompson) | The Atlantic Festival 2022
Post Syndicated from The Atlantic original https://www.youtube.com/watch?v=kmmVwg-dO5o
How Can Criminal-Justice Reform Move Forward? (With Ron Brownstein) | The Atlantic Festival 2022
Post Syndicated from The Atlantic original https://www.youtube.com/watch?v=tAVSUrSpUrg
[$] Safer flexible arrays for the kernel
Post Syndicated from original https://lwn.net/Articles/908817/
At the 2022 Linux
Security Summit Europe (LSS EU), Gustavo A. R. Silva reported in on
work he has been doing on “flexible” arrays in the kernel. While these
arrays provide some … flexibility … they are also a source of bugs,
which
can often result in security vulnerabilities. He has been working on ways
to make the use of flexible arrays safer in the kernel.
Kimberlé Crenshaw and Randall Kennedy on How to Teach About Race | The Atlantic Festival 2022
Post Syndicated from The Atlantic original https://www.youtube.com/watch?v=YX3klqRpfOI
America After Roe (With Planned Parenthood’s Alexis McGill Johnson) | The Atlantic Festival 2022
Post Syndicated from The Atlantic original https://www.youtube.com/watch?v=vROIROOkdZM
BLKBOK Performs His Song “George Floyd and the Struggle for Equality” | The Atlantic Festival 2022
Post Syndicated from The Atlantic original https://www.youtube.com/watch?v=10Z6F-bx0-0
Lessons Learned From the Coronavirus Pandemic (With Ed Yong) | The Atlantic Festival 2022
Post Syndicated from The Atlantic original https://www.youtube.com/watch?v=_wL3VDdazP8
Idea File: Glenn Kaino on A Forest for the Trees, Art, and Ecology | The Atlantic Festival 2022
Post Syndicated from The Atlantic original https://www.youtube.com/watch?v=hv1kcfcqHNg
How Is the Music Industry Evolving? (With Harvey Mason Jr.) | The Atlantic Festival 2022
Post Syndicated from The Atlantic original https://www.youtube.com/watch?v=Dc7wo8R6C_o
Stand-Up Comedy (With Cristela Alonzo) | The Atlantic Festival 2022
Post Syndicated from The Atlantic original https://www.youtube.com/watch?v=PxwotKVBrEQ
Enable self-service visual data integration and analysis for fund performance using AWS Glue Studio and Amazon QuickSight
Post Syndicated from Rajeshkumar Karuppaswamy original https://aws.amazon.com/blogs/big-data/enable-self-service-visual-data-integration-and-analysis-for-fund-performance-using-aws-glue-studio-and-amazon-quicksight/
IMM (Institutional Money Market) is a mutual fund that invests in highly liquid instruments, cash, and cash equivalents. IMM funds are large financial intermediaries that are crucial to financial stability in the US. Due to its criticality, IMM funds are highly regulated under the security laws, notably Rule 2a-7, Which states that during market stress, fund managers can impose a liquidity fee up to 2% or redemption gates (a delay in processing redemption) if the fund’s weekly liquid assets drop below 30% of its total assets. The liquidity fees and gates allow money market funds to stop heavy redemption in times of market volatility.
Traditional banks use legacy systems and rely on monolithic architectures. Typically, data and business logic is tightly coupled on the same mainframe machines. It’s hard for analysts and fund managers to perform self-service and gather real-time analytics from these legacy systems. They work on the previous nightly report and struggle to keep up with market fluctuations. The slightest modification to the reports on these legacy systems involves vast costs, time, and significant dependency on the software development team. Due to these limitations, analysts and fund managers can’t respond effectively to market trends and face a tremendous challenge in adhering to the regulatory requirements of monitoring the market volatility.
Over the last few years, many banks have adopted the cloud. Banks have migrated their legacy workloads to reduce cost, improve their competitive advantage, and address competition from FinTech and startups. As part of the cloud strategy, many mainframe applications got re-platformed or re-architected to a more efficient database platform. However, many opportunities exist in modernizing the application. One such option is to enable self-service to run real-time analytics. AWS offers various services that help such use cases. In this post, we demonstrate how to analyze fund performance visually using AWS Glue Studio and QuickSight in a self-service fashion.
The aim of the post is to assist operations analysts and fund managers to self-service their data analysis needs without previous coding experience. This post demonstrates how AWS Glue Studio reduces the software development team’s dependency and helps analysts and fund managers perform near-real-time analytics. This post also illustrates how to build visualizations and quickly get business insights using Amazon QuickSight.
Solution overview
Most banks record their daily trading transactions activity in relational database systems. A relational database keeps the ledger of daily transactions that involves many buys and sells of IMM funds. We use the mock trades data and a simulated Morningstar data feed to demonstrate our use case.
The following sample Amazon Relational Database Service (Amazon RDS) instance records daily IMM trades, and Morningstar market data gets stored in Amazon Simple Storage Service (Amazon S3). With AWS Glue Studio, analysts and fund managers can analyze the IMM trades in near-real time and compare them with market observations from Morningstar. They can then review the data in Amazon Athena, and use QuickSight to visualize and further analyze the trade patterns and market trends.
This near-real time and self-service enables fund managers quickly respond to the market volatility and apply fees or gates on IMM funds to comply with Rule 2a-7 regulatory requirements.
The following diagram illustrates the solution architecture.

Provision resources with AWS CloudFormation
To create your resources for this use case, we deploy an AWS CloudFormation template. Complete the following steps:
- Choose Launch Stack (
in us-east-1):

- Choose Next three times to reach the Review step.
- Select I acknowledge that AWS CloudFormation might create IAM resources.
- Choose Create stack.
Create an AWS Glue connection
You create an AWS Glue connection to access the MySQL database created by the CloudFormation template. An AWS Glue crawler uses the connection in the next step.
- On the AWS Glue console, under Databases in the navigation pane, choose Connections.
- Choose Add connection.

- For Connection name, enter
Trade-Analysis. - For Connection type¸ choose JDBC.
- Choose Next.

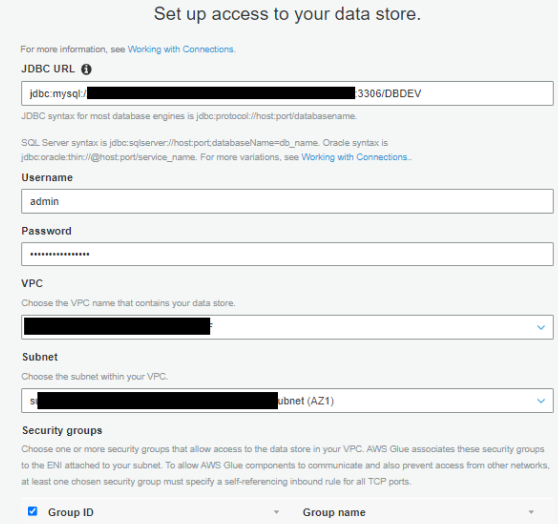
- For JDBC URL, enter your URL.
To connect to an Amazon RDS for MySQL data store with a DBDEV database, use the following code:For more details, see AWS Glue connection properties. Refer to the CloudFormation
fund-analysisstack Outputs tab to get the Amazon RDS ARN.The next step requires you to first retrieve your MySQL database user name and password via AWS Secrets Manager.
- On the Secrets Manager console, choose Secrets in the navigation pane.
- Choose the
secret rds-secret-fund-analysis. - Choose Retrieve secret value to get the user name and password.
- Return to the connection configuration and enter the user name and password.
- For VPC, choose the VPC ending with
fund-analysis. - For Subnet and Security groups, choose the values ending with
fund-analysis.

- Choose Next and Finish to complete the connection setup.
- Select the connection you created and choose Test Connection.
- For IAM role, choose the role
AWSGlueServiceRole-Studio.


For more details about using AWS Identity and Access Management (IAM), refer to Setting up for AWS Glue Studio.

Create and run AWS Glue crawlers
In this step, you create two crawlers. The crawlers connect to a data store, determine the schema for your data, and then create metadata tables in your AWS Glue Data Catalog.
Crawl MySQL data stores
The first crawler creates metadata for the MySQL data stores. Complete the following steps:
- On the AWS Glue console, choose Crawlers in the navigation pane.
- Choose Add crawler.
- For Crawler name, enter
Trades Crawlers. - Choose Next.
- For Crawler source type, choose Data stores.
- For Repeat crawls of S3 data stores, choose Crawl all folders.
- Choose Next.
- For Choose a data store, choose JDBC.
- For Connection, choose Trade-Analysis.
- For Include path, enter the MySQL database name (
DBDEV). - Choose Next.

- For Add another data store, choose No.
- Choose Next.
- For the IAM role to access the data stores, choose the role
AWSGlueServiceRole-Studio. - For Frequency, choose Run on demand.
- Choose Add database.

- For Database name, enter
trade_analysis_db. - Choose Create.
- Choose Next.
- Review all the steps and choose Finish to create your crawler.
- Select the
Trades Crawlerscrawler and choose Run crawler to get the metadata.


Crawl Amazon S3 data stores
Now you configure a crawler to create metadata for the Amazon S3 data stores.
- On the AWS Glue console, choose Crawlers in the navigation pane.
- Choose Add crawler.
- For Crawler name, enter
Ratings. - Choose Next.
- For Crawler source type, choose Data stores.
- For Repeat crawls of S3 data stores, choose Crawl all folders.
- Choose Next.
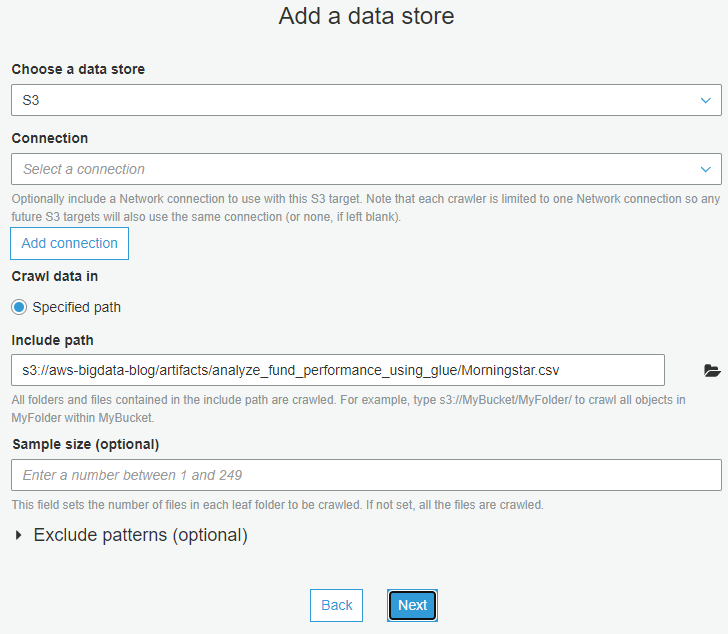
- For Choose a data store, choose S3.
- For Connection, choose Trade-Analysis.
- For Include path, enter
s3://aws-bigdata-blog/artifacts/analyze_fund_performance_using_glue/Morningstar.csv. - Choose Next.

- For Add another data store, choose No.
- Choose Next.
- For the IAM role to access the data stores, choose the role
AWSGlueServiceRole-Studio. - For Frequency, choose Run on demand.
- Choose Add database.
- For Database name, enter
trade_analysis_db. - Review all the steps and choose Finish to create your crawler.
- Select the
Ratingscrawler and choose Run crawler to get the metadata.
Review crawler output
To review the output of your two crawlers, navigate to the Databases page on the AWS Glue console.
You can review the database trade_analysis_db created in previous steps and the contents of the metadata tables.

Create a job using AWS Glue Studio
A job is the AWS Glue component that allows the implementation of business logic to transform data as part of the extract, transform, and load (ETL) process. For more information, see Adding jobs in AWS Glue.
To create an AWS Glue job using AWS Glue Studio, complete the following steps:
- On the AWS Glue console, in the navigation pane, choose AWS Glue Studio.
- Choose Create and manage jobs.
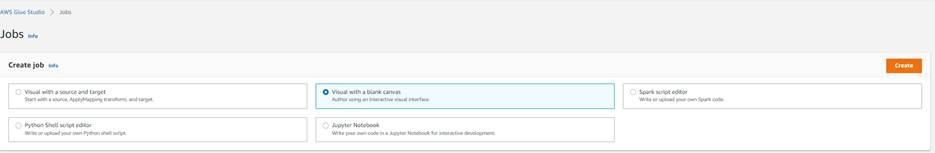
- Choose View jobs.
AWS Glue Studio supports different sources. For this post, you use two AWS Glue tables as data sources and one S3 bucket as the destination. - In the Create job section, select Visual with a blank canvas.
- Choose Create.

This takes you to the visual editor to create an AWS Glue job. - Change the job name from
Untitled JobtoTrade-Analysis-Job.
You now have an AWS Glue job ready to filter, join, and aggregate data from two different sources.
Add two data sources
For this post, you use two AWS Glue tables as data sources: Trades and Ratings, which you created earlier.
- On the AWS Glue Studio console, on the Source menu, choose MySQL.

- On the Node properties tab, for Name, enter Trades.
- For Node type, choose MySQL.

- On the Data Source properties – MySQL tab, for Database, choose
trade_analysis_db. - For Table, choose
dbdev_mft_actvitity.
Before adding the second data source to the analysis job, be sure that the node you just created isn’t selected. - On the Source menu, choose Amazon S3.
- On the Node properties tab, for Name, enter
Ratings. - For Node type, choose Amazon S3.

- On the Data Source properties – S3 tab, for Database, choose
trade_analysis_db. - For Table, choose
morning_star_csv.
You now have two AWS Glue tables as the data sources for the AWS Glue job.The Data preview tab helps you sample your data without having to save or run the job. The preview runs each transform in your job so you can test and debug your transformations. - Choose the
Ratingsnode and on the Data preview tab, choose Start data preview session.

- Choose the
AWSGlueServiceRole-StudioIAM role and choose Confirm to sample the data.


Data previews are available for each source, target, and transform node in the visual editor, so you can verify the results step by step for other nodes.
Join two tables
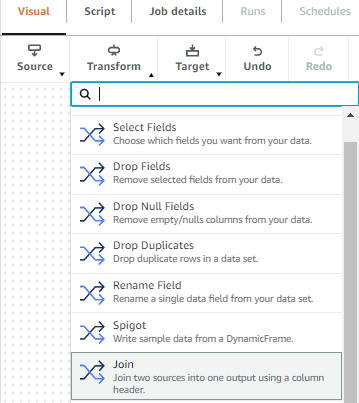
A transform is the AWS Glue Studio component were the data is modified. You have the option of using different transforms that are part of this service or custom code. To add transforms, complete the following steps:
- On the Transform menu, choose Join.

- On the Node properties tab, for Name, enter
trades and ratings join. - For Node type, choose Join.
- For Node parents, choose the
TradesandRatingsdata sources.

- On the Transform tab, for Join type, choose Outer join.
- Choose the common column between the tables to establish the connection.
- For Join conditions, choose symbol from the
Tradestable andmor_rating_fund_symbolfrom theRatingstable.


Add a target
Before adding the target to store the result, be sure that the node you just created isn’t selected. To add the target, complete the following steps:
- On the Target menu, choose Amazon S3.

- On the Node properties tab, for Name, enter
trades ratings merged. - For Node type, choose Amazon S3 for writing outputs.
- For Node parents, choose
trades and ratings join.

- On the Data target properties – S3 tab, for Format, choose Parquet.
- For Compression type, choose None.
- For S3 target location, enter
s3://glue-studio-blog- {Your Account ID as a 12-digit number}/. - For Data catalog update options, select Create a table in the Data Catalog and on subsequent runs, update the schema and add new partitions.
- For Database, choose
trade-analysis-db. - For Table name, enter
tradesratingsmerged.


Configure the job
When the logic behind the job is complete, you must set the parameters for the job run. In this section, you configure the job by selecting components such as the IAM role and the AWS Glue version you use to run the job.
- Choose the Job details tab.

- For Job bookmark, choose Disable.
- For Number of retries, optionally enter
0.

- Choose Save.

- When the job is saved, choose Run.


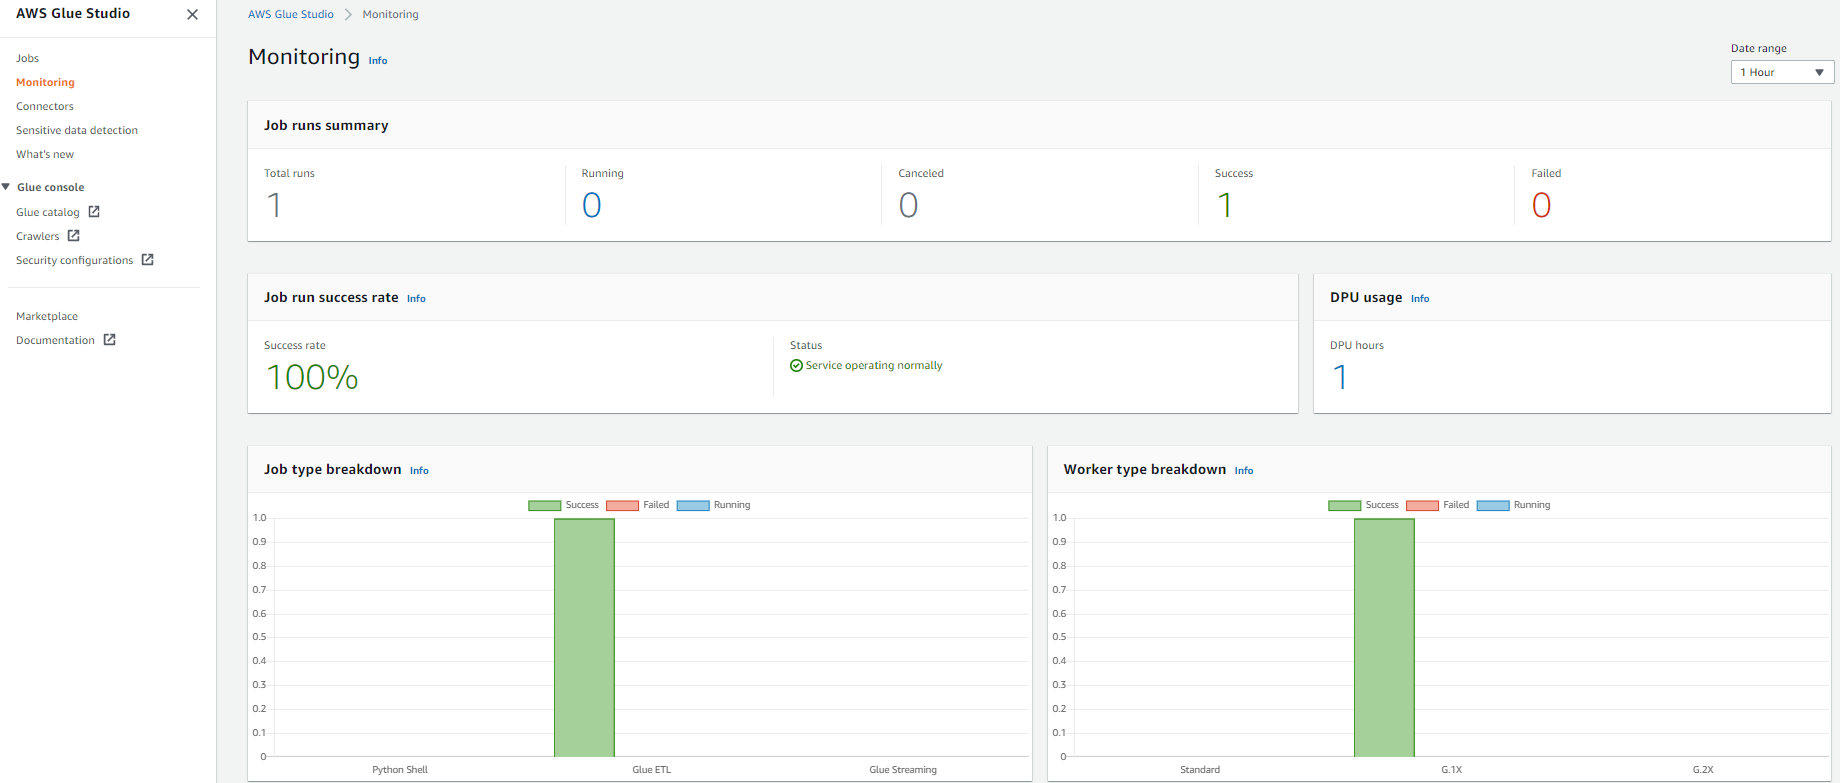
Monitor the job
AWS Glue Studio offers a job monitoring dashboard that provides comprehensive information about your jobs. You can get job statistics and see detailed information about the job and the job status when running.
- In the AWS Glue Studio navigation pane, choose Monitoring.
- Change the date range to 1 hour using the Date range selector to get the recently submitted job.
The Job runs summary section displays the current state of the job run. The status of the job could be Running, Canceled, Success, or Failed.The Job run success rate section provides the estimated DPU usage for jobs, and gives you a summary of the performance of the job. Job type breakdown and Worker type breakdown contain additional information about the job.

- For get more details about the job run, choose View run details.


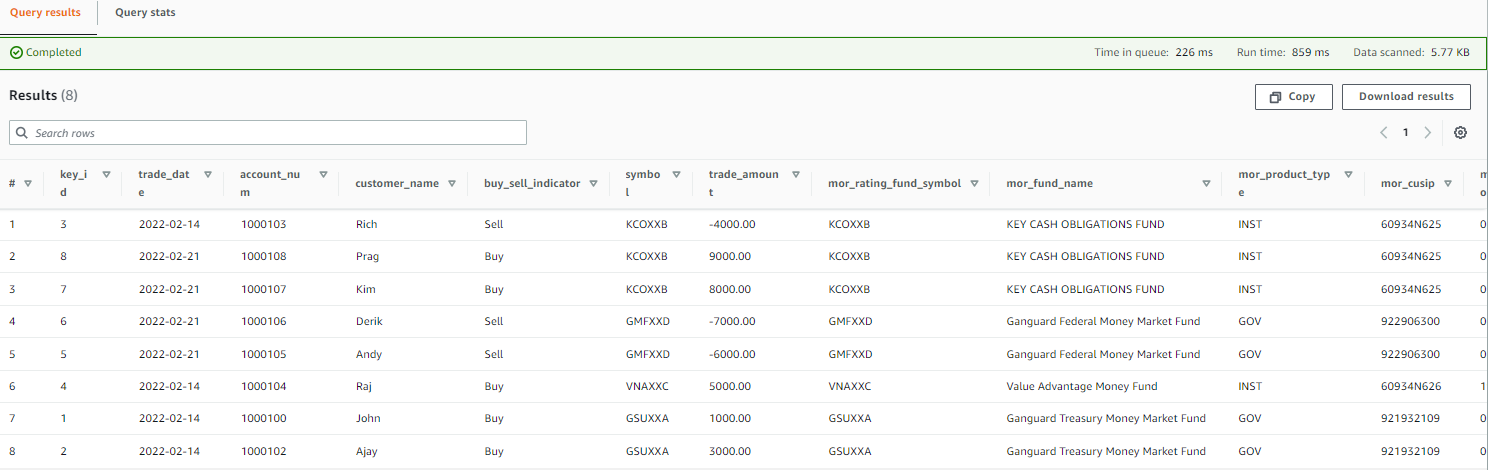
Review the results using Athena
To view the data in Athena, complete the following steps:
- Navigate to the Athena console, where you can see the database and tables created by your crawlers.

If you haven’t used Athena in this account before, a message appears instructing you to set a query result location.

- Choose Settings, Manage, Browse S3, and select any bucket that you created.
- Choose Save and return to the editor to continue.
- In the Data section, expand Tables to see the tables you created with the AWS Glue crawlers.
- Choose the options menu (three dots) next to one of the tables and choose Preview Table.


The following screenshot shows an example of the data.
Create a QuickSight dashboard and visualizations
To set up QuickSight for the first time, sign up for a QuickSight subscription and allow connections to Athena.
To create a dashboard in QuickSight based on the AWS Glue Data Catalog tables you created, complete the following steps:
- On the QuickSight console, choose Datasets in the navigation pane.
- Choose New dataset.

- Create a new QuickSight dataset called Fund-Analysis with Athena as the data source.

- In the Choose your table section, choose
AwsDataCatlogfor Catalog and choosetrade_analysis_dbfor Database. - For Tables, select the
tradesratingmergedtable to visualize. - Choose Select.

- Import the data into SPICE.
SPICE is an in-memory engine that QuickSight uses to perform advanced calculations and improve performance. Importing the data into SPICE can save time and money. When using SPICE, you can refresh your datasets both fully or incrementally. As of this writing, you can schedule incremental refreshes up to every 15 minutes. For more information, refer to Refreshing SPICE data. For near-real-time analysis, select Directly query your data instead. - Choose Visualize.

After you create the dataset, you can view it and edit its properties. For this post, leave the properties unchanged. - To analyze the market performance from the Morningstar file, choose the clustered bar combo chart under Visual types.
- Drag
Fund_Symbolfrom Fields list to X-axis. - Drag
Ratingsto Y-axis and Lines. - Choose the default title choose Edit title to change the title to “Market Analysis.”
The following QuickSight dashboard was created using a custom theme, which is why the colors may appear different than yours.

- To display the Morningstar details in tabular form, add a visual to create additional graphs.

- Choose the table visual under Visual types.
- Drag
Fund SymbolandFund Namesto Group by. - Drag
Ratings,Historical Earnings, andLT Earningsto Value.

In QuickSight, up until this point, you analyzed the market performance reported by Morningstar. Let’s analyze the near-real-time daily trade activities. - Add a visual to create additional graphs.
- Choose the clustered bar combo chart under Visual types.
- Drag
Fund_Symbolfrom Fields list to X-axis andTrade Amountto Y-axis. - Choose the default title choose Edit title to change the title to “Daily Transactions.”

- To display the daily trades in tabular form, add a visual to create additional graphs.
- Drag
Trade Date,Customer Name,Fund Name,Fund Symbol, andBuy/Sellto Group by. - Drag
Trade Amountto Value.


The following screenshot shows a complete dashboard. This compares the market observation reported in the street against the daily trades happening in the bank.

In the Market Analysis section of the dashboard, GMFXXD funds were performing well based on the previous night’s feed from Morningstar. However, the Daily Transactions section of the dashboard shows that customers were selling their positions from the funds. Relying only on the previous nightly batch report will mislead the fund managers or operation analyst to act.
Near-real-time analytics using AWS Glue Studio and QuickSight can enable fund managers and analysts to self-serve and impose fees or gates on those IMM funds.
Clean up
To avoid incurring future charges and to clean up unused roles and policies, delete the resources you created: the CloudFormation stack, S3 bucket, and AWS Glue job.
Conclusion
In this post, you learned how to use AWS Glue Studio to analyze data from different sources with no previous coding experience and how to build visualizations and get business insights using QuickSight. You can use AWS Glue Studio and QuickSight to speed up the analytics process and allow different personas to transform data with no development experience.
For more information about AWS Glue Studio, see the AWS Glue Studio User Guide. For information about QuickSight, refer to the Amazon QuickSight User Guide.
About the authors
 Rajeshkumar Karuppaswamy is a Customer Solutions Manager at AWS. In this role, Rajeshkumar works with AWS Customers to drive Cloud strategy, provides thought leadership to accelerate businesses achieve speed, agility, and drive innovation. His areas of interests are AI & ML, analytics, and data engineering.
 Richa Kaul is a Senior Leader in Customer Solutions serving Financial Services customers. She is based out of New York. She has extensive experience in large scale cloud transformation, employee excellence, and next generation digital solutions. She and her team focus on optimizing value of cloud by building performant, resilient and agile solutions. Richa enjoys multi sports like triathlons, music, and learning about new technologies.
 Noritaka Sekiyama is a Principal Big Data Architect on the AWS Glue team. He is responsible for building software artifacts to help customers. This summer, he enjoyed goldfish scooping with his children.
How to Download and Back Up OneDrive Data
Post Syndicated from Lora Maslenitsyna original https://www.backblaze.com/blog/how-to-download-and-back-up-onedrive-data/
On the Backblaze blog, we’ve been sharing tips for backing up and doing more with your data, especially when it comes to data digitally scattered across social media platforms. We asked what you, our readers, wanted to know about protecting your data online and you responded with this question: How do you download and back up data on Microsoft OneDrive?
OneDrive is an online file hosting service that many users take advantage of to sync the data on their computer. Although it offers 5GB of storage space for free, users pay a fee to store data that exceeds tiers of 100GB, 1TB, and 6TB. OneDrive even notes on their website that to free up space on your OneDrive account, you should download that file or folder to a location outside of your OneDrive folders, and then delete the OneDrive copy of the file or folder to reduce your storage amount. Of course, this means that the document is no longer syncing. And by doing so, you’re forced to constantly juggle the amount of data saved in OneDrive to stay under the free limit. Worse yet, the data you remove from OneDrive is no longer protected using the 3-2-1 backup method.
This guide walks you through ensuring your data on OneDrive is safely backed up and how to keep your data safe using the 3-2-1 backup strategy. So, read on to learn how to save your OneDrive data, including:
- A step-by-step guide to accessing and downloading your data.
- What to do with your downloaded OneDrive data to ensure it stays protected.
Back Up Everything But the Kitchen Sync
If you’re reading this blog post, you probably already know that saving your data to a sync service is not the same as backing it up. Sync and backup services are complimentary, but only a backup will save a copy of your data and keep it safe against accidental deletion, updates, a ransomware attack, and more.
To help you save your synced computer data, we’re developing a series of guides to downloading and backing up your data across different sync services. Below is a list of our other guides, and comment below to let us know what other sync services you’d like to see us cover.
- How to Download and Back Up Email Account Data
- How to Download and Back Up Your Facebook Data
- How to Download and Back Up Your Google Drive Data
- How to Download and Back Up Your TikTok Data
- How to Download and Back Up Your Twitch Content
- How to Download and Back Up YouTube Videos
- How to Download and Back Up Yahoo and AOL Data
- How to Back Up Your Data Once You’ve Downloaded It
How to Download Data From Microsoft OneDrive
-
- Open your OneDrive account and select the files or folders you want to download. You can select individual items by clicking the circle check box next to each item. You can also select several files at once by clicking on one file, scrolling down the list, then left-clicking while holding down the Shift key on the last item in the list you want to select. To select all of the files in a folder, click the circle to the left of the top row, or simply press CTRL + A (or COMMAND + A on a Mac).
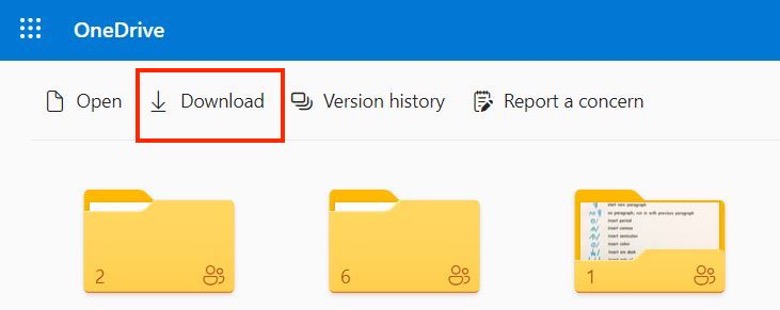
- In the top menu, select Download. You can also right-click an individual file and select Download. If you choose multiple files or folders and then select Download, your browser will download a ZIP file containing all the data you selected. If you’re in a folder and you select Download without selecting any files or folders, your browser will download everything saved in that folder.
- Save your OneDrive data on your computer. Your browser will download your files to the Downloads folder of your computer. Select the files and save them to a permanent location. For some users, your browser may prompt you to choose the location where you want to save the download.

Now that you’ve downloaded your OneDrive data, keep reading to find out how to ensure that data is safely backed up.
The 3-2-1 Method in a Nutshell
Back up your data based on these principles:
- Redundancy. Have several copies of your data.
- Geographic Distance. Have those copies in different locations.
- Access. Have different types of access to your backup data. A good example here: you don’t want all of your data to be connected to the internet to reduce the risk of cyberattacks. You also don’t want all copies of your data stored in your home in case of disaster or theft.
How to Back Up OneDrive Data
Once you have all of your OneDrive data downloaded on your computer, you’ve fulfilled the first step of the 3-2-1 backup strategy by storing your data on your local device. Next, you should make sure to follow the next steps and save your data on a secondary, external device and in a third, off-site location. Cloud storage is the one of the best options for easily securing your data off-site.
If you’re using Backblaze Personal Backup to protect all of the data on your computer and external drives, you’re all set! Backblaze automatically and continuously backs up a copy of all of your data to the cloud.
Another option to consider when you want to securely store your data and offload some of it from your local device is to upload your data to Backblaze B2 Cloud Storage directly. As long as you are still keeping a copy of that data on other local drives or devices, you’re still fulfilling the 3-2-1 backup method. You can learn more about the difference between using Personal Backup and B2 Cloud Storage and how to save and organize your data in cloud storage by reading this blog post.
Read On to Get the Most Out of Backblaze and OneDrive
Our help section is filled with useful guides on maximizing the integration of Backblaze and OneDrive. Check out our guides for Windows or Mac to learn more.
Don’t Rely on Sync Services to Secure Your Data
Chances are, the data you have saved in your OneDrive folders is data you want to keep. Don’t wait until you accidentally get locked out of your account or a software update wreaks havoc on your synced data. Back up your data today, and comment below to let us know what else you’d like to know about to help you keep your data safe.
The post How to Download and Back Up OneDrive Data appeared first on Backblaze Blog | Cloud Storage & Cloud Backup.
What’s the best option for a router at BestBuy? Let’s find out!
Post Syndicated from Crosstalk Solutions original https://www.youtube.com/watch?v=Ax--F_AIbfo