Post Syndicated from The Atlantic original https://www.youtube.com/watch?v=Dc7wo8R6C_o
Stand-Up Comedy (With Cristela Alonzo) | The Atlantic Festival 2022
Post Syndicated from The Atlantic original https://www.youtube.com/watch?v=PxwotKVBrEQ
Enable self-service visual data integration and analysis for fund performance using AWS Glue Studio and Amazon QuickSight
Post Syndicated from Rajeshkumar Karuppaswamy original https://aws.amazon.com/blogs/big-data/enable-self-service-visual-data-integration-and-analysis-for-fund-performance-using-aws-glue-studio-and-amazon-quicksight/
IMM (Institutional Money Market) is a mutual fund that invests in highly liquid instruments, cash, and cash equivalents. IMM funds are large financial intermediaries that are crucial to financial stability in the US. Due to its criticality, IMM funds are highly regulated under the security laws, notably Rule 2a-7, Which states that during market stress, fund managers can impose a liquidity fee up to 2% or redemption gates (a delay in processing redemption) if the fund’s weekly liquid assets drop below 30% of its total assets. The liquidity fees and gates allow money market funds to stop heavy redemption in times of market volatility.
Traditional banks use legacy systems and rely on monolithic architectures. Typically, data and business logic is tightly coupled on the same mainframe machines. It’s hard for analysts and fund managers to perform self-service and gather real-time analytics from these legacy systems. They work on the previous nightly report and struggle to keep up with market fluctuations. The slightest modification to the reports on these legacy systems involves vast costs, time, and significant dependency on the software development team. Due to these limitations, analysts and fund managers can’t respond effectively to market trends and face a tremendous challenge in adhering to the regulatory requirements of monitoring the market volatility.
Over the last few years, many banks have adopted the cloud. Banks have migrated their legacy workloads to reduce cost, improve their competitive advantage, and address competition from FinTech and startups. As part of the cloud strategy, many mainframe applications got re-platformed or re-architected to a more efficient database platform. However, many opportunities exist in modernizing the application. One such option is to enable self-service to run real-time analytics. AWS offers various services that help such use cases. In this post, we demonstrate how to analyze fund performance visually using AWS Glue Studio and QuickSight in a self-service fashion.
The aim of the post is to assist operations analysts and fund managers to self-service their data analysis needs without previous coding experience. This post demonstrates how AWS Glue Studio reduces the software development team’s dependency and helps analysts and fund managers perform near-real-time analytics. This post also illustrates how to build visualizations and quickly get business insights using Amazon QuickSight.
Solution overview
Most banks record their daily trading transactions activity in relational database systems. A relational database keeps the ledger of daily transactions that involves many buys and sells of IMM funds. We use the mock trades data and a simulated Morningstar data feed to demonstrate our use case.
The following sample Amazon Relational Database Service (Amazon RDS) instance records daily IMM trades, and Morningstar market data gets stored in Amazon Simple Storage Service (Amazon S3). With AWS Glue Studio, analysts and fund managers can analyze the IMM trades in near-real time and compare them with market observations from Morningstar. They can then review the data in Amazon Athena, and use QuickSight to visualize and further analyze the trade patterns and market trends.
This near-real time and self-service enables fund managers quickly respond to the market volatility and apply fees or gates on IMM funds to comply with Rule 2a-7 regulatory requirements.
The following diagram illustrates the solution architecture.

Provision resources with AWS CloudFormation
To create your resources for this use case, we deploy an AWS CloudFormation template. Complete the following steps:
- Choose Launch Stack (
in us-east-1):

- Choose Next three times to reach the Review step.
- Select I acknowledge that AWS CloudFormation might create IAM resources.
- Choose Create stack.
Create an AWS Glue connection
You create an AWS Glue connection to access the MySQL database created by the CloudFormation template. An AWS Glue crawler uses the connection in the next step.
- On the AWS Glue console, under Databases in the navigation pane, choose Connections.
- Choose Add connection.

- For Connection name, enter
Trade-Analysis. - For Connection type¸ choose JDBC.
- Choose Next.

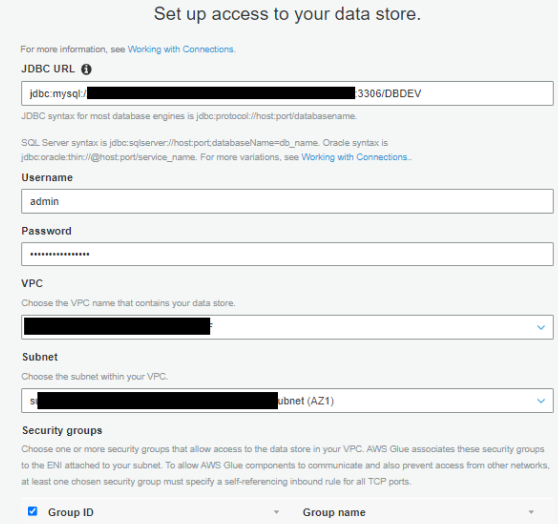
- For JDBC URL, enter your URL.
To connect to an Amazon RDS for MySQL data store with a DBDEV database, use the following code:For more details, see AWS Glue connection properties. Refer to the CloudFormation
fund-analysisstack Outputs tab to get the Amazon RDS ARN.The next step requires you to first retrieve your MySQL database user name and password via AWS Secrets Manager.
- On the Secrets Manager console, choose Secrets in the navigation pane.
- Choose the
secret rds-secret-fund-analysis. - Choose Retrieve secret value to get the user name and password.
- Return to the connection configuration and enter the user name and password.
- For VPC, choose the VPC ending with
fund-analysis. - For Subnet and Security groups, choose the values ending with
fund-analysis.

- Choose Next and Finish to complete the connection setup.
- Select the connection you created and choose Test Connection.
- For IAM role, choose the role
AWSGlueServiceRole-Studio.


For more details about using AWS Identity and Access Management (IAM), refer to Setting up for AWS Glue Studio.

Create and run AWS Glue crawlers
In this step, you create two crawlers. The crawlers connect to a data store, determine the schema for your data, and then create metadata tables in your AWS Glue Data Catalog.
Crawl MySQL data stores
The first crawler creates metadata for the MySQL data stores. Complete the following steps:
- On the AWS Glue console, choose Crawlers in the navigation pane.
- Choose Add crawler.
- For Crawler name, enter
Trades Crawlers. - Choose Next.
- For Crawler source type, choose Data stores.
- For Repeat crawls of S3 data stores, choose Crawl all folders.
- Choose Next.
- For Choose a data store, choose JDBC.
- For Connection, choose Trade-Analysis.
- For Include path, enter the MySQL database name (
DBDEV). - Choose Next.

- For Add another data store, choose No.
- Choose Next.
- For the IAM role to access the data stores, choose the role
AWSGlueServiceRole-Studio. - For Frequency, choose Run on demand.
- Choose Add database.

- For Database name, enter
trade_analysis_db. - Choose Create.
- Choose Next.
- Review all the steps and choose Finish to create your crawler.
- Select the
Trades Crawlerscrawler and choose Run crawler to get the metadata.


Crawl Amazon S3 data stores
Now you configure a crawler to create metadata for the Amazon S3 data stores.
- On the AWS Glue console, choose Crawlers in the navigation pane.
- Choose Add crawler.
- For Crawler name, enter
Ratings. - Choose Next.
- For Crawler source type, choose Data stores.
- For Repeat crawls of S3 data stores, choose Crawl all folders.
- Choose Next.
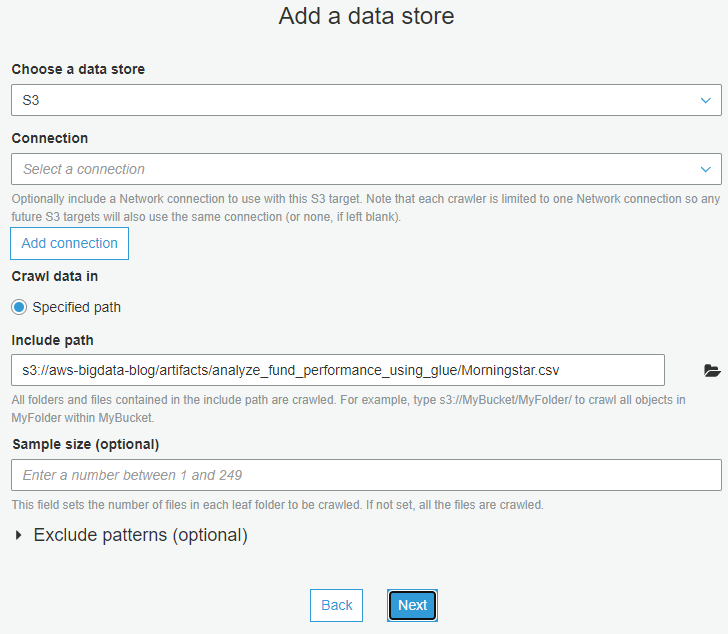
- For Choose a data store, choose S3.
- For Connection, choose Trade-Analysis.
- For Include path, enter
s3://aws-bigdata-blog/artifacts/analyze_fund_performance_using_glue/Morningstar.csv. - Choose Next.

- For Add another data store, choose No.
- Choose Next.
- For the IAM role to access the data stores, choose the role
AWSGlueServiceRole-Studio. - For Frequency, choose Run on demand.
- Choose Add database.
- For Database name, enter
trade_analysis_db. - Review all the steps and choose Finish to create your crawler.
- Select the
Ratingscrawler and choose Run crawler to get the metadata.
Review crawler output
To review the output of your two crawlers, navigate to the Databases page on the AWS Glue console.
You can review the database trade_analysis_db created in previous steps and the contents of the metadata tables.

Create a job using AWS Glue Studio
A job is the AWS Glue component that allows the implementation of business logic to transform data as part of the extract, transform, and load (ETL) process. For more information, see Adding jobs in AWS Glue.
To create an AWS Glue job using AWS Glue Studio, complete the following steps:
- On the AWS Glue console, in the navigation pane, choose AWS Glue Studio.
- Choose Create and manage jobs.
- Choose View jobs.
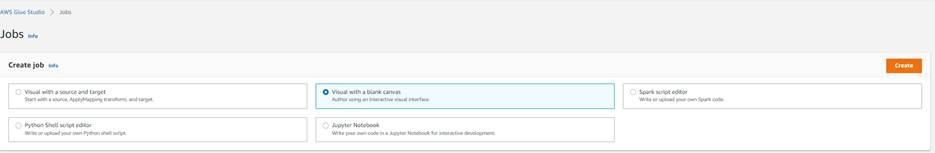
AWS Glue Studio supports different sources. For this post, you use two AWS Glue tables as data sources and one S3 bucket as the destination. - In the Create job section, select Visual with a blank canvas.
- Choose Create.

This takes you to the visual editor to create an AWS Glue job. - Change the job name from
Untitled JobtoTrade-Analysis-Job.
You now have an AWS Glue job ready to filter, join, and aggregate data from two different sources.
Add two data sources
For this post, you use two AWS Glue tables as data sources: Trades and Ratings, which you created earlier.
- On the AWS Glue Studio console, on the Source menu, choose MySQL.

- On the Node properties tab, for Name, enter Trades.
- For Node type, choose MySQL.

- On the Data Source properties – MySQL tab, for Database, choose
trade_analysis_db. - For Table, choose
dbdev_mft_actvitity.
Before adding the second data source to the analysis job, be sure that the node you just created isn’t selected. - On the Source menu, choose Amazon S3.
- On the Node properties tab, for Name, enter
Ratings. - For Node type, choose Amazon S3.

- On the Data Source properties – S3 tab, for Database, choose
trade_analysis_db. - For Table, choose
morning_star_csv.
You now have two AWS Glue tables as the data sources for the AWS Glue job.The Data preview tab helps you sample your data without having to save or run the job. The preview runs each transform in your job so you can test and debug your transformations. - Choose the
Ratingsnode and on the Data preview tab, choose Start data preview session.

- Choose the
AWSGlueServiceRole-StudioIAM role and choose Confirm to sample the data.


Data previews are available for each source, target, and transform node in the visual editor, so you can verify the results step by step for other nodes.
Join two tables
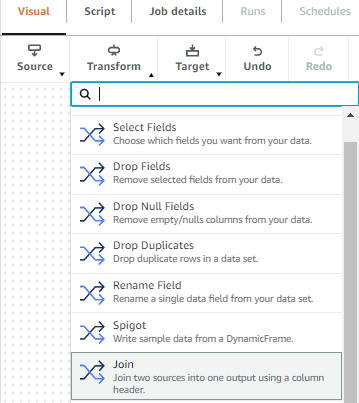
A transform is the AWS Glue Studio component were the data is modified. You have the option of using different transforms that are part of this service or custom code. To add transforms, complete the following steps:
- On the Transform menu, choose Join.

- On the Node properties tab, for Name, enter
trades and ratings join. - For Node type, choose Join.
- For Node parents, choose the
TradesandRatingsdata sources.

- On the Transform tab, for Join type, choose Outer join.
- Choose the common column between the tables to establish the connection.
- For Join conditions, choose symbol from the
Tradestable andmor_rating_fund_symbolfrom theRatingstable.


Add a target
Before adding the target to store the result, be sure that the node you just created isn’t selected. To add the target, complete the following steps:
- On the Target menu, choose Amazon S3.

- On the Node properties tab, for Name, enter
trades ratings merged. - For Node type, choose Amazon S3 for writing outputs.
- For Node parents, choose
trades and ratings join.

- On the Data target properties – S3 tab, for Format, choose Parquet.
- For Compression type, choose None.
- For S3 target location, enter
s3://glue-studio-blog- {Your Account ID as a 12-digit number}/. - For Data catalog update options, select Create a table in the Data Catalog and on subsequent runs, update the schema and add new partitions.
- For Database, choose
trade-analysis-db. - For Table name, enter
tradesratingsmerged.


Configure the job
When the logic behind the job is complete, you must set the parameters for the job run. In this section, you configure the job by selecting components such as the IAM role and the AWS Glue version you use to run the job.
- Choose the Job details tab.

- For Job bookmark, choose Disable.
- For Number of retries, optionally enter
0.

- Choose Save.

- When the job is saved, choose Run.


Monitor the job
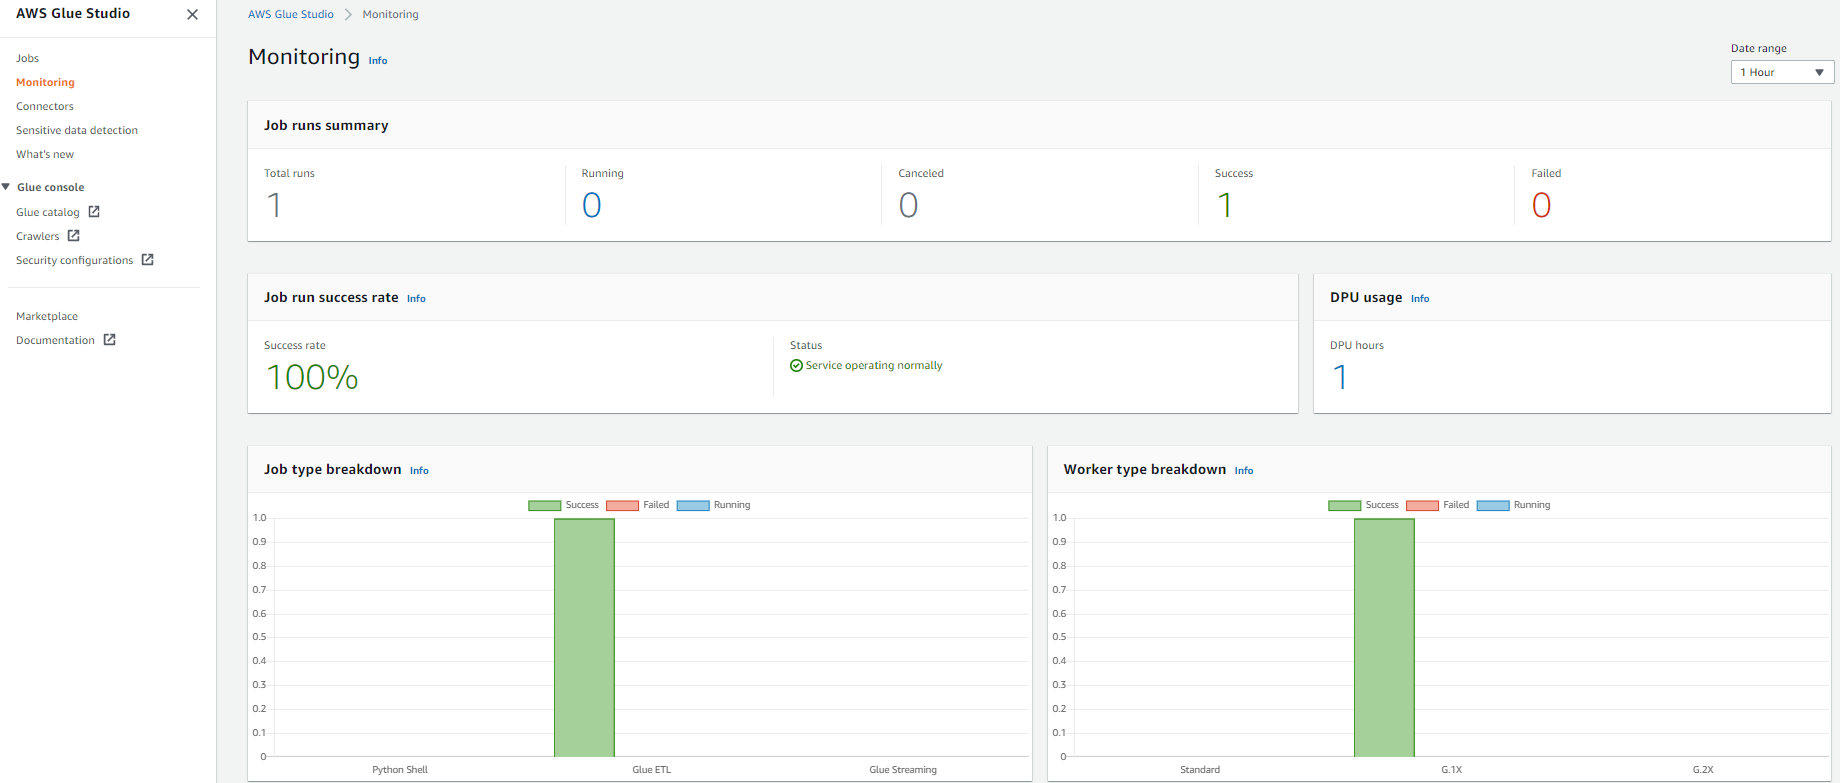
AWS Glue Studio offers a job monitoring dashboard that provides comprehensive information about your jobs. You can get job statistics and see detailed information about the job and the job status when running.
- In the AWS Glue Studio navigation pane, choose Monitoring.
- Change the date range to 1 hour using the Date range selector to get the recently submitted job.
The Job runs summary section displays the current state of the job run. The status of the job could be Running, Canceled, Success, or Failed.The Job run success rate section provides the estimated DPU usage for jobs, and gives you a summary of the performance of the job. Job type breakdown and Worker type breakdown contain additional information about the job.

- For get more details about the job run, choose View run details.


Review the results using Athena
To view the data in Athena, complete the following steps:
- Navigate to the Athena console, where you can see the database and tables created by your crawlers.

If you haven’t used Athena in this account before, a message appears instructing you to set a query result location.

- Choose Settings, Manage, Browse S3, and select any bucket that you created.
- Choose Save and return to the editor to continue.
- In the Data section, expand Tables to see the tables you created with the AWS Glue crawlers.
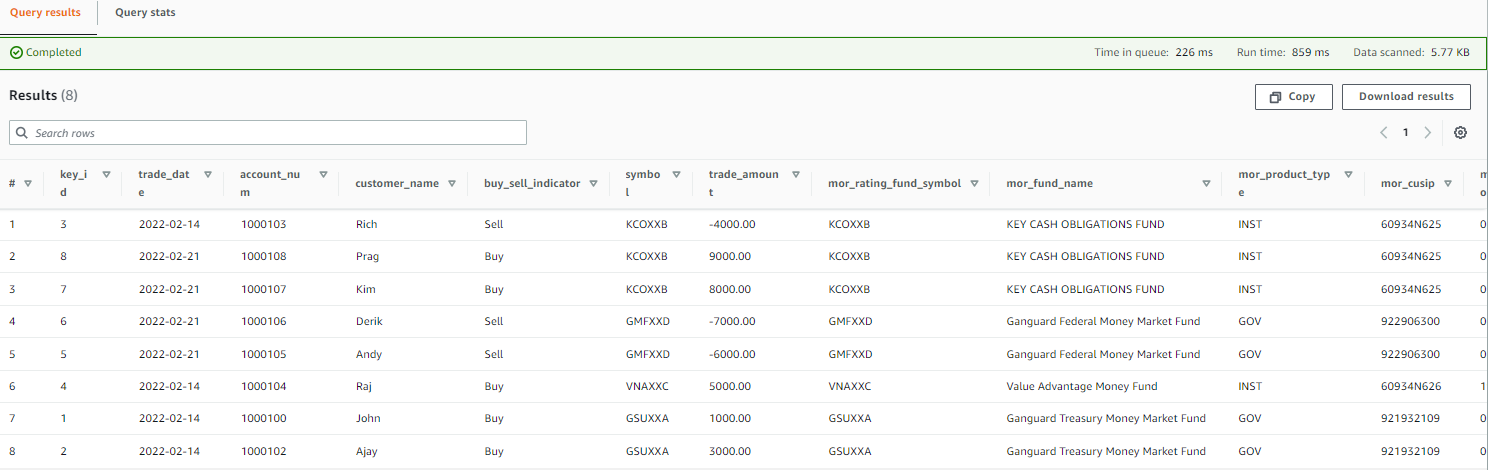
- Choose the options menu (three dots) next to one of the tables and choose Preview Table.


The following screenshot shows an example of the data.
Create a QuickSight dashboard and visualizations
To set up QuickSight for the first time, sign up for a QuickSight subscription and allow connections to Athena.
To create a dashboard in QuickSight based on the AWS Glue Data Catalog tables you created, complete the following steps:
- On the QuickSight console, choose Datasets in the navigation pane.
- Choose New dataset.

- Create a new QuickSight dataset called Fund-Analysis with Athena as the data source.

- In the Choose your table section, choose
AwsDataCatlogfor Catalog and choosetrade_analysis_dbfor Database. - For Tables, select the
tradesratingmergedtable to visualize. - Choose Select.

- Import the data into SPICE.
SPICE is an in-memory engine that QuickSight uses to perform advanced calculations and improve performance. Importing the data into SPICE can save time and money. When using SPICE, you can refresh your datasets both fully or incrementally. As of this writing, you can schedule incremental refreshes up to every 15 minutes. For more information, refer to Refreshing SPICE data. For near-real-time analysis, select Directly query your data instead. - Choose Visualize.

After you create the dataset, you can view it and edit its properties. For this post, leave the properties unchanged. - To analyze the market performance from the Morningstar file, choose the clustered bar combo chart under Visual types.
- Drag
Fund_Symbolfrom Fields list to X-axis. - Drag
Ratingsto Y-axis and Lines. - Choose the default title choose Edit title to change the title to “Market Analysis.”
The following QuickSight dashboard was created using a custom theme, which is why the colors may appear different than yours.

- To display the Morningstar details in tabular form, add a visual to create additional graphs.

- Choose the table visual under Visual types.
- Drag
Fund SymbolandFund Namesto Group by. - Drag
Ratings,Historical Earnings, andLT Earningsto Value.

In QuickSight, up until this point, you analyzed the market performance reported by Morningstar. Let’s analyze the near-real-time daily trade activities. - Add a visual to create additional graphs.
- Choose the clustered bar combo chart under Visual types.
- Drag
Fund_Symbolfrom Fields list to X-axis andTrade Amountto Y-axis. - Choose the default title choose Edit title to change the title to “Daily Transactions.”

- To display the daily trades in tabular form, add a visual to create additional graphs.
- Drag
Trade Date,Customer Name,Fund Name,Fund Symbol, andBuy/Sellto Group by. - Drag
Trade Amountto Value.


The following screenshot shows a complete dashboard. This compares the market observation reported in the street against the daily trades happening in the bank.

In the Market Analysis section of the dashboard, GMFXXD funds were performing well based on the previous night’s feed from Morningstar. However, the Daily Transactions section of the dashboard shows that customers were selling their positions from the funds. Relying only on the previous nightly batch report will mislead the fund managers or operation analyst to act.
Near-real-time analytics using AWS Glue Studio and QuickSight can enable fund managers and analysts to self-serve and impose fees or gates on those IMM funds.
Clean up
To avoid incurring future charges and to clean up unused roles and policies, delete the resources you created: the CloudFormation stack, S3 bucket, and AWS Glue job.
Conclusion
In this post, you learned how to use AWS Glue Studio to analyze data from different sources with no previous coding experience and how to build visualizations and get business insights using QuickSight. You can use AWS Glue Studio and QuickSight to speed up the analytics process and allow different personas to transform data with no development experience.
For more information about AWS Glue Studio, see the AWS Glue Studio User Guide. For information about QuickSight, refer to the Amazon QuickSight User Guide.
About the authors
 Rajeshkumar Karuppaswamy is a Customer Solutions Manager at AWS. In this role, Rajeshkumar works with AWS Customers to drive Cloud strategy, provides thought leadership to accelerate businesses achieve speed, agility, and drive innovation. His areas of interests are AI & ML, analytics, and data engineering.
 Richa Kaul is a Senior Leader in Customer Solutions serving Financial Services customers. She is based out of New York. She has extensive experience in large scale cloud transformation, employee excellence, and next generation digital solutions. She and her team focus on optimizing value of cloud by building performant, resilient and agile solutions. Richa enjoys multi sports like triathlons, music, and learning about new technologies.
 Noritaka Sekiyama is a Principal Big Data Architect on the AWS Glue team. He is responsible for building software artifacts to help customers. This summer, he enjoyed goldfish scooping with his children.
How to Download and Back Up OneDrive Data
Post Syndicated from Lora Maslenitsyna original https://www.backblaze.com/blog/how-to-download-and-back-up-onedrive-data/
On the Backblaze blog, we’ve been sharing tips for backing up and doing more with your data, especially when it comes to data digitally scattered across social media platforms. We asked what you, our readers, wanted to know about protecting your data online and you responded with this question: How do you download and back up data on Microsoft OneDrive?
OneDrive is an online file hosting service that many users take advantage of to sync the data on their computer. Although it offers 5GB of storage space for free, users pay a fee to store data that exceeds tiers of 100GB, 1TB, and 6TB. OneDrive even notes on their website that to free up space on your OneDrive account, you should download that file or folder to a location outside of your OneDrive folders, and then delete the OneDrive copy of the file or folder to reduce your storage amount. Of course, this means that the document is no longer syncing. And by doing so, you’re forced to constantly juggle the amount of data saved in OneDrive to stay under the free limit. Worse yet, the data you remove from OneDrive is no longer protected using the 3-2-1 backup method.
This guide walks you through ensuring your data on OneDrive is safely backed up and how to keep your data safe using the 3-2-1 backup strategy. So, read on to learn how to save your OneDrive data, including:
- A step-by-step guide to accessing and downloading your data.
- What to do with your downloaded OneDrive data to ensure it stays protected.
Back Up Everything But the Kitchen Sync
If you’re reading this blog post, you probably already know that saving your data to a sync service is not the same as backing it up. Sync and backup services are complimentary, but only a backup will save a copy of your data and keep it safe against accidental deletion, updates, a ransomware attack, and more.
To help you save your synced computer data, we’re developing a series of guides to downloading and backing up your data across different sync services. Below is a list of our other guides, and comment below to let us know what other sync services you’d like to see us cover.
- How to Download and Back Up Email Account Data
- How to Download and Back Up Your Facebook Data
- How to Download and Back Up Your Google Drive Data
- How to Download and Back Up Your TikTok Data
- How to Download and Back Up Your Twitch Content
- How to Download and Back Up YouTube Videos
- How to Download and Back Up Yahoo and AOL Data
- How to Back Up Your Data Once You’ve Downloaded It
How to Download Data From Microsoft OneDrive
-
- Open your OneDrive account and select the files or folders you want to download. You can select individual items by clicking the circle check box next to each item. You can also select several files at once by clicking on one file, scrolling down the list, then left-clicking while holding down the Shift key on the last item in the list you want to select. To select all of the files in a folder, click the circle to the left of the top row, or simply press CTRL + A (or COMMAND + A on a Mac).
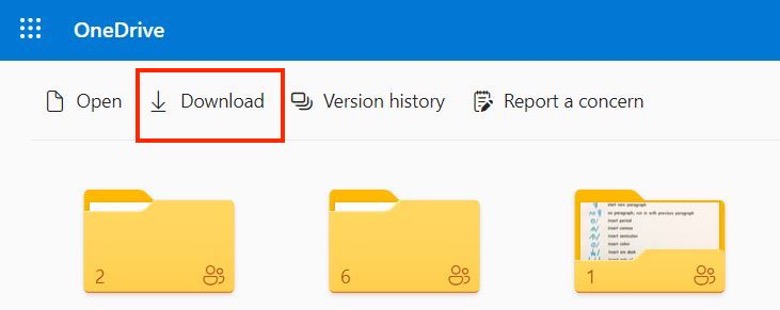
- In the top menu, select Download. You can also right-click an individual file and select Download. If you choose multiple files or folders and then select Download, your browser will download a ZIP file containing all the data you selected. If you’re in a folder and you select Download without selecting any files or folders, your browser will download everything saved in that folder.
- Save your OneDrive data on your computer. Your browser will download your files to the Downloads folder of your computer. Select the files and save them to a permanent location. For some users, your browser may prompt you to choose the location where you want to save the download.

Now that you’ve downloaded your OneDrive data, keep reading to find out how to ensure that data is safely backed up.
The 3-2-1 Method in a Nutshell
Back up your data based on these principles:
- Redundancy. Have several copies of your data.
- Geographic Distance. Have those copies in different locations.
- Access. Have different types of access to your backup data. A good example here: you don’t want all of your data to be connected to the internet to reduce the risk of cyberattacks. You also don’t want all copies of your data stored in your home in case of disaster or theft.
How to Back Up OneDrive Data
Once you have all of your OneDrive data downloaded on your computer, you’ve fulfilled the first step of the 3-2-1 backup strategy by storing your data on your local device. Next, you should make sure to follow the next steps and save your data on a secondary, external device and in a third, off-site location. Cloud storage is the one of the best options for easily securing your data off-site.
If you’re using Backblaze Personal Backup to protect all of the data on your computer and external drives, you’re all set! Backblaze automatically and continuously backs up a copy of all of your data to the cloud.
Another option to consider when you want to securely store your data and offload some of it from your local device is to upload your data to Backblaze B2 Cloud Storage directly. As long as you are still keeping a copy of that data on other local drives or devices, you’re still fulfilling the 3-2-1 backup method. You can learn more about the difference between using Personal Backup and B2 Cloud Storage and how to save and organize your data in cloud storage by reading this blog post.
Read On to Get the Most Out of Backblaze and OneDrive
Our help section is filled with useful guides on maximizing the integration of Backblaze and OneDrive. Check out our guides for Windows or Mac to learn more.
Don’t Rely on Sync Services to Secure Your Data
Chances are, the data you have saved in your OneDrive folders is data you want to keep. Don’t wait until you accidentally get locked out of your account or a software update wreaks havoc on your synced data. Back up your data today, and comment below to let us know what else you’d like to know about to help you keep your data safe.
The post How to Download and Back Up OneDrive Data appeared first on Backblaze Blog | Cloud Storage & Cloud Backup.
What’s the best option for a router at BestBuy? Let’s find out!
Post Syndicated from Crosstalk Solutions original https://www.youtube.com/watch?v=Ax--F_AIbfo
Lila Downs | Journey, Career & Beyond | Talks at Google
Post Syndicated from Talks at Google original https://www.youtube.com/watch?v=xCILNrxoF90
Filmmaker Joe Berlinger Discusses “Shadowland” and Conspiracy Theories | The Atlantic Festival 2022
Post Syndicated from The Atlantic original https://www.youtube.com/watch?v=y6kXOr3WV_0
One Year After IntSights Acquisition, Threat Intel’s Value Is Clear
Post Syndicated from Stacy Moran original https://blog.rapid7.com/2022/09/22/one-year-after-intsights-acquisition-threat-intels-value-is-clear/
Rapid7 Strengthens Market Position With 360-Degree XDR and Best-in-Class Threat Intelligence Offerings

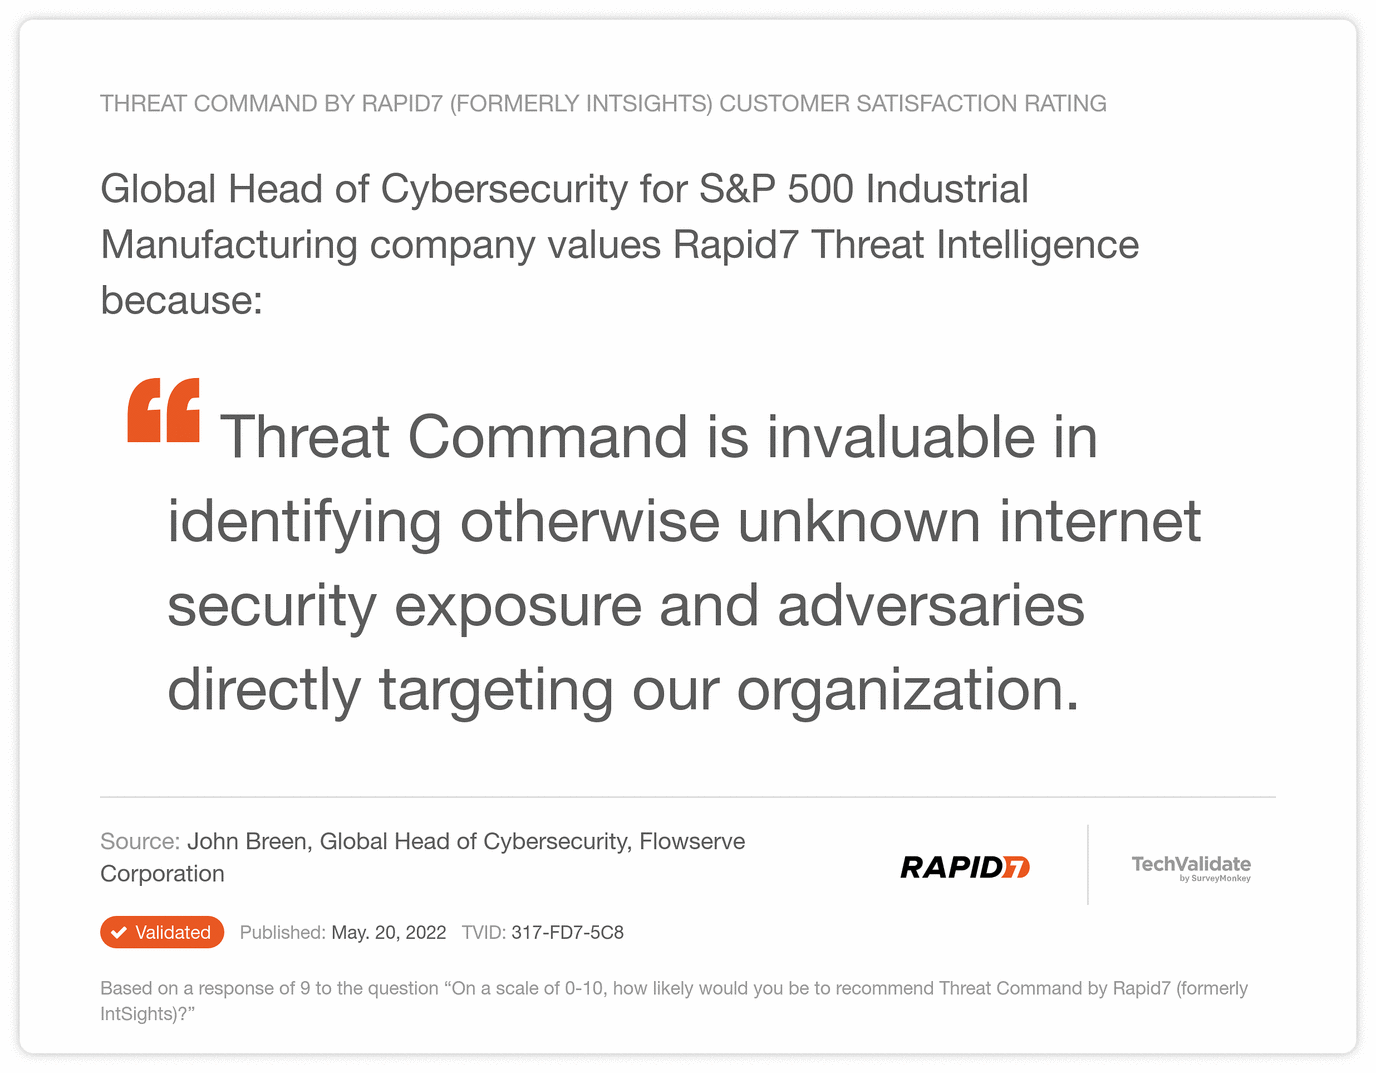
Time flies… and provides opportunities to establish proof points. After recently passing the one-year milestone of Rapid7’s acquisition of IntSights, the added value threat intelligence brings to our product portfolio is unmistakable.
Cross-platform SIEM, SOAR, and VM integrations expand capabilities and deliver super-charged XDR
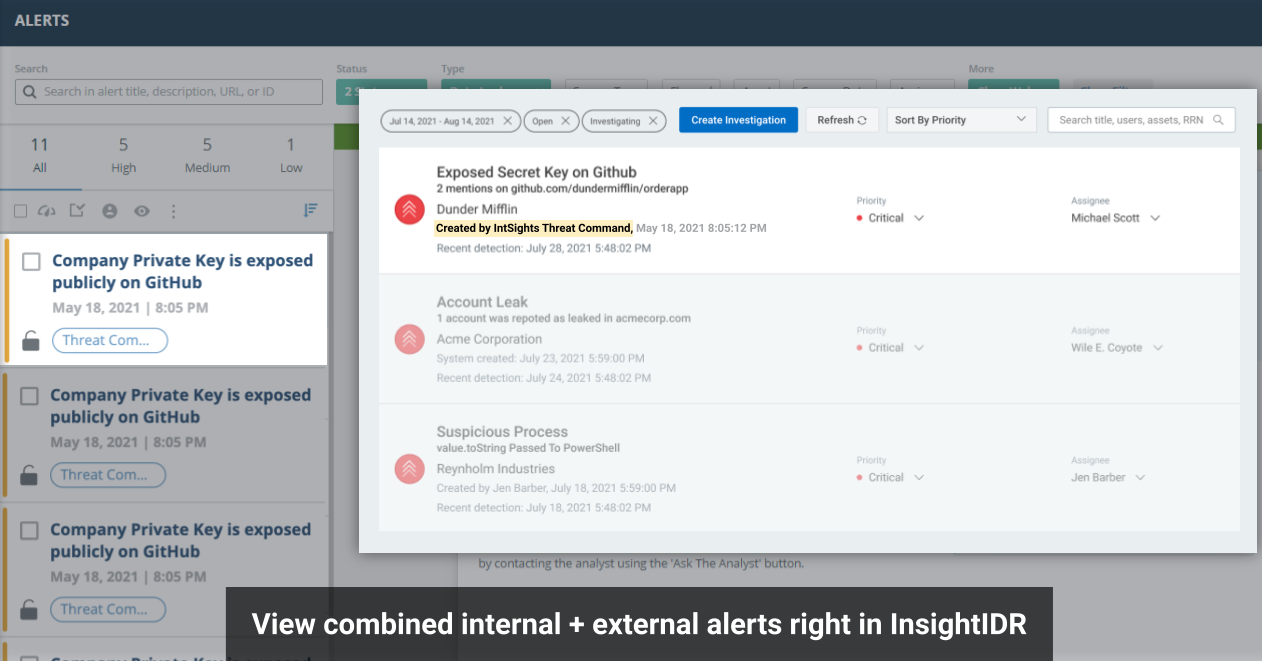
Integrations with Rapid7 InsightIDR (SIEM) and InsightConnect (SOAR) strengthen our product offerings. Infusing these tools with threat intelligence elevates customer security outcomes and delivers greater visibility across applications, while speeding response times. The combination of expertly vetted detections, contextual intelligence, and automated workflows within the security operations center (SOC) helps teams gain immediate visibility into the external attack surface from within their SIEM environments.
The threat intelligence integration with IDR is unique to Rapid7. It’s the only XDR solution in the market to infuse both generic threat intelligence IOCs and customized digital risk protection coverage. Users receive contextual, tailored alerts based on their digital assets, enabling them to detect potential threats before they hit endpoints and become incident response cases.

Capabilities
- Expand and accelerate threat detection with native integration of Threat Command alerts and TIP Threat Library IOCs with InsightIDR.
- Proactively thwart attack plans with alerts that identify active threats across the attack surface.
Benefits
- 360-degree visibility and protection across your internal and external attack surface
- Faster automated discovery and elimination of threats via correlation of Threat Command alerts with InsightIDR investigative capabilities
Learn more: 360-Degree XDR and Attack Surface Coverage, XDR Solution Brief
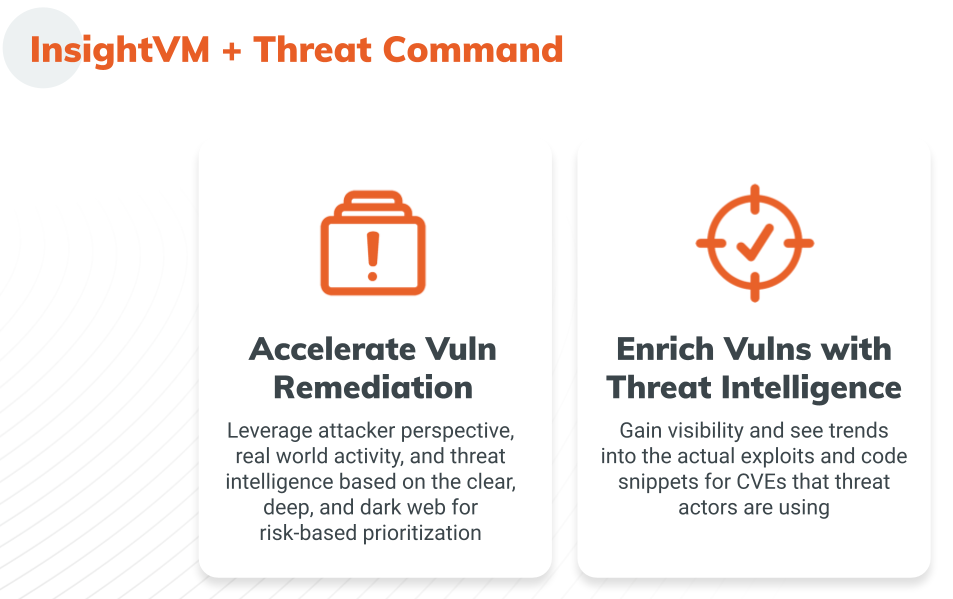
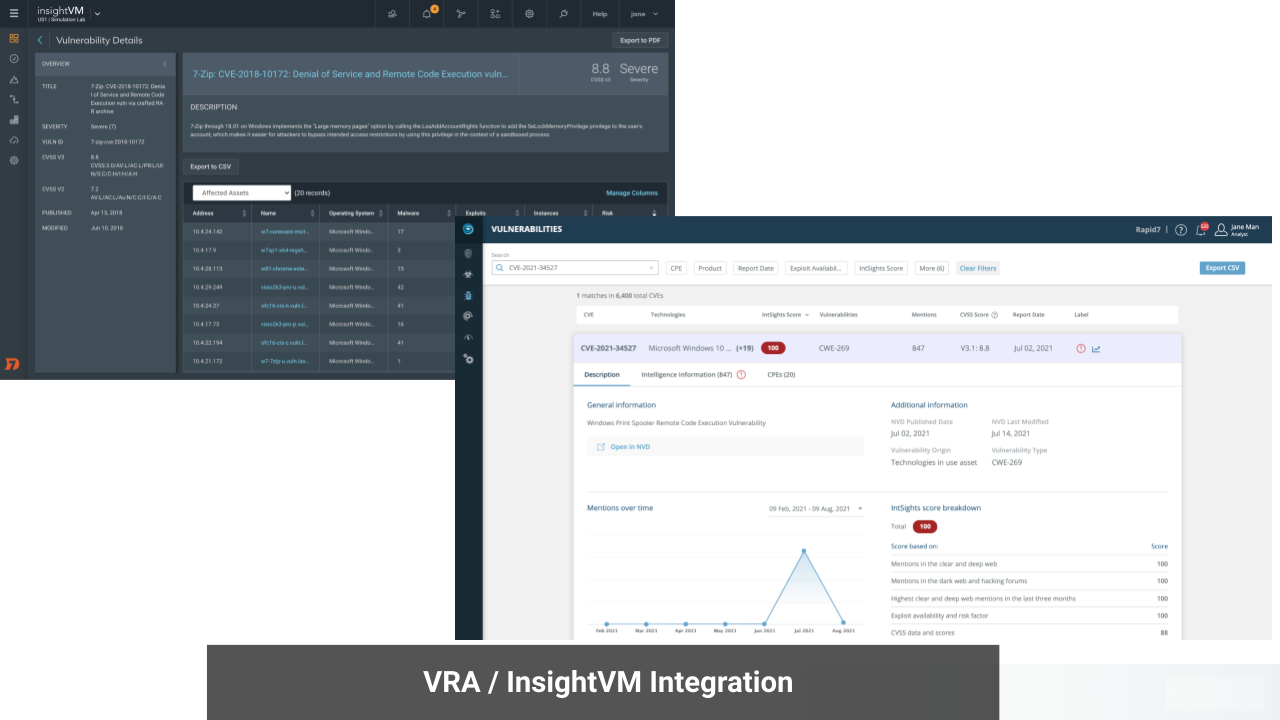
The Threat Command Vulnerability Risk Analyzer (VRA) + InsightVM integration delivers complete visibility into digital assets and vulnerabilities across your attack surface, including attacker perspective, trends, and active discussions and exploits. Joint customers can import data from InsightVM into their VRA environment where CVEs are enriched with valuable context and prioritized by vulnerability criticality and risk, eliminating the guesswork of manual patch management. VRA is a bridge connecting objective critical data with contextualized threat intelligence derived from tactical observations and deep research. In addition to VRA, customers can leverage Threat Command’s Browser Extension to obtain additional context on CVEs, and TIP module to see related IOCs and block actively exploited vulnerabilities.
Integration benefits
- Visibility: Continuously monitor assets and associated vulnerabilities.
- Speed: Instantly assess risk from emerging vulnerabilities and improve patching cadence.
- Assessment: Eliminate blind spots with enhanced vulnerability coverage.
- Productivity: Reduce time security analysts spend searching for threats by 75% or more.
- Prioritization: Focus on the vulnerabilities that matter most.
- Automation: Integrate CVEs enriched with threat intelligence into existing security stack.
- Simplification: Rely on intuitive dashboards for centralized vulnerability management.
Learn how to leverage this integration to effectively prioritize and accelerate vulnerability remediation in this short demo and Integration Solution Brief.
In addition to these game-changing integrations that infuse Rapid7 Insight Platform solutions with external threat intelligence, Threat Command also introduced numerous feature and platform enhancements during the past several months.
Expanded detections and reduced noise
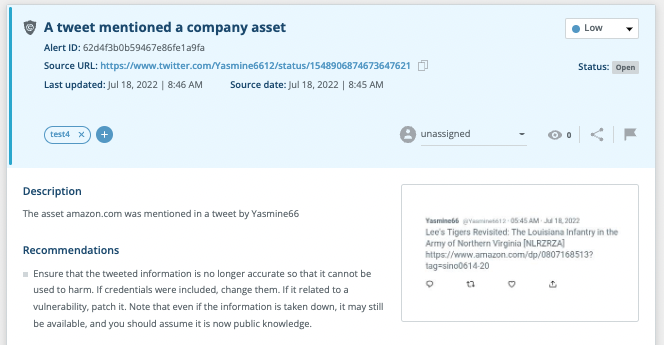
Of all mainstream social media platforms, Twitter has the fewest restrictions and regulations; coupled with maximum anonymity, this makes the service a breeding ground for hostile discourse.
Twitter by the numbers (in 2021)
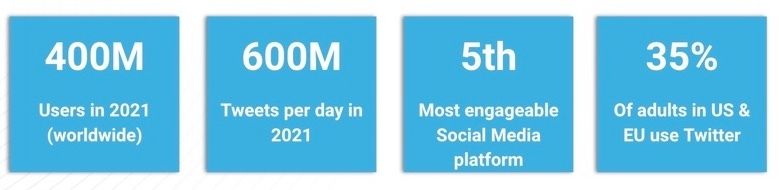
Threat Command Twitter Chatter coverage continually monitors Twitter discourse and alerts customers regarding mentions of company domains. Expanded Twitter coverage later this year will include company and brand names.
Threat Command’s Information Stealers feature expands the platform’s botnets credentials coverage. We now detect and alert on information-stealing malware that gathered leaked credentials and private data from infected devices. Customers are alerted when employees or users have been compromised (via corporate email, website, or mobile app). Rely on extended protection against this prevalent and growing malware threat based on our unique ability to obtain compromised data via our exclusive access to threat actors.
Accelerated time to value
The recently enhanced Threat Command Asset Management dashboard provides visibility into the risk associated with specific assets, displays asset targeting trends, and enables drill-down for alert investigation. Users can now categorize assets using tags and comments, generate bulk actions for multiple assets, and see a historical perspective of all activity related to specific assets.
Better visibility for faster decisions
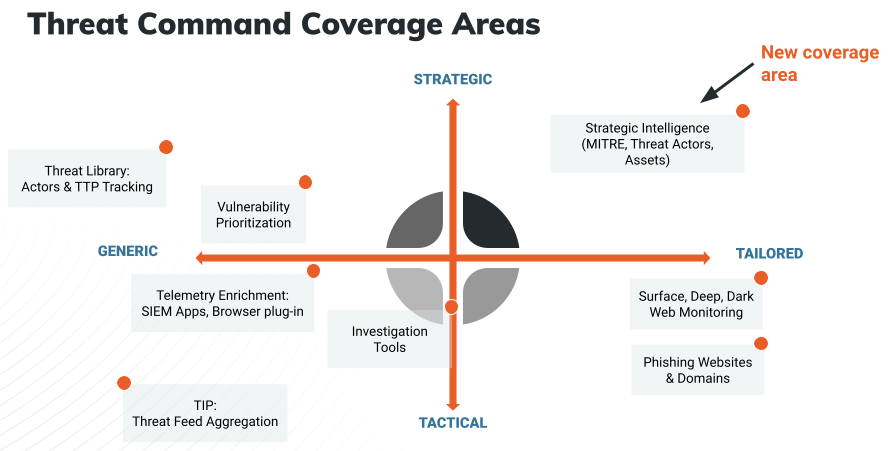
Strategic Intelligence is now available to existing Threat Command customers for a limited time in Open Preview mode. The Strategic Intelligence dashboard, aligned to the MITRE ATT&CK framework, enables CISOs and other security executives to track risk over time and assess, plan, and budget for future security investments.
Capabilities
- View potential vulnerabilities attackers may use to execute an attack – aligned to the MITRE ATT&CK framework (tactics & techniques).
- See trends in your external attack surface and track progress over time in exposed areas.
- Benchmark your exposure relative to other Threat Command customers in your sector/vertical.
- Easily communicate gaps and trends to management via dashboard and/or reports.
Benefits
- Rapid7 is the first vendor in the TI space to provide a comprehensive strategic view of an organization’s external threat landscape.
- Achieve your security goals with complete, forward-looking, and actionable intelligence context about your external assets.
- Bridge the communication and reporting gap between your CTI analysts dealing with everyday threats and the CISO, focused on the bigger picture.
Stay tuned!
There are many more exciting feature enhancements and new releases planned by year end.
Learn more about how Threat Command simplifies threat intelligence, delivering instant value for organizations of any size or maturity, while reducing risk exposure.
Additional reading:
Rust 1.64.0 released
Post Syndicated from original https://lwn.net/Articles/909085/
Version
1.64.0 of the Rust language has been released. Changes include the
stabilization of the IntoFuture
trait, easier access to C-compatible types, the availability of
rust-analyzer via
rustup, and more.
Logpush: now lower cost and with more visibility
Post Syndicated from Duc Nguyen original https://blog.cloudflare.com/logpush-filters-alerts/

Logs are a critical part of every successful application. Cloudflare products and services around the world generate massive amounts of logs upon which customers of all sizes depend. Structured logging from our products are used by customers for purposes including analytics, debugging performance issues, monitoring application health, maintaining security standards for compliance reasons, and much more.
Logpush is Cloudflare’s product for pushing these critical logs to customer systems for consumption and analysis. Whenever our products generate logs as a result of traffic or data passing through our systems from anywhere in the world, we buffer these logs and push them directly to customer-defined destinations like Cloudflare R2, Splunk, AWS S3, and many more.
Today we are announcing three new key features related to Cloudflare’s Logpush product. First, the ability to have only logs matching certain criteria be sent. Second, the ability to get alerted when logs are failing to be pushed due to customer destinations having issues or network issues occurring between Cloudflare and the customer destination. In addition, customers will also be able to query for analytics around the health of Logpush jobs like how many bytes and records were pushed, number of successful pushes, and number of failing pushes.
Filtering logs before they are pushed
Because logs are both critical and generated with high volume, many customers have to maintain complex infrastructure just to ingest and store logs, as well as deal with ever-increasing related costs. On a typical day, a real, example customer receives about 21 billion records, or 2.1 terabytes (about 24.9 TB uncompressed) of gzip compressed logs. Over the course of a month, that could easily be hundreds of billions of events and hundreds of terabytes of data.
It is often unnecessary to store and analyze all of this data, and customers could get by with specific subsets of the data matching certain criteria. For example, a customer might want just the set of HTTP data that had status code >= 400, or the set of firewall data where the action taken was to block the user.
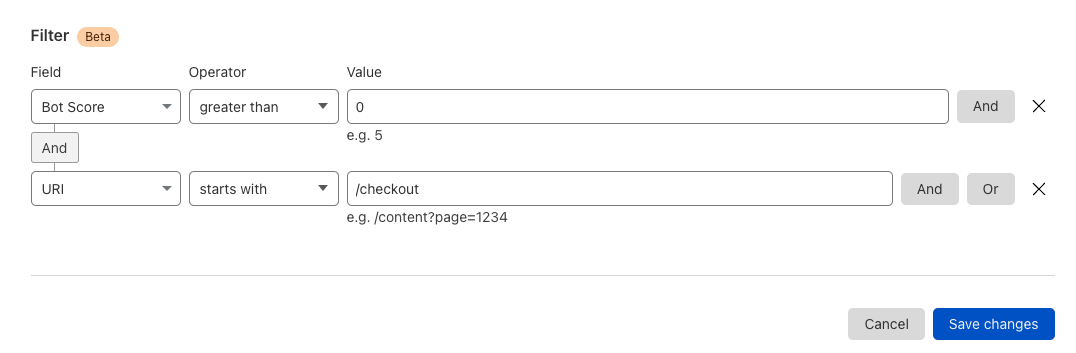
We can now achieve this in our Logpush jobs by setting specific filters on the fields of the log messages themselves. You can use either our API or the Cloudflare dashboard to set up filters.
To do this in the dashboard, either create a new Logpush job or modify an existing job. You will see the option to set certain filters. For example, an ecommerce customer might want to receive logs only for the checkout page where the bot score was non-zero:
Logpush job alerting
When logs are a critical part of your infrastructure, you want peace of mind that logging infrastructure is healthy. With that in mind, we are announcing the ability to get notified when your Logpush jobs have been retrying to push and failing for 24 hours.
To set up alerts in the Cloudflare dashboard:
1. First, navigate to “Notifications” in the left-panel of the account view
2. Next, Click the “add” button
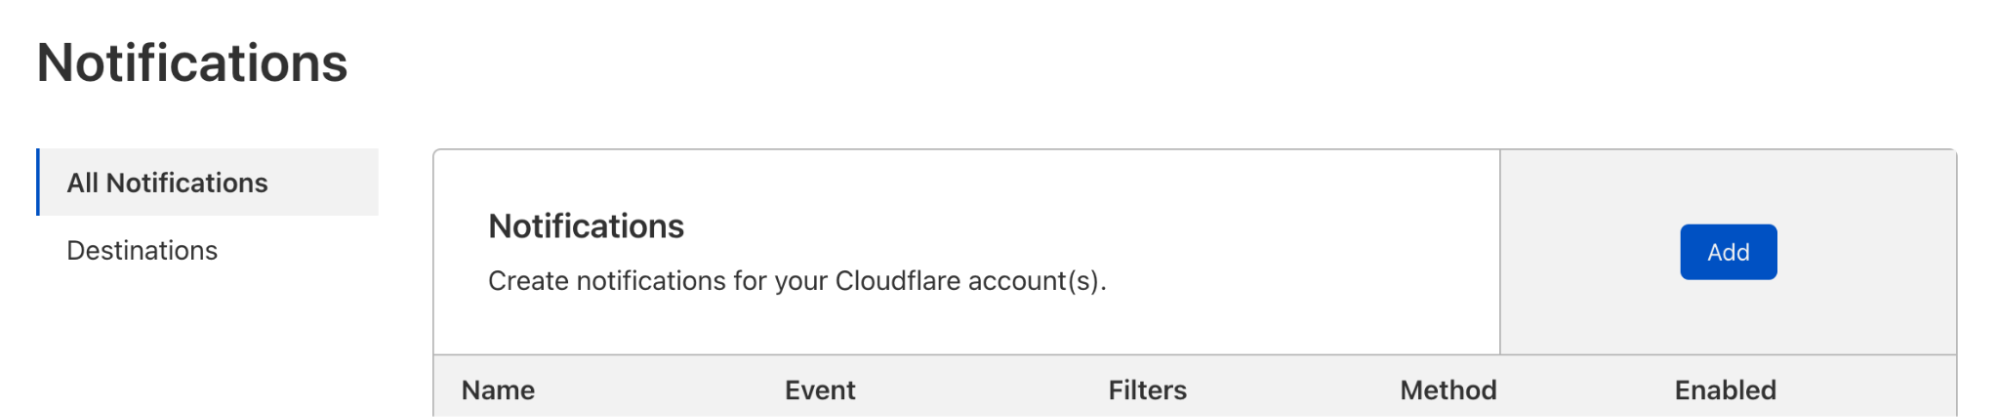
3. Select the alert “Failing Logpush Job Disabled”

4. Configure the alert and click Save.
That’s it — you will receive an email alert if your Logpush job is disabled.
Logpush Job Health API
We have also added the ability to query for stats related to the health of your Logpush jobs to our graphql API. Customers can now use our GraphQL API to query for things like the number of bytes pushed, number of compressed bytes pushed, number of records pushed, the status of each push, and much more. Using these stats, customers can have greater visibility into a core part of infrastructure. The GraphQL API is self documenting so full details about the new logpushHealthAdaptiveGroups node can be found using any GraphQL client, but head to GraphQL docs for more information.
Below are a couple example queries of how you can use the GraphQL to find stats related to your Logpush jobs.
Query for number of pushes to S3 that resulted in status code != 200
query
{
  viewer
  {
    zones(filter: { zoneTag: $zoneTag})
    {
      logpushHealthAdaptiveGroups(filter: {
        datetime_gt:"2022-08-15T00:00:00Z",
        destinationType:"s3",
        status_neq:200
      },
      limit:10)
      {
        count,
        dimensions {
          jobId,
          status,
          destinationType
        }
      }
    }
  }
}
Getting the number of bytes, compressed bytes and records that were pushed
query
{
  viewer
  {
    zones(filter: { zoneTag: $zoneTag})
    {
      logpushHealthAdaptiveGroups(filter: {
        datetime_gt:"2022-08-15T00:00:00Z",
        destinationType:"s3",
        status:200
      },
      limit:10)
      {
        sum {
          bytes,
          bytesCompressed,
          records
        }
      }
    }
  }
}
Summary
Logpush is a robust and flexible platform for customers who need to integrate their own logging and monitoring systems with Cloudflare. Different Logpush jobs can be deployed to support multiple destinations or, with filtering, multiple subsets of logs.
Customers who haven’t created Logpush jobs are encouraged to do so. Try pushing your logs to R2 for safe-keeping! For customers who don’t currently have access to this powerful tool, consider upgrading your plan.
Security updates for Thursday
Post Syndicated from original https://lwn.net/Articles/909051/
Security updates have been issued by Debian (e17, fish, mako, and tinygltf), Fedora (mingw-poppler), Mageia (firefox, google-gson, libxslt, open-vm-tools, redis, and sofia-sip), Oracle (dbus-broker, kernel, kernel-container, mysql, and nodejs and nodejs-nodemon), Slackware (bind), SUSE (cdi-apiserver-container, cdi-cloner-container, cdi-controller-container, cdi-importer-container, cdi-operator-container, cdi-uploadproxy-container, cdi-uploadserver-container, containerized-data-importer, go1.18, go1.19, kubevirt, virt-api-container, virt-controller-container, virt-handler-container, virt-launcher-container, virt-libguestfs-tools-container, virt-operator-container, libconfuse0, and oniguruma), and Ubuntu (bind9 and pcre2).
Cloudflare Zaraz supports Managed Components and DLP to make third-party tools private
Post Syndicated from Yo'av Moshe original https://blog.cloudflare.com/zaraz-uses-managed-components-and-dlp-to-make-tools-private/

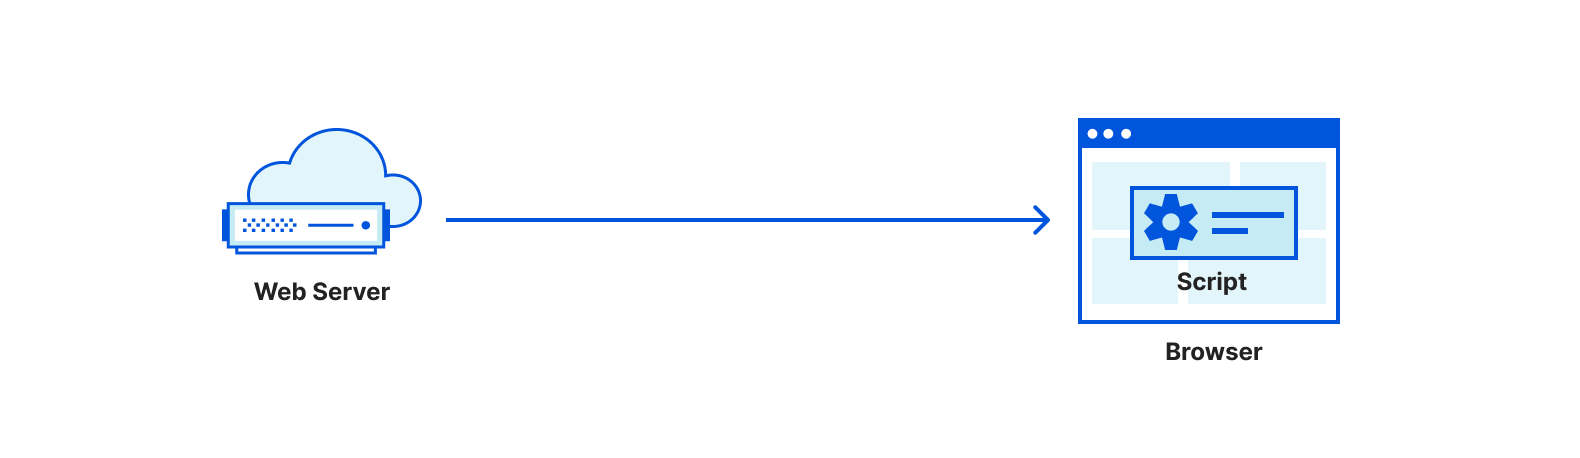
When it comes to privacy, much is in your control as a website owner. You decide what information to collect, how to transmit it, how to process it, and where to store it. If you care for the privacy of your users, you’re probably taking action to ensure that these steps are handled sensitively and carefully. If your website includes no third party tools at all – no analytics, no conversion pixels, no widgets, nothing at all – then it’s probably enough! But… If your website is one of the other 94% of the Internet, you have some third-party code running in it. Unfortunately, you probably can’t tell what exactly this code is doing.
Third-party tools are great. Your product team, marketing team, BI team – they’re all right when they say that these tools make a better website. Third-party tools can help you understand your users better, embed information such as maps, chat widgets, or measure and attribute conversions more accurately. The problem doesn’t lay with the tools themselves, but with the way they are implemented – third party scripts.
Third-party scripts are pieces of JavaScript that your website is loading, often from a remote web server. Those scripts are then parsed by the browser, and they can generally do everything that your website can do. They can change the page completely, they can write cookies, they can read form inputs, URLs, track visitors and more. It is mostly a restrictions-less system. They were built this way because it used to be the only way to create a third-party tool.
Over the years, companies have suffered a lot of third party scripts. Those scripts were sometimes hacked, and started hijacking information from visitors to websites that were using them. More often, third party scripts are simply collecting information that could be sensitive, exposing the website visitors in ways that the website owner never intended.
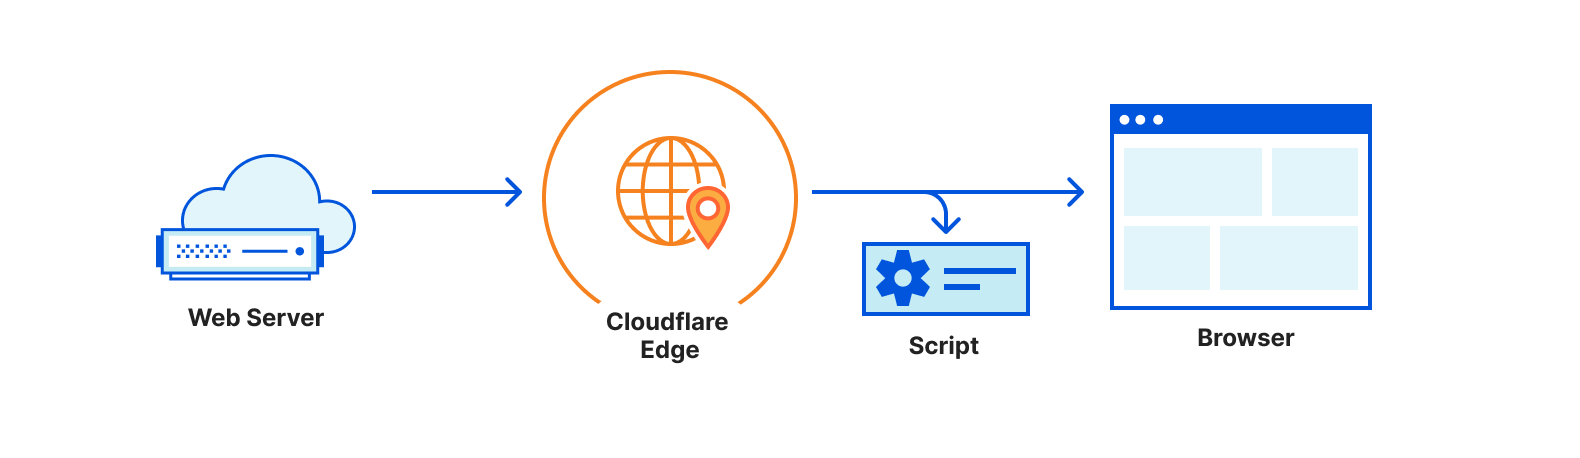
Recently we announced that we’re open sourcing Managed Components. Managed Components are a new API to load third-party tools in a secure and privacy-aware way. It changes the way third-party tools load, because by default there are no more third-party scripts in it at all. Instead, there are components, which are controlled with a Components Manager like Cloudflare Zaraz.
In this blogpost we will discuss how to use Cloudflare Zaraz for granting and revoking permissions from components, and for controlling what information flows into components. Even more exciting, we’re also announcing the upcoming DLP features of Cloudflare Zaraz, that can report, mask and remove PII from information shared with third-parties by mistake.
How are Managed Components better
Because Managed Components run isolated inside a Component Manager, they are more private by design. Unlike a script that gets unlimited access to everything on your website, a Managed Component is transparent about what kind of access it needs, and operates under a Component Manager that grants and revokes permissions.
When you add a Managed Component to your website, the Component Manager will list all the permissions required for this component. Such permissions could be “setting cookies”, “making client-side network requests”, “installing a widget” and more. Depending on the tool, you’ll be able to remove permissions that are optional, if your website maintains a more restrictive approach to privacy.
Aside from permissions, the Component Manager also lets you choose what information is exposed to each Managed Component. Perhaps you don’t want to send IP addresses to Facebook? Or rather not send user agent strings to Mixpanel? Managed Components put you in control by telling you exactly what information is consumed by each tool, and letting you filter, mask or hide it according to your needs.
Data Loss Prevention with Cloudflare Zaraz
Another area we’re working on is developing DLP features that let you decide what information to forward to different Managed Components not only by the field type, e.g. “user agent header” or “IP address”, but by the actual content. DLP filters can scan all information flowing into a Managed Component and detect names, email addresses, SSN and more – regardless of which field they might be hiding under.
Our DLP Filters will be highly flexible. You can decide to only enable them for users from specific geographies, for users on specific pages, for users with a certain cookie, and you can even mix-and-match different rules. After configuring your DLP filter, you can set what Managed Components you want it to apply for – letting you filter information differently according to the receiving target.
For each DLP filter you can choose your action type. For example, you might want to not send any information in which the system detected a SSN, but to only report a warning if a first name was detected. Masking will allow you to replace an email address like [email protected] with [email protected], making sure events containing email addresses are still sent, but without exposing the address itself.
While there are many DLP tools available in the market, we believe that the integration between Cloudflare Zaraz’s DLP features and Managed Components is the safest approach, because the DLP rules are effectively fencing the information not only before it is being sent, but before the component even accesses it.
Getting started with Managed Components and DLP
Cloudflare Zaraz is the most advanced Component Manager, and you can start using it today. We recently also announced an integrated Consent Management Platform. If your third-party tool of course is missing a Managed Component, you can always write a Managed Component of your own, as the technology is completely open sourced.
While we’re working on bringing advanced permissions handling, data masking and DLP Filters to all users, you can sign up for the closed beta, and we’ll contact you shortly.
API Endpoint Management and Metrics are now GA
Post Syndicated from Jin-Hee Lee original https://blog.cloudflare.com/api-management-metrics/

The Internet is an endless flow of conversations between computers. These conversations, the constant exchange of information from one computer to another, are what allow us to interact with the Internet as we know it. Application Programming Interfaces (APIs) are the vital channels that carry these conversations, and their usage is quickly growing: in fact, more than half of the traffic handled by Cloudflare is for APIs, and this is increasing twice as fast as traditional web traffic.
In March, we announced that we’re expanding our API Shield into a full API Gateway to make it easy for our customers to protect and manage those conversations. We already offer several features that allow you to secure your endpoints, but there’s more to endpoints than their security. It can be difficult to keep track of many endpoints over time and understand how they’re performing. Customers deserve to see what’s going on with their API-driven domains and have the ability to manage their endpoints.
Today, we’re excited to announce that the ability to save, update, and monitor the performance of all your API endpoints is now generally available to API Shield customers. This includes key performance metrics like latency, error rate, and response size that give you insights into the overall health of your API endpoints.
A Refresher on APIs
The bar for what we expect an application to do for us has risen tremendously over the past few years. When we open a browser, app, or IoT device, we expect to be able to connect to data instantly, compare dozens of flights within seconds, choose a menu item from a food delivery app, or see the weather for ten locations at once.
How are applications able to provide this kind of dynamic engagement for their users? They rely on APIs, which provide access to data and services—either from the application developer or from another company. APIs are fundamental in how computers (or services) talk to each other and exchange information.
You can think of an API as a waiter: say a customer orders a delicious bowl of Mac n Cheese. The waiter accepts this order from the customer, communicates the request to the chef in a format the chef can understand, and then delivers the Mac n Cheese back to the customer (assuming the chef has the ingredients in stock). The waiter is the crucial channel of communication, which is exactly what the API does.
Managing API Endpoints
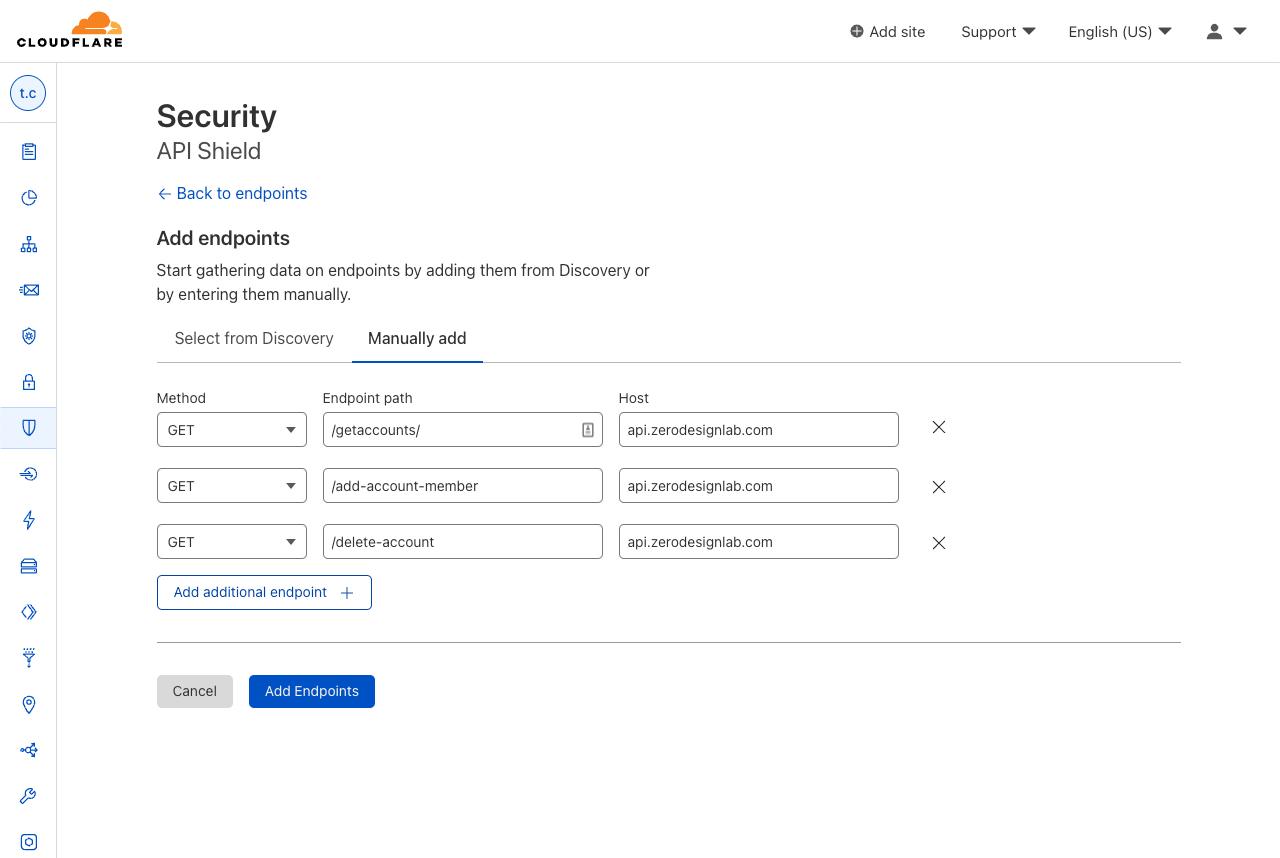
The first step in managing APIs is to get a complete list of all the endpoints exposed to the internet. API Discovery automatically does this for any traffic flowing through Cloudflare. Undiscovered APIs can’t be monitored by security teams (since they don’t know about them) and they’re thus less likely to have proper security policies and best practices applied. However, customers have told us they also want the ability to manually add and manage APIs that are not yet deployed, or they want to ignore certain endpoints (for example those in the process of deprecation). Now, API Shield customers can choose to save endpoints found by Discovery or manually add endpoints to API Shield.
But security vulnerabilities aren’t the only risk or area of concern with APIs – they can be painfully slow or connections can be unsuccessful. We heard questions from our customers such as: what are my most popular endpoints? Is this endpoint significantly slower than it was yesterday? Are any endpoints returning errors that may indicate a problem with the application?
That’s why we built Performance Metrics into API Shield, which allows our customers to quickly answer these questions themselves with real-time data.
Prioritizing Performance

Once you’ve discovered, saved, or removed endpoints, you want to know what’s going well and what’s not. To end-users, a huge part of what defines the experience as “going well” is good performance. Poor performance can lead to a frustrating experience: when you’re shopping online and press a button to check out, you don’t want to wait around for minutes for the page to load. And you certainly never want to see a dreaded error symbol telling you that you can’t get what you came for.
Exposing performance metrics of API endpoints puts concrete numerical data into your developers’ hands to tell you how things are going. When things are going poorly, these dashboard metrics will point out exactly which aspect of performance is causing concern: maybe you expected to see a spike in requests, but find out that request count is normal and latency is just higher than usual.
Empowering our customers to make data-driven decisions to better manage their APIs ends up being a win for our customers and our customers’ customers, who expect to seamlessly engage with the domain’s APIs and get exactly what they came for.
Management and Performance Metrics in the Dashboard
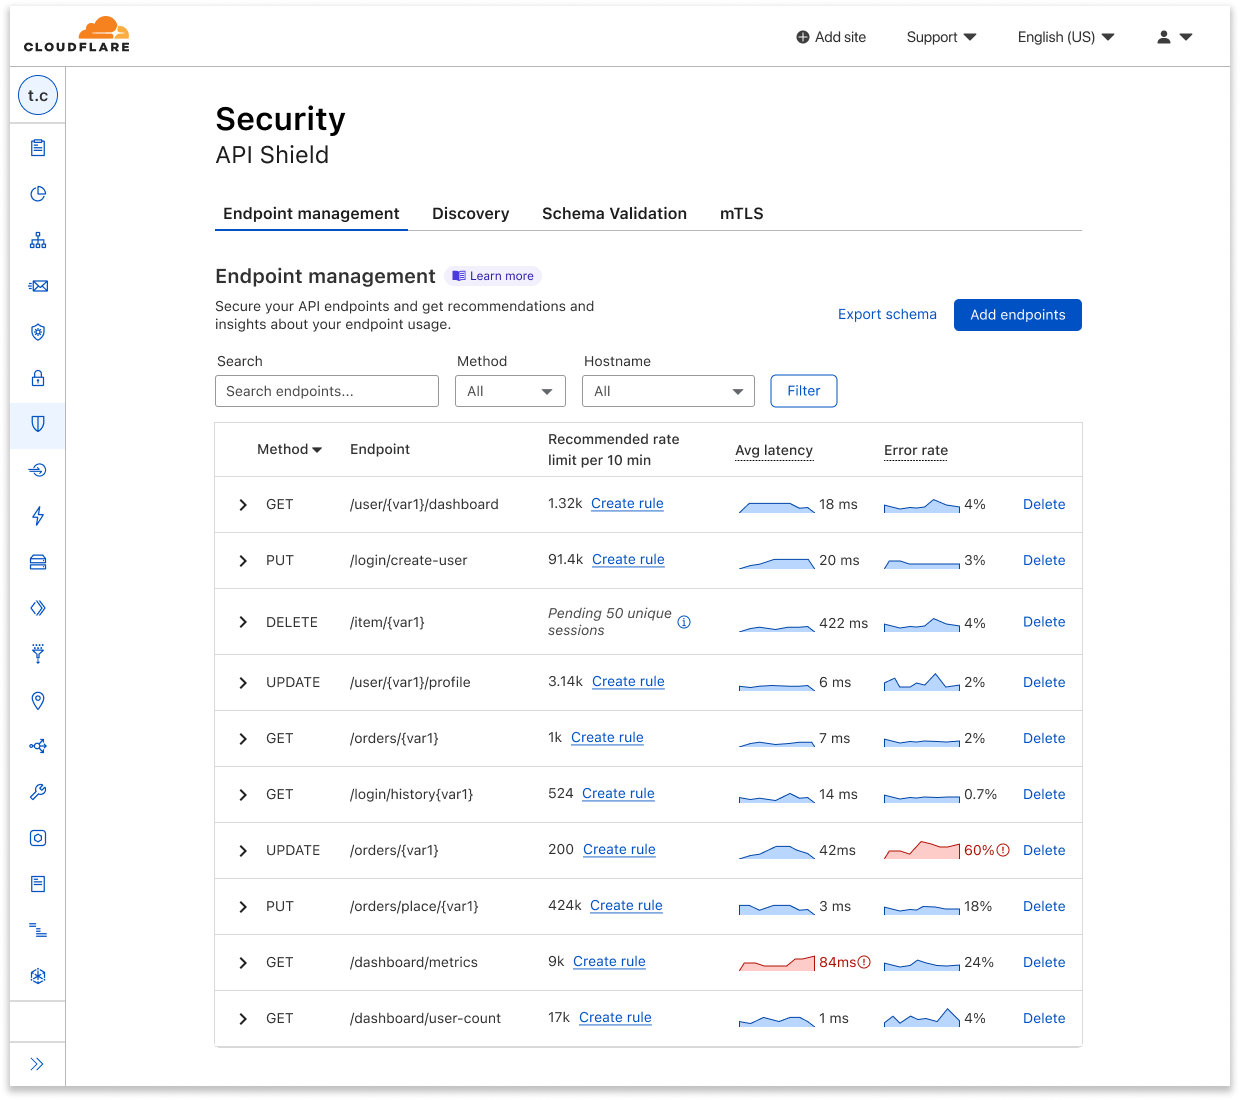
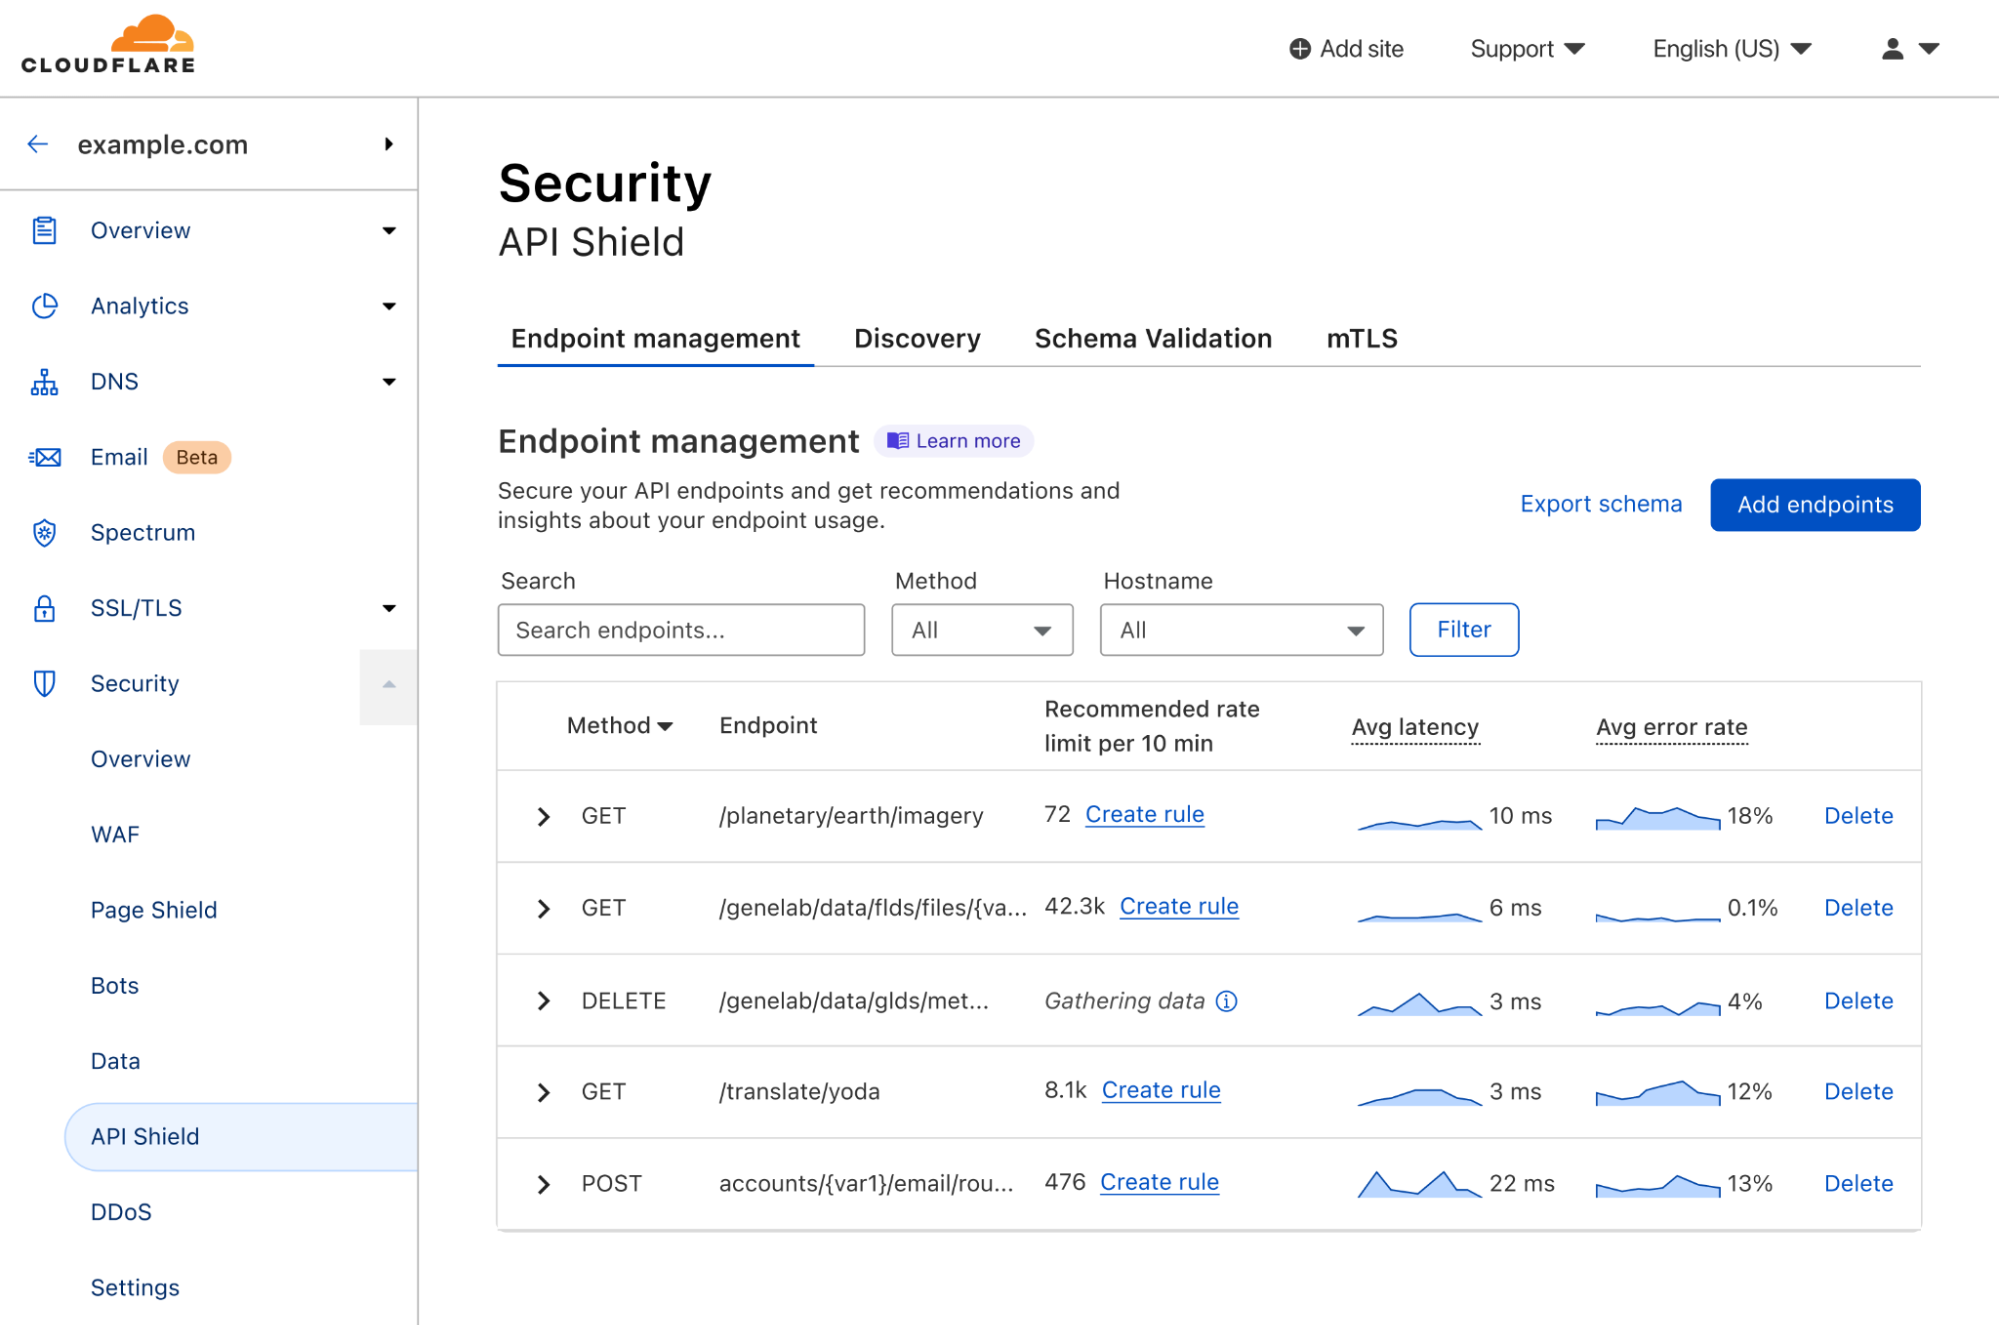
So, what’s available today? Log onto your Cloudflare dashboard, go to the domain-level Security tab, and open up the API Shield page. Here, you’ll see the Endpoint Management tab, which shows you all the API endpoints that you’ve saved, alongside placeholders for metrics that will soon be gathered.
Here you can easily delete endpoints you no longer want to track, or click manually add additional endpoints. You can also export schemas for each host to share internally or externally.
Once you’ve saved the endpoints that you want to keep tabs on, Cloudflare will start collecting data on its performance and make it available to you as soon as possible.
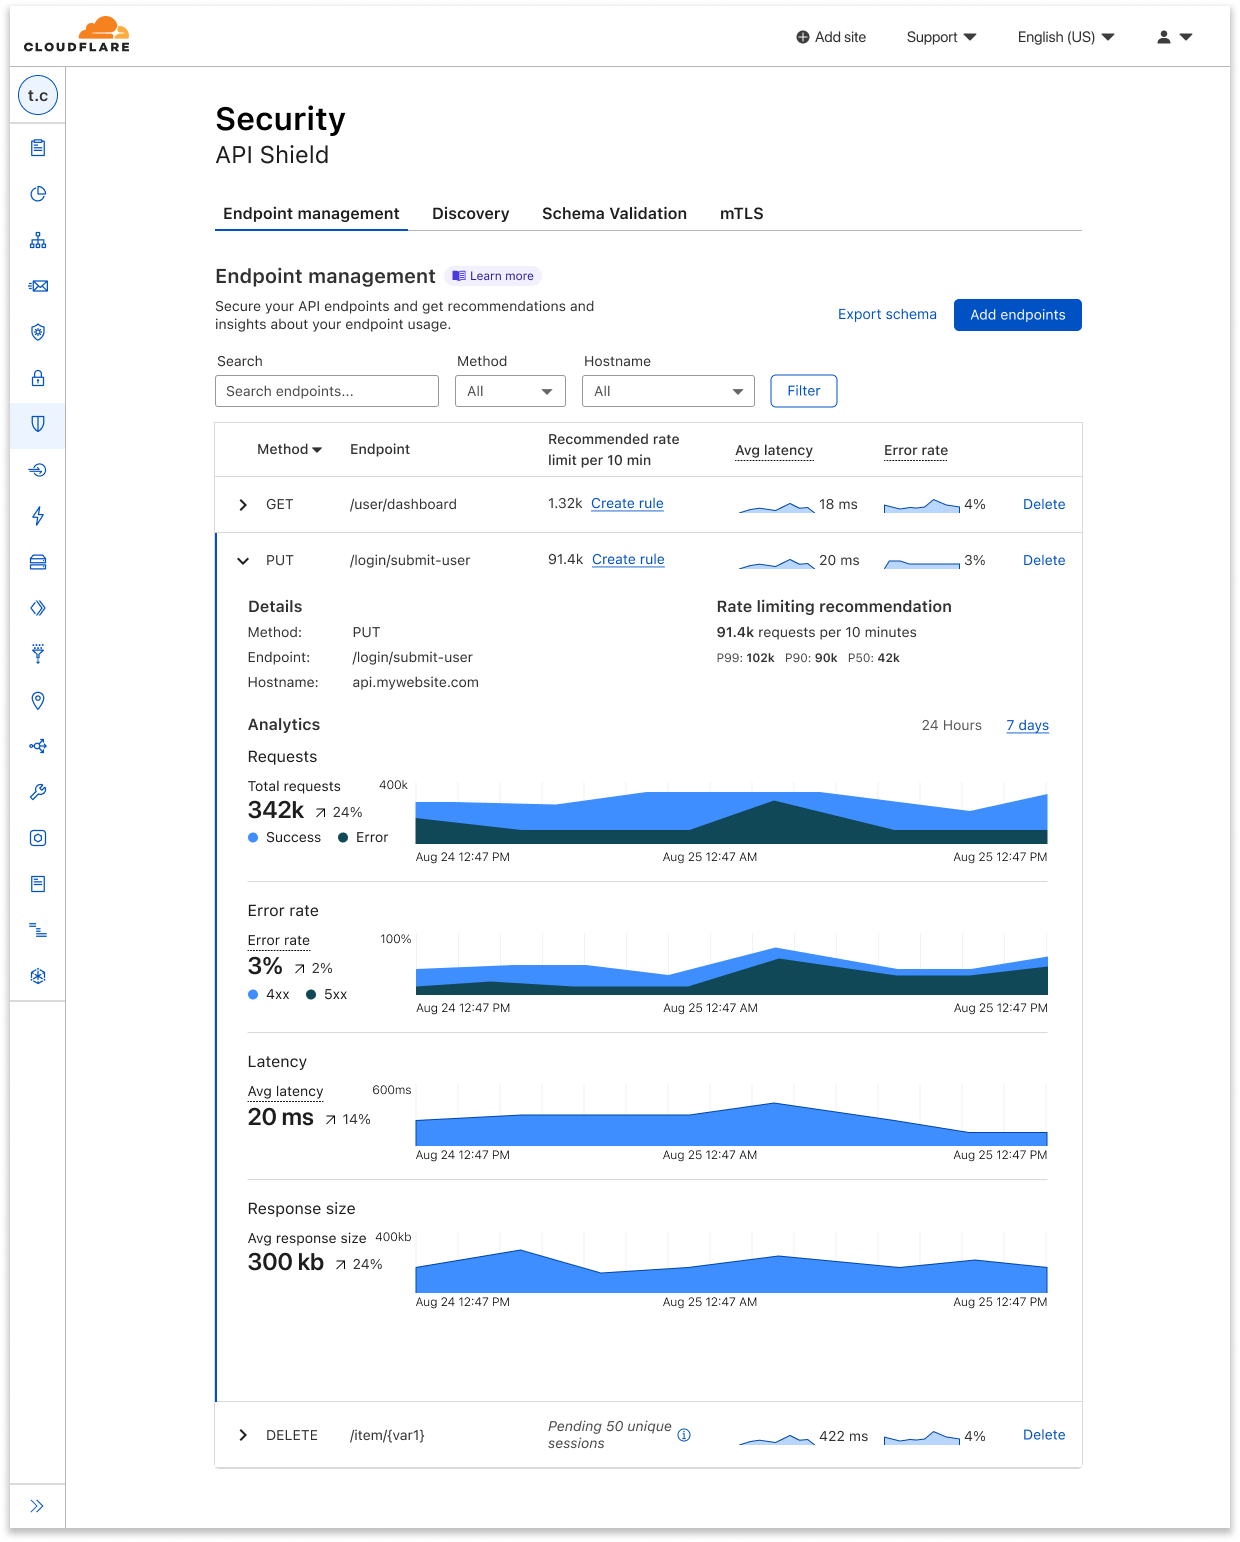
In Endpoint Management, you can see a few summary metrics in the collapsed view of each endpoint, including recommended rate limits, average latency, and error rate. It can be difficult to tell whether things are going well or not just from seeing a value alone, so we added sparklines that show relative performance, comparing an endpoint’s current metrics with its usual or previous data.
If you want to view further details about a given endpoint, you can expand it for additional metrics such as response size and errors separated by 4xx and 5xx. The expanded view also allows you to view all metrics at a single timestamp by hovering over the charts.
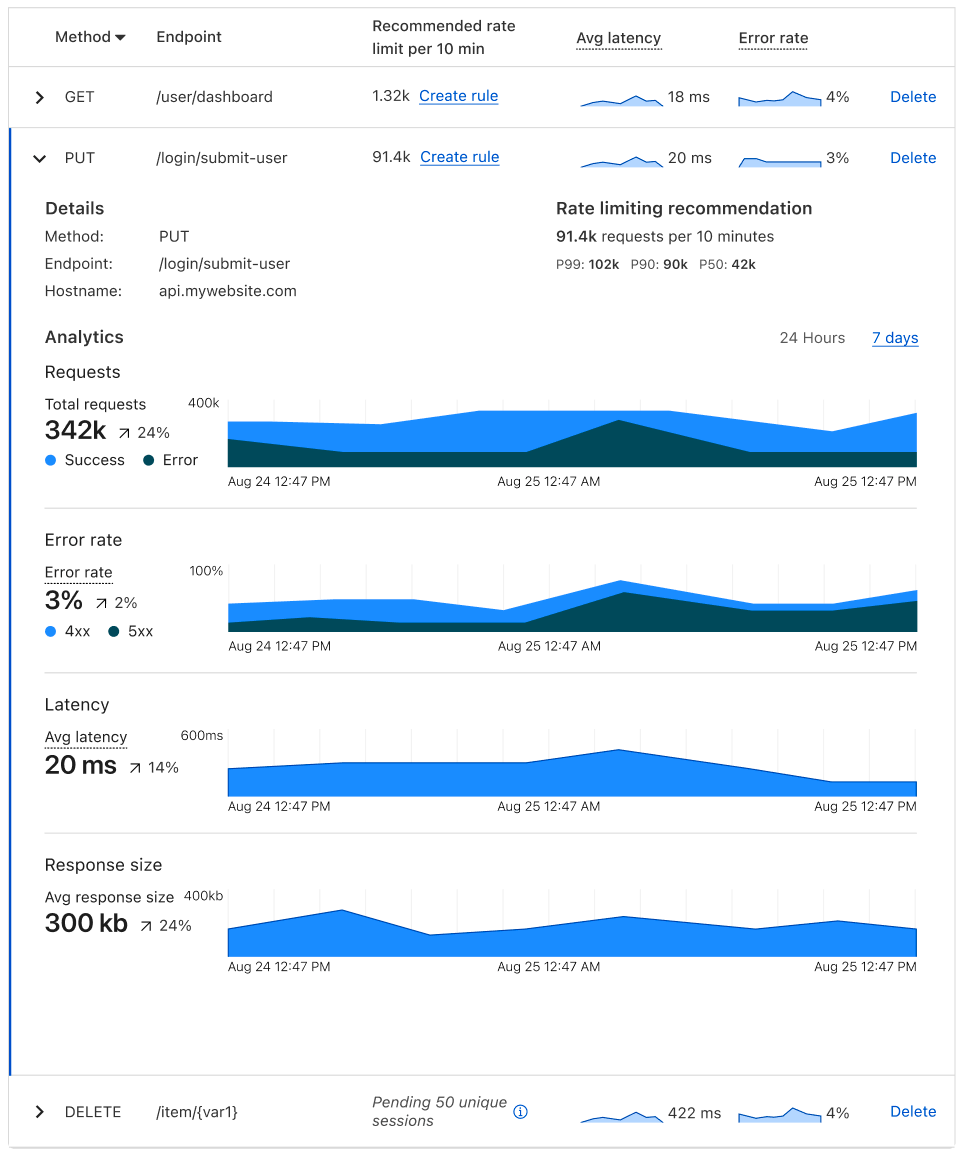
For each saved endpoint, customers can see the following metrics:
- Request count: total number of requests to the endpoint over time.
- Rate limiting recommendation per 10 minutes, which is guided by the request count.
- Latency: average origin response time, in milliseconds (ms). How long does it take from the moment a visitor makes a request to the moment the visitor gets a response back from the origin?
- Error rate vs. overall traffic: grouped by 4xx, 5xx, and their sum.
- Response size: average size of the response (in bytes) returned to the request.
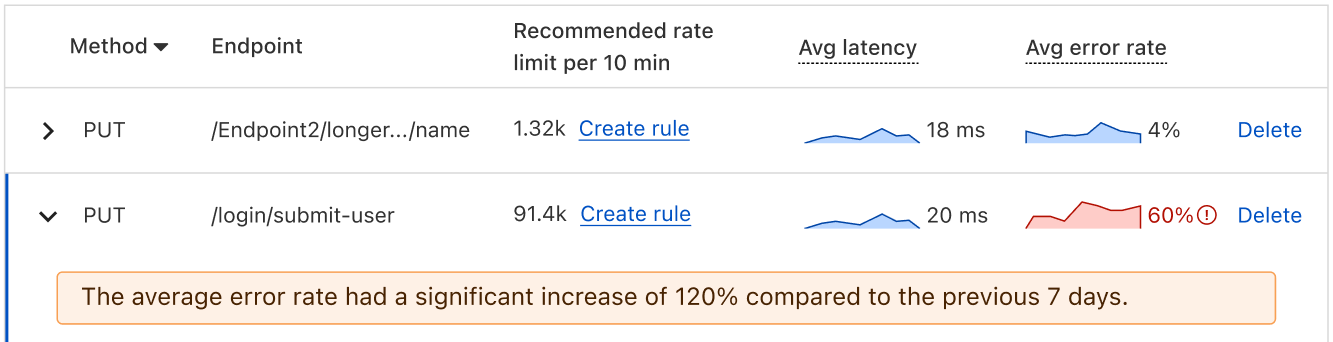
You can toggle between viewing these metrics on a 24-hour period or a 7-day period, depending on the scale on which you’d like to view your data. And in the expanded view, we provide a percentage difference between the averages of the current vs. the previous period. For example, say I’m viewing my metrics on a 24-hour timeline. My average latency yesterday was 10 ms, and my average latency today is 30 ms, so the dashboard shows a 200% increase. We also use anomaly detection to bring attention to endpoints that have concerning performance changes.
Additional improvements to Discovery and Schema Validation
As part of making endpoint management GA, we’re also adding two additional enhancements to API Shield.
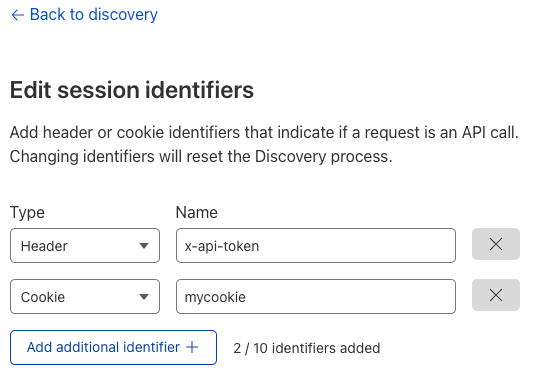
First, API Discovery now accepts cookies — in addition to authorization headers — to discover endpoints and suggest rate limiting thresholds. Previously, you could only identify an API session with HTTP headers, which didn’t allow customers to protect endpoints that use cookies as session identifiers. Now these endpoints can be protected as well. Simply go to the API Shield tab in the dashboard, choose edit session identifiers, and either change the type, or click Add additional identifier.
Second, we added the ability to validate the body of requests via Schema Validation for all customers. Schema Validation allows you to provide an OpenAPI schema (a template for your API traffic) and have Cloudflare block non-conformant requests as they arrive at our edge. Previously, you provided specific headers, cookies, and other features to validate. Now that we can validate the body of requests, you can use Schema Validation to confirm every element of a request matches what is expected. If a request contains strange information in the payload, we’ll notice. Note: customers who have already uploaded schemas will need to re-upload to take advantage of body validation.
Take a look at our developer documentation for more details on both of these features.
Get started
Endpoint Management, performance metrics, schema exporting, discovery via cookies, and schema body validation are all available now for all API Shield customers. To use them, log into the Cloudflare dashboard, click on Security in the navigation bar, and choose API Shield. Once API Shield is enabled, you’ll be able to start discovering endpoints immediately. You can also use all features through our API.
If you aren’t yet protecting a website with Cloudflare, it only takes a few minutes to sign up.
Astro Pi Mission Zero 2022/23 is open for young people
Post Syndicated from Sam Duffy original https://www.raspberrypi.org/blog/astro-pi-mission-zero-2022-23-is-open/
Inspire young people about coding and space science with Astro Pi Mission Zero. Mission Zero offers young people the chance to write code that will run in space! It opens for participants today.

What is Mission Zero?
In Mission Zero, young people write a simple computer program to run on an Astro Pi computer on board the International Space Station (ISS).
Following step-by-step instructions, they write code to take a reading from an Astro Pi sensor and display a colourful image for the ISS astronauts to see as they go about their daily tasks. This is a great, one-hour activity for beginners to programming.

Participation is free and open for young people up to age 19 in ESA Member States (eligibility details). Everything can be done in a web browser, on any computer with internet access. No special hardware or prior coding skills are needed.
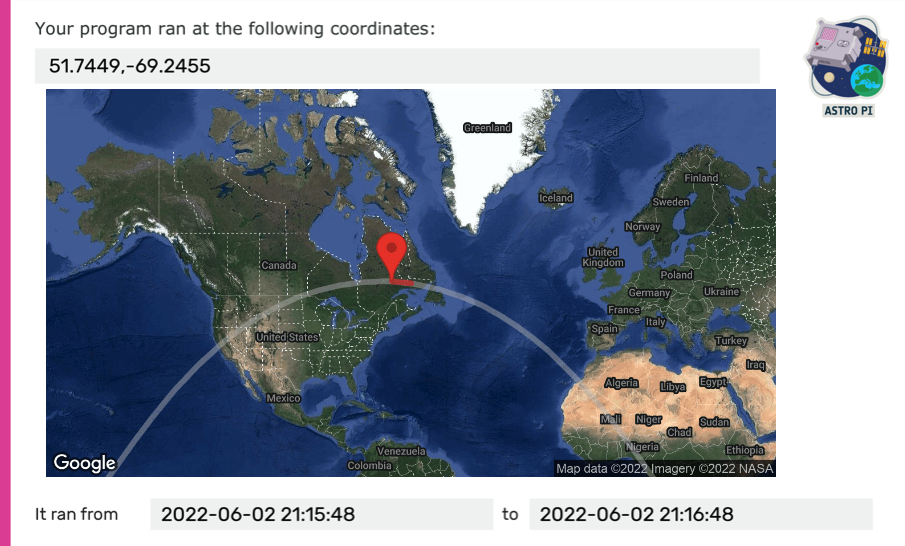
Participants will receive a piece of space science history to keep: a personalised certificate they can download, which shows their Mission Zero program’s exact start and end time, and the position of the ISS when their program ran.

All young people’s entries that meet the eligibility criteria and follow the official Mission Zero guidelines will have their program run in space for up to 30 seconds.
Mission Zero 2022/23 is open until 17 March 2023.
New this year for Mission Zero participants
If you’ve been involved in Mission Zero before, you will notice lots of things have changed. This year’s Mission Zero participants will be the first to use our brand-new online code editor, a tool that makes it super easy to write their program using the Python language.
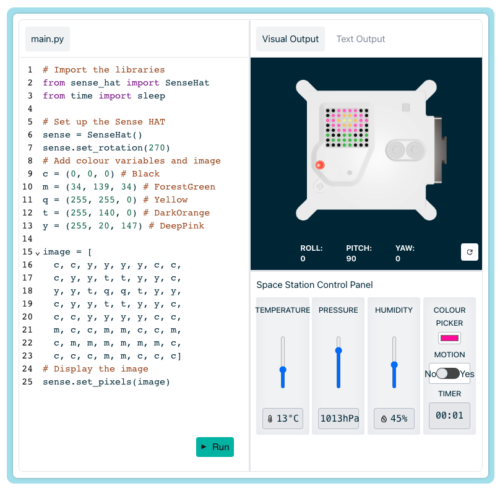
Thanks to the new Astro Pi computers that we sent to the ISS in 2021, there’s a brand-new colour and luminosity sensor, which has never been available to Mission Zero programmers before:
Finally, this year we’re challenging coders to create a colourful image to show on the Astro Pi’s LED display, and to use the data from the colour sensor to determine the image’s background colour.
The theme to inspire images for Mission Zero 2022/23 is ‘flora and fauna’. The images participants design can represent any aspect of this theme, such as flowers, trees, animals, or insects. Young people could even choose to program a series of images to show a short animation during the 30 seconds their program will run.


Here are some examples of images created by last year’s Mission Zero participants. What will you create?
Sign up for Astro Pi news
The European Astro Pi Challenge is an ESA Education project run in collaboration with us here at the Raspberry Pi Foundation. Young people can also take part in Astro Pi Mission Space Lab, where they will work to design a real scientific experiment to run on the Astro Pi computers.
You can keep updated with all of the latest Astro Pi news by following the Astro Pi Twitter account or signing up to the newsletter at astro-pi.org.
The post Astro Pi Mission Zero 2022/23 is open for young people appeared first on Raspberry Pi.
Handy Tips #38: Automating SNMP item creation with low-level discovery
Post Syndicated from Arturs Lontons original https://blog.zabbix.com/handy-tips-38-automating-snmp-item-creation-with-low-level-discovery/23521/
The post Handy Tips #38: Automating SNMP item creation with low-level discovery appeared first on Zabbix Blog.
Protests spur Internet disruptions in Iran
Post Syndicated from David Belson original https://blog.cloudflare.com/protests-internet-disruption-ir/


Over the past several days, protests and demonstrations have erupted across Iran in response to the death of Mahsa Amini. Amini was a 22-year-old woman from the Kurdistan Province of Iran, and was arrested on September 13, 2022, in Tehran by Iran’s “morality police”, a unit that enforces strict dress codes for women. She died on September 16 while in police custody.
Published reports indicate that the growing protests have resulted in at least eight deaths. Iran has a history of restricting Internet connectivity in response to protests, taking such steps in May 2022, February 2021, and November 2019. They have taken a similar approach to the current protests, including disrupting Internet connectivity, blocking social media platforms, and blocking DNS. The impact of these actions, as seen through Cloudflare’s data, are reviewed below.
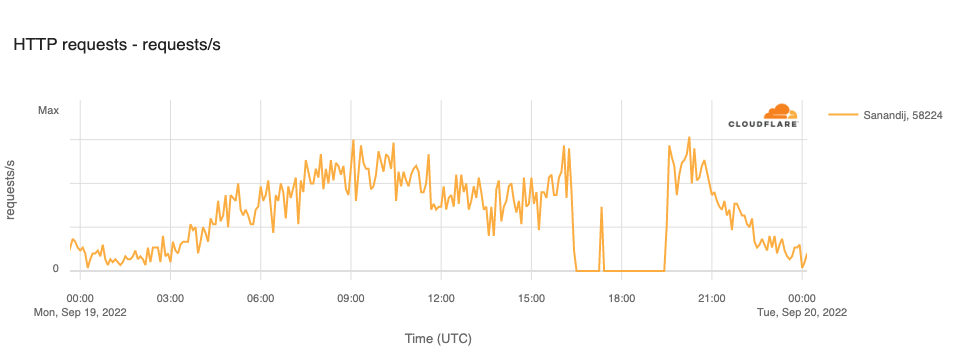
Impact to Internet traffic
In the city of Sanandij in the Kurdistan Province, several days of anti-government protests took place after the death of Mahsa Amini. In response, the government reportedly disrupted Internet connectivity there on September 19. This disruption is clearly visible in the graph below, with traffic on TCI (AS58224), Iran’s fixed-line incumbent operator, in Sanandij dropping to zero between 1630 and 1925 UTC, except for a brief spike evident between 1715 and 1725 UTC.
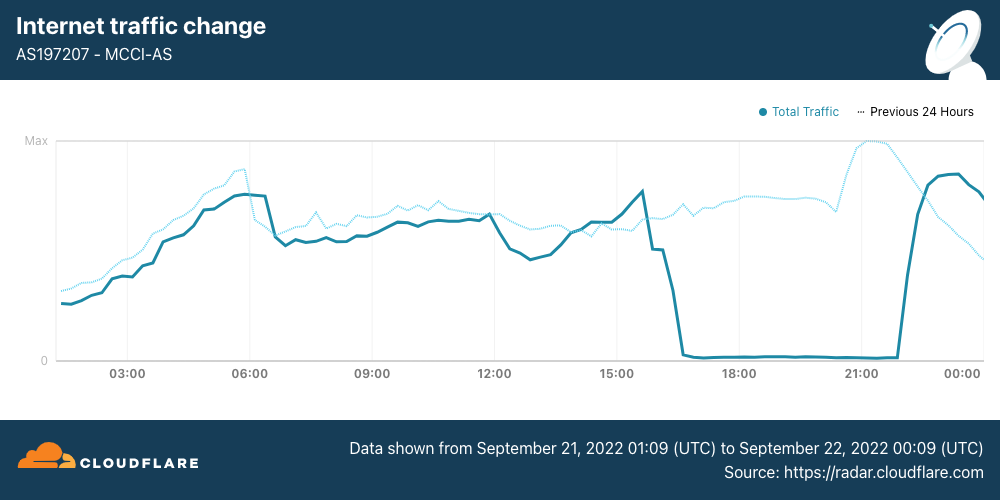
On September 21, Internet disruptions started to become more widespread, with mobile networks effectively shut down nationwide. (Iran is a heavily mobile-centric country, with Cloudflare Radar reporting that 85% of requests are made from mobile devices.) Internet traffic from Iran Mobile Communications Company (AS197207) started to decline around 1530 UTC, and remained near zero until it started to recover at 2200 UTC, returning to “normal” levels by the end of the day.
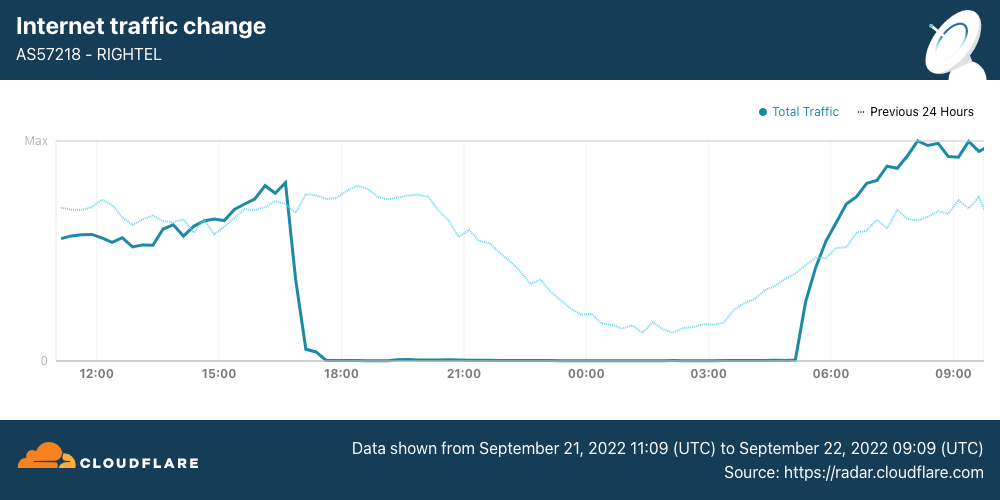
Internet traffic from RighTel (AS57218) began to decline around 1630 UTC. After an outage lasting more than 12 hours, traffic returned at 0510 UTC.
Internet traffic from MTN Irancell (AS44244) began to drop just before 1700 UTC. After a 12-hour outage, traffic began recovering at 0450 UTC.
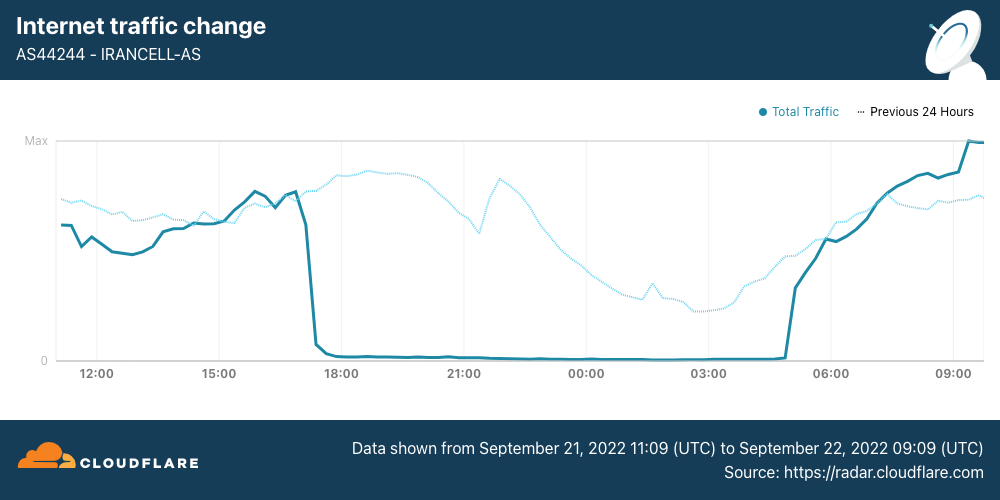
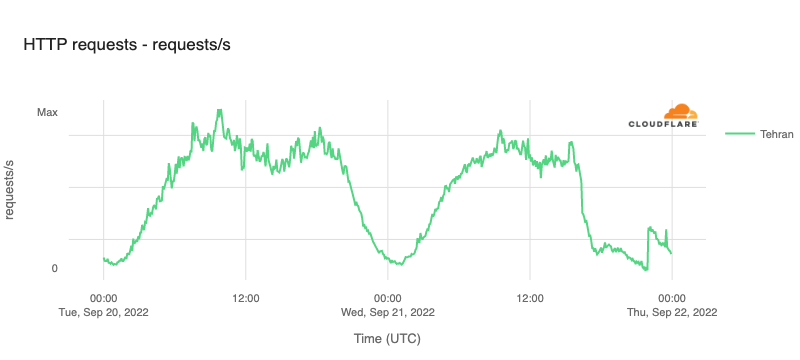
The impact of these disruptions is also visible when looking at traffic at both a regional and national level. In Tehran Province, HTTP request volume declined by approximately 70% around 1600 UTC, and continued to drop for the next several hours before seeing a slight recovery at 2200 UTC, likely related to the recovery also seen at that time on AS197207.
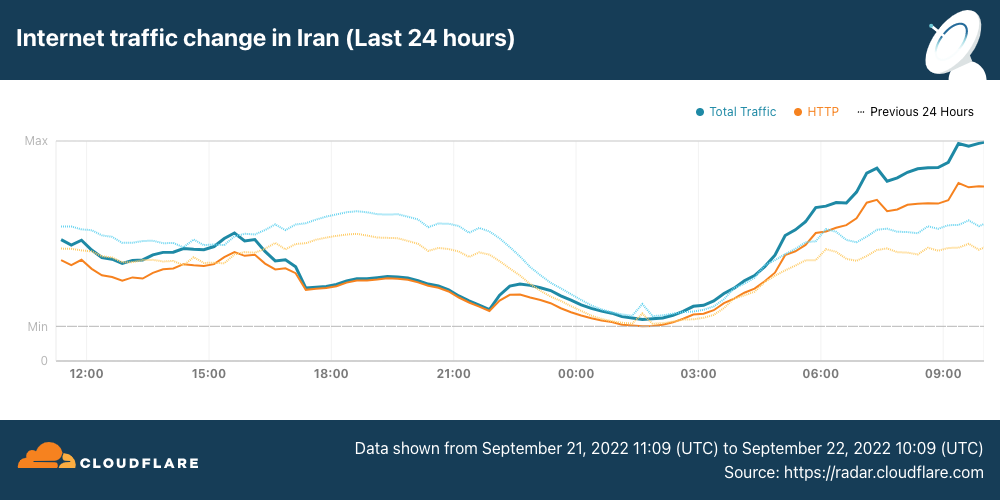
Similarly, Internet traffic volumes across the whole country began to decline just after 1600 UTC, falling approximately 40%. Nominal recovery at 2200 UTC is visible in this view as well, again likely from the increase in traffic from AS197207. More aggressive traffic growth is visible starting around 0500 UTC, after the remaining two mobile network providers came back online.
DNS blocking
In addition to shutting down mobile Internet providers within the country, Iran’s government also reportedly blocked access to social media platform Instagram, as well as blocking access to DNS-over-HTTPS from open DNS resolver services including Quad9, Google’s 8.8.8.8, and Cloudflare’s 1.1.1.1. Analysis of requests originating in Iran to 1.1.1.1 illustrates the impacts of these blocking attempts.
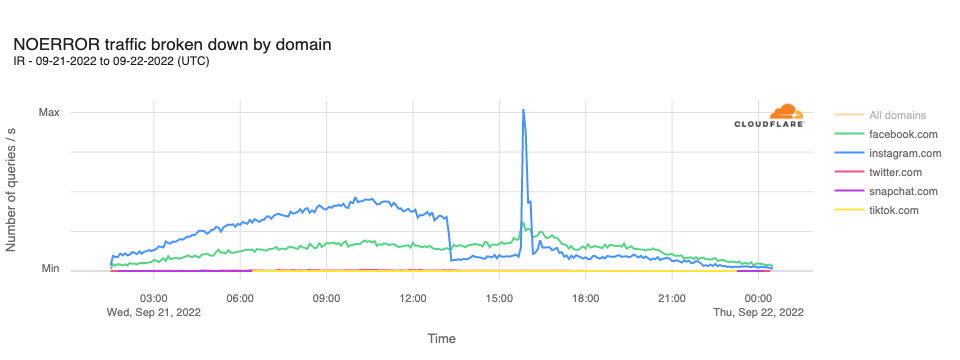
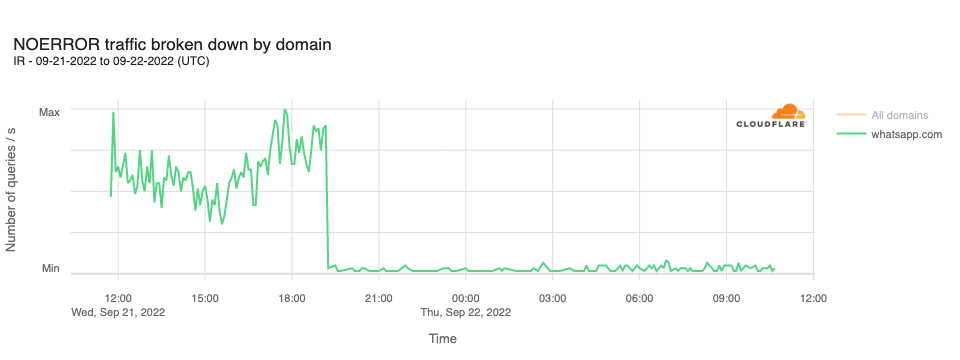
In analyzing DNS requests to Cloudflare’s resolver for domains associated with leading social media platforms, we observe that requests for instagram.com hostnames drop sharply at 1310 UTC, remaining lower for the rest of the day, except for a significant unexplained spike in requests between 1540 and 1610 UTC. Request volumes for hostnames associated with other leading social media platforms did not appear to be similarly affected.
In addition, it was reported that access to WhatsApp had also been blocked in Iran. This can be seen in resolution requests to Cloudflare’s resolver for whatsapp.com hostnames. The graph below shows a sharp decline in query traffic at 1910 UTC, dropping to near zero.
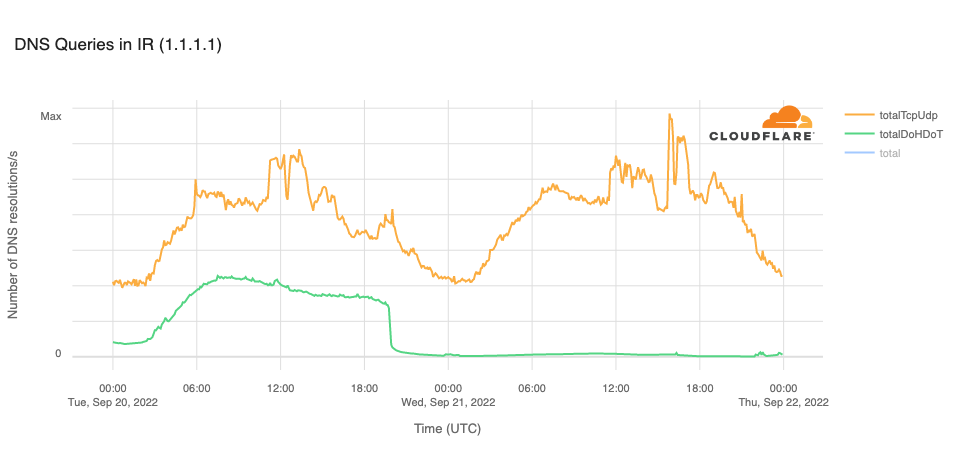
The Open Observatory for Network Interference (OONI), an organization that measures Internet censorship, reported in a Tweet that the cloudflare-dns.com domain name, used for DNS-over-HTTPS (DoH) and DNS-over-TLS (DoT) connections to Cloudflare’s DNS resolver, was blocked in Iran on September 20. This is clearly evident in the graph below, with resolution volume over DoH and DoT dropping to zero at 1940 UTC. The OONI tweet also noted that the 1.1.1.1 IP address “remains blocked on most networks.” The trend line for resolution over TCP or UDP (on port 53) in the graph below suggests that the IP address is not universally blocked, as there are still resolution requests reaching Cloudflare.
Interested parties can use Cloudflare Radar to monitor the impact of such government-directed Internet disruptions, and can follow @CloudflareRadar on Twitter for updates on Internet disruptions as they occur.
Prompt Injection/Extraction Attacks against AI Systems
Post Syndicated from Bruce Schneier original https://www.schneier.com/blog/archives/2022/09/prompt-injection-extraction-attacks-against-ai-systems.html
This is an interesting attack I had not previously considered.
The variants are interesting, and I think we’re just starting to understand their implications.
10 бюрократични пречки, чието премахване започнахме
Post Syndicated from Bozho original https://blog.bozho.net/blog/3947
В рамките на предходна кампания публикувах списък с бюрократични пречки, за чието отпадане ще работя. Ето ревизирана версия, с прогреса, който постигнахме за седем месеца:
1. Удостоверенията – голяма част от обикалянето по гишета е събирането на удостоверения и бележки за данни, които администрацията има за вас. Тя е длъжна да ги събира по електронен път, служебно, но се оправдава, че не го прави, защото „нашият закон е специален“ и „нямаме техническа възможност“. Подготвихме и приехме на Министерски съвет изменения в Закона за електронното управление, което приравнява служебните справки на предоставено удостоверение, като по този начин елиминираме оправданието с „нашия специален закон“. На първия ден на Народното събрание този закон ще бъде внесен.
2. Печатите – Имахме готов законопроект, който дадох на работна група, която създадох. Стигнахме до извода, че за да е трайна и системна реформата, трябва изцяло нов закон, който да урежда работата с документи и печати, като по този закон вече се работи. Никой няма да има право да ви върне, защото на нещо някъде липсва печат.
3. „Тук не е информация“ – отношението към гражданите, че те трябва сами да си знаят всички бюрократични процедури, трябва да спре. Закон забраняващ „тук не е информация“ е комично да има, но може да има ясни правила за „дизайн на услугите“ както в дигиталната, така и във физическата среда, които да правят омразния надпис „Тук не е информация“ излишен. В края на мандата изготвихме проект на изменение на наредба, с която се въвежда забрана за надписи с отрицание, вкл. „Тук не е информация“. В следващ кабинет ще има време да мине обществено обсъждане и да бъде приета.
4. „Това не може по електронен път, елате на място“ – по закон всичко трябва да може да се прави по електронен път. Докато бях министър, получих редица сигнали за такива откази и ги разпределих на отговорните за контрола, които да съставят актове на нарушаващите администрации.
5. Разпечатването на платежни – дори електронизирани към момента услуги изисква прикачване на платежно (макар нормативната уредба, създавана с мое участие преди години, да го забранява). В рамките на мандата присъединихме много нови институции към системата за електронни плащания, което да елиминира тези проблеми, а заедно с МФ инструктирахме администрациите да позволят плащане и с чуждестранни карти и иновативни платежни услуги, така че онлайн плащанията да се все по-достъпни.
6. Сканираните PDF-и – всички документи се създават в електронен вид. След това, заради аналоговото мислене в администрацията, се разпечатват, подписват, подпечатват и сканират. Това ги прави (почти) невъзможни за търсене и индексиране. Отпадането на печатите ще реши и този проблем. В МЕУ сканирани документи нямаше.
7. Трудовата книжка – по-предното редовно правителство предложи смяна на дизайна на трудовата книжка. Крайно време е този документ да отпадне. Създадох работна група, която предостави пълен анализ на данните от трудовата книжка и нормативните актове, в които те са уредени и предложения за пълна електронизация.
8. Медицинския картон – единният (електронен) здравен запис, до който има всеки лекар при нужда, трябва да замени парцалите, които разнасяме по лекари (или които сме загубили много отдавна). МЗ, в сътрудничество с МЕУ и Информационно обслужване, въведе изцяло електронна рецепта, която е важна стъпка към пълнотата на здравния запис, а аз изисках от НЗОК да спазят закона, като предоставят данните си на Министерсетво на здравеопазването.
9. Подписване с електронен подпис – Java вече (почти) не е проблем, но електронните подписи са неудобни. Затова стартирахме приоритетно проекта за електронна идентификация, който ще е готов в началото на следващата година, и чрез който ще могат да се заявяват услуги без електронен подпис (след като минат и измененията в Закона за електронното управление, които подготвихме)
10. Хартиените ваучери за храна – тези ваучери са полезни, но администрирането им е ужасно бюрократично – по-големите вериги строят отделни складове за хартиените ваучери, напр. Подготвихме електронизирането им с наредба, като нужните изменения в Закона за корпоративното подоходно облагане ще ги внесем в първия ден народното събрание.
Бюрокрацията пречи на гражданите, на бизнеса и на администрацията. Нейното отпадане е трудно, защото „винаги така сме го правили“, но задължително. Ще продължим започнатото по всички тези теми.
#25

Материалът 10 бюрократични пречки, чието премахване започнахме е публикуван за пръв път на БЛОГодаря.
[$] LWN.net Weekly Edition for September 22, 2022
Post Syndicated from original https://lwn.net/Articles/908080/
The LWN.net Weekly Edition for September 22, 2022 is available.
Regional Services comes to India, Japan and Australia
Post Syndicated from Achiel van der Mandele original https://blog.cloudflare.com/regional-services-comes-to-apac/

This post is also available in Deutsch, Français.

We announced the Data Localization Suite in 2020, when requirements for data localization were already important in the European Union. Since then, we’ve witnessed a growing trend toward localization globally. We are thrilled to expand our coverage to these countries in Asia Pacific, allowing more customers to use Cloudflare by giving them precise control over which parts of the Cloudflare network are able to perform advanced functions like WAF or Bot Management that require inspecting traffic.
Regional Services, a recap
In 2020, we introduced (Regional Services), a new way for customers to use Cloudflare. With Regional Services, customers can limit which data centers actually decrypt and inspect traffic. This helps because certain customers are affected by regulations on where they are allowed to service traffic. Others have agreements with their customers as part of contracts specifying exactly where traffic is allowed to be decrypted and inspected.
As one German bank told us: “We can look at the rules and regulations and debate them all we want. As long as you promise me that no machine outside the European Union will see a decrypted bank account number belonging to one of my customers, we’re happy to use Cloudflare in any capacity”.
Under normal operation, Cloudflare uses its entire network to perform all functions. This is what most customers want: leverage all of Cloudflare’s data centers so that you always service traffic to eyeballs as quickly as possible. Increasingly, we are seeing customers that wish to strictly limit which data centers service their traffic. With Regional Services, customers can use Cloudflare’s network but limit which data centers perform the actual decryption. Products that require decryption, such as WAF, Bot Management and Workers will only be applied within those data centers.
How does Regional Services work?
You might be asking yourself: how does that even work? Doesn’t Cloudflare operate an anycast network? Cloudflare was built from the bottom up to leverage anycast, a routing protocol. All of Cloudflare’s data centers advertise the same IP addresses through Border Gateway Protocol. Whichever data center is closest to you from a network point of view is the one that you’ll hit.
This is great for two reasons. The first is that the closer the data center to you, the faster the reply. The second great benefit is that this comes in very handy when dealing with large DDoS attacks. Volumetric DDoS attacks throw a lot of bogus traffic at you, which overwhelms network capacity. Cloudflare’s anycast network is great at taking on these attacks because they get distributed across the entire network.
Anycast doesn’t respect regional borders, it doesn’t even know about them. Which is why out of the box, Cloudflare can’t guarantee that traffic inside a country will also be serviced there. Although typically you’ll hit a data center inside your country, it’s very possible that your Internet Service Provider will send traffic to a network that might route it to a different country.
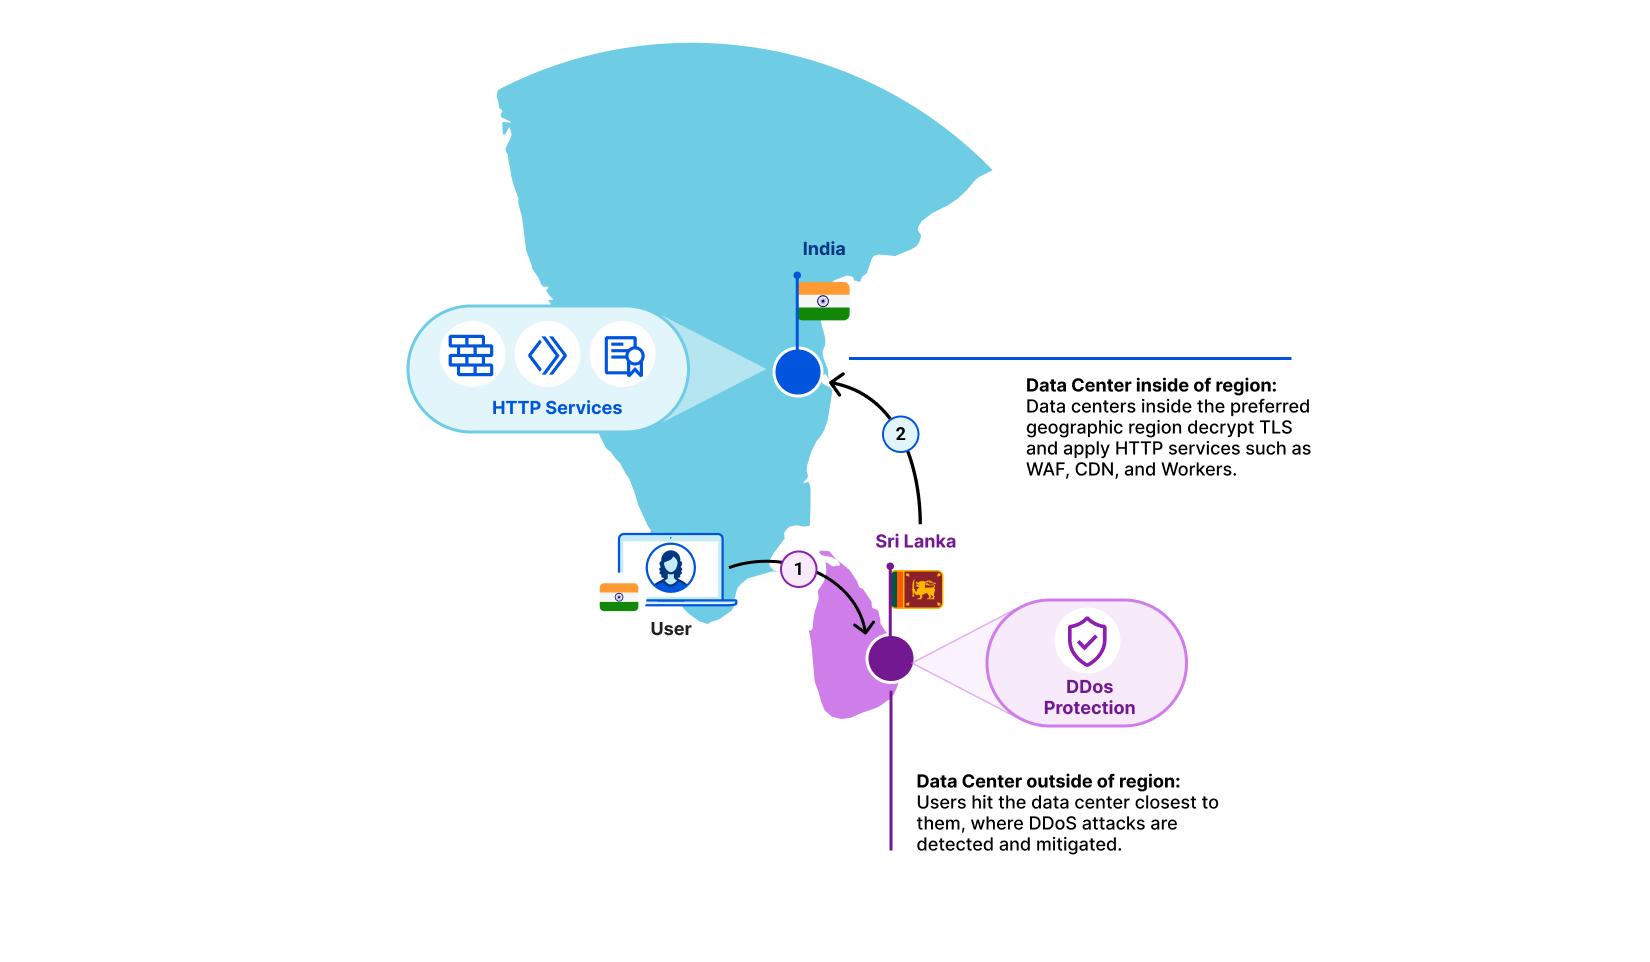
Regional Services solves that: when turned on, each data center becomes aware of which region it is operating in. If a user from a country hits a data center that doesn’t match the region that the customer has selected, we simply forward the raw TCP stream in encrypted form. Once it reaches a data center inside the right region, we decrypt and apply all Layer 7 products. This covers products such as CDN, WAF, Bot Management and Workers.
Let’s take an example. A user is in Kerala, India and their Internet Service Provider has determined that the fastest path to one of our data centers is to Colombo, Sri Lanka. In this example, a customer may have selected India as the sole region within which traffic should be serviced. The Colombo data center sees that this traffic is meant for the India region. It does not decrypt, but instead forwards it to the closest data center inside India. There, we decrypt and products such as WAF and Workers are applied as if the traffic had hit the data center directly.
Bringing Regional Services to Asia
Historically, we’ve seen most interest in Regional Services in geographic regions such as the European Union and the Americas. Over the past few years, however, we are seeing a lot of interest from Asia Pacific. Based on customer feedback and analysis on regulations we quickly concluded there were three key regions we needed to support: India, Japan and Australia. We’re proud to say that all three are now generally available for use today.
But we’re not done yet! We realize there are many more customers that require localization to their particular region. We’re looking to add many more in the near future and are working hard to make it easier to support more of them. If you have a region in mind, we’d love to hear it!
India, Japan and Australia are all live today! If you’re interested in using the Data Localization Suite, contact your account team!