Post Syndicated from The Atlantic original https://www.youtube.com/shorts/TdJhIxHn5W4
THIS just made ESPHome Easier!
Post Syndicated from digiblur DIY original https://www.youtube.com/watch?v=jnymd-vTQIE
[$] Block-layer error injection
Post Syndicated from daroc original https://lwn.net/Articles/1086344/
Storage code has to cope with hardware that fails in inconvenient
ways, but coaxing a healthy disk into producing those failures on
demand, for testing, is usually not possible. The kernel
provides several ways to inject block-layer I/O errors, but none of those can select the
operation to fail, pick the status code to return, or target a disk
directly without employing a stacked device on top. Use of a stacked device means
the test runs against the mapper device, not the disk it was meant to
exercise. A patch
series from Christoph Hellwig adds a configurable error-injection
interface that does all three things that the current error-injection code
lacks, controlled by a per-disk debugfs
file.
Comic for 2026.08.12 – Manuscript
Post Syndicated from Explosm.net original https://explosm.net/comics/manuscript
New Cyanide and Happiness Comic
Burst to Region: Overflow AWS Outposts workloads to Amazon EC2
Post Syndicated from Diya . original https://aws.amazon.com/blogs/compute/burst-to-region-overflow-aws-outposts-workloads-to-amazon-ec2/
AWS Outposts brings AWS infrastructure into your data center, giving on-premises workloads the low latency and data locality they need. But unlike the AWS Region, an Outposts rack has a fixed amount of compute. When your workload needs more instances than the rack can provide, you have two options: drop requests, or overflow them somewhere with room to grow. This post shows you how to automate the second option. You build a Burst to Region pattern that detects capacity constraints on your Outpost, launches Amazon Elastic Compute Cloud (Amazon EC2) instances in the parent Region, gradually shifts traffic to them, and returns traffic to local instances once capacity recovers.
To implement this pattern you configure Amazon CloudWatch, Amazon Simple Notification Service (Amazon SNS), AWS Lambda, Amazon EC2 Auto Scaling, Elastic Load Balancing (Application Load Balancer), and Amazon EventBridge. You trade a moderate latency increase for continued availability during capacity events.
When to use this pattern
This pattern assumes your Outposts workload scales out through Amazon EC2 Auto Scaling. Burst to Region reacts to instance-capacity exhaustion on the rack. It engages when your workload tries to launch more instances than the available Outpost capacity supports. If your fleet is fixed size and degrades under load without scaling out, the capacity alarm never fires and overflow never triggers. For those workloads, monitor per-instance saturation (CPU, latency) separately.
Good candidates prefer local capacity but can tolerate Region latency under pressure. If your application runs on Outposts for proximity yet degrades gracefully when some traffic takes the longer path to the Region, it fits this pattern. Examples include:
- Internal enterprise applications.
- Stateless web frontends and API layers.
- Pre-processing tiers where single-digit to tens-of-milliseconds additional round-trip latency during peaks is acceptable.
Poor candidates cannot absorb any added latency or must stay on the Outpost. Avoid this pattern for:
- Applications with sub-millisecond requirements.
- Workloads with strict data residency or sovereignty mandates that prevent traffic from leaving the on-premises environment.
- Real-time control systems with hard timing constraints.
- Applications tightly coupled to on-premises data stores with no Region replica.
The core tradeoff is explicit. During capacity events, you accept moderately higher latency to maintain availability. If your workload cannot tolerate any latency increase, keep it pinned to Outposts and reserve capacity through other means, such as Capacity Reservations.
Solution overview
Burst to Region works in three moves: detect capacity pressure on the Outpost, launch overflow compute in the parent Region, and shift traffic gradually until local capacity recovers. Six AWS services coordinate to make this automatic. The following diagram shows the reference architecture for the Burst to Region pattern, illustrating how the six AWS services interact during capacity detection, overflow scaling, traffic distribution, and recovery.
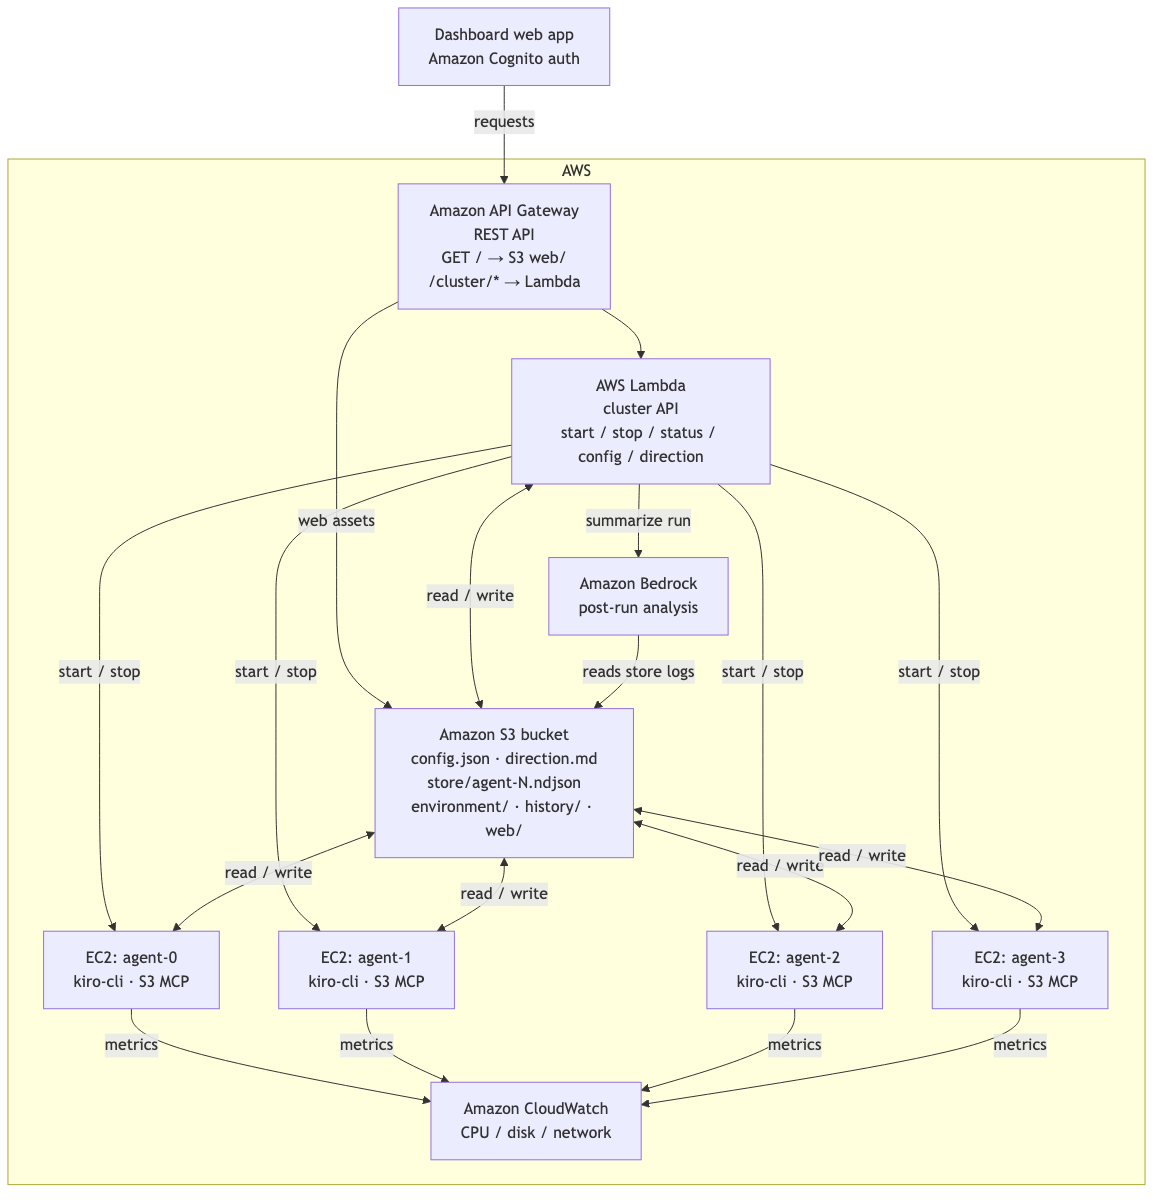
Figure 1: Reference architecture for Burst to Region on AWS Outposts
The pattern uses six AWS services working together:
- Amazon CloudWatch monitors Outposts capacity utilization and raises alarms.
- Amazon SNS provides event fan-out from alarm to orchestrator.
- AWS Lambda orchestrates the burst logic (scale-out, weight adjustment, recovery)
- Amazon EC2 Auto Scaling manages the overflow fleet lifecycle.
- Application Load Balancer distributes traffic across both locations using weighted target groups.
- Amazon EventBridge handles periodic recovery evaluation.
You must configure five phases for this pattern:
- Monitor. CloudWatch tracks Outposts capacity utilization metrics in the
AWS/Outpostsnamespace. - Detect. A CloudWatch alarm fires when utilization exceeds a threshold (for example, 80%).
- Overflow. The alarm triggers a Lambda function through Amazon SNS. Lambda scales out a Region-based Amazon EC2 Auto Scaling group and adjusts ALB target group weights.
- Distribute. The ALB splits traffic between Outposts instances and Region instances using weighted forwarding.
- Recover. An Amazon EventBridge scheduled rule periodically evaluates capacity. When Outposts recovers, Lambda scales down the overflow fleet and returns all traffic to local instances.
Design decisions
We chose Application Load Balancer with weighted forwarding over Amazon Route 53 weighted routing for traffic distribution. ALB provides health-aware routing to only healthy overflow instances and target group stickiness for session consistency. Weight changes take effect for new connections after calling the ModifyRule API. DNS-based shifting through Route 53 provides too coarse control for rapid weight adjustments, and TTL propagation delays make recovery slower.
The burst orchestrator runs as a Lambda function rather than a long-running service. It executes only during state transitions, so there is no steady-state compute cost. Lambda integrates natively with Amazon SNS and Amazon EventBridge for event-driven invocation without additional infrastructure.
You implement recovery with an Amazon EventBridge scheduled rule (every 5 minutes) rather than relying solely on the CloudWatch alarm to return to OK state. The alarm confirms capacity is available, but does not confirm that overflow instances have drained active connections. The scheduled rule provides gradual, safe scale-down.
Implementation
This section walks through the key components of the Burst to Region pattern. For the complete deployable AWS SAM template, see the GitHub repository.
Prerequisites
To deploy this pattern, you need:
- An AWS account with a configured AWS Outposts rack.
- An Amazon Virtual Private Cloud (Amazon VPC) with subnets associated with your Outposts and subnets in the parent AWS Region.
- IAM permissions to create CloudWatch alarms, Lambda functions, Auto Scaling groups, and ALB resources.
- AWS Serverless Application Model (AWS SAM) CLI installed and configured.
- Existing Amazon EC2 Auto Scaling group running on your Outpost (these become your baseline fleet)
- A custom domain name with a DNS record (Route 53 alias or CNAME) pointing to your Application Load Balancer, and an AWS Certificate Manager (ACM) certificate for that domain to enable HTTPS.
Capacity monitoring and alarm
The CloudWatch alarm monitors instance utilization on the Outpost and triggers the burst workflow when capacity is constrained.
The InstanceTypeCapacityUtilization metric reports the percentage of a given instance type’s capacity in use. Note that this metric includes capacity consumed by managed services such as Amazon Relational Database Service (Amazon RDS) or Application Load Balancer running on the Outpost — not only your application’s EC2 instances. Factor this into your threshold planning.
Why these values matter:
- Period: 300 and EvaluationPeriods: 2 require 10 minutes of sustained high utilization before triggering. This avoids false alarms from transient spikes.
- Threshold: 80 (recommended starting point) leaves a 20% buffer. A threshold set too high (95%) risks launch failures before the overflow fleet is ready. A threshold set too low (50%) causes unnecessary bursts.
- TreatMissingData: notBreaching prevents false alarms when data points are missing. Since this alarm is scoped to a single instance type, treating missing data as breaching could trigger unnecessary bursts when the instance type is simply not in use.
- Separate scale-out from scale-in: This alarm triggers burst scale-out at 80%. Recovery is handled separately by the Amazon EventBridge scheduled rule, which uses a lower threshold (for example, 60%) before scaling in. This hysteresis gap prevents flapping where scaling down immediately pushes utilization back above the alarm threshold.
Burst orchestrator (Lambda)
The Lambda function handles two event paths: alarm-triggered scale-out and scheduled recovery evaluation. The following pseudocode shows the orchestration flow:
The key actions the function performs:
- scale_out_overflow — Sets the overflow Auto Scaling group desired capacity from 0 to your configured burst size.
- set_alb_weights — Calls the ModifyListener API to adjust weighted forwarding between the Outposts and Region target groups.
- publish_burst_metric — Writes a custom CloudWatch metric (BurstActive) for dashboard visibility.
- handle_recovery_check — Called every 5 minutes by Amazon EventBridge. Confirms Outposts capacity has recovered, steps weights back gradually, waits for connection draining, then scales down the overflow fleet.
Important: The orchestrator does not shift ALB weights immediately upon scale-out. It waits for the next Amazon EventBridge invocation (up to 5 minutes) to confirm that overflow instances have passed health checks and are registered as healthy in the target group. This helps prevent routing traffic to instances that have not finished launching.
For the production-ready implementation with error handling, gradual weight stepping, and connection draining verification, see the GitHub repository.
Overflow Auto Scaling group
The overflow fleet starts at zero and scales only when the Lambda function sets desired capacity during a burst event:
The overflow fleet starts at zero capacity and incurs no cost at rest. During a burst event, the Lambda function calls the SetDesiredCapacity API to launch overflow instances. During recovery, it sets desired capacity back to zero.
The launch template mirrors your Outposts instance type to maintain consistent performance characteristics across both locations.
ALB weighted forwarding
The ALB listener uses weighted forwarding across two target groups. In steady state, all traffic goes to Outposts (weight 100/0). During burst, the Lambda function adjusts these weights dynamically using the ModifyListener API. Clients reach the ALB through a DNS record — either a Route 53 alias or a CNAME pointing to the ALB’s DNS name.
Note on stickiness: Target group stickiness keeps a client pinned to whichever target group served its first request for DurationSeconds. We set this to 300 seconds (5 minutes) to match the Amazon EventBridge evaluation interval. This balances session consistency for stateful workloads against the need for weight changes to take effect within a reasonable window. For purely stateless workloads, you can disable stickiness entirely to allow immediate weight convergence. For workloads requiring longer session affinity, increase the duration but understand that weight transitions will converge more slowly — existing sticky sessions continue going to the original target group until they expire.
Traffic weight progression
Use stepped transitions rather than abrupt weight changes. The following table shows the recommended progression:
| Phase | Outposts weight | Region weight | Condition to advance |
| Normal | 100 | 0 | Steady state |
| Burst step 1 | 90 | 10 | Region target group has at least 1 healthy host |
| Burst step 2 | 70 | 30 | Region target group healthy for 2 consecutive checks |
| Burst step 3 | 50 | 50 | Only if Outposts capacity exceeds 95% used |
| Recovery step 1 | 80 | 20 | Outposts capacity below 70% |
| Recovery step 2 | 100 | 0 | Outposts capacity below 60% for 2 checks |
Avoid jumping directly from 0% to 50% Region traffic. Cold overflow instances need time to warm caches and stabilize before absorbing significant load.
Best practices
Apply these best practices to get the most from this pattern while avoiding common pitfalls.
Traffic tiering
Classify your workloads into two tiers at the ALB listener level. Latency-critical paths use routing rules with the Outposts target group only. These never overflow regardless of capacity state. Overflow-eligible paths use the weighted forwarding rule. This separation helps make sure that your most latency-sensitive flows are not impacted by the burst mechanism.
Managing data gravity
For stateless workloads, Burst to Region requires no special data handling. For workloads with session state or shared data:
- Store session state in Amazon ElastiCache or Amazon DynamoDB rather than local instance memory. Both Outposts and Region instances access the same session store.
- If your application reads from a local database on Outposts, overflow instances need a Region-accessible replica. Consider Amazon Relational Database Service (Amazon RDS) read replicas or DynamoDB global tables.
Anti-pattern: Do not burst workloads that write to Outposts-local storage and expect synchronous consistency. The latency and complexity of cross-location writes defeats the purpose of the pattern.
Cost optimization
The overflow fleet consumes On-Demand pricing by default since it starts at zero and scales only during peaks.
| Burst profile | Recommended pricing | Rationale |
| Unpredictable spikes (minutes) | On-Demand | Maximum flexibility, no commitment waste |
| Predictable daily peaks (hours) | Savings Plans (Compute) | Covers overflow hours at discount |
| Frequent, long bursts | Reserved capacity plus On-Demand | Baseline discount plus burst flexibility |
Monitor your BurstActive custom metric over time. If overflow is active more than 30% of the time, you likely need additional Outposts capacity rather than relying on Region overflow.
Security consistency
Maintain identical security posture across both environments:
- Use the same security group rules for Outposts and Region instances.
- Deploy with AWS CloudFormation StackSets to support consistency.
- Share the same IAM instance profile. The overflow launch template references the same role as your Outposts instances.
- Apply the same AWS Systems Manager patch baselines and compliance rules to both fleets.
Observability
Build a CloudWatch dashboard that provides visibility into burst state and performance. The SAM template in the repository deploys a pre-configured dashboard tracking:
- Burst status: Custom
BurstActivemetric (1 = active, 0 = normal) - Capacity headroom:
UsedInstanceType_Countcompared toAvailableInstanceType_Count. Note thatUsedInstanceType_Countincludes instances consumed by managed services (Amazon RDS, ALB), so your available application capacity may be lower than the raw availability count suggests. - Overflow fleet size: Auto Scaling group
GroupInServiceInstances. - Latency comparison:
TargetResponseTimeper target group (Outposts compared to Region) - Traffic distribution:
RequestCountper target group.
Set a CloudWatch alarm on Region target group TargetResponseTime exceeding your acceptable threshold. This provides early warning if overflow latency degrades beyond your tolerance.
Service link considerations
Because the ALB resides in the Region, all traffic to Outposts targets traverses the service link. Keep the following in mind:
Bandwidth planning: Steady-state traffic to Outposts targets flows over the service link. Verify that your connection meets the minimum 500 Mbps per compute rack recommended by AWS, with sufficient headroom for both application traffic and Outposts control plane communication. Monitor service link VIF throughput using IfTrafficIn and IfTrafficOut metrics (on service link VIFs) to detect saturation before it impacts performance.
Latency impact: The service link adds latency compared to a locally deployed load balancer. The exact impact depends on your service link connection type and distance to the parent Region (AWS specifies a maximum of 175 ms round-trip for service link). For internet-facing workloads, this is typically negligible relative to the client-to-Region round trip. For workloads serving on-premises users through the Local Gateway, consider Route 53 weighted routing between an ALB on Outposts and a separate ALB in the Region instead.
Connection draining: When scaling down the overflow fleet, allow sufficient time for in-flight requests to complete. The deregistration delay configured on the target group (default 300 seconds) and the Auto Scaling scale-in cool-down period work together to help provide graceful termination and minimize the risk of dropping active connections.
Failure modes: If the service link goes down, the ALB cannot reach Outposts targets. Health checks fail, and all traffic automatically shifts to Region targets. This provides an unintentional but useful failover behavior. However, note that the overflow fleet is sized for burst capacity, not for sustaining 100% of production traffic. Monitor the ConnectedStatus metric (under the AWS/Outposts namespace, dimension OutpostId) and alert on degradation. If you need full failover capability, architect a separate disaster recovery solution with appropriately sized Region capacity.
Limitations
Be aware of these constraints when implementing this pattern:
- ALB requirement: The pattern requires an Application Load Balancer in the Region. Workloads that rely on direct IP access through the Local Gateway (without an ALB) cannot use this pattern without an architecture change.
- Stateful workloads: Applications with local disk state or in-memory sessions require external session stores (ElastiCache, DynamoDB) before they can burst. Without this, overflow instances serve requests without session context.
- Database coupling: If your application writes to a database running exclusively on the Outpost, overflow instances in the Region cannot reach it without a cross-location replica or proxy. Read-heavy workloads with a Region read replica are ideal candidates.
- Service link as single path: All ALB-to-Outpost traffic shares the service link with AWS control plane operations. Under extreme load, bandwidth contention can degrade both application traffic and management operations.
- ALB on Outposts: As of this writing, ALB on Outposts does not support weighted target groups spanning both locations. The ALB must reside in the Region for this pattern to work.
Testing the pattern
Validate the burst mechanism before relying on it in production:
Simulate capacity pressure:
Verify overflow fleet launched:
Verify ALB weights shifted (after recovery check runs):
Trigger recovery:
Confirm overflow fleet scales back to zero and all traffic returns to Outposts targets. Recovery is gradual — the Amazon EventBridge rule evaluates every 5 minutes and steps weights back before scaling down, so full recovery may take 10–15 minutes depending on your weight progression configuration.
Clean up
To avoid ongoing charges, verify that the overflow Auto Scaling group has scaled to zero, then delete the stack:
This removes all resources created by the template, including the Lambda function, CloudWatch alarm, SNS topic, Amazon EventBridge rule, and the overflow Auto Scaling group.
Conclusion
This Burst to Region pattern extends AWS Outposts capacity into the parent Region during peak demand. You trade a moderate latency increase for continued availability when local capacity is exhausted.
The pattern works best when you clearly classify which workloads can overflow, implement gradual traffic transitions, and maintain security and observability parity across both environments.
For the complete deployable AWS SAM template including the Lambda orchestrator, CloudWatch dashboard, and all IAM roles, see the GitHub repository. To learn more about capacity planning for Outposts, see Managing your AWS Outposts capacity using Amazon CloudWatch and AWS Lambda and AWS Outposts monitoring and reporting: A comprehensive Amazon EventBridge solution.
For more information, see the AWS Outposts User Guide and the Amazon EC2 Auto Scaling User Guide.
AMD Instinct MI455X Deep Dive: CDNA 5 Marks The Next Era of Instinct
Post Syndicated from Ryan Smith original https://www.servethehome.com/amd-instinct-mi455x-deep-dive-cdna-5-marks-the-next-era-of-instinct/
We are taking a deep dive look into AMD’s Instinct MI455X accelerator and its CDNA 5 architecture, the backbone of AMD’s next-gen AI server offerings and their massive Helios rackscale system
The post AMD Instinct MI455X Deep Dive: CDNA 5 Marks The Next Era of Instinct appeared first on ServeTheHome.
Trump, the DOJ & Pam Bondi #lastweektonight
Post Syndicated from LastWeekTonight original https://www.youtube.com/shorts/oWjqP9GATrM
S10 E2: Project Veritas & Artificial Intelligence: Last Week Tonight with John Oliver
Post Syndicated from LastWeekTonight original https://www.youtube.com/watch?v=27bhd57rDD4
[$] A look at CrossPoint e-reader firmware
Post Syndicated from jzb original https://lwn.net/Articles/1087635/
There are a number of small,
inexpensive, low-powered e-reader or e-paper devices that have promise as
ebook readers with one minor problem: the firmware they ship with does not
realize their full potential. To solve that problem, the CrossPoint Reader project looks to
provide replacement firmware that offers necessary features, better performance,
and a more pleasant reading experience. On August 7, the project released version
1.5.0, which opens large EPUBs more quickly, provides
offline dictionary lookups, and has reworked settings for changing layout and
font options. The release also improves support for right-to-left text as well
as Chinese, Japanese, and
Korean (CJK) text rendering.
How Social Media Has Fueled the Rise of the Personal-Growth Narrative
Post Syndicated from The Atlantic original https://www.youtube.com/shorts/zpqhfg3UHzM
QEMU 11.1 released
Post Syndicated from jzb original https://lwn.net/Articles/1088490/
Version
11.1 of the QEMU emulator has been released. The release contains
more than 3,200 commits from 285 authors and includes a long list of
improvements; see the announcement and changelog for the
details.
Fans Don’t Cool Rooms (And That’s The Point)
Post Syndicated from BeardedTinker original https://www.youtube.com/watch?v=-th38Ime63E
Build an AI email pipeline with Amazon Bedrock and SES Mail Manager
Post Syndicated from Zip Zieper original https://aws.amazon.com/blogs/messaging-and-targeting/build-an-ai-email-pipeline-with-amazon-bedrock-and-ses-mail-manager/
Processing inbound email attachments at scale involves extracting files, routing them by recipient, scanning for malware, and classifying content. This traditionally requires stitching together polling loops, event rules, and multiple integration points. Amazon Simple Email Service (Amazon SES) Mail Manager now provides two new rule actions that simplify this pattern. The Lambda action invokes AWS Lambda functions directly from rule sets, and the Bounce action returns rejection responses. Together, they let you build multi-step email processing pipelines with declarative configuration.
In this post, you learn how to build an attachment processing pipeline that automatically extracts email attachments and classifies them with Amazon Bedrock. The pipeline also rejects infected files with RFC-compliant bounce responses. The complete implementation is available as an AWS Cloud Development Kit (AWS CDK) deployment in the companion GitHub repository sample-amazon-ses-mail-manager-attachment-pipeline. You can deploy it manually using the steps in this post, or hand it off to an AI coding agent such as Kiro or Claude Code. The repository includes a machine-readable agentic deployment guide that walks an agent through every deployment step, from prerequisite checks to post-deploy verification.
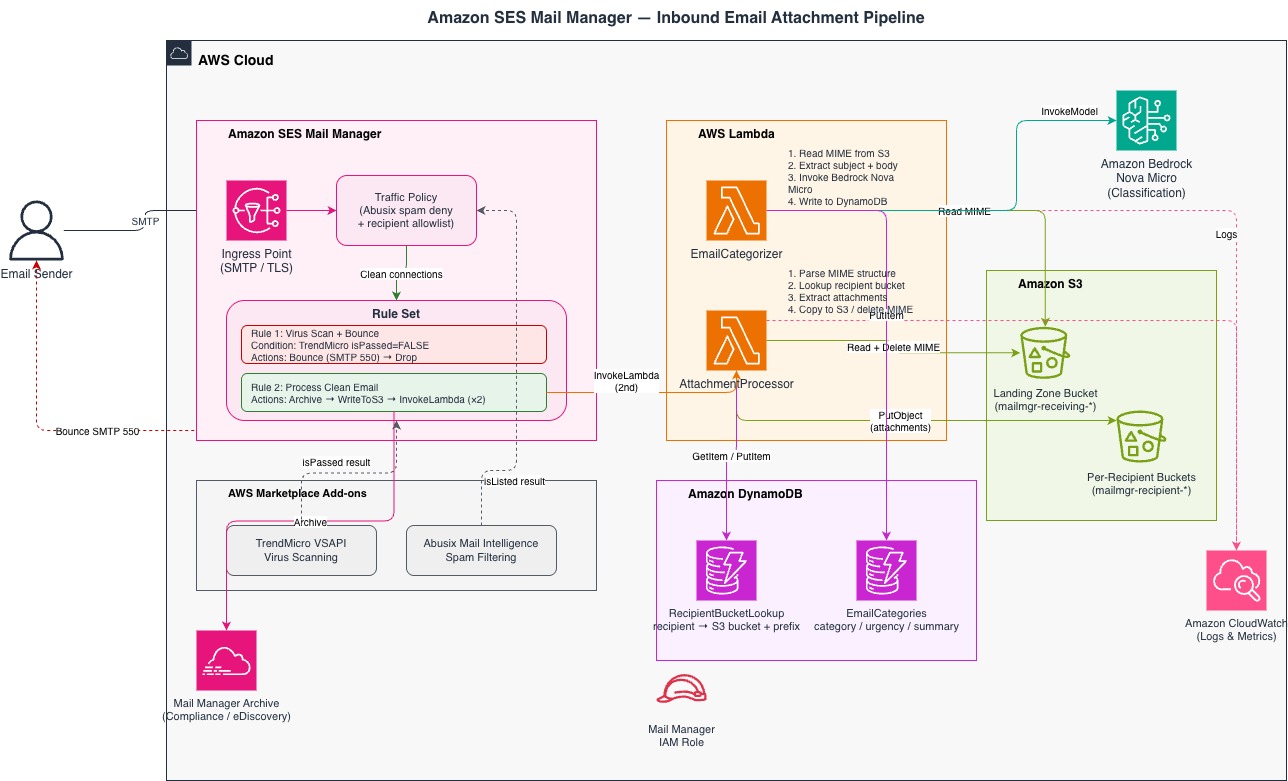
The problem: scaling document intake for a multi-tenant platform
Consider a fictitious SaaS platform from AnyCompany that lets customers submit documents by email. Each customer sends invoices, contracts, and supporting files to a dedicated address (for example, [email protected] or [email protected]). They expect those attachments to land in their isolated storage, classified and ready for downstream processing.
Without a purpose-built pipeline, the typical approach looks like this: an Amazon S3 event notification triggers a Lambda function that polls for new MIME objects, parses them, looks up the recipient in a routing table, and fans out extraction to another function. Worse, it relies on a separate virus-scanning step having run first. Orchestration lives in AWS Step Functions or Amazon EventBridge rules. Adding a new customer means updating routing configuration in multiple places. Adding classification means bolting on yet another Lambda in the chain.
The result is fragile. When volume spikes during month-end invoice runs or onboarding waves, the polling loop backs up and retries cascade. Infected files occasionally slip past the scanner because the scan and extraction steps are not transactionally linked.
This pipeline solves the problem declaratively. Mail Manager’s traffic policy rejects unauthorized senders and enforces size limits at the SMTP connection level. This filtering happens before any processing resources are consumed. The rule set handles virus scanning, bouncing, archiving, classification, and extraction in a single ordered sequence. Each step completes before the next begins. If an attachment is infected, the sender gets an immediate SMTP bounce. There are no silent failures and no orphaned files in downstream storage.
The result is a pipeline where:
- Adding a customer means adding an email address to the Mail Manager address list and a row in Amazon DynamoDB. No changes to code.
- Adding a classification category means editing a prompt string. No schema migration.
- Infected files never reach storage because the bounce fires during the SMTP transaction, before any Lambda is invoked.
Pipeline architecture overview
Table 1: Architecture components and their roles in the email processing pipeline
| Component | Role |
| Amazon SES Mail Manager open Ingress Endpoint | Email arrives via public internet at a Mail Manager open ingress point over SMTP. |
| Mail Manager traffic policy | Filters spam using the Abusix (or Spamhaus) email add-on, then enforces a recipient allowlist at the connection level. |
| Mail Manager rule set | Messages for allowed recipients are passed to the rule set, which sequentially evaluates each message against two rules. |
| Rule 1 | Uses the Trend Micro email add-on to scan for infected attachments, then bounces any unsafe messages back to sender (using Amazon SES outbound). |
| Rule 2 | Clean messages passed from Rule 1 are copied to a Mail Manager archive and written as raw Multipurpose Internet Mail Extensions (MIME) objects to a “landing-zone” Amazon S3 bucket. |
| AWS Lambda (AttachmentProcessor) | Triggered by the arrival of objects in the S3 bucket, this function parses MIME email, extracts attachments, and routes them to per-recipient S3 buckets. |
| AWS Lambda (EmailCategorizer) | Triggered by the arrival of objects in the landing-zone S3 bucket, this function classifies each email using Amazon Nova Micro via Amazon Bedrock and writes results to Amazon DynamoDB. |
| Amazon S3 (landing zone + per-recipient buckets) | Stores raw MIME objects in a shared landing-zone bucket; stores extracted attachments in isolated per-recipient buckets keyed by local part (for example, invoices/ for [email protected]). |
| Amazon DynamoDB (RecipientBucketLookup) | Maps recipient email addresses to their designated S3 bucket and key prefix. |
| Amazon DynamoDB (EmailCategories) | Stores Amazon Bedrock classification results: category, urgency, and summary. |
| Amazon Bedrock (Amazon Nova Micro) | Classifies each email into a category (invoice, contract, HR, unknown) and urgency level. |
| AWS IAM roles | Mail Manager and Lambda execution permissions following the principle of least privilege. |
How the Mail Manager traffic policy filters connections
The traffic policy (Receive-attachments) makes connection-level decisions before any message content is processed. It evaluates two statements in order:
- Deny spam — Connections from senders flagged by Abusix as spam sources are denied immediately.
- Allow approved recipients — Connections where the recipient is in the
approved-recipientsaddress list pass through to the rule set.
The policy uses a default action of DENY, so any connection that does not match an explicit ALLOW statement is rejected. The policy also enforces a 35 MB maximum message size. You can add additional statements to enforce SPF, DKIM, or DMARC authentication results. This is useful in regulated industries where sender verification is required before any processing occurs.
The PolicyStatements array defines the evaluation order (deny first, then allow):
For the complete create_traffic_policy call with all parameters, see the companion repository.
API reference: CreateTrafficPolicy
Rule set: the processing pipeline
Messages that pass the traffic policy enter the rule set (attachment-pipeline-rules), which evaluates two rules in order.
Rule 1 — Virus scan and bounce
This rule checks the Trend Micro add-on result. If Trend Micro reports isPassed = FALSE (infected attachment detected) — note that Mail Manager has already accepted the message by this point — the rule fires a Bounce action, which generates a non-delivery report (NDR) back to the sender with SMTP 550 (permanent failure) and status 5.7.1 (security/policy reason). It then Drops the message. No further rules run.
This after-the-fact NDR prevents infected messages from entering your processing pipeline while still providing clear guidance to legitimate senders.
Rule 2 — Process clean email
This rule has no conditions, so it applies to every message that passed the virus scan. It runs four actions in sequence:
- Archive — Mail Manager stores a copy in the archive for compliance and electronic discovery (eDiscovery).
- WriteToS3 — Mail Manager writes the raw MIME object to the
amzn-s3-demo-bucket-general-receivingS3 bucket, keyed by message ID. - InvokeLambda (
EmailCategorizer,REQUEST_RESPONSE) — Mail Manager invokes the categorizer, which classifies the email with Amazon Bedrock and writes results to Amazon DynamoDB. - InvokeLambda (
AttachmentProcessor,REQUEST_RESPONSE) — Mail Manager invokes the processor, which extracts attachments and routes them to per-recipient S3 locations.
The categorizer fires before the attachment processor by design: the attachment processor deletes the original MIME from Amazon S3 after successfully extracting attachments. By running first, the categorizer is guaranteed to find the MIME in Amazon S3.
Because the Bounce and Drop actions fire in Rule 1, the Lambda functions in Rule 2 are never invoked for infected messages. There is no risk of malicious content reaching your Amazon S3 buckets or Amazon Bedrock.
API reference: CreateRuleSet
How Amazon Bedrock classifies inbound email
The MailManager-EmailCategorizer function uses Amazon Nova Micro (amazon.nova-micro-v1:0) to classify each email. Amazon Nova Micro is a fast, lightweight text-only model optimized for classification and structured output tasks. Access to all Amazon Bedrock foundation models, including Amazon Nova Micro, is available by default in all commercial AWS Regions. No access request is needed.
The function performs the following steps:
- Parses the recipient, message ID, and subject from the Mail Manager event.
- Retrieves the raw MIME from the
amzn-s3-demo-bucket-general-receivingS3 bucket. - Extracts the plain-text or HTML body from the MIME structure.
- Sends the subject (capped at 500 characters) and body (capped at 4,000 characters) to Amazon Bedrock with a classification prompt.
- Writes the structured result to the
EmailCategoriesDynamoDB table.
The classification prompt returns a structured JSON response:
If Amazon Bedrock returns an error or malformed JSON, the function falls back to category: unknown, urgency: non-urgent and continues. It never blocks the attachment processor.
Choosing a classification model
To customize the classification categories for your use case, update the SYSTEM_PROMPT in the categorizer Lambda function. The prompt uses a structured instruction format that you can extend with additional categories, urgency levels, or routing rules. For example, an insurance carrier could add categories like claim_new, claim_status, document_submission, and complaint to automatically triage patient email. You can also update the COMPANY_NAME environment variable to inject your organization’s name into the classification prompt without modifying the function code.
To switch the model, update the BEDROCK_MODEL_ID environment variable. The following table compares supported options:
| Model | Model ID | Best for | Latency | Relative cost |
| Amazon Nova Micro | amazon.nova-micro-v1:0 | Fast structured classification, low latency | ~200ms | Lowest |
| Amazon Nova Lite | amazon.nova-lite-v1:0 | Richer summaries, multi-label classification | ~400ms | Moderate |
| Anthropic Claude 3 Haiku | anthropic.claude-3-haiku-20240307-v1:0 | Complex reasoning, nuanced categorization | ~600ms | Higher |
Attachment extraction and routing
The MailManager-AttachmentProcessor function handles MIME parsing, recipient-based routing, and cleanup. It performs the following steps:
- Parses the recipient email address and message ID from the Mail Manager event information.
- Retrieves the raw MIME message from the
amzn-s3-demo-bucket-general-receivingS3 bucket using the message ID from the event as the S3 key. - Looks up the recipient’s S3 destination in the
RecipientBucketLookupDynamoDB table, or creates a new entry if this is the first email for that recipient. - Extracts attachment parts from the MIME message, skipping plain-text and HTML body parts that have no file name.
- Copies each attachment to the recipient’s S3 bucket at the prefix
{local_part}/(for example,invoices/for [email protected]). - Deletes the original MIME object from the landing-zone bucket, but only if every attachment copy succeeded. If any copy failed, the MIME is retained for retry.
- Returns a response to Mail Manager indicating success or failure.
This synchronous invocation pattern allows the rule set to make routing decisions based on the Lambda function’s response. If attachment extraction fails, subsequent rules can bounce the message or route it to a quarantine location.
Attachment detection logic
The function detects attachments using three criteria:
Content-Dispositioncontainingattachment.- Any MIME part with a file name (even if disposition is
inlineor missing). - Non-text, non-multipart parts (such as
application/pdforimage/*).
For parts without a file name, the function generates one from the content type (for example, attachment.pdf).
Input validation and security
The pipeline implements the following input validation to protect against malicious content and unexpected inputs:
- messageId validation — the
messageIdfrom the Mail Manager event is validated against an alphanumeric-plus-hyphen pattern ([a-zA-Z0-9\-]+) before use as an S3 key. Unexpected formats raise aValueError, which causes Mail Manager to apply theActionFailurePolicy. - Attachment filename sanitization — filenames from MIME
Content-Dispositionheaders are attacker-controlled. Before use as S3 key components, each filename is processed throughos.path.basename()to strip directory components, leading-dot stripping to prevent hidden-file creation, and a character allowlist ([\w.\- ]). Filenames are also truncated to 255 characters. - Prompt size caps — the email body sent to Amazon Bedrock is capped at 4,000 characters. The subject line is capped at 500 characters, preventing oversized prompts and excessive token usage.
The following additional controls are recommended before adapting this pipeline for production:
- Validate attachment file types against an approved allowlist (such as
.pdf,.docx,.xlsx). Reject or quarantine messages with disallowed file types. - Implement per-attachment size limits in addition to the overall 35 MB message size limit.
- Verify MIME structure integrity before parsing. Handle malformed MIME structures as error conditions.
- Log validation failures to Amazon CloudWatch for security monitoring and audit purposes.
AWS CloudFormation and CDK support for Mail Manager rule actions
The InvokeLambda and Bounce rule actions are supported natively in AWS::SES::MailManagerRuleSet as of March 2026. The companion CDK stack uses CfnMailManagerRuleSet directly. No Custom Resource is required.
When using the Python CDK L1 bindings, note that typed property classes for Bounce and InvokeLambda are not yet exposed in the Python bindings. Pass these actions as plain dicts with camelCase keys matching the AWS CloudFormation property names. RuleActionProperty accepts Dict[str, Any] for each field:
API reference: AWS::SES::MailManagerRuleSet | AWS CDK API Reference
Prerequisites
This post and companion GitHub project assume familiarity with SMTP protocols, email infrastructure concepts, AWS Lambda, Amazon S3, Amazon DynamoDB, and AWS IAM.
Estimated time: 20–30 minutes to deploy and test.
Estimated cost: This pipeline uses a Mail Manager open ingress endpoint that costs $50/mo in addition to various AWS services that are charged based on actual usage. In a low-volume test environment (fewer than 1,000 email messages per day), costs should typically be under $60 USD per month driven primarily by Mail Manager archiving, S3 storage, Lambda invocations, and Amazon Bedrock token usage. Use the AWS Pricing Calculator to estimate costs for your expected volume.
AWS IAM permissions: The deploying user needs permissions to create and manage AWS CloudFormation stacks, Lambda functions, S3 buckets, DynamoDB tables, AWS IAM roles, and Amazon SES Mail Manager resources. For testing, AdministratorAccess is sufficient. For production, scope permissions to the specific actions required: cloudformation:CreateStack, lambda:CreateFunction, s3:CreateBucket, dynamodb:CreateTable, iam:CreateRole, iam:PassRole, ses:CreateTrafficPolicy, ses:CreateRuleSet, and ses:CreateAddressList. (Separately, the Lambda functions’ own execution roles, created by the stack, grant bedrock:InvokeModel at runtime; that permission is not needed by the person deploying the stack.)
To deploy this pipeline, you need the following:
- An active AWS account.
- AWS Command Line Interface (AWS CLI) version 2.x or later installed and configured with credentials and default region.
- AWS CDK version 2.x or later installed (
npm install -g aws-cdk) and Python 3.12 or later. - Amazon SES configured with production access in the target region with a verified Amazon SES identity for the bounce sender address.
- Ability to administer the DNS entries for the Amazon SES identity to add an MX record pointing to the Mail Manager ingress endpoint’s A record.
Deployment
Tip: Whichever path you choose, review the Prerequisites section first to make sure your AWS account has the necessary permissions and that you have a verified domain available in Amazon SES. The complete solution is available as an open-source reference implementation. To deploy it in your AWS account, clone the companion repository:
From here, you have two paths to get up and running:
Option 1: Deploy manually
Follow the step-by-step instructions in the repository’s README.md. At a high level, you will:
- Install prerequisites (AWS CDK, Node.js, Python).
- Configure your environment variables (AWS account, region, verified domain).
- Bootstrap your CDK environment.
- Deploy the stack with
cdk deploy. - Complete post-deployment verification (confirm email receiving rules are active and test with a sample message).
Option 2: Deploy with a coding agent
If you use an AI-powered coding assistant (such as Amazon Q Developer CLI or Kiro), install the AWS MCP server and SES/Mail Manager skills to empower your AI assistants with deep context on Amazon SES and Mail Manager. These resources give your assistant live access to AWS APIs and CDK documentation, which significantly reduces trial-and-error during deployment. The repository’s AGENTS.md file contains machine-readable guidance, deployment failure recovery patterns, and region handling notes specifically for AI assistants. Simply point your AI assistant at the AGENTS.md file in the repository root. This file provides structured, machine-readable instructions that guide the agent through the full deployment, from prerequisite checks through stack deployment and validation, without manual intervention.
Validating the deployment
Once your stack is deployed and the MX record is in place, send a test email with an attachment to one of your approved recipient addresses. Then confirm each stage of the pipeline executed successfully:
1. Check Lambda execution
Open Amazon CloudWatch Logs for both functions and confirm they completed without errors:
You should see log entries showing the message ID being processed by each function in sequence: the categorizer first, then the attachment processor.
2. Confirm email classification
Query the EmailCategories DynamoDB table to verify Amazon Bedrock classified your test message:
A successful record includes category, urgency, and a short summary, all generated by Amazon Nova Micro from the email’s subject and body.
3. Verify attachment extraction
Look up your recipient’s S3 destination in the RecipientBucketLookup table, then list the bucket contents to confirm the attachment arrived:
If all three checks pass, your pipeline is fully operational. Email messages are being scanned, classified, and routed to per-recipient storage without any external orchestration.
Troubleshooting
If your test email does not flow through the pipeline as expected, start with these common issues:
| Symptom | Likely cause | Resolution |
| Bounce action fails silently — infected emails are dropped without notification | The bounce_sender identity is not verified in the deployment region. Amazon SES identities are regional. |
Verify the domain in your target region: aws sesv2 create-email-identity --email-identity example.com --region <region>, add the DKIM CNAMEs to DNS, and wait for verification. No redeployment required. |
| Bounce action returns a validation error | bounce_sender is set to a bare domain instead of an email address |
Use a full address like [email protected], not just example.com |
For CDK deployment issues, stack rollback errors, and teardown conflicts, see the repository troubleshooting guide.
General debugging tip: Both Lambda functions log to /aws/lambda/MailManager-EmailCategorizer and /aws/lambda/MailManager-AttachmentProcessor in Amazon CloudWatch Logs. Start there for any runtime failures.
Clean up
To avoid ongoing charges, destroy the stack when you are done:
Note: If the destroy fails with a
ConflictException, detach the ingress point from the traffic policy first. Amazon DynamoDB tables created withRETAINpolicies may also need manual deletion. See the repository’s Common failure modes table for details.Do not forget to remove the MX record from your domain’s DNS once the ingress point is deleted. After completing the clean up, verify on the AWS Management Console that the Mail Manager ingress endpoint, Amazon S3 buckets, Amazon DynamoDB tables, and Lambda functions no longer appear in your account.
Conclusion
The Lambda action and Bounce action in Amazon SES Mail Manager support multi-step inbound email processing without complex orchestration workarounds. This pipeline demonstrates how these capabilities work together in production: scanning attachments for malware, classifying email content with AI, extracting and routing files to per-recipient storage, and providing immediate RFC-compliant feedback to senders. The modular architecture supports extension: add new classification categories, integrate additional scanning engines, or chain Lambda functions for multi-stage processing. The synchronous invocation pattern means that every processing step completes before the next begins, giving you full control over the pipeline flow. Get started by cloning the sample-amazon-ses-mail-manager-attachment-pipeline repository and deploying to your account. For an overview of the four new Mail Manager capabilities used in this pipeline, see Four new Amazon SES Mail Manager capabilities, explained.
FAQ
Q: Can I use a different Amazon Bedrock model for email classification?
Yes. Update the BEDROCK_MODEL_ID environment variable on the MailManager-EmailCategorizer Lambda function. No changes to code are required. See the preceding model comparison table for supported options.
Q: Do I need to request access to Amazon Nova Micro?
No. In all commercial AWS Regions, access to Amazon Bedrock foundation models including Amazon Nova Micro is available by default. AWS GovCloud (US) regions require an explicit access request through the Amazon Bedrock console.
Q: What happens if the Lambda function times out or fails?
A REQUEST_RESPONSE invocation is time-bounded to approximately 30 seconds, or sooner if your function’s own configured timeout is shorter. In either case, Mail Manager applies the ActionFailurePolicy configured on the rule action. If set to CONTINUE, the pipeline moves to the next action. If set to DROP, the message is discarded. This pipeline uses CONTINUE, so a transient classification failure does not block attachment delivery.
Q: Can I add more classification categories?
Yes. Edit the SYSTEM_PROMPT in the categorizer Lambda function. The function writes whatever categories the model returns to Amazon DynamoDB. No schema changes are needed.
Q: How does the pipeline handle email messages with no attachments?
The AttachmentProcessor detects zero attachment parts, skips extraction, deletes the raw MIME from the landing-zone bucket, and returns success. The EmailCategorizer still classifies the message normally.
Q: What is the maximum attachment size supported?
The traffic policy enforces a 35 MB maximum message size (total MIME payload including all attachments and base64 encoding overhead). Individual attachments are not size-limited beyond this total cap.
Q: Can I deploy this with an AI coding agent?
Yes. The repository includes an AGENTS.md file with machine-readable deployment instructions. Point your AI assistant (Kiro, Claude Code, Amazon Q Developer CLI) at this file and it handles the full deployment without manual intervention.
Q: Is the Bounce action RFC-compliant?
Yes, with one clarification: it is not a live SMTP-transaction rejection. Mail Manager first accepts the message, then the rule set runs. If the Bounce action fires, it generates a non-delivery report (NDR) back to the sender with an RFC 5321-compliant SMTP reply code and an RFC 3463-compliant enhanced status code.
Related posts
- Four new Amazon SES Mail Manager capabilities, explained (TBD).
- Modernize email sending with Amazon SES and Proofpoint SER.
- Announcing Mail Manager for Amazon SES.
About the authors
Security updates for Wednesday
Post Syndicated from jzb original https://lwn.net/Articles/1088476/
Security updates have been issued by AlmaLinux (fence-agents, firefox, frr10, gstreamer1-plugins-good, iscsi-initiator-utils, isns-utils, kernel, kernel-rt, perl-DBI:1.641, postgresql, postgresql:12, and resource-agents), Debian (libgd2, openjdk-25, php7.4, php8.2, and postfix), Fedora (clamav, domoticz, and libidn), Red Hat (delve, edk2, firefox, go-fdo-client, go-fdo-server, grafana, host-metering, ignition, kernel, kernel package, kernel-rt, ldns, libarchive, mariadb10.11, mariadb:10.11, multiple packages, rhc, rhc-worker-playbook, rhc-worker-script, sssd, thunderbird, yggdrasil, and yggdrasil-worker-package-manager), Slackware (expat and openssh), and SUSE (avahi, chromedriver, erlang26, gawk, glib2, go-sendxmpp, google-guest-agent, google-osconfig-agent, gpg2, gstreamer-plugins-bad, gstreamer-plugins-base, helm, ignition, ImageMagick, java-11-openj9, java-17-openj9, java-1_8_0-openj9, java-21-openj9, java-25-openj9, libarchive, libkrun, libpcp-devel, libpng16, libssh, libssh2_org, multipath-tools, net-tools, nmap, openssl-1_1, openssl-3, pcp, perl, python-pip, python-pyasn1, python-urllib3, python3-pip, python313-Django5, runc, samba, snpguest, spice-vdagent, sssd, unbound, wget, wild, wpa_supplicant, xmlrpc-c, and zpaqfranz).
AI is Working in the SOC. So Why are Security Executives More Worried Than Ever?
Post Syndicated from Rapid7 original https://www.rapid7.com/blog/post/ai-report-500-security-leaders-reveal-security-operations-transformation
Something shifted in security operations over the last two years: AI stopped being a pilot program and became the plan.
And if you survey 500 security professionals on whether that’s going well – as Omdia did, commissioned by Rapid7 – you get a remarkable level of consensus: 97% report positive outcomes, 98% say AI reduces alert fatigue, and 95% say it’s helping address staffing shortages.
Those numbers are high enough that the story could stop there; AI is working, everyone agrees. Move on. But there’s a more interesting finding sitting underneath that consensus, and it tells you something important about where security operations is actually headed.
The confidence gap nobody is talking about
While frontline SOC teams report strong confidence in AI, executive security leaders like CISOs, CSOs, and VPs are taking a considerably harder look.
The research found that executive leaders are 1.6 times more likely than operational security managers to be highly concerned about how AI vendors handle their organization’s security data. This isn’t a contradiction of the 97% positive sentiment, but rather a maturity signal.
When AI was experimental, the question was: does it work? Operational teams answered that. Now that AI is embedded in production SOCs, a different question is arriving at the executive level: how do we govern it? Who is accountable when something is wrong? What happens when the model misses a critical threat, and whose job was it to catch that?
These are board-level questions, and the research suggests that the organizations who don’t have good answers are about to feel that gap acutely.
The human-AI balance is the real differentiator
92% of respondents said AI enhances rather than replaces human analysts. But 41% are actively worried about over-reliance, or that teams could start deferring to AI in moments where an experienced analyst would have caught something the model missed.
The best security teams aren’t choosing between AI and human expertise. They’re building operating models where AI handles the volume – triaging, pattern matching, initial investigations – while analysts lead the decisions that require context, creativity, and accountability.
The question for any SOC leader isn’t ‘should we use AI?’ It’s ‘where does AI create capacity without creating new blind spots?’
MDR is being redefined
86% of respondents believe AI-enabled MDR has a clear advantage over traditional approaches. And when asked what they actually expect from an AI-enabled MDR provider, the top answer wasn’t faster detection or higher automation rates. It was transparency.
55% said their top expectation is visibility into how AI decisions are being made. 53% want AI explicitly integrated with human analyst expertise. 52% want regular updates on model performance and accuracy. ‘We use AI’ is not a differentiator anymore. What buyers now want to know is: can you show me exactly how?
What this means for your security strategy
The Omdia research gives security leaders something most AI content doesn’t: an independent benchmark for where the market actually is.
Use it to pressure-test your AI governance posture, to reframe conversations with your board, and to evaluate whether your MDR provider can answer the transparency questions that 55% of buyers are now asking.
The full report covers all of this in detail, including where organizations remain most cautious, what makes AI adoption succeed or stall, and what the next phase of AI-enabled security operations looks like.
Extending AWS Transform custom with MCP Servers for End-to-End Code Modernization
Post Syndicated from Sureshkumar Natarajan original https://aws.amazon.com/blogs/devops/extending-aws-transform-custom-with-mcp-servers-for-end-to-end-code-modernization/
Automating migration pipelines shifts valuable resources toward innovation. In this post, we will help you learn how to extend AWS Transform custom with Model Context Protocol (MCP) server integrations that connect project management, automated testing, and source control.
You will discover how turning a code transformation tool into an automated migration pipeline can take you from a Jira user story to a validated pull request.
Introduction
AWS Transform custom learns organization-specific transformations and executes them consistently across codebases. However, real-world enterprise migrations don’t happen in a vacuum they require coordination across project management (Jira), source control (GitHub), and verification (Playwright) systems.
This post demonstrates how three MCP server integrations close the loop from planning to verification:
- Jira/Confluence MCP Server – The agent retrieves a user story with acceptance criteria and reads Confluence wiki pages containing org-specific migration standards, every transformation then follows institutional patterns.
- GitHub MCP Server – After the transformation completes, the agent automatically creates a pull request with the transformed code, proper commit messages, and links back to the Jira ticket.
- Playwright MCP Server – The agent validates the transformation by launching the migrated application in a headless browser and verifying UI functionality, catching regressions before any human reviews the PR.
Together, these integrations turn AWS Transform custom from a code transformation tool into an automated migration pipeline.
Solution Overview
Use Case: Migrate an AngularJS 1.4.7 Weather Dashboard application to React 19, orchestrated end-to-end through MCP integrations.
Source Repository: weather-dashboard-angular
Architecture
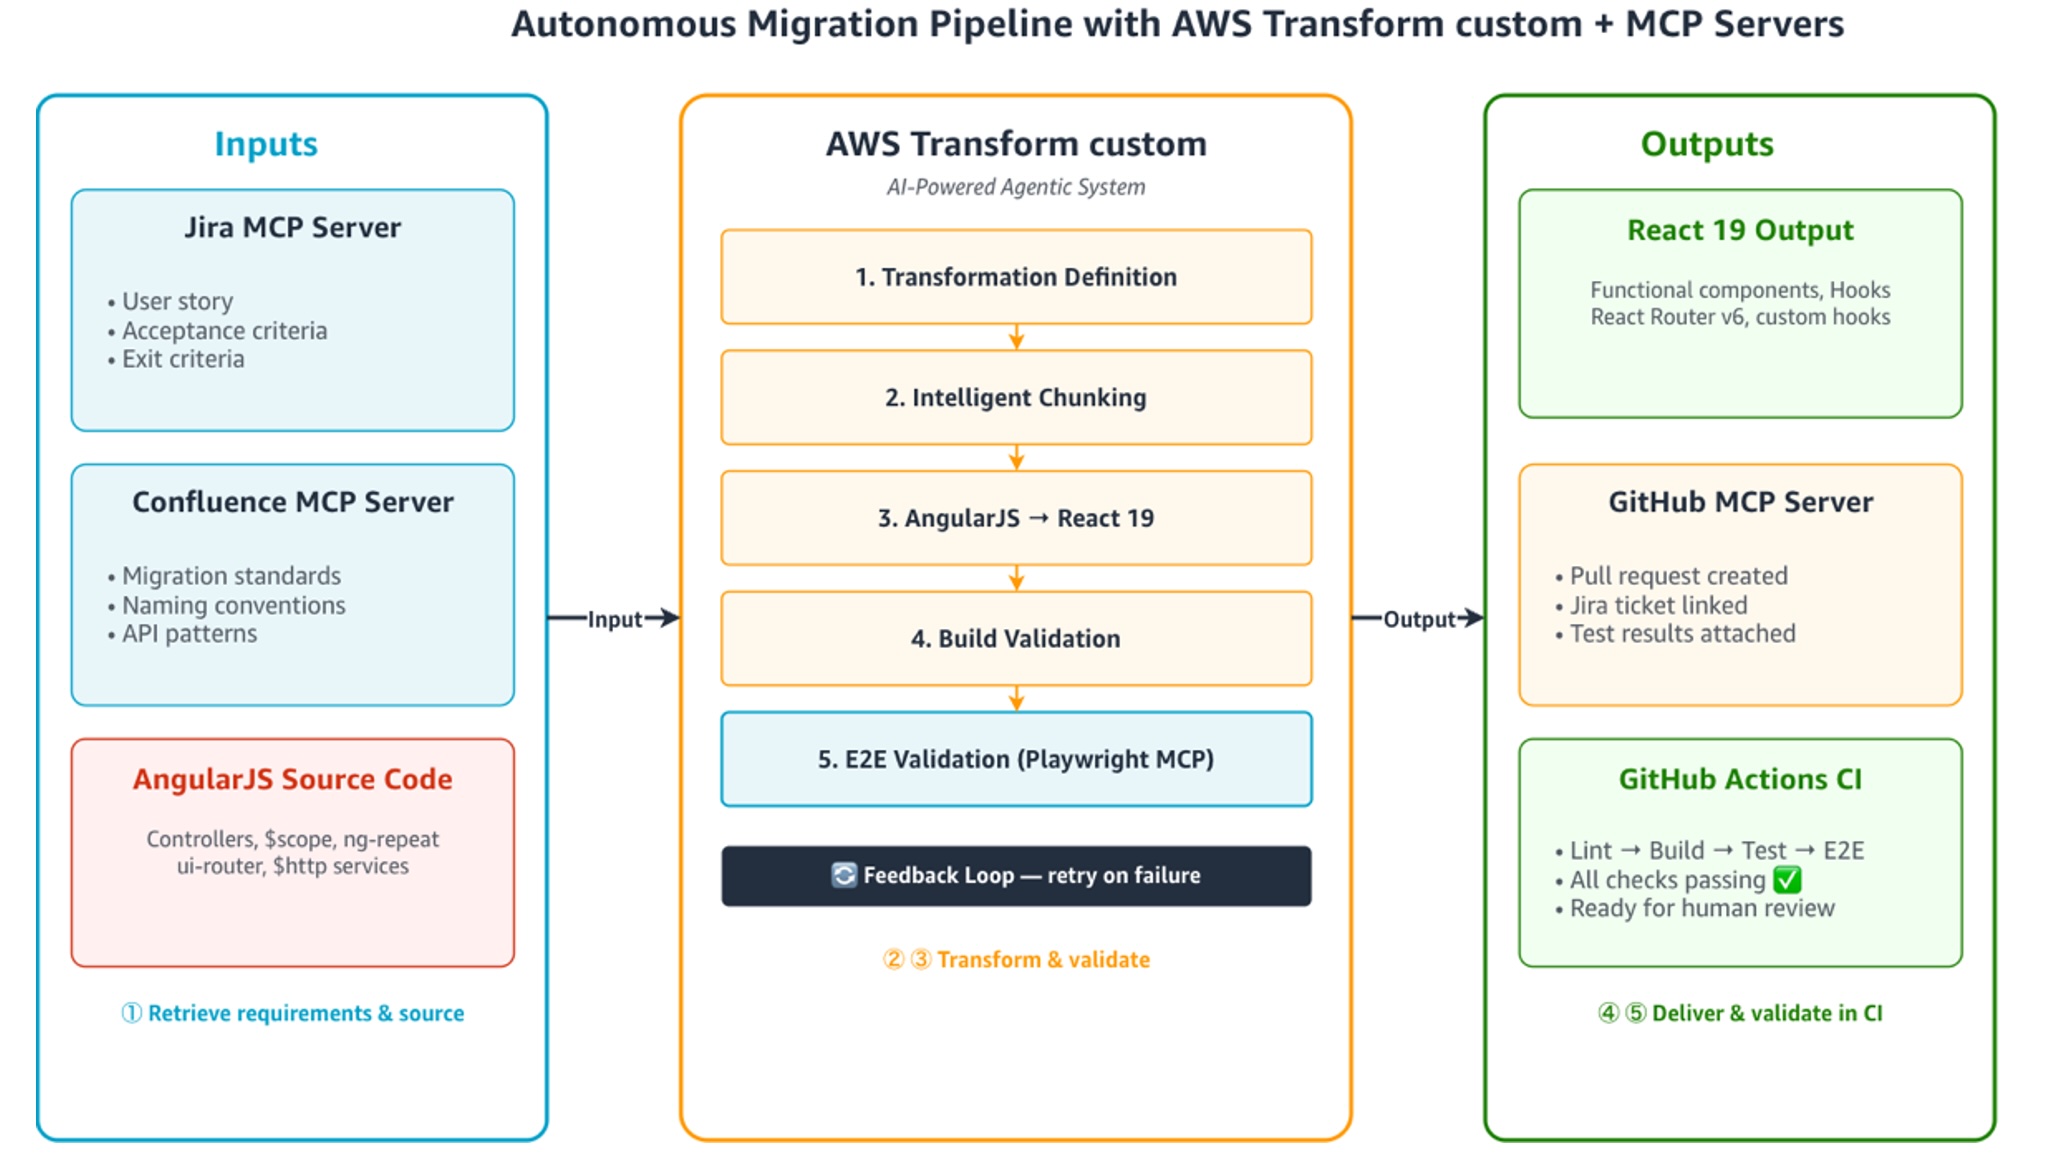
Figure 1: Autonomous migration pipeline architecture with MCP servers
The pipeline follows this flow (Figure 1):
- Jira/Confluence MCP Server – retrieves the user story, acceptance criteria, and org-specific migration standards from Confluence
- AWS Transform custom – uses these as context to execute the AngularJS → React 19 transformation
- Playwright MCP Server – validates the React output against acceptance criteria
- GitHub MCP Server – creates a PR with the transformed code, test results, and Jira links
- GitHub Actions – runs the CI pipeline to validate the build and tests on the PR
Prerequisites
Complete the following before you begin:
- AWS account with permissions for AWS Transform custom
- AWS Transform CLI installed and configured
- Node.js v20+
- Git initialized repository
- Jira/Confluence instance with API access (Atlassian Cloud)
- GitHub repository with write access
- Playwright installed (npm install -D @playwright/test)
- Docker Desktop installed and running (for Playwright MCP browser validation)
MCP server dependencies
| Server | Package | Purpose |
|---|---|---|
| Jira/Confluence | mcp-atlassian |
User stories, wiki standards |
| GitHub | @modelcontextprotocol/server-github |
Branch, commit, PR creation |
| Playwright | @playwright/mcp |
Browser-based UI validation |
The sample application
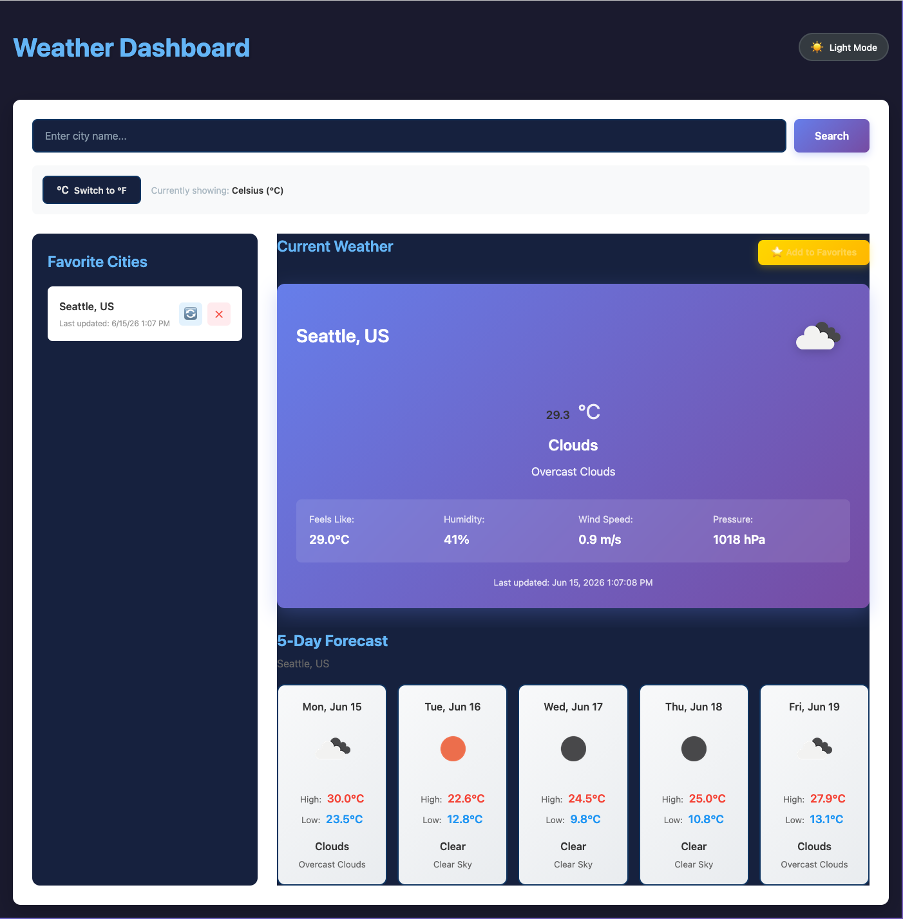
Figure 2: AngularJS Weather Dashboard application
This walkthrough uses an AngularJS 1.4.7 Weather Dashboard application with the following features (Figure 2):
- City weather search using OpenWeatherMap API
- 5-day forecast display
- Favorites management with local storage persistence
- Dark mode / light mode toggle
- Search history with autocomplete
- Temperature unit switching (Celsius/Fahrenheit)
- Responsive design and WCAG AA(Web Content Accessibility Guidelines) accessibility
- Playwright E2E(End to End) tests validate UI functionality
This application demonstrates real-world migration challenges including component state management, service injection patterns, event broadcasting, and local Storage persistence while remaining compact enough for a post walkthrough.
Step 1: Configure MCP servers for AWS Transform custom
AWS Transform custom reads MCP server configurations from ~/.aws/atx/mcp.json. Create this file with the three servers
{
"mcpServers": {
    "mcp-atlassian": {
      "command": "uvx",
      "args": ["mcp-atlassian@latest"],
      "env": {
        "JIRA_URL": "https://your-instance.atlassian.net",
        "JIRA_USERNAME": "[email protected]",
        "JIRA_API_TOKEN": "${JIRA_API_TOKEN}",
        "CONFLUENCE_URL": "https://your-instance.atlassian.net/wiki",
        "CONFLUENCE_USERNAME": "[email protected]",
        "CONFLUENCE_API_TOKEN": "${CONFLUENCE_API_TOKEN}"
      }
    },
    "playwright": {
      "url": "http://localhost:8931/mcp"
    },
    "github": {
      "command": "npx",
      "args": ["-y", "@modelcontextprotocol/server-github"],
      "env": {
        "GITHUB_PERSONAL_ACCESS_TOKEN": "${GITHUB_PAT}"
      }
    }
  }
}
Pro tip: The Playwright MCP server uses HTTP transport (“url”) rather than stdio (“command”). AWS Transform custom connects to a Docker-hosted Playwright browser that reaches your locally-served application. Step 4 explains the Docker setup.
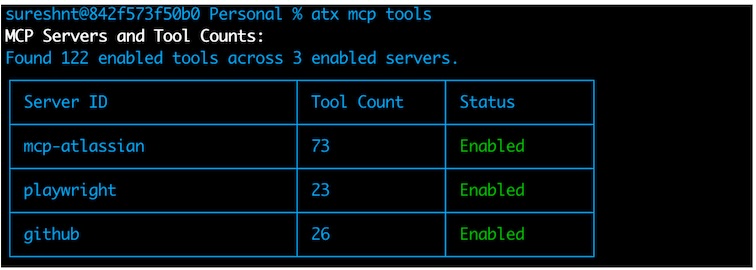
Verify the configuration- run this in the terminal
atx mcp tools
You should see three servers listed: mcp-atlassian (73 tools), playwright (23 tools), and github (26 tools).
Step 2: Jira/Confluence MCP server — sourcing requirements and standards
What this integration does
The Jira/Confluence MCP Server provides AWS Transform custom with structured requirements and organizational context. Rather than a developer manually describing what needs to happen, the agent pulls:
- User Story – The migration scope and acceptance criteria
- Confluence Wiki – Org-specific standards and migration best practices
- Status Updates – Comments back to the ticket as the pipeline progresses
Create the Jira user story
Create a story in your Jira project with acceptance criteria that define the migration scope.
Key fields:
Title: Migrate AngularJS Weather Dashboard to React 19 (Figure 3)
Type: Story
Priority: High
Acceptance Criteria: Check-boxes for each migration requirement (components converted, hooks used, tests passing, build succeeds)
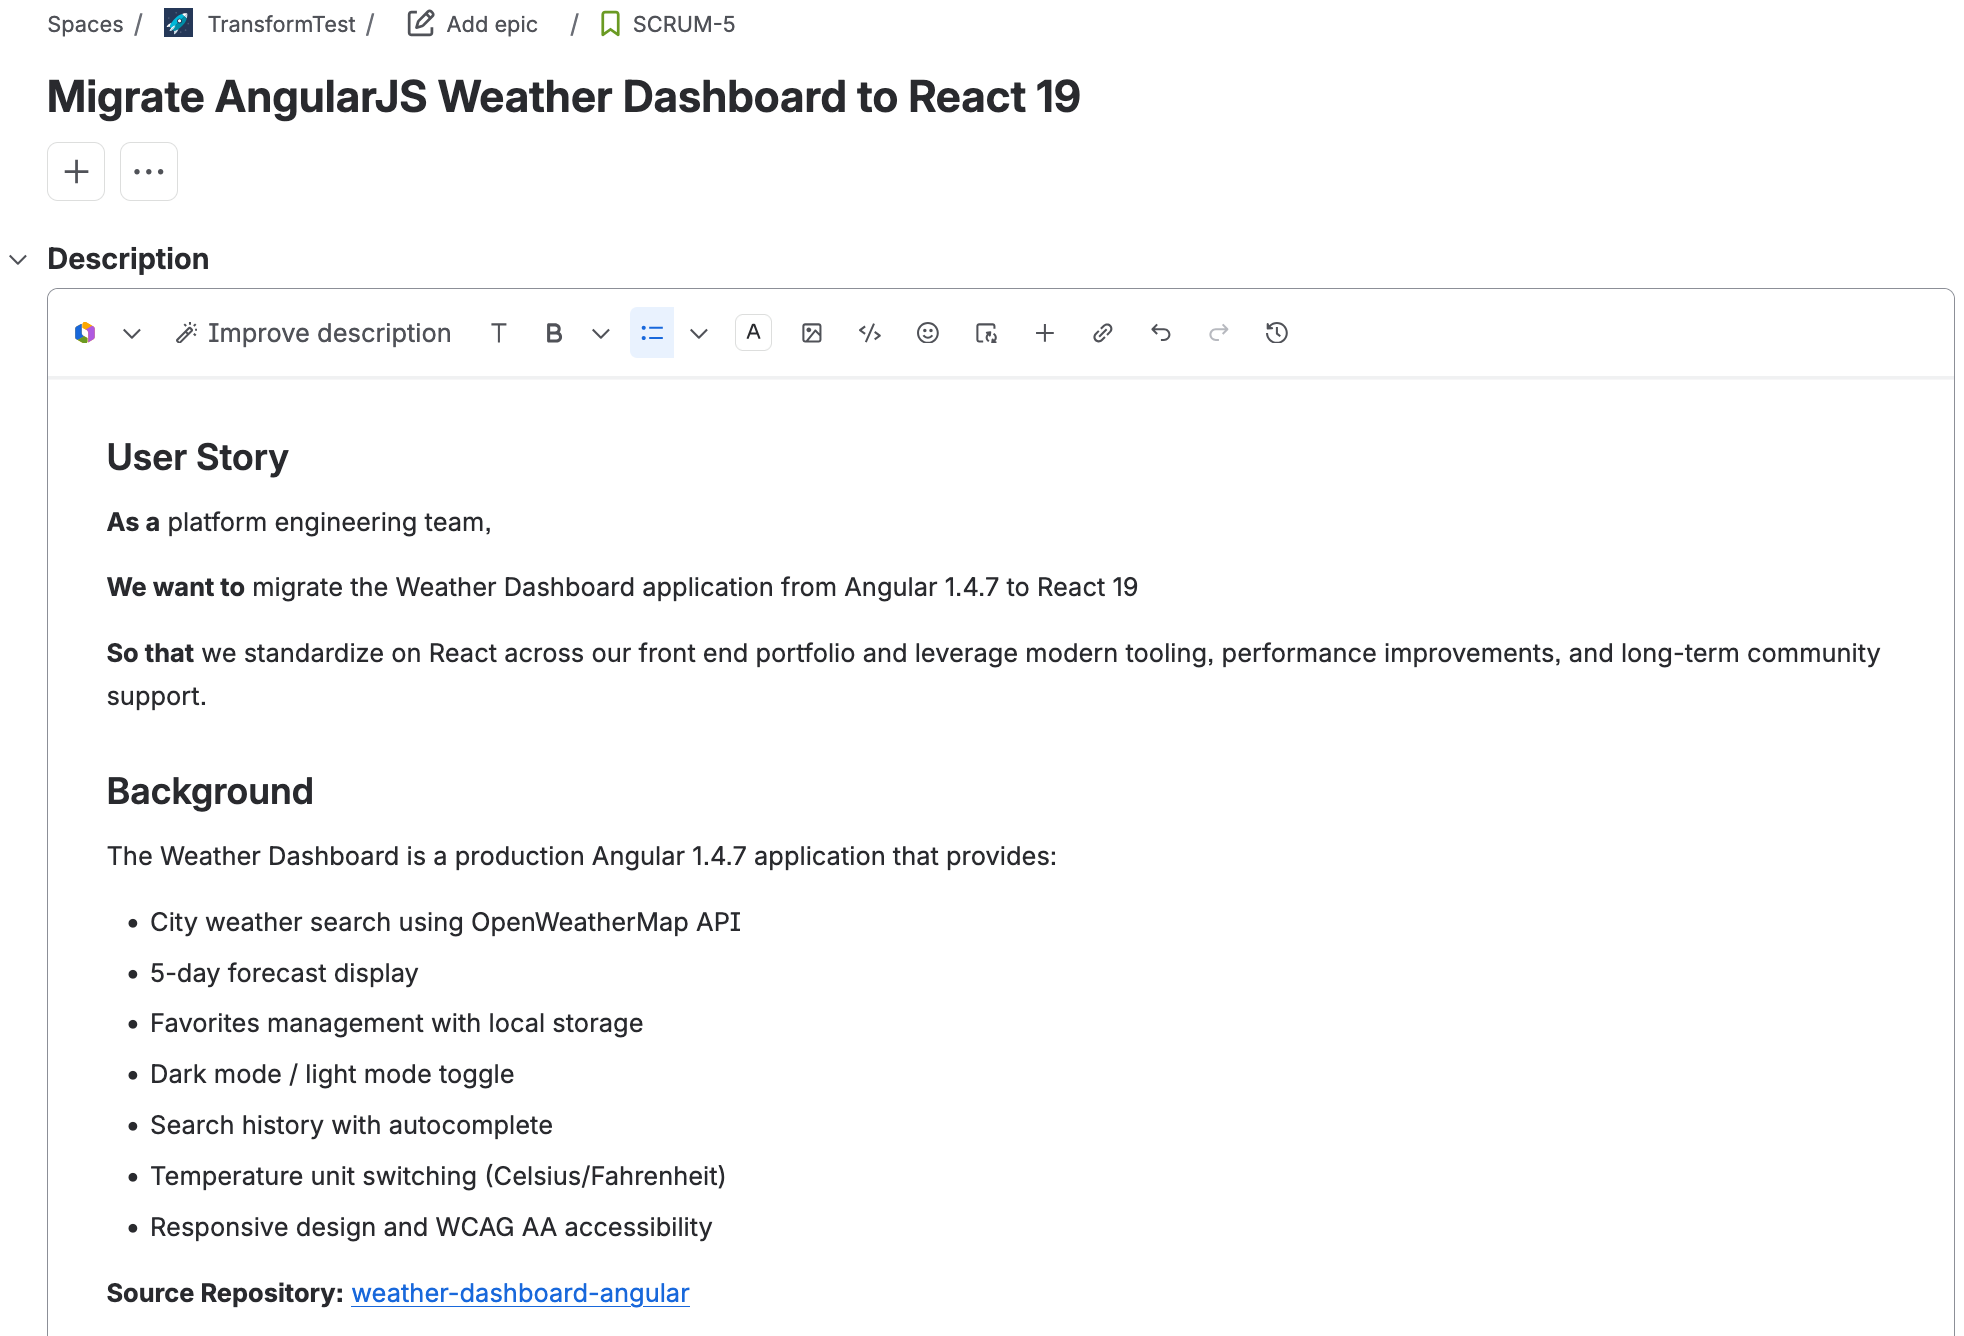
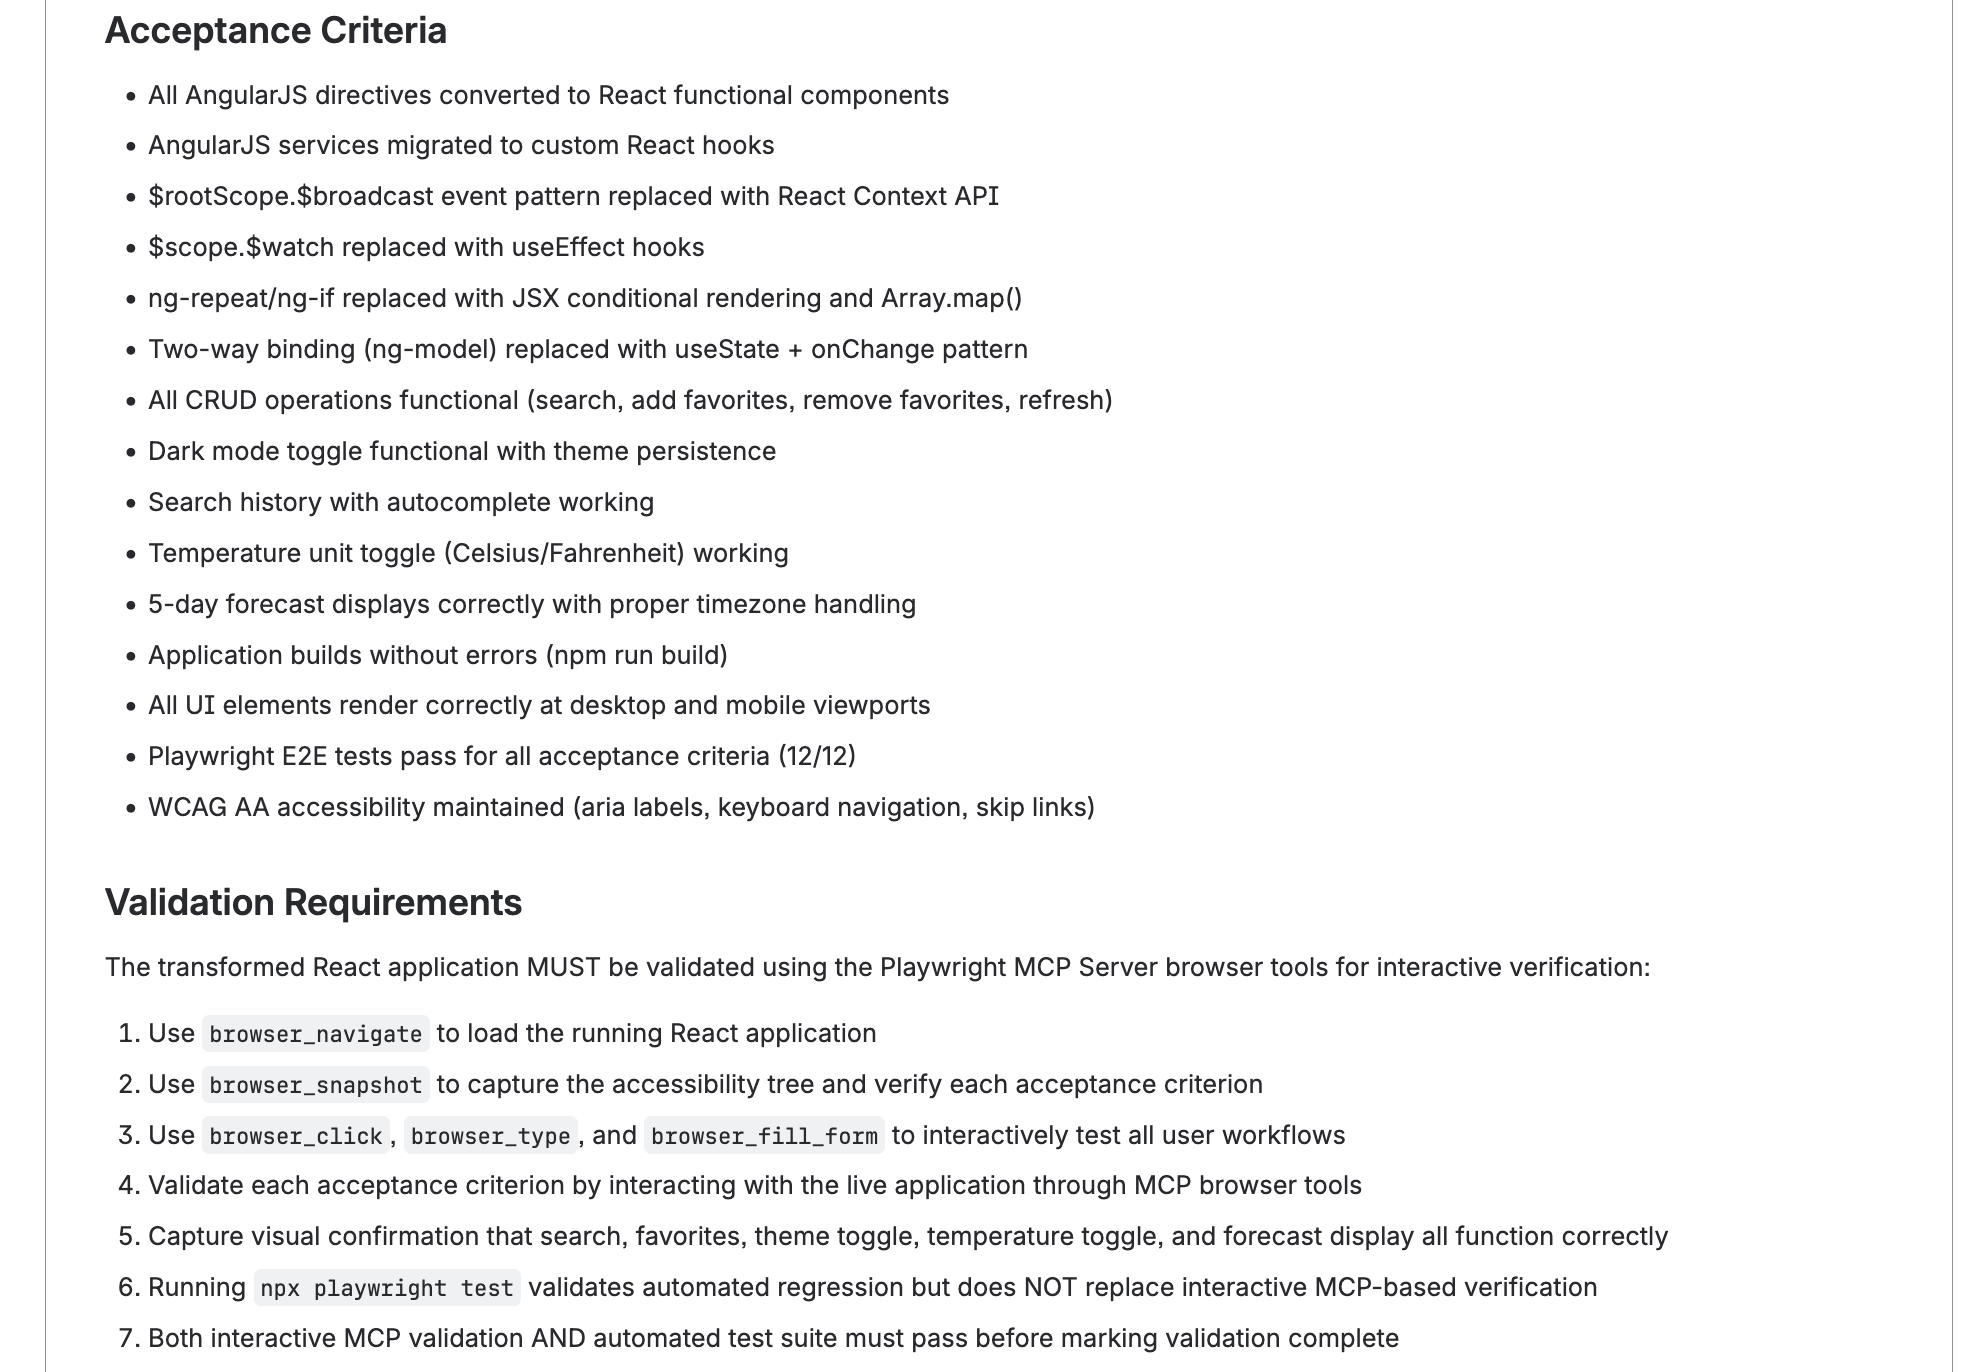
Figure 3: Jira user story with migration acceptance criteria
Create the Confluence wiki page
Create a Confluence page with your org-specific migration standards. Include:
- Pattern mappings (AngularJS directives → React components, services → hooks)
- File structure conventions
- Naming conventions
- Quality gates (build, tests, accessibility requirements)
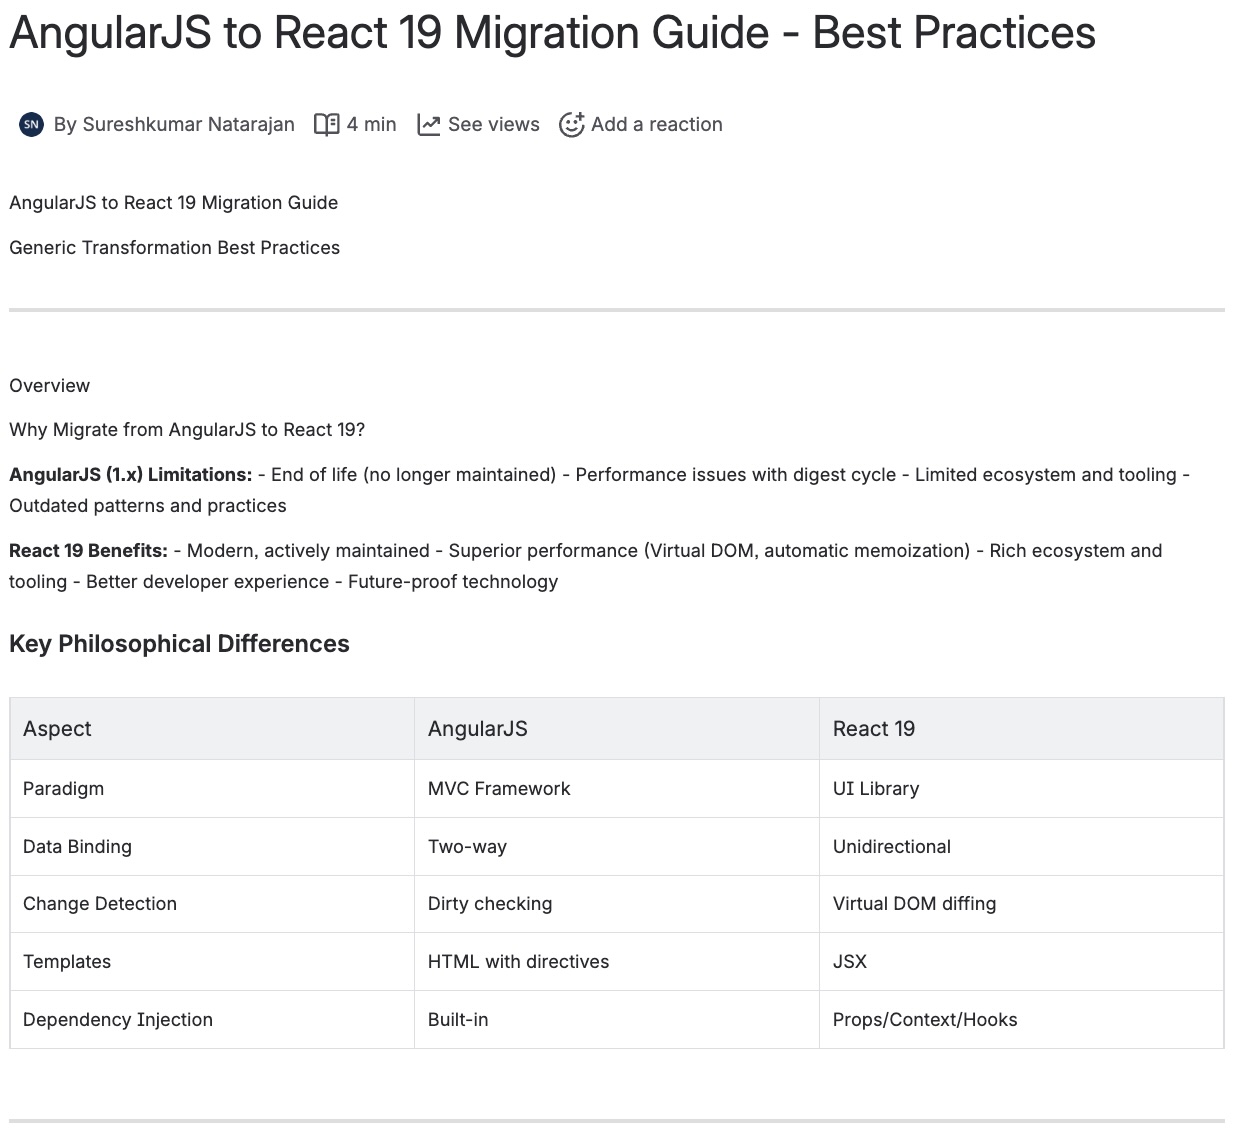
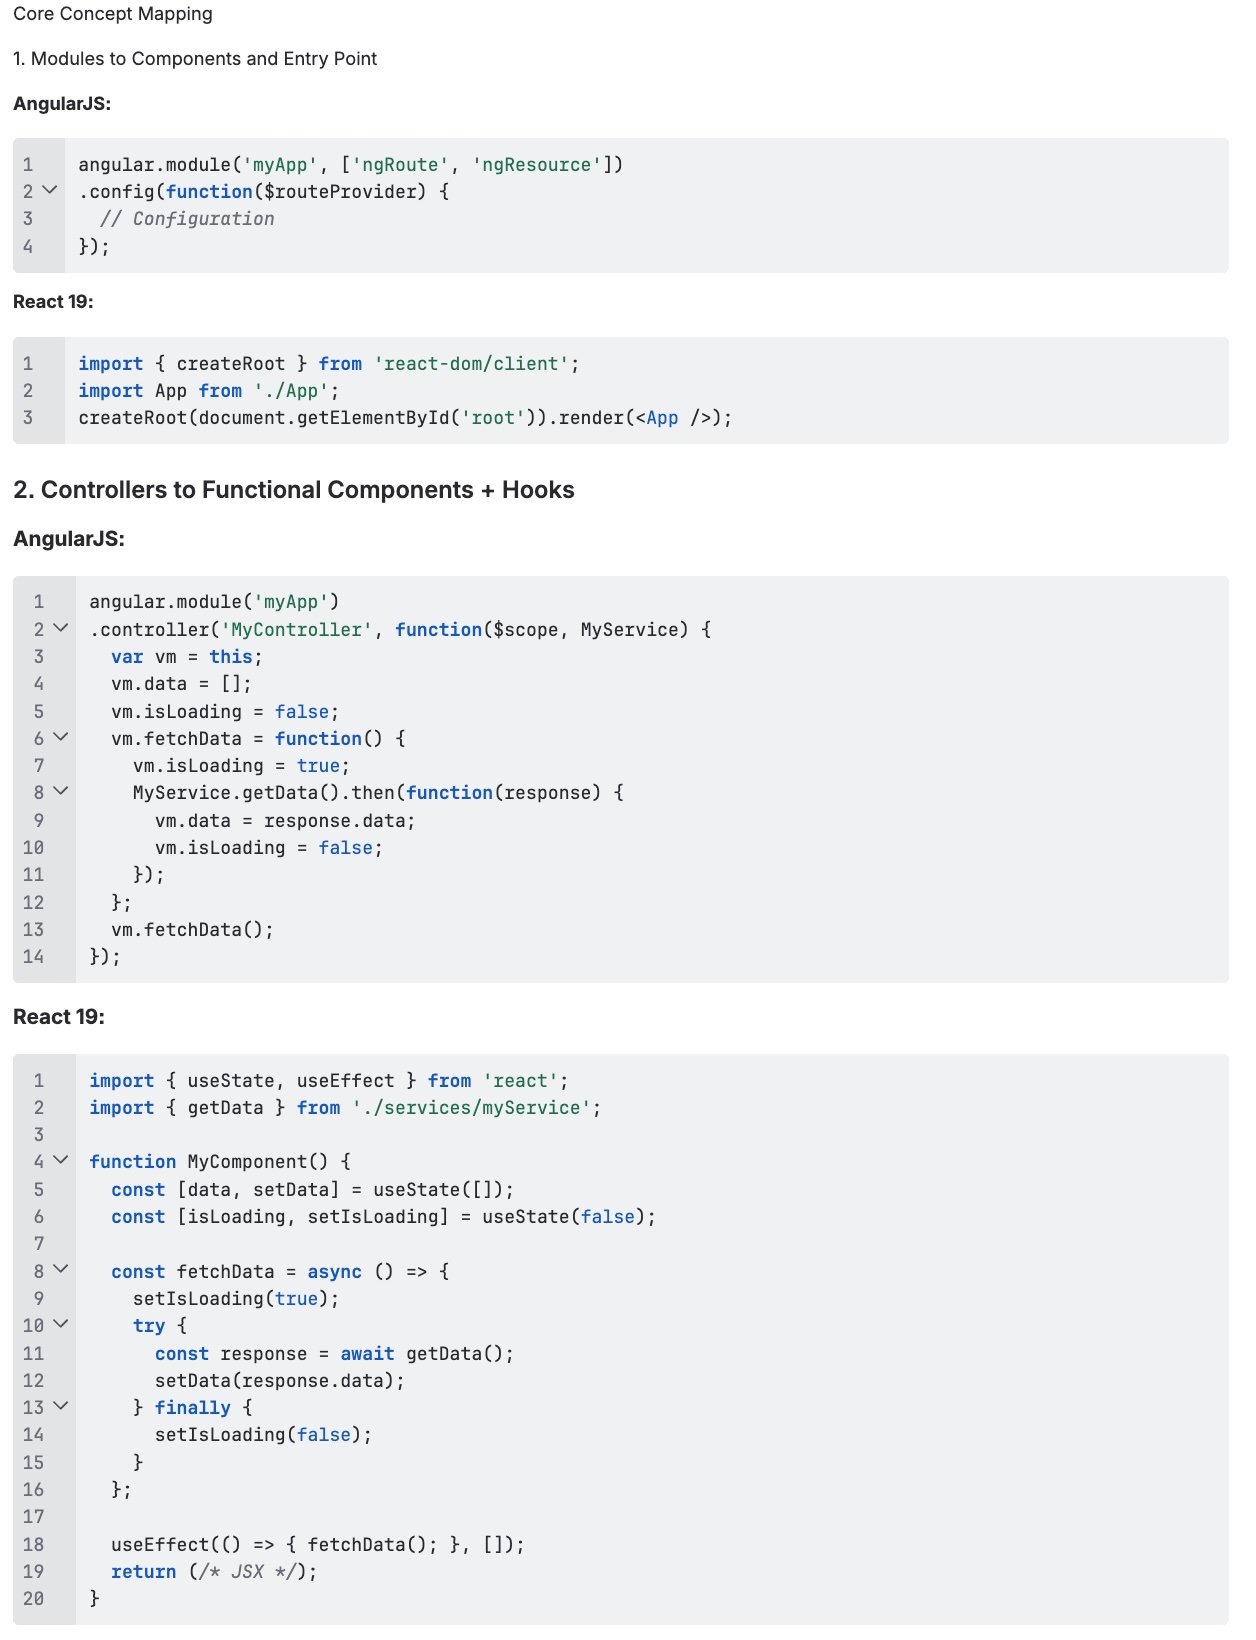
Figure 4: Confluence migration guide with pattern mapping table
How the agent uses these sources
During the transformation, agent invokes:
- jira_get_issue(“SCRUM-5”) → Retrieves story and acceptance criteria
- confluence_get_page(“622593”) → Retrieves org-specific migration standards
- jira_add_comment(“SCRUM-5”, “Transformation started…”) → Updates stakeholders
The acceptance criteria become the exit criteria for the transformation, and the wiki references guide code generation patterns.
Step 3: AWS Transform custom — AngularJS to React 19
Create the additional context
Create a config.json file that instructs the agent to use the MCP integrations:
{
  "codeRepositoryPath": "./weather-dashboard-angular",
  "transformationName": "AngularJS-to-React19-WeatherDashboard",
  "buildCommand": "npm run build",
  "additionalPlanContext": "The target framework is React 19 with functional components and hooks.\nUse Vite as the build tool.\n\nBefore starting the transformation:\n1. Connect to Jira via the MCP server and read user story SCRUM-5 to retrieve acceptance criteria and migration scope.\n2. Connect to Confluence via the MCP server and read the migration standards and best practices pages from the Software Development space.\n\nAfter transformation completes:\n1. Build the React app: cd react-app && npm run build\n2. Run the Playwright E2E tests: cd react-app && npx playwright test (all 12 must pass)\n3. You must have a preview server already running externally on port 4173 serving the built files. Do NOT start any server or run any shell command to start a server. Use the Playwright MCP browser tools IMMEDIATELY to validate the app interactively:\n   - browser_navigate to http://host.docker.internal:4173 (MUST use host.docker.internal, NOT localhost or 127.0.0.1)\n   - browser_snapshot to capture the accessibility tree and verify the page renders\n   - browser_type to enter a city name in the search input\n   - browser_click to click the search button, temperature toggle, and dark mode toggle\n   - Verify: app loads without errors, search input present, temperature toggle visible, dark mode works, favorites section renders, empty state displays, accessibility attributes present\n4. Use the GitHub MCP server to create a pull request with the transformation summary and test results, linking back to Jira ticket SCRUM-5.\n5. Connect to Jira via the MCP server and update ticket SCRUM-5 with the PR link and transition to In Review status.",
  "validationCommands": "npm run build"
}
Set up the playwright MCP Docker container
The Playwright MCP browser runs inside a Docker container. The container connects to your Mac’s locally-served application via host.docker.internal.
Start the Docker container
docker run -d -i --rm --init \
  --name mcp-playwright \
  -p 8931:8931 \
  --add-host=host.docker.internal:host-gateway \
  --entrypoint node \
  mcr.microsoft.com/playwright/mcp \
  /app/cli.js --headless --browser chromium --no-sandbox \
  --port 8931 --host 0.0.0.0
Install browsers inside the container:
Set up the pre-start server script
ATX’s shell tool cannot properly background long-running processes any server start command blocks for up to 900 seconds, causing the MCP browser session to expire. To solve this, run a helper script that watches for the build output and serves it automatically:
#!/bin/bash
# serve-for-atx.sh — Run this in a separate terminal BEFORE launching ATX
cd /path/to/weather-dashboard-angular
echo " Waiting for react-app/dist/index.html to be created by ATX build..."
while [ ! -f "./react-app/dist/index.html" ]; do
sleep 2
done
echo " Found! Serving on http://0.0.0.0:4173"
cd react-app/dist && python3 -m http.server 4173 --bind 0.0.0.0
This script
- Watches for ATX to complete the build (creates react-app/dist/index.html)
- Automatically starts serving the built files on port 4173
- Binds to 0.0.0.0 so the Docker container reaches it via host.docker.internal
Execute the transformation
Open two terminals
Terminal 1 — Start the pre-serve script
chmod +x serve-for-atx.sh./serve-for-atx.shTerminal 2 — Run the transformation
atx custom def exec \
  -n "AWS/early-access-angular-to-react-migration" \
  -p ./weather-dashboard-angular \
  -c "npm run build" \
  -g file://./config.json \
  --trust-all-tools \
  --non-interactive
What happens during execution
The agent:
- Reads Jira – Retrieves acceptance criteria from the user story
- Reads Confluence – Loads migration standards and pattern mappings
- Plans – Analyzes AngularJS component tree and identifies dependencies
- Transforms – Converts in dependency order: Constants/utilities → Services/hooks → Components → App shell
- Validates build – Runs npm run build after transformation
- Runs E2E tests – Executes npx playwright test (12 tests)
- Validates interactively – Uses Playwright MCP browser to navigate, click, type, and verify the running app
- Creates PR – Uses GitHub MCP server
- Updates Jira – Transitions ticket to “In Review” with PR link
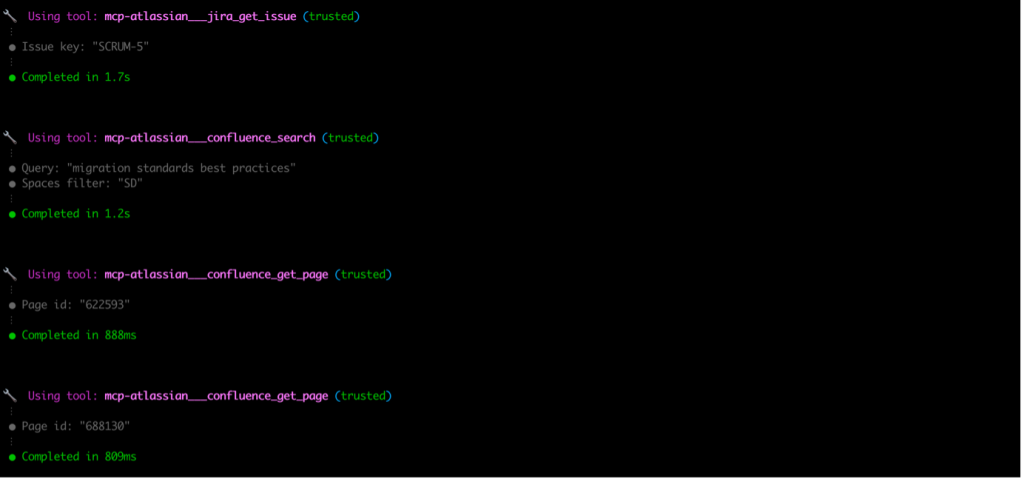
*Figure 5: MCP tool calls for Jira and Confluence context gathering*
Key transformation mappings
| AngularJS Pattern | React 19 Equivalent |
|---|---|
| Directive with template | Functional component with JSX |
| $scope / Controller | useState hook |
| $scope.$watch | useEffect with dependency array |
| $rootScope.$broadcast / $on | React Context API + useContext |
| Service with DI | Custom hook or service module |
| ng-repeat / ng-if | Array.map() / conditional rendering |
| ng-model (two-way binding) | useState + onChange handler |
| ng-class | Conditional className |
Step 4: Playwright MCP server — validating the output
What this integration does
The Playwright MCP Server launches the transformed React application in a headless browser and validates UI functionality against the acceptance criteria. It catches functional regressions before any human reviews the code.
How the agent uses Playwright MCP
After the build succeeds and the E2E test suite passes, the agent calls the Playwright MCP browser tools to interactively validate the application (Figure 6):
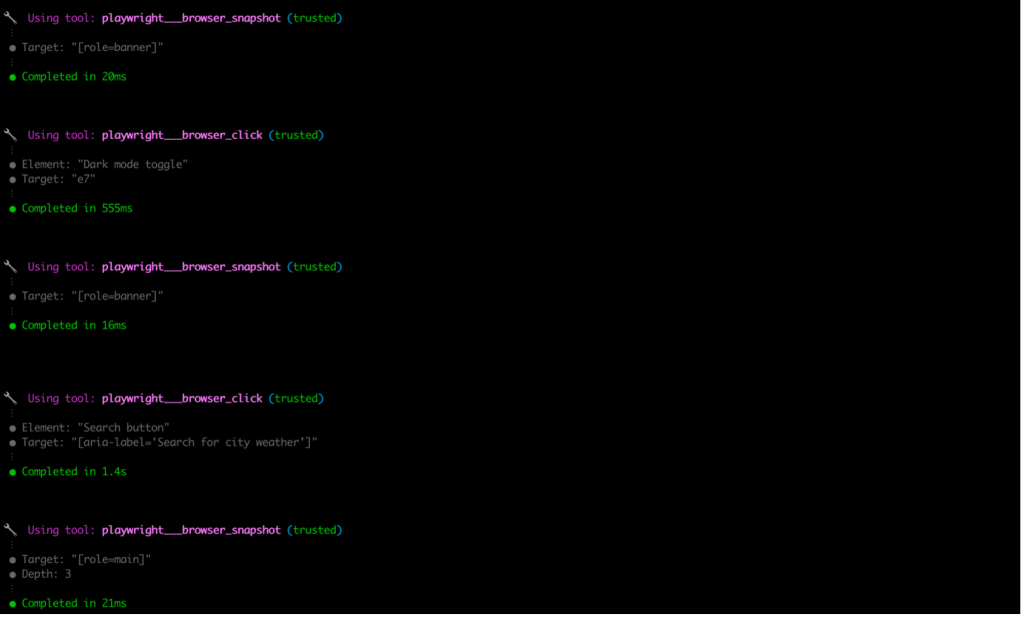
Figure 6: Playwright MCP tool calls for end-to-end validation
- browser_navigate(“http://host.docker.internal:4173”) – Loads the app
- browser_snapshot() – Captures the accessibility tree to verify structure
- browser_type(target, “London”) – Types a city name in search
- browser_click(target) – Clicks search, toggles, and buttons
- browser_snapshot() -Verifies results rendered correctly
Why Docker hosts the browser
The Docker container solves three problems:
- Shell timeout — ATX’s shell tool waits up to 900 seconds for background processes, causing MCP session expiry. The Docker container runs independently.
- Network isolation — The Docker-hosted browser connects to ATX via HTTP transport on port 8931, keeping the session alive regardless of shell commands.
- Host access — The browser reaches the locally-served app via host.docker.internal, which Docker resolves to the host machine’s IP.
Validation criteria
| Test | What It Validates |
|---|---|
| AC1 | Application renders without console errors |
| AC2 | City search returns and displays weather data |
| AC3 | 5-day forecast displays with correct dates |
| AC4 | Dark mode toggle switches theme |
| AC5 | Temperature unit toggle works |
| AC6 | Favorites can be added and removed |
| AC7 | Search history autocomplete appears |
| AC8 | Responsive layout at mobile viewport |
| AC9 | Accessibility — ARIA labels present |
| AC10 | Skip to main content link exists |
The feedback loop
If Playwright tests fail, the pipeline iterates:
- Playwright reports which acceptance criteria failed
- AWS Transform custom reads the failure output
- The agent corrects the transformation and re-runs build validation
- Playwright re-validates
- Only when all tests pass does the agent create the PR via GitHub MCP
This closed-loop approach means the PR already has passing tests before any human reviewer sees it..
Step 5: GitHub MCP server — creating the pull request
What this integration does
After the transformation passes validation, the GitHub MCP Server automatically creates a pull request with (Figure 7):
- A feature branch with descriptive naming
- Proper commit messages referencing the Jira ticket
- PR body with transformation summary and test results
- Links back to the original Jira story
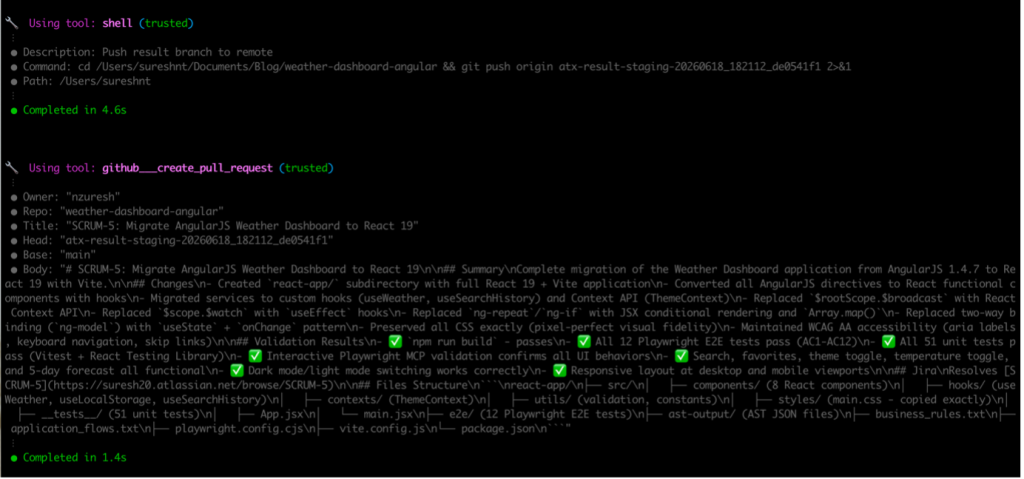
Figure 7: Git push and pull request creation with validation results
CI pipeline validation
A GitHub Actions workflow triggers automatically on the PR to independently verify the transformation (Figure 8):
name: Validate Migration
on:
  pull_request:
    branches: [main]
jobs:
  build-and-test:
    runs-on: ubuntu-latest
    steps:
      - uses: actions/checkout@v4
      - uses: actions/setup-node@v4
        with:
          node-version: '20'
      - run: cd react-app && npm ci
      - run: cd react-app && npm run build
      - run: cd react-app && npx playwright install --with-deps chromium
      - run: cd react-app && npx playwright test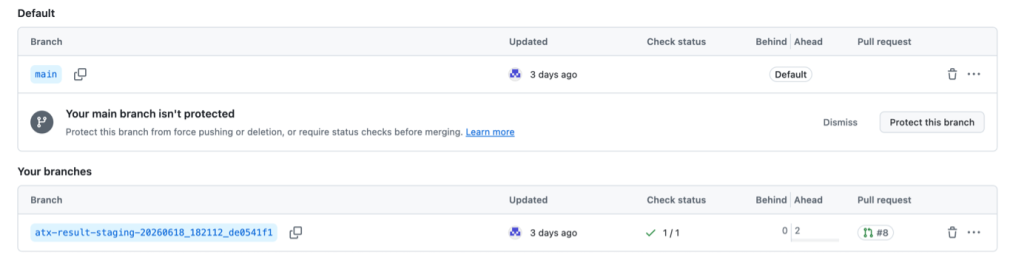
Figure 8: GitHub repository with result staging branch and passing CI checks
Post-PR actions
The agent also:
- Updates the Jira ticket status to “In Review”
- Adds a comment with the PR link and test results
- Documents the validation evidence in the PR description
Results
AWS Transform custom completed the transformation successfully. You can verify that the build passes, all E2E tests pass, all unit tests pass, and the interactive browser validation confirms full functionality. AWS Transform custom successfully migrated components and services from AngularJS directives to React components and custom hooks. The automated pipeline handled the transformation steps. Results may vary based on project complexity, codebase structure, and other factors.
Cleanup
Remove transformation session artifacts
rm -rf ~/.aws/atx/custom/<conversation-id>Stop the Docker container
docker stop mcp-playwrightKill the pre-serve script (Ctrl+C in Terminal 1)Conclusion
In this post, you learned how to extend AWS Transform custom with MCP server integrations that connect project management (Jira/Confluence), automated testing (Playwright), and source control (GitHub) into an automated migration pipeline.
By combining these three integrations with AWS Transform custom’s automated transformation capabilities, you can:
- Source requirements automatically from Jira user stories and organizational Confluence wikis
- Validate transformations against acceptance criteria using browser-based E2E tests and interactive MCP browser verification
- Deliver results as validated pull requests with full traceability back to the original ticket
- Run CI pipelines that independently verify the transformation before human review
This approach eliminates the manual coordination overhead that typically slows enterprise migrations — every transformation meets organizational standards and passes functional validation before human review.
The Model Context Protocol (MCP) provides an open, extensible integration layer — meaning you can swap Jira for Linear, GitHub for GitLab, or add additional MCP servers (Slack notifications, Confluence documentation updates, SonarQube quality gates) to further automate your modernization workflows.
Getting started
Ready to extend AWS Transform custom with MCP integrations? Use the following resources to help you get started:
• AWS Transform custom Getting Started Guide
• Model Context Protocol (MCP) specification
• Source application — weather-dashboard-angular
• Introducing AWS Transform custom (AWS News Blog)
About the Authors
Going Boldly: Space Shuttle Enterprise
Post Syndicated from The History Guy: History Deserves to Be Remembered original https://www.youtube.com/watch?v=w5noPC3PZqA
Honor Robot Phone Review incoming… what do you want tested??
Post Syndicated from Matt Granger original https://www.youtube.com/shorts/IZmEL8CCHxA
Windows Monitoring with Zabbix
Post Syndicated from Arturs Lontons original https://blog.zabbix.com/windows-monitoring-with-zabbix/33053/
Windows environments provide a variety of approaches for monitoring both on the OS and the application level. The article will cover utilizing Zabbix agent on Windows to collect and discover OS and application level metrics from a variety of Windows-supported sources.
Deploying Zabbix agent on Windows
Zabbix agent can be deployed either by downloading the official MSI packages or by installing the Zabbix agent from binary files. Both Zabbix agent and Zabbix agent 2 are available to install via these methods. Generally speaking, Zabbix agent 2 is a more feature-rich version than the regular Zabbix agent. On the other hand, if you do encounter any compatibility issues with Zabbix agent 2 – the classic Zabbix agent can be used instead.
During the MSI install the following Zabbix agent configuration parameters can be defined:
- Zabbix server address
- Zabbix agent PSK encryption settings
- Direction of the connection (Active/Passive checks)
- Optional install of Zabbix sender and Zabbix get tools
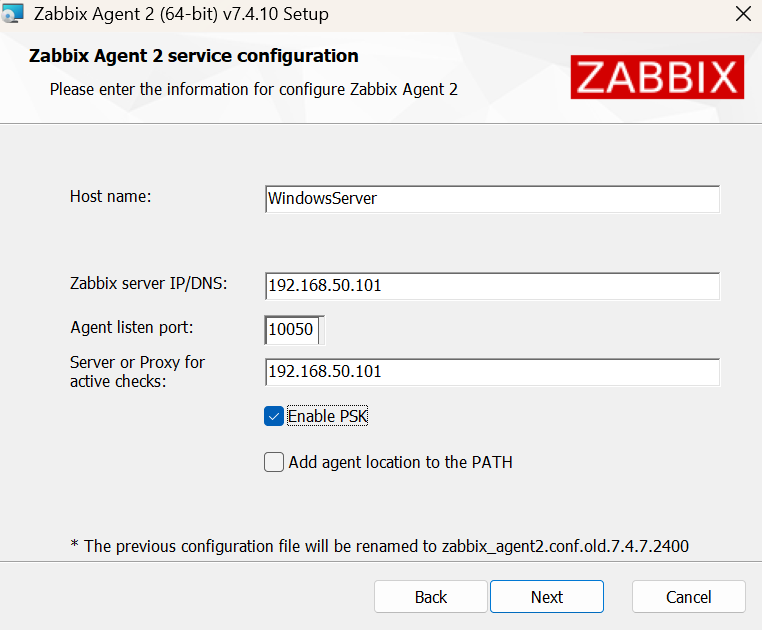
Installing Zabbix agent from binary file is also a fast and simple process:
- Download the Zabbix agent binary files
- Adjust the Zabbix agent configuration file to fit your requirements
- Run the agent binary file with the —install command
- Use the –config command to point the Zabbix agent at the agent configuration file
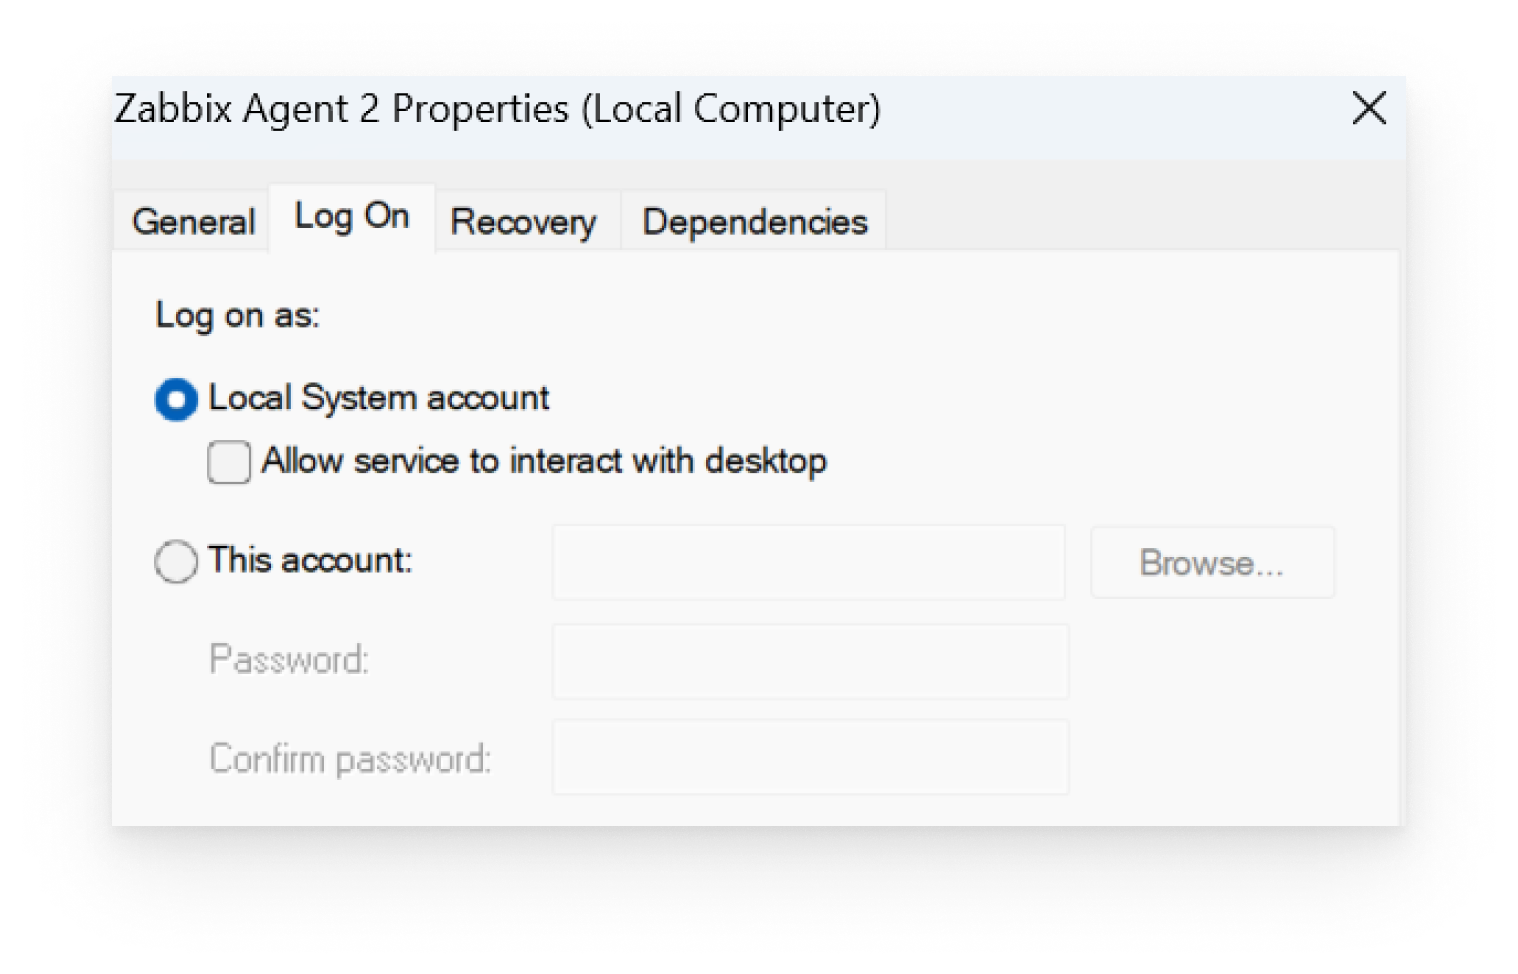
As a result of both approaches, Zabbix agent will be installed and run as a Windows service. By default the agent runs under the Local System account (Having unrestricted access to local system resources) – this can and should be adjusted based on your organizational security policies.
Additional Zabbix agent 2 plugins
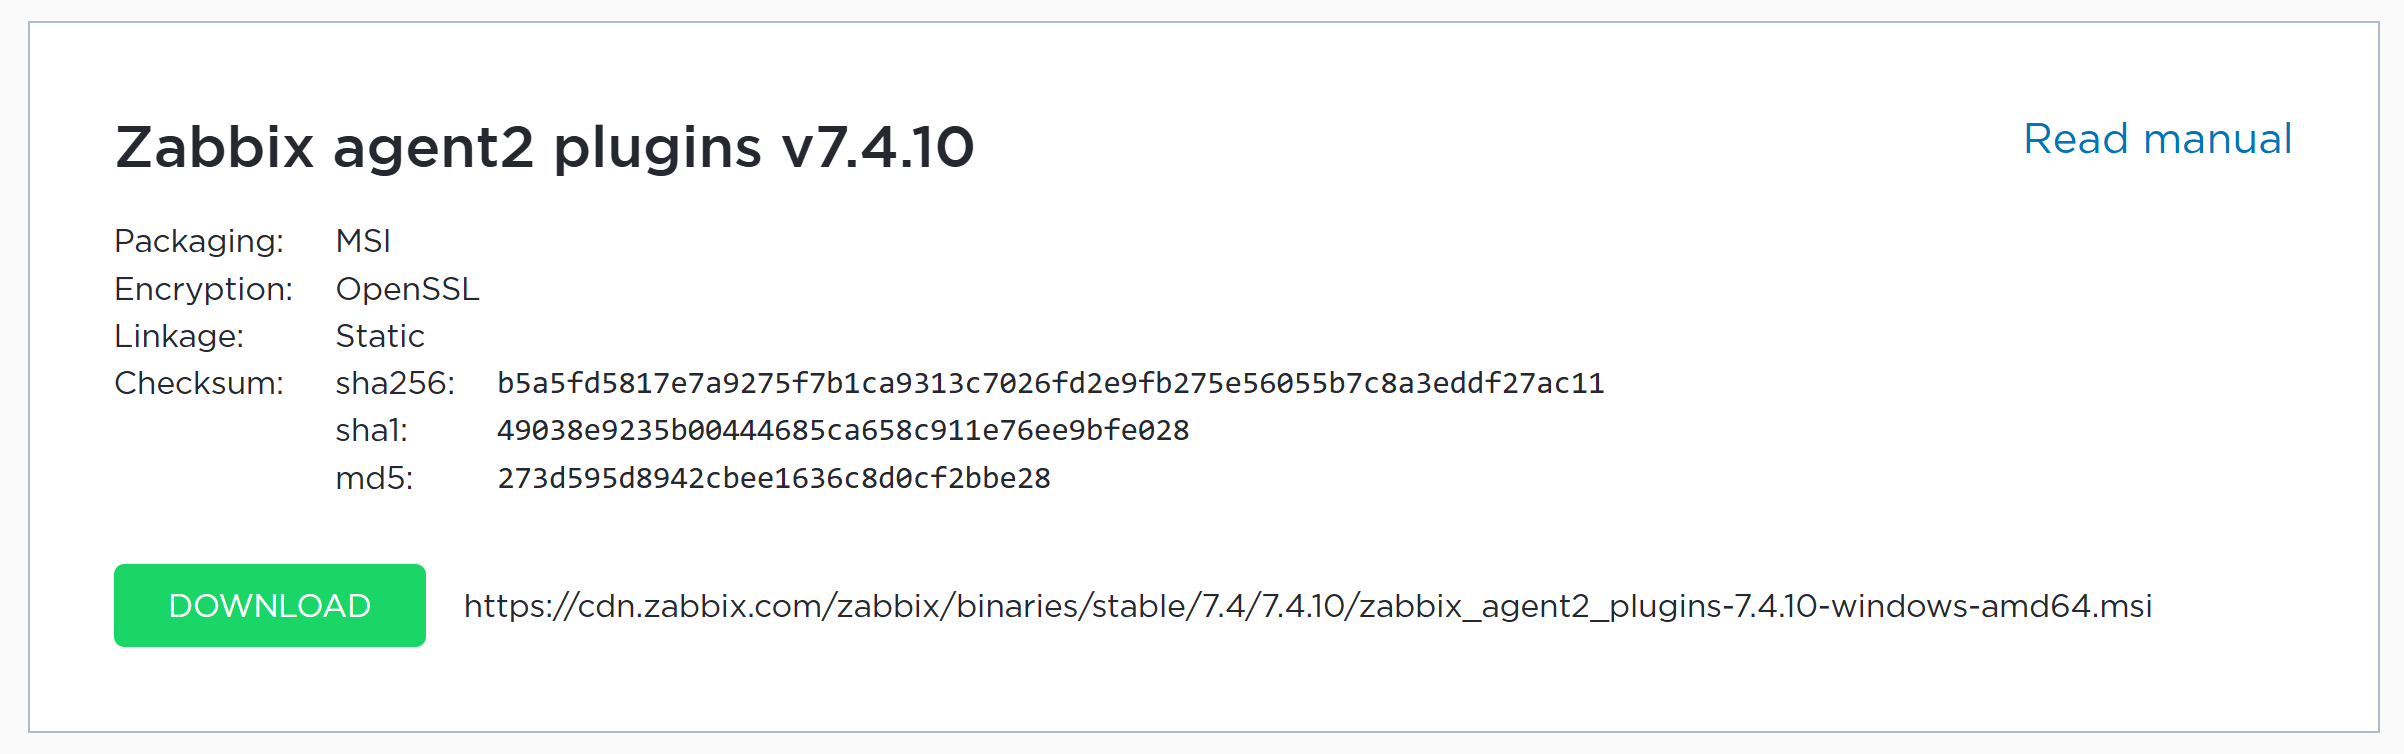
Multiple Zabbix agent 2 plugins are provided in a separate package, which can also be installed via the MSI installer. The following plugins have to be installed via the dedicated Zabbix agent 2 plugins package:
- Ember plus
- MongoDB
- MSSQL
- NVIDIA GPU
- PostgreSQL
Configuring a Windows host in Zabbix
The quickest way to get started once the agent is deployed and configured, is to create a Windows host in Zabbix and use one of the official Zabbix templates on this host. The host can be either created manually or by using the Host Wizard for a more guided experience (Host Wizard is available starting from Zabbix 7.4).
After you have assigned the template, adjust the macros used for trigger thresholds and low-level discovery filters on the host level, so they fit your individual requirements. (Once again – the Host Wizard will guide you through this process during the host creation. Otherwise – open the Macros section in the host configuration and adjust them manually)
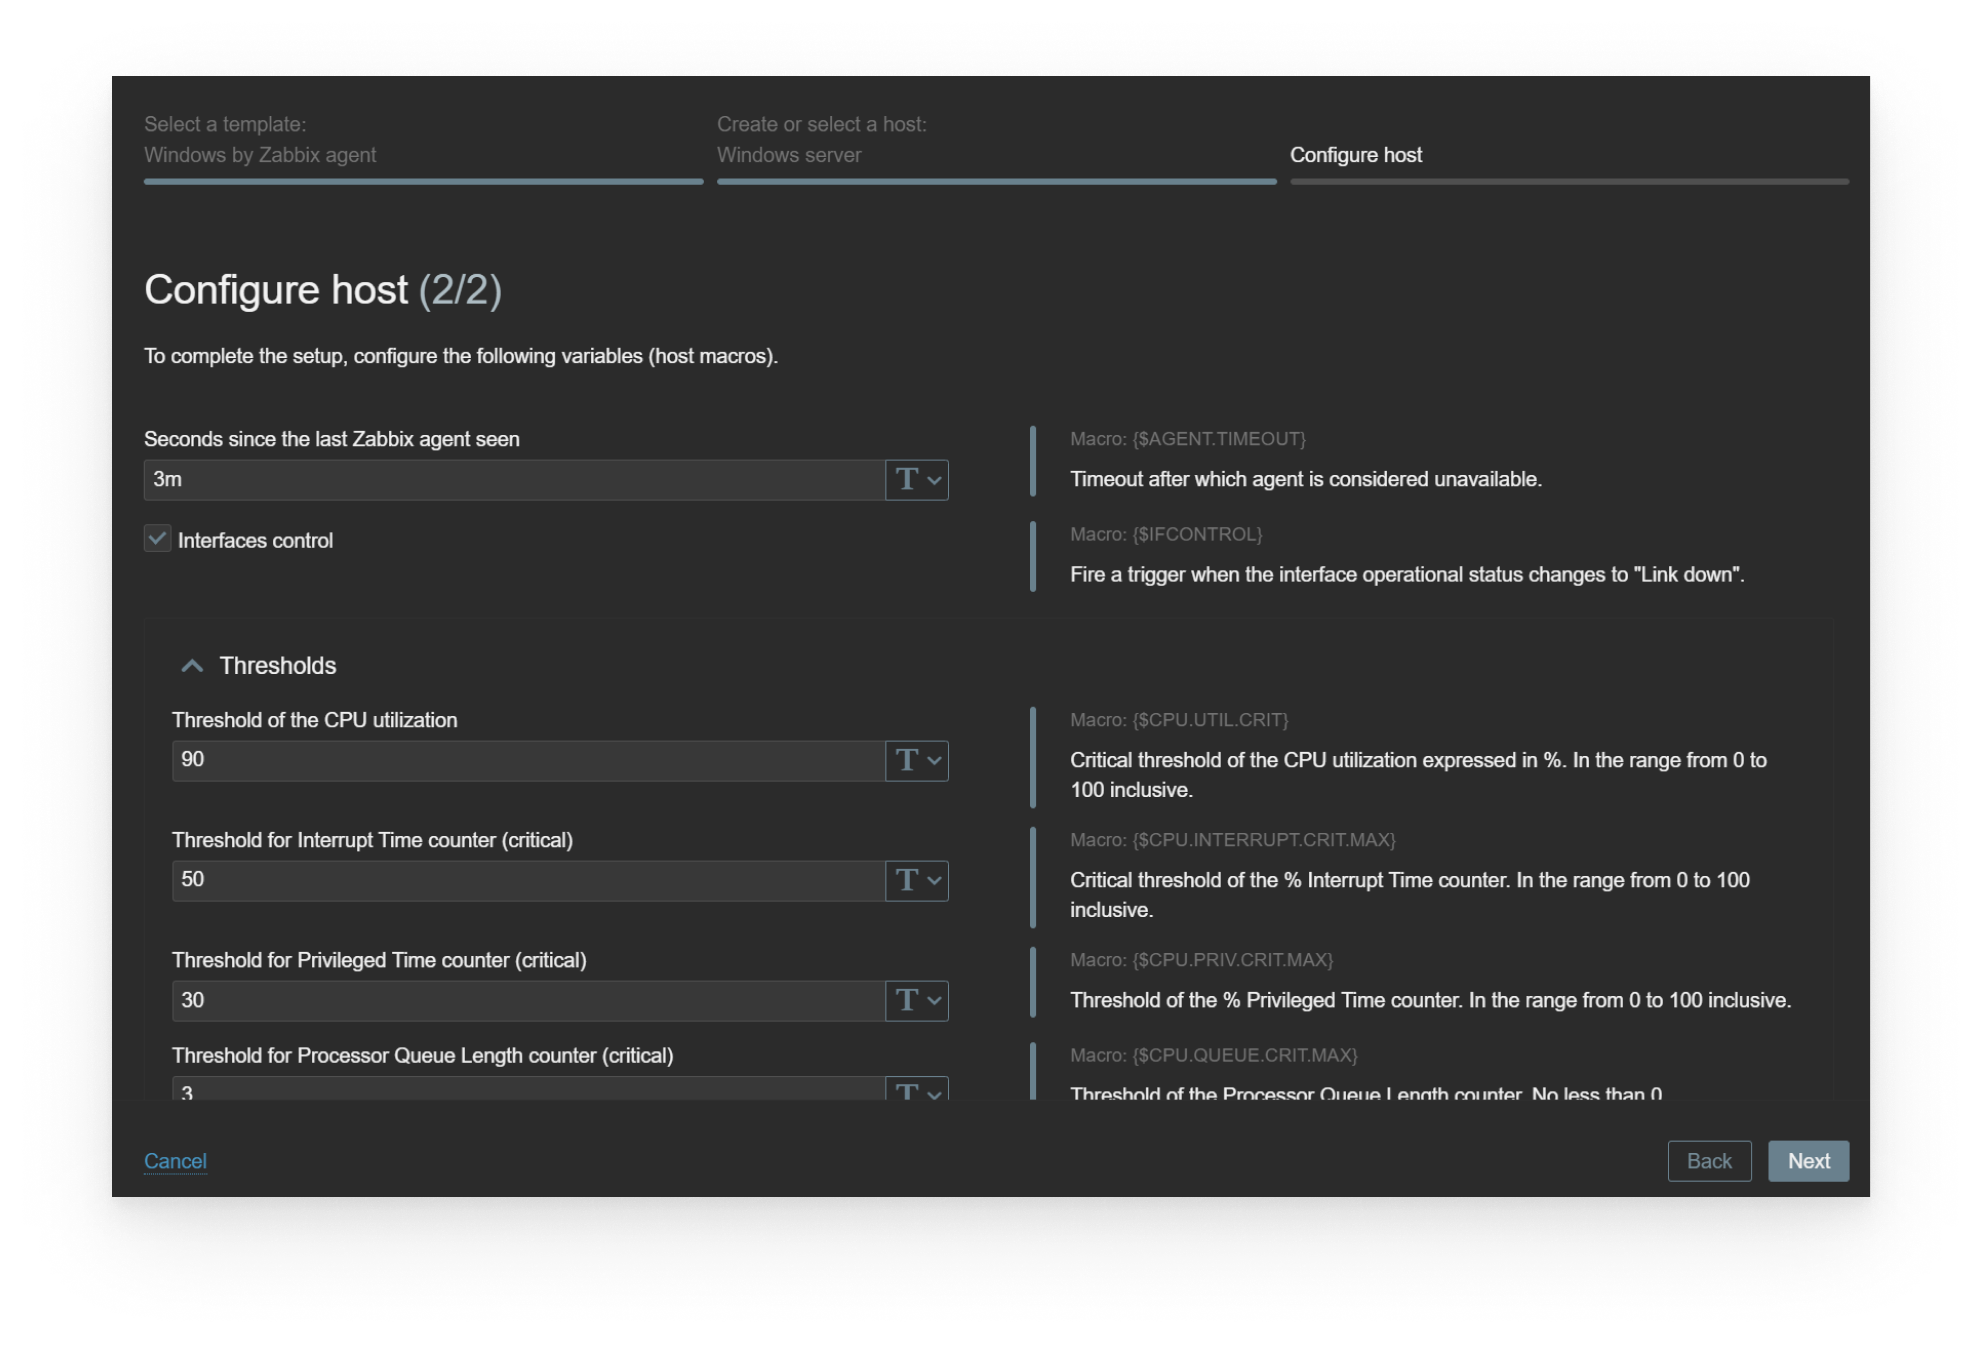
Official Zabbix templates for Windows environments
Zabbix provides a variety of templates for Windows OS and application monitoring:
- Windows by Zabbix agent
- MSSQL by Zabbix agent 2
- Microsoft SharePoint by HTTP
- Microsoft Exchange Server 2016 by Zabbix agent
- IIS by Zabbix agent
The templates contain static items, triggers, graphs and dashboards as well as a variety of low-level discovery rules to discover resources such as:
- Network interfaces
- Physical disks
- Windows services
- MSSQL Databases
- IIS Application pools
- SharePoint directories
- Exchange services
- And much more!
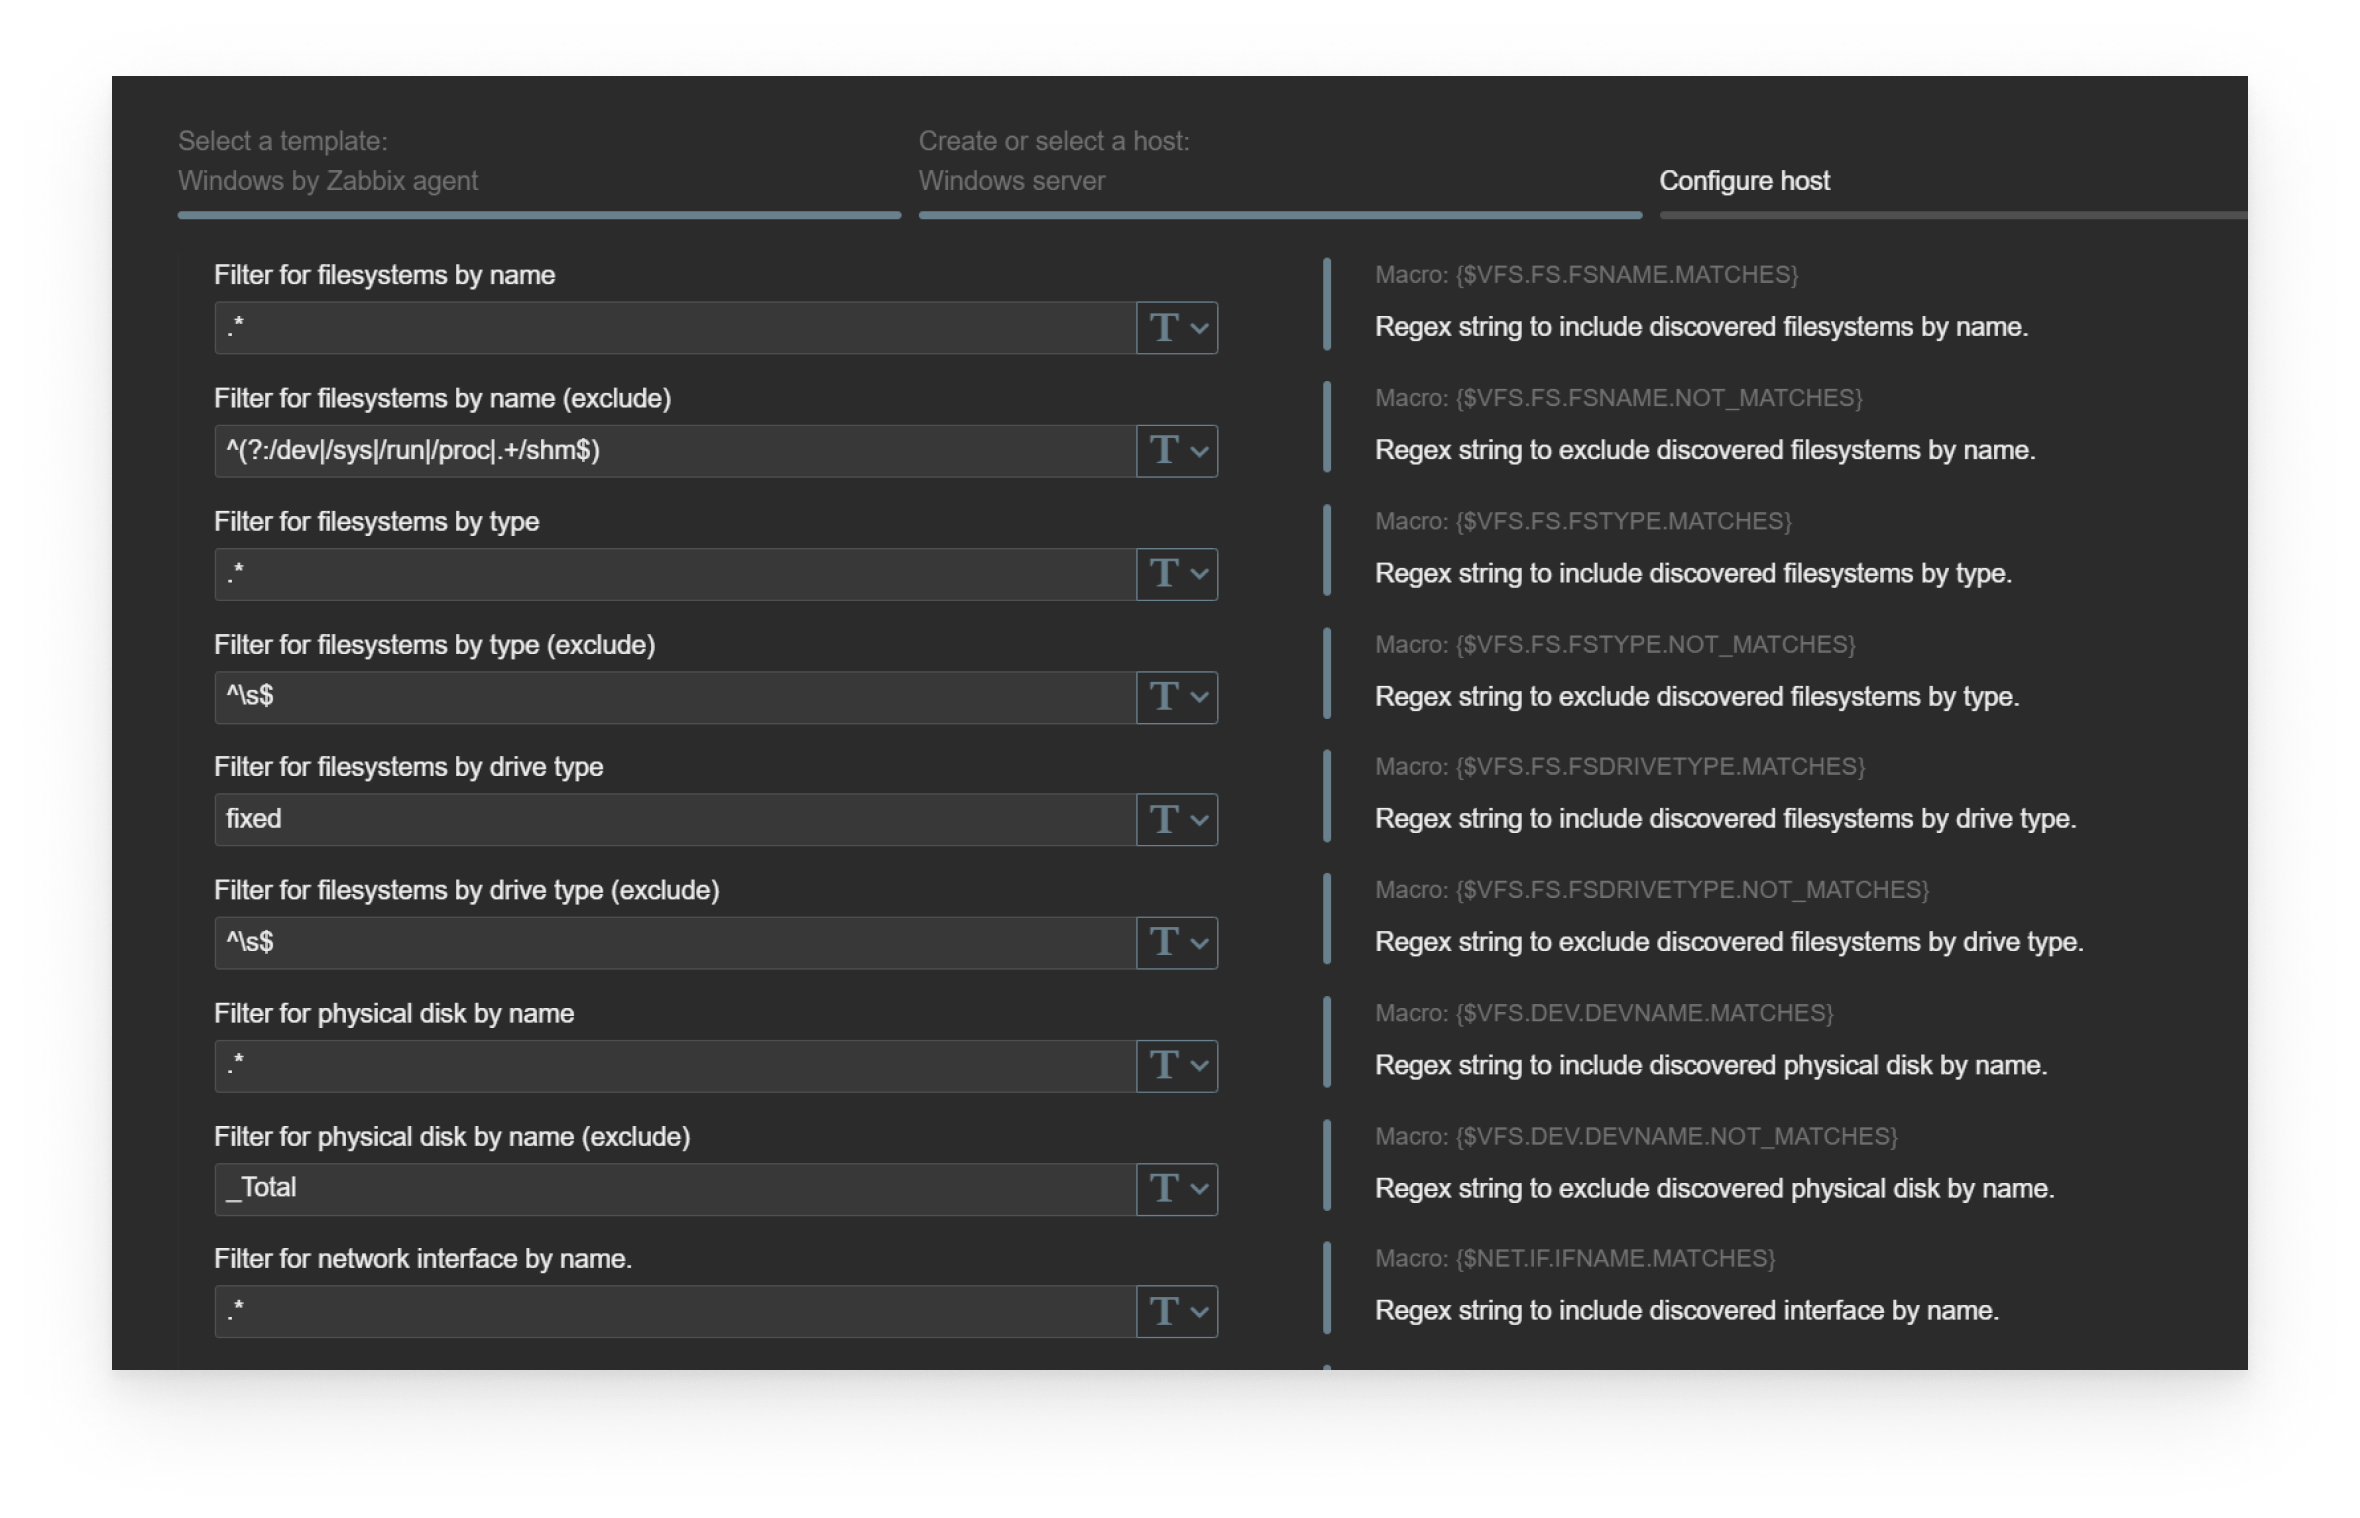
Depending on the application, additional configuration might be required on the application side. The required configuration steps are documented in the corresponding integration pages on our website.
Performance counters and WMI queries
Performance counters are used both in our official templates and are also a common way how existing templates can be extended and templates for other Windows applications can be built.
Performance counter monitoring is done by using a Zabbix agent item key – perf_counter[]
With this approach you can configure your Zabbix agent to collect any supported performance counter value. For example, here’s a performance counter item key for monitoring IIS application pool state:
perf_counter[“\APP_POOL_WAS(Customer Portal)\Current Application Pool State”]
The item key can also use performance counter indexes (numeric performance counter representations).
To ensure that performance counter items remain portable across different Windows hosts with different Windows locales, Zabbix provides English performance counter item key – perf_counter_en[].
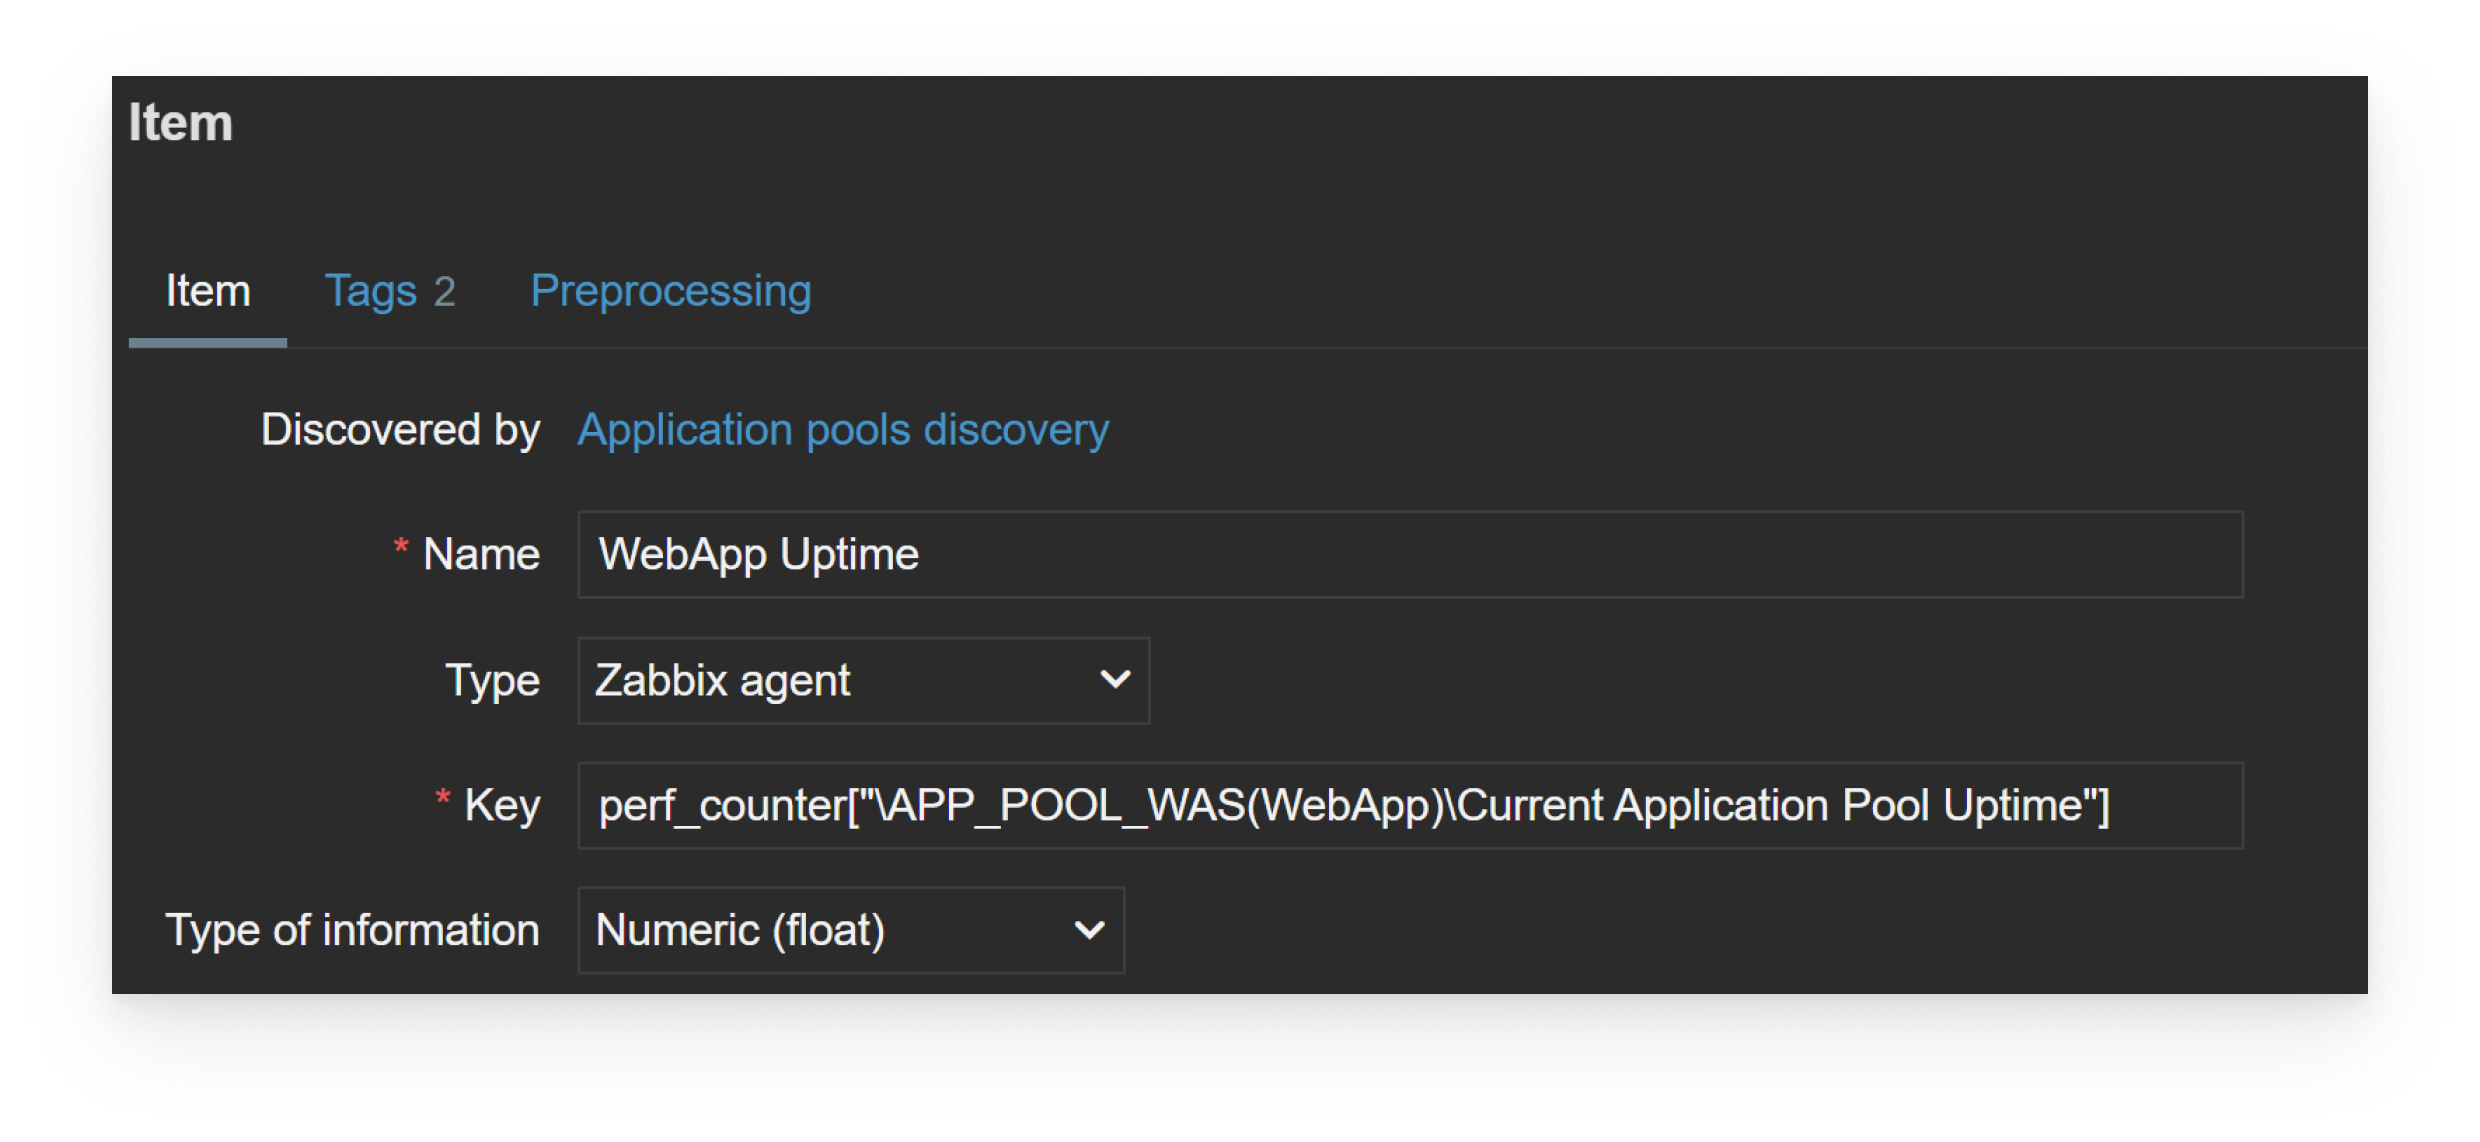
In addition to performance counters, Zabbix agent can also execute WMI (Windows Management Instrumentation) queries.
Two keys can be used to collect WMI data:
- get[<namespace>,<query>] – return the first selected object
- getall[<namespace>,<query>] – return the whole response in JSON (Can be used for low-level discovery)
For example – return the status of the first physical disk: wmi.get[root\cimv2,select status from Win32_DiskDrive where Name like ‘%PHYSICALDRIVE0%’]
Windows log monitoring
Zabbix agent provides 2 item keys specifically for Windows event log monitoring:
- Collect the event log entry matching the item key parameters: eventlog[name,<regexp>,<severity>,<source>,<eventid>,<maxlines>,<mode>]
- Collect the number of matching event log entries ofr a time period: count[name,<regexp>,<severity>,<source>,<eventid>,<maxproclines>,<mode>]
The event log entries can be filtered by log name, log contents (via a regular expression), log severity, source, and event ID.
For example, we might want to react only to log entries in the System log with entry severity matching Warning or Error.
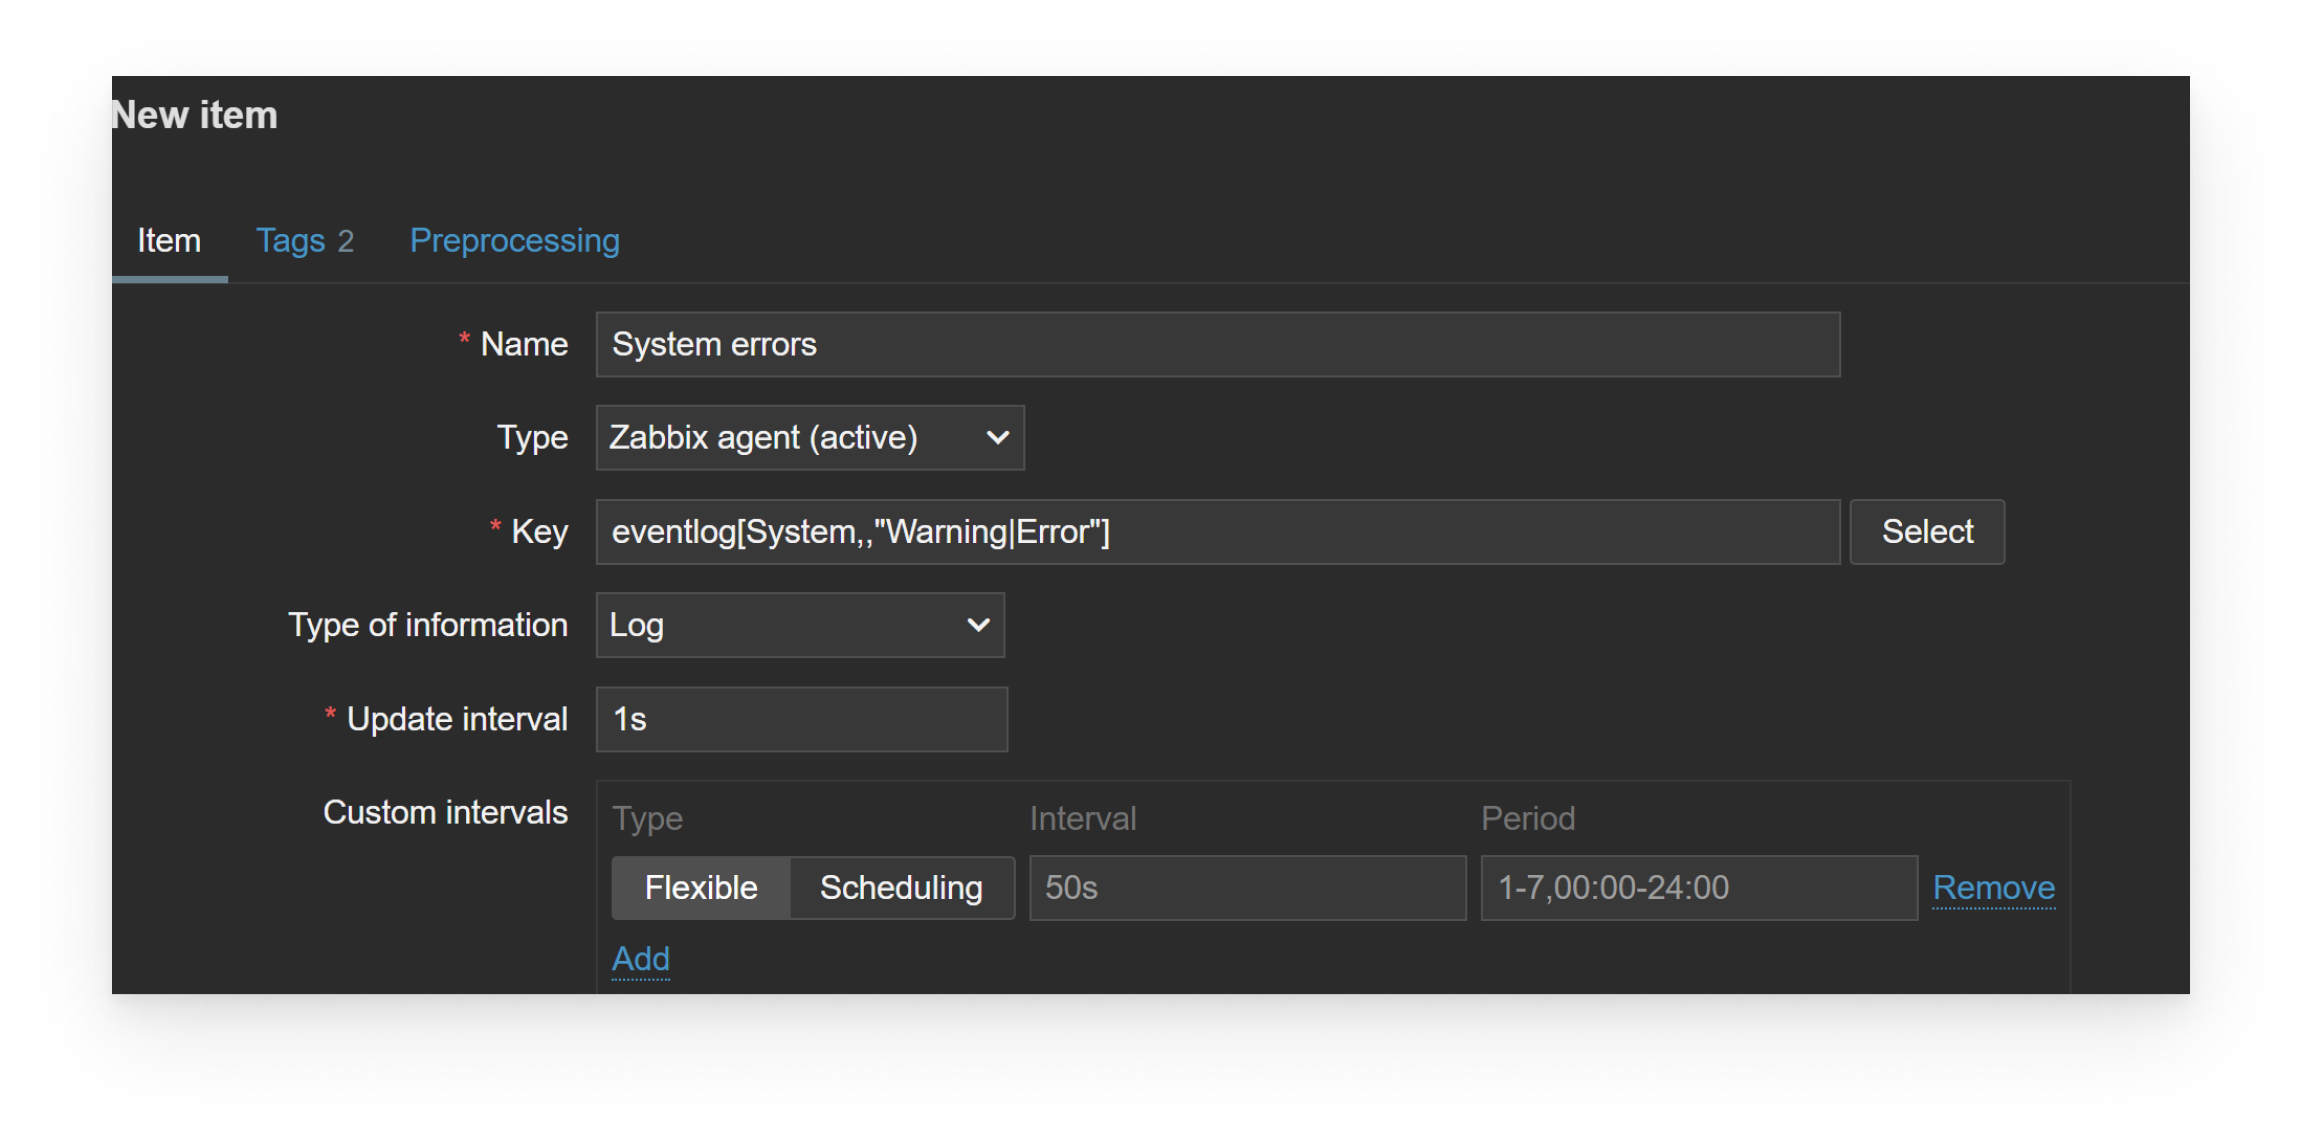
Here the regular log monitoring guidelines apply – it’s supported only by Zabbix agent active checks with the recommended update interval of 1 second (except for eventlog.count) and have a dedicated Type of information with a unique set of configuration settings.
Extending Zabbix agent on Windows
In addition to custom performance counters and WMI queries, Zabbix agent installations on Windows installations can be extended in standard Zabbix ways:
- Defining Zabbix agent User parameters with custom item keys
- Using Zabbix agent system.run item to run custom scripts and commands
Since Zabbix agent is language-agnostic, we can utilize Windows-specific PowerShell scripts or commands to collect custom data:
For example, we can use PowerShell to get a list of pending Windows updates:
UserParameter=GetUpdates,powershell Get-WindowsUpdate
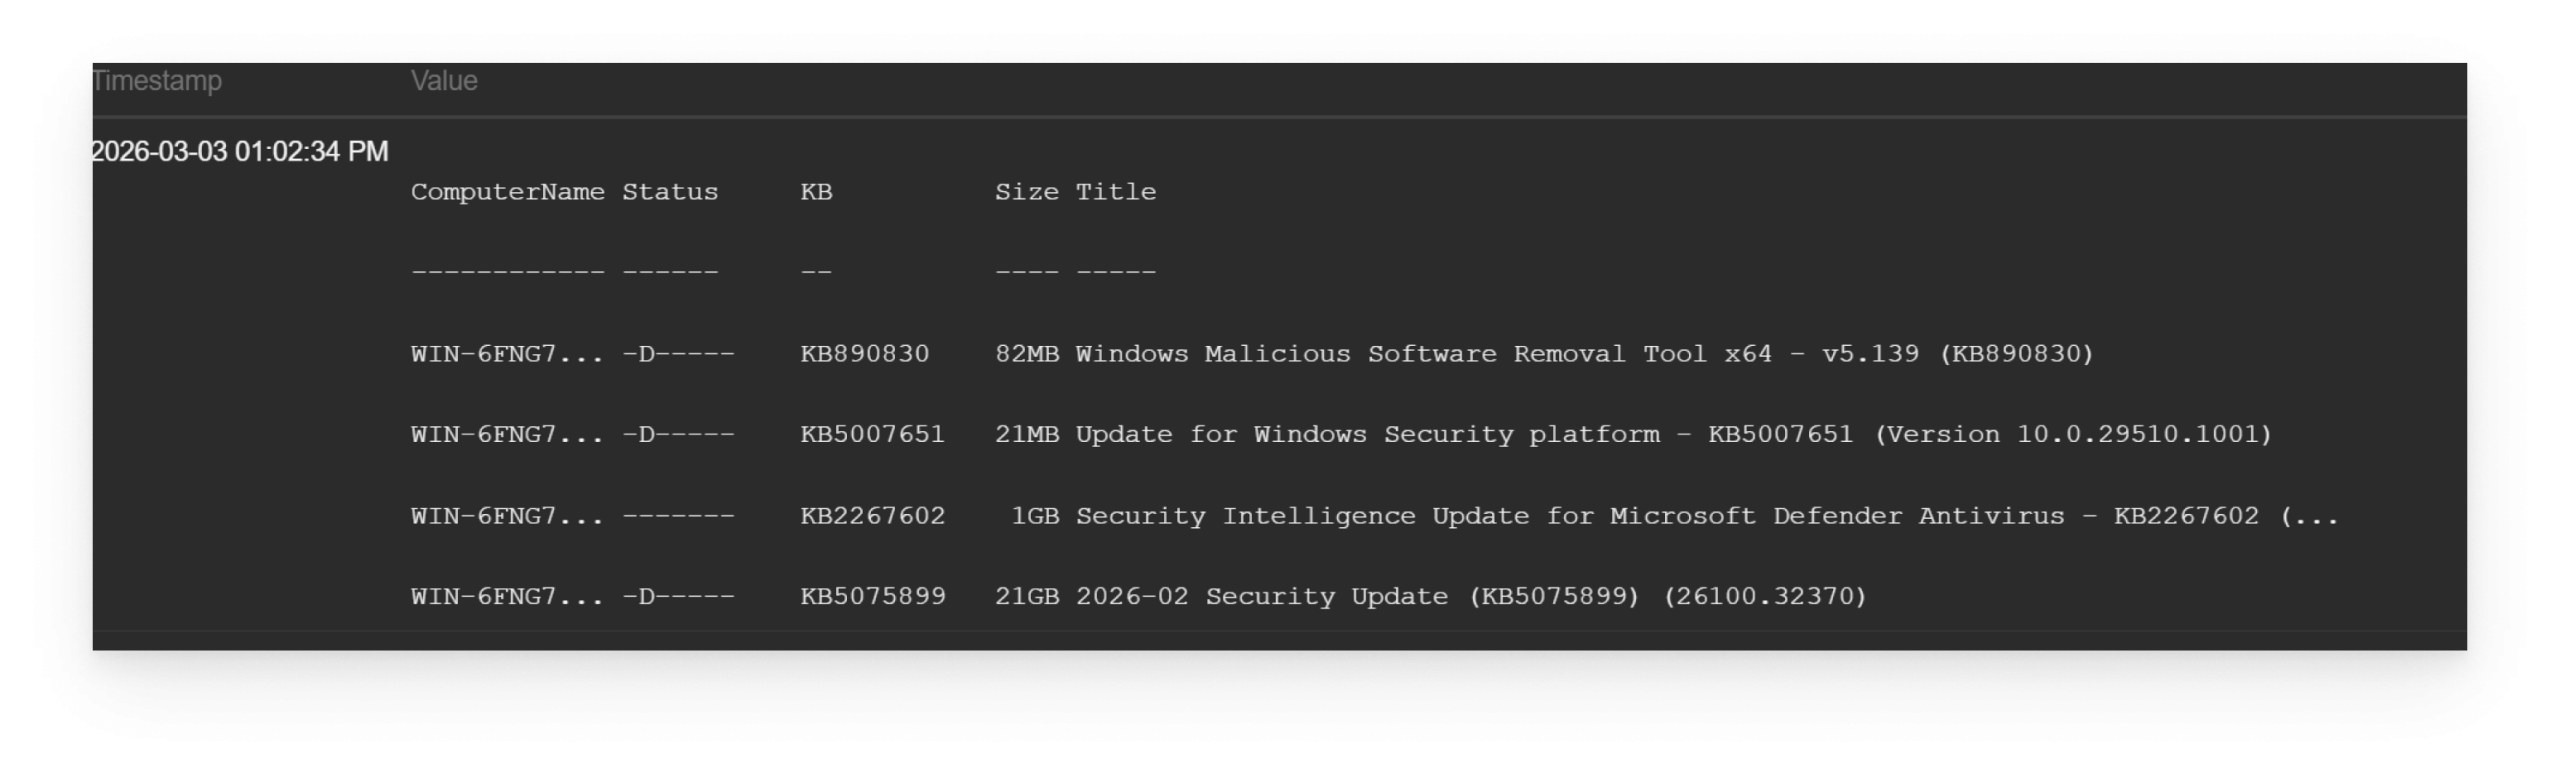
Native Zabbix features such as preprocessing and dependent items can be applied to the collected data to transform or extract the required values or utilize low-level discovery features to automatically create items and triggers based on the ouput of the script.
Finally, the collected data can be used to create different views of your Windows server resource usage, application states and any other collected metrics.
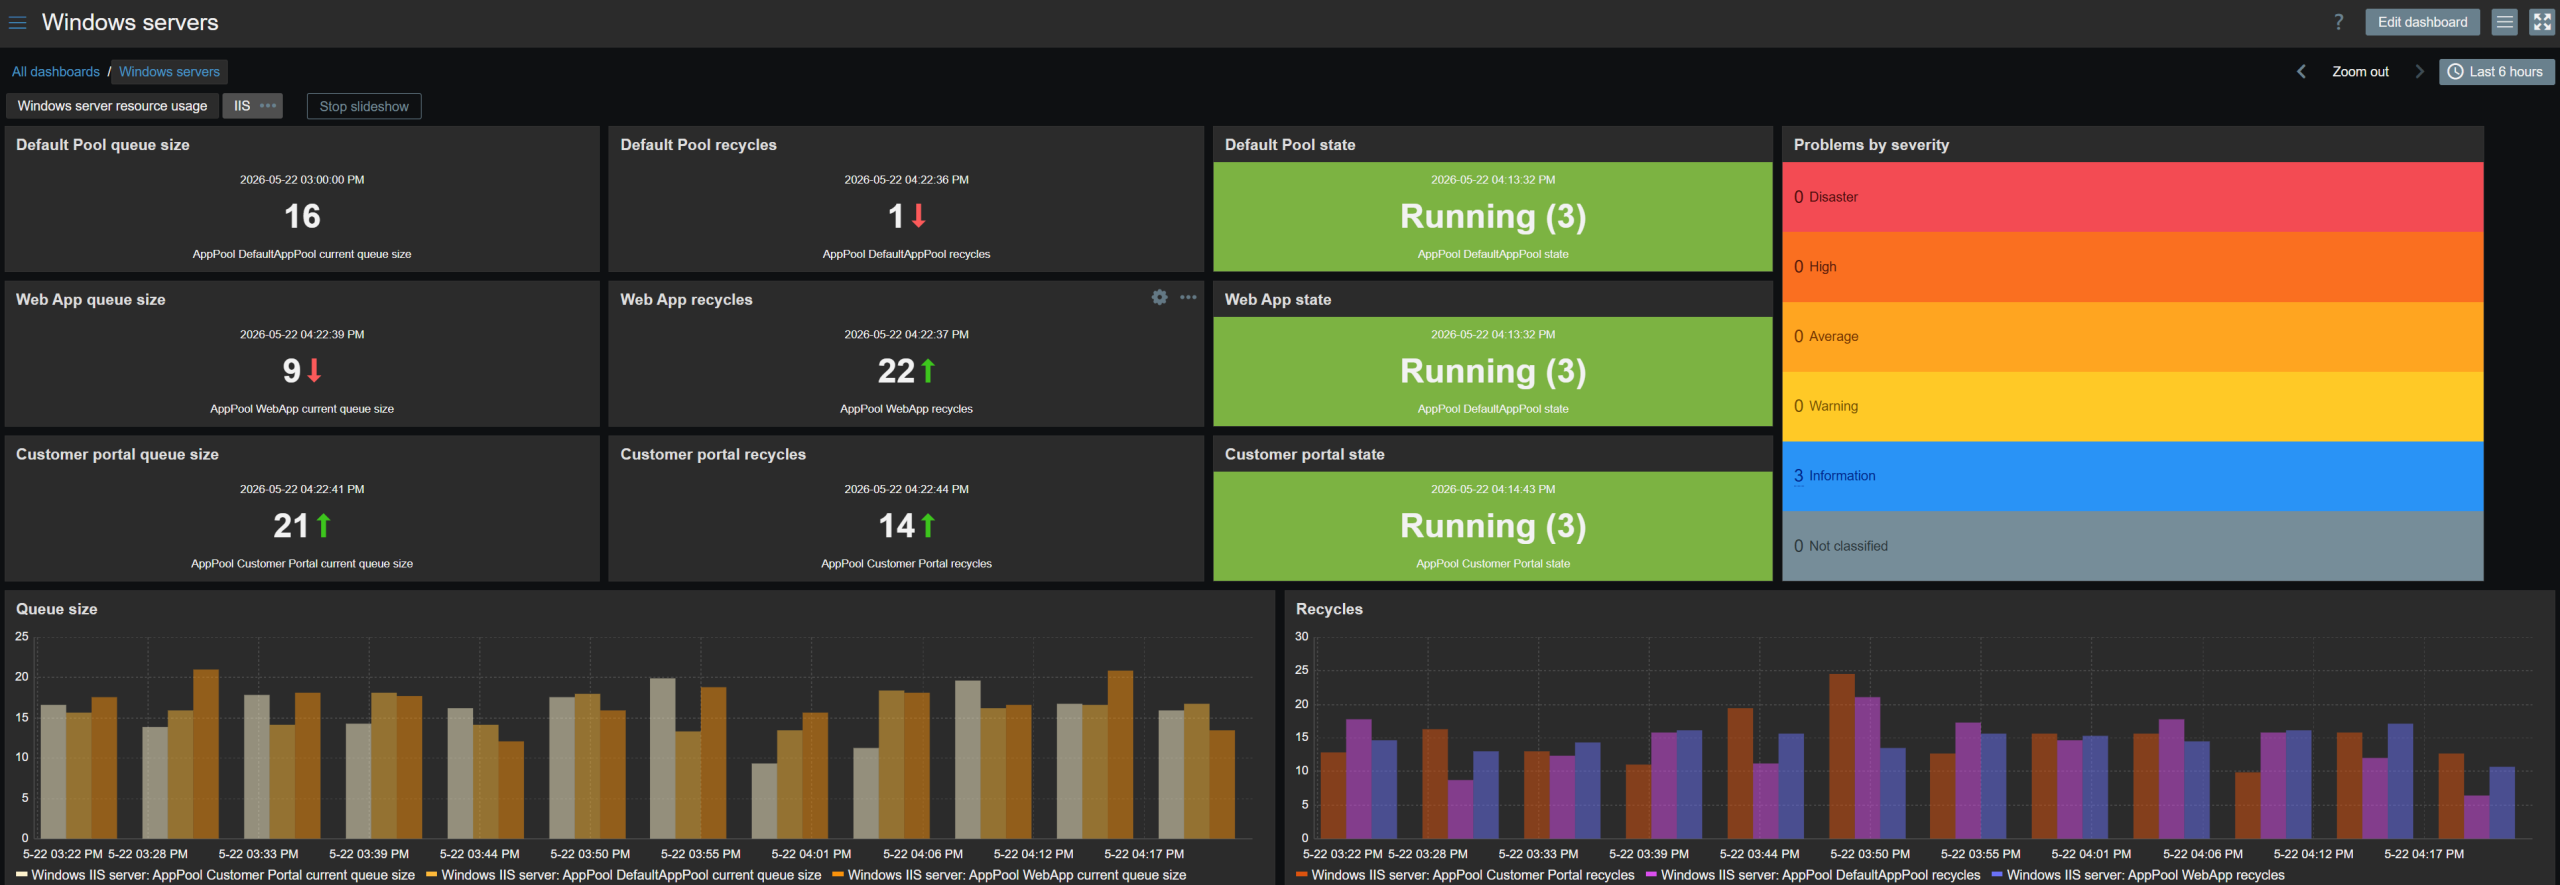
The post Windows Monitoring with Zabbix appeared first on Zabbix Blog.
Prompt Injections for Defense
Post Syndicated from Bruce Schneier original https://www.schneier.com/blog/archives/2026/08/prompt-injections-for-defense.html
This seems to work:
Researchers from Tracebit on Monday said they found that placing prompt injections alongside passwords, cryptographic keys, and other secrets stored on Amazon Web Services was often all that was needed to shut down attacks from AI hacking agents. The prompts direct the attacking LLM to perform an action forbidden by its guardrails, the safety barriers AI developers erect to prevent it from taking harmful actions. The LLM responds by shutting down.
Examples are a prompt that orders the LLM to provide steps for developing inhalable Anthrax spores, or, in the case of LLMs from Chinese developers, make references to the iconic Tank Man from the 1989 Tiananmen Square massacre. Once the LLM encounters these forbidden commands, it no longer follows its existing commands. The researchers have named the technique context bombing.
Of course, this only works against agents that have guardrails. As we start to see more locally run AI models, we’ll see more attackers using LLMs with no guardrails.