Как държавата режисира ужаса от Петрохан

Post Syndicated from Емилия Милчева original https://www.toest.bg/kak-durzhavata-rezhisira-uzhasa-ot-petrohan/

Как държавата режисира ужаса от Петрохан

Властта умее да режисира ужаса така, че сама да остане извън кадър, когато е необходимо. Показва ни отблизо чудовище – деянията му, жертвите, най-интимните подробности от чуждите травми, и ни оставя да поискаме още от същото. Една част от хората избират да се отвратят от чудовището, друга – от институциите манипулатори, трета, най-малката, и от двете.

Така беше режисиран ужасът от Петрохан шест седмици преди президентските избори. След осем месеца разследване и неприключило досъдебно производство прокуратурата и МВР избраха да разкажат какво е извършил т.нар. лама Ивайло Калушев – мъртъв, както и останалите петима от затворената общност, обитавала планинска хижа; човекът, манипулирал възрастни и прекрачил границите с деца, поверени му за отглеждане от родителите им по неясни причини.

Заключенията са, че няма данни за външна намеса, тоест екзекуторите трябва да се търсят в самата група, и делото най-вероятно ще бъде прекратено, тъй като извършителите са мъртви.

Като главен секретар на МВР Георги Кандев също беше съобщил, че няма данни за външна намеса нито на Околчица, нито на Петрохан.

Огласената версия е, че Ивайло Калушев, застрелял 22-годишния Н.З. и 15-годишния А.М., е организирал фаталния край на групата поради страх от разкрития за действията му с деца.

Кръв, порно, политика

Това, което дават по новините, е белег за нещо отдавна случващо се под носа ни: умишления отказ на институциите да си вършат работата. Коментар на Емилия Милчева.

Гавра с правосъдието

На двучасова пресконференция криминалният психолог Росен Йорданов произнесе моралната присъда, въпреки че няма обвинение, и нареди пред публиката секс с подрастващи, окултни практики, манипулации, оръжия и шест трупа. Говореше ту като вещо лице, ту „като човек“, остро и назидателно, сякаш не представя експертно заключение, а защитава обвинителна теза пред съдебни заседатели. Само че съдебни заседатели нямаше, имаше камери и оставаше само някой да разпространи „обвинителния акт“. 

Поведението на Йорданов допълнително разруши и без това оскъдното доверие в разследването и в институции като МВР и прокуратурата. Още на 10 и 15 февруари пред БНТ, преди да бъде назначен за вещо лице и преди да получи достъп до материалите, той вече беше определил Калушев като човек с „тежки нарцистични проблеми“, „професионален прелъстител и педофил“ и беше обяснил мотивите му. На 17 март същият психолог е привлечен като експерт, за да изследва безпристрастно именно личността, поведението и мотивите, за които вече публично е произнесъл присъдата си.

Затова адвокатите Ина Лулчева и Деница Тодорова, представляващи близки на загиналите, поискаха от прокуратурата да отстрани Йорданов и още две вещи лица заради пристрастност и предубеденост. Адвокат Димитър Марковски нарече пресконференцията „груба грешка“ – при 12 незавършени експертизи прокуратурата е фаворизирала една версия, преди да е приключило събирането и проверката на доказателствата. По БНР правозащитникът адвокат Михаил Екимджиев определи поведението на Йорданов като „фрийкшоу“ извън нормалните представи за професионална етика.

Самият Йорданов отказа да се оттегли. Обяви, че не е предубеден, а емоционален – заради случая. За адвокатите, поискали отвода му, каза: 

Те нямат какво друго да направят.

Този отказ не е маловажен професионален спор. Ако прокуратурата запази представената версия, наказателното производство за убийствата ще бъде прекратено, защото посочените извършители са мъртви. Няма да има открит съдебен процес, в който експертизата да бъде оспорена, вещите лица да бъдат разпитани, защитата да представи други доказателства и съдът да прецени коя версия издържа. Евентуалната жалба срещу прекратяването ще бъде разгледана в закрито заседание. 

Така публичният разказ на един експерт, нает от прокуратурата, може да остане единствената присъда. 

Ето така държавната режисура постига целта си. На обществото е даден достатъчно ужасяващ разказ, за да не пита защо трябва да му се вярва. Но доверие в институциите, още по-малко в българската съдебна система няма – дори и да казват част от истината. 

Да се разобличи прокуратурата не означава Калушев да бъде превърнат в невинна жертва на зли сили. Един критично мислещ човек няма да приеме присъда без съд, нито пък безусловна реабилитация на мъртвия. Съмненията в институция с дълга история на избирателни течове и политическа употреба не изключват тревожните факти за деца, оставени под едноличната власт и опека на възрастен мъж и откъснати от училище и семейство. 

Калушев не става невинен само защото прокуратурата злоупотребява с фактите и обслужва определени интереси. Нито пък самата прокуратура става достойна за доверие поради избора на убедително чудовище. 

В престрелката между основните лагери, на които се разполови общественото мнение, се изгубиха децата – жертви на възрастни, отказали да изпълнят задълженията си. 

Сексуалните престъпления срещу деца. Институционална и обществена слепота

В предишната си статия Теодора Станимирова представи данни, разкриващи системното безсилие на институциите спрямо сексуалните злоупотреби с деца. В продължението на темата Теодора разговаря с експерти, за да разбере каква е реалната ангажираност на обществото и институциите – отвъд популизма.

Гаврата с децата

Задочната психологична експертиза беше „предоставена“ за публикуване в сайта „Епицентър“, чиято главна редакторка Валерия Велева не се посвени да я пусне, без да бъдат заличени имената на децата, посочени като жертви на обявилия се за лама. През март 2010 г. лидерът на ДПС Ахмед Доган ѝ написа отворено писмо, обръщайки се към нея с прозвището „Мадам В.“, и я обвини в корупция и търговия с влияние.

Днес, 16 години по-късно, политическата употреба се оказа по-важна от защитата на децата (и техните родители). Асоциацията на европейските журналисти (АЕЖ) обяви, че ще сезира Държавната агенция за закрила на детето, Комисията за защита на личните данни и ГДБОП. 

Междувременно Велева напусна инициативния комитет на кандидатпрезидентската двойка Илияна Йотова – Кирил Вълчев след призиви да се оттегли. От самия инициативен комитет се разграничиха „от публичното изнасяне на лични данни, независимо от случаите, за които се отнася това“. 

Оттеглянето ѝ не отговаря на главния въпрос: 

Кой нарежда на прокуратурата да продължи практиката от времената на главните прокурори Иван Гешев и Борислав Сарафов за манипулации чрез течове на материали от досъдебни производства?

Има и друг съществен аспект – за ролята на контраразузнаването в аферата „Петрохан“. Според лидера на „Продължаваме промяната“ Асен Василев ДАНС е знаела какво се случва в хижа „Петрохан“ още от 2022 г. и е бездействала.

Очевидно някой в ДАНС покровителства групи, които нанасят щети на българските деца… Истинският въпрос е, когато са подавани сигнали в ДАНС през 2022 г., къде е спал ДАНС три години, какво е направил, кой в ДАНС е покровителствал това нещо, защо ДАНС не са сигнализирали прокуратурата. 

И получи отговор от шефа на ДАНС Пламен Тончев:

Проверете делото, образувано в прокуратурата през януари 2025 г. по информация на ДАНС. Там има всички пунктове и точки, които са изнесени в обвинението и днес, само че тогава, ако някой беше реагирал навреме, тези хора може би щяха да бъдат живи.

В документа от януари е била спомената и педофилия. Самият Тончев, назначение на Румен Радев, оглавява ДАНС от 2021 г., с известно прекъсване, когато беше преместен като шеф на Комисията по досиетата.

Всъщност още през февруари, десетина дни след откриването на труповете, разследващият сайт bird.bg публикува секретната справка от ДАНС. Още тогава стана ясно, че прокуратурата не е свършила нищо по преписка за „извършени сексуални или блудствени действия от Ивайло Калушев, относими към Глава Втора, Раздел VIII от Наказателния кодекс“. 

Резултатът от прехвърлянето на преписката между три прокуратури са тримата мъртъвци от „Петрохан“ и другите трима, един от които дете, в кемпера под връх Околчица. 

А до фаталните изстрели 15-годишният А.М. е живял в затворената общност, откъснат от обичайния си семеен и училищен живот. Преди него в същата среда и под контрола на Калушев там е израснал от малък и Н.З.

Родителите може да са били манипулирани, че поверяват децата си на т.нар. лама. Това обаче не отменя отговорността им – родителството не може да бъде преотстъпено на самопровъзгласил се духовен водач заедно с правото му да контролира всекидневието, образованието и съзнанието на детето. 

Частното училище „Космос“, където е бил записан А.М., също е допуснало продължителните му отсъствия да не задействат системата за закрила. А сега прокуратурата разследва нарушения при приема на ученици и издаването на документи с невярно съдържание, както и неизпълнение на задължения от служители на училището, МОН и регионалното управление. 

Около тези деца е имало кръг възрастни – родители, учители, чиновници и контролни органи. И от всичко това излиза, че държавата, която не успява да забележи навреме изчезването на едно дете от обичайната му среда, все пак успява да забележи интимните подробности от живота му и дори решава да ги покаже на всички. Емил Дечев, служебен министър на вътрешните работи в кабинета „Гюров“, ясно посочи, че „големият отсъстващ е българската прокуратура“, и призова за обективно разследване на всички версии.

Шест седмици преди президентските избори случаят „Петрохан“ е превърнат в оръжие за политическо поразяване на силите, подкрепили кандидатпрезидентската двойка Андрей Гюров и Георги Кандев, също и на кмета на София Васил Терзиев. Както стана ясно по-рано, Терзиев е дарил над 125 000 евро лични средства за дейността на групата и е посещавал нееднократно хижата.

Какво (не) знаем за сексуалните злоупотреби с деца

Какво знаят институциите за сексуалните злоупотреби с деца в България и какви мерки предприемат? Теодора Станимирова се сдоби с информация от ВСС, МВР, АСП, ДАЗД и МЗ, разговаря с експерти и ни разказва какво е научила.

Паралелно с това премиерът Румен Радев също не се засрами да употреби децата. 

Той избра училищния двор и първия учебен ден, за да нарече организацията „свърталище на педофилия“, а Калушев – „хладнокръвен убиец на деца и откровен педофил“. След психолога експерт Йорданов, който се похвали, че премиерът му благодарил, сега и Радев произнесе присъда, преди да е приключило разследването. 

Държавата, която не опази децата от „Петрохан“, подреди други деца за фон на закъснялото си възмущение. 

Какво се скри в мъглата?

Чудовището се оказа твърде удобно за властта. Колкото по-дълго гледаме него, толкова по-малко забелязваме растящите цени на горивата и газа, които внасят инфлация. 

След президентските избори на 25 октомври случаят „Петрохан“ ще бъде изместен от първите сметки за отопление и от увеличените разходи за живот. Последните данни на националната статистика за август показват инфлация от 5,1% на годишна база и ускоряваща се през последния летен месец.

В мъглата се скри границата между познанство, дарение, политическа подкрепа и съучастие. Имената на политици бяха вкарани в един и същ разказ с убийства и сексуално насилие, без да са представени данни, че са знаели за тях. Така вината по асоциация свърши онова, за което доказателствата не стигат – превърна контактите с Калушев в политическо обвинение. 

Не сме длъжни да избираме от какво да се отвратим. Достатъчно е да знаем, че институциите не защитиха децата, но пристигнаха навреме за камерите. 

Run open weight models on AWS Bedrock in AWS European Sovereign Cloud

Post Syndicated from Marta Taggart original https://aws.amazon.com/blogs/security/run-open-weight-models-on-aws-bedrock-in-aws-european-sovereign-cloud/

European organizations can run AI workloads on Amazon Web Services (AWS) while keeping data within the European Union (EU) and meeting regulatory requirements. You can now run generative AI workloads on open weight models on Amazon Bedrock in the AWS European Sovereign Cloud. We’re excited to announce the general availability of the first open weight model family, Gemma 4, on the Amazon Bedrock next-generation inference engine in the AWS European Sovereign Cloud. Gemma 4, released under the Apache 2.0 license, on Amazon Bedrock benefits from the same data residency and operational controls that define the AWS European Sovereign Cloud so you can build, iterate, and scale generative AI applications while meeting digital sovereignty requirements.

The AWS European Sovereign Cloud is an independent cloud for Europe, located entirely within the EU, designed to help customers meet their most stringent digital sovereignty requirements. It runs entirely within the EU and is independently operated with strong technical controls, sovereign assurances and legal protections. Only AWS employees who reside in the EU control day-to-day operations, including access to data centers, technical support, and customer service.

In this post, we explain how the Amazon Bedrock inference engine protects your inference data when running Gemma 4 models, how the AWS European Sovereign Cloud keeps it within the EU, and then walk through the available Gemma 4 models and your first inference request.

Next generation inference engine for Amazon Bedrock

The inference engine is a distributed engine for serving large-scale machine learning models, built for high performance, reliability, and security. You reach it through the bedrock-mantle endpoint, which supports OpenAI-compatible APIs (the Responses and Chat Completions APIs). You can bring an existing OpenAI SDK codebase to Amazon Bedrock by changing only the base URL and API key. The Responses API supports stateful conversation management, which rebuilds context without you passing conversation history with each request. Stored responses are scoped by Amazon Bedrock project, a logical boundary that represents a workload for access control, cost tracking, and usage monitoring.

The engine applies the same operational security practices you rely on across AWS. Access follows a least privilege model, where each operator has access only to the systems a specific task requires, and only for the time that privilege is needed. Any access to systems that store or process customer data or metadata is logged, monitored for anomalies, and audited. All your prompts and responses are kept private during inference.

How your inference data is protected

Amazon Bedrock uses a zero operator access data security model, meaning no service operators can access model input or output during inference. It also uses a zero data retention model, so by default it doesn’t store your inputs or outputs. For certain models, limited retention might apply for abuse detection (see the Amazon Bedrock abuse detection documentation). Your prompts and responses are encrypted in transit and, by default, are not shared with the model provider.

All inference stays within the eusc-de-east-1 AWS Region as described in the following section on data residency. Combined with the data residency and EU-based operations of the AWS European Sovereign Cloud, this gives organizations in highly regulated industries the confidence to run their most sensitive AI workloads in the cloud.

Data residency and regional availability

The AWS European Sovereign Cloud became generally available in January 2026, with its first Region in Brandenburg, Germany (eusc-de-east-1). It’s a separate, independently operated cloud, with infrastructure located entirely within the EU and no critical dependencies on non-EU personnel or infrastructure. All your content remains within the Region you select unless you choose otherwise. Beyond content, customer-created metadata including roles, permissions, resource labels, and configurations also stays within the EU. The AWS European Sovereign Cloud is operated exclusively by EU residents located in the EU. We’re also gradually transitioning the AWS European Sovereign Cloud to be operated exclusively by EU citizens located in the EU. During this transition period we will continue to work with a blended team of EU residents and EU citizens located in the EU.

All Amazon Bedrock inference requests, including Gemma 4, use in-Region inference in eusc-de-east-1, which keeps every request within the AWS European Sovereign Cloud. Global cross-Region inference, which routes requests across commercial AWS Regions worldwide, isn’t available in the AWS European Sovereign Cloud.

Control over who can access your data

With AWS Identity and Access Management (IAM), you decide which principals in your account can call the inference API and which models they can use. Fine-grained permissions let you grant only the access each workload needs, following least privilege, and we recommend short-lived credentials over long-term keys.

For auditing, every call to the endpoint is recorded in AWS CloudTrail, giving your security and compliance teams an audit trail of who invoked inference and when. You can also monitor usage with Amazon CloudWatch and set alarms on patterns that matter to you, such as unexpected spikes in request volume.

Open weight models in the AWS European Sovereign Cloud

Organizations adopting open weight foundation models (FMs) for production face a constant challenge: how to access the leading models without compromising on data protection, regulatory alignment, or operational control. Amazon Bedrock removes that challenge. It gives you leading open weight FMs through a fully managed service, with inference running entirely on infrastructure operated by AWS and the security and privacy controls you expect from Amazon Bedrock. Because the models are open weight, you can independently evaluate the model architecture and training methodology, benchmark your own workloads, and fine-tune on proprietary data when customization is required.

Gemma 4 is a family of open weight models, released under the Apache 2.0 license. It’s available in three instruction-tuned variants, so you can evaluate and choose the model that fits your workload. The following table provides guidance on which model to choose based on your use case:

Model

Use case

Specifications

Gemma 4 31B (google.gemma-4-31b-it)

Reasoning-heavy or coding-heavy with a single dense model

30.7 billion parameter dense model with a 256 K token context window

Gemma 4 26B-A4B (google.gemma-4-26b-a4b-it)

Cost-sensitive at high throughput, with knowledge breadth requirements

Mixture-of-experts model with 25.2 billion total parameters and 3.8 billion active per token, with a 256 K token context window

Gemma 4 E2B

(google.gemma-4-e2b-it)

Latency-sensitive, on-device-style, or multimodal classification

Compact model with 5.1 billion total parameters and 2.3 billion effective parameters using per-layer embeddings (PLE), with a 128 K token context window

All three variants offer built-in reasoning, native function calling, and multimodal input across text and image.

Get started with Gemma 4 models on Amazon Bedrock

Gemma 4 is served through the bedrock-mantle endpoint, the OpenAI-compatible API for the next-generation inference engine, so you can call it with the OpenAI Python and TypeScript SDKs. Use the following steps to use the OpenAI Python SDK to send your first request to Gemma 4 31B in the AWS European Sovereign Cloud.

Prerequisites

To follow this example, you need an AWS account with access to the AWS European Sovereign Cloud and an IAM principal with permissions to call the bedrock-mantle endpoint. Create an IAM policy that grants the two actions this walkthrough uses, then attach it to your IAM principal. The bedrock-mantle:CreateInference action runs inference, and the bedrock-mantle:CallWithBearerToken action authenticates with an Amazon Bedrock API key. The following sample policy grants the actions this example needs. Scope the resources further for your environment as described after the policy.

{
  "Version": "2012-10-17",
  "Statement": [
    {
      "Sid": "GemmaMantleInference",
      "Effect": "Allow",
      "Action": "bedrock-mantle:CreateInference",
      "Resource": "arn:aws-eusc:bedrock-mantle:eusc-de-east-1:<account-id>:project/<project-id>"
    },
    {
      "Sid": "GemmaMantleBearerToken",
      "Effect": "Allow",
      "Action": "bedrock-mantle:CallWithBearerToken",
      "Resource": "*"
    }
  ]
}

Replace <account-id> and <project-id> with your own values.

Install the OpenAI SDK and the Amazon Bedrock token generator with the command pip install “openai>=2.45.0" aws-bedrock-token-generator.

Authenticate

You authenticate with an Amazon Bedrock API key. Amazon Bedrock offers two types of API keys. Short-term keys expire automatically within 12 hours and inherit the permissions of the IAM principal that generated them, which makes them the recommended choice for production. Long-term keys last until a configured expiration and are intended for development and exploration. For production, use the auto-refreshing short-term key shown in the following example, or store the key in AWS Secrets Manager.

from aws_bedrock_token_generator import provide_token
from openai import BedrockOpenAI

region = "eusc-de-east-1"

client = BedrockOpenAI(
    aws_region=region,
    base_url="https://bedrock-mantle.eusc-de-east-1.api.amazonwebservices.eu/v1",
    bedrock_token_provider=lambda: provide_token(region=region),
)

Alternatively, you can pass a short-term API key through an environment variable. This key isn’t refreshed and expires after at most 12 hours.

import os
from openai import OpenAI

client = OpenAI(
    base_url="https://bedrock-mantle.eusc-de-east-1.api.amazonwebservices.eu/v1",
    api_key=os.environ["AWS_BEARER_TOKEN_BEDROCK"],
)

Run your first inference with the Responses API

The Responses API uses a single input field and returns the generated text in output_text. Setting store to false means Amazon Bedrock doesn’t retain the request or response.

response = client.responses.create(
    model="google.gemma-4-31b-it",
    input="Explain the benefits of open-weight models for regulated industries.",
    max_output_tokens=512,
    store=False,
)
print(response.output_text)

Call the Chat Completions API

You can also call the OpenAI-compatible Chat Completions endpoint directly. If you use AWS credentials instead of an API key, sign the request with AWS Signature Version 4 (SigV4), as in the following example.

export ENDPOINT=https://bedrock-mantle.eusc-de-east-1.api.amazonwebservices.eu
export AWS_REGION=eusc-de-east-1

curl -X POST ${ENDPOINT}/v1/chat/completions \
  --aws-sigv4 "aws:amz:${AWS_REGION}:bedrock" \
  --user "${AWS_ACCESS_KEY_ID}:${AWS_SECRET_ACCESS_KEY}" \
  -H "x-amz-security-token: ${AWS_SESSION_TOKEN}" \
  -H "Content-Type: application/json" \
  -d '{
    "model": "google.gemma-4-31b-it",
    "messages": [{"role": "user", "content": "Hello!"}]
  }'

Clean up

This walkthrough creates no persistent resources, so there’s nothing to delete. The short-term API keys used here expire automatically within 12 hours.

Pricing and availability

Gemma 4 is available in Amazon Bedrock in the AWS European Sovereign Cloud. You pay per token with no upfront commitment, and usage counts toward your existing AWS commitments. For current pricing, see Amazon Bedrock pricing. For model and Regional availability, see Regional availability by models.

Commitment to innovation

Beyond the technical integration, running AI workloads in a sovereign context raises important questions about requirements. As you plan AI workloads for a sovereign context, evaluate them against your organization’s requirements for data residency, model governance, and operational control. The AWS European Sovereign Cloud is designed to help you meet these requirements in the EU.

AWS is committed to making AWS the best place for European organizations to innovate with AI, without compromise. To learn more about AWS European Sovereign Cloud visit aws.eu.

If you have feedback about this post, submit comments in the Comments section below.


Author

Marta Taggart

Marta is a Principal Product Marketing Manager focused on digital sovereignty and the AWS European Sovereign Cloud in AWS Product Marketing. She helps customers navigate complex digital sovereignty requirements and understand how AWS solutions can help address their needs so they can build and innovate with confidence. Outside of work, she enjoys yoga and coffee.

Zohreh Norouzi

Zohreh Norouzi

Zohreh is a Senior Security Solutions Architect at Amazon Web Services (AWS). She helps customers make good security choices and accelerate their journey to the AWS Cloud. She has been actively involved in AI security initiatives, using her expertise to help customers build secure AI solutions at scale.

New low-cost burstable Amazon EC2 T8i instances are generally available

Post Syndicated from Channy Yun (윤석찬) original https://aws.amazon.com/blogs/aws/new-low-cost-burstable-amazon-ec2-t8i-instances-are-generally-available/

Today, we’re announcing the general availability of new low-cost burstable Amazon EC2 T8i instances powered by custom sixth generation Intel Xeon Scalable Processors (Granite Rapids), available only on AWS. T8i instances are among the lowest-cost EC2 instances and deliver up to 30% better price performance over previous generation T3 instances. These instances are designed to run a variety of low-to-moderate CPU utilization workloads such as freemium services, training and demo environments, staging and development, data processing, microservices, low-traffic websites, and login gateways.

T8i instances
Thousands and thousands of customers run various lightweight workloads on T3 instances that require small, cost-effective compute configurations. These include microservices architectures, low-traffic websites, development and testing environments, small databases, data processing jobs, and short-duration compute tasks. Many of these customers like T family’s burstable performance model, which provides a baseline level of CPU performance with the ability to burst above the baseline when needed using CPU credits.

As customers modernize their infrastructure, migrate from on-premises environments, adopt event-driven and microservices architectures, and experiment with AI inference workloads, they have asked for newer generation cost-optimized small instances, better price performance to reduce their total cost of ownership, and a seamless migration path that leverages their existing knowledge and tooling.

T8i instances address each of these requests:

  • Up to 30% better price performance. Powered by the AWS Nitro System and custom sixth generation Intel Xeon Scalable Processors (Granite Rapids), T8i instances enable customers to lower their total cost of ownership with up to 30% better price performance.
  • Up to 70% higher compute performance. T8i instances deliver up to 70% higher compute performance, up to 1.25x higher network bandwidth, and up to 2.4x higher EBS bandwidth compared to T3 instances.
  • Seamless upgrade from T3. For existing T3 customers, upgrading to T8i is straightforward. The instances offer the same CPU credit system and the same familiar lightweight compute options customers already know. Customers simply select T8i instead of T3 and immediately benefit from improved price performance.
  • Cost-effective entry point for new customers. For customers new to AWS or migrating from on-premises, T8i instances provide one of the most cost-effective entry points to run workloads that need low-to-moderate CPU utilization or for running short-duration compute tasks such as batch processing, event-driven functions, or CI/CD pipelines.

Instance specifications
T8i instances offer four sizes, each with two vCPU offered as a single core. The following table summarizes the specifications.

Instance size vCPUs Memory (GiB) Baseline Performance /vCPU (%) CPU credits earned / hour Network burst bandwidth (Gbps)
t8i.nano 2 0.25 5 3 Up to 6.25
t8i.micro 2 0.5 10 6 Up to 6.25
t8i.small 2 1 20 12 Up to 6.25
t8i.medium 2 2 20 12 Up to 6.25

Like T3, T8i instances offer unique vCPU-to-memory ratios such as 1:0.25, 1:0.5, and 1:1 that are not offered by other EC2 instances. Like T3, T8i instances utilize the CPU credit system along with the Standard and Unlimited credit configuration modes. Unlimited mode is the default on T8i.

For workloads that need larger instance sizes above T8i offerings (nano, micro, small, and medium), I recommend M8i Flex instances that offer up to 30% better price performance than equivalent previous generation T3 instances along with the flexibility to scale up to 16xlarge.

Now available
Amazon EC2 T8i instances are available today in the following AWS Regions: US East (N. Virginia, Ohio), US West (Oregon, N. California), Asia Pacific (Hyderabad, Malaysia, Mumbai, Seoul, Singapore, Sydney, Tokyo), Canada (Central), and Europe (Frankfurt, Ireland, London, Paris). For Regional availability and upcoming Region expansion, search the instance type in the CloudFormation resources tab of AWS Capabilities by Region.

You can purchase T8i instances via On-Demand instances, and Spot instances with Savings Plan option coming soon. T8i instances support shared tenancy only and do not support Dedicated tenancy or Dedicated Hosts. t8i.micro and t8i.small instances are also available under the AWS Free Tier. To learn more, visit the Amazon EC2 Pricing page.

Try T8i instances in the Amazon EC2 console and send feedback to AWS re:Post for EC2 or through your usual AWS Support contacts.

Channy

AWS Elastic Beanstalk introduces Cluster Mode

Post Syndicated from Channy Yun (윤석찬) original https://aws.amazon.com/blogs/aws/aws-elastic-beanstalk-introduces-cluster-mode/

Since the first launch of AWS Elastic Beanstalk in 2011, customers have deployed full-stack applications in Java, .NET, Python, Node.js, PHP, Ruby, and Go, trusting Elastic Beanstalk to manage deployment and infrastructure operations so they could focus on business logic. Fifteen years later, that trust has only deepened, and the service has been rebuilt to match it. Now, AWS Elastic Beanstalk is the application management service on AWS that takes full operational responsibility for your production environments. Bring applications however they exist today: source code, Dockerfiles, or container images. Elastic Beanstalk creates and manages the production environment underneath. You manage your application. AWS manages everything else, deploying, scaling, patching, monitoring, and maintaining it continuously. That operational responsibility stays with AWS, for the life of the application.

We have been rebuilding the operational engine underneath and delivering a series of capabilities that make it more powerful than ever. Elastic Beanstalk now uses AI-powered environment analysis to diagnose health issues and recommend fixes automatically. A new official GitHub Action lets teams deploy directly from their existing CI/CD workflows with a single YAML configuration. And we rebuilt the infrastructure foundation to deliver OpenTelemetry-based observability, traffic-splitting deployments with automatic rollback, event-driven autoscaling, secrets management through AWS Secrets Manager, and HTTPS by default via AWS Certificate Manager.

Today, we’re announcing the next chapter of AWS Elastic Beanstalk: a new fully-managed Cluster Mode that deploys, scales, patches, monitors, and upgrades your applications continuously for the life of the workload. You bring your application. AWS runs it.

A new Cluster Mode is built for teams running a portfolio of applications. Instead of operating each application in isolation, you run multiple applications that share infrastructure powered by Amazon Elastic Kubernetes Service (Amazon EKS), fully managed with a single operational baseline. Multiple applications share resources, so per-application cost decreases as your portfolio grows without adding operational complexity. Whether you run ten applications or a hundred, you manage them through one experience, with the same operational guarantees across every stack.

Elastic Beanstalk Cluster Mode benefits for your workloads:

  • Source code to production, any runtime. Upload source code in Java, .NET, Python, Node.js, PHP, Ruby, or Go. Elastic Beanstalk handles containerization automatically through Cloud Native Buildpacks when needed. No Dockerfile and no rearchitecting required. You can bring legacy applications from on-premises or deploy new services in any supported language.
  • Enterprise compliance built in. Elastic Beanstalk is HIPAA eligible, PCI DSS compliant, and aligned to SOC 1/2/3 with no additional configuration, so teams in regulated industries can deploy production workloads with the compliance posture they already require.
  • Production-grade deployment strategies. All-at-once, rolling, immutable, and traffic-splitting deployments with automatic rollback on failure. Event-driven autoscaling. AWS Secrets Manager integration. All native OpenTelemetry enabling easy integration with most observability backends, including Amazon CloudWatch.
  • AI-powered troubleshooting. When something goes wrong, Elastic Beanstalk collects service-side logs and provides AI-generated recommendations to help you resolve issues faster without digging through infrastructure.

A first look of Elastic Beanstalk Cluster Mode
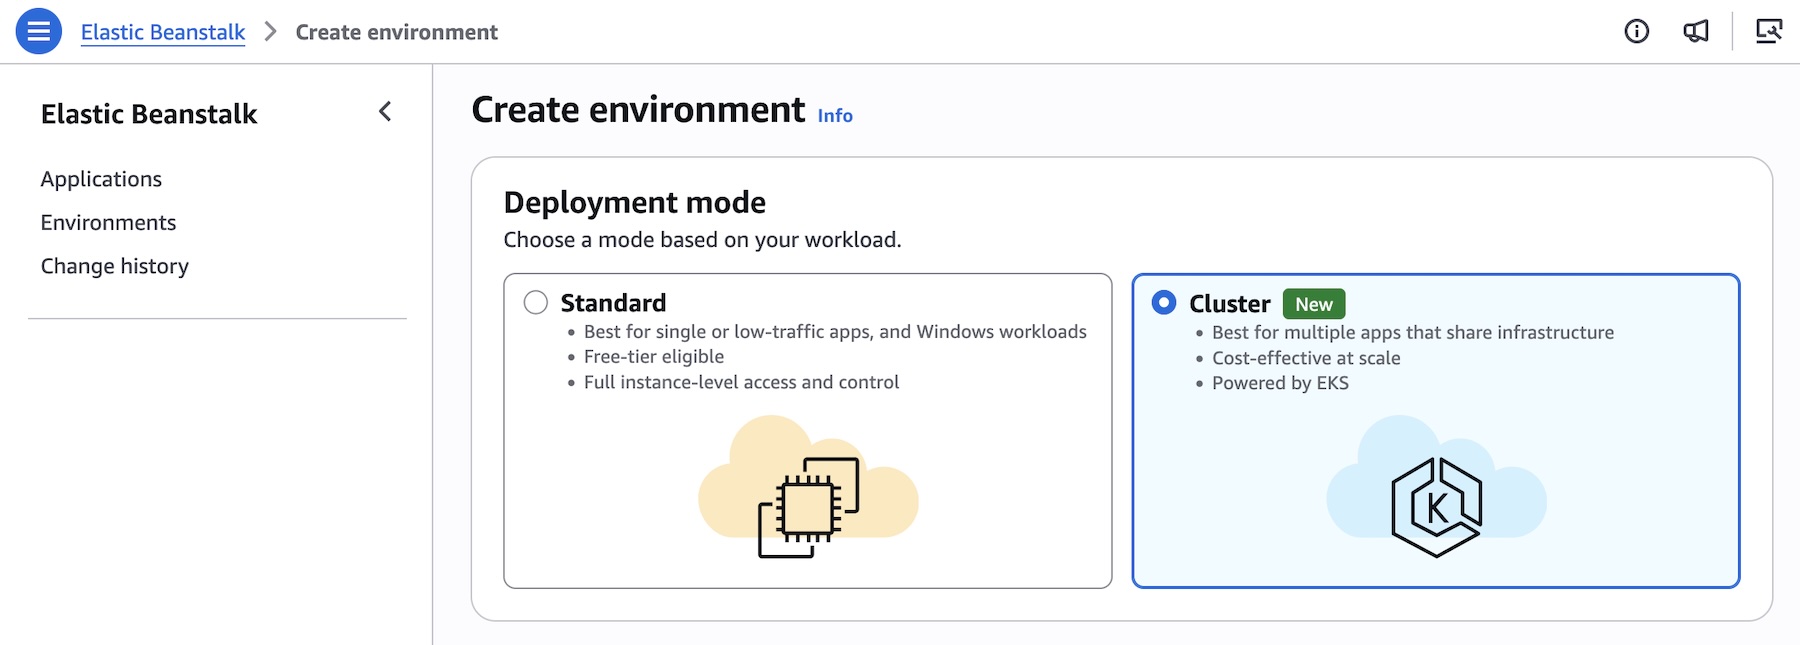
To get started, go to the Elastic Beanstalk console, create a new environment, and choose the Cluster in the Deployment type.

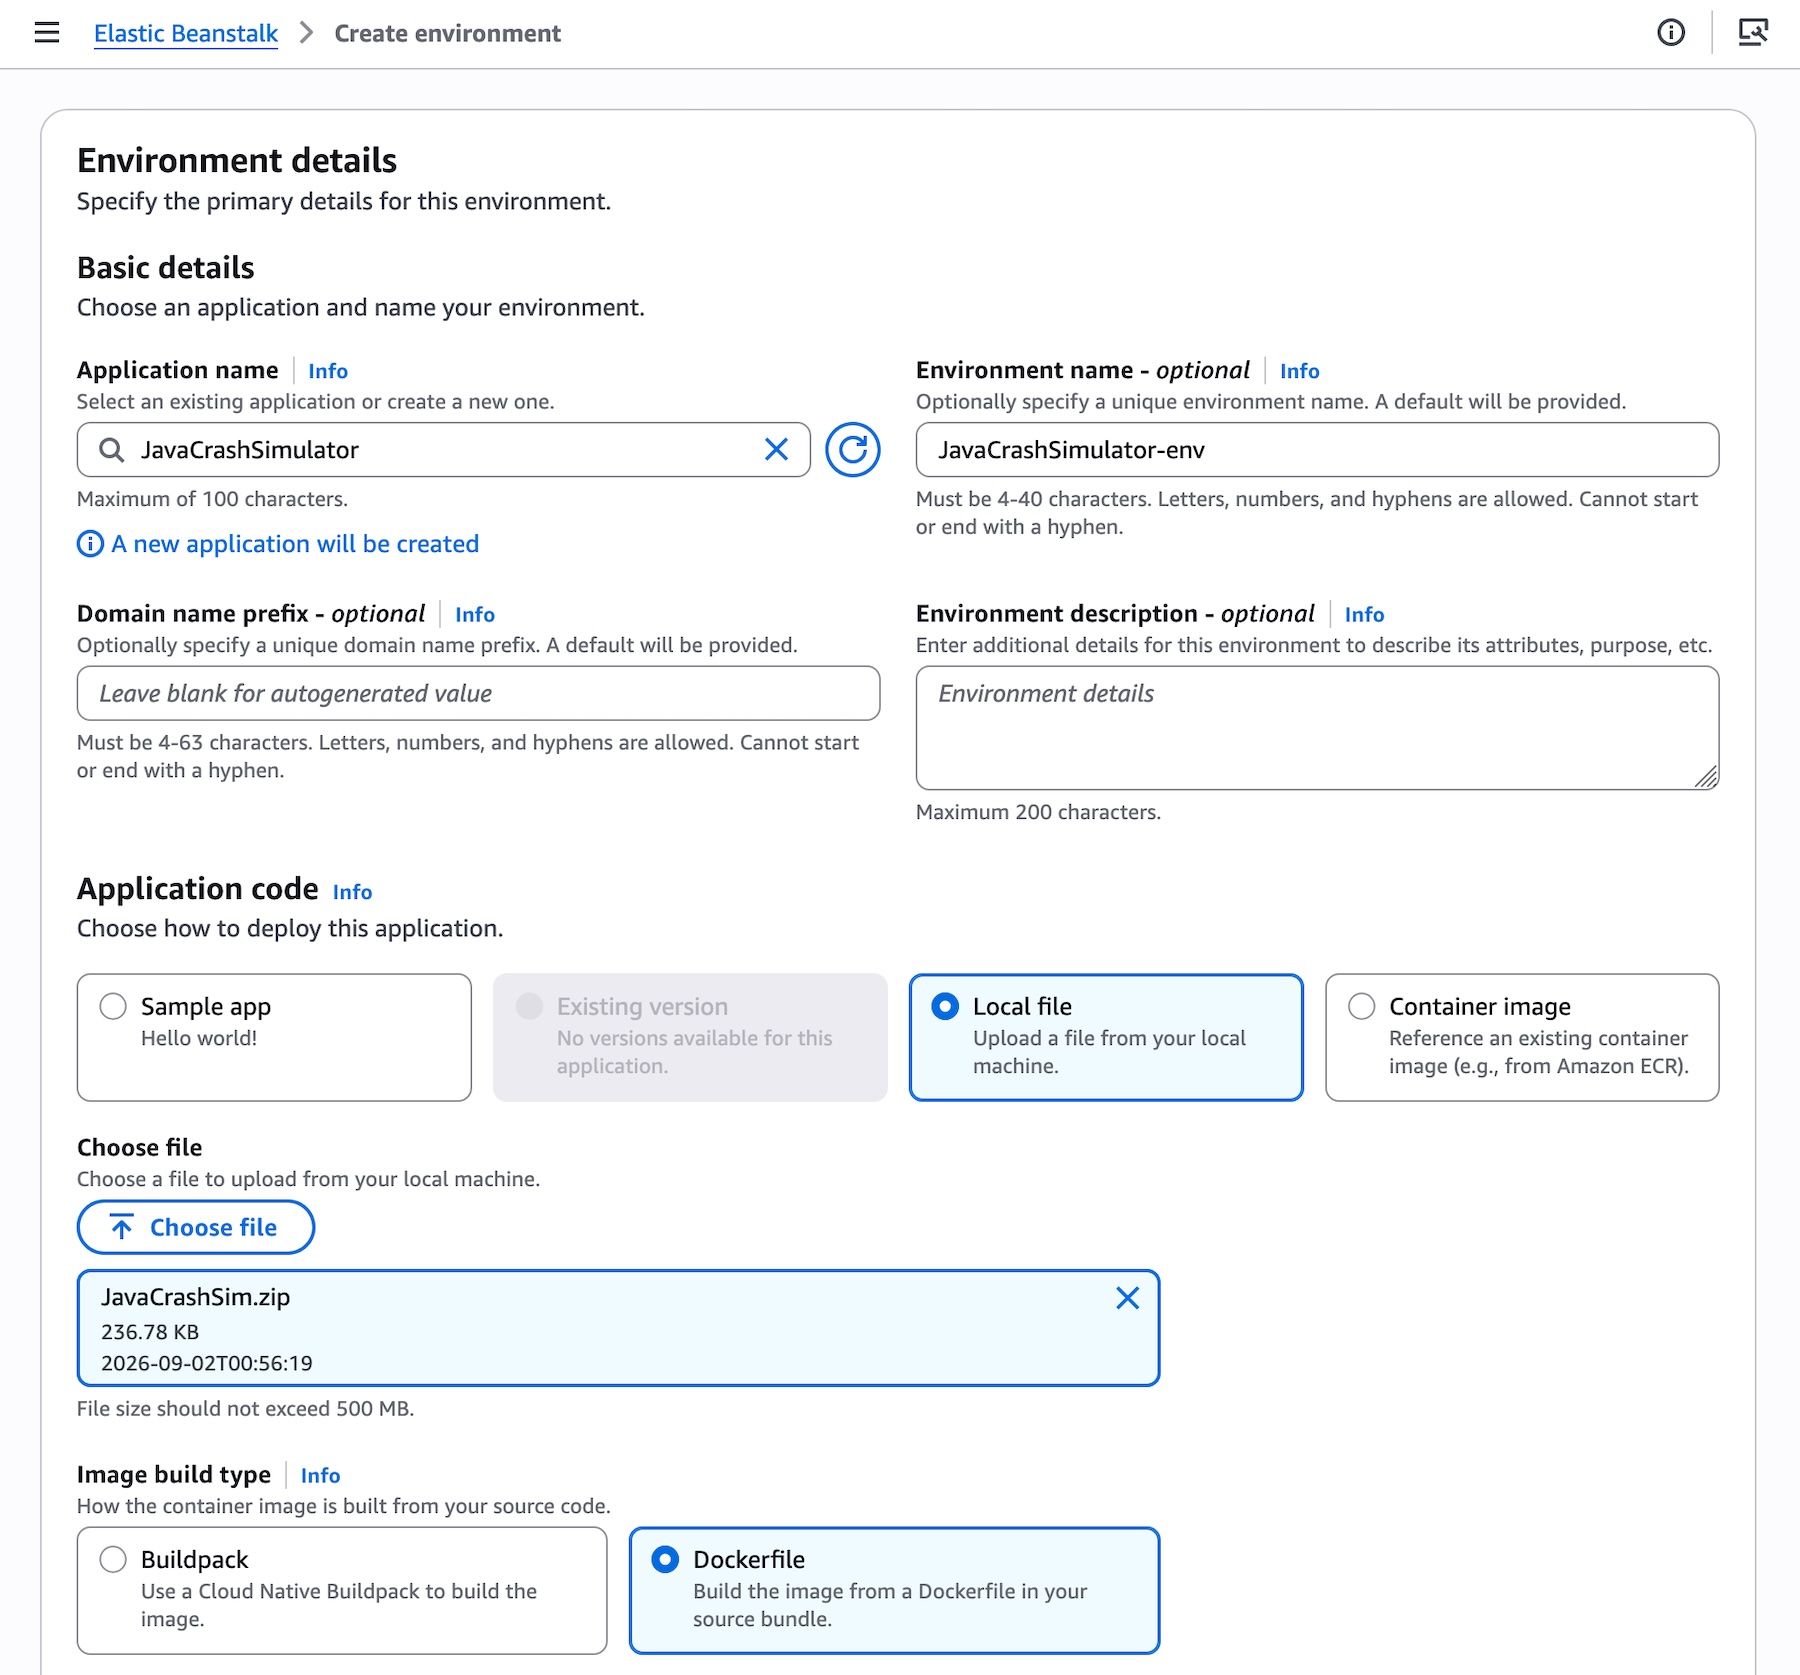
Elastic Beanstalk accepts source code, docker file, or container image to deploy your application. For example, you can provide the application code for your environment by selecting Local file and specifying container image build options. For the rest of the sections, the default values should be good for most scenarios.

Choose Create button and the deployment will begin! Note that the first deployment for a given set of subnets triggers EKS cluster creation, which takes about ten-ish minutes. Subsequent deployments are faster because they reuse an existing EKS cluster.

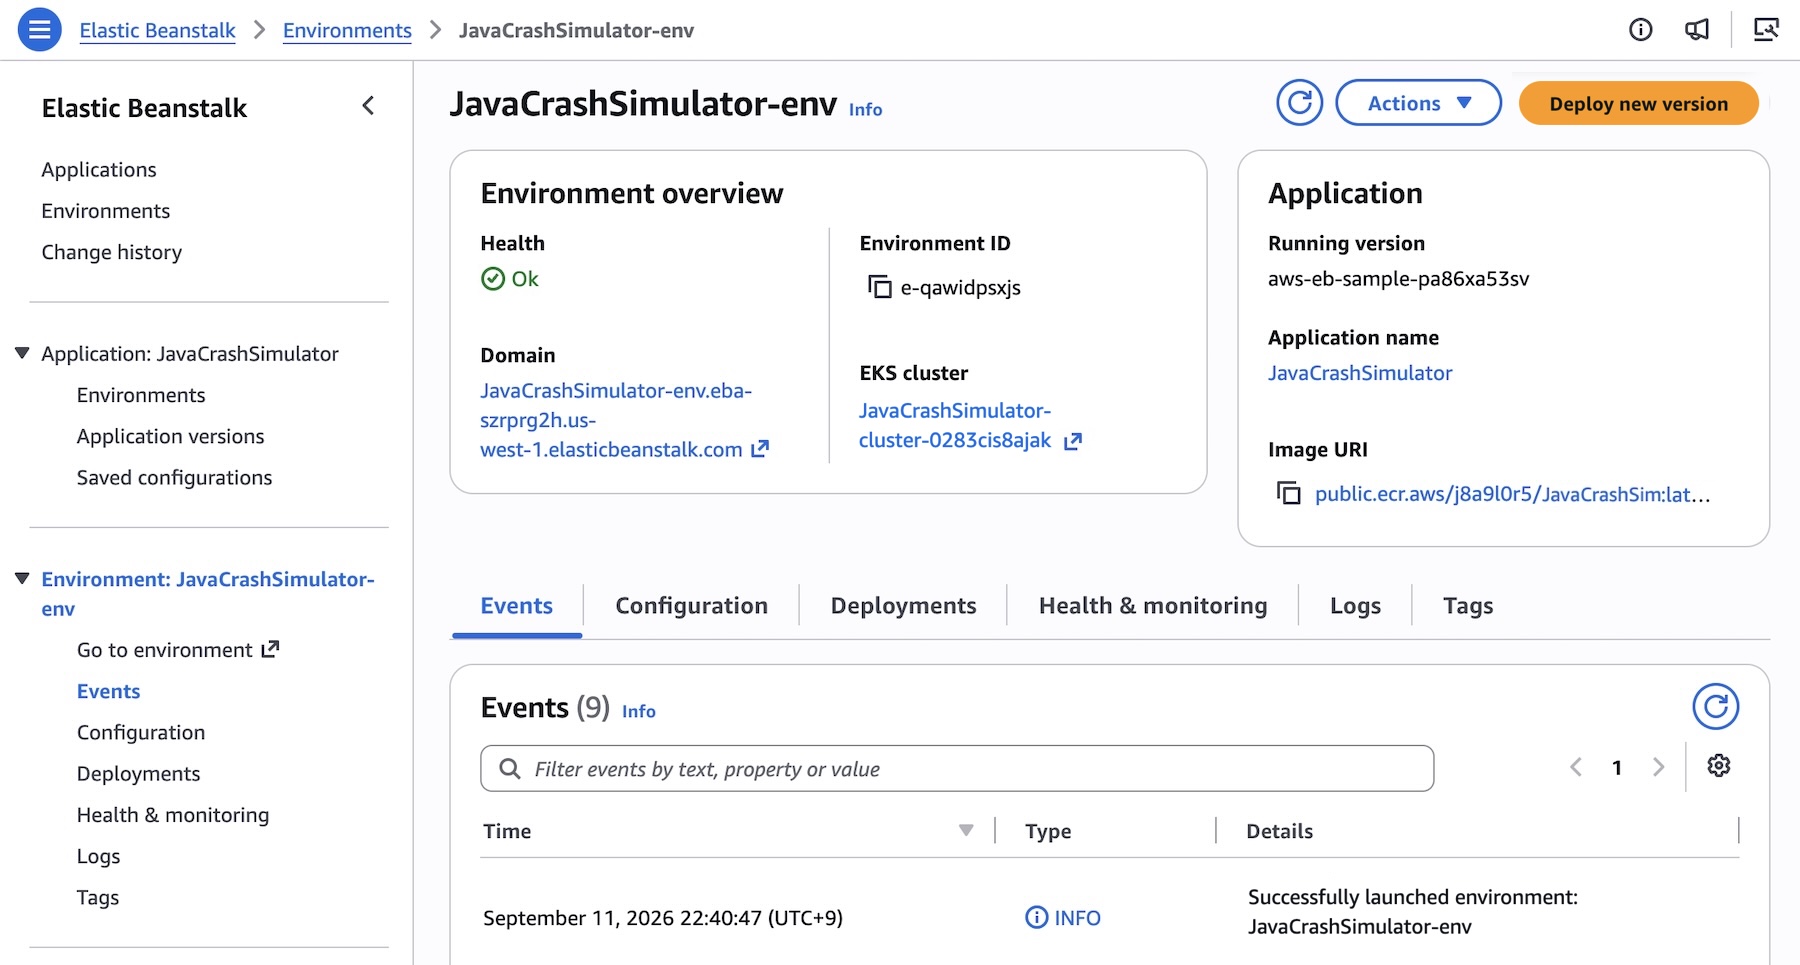
Here’s what it looks like when deployment is successful:

You can also use AWS Command Line Interface (AWS CLI), the EB CLI, or AWS SDKs. For example, consider deploying an application made up of several microservices to Kubernetes. Create an application first.

aws elasticbeanstalk create-application \
    --application-name "my-microservice" \
    --description "Multi-services demo" \

Each microservice may have pre-built images in Amazon Elastic Container Registry (Amazon ECR). Register them as application versions:

IMAGES=(
    "frontend-v1|public.ecr.aws/my-microservices/frontend:v1"
    "cartservice-v1|public.ecr.aws/my-microservices/cart:v1"
    "paymentservice-v1|public.ecr.aws/my-microservices/payment:v1"
    "shippingservice-v1|public.ecr.aws/my-microservices/shipping:v1"
)

for entry in "${IMAGES[@]}"; do
    IFS='|' read -r label uri <<< "$entry"
    aws elasticbeanstalk create-application-version \
        --application-name $APP_NAME \
        --version-label "$label" \
        --image-configuration Source="{Uri=$uri}" \
	--region "us-west-2
    echo "Registered: $label"
done

You can set and deploy the corresponding service options for each service. For example, the frontend service is the only service that needs a public internet interface such as Application Load Balancer and also sets a health check path since it’s an HTTP service:

[
    {"Namespace": "aws:elasticbeanstalk:eks", "OptionName": "cluster-role", "Value": "arn:aws:iam::0123456789012:rol<...>"},
    {"Namespace": "aws:elasticbeanstalk:eks", "OptionName": "node-role", "Value": "arn:aws:iam::0123456789012:role/E<...>"},
    {"Namespace": "aws:elasticbeanstalk:eks:environment", "OptionName": "observability-role", "Value": "arn:aws:iam::0123456<...>"},
    {"Namespace": "aws:elasticbeanstalk:eks:environment", "OptionName": "subnets", "Value": "subnet-1,subnet-2,subnet-3,<...>"},
    {"Namespace": "aws:elasticbeanstalk:eks:environment:autoscaling", "OptionName": "min-replica", "Value": "1"},
    {"Namespace": "aws:elasticbeanstalk:eks:environment:autoscaling", "OptionName": "max-replica", "Value": "2"},
    {"Namespace": "aws:elasticbeanstalk:eks:environment", "OptionName": "cpu", "Value": "0.5"},
    {"Namespace": "aws:elasticbeanstalk:eks:environment", "OptionName": "memory", "Value": "256Mi"},
    {"Namespace": "aws:elasticbeanstalk:eks:environment", "OptionName": "memory-limit", "Value": "512Mi"},
    {"Namespace": "aws:elasticbeanstalk:eks:environment", "OptionName": "service-port", "Value": "8080"},
    {"Namespace": "aws:elasticbeanstalk:eks:alb", "OptionName": "scheme", "Value": "internet-facing"},
    {"Namespace": "aws:elasticbeanstalk:eks:alb", "OptionName": "healthcheck-path", "Value": "/_healthz"}
] #frontend-options.json namespaces

Now, create the frontend service environment with these options. You can continue to deploy each service environment in a similar manner.

aws elasticbeanstalk create-environment \
    --application-name my-microservice \
    --environment-name frontend \
    --version-label frontend-v1 \
    --tier Name=Cluster,Type=EKS \
    --option-settings file:///tmp/frontend-options.json \

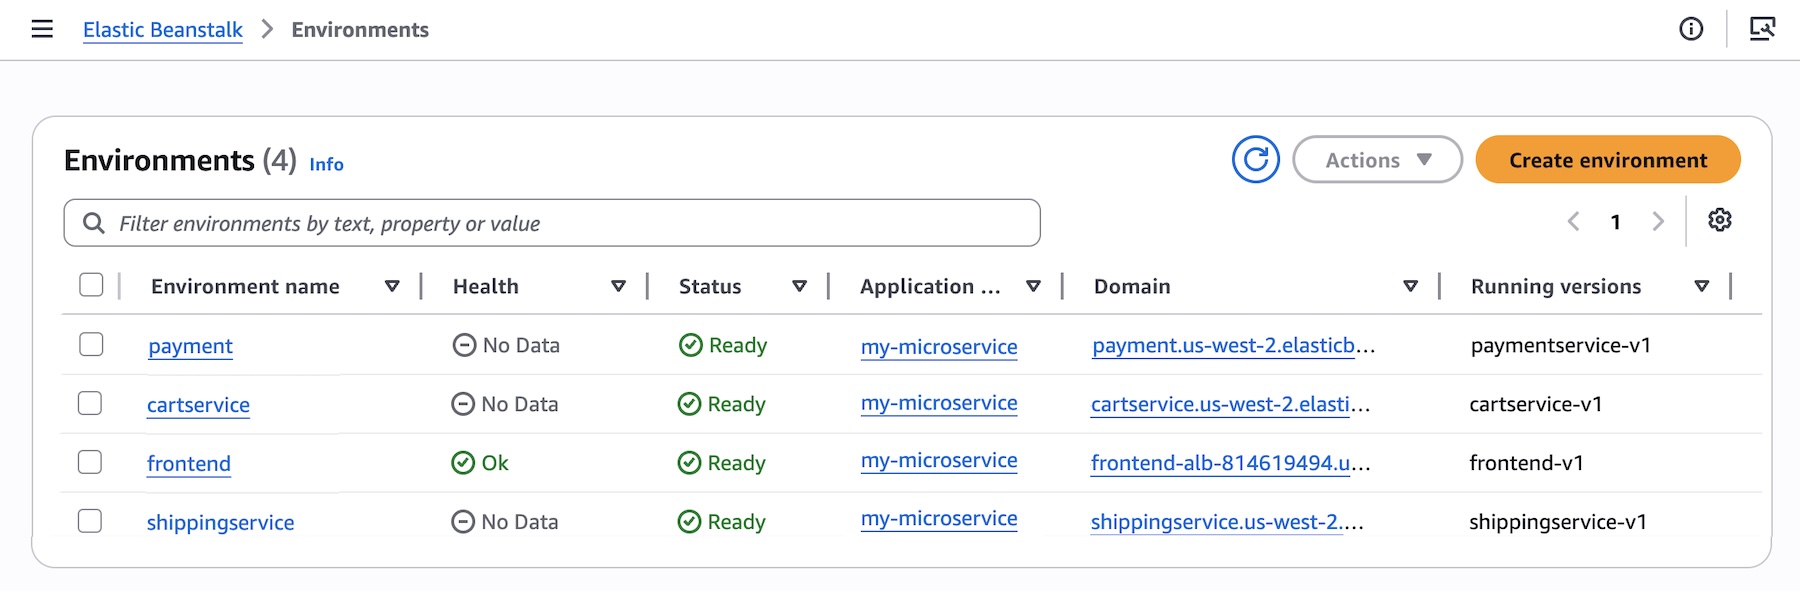
Here’s a look at the console once all services are deployed:

Elastic Beanstalk Standard powered by Amazon Elastic Compute Cloud (EC2) continues to be fully supported. Standard and Cluster Mode environments run side by side within the same Elastic Beanstalk application, enabling teams to migrate one environment at a time at their own pace. Validation checks confirm compatibility before any changes are made, so no environment is forced to move.

Elastic Beanstalk Standard Mode remains the best fit for:

  • Single applications or single-environment use cases
  • Windows/.NET Framework workloads on IIS
  • Applications that cannot be containerized
  • Workloads spending under $500/month where the EKS control plane fee and EKS Auto Mode premium add overhead that a single application cannot offset through bin-packing

To learn more about how to deploy and manage your applications in the Cluster Mode, visit the Elastic Beanstalk Cluster Mode documentation.

Now available
AWS Elastic Beanstalk Cluster Mode is generally available today in all AWS Regions that Elastic Beanstalk is available. For Regional availability and a future roadmap, visit the AWS Capabilities by Region. If you want to call APIs, search documentation, find regional availability, and troubleshooting about this new feature, try using the AWS MCP Server and plugins with your preferred AI tool.

There is no additional charge for Elastic Beanstalk Cluster Mode. You pay only for the underlying AWS resources your applications consume, including the EKS control plane fee, EKS Auto Mode compute (approximately 12% premium on EC2 instance costs), Amazon ECR, and Amazon CloudWatch. Note Elastic Beanstalk Cluster Mode is not AWS Free Tier eligible. To learn more, visit the AWS Elastic Beanstalk Pricing page.

Give it a try in the Elastic Beanstalk console and send feedback to AWS re:Post for AWS Elastic Beanstalk or through your usual AWS Support contacts.

Channy

Multi-modal autoscaling with Amazon EC2 Auto Scaling: adding signals for faster, more reliable scaling

Post Syndicated from Shubhendu Dubey original https://aws.amazon.com/blogs/compute/multi-modal-autoscaling-with-amazon-ec2-auto-scaling-adding-signals-for-faster-more-reliable-scaling/

How do you handle unpredictable workload patterns that spike during promotional events or seasonal peaks? Multi-modal autoscaling with Amazon EC2 Auto Scaling combines infrastructure metrics like CPU with application-level signals, so a group scales on the demand its users create and not only on how busy the servers look. Those signals track the load that drives your business outcomes, such as sales or sign-ups.

CPU-based autoscaling works well for many workloads, but some demand does not register as CPU right away. Adding signals such as request counts and application metrics lets a group respond to the load its users create. By publishing Amazon CloudWatch custom metrics and application-driven triggers, you give Auto Scaling more information to act on.

In our testing, a group that scaled only on CPU rejected about 7,000 checkout sessions during a demand spike, and a stronger baseline that added Application Load Balancer request count still rejected about 6,900. A group that added an application metric rejected none, and it held p99 latency to about 0.43 seconds against 2.25 seconds for the CPU-only group. Predictive scaling can add a forecasting layer for cyclical demand, but it needs days of history to be useful, so we treat it as a complement. In this post, we show you how to implement multi-modal autoscaling on EC2 Auto Scaling, with code samples and results from a controlled test.

Prerequisites

To follow along, you need access to the following AWS services with appropriate permissions:

  • EC2 Auto Scaling, for scaling policies and group management.

  • CloudWatch, for metrics, alarms, and dashboards.

  • AWS CloudFormation, for infrastructure deployment.

Expanding beyond single-metric scaling

The default target tracking policy in EC2 Auto Scaling uses average CPU utilization, a practical starting point because CPU usage is a universal characteristic of compute workloads. Adding complementary signals, such as application-level metrics or predictive forecasting, gives Auto Scaling more information to make timely capacity decisions.

For workloads that need a faster response from target tracking alone, see Faster scaling with Amazon EC2 Auto Scaling target tracking.

In distributed architectures, different components can have distinct scaling characteristics. An API gateway might correlate well with request rate, while a background processor scales better on queue depth. With multi-modal scaling, you can match each component’s policy to its actual workload pattern. For containerized workloads, consider event-driven autoscaling with KEDA on Amazon Elastic Kubernetes Service (Amazon EKS).

Multi-modal autoscaling architecture

Multi-modal autoscaling combines three approaches to capacity management. Reactive scaling responds to current CloudWatch metrics, such as CPU utilization, memory, network throughput, response times, and custom application indicators. Application-metric scaling brings workload-specific signals into the decision, using custom CloudWatch metrics like active user sessions, queue depth, or transaction volume. These application metrics are often the closest measurable proxy for business activity such as orders or sign-ups. Predictive scaling uses machine learning in EC2 Auto Scaling to forecast capacity needs from historical patterns, so infrastructure scales before demand increases.

With application-metric scaling, applications can scale on signals that infrastructure metrics miss. An ecommerce platform might scale on active checkout sessions, while a streaming service scales on concurrent stream counts. In the test later in this post, we use active checkout sessions as the custom metric.

Implementing multi-modal autoscaling

This section builds the configuration in layers. Start with CPU target tracking as a baseline that every group keeps, then add a custom application metric that reflects real user load. The test later in this post compares these signals against a request-count baseline. Predictive scaling is an optional forecasting layer described at the end.

Step 1: CPU target tracking

Start with the foundation that most workloads already use: a target tracking policy on average CPU utilization. Target tracking is a managed policy that adjusts capacity to keep a metric at or near a target value. It supports predefined metrics, including CPU utilization and request count per target, and custom CloudWatch metrics. When multiple target tracking policies are active, Auto Scaling coordinates them: it scales out if any policy requires it, but scales in only when all policies agree, which helps prevent oscillation.

# CPU target tracking scaling policy (ASG A)
CPUTargetTrackingPolicy:
  Type: AWS::AutoScaling::ScalingPolicy
  Properties:
    AutoScalingGroupName: !Ref AutoScalingGroupName
    PolicyType: TargetTrackingScaling
    TargetTrackingConfiguration:
      PredefinedMetricSpecification:
        PredefinedMetricType: ASGAverageCPUUtilization
      TargetValue: 70

Our test also included a second infrastructure baseline, a target tracking policy on the load balancer’s request count per target. It uses the same structure with a predefined metric:

# Request count target tracking (ASG B)
RequestCountPTTargetTrackingPolicy:
  Type: AWS::AutoScaling::ScalingPolicy
  Properties:
    AutoScalingGroupName: !Ref AutoScalingGroupName
    PolicyType: TargetTrackingScaling
    TargetTrackingConfiguration:
      PredefinedMetricSpecification:
        PredefinedMetricType: ALBRequestCountPerTarget
        ResourceLabel: !Sub "${Alb.LoadBalancerFullName}/${TargetGroupB.TargetGroupFullName}"
      TargetValue: 300
      DisableScaleIn: false

Step scaling is another option for spike handling. With step scaling, you can define different capacity increments for different alarm thresholds. It keeps evaluating the alarm during scaling activities, which can make it react faster than target tracking’s default evaluation window. Step scaling policies do not coordinate with each other.

Step 2: Add a custom application metric

Next, add a second target tracking policy on a custom CloudWatch metric that reflects application load. In our test, instances publish an active checkout sessions metric at a 10-second resolution. To act on that resolution, set a Period of 10 seconds on the policy. Without it, the policy waits for three 1-minute datapoints like any other and the high-resolution metric only adds publishing cost. With it, a scale-out can begin in about 30 seconds. The policy includes the Auto Scaling group dimension so it tracks the metric for the right group. We set the target to 100 active sessions per instance, about 75 percent of the measured per-instance capacity of 135. This leaves headroom to absorb a spike while new instances boot.

# Custom application metric target tracking (ASG C)
CustomMetricTargetTrackingPolicy:
  Type: AWS::AutoScaling::ScalingPolicy
  Properties:
    AutoScalingGroupName: !Ref AutoScalingGroupName
    PolicyType: TargetTrackingScaling
    TargetTrackingConfiguration:
      CustomizedMetricSpecification:
        MetricName: ActiveCheckoutSessions
        Namespace: ECommerce/CheckoutMetrics
        Dimensions:
          - Name: AutoScalingGroupName
            Value: !Ref AutoScalingGroupName
        Statistic: Average
        Period: 10
      TargetValue: 100
      DisableScaleIn: false

Step 3: Add predictive scaling

Predictive scaling is an optional forecasting layer. It uses machine learning in EC2 Auto Scaling to analyze historical load and scale ahead of recurring, cyclical demand, using customized metric specifications in ForecastAndScale mode. You need to provide several days of history for it to forecast well, so it complements reactive signals rather than replacing them. Start in ForecastOnly mode to watch the forecast before it drives any scaling.

Monitoring

Use CloudWatch dashboards to track how each policy contributes to scaling decisions, and set alarms on the metrics that matter for your workload, such as per-instance load or latency. Enable detailed monitoring on the launch template, with Monitoring set to true, so that the system publishes CPU metrics every minute. Without it, you cannot complete the CPU policy’s scale-in evaluation and your group will stop scaling in. Watching the policies side by side is what surfaced this scale-in behavior.

Performance results

We compared three Auto Scaling groups under an identical load profile in a single 75-minute test in the us-east-1 Region. Each group used c8g.large instances with a minimum of 6 and a maximum of 40 instances, and every group carried the same CPU target tracking policy at 70 percent as a fallback:

  • ASG A: CPU target tracking only. This is the single-signal infrastructure baseline.

  • ASG B: CPU target tracking plus an Application Load Balancer request-count policy. Request rate is a stronger infrastructure baseline than CPU alone.

  • ASG C: CPU target tracking plus the custom checkout-sessions metric at 10-second resolution, published with a Period of 10 seconds.

All the groups received the same load at the same time. During the shared ramp, arrival rate rose and every group scaled correctly, which makes the comparison fair. CPU crossed 70 percent on the CPU group, request count crossed its target of 300 on the request-count group, and all three converged to a similar size.

Ramp phase (arrivals 30% → 85%) A: CPU only B: A + ALB requests C: A + app sessions
Instances (start → peak) 6 → 9 6 → 10 6 → 10
CPU 73.6% 74.0% 69.0%
Requests per target (target 300) 319 323 297

Then arrival rate was held flat while the number of concurrent checkout sessions kept rising, a shape that infrastructure signals cannot see. The next table reports that divergence phase, measured directly from CloudWatch and the load balancer.

Measured metric (divergence) A: CPU only B: A + ALB requests C: A + app sessions
Instances (start → end) 11 → 11 11 → 11 11 → 22
Rejected checkouts 7,064 6,886 0
CPU (start → end) 67.2% → 45.1% 66.5% → 45.5% 66.2% → 36.8%
Peak sessions per instance 135 135 116
Requests per target 285 → 279 282 → 279 277 → 154

The difference is what each group could see. Arrival rate was held flat while the number of concurrent sessions rose, so CPU and request count stayed in range while the application saturated. The CPU-only and request-count groups held at 11 instances and rejected 7,064 and 6,886 checkouts. Their CPU even fell, from about 67 percent to about 45 percent, because a rejected request never reaches the work it would have done, so a policy targeting 70 percent saw spare capacity at the moment the application was failing users. The application-metric group read the rising sessions directly and scaled from 11 to 22 instances, rejecting none.

Effect on latency and errors

We measured latency and rejected checkouts on the load balancer during the test. At rest, all groups were identical. The gap opened only in the divergence phase, when concurrency rose without a matching change in arrival rate. Session slots are the scarce resource here, so sessions per instance is the causal driver of latency. The application group scales on sessions and we report latency as the outcome, rather than scaling on latency directly, which is not recommended for target tracking. The latency figures come from the load balancer’s TargetResponseTime at the end of the divergence phase. A client-side number measured over the internet would reflect network round-trip rather than the service.

Measured metric A: CPU only B: A + ALB requests C: A + app sessions
TargetResponseTime (average), end of divergence 1.122 s 1.120 s 0.284 s
TargetResponseTime (p99), end of divergence 2.254 s 2.235 s 0.431 s
TargetResponseTime (average) at warm-up 0.283 s 0.283 s 0.284 s
Rejected checkouts, drain phase 4,115 3,631 0

The application-metric group, ASG C, kept per-instance load near its target and rejected no checkouts. Its average latency at the end of the divergence phase was 0.284 seconds against 1.122 for the CPU-only group, and its p99 was 0.431 seconds against 2.254. The request-count group, ASG B, tracked its own signal within range the whole time, which is exactly why it could not react: request rate was flat while concurrency climbed.

Once every group has enough capacity, they perform the same. The value of the application signal is in the transition, the gap between when demand arrives and when the fleet is ready, which the infrastructure signals here never detected.

Handling known high-traffic events

For planned events like flash sales, scheduled scaling can pre-scale capacity ahead of time. Multi-modal scaling complements scheduled scaling by handling unplanned spikes and organic traffic that does not follow a fixed schedule.

Understanding cost implications

Running the application signal requires more instances. During the spike it held about 22 instances, against 11 on the infrastructure-only groups. That extra capacity is what kept sessions per instance near the target and stopped the group from turning checkouts away. For your own workload, the question is whether a spike’s worth of extra instances costs less than the checkouts you would otherwise reject.

Conclusion

Multi-modal autoscaling combines infrastructure metrics with application-level signals so a group scales on the demand its users create, not only on how busy its servers look. In our test, a group that scaled only on CPU rejected about 7,000 checkout sessions during a demand spike, and a stronger baseline that added load balancer request count still rejected about 6,900. A group that added a custom application metric rejected none, and held p99 latency near 0.43 seconds against 2.25 seconds for the CPU-only group. Its CPU even fell while the infrastructure groups were failing requests, which shows why an infrastructure signal alone can miss the demand that matters.

Start with CPU target tracking as a fallback. Add a signal that reflects the load your users create, and pick the one that tracks closest to a business outcome like orders or active users. Set a Period on a high-resolution custom metric so the policy can act on it, and enable detailed monitoring so scale-in works. Predictive scaling is worth adding for demand you can forecast, once the group has days of history to learn from.

To implement multi-modal autoscaling, you can open Amazon EC2 Auto Scaling in the AWS Management Console and add a second scaling signal to one of your existing groups, following the configuration steps in this post. For a deeper look at target tracking behavior, see Faster scaling with Amazon EC2 Auto Scaling target tracking. The Amazon EC2 Auto Scaling User Guide covers predictive scaling policies, custom metrics, and scaling cooldowns in detail.

The collective thoughts of the interwebz