AMD’s EPYC Venice is coming, and OEMs are eager to show off their upcoming wares. At Computex we caught MSI’s CD182-S6091-X2 (DLC), a liquid cooled dual socket 1OU2N server node
Предметът, който най-много мразех в училище беше биологията. Пълен с неща за запомняне/зазубряне, без никаква централна идея защо нещата са така, просто купчина неща, взаимодействащи си по някакъв начин. Нито един отговор “защо”, освен “вероятно по друг начин нямаше да работи”.
Тези дни зачетох “How Life Works: A User’s Guide to the New Biology” на Phillip Ball (бил освен всичко 10 години редактор на “Nature”), и там има изрично засегнат този момент – че гледаме една система, на която нямаме никаква идея защо е така (и вероятно няма “защо”), огромна купчина взаимодействащи си неща, толкова сложни, че още не може да ги разберем дори как работят и защо.
(това го има в wikipedia за много лекарства, “механизмът на действие не е съвсем ясен”)
Струва ми се, че вървим в подобна посока и с информатиката (или IT-то, или computer science, както и да му викате). Става все по-лесно да се сглоби нещо от готови компоненти и то някак да сработи, без да има идея дали от някаква част има смисъл, да се прекали с абстракциите и да се чудиш после как да пренесеш информация между три слоя и всякакви такива неща. AI-то единствено показва как може да се ускори този процес, защото преди неща, които щяха да са достатъчно хамалогия, че човек да се спре и да се замисли “абе, дали наистина има смисъл”, сега са просто някакво чакане.
И уж има абстракции, та човек може да се спре на едно ниво абстракция и да разглежда системите там, и да е сравнително поносимо. На практика обаче (това може и да е selection bias, щото при мен все идват по-“интересните” проблеми) абстракциите протичат, и това води до все по-сложни за оправяне проблеми.
Та с колкото по-малко идея правим системи, толкова по-трудни ще са за разбиране, и ще стигнем до същите методи на “лечение”. Не искам да обиждам докторите, които имат наистина отвратителна област на работа (не може да репродуцираш проблем, не може да правиш експерименти, инструментариумът е на невероятно допотопно ниво спрямо каквото наистина би било нужно, и безумно скъп, все едно добавянето на един printf да струва милион евро), но голяма част от решенията са почти от типа на онова с windows-ите, “рестартирай и ще се оправи” – почти никога няма сигурност и яснота дали наистина е това, просто щото няма как.
Все още е възможно да се събере екип за всяка една система, която сме направили, който да е до около 15 човека (числото си го измислям, но ми звучи правилно), и да може да я разбере end-to-end. Дали ще стигнем до момент, в който и 150 няма да стигнат?
The next generation of server memory is slated to get even faster. At Computex 2026 Micron was showing off DDR5-8000 RDIMMs, while Samsung had uber-fast 12,800 MT/s second-gen MRDIMMs
Adrian Mastronardi has released a book called Half a Second; it is a
detailed look into the XZ backdoor attempt
of 2024. The book is freely available under a (non-free) noncommercial,
no-derivatives CC license.
Half a Second tells that story as one continuous narrative:
the burned-out volunteer who maintained the code alone and was
patiently, expertly manipulated into giving it up; the engineer
whose half-second of curiosity caught the attack through a chain of
luck and hard-won instinct; and the operator who built it, who has
never been identified and, this book argues, may never be.
На „Прогресивна България“ и Румен Радев спешно им е нужен някакъв майсторски клас по политическо илюзионно изкуство, за да задържат магията, с която омаяха близо милион и половина гласоподаватели. Защото само магия или някаква слепота с ирационален произход може да прикрие как едно или друго гръмко обещание се разбиват в суровата реалност на управленската немощ.
Икономическата цена на този фарс „прогресивен“ (оплескахме я вече и тази дума) съвсем няма да е символична и вече се калкулира на гърба на данъкоплатците. Няма по-ярко доказателство за липса на кураж и капацитет за реформи от бюджета на излъганите надежди на министър Гълъб Донев.
На този фон през седмицата Румен Радев затвърди очакванията, че ще превърне България в „троянско магаре“, обслужващо руските интереси в Европа. Шумно заявеното оттегляне на България от т.нар. Коалиция на желаещите в подкрепа на Украйна е най-малкото загърбване на европейската солидарност, с което премиерът лицемерно жертва дипломатически капитал за електорална любов. Това, че ден по-късно външната министърка направи обратното, няма как да не е част от сценария. Или пък не?
За първи път обаче от близо 40 години насам български премиер си позволява да каже, че мястото на България не е там, където са Франция, Германия, Италия, Испания, Дания, Норвегия, Швеция, Нидерландия, Великобритания… И това няма да се размине без щети. Включително в любовта на електората, който никак не обича да е в отбора на губещите.
В своята нова статия за „Тоест“ Емилия Милчева осветлява един безпрецедентен казус: за първи път Комисията за защита от дискриминация признава, че една община – в случая Самоков – поддържа етническо разделение в училищата. Под това решение стои и подписът на настоящия вицепремиер Иво Христов, което внася темата директно в дневния ред на управляващите.
Емилия напомня, че над 200 училища в страната днес са сегрегирани чрез правила за прием и зониране, които всъщност лицемерно циментират предразсъдъците. Неудобният въпрос е: искаме ли изобщо децата ни да учат заедно, или институционалният расизъм умишлено ни отнема дори шанса да се опитаме, за да задоволи тихия конформизъм на мнозинството? Статията на Емилия изисква честен отговор от всеки от нас.
Децата също умират.Българските държавни системи не са пригодени да подкрепят детството нито в живота, нито в смъртта, пише Надежда Цекулова в поредния си много болезнен текст от поредицата „Да говорим с грижа“. В него тя ни среща с клиничната психоложка Камелия Стоянова и анестезиолога доц. Богдан Младенов.
В техните думи и съпреживени страдания личи реалното проявление на грижата, в която най-важните неща невинаги са твърде сложни за постигане – като липсата на болка или възможността на родителите да бъдат до леглото на детето си отвъд стерилните забрани за свиждане в интензивните отделения. И не на последно място – нуждата от психологическа подкрепа за самите медици, за да се справят със своята част от емоционалния товар. Този текст наистина причинява болка, но трябва да бъде прочетен, за да предизвиква не някаква жалост, а решителни действия.
Събитията от кухнята на медиите често остават скрити зад фасадата на „редакционните решения“, но когато някоя гипсова маска падне по-шумничко, наяве излизат лица и истини с трудно поносима грозота. В острия си анализ „Има ли кой да ги накаже? За забранителните списъци в bTV и кебапчетата в медиите“ Дарина Сарелска разплита скандала, започнал от една изтекла вътрешна комуникация.
Текстът разказва историята за сваленото интервю, но повдига важните въпроси за границите на властта в частните медии и за сбърканото разбиране за доверието, което не трябва да бъде между гостите и редакцията или между журналистите и собствениците, а единствено между медията и нейната публика.
Когато стане дума за цензура, първосигналният рефлекс е да се защити „забраненото“. Но какво ако зад маската на борба за свобода на словото наднича чиста проба ксенофобия, ислямофобия или възхвала на саморазправата? Или всичко това в комплект?
Статията на Светла завършва със случка, която ме върна към скорошна статия на колегите от „Капитал“, която силно препоръчвам – много любопитен разговор с турския кулинарен изследовател Муса Даадевирен, в който той, говорейки за храна, всъщност споделя важни общовалидни истини. Ето една от тях:
… между обикновените хора има много малко враждебност. Конфликтите обикновено са между хегемонии и политически програми.
Добро напомняне за днешните политици, които, обречени на мимолетност, прикриват своята немощ с разделящ популизъм. Но и за нас, останалите, да не се подвеждаме, защото това, по което си приличаме, е много повече от това, което ни разделя.
Но да се върна на кинотематиката по-горе…
Всеки голям кинофестивал е огледало едновременно на себе си и на света. От тазгодишния двоен юбилей на фестивала в Карлови Вари Нева Мичева се завърна с текст, който е не само критически разрез на съвременното кино, показано там, но и бунт срещу неговото интелектуално и художествено обедняване. И разбира се, тя ни насочва към изключенията, които устояват на лесните отговори. Едно от тях е датският дебют „Гостенката“ на режисьора Мадс Менгел – а неговия прочит за сложните, противоречиви семейни връзки и нуждата от непредубедено любопитство към другия ще откриете в краткото, но съдържателно интервю, вградено в репортажа.
Нева ни провокира да се запитаме кога най-после ще съберем кураж да се взрем в сложността и красотата на собствения си свят отвъд удобните и вече втръснали шаблони. Текст, който задължително трябва да прочетете, преди да си пуснете следващия филм.
И докато в реалния свят сме залисани с политически битки и социални катаклизми, в рубриката „Игромислие“ Миглена Николчина и Северина Станкева правят своеобразна дисекция на една от най-награждаваните, но и най-дискутирани видеоигри на миналата година – „Светлосянка: Експедиция 33“ (Clair Obscur: Expedition 33). Двете авторки категорично отказват да се плъзнат по повърхността на натрапчивата семейна драма в сюжета и вместо това се гмуркат в дълбоките философски и естетически пластове на играта.
В рубриката ни „На второ четене“ Стефан Иванов представя новото юбилейно издание на стихосбирката на Георги Господинов „Черешата на един народ“, което приютява в книжното си тяло си и собствената си 30-годишна критическа рецепция. В един сложен и многопластов текст Стефан акцентира върху препрочитането на едни и същи стихове през дистанцията на три десетилетия. Той пише за трудното „сбъдване по каталог“ – Шенген, еврото и нискотарифните полети до и отвъд Босфора, – което остави метафизичната тъга на дядовците ни без географско убежище.
Стефан пише и за по-лошото – че докато поезията от 90-те сякаш си играеше на думи, днешната брутална реалност буквализира метафорите с плашеща сериозност: „Възраждане“ се превърна в парламентарна марка, детинският геополитически страх се материализира в истинска война на два дни път с кола, а постмодерната ирония капитулира пред плоските конспиративни теории на интернет троловете. Един горчив, но необходим прочит, който показва, че дори историята да се сбъдва грозно, истинската поезия остава непокътната. Достатъчно е просто да четем. Бавно.
А за да има какво да четем и за да не пропускаме есенцията и смисъла на най-важните теми от ежедневието, се грижи екипът на „Тоест“, който разчита единствено на дарения от читателите си, за да върши своята работа. Мъглата пред всички ни е доста гъста, затова е още по-важно публицистиката и журналистиката да са на мястото си. Демокрацията умира в тъмнина.
On July 17, 2026, a GitHub Security Advisory was published for CVE-2026-63030, a critical unauthenticated remote code execution vulnerability affecting WordPress Core. WordPress Core. While the official GitHub security advisory classifies the severity as Critical, the vulnerability has currently been assigned a CVSS score of 7.5. WordPress is one of the most widely deployed content management systems, making vulnerabilities in its core software potentially significant for organizations operating public-facing websites. The vulnerability reportedly allows an unauthenticated attacker to execute code via the WordPress REST API batch endpoint, potentially resulting in complete compromise of the website and its underlying data. No valid account or user interaction is required.
According to the advisory, the vulnerability affects WordPress versions 6.9.0 through 6.9.4 and versions 7.0.0 through 7.0.1. The issue is fixed in WordPress 6.9.5 and 7.0.2. A fix is also included in WordPress 7.1 Beta 2.
Cloudflare reported that the vulnerable code path can be reached when a persistent object cache is not in use. Searchlight Cyber, whose researchers identified the vulnerability, stated that it can be exploited remotely against a default WordPress installation without requiring additional plugins.
Technical exploit details have not yet been published by Searchlight Cyber, as of July 17 5:45 PM Eastern time. At the time of publication, Rapid7 is not aware of publicly confirmed in-the-wild exploitation. Organizations should not interpret the absence of public exploitation reports as an indication of low risk, particularly given the vulnerability’s unauthenticated attack path and the widespread deployment of WordPress; affected WordPress sites should be urgently patched. Due to WordPress Core being an open-source project and given the current ability of AI models to analyze open-source code, Rapid7 Labs believes it is highly likely that a public PoC will be made available in a short period of time.
Mitigation guidance
Organizations operating affected WordPress installations should prioritize upgrading immediately. Applying the WordPress-provided update is the most effective way to remediate CVE-2026-63030.
Affected and fixed versions include:
WordPress branch
Affected versions
Fixed version
Earlier than 6.9
Not affected by CVE-2026-63030
No action required for this CVE
6.9
6.9.0 through 6.9.4
6.9.5
7.0
7.0.0 through 7.0.1
7.0.2
7.1 beta
Affected beta versions were not fully specified
7.1 Beta 2
WordPress maintainers stated they are forcing updates for affected installations with automatic updates enabled. Administrators should nevertheless verify that each internet-facing WordPress website has successfully upgraded to WordPress 6.9.5, 7.0.2, or another fixed release appropriate for its branch. Workarounds are not recommended at this time.
Rapid7 customers
Exposure Command, InsightVM, and Nexpose
Exposure Command, InsightVM, and Nexpose customers can assess exposure to CVE-2026-63030 with authenticated vulnerability checks available in the July 20th, 2026 content release.
By AI Platform’s Model Runtime team and Inference team
Introduction
Most organizations consume LLMs through hosted APIs. Netflix went further — we run the full stack ourselves, from model deployment through inference, inside our existing production environment rather than a separate ML silo. Some of those decisions weren’t obvious, and a few revealed their trade-offs only under production load.
This post focuses on the choices where alternatives were seriously considered: engine selection, model packaging, API surface design, deployment strategy, and output constraints enforcement. The goal is to share not just what was built, but why — and what production revealed that the design phase didn’t anticipate.
Architecture Overview
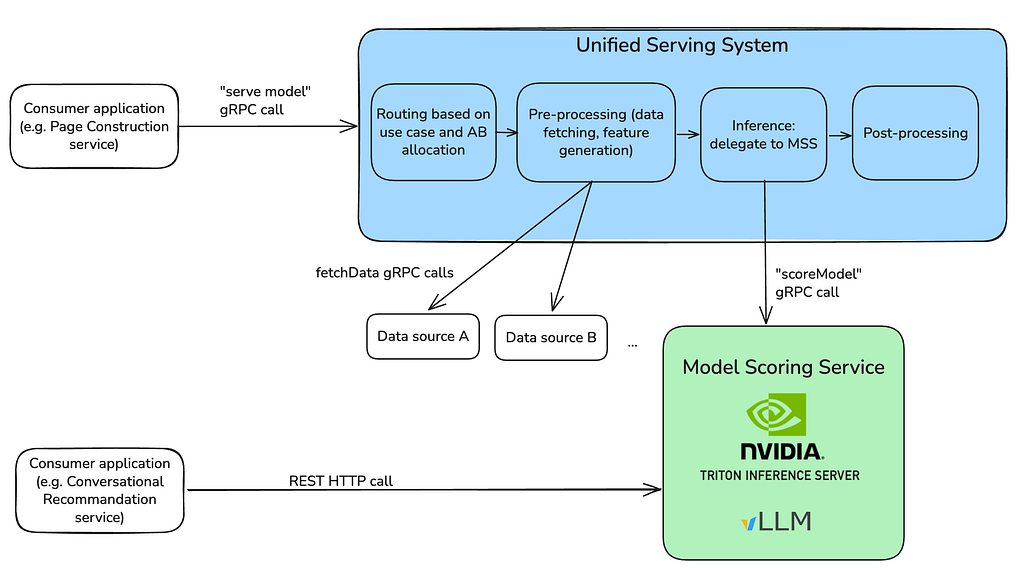
Member-scale ML at Netflix is fronted by a unified JVM-based serving system that handles the end-to-end flow for downstream consumers: routing and A/B test logic, candidate generation, feature fetching, inference, post-processing, and logging at each stage. Both real-time and cached batch paths are supported. Figure 1 shows the two ways callers reach inference today: the gRPC path through this serving system and a direct HTTP path used by newer LLM-driven applications.
Where inference runs depends on the model. Small CPU models run in-process, avoiding remote-call overhead. Larger models need GPUs — the serving system handles pre- and post-processing locally but delegates inference to a remote service, Model Scoring Service (MSS). MSS is the shared inference backend, supporting XGBoost, TensorFlow, PyTorch, and LLMs behind a unified interface, with NVIDIA Triton Inference Server underneath managing model loading, batching, and GPU scheduling.
On top of Triton sits a Java control plane that handles deployment, versioning, health checking, autoscaling, and multi-region rollout. Model authors package their artifacts and configure the deployment; the control plane provisions GPU instances, configures Triton, and orchestrates zero-downtime upgrades.
Figure 1. Serving Architecture Overview
Design Decisions and Implementation
Four decisions shape this platform — engine, packaging, API surface, and rollout — presented in dependency order, since each one constrains the next.
vLLM as the Paved-Path Engine
The platform was originally built on TensorRT-LLM, a performant inference engine at the time and already integrated with Triton — the compute backend in use within MSS.
By summer 2025, two things had shifted: open-source engines had largely closed the performance gap with specialized stacks, and our workload mix had broadened to include embedding generation, prefill-only inference for ranking and retrieval, autoregressive decoding, and custom models with non-trivial per-step constraint logic. We re-benchmarked against this mix and selected vLLM as our paved-path engine on operational fit:
Loads custom model architectures without a multi-step compilation pipeline — faster iteration on non-standard models.
Extensibility hooks for custom decoding logic — necessary for the constrained-decoding work described later.
Debuggability — easier to inspect failures and intermediate state than with a compiled engine in earlier TensorRT-LLM.
Familiarity — many ML practitioners were already using vLLM in research, which cut the research-to-production handoff cost.
Integrating vLLM into Triton
With vLLM picked, the next decision was how to package models for it. Triton supports two ways, and the choice has significant implications for maintainability — specifically, how tightly model artifacts are coupled to frontend upgrades.
Python backend. The author defines explicit input/output tensor specs at packaging time. These specs are frozen in the artifact and must match what the third-party vendor’s frontend’s request builder expects, so every frontend upgrade that touches I/O specs requires a coordinated change to packaging code; otherwise, requests fail at runtime.
vLLM backend. The artifact is just a JSON config pointing to the model weights and tokenizer. Triton’s vLLM backend reads this config and generates I/O tensor specs dynamically at deployment time — the author never defines them. Models and frontend evolve independently.
The vLLM backend is the architecturally correct default. Two things bit us in production:
Triton/vLLM version mismatch. Triton’s vLLM backend is compiled against a specific vLLM API surface. When the two drift — for example, Triton 25.09 importing vllm.engine.metrics, a module removed in vLLM 0.11.2 — the backend fails to load entirely. The platform has to pin compatible versions when baking the service image, and prevent model authors from overriding the vLLM version at packaging time.
Custom model logic. The vLLM backend expects a standard HuggingFace-compatible model and handles the full inference lifecycle. Models needing custom preprocessing, postprocessing, or non-standard execution — ensemble pipelines, custom tokenization — must use the Python backend, which gives full control over execute(). This escape hatch will likely remain necessary for a subset of models.
Ecosystem-Compatible HTTP Frontend
With engine and packaging settled, the next question is how callers reach the system. A key design goal of our system was that LLM models should NOT be special snowflakes. Every model — XGBoost ensemble or large-scale LLMs — is scored via the same gRPC call, so we reuse the same client libraries, health checking, and deployment pipelines. Given that the OpenAI-compatible API interface has become the de facto interface for the LLM ecosystem — inference engines, orchestration frameworks, evaluation tools, and client libraries all speak it — so we expose the OpenAI-compatible API as an additional frontend alongside gRPC.
The payoff shows up in the experimentation-to-production path: graduating from a hosted model to a fine-tuned self-hosted one — for quality, latency, cost, or data privacy — is nearly seamless. Same API, minimal code changes.
Behind the API, the implementation reuses NVIDIA’s Triton OpenAI-compatible frontend. It starts an embedded Triton server, wraps it in a TritonLLMEngine that converts request schemas into Triton inference requests, and serves responses through FastAPI. KServe HTTP/gRPC frontends are enabled alongside, so the same Triton instance remains accessible to the Java control plane over gRPC. Adopting Triton’s frontend directly exposed one gap: response_format — accepted by the schema — was silently dropped before reaching vLLM, so that a caller requesting JSON output proceeded without guided decoding constraints and could receive malformed JSON with no error surfaced by the platform. We git-subtreed and patched the frontend to translate response_format into vLLM’s guided decoding parameters at request time.
Deployment Strategies
With API surface and engine in place, the question that remains is how new versions roll out without dropping requests. GPU deployments take longer to bring up than CPU services, and the I/O schema may change between model versions — adding a coordination problem on top. The platform offers two strategies:
Red-Black deploys a new version alongside the current one. Once the new instance passes health checks, traffic shifts in phases — the new version scales up while the old scales down at the same rate. If any step fails, the system triggers an atomic rollback. Red-Black is the right choice when the model interface is stable. Production revealed a coordination gap when a new version requires an I/O schema change (e.g., new tensor dimensions): the upstream consumer can’t update its config until the new model is fully live, so it inevitably sends “old” requests to a “new” deployment during the migration window, and those fail.
Versioned solves that gap by maintaining an independent deployment for every (modelId, modelVersion) pair. Multiple versions serve simultaneously, decoupling model deployment from consumer updates: the consumer waits for the new version to be fully ready before switching its config, while the old version keeps serving legacy traffic. The platform cleans up older deployments after inactivity but always preserves the latest. The trade-off is a temporary increase in GPU cost during the transition overlap.
We recommend embedding variable configurations (e.g., tensor shapes) directly into the inference model to make it version-agnostic, so it can use the cheaper Red-Black path. Versioned is reserved for the rare cases where a breaking interface change is unavoidable.
Operational Notes
Beyond those four decisions, two operational details are worth flagging — both hit production gaps the design phase didn’t anticipate.
Boot sequence
Bringing a vLLM-on-Triton instance up involves several coordinated steps before the gRPC port opens. Two are non-routine.
Model caching. Downloading large LLMs directly from S3 or Hugging Face at startup is slow enough to inflate cold-start latency past what schedulers tolerate. We materialize models on Amazon FSx at the time of model announcement, so warm starts hit a high-performance file system instead of object storage.
Embedded vs standalone Triton. When consumers need the OpenAI-compatible API, Triton runs as an embedded server inside the OpenAI-compatible frontend process; otherwise, it runs standalone. This is configured per-deployment at packaging time.
The rest of the boot sequence is mechanical: extracting the model package, installing custom vLLM plugins via Python entry_points, cleaning the Prometheus multiprocess directory, and gating the gRPC port until the engine is ready.
Unified metrics endpoint
The Prometheus cleanup above hints at a wider observability gap. vLLM writes metrics to PROMETHEUS_MULTIPROC_DIR as .db files; Triton reports server-level metrics through its own Prometheus endpoint. Neither is aware of the other, and Triton’s built-in bridge surfaces only 9 of 40+ vLLM metrics — missing critical ones like token throughput, KV cache utilization, and prefix cache hit rates.
We added a lightweight HTTP proxy that merges both into a single /metrics endpoint: it fetches Triton metrics via HTTP, reads vLLM metrics from disk using Prometheus’s MultiProcessCollector, and returns the combined output. Existing dashboards and alerts work without modification.
Deep-Dive: Constrained Decoding at Scale
Some Netflix production workloads rely heavily on fine-grained control over token generation. Rather than applying business logic after inference — paying for invalid generations, then retrying or repairing — we push constraints inside the decode loop, so the model generates outputs that are compliant by construction. We implement this via vLLM’s custom logits processor interface, modeling each constraint as a state machine that evolves with the generated token history and emits token-eligibility masks at each step. Each request gets its own configured processor, since different requests apply different rules.
Getting this to scale ran across two engine versions: we initially deployed on vLLM V0 (V1 had feature gaps), then migrated to V1 in Q4 2025 once it matured. The two subsections that follow are the before-and-after.
Why the first implementation didn’t scale
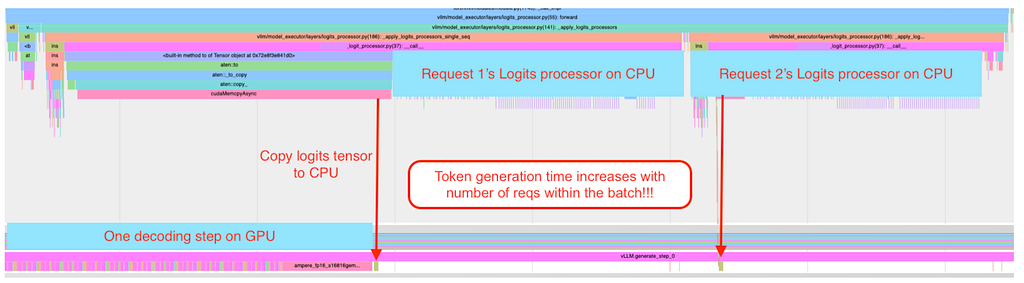
Our initial pure-Python implementation worked functionally but hit a scaling bottleneck. In vLLM V0, custom logits processors run per-request: the GPU produces logits for the whole batch, the CPU copies them across and waits for the transfer, and then constraint logic runs sequentially for each request — sequentially because the GIL prevents Python from parallelizing the per-request work. CPU time in logit processing therefore grows linearly with batch size, hitting tail latencies. End-to-end latency becomes CPU-bound even though the model’s forward pass is batched efficiently on GPU. It’s a bottleneck invisible in single-request benchmarks that only surfaces under realistic concurrency. Figure 2 makes the serial pattern visible.
Figure 2: Logits processor serial execution on CPU with vLLM V0
vLLM V1 enabled a batch-level design
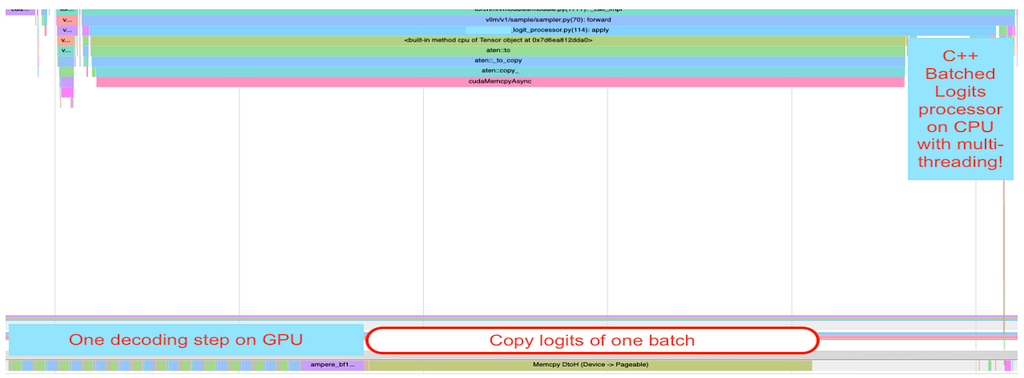
The structural fix arrived in vLLM V1, which moved logits processing to batch level. We rewrote our custom processor to operate on batch-level data structures, computing masks across many requests together, and reimplemented the hot path in C++ with multi-threading to step around the GIL. The V1 API requires explicit tracking of batch membership changes via update_state(batch_update) — more complex than V0’s per-request interface, but necessary to maintain correct state in a dynamically evolving batch. Figure 3 shows logits processing time staying flat as batch size grows.
Figure 3: Batched logits processor execution on CPU with vLLM V1
Operational hardening
Now, performance was no longer the bottleneck. But stateful constraint logic in the decode loop introduced two issues the design phase didn’t anticipate:
Partial prefills. V1 performs chunked prefilling, so a request can be prefilled over multiple engine steps. BatchUpdate lacks the granularity to tell whether a request was fully or only partially prefilled, so we added internal tracking.
Preemption. Under memory pressure, vLLM may evict a partially completed request’s KV cache and reschedule it later with a different prompt and output token list. This breaks the state machine’s assumption that the output token list grows monotonically. We detect when the token history shrinks between decode steps, reset the state machine, and reinitialize from the new prompt.
Wrap up
We set out to build an LLM serving platform for broad production ML requirements — low latency, deep customization, and integration with existing infrastructure. The result is a system on vLLM and Triton, unified behind a consistent API, designed to give ML practitioners a fast path from experimentation to production.
The lessons were often in the details — version pinning, silent API gaps, packaging trade-offs — but addressing them has made the platform meaningfully more robust and the developer experience smoother. Next investments reflect where we expect friction:
System prompt compression to reduce prompt length without sacrificing quality.
Asynchronous scheduling of vLLM V1.
Vectorized logits processors that run as fused GPU kernels instead of CPU code.
Lower-precision model variants to decrease memory footprint and increase throughput.
We’ll continue working closely with the open-source community as this space evolves.
Contributions
This system is the result of close collaboration and contributions from many teams within the AI Platform org at Netflix. In particular, Liping Peng designed and developed the model packaging workflow and drove the integration of Triton and vLLM with MSS to enable a unified pathway for serving LLMs. Hakan Baba, Nicolas Hortiguera, and ZQ Zhang led GPU capacity planning, system performance tuning, application integration and observability, as well as A/B test readiness and operational excellence efforts for all production models. Santino Ramos enabled vLLM for production models and optimized constrained decoding performance. Binh Tang developed the initial version of custom model serving and benchmarked different LLM serving frameworks. Lanxi Huang and Daneo Zhang built the serving development tools to enable user self-service. Lingyi Liu drove the overall system architecture and core technical decisions. Abhishek Agrawal and Shaojing Li provide management leadership to ensure alignment, prioritization and execution.
Acknowledgements
This work heavily leverages open-source ML libraries, such as Triton, vLLM and PyTorch, etc. We’re especially grateful to the teams and contributors from the community. We also thank our partner teams in Netflix AI for Member Systems for their close collaborations and innovation on the modeling side.
To provide the best experiences, we use technologies like cookies to store and/or access device information. Consenting to these technologies will allow us to process data such as browsing behavior or unique IDs on this site. Not consenting or withdrawing consent, may adversely affect certain features and functions.
Functional
Always active
The technical storage or access is strictly necessary for the legitimate purpose of enabling the use of a specific service explicitly requested by the subscriber or user, or for the sole purpose of carrying out the transmission of a communication over an electronic communications network.
Preferences
The technical storage or access is necessary for the legitimate purpose of storing preferences that are not requested by the subscriber or user.
Statistics
The technical storage or access that is used exclusively for statistical purposes.The technical storage or access that is used exclusively for anonymous statistical purposes. Without a subpoena, voluntary compliance on the part of your Internet Service Provider, or additional records from a third party, information stored or retrieved for this purpose alone cannot usually be used to identify you.
Marketing
The technical storage or access is required to create user profiles to send advertising, or to track the user on a website or across several websites for similar marketing purposes.