We are excited to share our work on how to learn good proxy metrics from historical experiments at KDD 2024. This work addresses a fundamental question for technology companies and academic researchers alike: how do we establish that a treatment that improves short-term (statistically sensitive) outcomes also improves long-term (statistically insensitive) outcomes? Or, faced with multiple short-term outcomes, how do we optimally trade them off for long-term benefit?
For example, in an A/B test, you may observe that a product change improves the click-through rate. However, the test does not provide enough signal to measure a change in long-term retention, leaving you in the dark as to whether this treatment makes users more satisfied with your service. The click-through rate is a proxy metric (S, for surrogate, in our paper) while retention is a downstream business outcome or north star metric (Y). We may even have several proxy metrics, such as other types of clicks or the length of engagement after click. Taken together, these form a vector of proxy metrics.
The goal of our work is to understand the true relationship between the proxy metric(s) and the north star metric — so that we can assess a proxy’s ability to stand in for the north star metric, learn how to combine multiple metrics into a single best one, and better explore and compare different proxies.
Several intuitive approaches to understanding this relationship have surprising pitfalls:
Looking only at user-level correlations between the proxy S and north star Y. Continuing the example from above, you may find that users with a higher click-through rate also tend to have a higher retention. But this does not mean that a product change that improves the click-through rate will also improve retention (in fact, promoting clickbait may have the opposite effect). This is because, as any introductory causal inference class will tell you, there are many confounders between S and Y — many of which you can never reliably observe and control for.
Looking naively at treatment effect correlations between S and Y. Suppose you are lucky enough to have many historical A/B tests. Further imagine the ordinary least squares (OLS) regression line through a scatter plot of Y on S in which each point represents the (S,Y)-treatment effect from a previous test. Even if you find that this line has a positive slope, you unfortunately cannot conclude that product changes that improve S will also improve Y. The reason for this is correlated measurement error — if S and Y are positively correlated in the population, then treatment arms that happen to have more users with high S will also have more users with high Y.
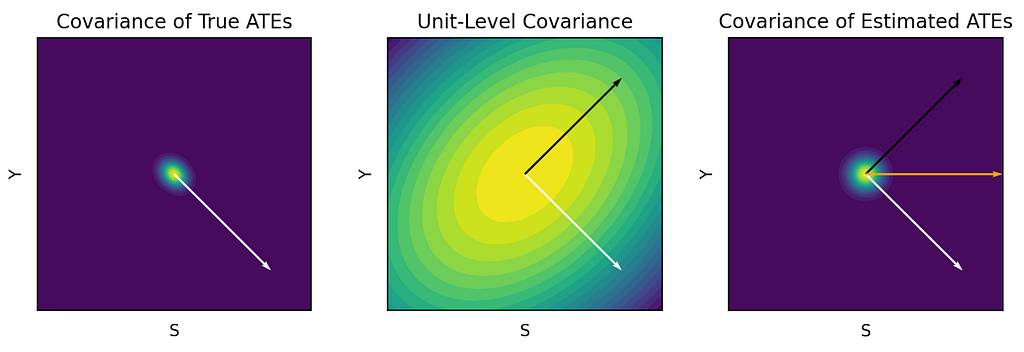
Between these naive approaches, we find that the second one is the easier trap to fall into. This is because the dangers of the first approach are well-known, whereas covariances between estimated treatment effects can appear misleadingly causal. In reality, these covariances can be severely biased compared to what we actually care about: covariances between true treatment effects. In the extreme — such as when the negative effects of clickbait are substantial but clickiness and retention are highly correlated at the user level — the true relationship between S and Y can be negative even if the OLS slope is positive. Only more data per experiment could diminish this bias — using more experiments as data points will only yield more precise estimates of the badly biased slope. At first glance, this would appear to imperil any hope of using existing experiments to detect the relationship.
This figure shows a hypothetical treatment effect covariance matrix between S and Y (white line; negative correlation), a unit-level sampling covariance matrix creating correlated measurement errors between these metrics (black line; positive correlation), and the covariance matrix of estimated treatment effects which is a weighted combination of the first two (orange line; no correlation).
To overcome this bias, we propose better ways to leverage historical experiments, inspired by techniques from the literature on weak instrumental variables. More specifically, we show that three estimators are consistent for the true proxy/north-star relationship under different constraints (the paper provides more details and should be helpful for practitioners interested in choosing the best estimator for their setting):
A Total Covariance (TC) estimator allows us to estimate the OLS slope from a scatter plot of true treatment effects by subtracting the scaled measurement error covariance from the covariance of estimated treatment effects. Under the assumption that the correlated measurement error is the same across experiments (homogeneous covariances), the bias of this estimator is inversely proportional to the total number of units across all experiments, as opposed to the number of members per experiment.
Jackknife Instrumental Variables Estimation (JIVE) converges to the same OLS slope as the TC estimator but does not require the assumption of homogeneous covariances. JIVE eliminates correlated measurement error by removing each observation’s data from the computation of its instrumented surrogate values.
A Limited Information Maximum Likelihood (LIML) estimator is statistically efficient as long as there are no direct effects between the treatment and Y (that is, S fully mediates all treatment effects on Y). We find that LIML is highly sensitive to this assumption and recommend TC or JIVE for most applications.
Our methods yield linear structural models of treatment effects that are easy to interpret. As such, they are well-suited to the decentralized and rapidly-evolving practice of experimentation at Netflix, which runs thousands of experiments per year on many diverse parts of the business. Each area of experimentation is staffed by independent Data Science and Engineering teams. While every team ultimately cares about the same north star metrics (e.g., long-term revenue), it is highly impractical for most teams to measure these in short-term A/B tests. Therefore, each has also developed proxies that are more sensitive and directly relevant to their work (e.g., user engagement or latency). To complicate matters more, teams are constantly innovating on these secondary metrics to find the right balance of sensitivity and long-term impact.
In this decentralized environment, linear models of treatment effects are a highly useful tool for coordinating efforts around proxy metrics and aligning them towards the north star:
Managing metric tradeoffs. Because experiments in one area can affect metrics in another area, there is a need to measure all secondary metrics in all tests, but also to understand the relative impact of these metrics on the north star. This is so we can inform decision-making when one metric trades off against another metric.
Informing metrics innovation. To minimize wasted effort on metric development, it is also important to understand how metrics correlate with the north star “net of” existing metrics.
Enabling teams to work independently. Lastly, teams need simple tools in order to iterate on their own metrics. Teams may come up with dozens of variations of secondary metrics, and slow, complicated tools for evaluating these variations are unlikely to be adopted. Conversely, our models are easy and fast to fit, and are actively used to develop proxy metrics at Netflix.
We are thrilled about the research and implementation of these methods at Netflix — while also continuing to strive for great and always better, per our culture. For example, we still have some way to go to develop a more flexible data architecture to streamline the application of these methods within Netflix. Interested in helping us? See our open job postings!
For feedback on this blog post and for supporting and making this work better, we thank Apoorva Lal, Martin Tingley, Patric Glynn, Richard McDowell, Travis Brooks, and Ayal Chen-Zion.
In a previous post, we introduced our systems for running marketing campaigns. Although we sent millions of messages daily, we had little insight into their effectiveness. Did they engage our users with our promotions? Did they encourage more transactions and bookings?
As Grab’s business expanded and the number of marketing campaigns increased, understanding the impact of these campaigns became crucial. This knowledge enables campaign managers to design more effective campaigns and avoid wasteful ones that degrade user experience.
Initially, campaign managers had to consult marketing analysts to gauge the impact of campaigns. However, this approach soon proved unsustainable:
Manual analysis doesn’t scale with an increasing number of campaigns.
Different analysts might assess the business impact in slightly different ways, leading to inconsistent results over time.
Thus, we recognised the need for a centralised solution allowing campaign managers to view their campaign impact analyses.
Marketing attribution model
The marketing analyst team designed a Marketing attribution model (MAM) for estimating the business impact of any campaign that sends messages to users. It quantifies business impact in terms of generated gross merchandise value (GMV), revenue, etc.
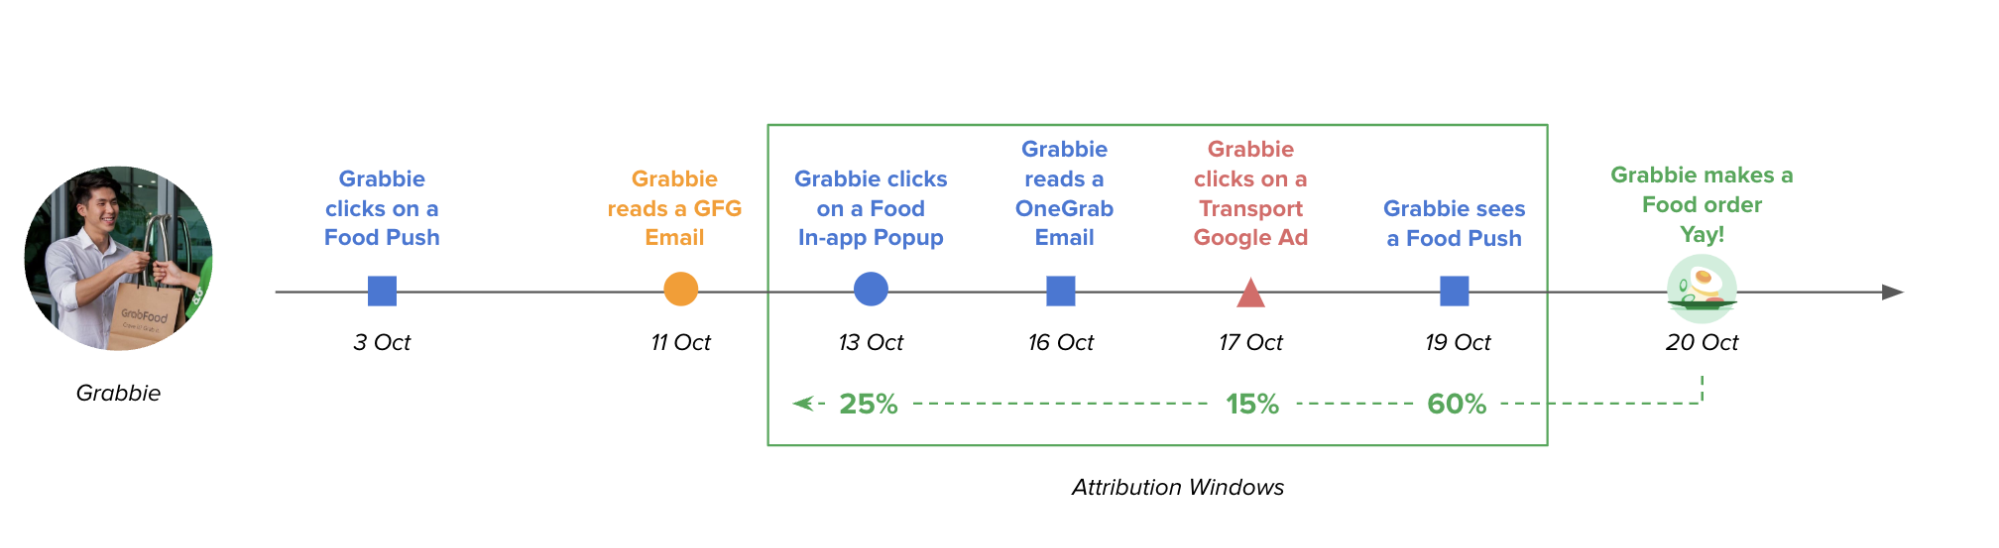
Unlike traditional models that only credit the last touchpoint (i.e. the last message user reads before making a transaction), MAM offers a more nuanced view. It recognises that users are exposed to various marketing messages (emails, pushes, feeds, etc.) throughout their decision-making process. As shown in Fig 1, MAM assigns credit to each touchpoint that influences a conversion (e.g., Grab usage) based on two key factors:
Relevance: Content directly related to the conversion receives a higher weightage. Imagine a user opening a GrabFood push notification before placing a food order. This push would be considered highly relevant and receive significant credit.
Recency: Touchpoints closer in time to the conversion hold more weight. For instance, a brand awareness email sent weeks before the purchase would be less impactful than a targeted GrabFood promotion right before the order.
By factoring in both relevance and recency, MAM avoids crediting the same touchpoint twice and provides a more accurate picture of which marketing campaigns are driving higher conversions.
Fig 1. How MAM does business attribution
While MAM is effective for comparing the impacts of different campaigns, it struggles with the assessment of a single campaign because it does not account for negative impacts. For example, consider a message stating, “Hey, don’t use Grab.” Clearly, not all messages positively impact business.
Hold-out group
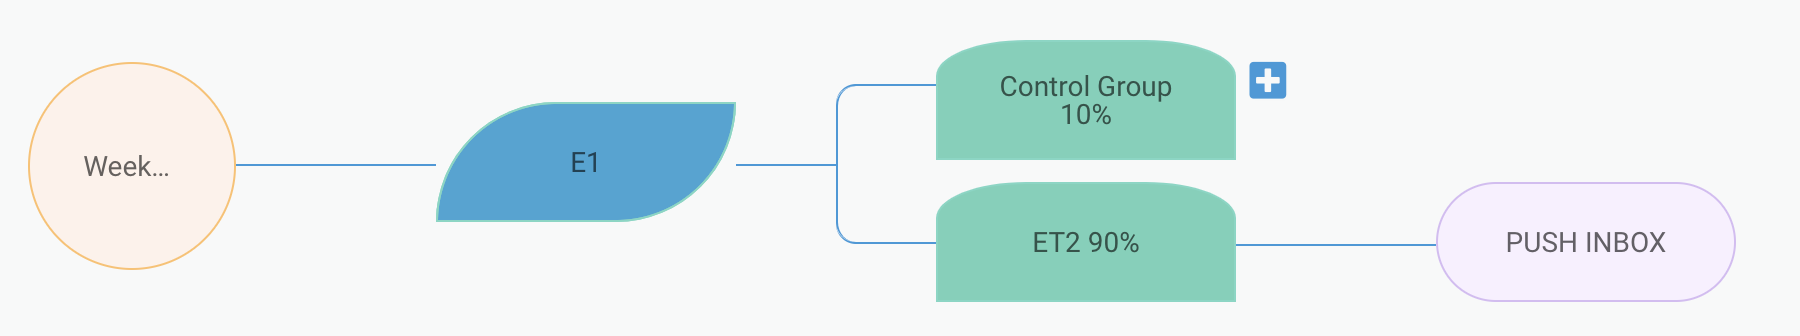
To better evaluate the impact of a single campaign, we divide targeted users into two groups:
Hold-out (control): do not send any message
Treatment: send the message
Fig 2. Campaign setup with hold-out group
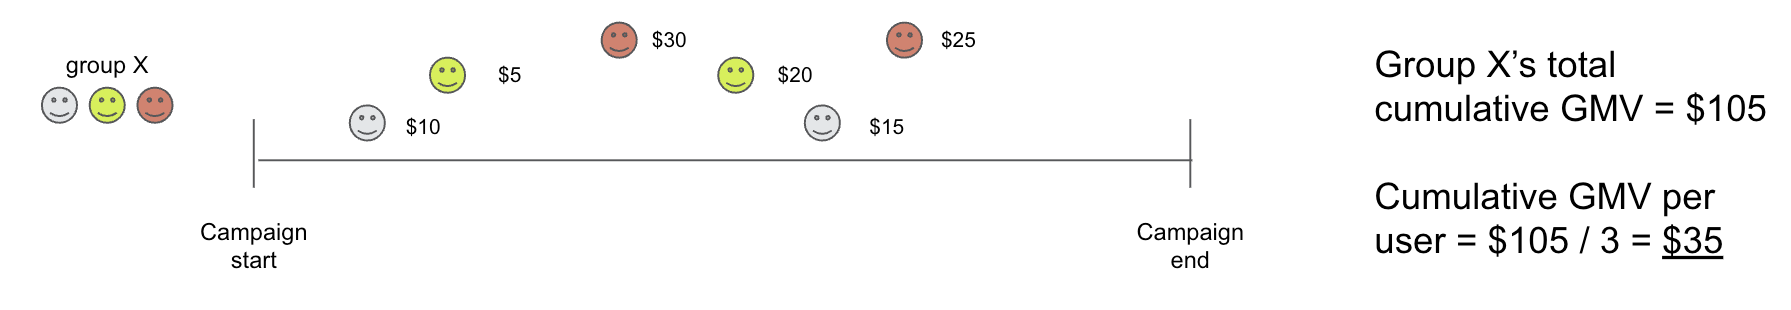
We then compare the business performance of sending versus not sending messages. For the treatment group, we ideally count only the user transactions potentially linked to the message (i.e., transactions occurring within X days of message receipt). However, since the hold-out group receives no messages, there are no equivalent metrics for comparison.
The only business metrics available for the hold-out group are the aggregated totals of GMV, revenue, etc., over a given time, divided by the number of users. We must calculate the same for the treatment group to ensure a fair comparison.
Fig 3. Metrics calculation for both hold-out and treatment group
The comparison might seem unreliable due to:
The metrics are raw aggregations, lacking attribution logic.
The aggregated GMV and revenue might be skewed by other simultaneous campaigns involving the same users.
Here, we have to admit that figuring out true business impact is difficult. All we can do is try our best to get as close to the truth as possible. To make the comparison more precise, we employed the following strategies:
Stratify the two groups, so that both groups contain roughly the same distribution of users.
Calculate statistical significance to rule out the difference caused by random factors.
Allow users to narrow down the business metrics to compare according to campaign set-up. For example, we don’t compare ride bookings if the campaign is promoting food.
Statistical significance is a common, yet important technique for evaluating the result of controlled experiments. Let’s see how it’s used in our case.
Statistical significance
When we do an A/B testing, we cannot simply conclude that A is better than B when A’s result is better than B. The difference could be due to other random factors. If you did an A/A test, you will still see differences in the results even without doing anything different to the two groups.
Statistical significance is a method to calculate the probability that the difference between two groups is really due to randomness. The lower the probability, the more confidently we can say our action is truly making some impact.
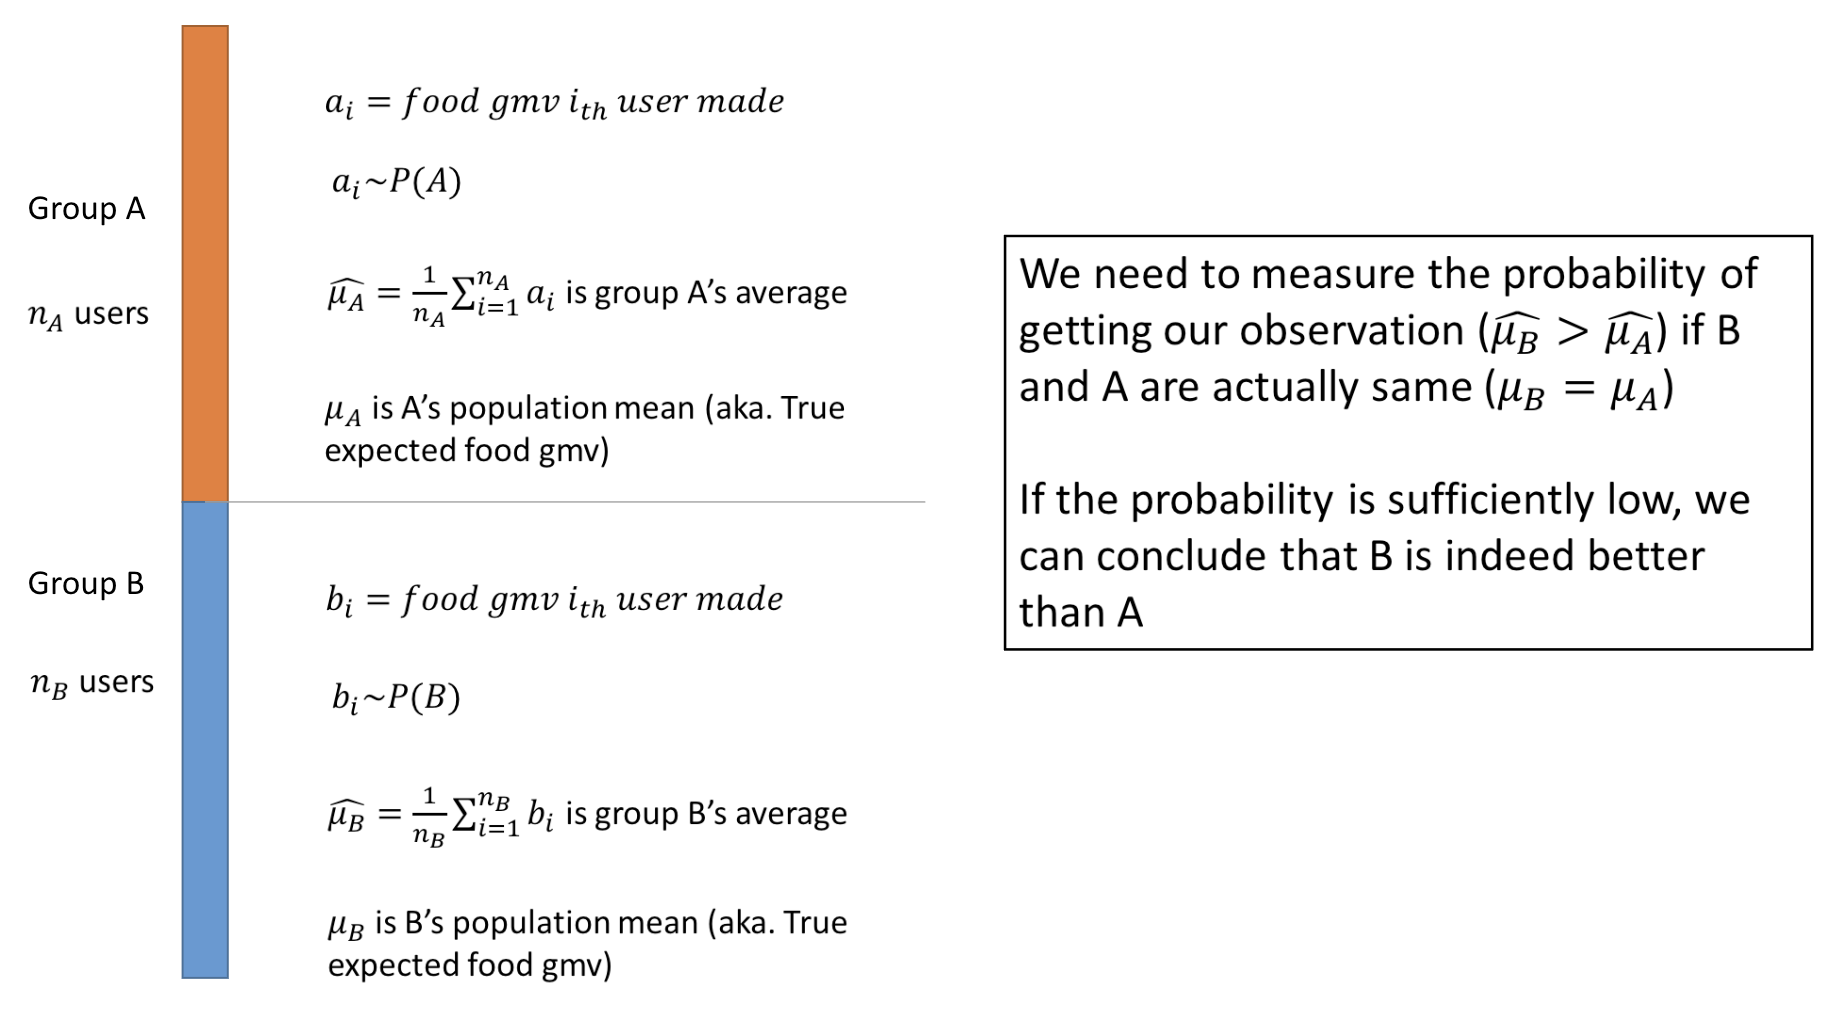
In our case, to derive statistical significance, we assume:
Our hold-out and treatment group are two sets of samples drawn from two populations, A and B.
A and B are the same except that B received our message. We can’t 100% prove this, but can reasonably guess this is close to true, since we split with stratification.
Assuming the business metrics we are comparing is food GMV, the base numbers can be formulated as shown in Fig 4.
Fig 4. Formulation for calculating statistical significance
To calculate the probability, we then use a formula derived from the central limit theorem (CLT). The mathematical derivation of the formula is beyond the scope of this post. Programmatically, we use the popular jStat library for the calculation.
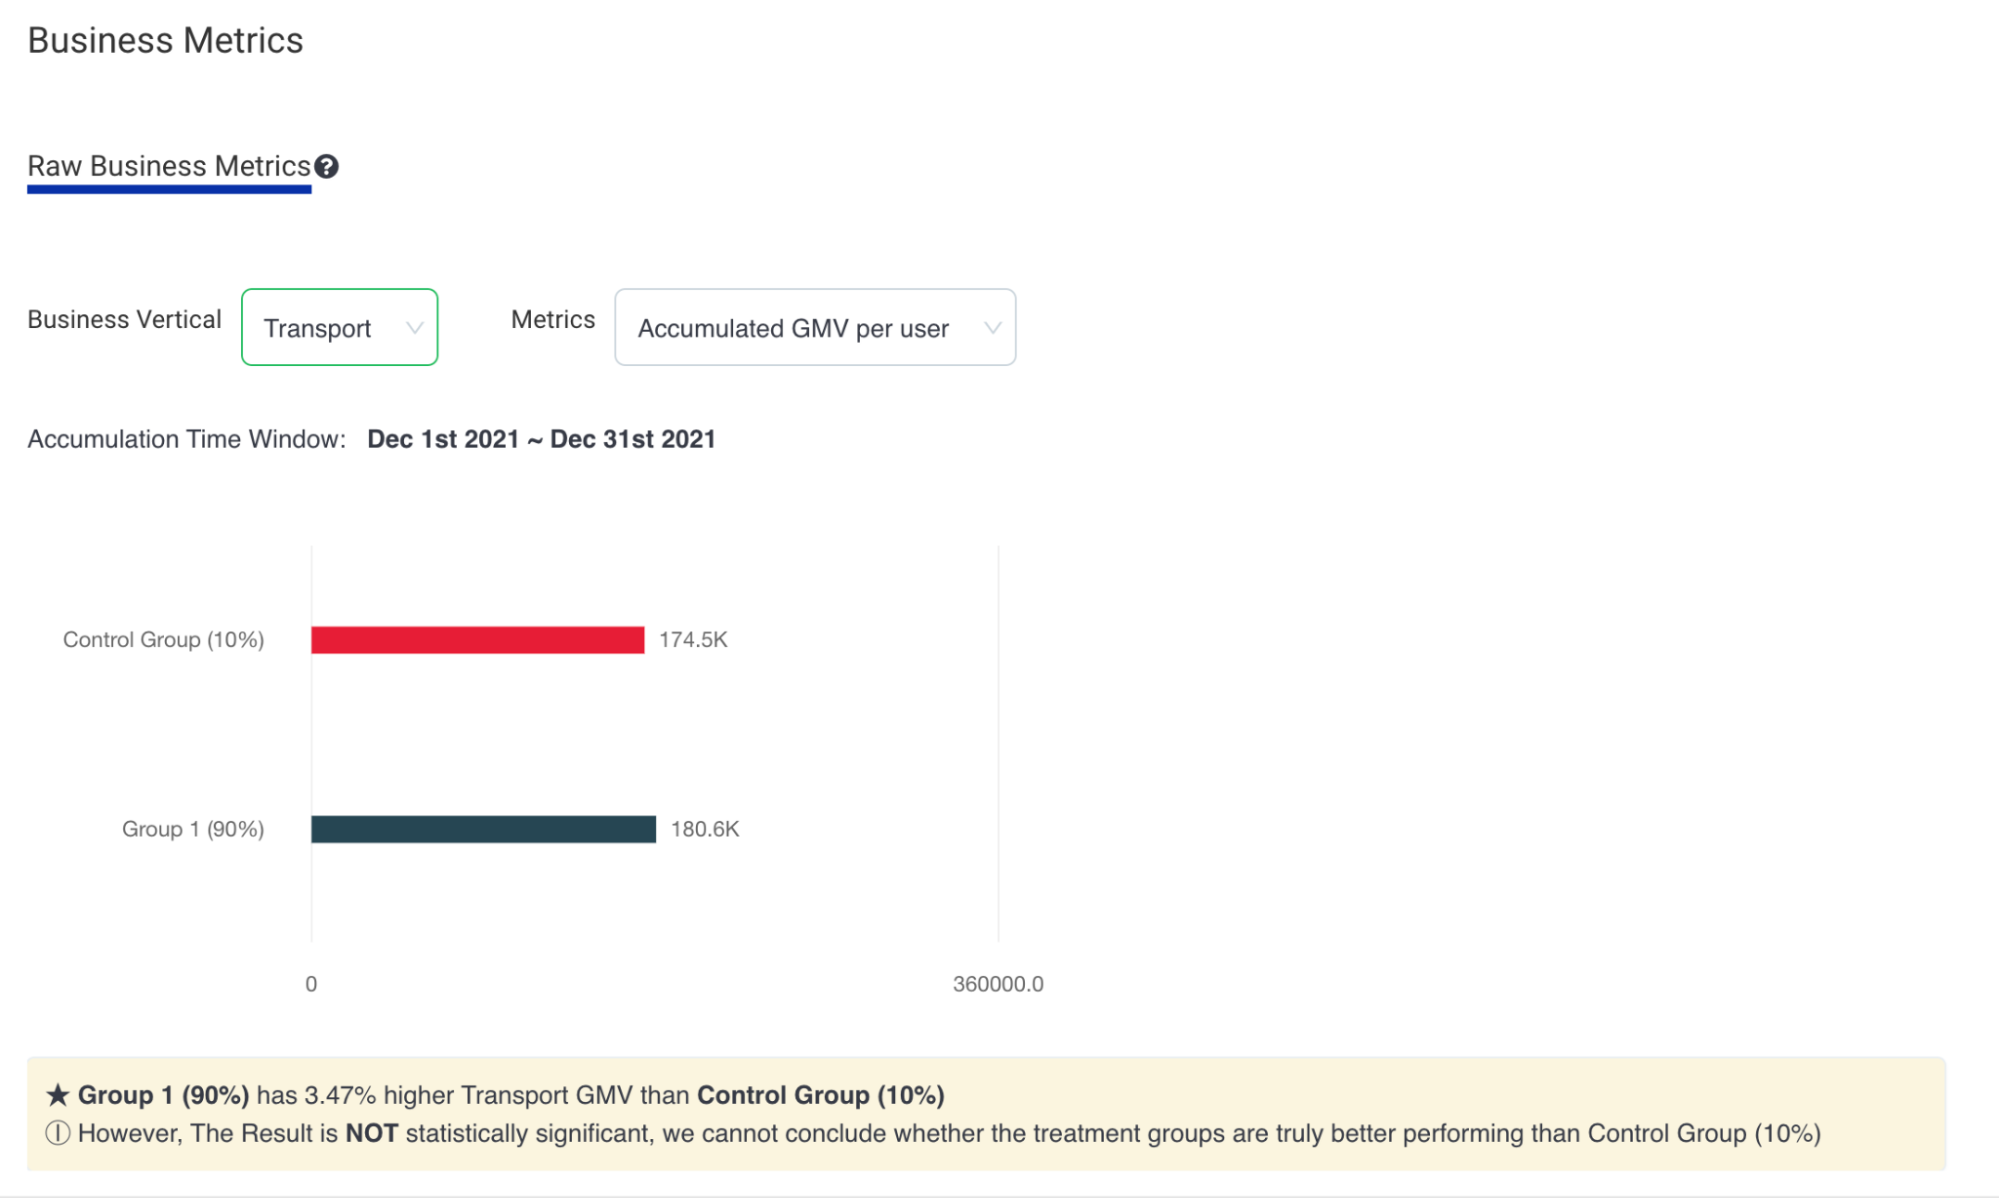
The calculation result of statistical significance as a special notice to the campaign owners is shown in Fig 5.
Fig 5. Display of business impact analysis with statistical significance
What’s next
Evaluating the true business impact remains challenging. We continue to refine our methodology and address potential biases, such as the assumption that both groups are of the same distribution, which might not hold true, especially in smaller group sizes. Furthermore, consistently reserving a 10% hold-out in each campaign is impractical for some campaigns, as sometimes campaign owners require messages to reach all targeted users.
We are committed to advancing our business impact evaluation solutions and will continue improving our existing solutions. We look forward to sharing more insights in future blogs.
Join us
Grab is the leading superapp platform in Southeast Asia, providing everyday services that matter to consumers. More than just a ride-hailing and food delivery app, Grab offers a wide range of on-demand services in the region, including mobility, food, package and grocery delivery services, mobile payments, and financial services across 428 cities in eight countries.
Powered by technology and driven by heart, our mission is to drive Southeast Asia forward by creating economic empowerment for everyone. If this mission speaks to you, join our team today!
Ever wondered what goes behind the scenes when you receive advisory messages on a confirmed booking? Or perhaps how you are awarded with rewards or points after completing a GrabPay payment transaction? At Grab, thousands of such campaigns targeting millions of users are operated daily by a backbone service called Trident. In this post, we share how Trident supports Grab’s daily business, the engineering challenges behind it, and how we solved them.
60-minute GrabMart delivery guarantee campaign operated via Trident
What is Trident?
Trident is essentially Grab’s in-house real-time if this, then that (IFTTT) engine, which automates various types of business workflows. The nature of these workflows could either be to create awareness or to incentivize users to use other Grab services.
If you are an active Grab user, you might have noticed new rewards or messages that appear in your Grab account. Most likely, these originate from a Trident campaign. Here are a few examples of types of campaigns that Trident could support:
After a user makes a GrabExpress booking, Trident sends the user a message that says something like “Try out GrabMart too”.
After a user makes multiple ride bookings in a week, Trident sends the user a food reward as a GrabFood incentive.
After a user is dropped off at his office in the morning, Trident awards the user a ride reward to use on the way back home on the same evening.
If a GrabMart order delivery takes over an hour of waiting time, Trident awards the user a free-delivery reward as compensation.
If the driver cancels the booking, then Trident awards points to the user as a compensation.
With the current COVID pandemic, when a user makes a ride booking, Trident sends a message to both the passenger and driver reminding about COVID protocols.
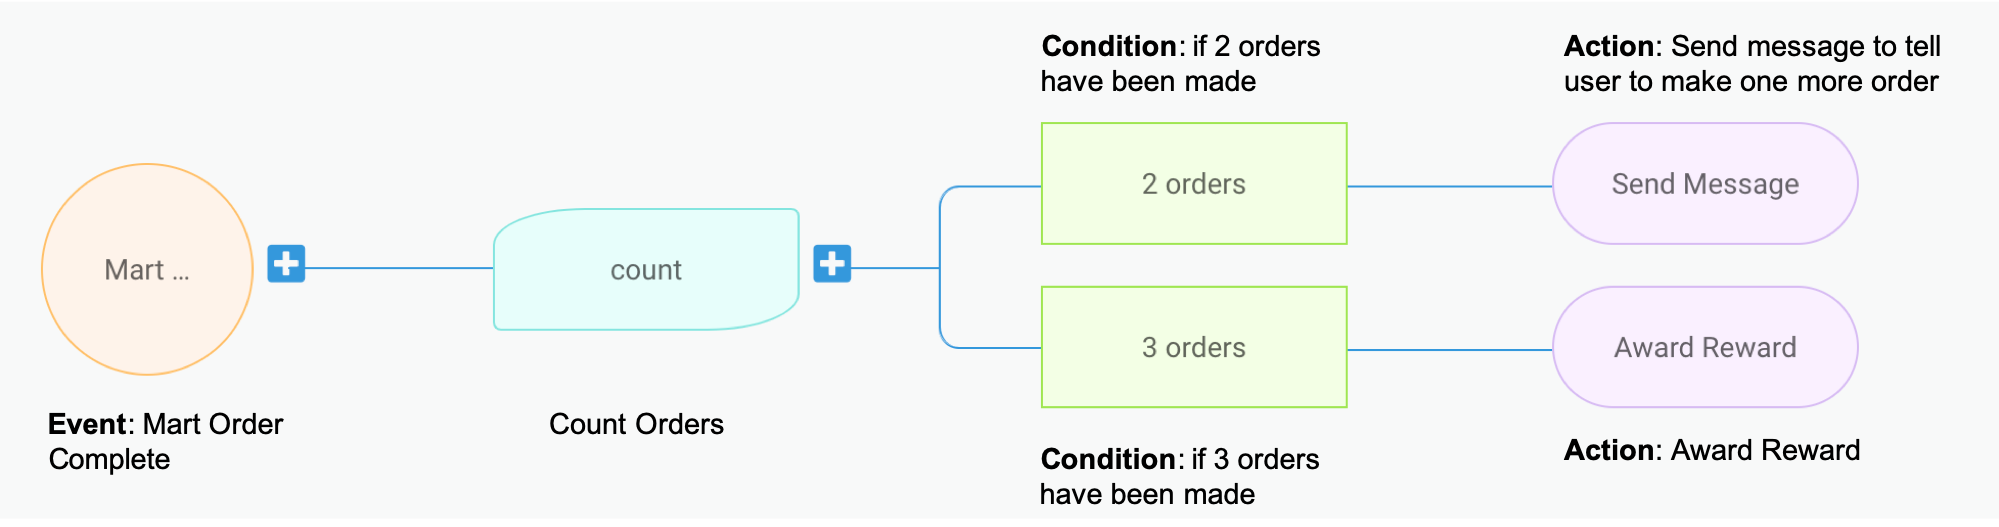
Trident processes events based on campaigns, which are basically a logic configuration on what event should trigger what actions under what conditions. To illustrate this better, let’s take a sample campaign as shown in the image below. This mock campaign setup is taken from the Trident Internal Management portal.
Trident process flow
This sample setup basically translates to: for each user, count his/her number of completed GrabMart orders. Once he/she reaches 2 orders, send him/her a message saying “Make one more order to earn a reward”. And if the user reaches 3 orders, award him/her the reward and send a congratulatory message. 😁
Other than the basic event, condition, and action, Trident also allows more fine-grained configurations such as supporting the overall budget of a campaign, adding limitations to avoid over awarding, experimenting A/B testing, delaying of actions, and so on.
An IFTTT engine is nothing new or fancy, but building a high-throughput real-time IFTTT system poses a challenge due to the scale that Grab operates at. We need to handle billions of events and run thousands of campaigns on an average day. The amount of actions triggered by Trident is also massive.
In the month of October 2020, more than 2,000 events were processed every single second during peak hours. Across the entire month, we awarded nearly half a billion rewards, and sent over 2.5 billion communications to our end-users.
Now that we covered the importance of Trident to the business, let’s drill down on how we designed the Trident system to handle events at a massive scale and overcame the performance hurdles with optimization.
Architecture design
We designed the Trident architecture with the following goals in mind:
Independence: It must run independently of other services, and must not bring performance impacts to other services.
Robustness: All events must be processed exactly once (i.e. no event missed, no event gets double processed).
Scalability: It must be able to scale up processing power when the event volume surges and withstand when popular campaigns run.
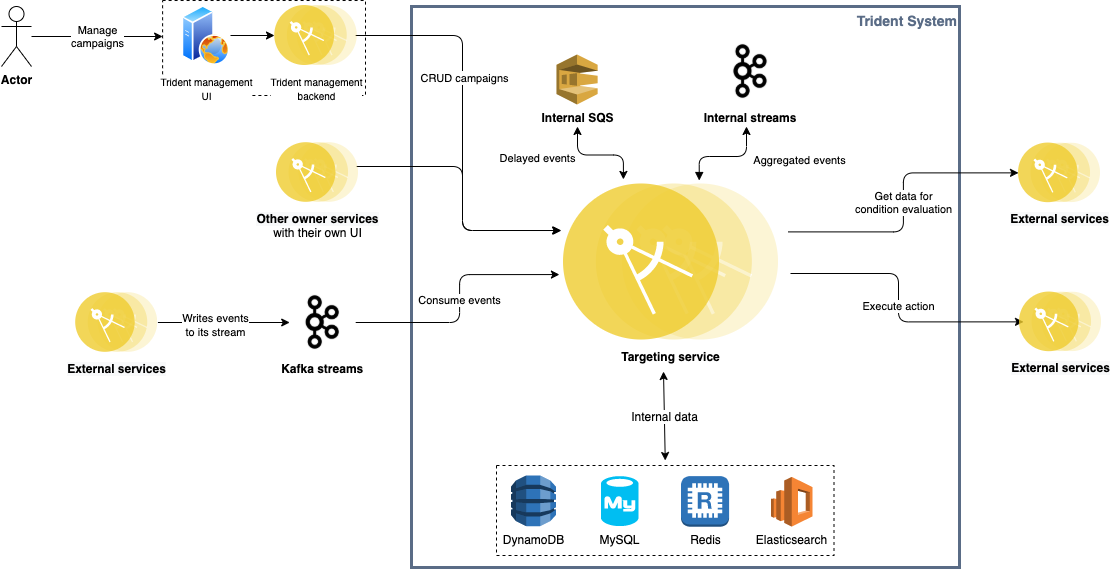
The following diagram depicts how the overall system architecture looks like.
Trident architecture
Trident consumes events from multiple Kafka streams published by various backend services across Grab (e.g. GrabFood orders, Transport rides, GrabPay payment processing, GrabAds events). Given the nature of Kafka streams, Trident is completely decoupled from all other upstream services.
Each processed event is given a unique event key and stored in Redis for 24 hours. For any event that triggers an action, its key is persisted in MySQL as well. Before storing records in both Redis and MySQL, we make sure any duplicate event is filtered out. Together with the at-least-once delivery guaranteed by Kafka, we achieve exactly-once event processing.
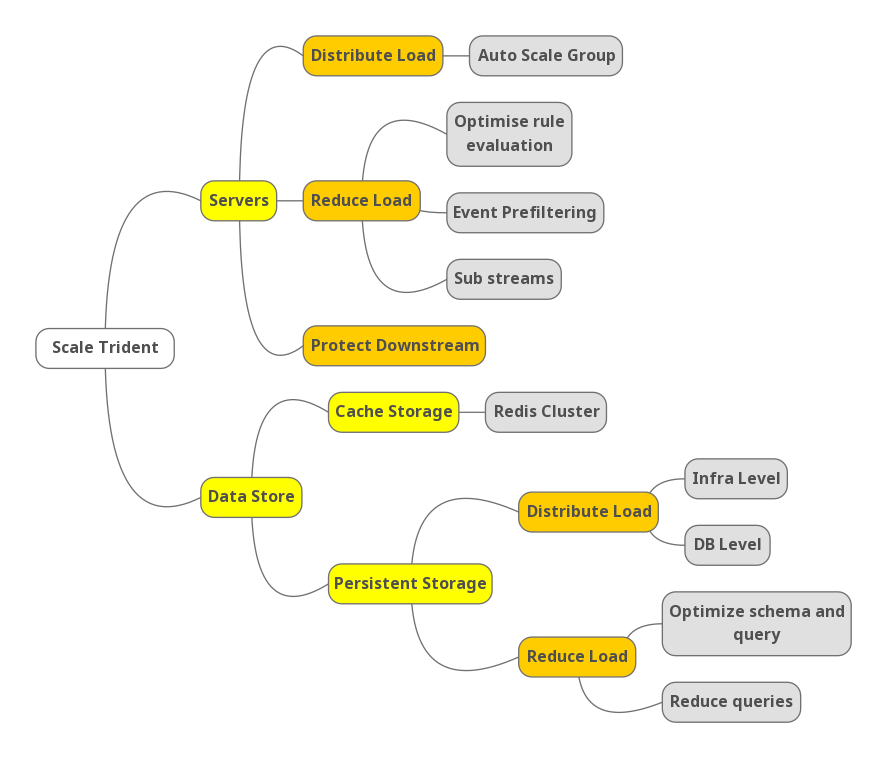
Scalability is a key challenge for Trident. To achieve high performance under massive event volume, we needed to scale on both the server level and data store level. The following mind map shows an outline of our strategies.
Outline of Trident’s scale strategy
Scale servers
Our source of events are Kafka streams. There are mostly two factors that could affect the load on our system:
Number of events produced in the streams (more rides, food orders, etc. results in more events for us to process).
Number of campaigns running.
Nature of campaigns running. The campaigns that trigger actions for more users cause higher load on our system.
There are naturally two types of approaches to scale up server capacity:
Distribute workload among server instances.
Reduce load (i.e. reduce the amount of work required to process each event).
Distribute load
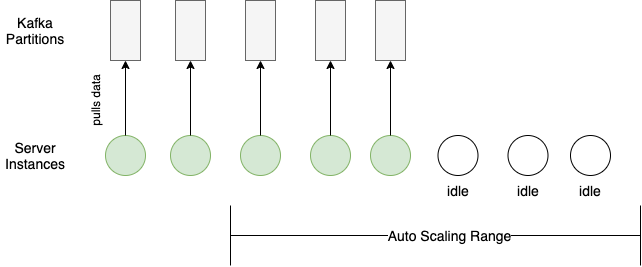
Distributing workload seems trivial with the load balancing and auto-horizontal scaling based on CPU usage that cloud providers offer. However, an additional server sits idle until it can consume from a Kafka partition.
Each Kafka partition can only be consumed by one consumer within the same consumer group (our auto-scaling server group in this case). Therefore, any scaling in or out requires matching the Kafka partition configuration with the server auto-scaling configuration.
Here’s an example of a bad case of load distribution:
Kafka partitions config mismatches server auto-scaling config
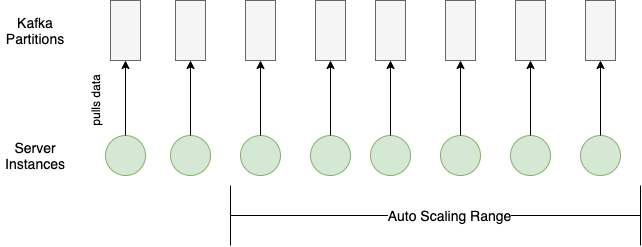
And here’s an example of a good load distribution where the configurations for the Kafka partitions and the server auto-scaling match:
Kafka partitions config matches server auto-scaling config
Within each server instance, we also tried to increase processing throughput while keeping the resource utilization rate in check. Each Kafka partition consumer has multiple goroutines processing events, and the number of active goroutines is dynamically adjusted according to the event volume from the partition and time of the day (peak/off-peak).
Reduce load
You may ask how we reduced the amount of processing work for each event. First, we needed to see where we spent most of the processing time. After performing some profiling, we identified that the rule evaluation logic was the major time consumer.
What is rule evaluation?
Recall that Trident needs to operate thousands of campaigns daily. Each campaign has a set of rules defined. When Trident receives an event, it needs to check through the rules for all the campaigns to see whether there is any match. This checking process is called rule evaluation.
More specifically, a rule consists of one or more conditions combined by AND/OR Boolean operators. A condition consists of an operator with a left-hand side (LHS) and a right-hand side (RHS). The left-hand side is the name of a variable, and the right-hand side a value. A sample rule in JSON:
Country is Singapore and taxi type is either JustGrab or GrabCar.
  {
    "operator": "and",
    "conditions": [
    {
      "operator": "eq",
      "lhs": "var.country",
      "rhs": "sg"
      },
      {
        "operator": "or",
        "conditions": [
        {
          "operator": "eq",
          "lhs": "var.taxi",
          "rhs": <taxi-type-id-for-justgrab>
          },
          {
            "operator": "eq",
            "lhs": "var.taxi",
            "rhs": <taxi-type-id-for-grabcard>
          }
        ]
      }
    ]
  }
When evaluating the rule, our system loads the values of the LHS variable, evaluates against the RHS value, and returns as result (true/false) whether the rule evaluation passed or not.
To reduce the resources spent on rule evaluation, there are two types of strategies:
Avoid unnecessary rule evaluation
Evaluate “cheap” rules first
We implemented these two strategies with event prefiltering and weighted rule evaluation.
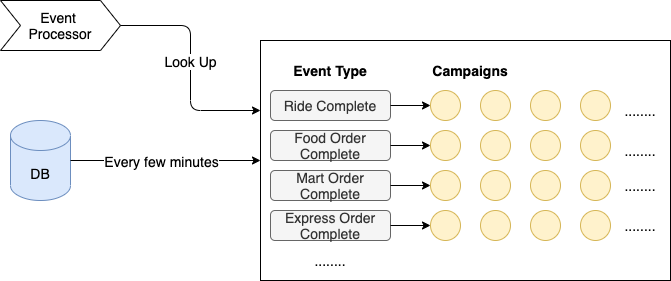
Event prefiltering
Just like the DB index helps speed up data look-up, having a pre-built map also helped us narrow down the range of campaigns to evaluate. We loaded active campaigns from the DB every few minutes and organized them into an in-memory hash map, with event type as key, and list of corresponding campaigns as the value. The reason we picked event type as the key is that it is very fast to determine (most of the time just a type assertion), and it can distribute events in a reasonably even way.
When processing events, we just looked up the map, and only ran rule evaluation on the campaigns in the matching hash bucket. This saved us at least 90% of the processing time.
Event prefiltering
Weighted rule evaluation
Evaluating different rules comes with different costs. This is because different variables (i.e. LHS) in the rule can have different sources of values:
The value is already available in memory (already consumed from the event stream).
The value is the result of a database query.
The value is the result of a call to an external service.
These three sources are ranked by cost:
In-memory < database < external service
We aimed to maximally avoid evaluating expensive rules (i.e. those that require calling external service, or querying a DB) while ensuring the correctness of evaluation results.
First optimization – Lazy loading
Lazy loading is a common performance optimization technique, which literally means “don’t do it until it’s necessary”.
Take the following rule as an example:
A & B
If we load the variable values for both A and B before passing to evaluation, then we are unnecessarily loading B if A is false. Since most of the time the rule evaluation fails early (for example, the transaction amount is less than the given minimum amount), there is no point in loading all the data beforehand. So we do lazy loading ie. load data only when evaluating that part of the rule.
Second optimization – Add weight
Let’s take the same example as above, but in a different order.
B & A
Source of data for A is memory and B is external service
Now even if we are doing lazy loading, in this case, we are loading the external data always even though it potentially may fail at the next condition whose data is in memory.
Since most of our campaigns are targeted, a popular condition is to check if a user is in a certain segment, which is usually the first condition that a campaign creator sets. This data resides in another service. So it becomes quite expensive to evaluate this condition first even though the next condition’s data can be already in memory (e.g. if the taxi type is JustGrab).
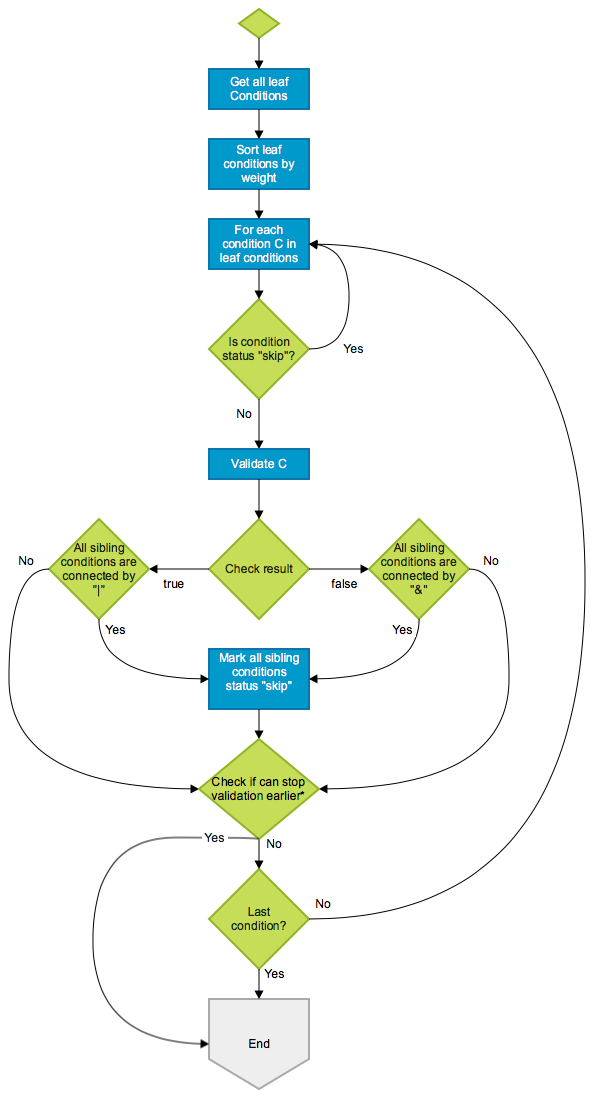
So, we did the next phase of optimization here, by sorting the conditions based on weight of the source of data (low weight if data is in memory, higher if it’s in our database and highest if it’s in an external system). If AND was the only logical operator we supported, then it would have been quite simple. But the presence of OR made it complex. We came up with an algorithm that sorts the evaluation based on weight keeping in mind the AND/OR. Here’s what the flowchart looks like:
Event flowchart
An example:
Conditions: A & ( B | C ) & ( D | E )

Actual result: true & ( false | false ) & ( true | true ) --> false

Weight: B < D < E < C < A

Expected check order: B, D, C
Firstly, we start validating B which is false. Apparently, we cannot skip the sibling conditions here since B and C are connected by |. Next, we check D. D is true and its only sibling E is connected by | so we can mark E “skip”. Then, we check E but since E has been marked “skip”, we just skip it. Still, we cannot get the final result yet, so we need to continue validating C which is false. Now we know (B | C) is false so the whole condition is false too. We can stop now.
Sub-streams
After investigation, we learned that we consumed a particular stream that produced terabytes of data per hour. It caused our CPU usage to shoot up by 30%. We found out that we process only a handful of event types from that stream. So we introduced a sub-stream in between, which contains the event types we want to support. This stream is populated from the main stream by another server, thereby reducing the load on Trident.
Protect downstream
While we scaled up our servers wildly, we needed to keep in mind that there were many downstream services that received more traffic. For example, we call the GrabRewards service for awarding rewards or the LocaleService for checking the user’s locale. It is crucial for us to have control over our outbound traffic to avoid causing any stability issues in Grab.
Therefore, we implemented rate limiting. There is a total rate limit configured for calling each downstream service, and the limit varies in different time ranges (e.g. tighter limit for calling critical service during peak hour).
Scale data store
We have two types of storage in Trident: cache storage (Redis) and persistent storage (MySQL and others).
Scaling cache storage is straightforward, since Redis Cluster already offers everything we need:
High performance: Known to be fast and efficient.
Scaling capability: New shards can be added at any time to spread out the load.
Fault tolerance: Data replication makes sure that data does not get lost when any single Redis instance fails, and auto election mechanism makes sure the cluster can always auto restore itself in case of any single instance failure.
All we needed to make sure is that our cache keys can be hashed evenly into different shards.
As for scaling persistent data storage, we tackled it in two ways just like we did for servers:
Distribute load
Reduce load (both overall and per query)
Distribute load
There are two levels of load distribution for persistent storage: infra level and DB level. On the infra level, we split data with different access patterns into different types of storage. Then on the DB level, we further distributed read/write load onto different DB instances.
Infra level
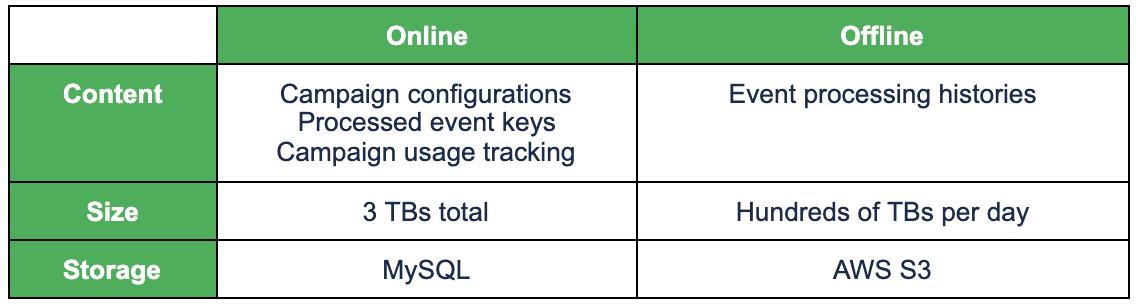
Just like any typical online service, Trident has two types of data in terms of access pattern:
Online data: Frequent access. Requires quick access. Medium size.
Offline data: Infrequent access. Tolerates slow access. Large size.
For online data, we need to use a high-performance database, while for offline data, we can just use cheap storage. The following table shows Trident’s online/offline data and the corresponding storage.
Trident’s online/offline data and storage
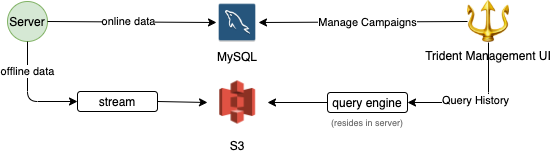
Writing of offline data is done asynchronously to minimize performance impact as shown below.
Online/offline data split
For retrieving data for the users, we have high timeout for such APIs.
DB level
We further distributed load on the MySQL DB level, mainly by introducing replicas, and redirecting all read queries that can tolerate slightly outdated data to the replicas. This relieved more than 30% of the load from the master instance.
Going forward, we plan to segregate the single MySQL database into multiple databases, based on table usage, to further distribute load if necessary.
Reduce load
To reduce the load on the DB, we reduced the overall number of queries and removed unnecessary queries. We also optimized the schema and query, so that query completes faster.
Query reduction
We needed to track usage of a campaign. The tracking is just incrementing the value against a unique key in the MySQL database. For a popular campaign, it’s possible that multiple increment (a write query) queries are made to the database for the same key. If this happens, it can cause an IOPS burst. So we came up with the following algorithm to reduce the number of queries.
Have a fixed number of threads per instance that can make such a query to the DB.
The increment queries are queued into above threads.
If a thread is idle (not busy in querying the database) then proceed to write to the database then itself.
If the thread is busy, then increment in memory.
When the thread becomes free, increment by the above sum in the database.
To prevent accidental over awarding of benefits (rewards, points, etc), we require campaign creators to set the limits. However, there are some campaigns that don’t need a limit, so the campaign creators just specify a large number. Such popular campaigns can cause very high QPS to our database. We had a brilliant trick to address this issue- we just don’t track if the number is high. Do you think people really want to limit usage when they set the per user limit to 100,000? 😉
Query optimization
One of our requirements was to track the usage of a campaign – overall as well as per user (and more like daily overall, daily per user, etc). We used the following query for this purpose:
INSERT INTO … ON DUPLICATE KEY UPDATE value = value + inc
The table had a unique key index (combining multiple columns) along with a usual auto-increment integer primary key. We encountered performance issues arising from MySQL gap locks when high write QPS hit this table (i.e. when popular campaigns ran). After testing out a few approaches, we ended up making the following changes to solve the problem:
Removed the auto-increment integer primary key.
Converted the secondary unique key to the primary key.
Conclusion
Trident is Grab’s in-house real-time IFTTT engine, which processes events and operates business mechanisms on a massive scale. In this article, we discussed the strategies we implemented to achieve large-scale high-performance event processing. The overall ideas of distributing and reducing load may be straightforward, but there were lots of thoughts and learnings shared in detail. If you have any comments or questions about Trident, feel free to leave a comment below.
All the examples of campaigns given in the article are for demonstration purpose only, they are not real live campaigns.
Join us
Grab is more than just the leading ride-hailing and mobile payments platform in Southeast Asia. We use data and technology to improve everything from transportation to payments and financial services across a region of more than 620 million people. We aspire to unlock the true potential of Southeast Asia and look for like-minded individuals to join us on this ride.
If you share our vision of driving South East Asia forward, apply to join our team today.
In November, Netflix was a proud sponsor of the 2020 Conference on Digital Experimentation (CODE), hosted by the MIT Initiative on the Digital Economy. As well as providing sponsorship, Netflix data scientists were active participants, with three contributions.
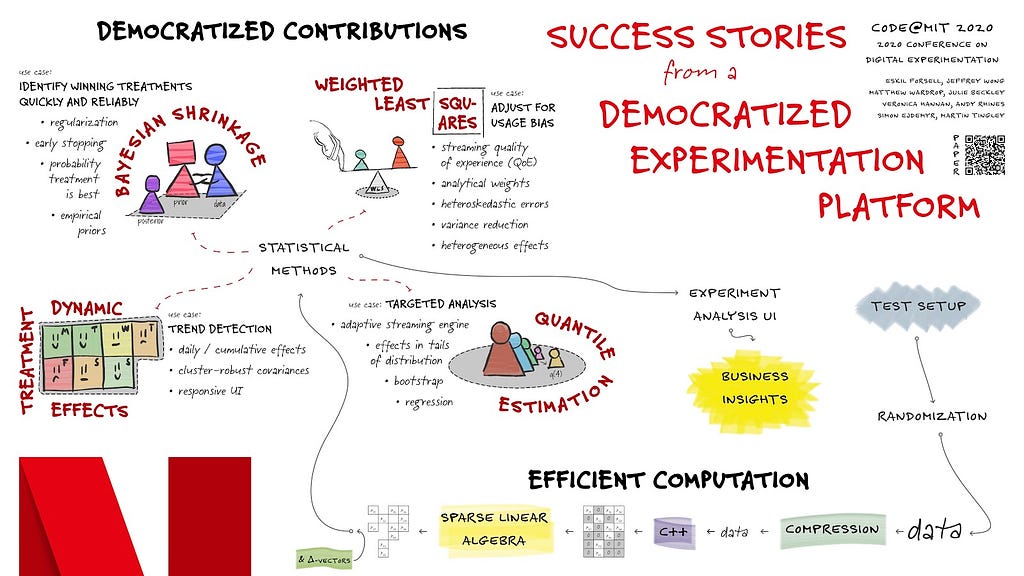
Eskil Forsell and colleagues presented a poster describing Success stories from a democratized experimentation platform. Over the last few years, we’ve been Reimagining Experimentation Analysis at Netflix with an open platform that supports contributions of metrics, methods and visualizations. This poster, reproduced below, highlights some of the success stories we are now seeing, as data scientists across Netflix partner with our platform team to broaden the suite of methodologies we can support at scale. Ultimately, these successes support confident decision making from our experiments, and help Netflix deliver more joy to our members!
Simon Ejdemyr presented a talk describing how Netflix is exploring Low-latency multivariate Bayesian shrinkage in online experiments. This work is another example of the benefits of the open Experimentation Platform at Netflix, as we are able to research and implement new methods directly within our production environment, where we can assess their performance in real applications. In such empirical validations of our Bayesian implementation, we see meaningful improvements to statistical precision, including reductions in sign and magnitude errors that can be common to traditional approaches to identifying winning treatments.
Finally, Jeffrey Wong participated in a Practitioners Panel discussion with Lilli Dworkin (Facebook) and Ronny Kohavi (Airbnb), moderated by Dean Eckles. One theme of the discussion was the challenge of applying the cutting edge causal inference methods that are developed by academic researchers in the context of the highly scaled and automated experimentation platforms at major technology companies. To address these challenges, Netflix has made a deliberate investment in Computational Causal Inference, an interdisciplinary and collaborative approach to accelerating causal inference research and providing data-science-centric software that helps us address scaling issues.
CODE was a great opportunity for us to share the progress we’ve made at Netflix, and to learn from our colleagues from academe and industry. We are all looking forward to CODE 2021, and to engaging with the experimentation community throughout 2021.
Netflix at MIT CODE 2020 was originally published in Netflix TechBlog on Medium, where people are continuing the conversation by highlighting and responding to this story.
The collective thoughts of the interwebz
Manage Consent
To provide the best experiences, we use technologies like cookies to store and/or access device information. Consenting to these technologies will allow us to process data such as browsing behavior or unique IDs on this site. Not consenting or withdrawing consent, may adversely affect certain features and functions.
Functional
Always active
The technical storage or access is strictly necessary for the legitimate purpose of enabling the use of a specific service explicitly requested by the subscriber or user, or for the sole purpose of carrying out the transmission of a communication over an electronic communications network.
Preferences
The technical storage or access is necessary for the legitimate purpose of storing preferences that are not requested by the subscriber or user.
Statistics
The technical storage or access that is used exclusively for statistical purposes.The technical storage or access that is used exclusively for anonymous statistical purposes. Without a subpoena, voluntary compliance on the part of your Internet Service Provider, or additional records from a third party, information stored or retrieved for this purpose alone cannot usually be used to identify you.
Marketing
The technical storage or access is required to create user profiles to send advertising, or to track the user on a website or across several websites for similar marketing purposes.