Post Syndicated from Steven Carpenter original https://aws.amazon.com/blogs/big-data/build-a-dynamic-rules-engine-with-amazon-managed-service-for-apache-flink/
Imagine you have some streaming data. It could be from an Internet of Things (IoT) sensor, log data ingestion, or even shopper impression data. Regardless of the source, you have been tasked with acting on the data—alerting or triggering when something occurs. Martin Fowler says: “You can build a simple rules engine yourself. All you need is to create a bunch of objects with conditions and actions, store them in a collection, and run through them to evaluate the conditions and execute the actions.”
A business rules engine (or simply rules engine) is a software system that executes many rules based on some input to determine some output. Simplistically, it’s a lot of “if then,” “and,” and “or” statements that are evaluated on some data. There are many different business rule systems, such as Drools, OpenL Tablets, or even RuleBook, and they all share a commonality: they define rules (collection of objects with conditions) that get executed (evaluate the conditions) to derive an output (execute the actions). The following is a simplistic example:
When a single condition or a composition of conditions evaluates to true, it is desired to send out an alert to potentially act on that event (trigger the heat to warm the 50 degrees room).
This post demonstrates how to implement a dynamic rules engine using Amazon Managed Service for Apache Flink. Our implementation provides the ability to create dynamic rules that can be created and updated without the need to change or redeploy the underlying code or implementation of the rules engine itself. We discuss the architecture, the key services of the implementation, some implementation details that you can use to build your own rules engine, and an AWS Cloud Development Kit (AWS CDK) project to deploy this in your own account.
Solution overview
The workflow of our solution starts with the ingestion of the data. We assume that we have some source data. It could be from a variety of places, but for this demonstration, we use streaming data (IoT sensor data) as our input data. This is what we will evaluate our rules on. For example purposes, let’s assume we are looking at data from our AnyCompany Home Thermostat. We’ll see attributes like temperature, occupancy, humidity, and more. The thermostat publishes the respective values every 1 minute, so we’ll base our rules around that idea. Because we’re ingesting this data in near real time, we need a service designed specifically for this use case. For this solution, we use Amazon Kinesis Data Streams.
In a traditional rules engine, there may be a finite list of rules. The creation of new rules would likely involve a revision and redeployment of the code base, a replacement of some rules file, or some overwriting process. However, a dynamic rules engine is different. Much like our streaming input data, our rules can also be streamed as well. Here we can use Kinesis Data Streams to stream our rules as they are created.
At this point, we have two streams of data:
- The raw data from our thermostat
- The business rules perhaps created through a user interface
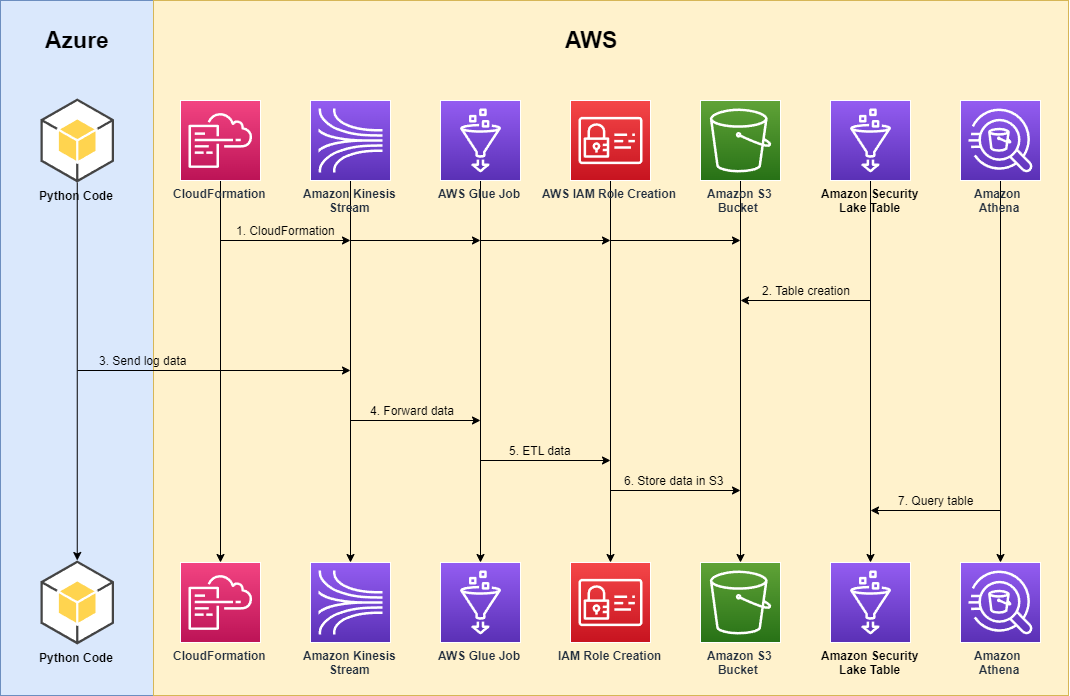
The following diagram illustrates we can connect these streams together.
Connecting streams
A typical use case for Managed Service for Apache Flink is to interactively query and analyze data in real time and continuously produce insights for time-sensitive use cases. With this in mind, if you have a rule that corresponds to the temperature dropping below a certain value (especially in winter), it might be critical to evaluate and produce a result as timely as possible.
Apache Flink connectors are software components that move data into and out of a Managed Service for Apache Flink application. Connectors are flexible integrations that let you read from files and directories. They consist of complete modules for interacting with AWS services and third-party systems. For more details about connectors, see Use Apache Flink connectors with Managed Service for Apache Flink.
We use two types of connectors (operators) for this solution:
- Sources – Provide input to your application from a Kinesis data stream, file, or other data source
- Sinks – Send output from your application to a Kinesis data stream, Amazon Data Firehose stream, or other data destination
Flink applications are streaming dataflows that may be transformed by user-defined operators. These dataflows form directed graphs that start with one or more sources and end in one or more sinks. The following diagram illustrates an example dataflow (source). As previously discussed, we have two Kinesis data streams that can be used as sources for our Flink program.

The following code snippet shows how we have our Kinesis sources set up within our Flink code:
We use a broadcast state, which can be used to combine and jointly process two streams of events in a specific way. A broadcast state is a good fit for applications that need to join a low-throughput stream and a high-throughput stream or need to dynamically update their processing logic. The following diagram illustrates an example how the broadcast state is connected. For more details, see A Practical Guide to Broadcast State in Apache Flink.

This fits the idea of our dynamic rules engine, where we have a low-throughput rules stream (added to as needed) and a high-throughput transactions stream (coming in at a regular interval, such as one per minute). This broadcast stream allows us to take our transactions stream (or the thermostat data) and connect it to the rules stream as shown in the following code snippet:
To learn more about the broadcast state, see The Broadcast State Pattern. When the broadcast stream is connected to the data stream (as in the preceding example), it becomes a BroadcastConnectedStream. The function applied to this stream, which allows us to process the transactions and rules, implements the processBroadcastElement method. The KeyedBroadcastProcessFunction interface provides three methods to process records and emit results:
- processBroadcastElement() – This is called for each record of the broadcasted stream (our rules stream).
- processElement() – This is called for each record of the keyed stream. It provides read-only access to the broadcast state to prevent modifications that result in different broadcast states across the parallel instances of the function. The
processElementmethod retrieves the rule from the broadcast state and the previous sensor event of the keyed state. If the expression evaluates toTRUE(discussed in the next section), an alert will be emitted. - onTimer() – This is called when a previously registered timer fires. Timers can be registered in the
processElementmethod and are used to perform computations or clean up states in the future. This is used in our code to make sure any old data (as defined by our rule) is evicted as necessary.
We can handle the rule in the broadcast state instance as follows:
Notice what happens in the code when the rule status is INACTIVE. This would remove the rule from the broadcast state, which would then no longer consider the rule to be used. Similarly, handling the broadcast of a rule that is ACTIVE would add or replace the rule within the broadcast state. This is allowing us to dynamically make changes, adding and removing rules as necessary.
Evaluating rules
Rules can be evaluated in a variety of ways. Although it’s not a requirement, our rules were created in a Java Expression Language (JEXL) compatible format. This allows us to evaluate rules by providing a JEXL expression along with the appropriate context (the necessary transactions to reevaluate the rule or key-value pairs), and simply calling the evaluate method:
A powerful feature of JEXL is that not only can it support simple expressions (such as those including comparison and arithmetic), it also has support for user-defined functions. JEXL allows you to call any method on a Java object using the same syntax. If there is a POJO with the name SENSOR_cebb1baf_2df0_4267_b489_28be562fccea that has the method hasNotChanged, you would call that method using the expression. You can find more of these user-defined functions that we used within our SensorMapState class.
Let’s look at an example of how this would work, using a rule expression exists that reads as follows:
"SENSOR_cebb1baf_2df0_4267_b489_28be562fccea.hasNotChanged(5)"
This rule, evaluated by JEXL, would be equivalent to a sensor that hasn’t changed in 5 minutes
The corresponding user-defined function (part of SensorMapState) that is exposed to JEXL (using the context) is as follows:
Relevant data, like that below, would go into the context window, which would then be used to evaluate the rule.
In this case, the result (or value of isAlertTriggered) is TRUE.
Creating sinks
Much like how we previously created sources, we also can create sinks. These sinks will be used as the end to our stream processing where our analyzed and evaluated results will get emitted for future use. Like our source, our sink is also a Kinesis data stream, where a downstream Lambda consumer will iterate the records and process them to take the appropriate action. There are many applications of downstream processing; for example, we can persist this evaluation result, create a push notification, or update a rule dashboard.
Based on the previous evaluation, we have the following logic within the process function itself:
When the process function emits the alert, the alert response is sent to the sink, which then can be read and used downstream in the architecture:
At this point, we can then process it. We have a Lambda function logging the records where we can see the following:
Although simplified in this example, these code snippets form the basis for taking the evaluation results and sending them elsewhere.
Conclusion
In this post, we demonstrated how to implement a dynamic rules engine using Managed Service for Apache Flink with both the rules and input data streamed through Kinesis Data Streams. You can learn more about it with the e-learning that we have available.
As companies seek to implement near real-time rules engines, this architecture presents a compelling solution. Managed Service for Apache Flink offers powerful capabilities for transforming and analyzing streaming data in real time, while simplifying the management of Flink workloads and seamlessly integrating with other AWS services.
To help you get started with this architecture, we’re excited to announce that we’ll be publishing our complete rules engine code as a sample on GitHub. This comprehensive example will go beyond the code snippets provided in our post, offering a deeper look into the intricacies of building a dynamic rules engine with Flink.
We encourage you to explore this sample code, adapt it to your specific use case, and take advantage of the full potential of real-time data processing in your applications. Check out the GitHub repository, and don’t hesitate to reach out with any questions or feedback as you embark on your journey with Flink and AWS!
About the Authors
 Steven Carpenter is a Senior Solution Developer on the AWS Industries Prototyping and Customer Engineering (PACE) team, helping AWS customers bring innovative ideas to life through rapid prototyping on the AWS platform. He holds a master’s degree in Computer Science from Wayne State University in Detroit, Michigan. Connect with Steven on LinkedIn!
 Aravindharaj Rajendran is a Senior Solution Developer within the AWS Industries Prototyping and Customer Engineering (PACE) team, based in Herndon, VA. He helps AWS customers materialize their innovative ideas by rapid prototyping using the AWS platform. Outside of work, he loves playing PC games, Badminton and Traveling.


 Florian Mair is a Senior Solutions Architect and data streaming expert at AWS. He is a technologist that helps customers in Europe succeed and innovate by solving business challenges using AWS Cloud services. Besides working as a Solutions Architect, Florian is a passionate mountaineer, and has climbed some of the highest mountains across Europe.
 Emil Dietl is a Senior Tech Lead at Krones specializing in data engineering, with a key field in Apache Flink and microservices. His work often involves the development and maintenance of mission-critical software. Outside of his professional life, he deeply values spending quality time with his family.
 Simon Peyer is a Solutions Architect at AWS based in Switzerland. He is a practical doer and is passionate about connecting technology and people using AWS Cloud services. A special focus for him is data streaming and automations. Besides work, Simon enjoys his family, the outdoors, and hiking in the mountains.