Today we’re expanding Amazon CloudWatch capabilities to unify and manage log data across operational, security, and compliance use cases with flexible and powerful analytics in one place and with reduced data duplication and costs.
You can also correlate your operational data in CloudWatch with other business data from your preferred tools to correlate with other data. This unified approach streamlines management and provides comprehensive correlation across security, operational, and business use cases.
Here are the detailed enhancements:
Streamline data ingestion and normalization – CloudWatch automatically collects AWS vended logs across accounts and AWS Regions, integrating with AWS Organizations from AWS services including AWS CloudTrail,Amazon Virtual Private Cloud (Amazon VPC) Flow Logs, AWS WAF access logs, Amazon Route 53 resolver logs, and pre-built connectors for third-party sources such as endpoint (CrowdStrike, SentinelOne), identity (Okta, Entra ID), cloud security (Wiz), network security (Zscaler, Palo Alto Networks), productivity and collaboration (Microsoft Office 365, Windows Event Logs, and GitHub), along with IT service manager with ServiceNow CMBD. To normalize and process your data as they are being ingested, CloudWatch offers managed OCSF conversion for various AWS and third-party data sources and other processors such ad Grok for custom parsing, field-level operations, and string manipulations.
Reduce costly log data management – CloudWatch consolidates log management into a single service with built-in governance capabilities without storing and maintaining multiple copies of the same data across different tools and data stores. The unified data store of CloudWatch eliminates the need for complex ETL pipelines and reduces your operational costs and management overhead needed to maintain multiple separate data stores and tools.
Discover business insights from log data – You can run queries in CloudWatch using natural language queries and popular query languages such as LogsQL, PPL, and SQL through a single interface, or query your data using your preferred analytics tools through Apache Iceberg-compatible tables. The new Facets interface gives you intuitive filtering by source, application, account, region, and log type, which you can use to run queries across log groups of multiple AWS accounts and Regions with intelligent parameter inference.
In the next sections we explore the new log management and analytics features of the CloudWatch Logs!
1. Data discovery and management by data sources and types
You can see a high-level overview of logs and all data sources with a new Logs Management View in the CloudWatch console. To get started, go to the CloudWatch console and choose Log Management under the Logs menu in the left navigation pane. In the Summary tab, you can observe your logs data sources and types, insights into how your log groups are doing across ingestion, and anomalies.
Choose the Data sources tab to find and manage your log data by data sources, types, and fields. CloudWatch ingests and automatically categorizes data sources by AWS services, third-party, or custom sources such as application logs.
Choose the Data source actions to integrate S3 Tables to make future logs for selected data sources. You have the flexibility to analyze the logs through Athena and Amazon Redshift and other query engines such as Spark using Iceberg compatible access patterns. With this integration, logs from CloudWatch are available in a read-only aws-cloudwatch S3 Tables bucket.
When you choose a specific data source such as CloudTrail data, you can view the details of the data source that includes information regarding data format, pipeline, facets/field indexes, S3 Tables association, and the number of logs with that data source. You can observe all log groups included in this data source and type and edit a source/type field index policy using the new schema support.
To learn more about how to manage your data sources and index policy, visit Data sources in the Amazon CloudWatch Logs User Guide.
2. Ingestion and transformation using CloudWatch pipelines
You can create pipelines to streamline collecting, transforming, and routing telemetry and security data while standardizing data formats to optimize observability and security data management. The new pipeline feature of CloudWatch connects data from a catalogue of data sources, so that you can add and configure pipeline processors from a library to parse, enrich, and standardize data.
In the Pipeline tab, choose Add pipeline. It shows you the pipeline configuration wizard. This wizard guides you through five steps where you can choose the data source and other source details such as log source types, configure destination, configure up to 19 processors to perform an action on your data (such as filtering, transforming, or enriching), and finally review and deploy the pipeline.
You also have the option to create pipelines through the new Ingestion experience in CloudWatch. To learn more about how to set up and manage the pipelines, visit Pipelines in the Amazon CloudWatch Logs User Guide.
3. Enhanced analytics and querying based on data sources
You can enhance analytics with support for Facets and querying based on data sources. Facets enable interactive exploration and drill-down into logs and their values are automatically extracted based on the selected time period.
Choose the Facets tab in the Log Insights under the Logs menu in the left navigation pane. You can view available facets and values that appear in the panel. Choose one or more facets and values to interactively explore your data. I choose Facets regarding a VPC Flow Logs group and action, query to list the five most frequent patterns in my VPC Flow Logs through the AI query generator, and get the result patterns.
You can save your query with the selected Facets and values that you have specified. When you next choose your saved query, the logs to be queried have the pre-specified facets and values. To learn more about Facet management, visit Facets in the CloudWatch Logs User Guide.
As I previously noted, you can integrate data sources into S3 Tables and query together. For example, using a Query Editor in Athena, you can query correlates network traffic with AWS API activity from a specific IP range (174.163.137.*) by joining VPC Flow Logs with CloudTrail logs based on matching source IP addresses.
This type of integrated search is particularly valuable for security monitoring, incident investigation, and suspicious behavior detection. You can view if an IP that’s making network connections is also performing sensitive AWS operations such as creating users, modifying security groups, or accessing data.
Now available New log management features of Amazon CloudWatch are available today in all AWS Regions except the AWS GovCloud (US) Regions and China Regions. For Regional availability and future roadmap, visit the AWS Capabilities by Region. There are no upfront commitments or minimum fees, and you pay for the usage of existing CloudWatch Logs for data ingestion, storage, and queries. To learn more, visit the CloudWatch pricing page.
Streamline your AWS infrastructure development with AI-powered documentation search, validation, and troubleshooting
Introduction
Today, we’re excited to introduce the AWS Infrastructure-as-Code (IaC) MCP Server, a new tool that bridges the gap between AI assistants and your AWS infrastructure development workflow. Built on the Model Context Protocol (MCP), this server enables AI assistants like Kiro CLI, Claude or Cursor to help you search AWS CloudFormation and Cloud Development Kit (CDK) documentation, validate templates, troubleshoot deployments, and follow best practices – all while maintaining the security of local execution.
Whether you’re writing AWS CloudFormation templates or AWS Cloud Development Kit (CDK) code, the IaC MCP Server acts as an intelligent companion that understands your infrastructure needs and provides contextual assistance throughout your development lifecycle.
The Model Context Protocol (MCP) is an open standard that enables AI assistants to securely connect to external data sources and tools. Think of it as a universal adapter that lets AI models interact with your development tools while keeping sensitive operations local and under your control.
The IaC MCP Server provides nine specialized tools organized into two categories:
Remote Documentation Search Tools
These tools connect to the AWS Knowledge MCP backend to retrieve relevant, up-to-date information:
search_cdk_documentation Search the AWS CDK knowledge base for APIs, concepts, and implementation guidance.
search_cdk_samples_and_constructs Discover pre-built AWS CDK constructs and patterns from the AWS Construct Library.
search_cloudformation_documentation Query CloudFormation documentation for resource types, properties, and intrinsic functions.
read_cdk_documentation_page Retrieve and read full documentation pages returned from searches or provided URLs.
Local Validation and Troubleshooting Tools
These tools run entirely on your machine
cdk_best_practices Access a curated collection of AWS CDK best practices and design principles.
validate_cloudformation_template Perform syntax and schema validation using cfn-lint to catch errors before deployment.
check_cloudformation_template_compliance Run security and compliance checks against your templates using AWS Guard rules and cfn-guard.
troubleshoot_cloudformation_deployment Analyze CloudFormation stack deployment failures with integrated CloudTrail event analysis. This tool will use your AWS credentials to analyze your stack status.
get_cloudformation_pre_deploy_validation_instructions Returns instructions for CloudFormation’s pre-deployment validation feature, which validates templates during change set creation.
Key Use Cases
Intelligent Documentation Assistant
Instead of manually searching through documentation, ask your AI assistant natural language questions:
“How do I create an S3 bucket with encryption enabled in CDK?”
The server searches CDK best practic and samples, returning relevant code examples and explanations.
2. Proactive Template Validation
Before deploying infrastructure changes:
User: “Validate my CloudFormation template and check for security issues”
AI Agent: [Uses validate_cloudformation_template and check_cloudformation_template_compliance]
“Found 2 issues: Missing encryption on EBS volumes,
and S3 bucket lacks public access block configuration”
3. Rapid Deployment Troubleshooting
When a stack deployment fails:
User: “My stack ‘stack_03’ in us-east-1 failed to deploy. What happened?”
AI Agent: [Uses troubleshoot_stack_deployment with CloudTrail integration]
“The deployment failed due to insufficient IAM permissions.
CloudTrail shows AccessDenied for ec2:CreateVpc.
You need to add VPC permissions to your deployment role.”
4. Learning and Exploration
New to AWS CDK? The server helps you discover constructs and patterns:
User: “Show me how to build a serverless API”
AI Agent: [Searches CDK constructs and samples]
“Here are three approaches using API Gateway + Lambda…”
Architecture and Security
Security Design
Local Execution: The MCP server runs entirely on your local machine using uv (the fast Python package manager). No code or templates are sent to external services except for documentation searches.
AWS Credentials: The server uses your existing AWS credentials (from ~/.aws/credentials, environment variables, or IAM roles) to access CloudFormation and CloudTrail APIs. This follows the same security model as the AWS CLI.
stdio Communication: The server communicates with AI assistants over standard input/output (stdio), with no network ports opened.
Minimal Permissions: For full functionality, the server requires read-only access to CloudFormation stacks and CloudTrail events—no write permissions needed for validation and troubleshooting workflows.
Getting Started
Prerequisites
Python 3.10 or later uv package manager AWS credentials configured locally MCP-compatible AI client (e.g., Kiro CLI, Claude Desktop)
Configuration
Configure the MCP server in your MCP client configuration. For this blog we will focus on Kiro CLI. Edit .kiro/settings/mcp.json):
Privacy Notice: This MCP server executes AWS API calls using your credentials and shares the response data with your third-party AI model provider (e.g., Amazon Q, Claude Desktop, Cursor, VS Code). Users are responsible for understanding your AI provider’s data handling practices and ensuring compliance with your organization’s security and privacy requirements when using this tool with AWS resources.
IAM Permissions
The MCP server requires the following AWS permissions:
For Template Validation and Compliance:
No AWS permissions required (local validation only)
For Deployment Troubleshooting:
cloudformation:DescribeStacks
cloudformation:DescribeStackEvents
cloudformation:DescribeStackResources
cloudtrail:LookupEvents (for CloudTrail deep links)
IMPORTANT: Ensure you have satisfied all prerequisites before attempting these commands.
1. With the mcp.json file correctly set, try to run a sample prompt. In your terminal, run kiro-cli chat to start using Kiro-cli in the CLI.
Figure 1: Kiro-CLI with AWS IaC MCP server
Scenarios:
“What are the CDK best practices for Lambda functions?”
Figure 2: Search the CDK best practices for Lambda functions
“Search for CDK samples that use DynamoDB with Lambda”
Figure 3: Search for CDK samples that use DynamoDB with Lambda
“Validate my CloudFormation template at ./template.yaml”
Figure 4: Validate my CloudFormation template with AWS IaC MCP Server
“Check if my template complies with security best practices”
Figure 5: Check if my template complies with security best practices with AWS IaC MCP Server
Best Practices
Start with Documentation Search: Before writing code, search for existing constructs and patterns
Validate Early and Often: Run validation tools before attempting deployment
Check Compliance: Use check_template_compliance to catch security issues during development
Leverage CloudTrail: When troubleshooting, the CloudTrail integration provides detailed failure context
Follow CDK Best Practices: Use the cdk_best_practices tool to align with AWS recommendations
What’s Next?
The IAC MCP Server represents a new paradigm in the AI agentic workflow infrastructure development – one where AI assistants understand your tools, help you navigate complex documentation, and provide intelligent assistance throughout the development lifecycle.
Feedback: We welcome issues and pull requests! Or respond to our IaC survey here.
Ready to supercharge your infrastructure as code development? Install the IaC MCP Server today and experience AI-powered assistance for your AWS CDK and CloudFormation workflows.
Have questions or feedback? Reach out to the blog authors on the AWS Developer Forums.
Today, we’re announcing a Controls Dedicated experience in AWS Control Tower. With this feature, you can use Amazon Web Services (AWS) managed controls without the need to set up resources you don’t need, which means you get started faster if you already have an established multi-account environment and want to use AWS Control Tower only for its managed controls. The Controls Dedicated experience gives you seamless access to the comprehensive collection of managed controls in the Control Catalog to incrementally enhance your governance stance.
Until now, customers were required to adopt and configure many recommended best practices which meant implementing a full AWS landing zone at the time of setting up a multi-account environment. This setup included defining the prescribed organizational structure, required services, and more, in AWS Control Tower to start using landing zone. This approach is helpful to ensure a well-architected multi-account environment, however, for customers who already have an established, well-architected multi-account environment and only want to use AWS managed controls, it was more challenging for them to adopt AWS Control Tower. The new Controls Dedicated experience provides a faster and more flexible way of using AWS Control Tower.
How it works Here’s how I define managed controls using the Controls Dedicated experience in AWS Control Tower in one of my accounts.
I start by choosing Enable AWS Control Tower on the AWS Control Tower landing page.
I have the option to set up a full environment, or only set up controls using the Controls Dedicated experience. I opt to set up controls by choosing I have an existing environment and want to enable AWS Managed Controls. Next, I set up the rest of the information, such as choosing the Home Region from the dropdown list so that AWS Control Tower resources are provisioned in this Region during enablement. I also select Turn on automatic account enrollment for AWS Control Tower to enroll accounts automatically when I move them into a registered organization unit. The rest of the information is optional; I choose Enable AWS Control Tower to finalize the process, and the landing zone setup begins.
Behind the scenes, AWS Control Tower installed the required service-linked AWS Identity and Access Management (IAM) roles, and to use detective controls, service-linked Config Recorder in AWS Config in the account where I’m deploying the AWS managed controls. The setup is completed, and now I have all the infrastructure required to use the controls in this account. The dashboard gives a summary of the environment such as the organizational units that were created, the shared accounts, the selected IAM configuration, the preventive controls to enforce policies, and detective controls to detect configuration violations.
I choose View enabled controls for a list of all controls that were installed during this process.
Good to know Usually, an existing AWS Organizations account is required before you can use AWS Control Tower. If you’re using the console to create controls and don’t already have an Organizations account, one will be set up on your behalf.
Earlier, I mentioned a service-linked Config Recorder. With a service-linked Config Recorder, AWS Control Tower prevents the resource types needed for deployed managed controls from being altered. You have flexibility and the ability to keep your own Config Recorders, and only the configuration items for the resource types that are required by your managed detective controls will be enabled, which optimizes your AWS Config costs.
Now available Controls Dedicated experience in AWS Control Tower is available today in all AWS Regions where AWS Control Tower is available.
Organizations are increasingly expanding their Kubernetes footprint by deploying microservices to incrementally innovate and deliver business value faster. This growth places increased reliance on the network, giving platform teams exponentially complex challenges in monitoring network performance and traffic patterns in EKS. As a result, organizations struggle to maintain operational efficiency as their container environments scale, often delaying application delivery and increasing operational costs.
Today, I’m excited to announce Container Network Observability in Amazon Elastic Kubernetes Service (Amazon EKS), a comprehensive set of network observability features in Amazon EKS that you can use to better measure your network performance in your system and dynamically visualize the landscape and behavior of network traffic in EKS.
Here’s a quick look at Container Network Observability in Amazon EKS:
Container Network Observability in EKS addresses observability challenges by providing enhanced visibility of workload traffic. It offers performance insights into network flows within the cluster and those with cluster-external destinations. This makes your EKS cluster network environment more observable while providing built-in capabilities for more precise troubleshooting and investigative efforts.
Getting started with Container Network Observability in EKS
I can enable this new feature for a new or existing EKS cluster. For a new EKS cluster, during the Configure observability setup, I navigate to the Configure network observability section. Here, I select Edit container network observability. I can see there are three included features: Service map, Flow table, and Performance metric endpoint, which are enabled by Amazon CloudWatch Network Flow Monitor.
On the next page, I need to install the AWS Network Flow Monitor Agent.
After it’s enabled, I can navigate to my EKS cluster and select Monitor cluster.
This will bring me to my cluster observability dashboard. Then, I select the Network tab.
Comprehensive observability features Container Network Observability in EKS provides several key features, including performance metrics, service map, and flow table with three views: AWS service view, cluster view, and external view.
With Performance metrics, you can now scrape network-related system metrics for pods and worker nodes directly from the Network Flow Monitor agent and send them to your preferred monitoring destination. Available metrics include ingress/egress flow counts, packet counts, bytes transferred, and various allowance exceeded counters for bandwidth, packets per second, and connection tracking limits. The following screenshot shows an example of how you can use Amazon Managed Grafana to visualize the performance metrics scraped using Prometheus.
With the Service map feature, you can dynamically visualize intercommunication between workloads in your cluster, making it straightforward to understand your application topology with a quick look. The service map helps you quickly identify performance issues by highlighting key metrics such as retransmissions, retransmission timeouts, and data transferred for network flows between communicating pods.
Let me show you how this works with a sample e-commerce application. The service map provides both high-level and detailed views of your microservices architecture. In this e-commerce example, we can see three core microservices working together: the GraphQL service acts as an API gateway, orchestrating requests between the frontend and backend services.
When a customer browses products or places an order, the GraphQL service coordinates communication with both the products service (for catalog data, pricing, and inventory) and the orders service (for order processing and management). This architecture allows each service to scale independently while maintaining clear separation of concerns.
For deeper troubleshooting, you can expand the view to see individual pod instances and their communication patterns. The detailed view reveals the complexity of microservices communication. Here, you can see multiple pod instances for each service and the network of connections between them.
This granular visibility is crucial for identifying issues like uneven load distribution, pod-to-pod communication bottlenecks, or when specific pod instances are experiencing higher latency. For example, if one GraphQL pod is making disproportionately more calls to a particular products pod, you can quickly spot this pattern and investigate potential causes.
Use the Flow table to monitor the top talkers across Kubernetes workloads in your cluster from three different perspectives, each providing unique insights into your network traffic patterns.
Flow table – Monitor the top talkers across Kubernetes workloads in your cluster from three different perspectives, each providing unique insights into your network traffic patterns:
AWS service view shows which workloads generate the most traffic to Amazon Web Services (AWS) services such as Amazon DynamoDB and Amazon Simple Storage Service (Amazon S3), so you can optimize data access patterns and identify potential cost optimization opportunities.
The Cluster view reveals the heaviest communicators within your cluster (east-west traffic), which means you can spot chatty microservices that might benefit from optimization or colocation strategies
External viewidentifies workloads with the highest traffic to destinations outside AWS (internet or on premises), which is useful for security monitoring and bandwidth management.
The flow table provides detailed metrics and filtering capabilities to analyze network traffic patterns. In this example, we can see the flow table displaying cluster view traffic between our e-commerce services. The table shows that the orders pod is communicating with multiple products pods, transferring amounts of data. This pattern suggests the orders service is making frequent product lookups during order processing.
The filtering capabilities are useful for troubleshooting, for example, to focus on traffic from a specific orders pod. This granular filtering helps you quickly isolate communication patterns when investigating performance issues. For instance, if customers are experiencing slow checkout times, you can filter to see if the orders service is making too many calls to the products service, or if there are network bottlenecks between specific pod instances.
Additional things to know Here are key points to note about Container Network Observability in EKS:
Pricing – For network monitoring, you pay standard Amazon CloudWatch Network Flow Monitor pricing.
Availability – Container Network Observability in EKS is available in all commercial AWS regions where Amazon CloudWatch Network Flow Monitor is available.
Export metrics to your preferred monitoring solution – Metrics are available in OpenMetrics format, compatible with Prometheus and Grafana. For configuration details, refer to Network Flow Monitor documentation.
AWS CloudFormation makes it easy to model and provision your cloud application infrastructure as code. CloudFormation templates can be written directly in JSON or YAML, or they can be generated by tools like the AWS Cloud Development Kit (CDK). Resources are created and managed by CloudFormation as units called Stacks. Additionally, change set enable you to preview the stack changes before deployment.
CloudFormation now offers powerful new features that transform how you develop and troubleshoot infrastructure as code, pre-deployment validation that catches errors in seconds, enhanced operation tracking, and simplified failure debugging. These capabilities shift-left infrastructure code validation, helping you prevent infrastructure deployment failures that impacts development velocity.
In this blog post, we’ll explore how these new features accelerate development cycles by catching common errors during change set creation and providing precise troubleshooting through operation tracking and failure filtering. Whether you’re a platform engineer managing complex multi-service deployments or a developer iterating on infrastructure templates, we’ll show you how to:
Validate resource properties and detect naming conflicts before deployment
Prevent deployment failures by checking S3 bucket emptiness before deletion operations
Track operations with unique IDs for focused troubleshooting
Quickly identify root causes using the new describe-events API
This comprehensive guide will walk through real-world scenarios demonstrating how these capabilities can reduce infrastructure deployment failures from hours of debugging to seconds of validation, helping you deliver cloud infrastructure faster and more reliably.
Key Capabilities
Pre-deployment Validation: Catch template errors instantly instead of discovering them after resource provisioning attempts. These include pre-deployment validation for resource property syntax errors, resource naming conflicts for existing resources in your account, and S3 bucket emptiness constraint violations on delete operations.
Operation Tracking: Say goodbye to long debugging sessions. Each stack action now comes with a unique Operation ID, transforming the “needle in haystack” troubleshooting experience into precise, targeted problem-solving.
Streamlined Events API for simplified Debugging: Use the new describe-events API and FailedEvents=true filter to instantly pinpoint issues. One command tells you exactly what went wrong, eliminating the need to scroll through endless logs.
Immediate Feedback: Transform your CI/CD pipeline from a potential bottleneck into a rapid iteration engine. Get immediate feedback on common deployment issues, allowing your team to fix and deploy faster than ever before.
How It works
Pre-deployment Validation
The following scenarios show how you can leverage CloudFormation pre-deployment validation to detect property syntax errors, resource naming conflicts, and constraint violations during change set creation.
Understanding Validation Modes CloudFormation pre-deployment validation operates in two modes that determine how validation failures are handled.
FAIL mode prevents change set execution when validation detects errors, ensuring problematic templates cannot proceed to deployment. This applies to property syntax errors and resource naming conflicts.
WARN mode allows change set creation to succeed despite validation failures, providing warnings that developers can review and address before execution. This applies to constraint violations like S3 bucket emptiness that may be resolvable through manual intervention.
Understanding these modes helps you anticipate whether validation issues will block your deployment workflow or simply require attention before execution.
Let’s walk you through practical scenarios:
Scenario 1: Validate Resource Property Syntax
CloudFormation evaluates each resource property definition or value before provisioning begins. The following example illustrates several common resource property errors:
The “AWS::Lambda::Function” Role property requires an ARN pattern.
The “AWS::Lambda::Function” Timeout property expects an integer instead of a string.
The “AWS::Lambda::Function” TracingConfig.Mode nested property ENUM value is invalid.
The “AWS::Lambda::Alias” Name property is required but not defined.
The “AWS::Lambda::Alias” the extra property Description in a nested path RoutingConfig.AdditionalVersionWeights.0 is not supported.
Prior to this launch, these resource configuration errors would be detected at the resource provisioning time only. However, with the pre-deployment validations feature, these errors can be identified ahead of the deployment phase, streamlining the development-test lifecycle efficiency and minimizing rollbacks during deployments.
You can see the status of the change set is failed with a detailed status reason. You can now proceed to review the change set validation results.
Step 3: Review validation results
Console
With the console, you can review multiple validation errors in a single interface. When you click on a validation, CloudFormation pinpoints the location of the invalid property error in your template.
Figure 3: Pre-deployment validations view
Use Case: Invalid ENUM value for nested property Catching invalid configuration values before deployment. This demonstrates validation of nested properties like TracingConfig.Mode. The tool helpfully shows the supported values “Active” & “Pass through” as well as the provided invalid value “DISABLED”.
Figure 4: Validation of Invalid ENUM value for nested property
Use Case: Lambda Function Timeout property type mismatch Preventing type-related deployment failures. Shows how validation catches string values (“30s”) where integers are required, saving developers from runtime errors.
Figure 5: Validation of Lambda Function Timeout property type mismatch
Use Case: Lambda Function Role property pattern mismatch Validating ARN format requirements. Demonstrates pattern validation ensuring Role properties match required ARN format.
Figure 6: Lambda Function Role property pattern mismatch
Use Case: Undefined required Lambda Alias Name property Catching missing required properties. Shows validation detecting absent mandatory fields, preventing incomplete resource definitions from reaching deployment.
Figure 7: Validation of undefined required Lambda Alias Name property
Notice how the validation Path field (e.g., “/Resources/MyLambdaFunction/Properties/TracingConfig/Mode”) pinpoints the exact template location of each error. This eliminates manual searching through hundreds of lines of infrastructure code – a common time sink that can take minutes in complex templates.
Use case: Unsupported property Shows how CloudFormation validation catches unsupported properties. In this example, the AWS::Lambda::Alias resource had an unsupported extra property Description in a nested path RoutingConfig.AdditionalVersionWeights.0.
Figure 8: CloudFormation validation of unsupported resource property
CLI command You can also use the new describe-events API to review the validation responses.
Scenario 2: Resource Name Conflict Validation Resource name conflict validation makes sure that new resources added to a template are not already present in your AWS account or globally (e.g: Amazon S3, Amazon Route 53 DNS), preventing deployment errors caused due to resource name conflicts
After reviewing the property validation exceptions, let’s assume that you resolved all the issues and successfully deployed the stack. Next, the you have decided to include a S3 bucket resource in the template. You name the bucket “dev-thumbnails” but didn’t verify if the bucket with this name already exists. If a bucket with this name already exists, the CreateChangeSet operation will fail, reporting to the developer that the bucket already exists.
Step 2: Review Deployment Validations Use CloudFormation change set console to review validations response or use the new DescribeEvents API in the CLi.
Scenario 3: S3 bucket not empty Since AWS S3 service does not allow customers to delete S3 Buckets when there are objects in them, the new pre-deployment validations will warn you if you try to delete a bucket that is not empty.
Resuming our journey, let’s assume that you fix the name conflict issue by renaming the bucket to “dev-test-tumbnails”, and then updates the stack. After testing the lambda function’s integration with S3, the dev-cycle generated a few thumbnail objects in the S3 bucket.
Later, you decide to fix the bucket name because you notice a typo: “dev-test-tumbnails” should be “dev-test-thumbnails” (missing “h”). When you update the template to use the corrected name, CloudFormation will need to create the new bucket then delete the old one during the clean-up phase.
{
  "OperationEvents": [
    {
      "EventId": "24920e0f-1941-45a5-9177-786bc805b724",
      "StackId": "arn:aws:cloudformation:us-west-2:123456789012:stack/dev-lambda-stack/2d2c3240-bb59-11f0-b080-0613dc96740d",
      "OperationId": "8fef2b60-b411-4d0e-920e-7ec7c7aa39f2",
      "OperationType": "CREATE_CHANGESET",
      "OperationStatus": "SUCCEEDED",
      "EventType": "STACK_EVENT",
      "Timestamp": "2025-11-06T22:52:26.355000+00:00",
      "StartTime": "2025-11-06T22:52:21.071000+00:00",
      "EndTime": "2025-11-06T22:52:26.355000+00:00"
    },
    {
      "EventId": "c117e02d-a652-4755-9586-6d4ccb0f6504",
      "StackId": "arn:aws:cloudformation:us-west-2:123456789012:stack/dev-lambda-stack/2d2c3240-bb59-11f0-b080-0613dc96740d",
      "OperationId": "8fef2b60-b411-4d0e-920e-7ec7c7aa39f2",
      "OperationType": "CREATE_CHANGESET",
      "EventType": "VALIDATION_ERROR",
      "LogicalResourceId": "MyDevThumbnailsBucket",
      "PhysicalResourceId": "",
      "ResourceType": "AWS::S3::Bucket",
      "Timestamp": "2025-11-06T22:52:25.960000+00:00",
      "ValidationFailureMode": "WARN", "ValidationName": "BUCKET_EMPTINESS_VALIDATION", "ValidationStatus": "FAILED", "ValidationStatusReason": "The bucket 'dev-tumbnails' is not empty. You must either delete all objects and versions or use the deletion policy to retain it, otherwise the delete operation will fail.", "ValidationPath": "/Resources/MyDevThumbnailsBucket"
    },
    {
      "EventId": "6c66ff53-6751-4b4c-96b8-d1a33fc43b4f",
      "StackId": "arn:aws:cloudformation:us-west-2:123456789012:stack/dev-lambda-stack/2d2c3240-bb59-11f0-b080-0613dc96740d",
      "OperationId": "8fef2b60-b411-4d0e-920e-7ec7c7aa39f2",
      "OperationType": "CREATE_CHANGESET",
      "OperationStatus": "IN_PROGRESS",
      "EventType": "STACK_EVENT",
      "Timestamp": "2025-11-06T22:52:21.071000+00:00",
      "StartTime": "2025-11-06T22:52:21.071000+00:00"
    }
  ]
}
Bucket emptiness validation uses WARN mode, which allows change set creation to succeed even when the validation check fails. This gives you time to review and empty the bucket before execution. However, if you execute the change set without emptying the bucket, the delete operation will fail.
Notice in the output above:
ValidationStatus: "FAILED" – The emptiness check detected objects in the bucket
ValidationFailureMode: "WARN" – This is a warning, not a blocking error
OperationStatus: "SUCCEEDED" – Change set creation completed successfully despite the warning
This design allows you to review the warning, take corrective action (such as emptying the bucket), and then proceed with execution.
Beyond catching errors early, these capabilities also transform how you troubleshoot failed deployments with enhanced operation tracking and filtering.
New DescribeEvents API with Operation IDs and root cause filtering
The new DescribeEvents API retrieves CloudFormation events based on flexible query criteria. It groups stack operations by operation ID, enabling you to focus specifically on individual stack operations involved during your stack deployment.
Operation: An operation is any action performed on a stack, including stack lifecycle actions (Create, Update, Delete, Rollback), change set creation, nested stack creation, and automatic rollbacks triggered by failures. Each operation has a unique identifier and represents a discrete change attempt on the stack.
Figure 11: Stack Events grouped by Operation Id
Scenario When an update operation on an existing stack fails and results in a rollback, and you want to understand the reason behind the update stack failure. Using the operation ID obtained from the update stack response or from the describe stacks response, you can call describe events to get details on the failure.
The stack description available via describe-stacks API now includes LastOperations information showing recent operation IDs and their types. This enables you to quickly identify which operations occurred and their current status without parsing through event logs.
Figure 11: CloudFormation Stack Info page showing new operation IDs
Step 3: Review operation status with describe events API and operation id Using the operation ID from the previous step, you can now query specific operation events to understand exactly what happened during that operation. This targeted approach eliminates the need to search through all stack events to find relevant information.
Figure 12: New CloudFormation stack operation page
Step 4: Identify failure root cause(s) with FailedEvents filter The new failure root cause filter instantly surfaces only the events that caused the operation to fail. This eliminates the need to manually scan through progress events to identify the root cause of deployment failures.
The FailedEvents=true filter transforms troubleshooting from parsing dozens of progress events to instantly seeing only what matters. This can make diagnosis of issues during an incident much easier..
Real-World Impact These features improve your Infrastructure development experience with CloudFormation:
Template syntax errors: Previously discovered after minutes of provisioning, now caught in seconds
Resource conflicts: No more failed deployments due to existing resources
Debugging complexity: Transform troubleshooting sessions into faster targeted fixes
CI/CD reliability: Reduce pipeline failures and improve deployment confidence
Getting Started
These capabilities are available today in all AWS Regions where CloudFormation is supported. Pre-deployment validation is automatically enabled for all change set operations, no configuration required.
Try it now:
Create any change set from the CloudFormation console or via SDK or CLI with aws cloudformation create-change-set
Use `aws cloudformation describe-events –change-set-name <your-changeset-arn>` to see validation results
Filter failure root causes instantly: via console or CLI with aws cloudformation describe-events –operation-id <id> –filter FailedEvents=true
Best Practices
Always use change sets: Even for simple updates, change sets now provide validation feedback
Leverage Operation IDs: Use the unique identifiers for focused troubleshooting
Filter events strategically: Use –filters FailedEvents=true to focus on problems
Automate validation: Integrate the describe-events API into your CI/CD pipelines
Use Console: CloudFormation console provides a visual experience with error source mapping to the specific line on your template.
Conclusion
Start using these features today in your development workflow. Whether you’re building new infrastructure or maintaining existing stacks, early validation and enhanced troubleshooting will accelerate your deployment cycles and make it easier to manage infrastructure.
Ready to experience faster CloudFormation development? Create your first change set and see validation in action.
Organizations operating at scale on AWS often need to manage resources across multiple accounts and regions. Whether it’s deploying security controls, compliance configurations, or shared services, maintaining consistency can be challenging.
AWS CloudFormation StackSets (StackSets) has been helping organizations deploy resources across multiple accounts and regions since its launch. While the service is powerful on its own, combining it with Infrastructure as Code (IaC) tools and implementing automated deployments can significantly enhance its capabilities.
In this post, we’ll show you how to leverage AWS CloudFormation StackSets at scale using AWS CDK and implement a robust CI/CD pipeline for automated deployments with AWS CodePipeline.
StackSets key concepts
AWS CloudFormation StackSets allows you to create, update, or delete CloudFormation stacks across multiple AWS accounts and regions with a single operation. It’s essentially a way to manage infrastructure at scale across your AWS organization. Using an administrator account, you define and manage a CloudFormation template, and use the template as the basis for provisioning stacks into selected target accounts across specified AWS Regions:
Figure 1. StackSets overview.
The Administrator Account is the AWS account where you create and manage StackSets and the Target Accounts are the AWS accounts where the stack instances are deployed.
The Stack Instances are individual stacks created from the StackSet template deployed to specific account-region combinations.
You can make the following operations using StackSets: Create, update, and delete actions performed on stack instances. These operations can be applied in concurrent or sequential way.
Sequential Deployment:
Account-by-account deployment
Region-by-region within accounts
Configurable failure thresholds
Parallel Deployment:
Concurrent account deployments
Maximum concurrent account setting
Region priority configuration
Hybrid Deployment:
Combine sequential and parallel
Account group-based deployment
Regional deployment strategies
The power of StackSets
The use of StackSets allows us to extend AWS CloudFormation’s capabilities in several important ways:
Governance
It provides you with Centralized Management as a single point of control while including consistent deployment patterns and automated stack instance management across AWS accounts and regions.
With Drift Detection feature, you can identify if any of the stack instances of your StackSet have configuration differences according to its expected configuration. You detect changes made outside CloudFormation and changes made to an instance stack through CloudFormation directly without using the StackSet.
Flexible Deployment
You also have flexible deployment options with controlled rollout. For example, with Concurrent Deployments you can deploy to multiple accounts within each region simultaneously while controlling deployment order. It also includes failure tolerance with automated retry failed operations.
Operational Efficiency
It reduces manual effort in managing multi-account and multi-region environments while minimizes human error in deployments.
Cost Management
It delivers comprehensive resource organization and streamlined tracking of resources across accounts and regions containing instance stacks. Using centralized management, simplifies the resource tracking and organization enabling you you to have:
unified visibility: view all related stacks from a single StackSet console (with their deployment status)
consistent tagging: apply standardized tags across all stack instances for cost allocation and resource grouping
drift detection: run drift detection across all stack instances simultaneously
operations tracking: track all operations (create, update and delete) across account/regions from one place
Built-in Safety
You can establish maximum concurrent operation limits, failure tolerance thresholds and automatic retry mechanisms. You also have recovery capabilities through update operations. All these features make a built-in safety mechanisms that prevent widespread failures.
Let’s say you have 100 target accounts, with the maximum concurrent limits, you can for example deploy a change to only 10 accounts. Also, with a failure threshold you can set how many failures do you allow before automatically stopping the process (e.g., stop if more than 5 accounts fail). This way you can gradually deploy and test your templates with a little group, establishing failure thresholds, instead of affecting the stacks preventing mass failures.
When an operation fails, AWS CloudFormation performs a rollback in the stack instances deploying the previous working template. You will still need to correct the template and apply it again in all the stack instances. With StackSets, you can fix the issues in the template and run again an update across all the stacks including the concurrent limit and failure threshold mentioned before to safety test the fix.
Security and Compliance management
This security-focused approach with StackSets helps organizations maintain a strong security posture across their AWS environment while reducing the operational overhead of managing security at scale.
You can use StackSets to deploy standardized security policies across accounts, enforce security baselines automatically and implement security guardrails organization-wide. For example, you can deploy detective control resource and its configuration in all your accounts like Amazon GuardDuty or Amazon Macie. You can also deploy preventive controls like SCPs, AWS Firewall Manager or AWS Shield Advanced. For example you can deploy through StackSets the following CloudFormation template en each target account to block certain actions in a region:
<code>AWSTemplateFormatVersion: '2010-09-09'</code><br /><code>Description: 'Service Control Policy to block access to specific AWS regions'</code><br /><br /><code>Parameters:</code><br /><code> PolicyName:</code><br /><code> Type: String</code><br /><code> Default: 'RegionDenyPolicy'</code><br /><code> Description: 'Name for the Service Control Policy'</code><br /><code> </code><br /><code> PolicyDescription:</code><br /><code> Type: String</code><br /><code> Default: 'Blocks access to Singapore region (ap-southeast-1) while allowing global services'</code><br /><code> Description: 'Description for the Service Control Policy'</code><br /><code> </code><br /><code> BlockedRegion:</code><br /><code> Type: String</code><br /><code> Default: 'ap-southeast-1'</code><br /><code> Description: 'AWS Region to block access to'</code><br /><code> AllowedValues:</code><br /><code> - 'ap-southeast-1'</code><br /><code> - 'ap-southeast-2'</code><br /><code> - 'eu-west-3'</code><br /><code> - 'us-west-1'</code><br /><code> - 'ca-central-1'</code><br /><code> </code><br /><code> TargetOUId:</code><br /><code> Type: String</code><br /><code> Description: 'Organizational Unit ID to attach the policy to (e.g., ou-root-xxxxxxxxxx)'</code><br /><code> </code><br /><code>Resources:</code><br /><code> RegionDenySCP:</code><br /><code> Type: AWS::Organizations::Policy</code><br /><code> Properties:</code><br /><code> Name: !Ref PolicyName</code><br /><code> Description: !Ref PolicyDescription</code><br /><code> Type: SERVICE_CONTROL_POLICY</code><br /><code> Content:</code><br /><code> Version: '2012-10-17'</code><br /><code> Statement:</code><br /><code> - Sid: DenyAccessToSpecificRegion</code><br /><code> Effect: Deny</code><br /><code> NotAction:</code><br /><code> - 'route53:*'</code><br /><code> - 'cloudfront:*'</code><br /><code> - 'sts:*'</code><br /><code> Resource: '*'</code><br /><code> Condition:</code><br /><code> StringEquals:</code><br /><code> 'aws:RequestedRegion':</code><br /><code> - !Ref BlockedRegion</code><br /><code> TargetIds:</code><br /><code> - !Ref TargetOUId</code><br /><code> Tags:</code><br /><code> - Key: Purpose</code><br /><code> Value: RegionCompliance</code><br /><code> - Key: ManagedBy</code><br /><code> Value: CloudFormation</code><br /><br /><code>Outputs:</code><br /><code> PolicyId:</code><br /><code> Description: 'ID of the created Service Control Policy'</code><br /><code> Value: !Ref RegionDenySCP</code><br /><code> Export:</code><br /><code> Name: !Sub '${AWS::StackName}-PolicyId'</code><br /><code> </code><br /><code> PolicyArn:</code><br /><code> Description: 'ARN of the created Service Control Policy'</code><br /><code> Value: !GetAtt RegionDenySCP.Arn</code><br /><code> Export:</code><br /><code> Name: !Sub '${AWS::StackName}-PolicyArn'</code>
Other capabilities include compliance-related resources consistently, maintain audit trails of security configurations and ensure regulatory requirements are met across all accounts. For example, you can enable CouldTrail and deploy AWS Config rules across all the instance stacks managed by the StackSet.
For both Security and Compliance incidents you can use StackSets to deploy automated response workflows, configure event notifications and implement remediation actions across your accounts and regions.
Import existing stacks into StackSets
A stack import operation can import existing stacks into new or existing StackSets, so that you can migrate existing stacks to a StackSet in one operation.
Solution Overview
This solution includes an AWS CodePipeline stack that creates a CI/CD pipeline to deploy our StackSet. This pipeline deploys an application stack containing the AWS CloudFormation StackSet with a monitoring dashboard in AWS CloudWatch.
Figure 2. Solution overview
The following Amazon CloudWatch dashboard is an example of what you will in the target accounts after the StackSet is deployed:
Figure 3. Dashboard example
In the CI/CD pipeline, before running the deployment commands, it applies python security and quality code checks to ensure code quality and security and cdk-nag to ensure AWS Well Architected best practices. You can find more details about these checks in the solution repository in README.md file.
The solution includes 2 AWS CloudFormation stacks defined by in the AWS CDK application and a template for the StackSet that will be deployed in the target accounts and regions. This stack contains the monitoring dashboard that will be deployed en the target regions of each target account as a single unit.
The idea of using AWS CodePipeline with IaC is that development teams can define and share “pipelines-as-code” patterns for deploying their applications making it easy to add stages. This way, security and quality code testing can run any time you change the source code.
Figure 4. Pipeline overview
The best practice is to ensure shift-left: adding this checks to the earlier stages of the SDLC. You can accomplish this complementing your CI/CD pipeline with githooks or IDE Plugins. For example with Amazon Q Developer IDE extension you can use the review function to analyze the security of your code locally.
To use the CI/CD pipeline just create a repository using any of the AWS CodeConnection git supported providers and add the contents of the folder. All details are included in the README.md so you can always get the latest version of the code and how it works.
Conclusion
In this post, we showed how to use AWS CDK to deploy AWS CloudFormation StackSets to reduce operational overhead and ensure consistency, compliance and security across multiple regions and accounts. We also learned how to create a CI/CD pipeline to guarantee a robust DevSecOps cycle for our Infrastructure as Code.
Now that we’ve explored the main concepts together, you can clone the example repository from the walkthrough section, follow the setup instructions, and customize the implementation to enhance AWS resources management across accounts and regions. Whether you’re managing a single account or multiple organizations, these practices can be adapted to your specific needs. Now that you learned the main concepts, go ahead and clone the example repository from walkthrough section, follow the setup instructions and customize the implementation to improve the AWS resources management across your accounts and regions.
As organizations adopt multi-account strategies for improved security features and governance, AWS CloudFormation StackSets enables organizations to deploy infrastructure across multiple accounts and regions. However, monitoring and tracking these distributed deployments across multiple accounts presents operational challenges. When a critical security baseline deployed across 50 accounts suddenly starts failing, teams face the daunting task of logging into each account individually to understand what went wrong and which accounts were affected.
This operational overhead scales exponentially with organization growth, requiring platform teams to spend countless hours switching between accounts and manually correlating deployment events. The lack of centralized visibility slows incident response and makes it difficult to identify patterns or implement proactive monitoring. In this blog post, we’ll explore a solution that centralizes AWS CloudFormation logs from multiple accounts into a single management account, making it easier to monitor and troubleshoot StackSets deployments.
Solution Architecture
Our solution creates a centralized logging system that collects AWS CloudFormation events from all target accounts and forwards them to a central management account. This approach provides a single pane of glass for monitoring and troubleshooting AWS CloudFormation deployments across your entire organization.
Figure 1. Architecture diagram showing event flow from member accounts to management account through EventBridge and CloudWatch Logs.
The architecture consists of four main components:
Management Account Setup: Creates a central event bus, log group, and necessary permissions in the organization’s management account.
Target Account Configuration: Deployed via StackSets to configure event rules that forward AWS CloudFormation events to the management account.
Resource Deployment: Uses StackSets to deploy common resources across target accounts, generating the events we want to monitor.
Monitoring and Visualization: Provides dashboards and queries for operational insights.
Event Capture:Amazon EventBridge rules in each target account capture these AWS CloudFormation events based on defined patterns.
Cross-Account Forwarding: Events are forwarded to a custom event bus in the management account using cross-account permissions.
Centralized Logging: The central event bus routes all events to a Amazon CloudWatch Log Group with structured logging.
Monitoring and Alerting: Administrators can view consolidated logs, create custom queries, and set up alerts from a single location.
Prerequisites
Before implementing this solution, ensure you have the following prerequisites in place:
AWS account: Ensure you have valid AWS account.
AWS Organizations: You must have an AWS Organization structure set up with a primary management account and several member accounts under the management account.
Appropriate Permissions: You must have access to the management account or be configured as a delegated administrator to create and manage StackSets. For detailed information about permissions and security considerations when using StackSets with AWS Organizations, please review the Prerequisites in the AWS CloudFormation StackSets documentation.
Implementation Deep Dive
The solution is implemented using two AWS CloudFormation templates that work together to create a comprehensive monitoring system:
This template establishes the central logging infrastructure in the management account by creating a custom Amazon EventBridge event bus with cross-account access policies and an encrypted Amazon CloudWatch Log Group using a customer-managed AWS Key Management Service (AWS KMS) key. A key feature is the included stack set resource that automatically deploys the target account configuration to all member accounts, eliminating manual setup and ensuring consistent configuration across the entire organization.
This template creates a service-managed stack set that deploys common resources to all accounts in specified organizational units. The StackSet is configured with auto-deployment enabled to automatically provision new accounts added to the organization and includes operation preferences for parallel regional deployment with fault tolerance settings.
On the Stacks page, choose Create stack at top right, and then choose With new resources (standard).
On the Create stack page, Upload a template file, choose Choose File to choose a template file from your local computer.
Choose Next to continue and to validate the template.
On the Specify stack details page, type a stack name in the Stack name box.
In the Parameters section, specify values for the parameters that were defined in the template.
Choose Next to continue creating the stack.
Acknowledge capabilities and transforms.
Choose Next to continue.
Choose Submit to launch your stack.
This creates a stack set that deploys Amazon Simple Storage Service (Amazon S3) infrastructure to all target accounts, generating AWS CloudFormation events that will be captured by your centralized logging system.
Figure 3: Screenshot showing successful deployment of common-resources-stackset.yaml template for target accounts
Step 4: Validation and Testing
Confirm event flow and monitoring functionality by viewing the log streams in the ‘central-cloudformation-logs’ log group.
Monitoring and Visualization
The centralized logging solution provides advanced monitoring capabilities through Amazon CloudWatch Logs Insights and custom dashboards.
You can customize your queries to get:
Recent AWS CloudFormation events across all accounts.
Failed stack operations for quick troubleshooting.
Successful deployments for verification.
Event distribution by account and region.
Status breakdown of all AWS CloudFormation operations.
The following query helps you analyze CloudFormation events across your organization by showing:
You can customize your queries to filter for specific conditions such as failed deployment status, particular resource types, or specific accounts to quickly identify and troubleshoot issues across your organization’s AWS CloudFormation deployments.
Cost Implications
When implementing this centralized monitoring solution, you should consider the following cost components:
Amazon EventBridge pricing – Costs associated with events being published across accounts to the central event bus
Amazon CloudWatch pricing – Storage costs for the centralized log group storing CloudFormation events from all accounts. Query costs when analyzing the centralized logs
To clean up the resources created in this solution, follow these steps:
First, delete the common resources stack set (common-resources-stackset) from the AWS CloudFormation console in your management account. This will remove all the resources deployed across your member accounts.
After the stack set operations are complete, delete the management account logging setup stack (log-setup-management) to remove the centralized logging infrastructure, including the event bus, log groups, and associated IAM roles.
Note: Make sure all stack set operations are complete before deleting the management account logging setup to ensure proper cleanup of all resources.
Conclusion
Managing infrastructure across multiple AWS accounts doesn’t have to be complex. By centralizing AWS CloudFormation logs, you can gain visibility into your multi-account deployments, troubleshoot issues more efficiently, and help achieve consistent resource deployment across your organization.
This solution demonstrates how AWS services like AWS CloudFormation StackSets, Amazon EventBridge, and Amazon CloudWatch Logs can be combined to create a powerful monitoring system for your infrastructure as code deployments.
Get started today by implementing this solution in your AWS Organization to gain immediate visibility into your multi-account deployments. Download the templates from our GitHub repository and follow the step-by-step guide to enhance your cloud operations.
AWS CloudFormation StackSets enables organizations to deploy infrastructure consistently across multiple AWS accounts and regions. However, success depends on choosing the right deployment strategy that balances three critical factors: deployment speed, operational safety, and organizational scale. This guide explores proven StackSets deployment strategies specifically designed for multi-account infrastructure management.
Understanding StackSets Deployment Fundamentals
What are StackSets Actually Used For?
Unlike single-account AWS CloudFormation templates, StackSets are specifically designed for multi-account infrastructure governance. Common use cases include Security baselines (deploying IAM policies, security groups, and access controls across all accounts), Compliance controls (rolling out AWS Config rules, AWS CloudTrail configurations, and audit requirements), Organizational standards (establishing consistent VPC configurations, tagging policies, and naming conventions), Shared services (deploying monitoring solutions, logging infrastructure, and backup policies) or Cost management (implementing budget controls, cost allocation tags, and resource optimization policies)
The Multi-Account Challenge
Managing infrastructure across dozens or hundreds of AWS accounts presents unique challenges:
Single Account (CFN Template) Multi-Account (StackSets) App A Org Unit A (50 accounts) | | [Deploy Once] [Deploy consistently across all] | | Success/Fail Complex success/failure matrix
Multi account and multi region Cloudformation deployment complexity
The Speed-Safety-Scale Triangle
Every StackSets deployment strategy involves trade-offs: Speed (how quickly changes propagate across your organization), Safety (risk mitigation and failure containment) and Scale (ability to manage hundreds of accounts efficiently)
Prerequisites
Before implementing any of the deployment strategies described in this guide, ensure you have:
“For a more conservative deployment, set Maximum Concurrent Accounts to 1, and Failure Tolerance to 0. Set your lowest-impact region to be first in the Region Order Start with one region.”
“For a faster deployment, increase the values of Maximum Concurrent Accounts and Failure Tolerance as needed. ”
Based on the above, we are proposing below several deployment strategies, depending on the speed, safety and scale you want to achieve.
1. Sequential Deployment: Maximum Safety
Use Case : Critical security updates, compliance requirements, first-time organizational rollouts
Below are listed some possible use cases:
Security baseline updates: New IAM policies affecting root access
Compliance rollouts: SOX, HIPAA, or PCI-DSS control implementations
Critical infrastructure changes: VPC security group modifications
Organizational policy changes: New AWS Config rules for audit compliance
Implementation Example:
For this example, we will download the following template ConfigRuleCloudtrailEnabled.yml from the Cloudformation sample library in the AWS documentation to configure an AWS Config rule to determine if AWS CloudTrail is enabled and follow the next steps:
The expected response should be similar to the following :
{"StacksetId": "security-baseline: ...."}
Step 2: Create Stack Instances
Before you launch the below command, you need to adjust the values of the following parameters:
OrganizationalUnitIds: you must change the value “ou-test” in the below command line to the name of the target OU you want to deploy to. I recommend creating a new test OU in the console or via the CLI for the purpose of this test.
regions: if needed, change the “us-east-1 eu-west-1” value, here you need to list all the regions you want to deploy to. AWS Config must be active in the accounts/regions that you choose, otherwise you’ll get an error when deploying the Stack.
# Deploy security baseline to production accounts # StackSet operation managed from us-east-1 # Deployed to regions us-east-1 and eu-west-1 # SEQUENTIAL = One region at a time, sequentially # MaxConcurrentPercentage = Deploy to 5% of accounts at once # FailureTolerancePercentage = Stop on first failure aws cloudformation create-stack-instances \ --stack-set-name security-baseline \ --deployment-targets OrganizationalUnitIds=ou-test\ --regions us-east-1 eu-west-1 \ --region us-east-1 \ --operation-preferences RegionConcurrencyType=SEQUENTIAL,MaxConcurrentPercentage=5,FailureTolerancePercentage=0
AWS CLI to create security-baseline Stack Instances sequentially for maximum safety
The CLI output should look like the following:
{"OperationId": ....}
Or create the StackSet and add the Stacks with the AWS Console:
In the CloudFormation Console, click “Create StackSet”
AWS CloudFormation Console: create a security-baseline Stackset
Upload your template from S3 or from your computer and click Next:
AWS CloudFormation Console: specify a template
Specify the StackSet name and parameters and click Next:
AWS CloudFormation Console: specify the StackSet name and parameters
Configure StackSet options and click Next:
AWS CloudFormation Console: configure the StackSet options
Set deployment options and click Next:
AWS CloudFormation Console: set deployment options
AWS CloudFormation Console: set more deployment options
Then Review and Submit.
Not to overweight this blog, we’ll provide only this example of CLI output and Console screenshot, but the “Parallel Deployment” and “Balanced Approach” will be similar to this example. You just need to update the parameters for the different StackSet Operations options.
A real-world example would be a financial services company deploying new MFA requirements across 200 production accounts. They could use sequential deployment with 5 concurrency to ensure each batch was validated before proceeding.
2. Parallel Deployment: Maximum Speed
The Parallel Deployment is best for non-critical updates, development environments, routine maintenance
Here are some possible use cases:
Development account standardization: Rolling out new development tools
Monitoring infrastructure: Deploying Amazon CloudWatch dashboards and alarms
Non-production updates: Updating development and staging environments
Implementation Example:
For this example, we will copy paste the .yml template from this Re:Post article about monitoring IAM events in a file called “monitoring-baseline.yml”, and use it in the following command lines.
Just like in the previous example, before you launch the below command, you need to adjust the values of the OrganizationalUnitIds and regions parameters.
# Deploy monitoring baseline to dev and sandbox accounts # StackSet operation managed from us-east-1 # Deployed to regions us-east-1 and eu-west-1 # PARALLEL = Deployment in parallel # MaxConcurrentPercentage = Deploy to 80% of accounts at once # FailureTolerancePercentage = Tolerate failures in 20% of accounts aws cloudformation create-stack-instances \ --stack-set-name monitoring-baseline \ --deployment-targets OrganizationalUnitIds=ou-development,ou-sandbox \ --regions us-east-1 eu-west-1 \ --region us-east-1 \ --operation-preferences RegionConcurrencyType=PARALLEL,MaxConcurrentPercentage=80,FailureTolerancePercentage=20
AWS CLI to create monitoring-baseline Stack Instances in parallel with high value for max concurrent percentage for maximum speed
3. Progressive Deployment: Balanced Approach or Multi Phase Approach (Recommended)
For most production scenarios with moderate risk tolerance, it is recommended to use a Balanced Approach, or Multi-Phase Implementation.
Balanced Approach
For this example, to make it easier, you can create a copy of “monitoring-baseline.yml” created previously, and name it “balanced-template.yml”.
cp monitoring-baseline.yml balanced-template.yml
bash command to copy the monitoring-baseline.yml file to balanced-template.yml
Then you can use it in the following command lines.
You need to adjust the values of the OrganizationalUnitIds and regions parameters.
# Deploy monitoring baseline to production accounts # StackSet operation managed from us-east-1 # Deployed to regions us-east-1 # SEQUENTIAL = Deployment in sequence # MaxConcurrentPercentage = 100% Deploy full speed for small pilot # FailureTolerancePercentage = Zero tolerance in pilot aws cloudformation create-stack-instances \ --stack-set-name balanced-deployment \ --deployment-targets Accounts=pilot-account-1,pilot-account-2 \ --regions us-east-1 \ --region us-east-1 \ --operation-preferences RegionConcurrencyType=SEQUENTIAL,MaxConcurrentPercentage=100,FailureTolerancePercentage=0
AWS CLI to create balanced-deployment Stack Instances sequentially for maximum safety in Pilot accounts
Wait for Pilot validation before proceeding to Phase 2
Phase 2: Early Adopter OUs (30% of target)
Phase 2: Create Early Adopter Stack Instances
You need to adjust the values of the OrganizationalUnitIds and regions parameters.
# Deploy monitoring baseline to production accounts # StackSet operation managed from us-east-1 # Deployed to regions us-east-1, eu-west-1 # PARALLEL = Deployment in parallel # MaxConcurrentPercentage = Deploy to 25% of accounts at once # FailureTolerancePercentage = Tolerate failures in 5% of accounts aws cloudformation create-stack-instances \ --stack-set-name balanced-deployment \ --deployment-targets OrganizationalUnitIds=ou-early-adopter \ --regions us-east-1 \ --region us-east-1 eu-west-1 \ --operation-preferences RegionConcurrencyType=PARALLEL,MaxConcurrentPercentage=25,FailureTolerancePercentage=5
AWS CLI to create balanced-deployment Stack Instances in parallel with low max concurrent percentage for a balanced deployment in Early Adopter OU
Wait for Early Adopter validation before proceeding to Phase 3
Phase 3: Full Deployment (Remaining 60%)
Phase 3: Full Deployment
You need to adjust the values of the OrganizationalUnitIds and regions parameters.
# Deploy monitoring baseline to production accounts # StackSet operation managed from us-east-1 # Deployed to regions us-east-1, eu-west-1 and ap-southeast-1 # PARALLEL = Deployment in parallel # MaxConcurrentPercentage = Deploy to 40% of accounts at once for higher speed after validation # FailureTolerancePercentage = Tolerate failures in 10% of accounts for moderate tolerance aws cloudformation create-stack-instances \ --stack-set-name balanced-deployment \ --deployment-targets OrganizationalUnitIds=ou-standard-prod,ou-legacy-prod \ --regions us-east-1 \ --region us-east-1 eu-west-1 ap-southeast-1 \ --operation-preferences RegionConcurrencyType=PARALLEL,MaxConcurrentPercentage=25,FailureTolerancePercentage=5
AWS CLI to create balanced-deployment Stack Instances in parallel with low max concurrent percentage for a balanced deployment in the remaining OUs
Using Step Functions for Orchestration
AWS Step Functions provides a serverless workflow service that can orchestrate StackSets deployments with advanced control flow, error handling, and state management capabilities. This approach enhances your multi-account deployments with features not available through standard StackSets operations alone.
Some of the Key Benefits include:
Advanced Deployment Orchestration: Coordinate multi-phase rollouts with validation gates
Human Approval Workflows: Implement manual approval steps for critical changes
Enhanced Error Handling: Define sophisticated retry policies and fallback mechanisms
Visual Monitoring: Track deployment progress through the Step Functions visual console
Real-World Use Case: Compliance Control Rollout
In regulated industries, AWS Step Functions enables a phased approach that combines automation with necessary governance. For instance, you can:
Deploy compliance controls to test accounts
Run automated validation and generate compliance reports
Obtain manual approval from compliance team
Deploy to production accounts with comprehensive monitoring
This approach ensures consistent governance while maintaining the complete audit trail required for regulatory compliance.
Monitoring and Optimization
AWS CloudFormation StackSets do not have extensive built-in Amazon CloudWatch metrics specifically designed for monitoring StackSet operations and health. This is actually why the monitoring implementation in our blog post is valuable.
Here’s what AWS does and doesn’t provide out of the box:
What AWS provides natively:
Basic AWS API call metrics via AWS CloudTrail (which show that operations happened but don’t track success rates or performance)
General service quotas and throttling metrics for CloudFormation as a whole
CloudFormation provides some metrics for individual stacks, but not consolidated StackSet-specific metrics
What requires custom implementation (as in our blog post):
Success rate metrics for StackSet operations across accounts
Deployment completion time tracking
Configuration drift detection and monitoring
Account-specific failure analysis
Comprehensive dashboards that show StackSet health across your organization
The code in our blog post demonstrates how to implement the success rate custom metrics by:
Gathering data from the CloudFormation API about StackSet operations
Calculating the success rate metrics for StackSet deployments
Creating custom Amazon CloudWatch metrics in a custom namespace (like “StackSetMonitoring”)
Setting up alerts for issues
This explains why organizations need to implement custom monitoring solutions like the one shown in our blog post rather than relying solely on built-in metrics.
Automated Monitoring Implementation: example of a custom metric to monitor the StackSet operations success rate
The following AWS Cloudformation template provides real-time monitoring and alerting for AWS CloudFormation StackSet operations through automated infrastructure deployment. This solution creates a complete monitoring system using a AWS Lambda function, Amazon EventBridge rules, Amazon SNS notifications, and Amazon CloudWatch dashboards to track StackSet success and failure rates. The core Lambda function named StackSetMonitor continuously monitors all active StackSets in your account, calculating success rates and publishing custom metrics to Amazon CloudWatch under the StackSetMonitoring namespace.
Below you’ll find a few example of possible custom metrics that could be implemented based on this AWS Cloudformation template:
Count of all operations (CREATE, UPDATE, DELETE) per StackSet over time periods
Number of stack instances with configuration drift (requires additional API calls)
Average time taken for StackSet operations to complete
Rate of StackSet operations to identify peak usage times
Number of individual stack instances that failed during operations
Number of retried operations (indicates infrastructure issues)
…
Here’s the StackSetMonitor.yml CloudFormation Template:
# StackSetMonitor.yml
# CFN template for monitoring AWS CloudFormation StackSet operations with real-time alerts, metrics, and dashboards.
AWSTemplateFormatVersion: '2010-09-09'
Description: 'CloudFormation template for StackSet operation monitoring using CloudWatch and SNS'
Parameters:
StackSetName:
Type: String
Description: 'Name of the StackSet to monitor'
Default: 'security-baseline'
MinLength: 1
MaxLength: 128
AllowedPattern: '[a-zA-Z][-a-zA-Z0-9]*'
ConstraintDescription: 'Must be a valid StackSet name (1-128 characters, alphanumeric and hyphens, must start with a letter)'
VpcId:
Type: String
Description: 'VPC ID where the Lambda function will be deployed (leave empty to create new VPC)'
Default: ''
SubnetIds:
Type: CommaDelimitedList
Description: 'List of subnet IDs for the Lambda function (leave empty to create new subnets)'
Default: ''
SecurityGroupIds:
Type: CommaDelimitedList
Description: 'List of security group IDs for the Lambda function (leave empty to create new security group)'
Default: ''
Conditions:
CreateVPC: !Equals [!Ref VpcId, '']
CreateVPCAndSubnets: !And [!Equals [!Ref VpcId, ''], !Equals [!Join [',', !Ref SubnetIds], '']]
HasCustomSecurityGroups: !Not [!Equals [!Join [',', !Ref SecurityGroupIds], '']]
Resources:
# KMS Key for CloudWatch Logs encryption
LogsKMSKey:
Type: AWS::KMS::Key
DeletionPolicy: Delete
UpdateReplacePolicy: Delete
Properties:
Description: 'KMS Key for StackSet Monitor CloudWatch Logs and Lambda environment variable encryption'
EnableKeyRotation: true
KeyPolicy:
Version: '2012-10-17'
Statement:
- Sid: Enable IAM User Permissions
Effect: Allow
Principal:
AWS: !Sub 'arn:${AWS::Partition}:iam::${AWS::AccountId}:root'
Action: 'kms:*'
Resource: '*'
- Sid: Allow CloudWatch Logs
Effect: Allow
Principal:
Service: !Sub 'logs.${AWS::Region}.amazonaws.com'
Action:
- 'kms:Encrypt'
- 'kms:Decrypt'
- 'kms:ReEncrypt*'
- 'kms:GenerateDataKey*'
- 'kms:DescribeKey'
Resource: '*'
Condition:
ArnEquals:
'kms:EncryptionContext:aws:logs:arn':
- !Sub 'arn:${AWS::Partition}:logs:${AWS::Region}:${AWS::AccountId}:log-group:/aws/lambda/StackSetMonitor'
- !Sub 'arn:${AWS::Partition}:logs:${AWS::Region}:${AWS::AccountId}:log-group:/aws/cloudformation/stacksets'
- Sid: Allow Lambda Service
Effect: Allow
Principal:
Service: lambda.amazonaws.com
Action:
- 'kms:Encrypt'
- 'kms:Decrypt'
- 'kms:ReEncrypt*'
- 'kms:GenerateDataKey*'
- 'kms:DescribeKey'
Resource: '*'
LogsKMSKeyAlias:
Type: AWS::KMS::Alias
Properties:
AliasName: alias/stackset-monitor-logs
TargetKeyId: !Ref LogsKMSKey
# VPC Resources (created when no existing VPC is provided)
StackSetMonitorVPC:
Type: AWS::EC2::VPC
Condition: CreateVPC
Properties:
CidrBlock: 10.0.0.0/16
EnableDnsHostnames: true
EnableDnsSupport: true
Tags:
- Key: Name
Value: StackSetMonitor-VPC
- Key: Purpose
Value: VPC for StackSet Monitor Lambda function
PrivateSubnet1:
Type: AWS::EC2::Subnet
Condition: CreateVPC
Properties:
VpcId: !Ref StackSetMonitorVPC
CidrBlock: 10.0.1.0/24
AvailabilityZone: !Select [0, !GetAZs '']
Tags:
- Key: Name
Value: StackSetMonitor-Private-Subnet-1
- Key: Purpose
Value: Private subnet for StackSet Monitor Lambda
PrivateSubnet2:
Type: AWS::EC2::Subnet
Condition: CreateVPC
Properties:
VpcId: !Ref StackSetMonitorVPC
CidrBlock: 10.0.2.0/24
AvailabilityZone: !Select [1, !GetAZs '']
Tags:
- Key: Name
Value: StackSetMonitor-Private-Subnet-2
- Key: Purpose
Value: Private subnet for StackSet Monitor Lambda
PrivateRouteTable1:
Type: AWS::EC2::RouteTable
Condition: CreateVPC
Properties:
VpcId: !Ref StackSetMonitorVPC
Tags:
- Key: Name
Value: StackSetMonitor-Private-RT-1
PrivateRouteTable2:
Type: AWS::EC2::RouteTable
Condition: CreateVPC
Properties:
VpcId: !Ref StackSetMonitorVPC
Tags:
- Key: Name
Value: StackSetMonitor-Private-RT-2
PrivateSubnet1RouteTableAssociation:
Type: AWS::EC2::SubnetRouteTableAssociation
Condition: CreateVPC
Properties:
RouteTableId: !Ref PrivateRouteTable1
SubnetId: !Ref PrivateSubnet1
PrivateSubnet2RouteTableAssociation:
Type: AWS::EC2::SubnetRouteTableAssociation
Condition: CreateVPC
Properties:
RouteTableId: !Ref PrivateRouteTable2
SubnetId: !Ref PrivateSubnet2
# VPC Endpoints for AWS Services (no internet access needed)
CloudFormationVPCEndpoint:
Type: AWS::EC2::VPCEndpoint
Condition: CreateVPC
Properties:
VpcId: !Ref StackSetMonitorVPC
ServiceName: !Sub com.amazonaws.${AWS::Region}.cloudformation
VpcEndpointType: Interface
SubnetIds:
- !Ref PrivateSubnet1
- !Ref PrivateSubnet2
SecurityGroupIds:
- !Ref VPCEndpointSecurityGroup
PrivateDnsEnabled: true
PolicyDocument:
Version: '2012-10-17'
Statement:
- Effect: Allow
Principal: '*'
Action:
- cloudformation:ListStackSets
- cloudformation:ListStackSetOperations
- cloudformation:ListStackInstances
- cloudformation:DescribeStackInstance
- cloudformation:DescribeStacks
- cloudformation:GetTemplate
Resource: '*'
CloudWatchVPCEndpoint:
Type: AWS::EC2::VPCEndpoint
Condition: CreateVPC
Properties:
VpcId: !Ref StackSetMonitorVPC
ServiceName: !Sub com.amazonaws.${AWS::Region}.monitoring
VpcEndpointType: Interface
SubnetIds:
- !Ref PrivateSubnet1
- !Ref PrivateSubnet2
SecurityGroupIds:
- !Ref VPCEndpointSecurityGroup
PrivateDnsEnabled: true
PolicyDocument:
Version: '2012-10-17'
Statement:
- Effect: Allow
Principal: '*'
Action:
- cloudwatch:PutMetricData
Resource: '*'
SNSVPCEndpoint:
Type: AWS::EC2::VPCEndpoint
Condition: CreateVPC
Properties:
VpcId: !Ref StackSetMonitorVPC
ServiceName: !Sub com.amazonaws.${AWS::Region}.sns
VpcEndpointType: Interface
SubnetIds:
- !Ref PrivateSubnet1
- !Ref PrivateSubnet2
SecurityGroupIds:
- !Ref VPCEndpointSecurityGroup
PrivateDnsEnabled: true
PolicyDocument:
Version: '2012-10-17'
Statement:
- Effect: Allow
Principal: '*'
Action:
- sns:Publish
Resource: '*'
EventsVPCEndpoint:
Type: AWS::EC2::VPCEndpoint
Condition: CreateVPC
Properties:
VpcId: !Ref StackSetMonitorVPC
ServiceName: !Sub com.amazonaws.${AWS::Region}.events
VpcEndpointType: Interface
SubnetIds:
- !Ref PrivateSubnet1
- !Ref PrivateSubnet2
SecurityGroupIds:
- !Ref VPCEndpointSecurityGroup
PrivateDnsEnabled: true
PolicyDocument:
Version: '2012-10-17'
Statement:
- Effect: Allow
Principal: '*'
Action:
- events:PutEvents
Resource: '*'
LogsVPCEndpoint:
Type: AWS::EC2::VPCEndpoint
Condition: CreateVPC
Properties:
VpcId: !Ref StackSetMonitorVPC
ServiceName: !Sub com.amazonaws.${AWS::Region}.logs
VpcEndpointType: Interface
SubnetIds:
- !Ref PrivateSubnet1
- !Ref PrivateSubnet2
SecurityGroupIds:
- !Ref VPCEndpointSecurityGroup
PrivateDnsEnabled: true
PolicyDocument:
Version: '2012-10-17'
Statement:
- Effect: Allow
Principal: '*'
Action:
- logs:CreateLogGroup
- logs:CreateLogStream
- logs:PutLogEvents
Resource: '*'
SQSVPCEndpoint:
Type: AWS::EC2::VPCEndpoint
Condition: CreateVPC
Properties:
VpcId: !Ref StackSetMonitorVPC
ServiceName: !Sub com.amazonaws.${AWS::Region}.sqs
VpcEndpointType: Interface
SubnetIds:
- !Ref PrivateSubnet1
- !Ref PrivateSubnet2
SecurityGroupIds:
- !Ref VPCEndpointSecurityGroup
PrivateDnsEnabled: true
PolicyDocument:
Version: '2012-10-17'
Statement:
- Effect: Allow
Principal: '*'
Action:
- sqs:SendMessage
Resource: '*'
STSVPCEndpoint:
Type: AWS::EC2::VPCEndpoint
Condition: CreateVPC
Properties:
VpcId: !Ref StackSetMonitorVPC
ServiceName: !Sub com.amazonaws.${AWS::Region}.sts
VpcEndpointType: Interface
SubnetIds:
- !Ref PrivateSubnet1
- !Ref PrivateSubnet2
SecurityGroupIds:
- !Ref VPCEndpointSecurityGroup
PrivateDnsEnabled: true
PolicyDocument:
Version: '2012-10-17'
Statement:
- Effect: Allow
Principal: '*'
Action:
- sts:AssumeRole
- sts:GetCallerIdentity
- sts:AssumeRoleWithWebIdentity
Resource: '*'
# Security Group for Lambda function
LambdaSecurityGroup:
Type: AWS::EC2::SecurityGroup
Properties:
GroupDescription: Security group for StackSet Monitor Lambda function
VpcId: !If
- CreateVPC
- !Ref StackSetMonitorVPC
- !Ref VpcId
SecurityGroupEgress:
- IpProtocol: tcp
FromPort: 443
ToPort: 443
CidrIp: 10.0.0.0/16
Description: HTTPS to VPC Endpoints
- IpProtocol: tcp
FromPort: 53
ToPort: 53
CidrIp: 10.0.0.0/16
Description: DNS TCP to VPC for name resolution
- IpProtocol: udp
FromPort: 53
ToPort: 53
CidrIp: 10.0.0.0/16
Description: DNS UDP to VPC for name resolution
Tags:
- Key: Name
Value: StackSetMonitor-Lambda-SG
- Key: Purpose
Value: Security group for StackSet Monitor Lambda
VPCEndpointSecurityGroup:
Type: AWS::EC2::SecurityGroup
Condition: CreateVPC
Properties:
GroupDescription: Security group for VPC Endpoints
VpcId: !Ref StackSetMonitorVPC
SecurityGroupIngress:
- IpProtocol: tcp
FromPort: 443
ToPort: 443
SourceSecurityGroupId: !Ref LambdaSecurityGroup
Description: HTTPS from Lambda security group
- IpProtocol: tcp
FromPort: 53
ToPort: 53
SourceSecurityGroupId: !Ref LambdaSecurityGroup
Description: DNS TCP from Lambda security group
- IpProtocol: udp
FromPort: 53
ToPort: 53
SourceSecurityGroupId: !Ref LambdaSecurityGroup
Description: DNS UDP from Lambda security group
SecurityGroupEgress:
- IpProtocol: tcp
FromPort: 443
ToPort: 443
CidrIp: 10.0.0.0/16
Description: HTTPS outbound within VPC
- IpProtocol: tcp
FromPort: 53
ToPort: 53
CidrIp: 10.0.0.0/16
Description: DNS TCP outbound within VPC
- IpProtocol: udp
FromPort: 53
ToPort: 53
CidrIp: 10.0.0.0/16
Description: DNS UDP outbound within VPC
Tags:
- Key: Name
Value: StackSetMonitor-VPCEndpoint-SG
- Key: Purpose
Value: Security group for VPC Endpoints
# Dead Letter Queue for Lambda function
StackSetMonitorDLQ:
Type: AWS::SQS::Queue
DeletionPolicy: Delete
UpdateReplacePolicy: Delete
Properties:
QueueName: StackSetMonitor-DLQ
MessageRetentionPeriod: 1209600 # 14 days
KmsMasterKeyId: alias/aws/sqs
Tags:
- Key: Purpose
Value: Dead Letter Queue for StackSet Monitor Lambda
StackSetAlertsTopic:
Type: AWS::SNS::Topic
Properties:
TopicName: StackSetAlerts
DisplayName: StackSet Monitoring Alerts
KmsMasterKeyId: alias/aws/sns
StackSetLogGroup:
Type: AWS::Logs::LogGroup
DeletionPolicy: Delete
UpdateReplacePolicy: Delete
Properties:
LogGroupName: /aws/cloudformation/stacksets
RetentionInDays: 30
KmsKeyId: !GetAtt LogsKMSKey.Arn
LambdaLogGroup:
Type: AWS::Logs::LogGroup
DeletionPolicy: Delete
UpdateReplacePolicy: Delete
Properties:
LogGroupName: /aws/lambda/StackSetMonitor
RetentionInDays: 30
KmsKeyId: !GetAtt LogsKMSKey.Arn
StackSetMonitoringDashboard:
Type: AWS::CloudWatch::Dashboard
Properties:
DashboardName: StackSetMonitoring
DashboardBody: !Sub |
{
"widgets": [
{
"type": "metric",
"width": 24,
"height": 8,
"properties": {
"metrics": [
[ "StackSetMonitoring", "SuccessRate", "StackSetName", "${StackSetName}" ]
],
"region": "${AWS::Region}",
"title": "StackSet Operations",
"period": 300,
"stat": "Average"
}
},
{
"type": "log",
"width": 24,
"height": 6,
"properties": {
"query": "SOURCE '/aws/lambda/StackSetMonitor' | fields @timestamp, @message\n| sort @timestamp desc\n| limit 20",
"region": "${AWS::Region}",
"title": "Latest StackSet Monitor Logs",
"view": "table"
}
}
]
}
# Consolidated rule to catch ALL StackSet events for comprehensive monitoring
AllStackSetOperationsRule:
Type: AWS::Events::Rule
Properties:
Name: AllStackSetOperationsRule
Description: "Rule for monitoring all CloudFormation StackSet operations with failure notifications"
EventPattern: {source: ["aws.cloudformation"], detail-type: ["CloudFormation StackSet Operation Status Change"]}
State: ENABLED
Targets:
- Id: ProcessAllEvents
Arn: !GetAtt StackSetMonitorLambda.Arn
- Id: NotifyFailure
Arn: !Ref StackSetAlertsTopic
InputTransformer:
InputPathsMap:
"stackSetId": "$.detail.stack-set-id"
"operationId": "$.detail.operation-id"
"status": "$.detail.status"
"time": "$.time"
InputTemplate: '"StackSet Event: ID: <stackSetId>, Op: <operationId>, Status: <status>, Time: <time>"'
StackSetMonitorLambda:
Type: AWS::Lambda::Function
DependsOn: LambdaLogGroup
Properties:
FunctionName: StackSetMonitor
Handler: index.lambda_handler
Role: !GetAtt StackSetMonitorRole.Arn
Runtime: python3.12
Timeout: 300
MemorySize: 512
ReservedConcurrentExecutions: 1
DeadLetterConfig:
TargetArn: !GetAtt StackSetMonitorDLQ.Arn
VpcConfig:
SecurityGroupIds: !If
- HasCustomSecurityGroups
- !Ref SecurityGroupIds
- - !Ref LambdaSecurityGroup
SubnetIds: !If
- CreateVPCAndSubnets
- - !Ref PrivateSubnet1
- !Ref PrivateSubnet2
- !Ref SubnetIds
KmsKeyArn: !GetAtt LogsKMSKey.Arn
Code:
ZipFile: |
import boto3
import json
import os
import logging
import time
import datetime
from typing import Dict, Any, Optional
# Custom JSON encoder to handle datetime objects
class DateTimeEncoder(json.JSONEncoder):
def default(self, obj):
if isinstance(obj, datetime.datetime):
return obj.isoformat()
return super().default(obj)
# Set up logging with more details
logger = logging.getLogger()
logger.setLevel(logging.INFO)
# Log initialization to verify Lambda is loading correctly
print("StackSetMonitor Lambda initializing...")
def validate_event(event: Dict[str, Any]) -> bool:
"""Validate the incoming event structure"""
if not isinstance(event, dict):
logger.error("Event must be a dictionary")
return False
# If it's an EventBridge event, validate required fields
if 'detail' in event:
detail = event.get('detail', {})
if not isinstance(detail, dict):
logger.error("Event detail must be a dictionary")
return False
# Validate StackSet event structure
if 'stack-set-id' in detail:
stack_set_id = detail.get('stack-set-id')
if not isinstance(stack_set_id, str) or not stack_set_id.strip():
logger.error("stack-set-id must be a non-empty string")
return False
# Validate operation-id if present
operation_id = detail.get('operation-id')
if operation_id is not None and not isinstance(operation_id, str):
logger.error("operation-id must be a string if provided")
return False
# Validate status if present
status = detail.get('status')
if status is not None and not isinstance(status, str):
logger.error("status must be a string if provided")
return False
return True
def validate_context(context: Any) -> bool:
"""Validate the Lambda context object"""
if context is None:
logger.error("Context cannot be None")
return False
# Check for required context attributes
required_attrs = ['function_name', 'function_version', 'invoked_function_arn', 'memory_limit_in_mb']
for attr in required_attrs:
if not hasattr(context, attr):
logger.error(f"Context missing required attribute: {attr}")
return False
return True
def sanitize_string(value: str, max_length: int = 255) -> str:
"""Sanitize and truncate string inputs"""
if not isinstance(value, str):
return str(value)[:max_length]
return value.strip()[:max_length]
def lambda_handler(event: Dict[str, Any], context: Any) -> Dict[str, Any]:
"""Main Lambda handler function for StackSet monitoring with input validation"""
# Input validation
if not validate_event(event):
return {
"statusCode": 400,
"body": json.dumps({
"status": "error",
"message": "Invalid event structure"
}, cls=DateTimeEncoder)
}
if not validate_context(context):
return {
"statusCode": 400,
"body": json.dumps({
"status": "error",
"message": "Invalid context object"
}, cls=DateTimeEncoder)
}
# Log the validated event for debugging
logger.info(f"Event received: {json.dumps(event, cls=DateTimeEncoder)}")
logger.info(f"Function: {context.function_name}, Version: {context.function_version}")
try:
cf = boto3.client('cloudformation')
cw = boto3.client('cloudwatch')
# Log that we're starting processing
logger.info(f"Starting StackSet monitoring at {time.time()}")
# Check if this is an event from EventBridge
if 'detail' in event and 'stack-set-id' in event.get('detail', {}):
detail = event['detail']
stack_set_id = sanitize_string(detail['stack-set-id'])
operation_id = sanitize_string(detail.get('operation-id', 'N/A'))
status = sanitize_string(detail.get('status', 'N/A'))
# Validate stack_set_id format
if not stack_set_id or len(stack_set_id) > 128:
logger.error(f"Invalid stack_set_id: {stack_set_id}")
return {
"statusCode": 400,
"body": json.dumps({
"status": "error",
"message": "Invalid stack_set_id format"
}, cls=DateTimeEncoder)
}
# Log the StackSet operation with additional context
logger.info(f"Processing StackSet event - ID: {stack_set_id}, Op: {operation_id}, Status: {status}")
# Extract stack set name from the ID
stack_set_name = stack_set_id.split('/')[-1] if '/' in stack_set_id else stack_set_id
stack_set_name = sanitize_string(stack_set_name, 128)
logger.info(f"Extracted StackSet name: {stack_set_name}")
# Always gather metrics regardless of event type
# Get all active StackSets
stack_sets_response = cf.list_stack_sets(Status='ACTIVE')
stack_sets = stack_sets_response.get('Summaries', [])
if not isinstance(stack_sets, list):
logger.error("Invalid response from list_stack_sets")
return {
"statusCode": 500,
"body": json.dumps({
"status": "error",
"message": "Invalid CloudFormation API response"
}, cls=DateTimeEncoder)
}
logger.info(f"Found {len(stack_sets)} active StackSets")
for stack_set in stack_sets:
if not isinstance(stack_set, dict) or 'StackSetName' not in stack_set:
logger.warning(f"Skipping invalid stack_set entry: {stack_set}")
continue
stack_set_name = sanitize_string(stack_set['StackSetName'], 128)
logger.info(f"Processing StackSet: {stack_set_name}")
try:
operations = cf.list_stack_set_operations(StackSetName=stack_set_name, MaxResults=5)
# Validate operations response
if not isinstance(operations, dict):
logger.error(f"Invalid operations response for {stack_set_name}")
continue
# Calculate success rate
successes = 0
operations_list = operations.get('Summaries', [])
if not isinstance(operations_list, list):
logger.error(f"Invalid operations list for {stack_set_name}")
continue
total_ops = len(operations_list)
logger.info(f"Found {total_ops} recent operations for {stack_set_name}")
for op in operations_list:
if isinstance(op, dict) and op.get('Status') == 'SUCCEEDED':
successes += 1
success_rate = (successes / total_ops * 100) if total_ops > 0 else 100
# Validate success_rate is within expected bounds
if not (0 <= success_rate <= 100):
logger.error(f"Invalid success_rate calculated: {success_rate}")
continue
# Publish metrics to CloudWatch
cw.put_metric_data(
Namespace='StackSetMonitoring',
MetricData=[
{'MetricName': 'SuccessRate', 'Value': success_rate,
'Dimensions': [{'Name': 'StackSetName', 'Value': stack_set_name}]}
]
)
logger.info(f"Published metrics for {stack_set_name}: Success Rate = {success_rate}%")
except Exception as e:
logger.error(f"Error processing StackSet {stack_set_name}: {str(e)}")
return {
"statusCode": 200,
"body": json.dumps({
"status": "completed",
"message": f"Processed {len(stack_sets)} StackSets"
}, cls=DateTimeEncoder)
}
except Exception as e:
logger.error(f"Error in Lambda function: {str(e)}")
# Return a proper response even on error
return {
"statusCode": 500,
"body": json.dumps({
"status": "error",
"message": str(e)
}, cls=DateTimeEncoder)
}
# Managed IAM Policies
CloudFormationAccessPolicy:
Type: AWS::IAM::ManagedPolicy
Properties:
Description: 'Policy for CloudFormation and CloudWatch access for StackSet Monitor'
PolicyDocument:
Version: '2012-10-17'
Statement:
- Effect: Allow
Action:
- cloudformation:ListStackSets
- cloudformation:ListStackSetOperations
- cloudformation:ListStackInstances
- cloudformation:DescribeStackInstance
Resource:
- !Sub "arn:${AWS::Partition}:cloudformation:${AWS::Region}:${AWS::AccountId}:stackset/*"
- !Sub "arn:${AWS::Partition}:cloudformation:${AWS::Region}:${AWS::AccountId}:stackset-target/*"
- Effect: Allow
Action:
- cloudwatch:PutMetricData
Resource: "*"
Condition:
StringEquals:
"cloudwatch:namespace": "StackSetMonitoring"
- Effect: Allow
Action:
- sns:Publish
Resource: !Ref StackSetAlertsTopic
EventsAccessPolicy:
Type: AWS::IAM::ManagedPolicy
Properties:
Description: 'Policy for EventBridge access for StackSet Monitor'
PolicyDocument:
Version: '2012-10-17'
Statement:
- Effect: Allow
Action:
- events:PutEvents
Resource: !Sub "arn:${AWS::Partition}:events:${AWS::Region}:${AWS::AccountId}:event-bus/default"
LogsAccessPolicy:
Type: AWS::IAM::ManagedPolicy
Properties:
Description: 'Policy for CloudWatch Logs access for StackSet Monitor'
PolicyDocument:
Version: '2012-10-17'
Statement:
- Effect: Allow
Action:
- logs:CreateLogGroup
- logs:CreateLogStream
- logs:PutLogEvents
Resource:
- !Sub "arn:${AWS::Partition}:logs:${AWS::Region}:${AWS::AccountId}:log-group:/aws/lambda/StackSetMonitor"
- !Sub "arn:${AWS::Partition}:logs:${AWS::Region}:${AWS::AccountId}:log-group:/aws/lambda/StackSetMonitor:*"
- !Sub "arn:${AWS::Partition}:logs:${AWS::Region}:${AWS::AccountId}:log-group:/aws/cloudformation/stacksets"
- !Sub "arn:${AWS::Partition}:logs:${AWS::Region}:${AWS::AccountId}:log-group:/aws/cloudformation/stacksets:*"
DLQAccessPolicy:
Type: AWS::IAM::ManagedPolicy
Properties:
Description: 'Policy for Dead Letter Queue access for StackSet Monitor'
PolicyDocument:
Version: '2012-10-17'
Statement:
- Effect: Allow
Action:
- sqs:SendMessage
Resource: !GetAtt StackSetMonitorDLQ.Arn
StackSetMonitorRole:
Type: AWS::IAM::Role
Properties:
AssumeRolePolicyDocument:
Version: '2012-10-17'
Statement:
- Effect: Allow
Principal:
Service: lambda.amazonaws.com
Action: sts:AssumeRole
ManagedPolicyArns:
- arn:aws:iam::aws:policy/service-role/AWSLambdaVPCAccessExecutionRole
- !Ref CloudFormationAccessPolicy
- !Ref EventsAccessPolicy
- !Ref LogsAccessPolicy
- !Ref DLQAccessPolicy
# Permissions for event rules to invoke Lambda
AllOperationsRuleLambdaPermission:
Type: AWS::Lambda::Permission
Properties:
FunctionName: !Ref StackSetMonitorLambda
Action: lambda:InvokeFunction
Principal: events.amazonaws.com
SourceArn: !GetAtt AllStackSetOperationsRule.Arn
# Using a one minute schedule for testing, but you can change this value
StackSetMonitorSchedule:
Type: AWS::Events::Rule
Properties:
Name: RegularStackSetMonitoring
Description: "Triggers Lambda function every 1 minute to check StackSet operations"
ScheduleExpression: "rate(1 minute)"
State: ENABLED
Targets:
- Id: RunMonitor
Arn: !GetAtt StackSetMonitorLambda.Arn
ScheduleLambdaInvokePermission:
Type: AWS::Lambda::Permission
Properties:
FunctionName: !Ref StackSetMonitorLambda
Action: lambda:InvokeFunction
Principal: events.amazonaws.com
SourceArn: !GetAtt StackSetMonitorSchedule.Arn
StackSetSuccessRateAlarm:
Type: AWS::CloudWatch::Alarm
Properties:
AlarmDescription: "Alarm when StackSet operation success rate is low"
MetricName: SuccessRate
Namespace: "StackSetMonitoring"
Statistic: Average
Period: 300
EvaluationPeriods: 3
DatapointsToAlarm: 2
Threshold: 80
ComparisonOperator: LessThanThreshold
AlarmActions: [!Ref StackSetAlertsTopic]
Dimensions: [{Name: StackSetName, Value: !Ref StackSetName}]
Outputs:
SNSTopicArn:
Description: The ARN of the SNS topic for alerts
Value: !Ref StackSetAlertsTopic
DashboardURL:
Description: URL to the CloudWatch Dashboard
Value: !Sub https://console.aws.amazon.com/cloudwatch/home?region=${AWS::Region}#dashboards:name=StackSetMonitoring
LambdaLogGroupName:
Description: Name of the CloudWatch Log Group for Lambda logs
Value: !Ref LambdaLogGroup
DeadLetterQueueArn:
Description: ARN of the Dead Letter Queue for Lambda function failures
Value: !GetAtt StackSetMonitorDLQ.Arn
DeadLetterQueueURL:
Description: URL of the Dead Letter Queue for monitoring failed Lambda executions
Value: !Ref StackSetMonitorDLQ
TestLambdaCommand:
Description: Command to manually test the Lambda function
Value: !Sub "aws lambda invoke --function-name ${StackSetMonitorLambda} --payload '{}' response.json && cat response.json"
LambdaFunctionArn:
Description: ARN of the Lambda function configured with VPC
Value: !GetAtt StackSetMonitorLambda.Arn
LambdaSecurityGroupId:
Description: Security Group ID created for the Lambda function
Value: !Ref LambdaSecurityGroup
VpcConfiguration:
Description: VPC configuration summary for the Lambda function
Value: !Sub
- "VPC: ${VpcId}, Subnets: ${SubnetList}, Security Groups: ${LambdaSecurityGroup}"
- SubnetList: !Join [',', !Ref SubnetIds]
You need to run the following CLI command to deploy the CloudFormation stacks. You can change the ParameterValue of StackSetName“your-stackset-name” by the name of the StackSet you want to monitor. The default value is “security-baseline”. Your CLI profile should use region=“us-east-1“.
AWS CLI to deploy the StackSetMonitor.yml CloudFormation template
The CLI output should look like the following:
{"StackId": "arn:aws:cloudformation:...."}
Here’s the expected output for the CloudFormation template:
StackSetMonitor Console output
And an example of Amazon CloudWatch Dashboard and Alarm screen:
Amazon CloudWatch Dashboard screenshot for StackSetMonitor stack to track StackSet operations success rate
Amazon CloudWatch Alarm screenshot for StackSetMonitor stack to track StackSet operations success rate
SNS subscription setup involves retrieving the topic ARN from stack outputs and configuring notifications for email or SMS endpoints (below example CLI for email subscription):
AWS CLI to subscribe to the topic providing the user email
Cost:
The estimated monthly expenses ranges between 5 and 15 USD depending on StackSet activity levels, with approximately 2,880 Lambda executions per day (each minute) under the default monitoring schedule.
The solution supports customization of monitoring frequency by modifying the ScheduleExpression from the default one-minute interval. The cost will decrease if the monitoring is less frequent.
Cleanup:
For cleanup, you can run the following command lines:
To cleanup the Stack Instances and StackSets created in the Core Deployment Strategies section:
You need to change the parameter OrganizationalUnitIds value with the name of the OU, the parameter regions with the list of regions where you want to delete your stack instances, and the value of the stack-set-name parameter (security-baseline, monitoring-baseline, balanced-deployment…).
You can also remove any IAM roles/policies that you specifically created for this blog that you might not need anymore
Conclusion
Throughout this guide, we’ve explored the nuanced approaches to AWS CloudFormation StackSets deployments across large-scale environments. The key takeaways include:
Balance is Critical: Every deployment strategy requires careful consideration of the trade-offs between speed, safety, and scale based on your organizational needs.
Progressive Adoption Works: For most organizations, a progressive deployment approach with validation gates provides the optimal balance of safety and efficiency.
Organizational Context Matters: Enterprise, startup, and regulated industry patterns demonstrate that deployment strategies should be tailored to your specific business requirements and risk tolerance.
Monitoring is Essential: As organizations scale to hundreds of accounts, comprehensive monitoring becomes critical for maintaining visibility and ensuring compliance.
These different approaches will help you adopt the right strategy for your AWS CloudFormation Stacksets deployments in your AWS Organization.
You can now test these different approaches on your sandbox environment, before adapting them for your specific needs, in order to balance Speed, Safety and Scale to optimize your deployments.
Starting today, you can use enhanced logging capability in Amazon EventBridge to monitor and debug your event-driven applications with comprehensive logs. These new enhancements help improve how you monitor and troubleshoot event flows.
The new observability capabilities address microservices and event-driven architecture monitoring challenges by providing comprehensive event lifecycle tracking. EventBridge now generates detailed log entries every time a matched event against rules is published, delivered to subscribers, or encounters failures and retries.
You gain visibility into the complete event journey with detailed information about successes, failures, and status codes that make identifying and diagnosing issues straightforward. What used to take hours of trial-and-error debugging now takes minutes with detailed event lifecycle tracking and built-in query tools.
Using Amazon EventBridge enhanced observability Let me walk you through a demonstration that showcases the logging capability in Amazon EventBridge.
I can enable logging for an existing event bus or when creating a new custom event bus. First, I navigate to the EventBridge console and choose Event buses in the left navigation pane. In Custom event bus, I choose Create event bus.
I can see this new capability in the Logs section. I have three options to configure the Log destination: Amazon CloudWatch Logs, Amazon Data Firehose Stream, and Amazon Simple Storage Service (Amazon S3). If I want to stream my logs into a data lake, I can select Amazon Kinesis Data Firehose Stream. Logs are encrypted in transit with TLS and at rest if a customer-managed key (CMK) is provided for the event bus. CloudWatch Logs supports customer-managed keys, and Data Firehose offers server-side encryption for downstream destinations.
For this demo, I select CloudWatch logs and S3 logs.
I can also choose Log level, from Error, Info, or Trace. I choose Trace and select Include execution data because I need to review the payloads. You need to be mindful as logging payload data may contain sensitive information, and this setting applies to all log destinations you select. Then, I configure two destinations, one each for CloudWatch log group and S3 logs. Then I choose Create.
After logging is enabled, I can start publishing test events to observe the logging behavior.
For the first scenario, I’ve built an AWS Lambda function and configured this Lambda function as a target.
I navigate to my event bus to send a sample event by choosing Send events.
After I sent the sample event, I can see the logs are available in my S3 bucket.
I can also see the log entries appearing in the Amazon CloudWatch logs. The logs show the event lifecycle, from EVENT_RECEIPT to SUCCESS. Learn more about the complete event lifecycle on TBD:DOC_PAGE.
Now, let’s evaluate these logs. For brevity, I only include a few logs and have redacted them for readability. Here’s the log from when I triggered the event:
The additional log entries include rich metadata that makes troubleshooting straightforward. For example, on a successful event, I can see the latency timing from starting to completing the event, duration for the target to finish processing, and HTTP status code.
Debugging failures with complete event lifecycle tracking The benefit of EventBridge logging becomes apparent when things go wrong. To test failure scenarios, I intentionally misconfigure a Lambda function’s permissions and change the rule to point to a different Lambda function without proper permissions.
The attempt failed with a permanent failure due to missing permissions. The log shows it’s a FIRST attempt that resulted in NO_PERMISSIONS status.
{
    "message_type": "INVOCATION_ATTEMPT_PERMANENT_FAILURE",
    "log_level": "ERROR",
    "details": {
        "rule_arn": "arn:aws:events:us-east-1:123:rule/demo-logging/demo-order-placed",
        "role_arn": "arn:aws:iam::123:role/service-role/Amazon_EventBridge_Invoke_Lambda_123",
        "target_arn": "arn:aws:lambda:us-east-1:123:function:demo-evb-fail",
        "attempt_type": "FIRST",
        "attempt_count": 1,
        "invocation_status": "NO_PERMISSIONS",
        "target_duration_ms": 25,
        "target_response_body": "{\"requestId\":\"a4bdfdc9-4806-4f3e-9961-31559cb2db62\",\"errorCode\":\"AccessDeniedException\",\"errorType\":\"Client\",\"errorMessage\":\"User: arn:aws:sts::123:assumed-role/Amazon_EventBridge_Invoke_Lambda_123/db4bff0a7e8539c4b12579ae111a3b0b is not authorized to perform: lambda:InvokeFunction on resource: arn:aws:lambda:us-east-1:123:function:demo-evb-fail because no identity-based policy allows the lambda:InvokeFunction action\",\"statusCode\":403}",
        "http_status_code": 403
    }
}
The final log entry summarizes the complete failure with timing metrics and the exact error message.
{
    "message_type": "INVOCATION_FAILURE",
    "log_level": "ERROR",
    "details": {
        "rule_arn": "arn:aws:events:us-east-1:123:rule/demo-logging/demo-order-placed",
        "role_arn": "arn:aws:iam::123:role/service-role/Amazon_EventBridge_Invoke_Lambda_123",
        "target_arn": "arn:aws:lambda:us-east-1:123:function:demo-evb-fail",
        "total_attempts": 1,
        "final_invocation_status": "NO_PERMISSIONS",
        "ingestion_to_start_latency_ms": 62,
        "ingestion_to_complete_latency_ms": 114,
        "target_duration_ms": 25,
        "http_status_code": 403
    },
    "error": {
        "http_status_code": 403,
        "error_message": "User: arn:aws:sts::123:assumed-role/Amazon_EventBridge_Invoke_Lambda_123/db4bff0a7e8539c4b12579ae111a3b0b is not authorized to perform: lambda:InvokeFunction on resource: arn:aws:lambda:us-east-1:123:function:demo-evb-fail because no identity-based policy allows the lambda:InvokeFunction action",
        "aws_service": "AWSLambda",
        "request_id": "a4bdfdc9-4806-4f3e-9961-31559cb2db62"
    }
}
The logs provide detailed performance metrics that help identify bottlenecks. The ingestion_to_start_latency_ms: 62 shows the time from event ingestion to starting invocation, while ingestion_to_complete_latency_ms: 114 represents the total time from ingestion to completion. Additionally, target_duration_ms: 25 indicates how long the target service took to respond, helping distinguish between EventBridge processing time and target service performance.
The error message clearly states what failed, lambda:InvokeFunction action, why it failed, (no identity-based policy allows the action), which role was involved (Amazon_EventBridge_Invoke_Lambda_1428392416), and which specific resource was affected, which was indicated by the Lambda function Amazon Resource Name (ARN).
Debugging API Destinations with EventBridge Logging One particular use case that I think EventBridge logging capability will be helpful is to debug issues with API destinations. EventBridge API destinations are HTTPS endpoints that you can invoke as the target of an event bus rule or pipe. HTTPS endpoints help you to route events from your event bus to external systems, software-as-a-service (SaaS) applications, or third-party APIs using HTTPS calls. They use connections to handle authentication and credentials, making it easy to integrate your event-driven architecture with any HTTPS-based service.
API destinations are commonly used to send events to external HTTPS endpoints and debugging failures from the external endpoint can be a challenge. These problems typically stem from changes to the endpoint authentication requirements or modified credentials.
To demonstrate this debugging capability, I intentionally configured an API destination with incorrect credentials in the connection resource.
When I send an event to this misconfigured endpoint, the enhanced logging shows the root cause of this failure.
{
    "resource_arn": "arn:aws:events:us-east-1:123:event-bus/demo-logging",
    "message_timestamp_ms": 1750344097251,
    "event_bus_name": "demo-logging",
    //REDACTED FOR BREVITY//,
    "message_type": "INVOCATION_FAILURE",
    "log_level": "ERROR",
    "details": {
        //REDACTED FOR BREVITY//,
        "total_attempts": 1,
        "final_invocation_status": "SDK_CLIENT_ERROR",
        "ingestion_to_start_latency_ms": 135,
        "ingestion_to_complete_latency_ms": 549,
        "target_duration_ms": 327,
        "target_response_body": "",
        "http_status_code": 400
    },
    "error": {
        "http_status_code": 400,
        "error_message": "Unable to invoke ApiDestination endpoint: The request failed because the credentials included for the connection are not authorized for the API destination."
    }
}
The log provides immediate clarity about the failure. The target_arn shows this involves an API destination, the final_invocation_status indicates SDK_CLIENT_ERROR, and the http_status_code of 400 , which points to a client-side issue. Most importantly, the error_message explicitly states that: Unable to invoke ApiDestination endpoint: The request failed because the credentials included for the connection are not authorized for the API destination.
This complete log sequence provides useful debugging insights because I can see exactly how the event moved through EventBridge — from event receipt, to ingestion, to rule matching, to invocation attempts. This level of detail eliminates guesswork and points directly to the root cause of the issue.
Additional things to know Here are a couple of things to note:
Architecture support – Logging works with all EventBridge features including custom event buses, partner event sources, and API destinations for HTTPS endpoints.
Performance impact – Logging operates asynchronously with no measurable impact on event processing latency or throughput.
Pricing – You pay standard Amazon S3, Amazon CloudWatch Logs or Amazon Data Firehose pricing for log storage and delivery. EventBridge logging itself incurs no additional charges. For details, visit the Amazon EventBridge pricing page .
Availability – Amazon EventBridge logging capability is available in all AWS Regions where EventBridge is supported.
This post demonstrates how to leverage AWS CloudFormation Lambda Hooks to enforce compliance rules at provisioning time, enabling you to evaluate and validate Lambda function configurations against custom policies before deployment. Often these policies impact the way a software should be built, restricting language versions and runtimes. A great example is applying those policies on AWS Lambda, a serverless compute service for running code without having to provision or manage servers. While AWS Lambda already manages the deprecation of runtimes, preventing you from deploying unsupported runtimes, organizations may need to provide and enforce their specific compliance rules not directly linked to the deprecation of a specific language version.
Introducing Lambda Hooks
AWS CloudFormation Lambda Hooks are a powerful feature that allows developers to evaluate CloudFormation and AWS Cloud Control API operations against custom code implemented as Lambda functions. This capability enables proactive inspection of resource configurations before provisioning, enhancing security, compliance, and operational efficiency.
Lambda Hooks provide a mechanism to intercept and evaluate various CloudFormation operations, including resource operations, stack operations, and change set operations (they can also be used with Cloud Control API, but in this post we’re focusing on CloudFormation). By activating a Lambda Hook, CloudFormation creates an entry in your account’s registry as a private Hook, allowing you to configure it for specific AWS accounts and regions. When configuring Lambda Hooks, you can specify one or more Lambda functions to be invoked during the evaluation process. These functions can be in the same AWS account and Region as the Hook, or in another Account you own, provided proper permissions are set up. The evaluation process occurs at specific points in the CloudFormation Stack lifecycle. For instance, during stack creation, update, or deletion, the configured Lambda functions are invoked to assess the proposed changes against your defined compliance rules. Based on the evaluation results, the hook can either block the operation or issue a warning, allowing the operation to proceed.
Lambda Hooks evaluate resources before they are provisioned through CloudFormation, providing a pre-emptive layer of governance. This means that non-compliant resources are caught and prevented from being deployed, rather than requiring retroactive fixes. By leveraging Lambda Hooks, organizations can automate and standardize their compliance checks across all AWS accounts and regions. This centralized approach to policy enforcement ensures consistency and reduces the overhead of managing compliance manually.
Solution Overview
The following sections demonstrate a practical use case for AWS CloudFormation Lambda Hooks, focusing on enforcing compliance rules on AWS Lambda runtimes.
Meet AnyCompany, a forward-thinking enterprise with a robust set of compliance rules governing their software development practices. Among these rules is a strict policy on the use of specific AWS Lambda runtimes.
As they continue to embrace serverless architecture, AnyCompany faces a challenge: how to prevent the deployment of Lambda functions that use non-compliant runtimes. Given their commitment to AWS CloudFormation for deploying Lambda functions, AnyCompany is keen to leverage the power of AWS CloudFormation Lambda Hooks.
We’ll explore the setup process, demonstrate the hook in action, and discuss the broader implications for maintaining compliance in a dynamic cloud environment.
Architecture
The following architecture highlights the implementation of the Lambda Hook. In this implementation, we are using AWS CloudFormation Lambda Hooks to intercept the deployment of Lambda Functions and perform the compliance checks on these resources. The Lambda Hook will interact with an AWS Lambda Function, which will perform the compliance checks. Finally, we’re using AWS Systems Manager Parameter Store to store the Configuration Parameter which contains the list of permitted Lambda Runtimes.
Figure 1: Architecture of the Solution
A Developer (or a CI/CD pipeline) deploys a CloudFormation stack containing Lambda functions.
CloudFormation invokes the respective Lambda Hook, which is configured to intercept operations on AWS Lambda Resources. We are setting this hook to “FAIL” deployment in case checks are not successful.
hook-lambda: directory containing all the code related to the CloudFormation Lambda Hook (Validation Lambda Function, and the CloudFormation template for the Solution)
sample: directory containing the code of the sample used to test the CloudFormation Lambda Hook
deploy.sh: utility script to deploy the Solution via AWS CLI
cleanup.sh: utility script to clean up the AWS CloudFormation Hook infrastructure via the AWS CLI
template.yml: AWS CloudFormation Template containing all the AWS Resources involved in the Solution
Prerequisites
You must have the following prerequisites for this solution:
An AWS account or sign up to create and activate one.
The following software installed on your development machine:
Install the AWS Command Line Interface (AWS CLI) and configure it to point to your AWS account.
Install Node.js and use a package manager such as npm.
Appropriate AWS credentials for interacting with resources in your AWS account.
Walkthrough
Creating the AWS Lambda Validation Function – Lambda Code
The CloudFormation Lambda Hook interacts with a specific Lambda (referred to as Validation Lambda throughout the rest of this post), which gets invoked during CloudFormation CREATE and UPDATE STACK operations involving Lambda Functions. The goal is to check if these Lambda functions have runtimes that comply with AnyCompany’s rules.
Below is the detailed description of the steps that the Validation Lambda function handler follows (the code is written in Typescript).
First, the Validation Lambda retrieves an environment variable containing the SSM Parameter Store parameter name which contains the compliant runtimes list. Additionally, safety checks ensure that only Lambda Resources are considered and that their Runtime property is defined.
Note that both safety checks could be skipped, since the Hook should already be configured to interact only with Lambda Resources and the Lambda’s Runtime property is always required. However, they remain in place to demonstrate how to retrieve this information from the Lambda Hook event in your handler.
const parameterName = process.env.PERMITTED_RUNTIMES_PARAM;
if (!parameterName) {
	throw new Error('Permitted Runtimes Parameter is not set');
}

const resourceProperties = event.requestData.targetModel.resourceProperties;
// Check if this is a Lambda function resource
if (event.requestData.targetType !== 'AWS::Lambda::Function') {
console.log("Resource is not a Lambda function, skipping");
	return {
		hookStatus: 'SUCCESS',
		message: 'Not a Lambda function resource, skipping validation',
		clientRequestToken: event.clientRequestToken
	}
}

// Check runtime version compliance
const runtime = resourceProperties.Runtime;
if (!runtime) {
	console.log("Runtime not defined, failing");
	return {
		hookStatus: 'FAILURE',
		errorCode: 'NonCompliant',
		message: 'Runtime is required for Lambda functions',
		clientRequestToken: event.clientRequestToken
	}
}
Then the Validation Lambda retrieves the value of the Configuration Parameter from SSM Parameter Store through a utility class called ParameterStoreService. For this post, consider that the value inside that Configuration Parameter is a list of strings, where each string contains one of the possible Lambda runtime values that you can find here (e.g. nodejs22.x,nodejs20.x,python3.11,python3.10,java17,java11,dotnet6). After retrieving the value, the Validation Lambda checks if the runtime of the Lambda Resource complies with the configured admitted runtimes. If the runtime is not compliant, you’ll receive a properly formatted response with FAILURE as hookStatus, otherwise the response will contain a SUCCESS hookStatus.
// Retrieve configuration from Parameter Store
const compliantRuntimes = await parameterStoreService.getParameterFromStore(parameterName);

// Check if Lambda runtime is permitted or not
if (!compliantRuntimes.includes(runtime)) {
console.log("Runtime " + runtime + " not compliant ");
	return {
		hookStatus: 'FAILURE',
		errorCode: 'NonCompliant',
		message: `Runtime ${runtime} is not compliant. Please use one of: ${compliantRuntimes.join(', ')}`,
		clientRequestToken: event.clientRequestToken
	}
}

return {
	hookStatus: 'SUCCESS',
	message: 'Runtime version compliance check passed',
	clientRequestToken: event.clientRequestToken
}
For more information about the possible response values of CloudFormation Lambda Hooks Lambda, have a look at this link.
Creating the validation Lambda – Lambda CloudFormation definition
The Validation Lambda function will be deployed via CloudFormation, in the same Stack with the CloudFormation Lambda Hook definition and the AWS Systems Manager Parameter Store Parameter. Here’s the fragment of the CloudFormation Template containing its definition:
Please note that the above template contains a reference to an IAM Role because the Hook requires proper permissions to call the target (Lambda Function). Here’s the IAM Role definition:
Configuring the compliant runtimes – Using Systems Manager Parameter Store
AWS Systems Manager Parameter Store is a secure, hierarchical storage service for configuration data management and secrets management, allowing users to store and retrieve data such as configurations, database strings etc. as parameter values.
In this specific example, we’ll leverage Parameter Store to store our permitted Lambda runtimes configuration. This configuration value is a StringList parameter, containing a comma-separated list of permitted runtimes. Here’s the fragment of the CloudFormation template that defines the Parameter:
Please note the usage of CloudFormation parameters for the ‘Name’ and ‘Value’ properties, allowing for dynamic input when deploying the CloudFormation template.
Deploying the Solution
To deploy the solution you can leverage the script deploy.sh in the root folder of the repository. This script will perform the following actions:
Compile and build the Validation Lambda Function
Create an Amazon S3 Bucket to store the CloudFormation Template
Upload the CloudFormation template and Lambda code to the S3 Bucket
Deploy the CloudFormation template
Testing the Lambda Hook
To test the CloudFormation Lambda Hook, deploy a simple testing CloudFormation template containing a Hello World Lambda function. First, test the Lambda configured with a permitted Lambda runtime, then modify the template to configure the Lambda with a non-compliant runtime.
Here’s the initial definition of the testing CloudFormation Template:
Please note that the Runtime value is nodejs22.x, which is currently in the list of permitted runtimes. The expectation is that the deployment of this function will succeed.
As expected, the deployment was successful. You can also see that the CloudFormation Lambda Hook has been invoked by taking a look at the CloudWatch Logs:
Figure 3: Validation Lambda Function Logs with successful validation
Now modify the original sample Template in order to set a Lambda Runtime which is not inside the list of permitted runtimes:
Deploy this template via AWS CLI with the same command used before and check the CloudFormation Console:
Figure 4: CloudFormation Console showing failed Stack deployment due to Hook intervention
As expected, the deployment was not successful. The CloudFormation Lambda Hook has been invoked, and since the Lambda Runtime was not present in the permitted runtimes list, the deployment failed.
You can also see that the hook failed In the CloudWatch Logs:
Figure 5: Validation Lambda Function Logs with validation error
Cleaning up
To clean up the resources related to the sample, you can run the script cleanup_sample.sh inside the sample folder. This script will delete the sample’s CloudFormation Template through the AWS CLI.
To cleanup the resources related to the solution described above and based on AWS CloudFormation Lambda Hook, you can leverage the script cleanup.sh in the root folder of the repository. This script will perform the following actions:
Delete the CloudFormation Stack
Empty the S3 Bucket used for the deployment of the Stack
Delete the S3 Bucket
Conclusion
In this post, you explored the implementation of CloudFormation Hooks to enforce runtime compliance in Lambda functions across your AWS infrastructure. By leveraging the Lambda hook’s capabilities, you learned how to create a preventative control that validates Lambda runtime configurations before deployment.
By activating the Lambda hook and implementing a custom Lambda function validator, you established an automated mechanism to ensure that only compliant runtimes are used within your organization’s Lambda functions during CloudFormation stack creation and updates. The solution’s integration with common development tools like AWS CLI, AWS SAM, CI/CD pipelines, and AWS CDK makes it straightforward to implement these controls within existing workflows, eliminating the need for manual runtime checks or post-deployment remediation.
The validation approach demonstrated in this post extends beyond Lambda runtimes and can be adapted to different AWS Resources supported by CloudFormation, allowing you to enforce policies on different infrastructure components offered by AWS.
Landing Zone Accelerator on AWS (LZA) enables customers to deploy a flexible, configuration-driven solution to establish a landing zone while also leveraging AWS Control Tower. At AWS Professional Services, we’ve helped customers deploy and configure LZA hundreds of times. A common request we encounter is integrating LZA configuration into customers’ existing GitOps workflows. GitOps has emerged as a leading model for Infrastructure as Code (IaC), helping organizations automate and manage their cloud infrastructure. The model uses Git repositories as the single source of truth for infrastructure configuration, enabling teams to maintain consistent, version-controlled environments.
In this blog, we will focus on common LZA implementation steps based on our experience, helping customers jump-start their LZA environment and implement GitOps for their AWS infrastructure management. First, we will demonstrate how to leverage LZA while complying with your organization’s policies such as private package repositories. Next, we will guide you through a new installation of LZA that takes advantage of an auto-generated starter set of configuration files. Finally, we will direct you to another blog post that will enable you to leverage GitOps for ongoing management of your LZA configuration.
Architecture overview
The LZA solution leverages two distinct repositories; one for the LZA source code, and another for your organization’s specific configuration files. LZA creates two separate AWS CodePipelines , which are used to install the LZA solution and apply your organization’s specific configuration. Figure 1 illustrates the association between repositories and pipelines. By default, when installing LZA, the solution uses GitHub as the source and pulls the installation files published by AWS from the official LZA GitHub repository.
Figure 1. Landing Zone Accelerator solution components
Deploy LZA as a new install
Step 1: Preparing your enterprise private GitHub to host LZA source code. Customers may choose to deploy LZA from the official AWS GitHub repository for LZA, but we often we find customers have policies in place that require these types of packages to be deployed from a private repository managed by the organization. For customers using GitHub privately in their enterprise, this can be as easy as cloning the LZA source code repository into your own private GitHub repository, enabling you to take advantage of policies and controls within your organization. Before moving to the next step, take a moment and clone the repository into your own private repository. A GitHub personal access token stored in AWS Secrets Manager is required to enable the stack to access your private repository. Before deploying LZA, follow these instructions to enable stack access to your repository.
Step 2: In the organization management account, install LZA as a CloudFormation Stack.
To get started, we will be going through a new installation of the LZA solution. The following steps provide specific parameter options to the CloudFormation template to support a new installation of LZA.
Specify the following parameters for Source Code Repository Configuration, see Figure 2.
For Stack name, specify a name you like.
For Source Location, choose github.
For Repository Owner, specify your GitHub account owner ID.
For Repository Name, specify your cloned LZA source code repository
For Branch Name, specify the branch name of your LZA source code repository.
We intentionally want to use S3 for the configuration repository because as the LZA solution is installed, it will auto-generate a set of starter configuration YAML files and deploy them for us in S3. This makes it very easy to get started with an initial set of customized YAML files for your environment. We choose “No” in the Use Existing Config Repository field, to have LZA to perform a new LZA installation.
Choose Next, and complete the remainder of the stack settings.
Finally, choose Create stack to launch the CloudFormation stack.
The installer stack typically takes minutes to complete (See Figure 4).
Figure 4. LZA installer stack completion
Step 3: Validate two LZA pipelines are created and successfully completed in AWS CodePipeline console.
After the CloudFormation stack completes, open the AWS CodePipeline console. You’ll see a new pipeline named “AWSAccelerator-Installer” running (See Figure 5). This is the LZA Installer pipeline, and it’s connected to the GitHub source repository you specified in Step 2 above with parameters from 2 to 5. This Installer pipeline automatically generates a set of LZA configuration files stored as a compressed ZIP archive in Amazon S3. It will be designated as configuration repository of the LZA solution.
When the AWSAccelerator-Installer pipeline completes, the solution automatically creates and runs a second pipeline named “AWSAccelerator-Pipeline” as shown in Figure 6. This pipeline connects to both the GitHub source repository, and the newly created configuration repository in Amazon S3. The AWSAccelerator-Pipeline is the pipeline that manages your landing zone deployment and customization.
Figure 6. AWSAccelerator-Pipeline created from the AWSAccelerator-Installer pipeline
After the AWSAccelerator-Pipeline completes, your LZA solution is ready for customization.
Step 4: Migrate the LZA configuration repository from S3 to GitHub
With the AWSAccelerator-Pipeline completed, your initial landing zone is now deployed, leveraging the configuration stored in your S3 bucket. For some customers, they may need to ensure that changes to the landing zone configuration are controlled through their existing GitOps processes and tooling. See Figure 7 as an example where the S3 configuration files have been copied to a customer owned GitHub repository. This transition step can be performed in future LZA upgrade window when there is a new release of LZA source code, or right after the initial LZA installation completes in Step 3. For more information on migrating from S3 to GitHub, follow this guide to configure your AWSAccelerator-Pipelines with AWS CodeConnection.
Figure 7. CodeConnection based LZA Configuration Repository
Conclusion
In this post, we explored key steps to streamline your LZA implementation journey. By demonstrating how to work with your private package repositories, providing guidance on leveraging auto-generated configuration files, and introducing GitOps-based management, we’ve outlined a practical path to establish and maintain a robust AWS infrastructure foundation. These approaches can significantly reduce the time and complexity typically associated with LZA deployments while ensuring compliance with organizational policies. We encourage you to try these implementation steps and explore the referenced resources to enhance your AWS cloud operations. For more information about Landing Zone Accelerator, visit the AWS Landing Zone Accelerator on GitHub.
Today, we’re excited to announce that AWS Chatbot has been renamed to Amazon Q Developer, representing an enhancement to developer productivity through generative AI-powered capabilities.
This update represents more than a name change – it’s an enhancement of our chat-based DevOps capabilities. By combining AWS Chatbot’s proven functionality with Amazon Q’s generative AI capabilities, we’re providing developers with more intuitive, efficient tools for cloud resource management.
Transition for Existing Users
The transition to Amazon Q Developer maintains compatibility with most workflows. Current AWS Chatbot users should experience no disruption to their configurations, permissions, or established processes, except for the following use cases.
Notifications: If you are using Q in chat applications to send notifications, then you don’t need to make any changes. Your notifications will start showing “Amazon Q” as the sender.
Manual commands: The visible change is the new “@Amazon Q” command replacing the previous “@aws” mention in chat channels. If you are running commands manually, then you will use “@Amazon Q” instead of “@aws”.
Tip: it is faster to type @Q. The chat platform displays auto complete recommendations with the matching app in the channel.
Programmatic commands: Your Slack Automation Workflows that trigger commands within the AWS Chatbot won’t change with this renaming. If you are sending messages to your Slack channels programmatically using Webhooks or the API with “@aws”, you’ll need to change how you invoke the app programmatically. For more information, see Updating Slack bot user app mentions when sending messages to chat channels programmatically.
All service APIs, SDK endpoints, and AWS Identity and Access Management (IAM) permissions remain unchanged, ensuring business continuity.
We’ve maintained the original AWS ChatBot accessibility by offering Amazon Q Developer’s chat features through the Free tier. This ensures that teams of all sizes can benefit from these enhanced capabilities without additional costs. The renamed service is accessible in all commercial regions, maintaining the same geographical reach as the original AWS Chatbot service.
Security remains paramount with Amazon Q Developer. The service maintains all existing security controls, including AWS Organizations Service Control Policies and chat application policies. Organizations can precisely control access to resources and features through granular IAM permissions and channel-specific guardrails. To take advantage of generative AI capabilities organizations will need to add to the configuration of their channel permissions.
Enhanced Chat Capabilities for DevOps
Amazon Q Developer integration with Microsoft Teams and Slack transforms these chat applications into powerful DevOps command centers, where team members can monitor, diagnose, and optimize their AWS resources and applications. Amazon Q Developer in chat applications provide real-time visibility into environment states, helping team members quickly identify which resources are operational or experiencing issues.
Team members can reduce incident response times and monitor performance issues, traffic spikes, infrastructure events, and security threats through DevOps tooling that enables custom notifications with team member tagging for critical application events, interactive action buttons and aliases for telemetry retrieval, and command execution in chat channels.
Amazon Q in Slack channel
Building on existing features like custom notifications and actions, command aliases, and Amazon Bedrock Agents integration, Amazon Q Developer uses natural language processing to understand context and intent. For example, when investigating resources in a region, you can ask, “What EC2 instances are in us-east-1?”. This natural language understanding streamlines interactions and improves efficiency.
Ask Amazon Q about resources in AWS Account
Amazon Q Developer can be used for more comprehensive resource management and status monitoring in chat channels. It can be used to send alerts to chat channels on Amazon CloudWatch metrics for monitoring, or can be used to explore resources across regions or within an account. DevOps teams can execute queries, such as count all VPCs in a region, listing all subnets in a VPC or providing all details for Amazon Elastic Compute Cloud (EC2) instances in a region, such as “provide all details for EC2 instances in us-east-1”, providing better visibility into infrastructure.
Use Amazon Q to query AWS resources information
Getting Started
Setting up Amazon Q Developer involves a straightforward process through the Amazon Q Developer console or the AWS SDK. To interact with Amazon Q Developer’s generative AI capabilities, start by adding appropriate managed policies (AmazonQDeveloperAccess or AmazonQFullAccess) to your IAM roles. Your teams can then customize their notification preferences, set up automated responses, and configure security guardrails according to their specific requirements.
We’re excited to see how you and your teams leverage these enhanced capabilities to streamline their DevOps workflows and improve collaboration.
About the Author
Aaron Sempf is Next Gen Tech Lead for the AWS Partner Organization in Asia-Pacific and Japan. With over twenty years in distributed system engineering design and development, he focuses on solving for large scale complex integration and event driven systems. In his spare time, he can be found coding prototypes for autonomous robots, IoT devices, distributed solutions and designing Agentic Architecture patterns for GenAI assisted business automation.
AWS CloudFormation enables you to model and provision your cloud application infrastructure as code-base templates. Whether you prefer writing templates directly in JSON or YAML, or using programming languages like Python, Java, and TypeScript with the AWS Cloud Development Kit (CDK), CloudFormation and CDK provide the flexibility you need. For organizations adopting multi-account strategies, CloudFormation StackSets offers a powerful capability to deploy resources across multiple regions and accounts in parallel.
Last year, we delivered broad set of enhancements that accelerated the development cycle, simplified troubleshooting, and introduced new deployment safety and configuration governance capabilities. Let’s dive into the key launches that shaped CloudFormation in 2024.
Development cycle improvements
Deploy stacks up to 40% faster with optimistic stabilization and configuration complete
In March, we introduced optimistic stabilization with the new CONFIGURATION_COMPLETE event, delivering up to 40% faster stack creation times. This new event signals that CloudFormation has created the resource and applied the configuration as defined in the stack template, allowing us to begin parallel creation of dependent resources. For example, if your stack contains resource B that depends on resource A, CloudFormation will now start provisioning resource B when resource A reaches the CONFIGURATION_COMPLETE state, rather than waiting for full stabilization. Read How we sped up AWS CloudFormation deployments with optimistic stabilization to learn more.
Figure 1: CloudFormation’s old and new deployment strategy
Catch template errors before deployment with early validation
In March, we launched early resource properties validation checks. This feature validates your stack operation upfront for invalid resource property errors, helping you fail fast and minimize the steps required for a successful deployment. Previously, you had to wait until CloudFormation attempted to provision a resource before discovering property-related errors. Now, we validate your template before deploying the first resource and provide clear error messages upfront.
Figure 2: CloudFormation’s early template properties validation feature
Safely clean up failed stacks with enhanced deletion controls
In May, we enhanced the DeleteStack API with a new DeletionMode parameter, allowing you to safely delete stacks that are in DELETE_FAILED state. By passing the FORCE_DELETE_STACK value to this parameter, you can now resolve stuck stacks more efficiently during your development and testing cycles.
Accelerate feedback loops with CloudFormation custom resource timeout controls
In June, we introduced the ServiceTimeout property for custom resources. This new capability allows you to set custom timeout values for your custom resource logic execution. Previously, custom resources had a fixed one-hour timeout, which could lead to long wait times when debugging custom resource logic. Now, you can set appropriate timeout values to accelerate your development feedback loops. Refer to the custom resourcesdocumentation to learn more about the ServiceTimeout property.
Figure 3: CloudFormation’s ServiceTimeout property for Custom resource
Streamlined Troubleshooting Experience
Resolve deployment issues faster with one-click CloudTrail access
In May, we launched integration with AWS CloudTrail in the Events tab of the CloudFormation console. Troubleshooting some failed stack operations can be time-consuming, so we have streamlined this process by providing direct links from stack operation events to relevant CloudTrail events. When you click ‘Detect Root Cause’ in the CloudFormation Console, you’ll now see a pre-configured CloudTrail deep-link to the API events generated by your stack operation, eliminating multiple manual steps from the troubleshooting process.
Figure 4: CloudFormation troubleshooting with CloudTrail integration
Visualize your entire deployment process with timeline view
In November, we launched deployment timeline view. It gives you unprecedented visibility into your stack operations. This visual tool shows the sequence of actions CloudFormation takes during a deployment, helping you understand resource dependencies and provisioning duration. You can see which resources are being created in parallel, track their status through color-coding, and quickly identify bottlenecks in your deployments.
Get instant troubleshooting help with Amazon Q Developer
We integrated Amazon Q Developer to provide AI-powered assistance for troubleshooting. When you encounter a failed stack operation, you can now click “Diagnose with Q” to receive a clear, human-readable analysis of the error. Need more help? The “Help me resolve” button provides actionable steps tailored to your specific scenario.
Figure 6: CloudFormation troubleshooting with Q feature
We’ve also improved how change sets handle references. When referenced values are available before deployment, Change sets can now resolve them to their expected values, giving you a more accurate preview of your planned changes.
Figure 7: CloudFormation’s change sets feature
Easy onboarding to Infrastructure-as-Code (IaC)
Eliminate weeks of manual effort with IaC Generator
In February, we launched the CloudFormation IaC Generator, a capability addressing one of our customers’ biggest challenges: onboarding existing cloud resources to CloudFormation. This feature makes it easier to generate CloudFormation templates for existing AWS resources. You can now onboard workloads to IaC in minutes instead of spending weeks writing templates manually.
The IaC generator supports over 600 AWS resource types and provides recommendations for related resources. For instance, when you select an S3 bucket, it automatically suggests including associated bucket policies. You can use the generated templates to import resources into CloudFormation, download them for deployment.
Figure 8: CloudFormation’s IaC Generator
In August, we enhanced the IaC Generator with two improvements. First, we added a graphical summary view that helps you quickly find resources after the account scan completes. Second, we integrated with AWS Infrastructure Composer to visualize your application architecture, making it easier to understand resource relationships and configurations.
Figure 9: IaC generator resource scan
Proactive Control Improvements
In November, we launched major enhancements to CloudFormation Hooks, giving you easier ways to author proactive configuration controls and more points to enforce them with your cloud infrastructure provisioning.
CloudFormation Hooks for stack and change set target invocation points
First, we introduced stack and change set target invocation points for CloudFormation Hooks. This extends Hooks beyond individual resource validation, allowing you to run validation checks against entire templates and examine resource relationships. For example, you can now create hooks that validate architectural patterns across multiple resources or enforce team-specific deployment standards. With the change set invocation point, you can automate your change set reviews and reduce the time needed to resolve compliance issues. Refer to the Hooks developer guide to learn more.
Figure 10: CloudFormation’s Hooks for stack and change set target invocation points
Managed hooks for the CloudFormation Guard domain specific language
We introduced the managed hooks to author configuration controls using CloudFormation Guard domain-specific language. This simplifies the hook creation process—you can now write hooks by providing your Guard rule set stored as an S3 object. This is particularly valuable if you’re already using Guard for static template validation, as you can extend these rules to dynamic checks before deployments. To learn more about the Guard hook, check out the AWS DevOps Blog or refer to the Guard Hook User Guide.
Figure 11: CloudFormation Hooks’ Guard language feature
Figure 12: CloudFormation Hooks’ Lambda function feature
CloudFormation Hooks for AWS Cloud Control API target invocation points
Lastly, we extended Hooks to support AWS Cloud Control API (CCAPI) resource configurations. This means your existing resource Hooks can now evaluate configurations from CCAPI create and update operations, allowing you to standardize your proactive control evaluation regardless your IaC tool. If you’re already using pre-built Lambda or Guard hooks, you simply need to specify “Cloud_Control” as a target in your hooks’ configuration to extend their coverage. Learn the detail of this feature from this AWS DevOps Blog. Figure 13: CloudFormation Hooks for AWS Cloud Control API target invocation point
Additional Platform Improvements
StackSets ListStackSetAutoDeploymentTargets API
In March, we enhanced StackSets with the ListStackSetAutoDeploymentTargets API. This new capability gives you better visibility into your auto-deployment configurations by allowing you to list existing target Organizational Units (OUs) and AWS Regions for a given stack set. Instead of logging into individual accounts to understand your deployment scope, you can now get this information in a single API call.
CloudFormation Git sync with request review support
In September, we improved CloudFormation Git sync with pull request workflow support. When you create or update a pull request in a linked repository, CloudFormation automatically posts change set information as PR comments. This integration provides a clear overview of proposed changes within your familiar Git workflow, allowing team members to review infrastructure changes alongside code changes. Visit our user guide and launch blog to learn more.
Figure 14: CloudFormation Git sync with request review support feature
Early 2025 improvements
Reshape your AWS CloudFormation stacks seamlessly with stack refactoring
In February 2025, CloudFormation introduced a new capability called stack refactoring that makes it easy to reorganize cloud resources across your CloudFormation stacks. Stack refactoring enables you to move resources from one stack to another, split monolithic stacks into smaller components, and rename the logical name of resources within a stack. This enables you to adapt your stacks to meet architectural patterns, operational needs, or business requirements. To explore an example scenario, read Introducing AWS CloudFormation Stack Refactoring.
Learn more
Here are some resources to help you get started learning and using CloudFormation to manage your cloud infrastructure:
As we are starting 2025, our focus remains on making infrastructure deployment faster, safer, and more manageable. These enhancements reflect our commitment to solving real customer challenges and improving the CloudFormation experience. We are excited about the roadmap ahead and look forward to bringing you more innovations in 2025.
We encourage you to try these new features and share your feedback. For more detailed information about any of these launches, visit our documentation or check out the AWS DevOps Blog.
Today, I’m happy to announce the general availability of network activity events for Amazon Virtual Private Cloud (Amazon VPC) endpoints in AWS CloudTrail. This feature helps you to record and monitor AWS API activity traversing your VPC endpoints, helping you strengthen your data perimeter and implement better detective controls.
Previously, it was hard to detect potential data exfiltration attempts and unauthorized access to the resources within your network through VPC endpoints. While VPC endpoint policies could be configured to prevent access from external accounts, there was no built-in mechanism to log denied actions or detect when external credentials were used at a VPC endpoint. This often required you to build custom solutions to inspect and analyze TLS traffic, which could be operationally costly and negate the benefits of encrypted communications.
With this new capability, you can now opt in to log all AWS API activity passing through your VPC endpoints. CloudTrail records these events as a new event type called network activity events, which capture both control plane and data plane actions passing through a VPC endpoint.
Network activity events in CloudTrail provide several key benefits:
Comprehensive visibility – Log all API activity traversing VPC endpoints, regardless of the AWS account initiating the action.
External credential detection – Identify when credentials from outside your organization are accessing your VPC endpoint.
Data exfiltration prevention – Detect and investigate potential unauthorized data movement attempts.
Enhanced security monitoring – Gain insights into all AWS API activity at your VPC endpoints without the need to decrypt TLS traffic.
Visibility for regulatory compliance – Improve your ability to meet regulatory requirements by tracking all API activity passing through.
Getting started with network activity events for VPC endpoint logging To enable network activity events, I go to the AWS CloudTrail console and choose Trails in the navigation pane. I choose Create trail to create a new one. I enter a name in the Trail name field and choose an Amazon Simple Storage Service (Amazon S3) bucket to store the event logs. When I create a trail in CloudTrail, I can specify an existing Amazon S3 bucket or create a new bucket to store my trail’s event logs.
If you set Log file SSE-KMS encryption to Enabled, you have two options: Choose New to create a new AWS Key Management Service (AWS KMS) key or choose Existing to choose an existing KMS key. If you chose New, you need to type an alias in the AWS KMS alias field. CloudTrail encrypts your log files with this KMS key and adds the policy for you. The KMS key and Amazon S3 must be in the same AWS Region. For this example, I use an existing KMS key. I enter the alias in the AWS KMS alias field and leave the rest as default for this demo. I choose Next for the next step.
In the Choose log events step, I choose Network activity events under Events. I choose the event source from the list of AWS services, such as cloudtrail.amazonaws.com, ec2.amazonaws.com, kms.amazonaws.com, s3.amazonaws.com, and secretsmanager.amazonaws.com. I add two network activity event sources for this demo. For the first source, I select ec2.amazonaws.com option. For Log selector template, I can use templates for common use cases or create fine-grained filters for specific scenarios. For example, to log all API activities traversing the VPC endpoint, I can choose the Log all events template. I choose Log network activity access denied events template to log only access denied events. Optionally, I can enter a name in the Selector name field to identify the log selector template, such as Include network activity events for Amazon EC2.
As a second example, I choose Custom to create custom filters on multiple fields, such as eventName and vpcEndpointId. I can specify specific VPC endpoint IDs or filter the results to include only the VPC endpoints that match specific criteria. For Advanced event selectors, I choose vpcEndpointId from the Field dropdown, choose equals as Operator, and enter the VPC endpoint ID. When I expand the JSON view, I can see my event selectors as a JSON block. I choose Next and after reviewing the selections, I choose Create trail.
After it’s configured, CloudTrail will begin logging network activity events for my VPC endpoints, helping me analyze and act on this data. To analyze AWS CloudTrail network activity events, you can use the CloudTrail console, AWS Command Line Interface (AWS CLI), and AWS SDK to retrieve relevant logs. You can also use CloudTrail Lake to capture, store and analyze your network activity events. If you are using Trails, you can use Amazon Athena to query and filter these events based on specific criteria. Regular analysis of these events can help you maintain security, comply with regulations, and optimize your network infrastructure in AWS.
Now available CloudTrail network activity events for VPC endpoint logging provide you with a powerful tool to enhance your security posture, detect potential threats, and gain deeper insights into your VPC network traffic. This feature addresses your critical needs for comprehensive visibility and control over your AWS environments.
Network activity events for VPC endpoints are available in all commercial AWS Regions.
To get started with CloudTrail network activity events, visit AWS CloudTrail. For more information on CloudTrail and its features, refer to the AWS CloudTrail documentation.
As your cloud infrastructure grows and evolves, you may find the need to reorganize your AWS CloudFormation stacks for better management, for improved modularity, or to align with changing business requirements. CloudFormation now offers a powerful feature that allows you to move resources between stacks. In this post, we’ll explore the process of stack refactoring and how it can help you maintain a well-organized and efficient cloud infrastructure.
Understanding Stack Refactoring
Stack refactoring is the process of restructuring your CloudFormation stacks by moving resources from one stack to another or renaming a resource with a new logical ID within the same stack. This capability is particularly useful when you want to:
Split a large, monolithic stack into smaller, more manageable stacks
Reorganize resources to better align with your application architecture or organizational structure
Rename the logical IDs of resources to make templates more readable
Example Scenario
To demonstrate this capability, you are going to create a stack and then move some of its resources into a new stack. You will evaluate the new CLI commands that you need to leverage to make this possible. For this example, you are going to have an SNS topic with a lambda function subscribed to your SNS topic. As your usage of the SNS topic expands, you want to break apart the subscriptions into a different stack.
Create a new template called before.yaml with your starting template:
Create a new template called afterSns.yaml with the content below. This template has your SNS topic in it and has a new export in it that will export the SNS topic ARN. This export will be used by your other templates to get the required SNS topic ARN.
Create a new template called afterLambda.yaml with the content below. This template includes all the resources to create a Lambda subscription to your SNS topic. This template switched the !Ref Topic to use the exported valued by using !ImportValue TopicArn.
Create a resource mappings file called refactor.json to rename the logical ID of a resource. This file defines the source and destination stack names and logical IDs for resources being refactored. If the logical IDs don’t change, this file doesn’t need to be specified.
Create a stack refactor task. You are using enable-stack-creation to tell the refactoring capability to create the destination stack for us. If the destination stack already exists you don’t have to provide this option.
Stack refactoring in AWS CloudFormation represents a significant advancement in infrastructure management, offering a safer and more efficient way to reorganize your cloud resources without disruption. This feature eliminates the traditional need to remove the resource, with a retain policy, and then import the resource when restructuring stacks, helping you reduce misconfiguration risk and save time. Through the example demonstrated in this post, you’ve seen how to split a monolithic stack into smaller, focused stacks while using exports and imports to maintain dependencies between stacks. You’ve also explored the new CloudFormation CLI commands that make stack refactoring possible while maintaining resource stability during reorganization.
As your infrastructure evolves, stack refactoring provides the flexibility needed to adapt your CloudFormation stack organization to changing requirements while maintaining the integrity of your cloud resources. This capability is particularly valuable for teams looking to improve their infrastructure maintainability and align their resource organization with evolving architectural patterns. Remember to thoroughly test your refactoring plans in a non-production environment first, and always ensure your new stack structure maintains the necessary security and access controls.
Amazon Cognito is a developer-centric and security-focused customer identity and access management (CIAM) service that simplifies the process of adding user sign-up, sign-in, and access control to your mobile and web applications. Cognito is a highly available service that supports a range of use cases, from managing user authentication and authorization to enabling secure access to your APIs and workloads. It’s a managed service that can act as an identity provider (IdP) for your applications, can scale to millions of users, provides advanced security features, and can support identity federation with third-party IdPs.
A feature of Amazon Cognito is support for OAuth 2.0 client credentials grants, used for machine-to-machine (M2M) authorization. As your M2M use cases scale, it becomes important to have proper monitoring, optimization of token issuance, and awareness of security best practices and considerations. It’s a best practice for app clients to locally cache and reuse access tokens while still valid and not expired. You can customize how long issued tokens are valid, so it’s important to make sure that the timeframe is aligned with your security requirements. If caching and reusing access tokens isn’t possible at the client level or cannot be enforced, then combining your M2M use cases with a REST API proxy integration using Amazon API Gateway enables you to cache token responses. By using API Gateway caching, you can optimize the request and response of access tokens for M2M authorization. This reduces redundant calls to Cognito for access tokens, thus improving the overall performance, availability, and security of your M2M use cases.
In this post, we explore strategies to help monitor, optimize, and secure Amazon Cognito M2M authorization. You’ll first learn some effective monitoring techniques to keep track of your usage, then delve into optimization strategies using API Gateway and token caching. Lastly, we will cover security best practices and considerations to bolster the security of your M2M use cases. Let’s dive in and discover how to make the most out of your Amazon Cognito M2M implementation.
Machine-to-machine authorization
Amazon Cognito uses an OAuth 2.0 client credentials grant to handle M2M authorization. A Cognito user pool can issue a client ID and client secret to allow your service to request a JSON web token (JWT)-compliant access token to access protected resources. Figure 1 illustrates how an app client requests an access token using the client credentials grant flow with Amazon Cognito.
Figure 1: Client credentials grant flow
The client credential grant flow (Figure 1) includes the following steps:
The app client makes an HTTP POST request to the Amazon Cognito user pool /token endpoint (see The token issuer endpoint for more information), which provides an authorization header consisting of the client ID and client secret, and request parameters consisting of grant type, client ID, and scopes.
After validating the request, Cognito will return a JWT-compliant access token.
The client can make subsequent requests to a downstream resource server using the Cognito issued access token.
The resource server gets a JSON Web Key Set (JWKS) from the Cognito user pool. The JWKS contains the user pool’s public keys, which should be used to verify the token signature.
The resource server uses the public key to verify the signature of the access token is valid (proving the token has not been tampered with). The resource server also needs to verify that the token is not expired and required claims and values are present, including scopes. The resource server should use the aws-jwt-verify library to verify that the access token is valid.
After the access token is verified and the app client is authorized, the requested resource is returned to the app client.
Now, let’s dive deep into the monitoring, optimization, and security considerations around M2M authorization with Amazon Cognito.
Monitoring usage and costs
In May 2024, Amazon Cognito introduced pricing for M2M authorization to support continued growth and expand M2M features. Customer accounts using M2M with Cognito prior to May 9, 2024, are exempt from M2M pricing until May 9, 2025 (for more information, see Amazon Cognito introduces tiered pricing for machine-to-machine (M2M) usage). To get better visibility into your existing Amazon Cognito usage types, you can use the Security tab of the Cost and Usage Dashboards Operations Solution (CUDOS) dashboard. This dashboard is part of the Cloud Intelligence Dashboard, an opensource framework that provides AWS customers actionable insights and optimization opportunities at an organization scale. As shown in Figure 2, the Security tab in the CUDOS dashboard provides visuals that show the cost and spend of Amazon Cognito per usage type and the projected cost for M2M app clients and token requests after the exemption period with daily granularity. This daily breakdown allows you to track how your cost optimization efforts are trending.
Figure 2: Example Amazon Cognito spend and projected cost with daily granularity
You can also see the monthly spend per account for each usage type, as shown in Figure 3.
Figure 3: Example Amazon Cognito spend and projected cost per AWS account
You can see the usage and spend per resource ID of user pools contributing to the cost, as shown in Figure 4. This resource-level granularity enables you to identify the top spending user pool and prioritize usage and cost management efforts accordingly. An interactive demo of this dashboard is available. For more information, see Cloud Intelligence Dashboards.
Figure 4: Example Amazon Cognito resource usage and cost by resource ID, account, and AWS Region
In addition to using the CUDOS dashboard to help understand Cognito M2M usage and costs, you can also request fine-grained usage details down to the app client level. This can include the number of access tokens successfully requested per app client and the last time the app client was used to issue tokens. To understand fine-grained app client usage, you need to make sure that token requests include the client_id request query parameter. This will result in an AWS CloudTrail log event that includes the client ID within the additionalEventData JSON object that is associated with the client credentials token request, as shown in Figure 5.
Figure 5: Sample CloudTrail event log including client_id
You can also use an Amazon CloudWatch log group to capture and store your CloudTrail logs for longer retention and analysis. Then using CloudWatch Logs Insights, you can use the following sample query to gather app client usage.
fields additionalEventData.userPoolId as user_pool_id, additionalEventData.requestParameters.client_id.0 as client_id, eventName, additionalEventData.responseParameters.status
| filter additionalEventData.requestParameters.grant_type.0="client_credentials" and eventName="Token_POST" and additionalEventData.responseParameters.status="200"
| stats count(*) as count, latest(eventTime) as last_used by user_pool_id, client_id
| sort count desc
Figure 6 is an example result from the preceding CloudWatch Logs Insights query. The result includes the user_pool_id, client_id, count, and last_used columns. The total number of successful token requests grouped per user pool and client ID will be displayed in the count column and the last time the app client successfully issued an access token will be displayed in the last_used column.
Figure 6: Example screenshot result set from CloudWatch Logs Insights query
Optimizing token requests
Now that you know how to better monitor your Amazon Cognito usage and costs, let’s dive deeper into how to optimize your token requests usage. For M2M, it’s recommended that clients use mechanisms to locally cache access tokens to use for authorization. This will reduce the need for the client to request a new access token until the previously issued token is no longer valid. However, the environment where the client runs could be hosted by an external third party or owned by a different team and as the resource owner, you won’t have control over whether the third party implements token caching at the client side. If this is a scenario that you have, you can use a HTTP proxy integration to cache the access token using API Gateway. Because the M2M use case follows the client credentials grant flow of the OAuth 2.0 specification, the /token endpoint of your user pool is what will be configured with the API Gateway proxy integration. This proxy integration is where caching in API Gateway can be used. With caching, you can reduce the number of token requests made to your user pool /token endpoint and improve the latency of the client receiving a cached token in the response. With caching, you can achieve additional benefits, such as cost optimization, improved performance efficiency, higher levels of availability, and custom domain flexibility.
Solution overview
Figure 7: Token caching solution
The solution (shown in the Figure 7) includes the following steps.
The client makes an HTTP POST request to an API Gateway REST API.
The API Gateway method request caches the scope URL query string parameter and the Authorization HTTP request header as caching keys. The integration request is configured as a proxy to the /oauth2/token endpoint of your Amazon Cognito user pool.
Cognito validates the request, making sure that the client ID and client secret are correct from the authorization header, a valid client ID has been provided as a query string parameter, and the client is authorized for the requested scopes.
If the request is valid, Cognito returns an access token to the gateway through the integration response. With caching enabled, the response from the HTTP integration (Cognito token endpoint) is cached for the specified time-to-live (TTL) period.
The method response of the gateway returns the access token to the client.
Subsequent token requests with a remaining cached TTL will be returned, using the authorization header and scope as the caching keys.
To set up token caching, follow the steps in Managing user pool token expiration and caching. After a valid token request is returned through the API Gateway proxy integration and cached, subsequent token requests to the proxy that match the caching keys (authorization header and scope parameter) will return that same access token. This token will be returned to the client until the TTL of the cached token has expired. It’s recommended to set the TTL of the cache to be a few minutes less than the TTL of the access token issued from Amazon Cognito. For example, if your security posture requires access tokens to be valid for 1 hour, then set your caching TTL to be a few minutes less than the 1-hour token validity. It’s also important to understand the ideal caching capacity for your use case. The caching capacity affects the CPU, memory, and network bandwidth of the cache instance within the gateway. As a result, the cache capacity can affect the performance of your cache. See Enable Amazon API Gateway caching for more information. For information about how to determine the ideal cache capacity for your use case, see How do I select the best Amazon API Gateway Cache capacity to avoid hitting a rate limit?. Let’s now explore some security best practices and considerations to raise the security bar of your M2M use cases.
Security best practices
Now that you know how to monitor Amazon Cognito M2M usage and costs and how to optimize access token requests, let’s review some security best practices and considerations. Using OAuth 2.0 client credentials grant for M2M authorization helps protect your APIs. One of the key factors for this is that the access token used by the client to connect to the resource server is a temporary and time-bound token. The client must obtain a new access token after its previous token has expired so you won’t have to issue long-lived credentials that are used directly between the client and the resource server. The client ID and client secret remain confidential on the client and are only used between the client and the Amazon Cognito user pool to request an access token.
Use AWS Secrets Manager
If the workload is running on AWS, use AWS Secrets Manager so you don’t have to worry about hard-coding credentials into workloads and applications. If the workload is running on premises or through another provider, then use a similar secrets’ vault or privileged access management solution to house the workload credentials. The workload should retrieve credentials for authentication only at runtime.
Use AWS WAF
It’s a security best practice to use AWS WAF to protect your Amazon Cognito user pool endpoints. This can help protect your user pools from unwanted HTTP web requests by forwarding selected non-confidential headers, request body, query parameters, and other request components to an AWS WAF web access control list (ACL) associated with your user pool. By using AWS WAF, you can also add managed rule groups to your user pool, such as the AWS managed rule group for Bot Control, to add protection against automated bots that can consume excess resources, cause downtime, or perform malicious activities. Learn more about how to associate an AWS WAF Web ACL with your Cognito user pool.
Always verify tokens
After a client has obtained an access token, it’s important to make sure the client is authorized to access the requested resources. If the resource is using API Gateway and the built-in Amazon Cognito authorizer, then the integrity of the token, the signature, and token expiration are checked and validated for you. However, if you require a more custom authorization decision with API Gateway, you can use an AWS Lambda authorizer along with the aws-jwt-verify library. By doing so, you can verify that the signature of the JWT token is valid, make sure that the token isn’t expired, and that the necessary and expected claims are present (including necessary scopes). For more fine-grained authorization decisions, look into using Amazon Verified Permissions with the resource server or even within a Lambda authorizer. If the resource server is an external system that is, outside of AWS or a custom resource server, you want to make sure that the access token is validated and verified before the requested resources are returned to the client.
Define scopes at the app client level
It’s important to carefully define and constrain the scope of access for each app client to align with the principle of least privilege. By restricting each client ID to only the necessary scopes, organizations can minimize the risk of issuing access tokens with more access and permissions than is required. If your use case aligns with M2M multi-tenancy, consider creating a dedicated app client per tenant and using defined custom scopes for that tenant. Remember that the number of M2M app clients is a pricing dimension and will incur a cost. See Custom scope multi-tenancy best practices for more information.
Security considerations
If you’re using API Gateway to proxy token requests and caching access tokens, the following are some security considerations to raise the security bar of your M2M workload.
Allow token requests only through an API Gateway proxy
After your API Gateway proxy integration is configured and set up for optimization and you have AWS WAF configured for your user pool, you can add an additional layer of security by using an allow list so that only requests from your API Gateway proxy to your Amazon Cognito user pool are accepted. For this, inject a custom HTTP header within the integration request of the POST method execution and create an allow rule within your web ACL that looks for that specific header. You will also create an additional web ACL rule to block all traffic. The single allow rule will have a priority order of 0 and the block-all-traffic rule will have a priority order of 1. Ultimately, this will block all requests that go directly to your Cognito user pool /token endpoint and only allow requests that have been made through the API Gateway proxy. Figure 8 that follows is a deeper explanation of this setup.
Figure 8: Token caching solution with AWS WAF
The process shown in Figure 8 has the following steps:
The client makes a direct HTTP POST call to the /oauth2/token endpoint of the Amazon Cognito user pool. This request would be denied by the AWS WAF web ACL deny all rule.
The client initiates an OAuth2 client credentials grant (HTTP POST) against an API Gateway stage (/token).
The REST API gateway is a proxy integration to the /oauth2/token endpoint of the Cognito user pool.
Within the integration request settings, configure a custom header (for example, x-wafAuthAllowRule). Treat the value of this header as a secret that remains only within the API Gateway integration request and is not exposed outside of the gateway.
Consider using Lambda, Amazon EventBridge, and AWS Secrets Manager to automatically rotate this header value in both the API Gateway integration request and in the AWS WAF web ACL rule.
The request is proxied to the Cognito /oauth2/token endpoint and AWS WAF is configured to protect the Cognito user pool endpoints and therefore web ACL rules are evaluated.
The custom header from the integration request (the preceding step) is evaluated against the web ACL rules to allow this request.
Cognito will verify the authorization header (containing the client ID and client secret) and requested scopes.
After successful credential validation, an access token is returned to the gateway within the integration response.
The access token is cached using the following caching keys:
Authorization header.
Scope query string parameter.
The access token is returned to the client through API Gateway.
Subsequent token requests with a remaining cached TTL are returned to client immediately, using the authorization header and scope as the caching keys.
Additional authorizer with API Gateway
Using the client credentials grant is designed to obtain an access token so that an app client can access downstream resources. If you’re using API Gateway as a proxy integration to your token endpoint, as described previously, you can also use a separate authorizer with an API Gateway proxy. Therefore, to begin the OAuth 2.0 client credentials grant flow, a separate authorization takes place first. For example, if you’re in a highly regulated industry, you might require the use of mTLS authentication to obtain an access token. This might seem like a double-authentication scenario; however, this helps prevent unauthenticated attempts against your API Gateway proxy integration to get an access token from Amazon Cognito.
Encrypting the API cache
While configuring your API Gateway proxy integration and provisioning your API cache, you can enable encryption of the cached response data. Because this caches access tokens for the set TTL of your choosing, you should consider encrypting this data at rest if necessary to help meet your security requirements. You can use the default method caching or set an override stage-level caching and enable encryption at rest.
Conclusion
In this post, we shared how you can monitor, optimize, and enhance the security posture of your machine-to-machine (M2M) authorization use cases with Amazon Cognito. This involved using the Cost and Usage Dashboards Operations Solution (CUDOS) to understand your Cognito M2M token requests and costs. We also discussed using caching from Amazon API Gateway as an HTTP proxy integration to the Cognito user pool /oauth2/token endpoint. By following the guidance in this post, you can better understand your M2M usage and costs and achieve added benefits such as cost optimization, performance efficiency, and higher levels of availability. Lastly, we provided several security best practices and considerations that can be used as additional layers to elevate your security posture.
If you have feedback about this post, submit comments in the Comments section below. If you have questions about this post, start a new thread on Amazon Cognito re:Post or contact AWS Support.
As organizations increasingly use generative AI to streamline processes, enhance efficiency, and gain a competitive edge in today’s fast-paced business environment, they seek mechanisms for measuring and monitoring their use of AI services.
To help you navigate the process of adopting generative AI technologies and proactively measure your generative AI implementation, AWS developed the AWS Audit Manager generative AI best practices framework. This framework provides a structured approach to evaluating and adopting generative AI technologies and addresses important aspects such as strategy alignment, governance, risk assessment, and security and operational best practices. You can use the framework within AWS Audit Manager as you implement generative AI workloads, to measure and monitor existing workloads through Audit Manager capabilities such as automated evidence collection and customized assessment reports.
In this blog post, we’ll cover the AWS Audit Manager generative AI best practices framework and how it can help you during your generative AI journey. We’ll highlight key considerations to prioritize when deploying generative AI workloads, and discuss how the framework can facilitate auditing and compliance with generative AI-specific controls using Audit Manager.
Starting the generative AI Journey
An important consideration in preparing for the introduction of generative AI in your organization is the need to align your risk management strategies with robust mitigation measures. Examples of potential risks include the following:
Data quality, reliability, and bias: Poor source-data quality used to train models might lead to inconsistent, inaccurate, or biased outputs, which can have significant financial and regulatory impact for organizations. For example, a language model trained on biased data might generate text that reinforces harmful stereotypes or propagates misinformation. Similarly, training AI on biased product reviews or ratings might lead to product suggestions that don’t accurately reflect product quality or user preferences.
Model explainability and transparency: The opaque nature of many generative AI models makes it challenging to understand how they arrive at specific outputs or decisions. For example, if a model is used to generate creative content, such as stories or learning materials, it could be difficult to understand why certain outputs are generated, including potential biases or inappropriate content.
Data privacy and security: Generative AI models are trained on vast amounts of data, which might inadvertently include sensitive or personal information. For example, a model trained to generate text could potentially produce sentences that contain personal details from its training data.
AWS empowers organizations to use this technology responsibly while helping them to align with best practices. As part of enabling organizations to create a comprehensive risk management strategy for generative AI systems, AWS has built the AWS Audit Manager generative AI best practices framework which is mapped to Amazon Bedrock and Amazon SageMaker in AWS Audit Manager.
Amazon Bedrock is a managed service that enables you to create, manage, and scale machine learning (ML) and AI services while facilitating adherence to security and defined compliance requirements. Amazon SageMaker is a fully managed ML service that can build, train, and deploy ML models for extended use cases that require deep customization and model fine-tuning.
You can use this framework to facilitate your auditing and compliance requirements by taking advantage of controls for more responsible, ethical, and effective deployment of generative AI models.
The framework is organized into four pillars, as follows:
Data Governance: Data is the foundation of generative AI models, and the quality and diversity of the training data can significantly impact the model’s performance and output. The Data Governance pillar focuses on facilitating data management practices such as data sourcing, data quality, data privacy, and data bias.
Model Development: This pillar focuses on the responsible development and testing of generative AI models and covers aspects such as model architecture selection, model training, and model evaluation.
Model Deployment: This pillar addresses the challenges associated with deploying generative AI models in production environments and covers aspects such as model deployment strategies, infrastructure considerations, and access controls.
Monitoring & Oversight: This pillar focuses on the ongoing monitoring and governance of generative AI models in production environments and addresses aspects such as model performance monitoring and incident response planning.
You can also use Amazon Bedrock Guardrails to provide an additional level of control on top of the protections built into foundation models (FMs) to help deliver relevant and safe user experiences that align with your organization’s policies and principles.
Each organization’s generative AI journey is unique, influenced by factors such as industry-specific regulations, risk appetite, and scale of generative AI deployment. By integrating the framework with Amazon Bedrock or Amazon SageMaker, you can customize the controls to your organization’s unique needs, aligning your generative AI deployments with your specific risk management strategies. This customization is especially valuable for highly regulated sectors, such as the financial sector.
For example, you can map the risk of inaccurate outputs to controls related to data quality and model validation. Similarly, you can map data security risks to controls related to access management and encryption.
Let’s consider an example that uses a subset of these risks to understand how you could perform this mapping. A financial services firm decides to use generative AI models to develop a chatbot capable of understanding complex customer inquiries and providing accurate and tailored responses for their customer portal. Although chatbots can greatly enhance customer experiences and operational efficiency, they also introduce risks that you need to understand and measure, so that you can develop a corresponding mitigation strategy.
An auditor within the internal audit function of the financial organization would like to use the AWS Audit Manager generative AI best practices framework to assess compliance with the following sample of risks associated with the application:
Responsible: Validating that the chatbot adheres to ethical principles, such as fairness and transparency, and avoids perpetuating biases or discrimination against certain customer segments.
Accurate: Verifying the reliability and accuracy of the chatbot’s responses, particularly when handling sensitive financial information or providing advice on complex financial products.
Secure: Protecting the integrity and security of the data being used to train the generative AI model from unauthorized access and validating that sensitive customer data is segregated from data used for training.
Example mapping
We’ve provided an example mapping here that illustrates how you can use the framework within Audit Manager to develop a risk management strategy. Based on your individual control objectives and organizational requirements, you can further customize controls, and evidence collection can be automated or manually defined. The example mapping is as follows:
Responsible: Implement mechanisms for AI model monitoring and explainability to detect and mitigate potential biases or unfair outcomes.
RESPAI3.8: Document Risks and Tolerances: Define, document, and implement specific controls to address identified risks and organizational risk tolerances.
RESPAI3.9: Develop AI RACI: Define organizational roles and responsibilities, lines of communication, and ownership of controls to address identified risks. Ensure that this mapping, measuring, and managing of generative AI risks is clear to individuals and teams throughout the organization.
RESPAI3.13: Continuous Risk Monitoring: Periodically perform retrospectives and review policies and procedures to determine if new risks should be considered, and if current risks are addressed based on AI performance, incidents, and user feedback.
RESPAI3.15: Ethical Guidelines: Develop and adhere to ethical guidelines for the deployment and usage of generative AI models.
Accurate: Implement robust data quality checks, model validation processes, and ongoing monitoring to ensure the accuracy and reliability of the generative AI chatbot’s outputs.
ACCUAI3.4: Regular Audits: Conduct periodic reviews to assess the model’s accuracy over time, especially after system updates or when integrating new data sources.
ACCUAI3.6: Source Verification: Ensure that the data source is reputable, reliable, and the data is of high quality.
ACCUAI3.14: Quality Data Sourcing: The accuracy of generative AI largely depends on the quality of its training data. Ensure that the data is representative, comprehensive, and free from biases or errors.
Secure: Implement robust access controls, data encryption, and security monitoring measures to protect the generative AI chatbot system and training data.
SECAI3.2: Data Encryption In Transit: Implement end-to-end encryption for the input and output data of the AI models to minimum industry standards.
SECAI3.3: Data Encryption At Rest: Implement data encryption at rest for data that’s stored to train the AI models, and for the metadata that’s produced by AI models.
Note: This is an example of a control that can be configured with automated evidence collection using AWS Config as the underlying data source, or further customized with additional data sources according to the scope of the control.
SECAI3.7: Least Privilege: Document, implement, and enforce least privileged principles when granting access to generative AI systems.
SECAI3.8: Periodic Reviews: Document, implement, and enforce periodic reviews of users’ access to generative AI systems.
Note: This is an example of a control that can be configured with manual evidence collection based on the specific policies and procedures defined by each organization.
SECAI3.15: Access Logging: Require and enable mechanisms that allow users to request access to generative AI models. Ensure that access requests are properly logged, reviewed, and approved.
Conclusion
It’s important for institutions, especially those in highly regulated sectors, to proactively address new developments that relate to generative AI. Using the AWS Audit Manager generative AI best practices framework as part of a comprehensive risk management strategy can help you stay ahead of the curve and embrace an agile and responsible approach to generative AI.
The guidance provided by the framework, together with the capabilities of Audit Manager, Amazon Bedrock and SageMaker can help you establish secure and controlled environments for generative AI implementation, automate evidence collection and risk assessments, and monitor and mitigate potential risks. By embracing the potential of generative AI while adhering to best practices, you can position your organization at the forefront of innovation while maintaining the trust and confidence of stakeholders and customers.
If you have feedback about this post, submit comments in the Comments section below. If you have questions about this post, contact AWS Support.
The growing complexity of modern software makes troubleshooting difficult, requiring deep knowledge and manual work across various systems. This results in slower problem-solving and less efficient operations. More and more customers need automated tools to handle routine tasks and simplify complex processes, so they can resolve issues faster and focus on delivering inovations for their customers.
Today, we’re announcing a new capability in Amazon Q Developer to investigate and remediation operational issues, which is now in preview. This generative AI-powered capability guides you through operational diagnostics and automates root cause analysis for problems in your workloads.
Here’s a quick look at how you can now use Amazon Q Developer for operational investigations.
AWS has more operational experience and scale than any other major cloud provider, delivering cloud services to customers around the world for over 17 years. AWS built this experience into Amazon Q Developer operational capabilities to create and present investigation hypotheses, and guide you through troubleshooting and remediation – capabilities that no other major cloud provider offers.
Get started with operational investigation using Amazon Q Developer This new capability from Amazon Q Developer seamlessly integrates with Amazon CloudWatch and AWS Systems Manager, providing a unified experience while troubleshooting issues. To get started with this capability, you need to complete some prerequisites. You can learn more on the Get Started with Amazon Q Developer Operational Investigations page.
I’ve completed the setup and configured a CloudWatch alarm to monitor the metrics for my application. After receiving a notification email, I navigate to that alarm in Amazon CloudWatch. I observe that the metric has exceeded its threshold over several time periods.
With this finding, I select Investigate. Then, I have two options: Start new investigation or Add to existing investigation. Because I’m just getting started, I select Start a new investigation and provide some details and notes if necessary.
After I’ve created the investigation, I can view the details by choosing View Details on the banner.
The investigation page is divided into two main sections: the left-hand Feed panel, which contains all findings added during the investigation, and the right-hand Suggestions panel, which displays a list of finding suggestions from Amazon Q Developer to assist in the investigation.
Amazon Q Developer uses its knowledge of my AWS resources to automatically discover the relationships between them and create a topology map of the application. This makes it possible for Amazon Q Developer to follow the architecture and quickly find the component that caused an alarm, helping me get back into production faster than ever before.
One of the hypotheses suggests that the slowness is caused by throttling on a DynamoDB table, with read and write capacity units frequently exceeding the provisioned limits. I find this hypothesis makes sense, and I can Accept it, which will bring it into my Feed.
With all these findings, I can collect all the supporting data to troubleshoot this issue. In one of the hypotheses from Amazon Q Developer, I can also view suggested actions. I select View actions to understand my options for remediation.
In the Suggested actions menu, Amazon Q Developer proposes AWS Systems Manager Automation runbooks related to the hypothesis. Where applicable, it suggests automated runbooks from the AWS Systems Manager library, which includes over 400 AWS-authored and thousands of customer-authored runbooks to help remediate observed issues. Each runbook defines the actions that Systems Manager performs to help resolve the issue. Additionally, Amazon Q Developer provides relevant documentation links from AWS re:Post articles and AWS Documentation pages.
Here’s the list of suggested actions from Amazon Q Developer. I choose View runbook to understand more on how I can solve this issue by modifying DynamoDB provisioned capacity.
Here, I can read more information on this runbook. It will offer a description of the runbook, including execution history telling me if I ran this runbook successfully in this account in the past.
I can enter the required parameters as defined in the configuration. Under Execution preview segment, I can review a summary highlighting the impact on targeted resources. After confirming the details, I select Execute to implement the necessary changes for my workloads.
After running the runbook, I can see the results, which are then added to my feed.
Another feature I appreciate is the multiple ways to access this capability. For example, in my CloudWatch metrics for my AWS Lambda function, I can initiate an investigation and add findings directly. I can also select the Amazon Q Developer operational investigations icon to open the investigation panel.
This new capability from Amazon Q Developer feels like having an AWS expert available 24/7 to assist with operational troubleshooting. It lowers the barrier to operational experience and saves valuable time and effort.
Now in preview The new capability of Amazon Q Developer to help you investigate and remediate operational issues is now in preview in the US East (N. Virginia) Region. Transform your operational investigation today and accelerate remediation with Amazon Q Developer. Visit Amazon CloudWatch documentation page to get started.
Expanding this capability, today we’re launching enhanced observability for your container workloads running on Amazon Elastic Container Service (Amazon ECS). This new capability will help reduce your mean time to detect (MTTD) and mean time to repair (MTTR) for your overall applications, helping prevent issues that could negatively impact your user experience.
Here’s a quick look at Container Insights with enhanced observability for Amazon ECS.
Container Insights with enhanced observability addresses a critical gap in container monitoring. Previously, correlating metrics with logs and events was a time-consuming process, often requiring manual searches and expertise in application architecture. Now, with this capability, CloudWatch and Amazon ECS automatically collect granular performance metrics such as CPU utilization at both the task and container levels while providing visual drill downs enabling easy root-cause analysis.
This new capability enables the following use cases:
Quickly identify root causes by viewing granular resource usage patterns and correlating telemetry data.
Proactively manage your ECS resources using curated dashboards based on AWS best practices.
Track your recent deployments and root causes of your deployment failures with the matching infrastructure anomalies enabling faster issue detection and quicker rollbacks when necessary.
Effortlessly monitor resources across multiple accounts without manual setup. Built-in cross-account support reduces operational overhead with single pane of glass observability.
Integration with other CloudWatch services such as Application Signals and CloudWatch Logs provides a seamless experience to correlate infrastructure with the services running and identify the impacted services.
Using container insights with enhanced observability for Amazon ECS There are two ways to enable Container Insights with enhanced observability:
Cluster-level onboarding – You can enable it for specific clusters individually.
Account-level onboarding – You can also enable it at the account level, which automatically enables observability for all new clusters created in your account. This approach saves time and effort by eliminating the need to manually enable it for each new cluster.
To enable this feature at the account level, I navigate to the Amazon ECS console and select Account settings. Under the CloudWatch Container Insights observability section, I can see it’s currently disabled. I choose Update.
On this page, I find a new option called Container Insights with enhanced observability. I select this option and then choose Save changes.
If I need to enable this capability at the cluster level, I can do so when creating a new cluster.
I can also enable this capability for my existing clusters. To do so, I select Update cluster, and then choose the option.
Once enabled, I can see task-level metrics by navigating to the Metrics tab in my cluster overview console. To access health and performance metrics across my clusters, I can select View Container Insights, which will redirect me to the Container Insights page.
To get a big picture of all my workloads across different clusters, I can navigate to Amazon CloudWatch and then to Container Insights.
This view addresses the challenge of effectively monitoring clusters, services, tasks, and containers by providing a honeycomb visualization that offers an intuitive, high-level summary of cluster health. The dashboard employs a dual-state monitoring approach:
Alarm state (red or green) – Reflects customer-defined thresholds and alerts, allowing teams to configure monitoring based on their specific requirements
Utilization state (dark blue or light blue) – Uses CloudWatch built-in best practices to monitor resource usage patterns across containers. The darker blue indicates clusters operating under higher utilization, enabling teams to proactively identify potential resource constraints before they impact performance
Let’s say there’s an issue in one of my clusters. I can hover over the cluster to display all the alarms created under that cluster at different layers, from the cluster layer down to the container layer.
I also have the option to view all clusters in a list format. The list format is essential for cross-account observability, displaying account IDs and labels for cluster ownership. This helps DevOps engineers quickly identify and collaborate with account owners to resolve potential application issues.
Now, I’d like to explore further. I select my cluster link, which redirects me to the Container Insights detailed dashboard view. Here, I can see a spike in memory utilization for this cluster.
I can dive deeper into container-level details, which help me quickly identify which services are causing this issue.
Another useful feature I found is the Filters option, which helps me conduct more thorough investigations across containers, services, or tasks in this cluster.
If I need to delve deeper into the application logs to understand the root cause of this issue, I can select the task, choose Actions, and choose which logs I would like to view.
On top of using AWS X-Ray traces, I can investigate another two types of logs here. First, I can use performance logs—structured logs containing metric data—to drill down and identify container-level root causes. Second, I examine collected application or container logs . These logs give me detailed insights into application behavior within the container, helping me trace the sequence of events that led to any issues.
In this case, I use application logs.
This streamlines my journey to troubleshoot my application. In this case, the issue is on the downstream calls to third-party applications, which return timeouts.
This integration with Amazon CloudWatch Application Signals provides me with end-to-end visibility, helping me correlate container performance with end-user experience.
When I select datapoints in the graphs, I can see associated traces, which show me all correlated services and their impact. I can also access relevant logs to understand root causes.
Additional things to know Here are a couple of important points to note:
Availability – Container Insights with enhanced observability for ECS is now available in all AWS Regions including the China Regions.
Pricing – Container Insights with enhanced observability for ECS comes with a flat metric pricing, visit the Amazon CloudWatch Pricing page.
Get started today and experience improved observability for your container workloads. Learn more on the Amazon CloudWatch documentation page.
Today we are announcing the integration of AWS CloudFormation Hooks with AWS Cloud Control API (CCAPI). This integration enables the use of hooks to validate the configuration of resources being provisioned through CCAPI. In this blog post, we will explore the integration between CloudFormation Hooks and CCAPI by configuring an existing hook to work with CCAPI and then test that hook using the AWS CLI and Terraform.
Understanding CloudFormation Hooks
CloudFormation Hooks integrate seamlessly with your CloudFormation and CCAPI requests to perform validation of your resource configuration during resource create and update operations. You can create hooks using AWS Lambda, AWS CloudFormation Guard rules, or using code and the CloudFormation Command Line Interface (CFN-CLI). A hook can be triggered on change sets, entire stack templates, or by each resource and it will return back any discovered misconfiguration information. Hooks can be configured to warn or fail on the operation allowing you to prevent any misconfigured resources from being deployed in your account. Some key benefits of using CloudFormation Hooks with CCAPI include:
Enforcing security best practices
Applying organizational policies to resource deployments
Optimizing resource configurations for cost and performance
For this post we are going to use the new AWS CloudFormation Guard (Guard) hook AWS::Hooks::GuardHook. Guard is an open-source policy-as-code tool that allows you to validate your infrastructure configurations against company policy guidelines. It provides a domain-specific language (DSL) for writing rules to check both required and prohibited resource configurations. The new AWS::Hooks::GuardHook allows you to use the Guard DSL inside of a hook so you can easily implement your organizations guidelines. The result is you can use the same Guard rules in our local development environment, continuous integration and continuous deployment pipelines, and at deployment time (using hooks). To learn more about AWS::Hooks::GuardHook you can look at the blog.
This is what the configuration of the current Guard hook looks like.
This hook has been configured to log the Guard validation report to an Amazon Simple Storage Service (S3) bucket. Additionally, this hook is configured to use a rule from the AWS CloudFormation Guard registry. This rule will validate that an S3 bucket is using versioning. This hook is configured with an alias named My::Hooks::Guard.
Here is the rule for reference. This rule will validate that the property VersioningConfiguration is provided and that its value is Enabled.
let s3_buckets_versioning_enabled = Resources.*[ Type == 'AWS::S3::Bucket' ]
rule S3_BUCKET_VERSIONING_ENABLED when %s3_buckets_versioning_enabled !empty {
  %s3_buckets_versioning_enabled.Properties.VersioningConfiguration exists
  %s3_buckets_versioning_enabled.Properties.VersioningConfiguration.Status == 'Enabled'
  <<
    Guard Rule Set: ABS-CCIGv2-Standard
    Controls: section4b-design-and-secure-the-cloud-14-standard-workloads,section4b-design-and-secure-the-cloud-15-standard-workloads
    Violation: S3 Bucket Versioning must be enabled.
    Fix: Set the S3 Bucket property VersioningConfiguration.Status to 'Enabled' .
  >>
}
Configuring the hook to work with CCAPI
This announcement adds a new hook target that can easily be configured on your existing or new hooks. To configure the hook to work with CCAPI you will edit the configuration to include a new TargetOperations value of CLOUD_CONTROL. This hook is only enabled to execute on CREATE and UPDATE operations. Additionally HookInvocationStatus is ENABLED which will execute the hook and FailureMode will tell the hook to FAIL the operation if the resource is not compliant.
By using TargetOperations of ["RESOURCE", "CLOUD_CONTROL"] the Guard rules will work the same across CloudFormation resource operations and CCAPI operations.
Testing the hook using AWS CLI
Test your hook using the AWS CLI which allows us to create, update, delete, and list resources.
Start by creating a S3 bucket using CCAPI. In this example you are providing no properties for creating the S3 bucket. Run the command aws cloudcontrol create-resource --type-name AWS::S3::Bucket --desired-state {} Response:
Get the request status by using the RequestToken from the response above. Run the command aws cloudcontrol get-resource-request-status --request-token 2c7b6f5e-4083-4ef8-9a23-5c81472540b1
Response:
{
    "ProgressEvent": {
        "TypeName": "AWS::S3::Bucket",
        "RequestToken": "2c7b6f5e-4083-4ef8-9a23-5c81472540b1",
        "HooksRequestToken": "4a193a00-4c76-41fe-87b8-75b838f00bbe",
        "Operation": "CREATE",
        "OperationStatus": "FAILED",
        "EventTime": "2024-11-05T09:41:40.785000-08:00",
        "StatusMessage": "Request [4a193a00-4c76-41fe-87b8-75b838f00bbe] failed \ndue to the following failed invocations: [My::Hooks::Guard]"
    },
    "HooksProgressEvent": [
        {
            "HookTypeName": "My::Hooks::Guard",
            "HookTypeVersionId": "00000006",
            "HookTypeArn": "arn:aws:cloudformation:eu-central-1:123456789012:type/hook/My-Hooks-Guard/00000001/aws-hooks/AWS-Hooks-GuardHook/00000001.00000005",
            "InvocationPoint": "PRE_PROVISION",
            "HookStatus": "HOOK_COMPLETE_FAILED",
            "HookEventTime": "2024-11-05T09:41:38.978000-08:00",
            "HookStatusMessage": "Template failed validation, the following rule(s) failed: S3_BUCKET_VERSIONING_ENABLED. Full output was written to s3://<my-guard-hook-logging-bocket>/cfn-guard-validate-report/AWS--S3--Bucket-4a193a00-4c76-41fe-87b8-75b838f00bbe-RESOURCE-AWS--S3--Bucket-CREATE-PRE_PROVISION/1730828427591.json",
            "FailureMode": "FAIL"
        }
    ]
}
In the response you will see all hooks that were executed and their response in relation to the request. This response shows that the hook My::Hooks::Guard failed because of the rule S3_BUCKET_VERSIONING_ENABLED . You are also provided a s3 location for where the full Guard output is stored.
You can get the Guard results file by using the following command. Replace <path-from-previous-output> with the path provided in the previous output. Run the command aws s3 cp s3://<path-from-previous-output> -
We truncated the output as it can be very verbose.
Testing the hook using Terraform
The Terraform AWS Cloud Control Provider allows you to manage AWS resources using CCAPI and Terraform. By leveraging this provider you get the benefit of using hooks to validate the configuration of Terraform provisioned resources.
Create a new Terraform configuration file named main.tf with the following content:
Run the following commands to initialize Terraform and create an execution plan. Run the command terraform init followed by terraform plan.
Apply the configuration by running. Run the command terraform apply
Response:
...
awscc_s3_bucket.example: Creating...
╷
│ Error: AWS SDK Go Service Operation Incomplete
│
│   with awscc_s3_bucket.example,
│   on main.tf line 14, in resource "awscc_s3_bucket" "example":
│   14: resource "awscc_s3_bucket" "example" {
│
│ Waiting for Cloud Control API service CreateResource operation completion returned: waiter state transitioned to FAILED. StatusMessage: Request [d417b05b-9eff-46ef-b164-08c76aec1801] failed
│ due to the following failed invocations: [My::Hooks::Guard]. ErrorCode:
╵
In this response you can see that the hook My::Hooks::Guard failed and the request token is d417b05b-9eff-46ef-b164-08c76aec1801
You can get details on the hook invocation by running the command aws cloudformation list-hook-results --hook-target TargetType=CLOUD_CONTROL,TargetId=d417b05b-9eff-46ef-b164-08c76aec1801Response:
{
    "TargetType": "CLOUD_CONTROL",
    "TargetId": "d417b05b-9eff-46ef-b164-08c76aec1801",
    "HookResults": [
        {
            "InvocationPoint": "PRE_PROVISION",
            "FailureMode": "FAIL",
            "TypeName": "My::Hooks::Guard",
            "TypeVersionId": "00000006",
            "Status": "HOOK_COMPLETE_FAILED",
            "HookStatusReason": "Template failed validation, the following rule(s) failed: S3_BUCKET_VERSIONING_ENABLED. Full output was written to s3://my-company-guard-hooks-eu-central-1/cfn-guard-validate-report/AWS--S3--Bucket-d417b05b-9eff-46ef-b164-08c76aec1801-RESOURCE-AWS--S3--Bucket-CREATE-PRE_PROVISION/1730829108790.json"
        }
    ]
}
As with the AWS CLI you now know what rule failed and additional you have the S3 bucket location for the Guard log file.
You can get the Guard results file by running the command aws s3 cp s3://<path-from-previous-output> -. Replace <path-from-previous-output> with the path provided in the previous output.Response:
CloudFormation Hooks provide a powerful way to enforce best practices and compliance for your AWS resources. By leveraging CloudFormation Hooks and the Cloud Control API you can create consistent validation of your resources before deployment across many of your infrastructure as code solutions.
The collective thoughts of the interwebz
Manage Consent
To provide the best experiences, we use technologies like cookies to store and/or access device information. Consenting to these technologies will allow us to process data such as browsing behavior or unique IDs on this site. Not consenting or withdrawing consent, may adversely affect certain features and functions.
Functional
Always active
The technical storage or access is strictly necessary for the legitimate purpose of enabling the use of a specific service explicitly requested by the subscriber or user, or for the sole purpose of carrying out the transmission of a communication over an electronic communications network.
Preferences
The technical storage or access is necessary for the legitimate purpose of storing preferences that are not requested by the subscriber or user.
Statistics
The technical storage or access that is used exclusively for statistical purposes.The technical storage or access that is used exclusively for anonymous statistical purposes. Without a subpoena, voluntary compliance on the part of your Internet Service Provider, or additional records from a third party, information stored or retrieved for this purpose alone cannot usually be used to identify you.
Marketing
The technical storage or access is required to create user profiles to send advertising, or to track the user on a website or across several websites for similar marketing purposes.
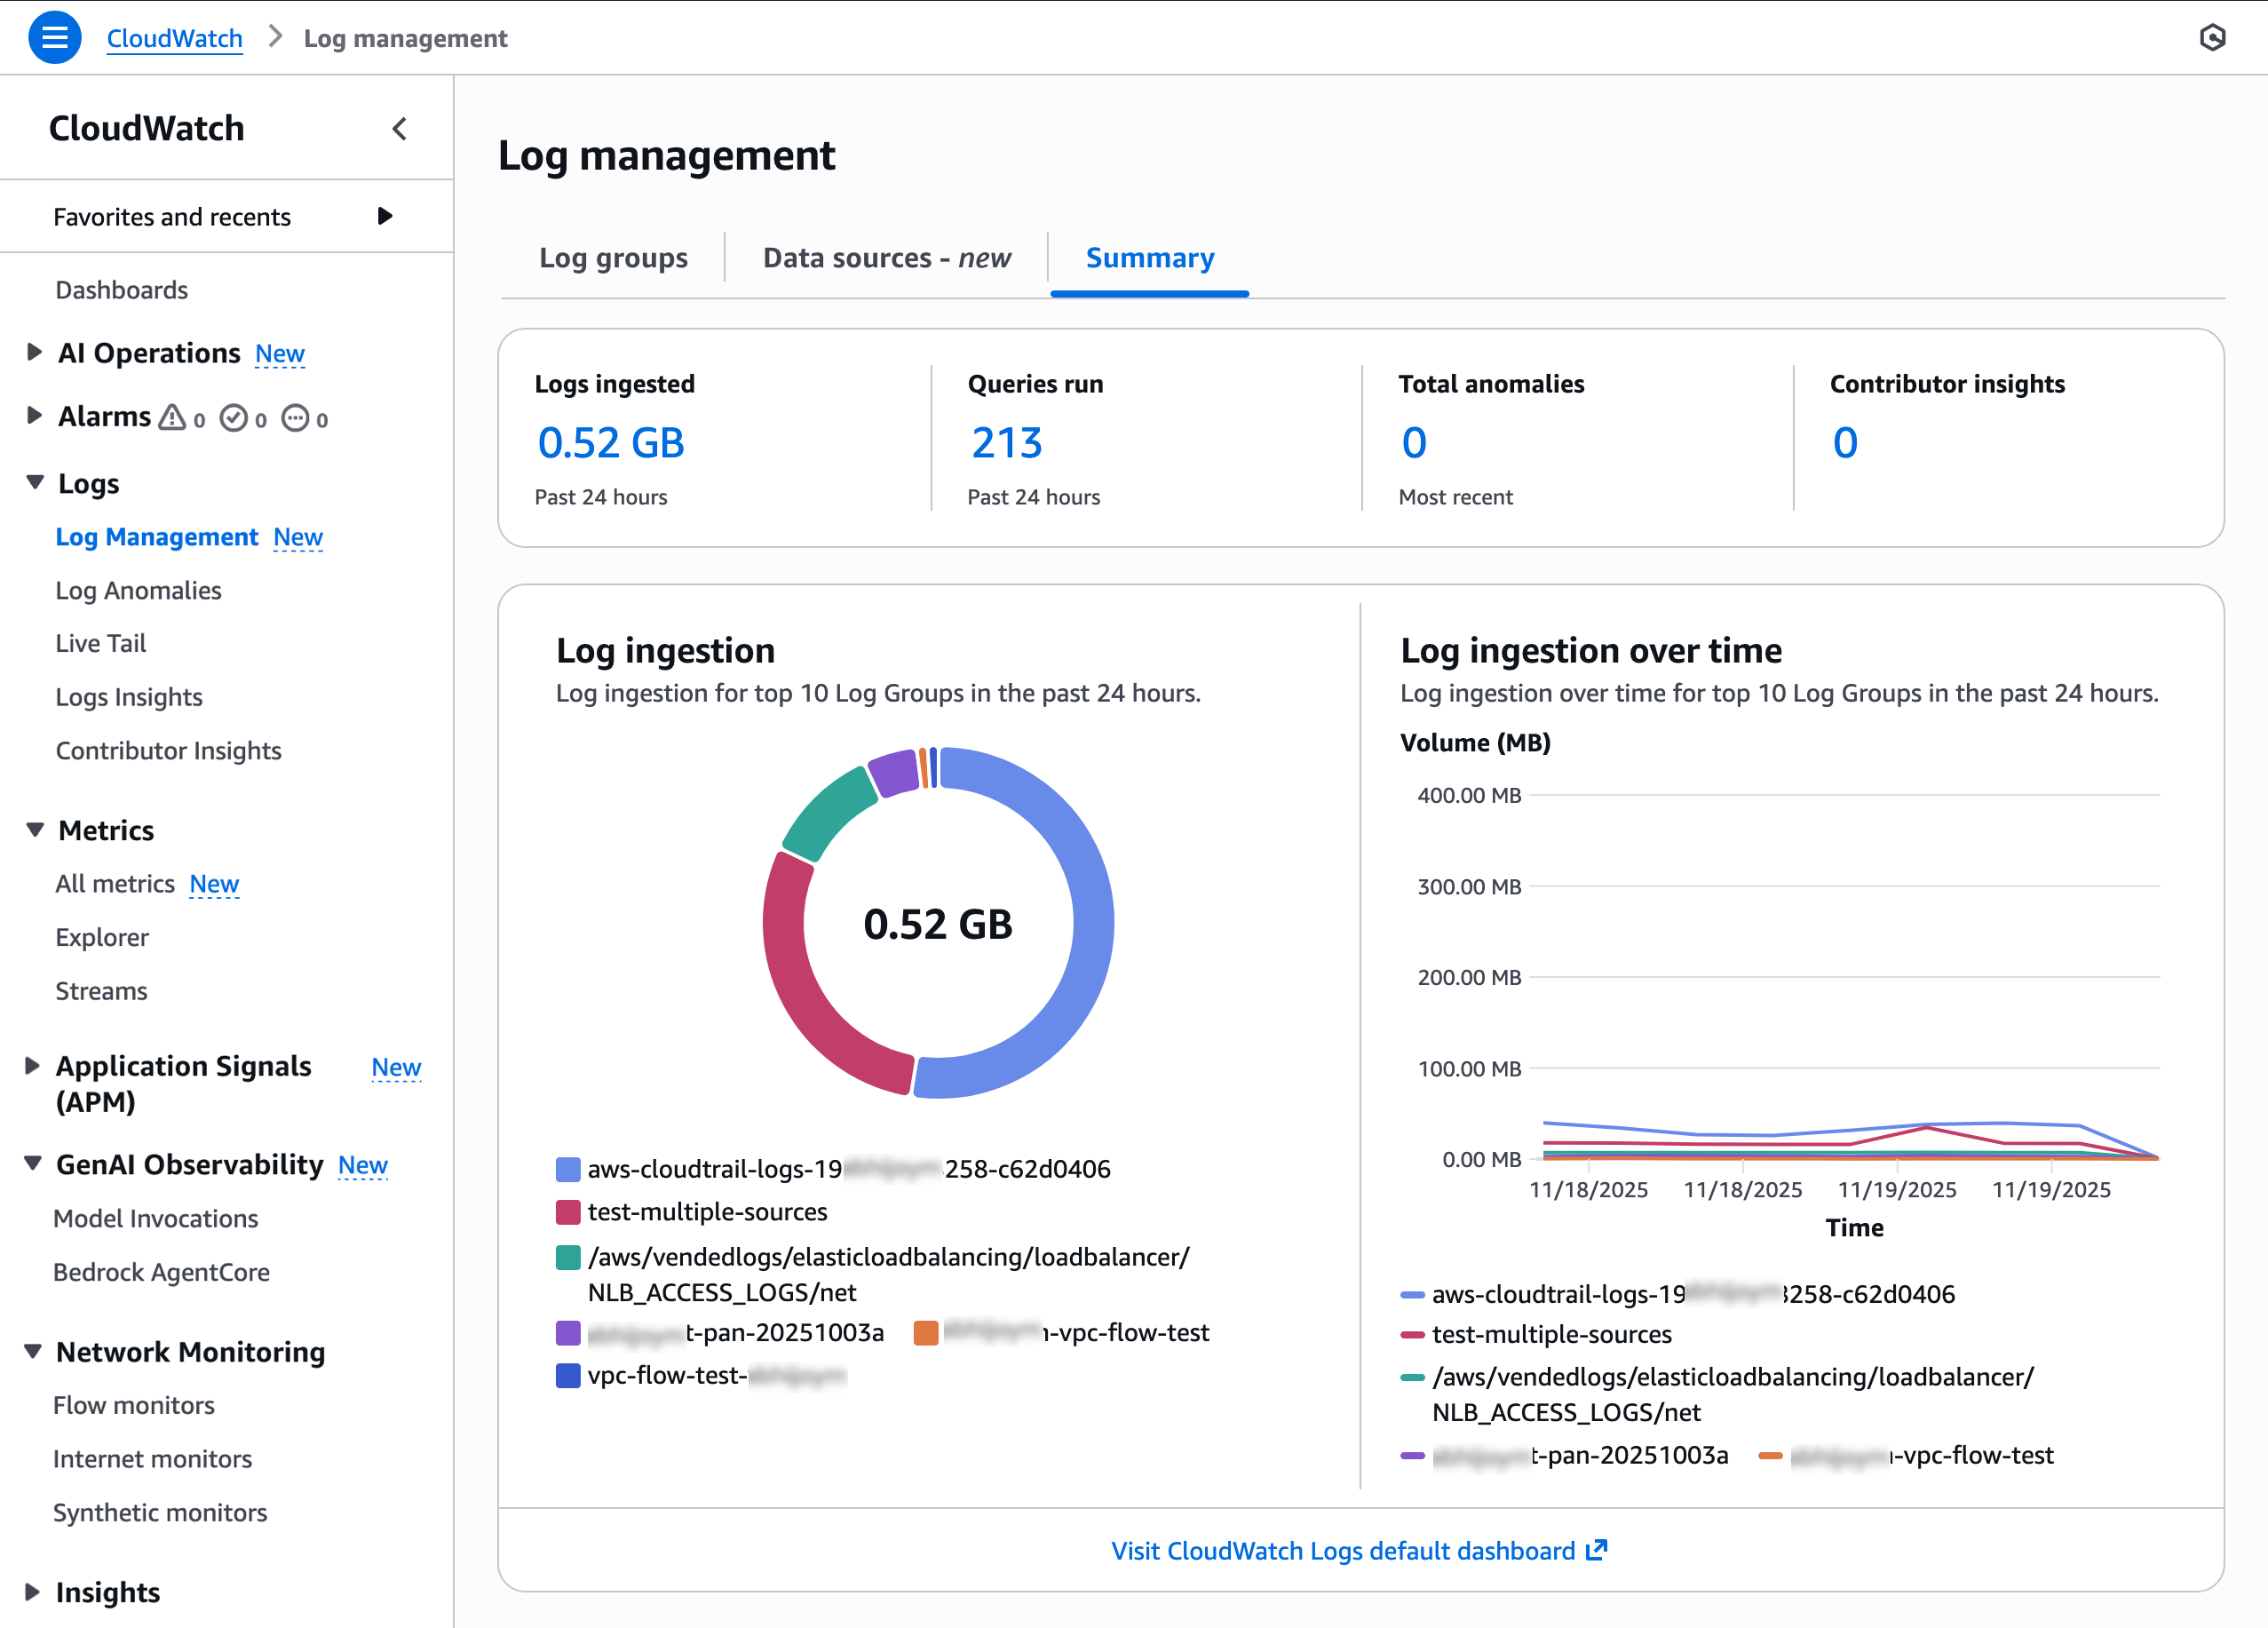
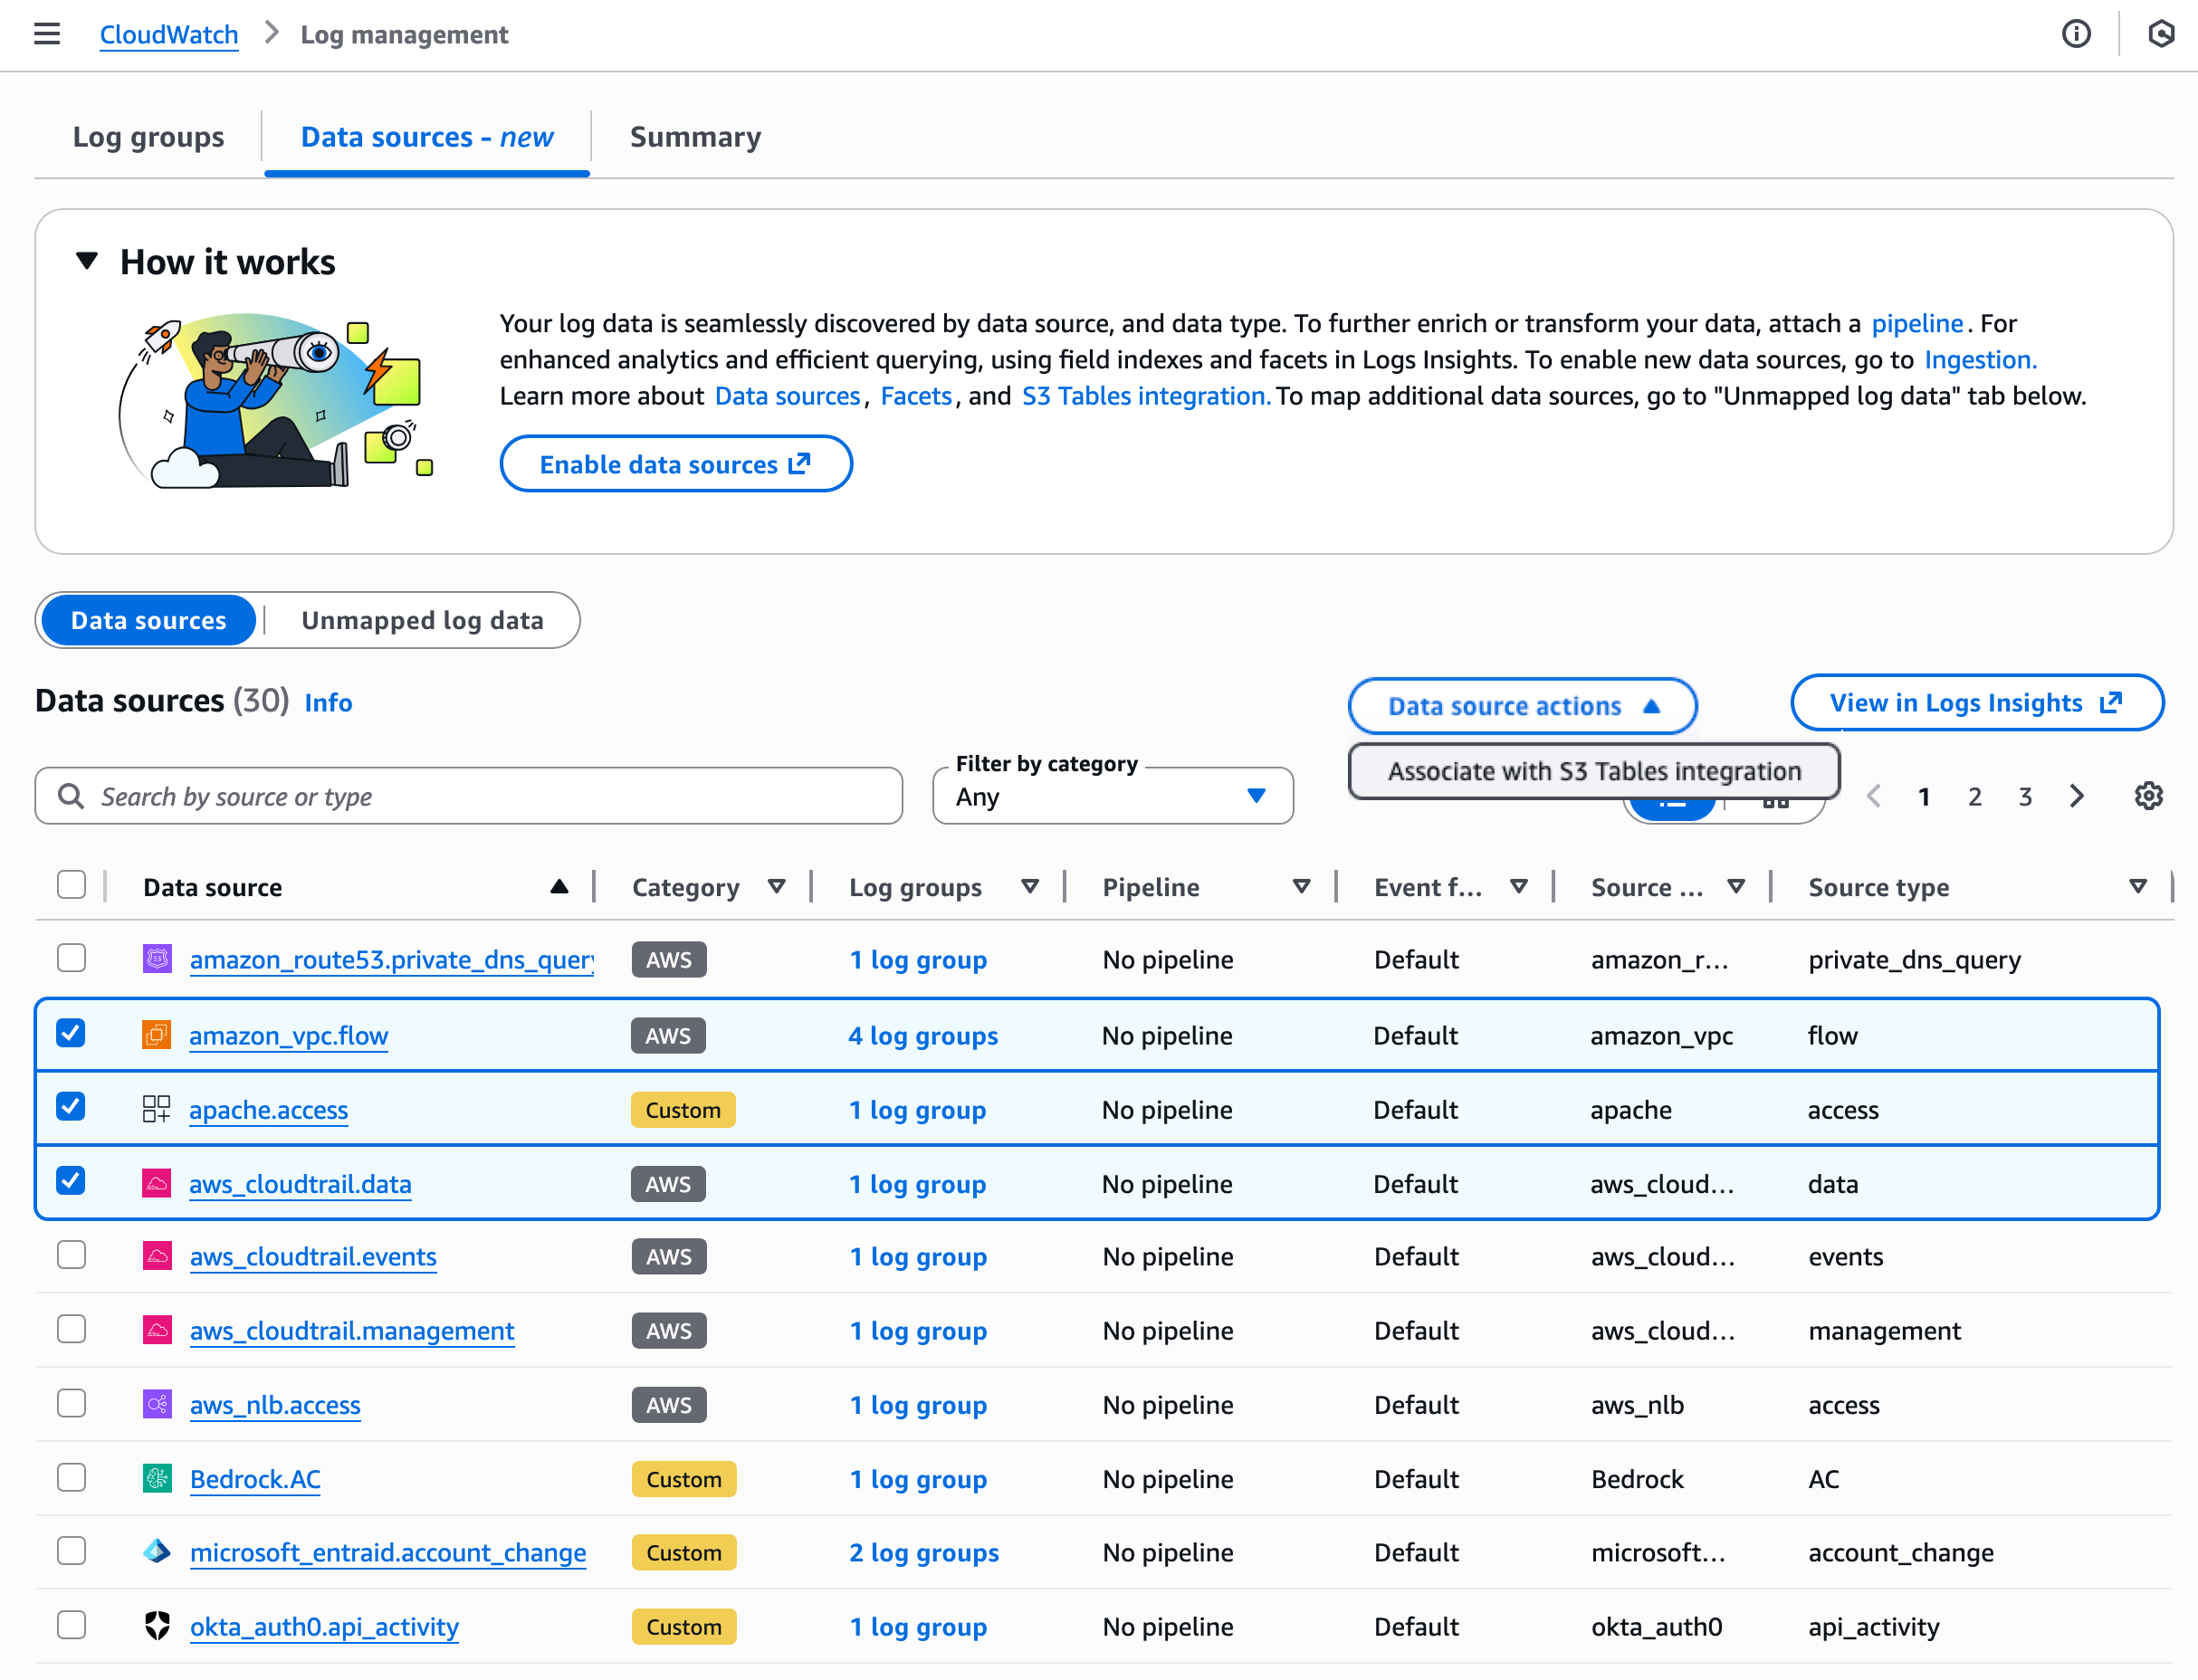
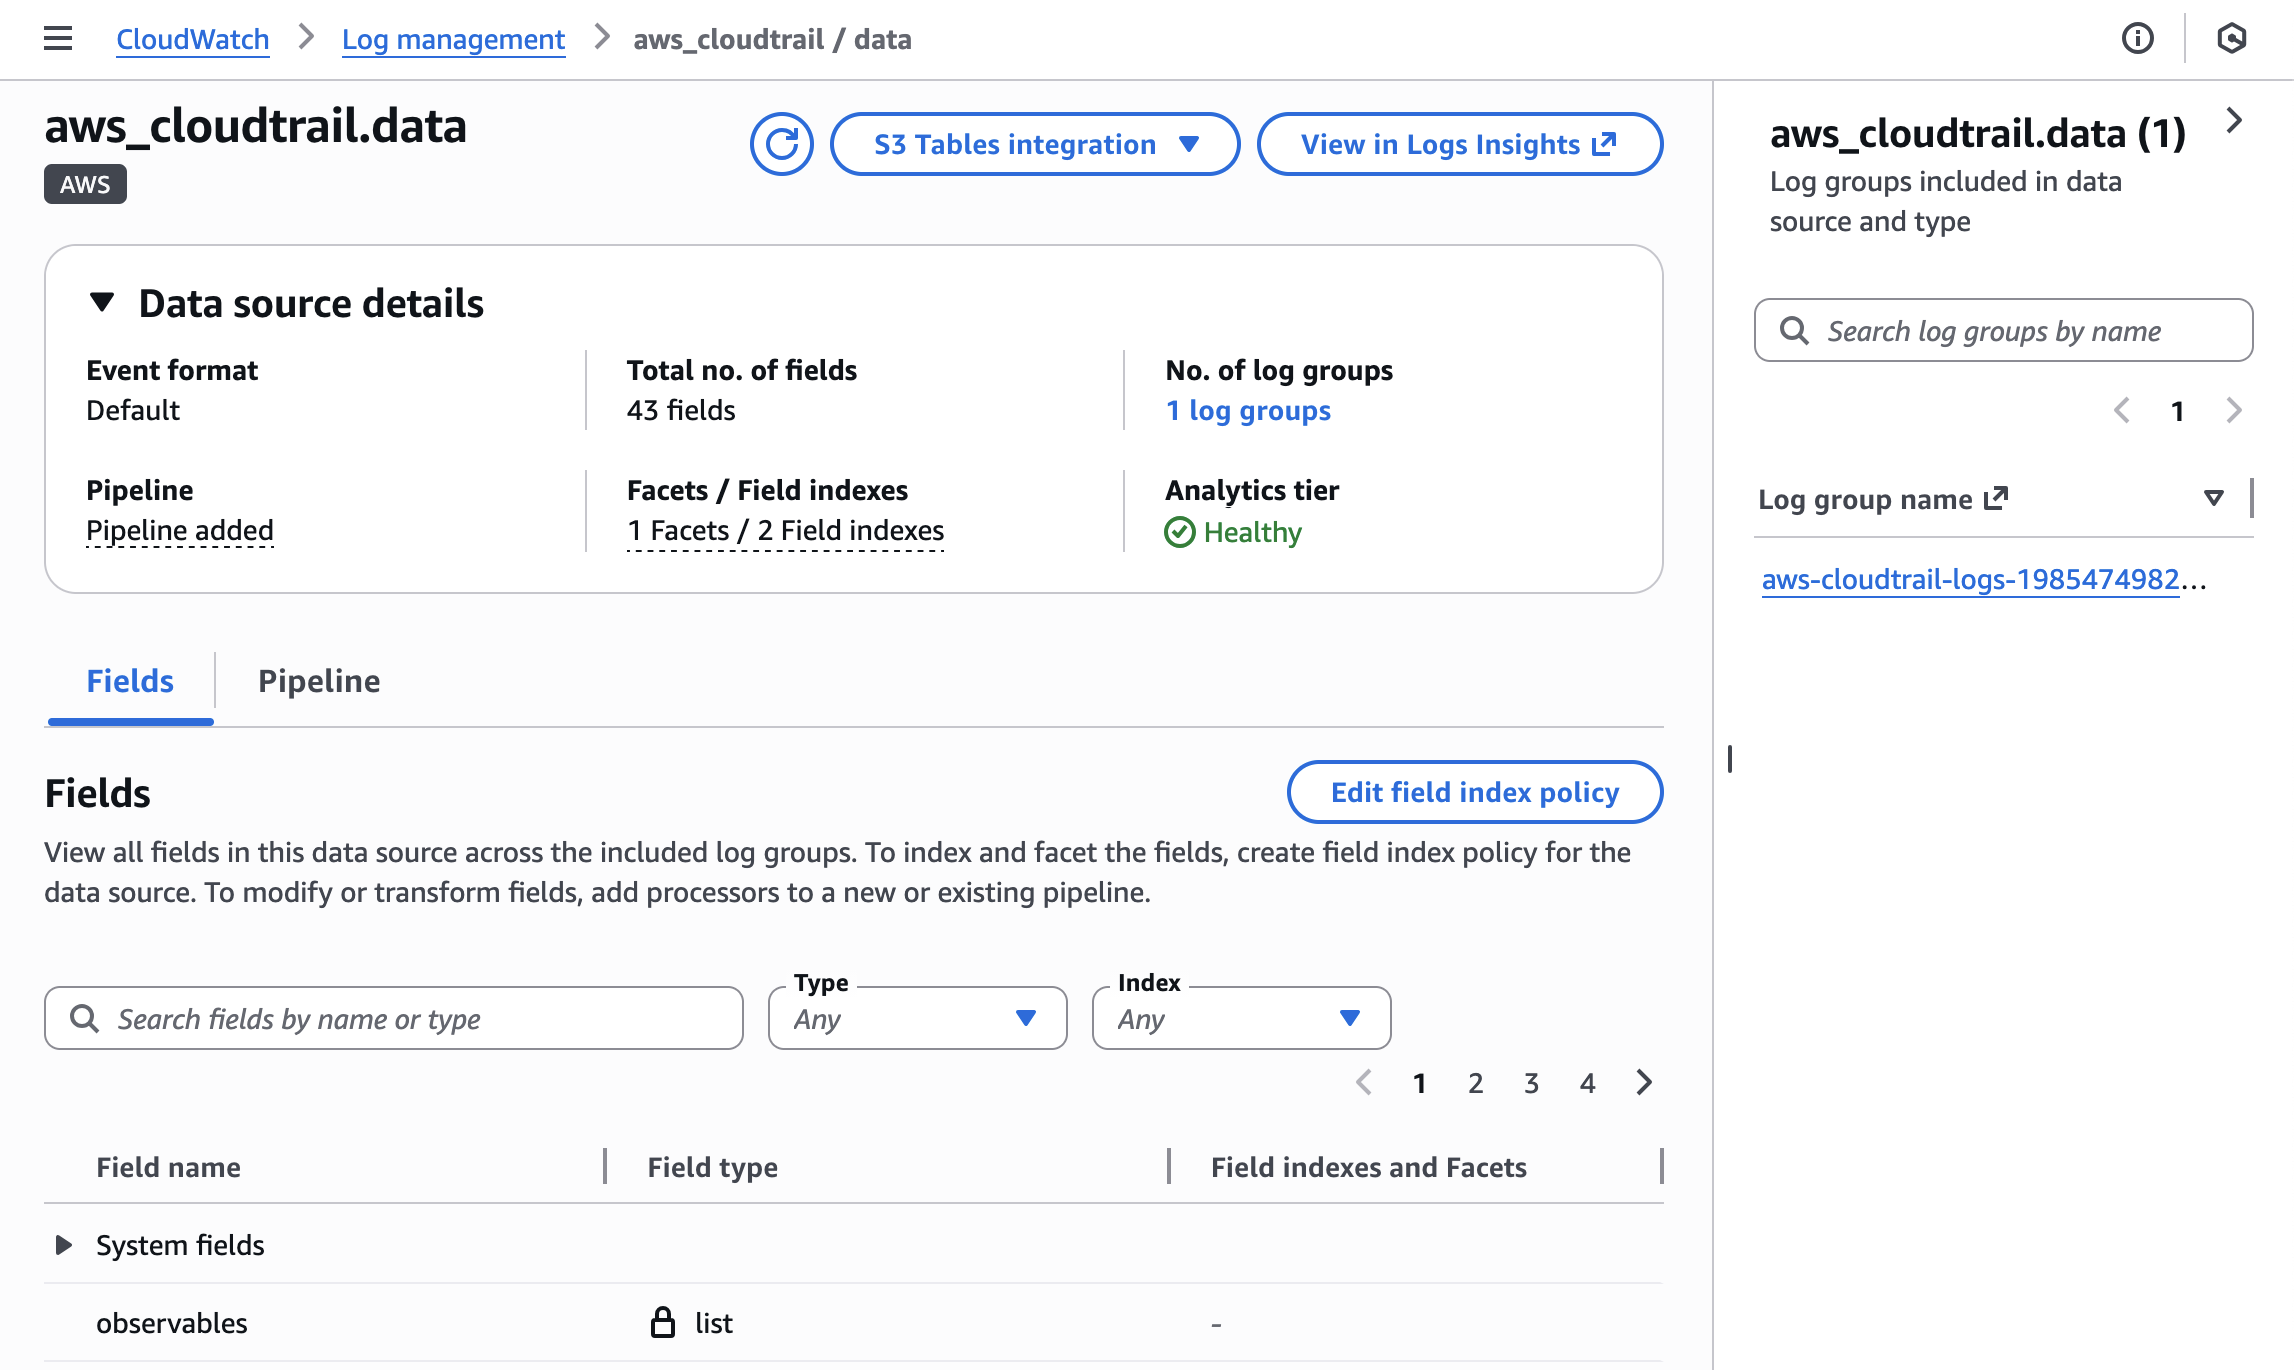
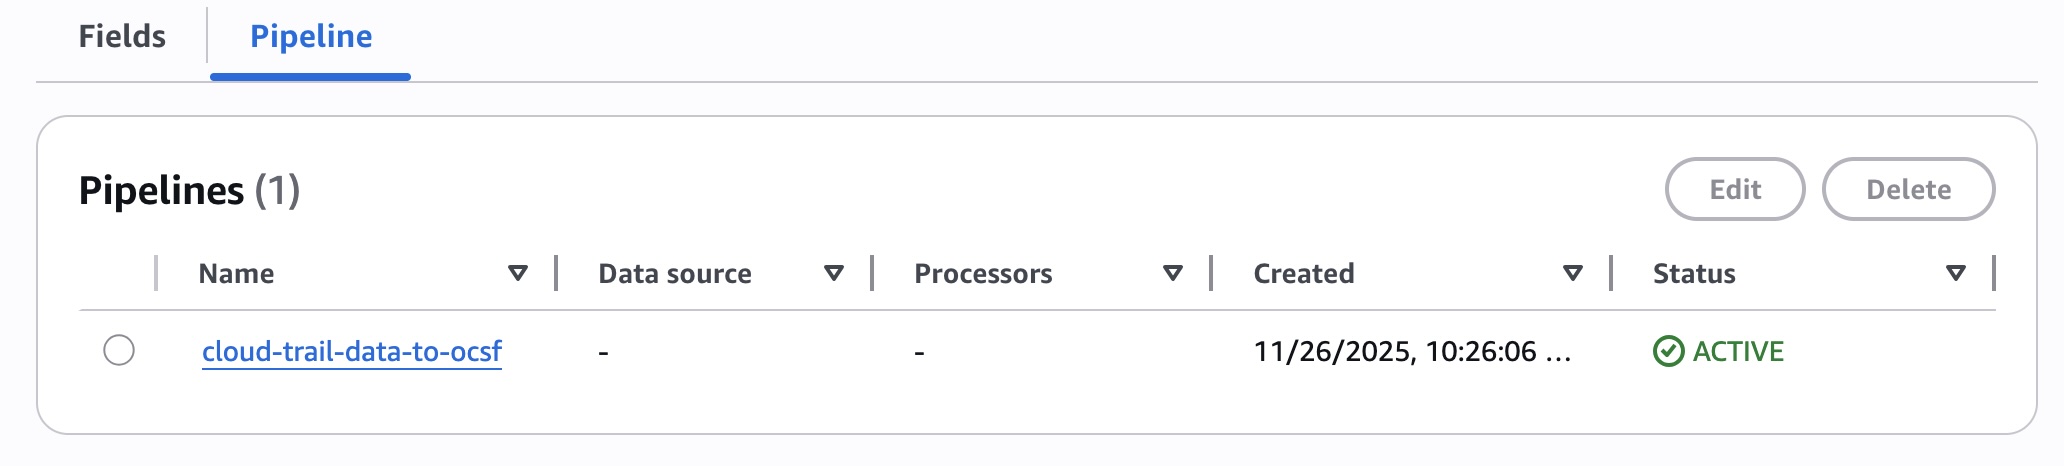
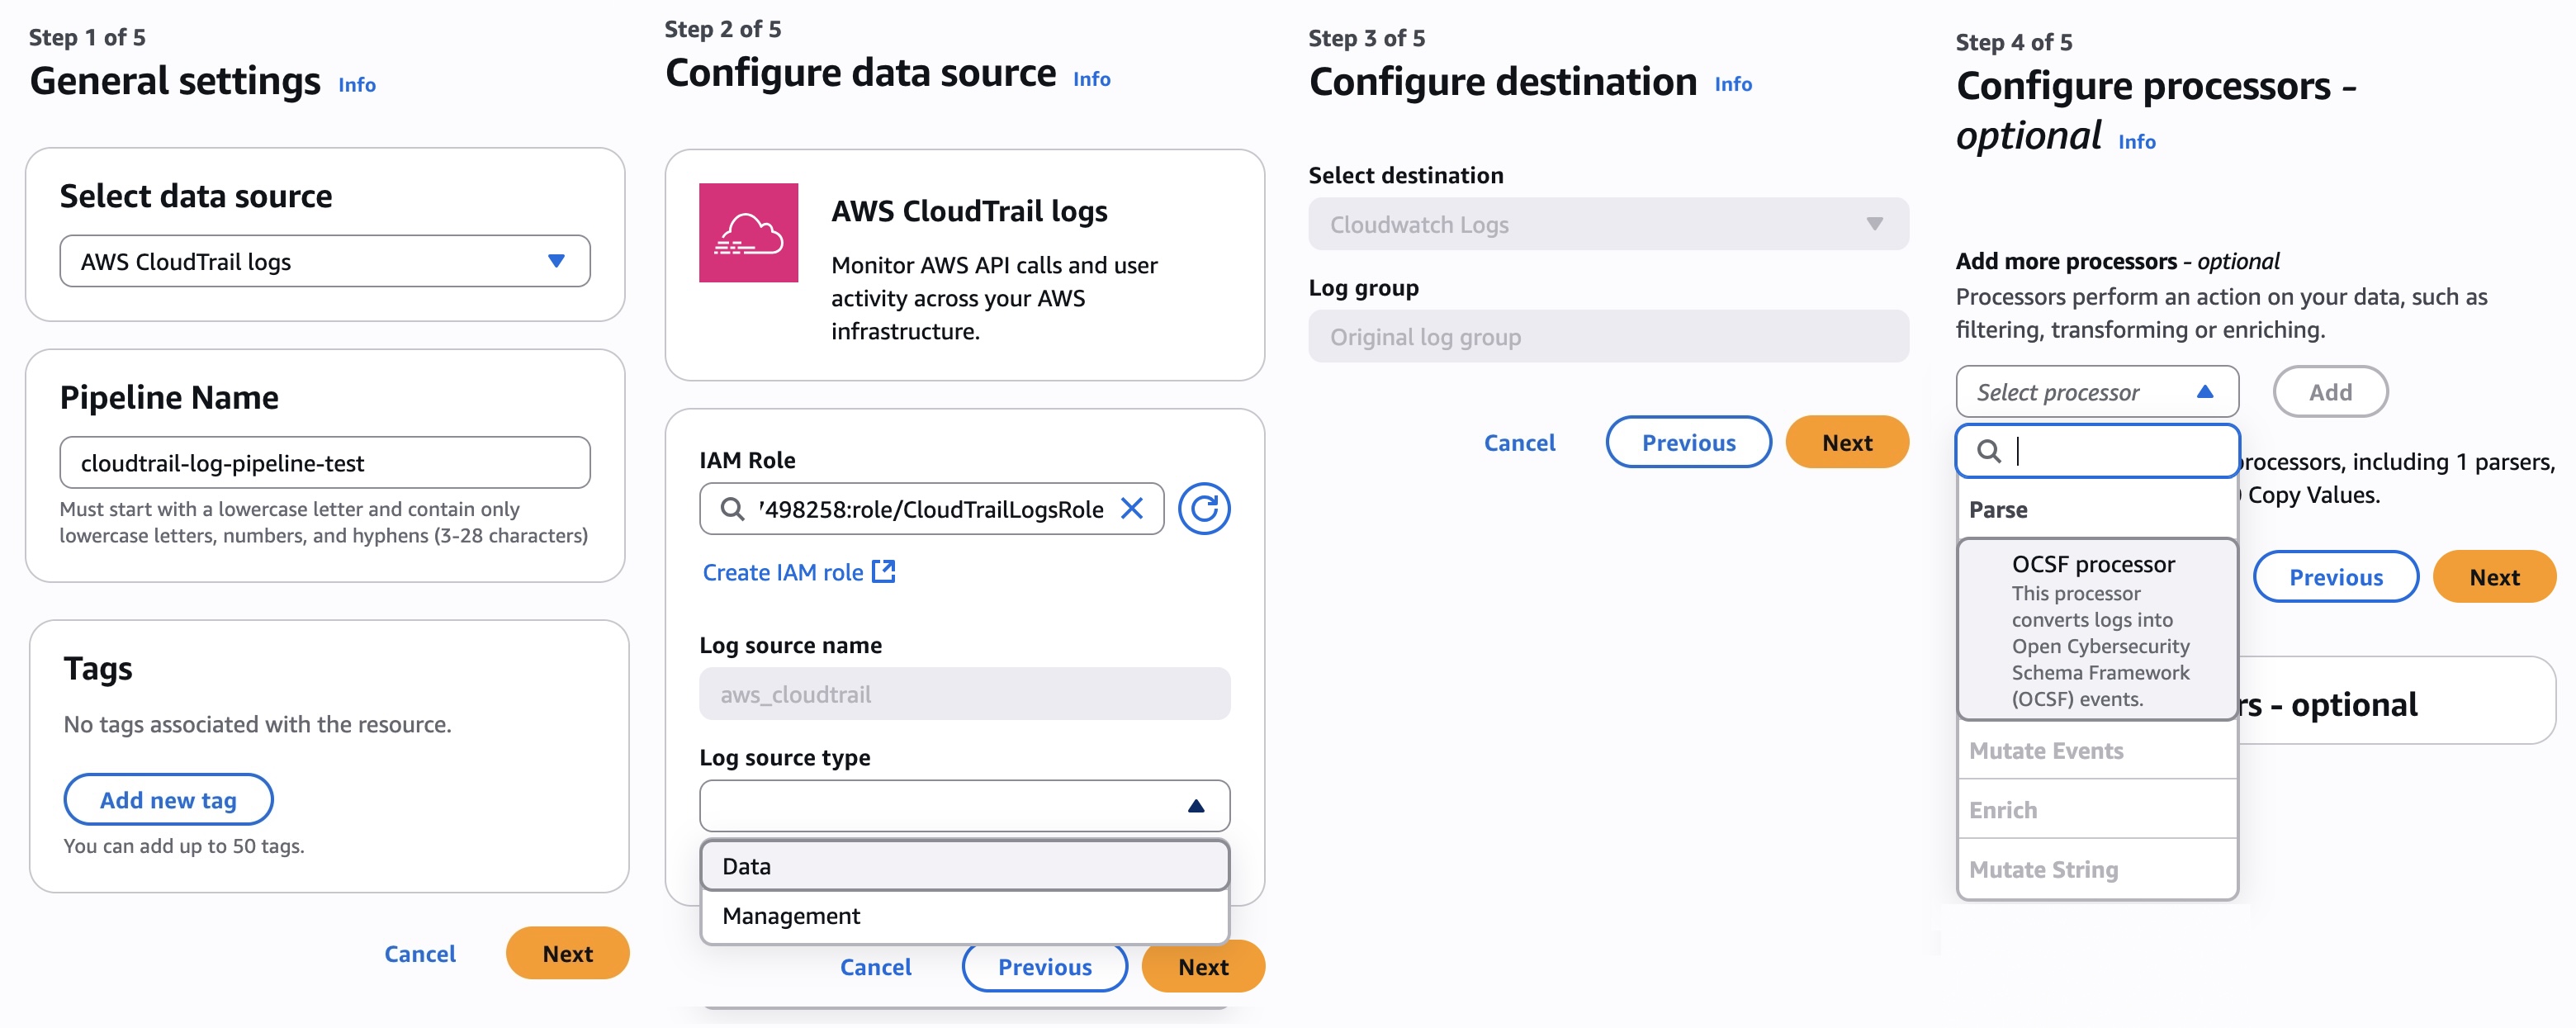
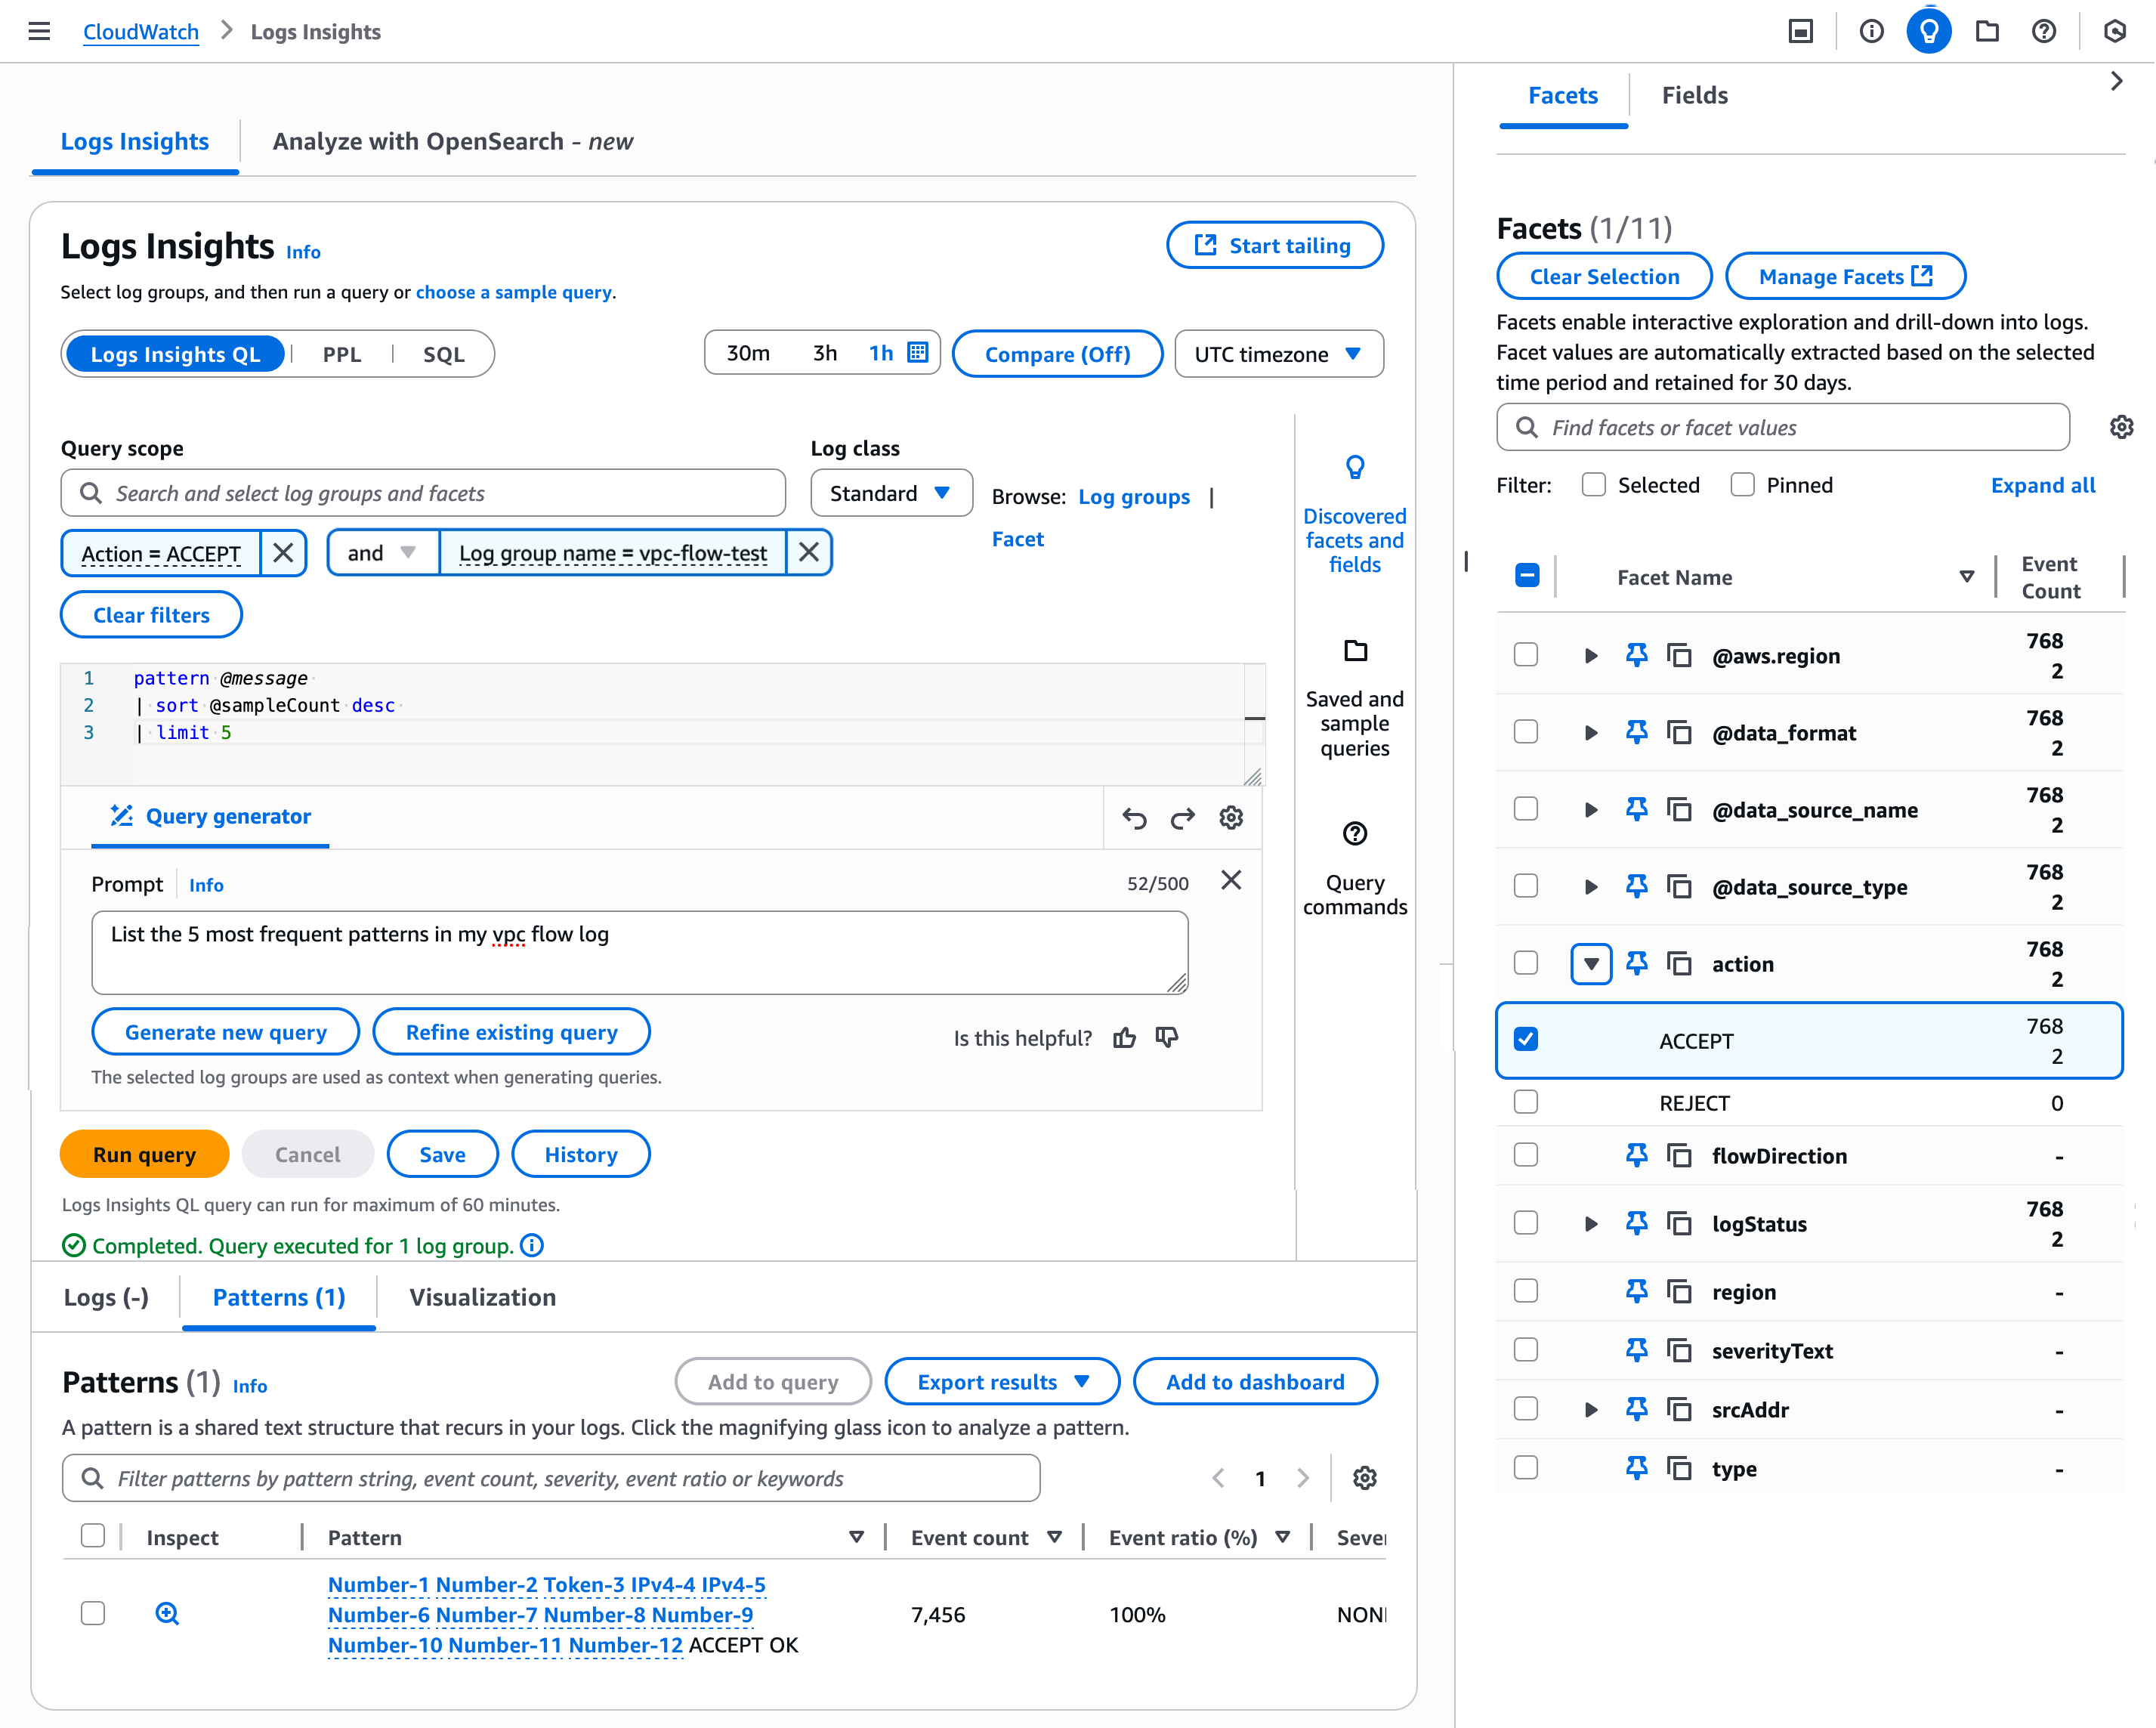
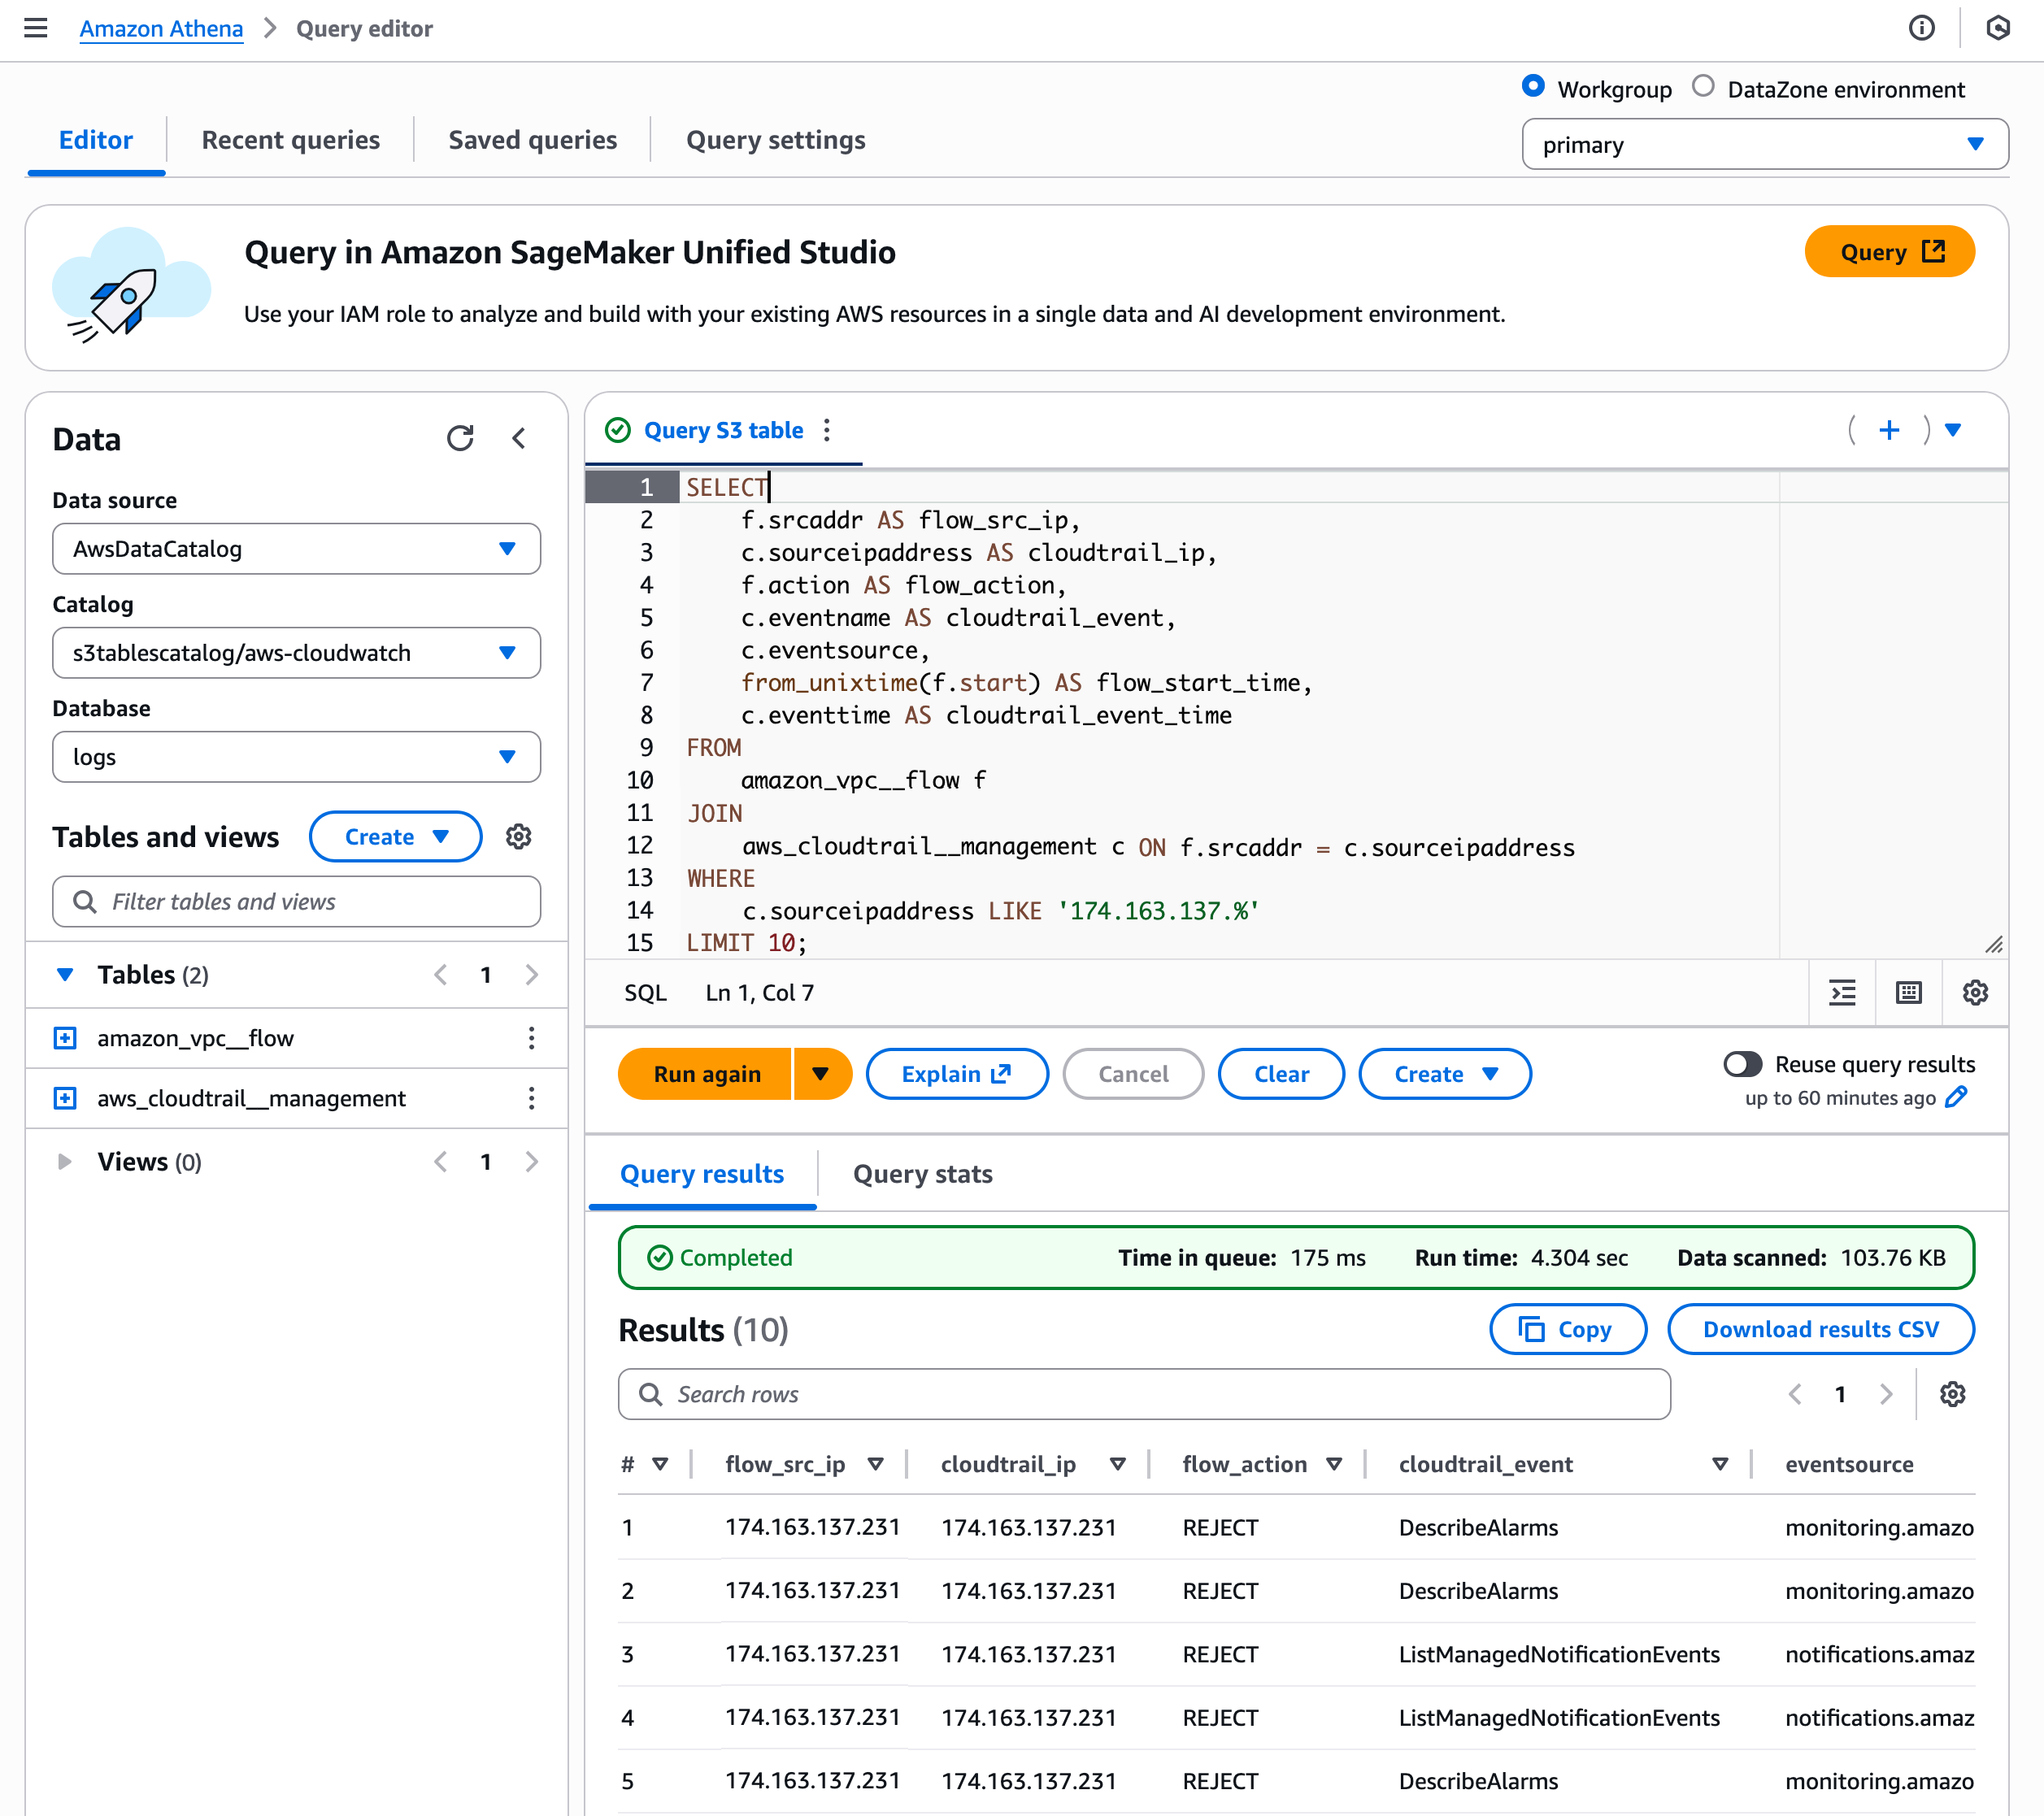
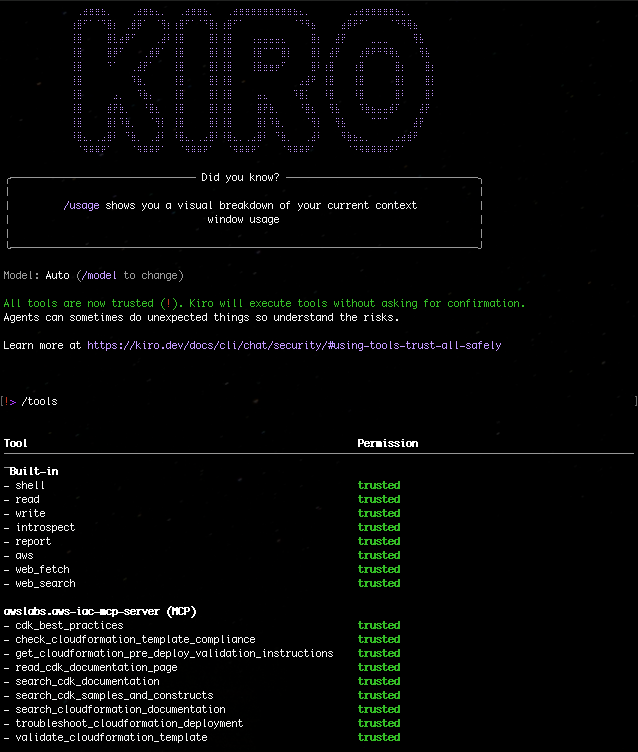

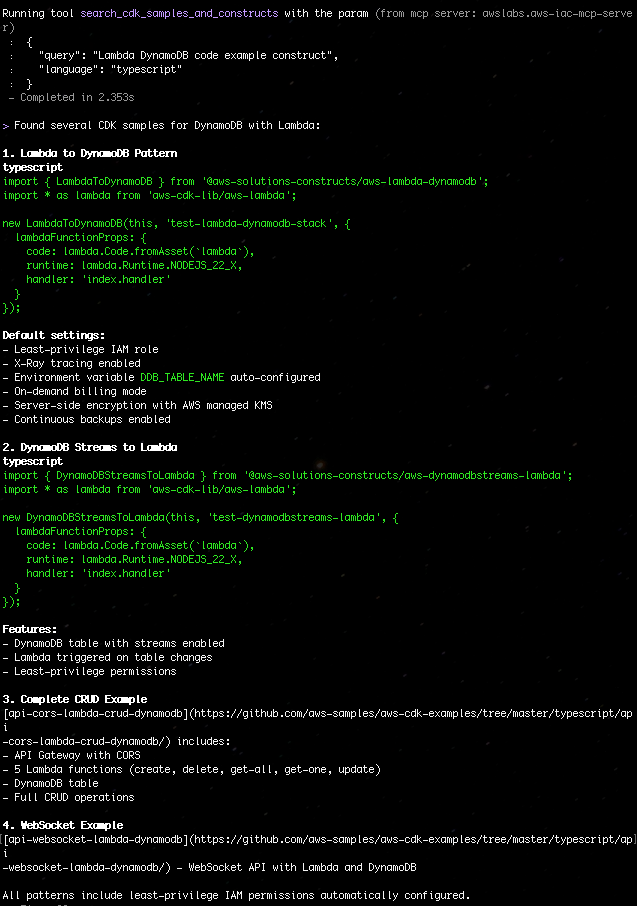
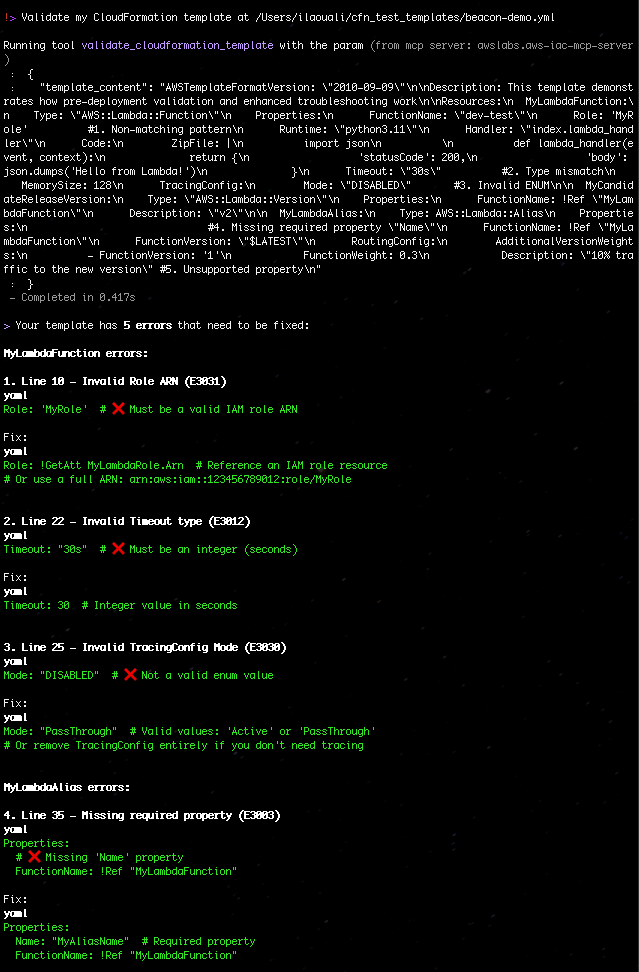
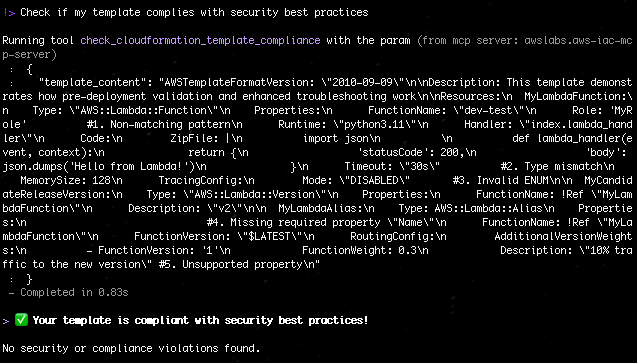
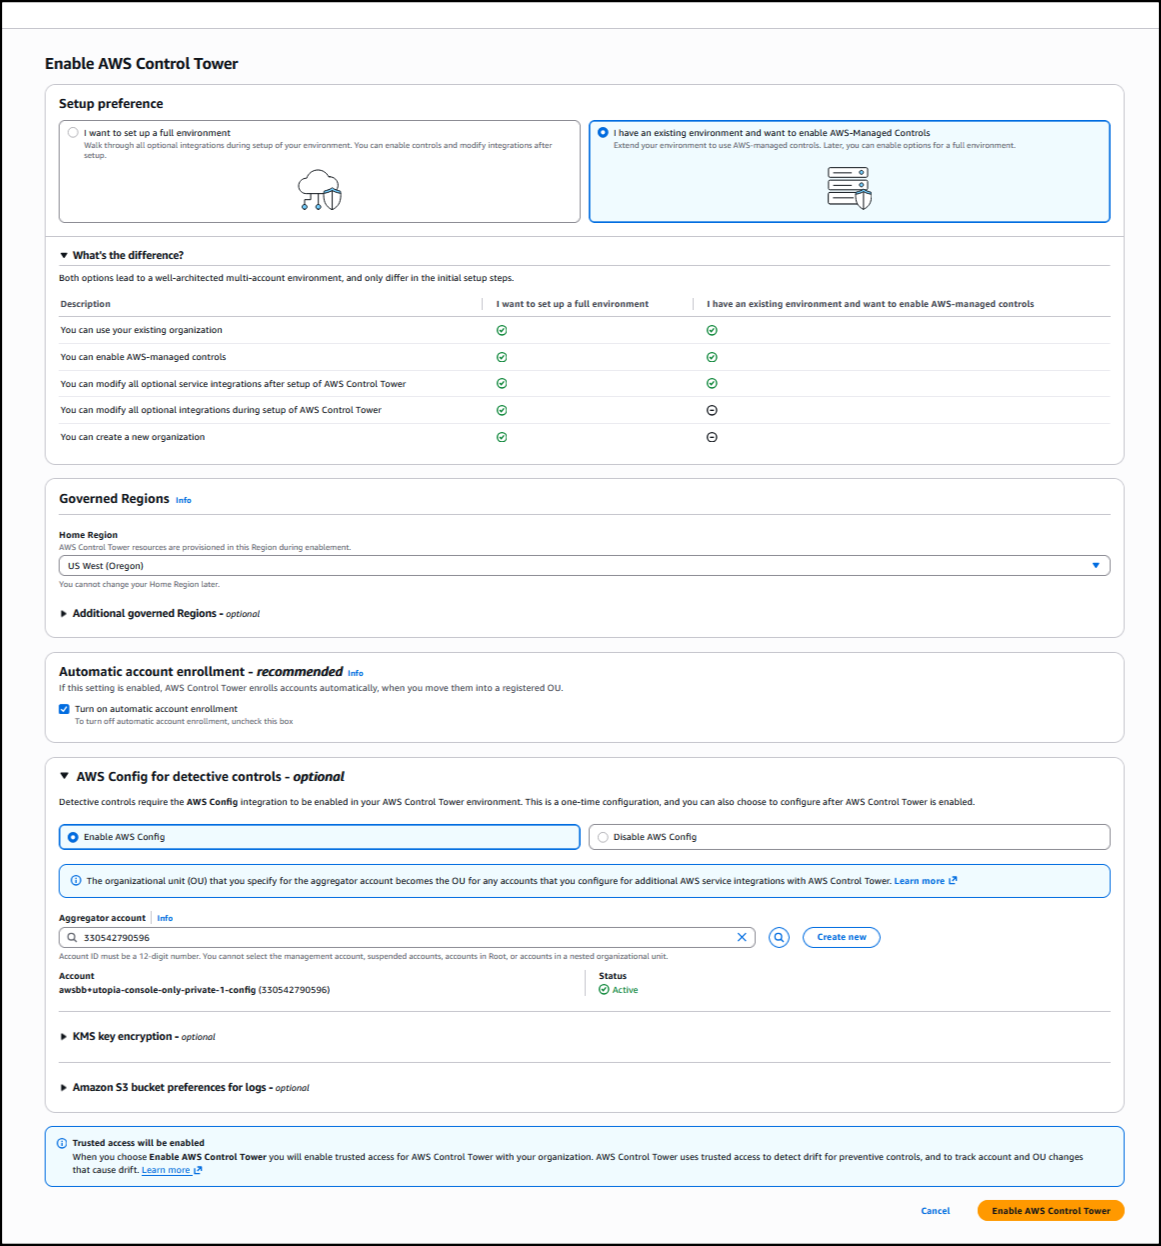
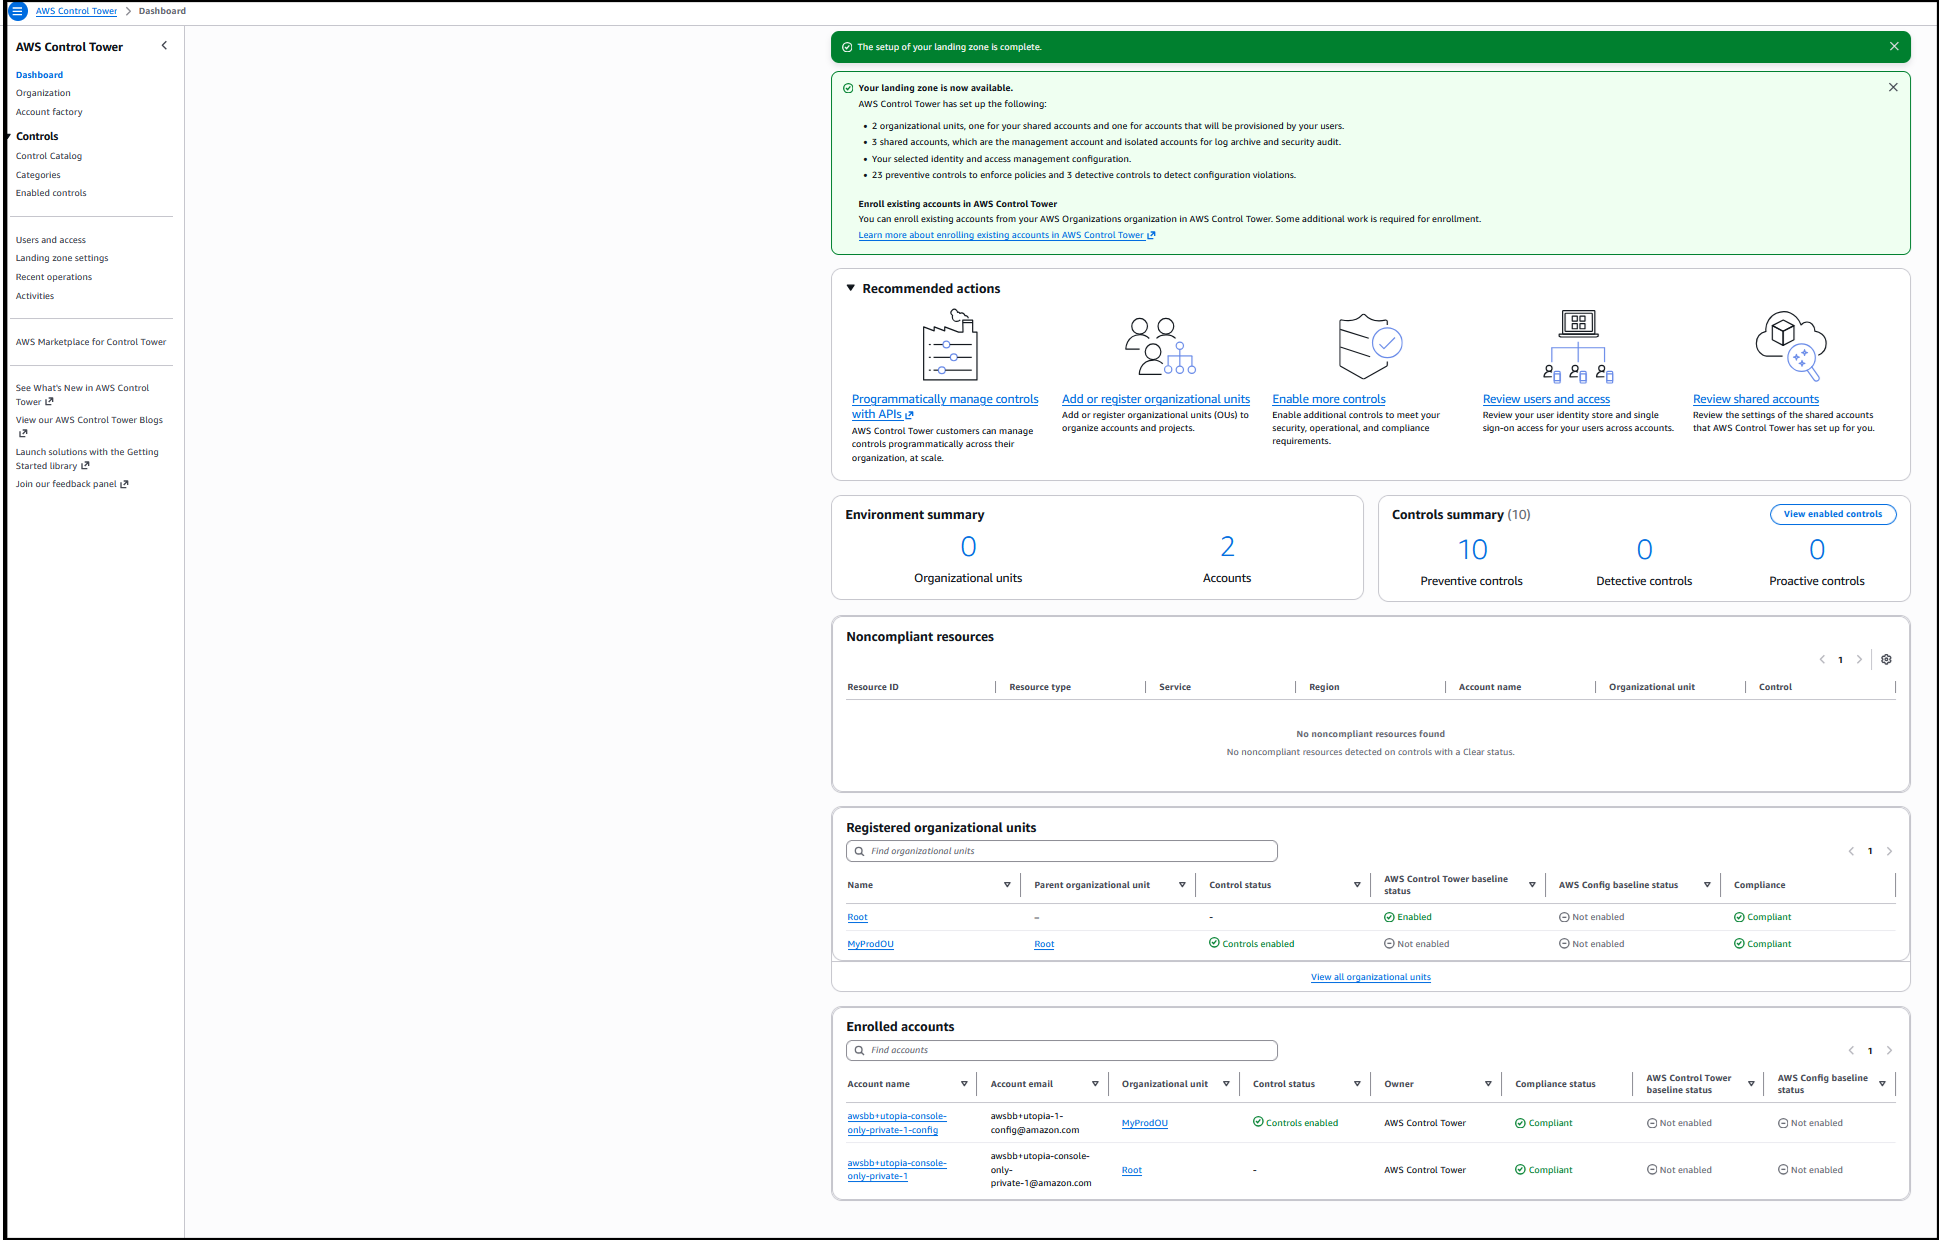
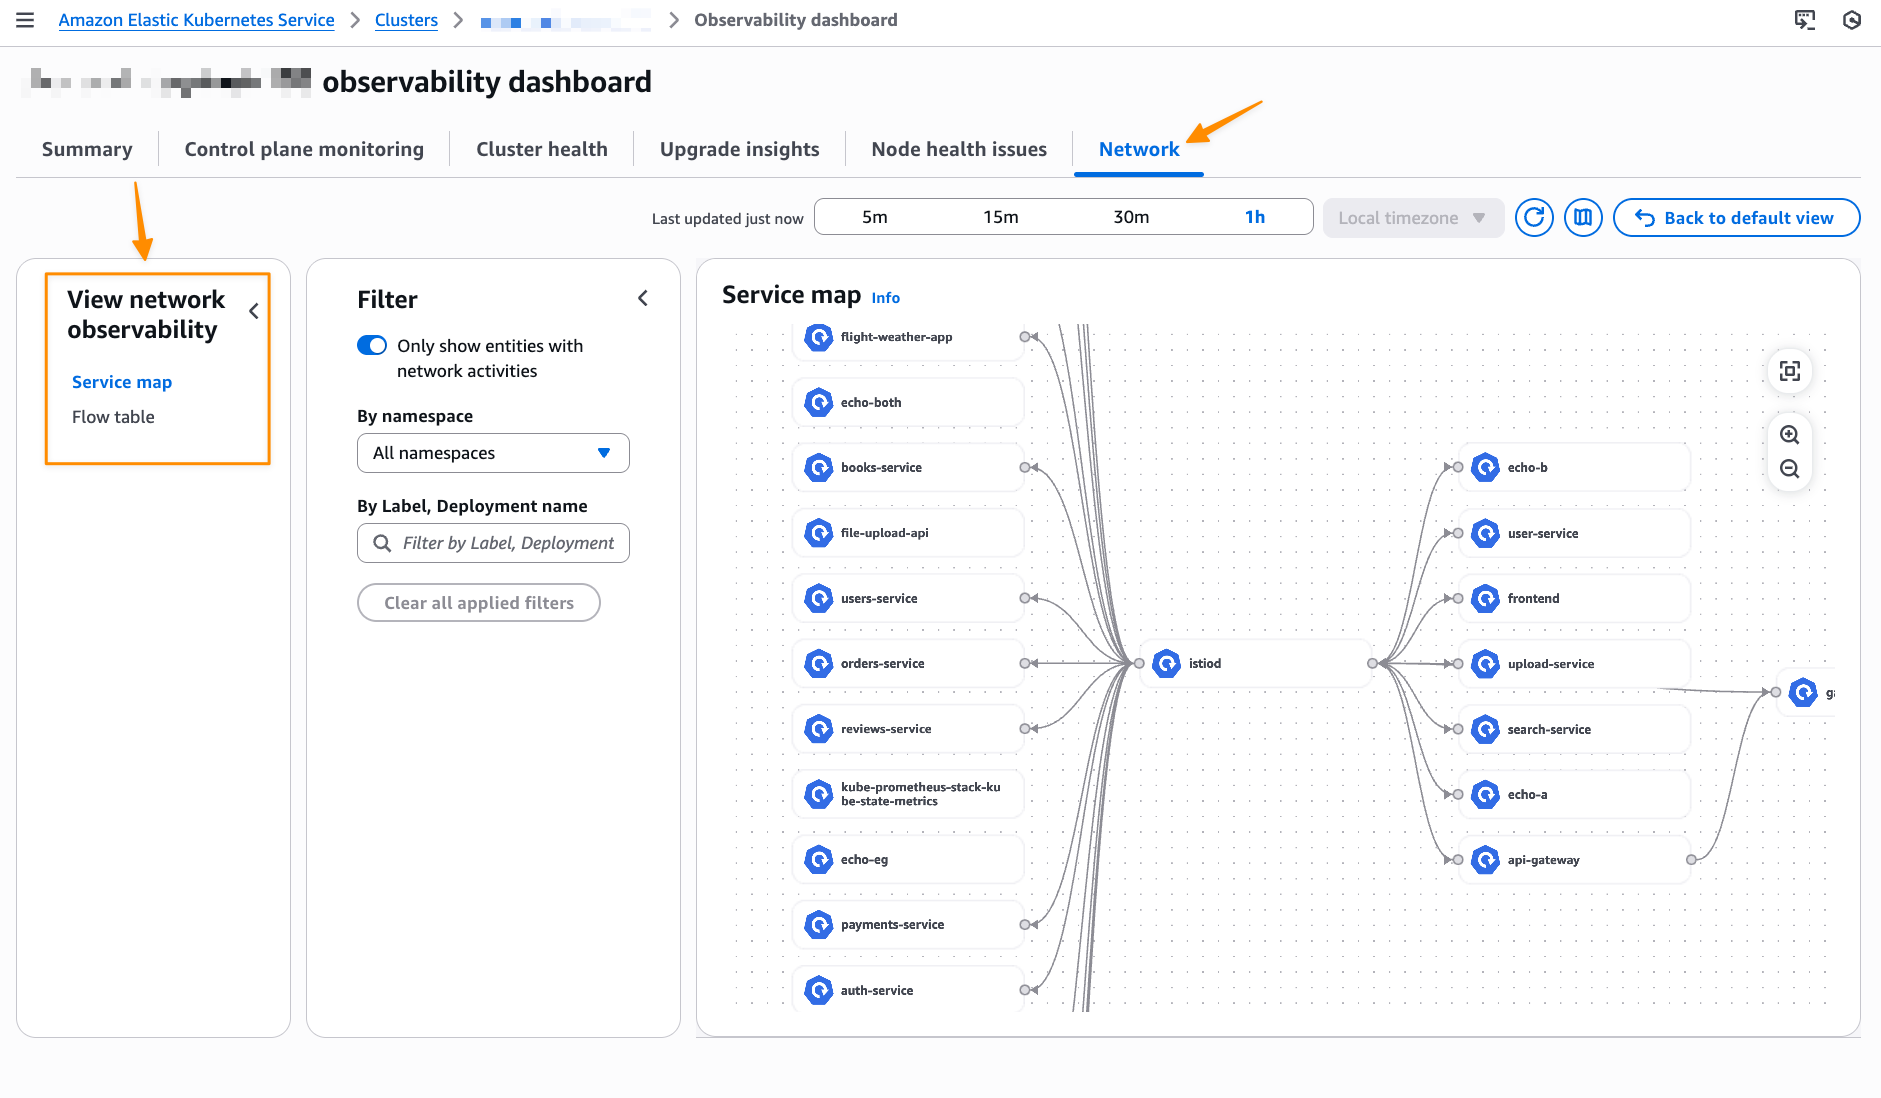
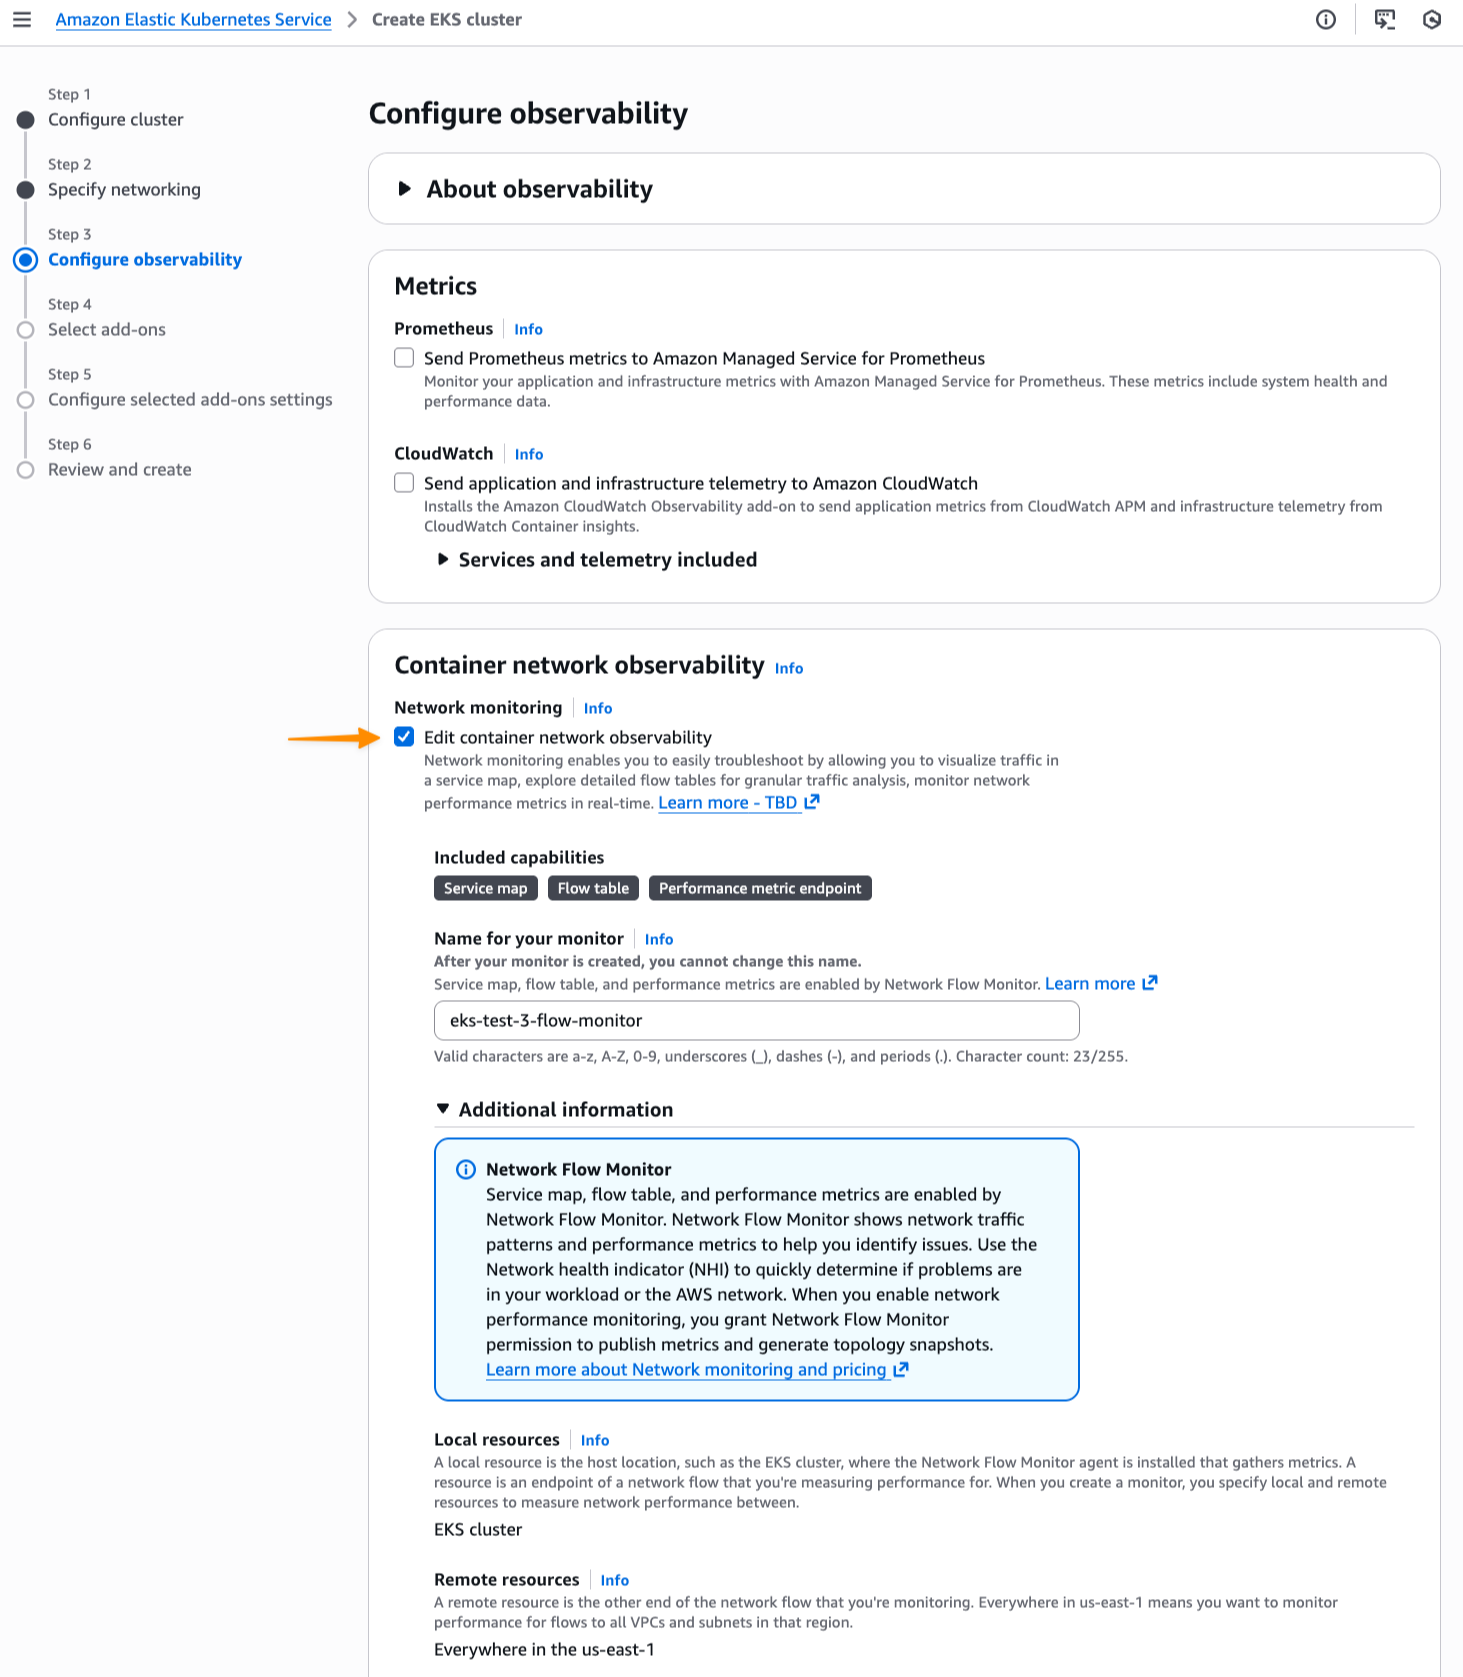
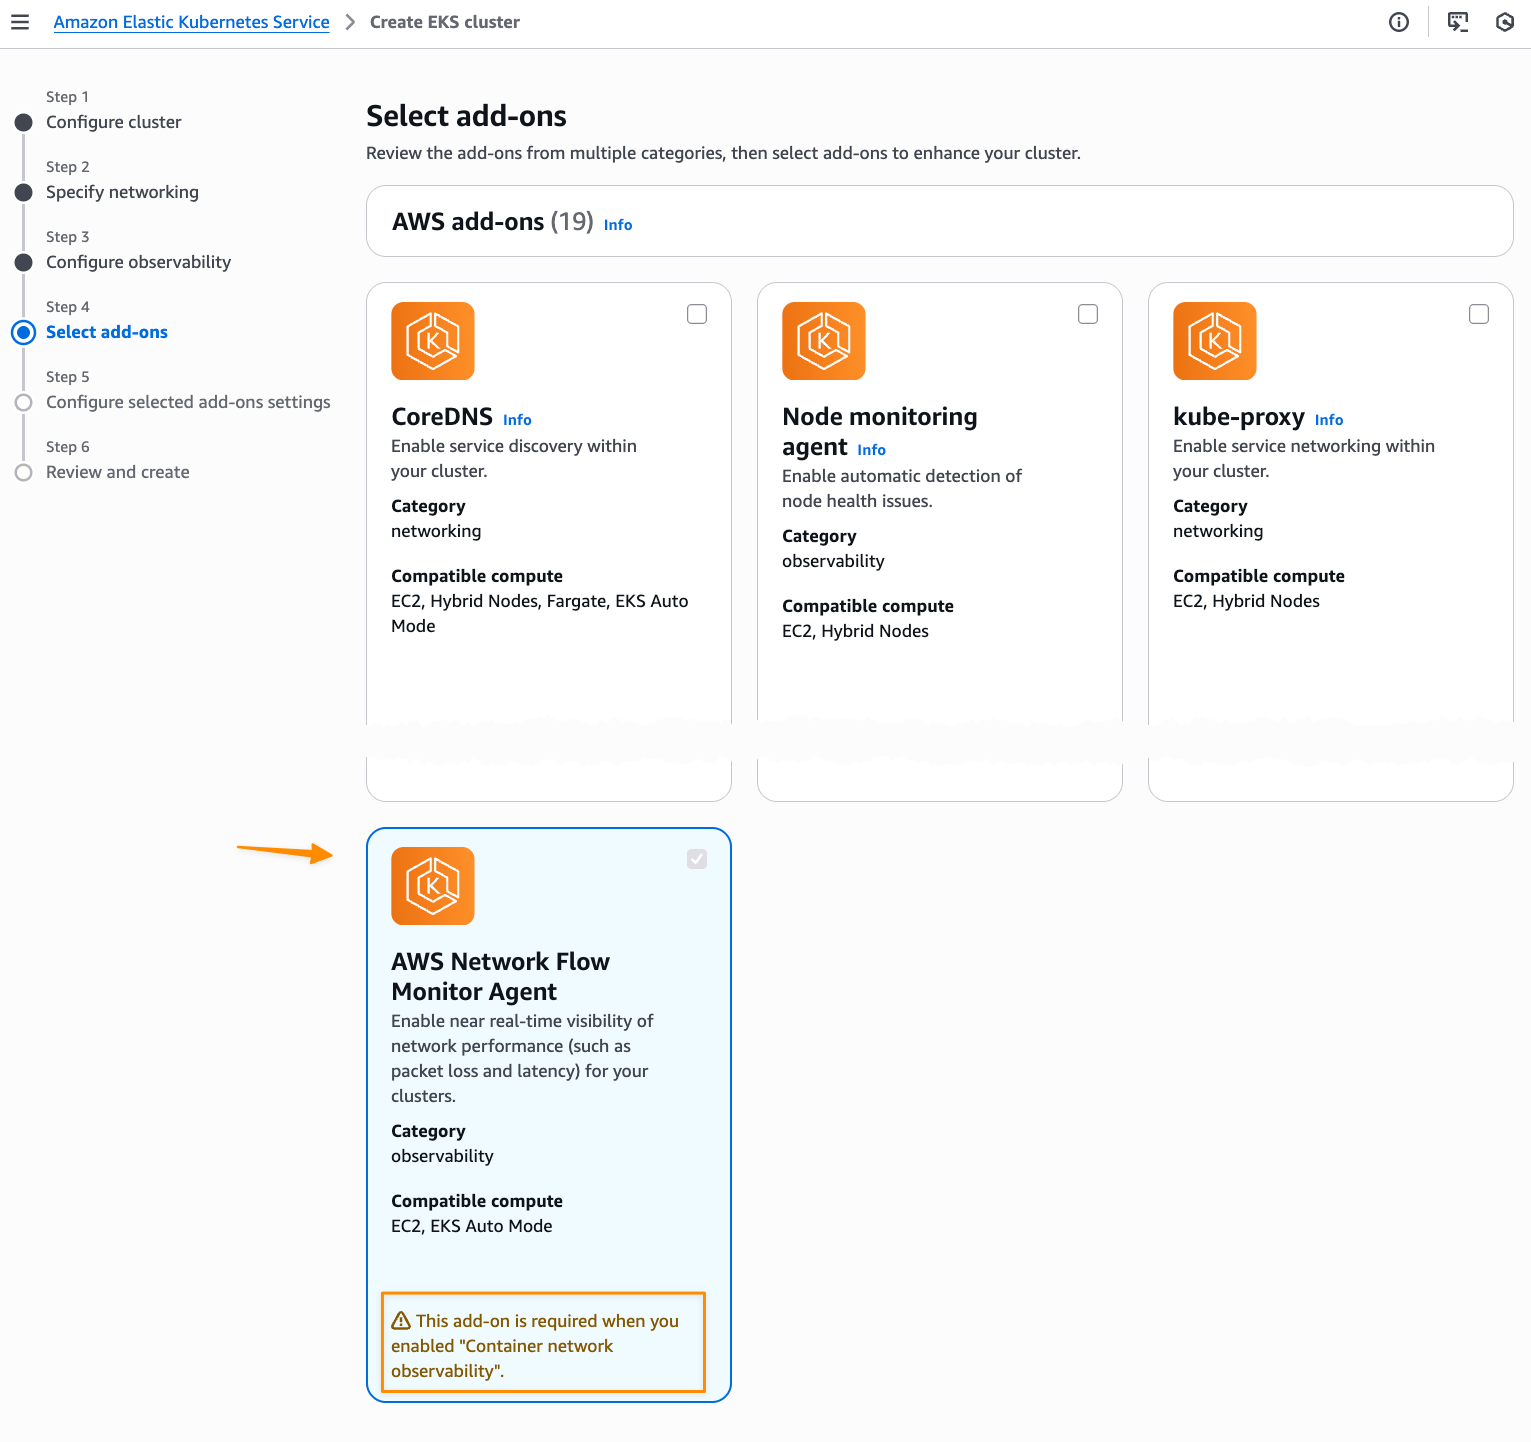
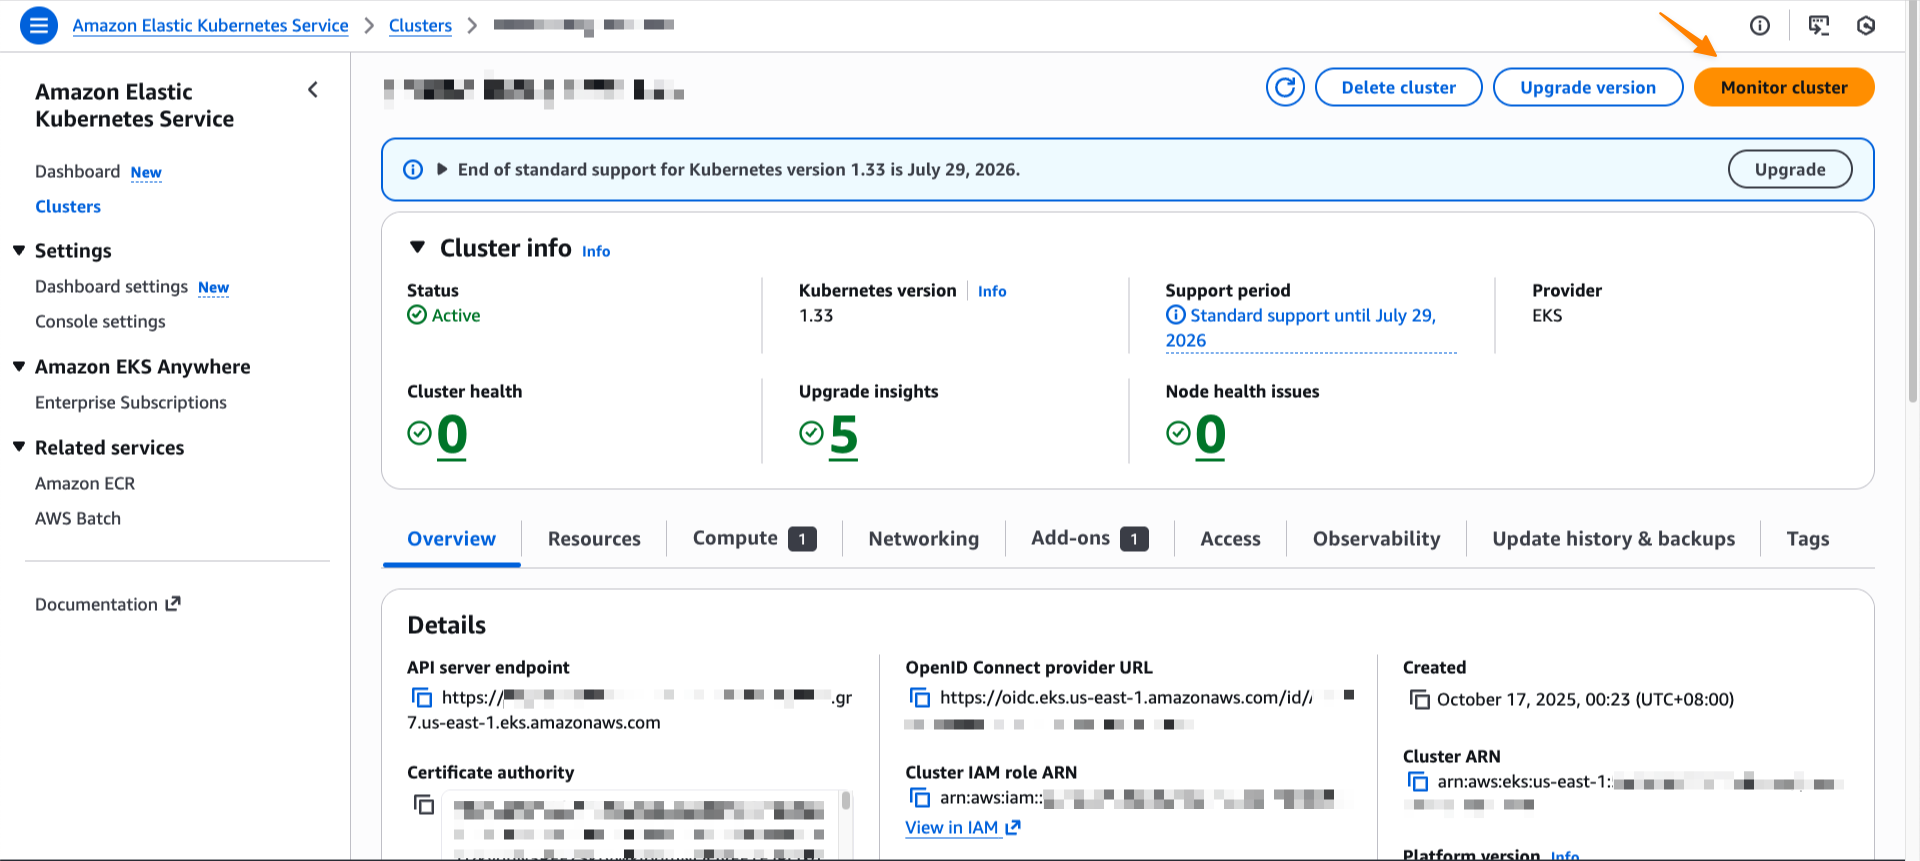
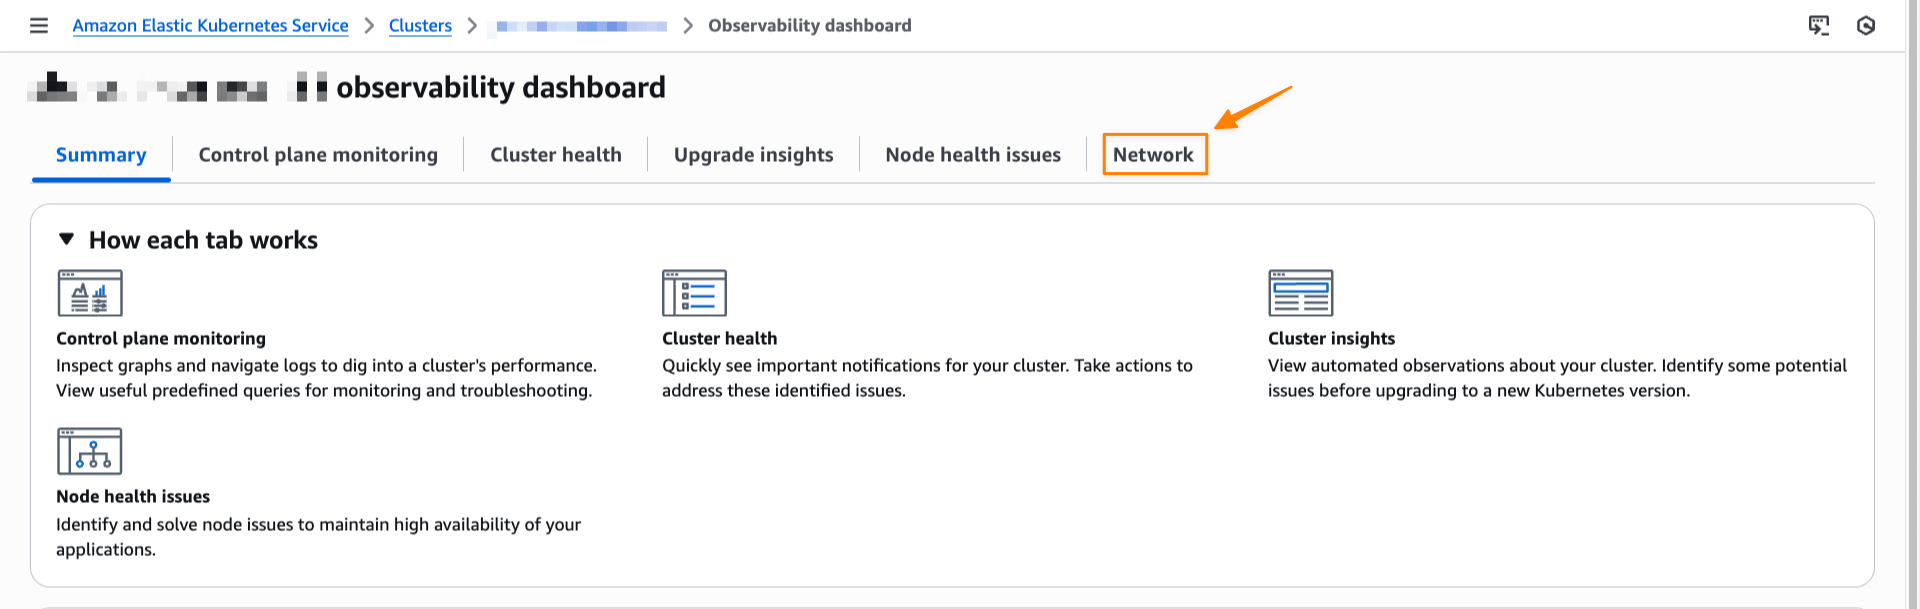
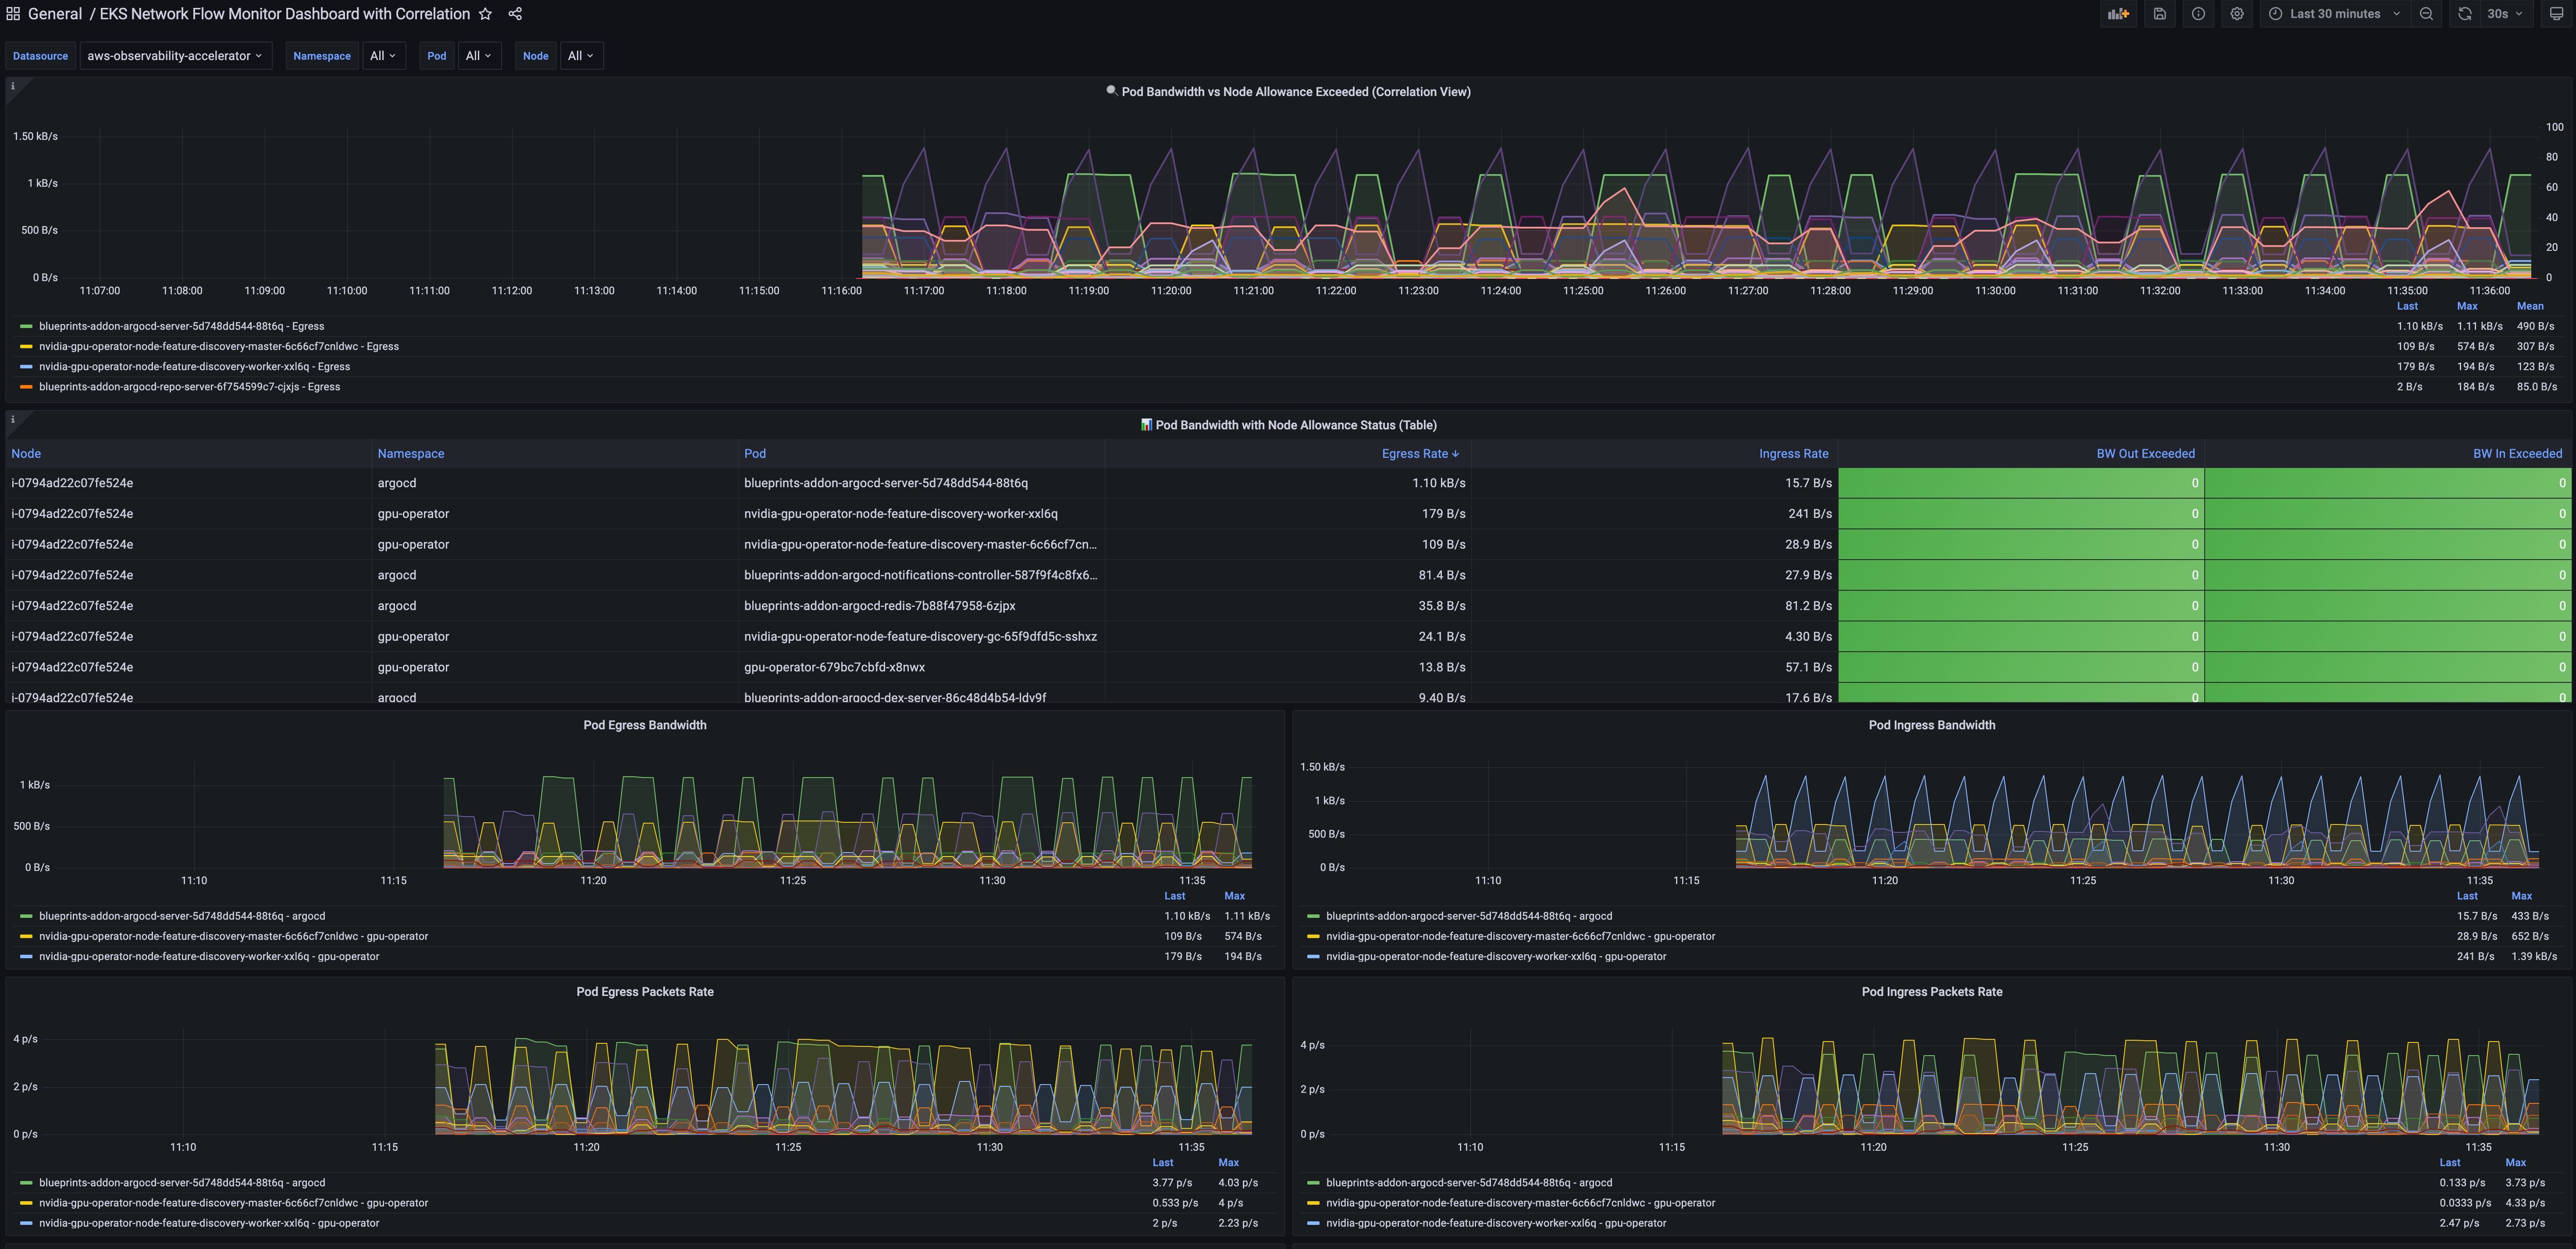
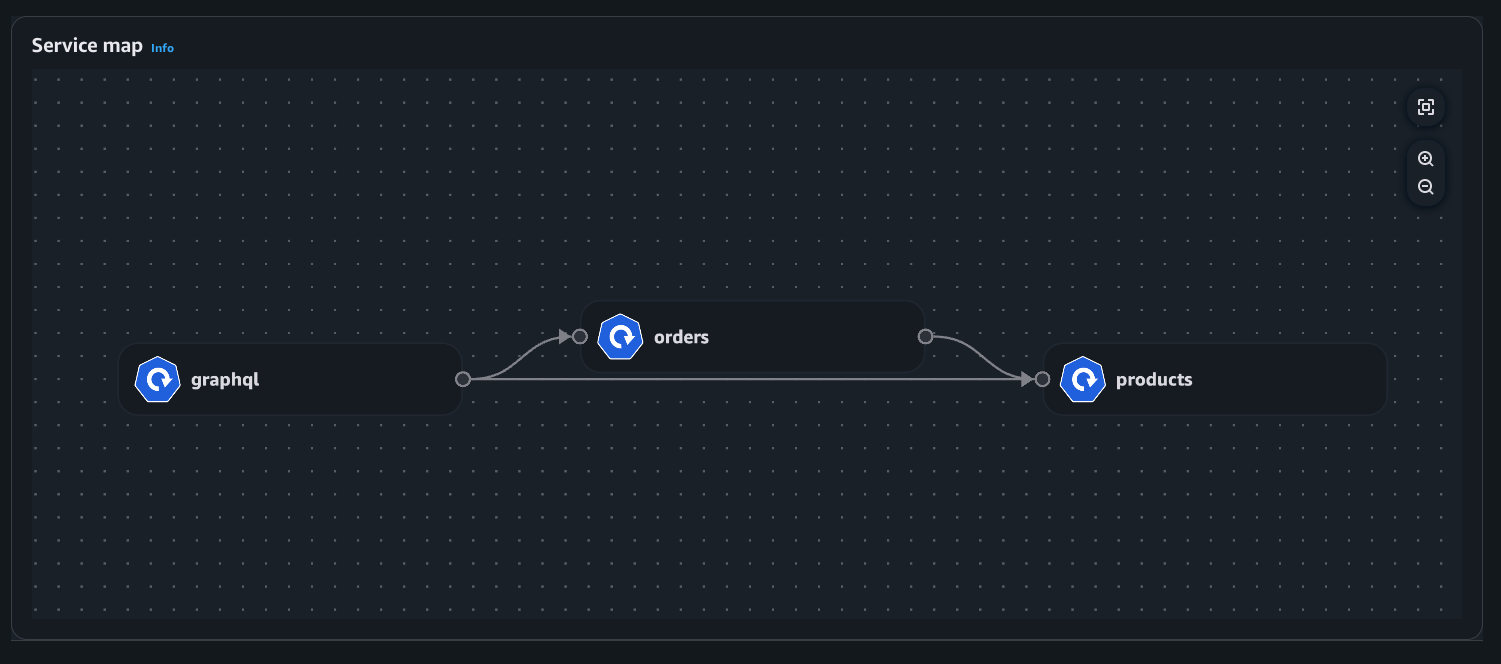
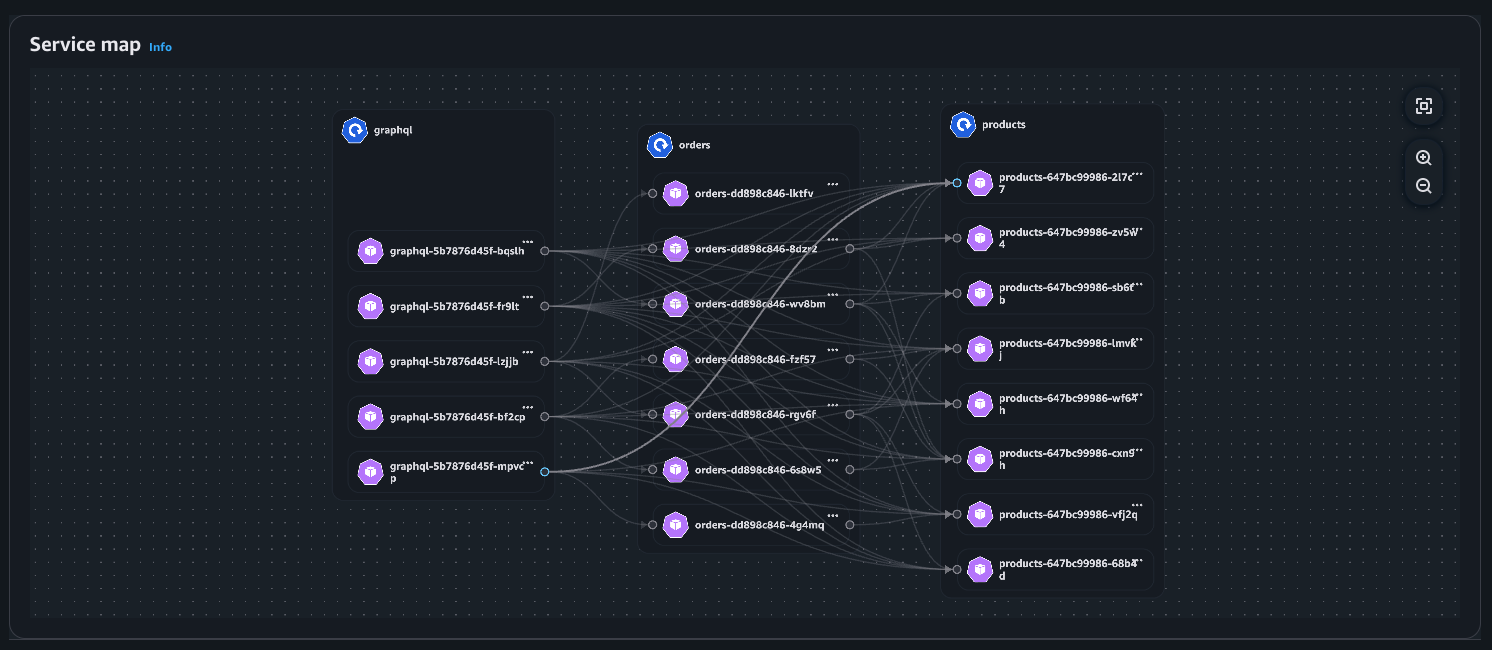
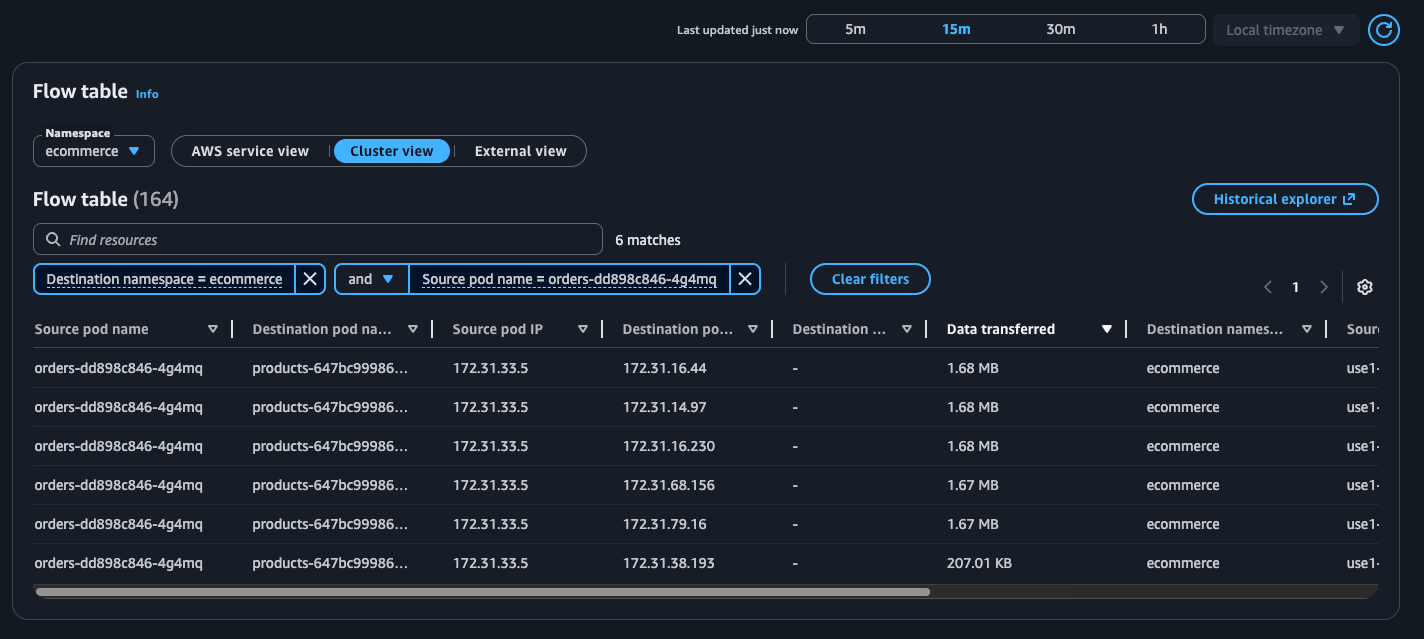
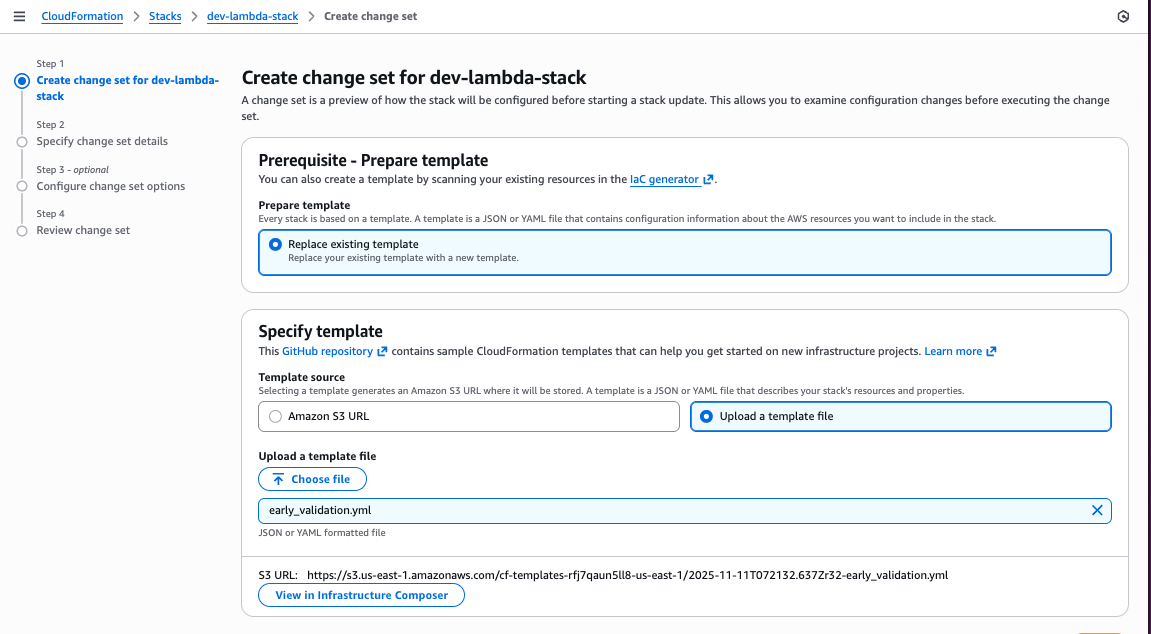
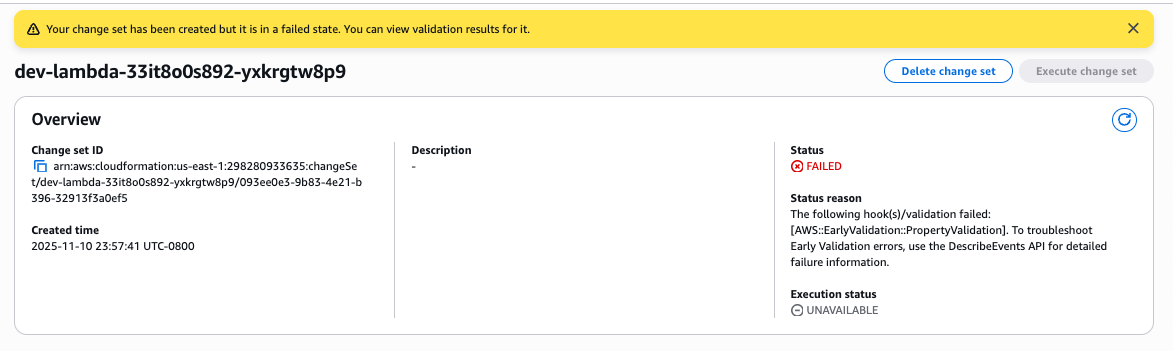
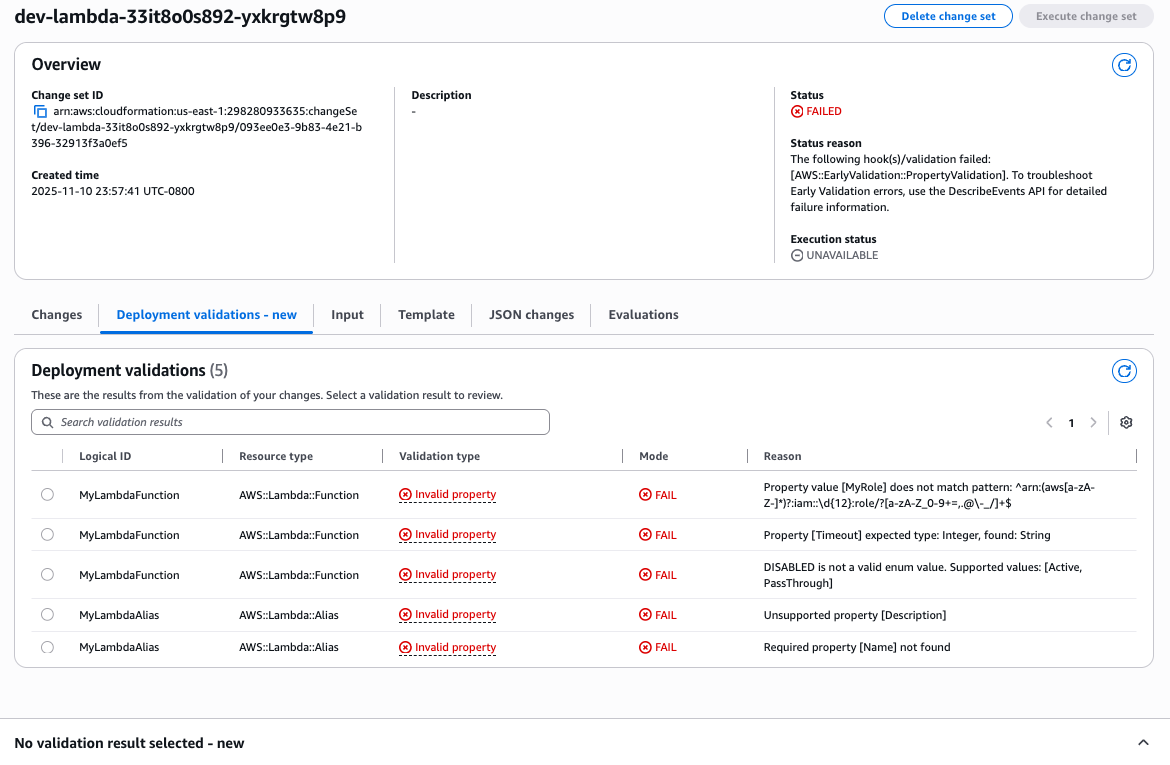
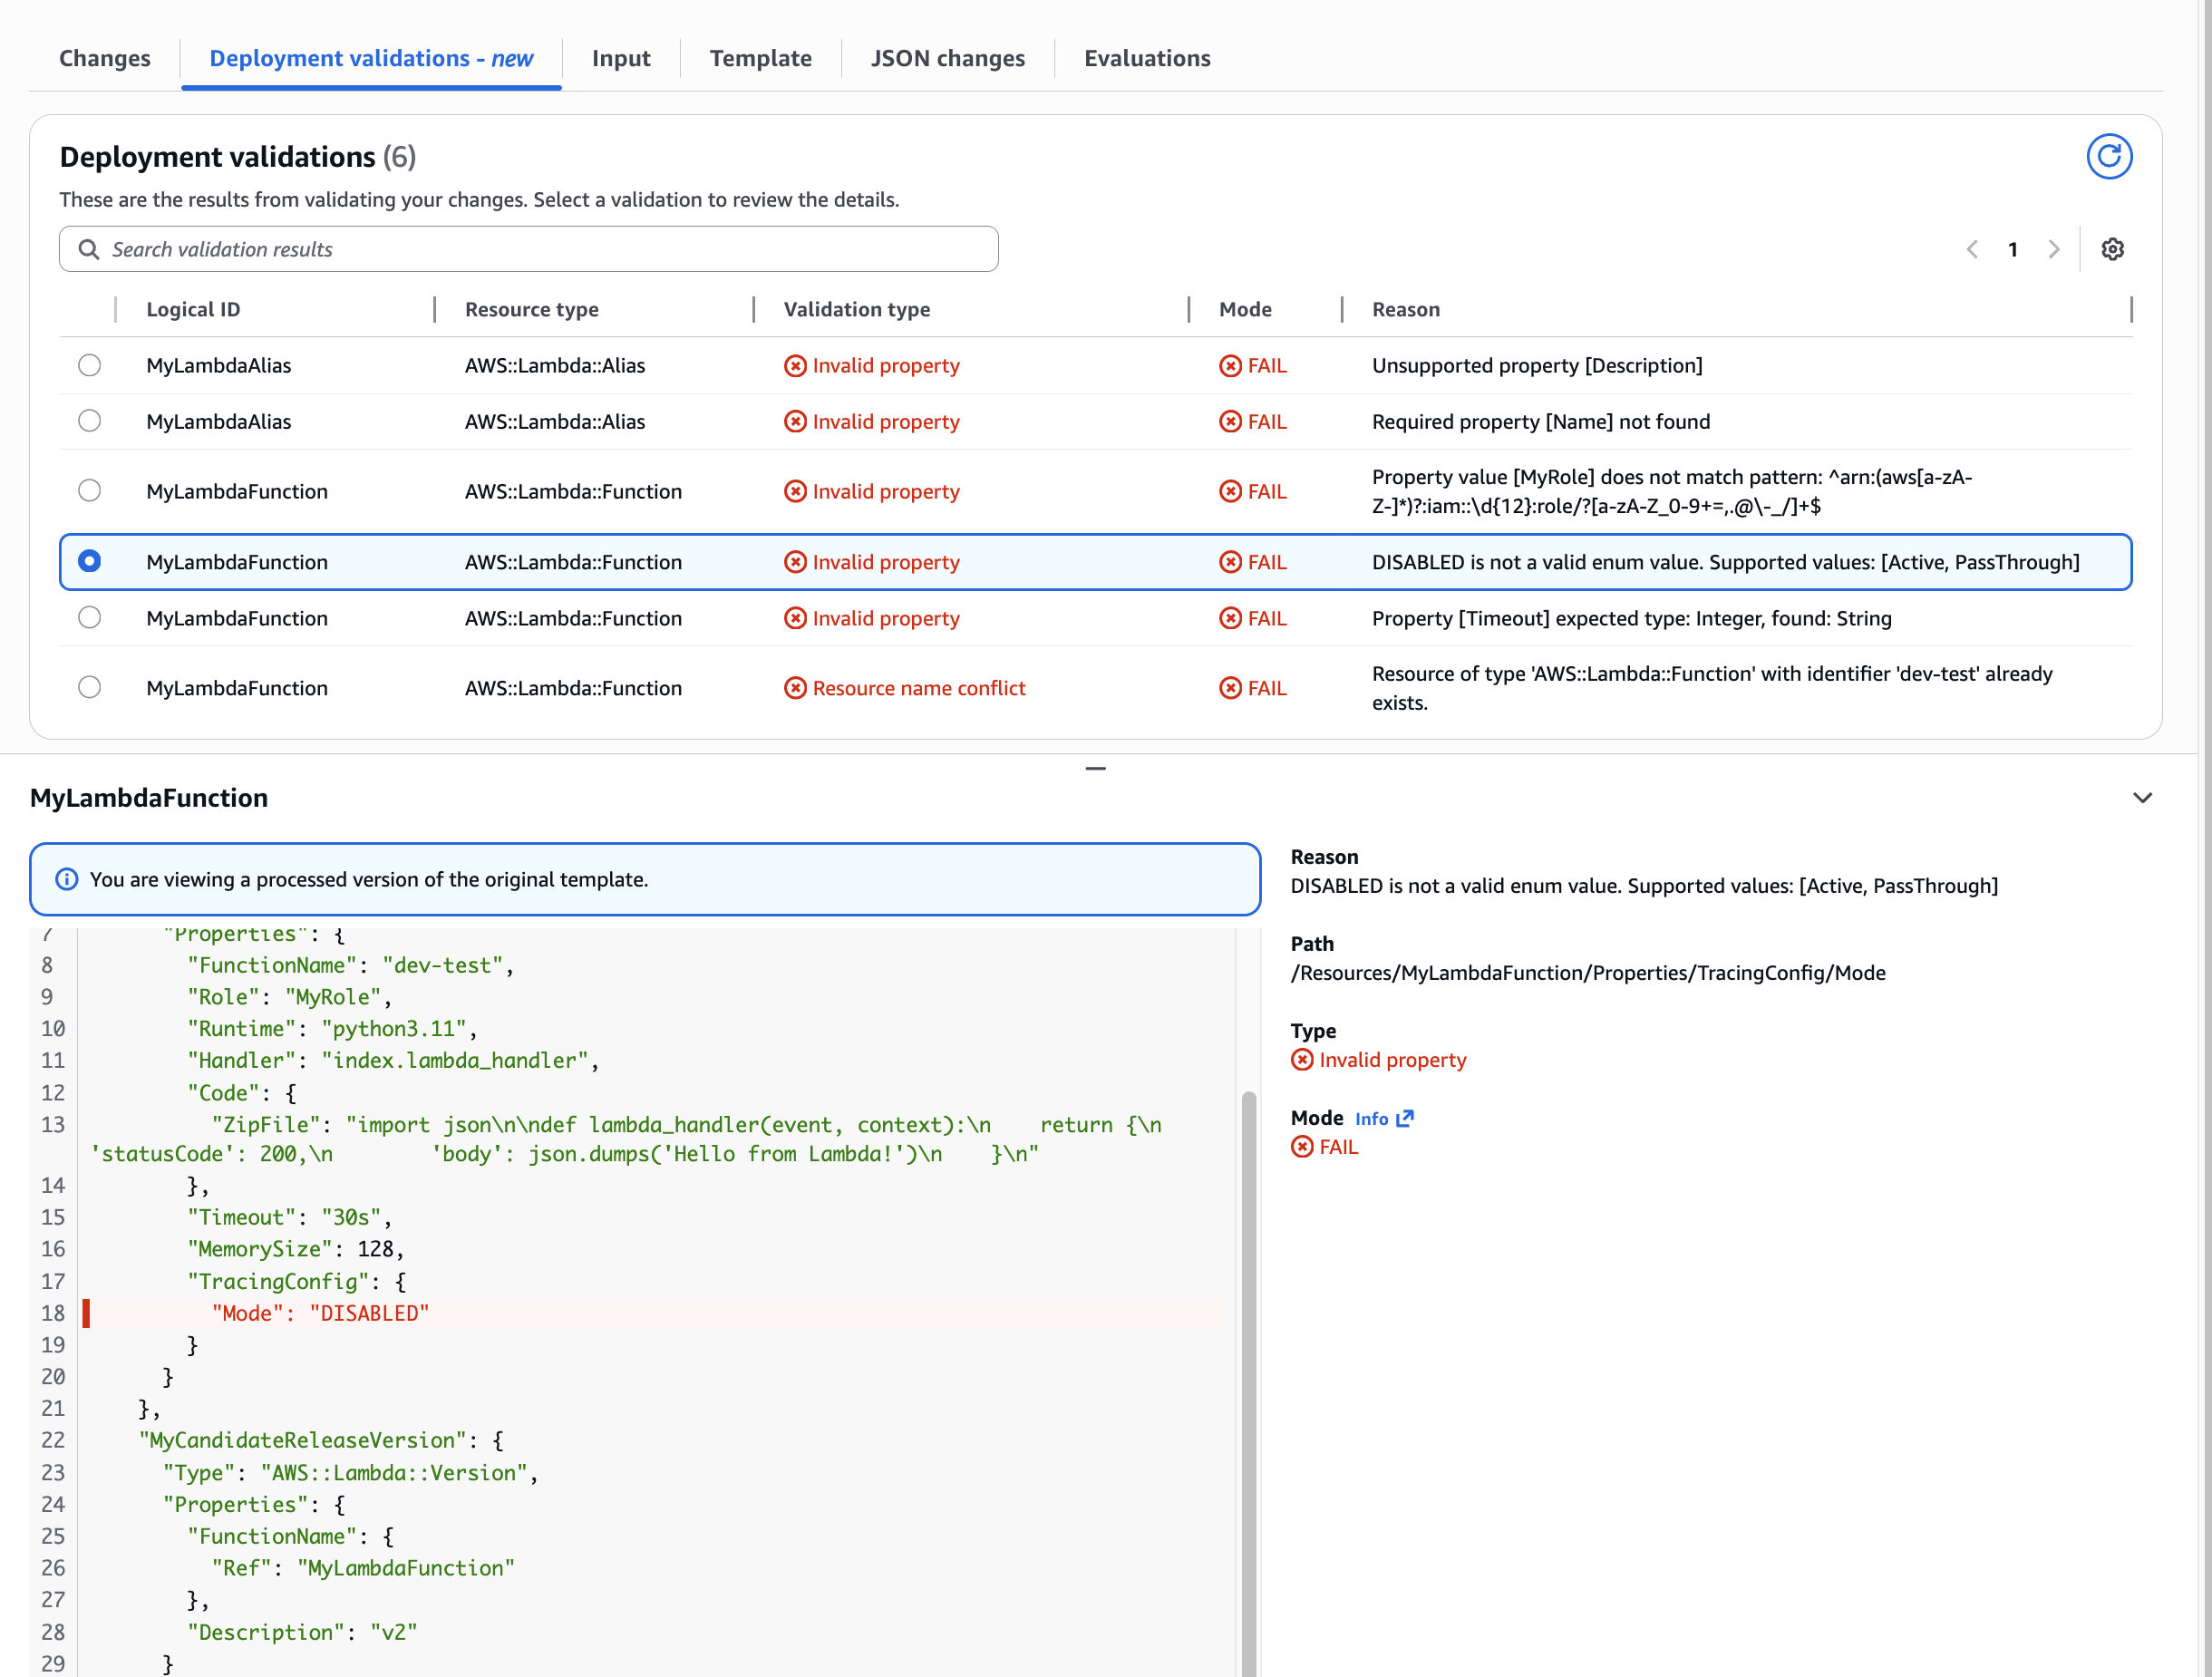
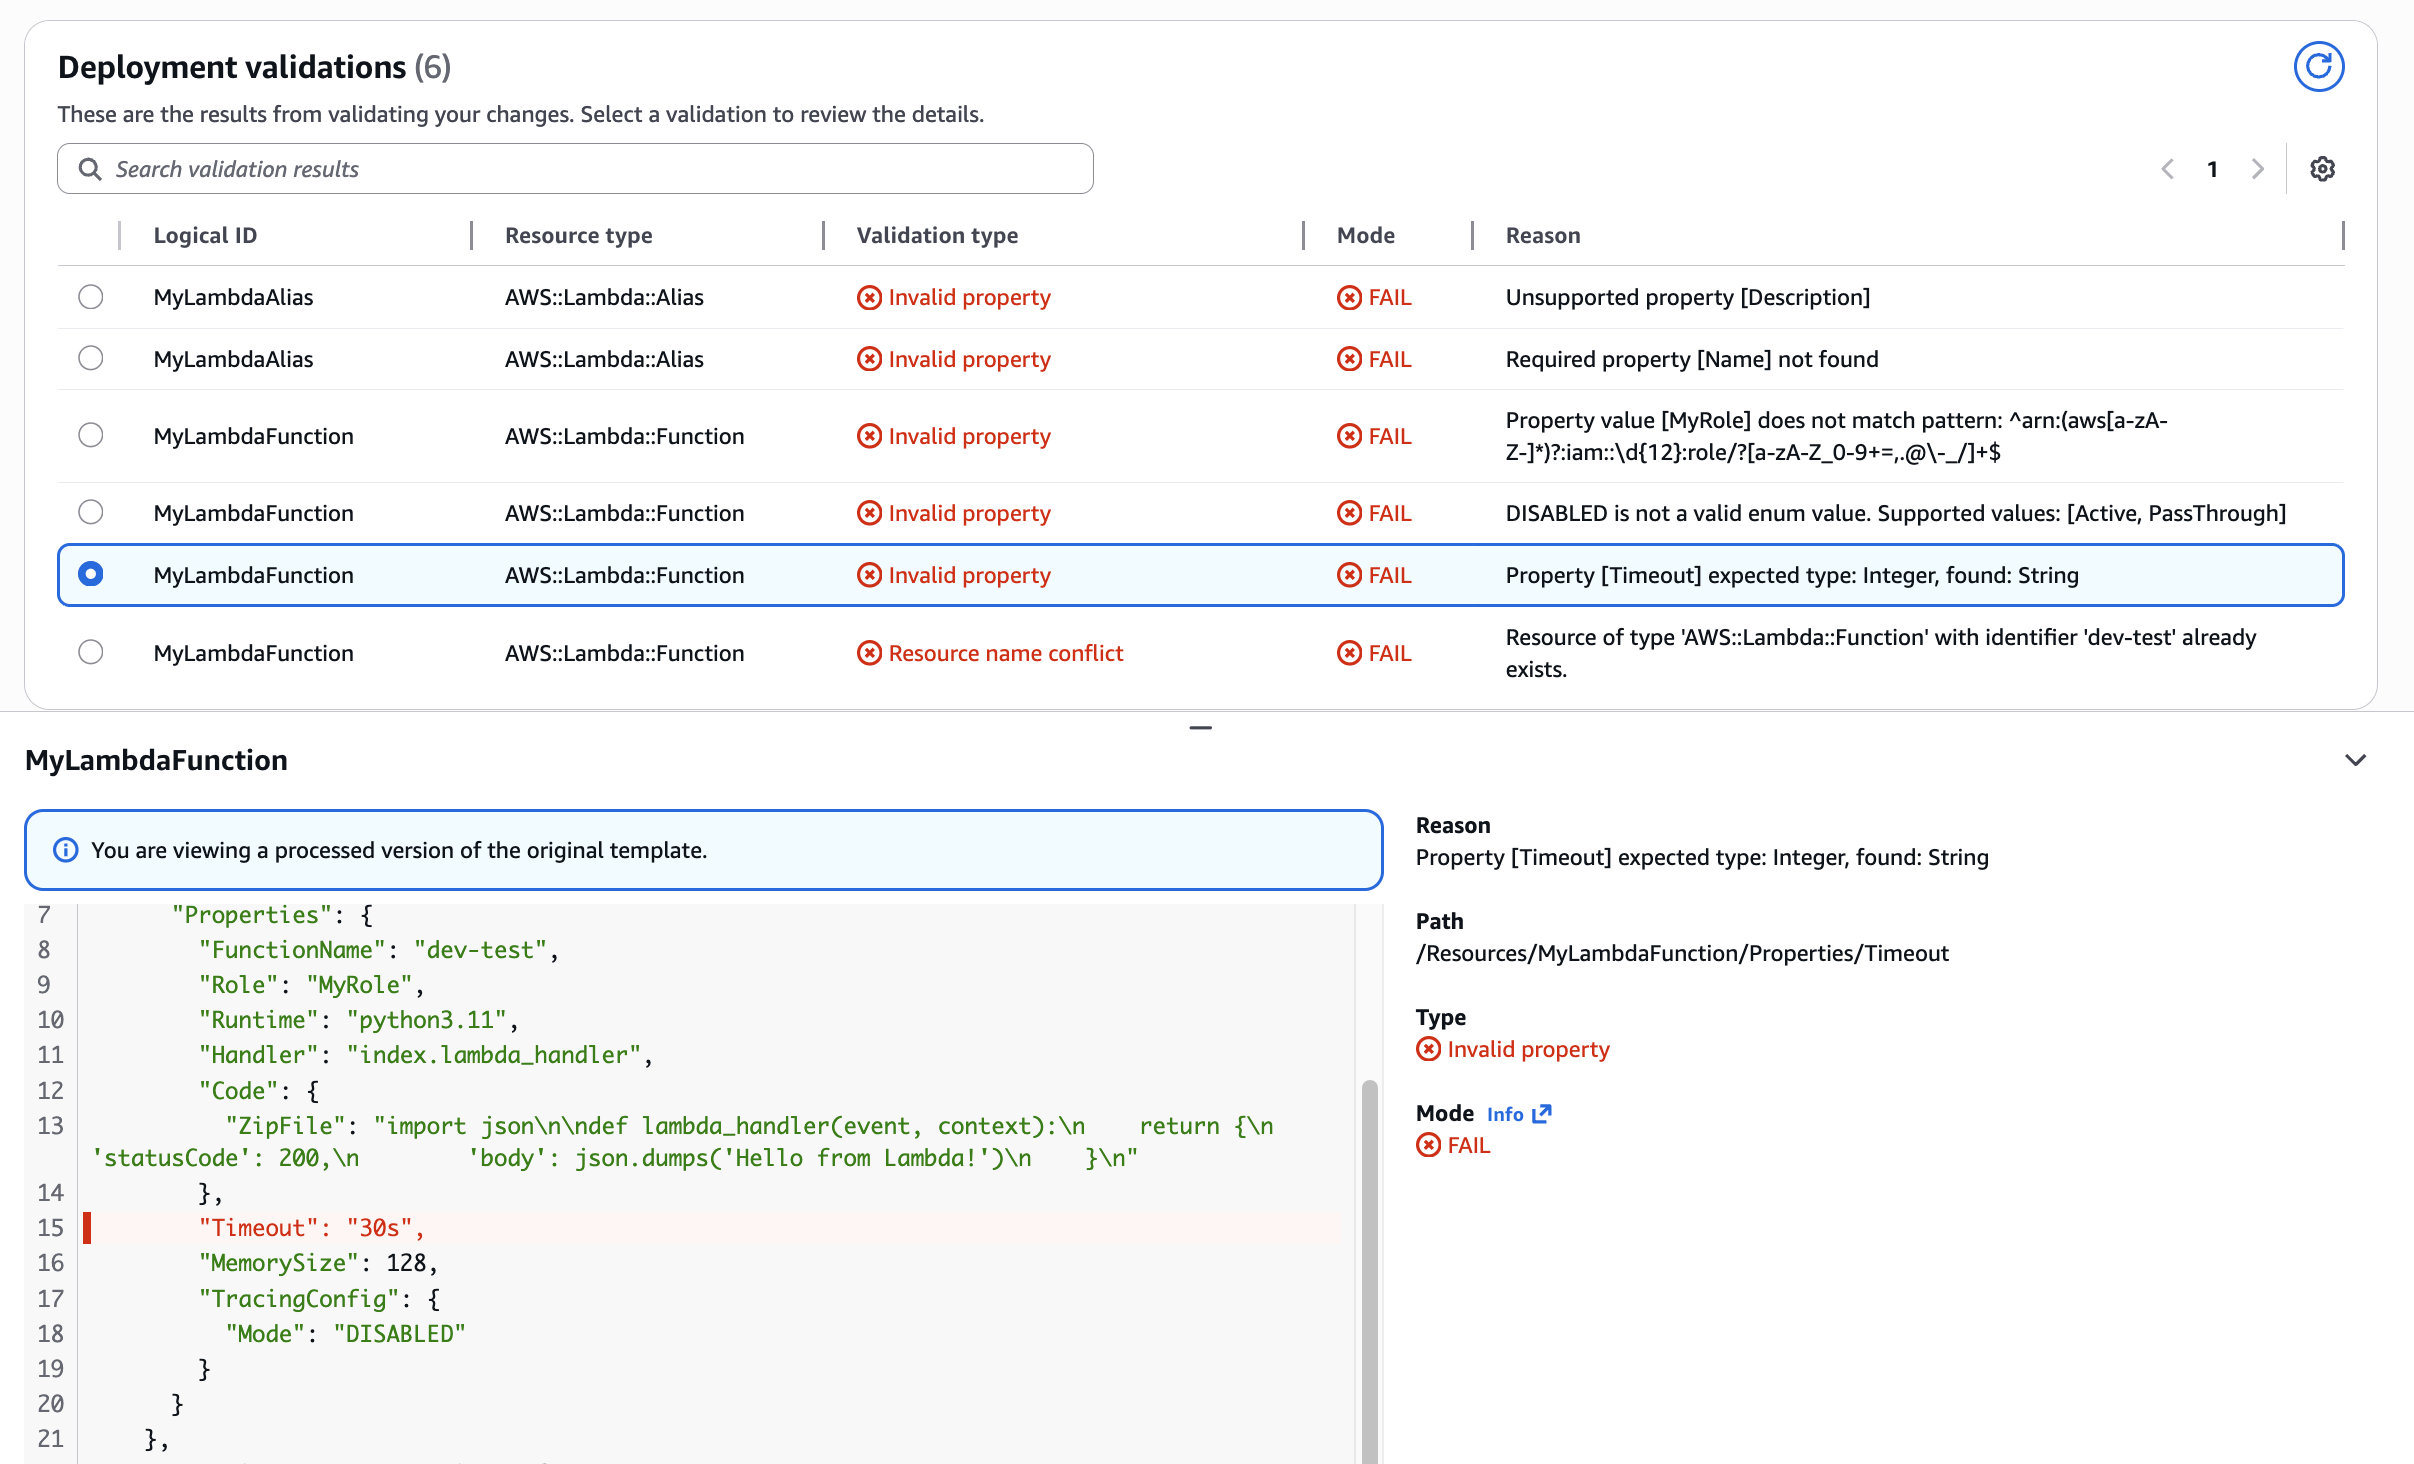
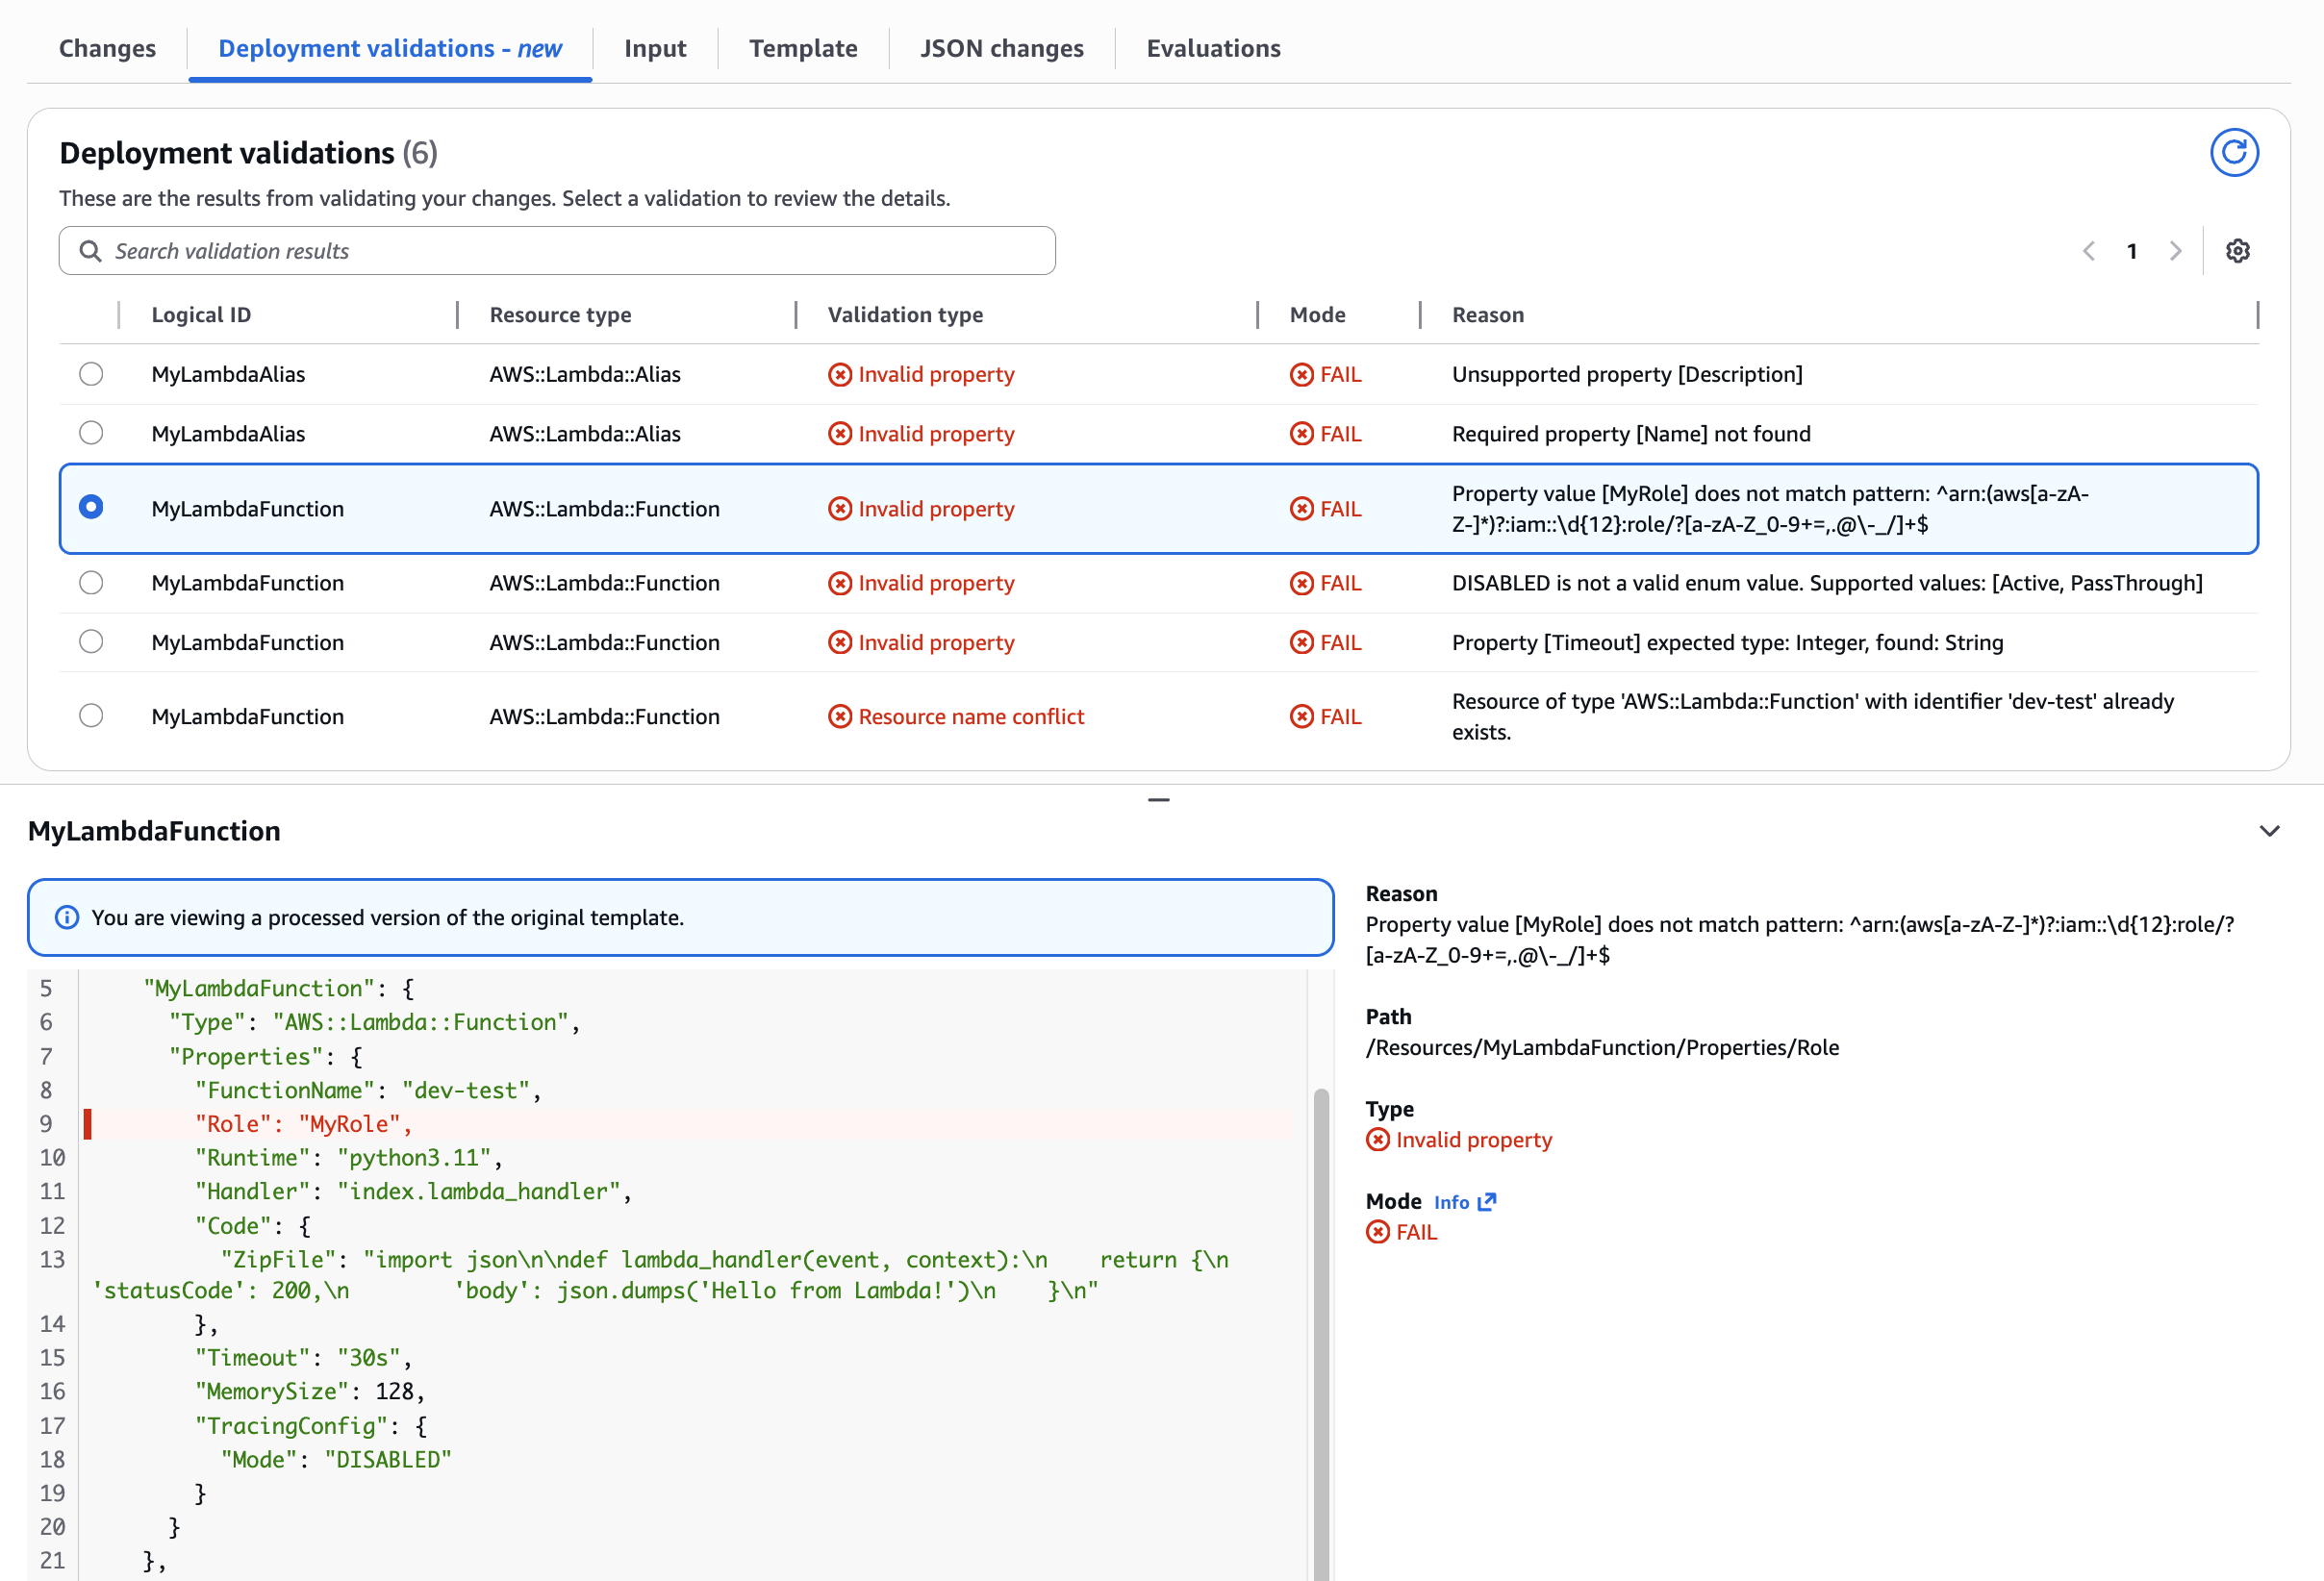
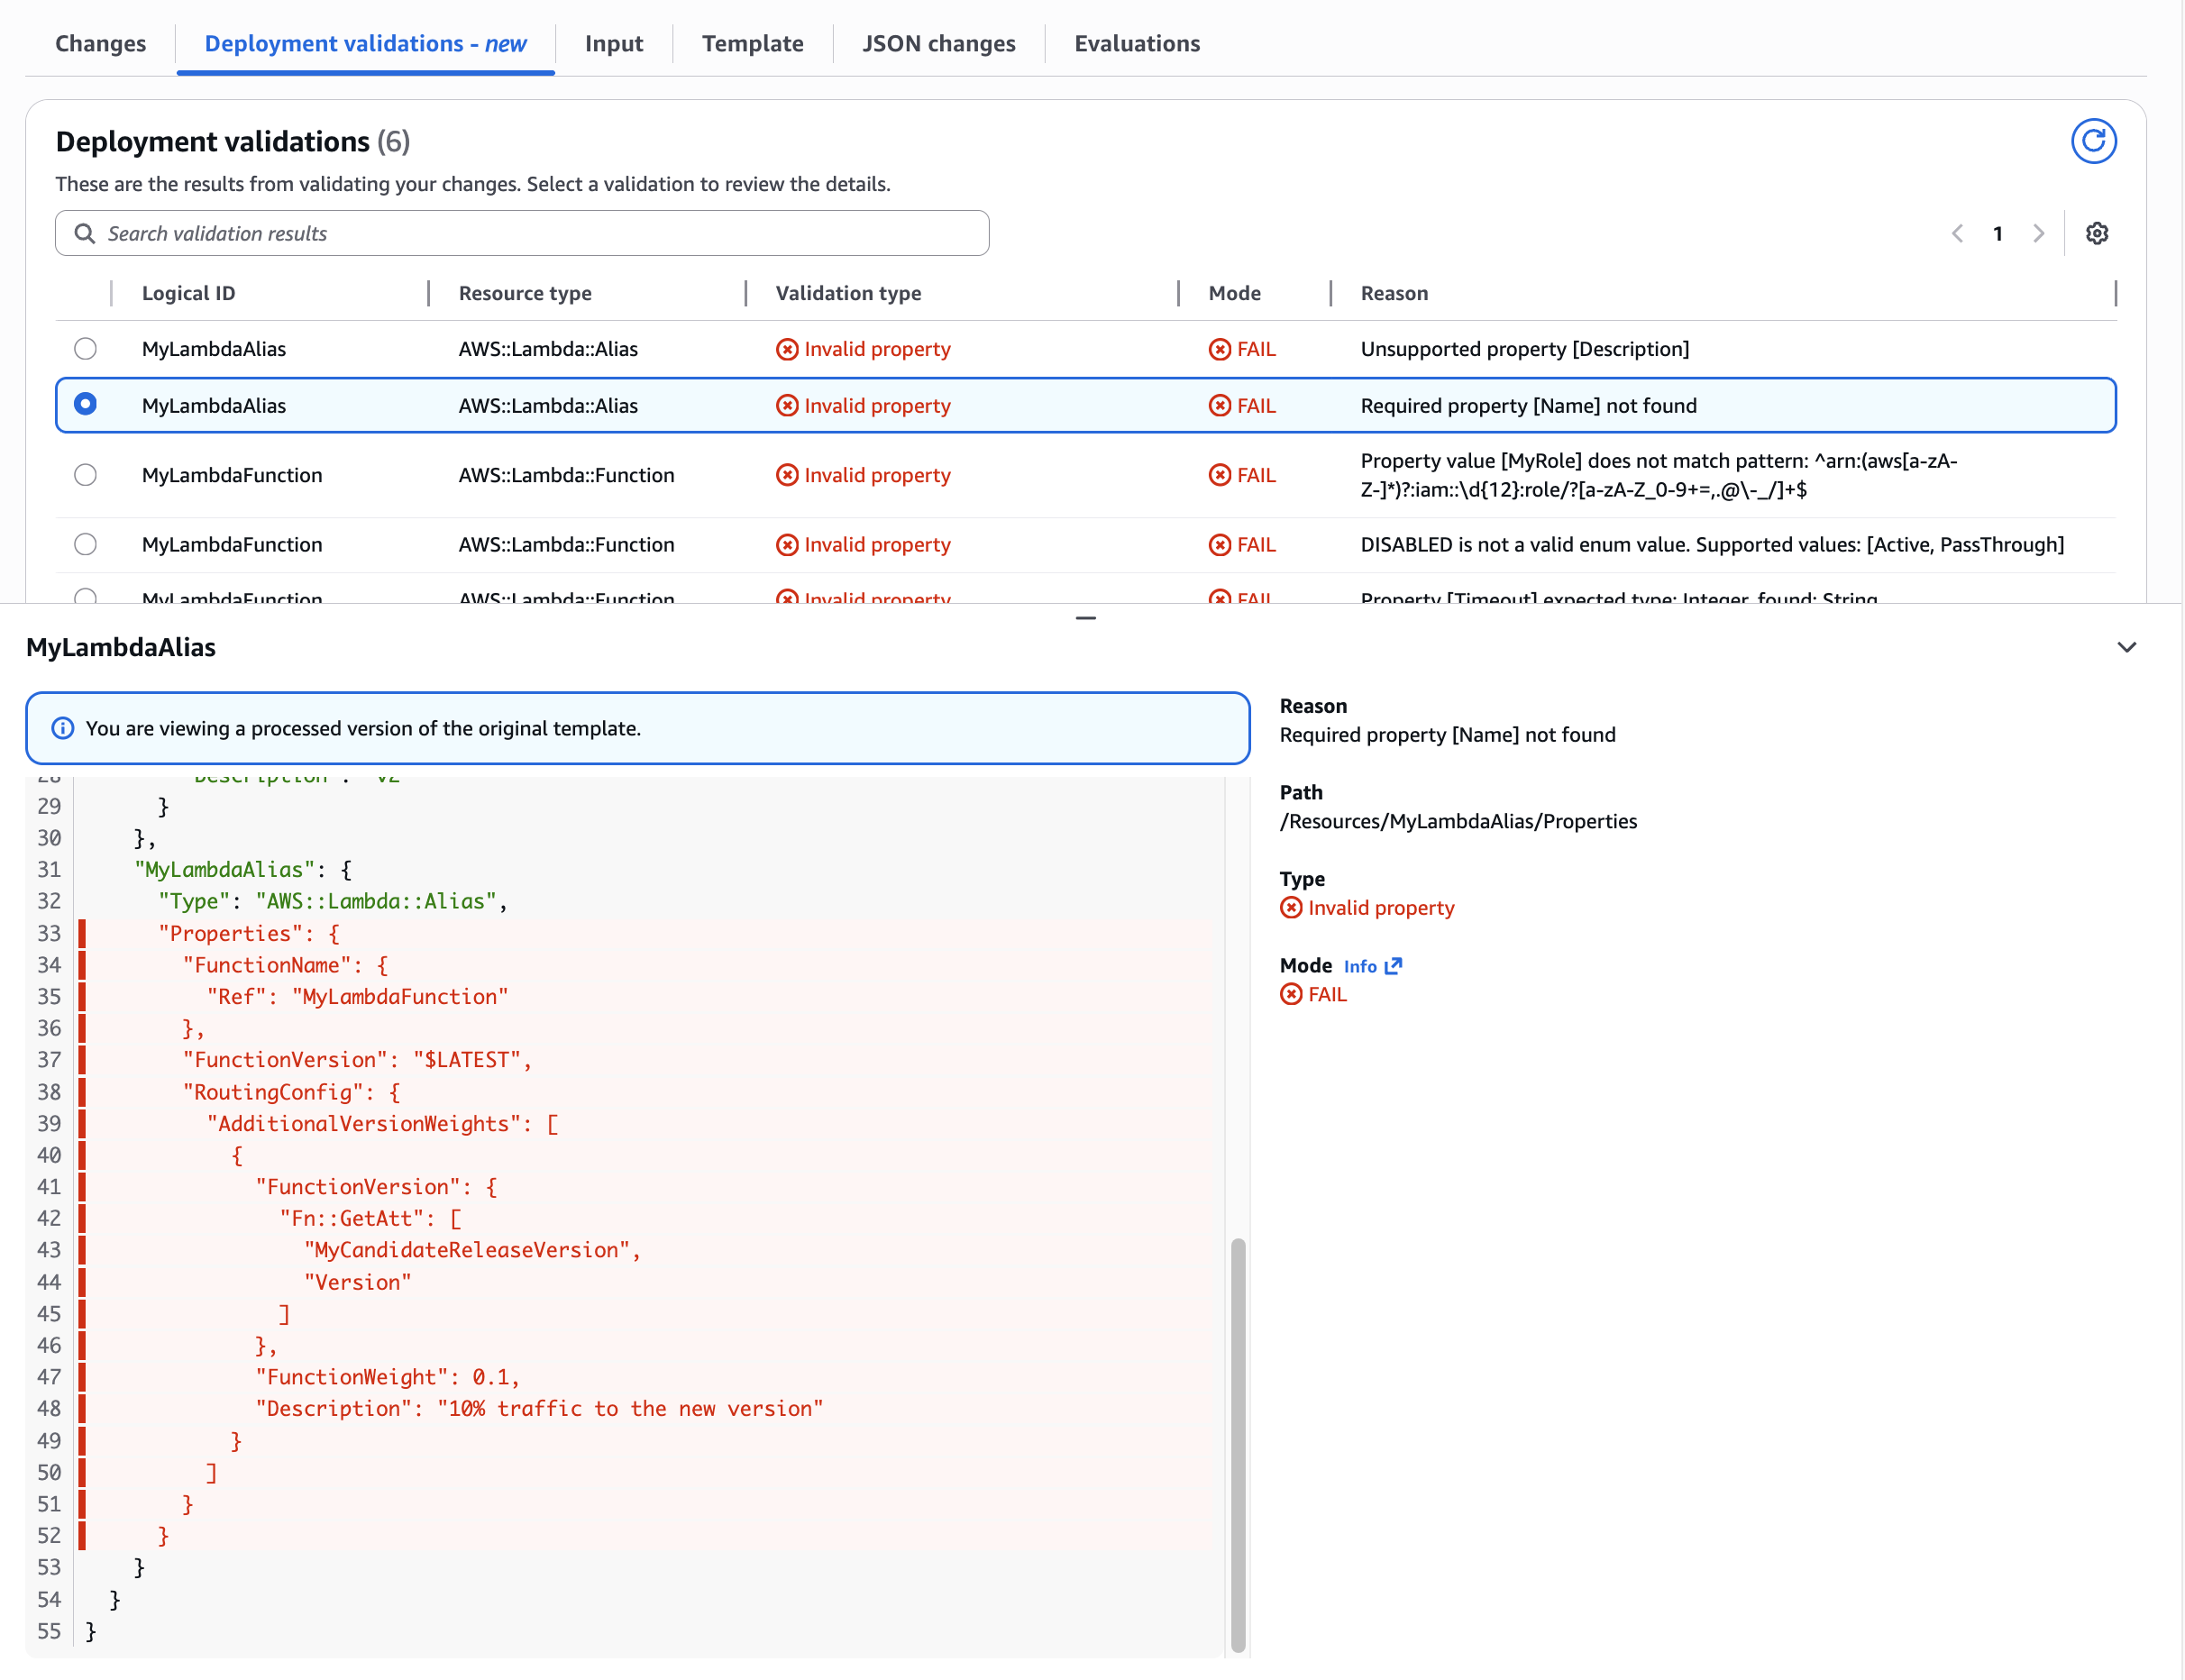
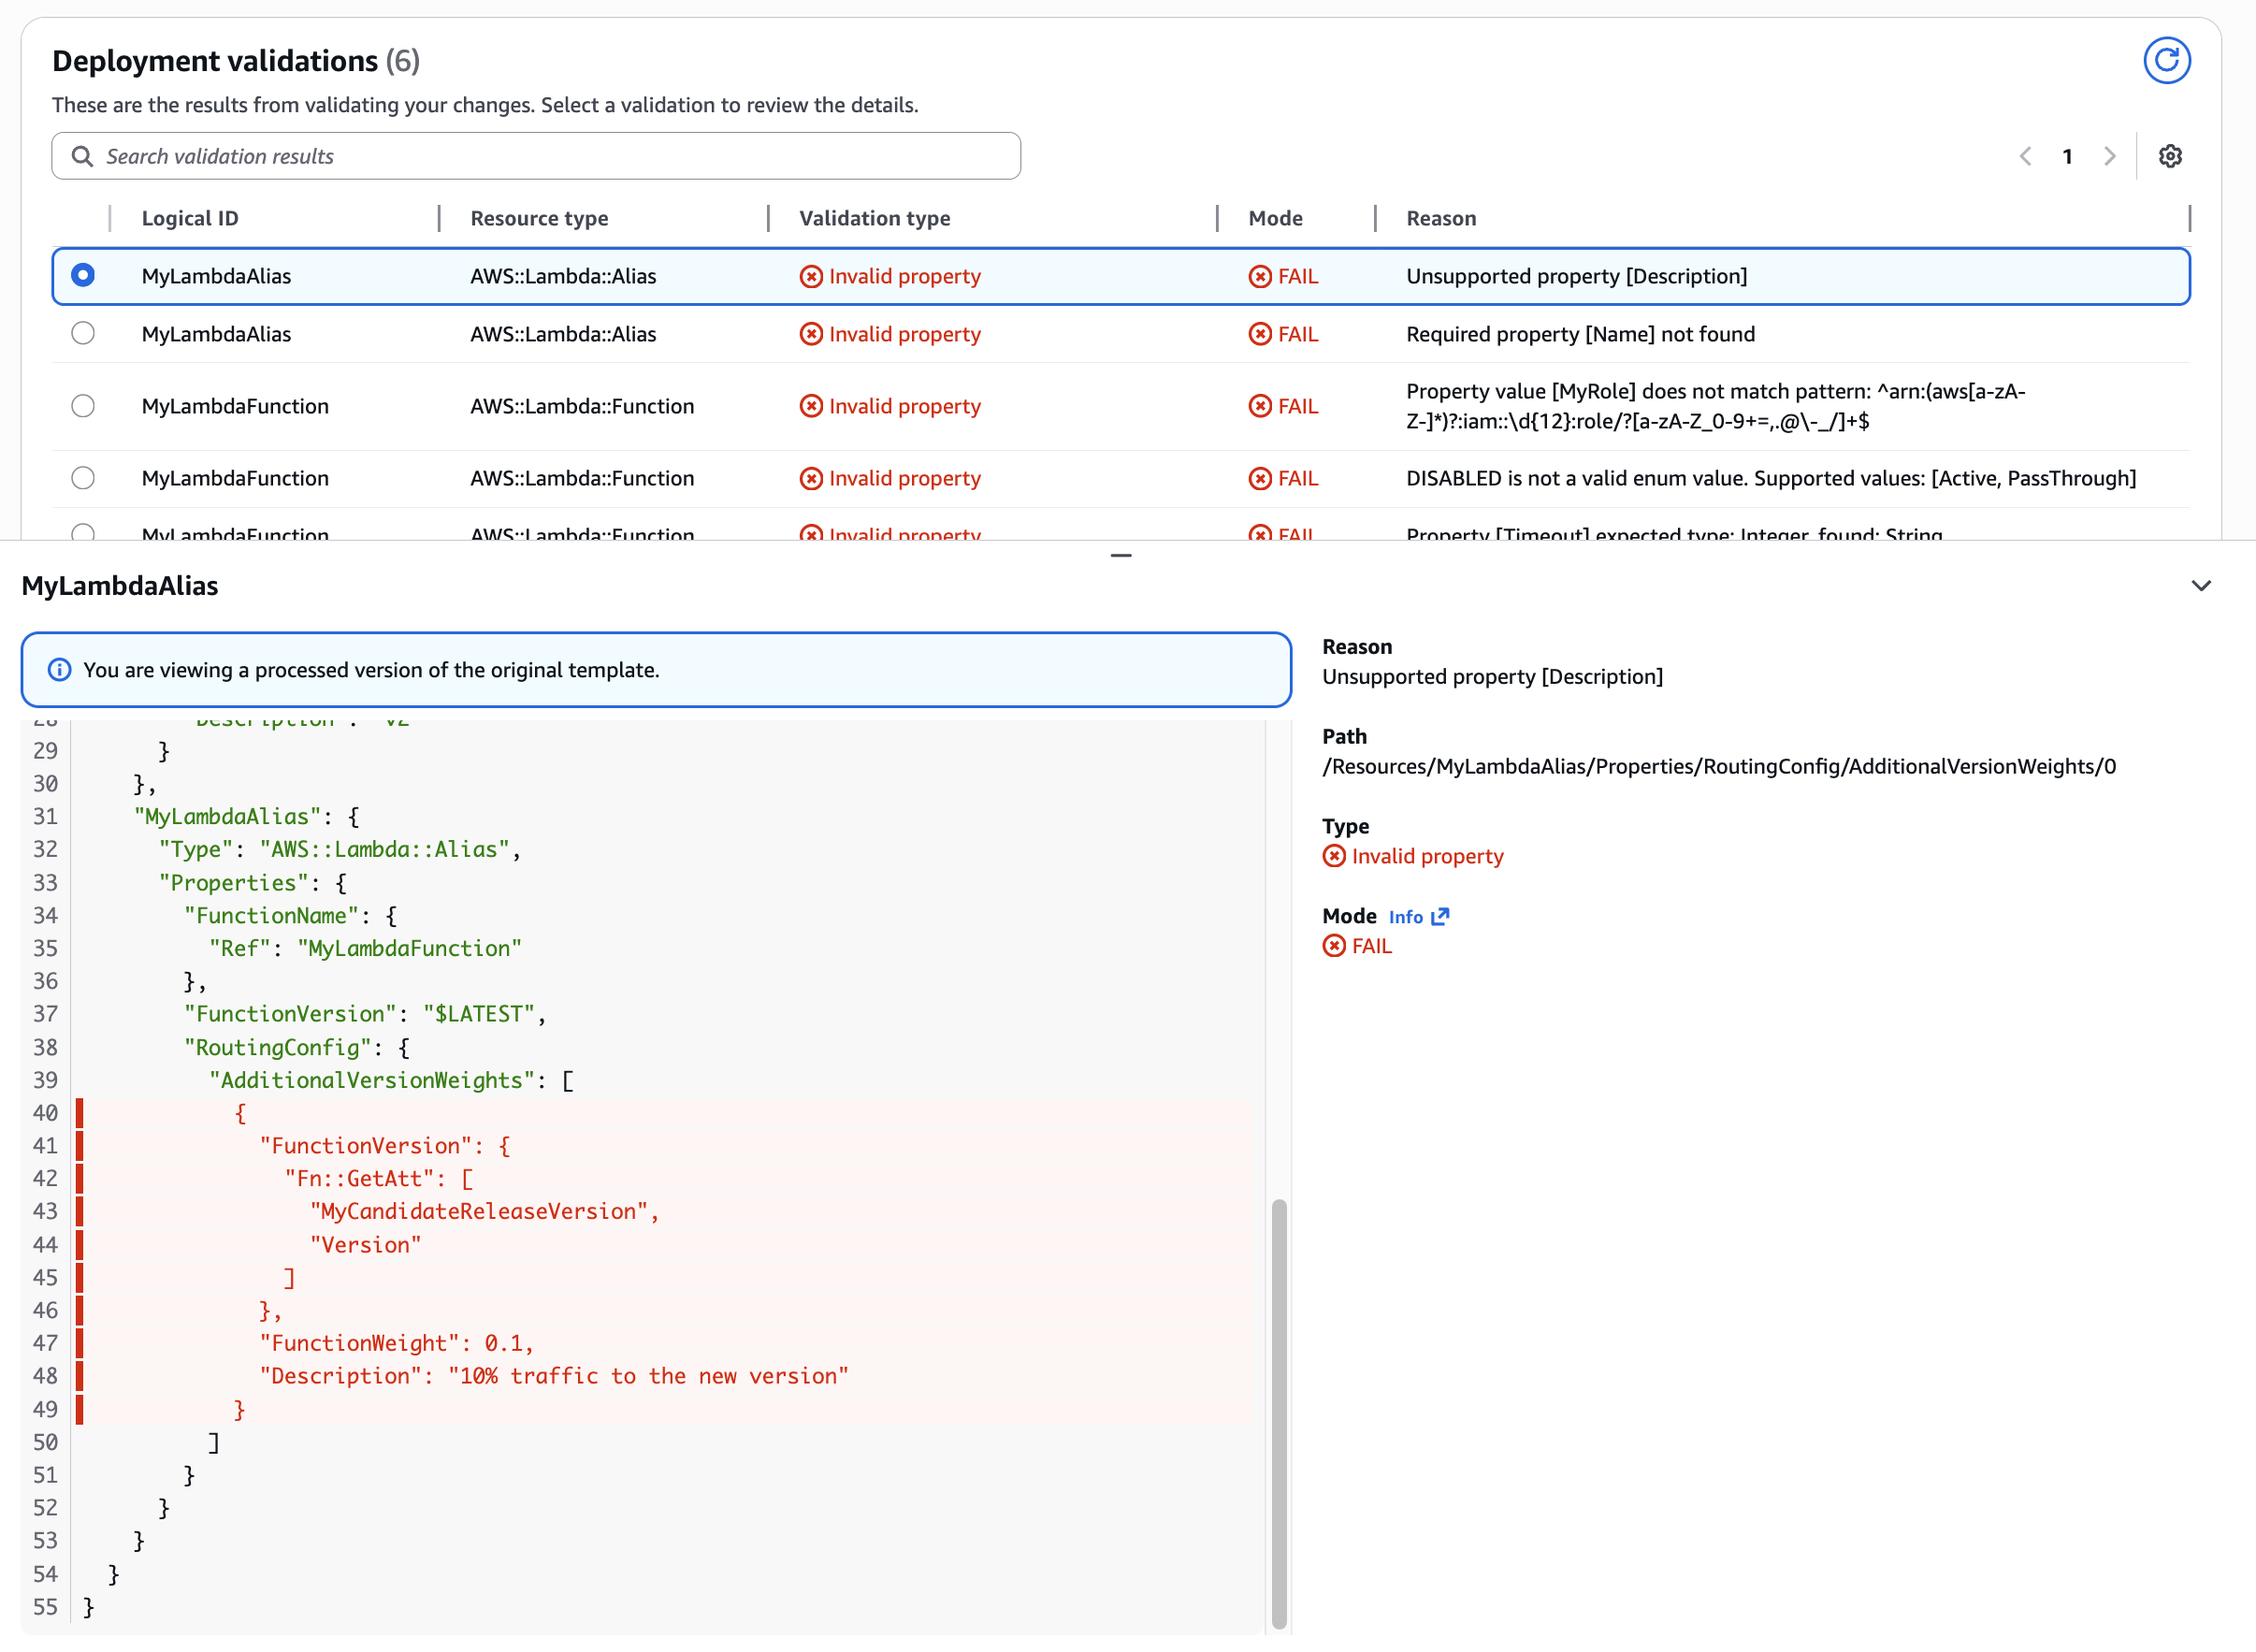
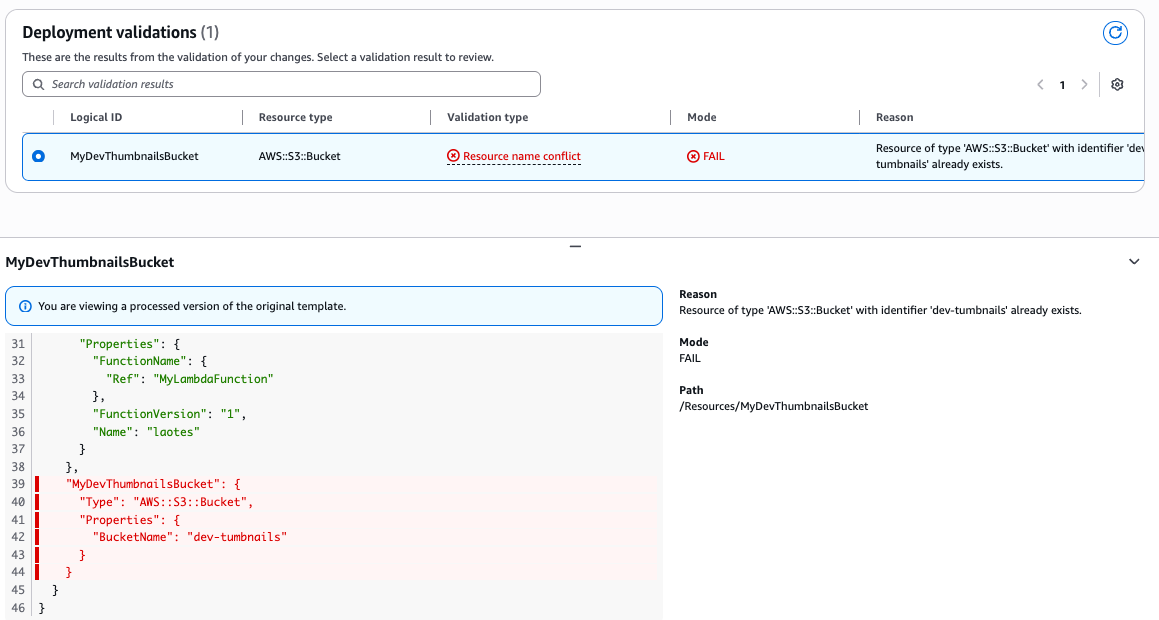
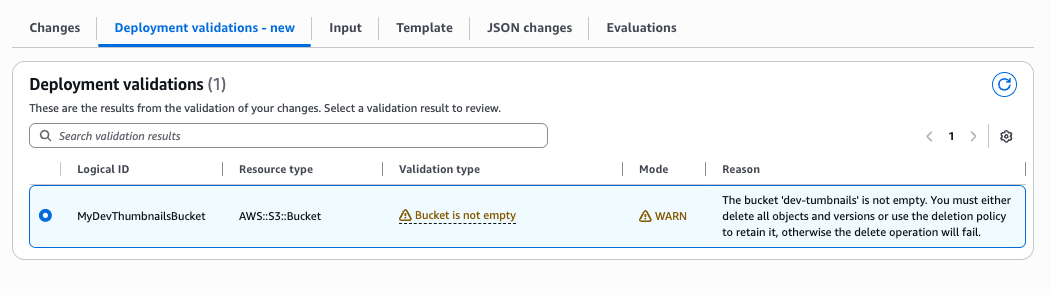
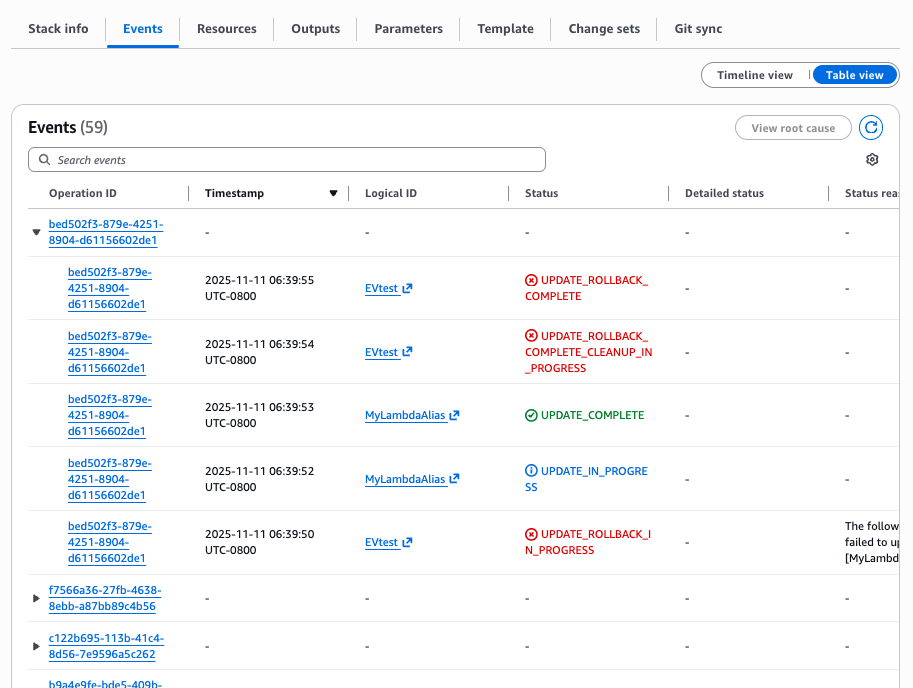
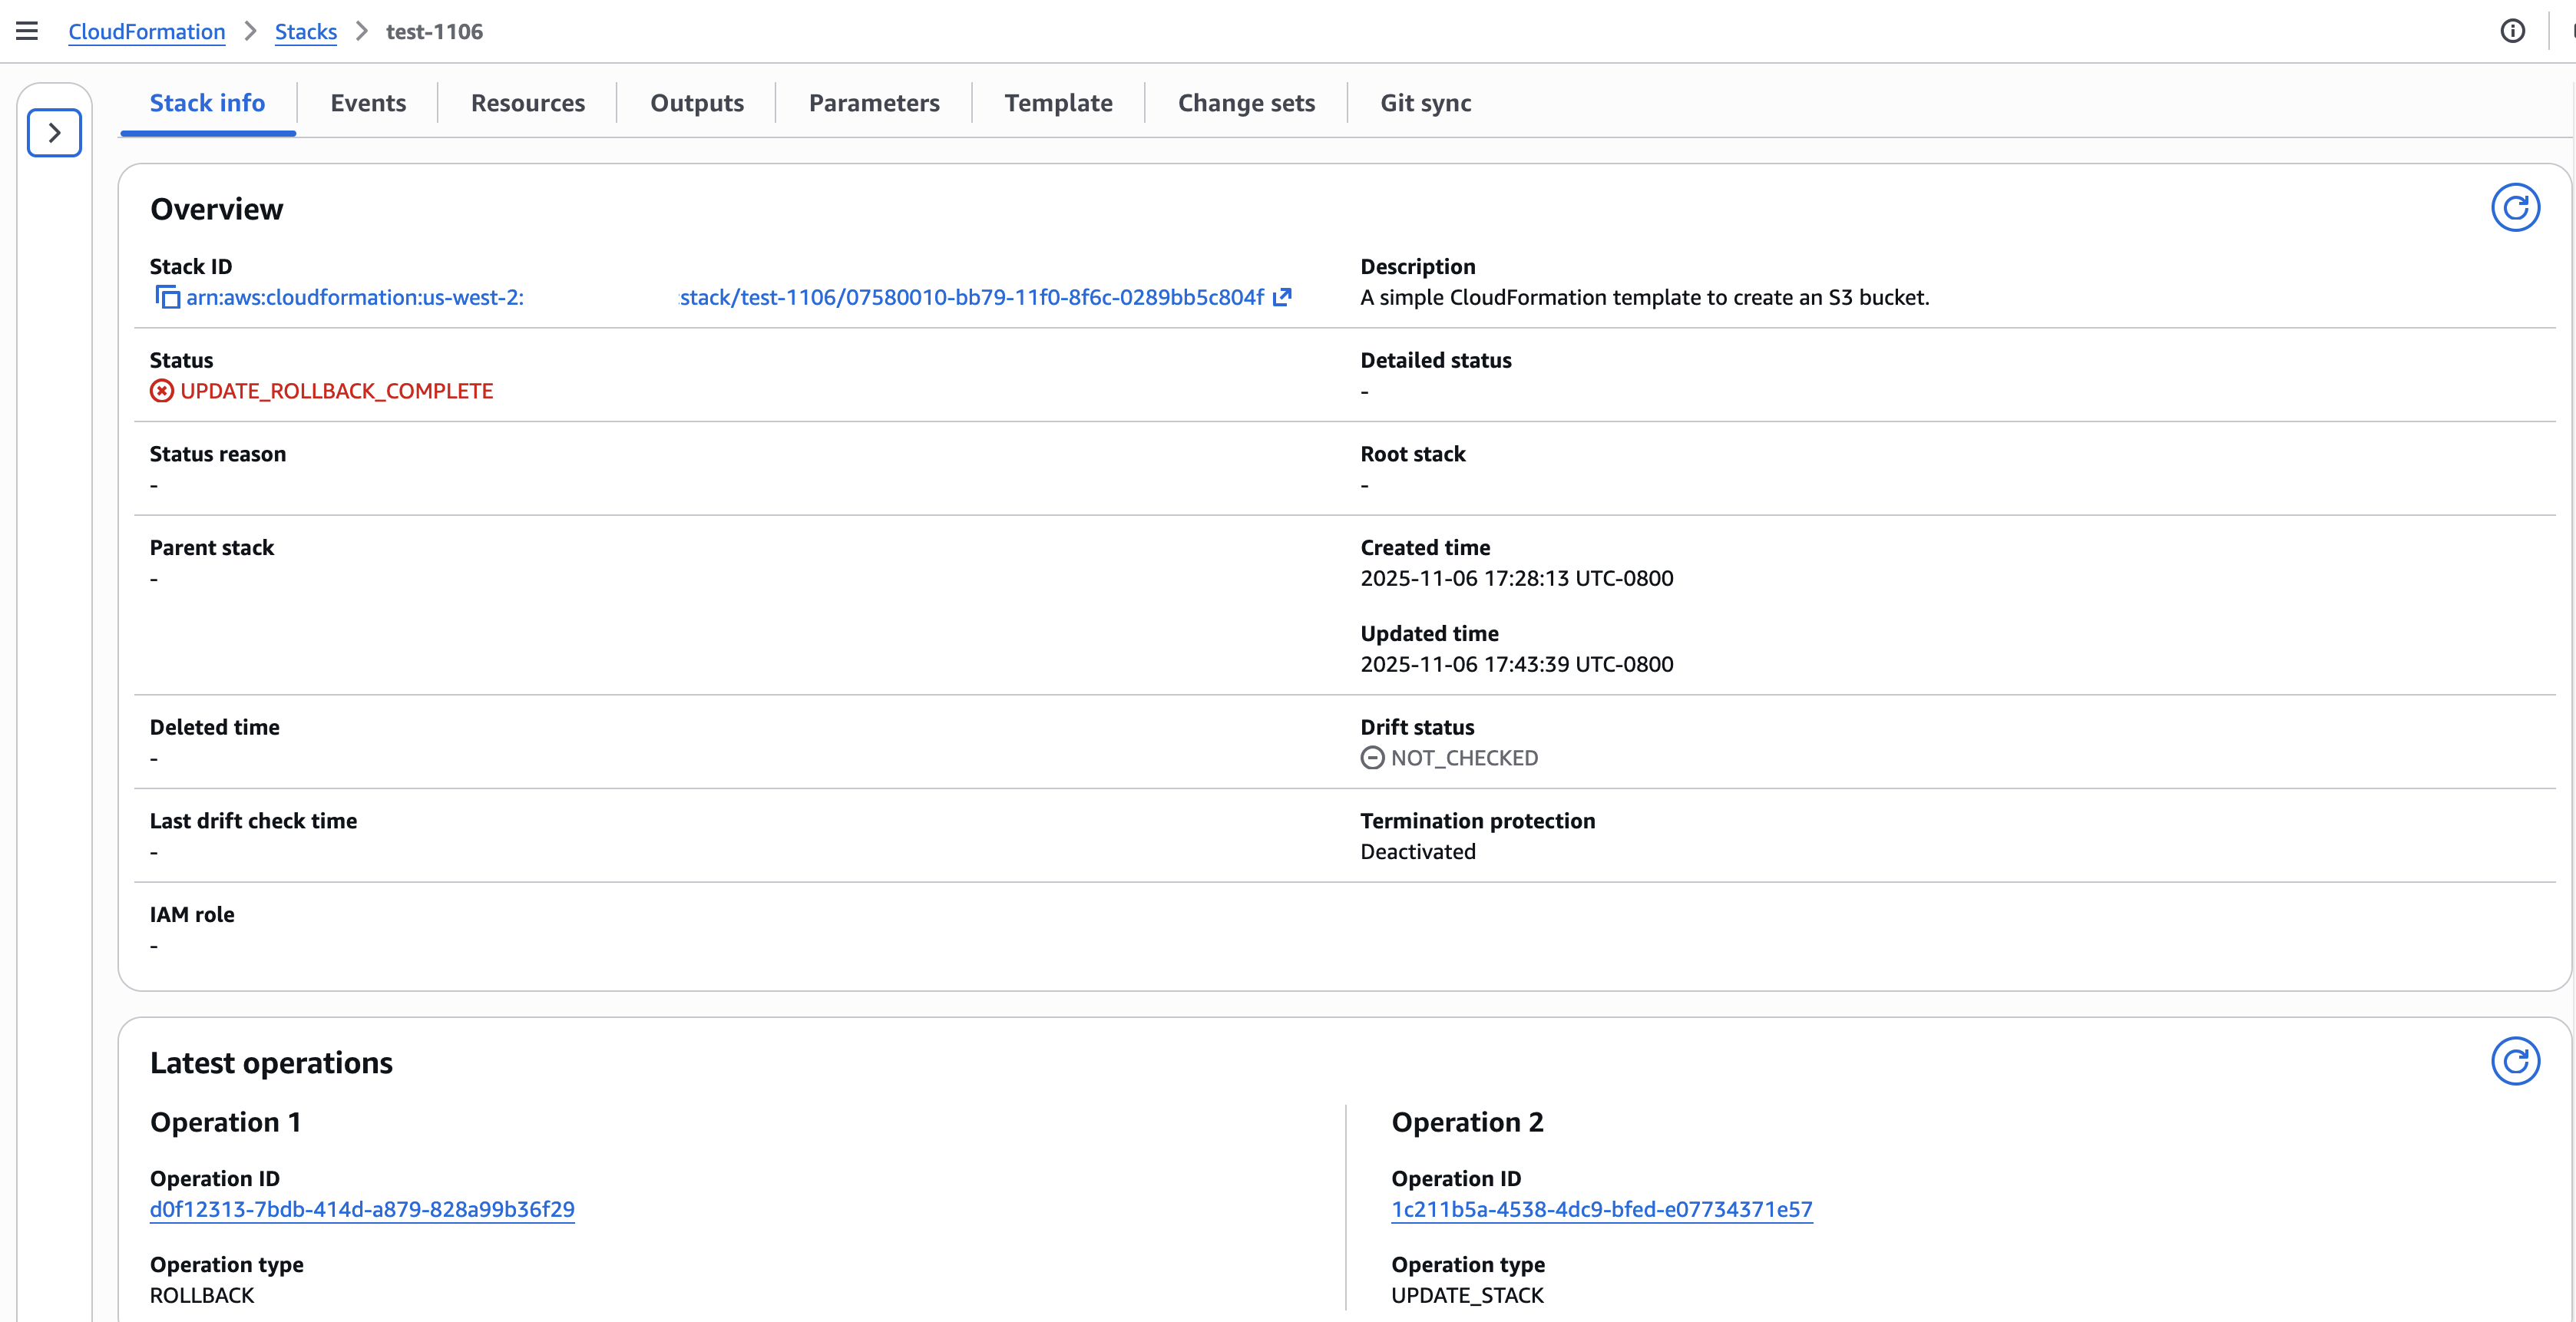
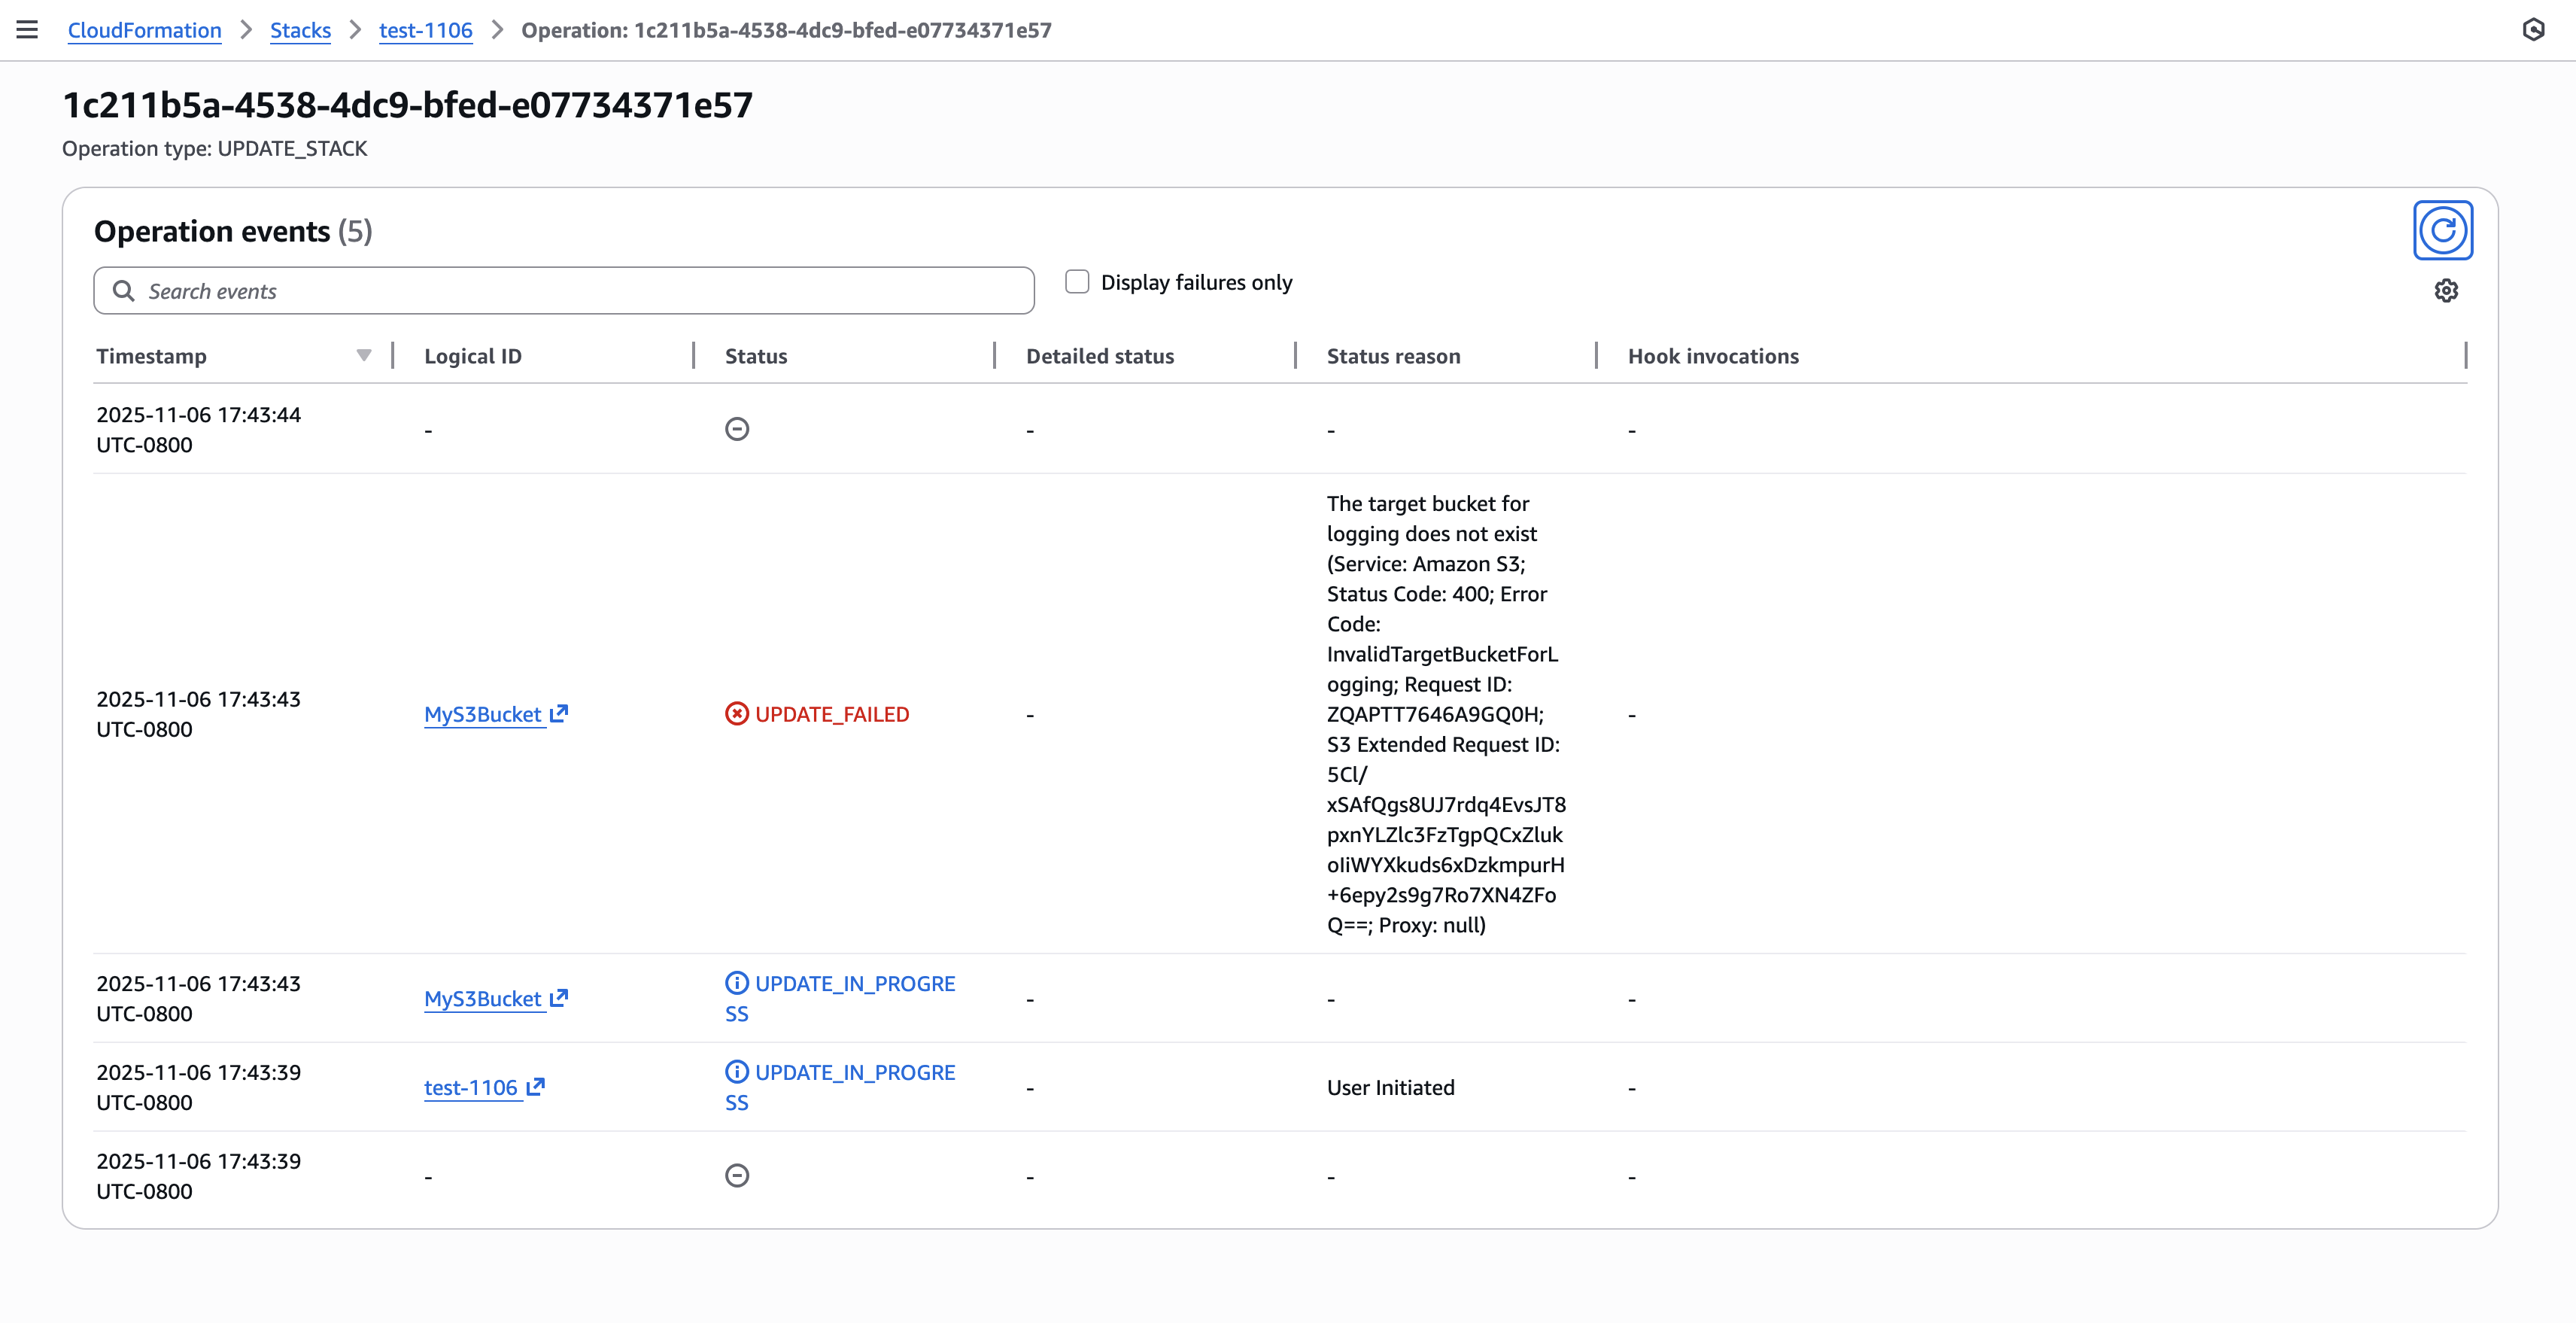 Figure 12: New CloudFormation stack operation page
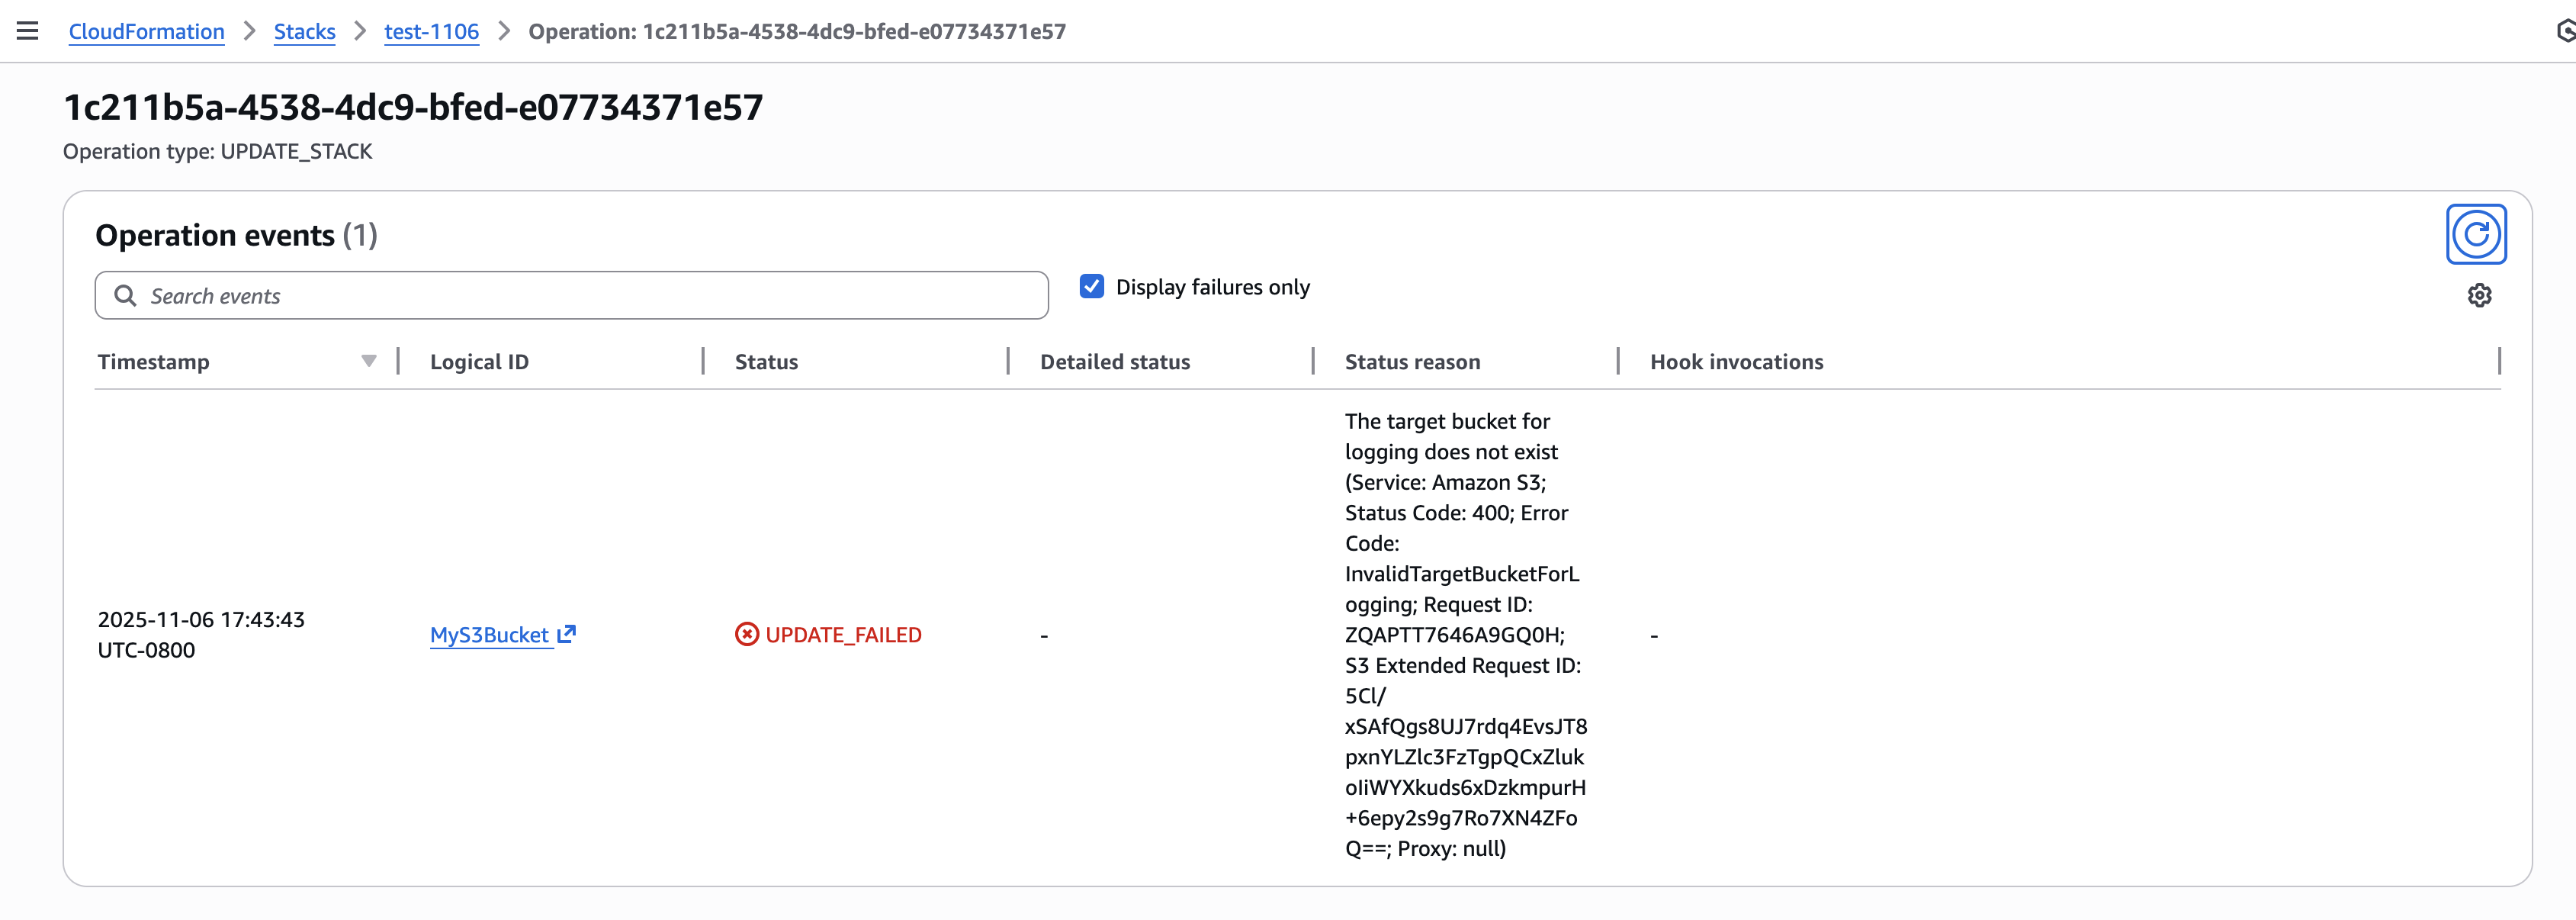
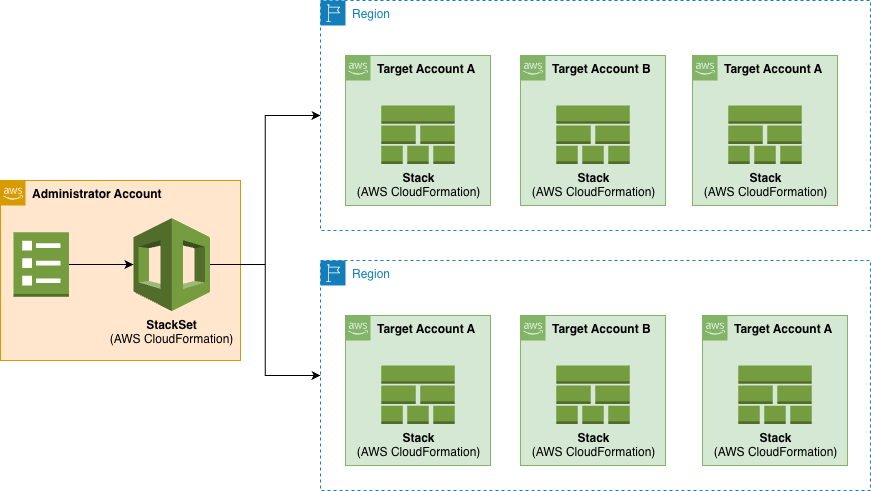
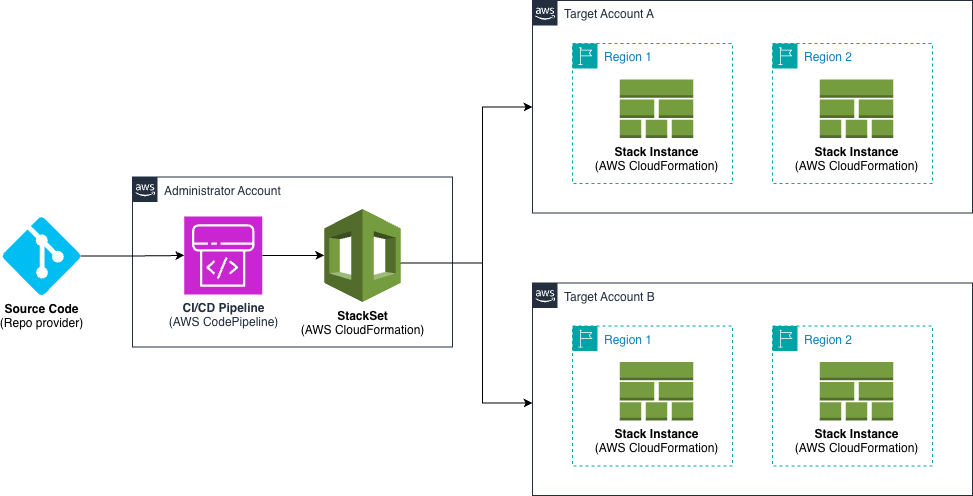
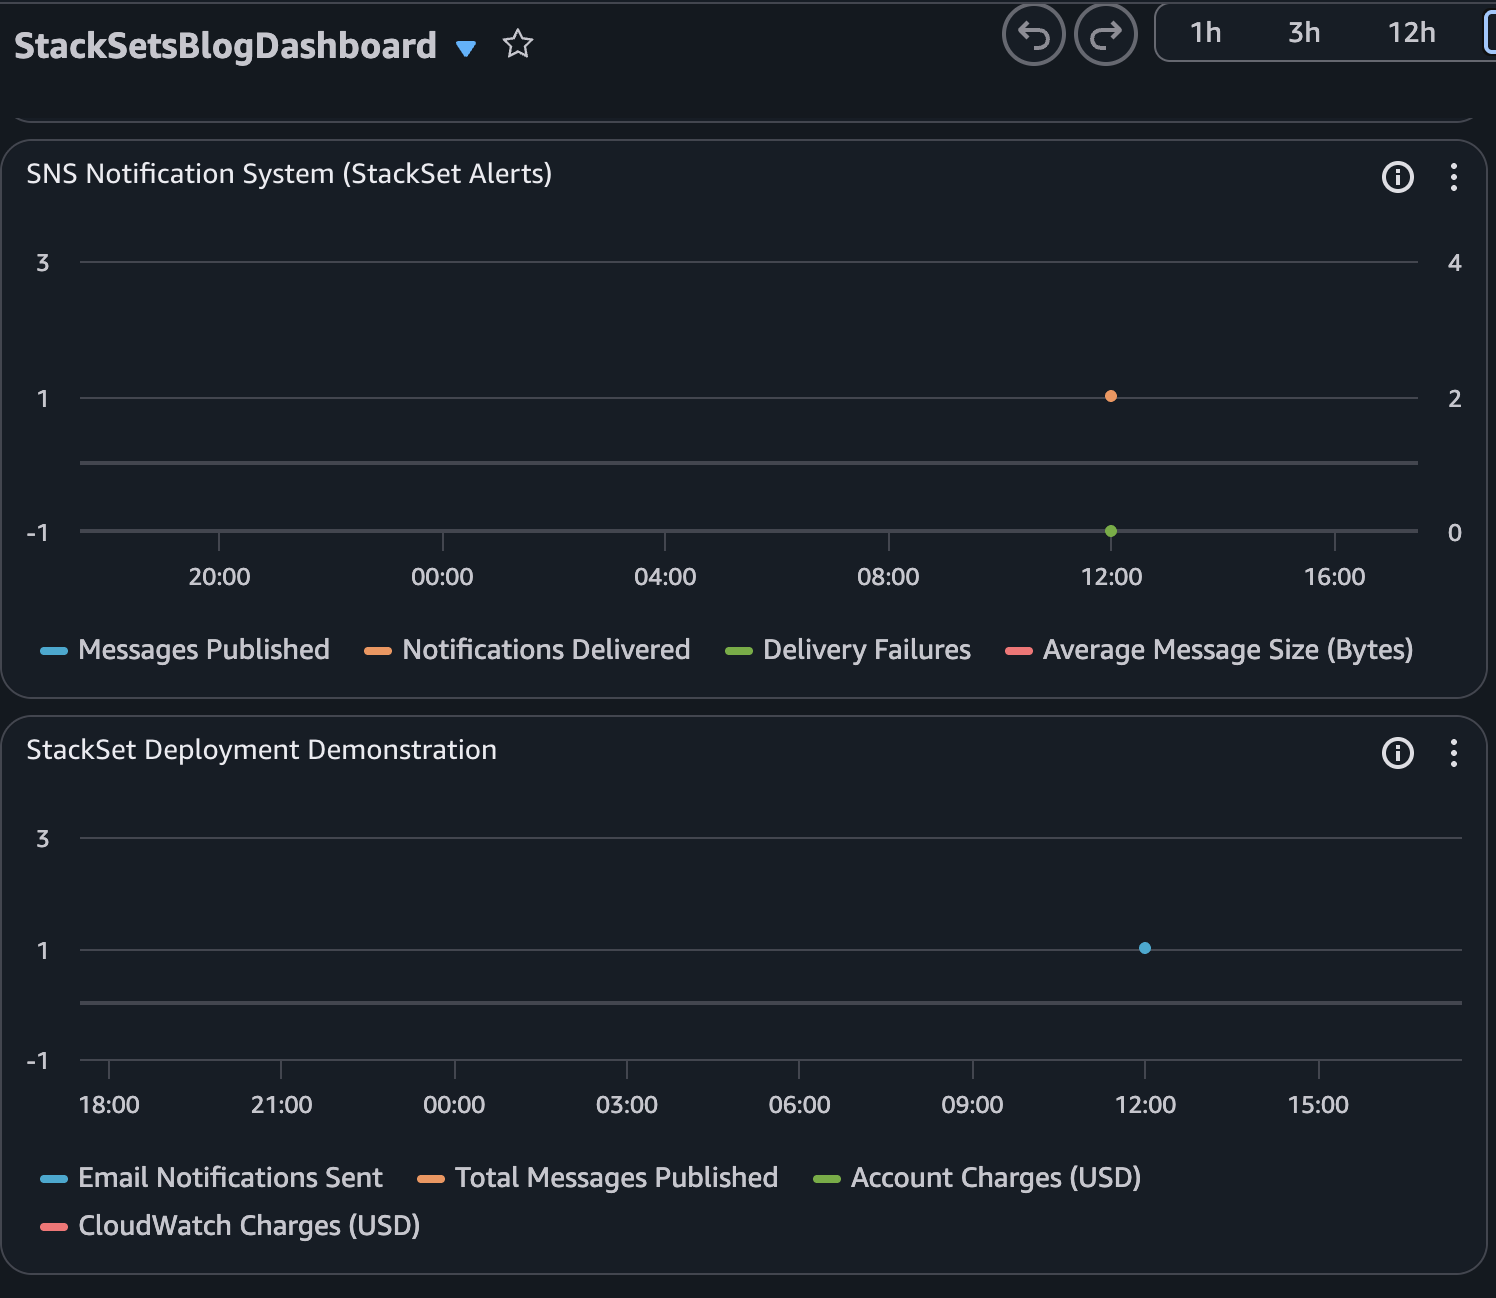
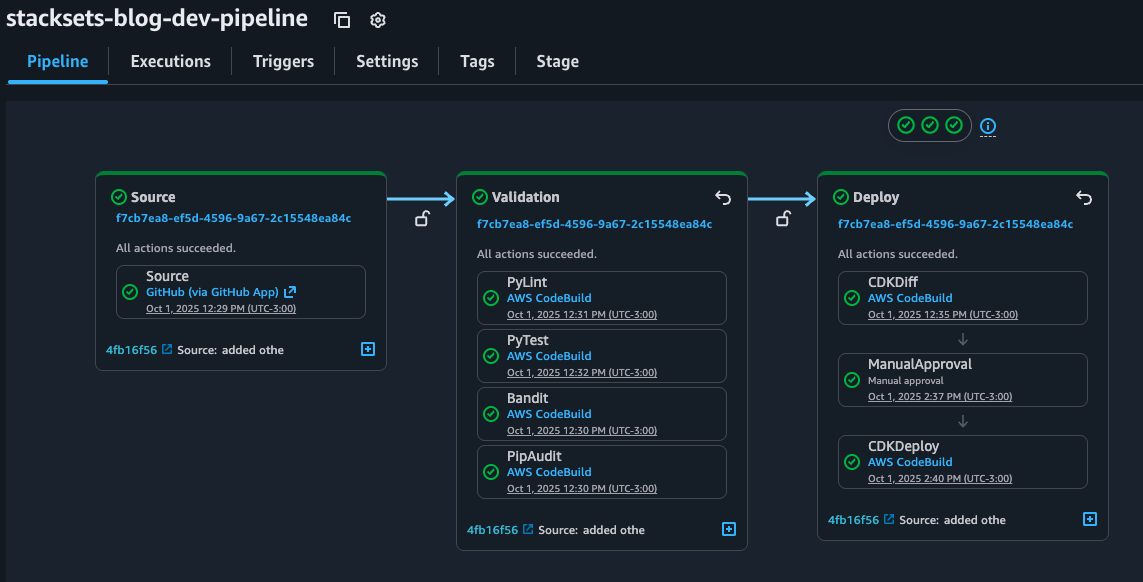
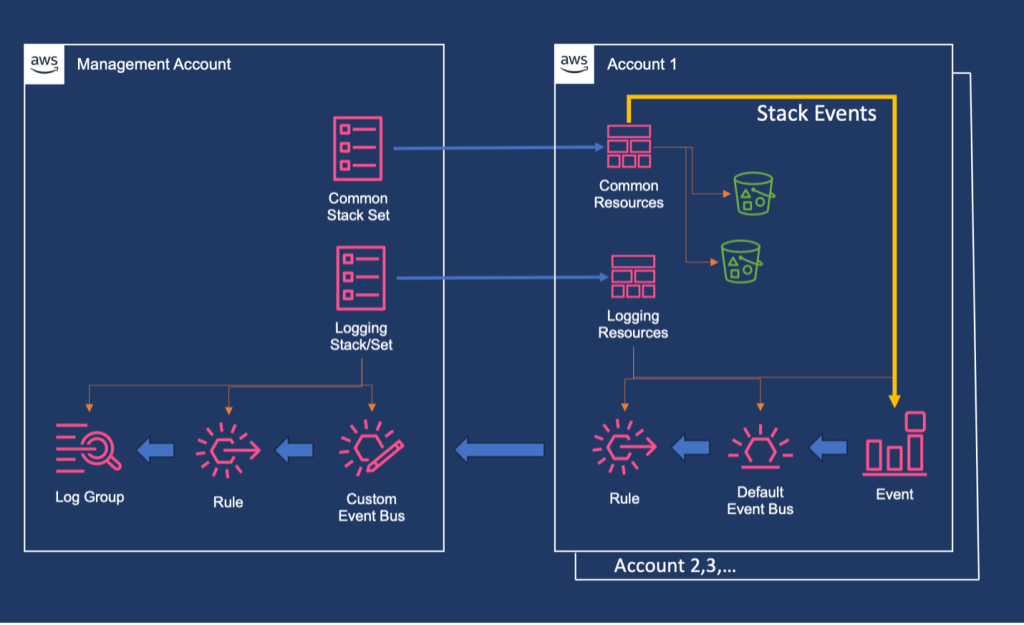
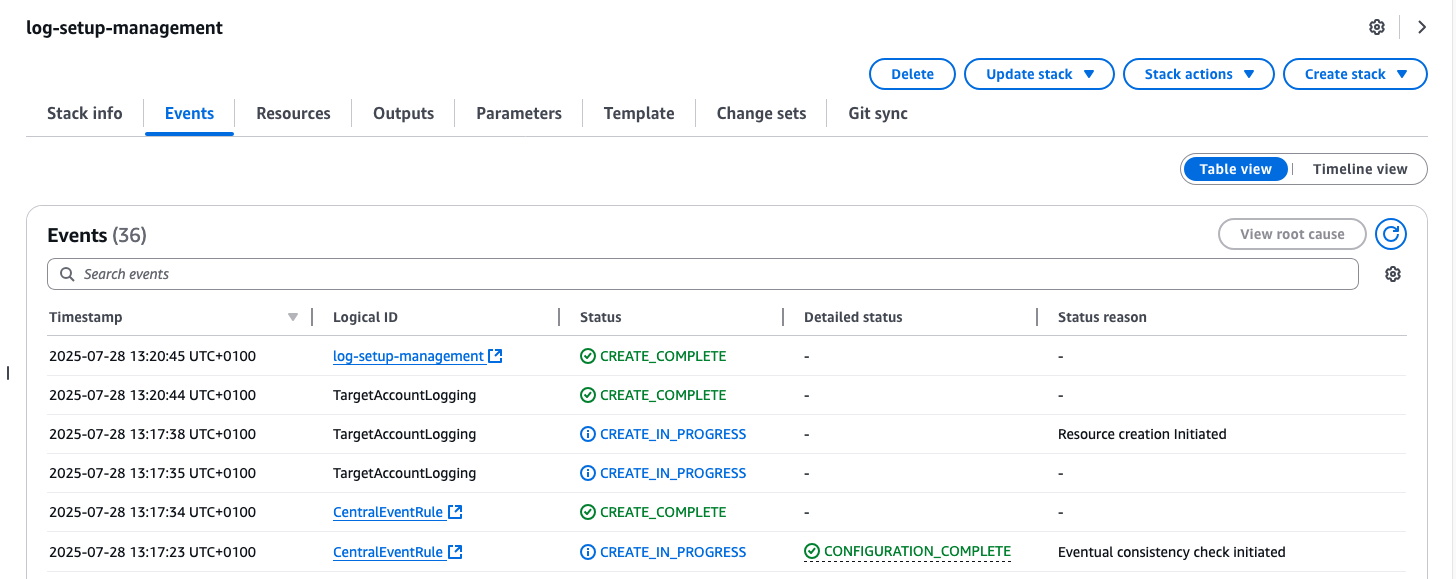
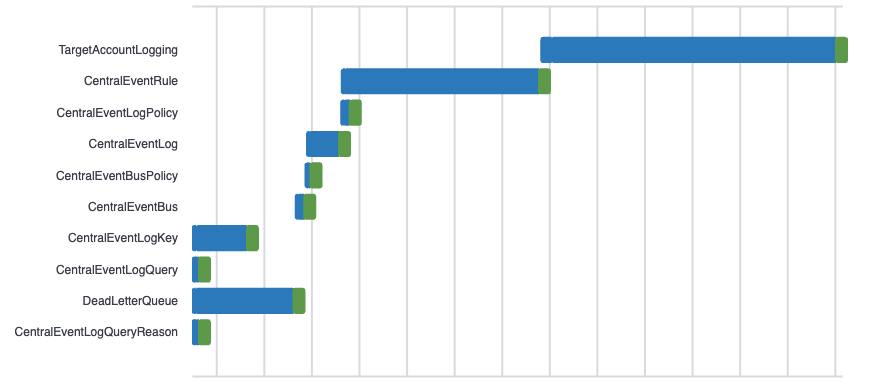
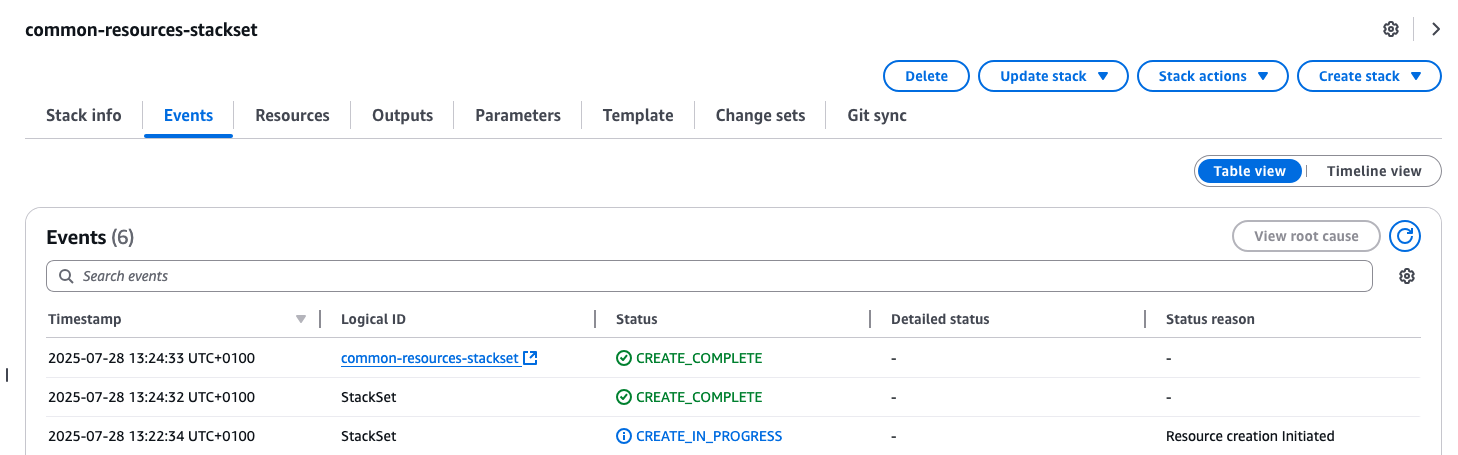
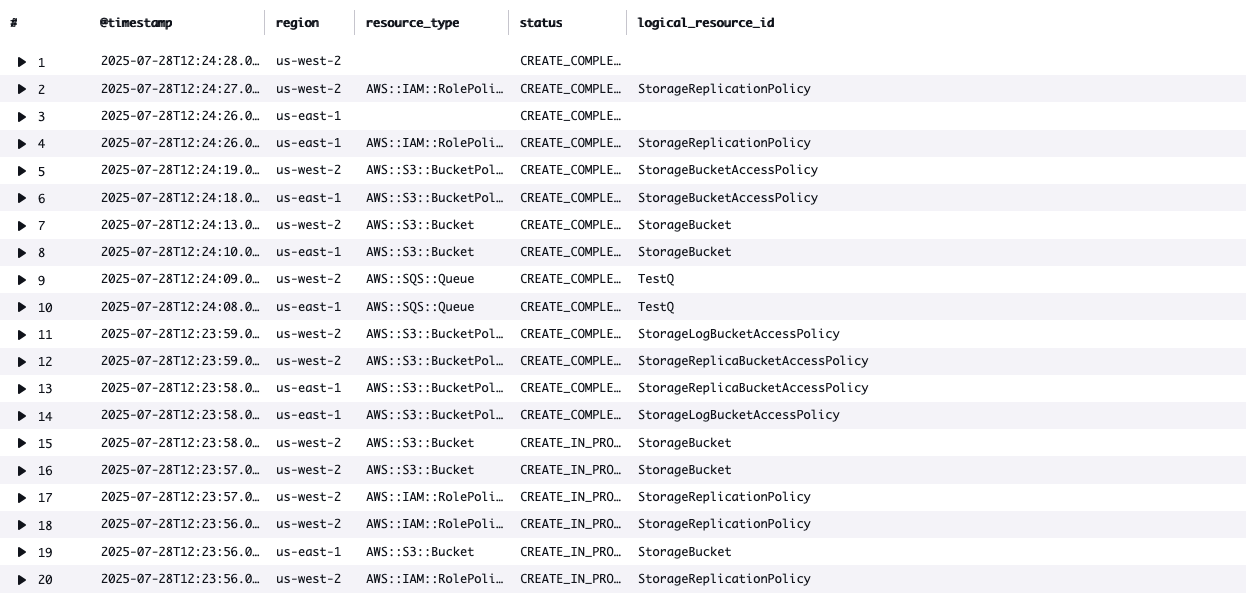
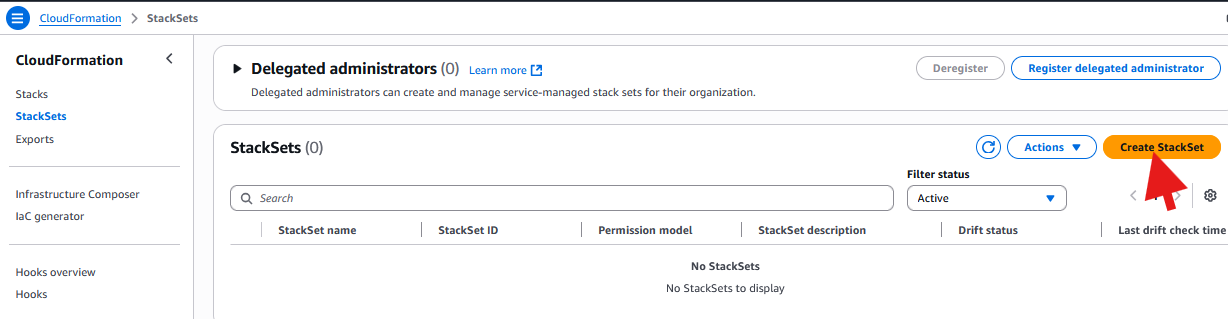
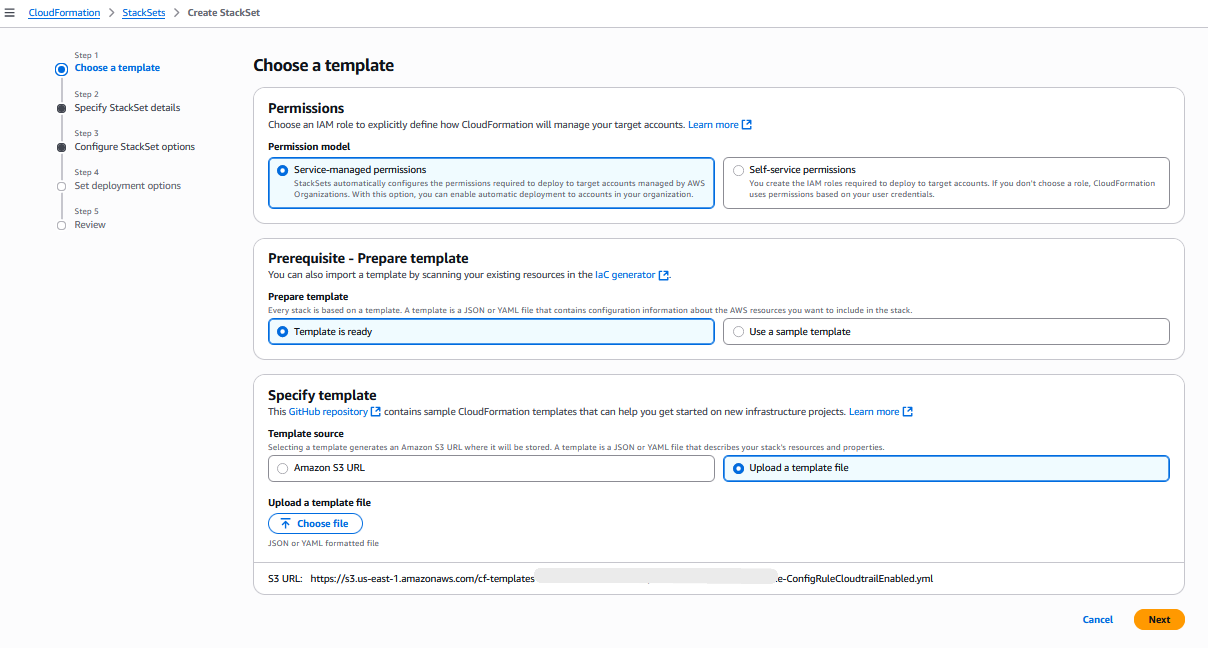
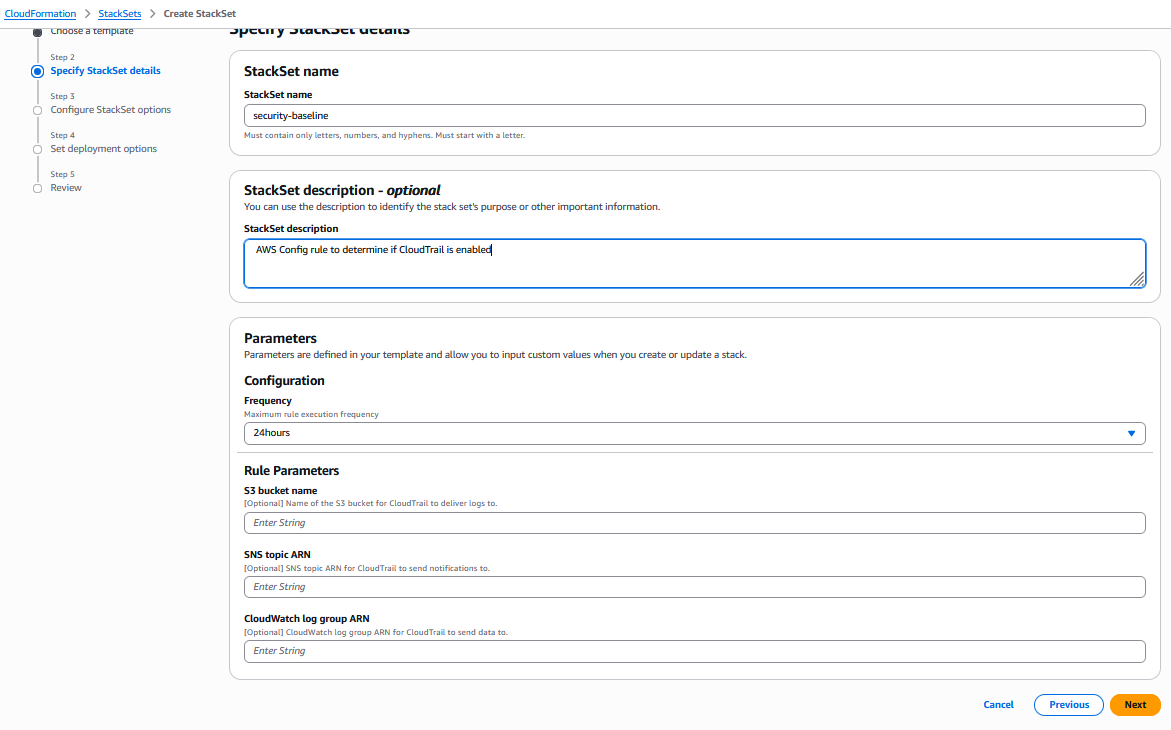
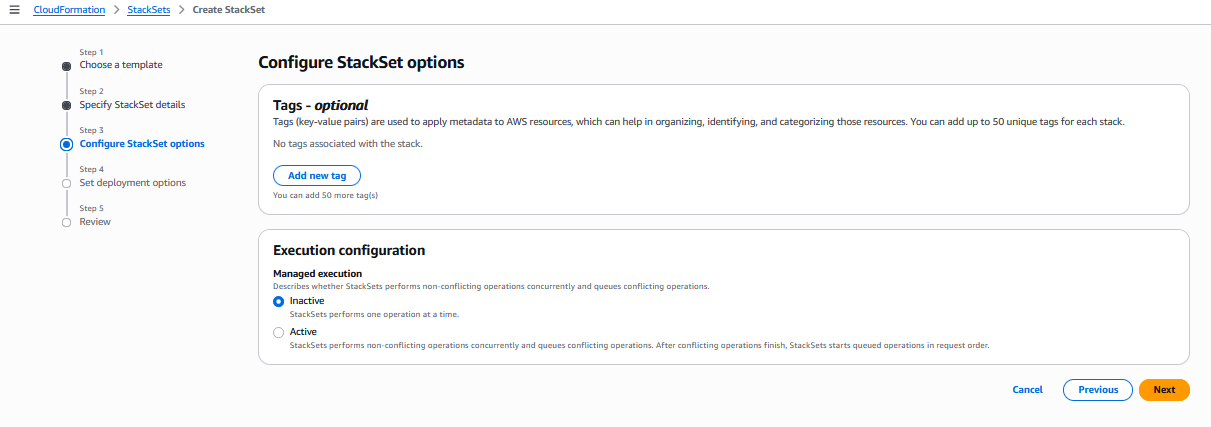
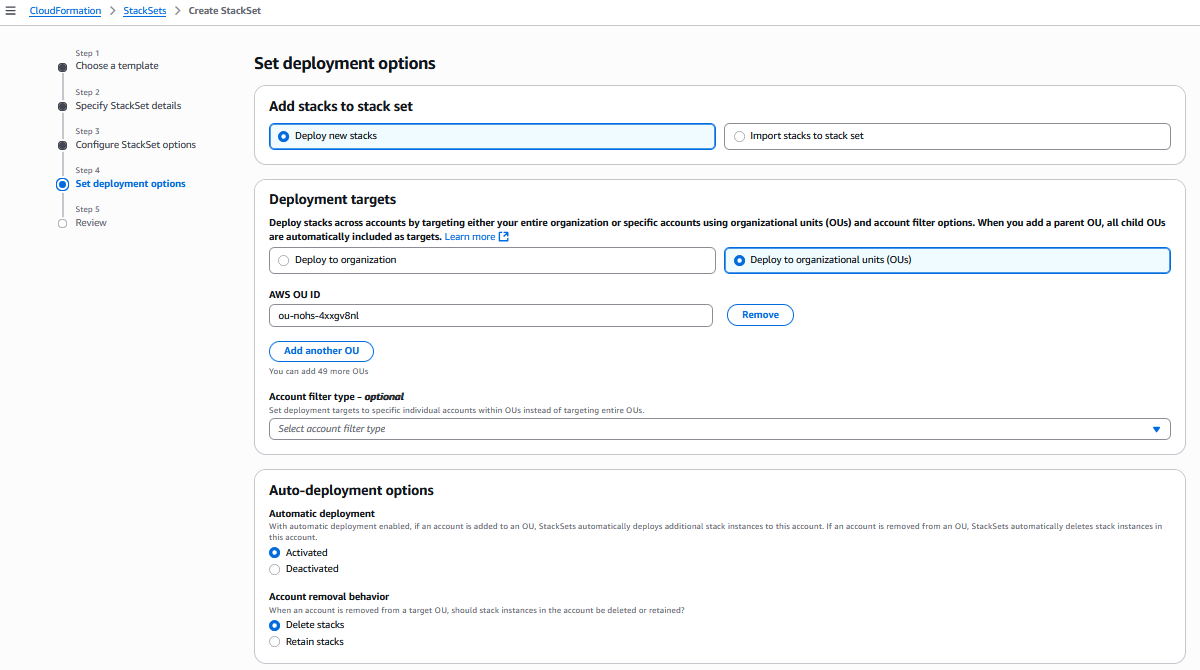
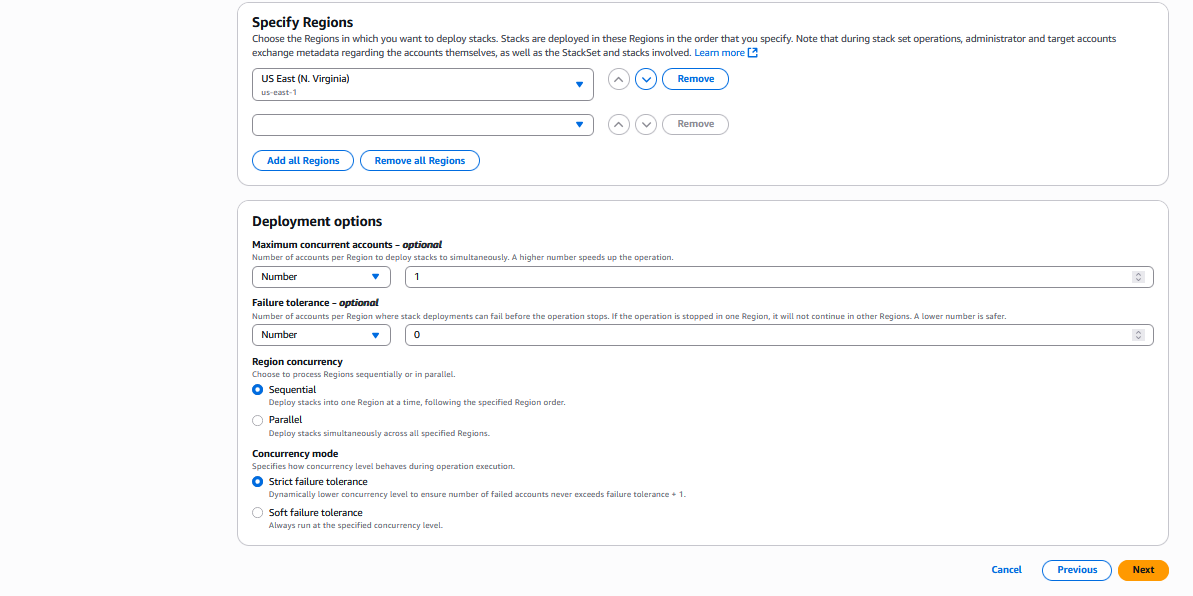
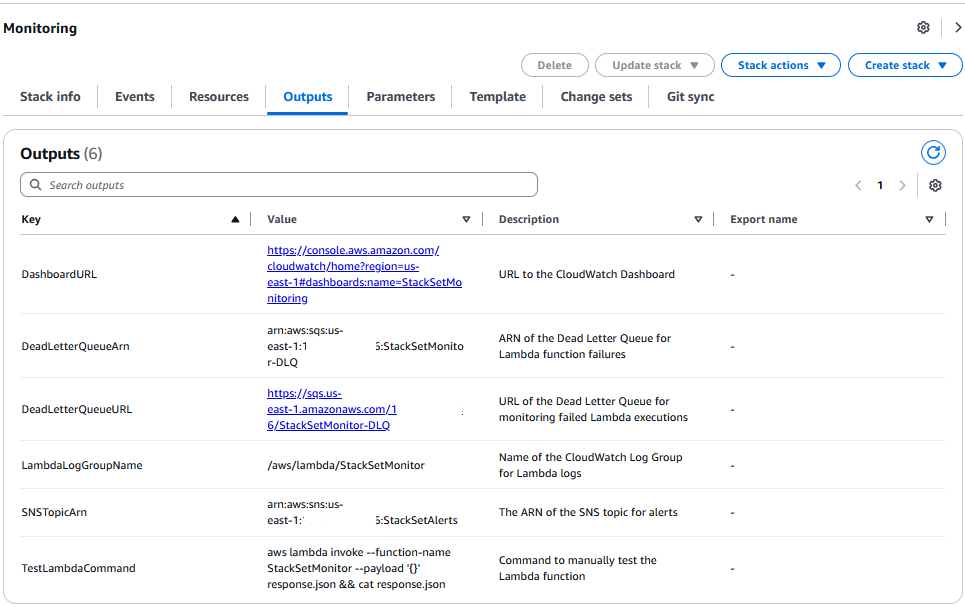
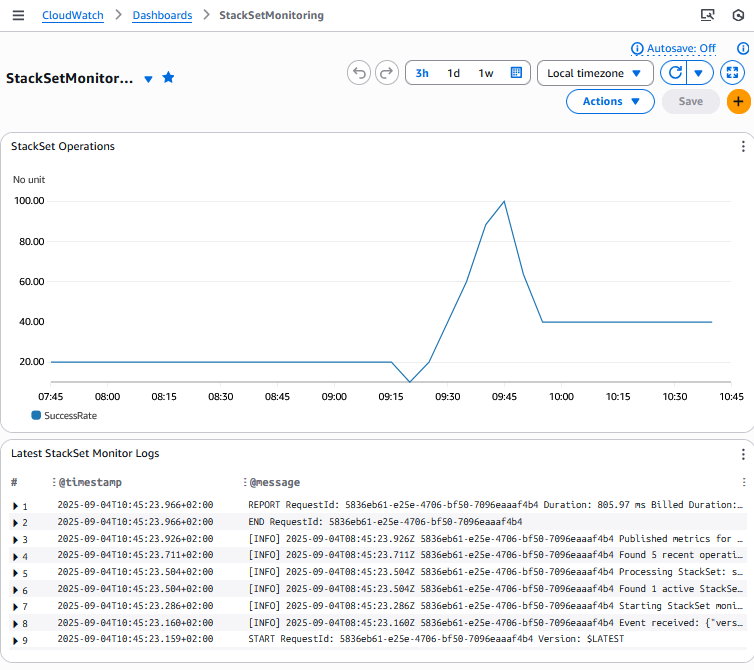
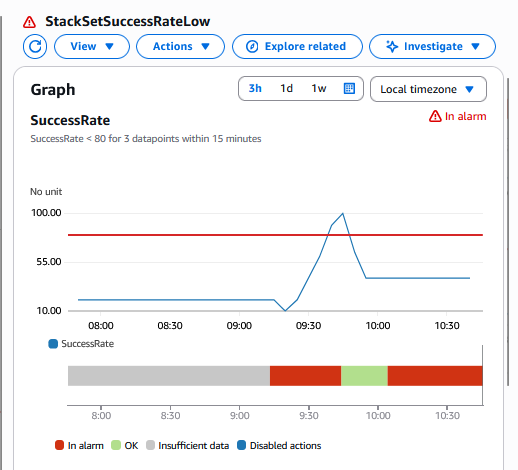


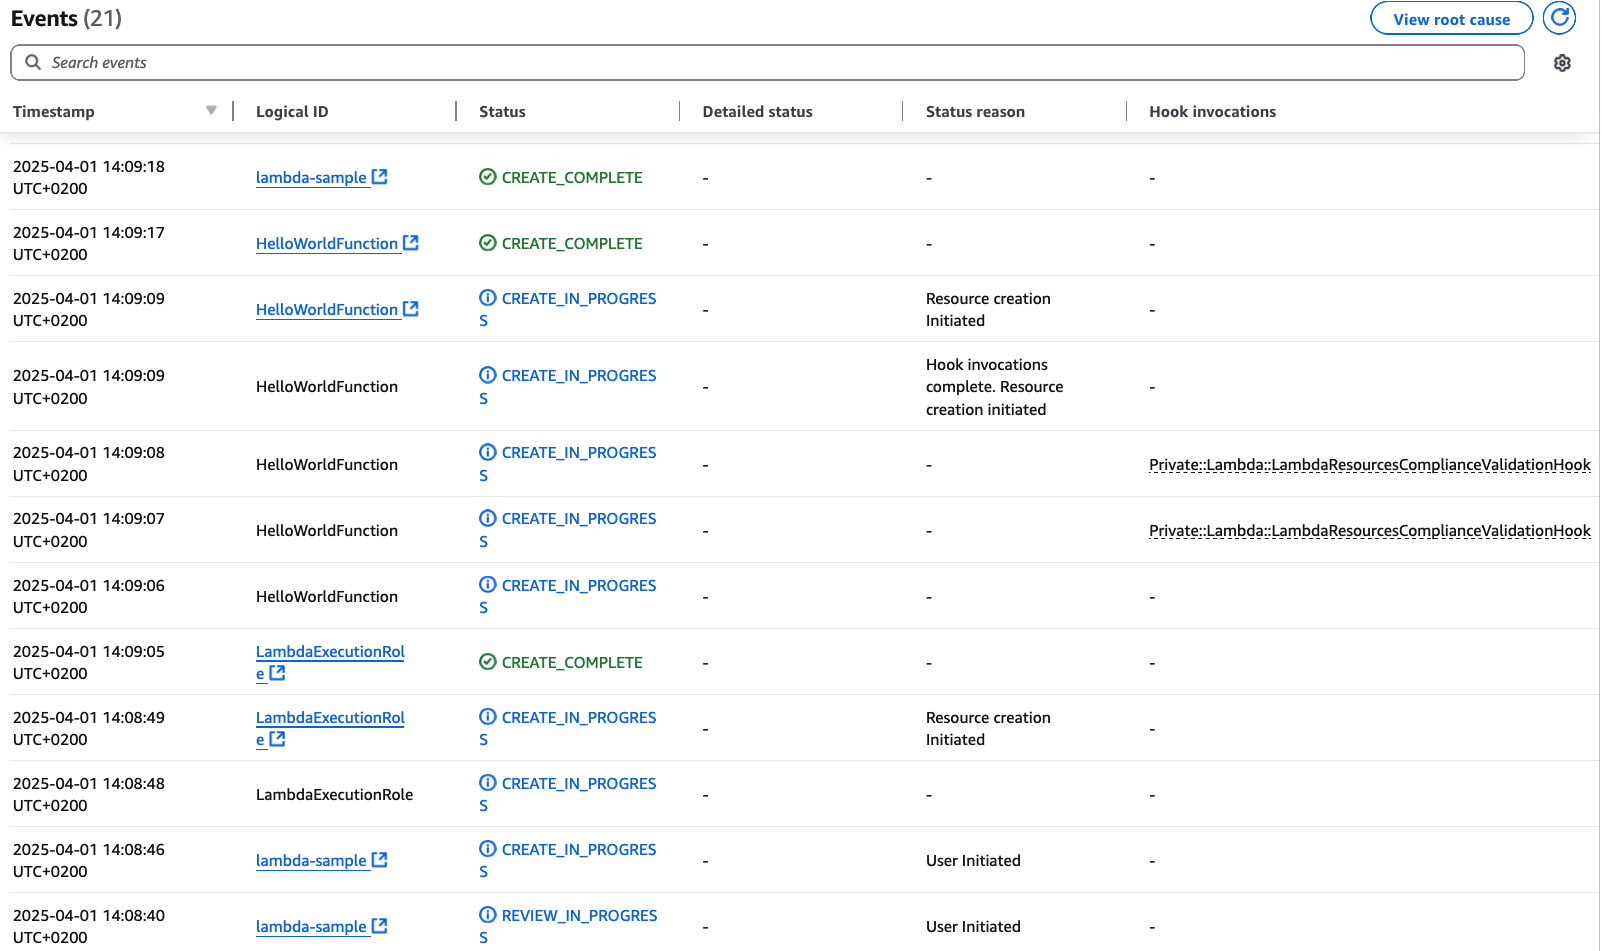
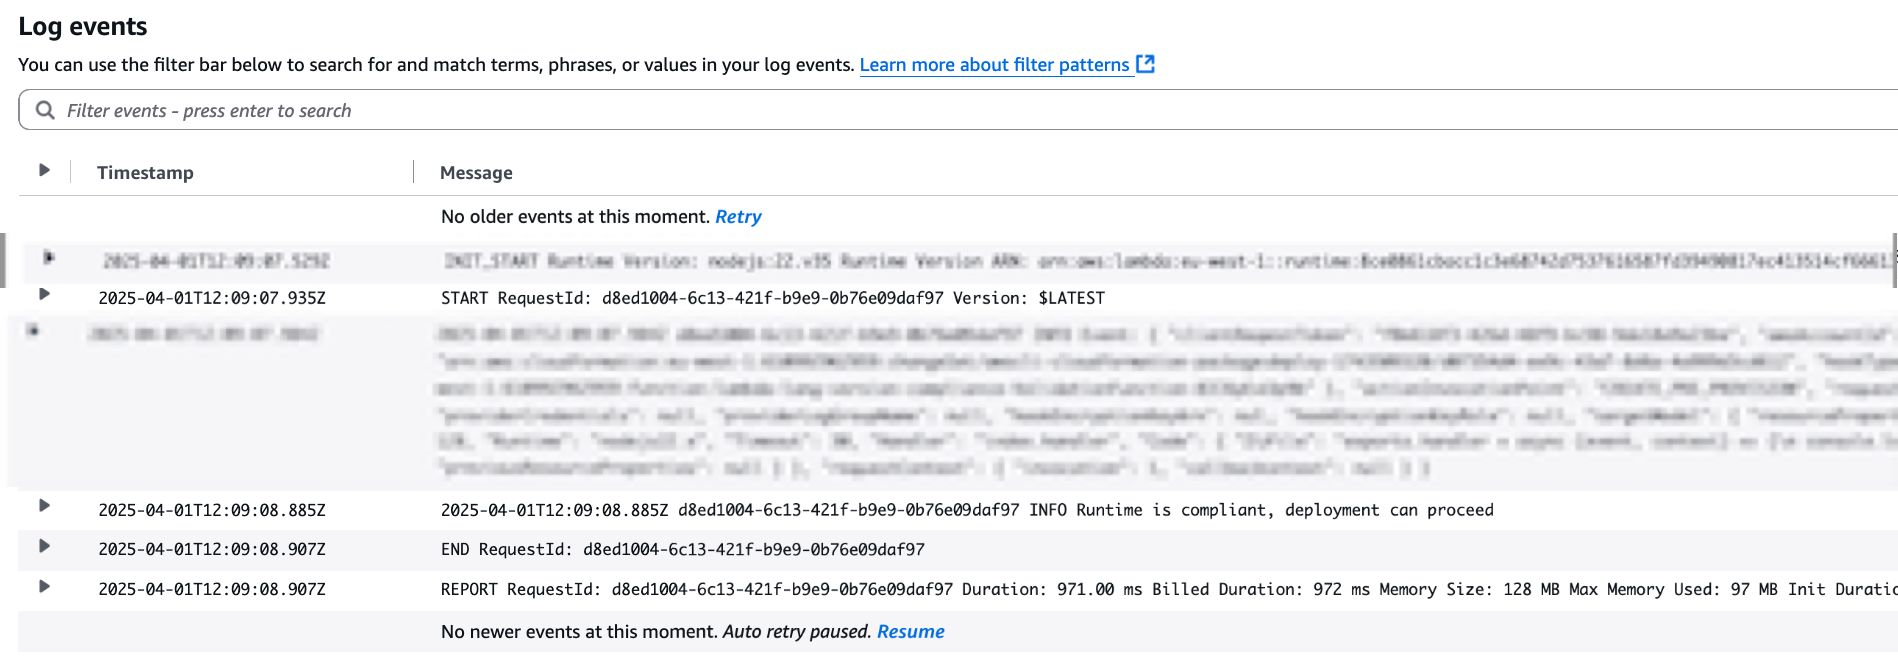
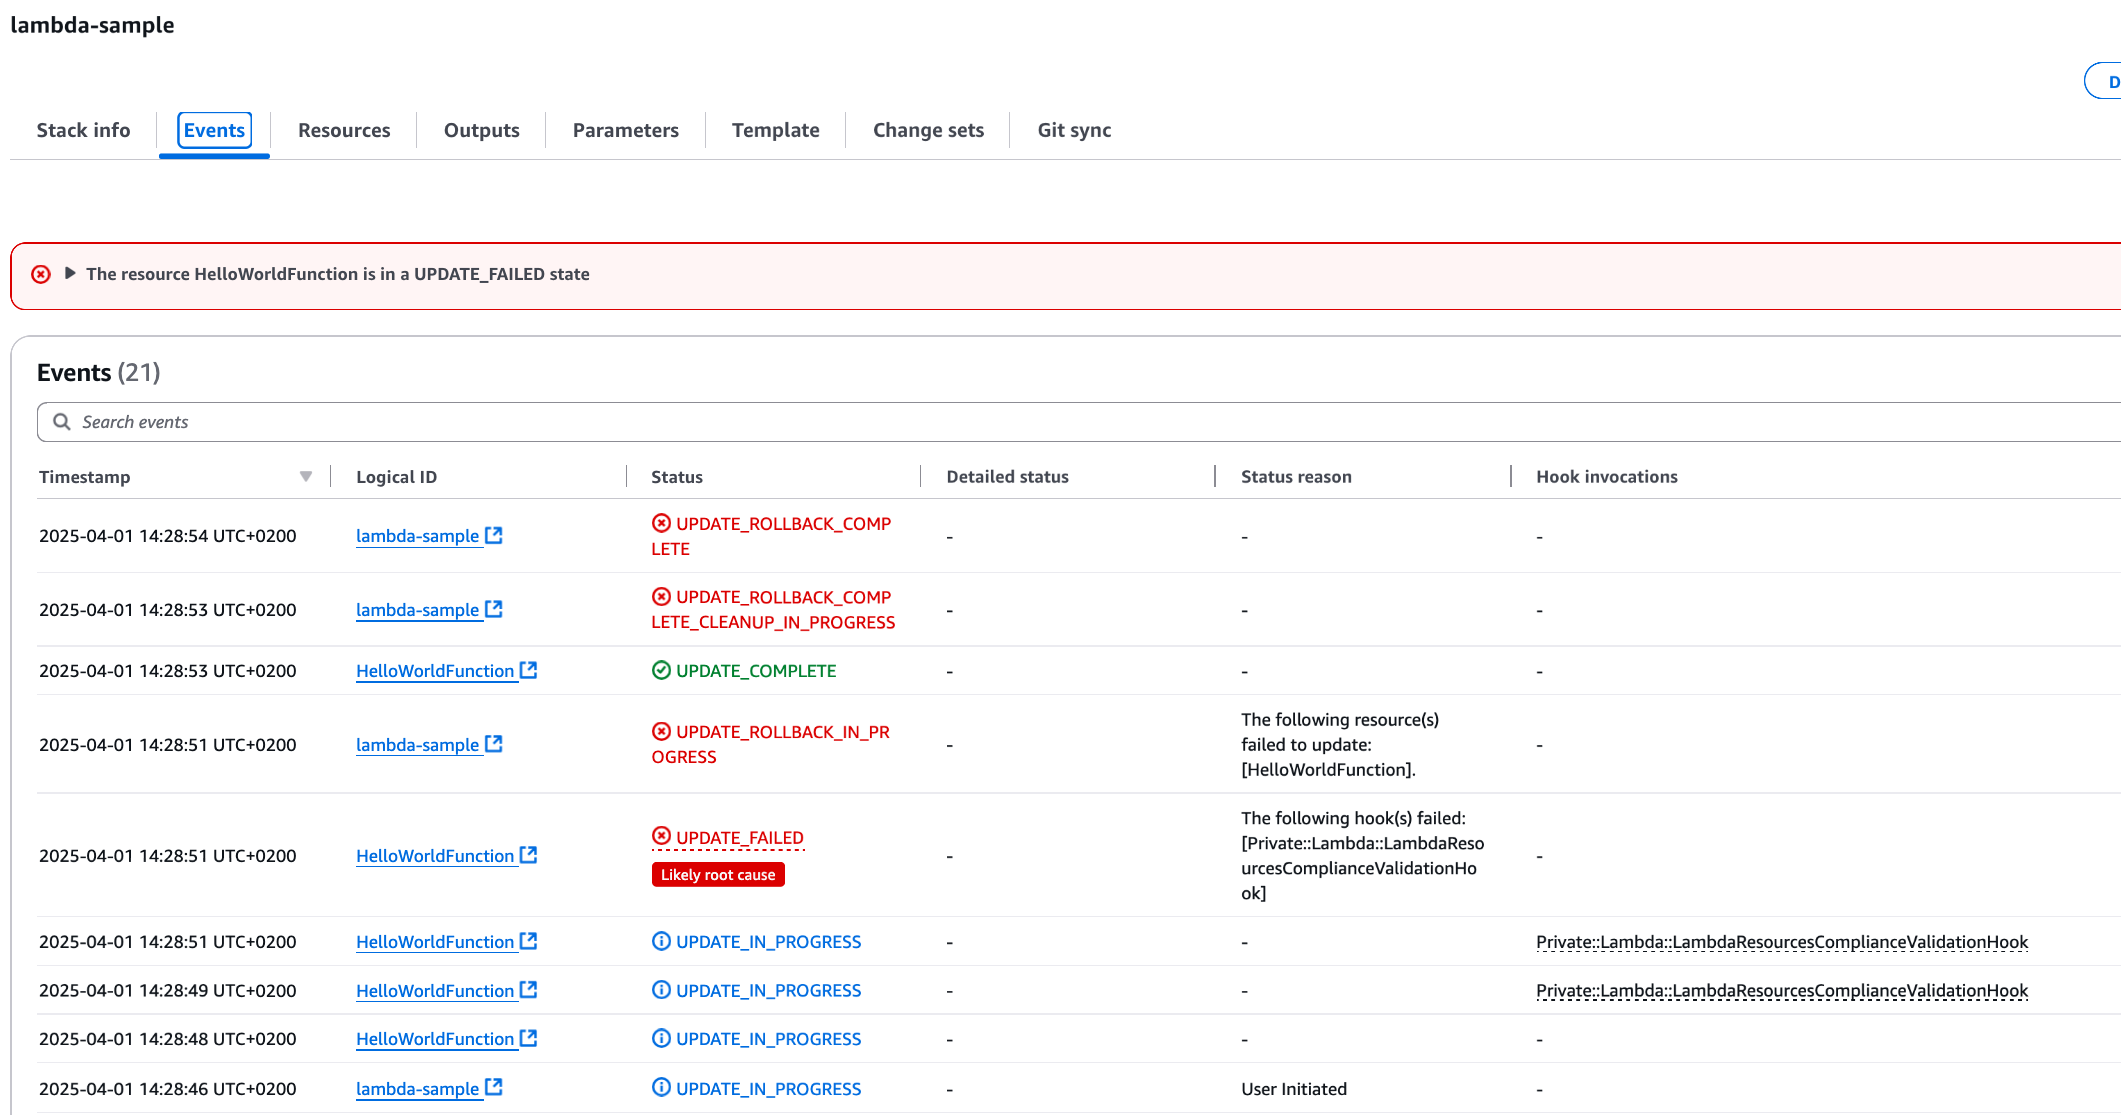
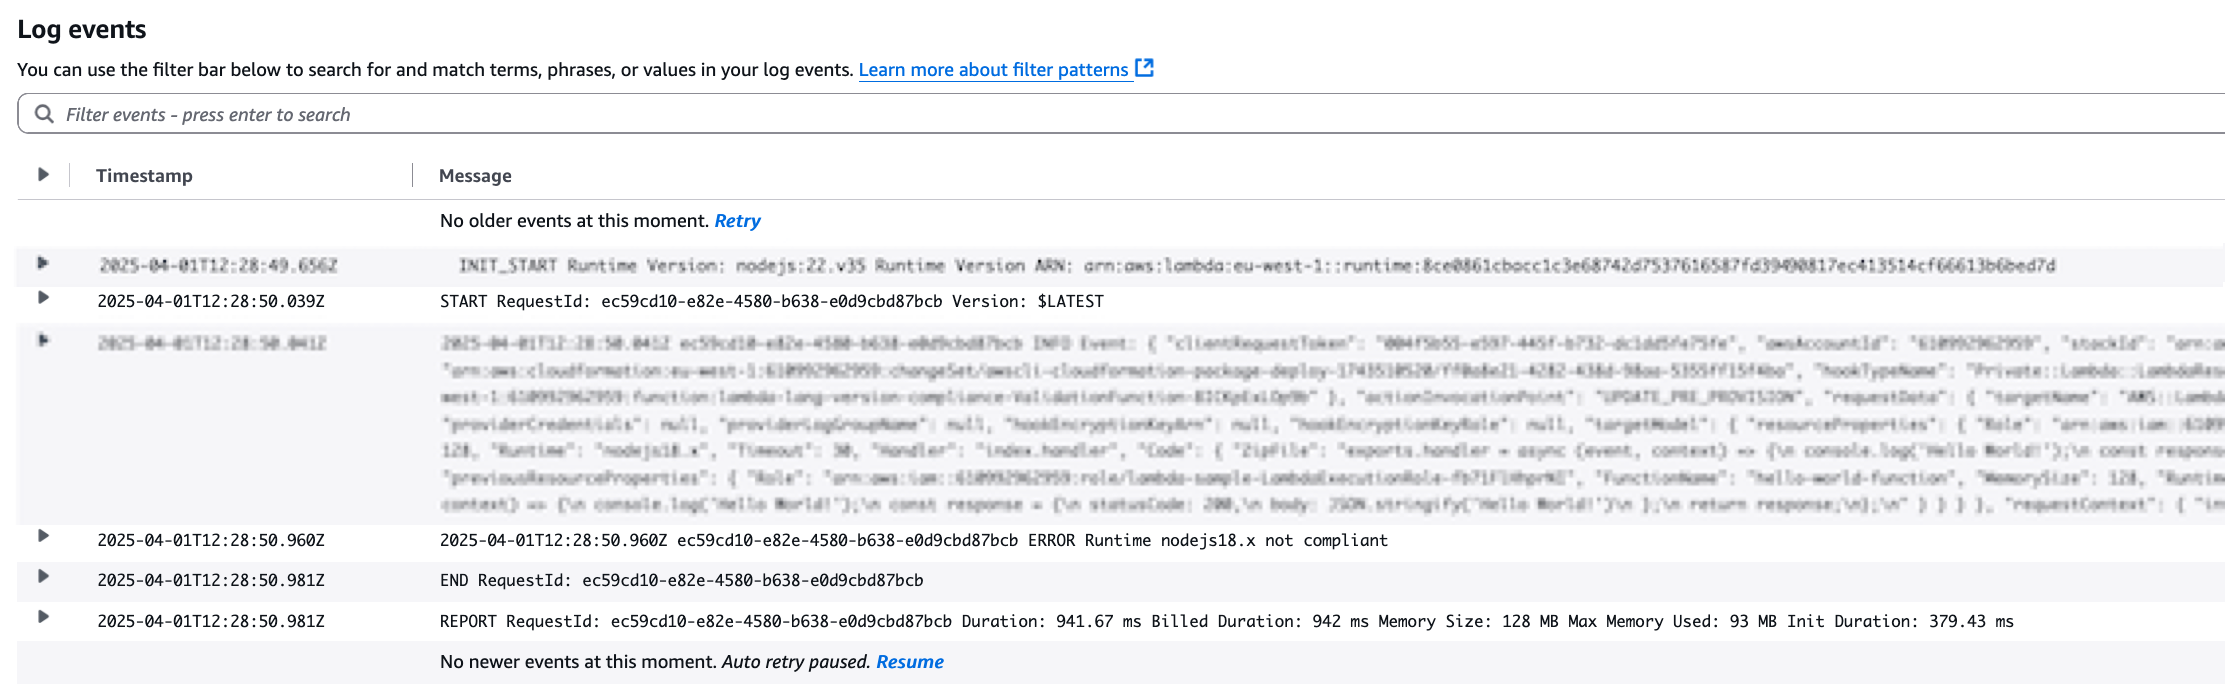


 Figure 4: CloudFormation troubleshooting with CloudTrail integration
 Figure 6: CloudFormation troubleshooting with Q feature

 Figure 9: IaC generator resource scan

 Figure 12: CloudFormation Hooks’ Lambda function feature
 Figure 14: CloudFormation Git sync with request review support feature


