All posts by Donnie Prakoso

AWS Weekly Roundup: AWS re:Invent keynote recap, on-demand videos, and more (December 8, 2025)

Post Syndicated from Donnie Prakoso original https://aws.amazon.com/blogs/aws/aws-weekly-roundup-aws-reinvent-keynote-recap-on-demand-videos-and-more-december-8-2025/

The week after AWS re:Invent builds on the excitement and energy of the event and is a good time to learn more and understand how the recent announcements can help you solve your challenges and unlock new opportunities. As usual, we have you covered with our top announcements of AWS re:Invent 2025 that you can learn all about here.

For me, one moment stood out above all the technical announcements: watching Rafi (Raphael Francis Quisumbing) from the Philippines receive the Now Go Build Award from Werner Vogels. Rafi has been an AWS Hero since 2015 and co-lead of AWS User Group Philippines since 2013. His dedication to building communities and empowering developers across the region embodies what this award represents. You can read more about Rafi on The Kernel. Congrats, Rafi!

The keynote recap: Agents, renaissance, and the developer’s role
This year’s AWS re:Invent keynotes painted a clear picture of where we’re headed.

Matt Garman emphasized that developers are “the heart of AWS” and that “freedom to invent” remains AWS’s core mission after 20 years. He focused on AI agents as the next inflection point: “AI assistants are starting to give way to AI agents that can perform tasks and automate on your behalf. This is where we’re starting to see material business returns from your AI investments.”

Swami Sivasubramanian highlighted the transformative moment we’re in: “For the first time in history, we can describe what we want to accomplish in natural language, and agents generate the plan. They write the code, call the necessary tools, and execute the complete solution.” AWS is building production-ready infrastructure that’s secure, reliable, and scalable—purpose-built for the non-deterministic nature of agents.

Peter DeSantis and Dave Brown reinforced that the core attributes AWS has obsessed over for 20 years—security, availability, performance, elasticity, cost, and agility—are more important than ever in the AI era. Dave Brown showcased Graviton and AWS’s custom silicon innovations that deliver these attributes at scale.

Werner Vogels delivered his final keynote after 14 years, introducing the concept of the “renaissance developer”—someone who is curious, thinks in systems, and communicates effectively. His message about AI and developer evolution resonated: “Will AI take my job? Maybe. Will AI make me obsolete? Absolutely not… if you evolve.” He emphasized that developers must be owners: “The work is yours, not that of the tools. You build it, you own it.”

You can also watch from keynotes, innovation talks to breakout sessions and more in the on-demand video page.

Innovations Talks

Breakout sessions — Topics Breakout sessions — Segments

Last week’s launches
Here are the launches that caught my attention not yet covered in our top announcements of AWS re:Invent 2025 post:

  • Kiro Autonomous Agent – Building on Kiro’s general availability in November with team features, AWS introduced an autonomous agent that maintains awareness across sessions, learns from pull requests and feedback, and handles bug triage and code coverage improvements spanning multiple repositories. “Orders of magnitude more efficient” than first-generation AI coding tools, Matt Garman said. Kiro is now Amazon’s standard AI development environment company-wide.
  • Multimodal Retrieval for Bedrock Knowledge Bases (GA) – Build AI-powered search and question-answering applications that work across text, images, audio, and video files. Developers can now ingest multimodal content with full control of parsing, chunking, embedding, and vector storage options, then send text or image queries to retrieve relevant segments across all media types.
  • AWS Interconnect – Multicloud (Preview) – Quickly establish private, secure, high-speed network connections with dedicated bandwidth and built-in resiliency between Amazon VPCs and other cloud environments. Starting in preview with Google Cloud as the first launch partner, with Microsoft Azure support coming in 2026.

See AWS What’s New for more launch news that I haven’t covered here. That’s all for this week. Check back next Monday for another Weekly Roundup!

Happy building!

Donnie

This post is part of our Weekly Roundup series. Check back each week for a quick roundup of interesting news and announcements from AWS!

Amazon Bedrock adds reinforcement fine-tuning simplifying how developers build smarter, more accurate AI models

Post Syndicated from Donnie Prakoso original https://aws.amazon.com/blogs/aws/improve-model-accuracy-with-reinforcement-fine-tuning-in-amazon-bedrock/

Organizations face a challenging trade-off when adapting AI models to their specific business needs: settle for generic models that produce average results, or tackle the complexity and expense of advanced model customization. Traditional approaches force a choice between poor performance with smaller models or the high costs of deploying larger model variants and managing complex infrastructure. Reinforcement fine-tuning is an advanced technique that trains models using feedback instead of massive labeled datasets, but implementing it typically requires specialized ML expertise, complicated infrastructure, and significant investment—with no guarantee of achieving the accuracy needed for specific use cases.

Today, we’re announcing reinforcement fine-tuning in Amazon Bedrock, a new model customization capability that creates smarter, more cost-effective models that learn from feedback and deliver higher-quality outputs for specific business needs. Reinforcement fine-tuning uses a feedback-driven approach where models improve iteratively based on reward signals, delivering 66% accuracy gains on average over base models.

Amazon Bedrock automates the reinforcement fine-tuning workflow, making this advanced model customization technique accessible to everyday developers without requiring deep machine learning (ML) expertise or large labeled datasets.

How reinforcement fine-tuning works
Reinforcement fine-tuning is built on top of reinforcement learning principles to address a common challenge: getting models to consistently produce outputs that align with business requirements and user preferences.

While traditional fine-tuning requires large, labeled datasets and expensive human annotation, reinforcement fine-tuning takes a different approach. Instead of learning from fixed examples, it uses reward functions to evaluate and judge which responses are considered good for particular business use cases. This teaches models to understand what makes a quality response without requiring massive amounts of pre-labeled training data, making advanced model customization in Amazon Bedrock more accessible and cost-effective.

Here are the benefits of using reinforcement fine-tuning in Amazon Bedrock:

  • Ease of use – Amazon Bedrock automates much of the complexity, making reinforcement fine-tuning more accessible to developers building AI applications. Models can be trained using existing API logs in Amazon Bedrock or by uploading datasets as training data, eliminating the need for labeled datasets or infrastructure setup.
  • Better model performance – Reinforcement fine-tuning improves model accuracy by 66% on average over base models, enabling optimization for price and performance by training smaller, faster, and more efficient model variants. This works with Amazon Nova 2 Lite model, improving quality and price performance for specific business needs, with support for additional models coming soon.
  • Security – Data remains within the secure AWS environment throughout the entire customization process, mitigating security and compliance concerns.

The capability supports two complementary approaches to provide flexibility for optimizing models:

  • Reinforcement Learning with Verifiable Rewards (RLVR) uses rule-based graders for objective tasks like code generation or math reasoning.
  • Reinforcement Learning from AI Feedback (RLAIF) employs AI-based judges for subjective tasks like instruction following or content moderation.

Getting started with reinforcement fine-tuning in Amazon Bedrock
Let’s walk through creating a reinforcement fine-tuning job.

First, I access the Amazon Bedrock console. Then, I navigate to the Custom models page. I choose Create and then choose Reinforcement fine-tuning job.

I start by entering the name of this customization job and then select my base model. At launch, reinforcement fine-tuning supports Amazon Nova 2 Lite, with support for additional models coming soon.

Next, I need to provide training data. I can use my stored invocation logs directly, eliminating the need to upload separate datasets. I can also upload new JSONL files or select existing datasets from Amazon Simple Storage Service (Amazon S3). Reinforcement fine-tuning automatically validates my training dataset and supports the OpenAI Chat Completions data format. If I provide invocation logs in the Amazon Bedrock invoke or converse format, Amazon Bedrock automatically converts them to the Chat Completions format.

The reward function setup is where I define what constitutes a good response. I have two options here. For objective tasks, I can select Custom code and write custom Python code that gets executed through AWS Lambda functions. For more subjective evaluations, I can select Model as judge to use foundation models (FMs) as judges by providing evaluation instructions.

Here, I select Custom code, and I create a new Lambda function or use an existing one as a reward function. I can start with one of the provided templates and customize it for my specific needs.

I can optionally modify default hyperparameters like learning rate, batch size, and epochs.

For enhanced security, I can configure virtual private cloud (VPC) settings and AWS Key Management Service (AWS KMS) encryption to meet my organization’s compliance requirements. Then, I choose Create to start the model customization job.

During the training process, I can monitor real-time metrics to understand how the model is learning. The training metrics dashboard shows key performance indicators including reward scores, loss curves, and accuracy improvements over time. These metrics help me understand whether the model is converging properly and if the reward function is effectively guiding the learning process.

When the reinforcement fine-tuning job is completed, I can see the final job status on the Model details page.

Once the job is completed, I can deploy the model with a single click. I select Set up inference, then choose Deploy for on-demand.

Here, I provide a few details for my model.

After deployment, I can quickly evaluate the model’s performance using the Amazon Bedrock playground. This helps me to test the fine-tuned model with sample prompts and compare its responses against the base model to validate the improvements. I select Test in playground.

The playground provides an intuitive interface for rapid testing and iteration, helping me confirm that the model meets my quality requirements before integrating it into production applications.

Interactive demo
Learn more by navigating an interactive demo of Amazon Bedrock reinforcement fine-tuning in action.

Additional things to know
Here are key points to note:

  • Templates — There are seven ready-to-use reward function templates covering common use cases for both objective and subjective tasks.
  • Pricing — To learn more about pricing, refer to the Amazon Bedrock pricing page.
  • Security — Training data and custom models remain private and aren’t used to improve FMs for public use. It supports VPC and AWS KMS encryption for enhanced security.

Get started with reinforcement fine-tuning by visiting the reinforcement fine-tuning documentation and by accessing the Amazon Bedrock console.

Happy building!
Donnie

Build multi-step applications and AI workflows with AWS Lambda durable functions

Post Syndicated from Donnie Prakoso original https://aws.amazon.com/blogs/aws/build-multi-step-applications-and-ai-workflows-with-aws-lambda-durable-functions/

Modern applications increasingly require complex and long-running coordination between services, such as multi-step payment processing, AI agent orchestration, or approval processes awaiting human decisions. Building these traditionally required significant effort to implement state management, handle failures, and integrate multiple infrastructure services.

Starting today, you can use AWS Lambda durable functions to build reliable multi-step applications directly within the familiar AWS Lambda experience. Durable functions are regular Lambda functions with the same event handler and integrations you already know. You write sequential code in your preferred programming language, and durable functions track progress, automatically retry on failures, and suspend execution for up to one year at defined points, without paying for idle compute during waits.

AWS Lambda durable functions use a checkpoint and replay mechanism, known as durable execution, to deliver these capabilities. After enabling a function for durable execution, you add the new open source durable execution SDK to your function code. You then use SDK primitives like “steps” to add automatic checkpointing and retries to your business logic and “waits” to efficiently suspend execution without compute charges. When execution terminates unexpectedly, Lambda resumes from the last checkpoint, replaying your event handler from the beginning while skipping completed operations.

Getting started with AWS Lambda durable functions
Let me walk you through how to use durable functions.

First, I create a new Lambda function in the console and select Author from scratch. In the Durable execution section, I select Enable. Note that, durable function setting can only be set during function creation and currently can’t be modified for existing Lambda functions.

After I create my Lambda durable function, I can get started with the provided code.

Lambda durable functions introduces two core primitives that handle state management and recovery:

  • Steps—The context.step() method adds automatic retries and checkpointing to your business logic. After a step is completed, it will be skipped during replay.
  • Wait—The context.wait() method pauses execution for a specified duration, terminating the function, suspending and resuming execution without compute charges.

Additionally, Lambda durable functions provides other operations for more complex patterns: create_callback() creates a callback that you can use to await results for external events like API responses or human approvals, wait_for_condition() pauses until a specific condition is met like polling a REST API for process completion, and parallel() or map() operations for advanced concurrency use cases.

Building a production-ready order processing workflow
Now let’s expand the default example to build a production-ready order processing workflow. This demonstrates how to use callbacks for external approvals, handle errors properly, and configure retry strategies. I keep the code intentionally concise to focus on these core concepts. In a full implementation, you could enhance the validation step with Amazon Bedrock to add AI-powered order analysis.

Here’s how the order processing workflow works:

  • First, validate_order() checks order data to ensure all required fields are present.
  • Next, send_for_approval() sends the order for external human approval and waits for a callback response, suspending execution without compute charges.
  • Then, process_order() completes order processing.
  • Throughout the workflow, try-catch error handling distinguishes between terminal errors that stop execution immediately and recoverable errors inside steps that trigger automatic retries.

Here’s the complete order processing workflow with step definitions and the main handler:

import random
from aws_durable_execution_sdk_python import (
    DurableContext,
    StepContext,
    durable_execution,
    durable_step,
)
from aws_durable_execution_sdk_python.config import (
    Duration,
    StepConfig,
    CallbackConfig,
)
from aws_durable_execution_sdk_python.retries import (
    RetryStrategyConfig,
    create_retry_strategy,
)


@durable_step
def validate_order(step_context: StepContext, order_id: str) -> dict:
    """Validates order data using AI."""
    step_context.logger.info(f"Validating order: {order_id}")
    # In production: calls Amazon Bedrock to validate order completeness and accuracy
    return {"order_id": order_id, "status": "validated"}


@durable_step
def send_for_approval(step_context: StepContext, callback_id: str, order_id: str) -> dict:
    """Sends order for approval using the provided callback token."""
    step_context.logger.info(f"Sending order {order_id} for approval with callback_id: {callback_id}")
    
    # In production: send callback_id to external approval system
    # The external system will call Lambda SendDurableExecutionCallbackSuccess or
    # SendDurableExecutionCallbackFailure APIs with this callback_id when approval is complete
    
    return {
        "order_id": order_id,
        "callback_id": callback_id,
        "status": "sent_for_approval"
    }


@durable_step
def process_order(step_context: StepContext, order_id: str) -> dict:
    """Processes the order with retry logic for transient failures."""
    step_context.logger.info(f"Processing order: {order_id}")
    # Simulate flaky API that sometimes fails
    if random.random() > 0.4:
        step_context.logger.info("Processing failed, will retry")
        raise Exception("Processing failed")
    return {
        "order_id": order_id,
        "status": "processed",
        "timestamp": "2025-11-27T10:00:00Z",
    }


@durable_execution
def lambda_handler(event: dict, context: DurableContext) -> dict:
    try:
        order_id = event.get("order_id")
        
        # Step 1: Validate the order
        validated = context.step(validate_order(order_id))
        if validated["status"] != "validated":
            raise Exception("Validation failed")  # Terminal error - stops execution
        context.logger.info(f"Order validated: {validated}")
        
        # Step 2: Create callback
        callback = context.create_callback(
            name="awaiting-approval",
            config=CallbackConfig(timeout=Duration.from_minutes(3))
        )
        context.logger.info(f"Created callback with id: {callback.callback_id}")
        
        # Step 3: Send for approval with the callback_id
        approval_request = context.step(send_for_approval(callback.callback_id, order_id))
        context.logger.info(f"Approval request sent: {approval_request}")
        
        # Step 4: Wait for the callback result
        # This blocks until external system calls SendDurableExecutionCallbackSuccess or SendDurableExecutionCallbackFailure
        approval_result = callback.result()
        context.logger.info(f"Approval received: {approval_result}")
        
        # Step 5: Process the order with custom retry strategy
        retry_config = RetryStrategyConfig(max_attempts=3, backoff_rate=2.0)
        processed = context.step(
            process_order(order_id),
            config=StepConfig(retry_strategy=create_retry_strategy(retry_config)),
        )
        if processed["status"] != "processed":
            raise Exception("Processing failed")  # Terminal error
        
        context.logger.info(f"Order successfully processed: {processed}")
        return processed
        
    except Exception as error:
        context.logger.error(f"Error processing order: {error}")
        raise error  # Re-raise to fail the execution

This code demonstrates several important concepts:

  • Error handling—The try-catch block handles terminal errors. When an unhandled exception is thrown outside of a step (like the validation check), it terminates the execution immediately. This is useful when there’s no point in retrying, such as invalid order data.
  • Step retries—Inside the process_order step, exceptions trigger automatic retries based on the default (step 1) or configured RetryStrategy (step 5). This handles transient failures like temporary API unavailability.
  • Logging—I use context.logger for the main handler and step_context.logger inside steps. The context logger suppresses duplicate logs during replay.

Now I create a test event with order_id and invoke the function asynchronously to start the order workflow. I navigate to the Test tab and fill in the optional Durable execution name to identify this execution. Note that, durable functions provides built-in idempotency. If I invoke the function twice with the same execution name, the second invocation returns the existing execution result instead of creating a duplicate.

I can monitor the execution by navigating to the Durable executions tab in the Lambda console:

Here I can see each step’s status and timing. The execution shows CallbackStarted followed by InvocationCompleted, which indicates the function has terminated and execution is suspended to avoid idle charges while waiting for the approval callback.

I can now complete the callback directly from the console by choosing Send success or Send failure, or programmatically using the Lambda API.

I choose Send success.

After the callback completes, the execution resumes and processes the order. If the process_order step fails due to the simulated flaky API, it automatically retries based on the configured strategy. Once all retries succeed, the execution completes successfully.

Monitoring executions with Amazon EventBridge
You can also monitor durable function executions using Amazon EventBridge. Lambda automatically sends execution status change events to the default event bus, allowing you to build downstream workflows, send notifications, or integrate with other AWS services.

To receive these events, create an EventBridge rule on the default event bus with this pattern:

{
  "source": ["aws.lambda"],
  "detail-type": ["Durable Execution Status Change"]
}

Things to know
Here are key points to note:

  • Availability—Lambda durable functions are now available in US East (Ohio) AWS Region. For the latest Region availability, visit the AWS Capabilities by Region page.
  • Programming language support—At launch, AWS Lambda durable functions supports JavaScript/TypeScript (Node.js 22/24) and Python (3.13/3.14). We recommend bundling the durable execution SDK with your function code using your preferred package manager. The SDKs are fast-moving, so you can easily update dependencies as new features become available.
  • Using Lambda versions—When deploying durable functions to production, use Lambda versions to ensure replay always happens on the same code version. If you update your function code while an execution is suspended, replay will use the version that started the execution, preventing inconsistencies from code changes during long-running workflows.
  • Testing your durable functions—You can test durable functions locally without AWS credentials using the separate testing SDK with pytest integration and the AWS Serverless Application Model (AWS SAM) command line interface (CLI) for more complex integration testing.
  • Open source SDKs—The durable execution SDKs are open source for JavaScript/TypeScript and Python. You can review the source code, contribute improvements, and stay updated with the latest features.
  • Pricing—To learn more on AWS Lambda durable functions pricing, refer to the AWS Lambda pricing page.

Get started with AWS Lambda durable functions by visiting the AWS Lambda console. To learn more, refer to AWS Lambda durable functions documentation page.

Happy building!

Donnie

Accelerate AI development using Amazon SageMaker AI with serverless MLflow

Post Syndicated from Donnie Prakoso original https://aws.amazon.com/blogs/aws/accelerate-ai-development-using-amazon-sagemaker-ai-with-serverless-mlflow/

Since we announced Amazon SageMaker AI with MLflow in June 2024, our customers have been using MLflow tracking servers to manage their machine learning (ML) and AI experimentation workflows. Building on this foundation, we’re continuing to evolve the MLflow experience to make experimentation even more accessible.

Today, I’m excited to announce that Amazon SageMaker AI with MLflow now includes a serverless capability that eliminates infrastructure management. This new MLflow capability transforms experiment tracking into an immediate, on-demand experience with automatic scaling that removes the need for capacity planning.

The shift to zero-infrastructure management fundamentally changes how teams approach AI experimentation—ideas can be tested immediately without infrastructure planning, enabling more iterative and exploratory development workflows.

Getting started with Amazon SageMaker AI and MLflow
Let me walk you through creating your first serverless MLflow instance.

I navigate to Amazon SageMaker AI Studio console and select the MLflow application. The term MLflow Apps replaces the previous MLflow tracking servers terminology, reflecting the simplified, application-focused approach.

Here, I can see there’s already a default MLflow App created. This simplified MLflow experience makes it more straightforward for me to start doing experiments.

I choose Create MLflow App, and enter a name. Here, I have both an AWS Identity and Access Management (IAM) role and Amazon Simple Service (Amazon S3) bucket are already been configured. I only need to modify them in Advanced settings if needed.

Here’s where the first major improvement becomes apparent—the creation process completes in approximately 2 minutes. This immediate availability enables rapid experimentation without infrastructure planning delays, eliminating the wait time that previously interrupted experimentation workflows.

After it’s created, I receive an MLflow Amazon Resource Name (ARN) for connecting from notebooks. The simplified management means no server sizing decisions or capacity planning required. I no longer need to choose between different configurations or manage infrastructure capacity, which means I can focus entirely on experimentation. You can learn how to use MLflow SDK at Integrate MLflow with your environment in the Amazon SageMaker Developer Guide.

With MLflow 3.4 support, I can now access new capabilities for generative AI development. MLflow Tracing captures detailed execution paths, inputs, outputs, and metadata throughout the development lifecycle, enabling efficient debugging across distributed AI systems.

This new capability also introduces cross-domain access and cross-account access through AWS Resource Access Manager (AWS RAM) share. This enhanced collaboration means that teams across different AWS domains and accounts can share MLflow instances securely, breaking down organizational silos.

Better together: Pipelines integration
Amazon SageMaker Pipelines is integrated with MLflow. SageMaker Pipelines is a serverless workflow orchestration service purpose-built for machine learning operations (MLOps) and large language model operations (LLMOps) automation—the practices of deploying, monitoring, and managing ML and LLM models in production. You can easily build, execute, and monitor repeatable end-to-end AI workflows with an intuitive drag-and-drop UI or the Python SDK.

From a pipeline, a default MLflow App will be created if one doesn’t already exist. The experiment name can be defined and metrics, parameters, and artifacts are logged to the MLflow App as defined in your code. SageMaker AI with MLflow is also integrated with familiar SageMaker AI model development capabilities like SageMaker AI JumpStart and Model Registry, enabling end-to-end workflow automation from data preparation through model fine-tuning.

Things to know
Here are key points to note:

  • Pricing – The new serverless MLflow capability is offered at no additional cost. Note there are service limits that apply.
  • Availability – This capability is available in the following AWS Regions: US East (N. Virginia, Ohio), US West (N.California, Oregon), Asia Pacific (Mumbai, Seoul, Singapore, Sydney, Tokyo), Canada (Central), Europe (Frankfurt, Ireland, London, Paris, Stockholm), South America (São Paulo).
  • Automatic upgrades: MLflow in-place version upgrades happen automatically, providing access to the latest features without manual migration work or compatibility concerns. The service currently supports MLflow 3.4, providing access to the latest capabilities including enhanced tracing features.
  • Migration support – You can use the open source MLflow export-import tool available at mlflow-export-import to help migrate from existing Tracking Servers, whether they’re from SageMaker AI, self-hosted, or otherwise to serverless MLflow (MLflow Apps).

Get started with serverless MLflow by visiting Amazon SageMaker AI Studio and creating your first MLflow App. Serverless MLflow is also supported in SageMaker Unified Studio for additional workflow flexibility.

Happy experimenting!
Donnie

Build production-ready applications without infrastructure complexity using Amazon ECS Express Mode

Post Syndicated from Donnie Prakoso original https://aws.amazon.com/blogs/aws/build-production-ready-applications-without-infrastructure-complexity-using-amazon-ecs-express-mode/

Deploying containerized applications to production requires navigating hundreds of configuration parameters across load balancers, auto scaling policies, networking, and security groups. This overhead delays time to market and diverts focus from core application development.

Today, I’m excited to announce Amazon ECS Express Mode, a new capability from Amazon Elastic Container Service (Amazon ECS) that helps you launch highly available, scalable containerized applications with a single command. ECS Express Mode automates infrastructure setup including domains, networking, load balancing, and auto scaling through simplified APIs. This means you can focus on building applications while deploying with confidence using Amazon Web Services (AWS) best practices. Furthermore, when your applications evolve and require advanced features, you can seamlessly configure and access the full capabilities of the resources, including Amazon ECS.

You can get started with Amazon ECS Express Mode by navigating to the Amazon ECS console.

Amazon ECS Express Mode provides a simplified interface to the Amazon ECS service resource with new integrations for creating commonly used resources across AWS. ECS Express Mode automatically provisions and configures ECS clusters, task definitions, Application Load Balancers, auto scaling policies, and Amazon Route 53 domains from a single entry point.

Getting started with ECS Express Mode
Let me walk you through how to use Amazon ECS Express Mode. I’ll focus on the console experience, which provides the quickest way to deploy your containerized application.

For this example, I’m using a simple container image application running on Python with the Flask framework. Here’s the Dockerfile of my demo, which I have pushed to an Amazon Elastic Container Registry (Amazon ECR) repository:


# Build stage
FROM python:3.6-slim as builder
WORKDIR /app
COPY requirements.txt .
RUN pip install --no-cache-dir --user -r requirements.txt gunicorn

# Runtime stage
FROM python:3.6-slim
WORKDIR /app
COPY --from=builder /root/.local /root/.local
COPY app.py .
ENV PATH=/root/.local/bin:$PATH
EXPOSE 80
CMD ["gunicorn", "--bind", "0.0.0.0:80", "app:app"]

On the Express Mode page, I choose Create. The interface is streamlined — I specify my container image URI from Amazon ECR, then select my task execution role and infrastructure role. If you don’t already have these roles, choose Create new role in the drop down to have one created for you from the AWS Identity and Access Management (IAM) managed policy.

If I want to customize the deployment, I can expand the Additional configurations section to define my cluster, container port, health check path, or environment variables.

In this section, I can also adjust CPU, memory, or scaling policies.

Setting up logs in Amazon CloudWatch Logs is something I always configure so I can troubleshoot my applications if needed. When I’m happy with the configurations, I choose Create.

After I choose Create, Express Mode automatically provisions a complete application stack, including an Amazon ECS service with AWS Fargate tasks, Application Load Balancer with health checks, auto scaling policies based on CPU utilization, security groups and networking configuration, and a custom domain with an AWS provided URL. I can also follow the progress in Timeline view on the Resources tab.

If I need to do a programmatic deployment, the same result can be achieved with a single AWS Command Line Interface (AWS CLI) command:

aws ecs create-express-gateway-service \
--image [ACCOUNT_ID].ecr.us-west-2.amazonaws.com/myapp:latest \
--execution-role-arn arn:aws:iam::[ACCOUNT_ID]:role/[IAM_ROLE] \
--infrastructure-role-arn arn:aws:iam::[ACCOUNT_ID]:role/[IAM_ROLE]

After it’s complete, I can see my application URL in the console and access my running application immediately.

After the application is created, I can see the details by visiting the specified cluster, or the default cluster if I didn’t specify one, in the ECS service to monitor performance, view logs, and manage the deployment.

When I need to update my application with a new container version, I can return to the console, select my Express service, and choose Update. I can use the interface to specify a new image URI or adjust resource allocations.

Alternatively, I can use the AWS CLI for updates:

aws ecs update-express-gateway-service \
  --service-arn arn:aws:ecs:us-west-2:[ACCOUNT_ID]:service/[CLUSTER_NAME]/[APP_NAME] \
  --primary-container '{
    "image": "[IMAGE_URI]"
  }'

I find the entire experience reduces setup complexity while still giving me access to all the underlying resources when I need more advanced configurations.

Additional things to know
Here are additional things about ECS Express Mode:

  • Availability – ECS Express Mode is available in all AWS Regions at launch.
  • Infrastructure as Code support – You can use IaC tools such as AWS CloudFormation, AWS Cloud Development Kit (CDK), or Terraform to deploy your applications using Amazon ECS Express Mode.
  • Pricing – There is no additional charge to use Amazon ECS Express Mode. You pay for AWS resources created to launch and run your application.
  • Application Load Balancer sharing – The ALB created is automatically shared across up to 25 ECS services using host-header based listener rules. This helps distribute the cost of the ALB significantly.

Get started with Amazon ECS Express Mode through the Amazon ECS console. Learn more on the Amazon ECS documentation page.

Happy building!
Donnie

Simplify access to external services using AWS IAM Outbound Identity Federation

Post Syndicated from Donnie Prakoso original https://aws.amazon.com/blogs/aws/simplify-access-to-external-services-using-aws-iam-outbound-identity-federation/

When building applications that span multiple cloud providers or integrate with external services, developers face a persistent challenge: managing credentials securely. Traditional approaches require storing long-term credentials like API keys and passwords, creating security risks and operational overhead.

Today, we’re announcing a new capability called AWS Identity and Access Management (IAM) outbound identity federation that customers can use to securely federate their Amazon Web Services (AWS) identities to external services without storing long-term credentials. You can now use short-lived JSON Web Tokens (JWTs) to authenticate your AWS workloads with a wide range of third-party providers, software-as-a-service (SaaS) platforms and self-hosted applications.

This feature enables IAM principals—such as IAM roles and users—to obtain cryptographically signed JWTs that assert their AWS identity. External services, such as third-party providers, SaaS platforms, and on-premises applications, can verify the token’s authenticity by validating its signature. Upon successful verification, you can securely access the external service.

How it works
With IAM outbound identity federation, you exchange your AWS IAM credentials for short-lived JWTs. This mitigates the security risks associated with long-term credentials while enabling consistent authentication patterns.

Let’s walk through a scenario where your application running on AWS needs to interact with an external service. To access the external service’s APIs or resources, your application calls the AWS Security Token Service (AWS STS) `GetWebIdentityToken` API to obtain a JWT.

The following diagram shows this flow:

  1. Your application running on AWS requests a token from AWS STS by calling the GetWebIdentityToken API. The application uses its existing AWS credentials obtained from the underlying platform (such as Amazon EC2 instance profiles, AWS Lambda execution roles, or other AWS compute services) to authenticate this API call.
  2. AWS STS returns a cryptographically signed JSON Web Token (JWT) that asserts the identity of your application.
  3. Your application sends the JWT to the external service for authentication.
  4. The external service fetches the verification keys from the JSON Web Key Set (JWKS) endpoint to verify the token’s authenticity.
  5. The external service validates the JWT’s signature using these verification keys and confirms the token is authentic and was issued by AWS.
  6. After successful verification, the external service exchanges the JWT for its own credentials. Your application can then use these credentials to perform its intended operations.

Setting up AWS IAM outbound identity federation
To begin using this feature, I need to enable outbound identity federation for my AWS account. I navigate to IAM and choose Account settings under Access management in the left-hand navigation pane.

After I enable the feature, AWS generates a unique issuer URL for my AWS account that hosts the OpenID Connect (OIDC) discovery endpoints at /.well-known/openid-configuration and /.well-known/jwks.json. The OpenID Connect (OIDC) discovery endpoints contain the keys and metadata necessary for token verification.

Next, I need to configure IAM permissions. My IAM principal (role or user) must have the sts:GetWebIdentityToken permission to request tokens.

For example, the following identity policy specifies access to the STS GetWebIdentityToken API, enabling the IAM principal to generate tokens.

{
  "Version": "2012-10-17",
  "Statement": [
    {
      "Effect": "Allow",
      "Action": "sts:GetWebIdentityToken",
      "Resource": "*",
    }
  ]
}

At this stage, I need to configure the external service to trust and accept tokens issued by my AWS account. The specific steps vary by service, but generally involve:

  1. Registering my AWS account issuer URL as a trusted identity provider
  2. Configuring which claims to validate (audience, subject patterns)
  3. Mapping token claims to permissions in the external service

Let’s get started
Now, let me walk you through an example showing both the client-side token generation and server-side verification process.

First, I call the STS GetWebIdentityToken API to obtain a JWT that asserts my AWS identity. When calling the API, I can specify the intended audience, signing algorithm, and token lifetime as request parameters.

  • Audience: Populates the `aud` claim in the JWT, identifying the intended recipient of the token (for example, “my-app”)
  • DurationSeconds: The token lifetime in seconds, ranging from 60 seconds (1 minute) to 3600 seconds (1 hour), with a default of 600 seconds (5 minutes)
  • SigningAlgorithm: Choose either ES384 (ECDSA using P-384 and SHA-384) or RS256 (RSA using SHA-256)
  • Tags (optional): An array of key-value pairs that appear as custom claims in the token, which you can use to include additional context that enables external services to implement fine-grained access control

Here’s an example of getting an identity token using the AWS SDK for Python (Boto3). I can also do this using AWS Command Line Interface (AWS CLI).


import boto3

sts_client = boto3.client('sts')
response = sts_client.get_web_identity_token(
    Audience=['my-app'],
    SigningAlgorithm='ES384',  # or 'RS256'
    DurationSeconds=300
)
jwt_token = response['IdentityToken']
print(jwt_token)

This returns a signed JWT that I can inspect using any JWT parser.

{
eyJraWQiOiJFQzM4NF8wIiwidHlwIjoiSldUIiwiYWxnIjoiRVMzODQifQ.hey<REDACTED FOR BREVITY>...

I can decode the token using any JWT parser like this JWT Debugger. The token header shows it’s signed with ES384 (ECDSA).


{
  "kid": "EC384_0",
  "typ": "JWT",
  "alg": "ES384"
}

Also, the payload contains standard OIDC claims plus AWS specific metadata. The standard OIDC claims include subject (“sub”), audience (“aud”), issuer (“iss”), and others.

{
  "aud": "my-app",
  "sub": "arn:aws:iam::ACCOUNT_ID:role/MyAppRole",
  "https://sts.amazonaws.com/": {
    "aws_account": "ACCOUNT_ID",
    "source_region": "us-east-1",
    "principal_id": "arn:aws:iam::ACCOUNT_ID:role/MyAppRole"
  },
  "iss": "https://abc12345-def4-5678-90ab-cdef12345678.tokens.sts.global.api.aws",
  "exp": 1759786941,
  "iat": 1759786041,
  "jti": "5488e298-0a47-4c5b-80d7-6b4ab8a4cede"
}

AWS STS also enriches the token with identity-specific claims (such as account ID, organization ID, and principal tags) and session context. These claims provide information about the compute environment and session where the token request originated. AWS STS automatically includes these claims when applicable based on the requesting principal’s session context. You can also add custom claims to the token by passing request tags to the API call. To learn more about claims provided in the JWT, visit the documentation page.

Note the iss (issuer) claim. This is your account-specific issuer URL that external services use to verify that the token originated from a trusted AWS account. External services can verify the JWT by validating its signature using AWS’s verification keys available at a public JSON Web Key Set (JWKS) endpoint hosted at the /.well-known/jwks.json endpoint of the issuer URL.

Now, let’s look at how external services handle this identity token.

Here’s a snippet of Python example that external services can use to verify AWS tokens:


import json
import jwt
import requests
from jwt import PyJWKClient

# Trusted issuers list - obtained from EnableOutboundFederation API response
TRUSTED_ISSUERS = [
    "https://EXAMPLE.tokens.sts.global.api.aws",
    # Add your trusted AWS account issuer URLs here
    # Obtained from EnableOutboundFederation API response
]

def verify_aws_jwt(token, expected_audience=None):
    """Verify an AWS IAM outbound identity federation JWT"""
    try:
        # Get issuer from token
        unverified_payload = jwt.decode(token, options={"verify_signature": False})
        issuer = unverified_payload.get('iss')

 	# Verify issuer is trusted
        if not TRUSTED_ISSUERS or issuer not in TRUSTED_ISSUERS:
            raise ValueError(f"Untrusted issuer: {issuer}")

        # Fetch JWKS from AWS using PyJWKClient
        jwks_client = PyJWKClient(f"{issuer}/.well-known/jwks.json")
        signing_key = jwks_client.get_signing_key_from_jwt(token)

        # Verify token signature and claims
        decoded_token = jwt.decode(
            token,
            signing_key.key,
            algorithms=["ES384", "RS256"],
            audience=expected_audience,
            issuer=issuer
        )
        return decoded_token
    except Exception as e:
        print(f"Token verification failed: {e}")
        return None

Using IAM policies to control access to token generation
An IAM principal (such as a role or user) must have the sts:GetWebIdentityToken permission in their IAM policies to request tokens for authentication with external services. AWS account administrators can configure this permission in all relevant AWS policy types such as identity policies, service control policies (SCPs), resource control policies (RCPs), and virtual private cloud endpoint (VPCE) policies to control which IAM principals in their account can generate tokens.

Additionally, administrators can use the new condition keys to specify signing algorithms (sts:SigningAlgorithm), permitted token audiences (sts:IdentityTokenAudience), and maximum token lifetimes (sts:DurationSeconds). To learn more about the condition keys, visit IAM and STS Condition keys documentation page.

Additional things to know
Here are key details about this launch:

Get started with AWS IAM outbound identity federation by visiting AWS IAM console and enabling the feature in your AWS account. For more information, visit Federating AWS Identities to External Services documentation page.

Happy building!
Donnie

Accelerate workflow development with enhanced local testing in AWS Step Functions

Post Syndicated from Donnie Prakoso original https://aws.amazon.com/blogs/aws/accelerate-workflow-development-with-enhanced-local-testing-in-aws-step-functions/

Today, I’m excited to announce enhanced local testing capabilities for AWS Step Functions through the TestState API, our testing API.

These enhancements are available through the API, so you can build automated test suites that validate your workflow definitions locally on your development machines, test error handling patterns, data transformations, and mock service integrations using your preferred testing frameworks. This launch introduces an API-based approach for local unit testing, providing programmatic access to comprehensive testing capabilities without deploying to Amazon Web Services (AWS).

There are three key capabilities introduced in this enhanced TestState API:

  • Mocking support – Mock state outputs and errors without invoking downstream services, enabling true unit testing of state machine logic. TestState validates mocked responses against AWS API models with three validation modes: STRICT (this is the default and validates all required fields), PRESENT (validates field types and names), and NONE (no validation), providing high-fidelity testing.

  • Support for all state types – All state types, including advanced states such as Map states (inline and distributed), Parallel states, activity-based Task states, .sync service integration patterns, and .waitForTaskToken service integration patterns, can now be tested. This means you can use TestState API across your entire workflow definition and write unit tests to verify control flow logic, including state transitions, error handling, and data transformations.

  • Testing individual states – Test specific states within a full state machine definition using the new stateName parameter. You can provide the complete state machine definition one time and test each state individually by name. You can control execution context to test specific retry attempts, Map iteration positions, and error scenarios.

Getting started with enhanced TestState
Let me walk you through these new capabilities in enhanced TestState.

Scenario 1: Mock successful results

The first capability is mocking support, which you can use to test your workflow logic without invoking actual AWS services or even external HTTP requests. You can either mock service responses for fast unit testing or test with actual AWS services for integration testing. When using mocked responses, you don’t need AWS Identity and Access Management (IAM) permissions.

Here’s how to mock a successful AWS Lambda function response:

aws stepfunctions test-state --region us-east-1 \
--definition '{
  "Type": "Task",
  "Resource": "arn:aws:states:::lambda:invoke",
  "Parameters": {"FunctionName": "process-order"},
  "End": true
}' \
--mock '{"result":"{\"orderId\":\"12345\",\"status\":\"processed\"}"}' \
--inspection-level DEBUG

This command tests a Lambda invocation state without actually calling the function. TestState validates your mock response against the Lambda service API model so your test data matches what the real service would return.

The response shows the successful execution with detailed inspection data (when using DEBUG inspection level):

{
    "output": "{\"orderId\":\"12345\",\"status\":\"processed\"}",
    "inspectionData": {
        "input": "{}",
        "afterInputPath": "{}",
        "afterParameters": "{\"FunctionName\":\"process-order\"}",
        "result": "{\"orderId\":\"12345\",\"status\":\"processed\"}",
        "afterResultSelector": "{\"orderId\":\"12345\",\"status\":\"processed\"}",
        "afterResultPath": "{\"orderId\":\"12345\",\"status\":\"processed\"}"
    },
    "status": "SUCCEEDED"
}

When you specify a mock response, TestState validates it against the AWS service’s API model so your mocked data conforms to the expected schema, maintaining high-fidelity testing without requiring actual AWS service calls.

Scenario 2: Mock error conditions
You can also mock error conditions to test your error handling logic:

aws stepfunctions test-state --region us-east-1 \
--definition '{
  "Type": "Task",
  "Resource": "arn:aws:states:::lambda:invoke",
  "Parameters": {"FunctionName": "process-order"},
  "End": true
}' \
--mock '{"errorOutput":{"error":"Lambda.ServiceException","cause":"Function failed"}}' \
--inspection-level DEBUG

This simulates a Lambda service exception so you can verify how your state machine handles failures without triggering actual errors in your AWS environment.

The response shows the failed execution with error details:

{
    "error": "Lambda.ServiceException",
    "cause": "Function failed",
    "inspectionData": {
        "input": "{}",
        "afterInputPath": "{}",
        "afterParameters": "{\"FunctionName\":\"process-order\"}"
    },
    "status": "FAILED"
}

Scenario 3: Test Map states
The second capability adds support for previously unsupported state types. Here’s how to test a Distributed Map state:

aws stepfunctions test-state --region us-east-1 \
--definition '{
  "Type": "Map",
  "ItemProcessor": {
    "ProcessorConfig": {"Mode": "DISTRIBUTED", "ExecutionType": "STANDARD"},
    "StartAt": "ProcessItem",
    "States": {
      "ProcessItem": {
        "Type": "Task", 
        "Resource": "arn:aws:states:::lambda:invoke",
        "Parameters": {"FunctionName": "process-item"},
        "End": true
      }
    }
  },
  "End": true
}' \
--input '[{"itemId":1},{"itemId":2}]' \
--mock '{"result":"[{\"itemId\":1,\"status\":\"processed\"},{\"itemId\":2,\"status\":\"processed\"}]"}' \
--inspection-level DEBUG

The mock result represents the complete output from processing multiple items. In this case, the mocked array must match the expected Map state output format.

The response shows successful processing of the array input:

{
    "output": "[{\"itemId\":1,\"status\":\"processed\"},{\"itemId\":2,\"status\":\"processed\"}]",
    "inspectionData": {
        "input": "[{\"itemId\":1},{\"itemId\":2}]",
        "afterInputPath": "[{\"itemId\":1},{\"itemId\":2}]",
        "afterResultSelector": "[{\"itemId\":1,\"status\":\"processed\"},{\"itemId\":2,\"status\":\"processed\"}]",
        "afterResultPath": "[{\"itemId\":1,\"status\":\"processed\"},{\"itemId\":2,\"status\":\"processed\"}]"
    },
    "status": "SUCCEEDED"
}

Scenario 4: Test Parallel states
Similarly, you can test Parallel states that execute multiple branches concurrently:

aws stepfunctions test-state --region us-east-1 \
--definition '{
  "Type": "Parallel",
  "Branches": [
    {"StartAt": "Branch1", "States": {"Branch1": {"Type": "Pass", "End": true}}},
    {"StartAt": "Branch2", "States": {"Branch2": {"Type": "Pass", "End": true}}}
  ],
  "End": true
}' \
--mock '{"result":"[{\"branch1\":\"data1\"},{\"branch2\":\"data2\"}]"}' \
--inspection-level DEBUG

The mock result must be an array with one element per branch. By using TestState, your mock data structure matches what a real Parallel state execution would produce.

The response shows the parallel execution results:

{
    "output": "[{\"branch1\":\"data1\"},{\"branch2\":\"data2\"}]",
    "inspectionData": {
        "input": "{}",
        "afterResultSelector": "[{\"branch1\":\"data1\"},{\"branch2\":\"data2\"}]",
        "afterResultPath": "[{\"branch1\":\"data1\"},{\"branch2\":\"data2\"}]"
    },
    "status": "SUCCEEDED"
}

Scenario 5: Test individual states within complete workflows
You can test specific states within a full state machine definition using the stateName parameter. Here’s an example testing a single state, though you would typically provide your complete workflow definition and specify which state to test:

aws stepfunctions test-state --region us-east-1 \
--definition '{
  "Type": "Task",
  "Resource": "arn:aws:states:::lambda:invoke",
  "Parameters": {"FunctionName": "validate-order"},
  "End": true
}' \
--input '{"orderId":"12345","amount":99.99}' \
--mock '{"result":"{\"orderId\":\"12345\",\"validated\":true}"}' \
--inspection-level DEBUG

This tests a Lambda invocation state with specific input data, showing how TestState processes the input and transforms it through the state execution.

The response shows detailed input processing and validation:

{
    "output": "{\"orderId\":\"12345\",\"validated\":true}",
    "inspectionData": {
        "input": "{\"orderId\":\"12345\",\"amount\":99.99}",
        "afterInputPath": "{\"orderId\":\"12345\",\"amount\":99.99}",
        "afterParameters": "{\"FunctionName\":\"validate-order\"}",
        "result": "{\"orderId\":\"12345\",\"validated\":true}",
        "afterResultSelector": "{\"orderId\":\"12345\",\"validated\":true}",
        "afterResultPath": "{\"orderId\":\"12345\",\"validated\":true}"
    },
    "status": "SUCCEEDED"
}

These enhancements bring the familiar local development experience to Step Functions workflows, helping me to get instant feedback on changes before deploying to my AWS account. I can write automated test suites to validate all Step Functions features with the same reliability as cloud execution, providing confidence that my workflows will work as expected when deployed.

Things to know
Here are key points to note:

  • Availability – Enhanced TestState capabilities are available in all AWS Regions where Step Functions is supported.
  • Pricing – TestState API calls are included with AWS Step Functions at no additional charge.
  • Framework compatibility – TestState works with any testing framework that can make HTTP requests, including Jest, pytest, JUnit, and others. You can write test suites that validate your workflows automatically in your continuous integration and continuous delivery (CI/CD) pipeline before deployment.
  • Feature support – Enhanced TestState supports all Step Functions features including Distributed Map, Parallel states, error handling, and JSONata expressions.
  • Documentation – For detailed options for different configurations, refer to the TestState documentation and API reference for the updated request and response model.

Get started today with enhanced local testing by integrating TestState into your development workflow.

Happy building!
Donnie

Streamlined multi-tenant application development with tenant isolation mode in AWS Lambda

Post Syndicated from Donnie Prakoso original https://aws.amazon.com/blogs/aws/streamlined-multi-tenant-application-development-with-tenant-isolation-mode-in-aws-lambda/

Multi-tenant applications often require strict isolation when processing tenant-specific code or data. Examples include software-as-a-service (SaaS) platforms for workflow automation or code execution where customers need to ensure that execution environments used for individual tenants or end users remain completely separate from one another. Traditionally, developers have addressed these requirements by deploying separate Lambda functions for each tenant or implementing custom isolation logic within shared functions which increased architectural and operational complexity.

Today, AWS Lambda introduces a new tenant isolation mode that extends the existing isolation capabilities in Lambda. Lambda already provides isolation at the function level, and this new mode extends isolation to the individual tenant or end-user level within a single function. This built-in capability processes function invocations in separate execution environments for each tenant, enabling you to meet strict isolation requirements without additional implementation effort to manage tenant-specific resources within function code.

Here’s how you can enable tenant isolation mode in the AWS Lambda console:

When using the new tenant isolation capability, Lambda associates function execution environments with customer-specified tenant identifiers. This means that execution environments for a particular tenant aren’t used to serve invocation requests from other tenants invoking the same Lambda function.

The feature addresses strict security requirements for SaaS providers processing sensitive data or running untrusted tenant code. You maintain the pay-per-use and performance characteristics of AWS Lambda while gaining execution environment isolation. Additionally, this approach delivers the security benefits of per-tenant infrastructure without the operational overhead of managing dedicated Lambda functions for individual tenants, which can quickly grow as customers adopt your application.

Getting started with AWS Lambda tenant isolation
Let me walk you through how to configure and use tenant isolation for a multi-tenant application.

First, on the Create function page in the AWS Lambda console, I choose Author from scratch option.

Then, under Additional configurations, I select Enable under Tenant isolation mode. Note that, tenant isolation mode can only be set during function creation and can’t be modified for existing Lambda functions.

Next, I write Python code to demonstrate this capability. I can access the tenant identifier in my function code through the context object. Here’s the full Python code:

import json
import os
from datetime import datetime

def lambda_handler(event, context):
    tenant_id = context.tenant_id
    file_path = '/tmp/tenant_data.json'

    # Read existing data or initialize
    if os.path.exists(file_path):
        with open(file_path, 'r') as f:
            data = json.load(f)
    else:
        data = {
            'tenant_id': tenant_id,
            'request_count': 0,
            'first_request': datetime.utcnow().isoformat(),
            'requests': []
        }

    # Increment counter and add request info
    data['request_count'] += 1
    data['requests'].append({
        'request_number': data['request_count'],
        'timestamp': datetime.utcnow().isoformat()
    })

    # Write updated data back to file
    with open(file_path, 'w') as f:
        json.dump(data, f, indent=2)

    # Return file contents to show isolation
    return {
        'statusCode': 200,
        'body': json.dumps({
            'message': f'File contents for {tenant_id} (isolated per tenant)',
            'file_data': data
        })
    }

When I’m finished, I choose Deploy. Now, I need to test this capability by choosing Test. I can see on the Create new test event panel that there’s a new setting called Tenant ID.

If I try to invoke this function without a tenant ID, I’ll get the following error “Add a valid tenant ID in your request and try again.”

Let me try to test this function with a tenant ID called tenant-A.

I can see the function ran successfully and returned request_count: 1. I’ll invoke this function again to get request_count: 2.

Now, let me try to test this function with a tenant ID called tenant-B.

The last invocation returned request_count: 1 because I never invoked this function with tenant-B. Each tenant’s invocations will use separate execution environments, isolating the cached data, global variables, and any files stored in /tmp.

This capability transforms how I approach multi-tenant serverless architecture. Instead of wrestling with complex isolation patterns or managing hundreds of tenant-specific Lambda functions, I let AWS Lambda automatically handle the isolation. This keeps tenant data isolated across tenants, giving me confidence in the security and separation of my multi-tenant application.

Additional things to know
Here’s a list of additional things you need to know:

  • Performance — Same-tenant invocations can still benefit from warm execution environment reuse for optimal performance.
  • Pricing — You’re charged when Lambda creates a new tenant-aware execution environment, with the price depending on the amount of memory you allocate to your function and the CPU architecture you use. For more details, view AWS Lambda pricing.
  • Availability — Available now in all commercial AWS Regions except Asia Pacific (New Zealand), AWS GovCloud (US), and China Regions.

This launch simplifies building multi-tenant applications on AWS Lambda, such as SaaS platforms for workflow automation or code execution. Learn more about how to configure tenant isolation for your next multi-tenant Lambda function in the AWS Lambda Developer Guide.

Happy building!
Donnie

Monitor network performance and traffic across your EKS clusters with Container Network Observability

Post Syndicated from Donnie Prakoso original https://aws.amazon.com/blogs/aws/monitor-network-performance-and-traffic-across-your-eks-clusters-with-container-network-observability/

Organizations are increasingly expanding their Kubernetes footprint by deploying microservices to incrementally innovate and deliver business value faster. This growth places increased reliance on the network, giving platform teams exponentially complex challenges in monitoring network performance and traffic patterns in EKS. As a result, organizations struggle to maintain operational efficiency as their container environments scale, often delaying application delivery and increasing operational costs.

Today, I’m excited to announce Container Network Observability in Amazon Elastic Kubernetes Service (Amazon EKS), a comprehensive set of network observability features in Amazon EKS that you can use to better measure your network performance in your system and dynamically visualize the landscape and behavior of network traffic in EKS.

Here’s a quick look at Container Network Observability in Amazon EKS:

Container Network Observability in EKS addresses observability challenges by providing enhanced visibility of workload traffic. It offers performance insights into network flows within the cluster and those with cluster-external destinations. This makes your EKS cluster network environment more observable while providing built-in capabilities for more precise troubleshooting and investigative efforts.

Getting started with Container Network Observability in EKS

I can enable this new feature for a new or existing EKS cluster. For a new EKS cluster, during the Configure observability setup, I navigate to the Configure network observability section. Here, I select Edit container network observability. I can see there are three included features: Service map, Flow table, and Performance metric endpoint, which are enabled by Amazon CloudWatch Network Flow Monitor.

On the next page, I need to install the AWS Network Flow Monitor Agent.

After it’s enabled, I can navigate to my EKS cluster and select Monitor cluster.

This will bring me to my cluster observability dashboard. Then, I select the Network tab.


Comprehensive observability features
Container Network Observability in EKS provides several key features, including performance metrics, service map, and flow table with three views: AWS service view, cluster view, and external view.

With Performance metrics, you can now scrape network-related system metrics for pods and worker nodes directly from the Network Flow Monitor agent and send them to your preferred monitoring destination. Available metrics include ingress/egress flow counts, packet counts, bytes transferred, and various allowance exceeded counters for bandwidth, packets per second, and connection tracking limits. The following screenshot shows an example of how you can use Amazon Managed Grafana to visualize the performance metrics scraped using Prometheus.


With the Service map feature, you can dynamically visualize intercommunication between workloads in your cluster, making it straightforward to understand your application topology with a quick look. The service map helps you quickly identify performance issues by highlighting key metrics such as retransmissions, retransmission timeouts, and data transferred for network flows between communicating pods.

Let me show you how this works with a sample e-commerce application. The service map provides both high-level and detailed views of your microservices architecture. In this e-commerce example, we can see three core microservices working together: the GraphQL service acts as an API gateway, orchestrating requests between the frontend and backend services.

When a customer browses products or places an order, the GraphQL service coordinates communication with both the products service (for catalog data, pricing, and inventory) and the orders service (for order processing and management). This architecture allows each service to scale independently while maintaining clear separation of concerns.

For deeper troubleshooting, you can expand the view to see individual pod instances and their communication patterns. The detailed view reveals the complexity of microservices communication. Here, you can see multiple pod instances for each service and the network of connections between them.

This granular visibility is crucial for identifying issues like uneven load distribution, pod-to-pod communication bottlenecks, or when specific pod instances are experiencing higher latency. For example, if one GraphQL pod is making disproportionately more calls to a particular products pod, you can quickly spot this pattern and investigate potential causes.

Use the Flow table to monitor the top talkers across Kubernetes workloads in your cluster from three different perspectives, each providing unique insights into your network traffic patterns.

Flow table – Monitor the top talkers across Kubernetes workloads in your cluster from three different perspectives, each providing unique insights into your network traffic patterns:

  • AWS service view shows which workloads generate the most traffic to Amazon Web Services (AWS) services such as Amazon DynamoDB and Amazon Simple Storage Service (Amazon S3), so you can optimize data access patterns and identify potential cost optimization opportunities.
  • The Cluster view reveals the heaviest communicators within your cluster (east-west traffic), which means you can spot chatty microservices that might benefit from optimization or colocation strategies
  • External viewidentifies workloads with the highest traffic to destinations outside AWS (internet or on premises), which is useful for security monitoring and bandwidth management.

The flow table provides detailed metrics and filtering capabilities to analyze network traffic patterns. In this example, we can see the flow table displaying cluster view traffic between our e-commerce services. The table shows that the orders pod is communicating with multiple products pods, transferring amounts of data. This pattern suggests the orders service is making frequent product lookups during order processing.

The filtering capabilities are useful for troubleshooting, for example, to focus on traffic from a specific orders pod. This granular filtering helps you quickly isolate communication patterns when investigating performance issues. For instance, if customers are experiencing slow checkout times, you can filter to see if the orders service is making too many calls to the products service, or if there are network bottlenecks between specific pod instances.

Additional things to know
Here are key points to note about Container Network Observability in EKS:

  • Pricing – For network monitoring, you pay standard Amazon CloudWatch Network Flow Monitor pricing.
  • Availability – Container Network Observability in EKS is available in all commercial AWS regions where Amazon CloudWatch Network Flow Monitor is available.
  • Export metrics to your preferred monitoring solution – Metrics are available in OpenMetrics format, compatible with Prometheus and Grafana. For configuration details, refer to Network Flow Monitor documentation.

Get started with Container Network Observability in Amazon EKS today to improve network observability in your cluster.

Happy building!
Donnie

Accelerate AI agent development with the Nova Act IDE extension

Post Syndicated from Donnie Prakoso original https://aws.amazon.com/blogs/aws/accelerate-ai-agent-development-with-the-nova-act-ide-extension/

Today, I’m excited to announce the Nova Act extension — a tool that streamlines the path to build browser automation agents without leaving your IDE. The Nova Act extension integrates directly into IDEs like Visual Studio Code (VS Code), Kiro, and Cursor, helping you to create web-based automation agents using natural language with the Nova Act model.

Here’s a quick look at the Nova Act extension in Visual Studio Code:

The Nova Act extension is built on top of the Amazon Nova Act SDK (preview), our browser automation agents SDK (Software Development Kit). The Nova Act extension transforms traditional workflow development by eliminating context switching between coding and testing environments. You can now build, customize, and test production-grade agent scripts—all within your IDE—using features like natural language based generation, atomic cell-style editing, and integrated browser testing. This unified experience accelerates development velocity for tasks like form filling, QA automation, search, and complex multi-step workflows.

You can start with the Nova Act extension by describing your workflow in natural language to quickly generate an initial agent script. Customize it using the notebook-style builder mode to integrate APIs, data sources, and authentication, then validate it with local testing tools that simulate real-world conditions, including live step-by-step debugging of lengthy multi-step workflows.

Getting started with the Nova Act extension
First, I need to install the Nova Act extension from the extension manager in my IDE. 

I’m using Visual Studio Code, and after choosing Extensions, I enter Nova Act. Then, I select the extension and choose Install

To get started, I need to obtain an API key. To do this, I navigate to the Nova Act page and follow the instructions to get the API key. I select Set API Key by opening the Command Palette with Cmd+Shift+P / Ctrl+Shift+P.

After I’ve entered my API key, I can try Builder Mode. This is a notebook-style builder mode that breaks complex automation scripts into modular cells, allowing me to test and debug each step individually before moving to the next.

Here, I can use the Nova Act SDK to build my agent. On the right side, I have a Live view panel to preview my agent’s actions in the browser and an Output panel to monitor execution logs, including the model’s thinking and actions.

To test the Nova Act extension, I choose Run all cells. This will start a new browser instance and act based on the given prompt.

I choose Fullscreen to see how browser automation works.

Another useful feature in Builder Mode is that I can navigate to the Output panel and select the cell to see its logs. This helps me debug or review logs specific to the cell I’m working on.

I can also select a template to get started.

Besides using Builder Mode, I can also chat with Nova Act to create a script for me. To do that, I select the extension and choose Generate Nova Act Script. The Nova Act extension opens a chat dialog in the right panel and automatically creates a script for me.

After I finish creating the script, I can choose Start Builder Mode, and the Nova Act extension will help me create a Python file in Builder Mode. This creates a seamless integration because I can switch between chat capability and Builder Mode.

In the chat interface, I see three workflow modes available:

  • Ask: Describe tasks in natural language to generate automation scripts
  • Edit: Refine or customize generated scripts before execution
  • Agent: Run, monitor, and interact with the AI agent performing the workflow

I can also add Context to provide relevant information about my active documents, instructions, problems, or additional Model Context Protocol (MCP) resources the agent can use, plus a screenshot of the current window. Providing this information helps the agent understand any specific requirements for the automation task.

The Nova Act extension also provides a set of predefined templates that I can access by entering / in the chat. These templates are predefined automation scenarios designed to help quickly generate scripts for common web tasks.

I can use these templates (for example, @novaAct /shopping [my requirements]) to get tailored Python scripts for my workflow. At launch, Nova Act extension provides the following templates:

  • /shopping: Automates online shopping tasks (searching, comparing, purchasing)
  • /extract: Handles data extraction
  • /search: Performs search and information gathering
  • /qa: Automates quality assurance and testing workflows
  • /formfilling: Completes forms and data entry tasks

This extension transforms my agent development workflow by positioning Nova Act extension as a full-stack agent builder tool—a complete agent IDE for the entire development lifecycle. I can prototype with natural language, customize with modular scripting, and validate with local testing—all without leaving my IDE—ensuring production-grade scripts.

Things to know
Here are key points to note:

  • Supported IDEs: At launch, the Nova Act extension is available for Visual Studio Code, Cursor, and Kiro, with additional IDE support planned
  • Open source: The Nova Act extension is available under the Apache 2.0 license, allowing for community contributions and customization
  • Pricing: The Nova Act extension is available at no charge.

Get started with Nova Act extension by installing it from your IDE’s extension marketplace or visiting the GitHub repository for documentation and examples.

Happy automating!
Donnie

AWS Weekly Roundup: Amazon Q Developer, AWS Step Functions, AWS Cloud Club Captain deadline, and more (September 22, 2025)

Post Syndicated from Donnie Prakoso original https://aws.amazon.com/blogs/aws/aws-weekly-roundup-amazon-q-developer-aws-step-functions-aws-cloud-club-captain-deadline-and-more-september-22-2025/

Three weeks ago, I published a post about the new AWS Region in New Zealand (ap-southeast-6). This led to an incredible opportunity to visit New Zealand, where I met passionate builders and presented at several events including Serverless and Platform Engineering meetup, AWS Tools and Programming meetup, AWS Cloud Clubs in Auckland, and AWS Community Day New Zealand.

During my content creation process for these presentations, I discovered a useful feature in Amazon Q CLI called tangent mode. This feature has transformed how I stay focused by creating conversation checkpoints that let you explore side topics without losing your main thread.

This feature is in experimental mode, and you can enable it with q settings chat.enableTangentMode true. Try it out and see if it helps you.

Last week’s launches
Here are some launches that got my attention:

  • New Foundation Models in Amazon Bedrock — Amazon Bedrock expands its model selection with Qwen model family, DeepSeek-V3.1, and Stability AI image services now generally available, giving developers access to powerful multilingual models and advanced image generation capabilities for text generation, code generation, image creation, and complex problem-solving tasks.
  • Amazon VPC Reachability Analyzer Expands to Seven New Regions — Network Access Analyzer capabilities are now available in additional regions, helping customers analyze and troubleshoot network connectivity issues across their VPC infrastructure with improved global coverage.
  • Amazon Q Developer Supports Remote MCP Servers — Amazon Q Developer now integrates with remote Model Context Protocol (MCP) servers, enabling developers to extend their AI assistant capabilities with custom tools and data sources for enhanced development workflows.
  • AWS Step Functions Enhances Distributed Map with New Data Source Options — Step Functions introduces additional data source options and improved observability features for Distributed Map, making it easier to process large-scale parallel workloads with better monitoring and debugging capabilities.
  • Amazon Corretto 25 Generally Available — Amazon’s no-cost, multiplatform distribution of OpenJDK 25 is now generally available, providing Java developers with long-term support, performance enhancements, and security updates for building modern applications.
  • Amazon SageMaker HyperPod Introduces Autoscaling — SageMaker HyperPod now supports automatic scaling capabilities, allowing machine learning teams to dynamically adjust compute resources based on workload demands, optimizing both performance and cost for distributed training jobs.

Additional Updates

  • AWS Named Leader in 2025 Gartner Magic Quadrant for AI Code Assistants – AWS has been recognized as a Leader in Gartner’s Magic Quadrant for AI Code Assistants, highlighting Amazon Q Developer’s capabilities in helping developers write code faster and more securely with AI-powered suggestions.
  • Become an AWS Cloud Club Captain – Only a couple of days before it closes! Join a growing network of student cloud enthusiasts by becoming an AWS Cloud Club Captain! As a Captain, you’ll get to organize events and build cloud communities while developing leadership skills. The application window is open September 1-28, 2025.

Upcoming AWS events
Check your calendars and sign up for these upcoming AWS events as well as AWS re:Invent and AWS Summits:

  • AWS AI Agent Global Hackathon – This is your chance to dive deep into our powerful generative AI stack and create something truly awesome. From September 8th to October 20th, you have the opportunity to create AI agents using AWS suite of AI services, competing for over $45,000 in prizes and exclusive go-to-market opportunities.
  • AWS Gen AI Lofts – You can learn AWS AI products and services with exclusive sessions and meet industry-leading experts, and have valuable networking opportunities with investors and peers. Register in your nearest city: Mexico City (September 30–October 2), Paris (October 7–21), London (Oct 13–21), and Tel Aviv (November 11–19).
  • AWS Community Days – Join community-led conferences that feature technical discussions, workshops, and hands-on labs led by expert AWS users and industry leaders from around the world: South Africa (September 20), Bolivia (September 20), Portugal (September 27), and Manila (October 4-5).

You can browse all upcoming AWS events and AWS startup events.

That’s all for this week. Check back next Monday for another Weekly Roundup!

Happy building!

— Donnie

Now Open — AWS Asia Pacific (New Zealand) Region

Post Syndicated from Donnie Prakoso original https://aws.amazon.com/blogs/aws/now-open-aws-asia-pacific-new-zealand-region/

Kia ora! Today, I’m pleased to share the general availability of the AWS Asia Pacific (New Zealand) Region with three Availability Zones and API name ap-southeast-6. With the new Region, customers can now run workloads and securely store data in New Zealand while serving end users with even lower latency.

The new AWS Asia Pacific (New Zealand) Region will help organizations run their applications and serve end users while maintaining data residency in New Zealand. The NZD $7.5 billion Amazon Web Services (AWS) investment to establish an AWS Region in New Zealand is expected to contribute NZD $10.8 billion to New Zealand’s gross domestic product (GDP) which is estimated to create 1,000 new jobs annually and will enable Kiwi organizations of all sizes to innovate and scale faster using the most secure and resilient infrastructure.

AWS in New Zealand
Since we opened our first office in New Zealand in 2013, we’ve been continuously expanding our infrastructure to better serve Kiwi customers:

Connectivity to the global AWS network – In 2016, AWS enhanced New Zealand’s connectivity to the AWS Global Infrastructure by establishing diverse, high-capacity subsea cable connections, improving network reliability and performance for customers.

Amazon CloudFront – In 2020, AWS expanded its infrastructure footprint in New Zealand by adding two Amazon CloudFront edge locations in Auckland.

AWS Local Zones – To further enhance its infrastructure offerings in New Zealand, AWS introduced an AWS Local Zone in Auckland in 2023 helping customers deliver applications that require single-digit millisecond latency.

AWS Direct Connect – In the same year, AWS also added a Direct Connect location in Auckland to help customers securely link their on-premises networks to AWS resulting in lower networking costs and improved application performance. With this Region launch, AWS is adding another Direct Connect location in Auckland.

Let’s take a look at how AWS customers are leveraging AWS capabilities for diverse needs.

Security and compliance
The New Zealand government has a cloud first policy to encourage cloud adoption across the public sector. AWS supports 143 security standards and compliance certifications, including Payment Card Industry Data Security Standard (PCI DSS), Health Insurance Portability and Accountability Act (HIPAA) and Health Information Technology for Economic and Clinical Health (HITECH), Federal Risk and Authorization Management Program (FedRAMP), General Data Protection Regulation (GDPR), Federal Information Processing Standard (FIPS) 140-3, and National Institute of Standards and Technology (NIST) 800-171, helping customers satisfy compliance requirements around the globe and providing a secure cloud infrastructure.

MATTR, a New Zealand-based organization providing infrastructure and digital trust services to businesses and governments, sees significant benefits from the new Region. To learn more about how MATTR and other organizations like Kiwibank and Deloitte plan to use the AWS New Zealand Region, visit this news article.

Accelerating AI innovation in New Zealand
AWS delivers the most comprehensive set of capabilities for generative AI at every layer of the stack, including a choice of cutting-edge large language models (LLMs) for implementing generative AI with Amazon Bedrock, and the most capable generative AI assistant to transform how work gets done with Amazon Q.

New Zealand customers are already benefiting from the generative AI capabilities offered by AWS.

Thematic is a New Zealand-based global leader in customer intelligence and feedback analysis. Thematic uses generative AI to turn customer feedback data from multiple channels into curated, accurate, and reliable customer intelligence.

“Using Amazon Bedrock is just so incredibly easy that it just makes sense. Whenever we design a solution, we do test more than 10 large language models (LLMs). Consistently the ones offered by AWS are winning those competitions,” said Nathan Holmberg, CTO and Co-Founder, Thematic.

To learn more on other customers like One NZ utilized generative AI, visit this article.

Building cloud skills together
Since signing a memorandum of understanding (MoU) with the New Zealand government in 2022, Amazon has trained more than 50,000 Kiwis toward our goal of 100,000. Amazon is committed to continuing to invest in cloud education through programs including AWS Academy, AWS Skills Builder, AWS Educate, and AWS re/Start. Organizations are using AWS to scale globally while investing in local talent development, supporting New Zealand’s growing demand for cloud expertise.

Xero, a global small business platform helps customers supercharge their business by bringing together the most important small business tools, including accounting, payroll and payments — on one platform. Leveraging AWS since 2016, Xero has scaled its platform globally, enhancing its features and enabling continual innovation.

“Amazon’s commitment to the New Zealand tech industry through their NZD $7.5B investment is promising. It’s a significant vote of confidence that will help connect New Zealand tech exporters with new global opportunities across the AWS ecosystem and the broader Amazon network,” says Bridget Snelling, Xero Country Manager, Aotearoa New Zealand.

Sustainable digital transformation
Through The Climate Pledge, Amazon is committed to reaching net-zero carbon across its business by 2040. AWS is committed to supporting New Zealand’s sustainability goals with efficient and responsible operations of its data centers in the country. The AWS Asia Pacific (New Zealand) Region is underpinned by renewable energy from day one through its agreement with Mercury New Zealand.

Energy companies are using AWS to modernize operations while advancing sustainability goals. Sharesies, a wealth development platform, is using AWS to modernize operations while advancing sustainability goals.

“Sharesies is very supportive of storing customer data in-country and being able to use renewable energy, “ says Sharesies Chief Technical Officer Richard Clark. “To do this in New Zealand on the AWS Cloud and have it fully powered by Mercury’s wind energy is a huge step forward. And very exciting!”

AWS partners in New Zealand
The AWS Partner Network (APN) in New Zealand includes a growing ecosystem of consulting and technology partners helping customers of all sizes design, architect, build, migrate, and manage their workloads on AWS. AWS Partners like Custom D, Grant Thornton Digital, MongoDB, and Parallo are actively supporting customers to deliver innovative solutions tailored to the unique needs of New Zealand organizations across various industries. With the new Region, these partners can now leverage the full capabilities of AWS cloud services locally.

AWS community in New Zealand
New Zealand is also home to one AWS Hero, 26 AWS Community Builders, 6 AWS User Groups and almost 9,000 community members across AWS User Groups in Auckland, Wellington, and Christchurch. If you’re interested in joining AWS User Groups New Zealand, visit their Meetup and social media pages.

Here’s what our AWS Hero Arshad Zackeriya, says about the new Region:

“The launch of the AWS Region in New Zealand is a game-changer for our country. It’s not just about a new set of data centers; it’s about unlocking the potential of New Zealand’s businesses and developer communities, allowing us to build a better, more connected Aotearoa for all.”

Available now
The AWS Asia Pacific (New Zealand) Region is the first infrastructure Region in New Zealand and sixteenth Region in Asia Pacific. With this launch, AWS now spans 120 Availability Zones within 38 geographic Regions around the world, with announced plans for 10 more Availability Zones and three more AWS Regions in the Kingdom of Saudi Arabia, Chile, and the European Sovereign Cloud.

The new Asia Pacific (New Zealand) Region is ready to support your business, and you can find a detailed list of the services available in this Region on the AWS Services by Region page. To learn more, visit the AWS Global Infrastructure page, and start building on ap-southeast-6!

Happy building!
Donnie

AWS Weekly Roundup: Kiro, AWS Lambda remote debugging, Amazon ECS blue/green deployments, Amazon Bedrock AgentCore, and more (July 21, 2025)

Post Syndicated from Donnie Prakoso original https://aws.amazon.com/blogs/aws/aws-weekly-roundup-kiro-aws-lambda-remote-debugging-amazon-ecs-blue-green-deployments-amazon-bedrock-agentcore-and-more-july-21-2025/

I’m writing this as I depart from Ho Chi Minh City back to Singapore. Just realized what a week it’s been, so let me rewind a bit. This week, I tried my first Corne keyboard, wrapped up rehearsals for AWS Summit Jakarta with speakers who are absolutely raising the bar, and visited Vietnam to participate as a technical keynote speaker in AWS Community Day Vietnam, an energetic gathering of hundreds of cloud practitioners and AWS enthusiasts who shared knowledge through multiple technical tracks and networking sessions.

What I presented was a keynote titled “Reinvent perspective as modern developers”, featuring serverless, containers, and how we can cut the learning curves and be more productive with Amazon Q Developer and Kiro. I got a chance to discuss with a couple of AWS Community Builders and community developers, who shared how Amazon Q Developer actually addressed their challenges on building applications, with several highlighting significant productivity improvements and smoother learning curves in their cloud development journeys.

As I head back to Singapore, I’m carrying with me not just memories of delicious cà phê sữa đá (iced milk coffee), but also fresh perspectives and inspirations from this vibrant community of cloud innovators.

Introducing Kiro
One of the highlights from last week was definitely Kiro, an AI IDE that helps you deliver from concept to production through a simplified developer experience for working with AI agents. Kiro goes beyond “vibe coding” with features like specs and hooks that help get prototypes into production systems with proper planning and clarity.

Join the waitlist to get notified when it becomes available.

Last week’s AWS Launches
In other news, last week we had AWS Summit in New York, where we released several services. Here are some launches that caught my attention:

Console to IDE Integration

ECS Blue-Green Deployments

AWS Free Tier Enhanced Benefits

  • Monitor and debug event-driven applications with new Amazon EventBridge logging — Amazon EventBridge now provides enhanced logging capabilities that offer comprehensive event lifecycle tracking with detailed information about successes, failures, and status codes. This new observability feature addresses microservices and event-driven architecture monitoring challenges by providing visibility into the complete event journey.

EventBridge Enhanced Logging

S3 Vectors Overview

  • Amazon EKS enables ultra-scale AI/ML workloads with support for 100k nodes per cluster — Amazon EKS now supports up to 100,000 worker nodes in a single cluster, enabling customers to scale up to 1.6 million AWS Trainium accelerators or 800K NVIDIA GPUs. This industry-leading scale empowers customers to train trillion-parameter models and advance AGI development while maintaining Kubernetes conformance and familiar developer experience.

EKS Ultra-Scale Performance Improvements

From AWS Builder Center
In case you missed it, we just launched AWS Builder Center and integrated community.aws. Here are my top picks from the posts:

Upcoming AWS events
Check your calendars and sign up for upcoming AWS and AWS Community events:

  • AWS re:Invent – Register now to get a head start on choosing your best learning path, booking travel and accommodations, and bringing your team to learn, connect, and have fun. If you’re an early-career professional, you can apply to the All Builders Welcome Grant program, which is designed to remove financial barriers and create diverse pathways into cloud technology.
  • AWS Builders Online Series – If you’re based in one of the Asia Pacific time zones, join and learn fundamental AWS concepts, architectural best practices, and hands-on demonstrations to help you build, migrate, and deploy your workloads on AWS.
  • AWS Summits — Join free online and in-person events that bring the cloud computing community together to connect, collaborate, and learn about AWS. Register in your nearest city: Taipei (July 29), Mexico City (August 6), and Jakarta (June 26–27).
  • AWS Community Days — Join community-led conferences that feature technical discussions, workshops, and hands-on labs led by expert AWS users and industry leaders from around the world: Singapore (August 2), Australia (August 15), Adria (September 5), Baltic (September 10), and Aotearoa (September 18).

You can browse all upcoming AWS led in-person and virtual developer-focused events.

That’s all for this week. Check back next Monday for another Weekly Roundup!

Donnie

This post is part of our Weekly Roundup series. Check back each week for a quick roundup of interesting news and announcements from AWS!


Join Builder ID: Get started with your AWS Builder journey at builder.aws.com

Accelerate safe software releases with new built-in blue/green deployments in Amazon ECS

Post Syndicated from Donnie Prakoso original https://aws.amazon.com/blogs/aws/accelerate-safe-software-releases-with-new-built-in-blue-green-deployments-in-amazon-ecs/

While containers have revolutionized how development teams package and deploy applications, these teams have had to carefully monitor releases and build custom tooling to mitigate deployment risks, which slows down shipping velocity. At scale, development teams spend valuable cycles building and maintaining undifferentiated deployment tools instead of innovating for their business.

Starting today, you can use the built-in blue/green deployment capability in Amazon Elastic Container Service (Amazon ECS) to make your application deployments safer and more consistent. This new capability eliminates the need to build custom deployment tooling while giving you the confidence to ship software updates more frequently with rollback capability.

Here’s how you can enable the built-in blue/green deployment capability in the Amazon ECS console.

You create a new “green” application environment while your existing “blue” environment continues to serve live traffic. After monitoring and testing the green environment thoroughly, you route the live traffic from blue to green. With this capability, Amazon ECS now provides built-in functionality that makes containerized application deployments safer and more reliable.

Below is a diagram illustrating how blue/green deployment works by shifting application traffic from the blue environment to the green environment. You can learn more at the Amazon ECS blue/green service deployments workflow page.

Amazon ECS orchestrates this entire workflow while providing event hooks to validate new versions using synthetic traffic before routing production traffic. You can validate new software versions in production environments before exposing them to end users and roll back near-instantaneously if issues arise. Because this functionality is built directly into Amazon ECS, you can add these safeguards by simply updating your configuration without building any custom tooling.

Getting started
Let me walk you through a demonstration that showcases how to configure and use blue/green deployments for an ECS service. Before that, there are a few setup steps that I need to complete, including configuring AWS Identity and Access Management (IAM) roles, which you can find on the Required resources for Amazon ECS blue/green deployments Documentation page.

For this demonstration, I want to deploy a new version of my application using the blue/green strategy to minimize risk. First, I need to configure my ECS service to use blue/green deployments. I can do this through the ECS console, AWS Command Line Interface (AWS CLI), or using infrastructure as code.

Using the Amazon ECS console, I create a new service and configure it as usual:

In the Deployment Options section, I choose ECS as the Deployment controller type, then Blue/green as the Deployment strategy. Bake time is the time after the production traffic has shifted to green, when instant rollback to blue is available. When the bake time expires, blue tasks are removed.

We’re also introducing deployment lifecycle hooks. These are event-driven mechanisms you can use to augment the deployment workflow. I can select which AWS Lambda function I’d like to use as a deployment lifecycle hook. The Lambda function can perform the required business logic, but it must return a hook status.

Amazon ECS supports the following lifecycle hooks during blue/green deployments. You can learn more about each stage on the Deployment lifecycle stages page.

  • Pre scale up
  • Post scale up
  • Production traffic shift
  • Test traffic shift
  • Post production traffic shift
  • Post test traffic shift

For my application, I want to test when the test traffic shift is complete and the green service handles all of the test traffic. Since there’s no end-user traffic, a rollback at this stage will have no impact on users. This makes Post test traffic shift suitable for my use case as I can test it first with my Lambda function.

Switching context for a moment, let’s focus on the Lambda function that I use to validate the deployment before allowing it to proceed. In my Lambda function as a deployment lifecycle hook, I can perform any business logic, such as synthetic testing, calling another API, or querying metrics.

Within the Lambda function, I must return a hookStatus. A hookStatus can be SUCCESSFUL, which will move the process to the next step. If the status is FAILED, it rolls back to the blue deployment. If it’s IN_PROGRESS, then Amazon ECS retries the Lambda function in 30 seconds.

In the following example, I set up my validation with a Lambda function that performs file upload as part of a test suite for my application.

import json
import urllib3
import logging
import base64
import os

# Configure logging
logger = logging.getLogger()
logger.setLevel(logging.DEBUG)

# Initialize HTTP client
http = urllib3.PoolManager()

def lambda_handler(event, context):
    """
    Validation hook that tests the green environment with file upload
    """
    logger.info(f"Event: {json.dumps(event)}")
    logger.info(f"Context: {context}")
    
    try:
        # In a real scenario, you would construct the test endpoint URL
        test_endpoint = os.getenv("APP_URL")
        
        # Create a test file for upload
        test_file_content = "This is a test file for deployment validation"
        test_file_data = test_file_content.encode('utf-8')
        
        # Prepare multipart form data for file upload
        fields = {
            'file': ('test.txt', test_file_data, 'text/plain'),
            'description': 'Deployment validation test file'
        }
        
        # Send POST request with file upload to /process endpoint
        response = http.request(
            'POST', 
            test_endpoint,
            fields=fields,
            timeout=30
        )
        
        logger.info(f"POST /process response status: {response.status}")
        
        # Check if response has OK status code (200-299 range)
        if 200 <= response.status < 300:
            logger.info("File upload test passed - received OK status code")
            return {
                "hookStatus": "SUCCEEDED"
            }
        else:
            logger.error(f"File upload test failed - status code: {response.status}")
            return {
                "hookStatus": "FAILED"
            }
            
    except Exception as error:
        logger.error(f"File upload test failed: {str(error)}")
        return {
            "hookStatus": "FAILED"
        }

When the deployment reaches the lifecycle stage that is associated with the hook, Amazon ECS automatically invokes my Lambda function with deployment context. My validation function can run comprehensive tests against the green revision—checking application health, running integration tests, or validating performance metrics. The function then signals back to ECS whether to proceed or abort the deployment.

As I chose the blue/green deployment strategy, I also need to configure the load balancers and/or Amazon ECS Service Connect. In the Load balancing section, I select my Application Load Balancer.

In the Listener section, I use an existing listener on port 80 and select two Target groups.

Happy with this configuration, I create the service and wait for ECS to provision my new service.

Testing blue/green deployments
Now, it’s time to test my blue/green deployments. For this test, Amazon ECS will trigger my Lambda function after the test traffic shift is completed. My Lambda function will return FAILED in this case as it performs file upload to my application, but my application doesn’t have this capability.

I update my service and check Force new deployment, knowing the blue/green deployment capability will roll back if it detects a failure. I select this option because I haven’t modified the task definition but still need to trigger a new deployment.

At this stage, I have both blue and green environments running, with the green revision handling all the test traffic. Meanwhile, based on Amazon CloudWatch Logs of my Lambda function, I also see that the deployment lifecycle hooks work as expected and emit the following payload:

[INFO]	2025-07-10T13:15:39.018Z	67d9b03e-12da-4fab-920d-9887d264308e	Event: 
{
    "executionDetails": {
        "testTrafficWeights": {},
        "productionTrafficWeights": {},
        "serviceArn": "arn:aws:ecs:us-west-2:123:service/EcsBlueGreenCluster/nginxBGservice",
        "targetServiceRevisionArn": "arn:aws:ecs:us-west-2:123:service-revision/EcsBlueGreenCluster/nginxBGservice/9386398427419951854"
    },
    "executionId": "a635edb5-a66b-4f44-bf3f-fcee4b3641a5",
    "lifecycleStage": "POST_TEST_TRAFFIC_SHIFT",
    "resourceArn": "arn:aws:ecs:us-west-2:123:service-deployment/EcsBlueGreenCluster/nginxBGservice/TFX5sH9q9XDboDTOv0rIt"
}

As expected, my AWS Lambda function returns FAILED as hookStatus because it failed to perform the test.

[ERROR]	2025-07-10T13:18:43.392Z	67d9b03e-12da-4fab-920d-9887d264308e	File upload test failed: HTTPConnectionPool(host='xyz.us-west-2.elb.amazonaws.com', port=80): Max retries exceeded with url: / (Caused by ConnectTimeoutError(<urllib3.connection.HTTPConnection object at 0x7f8036273a80>, 'Connection to xyz.us-west-2.elb.amazonaws.com timed out. (connect timeout=30)'))

Because the validation wasn’t completed successfully, Amazon ECS tries to roll back to the blue version, which is the previous working deployment version. I can monitor this process through ECS events in the Events section, which provides detailed visibility into the deployment progress.

Amazon ECS successfully rolls back the deployment to the previous working version. The rollback happens near-instantaneously because the blue revision remains running and ready to receive production traffic. There is no end-user impact during this process, as production traffic never shifted to the new application version—ECS simply rolled back test traffic to the original stable version. This eliminates the typical deployment downtime associated with traditional rolling deployments.

I can also see the rollback status in the Last deployment section.

Throughout my testing, I observed that the blue/green deployment strategy provides consistent and predictable behavior. Furthermore, the deployment lifecycle hooks provide more flexibility to control the behavior of the deployment. Each service revision maintains immutable configuration including task definition, load balancer settings, and Service Connect configuration. This means that rollbacks restore exactly the same environment that was previously running.

Additional things to know
Here are a couple of things to note:

  • Pricing – The blue/green deployment capability is included with Amazon ECS at no additional charge. You pay only for the compute resources used during the deployment process.
  • Availability – This capability is available in all commercial AWS Regions.

Get started with blue/green deployments by updating your Amazon ECS service configuration in the Amazon ECS console.

Happy deploying!
Donnie

Streamline the path from data to insights with new Amazon SageMaker Catalog capabilities

Post Syndicated from Donnie Prakoso original https://aws.amazon.com/blogs/aws/streamline-the-path-from-data-to-insights-with-new-amazon-sagemaker-capabilities/

Modern organizations manage data across multiple disconnected systems—structured databases, unstructured files, and separate visualization tools—creating barriers that slow analytics workflows and limit insight generation. Separate visualization platforms often create barriers that prevent teams from extracting comprehensive business insights.

These disconnected workflows prevent your organizations from maximizing your data investments, creating delays in decision making and missed opportunities for comprehensive analysis that combines multiple data types.

Starting today, you can use three new capabilities in Amazon SageMaker to accelerate your path from raw data to actionable insights:

  • Amazon QuickSight integration – Launch Amazon QuickSight directly from Amazon SageMaker Unified Studio to build dashboards using your project data, then publish them to the Amazon SageMaker Catalog for broader discovery and sharing across your organization.
  • Amazon SageMaker adds support for Amazon S3 general purpose buckets and Amazon S3 Access Grants in SageMaker Catalog– Make data stored in Amazon S3 general purpose buckets easier for teams to find, access, and collaborate on all types of data including unstructured data, while maintaining fine-grained access control using Amazon S3 Access Grants.
  • Automatic data onboarding from your lakehouse – Automatic onboarding of existing AWS Glue Data Catalog (GDC) datasets from the lakehouse architecture into SageMaker Catalog, without manual setup.

These new SageMaker capabilities address the complete data lifecycle within a unified and governed experience. You get automatic onboarding of existing structured data from your lakehouse, seamless cataloging of unstructured data content in Amazon S3, and streamlined visualization through QuickSight—all with consistent governance and access controls.

Let’s take a closer look at each capability.

Amazon SageMaker and Amazon QuickSight Integration
With this integration, you can build dashboards in Amazon QuickSight using data from your Amazon SageMaker projects. When you launch QuickSight from Amazon SageMaker Unified Studio, Amazon SageMaker automatically creates the QuickSight dataset and organizes it in a secured folder accessible only to project members.

Furthermore, the dashboards you build stay within this folder and automatically appear as assets in your SageMaker project, where you can publish them to the SageMaker Catalog and share them with users or groups in your corporate directory. This keeps your dashboards organized, discoverable, and governed within SageMaker Unified Studio.

To use this integration, both your Amazon SageMaker Unified Studio domain and QuickSight account must be integrated with AWS IAM Identity Center using the same IAM Identity Center instance. Additionally, your QuickSight account must exist in the same AWS account where you want to enable the QuickSight blueprint. You can learn more about the prerequisites on Documentation page

After these prerequisites are met, you can enable the blueprint for Amazon QuickSight by navigating to the Amazon SageMaker console and choosing the Blueprints tab. Then find Amazon QuickSight and follow the instructions.

You also need to configure your SQL analytics project profile to include Amazon QuickSight in Add blueprint deployment settings.

To learn more on onboarding setup, refer to the Documentation page.

Then, when you create a new project, you need to use the SQL analytics profile.

With your project created, you can start building visualizations with QuickSight. You can navigate to the Data tab, select the table or view to visualize, and choose Open in QuickSight under Actions.

This will redirect you to the Amazon QuickSight transactions dataset page and you can choose USE IN ANALYSIS to begin exploring the data.

When you create a project with the QuickSight blueprint, SageMaker Unified Studio automatically provisions a restricted QuickSight folder per project where SageMaker scopes all new assets—analyses, datasets, and dashboards. The integration maintains real-time folder permission sync, keeping QuickSight folder access permissions aligned with project membership.

Amazon Simple Storage Service (S3) general purpose buckets integration
Starting today, SageMaker adds support for S3 general purpose buckets in SageMaker Catalog to increase discoverability and allows granular permissions through S3 Access Grants, enabling users to govern data, including sharing and managing permissions. Data consumers, such as data scientists, engineers, and business analysts, can now discover and access S3 assets through SageMaker Catalog. This expansion also enables data producers to govern security controls on any S3 data asset through a single interface.

To use this integration, you need appropriate S3 general purpose bucket permissions, and your SageMaker Unified Studio projects must have access to the S3 buckets containing your data. Learn more about prerequisites on Amazon S3 data in Amazon SageMaker Unified Studio Documentation page.

You can add a connection to an existing S3 bucket.

When it’s connected, you can browse accessible folders and create discoverable assets by choosing on the bucket or a folder and selecting Publish to Catalog.

This action creates a SageMaker Catalog asset of type “S3 Object Collection” and opens an asset details page where users can augment business context to improve search and discoverability. Once published, data consumers can discover and subscribe to these cataloged assets. When data consumers subscribe to “S3 Object Collection” assets, SageMaker Catalog automatically grants access using S3 Access Grants upon approval, enabling cross-team collaboration while ensuring only the right users have the right access.

When you have access, now you can process your unstructured data in Amazon SageMaker Jupyter notebook. Following screenshot is an example to process image in medical use case.

If you have structured data, you can query your data using Amazon Athena or process using Spark in notebooks.

With this access granted through S3 Access Grants, you can seamlessly incorporate S3 data into my workflows—analyzing it in notebooks, combining it with structured data in the lakehouse and Amazon Redshift for comprehensive analytics. You can access unstructured data such as documents, images in JupyterLab notebooks to train ML models, or generate queryable insights.

Automatic data onboarding from your lakehouse
This integration automatically onboards all your lakehouse datasets into SageMaker Catalog. The key benefit for you is to bring AWS Glue Data Catalog (GDC) datasets into SageMaker Catalog, eliminating manual setup for cataloging, sharing, and governing them centrally.

This integration requires an existing lakehouse setup with Data Catalog containing your structured datasets.

When you set up a SageMaker domain, SageMaker Catalog automatically ingests metadata from all lakehouse databases and tables. This means you can immediately explore and use these datasets from within SageMaker Unified Studio without any configuration.

The integration helps you to start managing, governing, and consuming these assets from within SageMaker Unified Studio, applying the same governance policies and access controls you can use for other data types while unifying technical and business metadata.

Additional things to know
Here are a couple of things to note:

  • Availability – These integrations are available in all commercial AWS Regions where Amazon SageMaker is supported.
  • Pricing – Standard SageMaker Unified Studio, QuickSight, and Amazon S3 pricing applies. No additional charges for the integrations themselves.
  • Documentation – You can find complete setup guides in the SageMaker Unified Studio Documentation.

Get started with these new integrations through the Amazon SageMaker Unified Studio console.

Happy building!
Donnie

Monitor and debug event-driven applications with new Amazon EventBridge logging

Post Syndicated from Donnie Prakoso original https://aws.amazon.com/blogs/aws/monitor-and-debug-event-driven-applications-with-new-amazon-eventbridge-logging/

Starting today, you can use enhanced logging capability in Amazon EventBridge to monitor and debug your event-driven applications with comprehensive logs. These new enhancements help improve how you monitor and troubleshoot event flows.

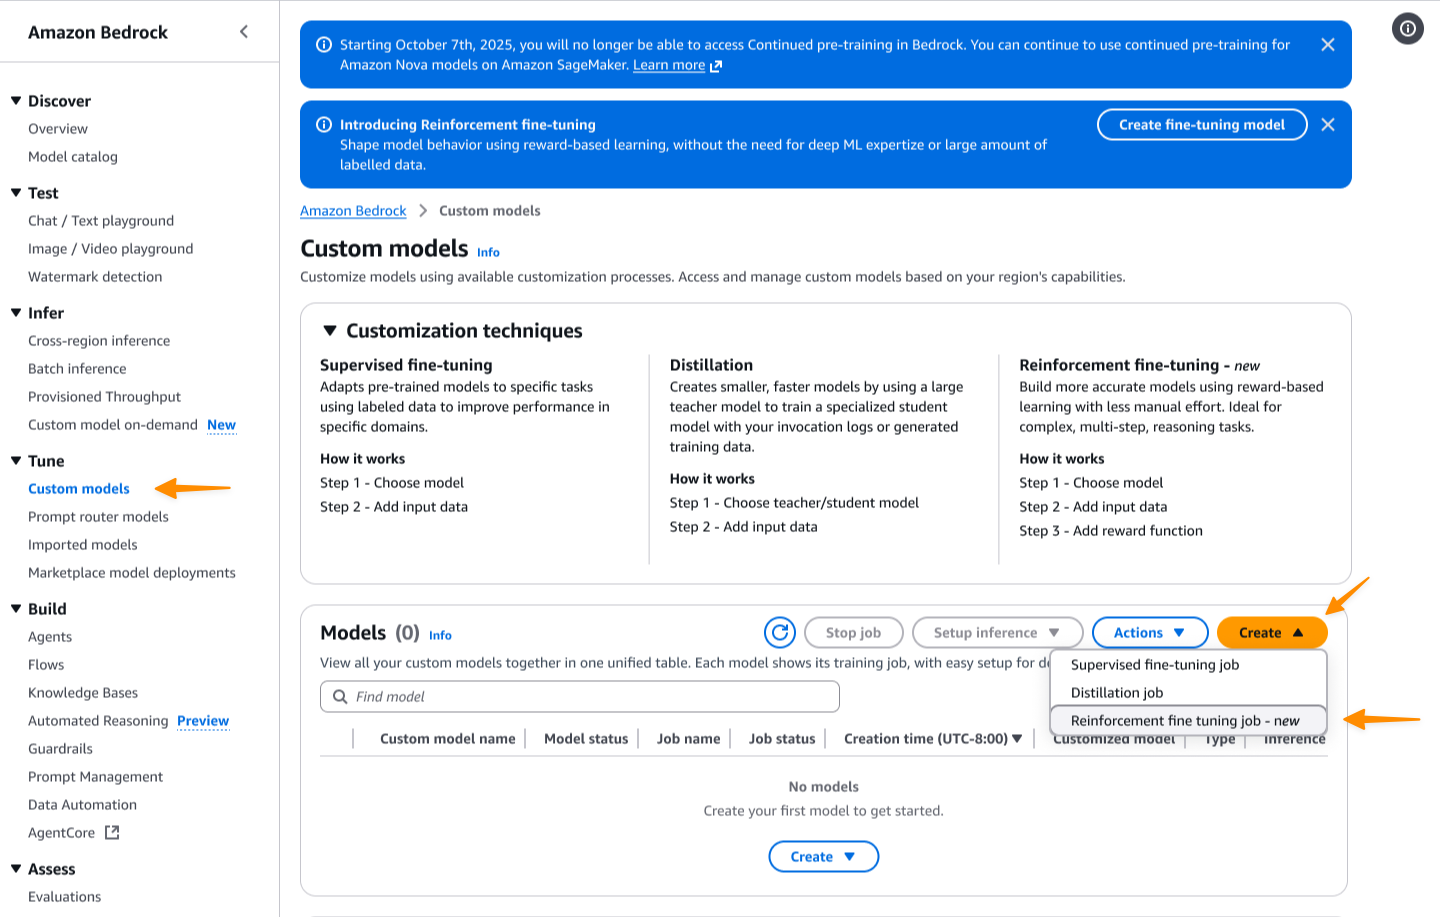
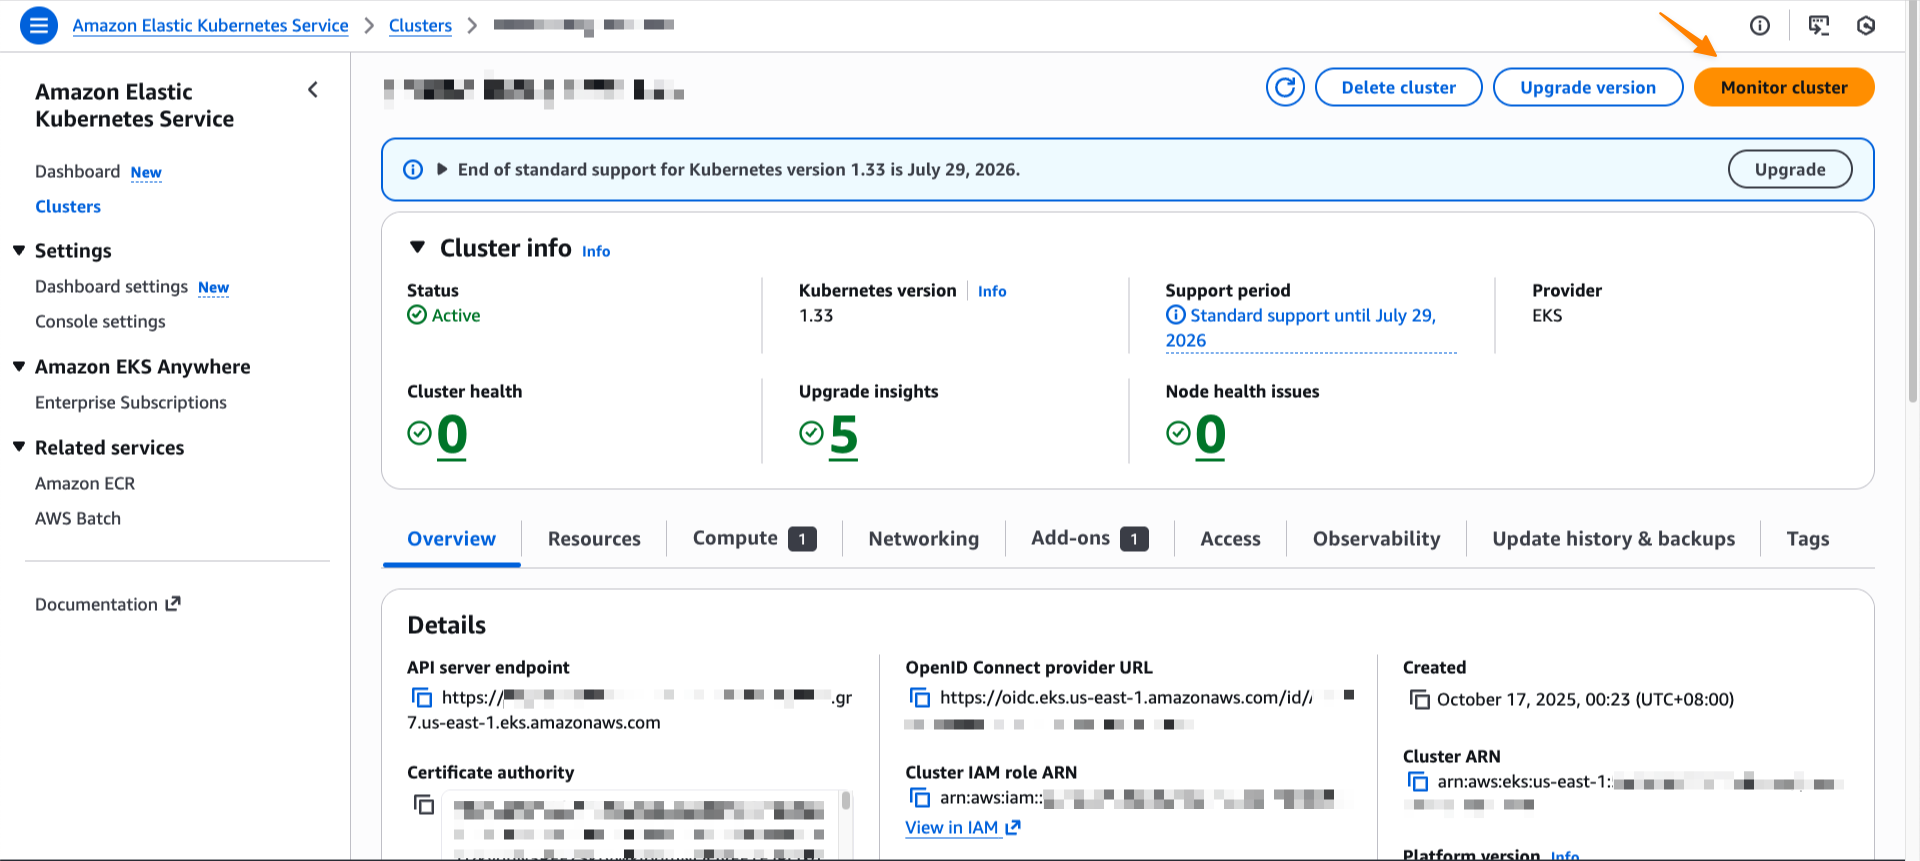
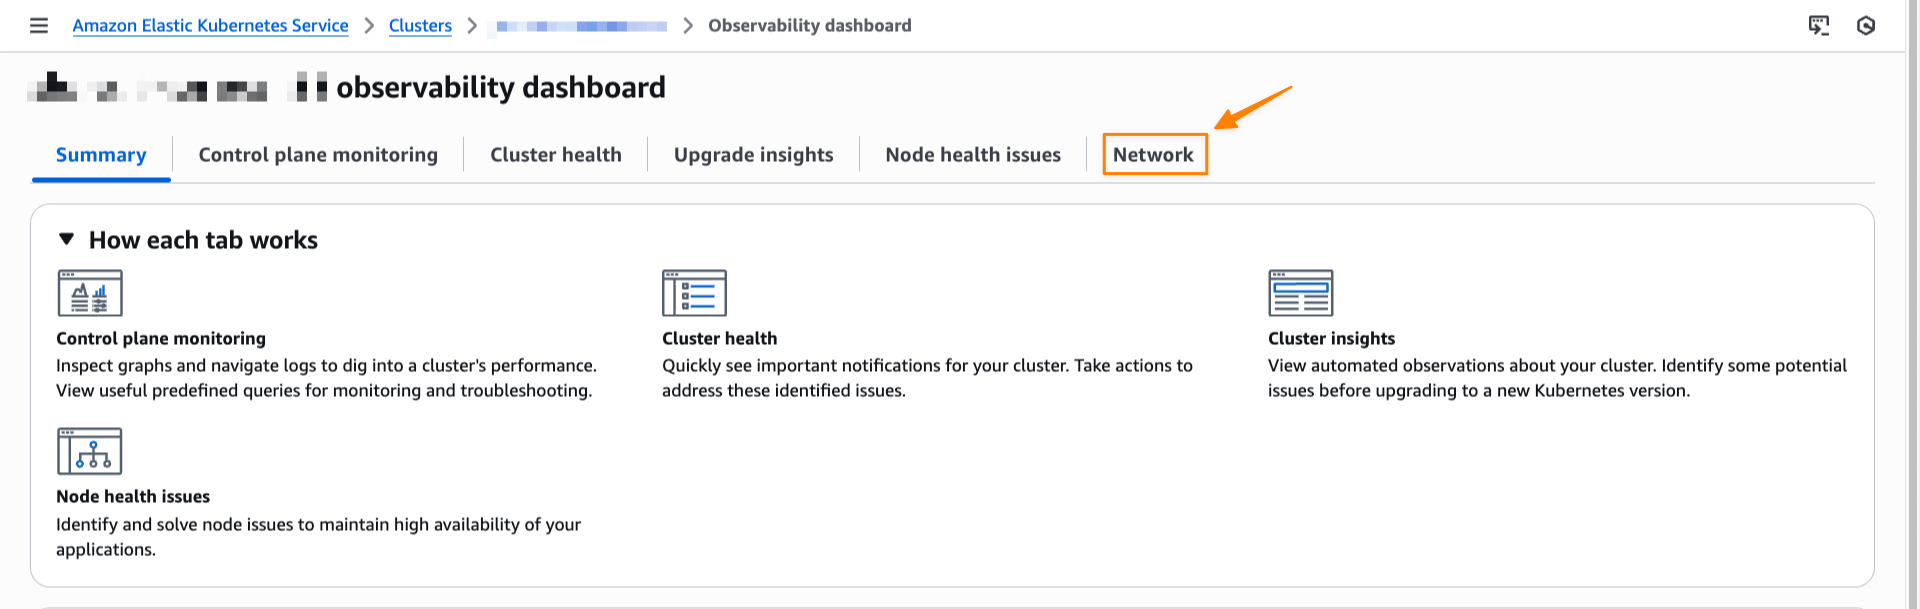
Here’s how you can find this new capability on the Amazon EventBridge console:

The new observability capabilities address microservices and event-driven architecture monitoring challenges by providing comprehensive event lifecycle tracking. EventBridge now generates detailed log entries every time a matched event against rules is published, delivered to subscribers, or encounters failures and retries.

You gain visibility into the complete event journey with detailed information about successes, failures, and status codes that make identifying and diagnosing issues straightforward. What used to take hours of trial-and-error debugging now takes minutes with detailed event lifecycle tracking and built-in query tools.

Using Amazon EventBridge enhanced observability
Let me walk you through a demonstration that showcases the logging capability in Amazon EventBridge.

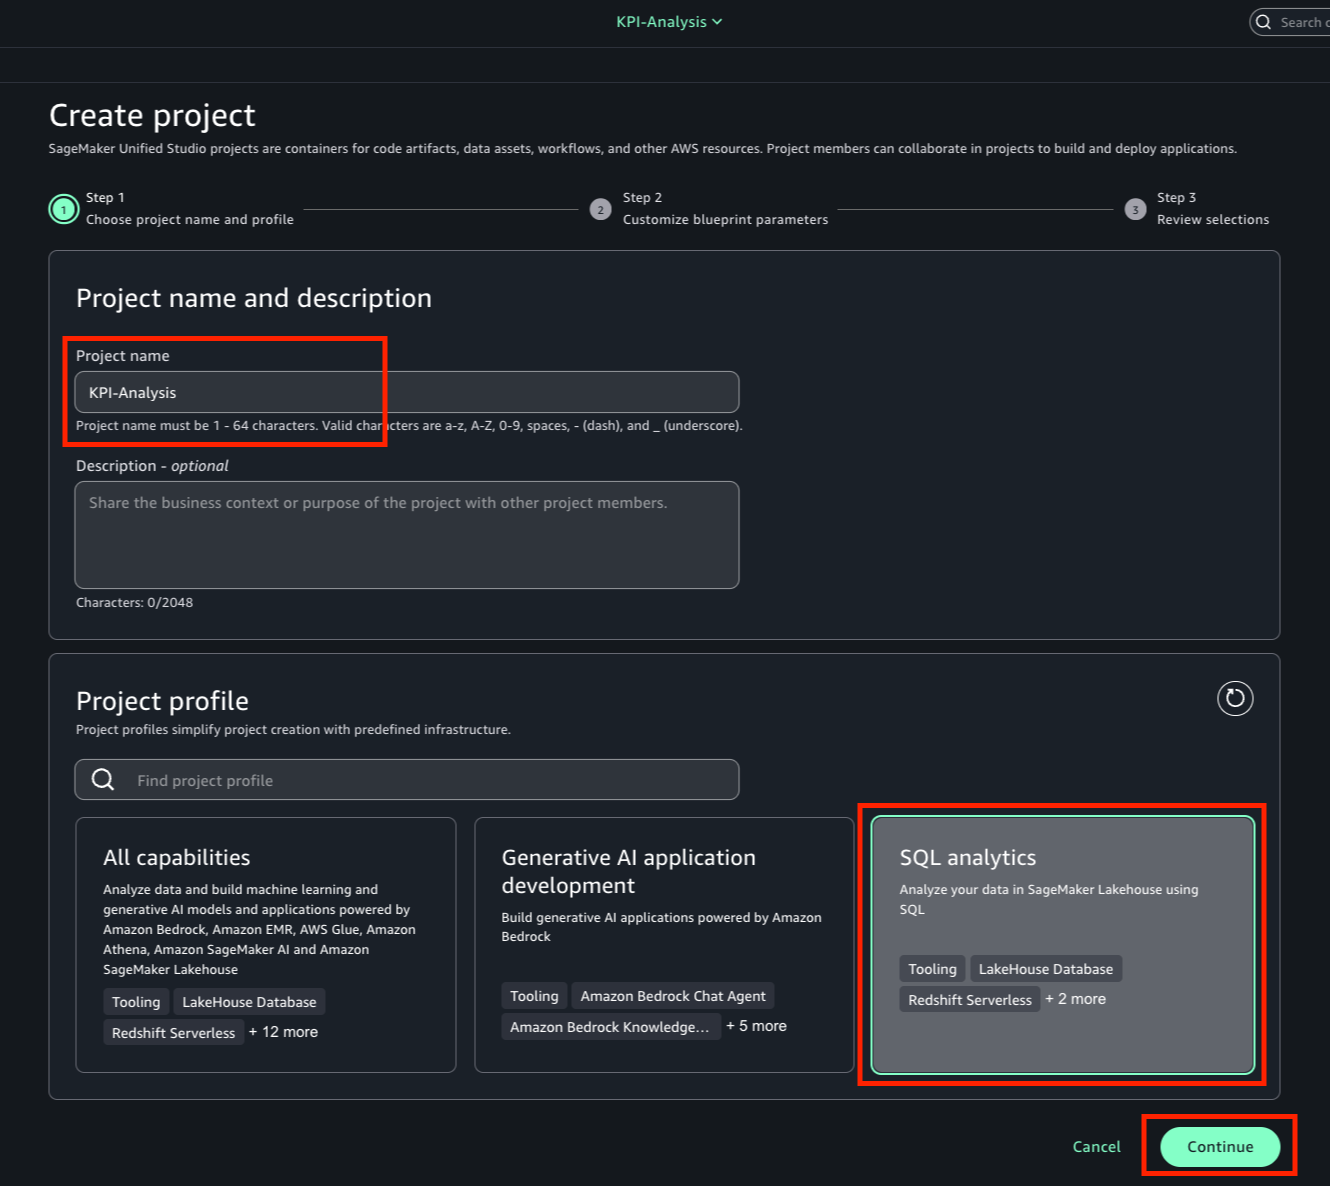
I can enable logging for an existing event bus or when creating a new custom event bus. First, I navigate to the EventBridge console and choose Event buses in the left navigation pane. In Custom event bus, I choose Create event bus.

I can see this new capability in the Logs section. I have three options to configure the Log destination: Amazon CloudWatch Logs, Amazon Data Firehose Stream, and Amazon Simple Storage Service (Amazon S3). If I want to stream my logs into a data lake, I can select Amazon Kinesis Data Firehose Stream. Logs are encrypted in transit with TLS and at rest if a customer-managed key (CMK) is provided for the event bus. CloudWatch Logs supports customer-managed keys, and Data Firehose offers server-side encryption for downstream destinations.

For this demo, I select CloudWatch logs and S3 logs.

I can also choose Log level, from Error, Info, or Trace. I choose Trace and select Include execution data because I need to review the payloads. You need to be mindful as logging payload data may contain sensitive information, and this setting applies to all log destinations you select. Then, I configure two destinations, one each for CloudWatch log group and S3 logs. Then I choose Create.

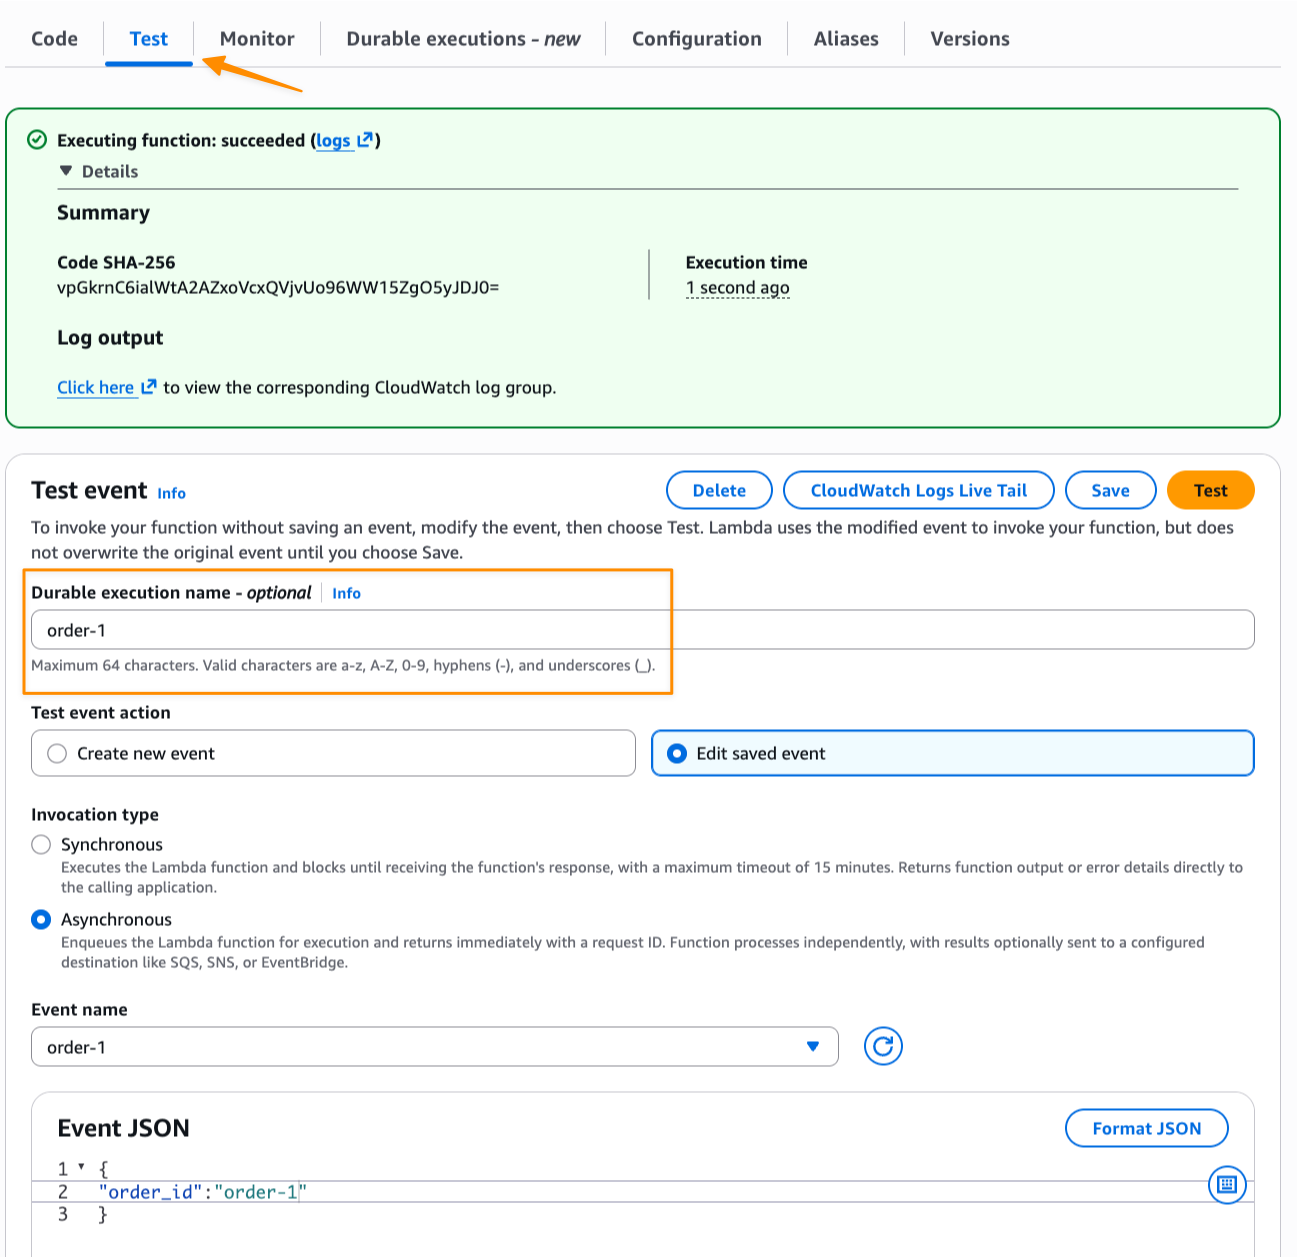
After logging is enabled, I can start publishing test events to observe the logging behavior.

For the first scenario, I’ve built an AWS Lambda function and configured this Lambda function as a target.

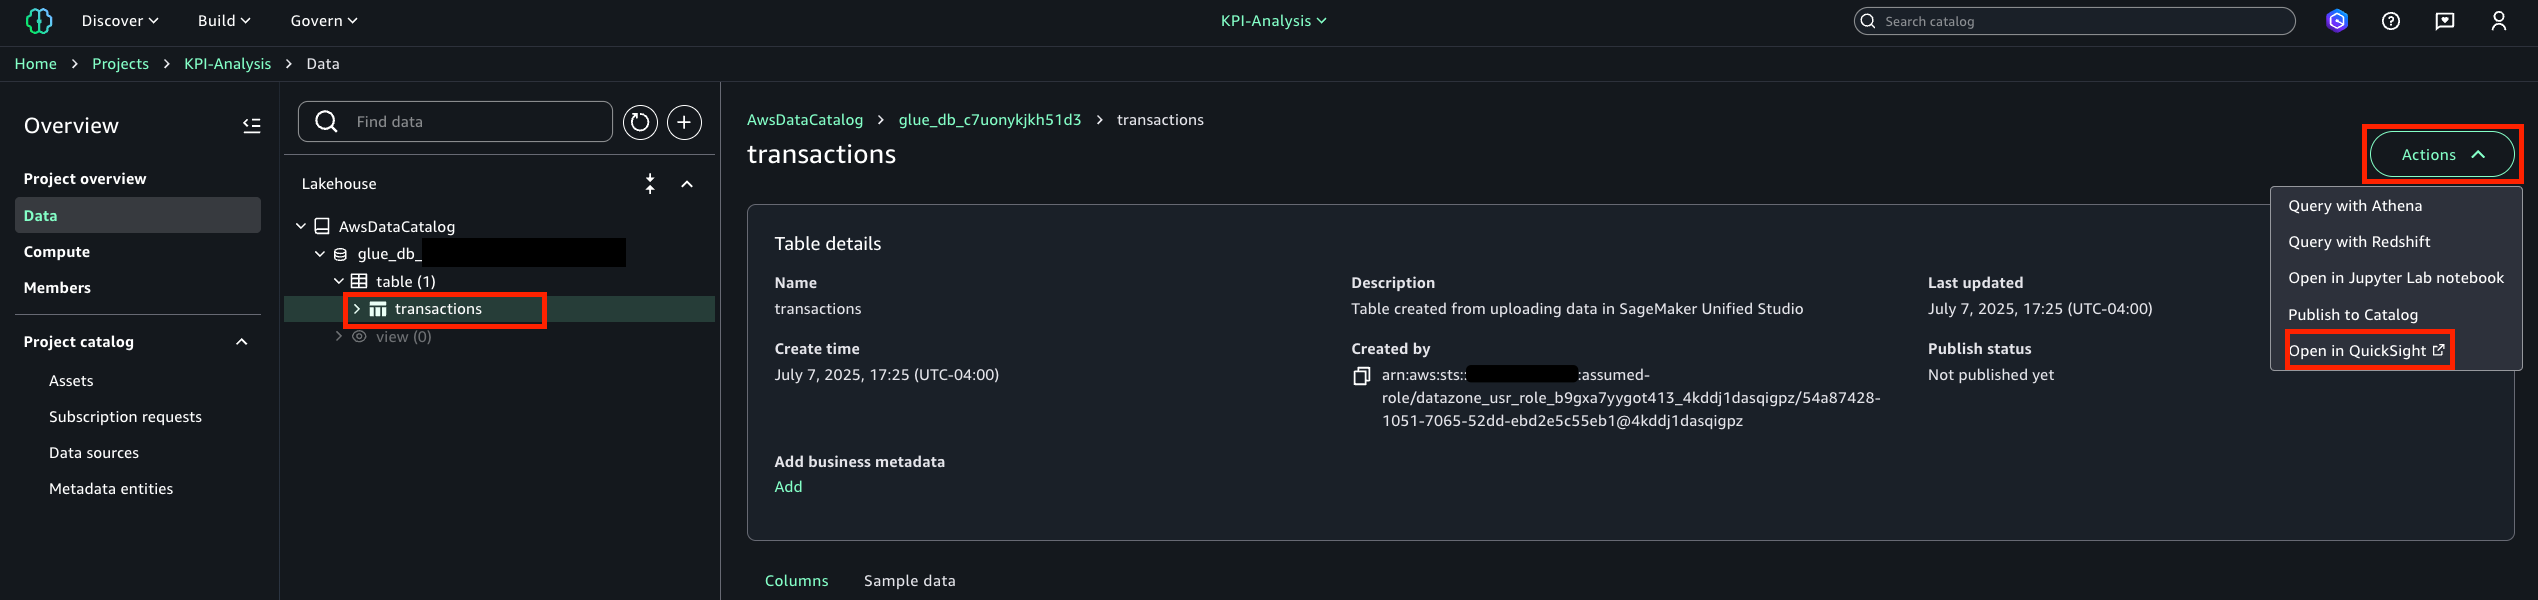
I navigate to my event bus to send a sample event by choosing Send events.

Here’s the payload that I use:

{
  "Source": "ecommerce.orders",
  "DetailType": "Order Placed",
  "Detail": {
    "orderId": "12345",
    "customerId": "cust-789",
    "amount": 99.99,
    "items": [
      {
        "productId": "prod-456",
        "quantity": 2,
        "price": 49.99
      }
    ]
  }
}

After I sent the sample event, I can see the logs are available in my S3 bucket.

I can also see the log entries appearing in the Amazon CloudWatch logs. The logs show the event lifecycle, from EVENT_RECEIPT to SUCCESS. Learn more about the complete event lifecycle on TBD:DOC_PAGE.

Now, let’s evaluate these logs. For brevity, I only include a few logs and have redacted them for readability. Here’s the log from when I triggered the event:

{
    "resource_arn": "arn:aws:events:us-east-1:123:event-bus/demo-logging",
    "message_timestamp_ms": 1751608776896,
    "event_bus_name": "demo-logging",
// REDACTED FOR BREVITY //
    "message_type": "EVENT_RECEIPT",
    "log_level": "TRACE",
    "details": {
        "caller_account_id": "123",
        "source_time_ms": 1751608775000,
        "source": "ecommerce.orders",
        "detail_type": "Order Placed",
        "resources": [],
        "event_detail": "REDACTED FOR BREVITY"
    }
}

Here’s the log when the event was successfully invoked:

{
    "resource_arn": "arn:aws:events:us-east-1:123:event-bus/demo-logging",
    "message_timestamp_ms": 1751608777091,
    "event_bus_name": "demo-logging",
// REDACTED FOR BREVITY //
    "message_type": "INVOCATION_SUCCESS",
    "log_level": "INFO",
    "details": {
// REDACTED FOR BREVITY //
        "total_attempts": 1,
        "final_invocation_status": "SUCCESS",
        "ingestion_to_start_latency_ms": 105,
        "ingestion_to_complete_latency_ms": 183,
        "ingestion_to_success_latency_ms": 183,
        "target_duration_ms": 53,
        "target_response_body": "<REDACTED FOR BREVITY>",
        "http_status_code": 202
    }
}

The additional log entries include rich metadata that makes troubleshooting straightforward. For example, on a successful event, I can see the latency timing from starting to completing the event, duration for the target to finish processing, and HTTP status code.

Debugging failures with complete event lifecycle tracking
The benefit of EventBridge logging becomes apparent when things go wrong. To test failure scenarios, I intentionally misconfigure a Lambda function’s permissions and change the rule to point to a different Lambda function without proper permissions.

The attempt failed with a permanent failure due to missing permissions. The log shows it’s a FIRST attempt that resulted in NO_PERMISSIONS status.

{
    "message_type": "INVOCATION_ATTEMPT_PERMANENT_FAILURE",
    "log_level": "ERROR",
    "details": {
        "rule_arn": "arn:aws:events:us-east-1:123:rule/demo-logging/demo-order-placed",
        "role_arn": "arn:aws:iam::123:role/service-role/Amazon_EventBridge_Invoke_Lambda_123",
        "target_arn": "arn:aws:lambda:us-east-1:123:function:demo-evb-fail",
        "attempt_type": "FIRST",
        "attempt_count": 1,
        "invocation_status": "NO_PERMISSIONS",
        "target_duration_ms": 25,
        "target_response_body": "{\"requestId\":\"a4bdfdc9-4806-4f3e-9961-31559cb2db62\",\"errorCode\":\"AccessDeniedException\",\"errorType\":\"Client\",\"errorMessage\":\"User: arn:aws:sts::123:assumed-role/Amazon_EventBridge_Invoke_Lambda_123/db4bff0a7e8539c4b12579ae111a3b0b is not authorized to perform: lambda:InvokeFunction on resource: arn:aws:lambda:us-east-1:123:function:demo-evb-fail because no identity-based policy allows the lambda:InvokeFunction action\",\"statusCode\":403}",
        "http_status_code": 403
    }
}

The final log entry summarizes the complete failure with timing metrics and the exact error message.

{
    "message_type": "INVOCATION_FAILURE",
    "log_level": "ERROR",
    "details": {
        "rule_arn": "arn:aws:events:us-east-1:123:rule/demo-logging/demo-order-placed",
        "role_arn": "arn:aws:iam::123:role/service-role/Amazon_EventBridge_Invoke_Lambda_123",
        "target_arn": "arn:aws:lambda:us-east-1:123:function:demo-evb-fail",
        "total_attempts": 1,
        "final_invocation_status": "NO_PERMISSIONS",
        "ingestion_to_start_latency_ms": 62,
        "ingestion_to_complete_latency_ms": 114,
        "target_duration_ms": 25,
        "http_status_code": 403
    },
    "error": {
        "http_status_code": 403,
        "error_message": "User: arn:aws:sts::123:assumed-role/Amazon_EventBridge_Invoke_Lambda_123/db4bff0a7e8539c4b12579ae111a3b0b is not authorized to perform: lambda:InvokeFunction on resource: arn:aws:lambda:us-east-1:123:function:demo-evb-fail because no identity-based policy allows the lambda:InvokeFunction action",
        "aws_service": "AWSLambda",
        "request_id": "a4bdfdc9-4806-4f3e-9961-31559cb2db62"
    }
}

The logs provide detailed performance metrics that help identify bottlenecks. The ingestion_to_start_latency_ms: 62 shows the time from event ingestion to starting invocation, while ingestion_to_complete_latency_ms: 114 represents the total time from ingestion to completion. Additionally, target_duration_ms: 25 indicates how long the target service took to respond, helping distinguish between EventBridge processing time and target service performance.

The error message clearly states what failed, lambda:InvokeFunction action, why it failed, (no identity-based policy allows the action), which role was involved (Amazon_EventBridge_Invoke_Lambda_1428392416), and which specific resource was affected, which was indicated by the Lambda function Amazon Resource Name (ARN).

Debugging API Destinations with EventBridge Logging
One particular use case that I think EventBridge logging capability will be helpful is to debug issues with API destinations. EventBridge API destinations are HTTPS endpoints that you can invoke as the target of an event bus rule or pipe. HTTPS endpoints help you to route events from your event bus to external systems, software-as-a-service (SaaS) applications, or third-party APIs using HTTPS calls. They use connections to handle authentication and credentials, making it easy to integrate your event-driven architecture with any HTTPS-based service. 

API destinations are commonly used to send events to external HTTPS endpoints and debugging failures from the external endpoint can be a challenge. These problems typically stem from changes to the endpoint authentication requirements or modified credentials.

To demonstrate this debugging capability, I intentionally configured an API destination with incorrect credentials in the connection resource.

When I send an event to this misconfigured endpoint, the enhanced logging shows the root cause of this failure.

{
    "resource_arn": "arn:aws:events:us-east-1:123:event-bus/demo-logging",
    "message_timestamp_ms": 1750344097251,
    "event_bus_name": "demo-logging",
    //REDACTED FOR BREVITY//,
    "message_type": "INVOCATION_FAILURE",
    "log_level": "ERROR",
    "details": {
        //REDACTED FOR BREVITY//,
        "total_attempts": 1,
        "final_invocation_status": "SDK_CLIENT_ERROR",
        "ingestion_to_start_latency_ms": 135,
        "ingestion_to_complete_latency_ms": 549,
        "target_duration_ms": 327,
        "target_response_body": "",
        "http_status_code": 400
    },
    "error": {
        "http_status_code": 400,
        "error_message": "Unable to invoke ApiDestination endpoint: The request failed because the credentials included for the connection are not authorized for the API destination."
    }
}

The log provides immediate clarity about the failure. The target_arn shows this involves an API destination, the final_invocation_status indicates SDK_CLIENT_ERROR, and the http_status_code of 400 , which points to a client-side issue. Most importantly, the error_message explicitly states that: Unable to invoke ApiDestination endpoint: The request failed because the credentials included for the connection are not authorized for the API destination.

This complete log sequence provides useful debugging insights because I can see exactly how the event moved through EventBridge — from event receipt, to ingestion, to rule matching, to invocation attempts. This level of detail eliminates guesswork and points directly to the root cause of the issue.

Additional things to know
Here are a couple of things to note:

  • Architecture support – Logging works with all EventBridge features including custom event buses, partner event sources, and API destinations for HTTPS endpoints.
  • Performance impact – Logging operates asynchronously with no measurable impact on event processing latency or throughput.
  • Pricing – You pay standard Amazon S3, Amazon CloudWatch Logs or Amazon Data Firehose pricing for log storage and delivery. EventBridge logging itself incurs no additional charges. For details, visit the Amazon EventBridge pricing page .
  • Availability – Amazon EventBridge logging capability is available in all AWS Regions where EventBridge is supported.
  • Documentation — For more details, refer to the Amazon EventBridge monitoring and debugging Documentation.

Get started with Amazon EventBridge logging capability by visiting the EventBridge console and enabling logging on your event buses.

Happy building!
— Donnie 

Build the highest resilience apps with multi-Region strong consistency in Amazon DynamoDB global tables

Post Syndicated from Donnie Prakoso original https://aws.amazon.com/blogs/aws/build-the-highest-resilience-apps-with-multi-region-strong-consistency-in-amazon-dynamodb-global-tables/

While tens of thousands of customers are successfully using Amazon DynamoDB global tables with eventual consistency, we’re seeing emerging needs for even stronger resilience. Many organizations find that the DynamoDB multi-Availability Zone architecture and eventually consistent global tables meet their requirements, but critical applications like payment processing systems and financial services demand more.

For these applications, customers require a zero Recovery Point Objective (RPO) during rare Region-wide events, meaning you can direct your app to read the latest data from any Region. Your multi-Region applications always need to access the same data regardless of location.

Starting today, you can use a new Amazon DynamoDB global tables capability that provides multi-Region strong consistency (MRSC), enabling zero RPO. This capability, first announced as a preview at AWS re:Invent 2024, simplifies building highly resilient global applications.

Here’s how you can enable MRSC starting with an existing empty DynamoDB table:

With MRSC, DynamoDB now offers you the highest level of resilience for your applications. If application processing is interrupted in a Region, you can redirect traffic to another Region containing a MRSC replica and know that you’ll be processing the latest data.

Getting started
Let me walk you through how you can use this new capability.

To start using MRSC, I need to create a global table from an existing DynamoDB table that doesn’t contain any data. I navigate to my existing table, select the Global tables tab and select Create replica.

The MRSC availability architecture requires three AWS Regions. I can configure MRSC with either three full replicas or with two replicas and a witness. A witness contains only replicated change data to provide the required availability without maintaining a full copy of my table data.

The following screenshot shows how I configure MRSC with two replicas and a witness. To configure MRSC with three full replicas instead, I can clear Configure Region 2 as Witness.

If I need to update my existing table programmatically, I can use the Amazon Q CLI to generate the required command with the following prompt:

> Hey Q! Update my existing DynamoDB table called "demo-mrsc" in us-east-1 with multi-Region strong consistency across us-east-2 with witness in us-west-2 Regions

Shortly after, Q CLI will respond back with following command:

> To update your DynamoDB table with multi-Region strong consistency, you'll need to use the update-table command with the appropriate parameters. Here's how you would do it:

aws dynamodb update-table \ 
    --table-name demo-mrsc \ 
    --replica-updates '[{"Create": {"RegionName": "us-east-2"}}]' \ 
    --global-table-witness-updates '[{"Create": {"RegionName": "us-west-2"}}]' \ 
    --multi-region-consistency STRONG \ 
    --region us-east-1

After it’s finished processing, I can check the status of my MRSC global table. I can see I have a witness configured for my DynamoDB global table. A witness reduces costs while still providing the resilience benefits of multi-Region strong consistency.

Then, in my application, I can use ConsistentRead to read data with strong consistency. Here’s a Python example:

import boto3

# Configure the DynamoDB client for your region
dynamodb = boto3.resource('dynamodb', region_name='us-east-2')
table = dynamodb.Table('demo-mrsc')

pk_id = "demo#test123"

# Read with strong consistency across regions
response = table.get_item(
    Key={
        'PK': pk_id
    },
    ConsistentRead=True
)

print(response)

For operations that require the strongest resilience, I can use ConsistentRead=True. For less critical operations where eventual consistency is acceptable, I can omit this parameter to improve performance and reduce costs.

Additional things to know
Here are a couple of things to note:

  • Availability – The Amazon DynamoDB multi-Region strong consistency capability is available in following AWS Regions: US East (Ohio, N. Virginia), US West (Oregon), Asia Pacific (Osaka, Seoul, Tokyo), and Europe (Frankfurt, Ireland, London, Paris)
  • Pricing – Multi-Region strong consistency pricing follows the existing global tables pricing structure. DynamoDB recently reduced global tables pricing by up to 67 percent, making this highly resilient architecture more affordable than ever. Visit Amazon DynamoDB lowers pricing for on-demand throughput and global tables in the AWS Database Blog to learn more.

Learn more about how you can achieve the highest level of application resilience, enable your applications to be always available and always read the latest data regardless of the Region by visiting Amazon DynamoDB global tables.

Happy building!

Donnie


Unify your security with the new AWS Security Hub for risk prioritization and response at scale (Preview)

Post Syndicated from Donnie Prakoso original https://aws.amazon.com/blogs/aws/unify-your-security-with-the-new-aws-security-hub-for-risk-prioritization-and-response-at-scale-preview/

AWS Security Hub has been a central place for you to view and aggregate security alerts and compliance status across Amazon Web Services (AWS) accounts. Today, we are announcing the preview release of the new AWS Security Hub which offers additional correlation, contextualization, and visualization capabilities. This helps you prioritize critical security issues, respond at scale to reduce risks, improve team productivity, and better protect your cloud environment.

Here’s a quick look at the new AWS Security Hub.

With this new enhancement, AWS Security Hub integrates security capabilities like Amazon GuardDuty, Amazon Inspector, AWS Security Hub Cloud Security Posture Management (CSPM), Amazon Macie, and other AWS security capabilities to help you gain visibility across your cloud environment through centralized management in a unified cloud security solution. 

Getting started with the new AWS Security Hub
Let me walk you through how to get started with AWS Security Hub.

If you’re a new customer to AWS Security Hub, you need to navigate to the AWS Security Hub console to enable AWS security capabilities and capabilities and start assessing risk across your organization. You can learn more on the Documentation page.

After you have AWS Security Hub enabled, it will automatically consume data from supporting security capabilities you’ve enabled, such as Amazon GuardDuty, Amazon Inspector, Amazon Macie, and AWS Security Hub CSPM. You can navigate to the AWS Security Hub console to view these findings and benefit from insights created through correlation of findings across these capabilities.

As security risks are uncovered, they’re presented in a redesigned Security Hub summary dashboard. The new Security Hub summary dashboard provides a comprehensive, unified view of your AWS security posture. The dashboard organizes security findings into distinct categories, making it easier to identify and prioritize risks.

The new Exposure summary widget helps you identify and prioritize security exposures by analyzing resource relationships and signals from Amazon Inspector, AWS Security Hub CSPM, and Amazon Macie. These exposure findings are automatically generated and are a key part of the new solution, highlighting where your critical security exposures are located. You can learn more about exposure on the Documentation page.

AWS Security Hub now provides a Security coverage widget designed to help you identify potential coverage gaps. You can use this widget to identify where you’re missing coverage by the security capabilities that power Security Hub. This visibility helps you identify which capabilities, accounts, and features you need to address to improve your security coverage.

As you can see on the navigation menu, AWS Security Hub is organized into five key areas to streamline security management:

  • Exposure: Provides visibility into all exposure findings, a security vulnerability or misconfiguration that could potentially expose an AWS resource or system to unauthorized access or compromise, generated by Security Hub, helping you identify resources that might be accessible from outside your environment
  • Threats: Consolidates all threat findings generated by Amazon GuardDuty, showing potential malicious activities and intrusion attempts
  • Vulnerabilities: Displays all vulnerabilities detected by Amazon Inspector, highlighting software flaws and configuration issues
  • Posture management: Shows all posture management findings from AWS Security Hub Cloud Security Posture Management (CSPM), helping provide compliance with security best practices
  • Sensitive data: Presents all sensitive data findings identified by Amazon Macie, helping you track and protect your sensitive information

When you navigate to the Exposure page, you’ll see findings grouped by title, with severity levels clearly indicated to help you focus on critical issues first.

To explore specific exposures, you can select any finding to see affected resources. The panel includes key information about the implicated resource, account, Region, and when the issue was detected.

In this panel, you’ll also find an attack path visualization that is particularly useful for understanding complex security relationships. For network exposure paths, you can see all components involved in the path—including virtual private clouds (VPCs), subnets, security groups, network access control lists (ACLs), and load balancers—helping you identify exactly where to implement security controls. The visualization also highlights Identity and Access Management (IAM) relationships, showing how permission configurations might allow privilege escalation or data access. Resources with multiple contributing traits are clearly marked so you can quickly identify which components represent the greatest risk.

The Threats dashboard provides actionable insights into potential malicious activities detected by Amazon GuardDuty, organizing findings by severity so you can quickly identify critical issues like unusual API calls, suspicious network traffic, or potential credential compromises. The dashboard includes GuardDuty Extended Threat Detection findings, with all “Critical” severity threats representing these Extended Threat Detections that require immediate attention.

Similarly, the Vulnerabilities dashboard from Amazon Inspector provides a comprehensive view of software vulnerabilities and network exposure risks. The dashboard highlights vulnerabilities with known exploits, packages requiring urgent updates, and resources with the highest numbers of vulnerabilities.

Another valuable new feature is the Resources view, which provides an inventory of all resources deployed in your organization covered by AWS Security Hub. You can use this view to quickly identify which resources have findings against them and filter by resource type or finding severity. Selecting any resource provides detailed configuration information without needing to pivot to other consoles, streamlining your investigation workflow.

The new Security Hub also offers integration capabilities to help you comprehensively monitor your cloud environments and connect with third-party security solutions. This gives you the flexibility to create a unified security solution tailored to your organization’s specific needs.

For example, with integration capability, when viewing a security finding, you can select the Create ticket option and choose your preferred ticketing integration.

Additional things to know
Here are a couple of things to note:

  • Availability – During this preview period, the new AWS Security Hub is available in following AWS Regions: US East (N. Virginia, Ohio), US West (N. California, Oregon), Africa (Cape Town), Asia Pacific (Hong Kong, Jakarta, Mumbai, Osaka, Seoul, Singapore, Sydney, Tokyo), Canada (Central), Europe (Frankfurt, Ireland, London, Milan, Paris, Stockholm), Middle East (Bahrain), and South America (São Paulo).
  • Pricing – The new AWS Security Hub is available at no additional charge during the preview period. However, you will still incur costs for the integrated capabilities including Amazon GuardDuty, Amazon Inspector, Amazon Macie, and AWS Security Hub CSPM.
  • Integration with existing AWS security capabilities – Security Hub integrates with Amazon GuardDuty, Amazon Inspector, AWS Security Hub CSPM, and Amazon Macie, providing a comprehensive security posture without additional operational overhead.
  • Enhanced data interoperability – The new Security Hub uses the Open Cybersecurity Schema Framework (OCSF), enabling seamless data exchange across your security capabilities with normalized data formats.

To learn more about the enhanced AWS Security Hub and join the preview, visit the AWS Security Hub product page.

Happy building!

Donnie

Accelerate CI/CD pipelines with the new AWS CodeBuild Docker Server capability

Post Syndicated from Donnie Prakoso original https://aws.amazon.com/blogs/aws/accelerate-ci-cd-pipelines-with-the-new-aws-codebuild-docker-server-capability/

Starting today, you can use AWS CodeBuild Docker Server capability to provision a dedicated and persistent Docker server directly within your CodeBuild project. With Docker Server capability, you can accelerate your Docker image builds by centralizing image building to a remote host, which reduces wait times and increases overall efficiency.

From my benchmark, with this Docker Server capability, I reduced the total building time by 98 percent, from 24 minutes and 54 seconds to 16 seconds. Here’s a quick look at this feature from my AWS CodeBuild projects.

AWS CodeBuild is a fully managed continuous integration service that compiles source code, runs tests, and produces software packages ready for deployment. Building Docker images is one of the most common use cases for CodeBuild customers, and the service has progressively improved this experience over time by releasing features such as Docker layer caching and reserved capacity features to improve Docker build performance.

With the new Docker Server capability, you can reduce build time for your applications by providing a persistent Docker server with consistent caching. When enabled in a CodeBuild project, a dedicated Docker server is provisioned with persistent storage that maintains your Docker layer cache. This server can handle multiple concurrent Docker build operations, with all builds benefiting from the same centralized cache.

Using AWS CodeBuild Docker Server
Let me walk you through a demonstration that showcases the benefits with the new Docker Server capability.

For this demonstration, I’m building a complex, multi-layered Docker image based on the official AWS CodeBuild curated Docker images repository, specifically the Dockerfile for building a standard Ubuntu image. This image contains numerous dependencies and tools required for modern continuous integration and continuous delivery (CI/CD) pipelines, making it a good example of the type of large Docker builds that development teams regularly perform.


# Copyright 2020-2024 Amazon.com, Inc. or its affiliates. All Rights Reserved.
#
# Licensed under the Amazon Software License (the "License"). You may not use this file except in compliance with the License.
# A copy of the License is located at
#
#    http://aws.amazon.com/asl/
#
# or in the "license" file accompanying this file.
# This file is distributed on an "AS IS" BASIS, WITHOUT WARRANTIES OR CONDITIONS OF ANY KIND, express or implied.
# See the License for the specific language governing permissions and limitations under the License.
FROM public.ecr.aws/ubuntu/ubuntu:20.04 AS core

ARG DEBIAN_FRONTEND="noninteractive"

# Install git, SSH, Git, Firefox, GeckoDriver, Chrome, ChromeDriver,  stunnel, AWS Tools, configure SSM, AWS CLI v2, env tools for runtimes: Dotnet, NodeJS, Ruby, Python, PHP, Java, Go, .NET, Powershell Core,  Docker, Composer, and other utilities
COMMAND REDACTED FOR BREVITY
# Activate runtime versions specific to image version.
RUN n $NODE_14_VERSION
RUN pyenv  global $PYTHON_39_VERSION
RUN phpenv global $PHP_80_VERSION
RUN rbenv  global $RUBY_27_VERSION
RUN goenv global  $GOLANG_15_VERSION

# Configure SSH
COPY ssh_config /root/.ssh/config
COPY runtimes.yml /codebuild/image/config/runtimes.yml
COPY dockerd-entrypoint.sh /usr/local/bin/dockerd-entrypoint.sh
COPY legal/bill_of_material.txt /usr/share/doc/bill_of_material.txt
COPY amazon-ssm-agent.json /etc/amazon/ssm/amazon-ssm-agent.json

ENTRYPOINT ["/usr/local/bin/dockerd-entrypoint.sh"]

This Dockerfile creates a comprehensive build environment with multiple programming languages, build tools, and dependencies – exactly the type of image that would benefit from persistent caching.

In the build specification (buildspec), I use the docker buildx build . command:

version: 0.2
phases:
  build:
    commands:
      - cd ubuntu/standard/5.0
      - docker buildx build -t codebuild-ubuntu:latest .

To enable the Docker Server capability, I navigate to the AWS CodeBuild console and select Create project. I can also enable this capability when editing existing CodeBuild projects.

I fill in all details and configuration. In the Environment section, I select Additional configuration.

Then, I scroll down and find Docker server configuration and select Enable docker server for this project. When I select this option, I can choose a compute type configuration for the Docker server. When I’m finished with the configurations, I create this project.

Now, let’s see the Docker Server capability in action.

The initial build takes approximately 24 minutes and 54 seconds to complete because it needs to download and compile all dependencies from scratch. This is expected for the first build of such a complex image.

For subsequent builds with no code changes, the build takes only 16 seconds and that shows 98% reduction in build time.

Looking at the logs, I can see that with Docker Server, most layers are pulled from the persistent cache:

The persistent caching provided by the Docker Server maintains all layers between builds, which is particularly valuable for large, complex Docker images with many layers. This demonstrates how Docker Server can dramatically improve throughput for teams running numerous Docker builds in their CI/CD pipelines.

Additional things to know
Here are a couple of things to note:

  • Architecture support – The feature is available for both x86 (Linux) and ARM builds.
  • Pricing – To learn more about pricing for Docker Server capability, refer to the AWS CodeBuild pricing page.
  • Availability – This feature is available in all AWS Regions where AWS CodeBuild is offered. For more information about the AWS Regions where CodeBuild is available, see the AWS Regions page.

You can learn more about the Docker Server feature in the AWS CodeBuild documentation.

Happy building! —

Donnie Prakoso


How is the News Blog doing? Take this 1 minute survey!

(This survey is hosted by an external company. AWS handles your information as described in the AWS Privacy Notice. AWS will own the data gathered via this survey and will not share the information collected with survey respondents.)

AWS Weekly Roundup: Amazon Nova Premier, Amazon Q Developer, Amazon Q CLI, Amazon CloudFront, AWS Outposts, and more (May 5, 2025)

Post Syndicated from Donnie Prakoso original https://aws.amazon.com/blogs/aws/aws-weekly-roundup-amazon-nova-premier-amazon-q-developer-amazon-q-cli-amazon-cloudfront-aws-outposts-and-more-may-5-2025/

Last week I went to Thailand to attend the AWS Summit Bangkok. It was an energizing and exciting event. We hosted the Developer Lounge, where developers can meet, discuss ideas, enjoy lightning talks, win SWAGs at AWS Builder ID Prize Wheel, take a challenge at Amazon Q Developer Coding Challenge, or learn Generative AI at Learn Amazon Bedrock booth.

Here’s a quick look:

Thank you to AWS Heroes, AWS Community Builders, AWS User Group leaders and developers for your collaboration.

Coming up next in ASEAN is AWS Summit Singapore—make sure you don’t miss it by registering now.

Last Week’s Launches
Here are some launches last week that caught my attention:

  • Amazon Nova Premier Now Generally Available — Amazon Nova Premier, our most capable model for complex tasks and teacher for model distillation, is now generally available in Amazon Bedrock. It excels at complex tasks requiring deep context understanding and multistep planning, while processing text, images, and videos with a 1M token context length. With Nova Premier and Amazon Bedrock Model Distillation, you can create highly capable, cost-effective, and low-latency versions of Nova Pro, Lite, and Micro, for your specific needs.

  • Amazon Q Developer elevates the IDE experience with new agentic coding experience — This new interactive, agentic coding experience for Visual Studio Code allows Q Developer to intelligently take actions on behalf of the developer. Amazon Q Developer introduces an interactive coding experience in Visual Studio Code, offering real-time collaboration for coding, documentation, and testing. It provides transparent reasoning, and supports automated or step-by-step changes in multiple languages.

  • New Foundation Models in Amazon Bedrock — Amazon Bedrock expands its model offerings with two significant additions:
    • Writer’s Palmyra X5 and X4 models feature extensive context windows (1M and 128K tokens respectively) and excel in complex reasoning for enterprise applications. They support multistep tool-calling and adaptive thinking with high reliability standards.
    • Meta’s Llama 4 Scout 17B and Maverick 17B models offer natively multimodal capabilities using mixture-of-experts architecture for enhanced reasoning and image understanding. They support multiple languages and extended context processing, with simplified integration through the Bedrock Converse API.
  • Second-Generation AWS Outposts Racks Released AWS announces the general availability of second-generation Outposts racks with significant enhancements including the latest x86 EC2 instances, simplified networking, and accelerated networking options. These improvements deliver doubled vCPU, memory, and network bandwidth, 40% better performance, and support for ultra-low latency workloads, making them ideal for demanding on-premises deployments.

  • Amazon CloudFront SaaS Manager Launches — Amazon CloudFront SaaS Manager helps SaaS providers and web hosting platforms efficiently manage content delivery across multiple customer domains. The service dramatically reduces operational complexity while providing high-performance content delivery and enterprise-grade security for every customer domain.

  • Amazon Aurora Now Supports PostgreSQL 17 — Amazon Aurora now supports PostgreSQL 17.4, offering community improvements and Aurora-specific enhancements like optimized memory management and faster failovers. The release includes new features for Babelfish, security fixes, and updated extensions, available in all AWS Regions.
  • CloudWatch Introduces Tiered Pricing for Lambda Logs — Amazon CloudWatch launches tiered pricing for AWS Lambda logs and new delivery destinations. Pricing in US East starts at $0.50/GB for CloudWatch and $0.25/GB for S3 and Firehose, both tiering down to $0.05/GB. This update enhances flexibility in log management across all supporting Regions.
  • RDS for MySQL Updates Minor VersionsAmazon RDS for MySQL now supports minor versions 8.0.42 and 8.4.5, delivering security fixes, bug fixes, and performance improvements. Users can upgrade automatically during maintenance windows or use Blue/Green deployments for safer updates.
  • Amazon Bedrock Model Distillation Generally AvailableAmazon Bedrock Model Distillation is now generally available, supporting new models like Amazon Nova and Claude 3.5. It enables smaller models to accurately predict function calling for Agents, delivering up to 500% faster responses and 75% lower costs with minimal accuracy loss for RAG use cases. The service includes automated workflows for data synthesis and student model training.
  • AI Search Flow Builder for Amazon OpenSearch Service Amazon OpenSearch Service now offers an AI search flow builder for OpenSearch 2.19+ domains. This low-code designer enables creation of sophisticated AI-enhanced search flows using AWS and third-party services, supporting use cases like RAG, query rewriting, and semantic encoding.

From Community.AWS
Here’s my personal favorites posts from community.aws:

Upcoming AWS events
Check your calendars and sign up for these upcoming AWS events:

  • AWS Summit — Join free online and in-person events that bring the cloud computing community together to connect, collaborate, and learn about AWS. Register in your nearest city: Poland (6 May), Bengaluru (May 7 – 8), Hong Kong (May 8), Seoul (May 14-15), Singapore (May 29), and Sydney (June 4–5).
  • AWS re:Inforce – Mark your calendars for AWS re:Inforce (June 16–18) in Philadelphia, PA. AWS re:Inforce is a learning conference focused on AWS security solutions, cloud security, compliance, and identity. You can subscribe for event updates now!
  • AWS Partners Events – You’ll find a variety of AWS Partner events that will inspire and educate you, whether you are just getting started on your cloud journey or you are looking to solve new business challenges.
  • AWS Community Days – Join community-led conferences that feature technical discussions, workshops, and hands-on labs led by expert AWS users and industry leaders from around the world: Yerevan, Armenia (May 24), Zurich, Switzerland (May 25), and Bengaluru, India (May 25).

You can browse all upcoming in-person and virtual events.

That’s all for this week. Check back next Monday for another Weekly Roundup!


How is the News Blog doing? Take this 1 minute survey!

(This survey is hosted by an external company. AWS handles your information as described in the AWS Privacy Notice. AWS will own the data gathered via this survey and will not share the information collected with survey respondents.)