Tag Archives: ansible

Forward Zabbix Events to Event-Driven Ansible and Automate your Workflows

Post Syndicated from Aleksandr Kotsegubov original https://blog.zabbix.com/forward-zabbix-events-to-event-driven-ansible-and-automate-your-workflows/25893/

Zabbix is highly regarded for its ability to integrate with a variety of systems right out of the box. That list of systems has recently been expanded with the addition of Event-Driven Ansible. Bringing Zabbix and Event-Driven Ansible together lets you completely automate your IT processes, with Zabbix being the source of events and Ansible serving as the executor. This article will explore in detail how to send events from Zabbix to Event-Driven Ansible.

What is Event-Driven Ansible?

Currently available in developer preview, Event-Driven Ansible is an event-based automation solution that automatically matches each new event to the conditions you specified. This eliminates routine tasks and lets you spend your time on more important issues. And because it’s a fully automated system, it doesn’t get sick, take lunch breaks, or go on vacation – by working around the clock, it can speed up important IT processes.

Sending an event from Zabbix to Event-Driven Ansible

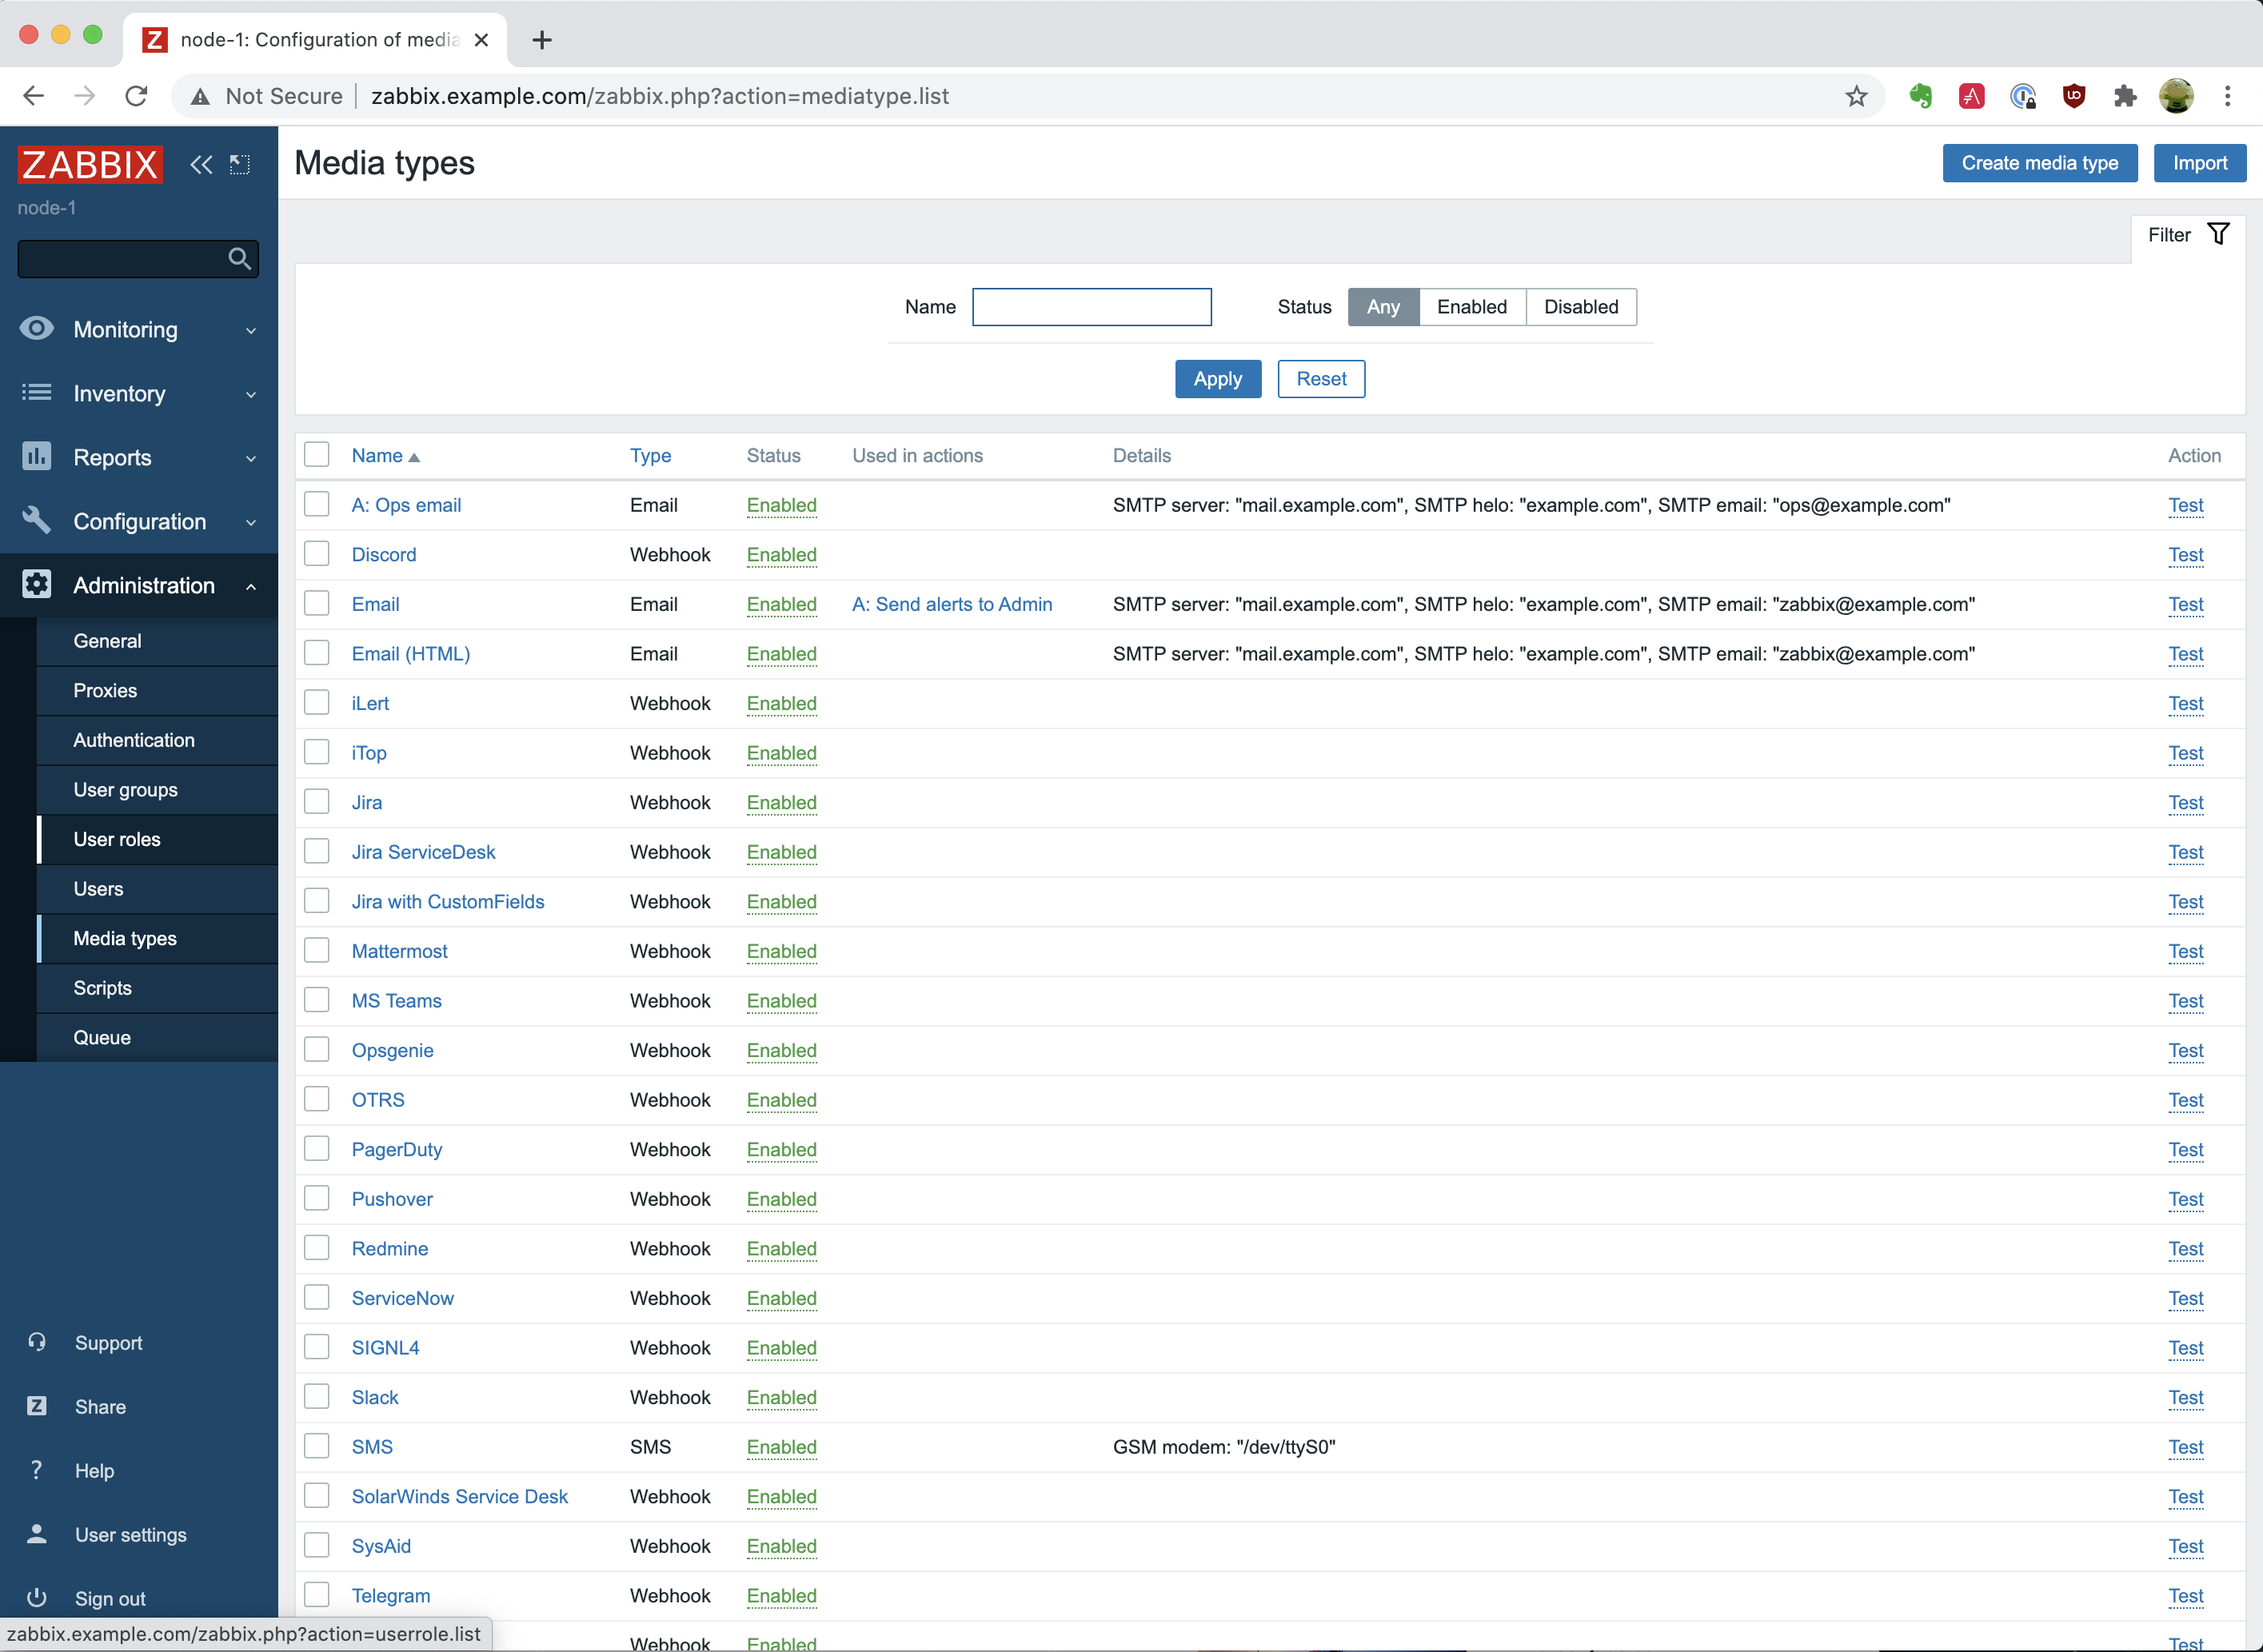
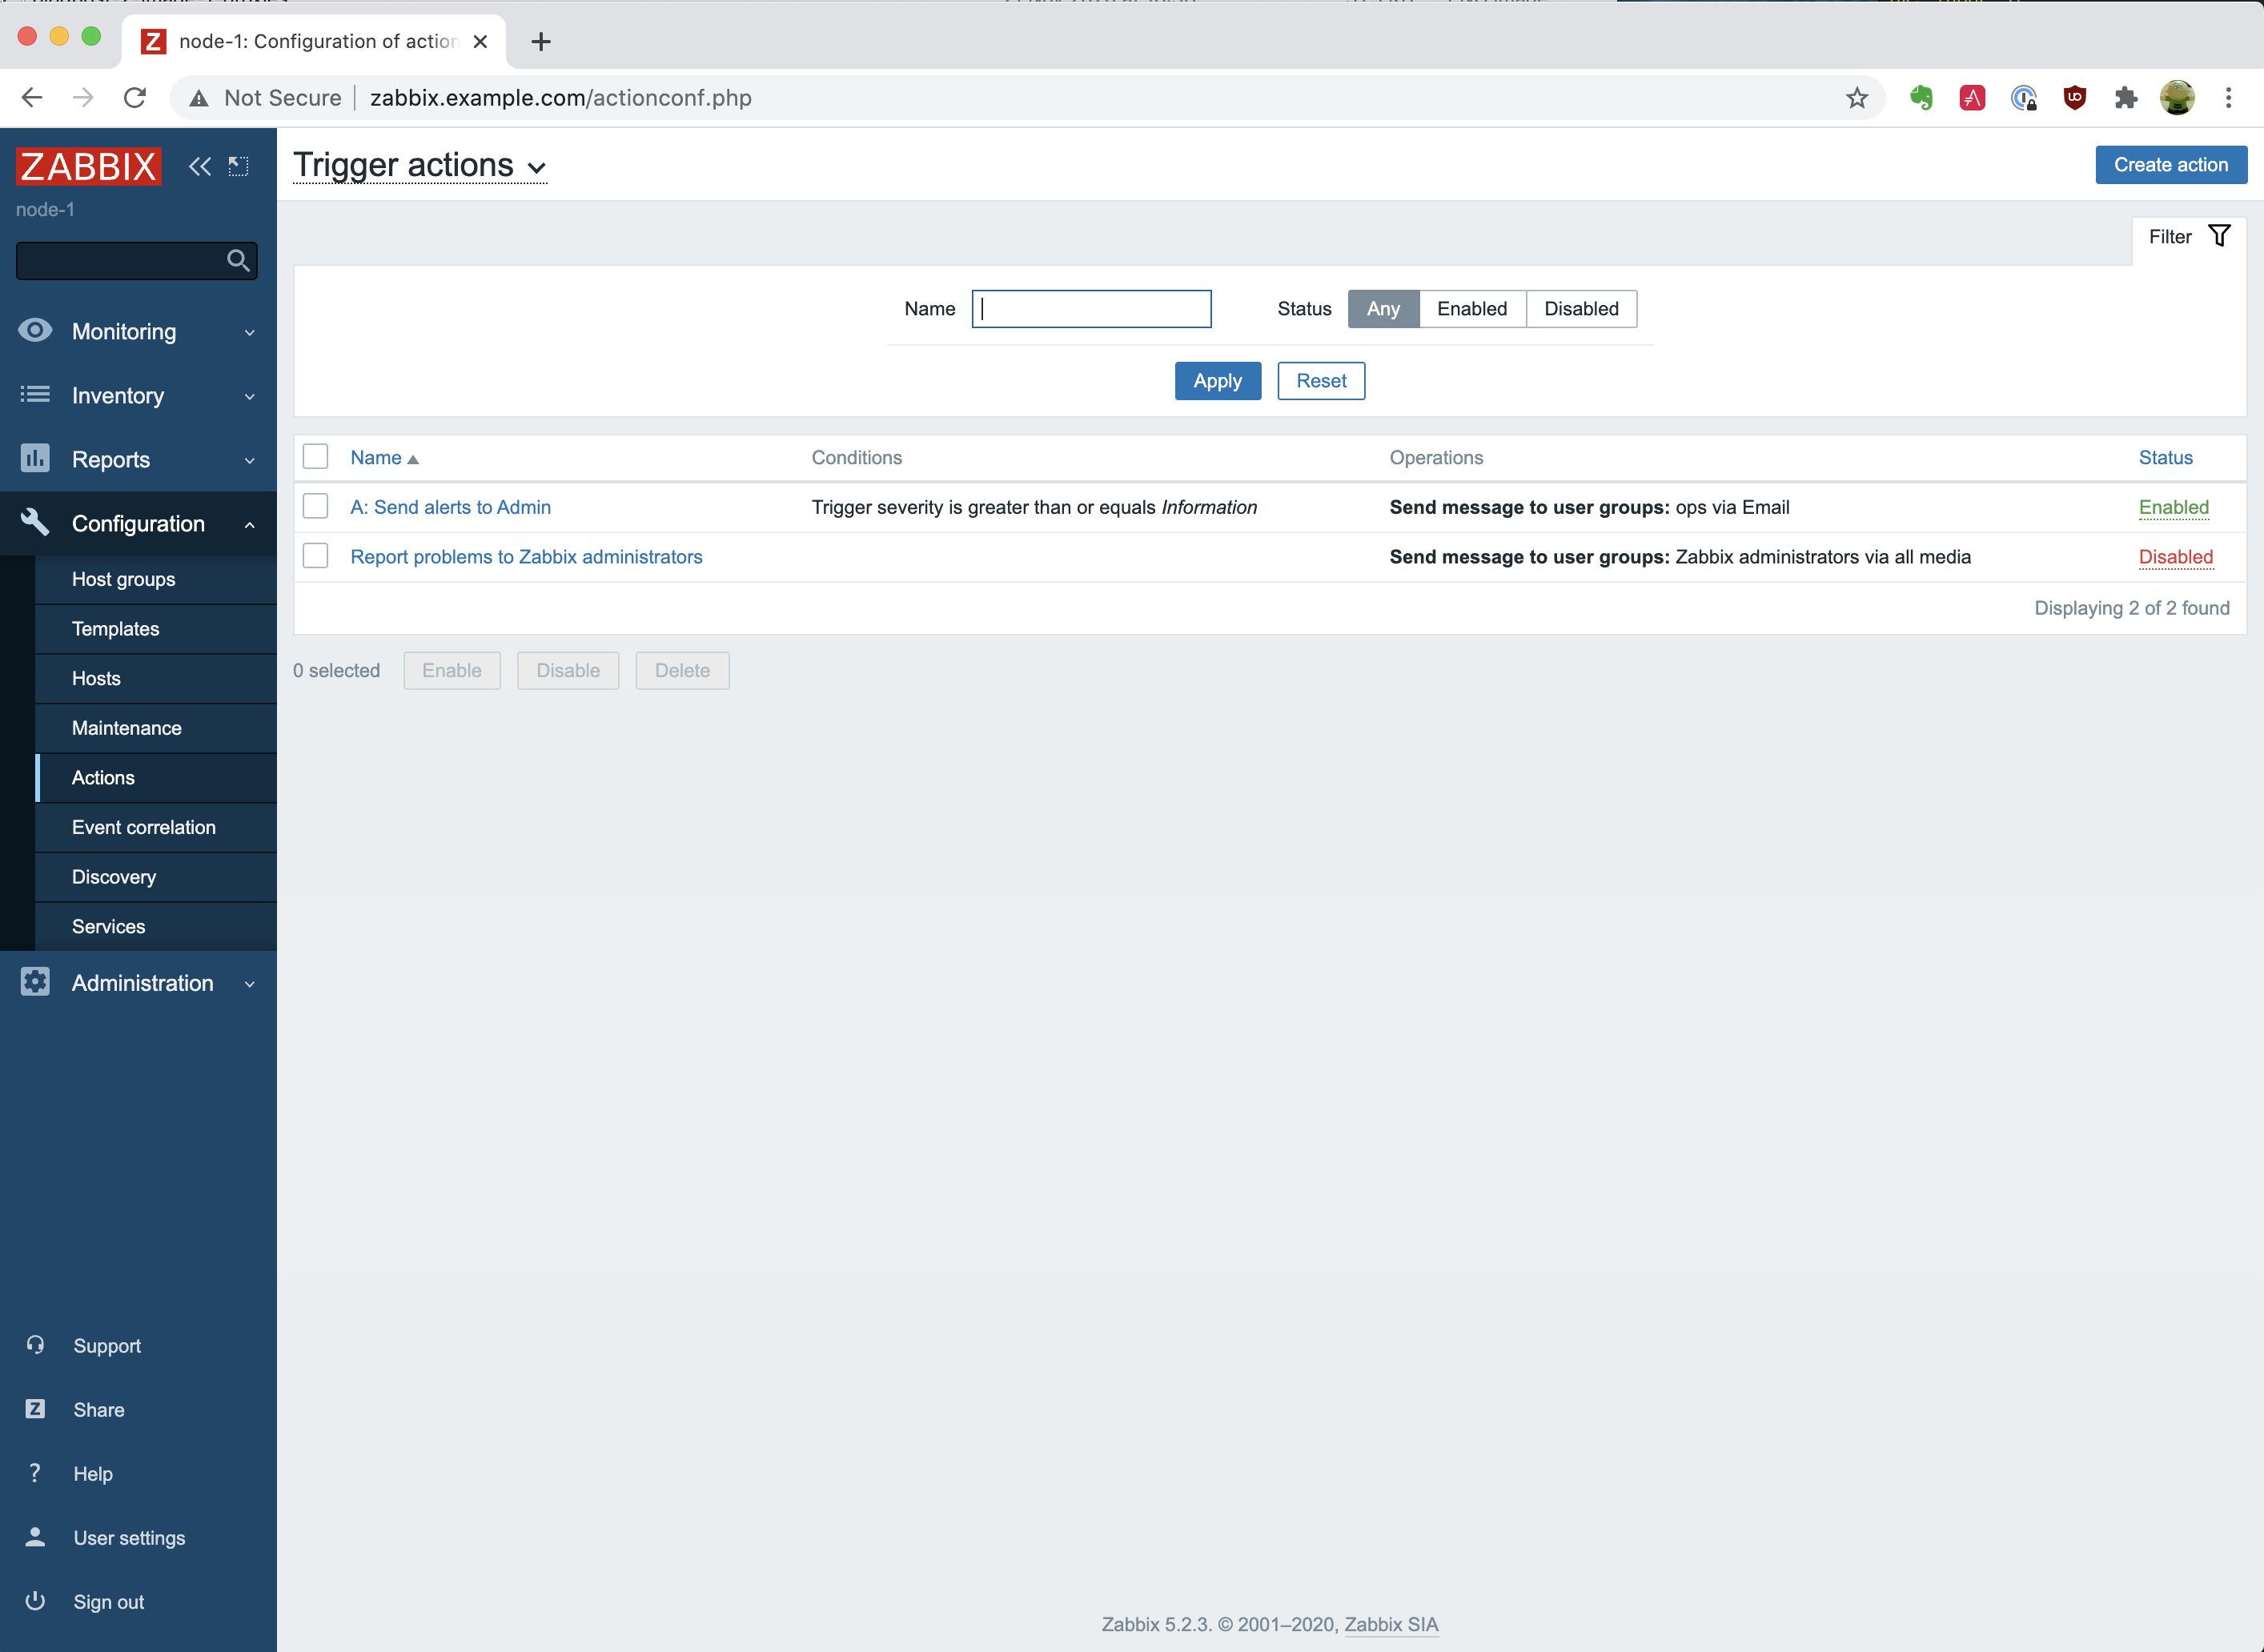
From the Zabbix side, the implementation is a media type that uses a webhook – a tool that’s already familiar to most users. This solution allows you to take advantage of the flexibility of setting up alerts from Zabbix using actions. This media type is delivered to Zabbix out of the box, and if your installation doesn’t have it, you can import it yourself from our integrations page.

On the Event-Driven Ansible side, the webhook plugin from the ansible.eda standard collection is used. If your system doesn’t have this collection, you can get it by running the following command:

ansible-galaxy collection install ansible.eda

Let’s look at the process of sending events in more detail with the diagram below.

From the Zabbix side:
  1. An event is created in Zabbix.

  2. The Zabbix server checks the created event according to the conditions in the actions. If all the conditions in an action configured to send an event to Event-Driven Ansible are met, the next step (running the operations configured in the action) is executed. 

  3. Sending through the “Event-Driven Ansible” media type is configured as an operation. The address specified by the service user for the “Event-Driven Ansible” media is taken as the destination.

  4. The media type script processes all the information about the event, generates a JSON, and sends it to Event-Driven Ansible.

From the Ansible side:
  1. An event sent from Zabbix arrives at the specified address and port. The webhook plugin listens on this port.

  2. After receiving an event, ansible-rulebook starts checking the conditions in order to find a match between the received event and the set of rules in ansible-rulebook.

  3. If the conditions for any of the rules match the incoming event, then the ansible-rulebook performs the specified action. It can be either a single command or a playbook launch.

Let’s look at the setup process from each side.

Sending events from Zabbix

Setting up sending alerts is described in detail on the Zabbix – Ansible integration page. Here are the basic steps:

  1. Import the media type of the required version if it is not present in your system.

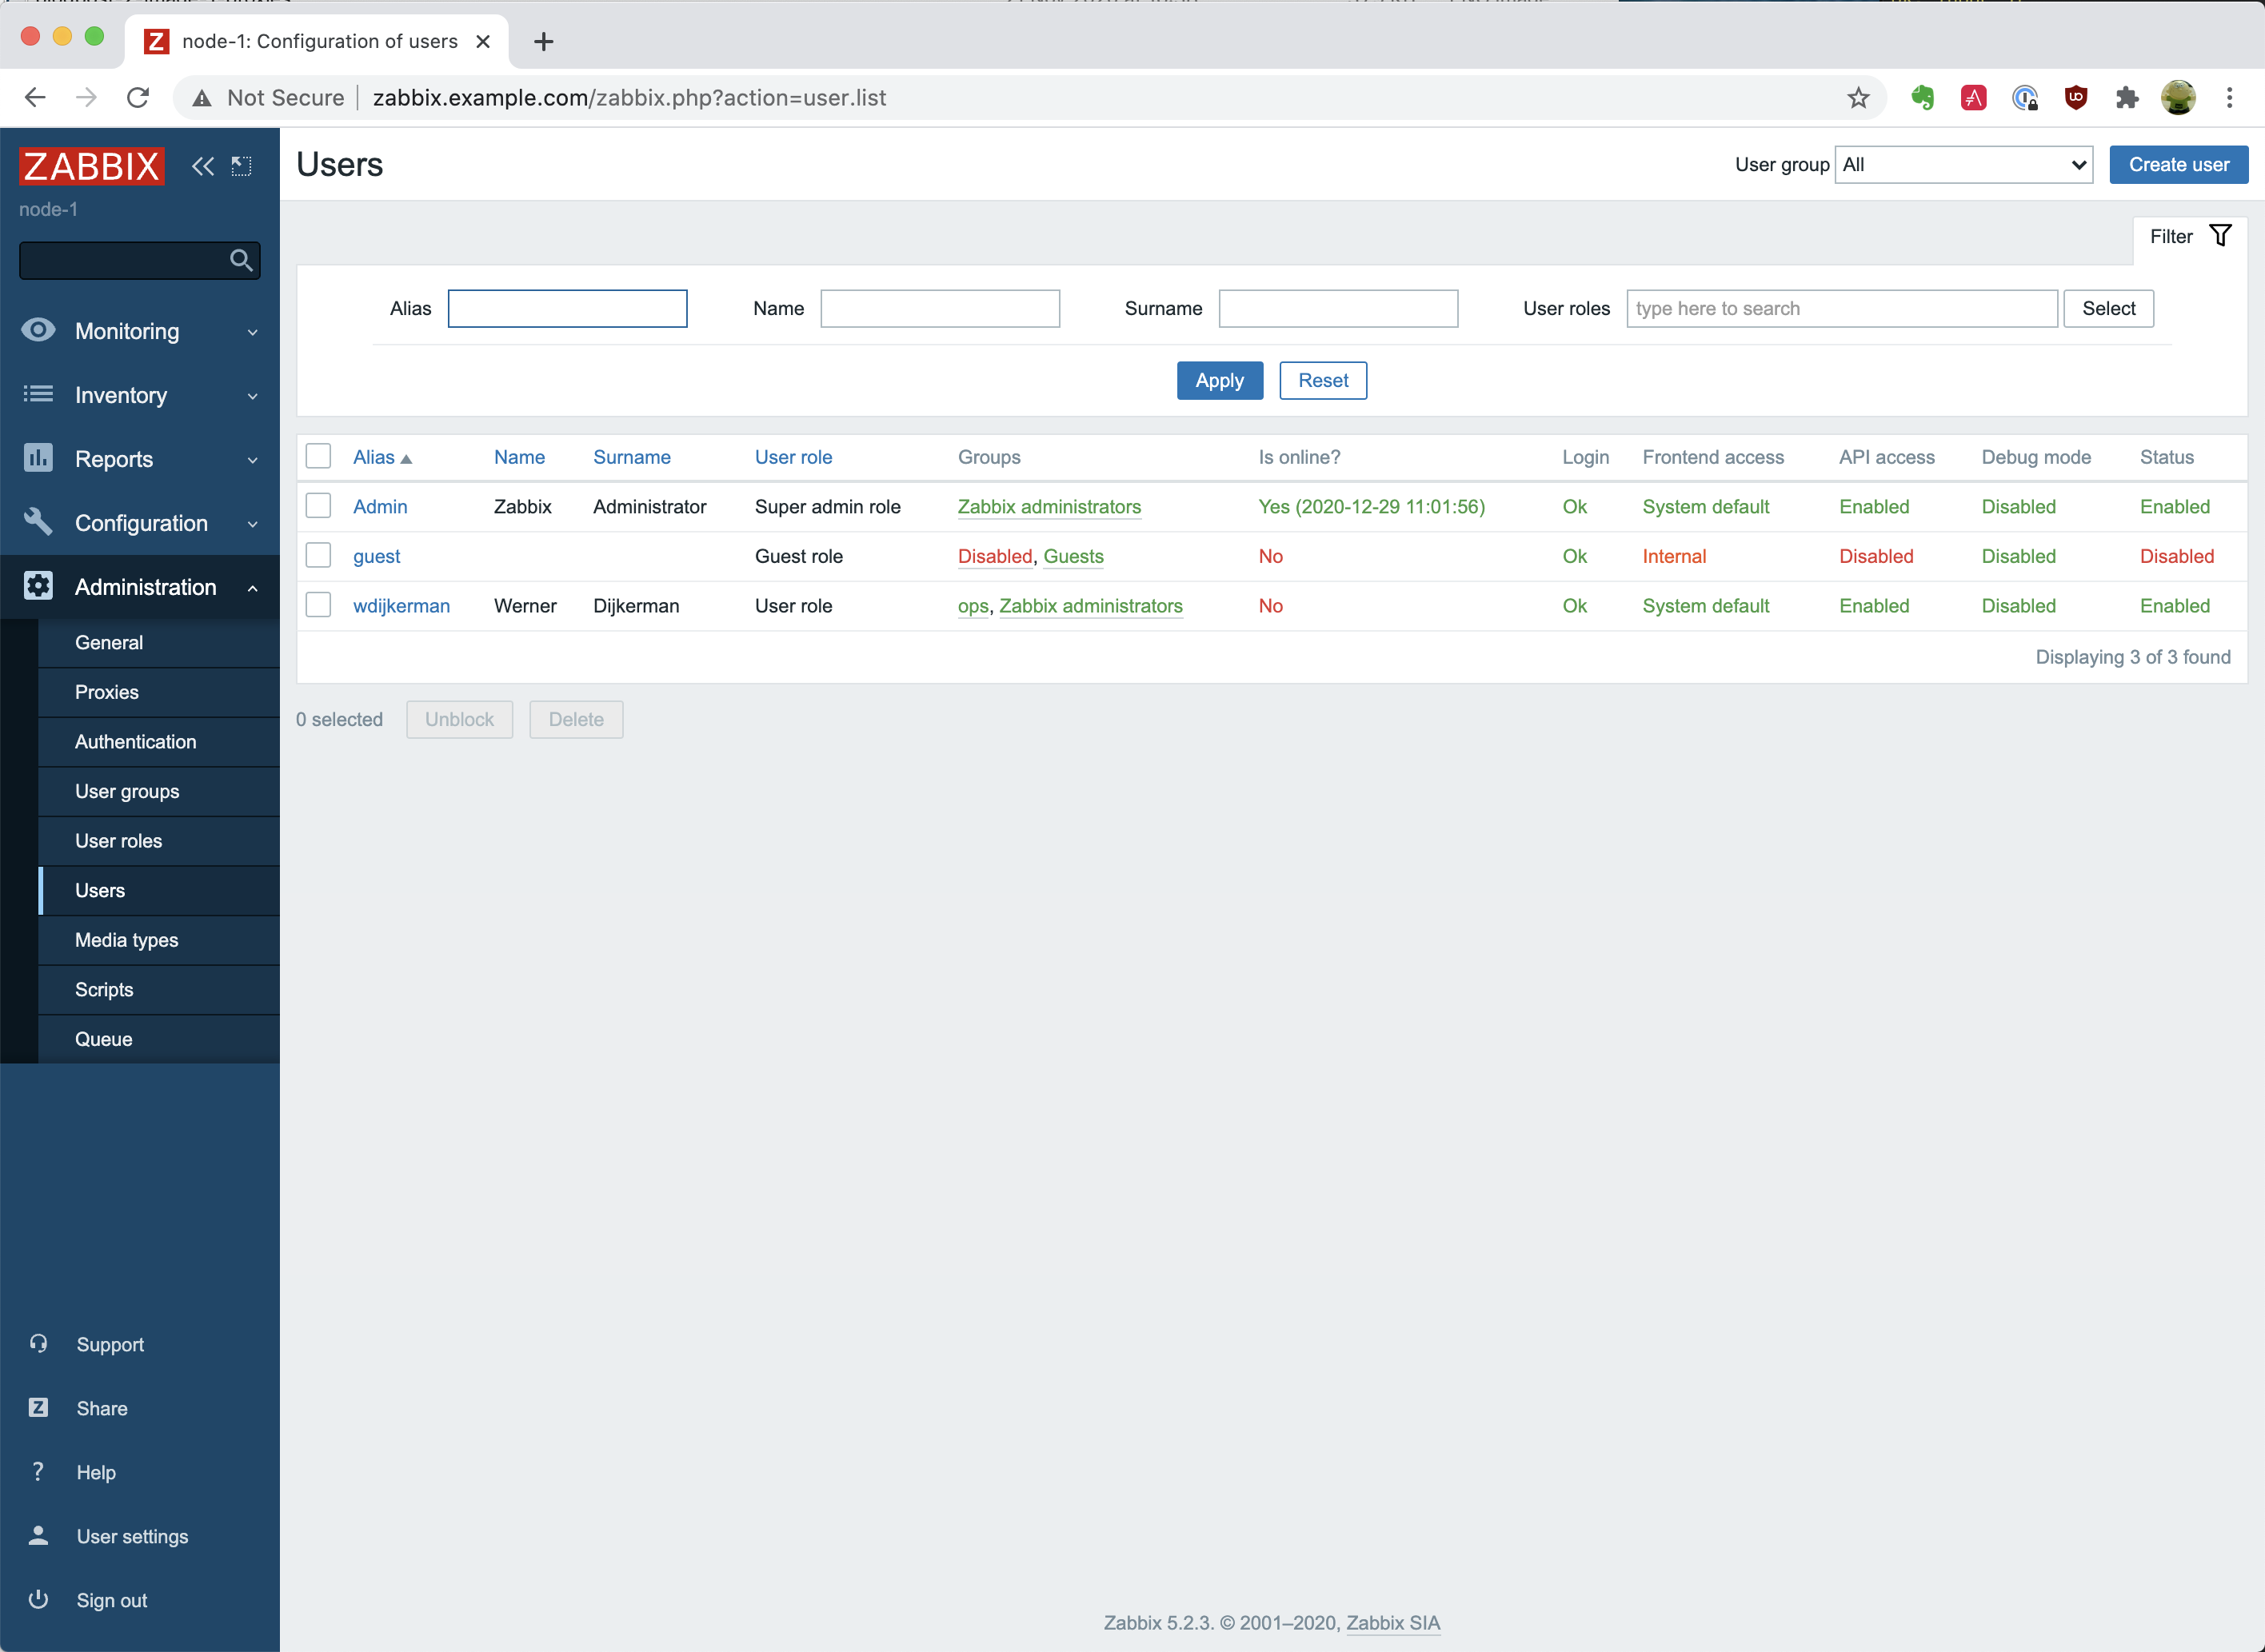
  2. Create a service user. Select “Event-Driven Ansible” as the media and specify the address of your server and the port which the webhook plugin will listen in on as the destination in the format xxx.xxx.xxx.xxx:port. This article will use the value 5001 as the port. This value will still be needed to configure ansible-rulebook.

  3. Configure an action to send notifications. As an operation, specify sending via “Event-Drive Ansible.” Specify the service user created in the previous step as the recipient.

Receiving events in Event-Driven Ansible

First things first – you need to have an eda-server installed. You can find detailed installation and configuration instructions here.

After installing an eda-server, you can make your first ansible-rulebook. To do this, you need to create a file with the “yml” extension. Call it zabbix-test.yml and put the following code in it:

---
- name: Zabbix test rulebook
  hosts: all
  sources:
    - ansible.eda.webhook:
        host: 0.0.0.0
        port: 5001
  rules:
    - name: debug
      condition: event.payload is defined
      action:
        debug:

Ansible-rulebook, as you may have noticed, uses the yaml format. In this case, it has 4 parameters – name, hosts, source, and rules.

Name and Host parameters

The first 2 parameters are typical for Ansible users. The name parameter contains the name of the ansible-rulebook. The hosts parameter specifies which hosts the ansible-rulebook applies to. Hosts are usually listed in the inventory file. You can learn more about the inventory file in the ansible documentation. The most interesting options are source and rules, so let’s take a closer look at them.

Source parameter

The source parameter specifies the origin of events for the ansible-rulebook. In this case, the ansible.eda.webhook plugin is specified as the event source. This means that after the start of the ansible-rulebook, the webhook plugin starts listening in on the port to receive the event. This also means that it needs 2 parameters to work:

  1. Parameter “host” – a value of 0.0.0.0 used to receive events from all addresses.
  2. Parameter “port” – with 5001 as the value. This plugin will accept all incoming messages received on this particular port. The value of the port parameter must match the port you specified when creating the service user in Zabbix.
Rules parameter

The rules parameter contains a set of rules with conditions for matching with an incoming event. If the condition matches the received event, then the action specified in the actions section will be performed. Since this ansible-rulebook is only for reference, it is enough to specify only one rule. For simplicity, you can use event.payload is defined as a condition. This simple condition means that the rule will check for the presence of the “event.payload” field in the incoming event. When you specify debug in the action, ansible-rulebook will show you the full text of the received event. With debug you can also understand which fields will be passed in the event and set the conditions you need.

The name, host, source parameters only affect the event source. In our case, the webhook plugin will always be the event source. Accordingly, these parameters will not change and in all the following examples they will be skipped. As an example, only the value of the rules parameter will be specified.

To start your ansible-rulebook you can use the command:

ansible-rulebook --rulebook /path/to/your/rulebook/zabbix-test.yml –verbose

The line Waiting for events in the output indicates that the ansible-rulebook has successfully loaded and is ready to receive events.

Examples 

Ansible-rulebook provides a wide variety of opportunities for handling incoming events. We will look into some of the possible conditions and scenarios for using ansible-rulebook, but please remember that a more detailed list of all supported conditions and examples can be found on the official documentation page. For a general understanding of the principles of working with ansible-rulebook, please read the documentation.

Let’s see how to build conditions for precise event filtering in more detail with a few examples.

Example #1

You need to run a playbook to change the NGINX configuration at the Berlin office when you receive an event from Zabbix. The host is in three groups:

  1. Linux servers
  2. Web servers
  3. Berlin.

And it has 3 tags:

  1. target: nginx
  2. class: software
  3. component: configuration.

You can see all these parameters in the diagram below:

On the left side you can see a host with configured monitoring. To determine whether an event belongs to a given rule, you will work with two fields – host groups and tags. These parameters will be used to determine whether the event belongs to the required server and configuration. According to the diagram, all event data is sent to the media type script to generate and send JSON. On the Ansible side, the webhook receives an event with JSON from Zabbix and passes it to the ansible-rulebook to check the conditions. If the event matches all the conditions, the ansible-rulebook starts the specified action. In this case, it’s the start of the playbook.

In accordance with the specified settings for host groups and tags, the event will contain information as in the block below. However, only two fields from the output are needed – “host_groups” and “event_tags.”

{
    ...,
    "host_groups": [
        "Berlin",
        "Linux servers",
        "Web servers"],
    "event_tags": {
        "class": ["os"],
        "component": ["configuration"],
        "target": ["nginx"]},
    ...
}
Search by host groups

First, you need to determine that the host is a web server. You can understand this by the presence of the “Web servers” group in the host in the diagram above. The second point that you can determine according to the scheme is that the host also has the group “Berlin” and therefore refers to the office in Berlin. To filter the event on the Event-Driven Ansible side, you need to build a condition by checking for the presence of two host groups in the received event – “Web servers” and “Berlin.” The “host_groups” field in the resulting JSON is a list, which means that you can use the is select construct to find an element in the list.

Search by tag value

The third condition for the search applies if this event belongs to a configuration. You can understand this by the fact that the event has a “component” tag with a value of “configuration.” However, the event_tags field in the resulting JSON is worth looking at in more detail. It is a dictionary containing tag names as keys, and because of that, you can refer to each tag separately on the Ansible side. What’s more, each tag will always contain a list of tag values, as tag names can be duplicated with different values. To search by the value of a tag, you can refer to a specific tag and use the is select construction for locating an element in the list.

To solve this example, specify the following rules block in ansible-rulebook:

  rules:
    - name: Run playbook for office in Berlin
      condition: >-
        event.payload.host_groups is select("==","Web servers") and
        event.payload.host_groups is select("==","Berlin") and
        event.payload.event_tags.component is select("==","configuration")
      action:
        run_playbook:
          name: deploy-nginx-berlin.yaml
Solution

The condition field contains 3 elements, and you can see all conditions on the right side of the diagram. In all three cases, you can use the is select construct and check if the required element is in the list.

The first two conditions check for the presence of the required host groups in the list of groups in “event.payload.host_groups.” In the diagram, you can see with a green dotted line how the first two conditions correspond to groups on the host in Zabbix. According to the condition of the example, this host must belong to both required groups, meaning that you need to set the logical operation and between the two conditions.

In the last condition, the event_tags field is a dictionary. Therefore, you can refer to the tag by specifying its name in the “event.payload.event_tags.component“ path and check for the presence of “configuration” among the tag values. In the diagram, you can see the relationship between the last condition and the tags on the host with a dotted line.

Since all three conditions must match according to the condition of the example, you once again need to put the logical operation and between them.

Action block

Let’s analyze the action block. If both conditions match, the ansible-rulebook will perform the specified action. In this case, that means the launch of the playbook using the run_playbook construct. Next, the name block contains the name of the playbook to run: deploy-nginx-berlin.yaml.

Example #2

Here is an example using the standard template Docker by Zabbix agent 2. For events triggered by “Container {#NAME}: Container has been stopped with error code”, the administrator additionally configured an action to send it to Event-Driven Ansible as well. Let’s assume that in the case of stopping the container “internal_portal” with the status “137”, its restart requires preparation, with the logic of that preparation specified in the playbook.

There are more details in the diagram above. On the left side, you can see a host with configured monitoring. The event from the example will have many parameters, but you will work with two – operational data and all tags of this event. According to the general concept, all this data will go into the media type script, which will generate JSON for sending to Event-Driven Ansible. On the Ansible side, the ansible-rulebook checks the received event for compliance with the specified conditions. If the event matches all the conditions, the ansible-rulebook starts the specified action, in this case, the start of the playbook.

In the block below you can see part of the JSON to send to Event-Driven Ansible. To solve the task, you need to be concerned only with two fields from the entire output: “event_tags” and “operation_data”:

{
    ...,
    "event_tags": {
        "class": ["software"],
        "component": ["system"],
        "container": ["/internal_portal"],
        "scope": ["availability"],
        "target": ["docker"]},
    "operation_data": "Exit code: 137",
    ...
}
Search by tag value

The first step is to determine that the event belongs to the required container. Its name is displayed in the “container” tag, so you need to add a condition to search for the name of the container “/internal_portal” in the tag. However, as discussed in the previous example, the event_tags field in the resulting JSON is a dictionary containing tag names as keys. By referring to the key to a specific tag, you can get a list of its values. Since tags can be repeated with different values, you can get all the values of this tag by key in the received JSON, and this field will always be a list. Therefore, to search by value, you can always refer to a specific tag and use the is select construction.

Search by operational data field

The second step is to check the exit code. According to the trigger settings, this information is displayed in the operational data and passed to Event-Driven Ansible in the “operation_data” field. This field is a string, and you need to check with a regular expression if this field contains the value “Exit code: 137.” On the ansible-rulebook side, the is regex construct will be used to search for a regular expression.

To solve this example, specify the following rules block in ansible-rulebook:

  rules:
    - name: Run playbook for container "internal_portal"
      condition: >-
        event.payload.event_tags.container is select("==","/internal_portal") and
        event.payload.operation_data is regex("Exit code.*137")
      action:
        run_playbook:
          name: restart_internal_portal.yaml
Solution

In the first condition, the event_tags field is a dictionary and you are referring to a specific tag, so the final path will contain the tag name, including “event.payload.event_tags.container.” Next, using the is select construct, the list of tag values is checked. This allows you to check that the required “internal_portal” container is present as the value of the tag. If you refer to the diagram, you can see the green dotted line relationship between the condition in the ansible-rulebook and the tags in the event from the Zabbix side.

In the second condition, access the event.payload.operation_data field using the is regex construct and the regular expression “Exit code.*137.” This way you check for the presence of the status “137” as a value. You can also see he link between the green dotted line of the condition on the ansible-rulebook side and the operational data of the event in Zabbix in the diagram.

Since both conditions must match, you can specify the and logical operation between the conditions.

Action block

Taking a look at the action block, if both conditions match, the ansible-rulebook will perform the specified action. In this case, it’s the launch of the playbook using the run_playbook construct. Next, the name block contains the name of the playbook to run:restart_internal_portal.yaml.

Conclusion

It’s clear that both tools (and especially their interconnected work) are great for implementing automation. Zabbix is a powerful monitoring solution, and Ansible is a great orchestration software. Both of these tools complement each other, creating an excellent tandem that takes on all routine tasks. This article has shown how to send events from Zabbix to Event-Driven Ansible and how to configure it on each side, and it has also proven that it’s not as difficult as it might initially seem. But remember – we’ve only looked at the simplest examples. The rest depends only on your imagination.

Questions

Q: How can I get the full list of fields in an event?

A: The best way is to make an ansible-rulebook with action “debug” and condition “event.payload is defined.” In this case, all events from Zabbix will be displayed. This example is described in the section “Receiving Events in Event-Driven Ansible.”

Q: Does the list of sent fields depend on the situation?

A: No. The list of fields in the sent event is always the same. If there are no objects in the event, the field will be empty. The case with tags is a good example – the tags may not be present in the event, but the “tags” field will still be sent.

Q: What events can be sent from Zabbix to Event-Drive Ansible?

A: In the current version (Zabbix 6.4)n, only trigger-based events and problems can be sent.

Q: Is it possible to use the values of received events in the ansible-playbook?

A: Yes. On the ansible-playbook side, you can get values using the ansible_eda namespace. To access the values in an event, you need to specify ansible_eda.event.

For example, to display all the details of an event, you can use:

  tasks:
    - debug:
        msg: "{{ ansible_eda.event }}"

To get the name of the container from example #2 of this article, you can use the following code:

  tasks:
    - debug:
        msg: "{{ ansible_eda.event.payload.event_tags.container }}"

The post Forward Zabbix Events to Event-Driven Ansible and Automate your Workflows appeared first on Zabbix Blog.

Finalizing the installation of Zabbix Agent with Ansible

Post Syndicated from Werner Dijkerman original https://blog.zabbix.com/finalizing-the-installation-of-zabbix-agent-with-ansible/13321/

In the previous blog posts, we created a Zabbix Server with a new user, a media type, and an action. In the 2nd blog post, we continued with creating and configuring a Zabbix Proxy. In the last part of this series of blog posts, we will install the Zabbix Agent on all of the 3 nodes we have running.

This blog post is the 3rd part of a 3 part series of blog posts where Werner Dijkerman gives us an example of how to set up your Zabbix infrastructure by using Ansible.
You can find part 1 of the blog post by clicking here.

To summarize, so far we have a Zabbix Server and a Zabbix Proxy. The Zabbix Server has a MySQL instance running on a separate node, the MySQL instance for the Zabbix Proxy runs on the same node. But we are missing one component right now, and that is something we will install with the help of this blog post. We will install the Zabbix Agent on the 3 nodes.

A git repository containing the code used in these blog posts is available on https://github.com/dj-wasabi/blog-installing-zabbix-with-ansible. Before we run Ansible, we need to make sure we have opened a shell on the “bastion” node. We can do that with the following command:

$ vagrant ssh bastion

Once we have opened the shell, go to the “/ansible” directory where we have all of our Ansible files present.

$ cd /ansible

In the previous blog post, we executed the “zabbix-proxy.yml” playbook. Now we are going to use the “zabbix-agent.yml” playbook. The playbook will install the Zabbix Agent on all nodes (“node-1”, “node-2” and “node-3”). Next up, on both the “node-1” and “node-3”, we will add a user parameters file specifically for MySQL. With this user parameters file, we are able to monitor the MySQL instances.

$ ansible-playbook -i hosts zabbix-agent.yml

This playbook will run for a few minutes installing the Zabbix Agent on the nodes. It will install the zabbix-agent package and add the configuration file, but it will also make a connection to the Zabbix Server API. We will automatically create a host with the correct IP information and the correct templates! When the Ansible playbook has finished running, the hosts can immediately be found in the Frontend. And better yet, it is automatically correctly configured, so the hosts will be monitored immediately!

We have several configurations spread over multiple files to make this work. We first start with the “all” file.

The file “/ansible/group_vars/all” contains the properties that will apply to all hosts. Here we have the majority of essential properties configured that are overriding the default properties of the Ansible Roles. Each role has some default configuration, which will work out of the box. But in our case, we need to override these, and we will discuss some of these properties next.

zabbix_url

This is the URL on which the Zabbix Frontend is available and thus also the API. This property is for example used when we create the hosts via the API as part of the Proxy and Agent installation.

zabbix_proxy

The Zabbix Agents will be monitored by the Zabbix Proxy unless the Agent runs on the Zabbix Server or the host running the database for the Zabbix Server. Like with the previous blog post, we will also use some Ansible notation to get the IP address of the host running the Zabbix Proxy to configure the Zabbix Agent.

zabbix_proxy: node-3
zabbix_agent_server: "{{ hostvars[zabbix_proxy]['ansible_host'] }}"
zabbix_agent_serveractive: "{{ hostvars[zabbix_proxy]['ansible_host'] }}"

With the above configuration, we configure both the Server and ServerActive in the Zabbix Agent’s configuration file to use the IP address of the host running the Zabbix Proxy. If you look at the files “/ansible/group_vars/zabbix_database” and “/ansible/group_vars/zabbix_server/generic” you would see that these contain the following:

zabbix_agent_server: "{{ hostvars['node-1']['ansible_host'] }}"
zabbix_agent_serveractive: "{{ hostvars['node-1']['ansible_host'] }}"

The Zabbix Agent on the Zabbix Server and on its database is using the IP address of the Zabbix Server to be used as the value for both the “Server” and “ActiveServer” configuration settings for the Zabbix Agent.

zabbix_api_user & zabbix_api_pass

These are the default in the roles, but I have added them here so it is clear that they exist. When you change the Admin user password, don’t forget to change them here as well.

zabbix_api_create_hosts & zabbix_api_create_hostgroups 

Because we automatically want to create the Zabbix Frontend hosts via the API, we need to set both these properties to true. Firstly, we create the host groups that can be found with the property named “zabbix_host_groups”. After that, as part of the Zabbix Agent installation, the hosts will be created via the API because of the property zabbix_api_create_hosts.

Now we need to know what kind of information we want these hosts created with. Let’s go through some of them.

zabbix_agent_interfaces

This property contains a list of all interfaces that are used to monitoring the host. This is relatively simple in our case, as the hosts only have 1 interface available. You can find some more information about what to use when you have other interfaces like IPMI or SNMP: https://github.com/ansible-collections/community.zabbix/blob/main/docs/ZABBIX_AGENT_ROLE.md#other-interfaces We use the interface with the value from property “ansible_host” for port 10050.

zabbix_host_groups

This property was also discussed before – we automatically assign our new host to these host groups. Again, we have a fundamental setup, and thus it is an effortless property.

zabbix_link_templates

We provide a list of all Zabbix Templates we will want to assign to the hosts with this property. This property seems a bit complicated, but no worries – let’s dive in!

zabbix_link_templates:
  - "{{ zabbix_link_templates_append if zabbix_link_templates_append is defined else [] }}"
  - "{{ zabbix_link_templates_default }}"

With the first line, we add the property’s value “zabbix_link_templates_append”, but we only do that if that property exists. If Ansible can not find that property, then we basically add an empty list. So where can we find this property? We can check the files in the other directories in the group_vars directory. If we check, for example “/ansible/group_vars/database/generic”, we will find the property:

zabbix_link_templates_append:
  - 'MySQL by Zabbix agent'

So on all nodes that are part of the database group, we add the value to the property “zabbix_link_templates”. All of the database servers will get this template attached to the host. If we would check the file “/ansible/group_vars/zabbix_server/generic”, then we will find the following:

zabbix_link_templates_append:
  - 'Zabbix Server'

As you probably understand now, when we create the Zabbix Server host, we will add the “Zabbix Server” template to the host, because this file is only used for the hosts that are part of the zabbix_server group.

With this setup, we can configure specific templates for the specific groups, but there is also at least 1 template that we always want to add. We don’t want to add the template to each file as that is a lot of configuration, so we use a new property for this named “zabbix_link_templates_default”. In our case, we only have Linux hosts, so we always want to add the templates:

zabbix_link_templates_default:
  - "Linux by Zabbix agent active"

On the Zabbix Server, we both assign the “Zabbix Server” template and the template “Linux by Zabbix agent active” to the host.

But what if we have Macros?

zabbix_macros

As part of some extra tasks in this playbook execution, we also need to provide a macro for some hosts. This macro is needed to make the Zabbix Template we assign to the hosts work. For the hosts running a MySQL database, we need to add a macro, which can be found with the property zabbix_macros_append in the file “/ansible/group_vars/database/generic”.

zabbix_macros_append:
  - macro_key: "MYSQL.HOST"
    macro_value: "{{ ansible_host }}"

We will create 1 macro with the key name “MYSQL.HOST” and assign a value that will be equal to the contents of the property ansible_host (For the “node-2” host, the host running the database for the Zabbix Server), which is “10.10.1.12”.

User parameters

The “problem” with assigning the MySQL template is that it also requires some UserParameter entries set. The Zabbix Agent role can deploy files containing UserParameters to the given hosts. In “/ansible/group_vars/database/generic” we can find the following properties:

zabbix_agent_userparameters_templates_src: "{{ inventory_dir }}/files/zabbix/mysql"
zabbix_agent_userparameters:
  - name: template_db_mysql.conf

The first property “zabbix_agent_userparameters_templates_src” will let Ansible know where to find the files. The “{{ inventory_dir }}” will be translated to “/ansible” and here you will find a directory named “files” (and you will find the group_vars directory as well) and further drilling down the directories, you will find the file “template_db_mysql.conf”.

With the second property “zabbix_agent_userparameters” we let Ansible know which file we want to deploy to the host. In this case, the only file found in the directory named “template_db_mysql.conf”.

When the Zabbix agent role is fully executed, we have everything set to monitor all the hosts automatically. Open the dashboard, and you will see something like the following:

It provides an overview, and on the right side, you will notice we have a total of 3 nodes of which 3 are available. Maybe you will see a “Problem” like in the screenshot above, but it will go away.

If we go to “Configuration” and “Hosts,” we will see that we have the 3 nodes, and they have the status “Enabled” and the “ZBX” icon is green, so we have a proper connection.

We should verify that we have some data, so go to “Monitoring” and click on “Latest data.” We select in the Host form field the “Zabbix database,” and we select “MySQL” as Application and click on “Apply.” If everything is right, it should provide us with some information and values, just like the following screenshot. If not, please wait a few minutes and try again.

Summary

This is the end of a 3 part blog post in creating a fully working Zabbix environment with a Zabbix Server, Proxy, and Agent. With these 3 blogposts you were able to see how you can install and configure a complete Zabbix environment with Ansible. Keep in mind that the code shown was for demo purposes and it is not something you can immediately use for the Production environment. We also used some of the available functionality of the Ansible collection for Zabbix, there are many more possibilities like creating a maintenance period or a discovery rule. Not everything is possible, if you do miss a task or functionality of a role that Ansible should do or configure, please create an issue on Github so we can make it happen.

Don’t forget to execute the following command:

$ vagrant destroy -f

With this, we clean up our environment and delete our 4 nodes, thus finishing with the task at hand!

Installing and configuring the Zabbix Proxy

Post Syndicated from Werner Dijkerman original https://blog.zabbix.com/installing-and-configuring-the-zabbix-proxy/13319/

In the previous blog post, we created a Zabbix Server setup, created several users, a media type, and an action. But today, we will install on a 3rd node the Zabbix Proxy. This Zabbix Proxy will have its database running on the same host, so the “node-3” host has both the MySQL and Zabbix Proxy running.

This blog post is the 2nd part of a 3 part series of blog posts where Werner Dijkerman gives us an example of how to set up your Zabbix infrastructure by using Ansible.
You can find part 1 of the blog post by clicking Here

A git repository containing the code of these blog posts is available, which can be found on https://github.com/dj-wasabi/blog-installing-zabbix-with-ansible. Before we run Ansible, we have opened a shell on the “bastion” node. We do that with the following command:

$ vagrant ssh bastion

Once we have opened the shell, go to the “/ansible” directory where we have all of our Ansible files present.

$ cd /ansible

With the previous blog post, we executed the “zabbix-server.yml” playbook. Now we use the “zabbix-proxy.yml” playbook. The playbook will deploy a MySQL database on “node-3” and also installs the Zabbix Proxy on the same host.

$ ansible-playbook -i hosts zabbix-proxy.yml

This playbook will run for a few minutes creating all services on the node. While it is running, we will explain some of the configuration options we have set.

The configuration which we will talk about can be found in “/ansible/group_vars/zabbix_proxy” directory. This is the directory that is only used when we deploy the Zabbix proxy and contains 2 files. 1 file called “secret”, and a file called “generic”. It doesn’t really matter what names the files have in this directory. I used a file called the “secret” for letting you know that this file contains secrets and should be encrypted with a tool like ansible-vault. As this is out of scope for this blog, I simply made sure the file is in plain text. So how do we know that this directory is used for the Zabbix Proxy node?

In the previous blog post, we mentioned that with the “-I” argument, we provided the location for the inventory file. This inventory file contains the hostnames and the groups that Ansible is using. If we open the inventory file “hosts”, we can see a group called “zabbix_proxy.” So Ansible uses the information in the “/ansible/group_vars/zabbix_proxy” directory as input for variables. But how does the “/ansible/zabbix-proxy.yml” file know which host or groups to use? At the beginning of this file, you will notice the following:

- hosts: zabbix_proxy
  become: true
  collections:
    - community.zabbix

Here you will see the that “hosts” key contains the value “zabbix_proxy”. All tasks and roles that we have configured in this play will be applied to all of the hosts that are part of the zabbix_proxy group. In our case, we have only 1 host part of the group. If you would have for example 4 different datacenters and within each datacenter you want to have a Zabbix Proxy running, executing this playbook will be done on these 4 hosts and at the end of the run you would have 4 Zabbix Proxy servers running.

Within the “/ansible/group_vars/zabbix_proxy/generic” the file, we have several options configured. Let’s discuss the following options:

* zabbix_server_host
* zabbix_proxy_name
* zabbix_api_create_proxy
* zabbix_proxy_configfrequency

zabbix_server_host

The first one, the “zabbix_server_host” property tells us where the Zabbix Proxy can find the Zabbix Server. This will allow the Zabbix Proxy and the Zabbix Server to communicate with each other. Normally you would have to configure the firewall (Iptables or Firewalld) as well to allow the traffic, but in this case, there is no need for that. Everything inside our environment which we have created with Vagrant has full access. When you are going to deploy a production-like environment, don’t forget to configure the firewall (Currently this configuration of the firewalls are not yet available as part of the Ansible Zabbix Collection for both the Zabbix Server and the Zabbix Proxy. So for now you should be creating a playbook in order to configure the local firewall to allow/deny traffic).

As you will notice, we didn’t configure the property with a value like an IP address or FQDN. We use some Ansible notation to do that for us, so we only have the Zabbix Server information in one place instead of multiple places. In this case, Ansible will get the information by reading the inventory file and looking for a host entry with the name “node-1” (Which is the hostname that is running the Zabbix Server), and we use the value found by the property named “ansible_host” (Which has a value “10.10.1.11”).

zabbix_proxy_name

This is the name of the Zabbix Proxy host, which will be shown in the Zabbix frontend. We will see this later in this blog when we will create a new host to be monitored. When you create a new host, you can configure if that new host should be monitored by a proxy and if so, you will see this name.

zabbix_api_create_proxy

When we deploy the Zabbix Proxy role, we will not only install the Zabbix Proxy package, the configuration file and start the service. We also perform an API call to the Zabbix Server to create a Zabbix Proxy entry. With this API call, we can configure hosts to be monitored via this new Zabbix Proxy.

zabbix_proxy_configfrequency

The last one is just for demonstration purposes. With a default installation/configuration of the Zabbix Proxy, it has a basic value of 3600. This means that the Zabbix Server sends the configuration every 3600 to the Zabbix Proxy. Because we are running a small demo here in this Vagrant setup, we have set this to 60 seconds.

Now the deployment of our Zabbix Proxy will be ready.

When we open the Zabbix Web interface again, we go to “Administration” and click on “Proxies”. Here we see the following:

We see an overview of all proxies available, and in our case, we only have 1. We have “node-3” configured, which has an “Active” mode. When you want to configure a “Passive” mode proxy, you’ll have to update the “/ansible/group_vars/zabbix_proxy” file and add somewhere in the file the following entry: “zabbix_proxy_status: passive”. Once you have updated and saved the file, you’ll have to rerun the “ansible-playbook -i hosts zabbix-proxy.yml” command. If you will then recheck the page, you will notice that it now has the “Passive” mode.

So let’s go to “Configuration” – “Hosts”. At the moment, you will only see 1 host, which is the “Zabbix server,” like in the following picture.

Let’s open the host creation page to demonstrate that you can now set the host to be monitored by a proxy. The actual creation of a host is something that we will do automatically when we deploy the Zabbix Agent with Ansible and not something we should do manually. 😉 
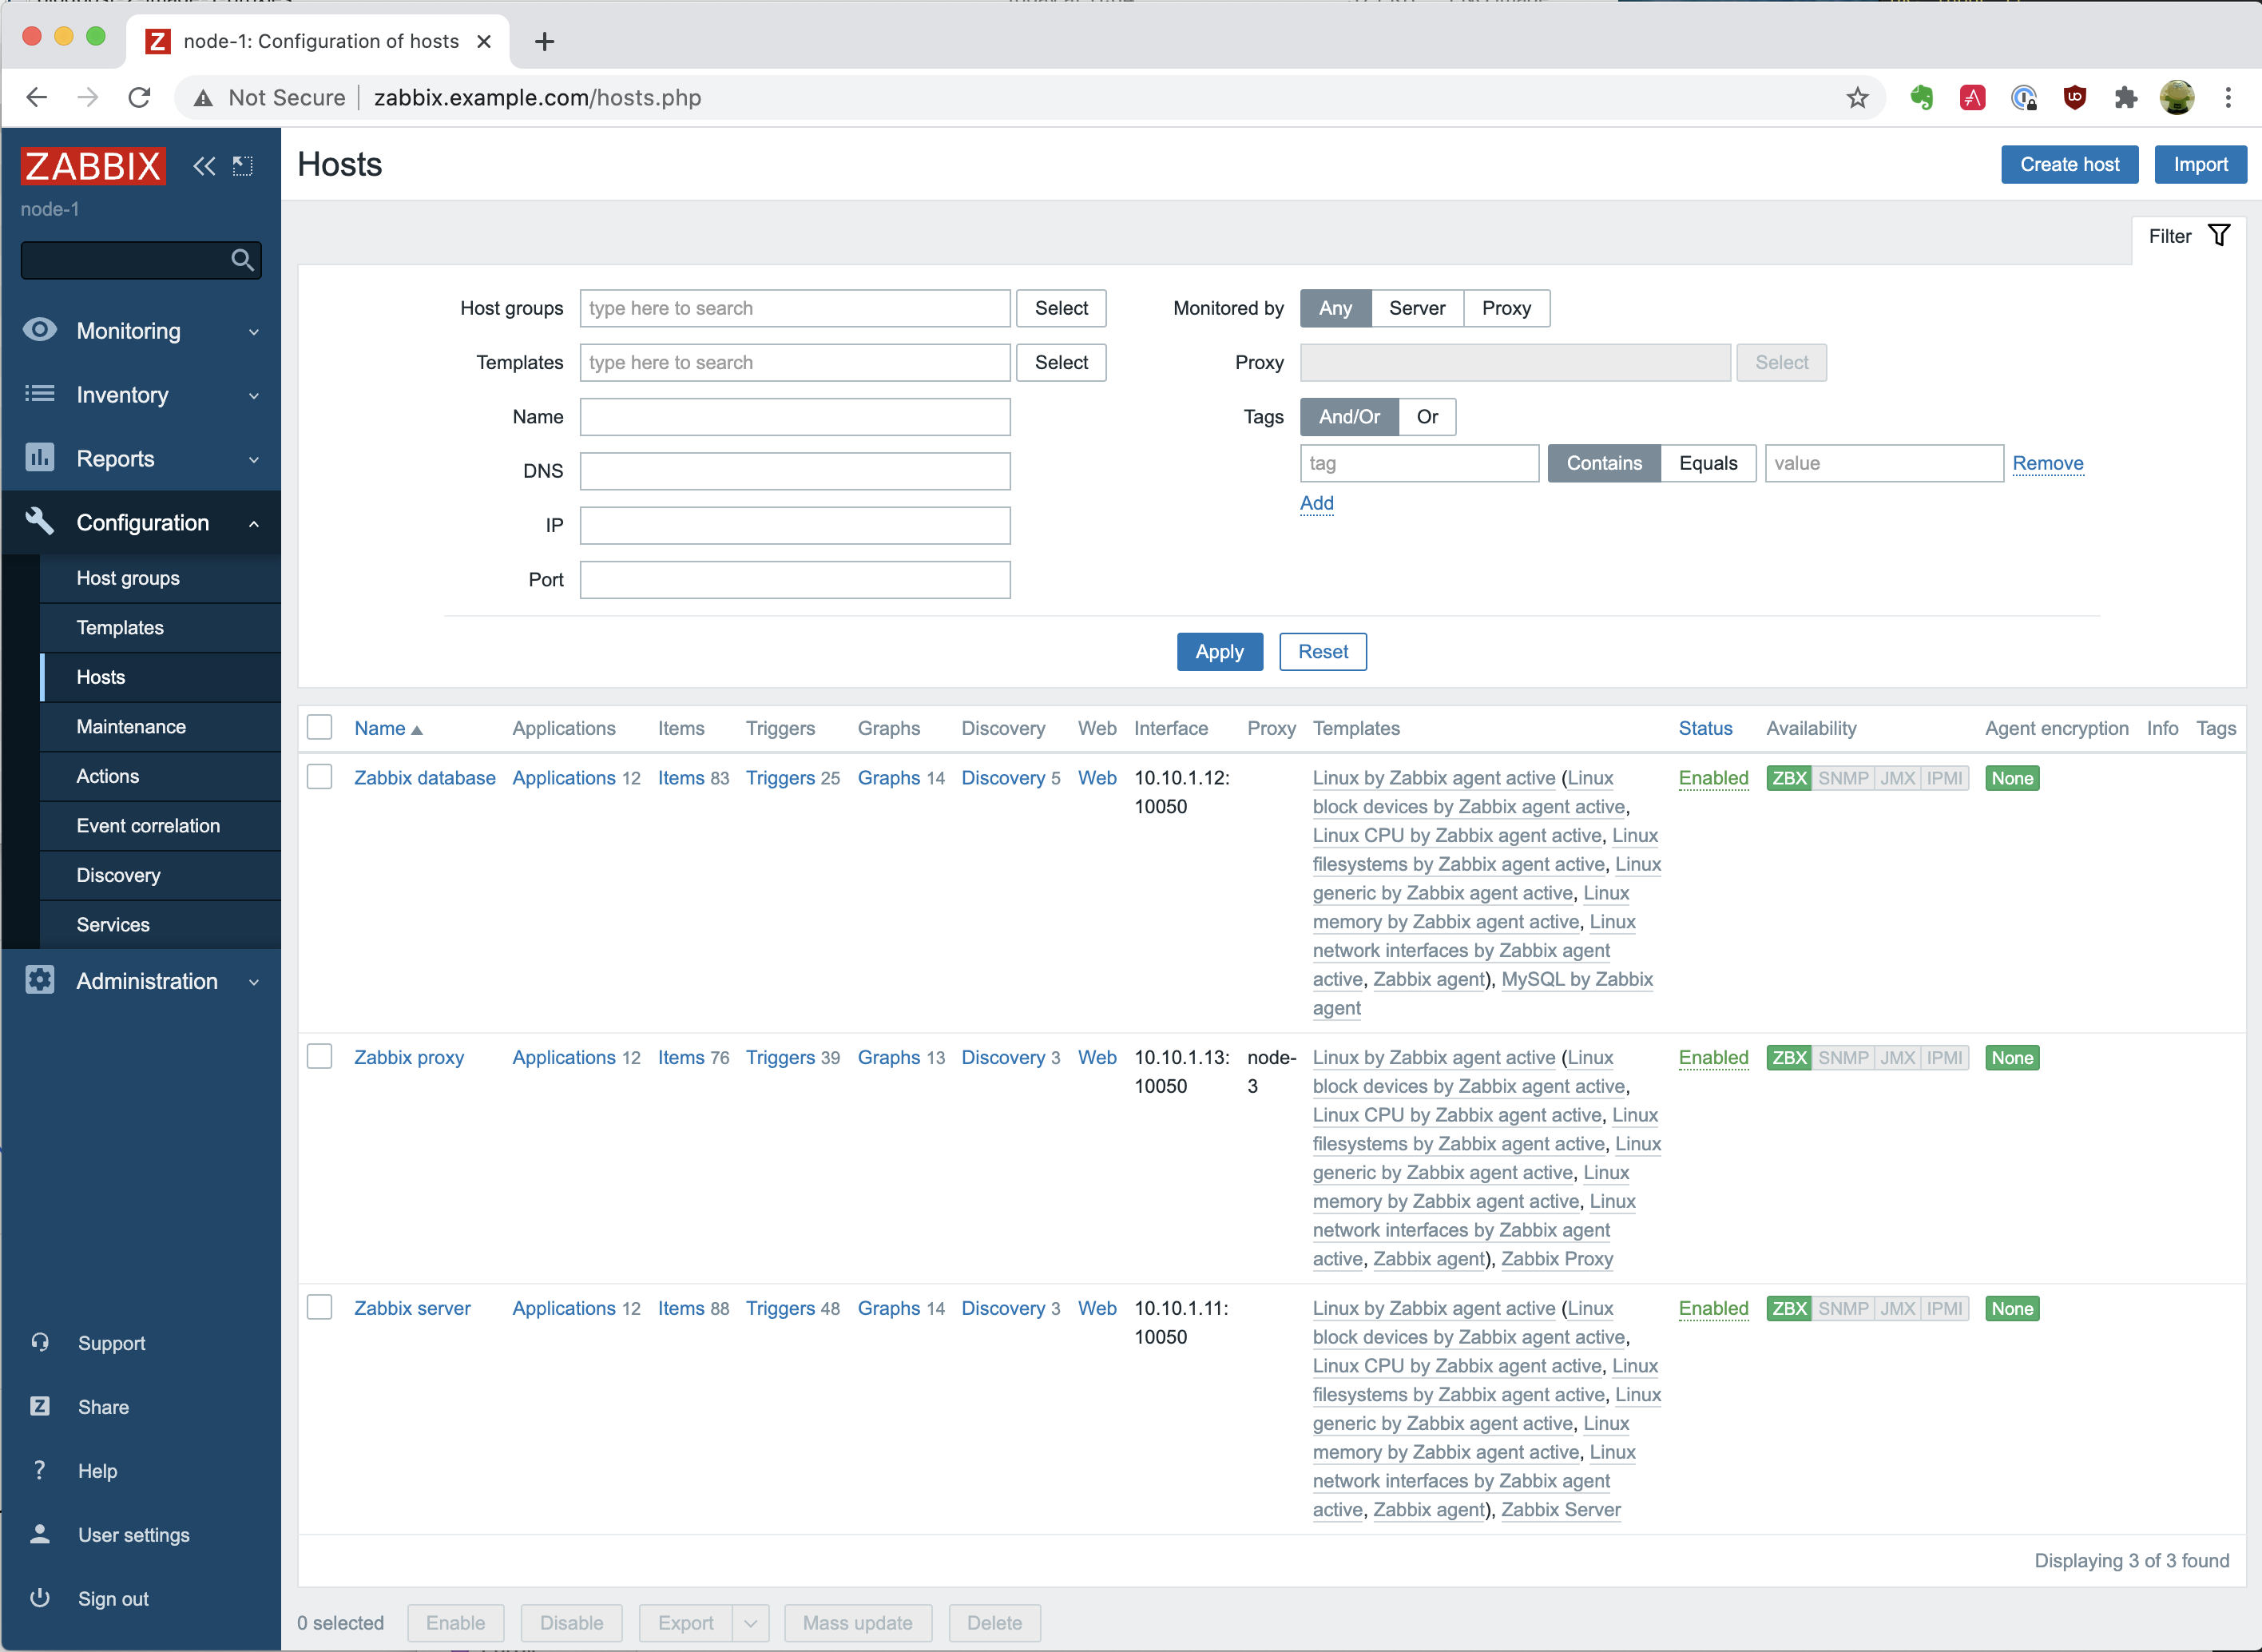
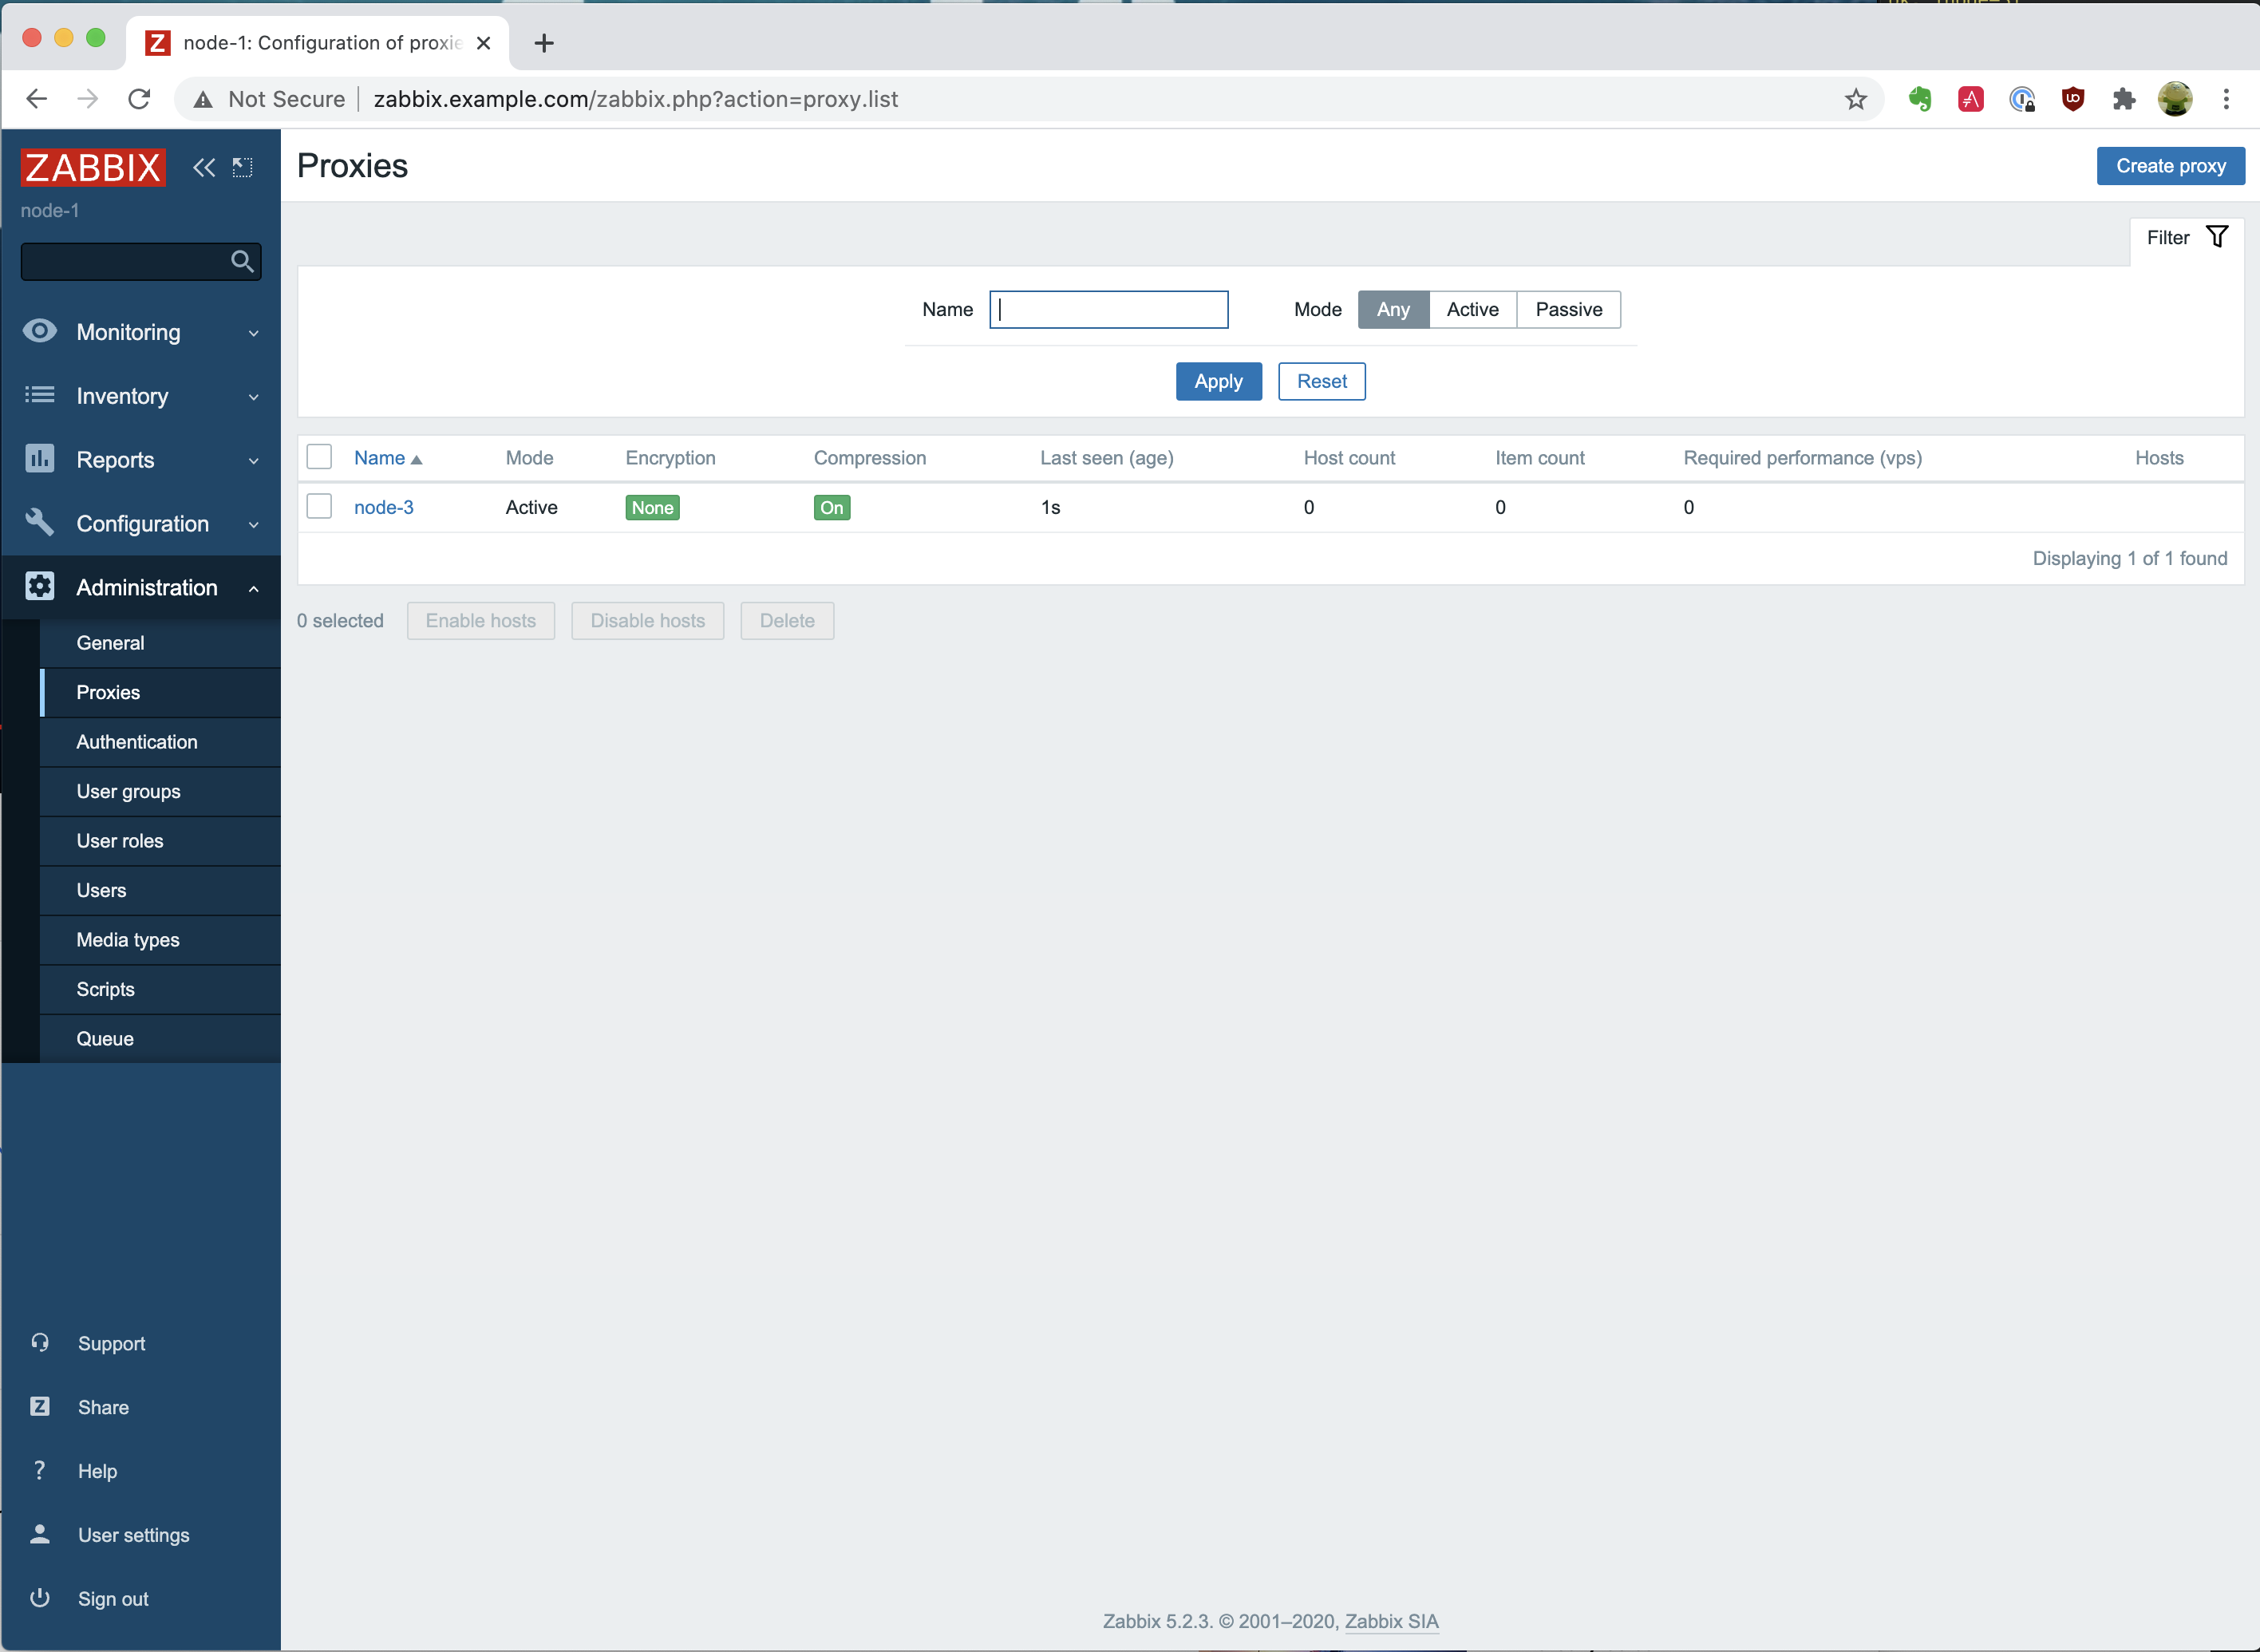
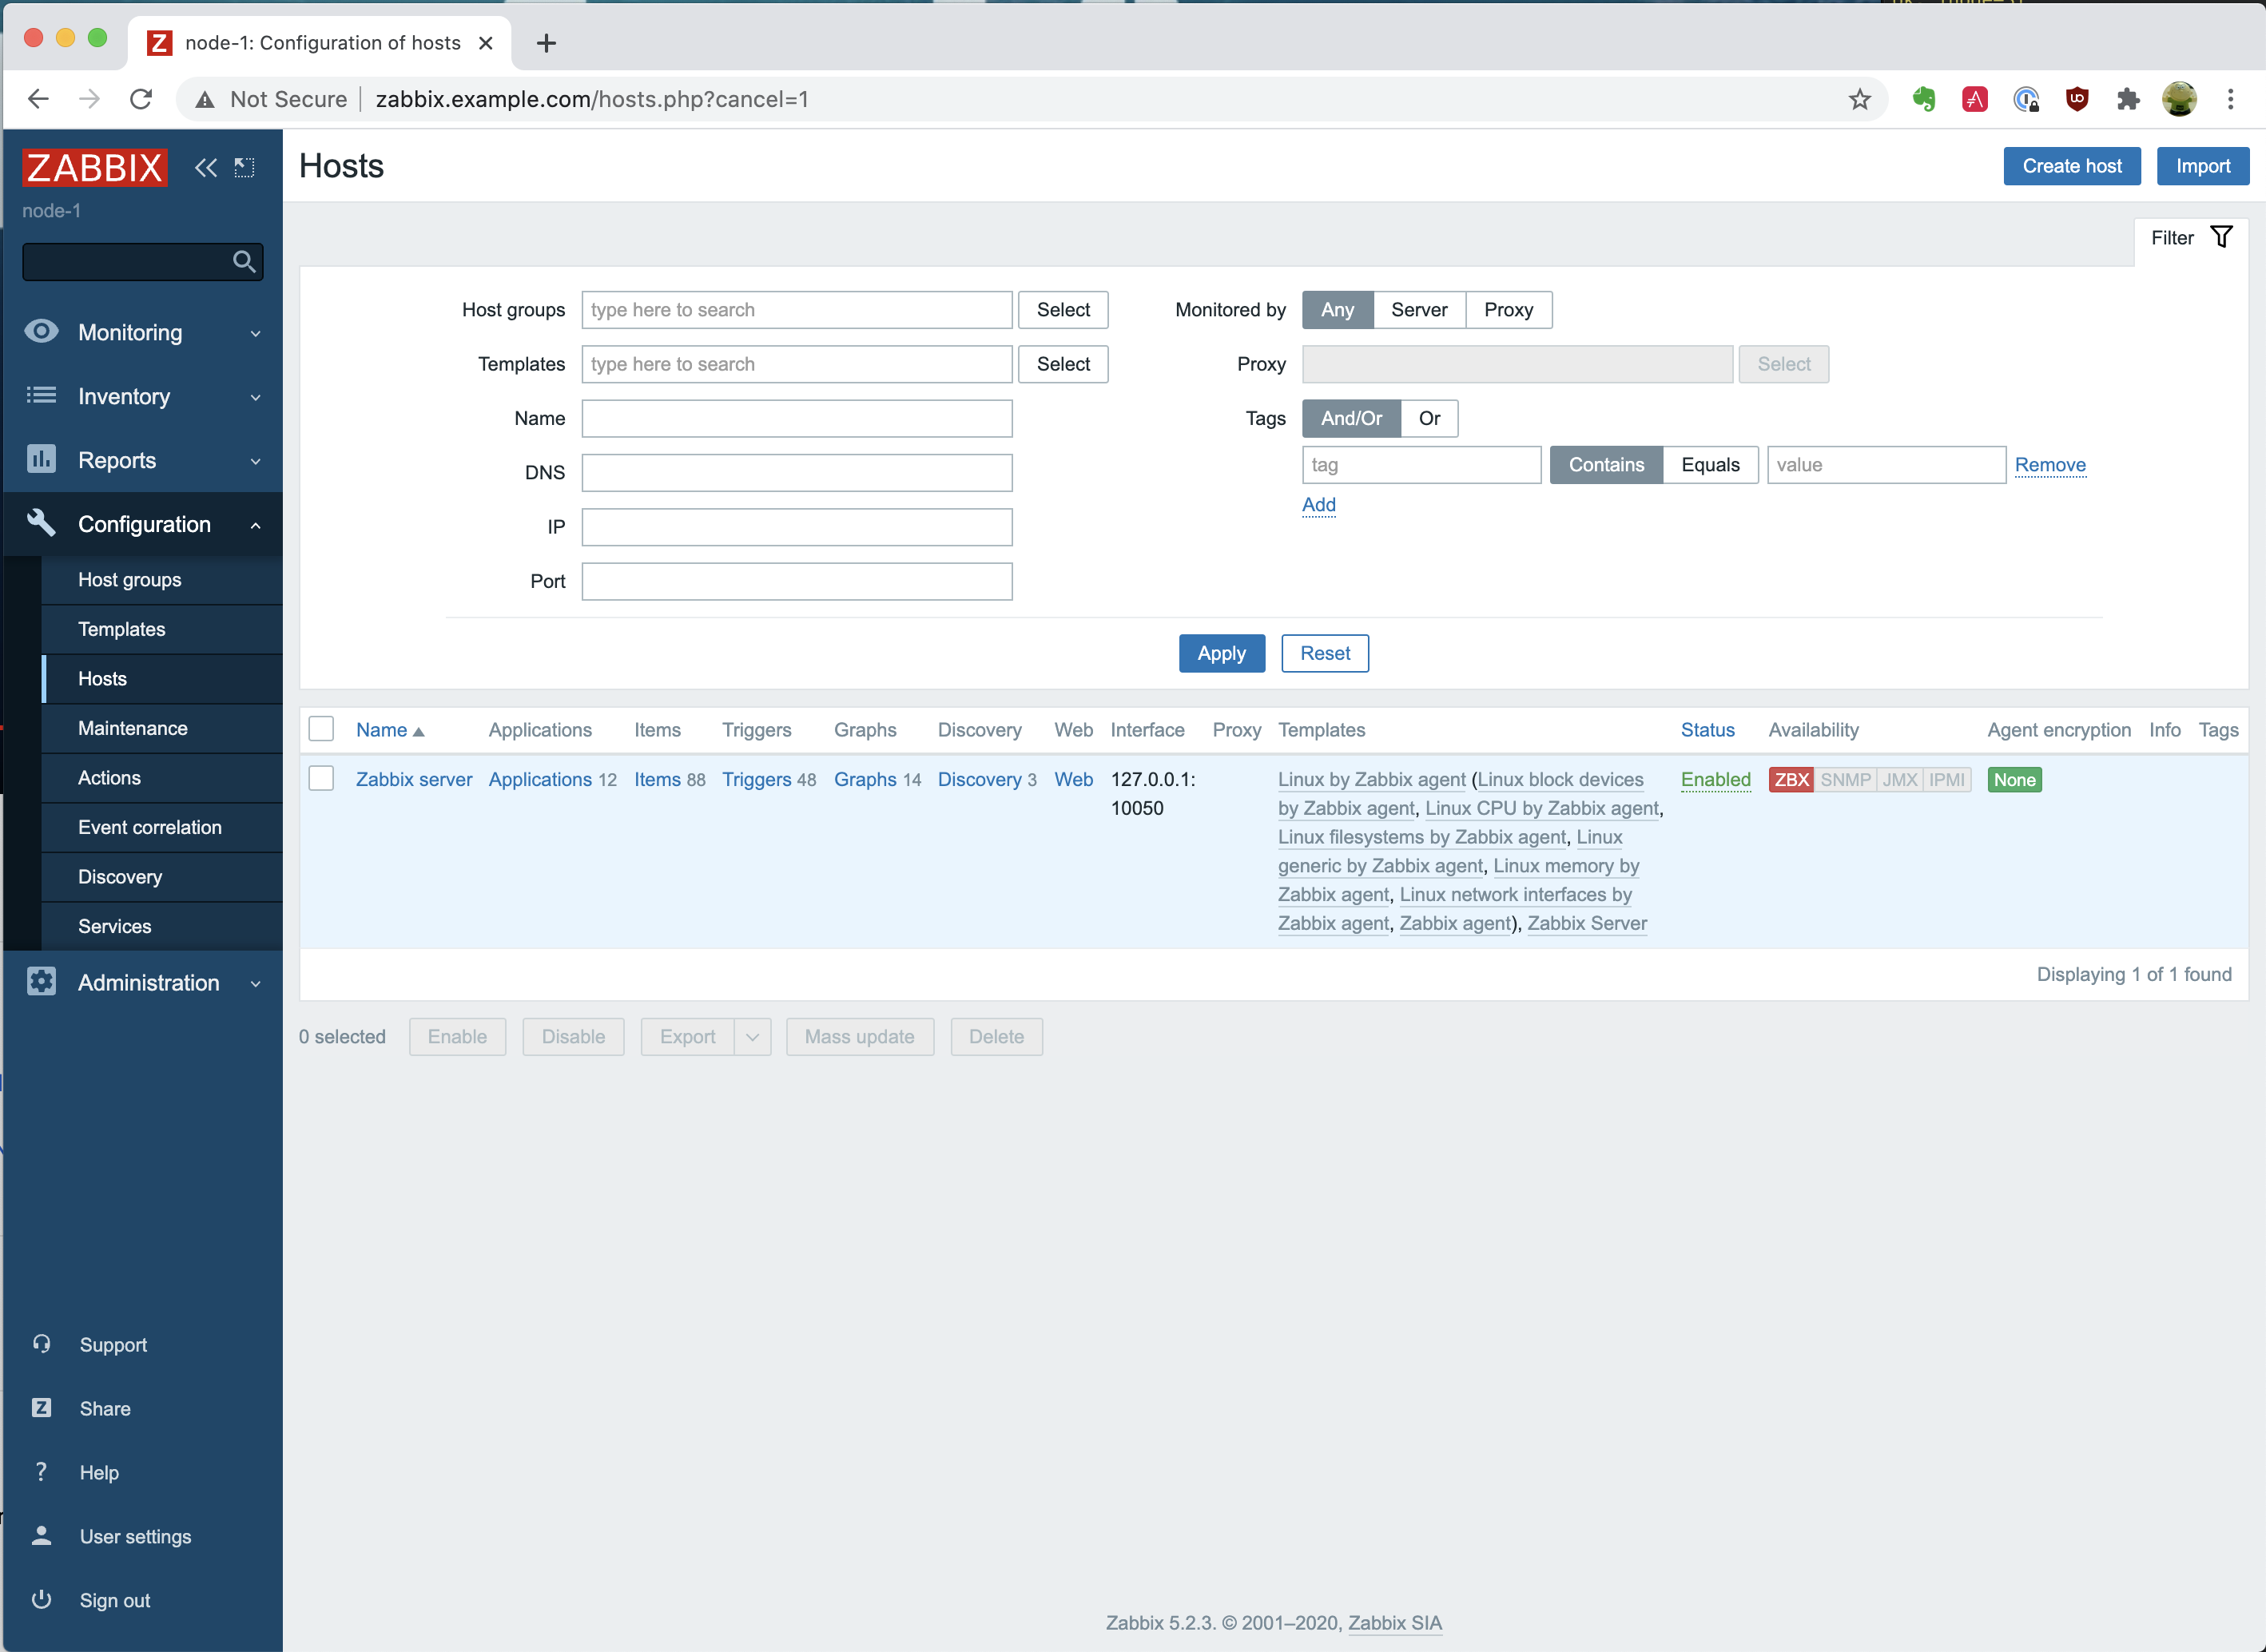
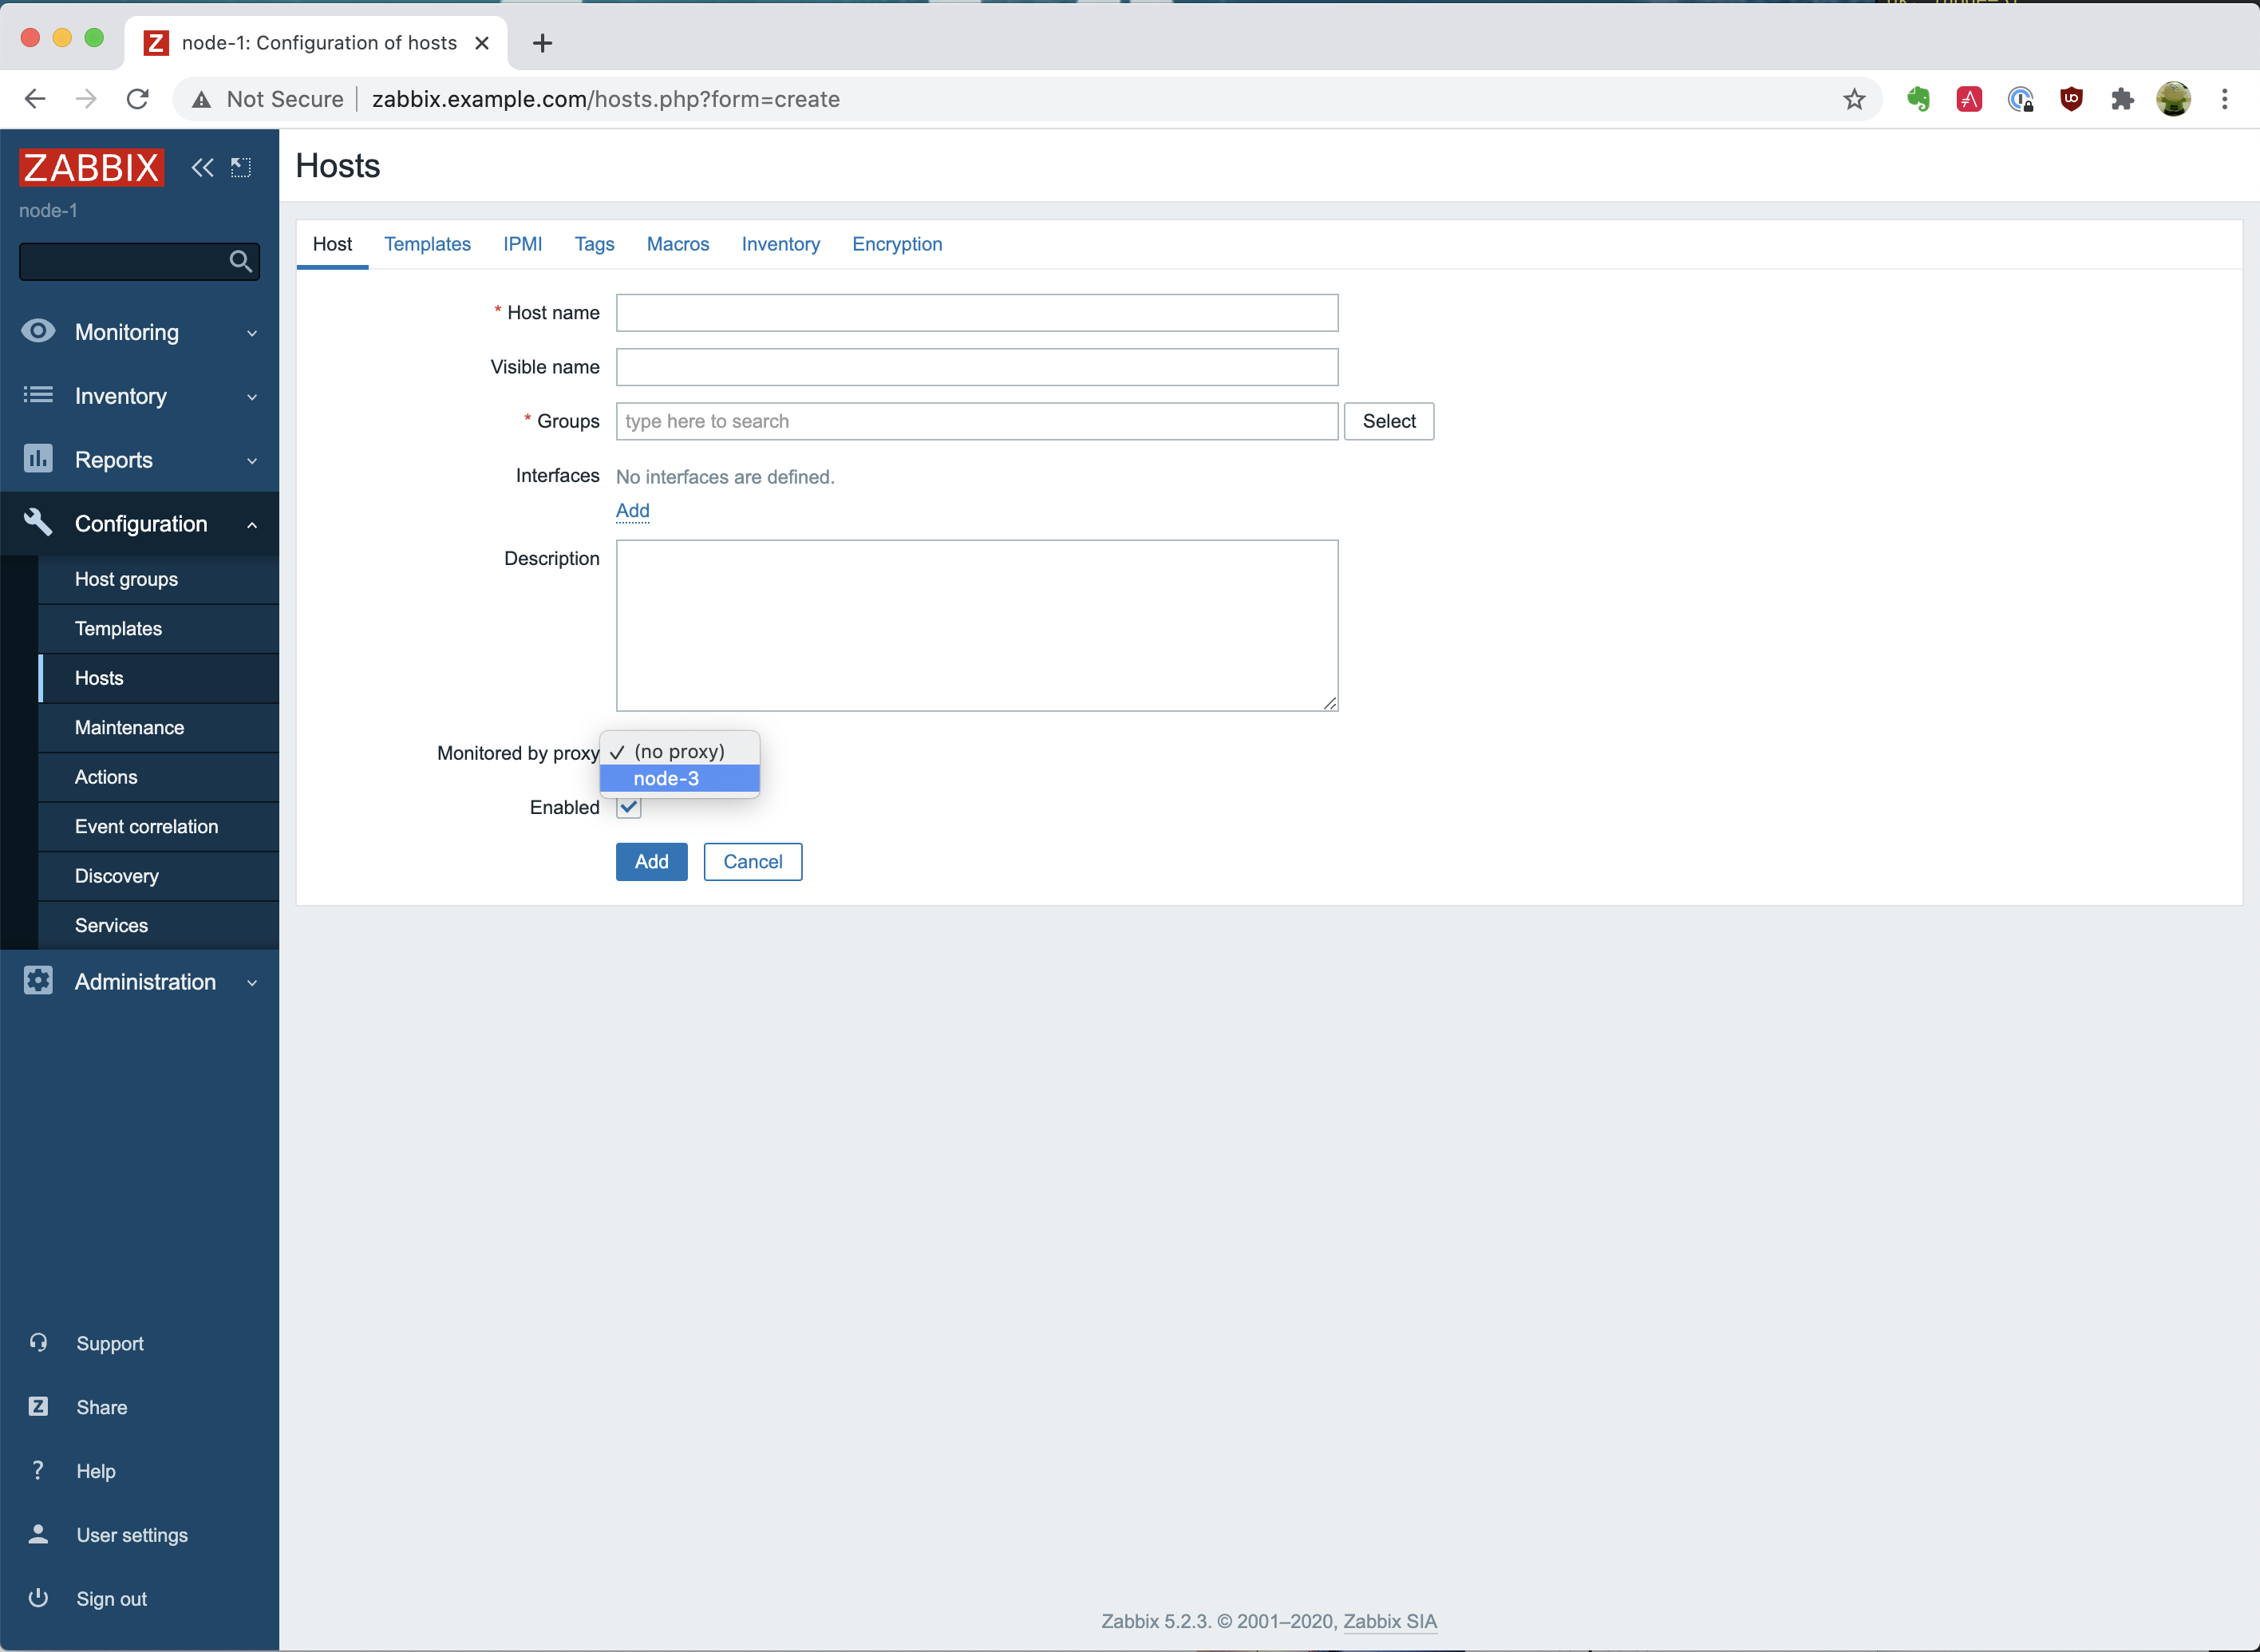
As you will notice, you are able to click on the dropdown menu with the option “Monitored by proxy” and see the “node-3” appear. That is very good!

Summary

We have installed and configured both a Zabbix Server and a Zabbix Proxy, and we are all set now. With the Zabbix Proxy, we have installed both the MySQL database and the Zabbix Proxy on the same node. Whereas we did install them separately with the Zabbix Server. With the following blog post, we will go and install the Zabbix Agent on all nodes.

Installing the Zabbix Server with Ansible

Post Syndicated from Werner Dijkerman original https://blog.zabbix.com/installing-the-zabbix-server-with-ansible/13317/

Today we are focusing more on the automation of installation and software configuration instead of using the manual approach. Installing and configuring software the manual way takes a lot more time, you can easily make more errors by forgetting steps or making typos, and it will probably be a bit boring when you need to do this for a large number of servers.

In this blog post, I will demonstrate how to install and configure a Zabbix environment with Ansible. Ansible has the potential to simplify many of your day-to-day tasks. As an alternative to Ansible, you may also opt in to use Puppet, Chef, and SaltStack to install and configure your Zabbix environment.

Ansible does not have any specific infrastructure requirements for it to do its job. We just need to make sure that the user exists on the target host, preferably configured with SSH keys. With tools like Puppet or Chef, you need to have a server running somewhere, and you will need to deploy an agent on your nodes. You can learn more about Ansible here:  https://docs.ansible.com/ansible/latest/index.html.

This post is the first in a series of three articles. We will set up a (MySQL) Database running on 1 node (“node-2”), Zabbix Server incl. Frontend, which will be running on a separate node (“node-1”). Once we have built this, we configure an action, media and we will create some users. In the following image you will see the environment we will create.

Our environment we will create.
The environment we will create.

In the 2nd blog post, we will set up a Zabbix Proxy and a MySQL database on a new but the same node (“node-3”). In the 3rd blog post, we will install the Zabbix Agent on all of the 3 nodes we were using so far and configure some user parameters. Where the Zabbix Agent on “node-3” is using the Zabbix Proxy, the Zabbix Agent on the nodes “node-1” and “node-2” will be monitored by the Zabbix Server.

Preparations

A git repository containing the code used in these blog posts is available, which can be found on https://github.com/dj-wasabi/blog-installing-zabbix-with-ansible. Before we can do anything, we have to install Vagrant (https://www.vagrantup.com/downloads.html) and Virtualbox (https://www.virtualbox.org/wiki/Downloads). Once you have done that, please clone the earlier mentioned git repository somewhere on your host. For this demo, we will not run the Zabbix Frontend with TLS certificates.

We have to update the hosts file. With the following line, we need to make sure that we can access the Zabbix Frontend.

10.10.1.11 zabbix.example.com

In the “ROOT” directory of the git repository which you cloned some moments ago, where you can also find the Vagrantfile, This Vagrantfile contains the configuration of the virtual machine of our setup. We will create 4 Virtual Machine’s running Ubuntu 20.04, each with 1 CPU and 1 GB of Ram which you can see in the first “config” block. In the 2nd config block, we configure our “bastion” host, which we discuss later. This node will get the ip 10.10.1.3 and we also mount the ansible directory in this Virtual Machine on location “/ansible”. For installing and configuring this node we will use a playbook bastion.yml to do this. With this playbook, we will install some packages like Python, git and Ansible inside this bastion virtual machine.

The 3rd config block is part of a loop that will configure and it will create 3 Virtual Machines. Each virtual machine is also an Ubuntu node, had its own ip (respectively 10.10.1.11 for the first node, 10.10.1.12 for the second and 10.10.1.13 for the 3rd node) and just like the “bastion” node, they have each 1 CPU and 1 GB of RAM.

You will have to execute the following command:

$ vagrant up

With this command, we will start our Virtual Machine’s. This might take a while, as it will download a VirtualBox image containing Ubuntu. The “vagrant up” command will start the “bastion” node and all other nodes as a part of this demo. Once that is done, we need to access a shell on the “bastion” node:

$ vagrant ssh bastion

This “bastion” node is a fundamental node on which we will execute Ansible, but we will not be installing anything on this host. We have opened a shell in the Virtual Machine we just created. You can compare it with creating an “ssh” connection. We have to go to the following directory before we can download the dependencies:

$ cd /ansible

As mentioned before, we have to download the Ansible dependencies. The installation depends on several Ansible Roles and an Ansible Collection. With the Ansible Roles and the Ansible Collection, we can install MySQL, Apache, and the Zabbix components. We have to execute the following command to download the dependencies:

$ ansible-galaxy install -r requirements.yml
Starting galaxy role install process
- downloading role 'mysql', owned by geerlingguy
- downloading role from https://github.com/geerlingguy/ansible-role-mysql/archive/3.3.0.tar.gz
- extracting geerlingguy.mysql to /home/vagrant/.ansible/roles/geerlingguy.mysql
- geerlingguy.mysql (3.3.0) was installed successfully
- downloading role 'apache', owned by geerlingguy
- downloading role from https://github.com/geerlingguy/ansible-role-apache/archive/3.1.4.tar.gz
- extracting geerlingguy.apache to /home/vagrant/.ansible/roles/geerlingguy.apache
- geerlingguy.apache (3.1.4) was installed successfully
- extracting wdijkerman.php to /home/vagrant/.ansible/roles/wdijkerman.php
- wdijkerman.php was installed successfully
Starting galaxy collection install process
Process install dependency map
Starting collection install process
Installing 'community.zabbix:1.2.0' to '/home/vagrant/.ansible/collections/ansible_collections/community/zabbix'
Created collection for community.zabbix at /home/vagrant/.ansible/collections/ansible_collections/community/zabbix
community.zabbix (1.2.0) was installed successfully

Your output may vary because of versions that might have been updated already since writing this blog post. We now have downloaded the dependencies and are ready to install the rest of our environment. But why do we need to download a role for MySQL, Apache and php? A role contains all the neccecerry tasks and files to configure that specific service. So in the case for the MySQL Ansible role, it will install the MySQL-server and all other packages that MySQL requires on the host, it will configure that the mysqld service is created and is running, but it will also create the databases, create and configure MySQL users and configure the root password. Using a role will help us install our environment and we don’t have to figure out ourselves on installing and configuring a MySQL server manually.

So what about the collection, the Ansible Community Zabbix Collection? Ansible has introduced this concept with Ansible 2.10 and is basically a “collection” of plugins, modules and roles for a specific service. In our case, with the Zabbix Collection, the collection contains the roles for installing the Zabbix Server, Proxy, Agent, Javagateway and the Frond-end. But it also contains a plugin to use a Zabbix environment as our inventory and contains modules for creating resources in Zabbix. All of these modules will work with the Zabbix API to configure these resources, like actions, triggers, groups. templates, proxies etc. Basically, everything we want to create and use can be done with a role or a collection.

Installing Zabbix Server

Now we can execute the following command, which will install the MySQL database on “node-2” and installs the Zabbix Server on “node-1”:

$ ansible-playbook -i hosts zabbix-server.yml

This might take a while, a minute, or 10 depending on the performance of your host. We execute the “ansible-playbook” command, and then “-i” we provide the location of the inventory file. Here you see the contents of the inventory file:

[zabbix_server]
node-1 ansible_host=10.10.1.11

[zabbix_database]
node-2 ansible_host=10.10.1.12

[zabbix_proxy]
node-3 ansible_host=10.10.1.13

[database:children]
zabbix_database
zabbix_proxy

This inventory file contains basically all of our nodes and to which group the hosts belong. We can see in that file that there is a group called “zabbix_server” (The value between [] square brackets is the name for the group) and contains the “node-1” host. Because we have a group called “zabbix_server,” we also have a directory containing some files. These are all the properties (or variables) that will be used for all hosts (in our case, only the “node-1”) in the “zabbix_server” group.

Web Interface

Now you can open your favorite browser and open “zabbix.example.com”, and you will see the Zabbix login screen. Please enter the default credentials:

Username: Admin
Password: zabbix

On the Dashboard, you will probably notice that it complains that it can not connect to the Zabbix Agent running on the Zabbix Server, which is fine as we haven’t  installed it yet. We will do this in a later blog post.

Dashboard overview

When we go to “Administration” and click on “Media types,” we will see a media type called “A: Ops email.” That is the one we have created. We can open the “/ansible/zabbix-server.yml” file and go to line 33, where we have configured the creation of the Mediatype. In this case, we have configured multiple templates for sending emails via the “mail.example.com” SMTP server.

Now we have seen the media type, we will look at the trigger we just created. This trigger makes use of the media type we just saw. The trigger can be found in the “/ansible/zabbix-server.yml” file on line 69. When you go to “Configuration” and “Actions,” you will see our created trigger “A: Send alerts to Admin”. But we don’t want to run this in Production, and for demonstrating purposes, we have selected to be triggered when the severity is Information or higher.

And lastly, we are going to see that we have also created new internal users. Navigate to “Administration” – “Users,” and you will see that we have created a user called “wdijkerman”, which can be found in the “/ansible/zabbix-server.yml” file on line 95. This user will be part of a group created earlier called “ops,”. The user type is Zabbix super admin and we have configured the email media type to be used 24×7.

We have defined a default password for this user – “password”. When you have changed the password in the Zabbix Frontend UI, executing the playbook would not change the password back again to “password.” So don’t worry about it. But if you would have removed – let’s say – the “ops” group, then, when you execute the playbook again, the group will be re-added to the user.

Summary

As you see, it is effortless to create and configure a Zabbix environment with Ansible. We didn’t have to do anything manually, and all installations and configurations were applied automatically when we executed the ansible-playbook command. You can find more information on either the Ansible page https://docs.ansible.com/ansible/latest/collections/community/zabbix/ or on the Github page https://github.com/ansible-collections/community.zabbix.

In the next post, we will install and configure the Zabbix Proxy.