Post Syndicated from Wolfgang Alper original https://blog.zabbix.com/put-zabbix-at-your-fingertips-with-the-intellitrend-mobile-app/31830/

The official Zabbix frontend works great on desktop, but it isn’t built for mobile. Monitoring doesn’t end when you step away from your workstation, and a reliable Zabbix mobile app keeps you connected to your Zabbix environment, gives you instant notifications, and allows you to react to problems or just check your host configuration at any time.
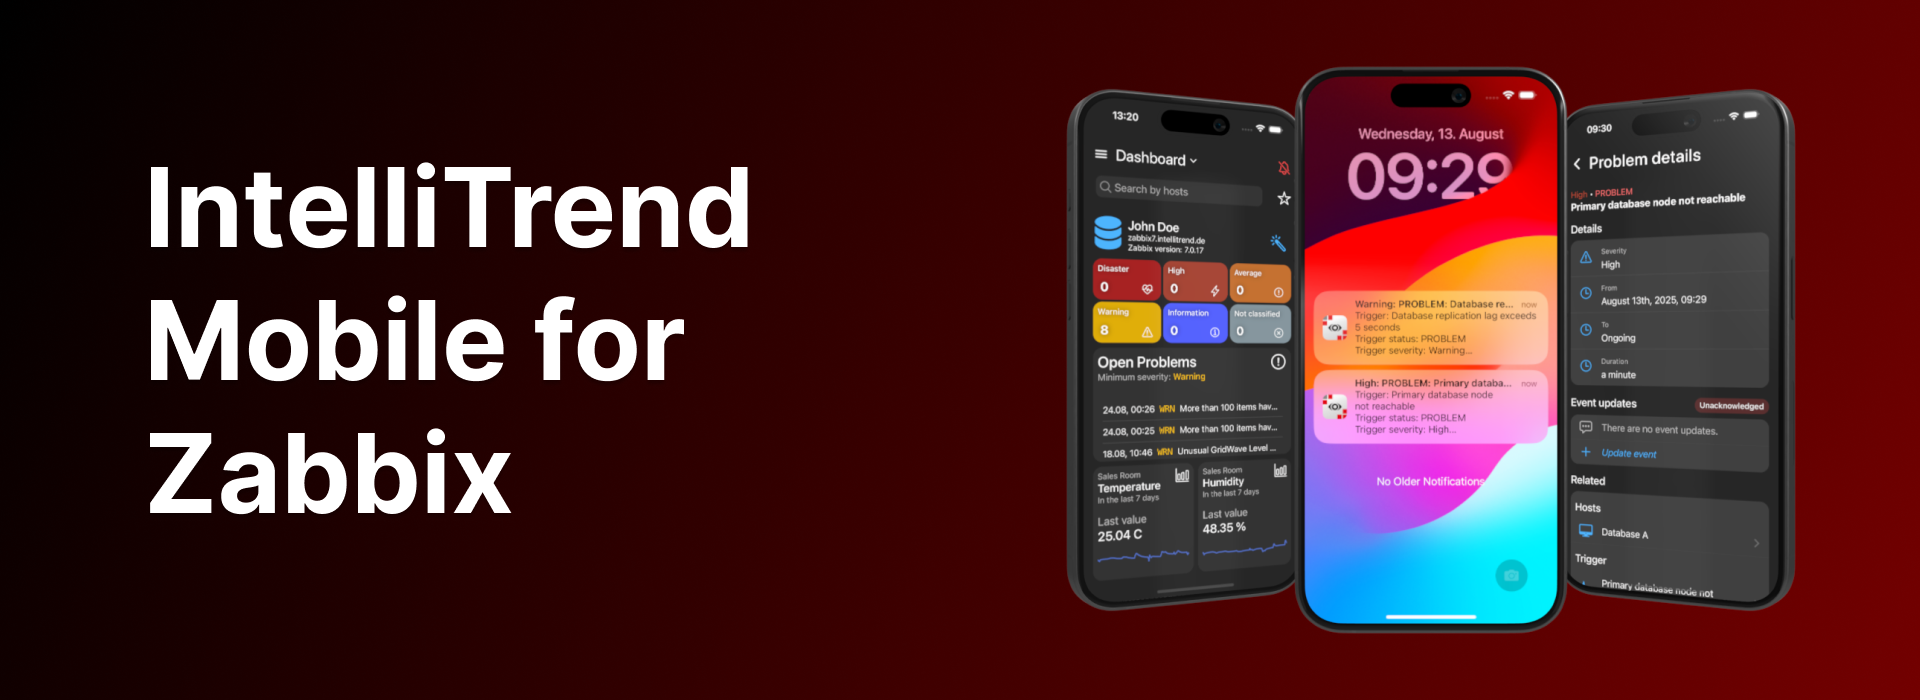
With IntelliTrend Mobile for Zabbix, you get a free, feature-rich mobile app for Zabbix, including real-time push notifications, custom mobile dashboards with unique widgets, built-in responsive host and item graphs, a detailed host viewer, and much more!


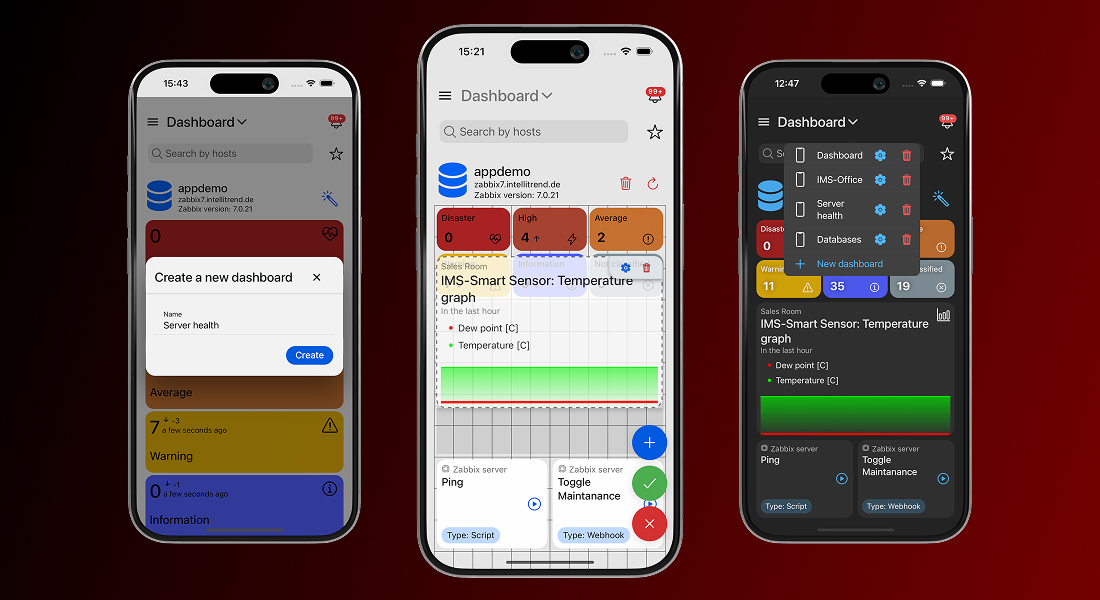
Mobile-optimized dashboards
Zabbix dashboards are great and powerful, but they are built for desktop screens and don’t always scale well on mobile devices. IntelliTrend Mobile solves that by giving you the ability to build as many dashboards as you need, each tailored to a specific purpose.
One dashboard can focus on infrastructure health, another on critical issues, and another on a single customer or environment. Every dashboard is an independent workspace, featuring its own layout, collection of widgets, and set of filter criteria.
Grid-based dashboard layout
Every IntelliTrend Mobile dashboard is powered by a grid-based layout system that gives you full control over how your dashboard looks and feels. You are not stuck with fixed widget sizes or a predefined structure – you can place widgets exactly where you want them, drag them around freely, and resize them to give each widget the space it really needs.
This grid system keeps everything orderly without boxing you in. Whether you build a clean, minimal dashboard or pack it with data-rich widgets, the editor helps you shape a layout that looks intentional and stays easy to work with.
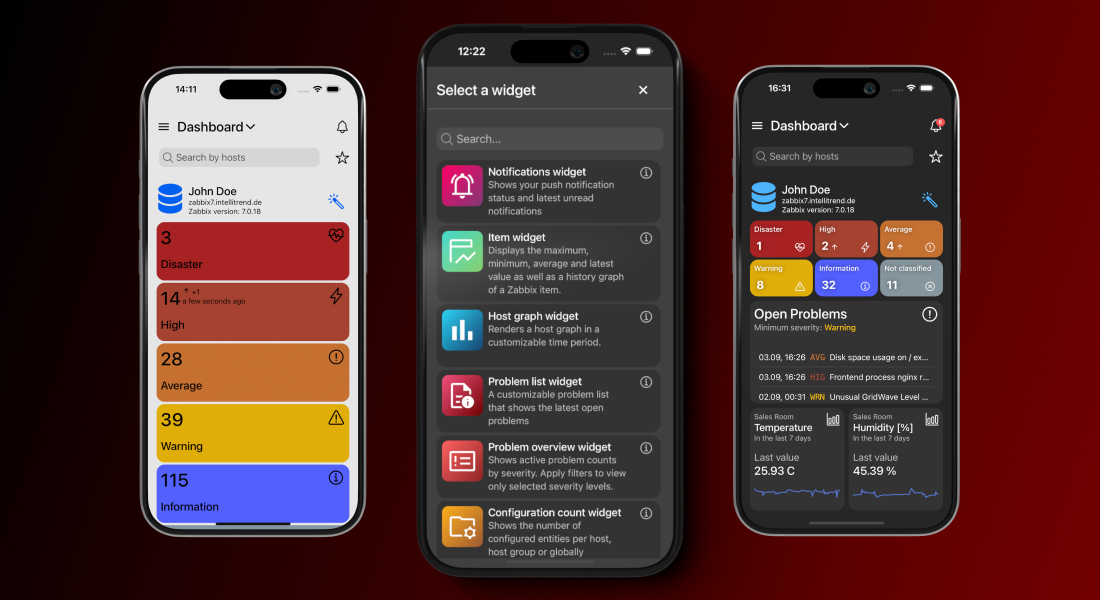
Highly customizable widgets
The app offers a variety of unique and customizable widgets, each designed to display key monitoring information clearly and efficiently. Each widget comes with its own set of configuration options, so you can decide what it shows and how it shows it. You can filter widgets by hosts, host groups, severities, and much more in order to keep the view focused on what matters the most to you.
Besides that, widgets let you adjust their appearance by hiding or revealing extra details, switching between compact and extended modes or adjusting how much data they present. The result is a dashboard that is fine-tuned to the way you work.
Smart problem management
When issues happen, speed and context are everything. That’s why problem management is the most important part of any Zabbix mobile app. IntelliTrend Mobile is built to keep you informed the moment something goes wrong and to let you take action without wasting time or switching devices.
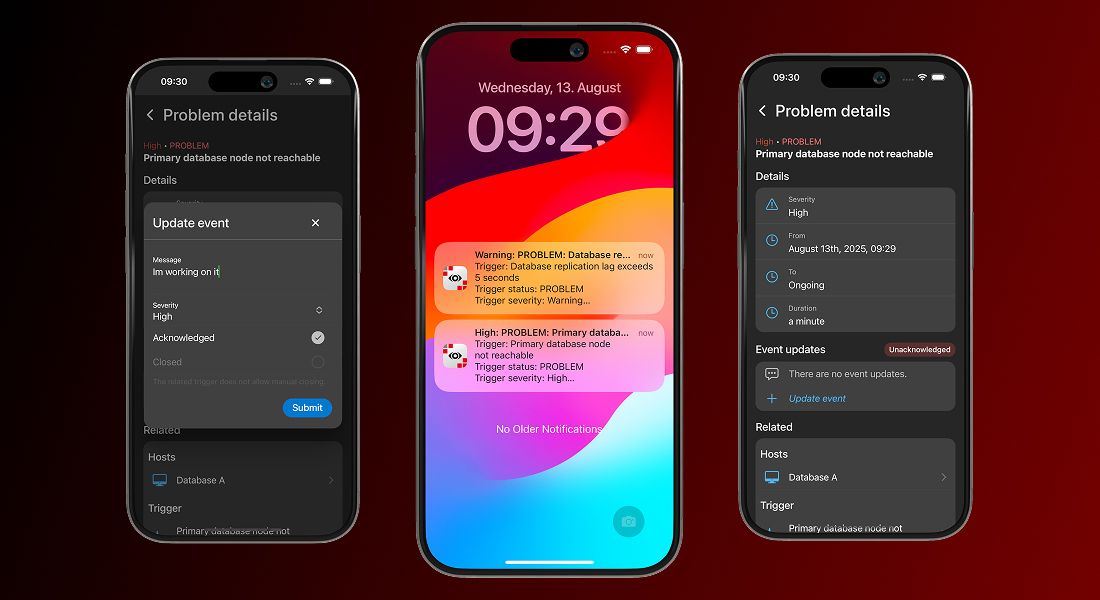
The problem view in the app gives you complete visibility into open and resolved issues, with filtering, sorting, and search options that let you quickly focus on the problems that require your attention. From the same interface, you can update and acknowledge problems without leaving the app.
Opening a problem takes you straight to a detailed view containing all the relevant information – severity, duration, related hosts, triggers, items, and historical data. What makes this view especially powerful is the ability to jump directly from the problem to the related host, item, or trigger within the app.
With a single tap, you can inspect the affected host, review item metrics, or analyze trigger history, all without leaving the mobile environment. This seamless navigation transforms problem management from a static list of alerts into a fully integrated, on-the-go investigation and resolution workflow.
Real-time response with Smart Alerts
The real game-changer, however, is IntelliTrend Mobile’s Smart Alerts feature. This isn’t just push notifications – it’s intelligent, actionable routing straight to the exact problem view in the app.
The moment a problem occurs, you’re notified in real time. Tap the alert and you’re immediately taken to the detailed problem screen. From there, you can analyze the issue, review metrics and history, acknowledge it, or take corrective action without ever opening the Zabbix web interface. No delays, no barriers, no switching devices!
With Smart Alerts, your team reacts faster, stays informed, and keeps systems running smoothly, turning mobile monitoring from passive alerts into active, on-the-go problem management.
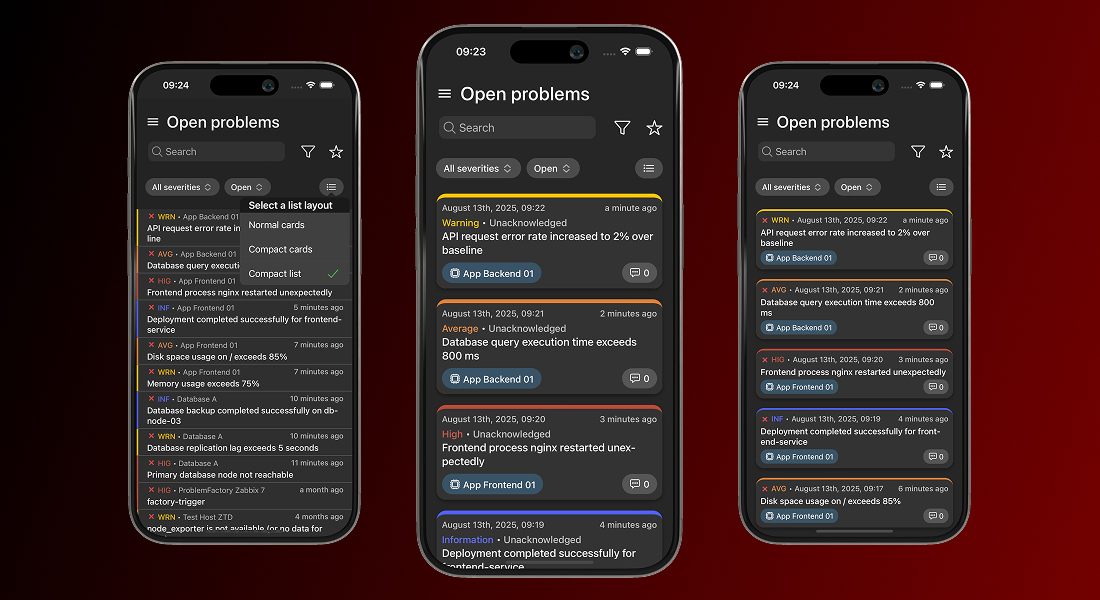
Flexible problem list views
IntelliTrend Mobile lets you choose how problems are displayed in the list. By default, each problem appears as a detailed card showing all relevant information. If you prefer a cleaner overview, you can switch to a compact card view or even a compact list view, for maximum information density.
This flexibility is especially helpful when your Zabbix server generates many problems, allowing you to scan large numbers of problems at a glance while keeping the interface tidy and manageable.
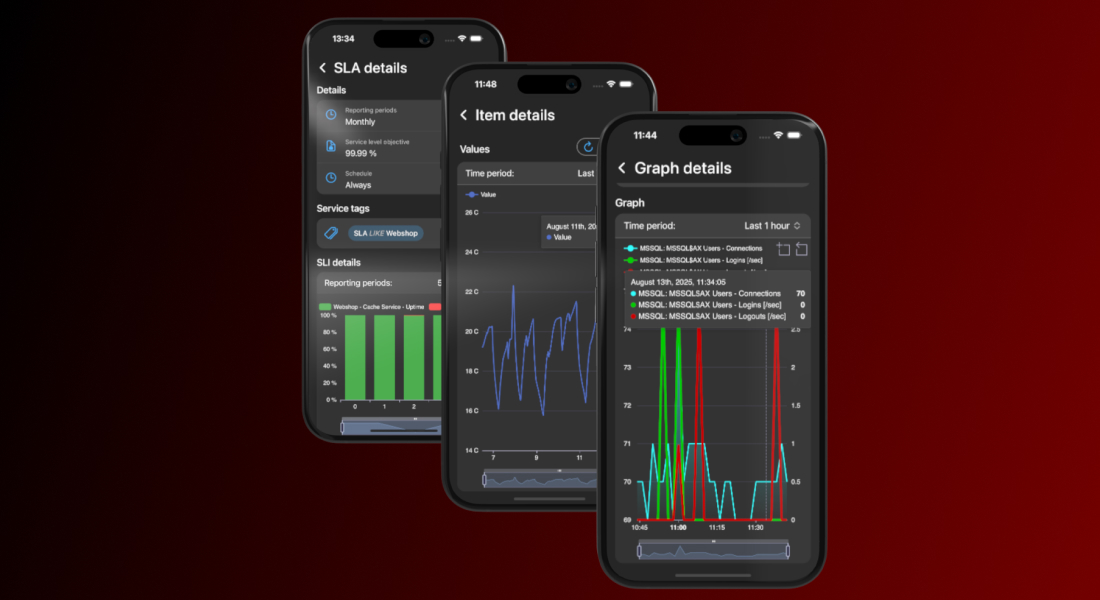
View item and host graphs with mobile-optimized charts
IntelliTrend Mobile reshapes the way you view Zabbix data while you’re on the move. Instead of relying on Zabbix’s static, desktop-focused graphs, the app renders item histories, host graphs, service uptimes, and SLA metrics using fully native, mobile-friendly charts. These charts are responsive, adapting seamlessly to your screen size and orientation for a smooth and clear viewing experience, whether you’re on a phone or tablet.
Every graph is interactive. You can zoom in to inspect a specific time window, pan across the timeline, or hover with your finger to see precise data points. Multiple data series can be toggled on or off, making it easy to focus on the metrics that matter.
You can quickly switch between time periods and pinpoint when an issue started, track its progression, or confirm when it was resolved – without ever opening the Zabbix web interface.
Complete host overview
You can also view all the essential details about any host right from the mobile app. Every host has a detailed view that puts all relevant information at your fingertips, making management simple, efficient, and fully mobile.
For each host, you can quickly see its visible and technical names, current status (enabled or disabled), and maintenance state, including whether data collection continues during maintenance. If the host is monitored by a proxy, you see the proxy that monitors it.

The host details view gives you instant access to all related configurations and objects:
Templates and host groups
You can view all templates assigned to a host and dive into any template’s full details with a single tap, making it easy to understand the monitoring configuration at a glance. Host groups work the same way – just tap a group to see every host it contains, giving you instant insight into related systems.
Host interfaces
IntelliTrend Mobile gives you a complete view of each host interface, including agent, SNMP, JMX, and IPMI types. For every interface, you can see its IP address, DNS name, port, and the interface type configured in Zabbix.
The app also shows the current availability status, highlighting interfaces that are unreachable or experiencing errors. This makes it easy to quickly identify connectivity problems, verify which monitoring protocols are active, and troubleshoot issues with data collection.
Macros
Macros are displayed with full detail (including type, value, and description) so you can verify configuration settings quickly or troubleshoot dynamically, all without leaving the host view.
Inventory
The host inventory view in IntelliTrend Mobile gives you full access to the complete Zabbix host inventory. All inventory fields configured in Zabbix are displayed directly in the app, giving you a complete overview of the host’s recorded details. You can also see the inventory mode for the host (Disabled, Manual, or Automatic) so it’s immediately clear how the inventory is being managed.
Open and resolved problems
From the host details page, you can jump straight into all open or resolved problems related to that specific host. One tap takes you directly to a filtered problem list, making it effortless to review recent problems or check the current state of the host without navigating through multiple menus.
Items, triggers, and graphs
All items, triggers, and graphs tied to the host are just one step away. Each entry opens a filtered list focused solely on that host, letting you move from the host view into any related object instantly. Whether you need to inspect a value, review a trigger, or explore a graph, the app keeps the entire chain of information connected.
Scripts
Execute host scripts directly from your mobile device, whether you’re restarting a service, collecting diagnostics, or triggering an automated workflow. It’s a fast, practical way to take action remotely, enabling real operations work even when you’re away from your desk.
With all these features combined, the host details view becomes a powerful, fully mobile workflow. Everything you need to monitor, analyze, and take action is right at your fingertips, making host management faster, more efficient, and truly on-the-go.
Customize your views
Favorites
You can create favorites for specific hosts or host groups and quickly switch your global scope to focus on them. Once a favorite is active, the app automatically filters all dashboards and list pages to show only data related to that host or host group.
Favorites make it easier to concentrate on the systems you manage most often, so you don’t have to reapply filters or navigate through long lists every time. You can switch between favorites at any time, giving you a fast way to move between different parts of your environment.
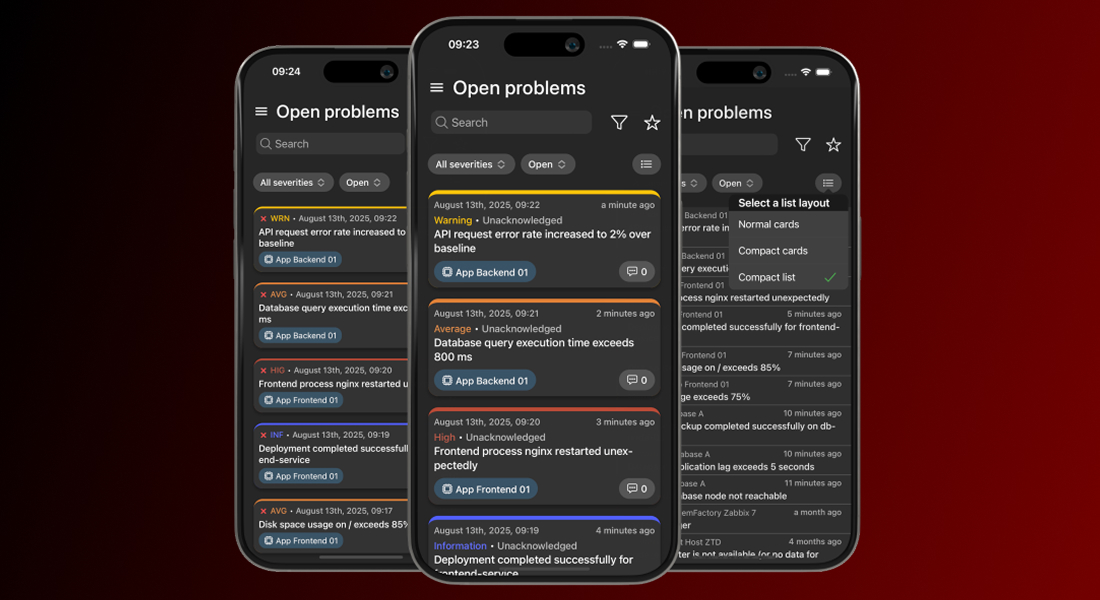
Layout modes
Everyone works differently, so the app comes with useful customization options. In addition to the filtering and sorting available on every list page, you can switch between different layout modes for all list pages.
Choose from the standard layout, a compact card layout, or a compact list layout for maximum information density. This lets you decide how much information you want to see at once and allows you to apply layout preferences individually for each page or set them globally in the app settings.
Many more features
The app already supports a wide range of features designed to give you full visibility into your Zabbix environment. Beyond the previously mentioned features, the app includes many more features, such as accessing services and SLAs to keep track of service performance and availability, explore templates, and view triggers, items, and graphs in detail.
But our development doesn’t stop here. We are constantly expanding app functionality and improving existing features based on user feedback. If you haven’t tried the app yet, now is a great time! We’d love to hear your honest thoughts about what works well, what could be better, and which features you’d like to see next. Your feedback helps to shape the future of IntelliTrend Mobile, and we take every suggestion seriously.
The post Put Zabbix at your Fingertips with the IntelliTrend Mobile App appeared first on Zabbix Blog.