A massive power outage struck significant portions of Portugal and Spain at 10:34 UTC on April 28, grinding transportation to a halt, shutting retail businesses, and otherwise disrupting everyday activities and services. Parts of France were also reportedly impacted by the power outage. Portugal’s electrical grid operator blamed the outage on a “fault in the Spanish electricity grid”, and later stated that “due to extreme temperature variations in the interior of Spain, there were anomalous oscillations in the very high voltage lines (400 kilovolts), a phenomenon known as ‘induced atmospheric vibration’” and that “These oscillations caused synchronisation failures between the electrical systems, leading to successive disturbances across the interconnected European network.”
The breadth of Cloudflare’s network and our customer base provides us with a unique perspective on Internet resilience, enabling us to observe the Internet impact of this power outage at both a local and national level, as well as at a network level, across traffic, network quality, and routing metrics.
Impacts in Portugal
Country level
In Portugal, Internet traffic dropped as the power grid failed, with traffic immediately dropping by half as compared to the previous week, falling to approximately 90% below the previous week within the next five hours.
Request traffic from users in Portugal to Cloudflare’s 1.1.1.1 DNS resolver also fell when the power went out, initially dropping by 40% as compared to the previous week, and falling further over the next several hours.
Network level
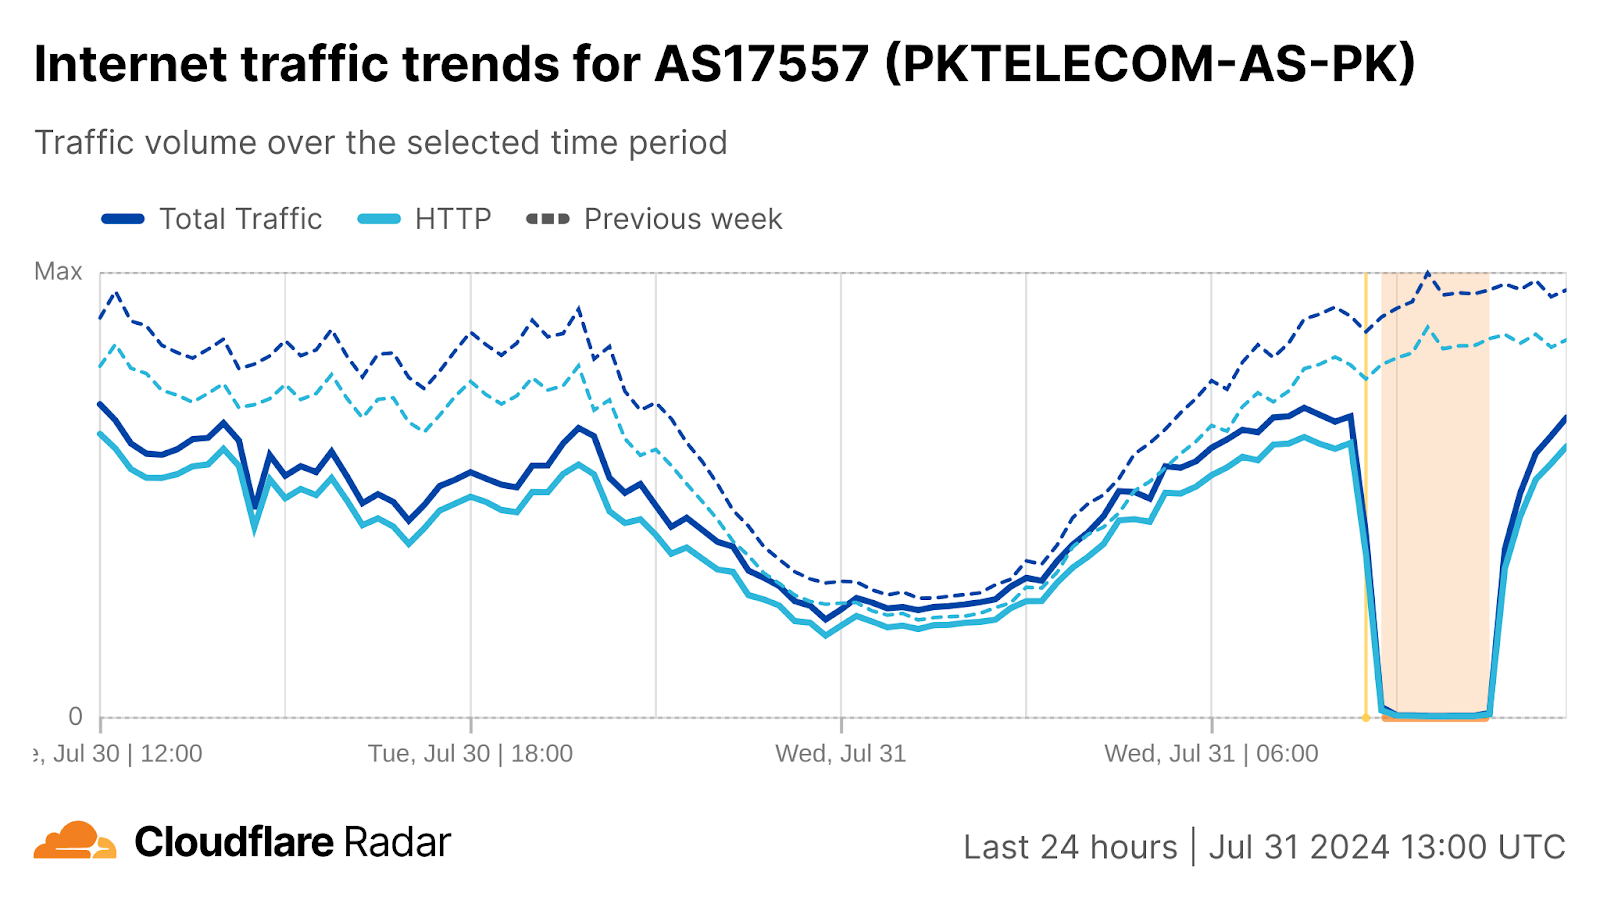
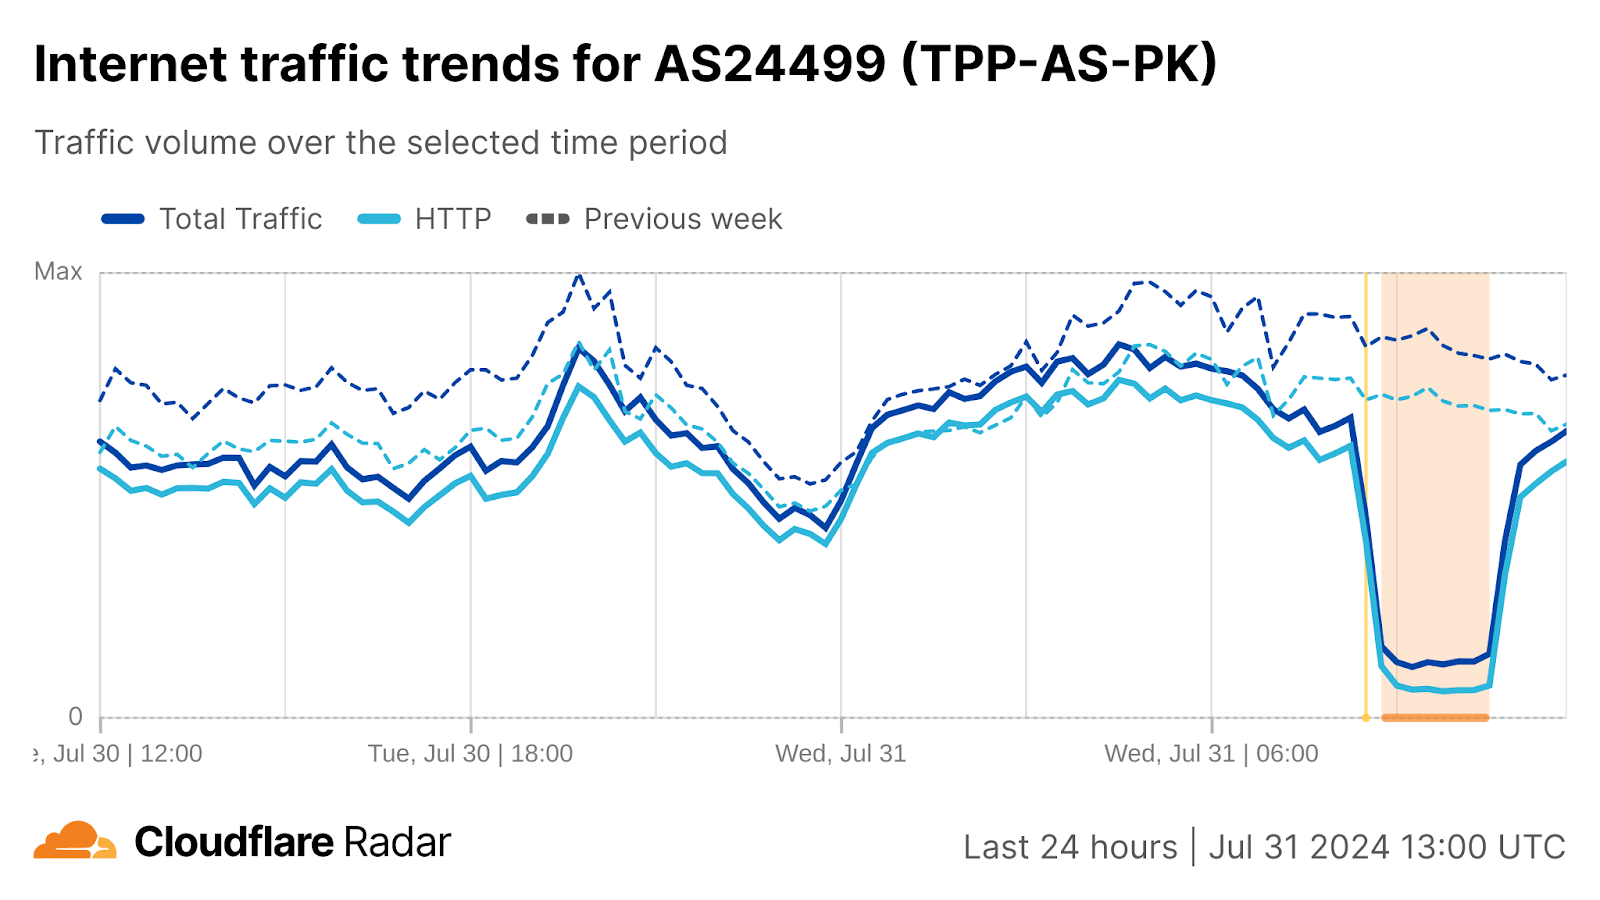
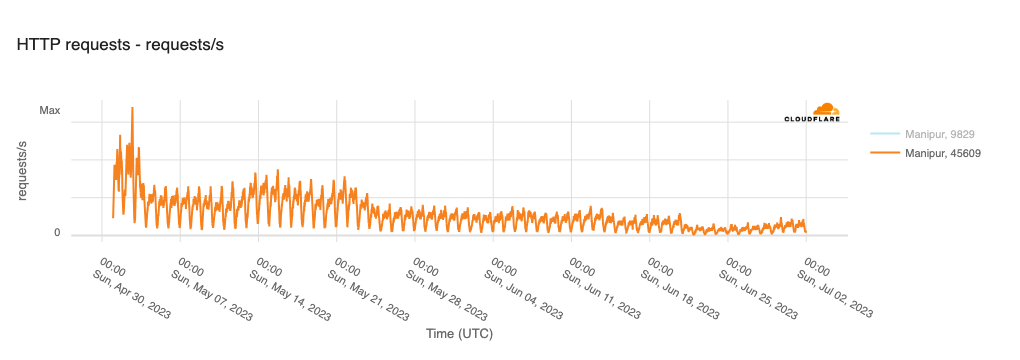
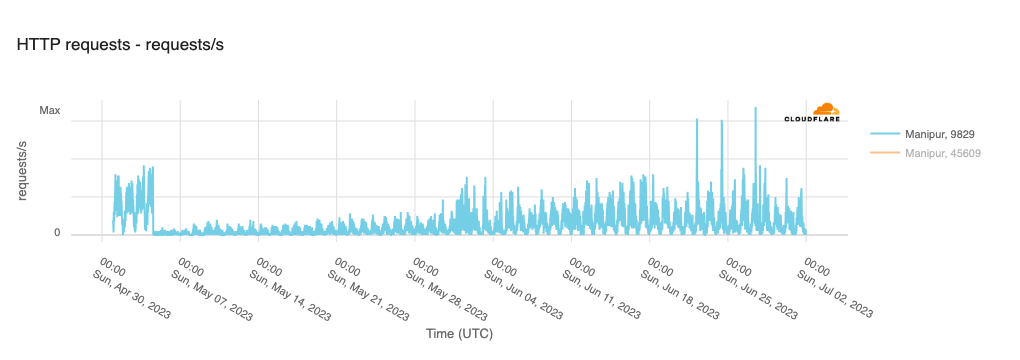
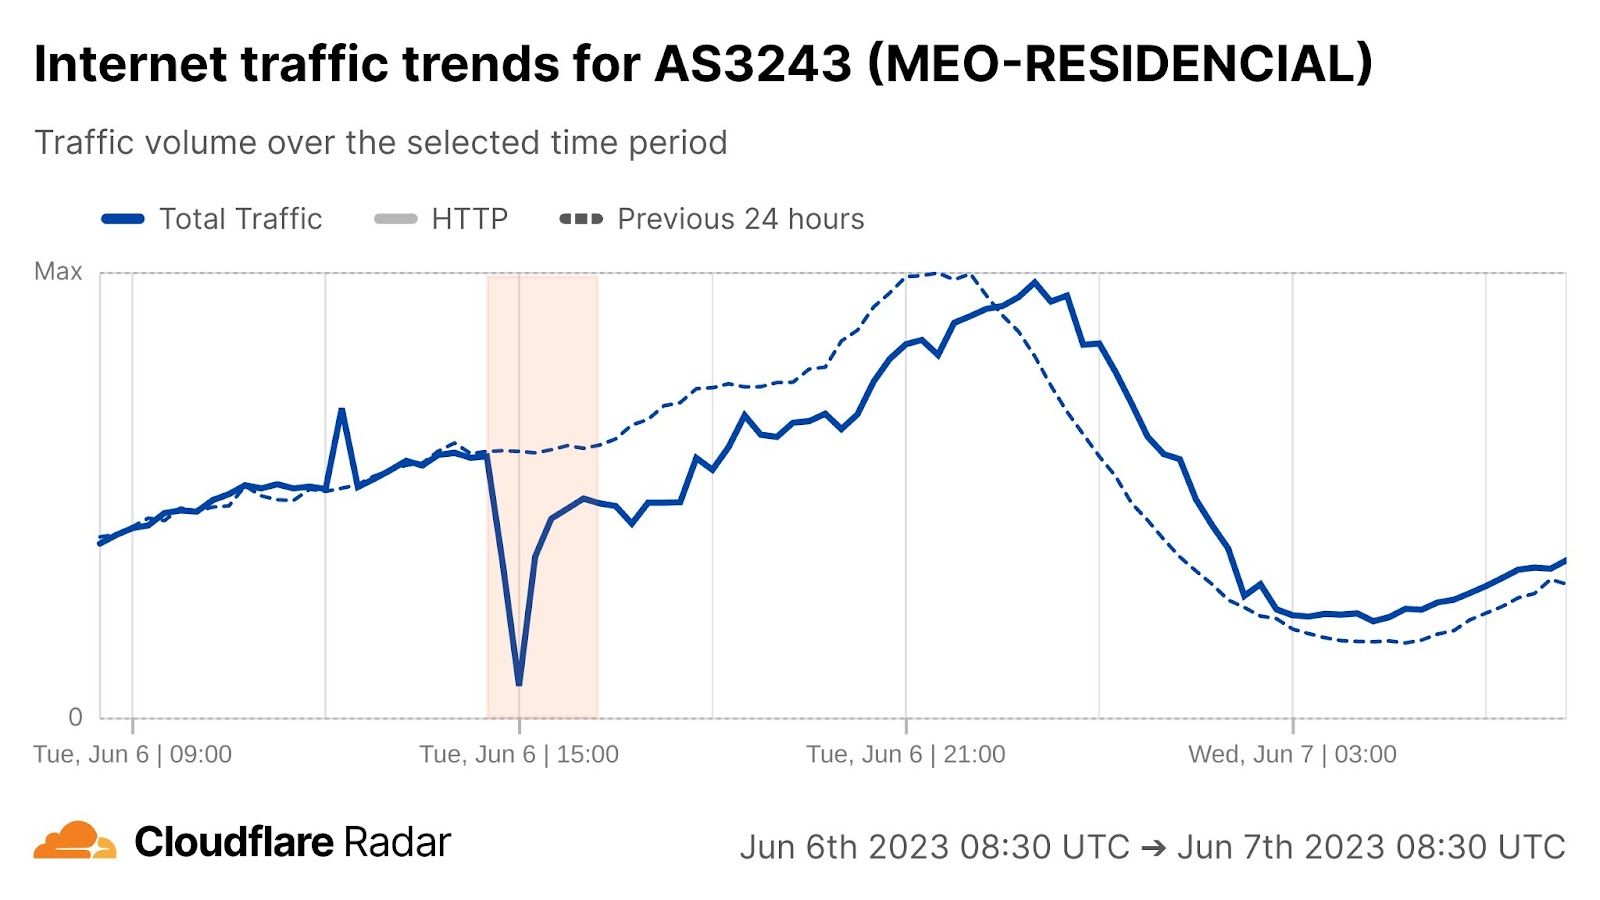
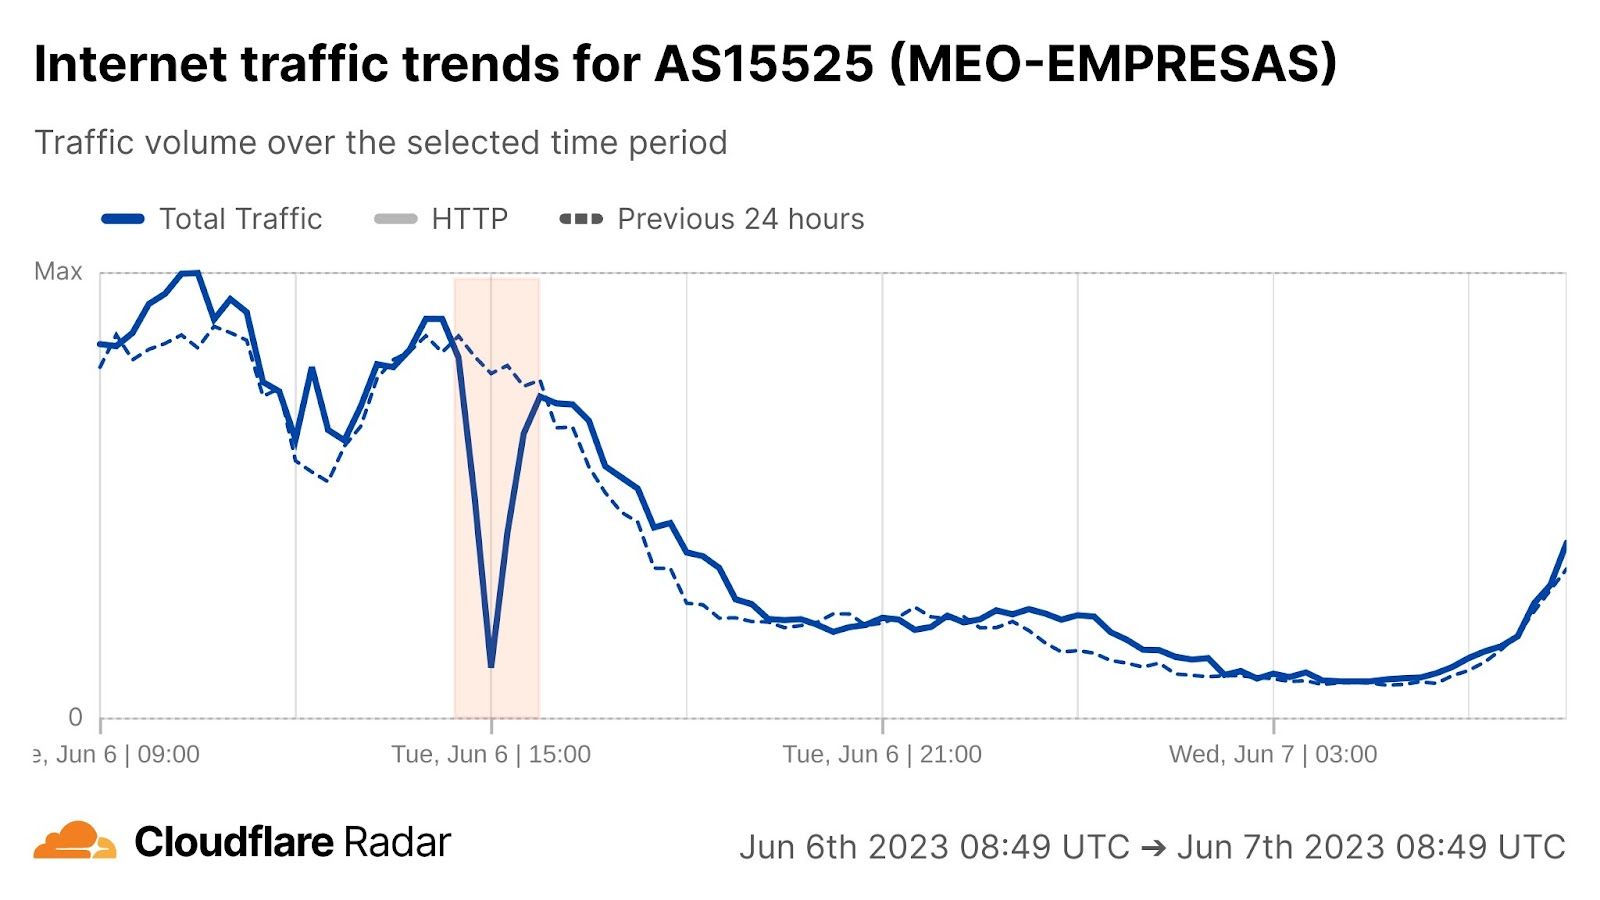
At a network level, the loss of Internet traffic from local providers including NOS, Vodafone, MEO, and NOWO was swift and significant. The Cloudflare Radar graphs below show that traffic from those networks effectively evaporated over the hours after the power outage began. The autonomous systems (ASNs) shown below for these providers may carry a mix of fixed and mobile broadband traffic. However, MEO breaks out at least some of their mobile traffic onto a separate ASN, and the graph below for MEO-MOVEL (AS42863) shows that request traffic from that network more than doubled after the power went out, as subscribers turned to their mobile devices for information about what was happening. However, despite the initial spike, this mobile traffic also fell over the next several hours, dropping to approximately half of the volume seen the prior week.
Regional level
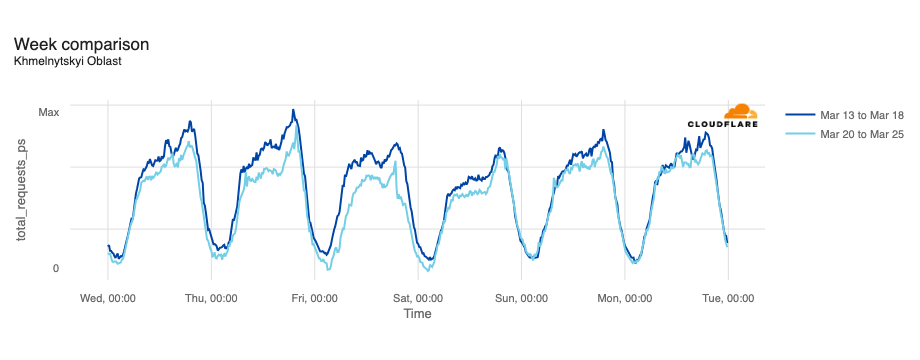
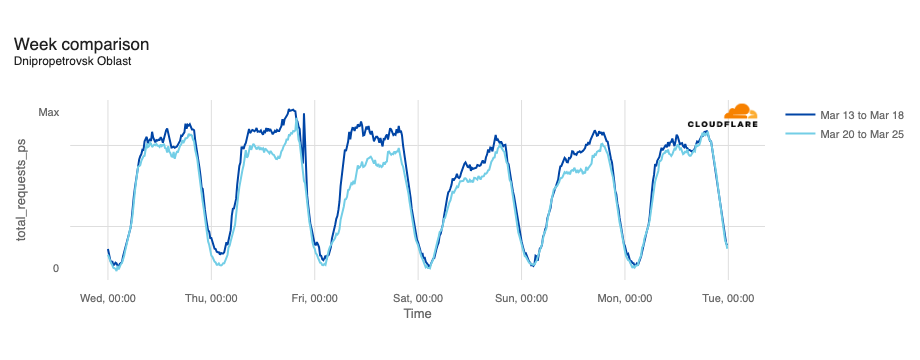
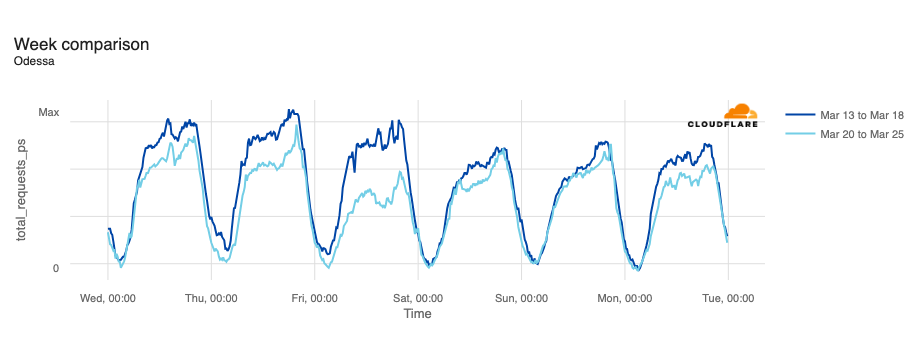
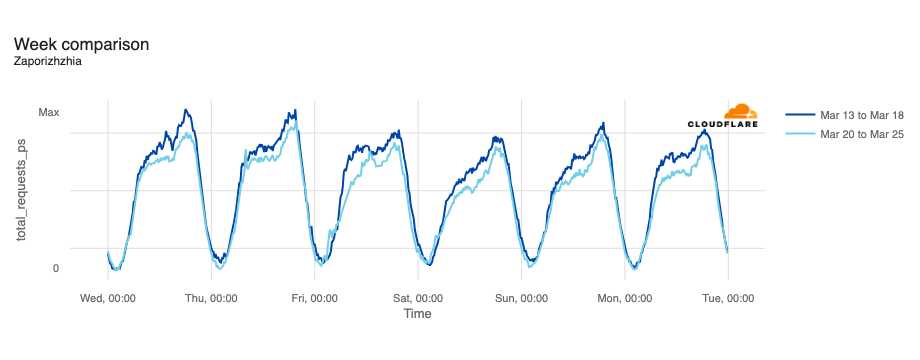
In addition to looking at traffic at a national and network level, we can also look at traffic at a regional level. As noted above, the power outage did not impact every region of the country. The traffic graphs below show the changes in Internet traffic from the parts of Portugal where an impact was observed.
In Lisbon and Porto, a sharp, but limited drop in traffic was observed as the power outage began, with traffic recovering slightly almost as quickly. However, traffic gradually declined in the subsequent hours, in contrast to the other regions reviewed below.
The most significant immediate traffic drops were observed in Aveiro, Beja, Bragança, Castelo Branco, Évora, Faro, Guarda, Portalegre, Santarém, Viana do Castelo, Vila Real, and Viseu. In these areas, traffic fell and then quickly stabilized at very low volumes. In Braga and Setúbal, traffic declined more gradually after the initial drop.
Network quality
The power outage also impacted the quality of connectivity at a national level in Portugal. Prior to the loss of power, median download speeds across the country were around 40 Mbps, but within several hours after the state of the outage, fell as low as 15 Mbps. As expected, latency at a country level saw an opposite impact. Prior to the loss of power, median latency was around 20 ms. However, it gradually grew to as much as 50 ms. The lower download speeds and higher latency are likely due to the congestion of the network links that remained available.
Routing
Network infrastructure in Portugal was also impacted by the power outage, with the impact seen as a drop in announced IP address space. (This means that portions of Portuguese providers’ networks are no longer visible to the rest of the Internet.) The number of announced IPv4 /24s (blocks of 256 IPv4 addresses) dropped by ~300 (around 1.2%), and the number of announced IPv6 /48s (blocks of over 1.2 octillion IPv6 addresses) dropped from 17,928,551 to 16,355,607 (around 9%). Address space began to drop further after 16:00 UTC, possibly as a result of backup power being exhausted and associated network infrastructure falling offline.
Impacts in Spain
Country level
In Spain, Internet traffic dropped as the power grid failed, with traffic immediately dropping by around 60% as compared to the previous week, falling to approximately 80% below the previous week within the next five hours.
Request traffic from users in Spain to Cloudflare’s 1.1.1.1 DNS resolver also fell when the power went out, initially dropping by 54% as compared to the previous week, but quickly stabilizing.
Network level
At a network level, traffic volumes from the top five ASNs in Spain fell rapidly once power was lost, with most declining gradually over the next several hours. In contrast, traffic from Digi Spain Telecom (AS57269) fell quickly, but then stabilized at the lower level. In comparison to the previous week, traffic from these providers fell between 75% and 93% in the hours after the power outage began.
Regional level
In most of the impacted regions in Spain, traffic dropped off quickly and stabilized, or continued to fall further. However, some recovery in traffic is also evident, and can be seen in Navarre, La Rioja, Cantabria, and Basque Country. This traffic recovery is likely associated with an initial restoration of power in those regions, as an update from Red Eléctrica (operator of Spain’s national electricity grid) noted that “Electricity is now available in parts of Catalonia, Aragon, the Basque Country, Galicia, Asturias, Navarre, Castile and León, Extremadura, Andalusia, and La Rioja.”
Network quality
The power outage also impacted the quality of connectivity at a national level in Spain. Prior to the loss of power, median download speeds across the country were around 35 Mbps, but within several hours after the state of the outage, fell as low as 19 Mbps. Interestingly, the median bandwidth didn’t see the clean gradual decline as it did in Portugal, instead falling and recovering twice before gradually declining.
As expected, latency at a country level saw a significant increase. Prior to the loss of power, median latency was around 22 ms, but grew to as much as 40 ms. As in Portugal, the lower download speeds and higher latency are likely due to the congestion of the network links that remained available.
Routing
Similar to Portugal, network infrastructure in Spain was also impacted by the power outage, with the impact seen as a drop in announced IP address space. By 14:30 UTC, the number of announced IPv4 /24 address blocks had fallen by around 2.4%, and continued to drop further over the following hours. The number of announced IPv6 /48 address blocks fell by over 8% during that same time span, and also continued to drop in the following hours.
Impacts in other European countries
Parts of Andorra and France were also reportedly impacted by the power outage, with additional outages reported as far away as Belgium. At a national level, no traffic disruptions were evident in any of the countries.
Analysis of traffic at a regional level in France shows a slight decline concurrent with the power outage in several regions, but the drops were nominal in comparison to Spain and Portugal, and traffic volumes recovered to expected levels within 90 minutes. No impact was evident at a regional level in Andorra.
It appears that Morocco may have been impacted in some fashion by the power outage, or at least Orange Maroc was. In a post on X, the provider stated (translated) “Internet traffic has been disrupted following a massive power outage in Spain and Portugal, which is affecting international connections.” Cloudflare Radar shows that traffic from the network fell sharply around 12:00 UTC, 90 minutes after the power outage began, with a full outage beginning around 15:00 UTC.
Conclusion
Power restoration in Spain had already started as this post was being written, and full recovery will likely take hours to days. As power is restored, Internet traffic and other metrics will recover as well. The current state of Internet connectivity in Spain and Portugal can be tracked on Cloudflare Radar.
The 2024 Cloudflare Radar Year in Review is our fifth annual review of Internet trends and patterns observed throughout the year at both a global and country/region level across a variety of metrics. In this year’s review, we have added several new traffic, adoption, connectivity, and email security metrics, as well as the ability to do year-over-year and geographic comparisons for selected metrics.
Below, we present a summary of key findings, and then explore them in more detail in subsequent sections.
Google maintained its position as the most popular Internet service overall. OpenAI remained at the top of the Generative AI category. Binance remained at the top of the Cryptocurrency category. WhatsApp remained the top Messaging platform, and Facebook remained the top Social Media site. 🔗
Global traffic from Starlink grew 3.3x in 2024, in line with last year’s growth rate. After initiating service in Malawi in July 2023, Starlink traffic from that country grew 38x in 2024. As Starlink added new markets, we saw traffic grow rapidly in those locations. 🔗
Googlebot, Google’s web crawler, was responsible for the highest volume of request traffic to Cloudflare in 2024, as it retrieved content from millions of Cloudflare customer sites for search indexing. 🔗
Traffic from ByteDance’s AI crawler (Bytespider) gradually declined over the course of 2024. Anthropic’s AI crawler (ClaudeBot) first started showing signs of ongoing crawling activity in April, then declined after an initial peak in May & June. 🔗
13.0% of TLS 1.3 traffic is using post-quantum encryption. 🔗
Adoption & Usage
Globally, nearly one-third of mobile device traffic was from Apple iOS devices. Android had a >90% share of mobile device traffic in 29 countries/regions; peak iOS mobile device traffic share was over 60% in eight countries/regions. 🔗
Globally, nearly half of web requests used HTTP/2, with 20.5% using HTTP/3. Usage of both versions was up slightly from 2023. 🔗
React, PHP, and jQuery were among the most popular technologies used to build websites, while HubSpot, Google, and WordPress were among the most popular vendors of supporting services and platforms. 🔗
Go surpassed NodeJS as the most popular language used for making automated API requests. 🔗
Google is far and away the most popular search engine globally, across all platforms. On mobile devices and operating systems, Baidu is a distant second. Bing is a distant second across desktop and Windows devices, with DuckDuckGo second most popular on macOS. Shares vary by platform and country/region. 🔗
Google Chrome is far and away the most popular browser overall. While this is also true on macOS devices, Safari usage is well ahead of Chrome on iOS devices. On Windows, Edge is the second most popular browser as it comes preinstalled and is the initial default. 🔗
Connectivity
225 major Internet disruptions were observed globally in 2024, with many due to government-directed regional and national shutdowns of Internet connectivity. Cable cuts and power outages were also leading causes. 🔗
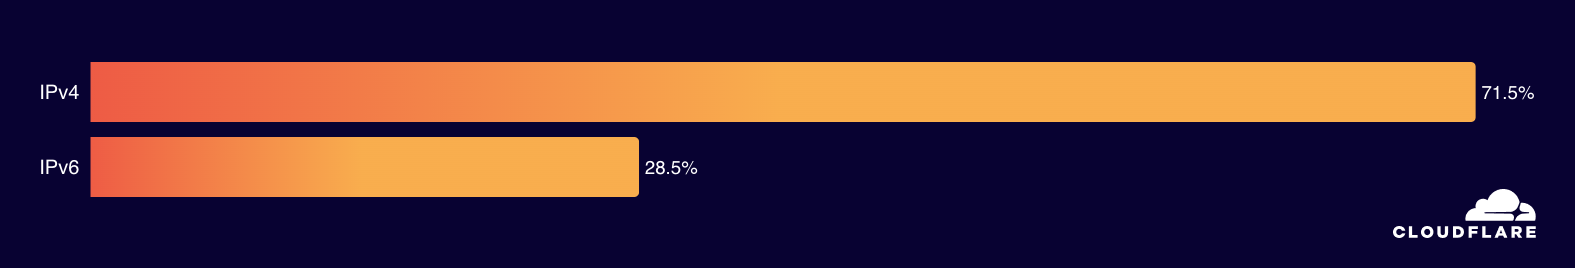
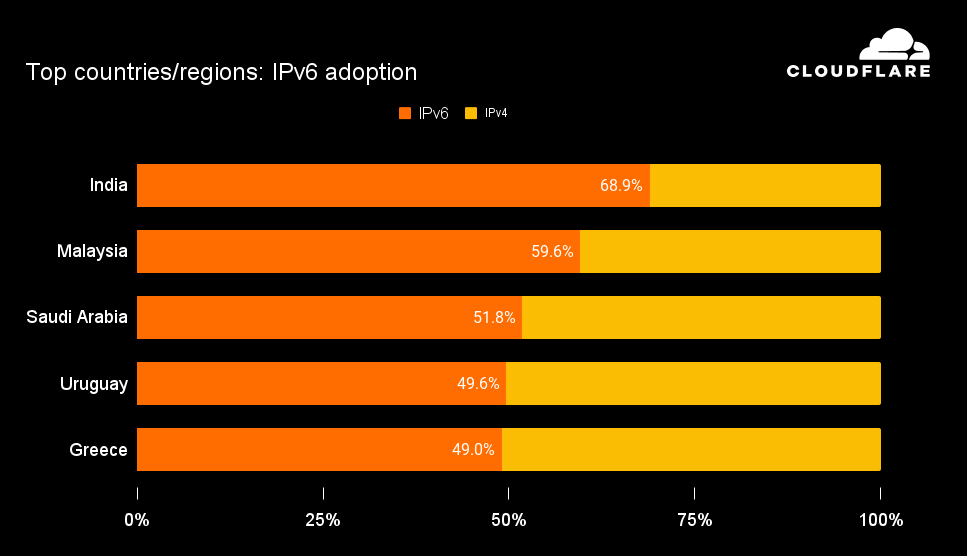
Aggregated across 2024, 28.5% of IPv6-capable requests were made over IPv6. India and Malaysia were the strongest countries, at 68.9% and 59.6% IPv6 adoption respectively. 🔗
The top 10 countries ranked by Internet speed all had average download speeds above 200 Mbps. Spain was consistently among the top locations across the measured Internet quality metrics. 🔗
41.3% of global traffic comes from mobile devices. In nearly 100 countries/regions, the majority of traffic comes from mobile devices. 🔗
20.7% of TCP connections are unexpectedly terminated before any useful data can be exchanged. 🔗
Security
6.5% of global traffic was mitigated by Cloudflare’s systems as being potentially malicious or for customer-defined reasons. In the United States, the share of mitigated traffic grew to 5.1%, while in South Korea, it dropped slightly to 8.1%. In 44 countries/regions, over 10% of traffic was mitigated. 🔗
The United States was responsible for over a third of global bot traffic. Amazon Web Services was responsible for 12.7% of global bot traffic, and 7.8% came from Google. 🔗
Globally, Gambling/Games was the most attacked industry, slightly ahead of 2023’s most targeted industry, Finance. 🔗
Log4j, a vulnerability discovered in 2021, remains a persistent threat and was actively targeted throughout 2024. 🔗
Routing security, measured as the share of RPKI valid routes and the share of covered IP address space, continued to improve globally throughout 2024. We saw a 4.7% increase in RPKI valid IPv4 address space in 2024, and a 6.4% increase in RPKI valid routes in 2024. 🔗
Email Security
An average of 4.3% of emails were determined to be malicious in 2024, although this figure was likely influenced by spikes observed in March, April, and May. Deceptive links and identity deception were the two most common types of threats found in malicious email messages. 🔗
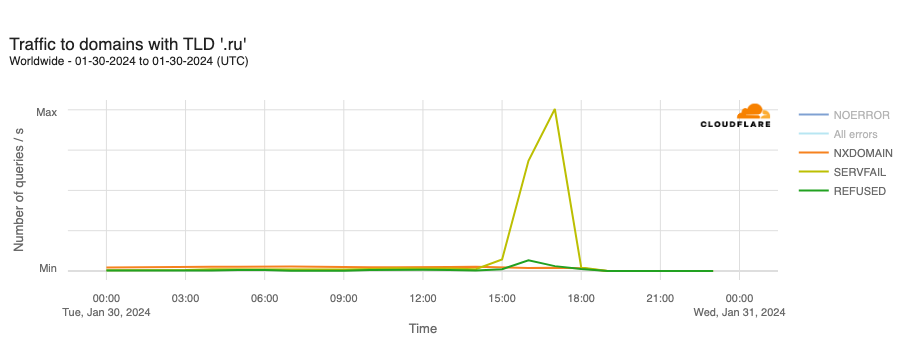
Over 99% of the email messages processed by Cloudflare Email Security from the .bar, .rest, and .uno top level domains (TLDs) were found to be either spam or malicious in nature. 🔗
Introduction
Over the last four years (2020, 2021, 2022, 2023), we have aggregated perspectives from Cloudflare Radar into an annual Year In Review, illustrating the Internet’s patterns across multiple areas over the course of that year. The Cloudflare Radar 2024 Year In Review microsite continues that tradition, featuring interactive charts, graphs, and maps you can use to explore and compare notable Internet trends observed throughout this past year.
Cloudflare’s network currently spans more than 330 cities in over 120 countries/regions, serving an average of over 63 million HTTP(S) requests per second for millions of Internet properties, in addition to handling over 42 million DNS requests per second on average. The resulting data generated by this usage, combined with data from other complementary Cloudflare tools, enables Radar to provide unique near-real time perspectives on the patterns and trends around security, traffic, performance, and usage that we observe across the Internet.
The 2024 Year In Review is organized into five sections: Traffic, Adoption & Usage, Connectivity, Security, and Email Security and covers the period from January 1 to December 1, 2024. We have incorporated several new metrics this year, including AI bot & crawler traffic, search engine and browser market share, connection tampering, and “most dangerous” top level domains (TLDs). To ensure consistency, we have kept underlying methodologies consistent with previous years’ calculations. Trends for 200 countries/regions are available on the microsite; smaller or less populated locations are excluded due to insufficient data. Some metrics are only shown worldwide, and are not displayed if a country/region is selected.
Below, we provide an overview of the content contained within the major Year In Review sections (Traffic, Adoption & Usage, Connectivity, Security, and Email Security), along with notable observations and key findings. In addition, we have also published a companion blog post that specifically explores trends seen across Top Internet Services.
The key findings and associated discussion within this post only provide a high-level perspective on the unique insights that can be found in the Year in Review microsite. Visit the microsite to explore the various datasets and metrics in more detail, including trends seen in your country/region, how these trends have changed as compared to 2023, and how they compare to other countries/regions of interest. Surveying the Internet from this vantage point provides insights that can inform decisions on everything from an organization’s security posture and IT priorities to product development and strategy.
Traffic trends
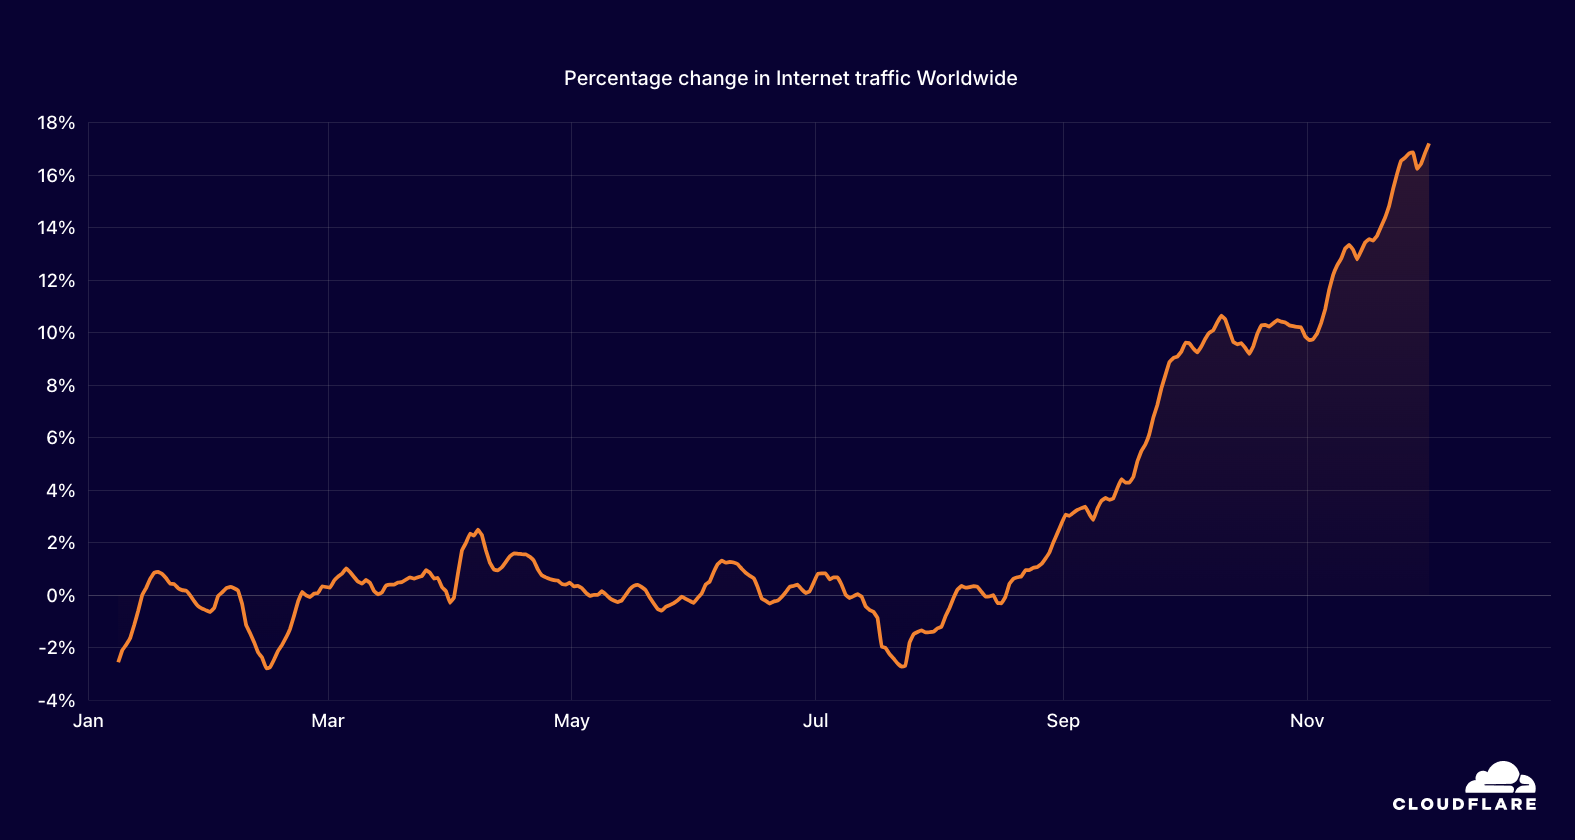
Global Internet traffic grew 17.2% in 2024.
An inflection point for Internet traffic arguably occurred thirty years ago. The World Wide Web went mainstream in 1994, thanks to the late 1993 release of the NCSA Mosaic browser for multiple popular operating systems, which included support for embedded images. In turn, “heavier” (in contrast to text-based) Internet content became the norm, and coupled with the growth in consumption through popular online services and the emerging consumer ISP industry, Internet traffic began to rapidly increase, and that trend has continued to the present.
To determine the traffic trends over time for the Year in Review, we use the average daily traffic volume (excluding bot traffic) over the second full calendar week (January 8-15) of 2024 as our baseline. (The second calendar week is used to allow time for people to get back into their “normal” school and work routines after the winter holidays and New Year’s Day. The percent change shown in the traffic trends chart is calculated relative to the baseline value — it does not represent absolute traffic volume for a country/region. The trend line represents a seven-day trailing average, which is used to smooth the sharp changes seen with data at a daily granularity. To compare 2024’s traffic trends with 2023 data and/or other locations, click the “Compare” icon at the upper right of the graph.
Throughout the first half of 2024, worldwide Internet traffic growth appeared to be fairly limited, within a percent or two on either side of the baseline value through mid-August. However, at that time growth clearly began to accelerate, climbing consistently through the end of November, growing 17.2% for the year. This trend is similar to those also seen in 2023 and 2022, as we discussed in the 2023 Year in Review blog post.
Internet traffic trends in 2024, worldwide
The West African country of Guinea experienced the most significant Internet traffic growth seen in 2024, reaching as much as 350% above baseline. Traffic growth didn’t begin in earnest until late February, and reached an initial peak in early April. It remained between 100% and 200% above baseline until September, when it experienced several multi-week periods of growth. While the September-November periods of traffic growth also occurred in 2023, they peaked at under 90% above baseline.
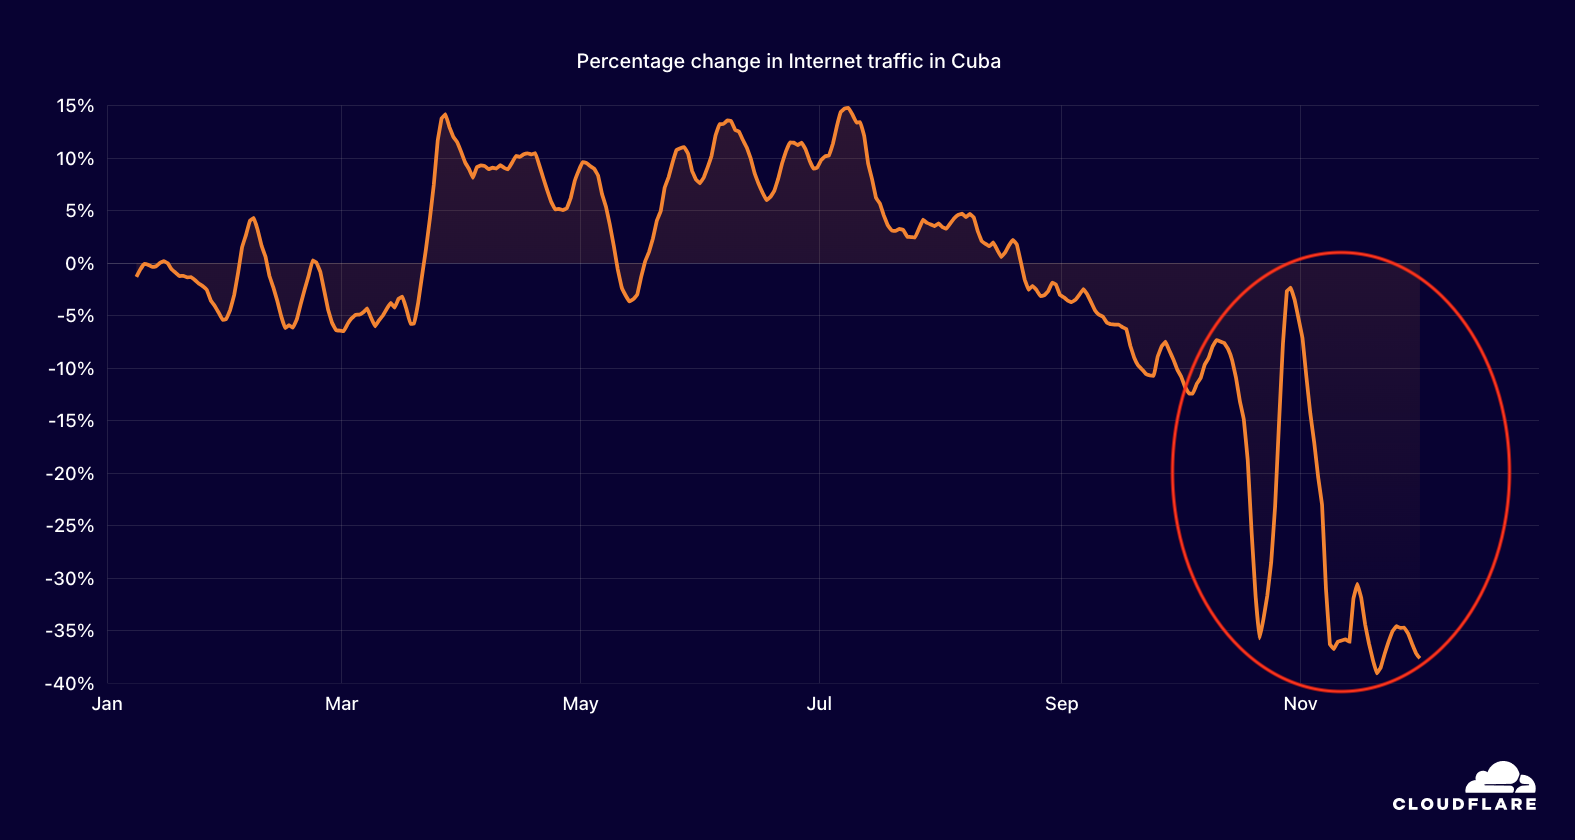
The impact of significant Internet outages is also clearly visible when looking at data across the year. Two significant Internet outages in Cuba are clearly visible as large drops in traffic in October and November. A reported “complete disconnection” of the national electricity system on the island occurred on October 18, lasting just over three days. Just a couple of weeks later, on November 6, damage from Hurricane Rafael caused widespread power outages in Cuba, resulting in another large drop in Internet traffic. Traffic has remained lower as Cuba’s electrical infrastructure continues to struggle.
Internet traffic trends in 2024, Cuba
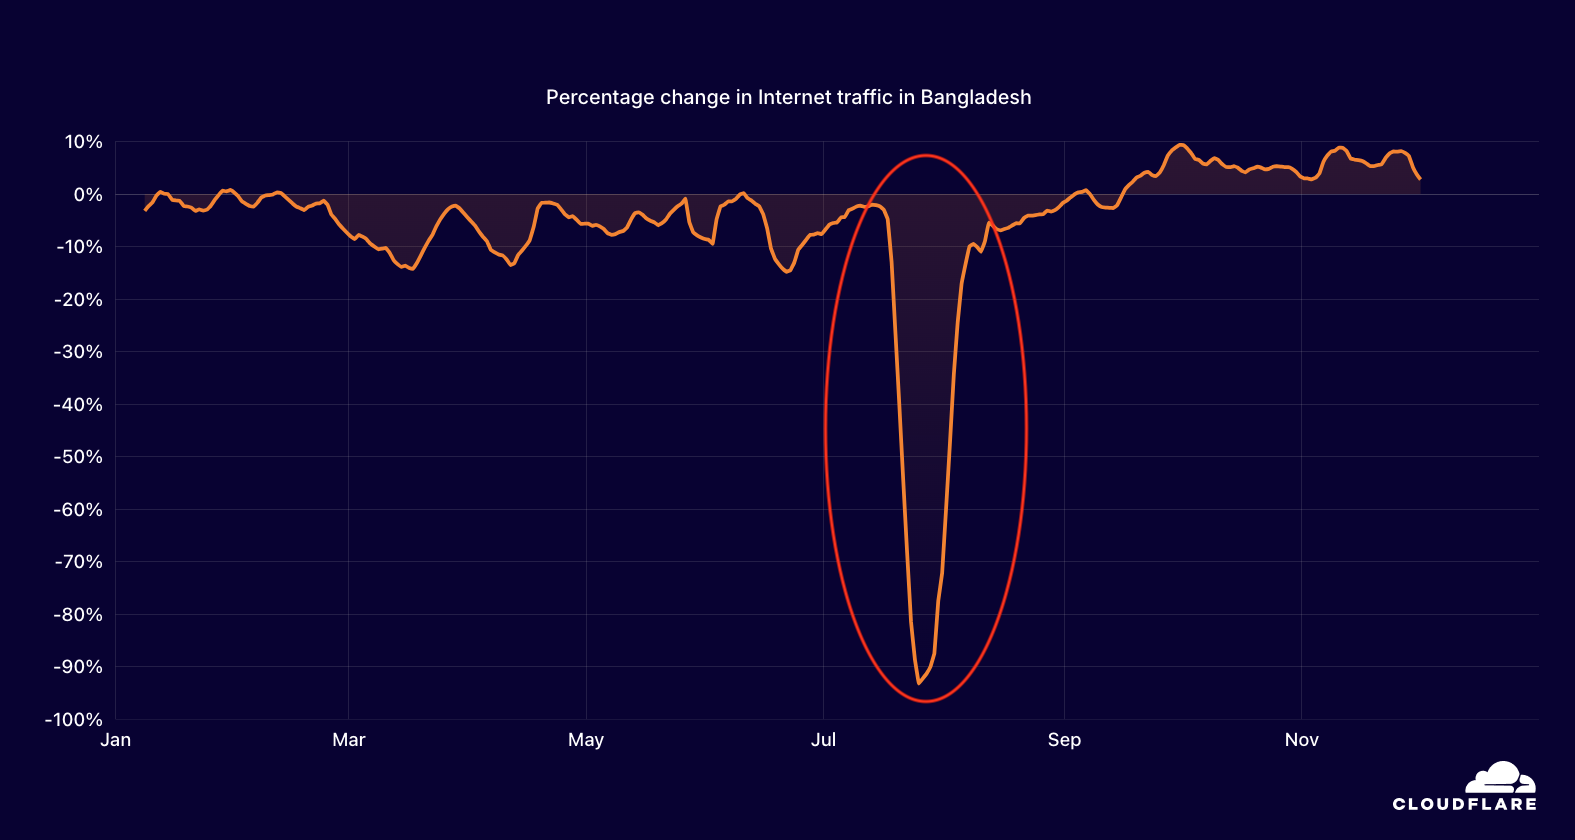
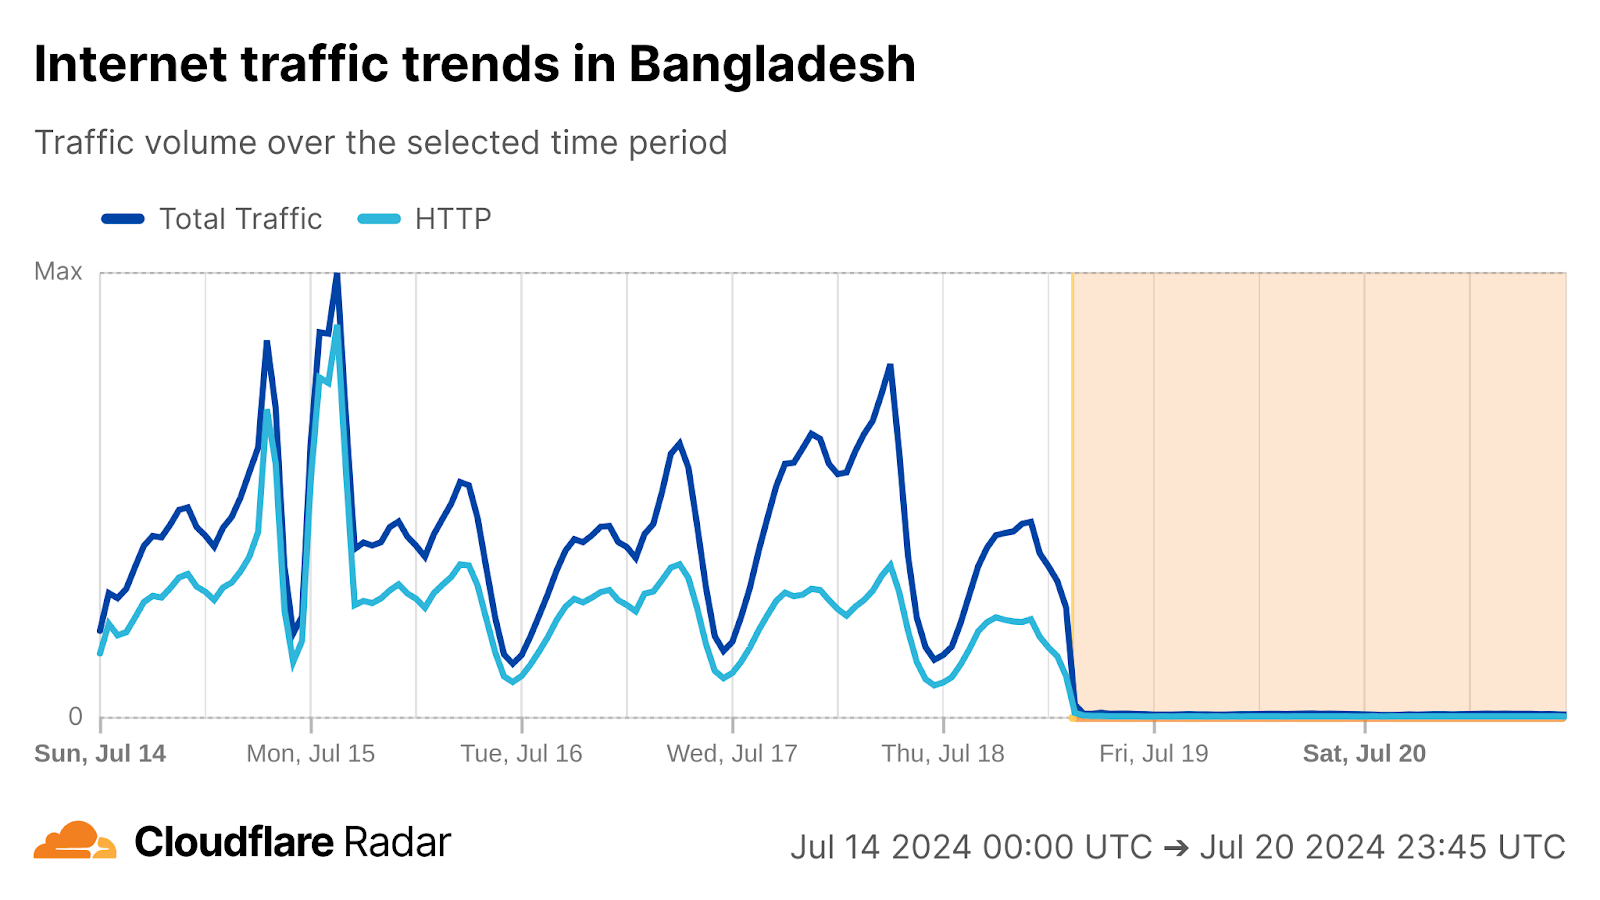
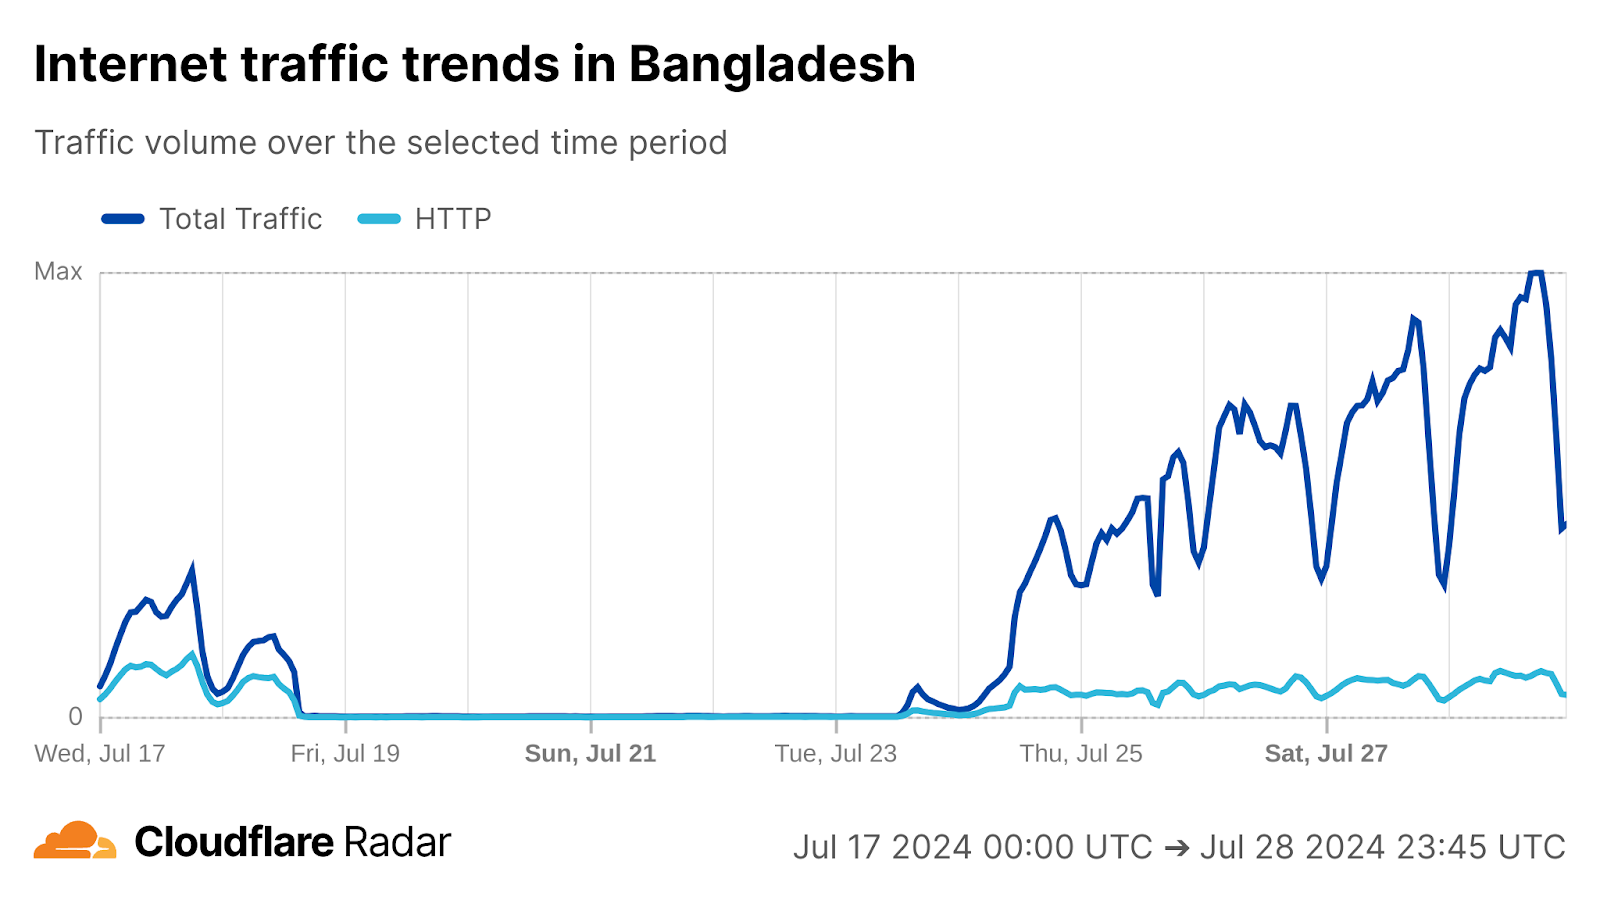
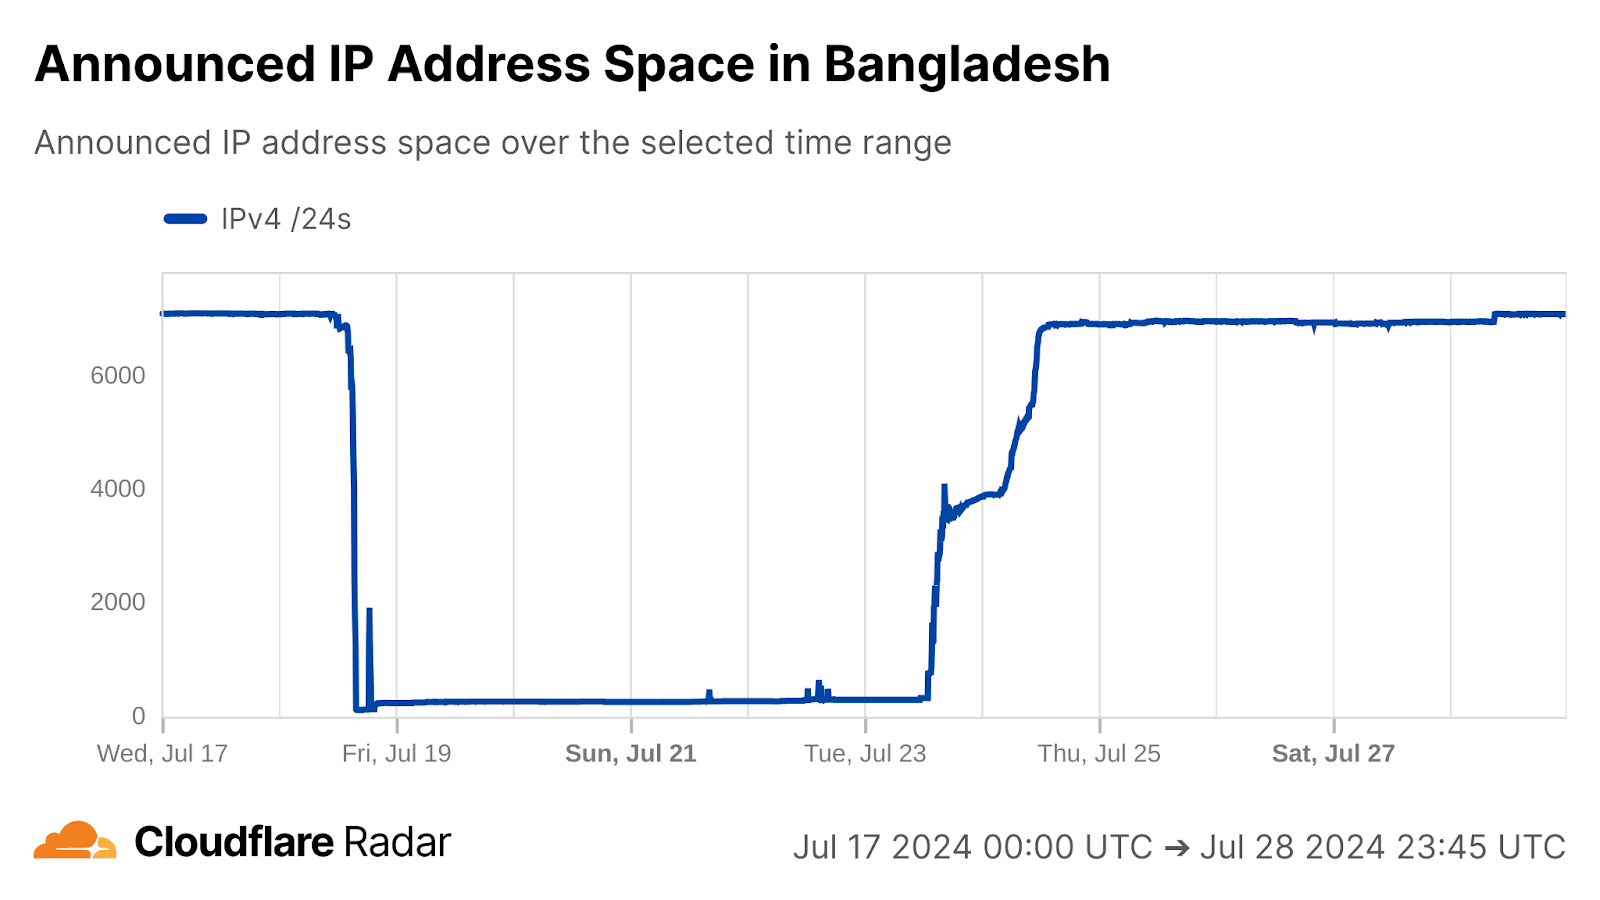
As we frequently discuss in Cloudflare Radar blog and social media posts, government-directed Internet shutdowns occur all too frequently, and the impact of these actions are also clearly visible when looking at long-term traffic data. In Bangladesh, the government ordered the shutdown of mobile Internet connectivity on July 18, in response to student protests. Shortly after mobile networks were shut down, fixed broadband networks were taken offline as well, resulting in a near complete loss of Internet traffic from the country. Connectivity gradually returned over the course of several days, between July 23-28.
Internet traffic trends in 2024, Bangladesh
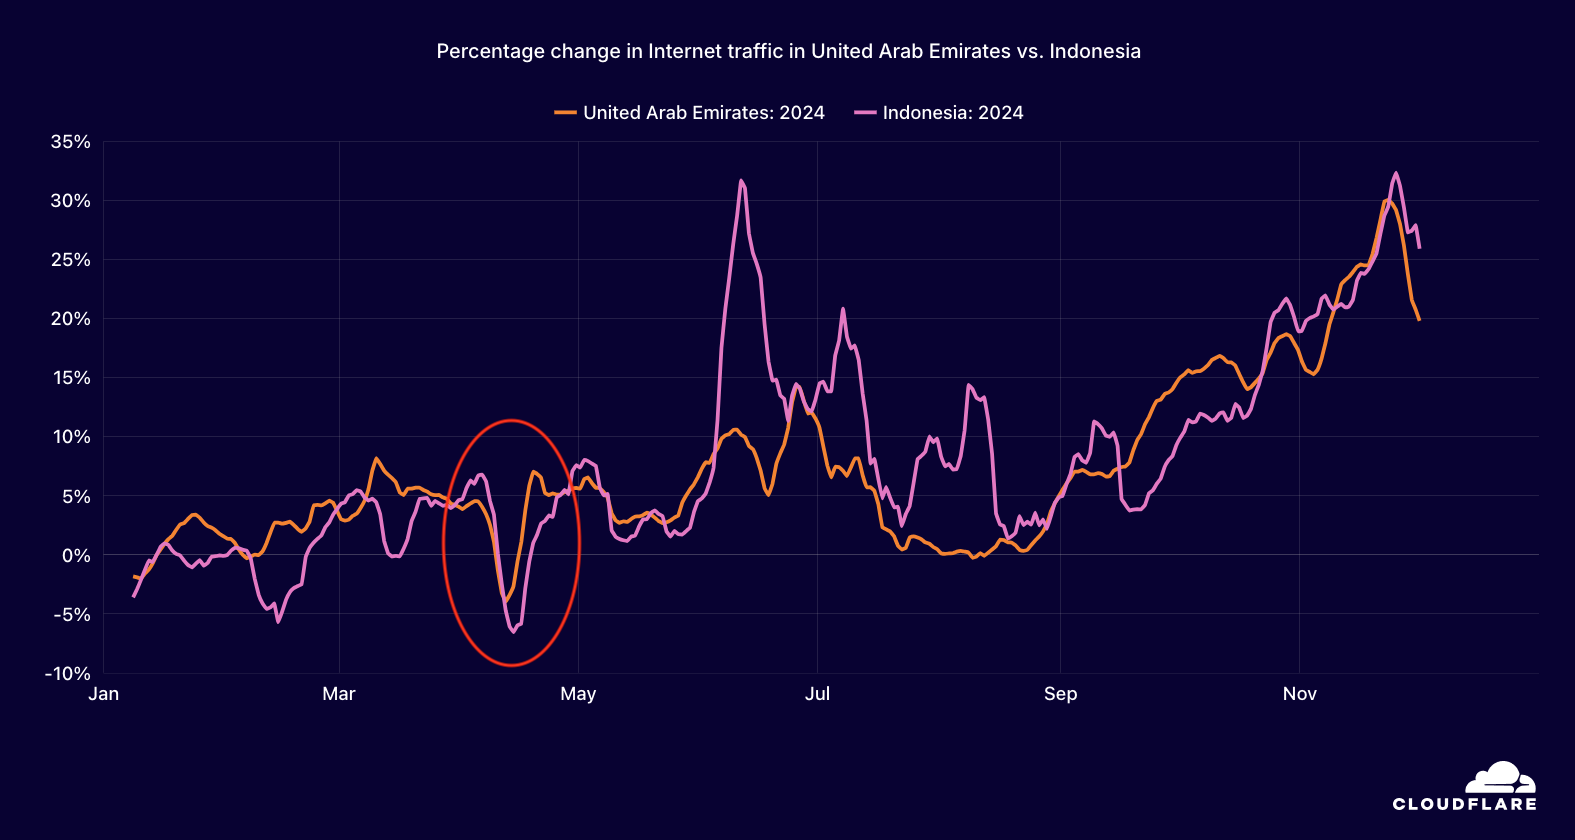
As we also noted last year, the celebration of major holidays can also have a visible impact on Internet traffic at a country level. For example, in Muslim countries including Indonesia and the United Arab Emirates, the celebration of Eid al-Fitr, the festival marking the end of the fast of Ramadan, is visible as a noticeable drop in traffic around April 9-10.
Internet traffic trends in 2024, Indonesia and United Arab Emirates
Google maintained its position as the most popular Internet service. OpenAI, Binance, WhatsApp, and Facebook led their respective categories.
Over the last several years, the Year In Review has ranked the most popular Internet services. These rankings cover an “overall” perspective, as well as a dozen more specific categories, based on analysis of anonymized query data of traffic to our 1.1.1.1 public DNS resolver from millions of users around the world. For the purposes of these rankings, domains that belong to a single Internet service are grouped together.
Google once again held the top spot overall, supported by its broad portfolio of services, as well as the popularity of the Android mobile operating system (more on that below). Meta properties Facebook, Instagram, and WhatsApp also held spots in the top 10.
Generative AI continued to grow in popularity throughout 2024, and in this category, OpenAI again held the top spot, building on the continued success and popularity of ChatGPT. Within Social Media, the top five remained consistent with 2023’s and 2022’s ranking, including Facebook, TikTok, Instagram, X, and Snapchat.
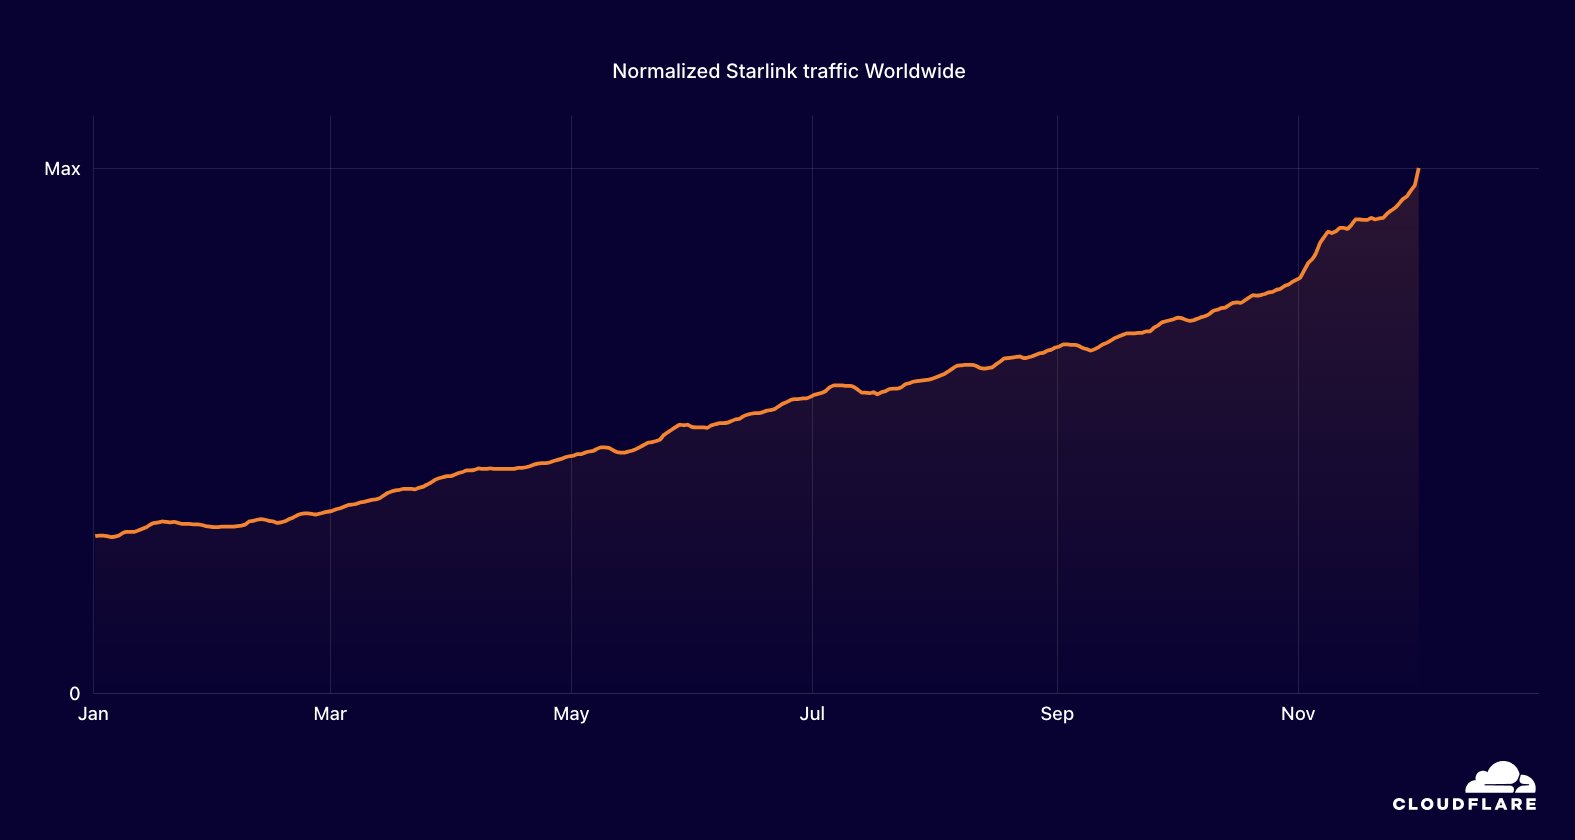
Global traffic from Starlink grew 3.3x in 2024, in line with last year’s growth rate. After initiating service in Malawi in July 2023, Starlink traffic from that country grew 38x in 2024.
SpaceX’s Starlink continues to be the leading satellite Internet service provider, bringing connectivity to unserved or underserved areas. In addition to opening up new markets in 2024, Starlink also announced relationships to provide in-flight connectivity to multiple airlines, and on cruise ships and trains, as well as enabling subscribers to roam with their subscription using the Starlink Mini.
We analyzed aggregate Cloudflare traffic volumes associated with Starlink’s primary autonomous system (AS14593) to track the growth in usage of the service throughout 2024. Similar to the traffic trends discussed above, the request volume shown on the trend line in the chart represents a seven-day trailing average. Comparisons with 2023 data can be shown by clicking the “Compare” icon at the upper right of the graph. Within comparative views, the lines are scaled to the maximum value shown.
On a worldwide basis, steady, consistent growth was seen across the year, though it accelerates throughout November. This acceleration may have been driven by traffic associated with customer-specific large software updates.
Starlink traffic growth worldwide in 2024
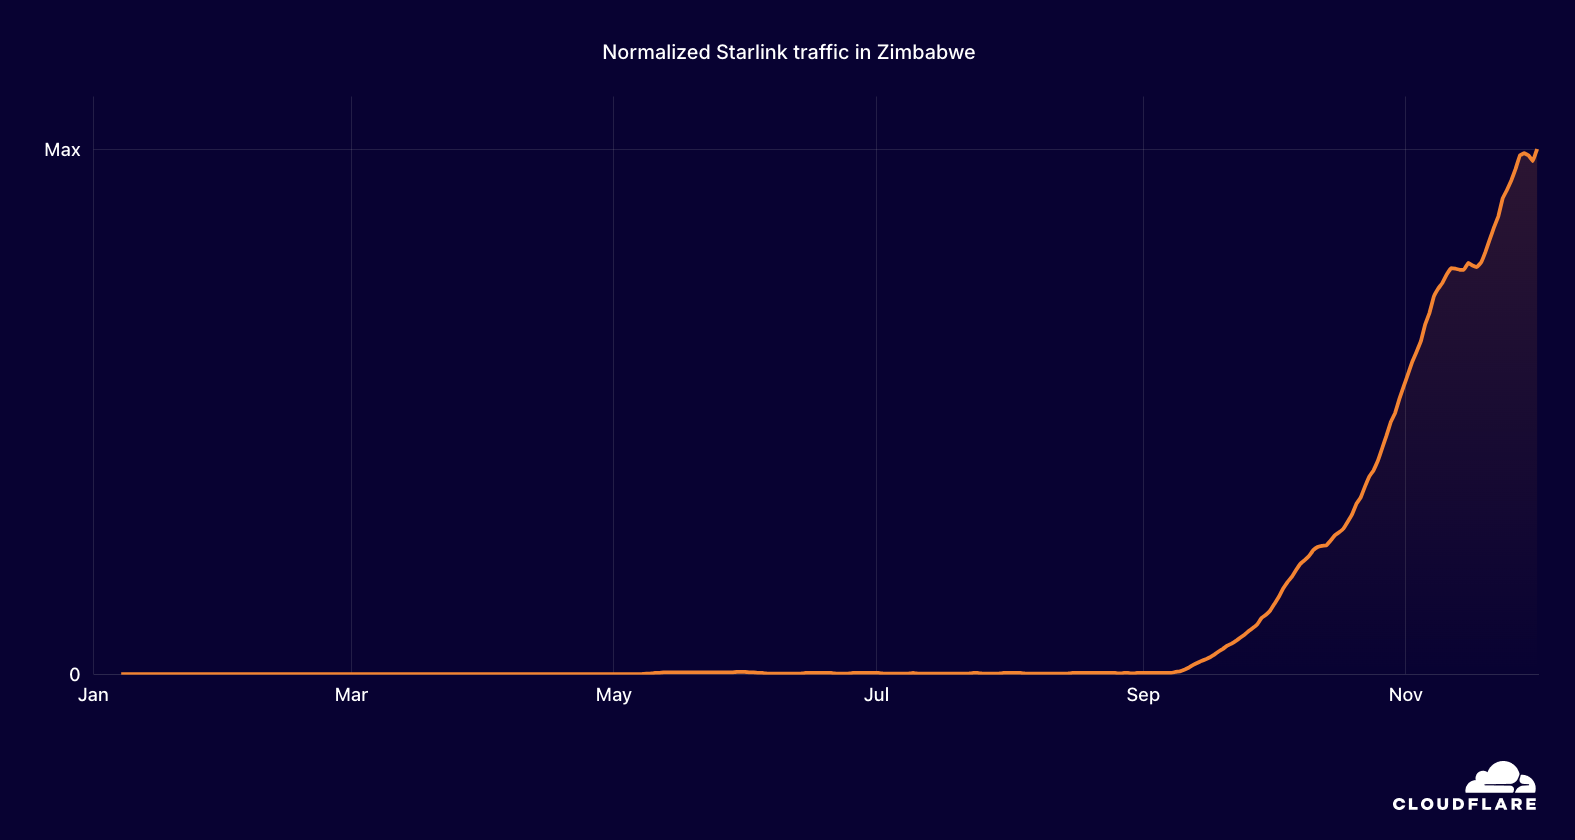
In many locations, there is pent-up demand for “alternative” connectivity providers such as Starlink, and in these countries/regions, we see rapid traffic growth when service becomes available, such as in Zimbabwe. Service availability was announced on September 7, and traffic from the country began to grow rapidly almost immediately thereafter.
Starlink traffic growth in Zimbabwe in 2024
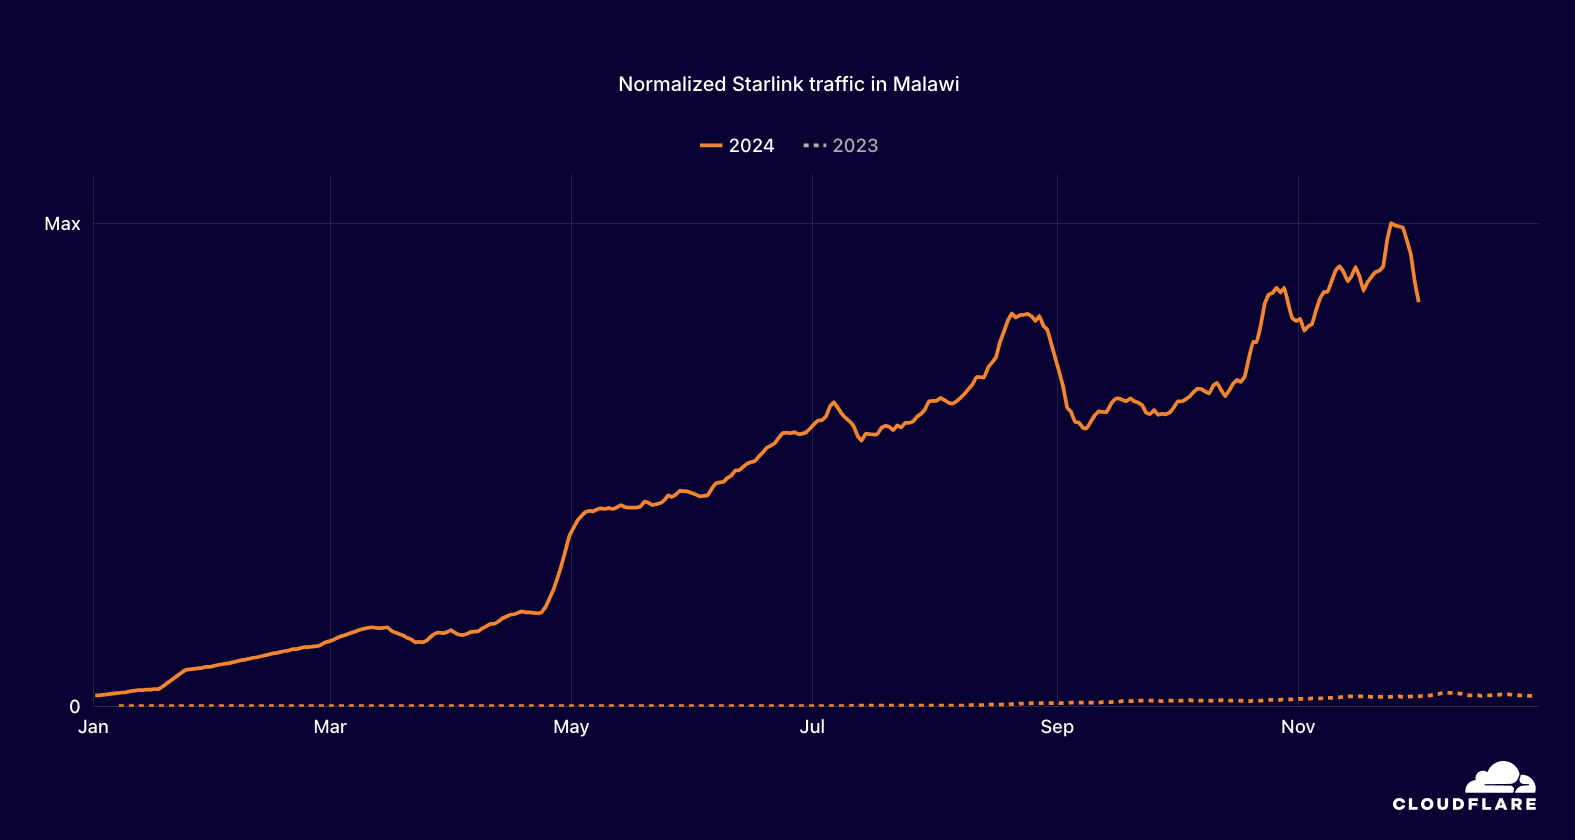
In new markets, traffic growth continues after that initial increase. For example Starlink service became available in Malawi in July 2023, and throughout 2024, Starlink traffic from the country grew 38x. While Malawi’s 38x increase is impressive, other countries also experienced significant growth. In the Eastern European country of Georgia, service became available on November 1, 2023. After a slow ramp, traffic began to take off growing over 100x through 2024. In Paraguay, service availability was announced on December 21, and began to grow at the beginning of January, registering an increase of over 900x across the year.
Starlink traffic growth in Malawi in 2024
Googlebot was responsible for the highest volume of request traffic to Cloudflare in 2024 as it retrieved content from millions of Cloudflare customer sites for search indexing.
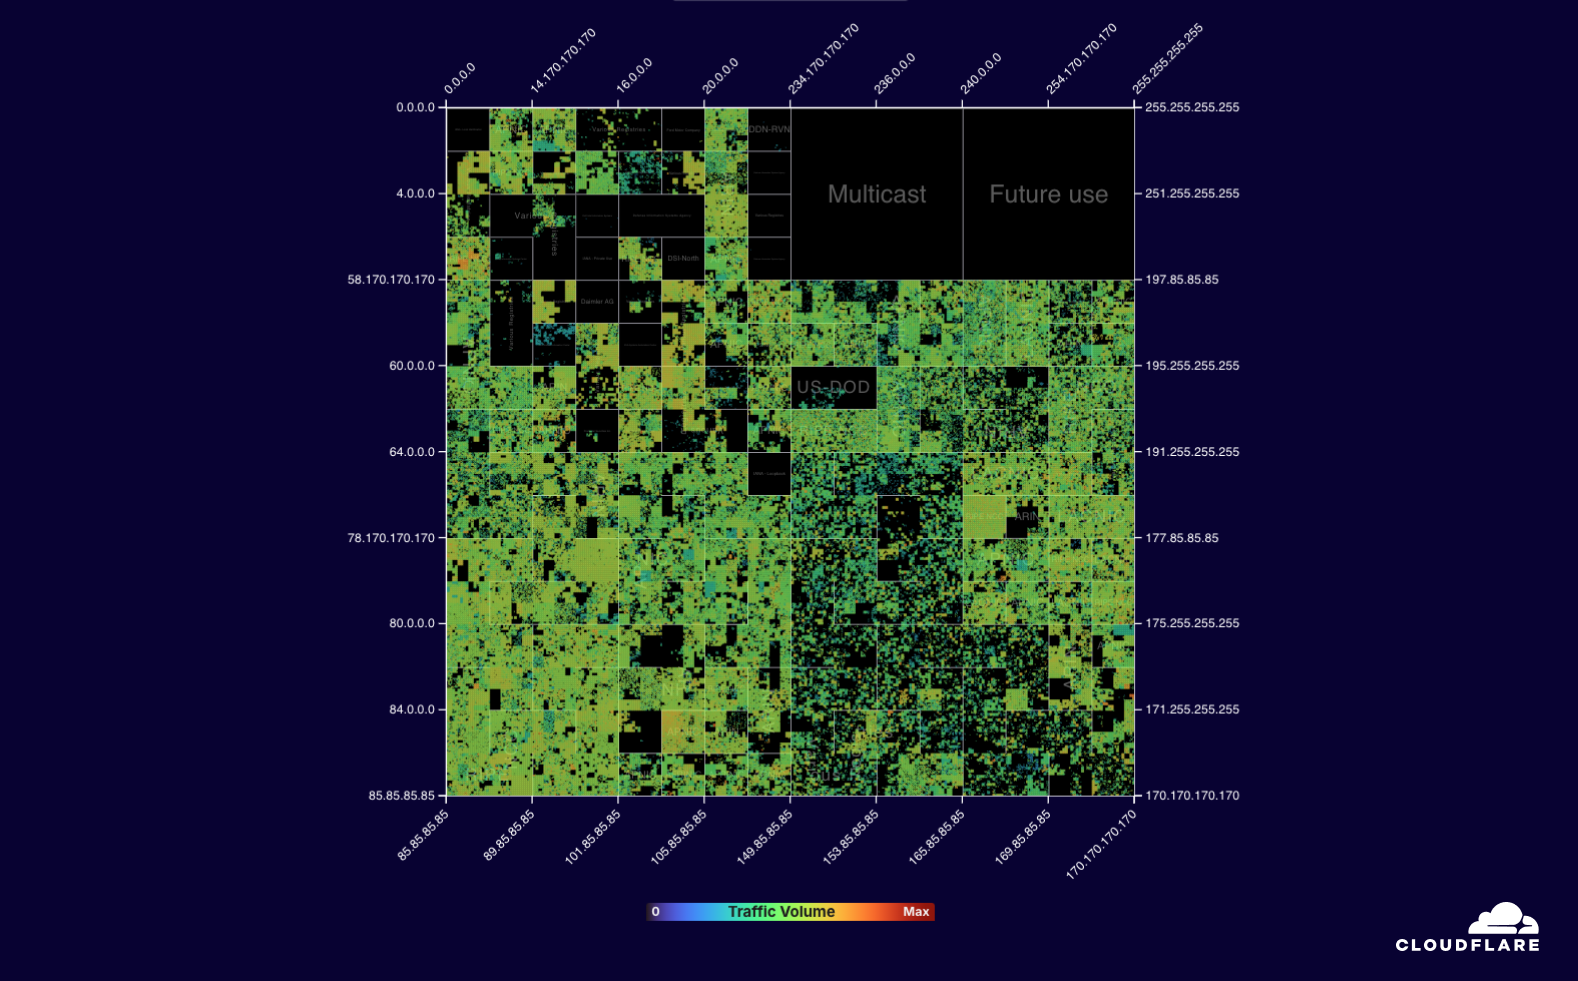
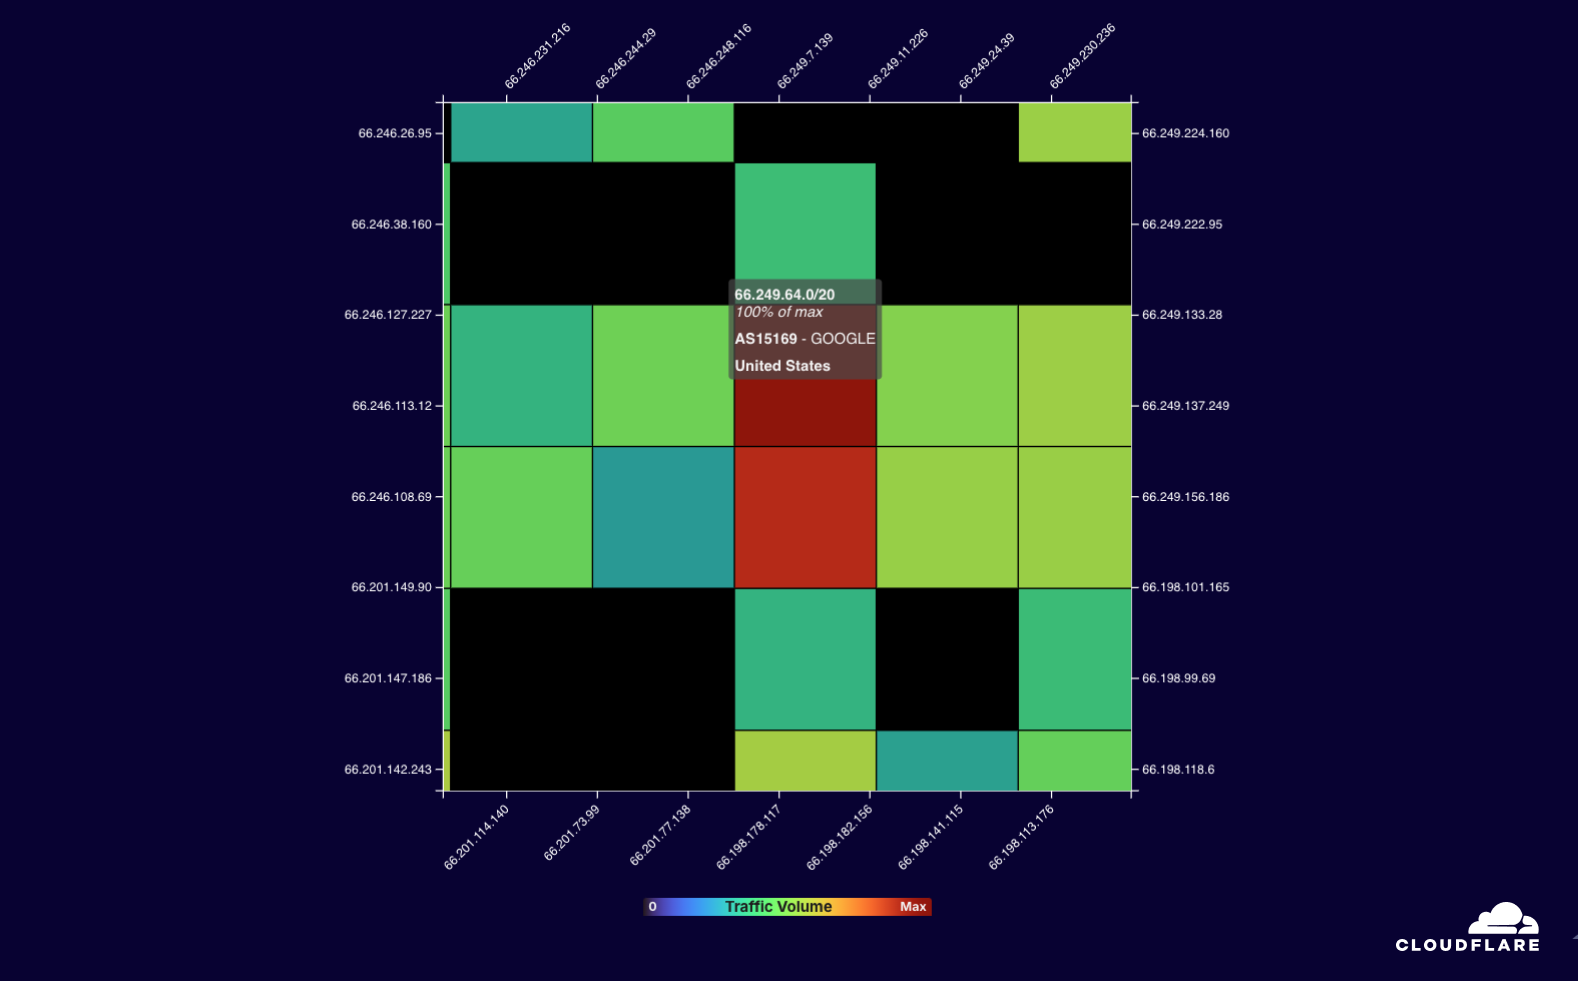
Cloudflare Radar shows users Internet traffic trends over a selected period of time, but at a country/region or network level. However, as we did in 2023, we again wanted to look at the traffic Cloudflare saw over the course of the full year from the entire IPv4 Internet. To do so, we can use Hilbert curves, which allow us to visualize a sequence of IPv4 addresses in a two-dimensional pattern that keeps nearby IP addresses close to each other, making them useful for surveying the Internet’s IPv4 address space.
Using a Hilbert curve, we can visualize aggregated IPv4 request traffic to Cloudflare from January 1 through December 1, 2024. Within the visualization, we aggregate IPv4 addresses at a /20 level, meaning that at the highest zoom level, each square represents traffic from 4,096 IPv4 addresses. This aggregation is done to keep the amount of data used for the visualization manageable. (While we would like to create a similar visualization for IPv6 traffic, the enormity of the full IPv6 address space would make associated traffic very hard to see in such a visualization, especially as such a small amount has been allocated for assignment by the Regional Internet Registries.)
Within the visualization, IP addresses are grouped by ownership, and for much of the IP address space shown there, a mouseover at the default zoom level will show the Regional Internet Registry (RIR) that the address block belongs to. However, there are also a number of blocks that were assigned prior to the existence of the RIR system, and for these, they are labeled with the name of the organization that owns them. Progressive zooming ultimately shows the autonomous system and country/region that the IP address block is associated with, as well as its share of traffic relative to the maximum. (If a country/region is selected, only the IP address blocks associated with that location are visible.) Overall traffic shares are indicated by shading based on a color scale, and although a number of large unshaded blocks are visible, this does not necessarily mean that the associated address space is unused, but rather that it may be used in a way that does not generate traffic to Cloudflare.
Hilbert curve showing aggregated 2024 traffic to Cloudflare across the IPv4 Internet
Warmer orange/red shading within the visualization represents areas of higher request volume, and buried within one of those areas is the IP address block that had the maximum request volume to Cloudflare during 2024. As it was in 2023, this address block was 66.249.64.0/20, which belongs to Google, and is one of several used by the Googlebot web crawler to retrieve content for search indexing. This use of that address space is a likely explanation for the high request volume, given the number of web properties on Cloudflare’s network.
Zoomed Hilbert curve view showing the IPv4 address block that generated the highest volume of requests
In addition to Google, owners of other prefixes in the top 20 include Alibaba, Microsoft, Amazon, and Apple. To explore the IPv4 Internet in more detail, we encourage you to go to the Year in Review microsite and explore it by dragging and zooming to move around IPv4 address space.
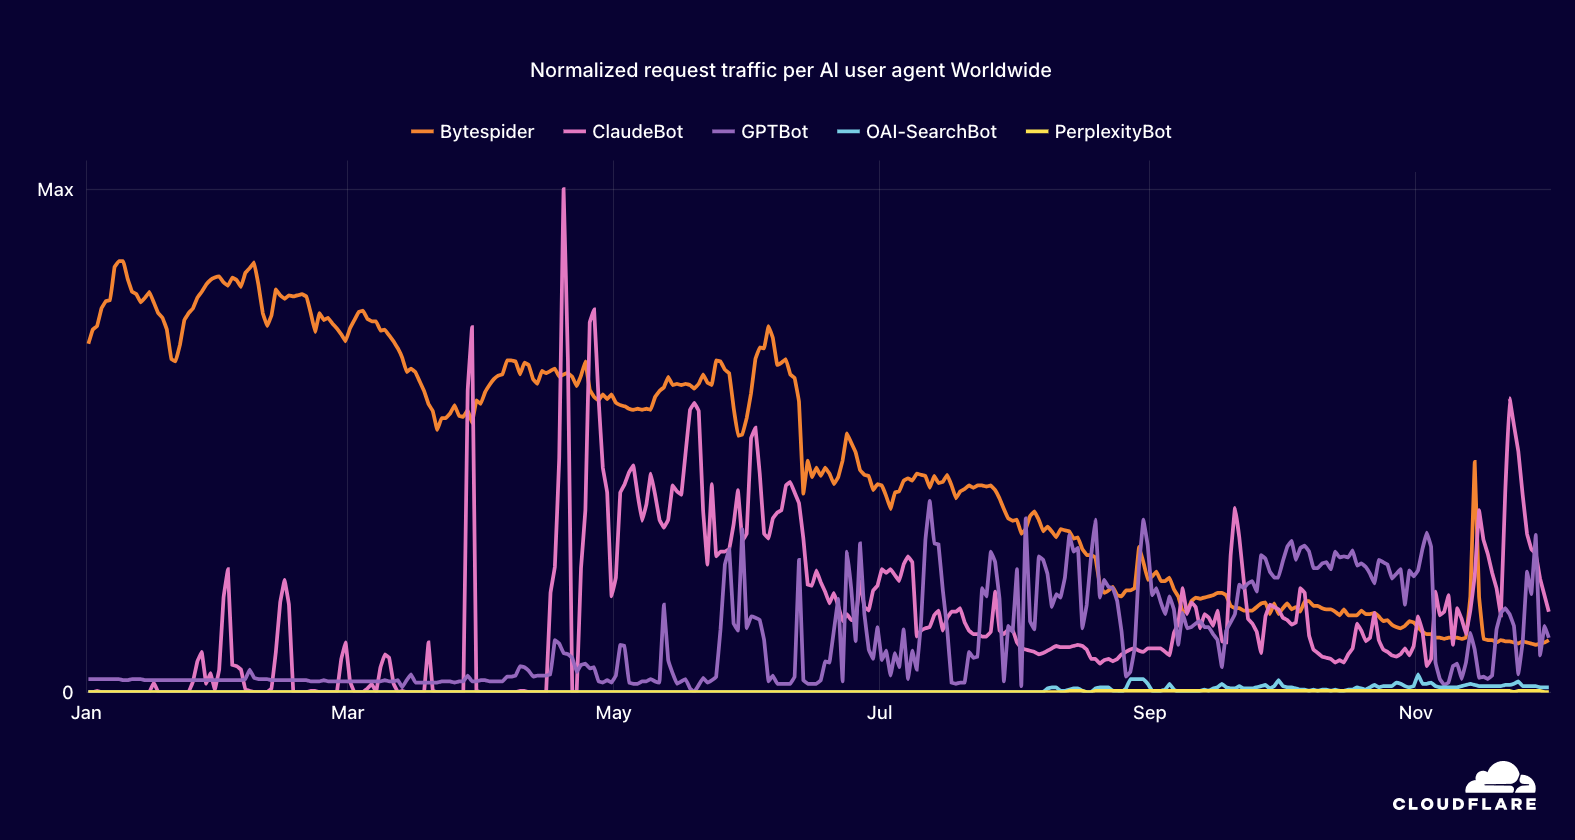
Among AI bots and crawlers, Bytespider (ByteDance) traffic gradually declined over the course of 2024, while ClaudeBot (Anthropic) was more active during the back half of the year.
AI bots and crawlers have been in the news throughout 2024 as they voraciously consume content to train ever-evolving models. Controversy has followed them, as not all bots and crawlers respect content owner directives to restrict crawling activity. In July, Cloudflare enabled customers to block these bots and crawlers with a single click, and during Birthday Week we introduced AI Audit to give website owners even more visibility into and control over how AI platforms access their content.
Tracking traffic trends for AI bots can help us better understand their activity over time — observing which are the most aggressive and have the highest volume of requests, which perform crawls on a regular basis, etc. The new AI bot & crawler traffic graph on Radar’s Traffic page, launched in September, provides insight into these traffic trends gathered over the selected time period for the top known AI bots.
Looking at traffic trends from two of those bots, we can see some interesting patterns. Bytespider is a crawler operated by ByteDance, the Chinese owner of TikTok, and is reportedly used to download training data for ByteDance’s Large Language Models (LLMs). Bytespider’s crawling activity trended generally downwards over the course of 2024, with end-of-November activity approximately 80-85% lower than that seen at the start of the year. ClaudeBot is Anthropic’s crawler, which downloads training data for its LLMs that power AI products like Claude. Traffic from ClaudeBot appeared to be mostly non-existent through mid-April, except for some small spikes that possibly represent test runs. Traffic became more consistently non-zero starting in late April, but after an early spike, trailed off through the remainder of the year.
Traffic trends for AI crawlers Bytespider and ClaudeBot in 2024
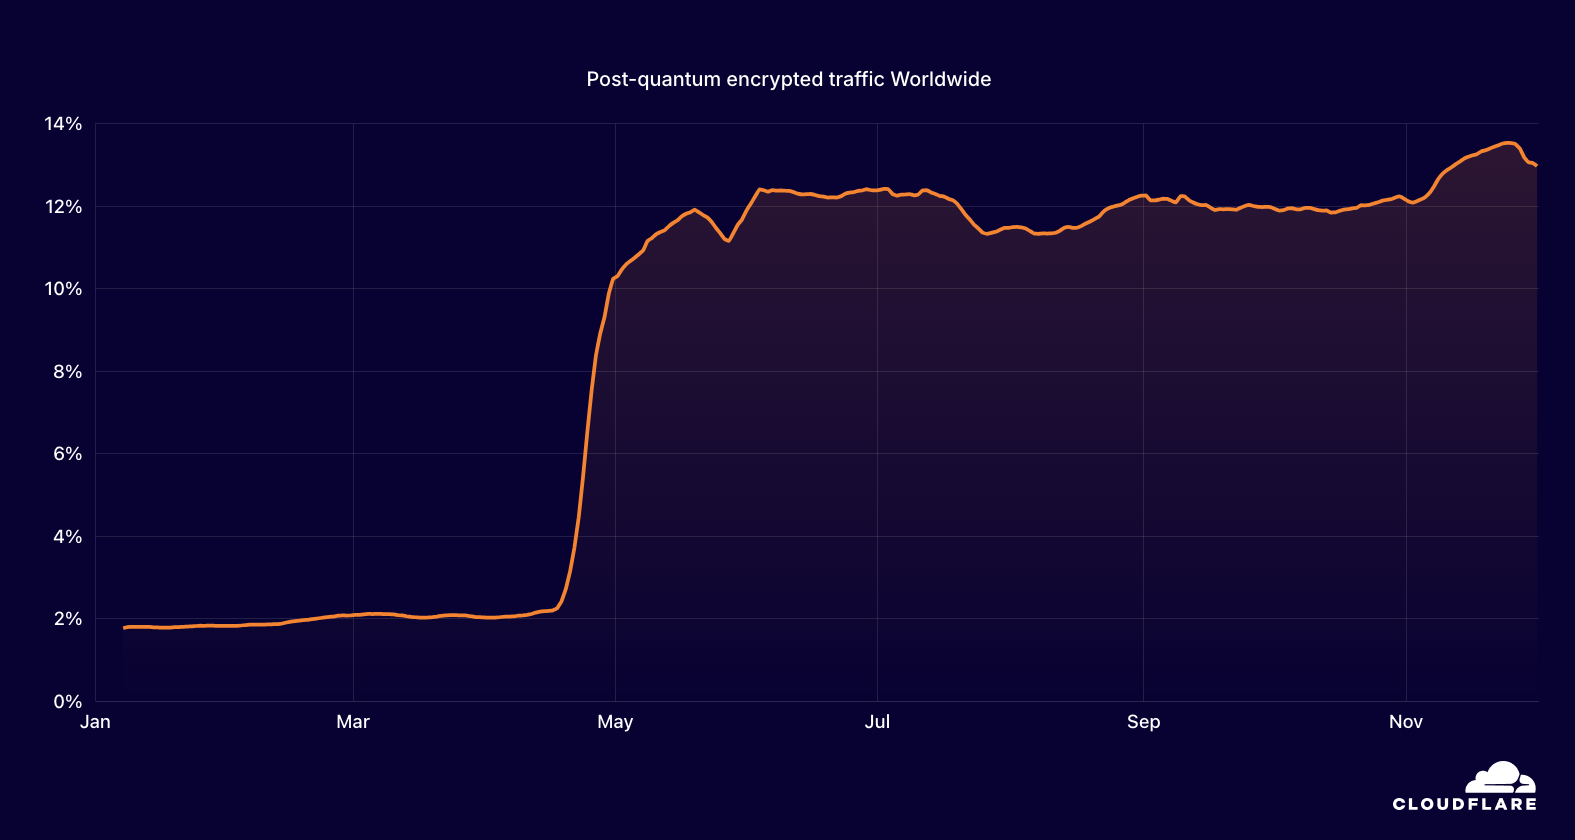
13.0% of TLS 1.3 traffic is using post-quantum encryption.
The term “post-quantum” refers to a new set of cryptographic techniques designed to protect data from adversaries that have the ability to capture and store current data for decryption by sufficiently powerful quantum computers in the future. The Cloudflare Research team has been exploring post-quantum cryptography since 2017.
In October 2022, we enabled post-quantum key agreement on our network by default, but use of it requires that browsers and clients support it as well. In 2024, Google’s Chrome 124 enabled it by default on April 17, and adoption grew rapidly following that release, increasing from just over 2% of requests to around 12% within a month, and ended November at 13%. We expect that adoption will continue to grow into and during 2025 due to support in other Chromium-based browsers, growing default support in Mozilla Firefox, and initial testing in Apple Safari.
Growth trends in post-quantum encrypted TLS 1.3 traffic during 2024
Adoption & Usage insights
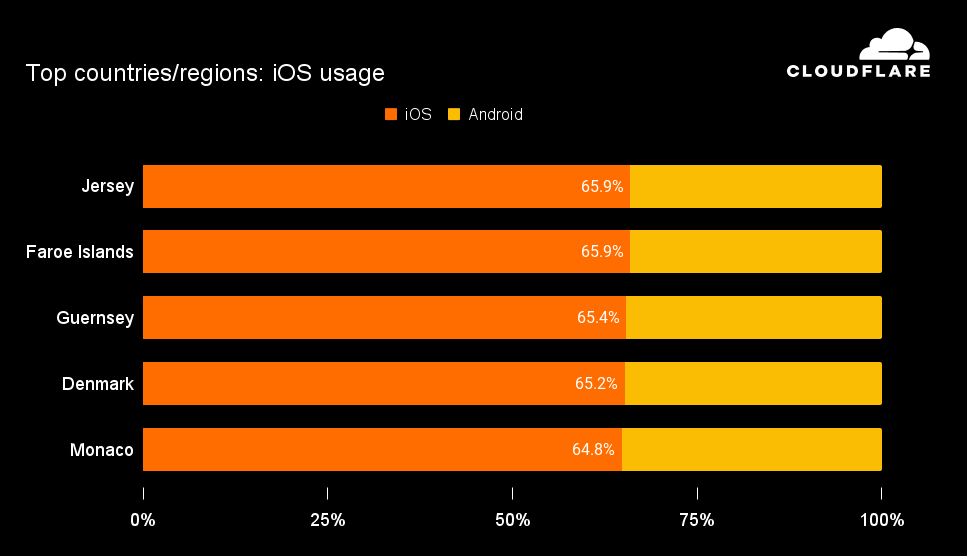
Globally, nearly one-third of mobile device traffic was from Apple iOS devices. Android had a >90% share of mobile device traffic in 29 countries/regions; peak iOS mobile device traffic share was over 60% in eight countries/regions.
The two leading mobile device operating systems globally are Apple’s iOS and Google’s Android, and by analyzing information in the user agent reported with each request, we can get insight into the distribution of traffic by client operating system throughout the year. Again, we found that Android is responsible for the majority of mobile device traffic when aggregated globally, due to the wide distribution of price points, form factors, and capabilities.
Global distribution of mobile device traffic by operating system in 2024
In contrast, iOS adoption tops out in the 65% range in Jersey, the Faroe Islands, Guernsey, and Denmark. Adoption rates of 50% or more were seen in a total of 26 countries/regions, including Norway, Sweden, Australia, Japan, the United States, and Canada. These locations likely have a greater ability to afford higher priced devices, owing to their comparatively higher gross national income per capita.
Countries/regions with the largest share of iOS traffic in 2024
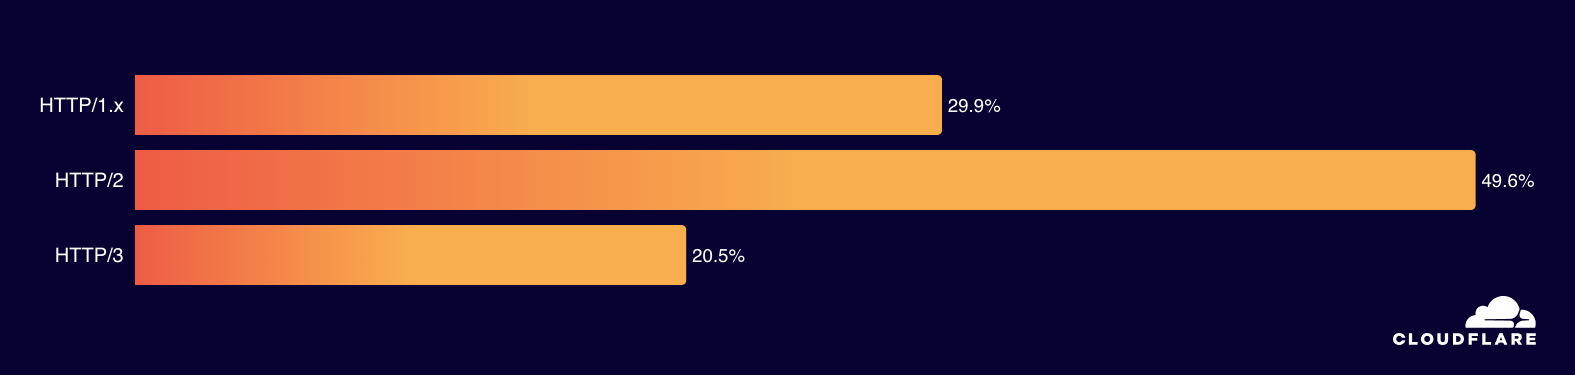
Globally, nearly half of web requests used HTTP/2, with 20.5% using HTTP/3.
HTTP (HyperText Transfer Protocol) is the core protocol that the web relies upon. HTTP/1.0 was first standardized in 1996, HTTP/1.1 in 1999, and HTTP/2 in 2015. The most recent version, HTTP/3, was completed in 2022, and runs on top of a new transport protocol known as QUIC. By running on top of QUIC, HTTP/3 can deliver improved performance by mitigating the effects of packet loss and network changes, as well as establishing connections more quickly. HTTP/3 also provides encryption by default, which mitigates the risk of attacks.
Current versions of desktop and mobile Google Chrome (and Chromium-based variants), Mozilla Firefox, and Apple Safari all support HTTP/3 by default. Cloudflare makes HTTP/3 available for free to all of our customers, although not every customer chooses to enable it.
Analysis of the HTTP version negotiated for each request provides insight into the distribution of traffic by the various versions of the protocol aggregated across the year. (“HTTP/1.x” aggregates requests made over HTTP/1.0 and HTTP/1.1.) At a global level, 20.5% of requests in 2024 were made using HTTP/3. Another 29.9% of requests were made over the older HTTP/1.x versions, while HTTP/2 remained dominant, accounting for the remaining 49.6%.
Global distribution of traffic by HTTP version in 2024
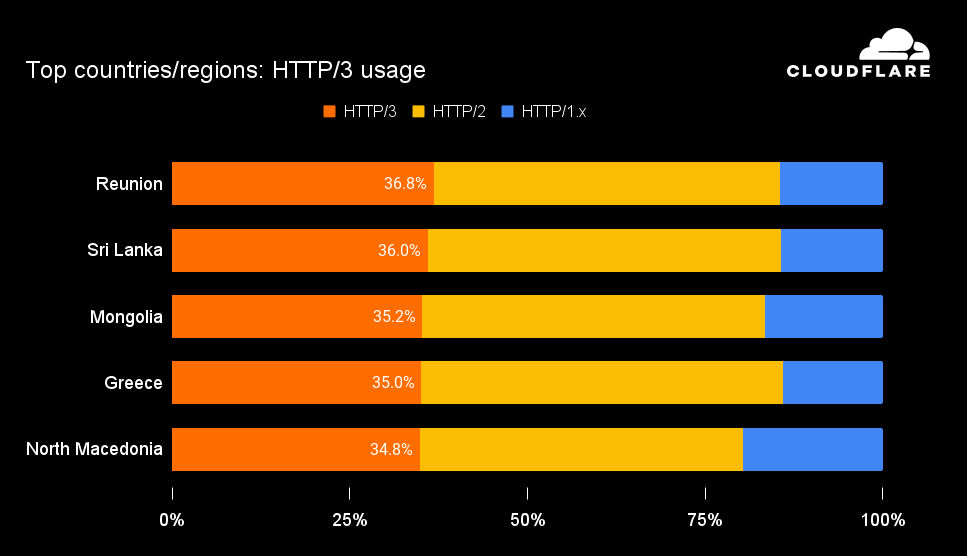
Looking at version distribution geographically, we found eight countries/regions sending more than a third of their requests over HTTP/3, with Reunion, Sri Lanka, Mongolia, Greece, and North Macedonia comprising the top five as shown below. Eight other countries/regions, including Iran, Ireland, Hong Kong, and China, sent more than half of their requests over HTTP/1.x throughout 2024. More than half of requests were made over HTTP/2 in a total of 147 countries/regions.
Countries/regions with the largest shares of HTTP/3 traffic in 2024
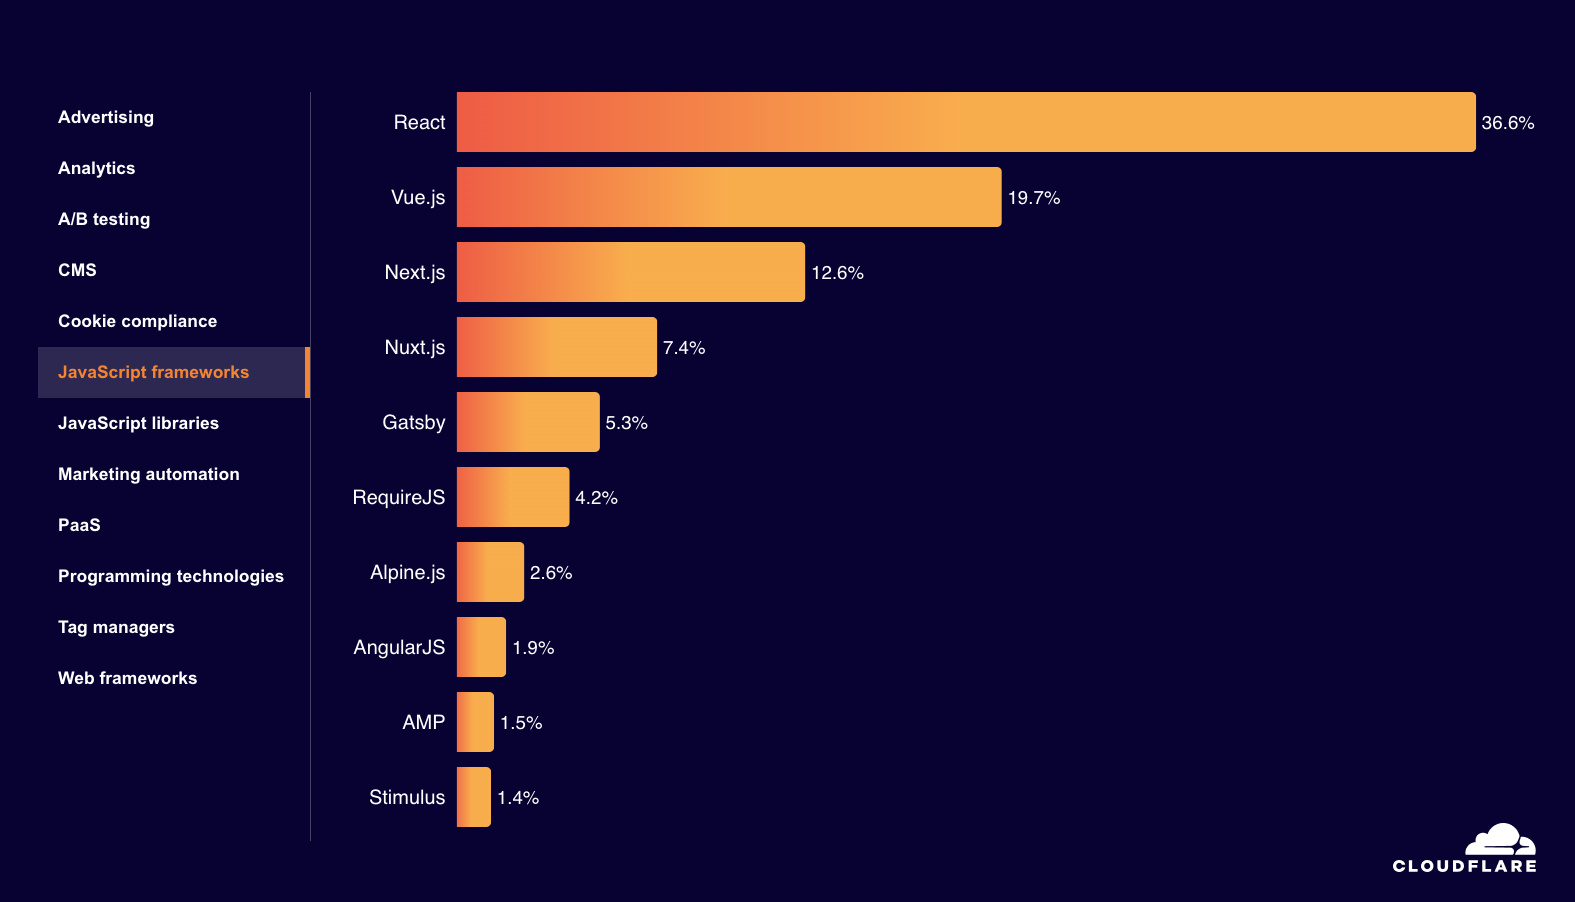
React, PHP, and jQuery were among the most popular technologies used to build websites, while Hubspot, Google, and WordPress were among the most popular vendors of supporting services and platforms.
Modern websites and applications are extremely complex, built on and integrating on a mix of frameworks, platforms, services, and tools. In order to deliver a seamless user experience, developers must ensure that all of these components happily coexist with each other. Using Cloudflare Radar’s URL Scanner, we again scanned websites associated with the top 5000 domains to identify the most popular technologies and services used across a dozen different categories.
In looking at core technologies used to build websites, React had a commanding lead over Vue.js and other JavaScript frameworks, PHP was the most popular programming technology, and jQuery’s share was 10x other popular JavaScript libraries.
Third-party services and platforms are also used by websites and applications to support things like analytics, content management, and marketing automation. Google Analytics remained the most widely used analytics provider, WordPress had a greater than 50% share among content management systems, and for marketing automation providers, category leader HubSpot had nearly twice the usage share of Marketo and MailChimp.
Top website technologies, JavaScript frameworks category in 2024
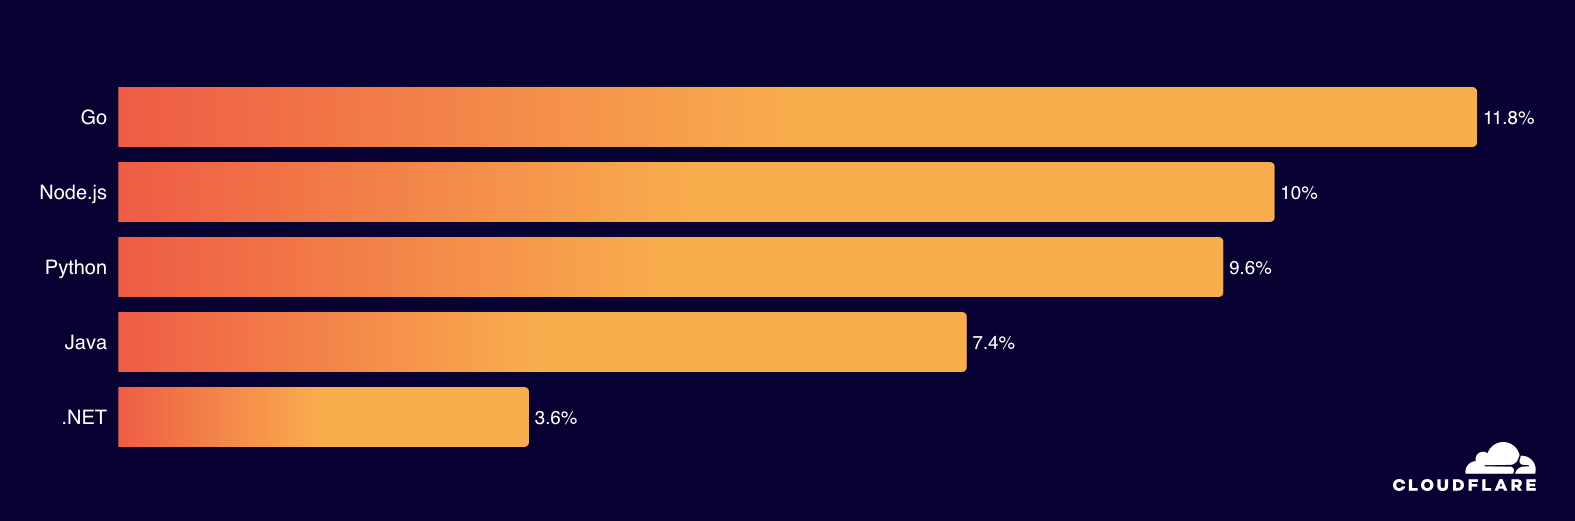
Go surpassed NodeJS as the most popular language used for making automated API requests.
Many dynamic websites and applications are built on automated API calls, and we can use our unique visibility into Web traffic to identify the top languages these API clients are written in. Applying heuristics to API-related requests determined to not be coming from a person using a browser or native mobile application helps us to identify the language used to build the API client.
Our analysis found that almost 12% of automated API requests are made by Go-based clients, with NodeJS, Python, Java, and .NET holding smaller shares. Compared to 2023, Go’s share increased by approximately 40%, allowing it to capture the top spot, while NodeJS’s share fell by just over 30%. Python and Java also saw their shares increase, while .NET’s fell.
Most popular API client languages in 2024
Google is the most popular search engine globally, across all platforms. On mobile devices/OS, Baidu is a distant second. Bing is a distant second across desktop and Windows devices, with DuckDuckGo second most popular on macOS.
Protecting and accelerating websites and applications for millions of customers, Cloudflare is in a unique position to measure search engine market share data. Our methodology uses HTTP’s referer header to identify the search engine sending traffic to customer sites and applications. The market share data is presented as an overall aggregate, as well as broken out by device type and operating system. (Device type and operating system data is derived from the User-Agent and Client Hints headers accompanying a content request.)
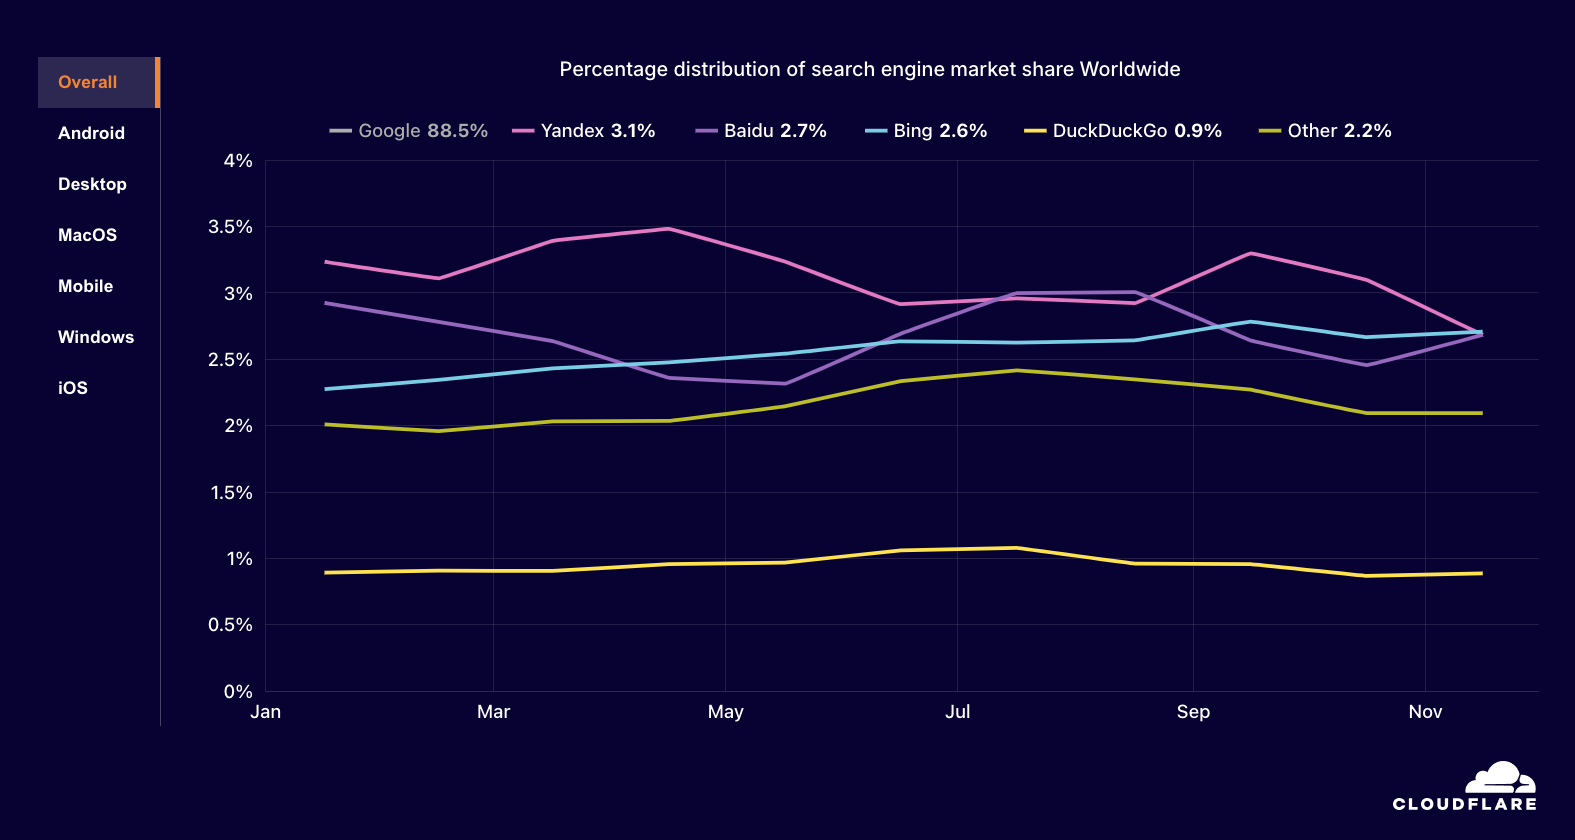
Aggregated at a global level, Google referred the most traffic to Cloudflare customers, with a greater than 88% share across 2024. Yandex, Baidu, Bing, and DuckDuckGo round out the top five, all with single digit percentage shares.
Overall worldwide search engine market share in 2024
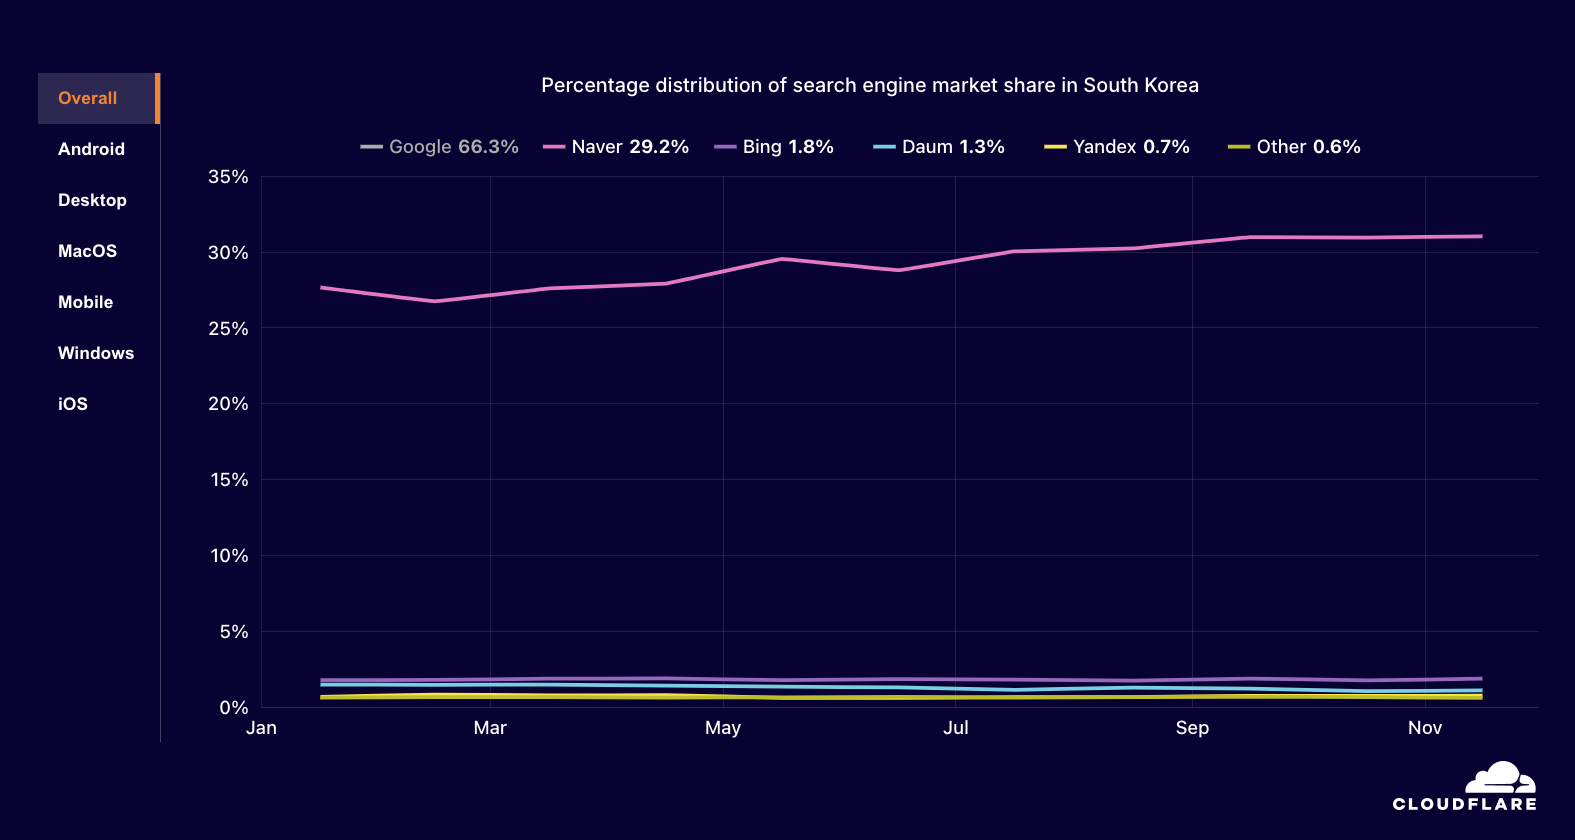
However, when drilling down by location or platform, differences are apparent in the top search engines and their shares. For example, in South Korea, Google is responsible for only two-thirds of referrals, while local platform Naver drives 29.2%, with local portal Daum also in the top five at 1.3%.
Overall search engine market share in South Korea in 2024
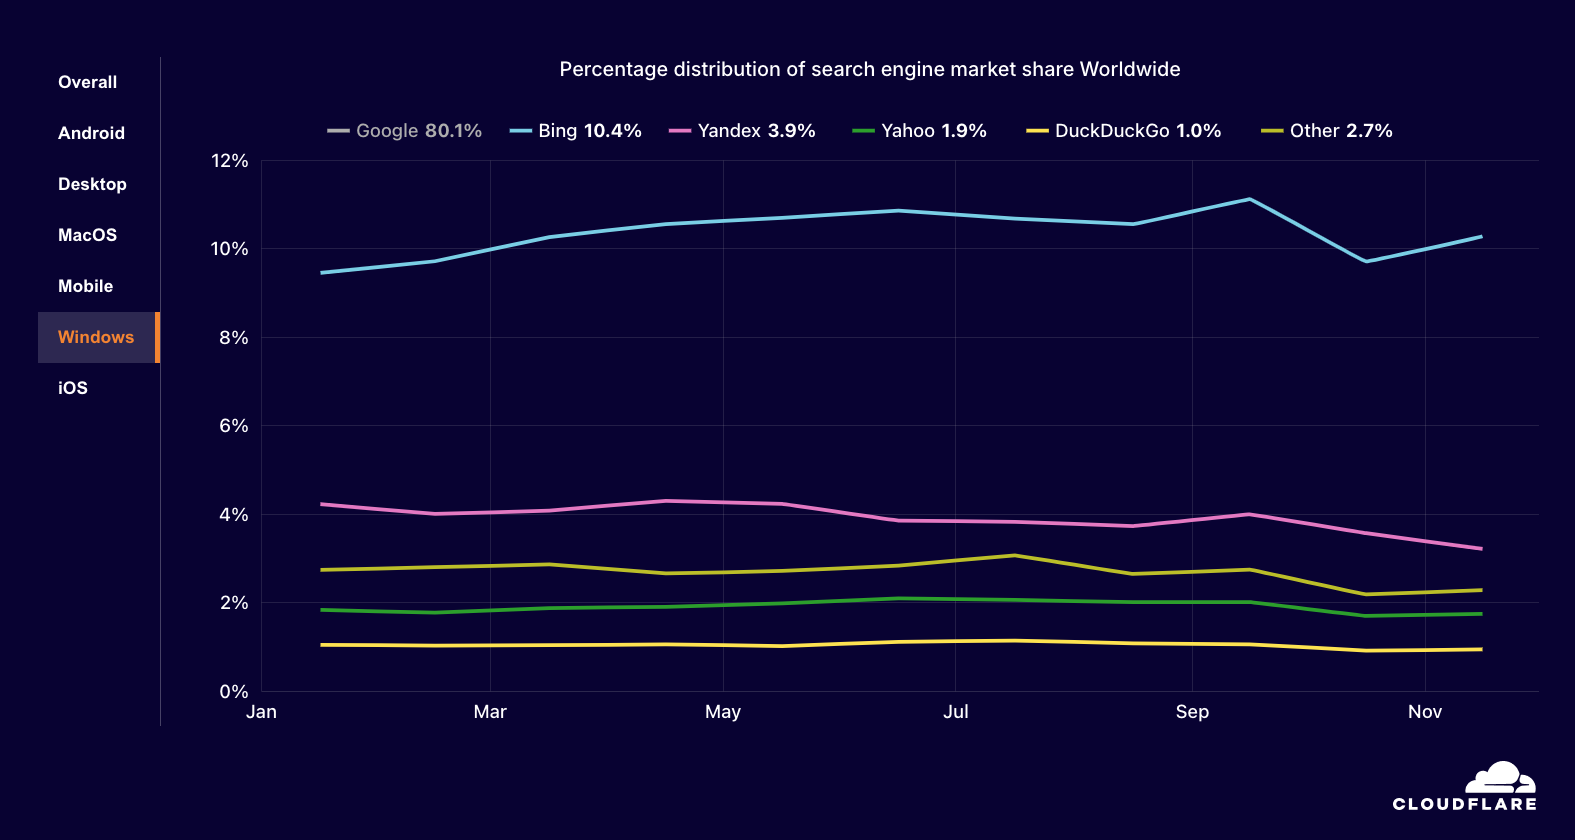
Google’s dominance is also blunted a bit on Windows devices, where it drives only 80% of referrals globally. Unsurprisingly, Bing holds the second spot for Windows users, with a 10.4% share. Yandex, Yahoo, and DuckDuckGo round out the top 5, all with shares below 5%.
Overall worldwide search engine market share for Windows devices in 2024
For additional details, including search engines aggregated under “Other”, please refer to the quarterly Search Engine Referral Reports on Cloudflare Radar.
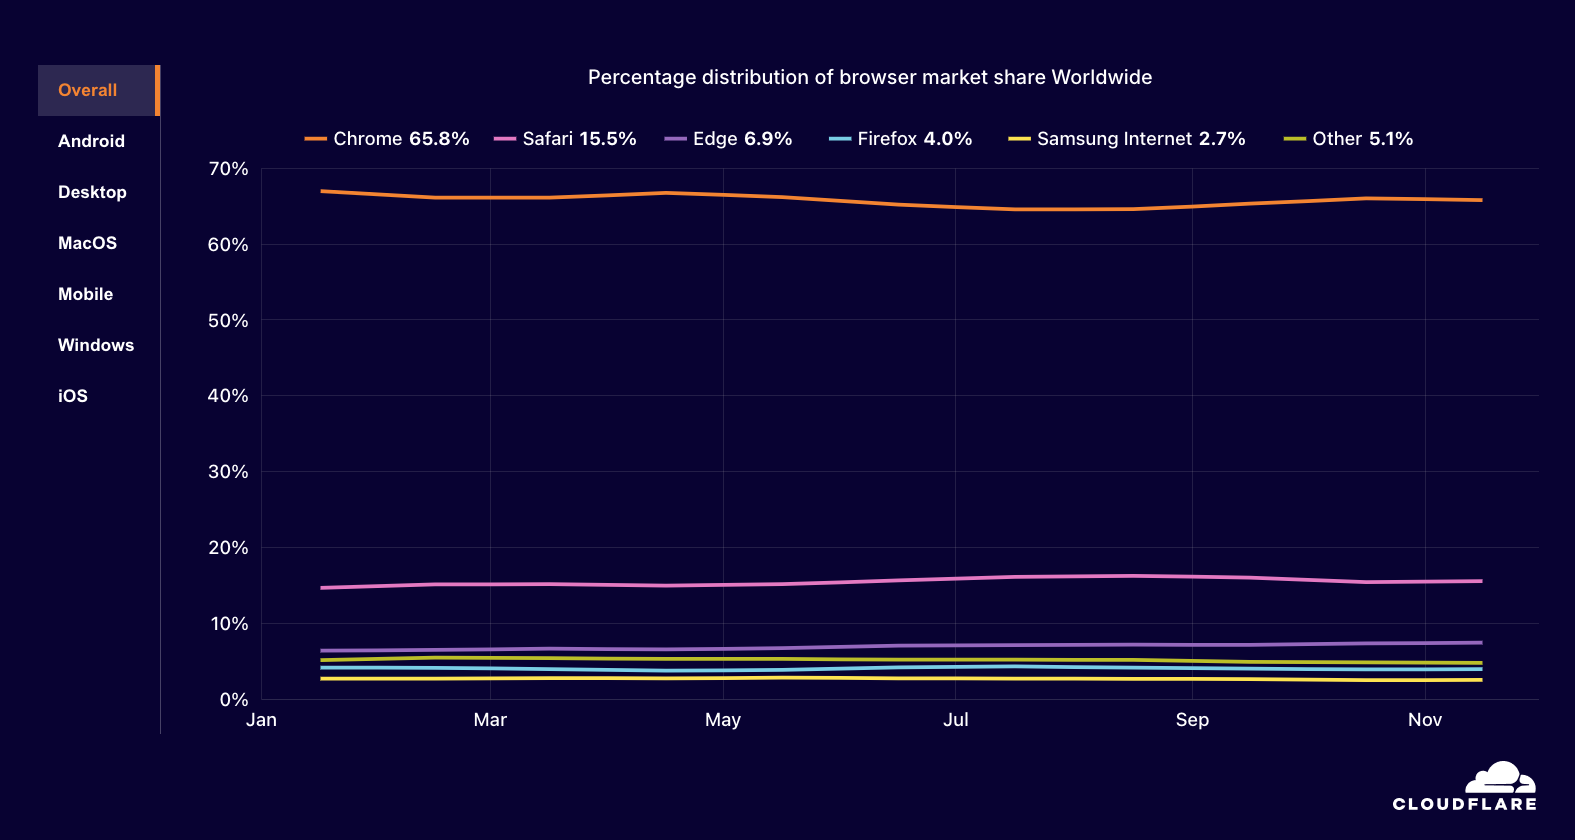
Google Chrome is the most popular browser overall. While also true on MacOS devices, Safari usage is well ahead of Chrome on iOS devices. On Windows, Edge is the second most popular browser.
Similar to our ability to measure search engine market share, Cloudflare is also in a unique position to measure browser market share. Our methodology uses information from the User-Agent and Client Hints headers to identify the browser making content requests, along with the associated operating system. Browser market share data is presented as an overall aggregate, as well as broken out by device type and operating system. Note that the shares of browsers available on both desktop and mobile devices, such as Chrome or Safari, are presented in aggregate.
Globally, we found that 65.8% of requests came from Google’s Chrome browser across 2024, and that just 15.5% came from Apple’s Safari browser. Microsoft Edge, Mozilla Firefox, and the Samsung Internet browser rounded out the top five, all with shares below 10%.
Overall worldwide web browser market share in 2024
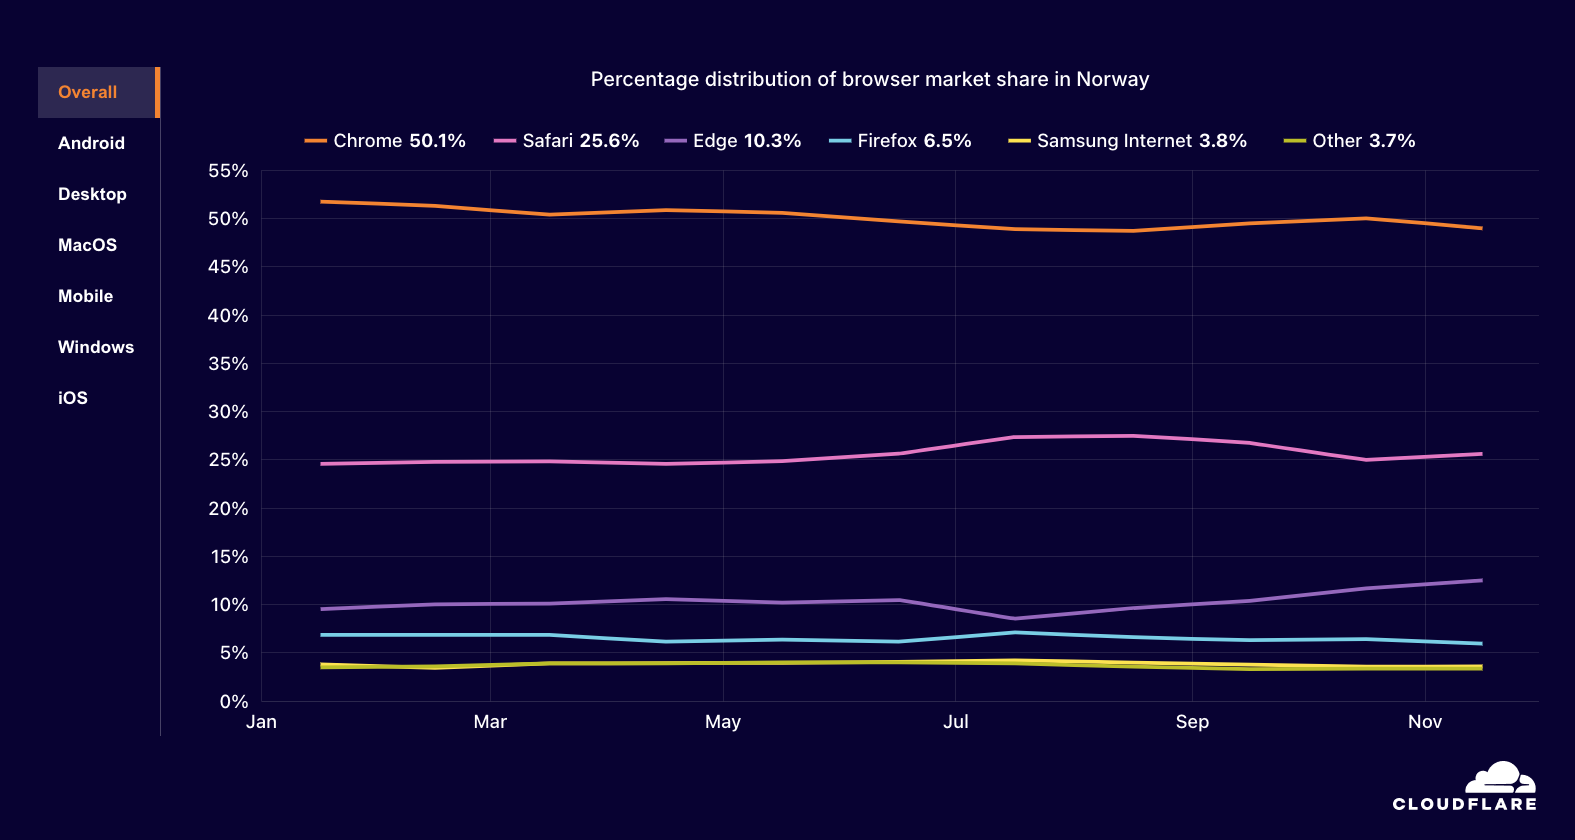
Similar to the search engine statistics discussed above, differences are clearly visible when drilling down by location or platform. In some countries where iOS holds a larger market share than Android, Chrome remains the leading browser, but by a much lower margin. For example, in Sweden, Chrome’s share fell to 56.2%, while Safari’s increased to 22.5%. In Norway, Chrome fell to just 50%, while Safari grew to 25.6%.
Overall web browser market share in Norway in 2024
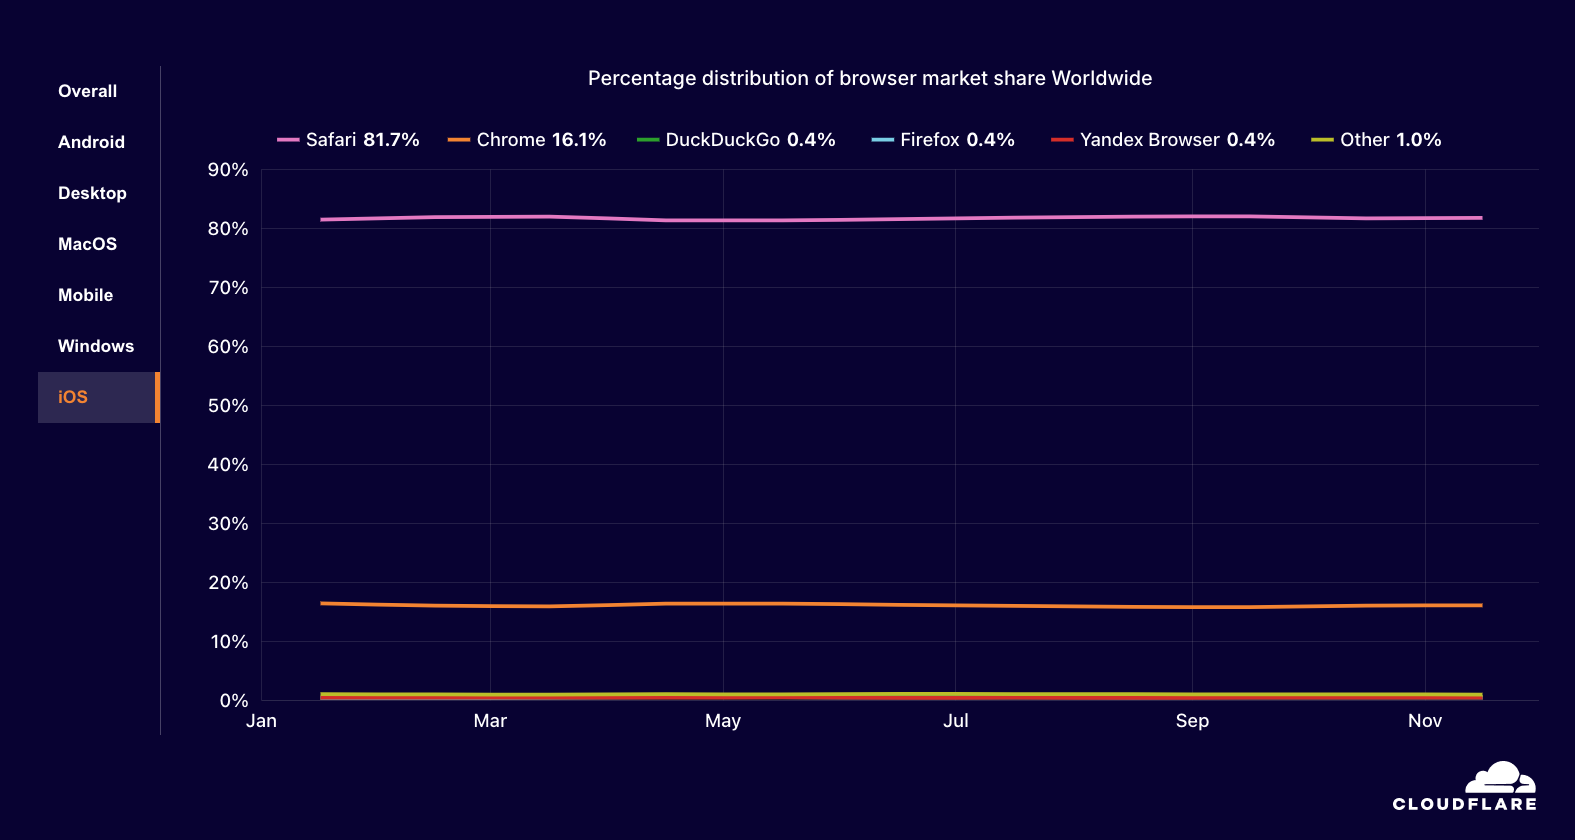
As the default browser on devices running iOS, Apple Safari was the most popular browser for iOS devices, commanding an 81.7% market share across the year, with Chrome at just 16.1%. And despite being the preinstalled default browser on Windows devices, Edge held just a 17.3% share, in comparison to Chrome’s 68.5%
Overall worldwide web browser market share for iOS devices in 2024
For additional details, including browsers aggregated under “Other”, please refer to the quarterly Browser Market Share Reports on Cloudflare Radar.
Connectivity
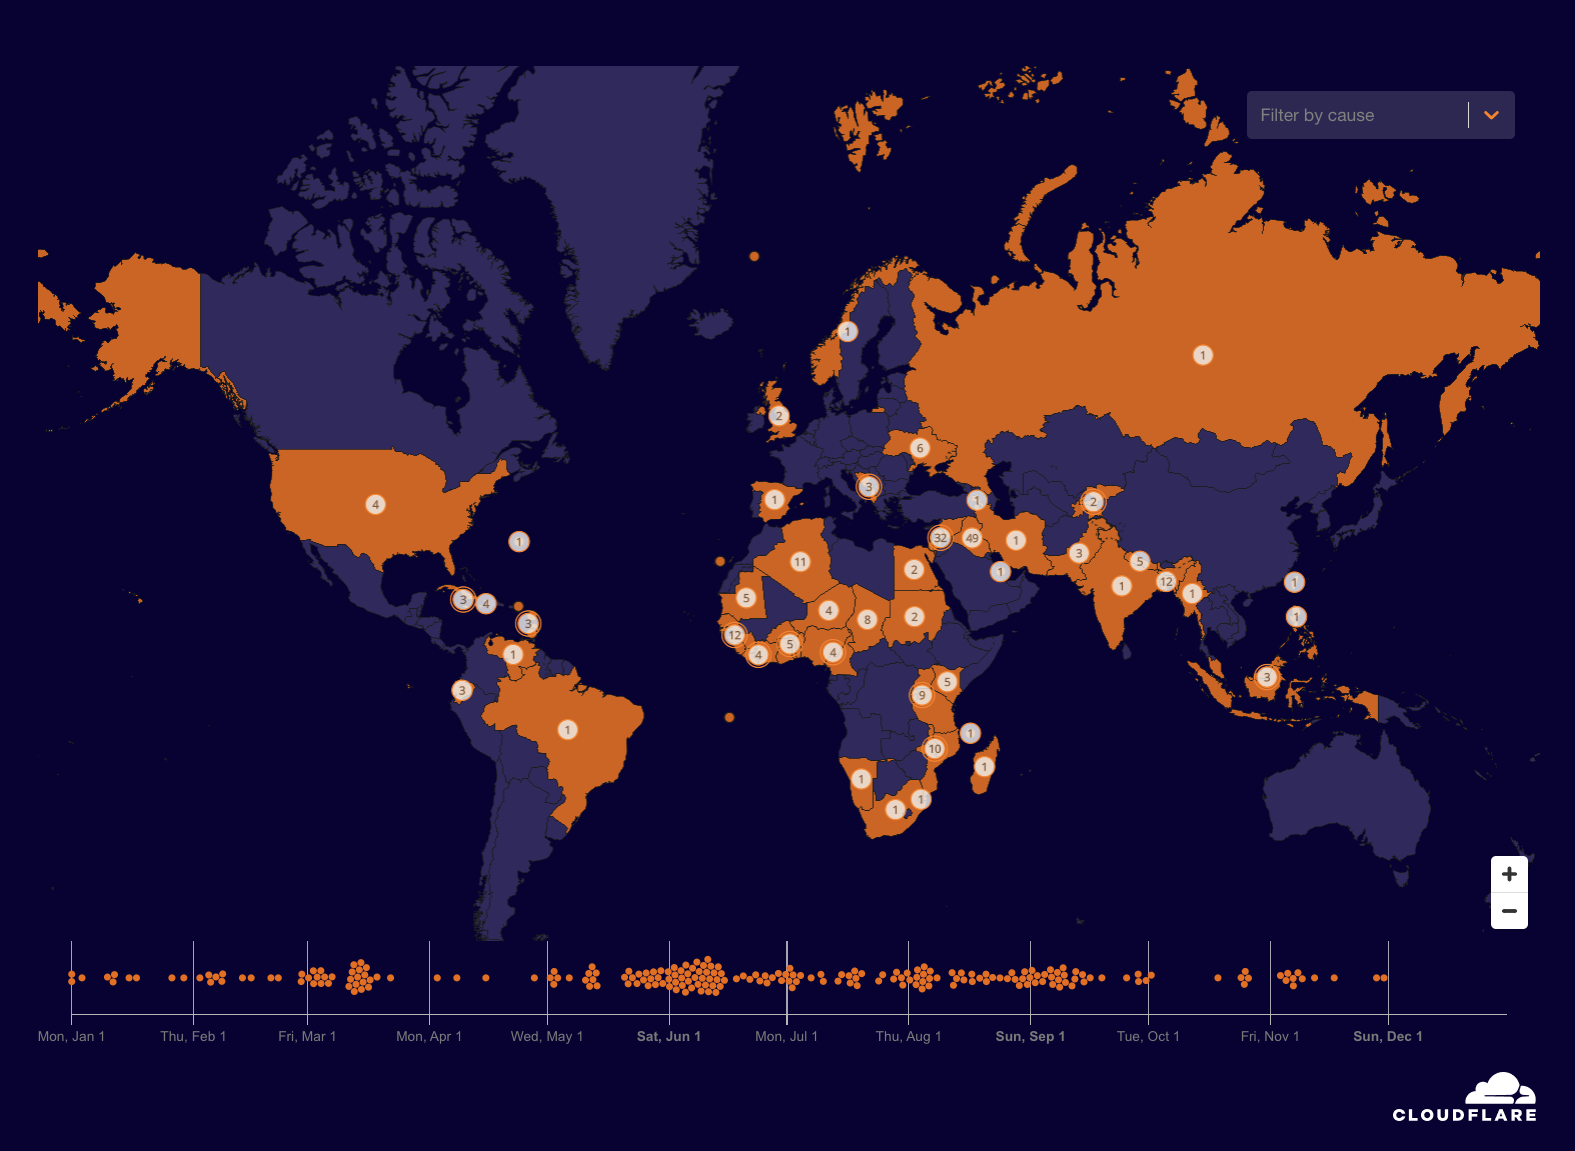
225 major Internet outages were observed around the world in 2024, with many due to government-directed regional and national shutdowns of Internet connectivity.
Throughout 2024, as we have over the last several years, we have written frequently about observed Internet outages, whether due to cable cuts, unspecified technical issues, government-directed shutdowns, or a number of other reasons covered in our quarterly summary posts (Q1, Q2, Q3). The impacts of these outages can be significant, including significant economic losses and severely limited communications. The Cloudflare Radar Outage Center tracks these Internet outages, and uses Cloudflare traffic data for insights into their scope and duration.
Some of the outages seen through the year were short-lived, lasting just a few hours, while others stretched on for days or weeks. In the latter category, an Internet outage in Haiti dragged on for eight days in September because repair crews were barred from accessing a damaged submarine cable due to a business dispute, while shutdowns of mobile and fixed Internet providers in Bangladesh lasted for approximately 10 days in July. In the former category, Iraq frequently experienced multi-hour nationwide Internet shutdowns intended to prevent cheating on academic exams — these contribute to the clustering visible in the timeline during June, July, August, and September.
Within the timeline on the Year in Review microsite, hovering over a dot will display metadata about that outage, and clicking on it will open a page with additional information. Below the map and timeline, we have added a bar graph illustrating the recorded reasons associated with the observed outages. In 2024, over half were due to government-directed shutdowns. If a country/region is selected, only outages and reasons for that country/region will be displayed.
Over 200 Internet outages were observed around the world during 2024
Aggregated across 2024, 28.5% of IPv6-capable requests were made over IPv6. India and Malaysia were the strongest countries, at 68.9% and 59.6% IPv6 adoption respectively.
The IPv4 protocol still used by many Internet-connected devices was developed in the 1970s, and was never meant to handle the vast and growing scale of the modern Internet. An initial specification for its successor, IPv6, was published in December 1995, evolving to a draft standard three years later, offering an expanded address space intended to better support the expected growth in the number of Internet-connected devices. At this point, available IPv4 space has long since been exhausted, and connectivity providers use solutions like Network Address Translation to stretch limited IPv4 resources. Hungry for IPv4 address space as their businesses and infrastructure grow, cloud and hosting providers are acquiring blocks of IPv4 address space for as much as \$30 – \$50 per address.
Cloudflare has been a vocal and active advocate for IPv6 since 2011, when we announced our Automatic IPv6 Gateway, which enabled free IPv6 support for all of our customers. In 2014, we enabled IPv6 support by default for all of our customers, but not all customers choose to keep it enabled for a variety of reasons. Note that server-side support is only half of the equation for driving IPv6 adoption, as end user connections need to support it as well. (In reality, it is a bit more complex than that, but server and client side support across applications, operating systems, and network environments are the two primary requirements. From a network perspective, implementing IPv6 also brings a number of other benefits.) By analyzing the IP version used for each request made to Cloudflare, aggregated throughout the year, we can get insight into the distribution of traffic by the various versions of the protocol.
At a global level, 28.5% of IPv6-capable (“dual-stack”) requests were made over IPv6, up from 26.4% in 2023. India was again the country with the highest level of IPv6 adoption, at 68.9%, carried in large part by 94% IPv6 adoption at Reliance Jio, one of the country’s largest Internet service providers. India was followed closely by Malaysia, where 59.6% of dual-stacked requests were made over IPv6 during 2024, thanks to strong IPv6 adoption rates across leading Internet providers within the country. IPv6 adoption in India was up from 66% in 2023, and in Malaysia, it was up from 57.3% last year. Saudi Arabia was the only other country with an IPv6 adoption rate above 50% this year, at 51.8%, whereas that list also included Vietnam, Greece, France, Uruguay, and Thailand in 2023. Thirty four countries/regions, including many in Africa, still have IPv6 adoption rates below 1%, while a total of 96 countries/regions have adoption rates below 10%.
Global distribution of traffic by IP version in 2024
Countries/regions with the largest shares of IPv6 traffic in 2024
The top 10 countries ranked by Internet speed all had average download speeds above 200 Mbps. Spain was consistently among the top locations across measured Internet quality metrics.
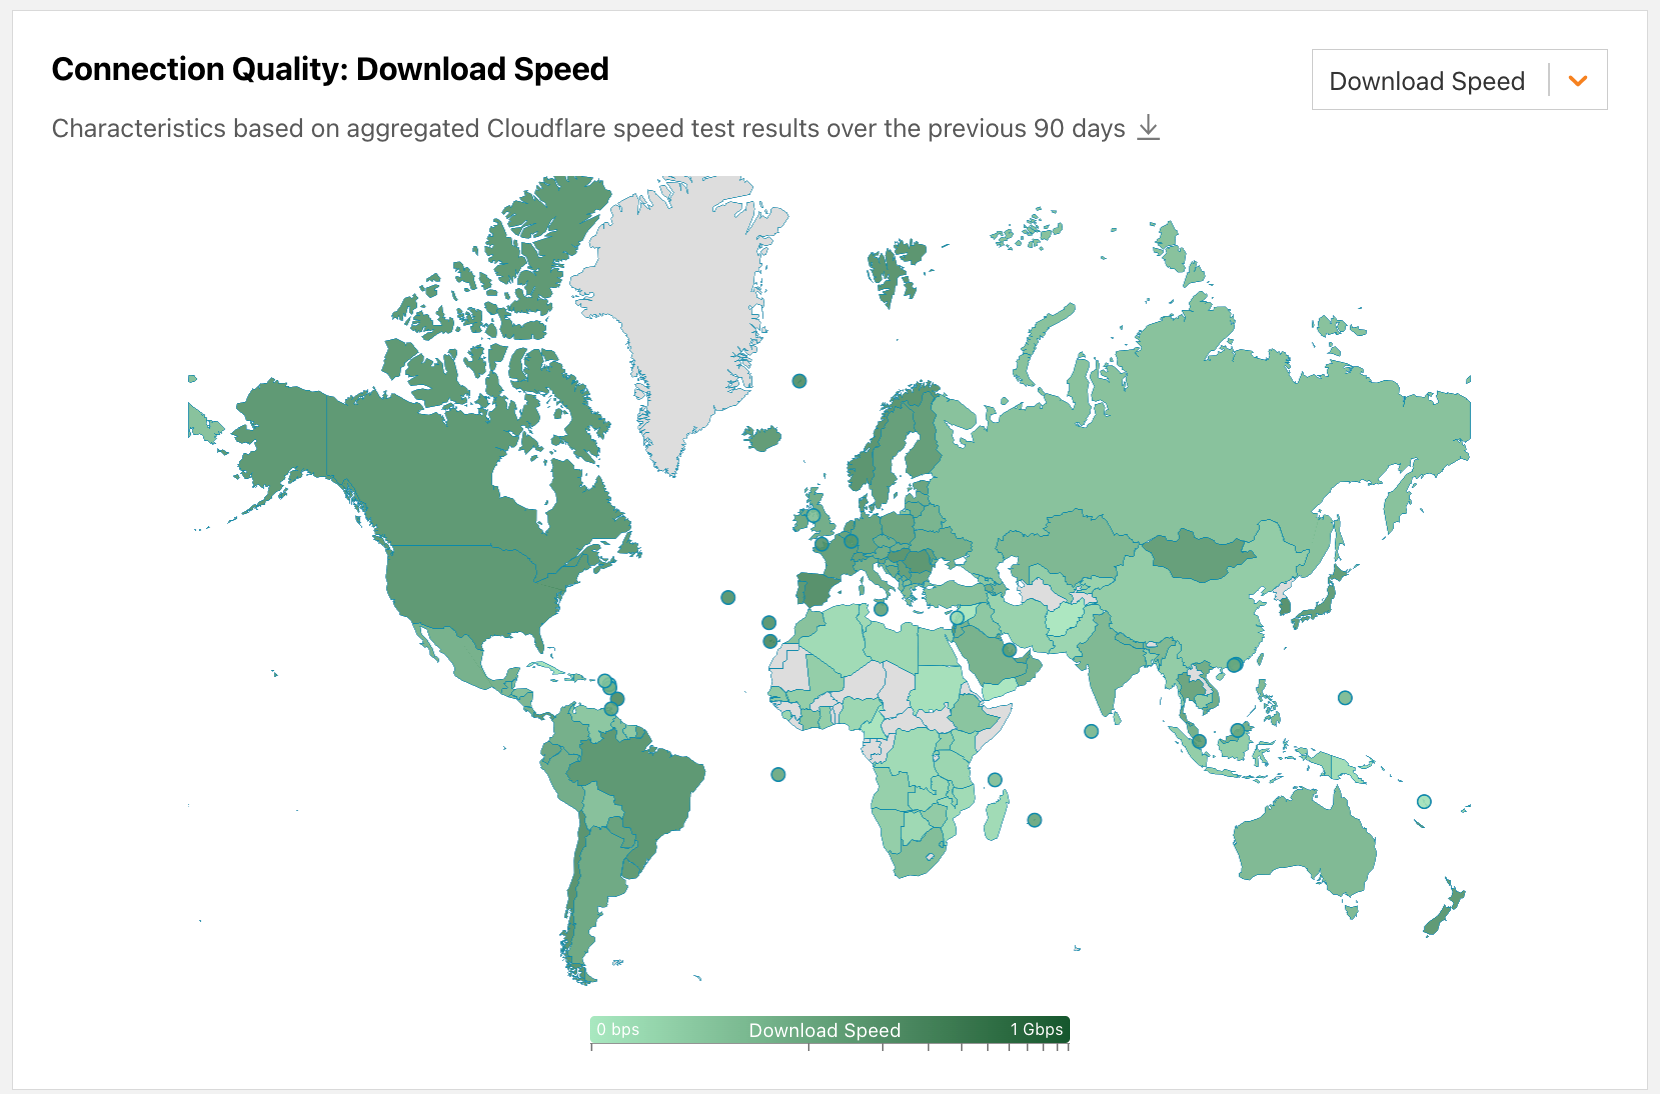
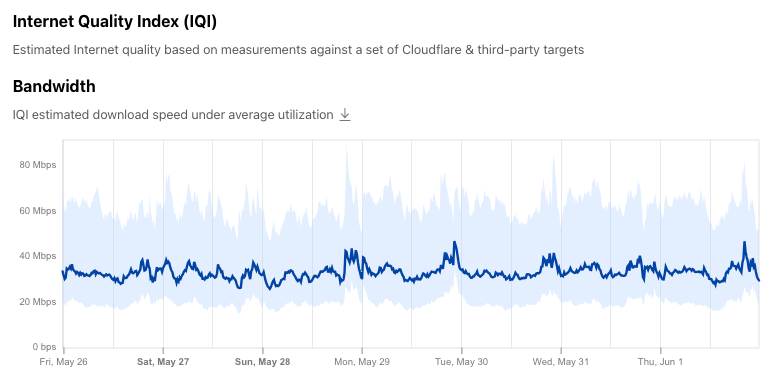
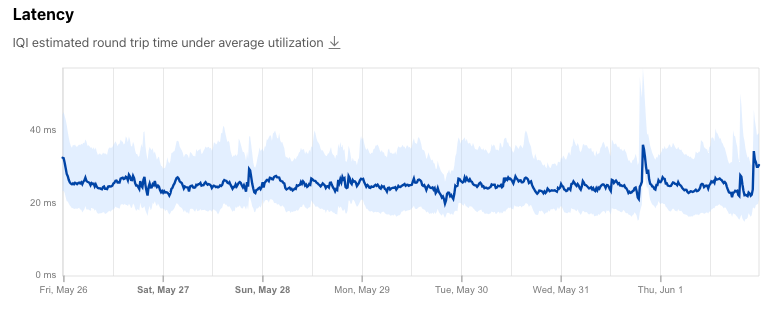
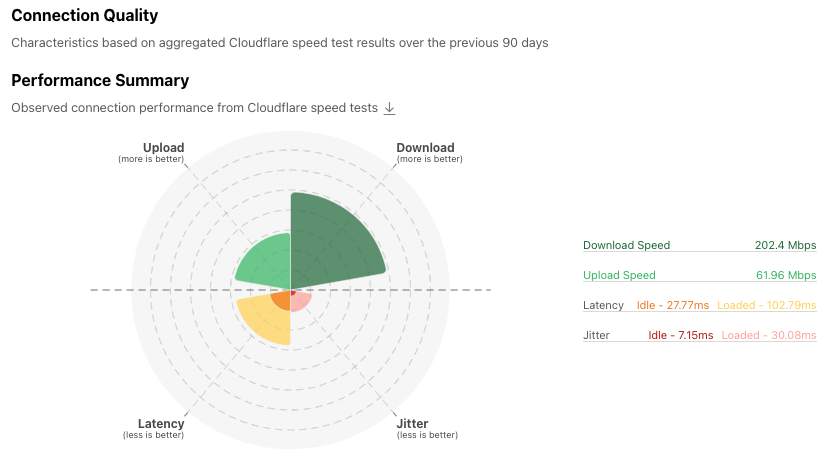
As more and more of our everyday lives move online, including entertainment, work, education, finance, shopping, and even basic social and personal interaction, the quality of our Internet connections is arguably more important than ever, necessitating higher connection speeds and lower latency. Although Internet providers continue to evolve their service portfolios to offer increased connection speeds and reduced latency in order to support growth in use cases like videoconferencing, live streaming, and online gaming, consumer adoption is often mixed due to cost, availability, or other issues. By aggregating the results of speed.cloudflare.com tests taken during 2024, we can get a geographic perspective on connection quality metrics including average download and upload speeds, and average idle and loaded latencies, as well as the distribution of the measurements.
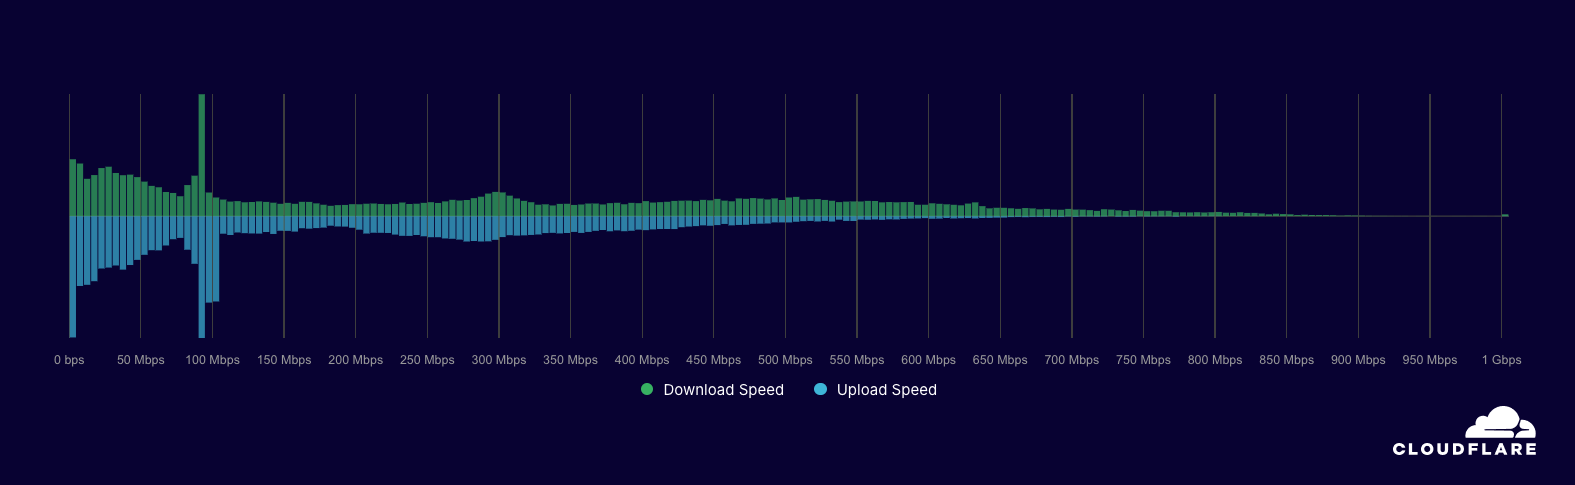
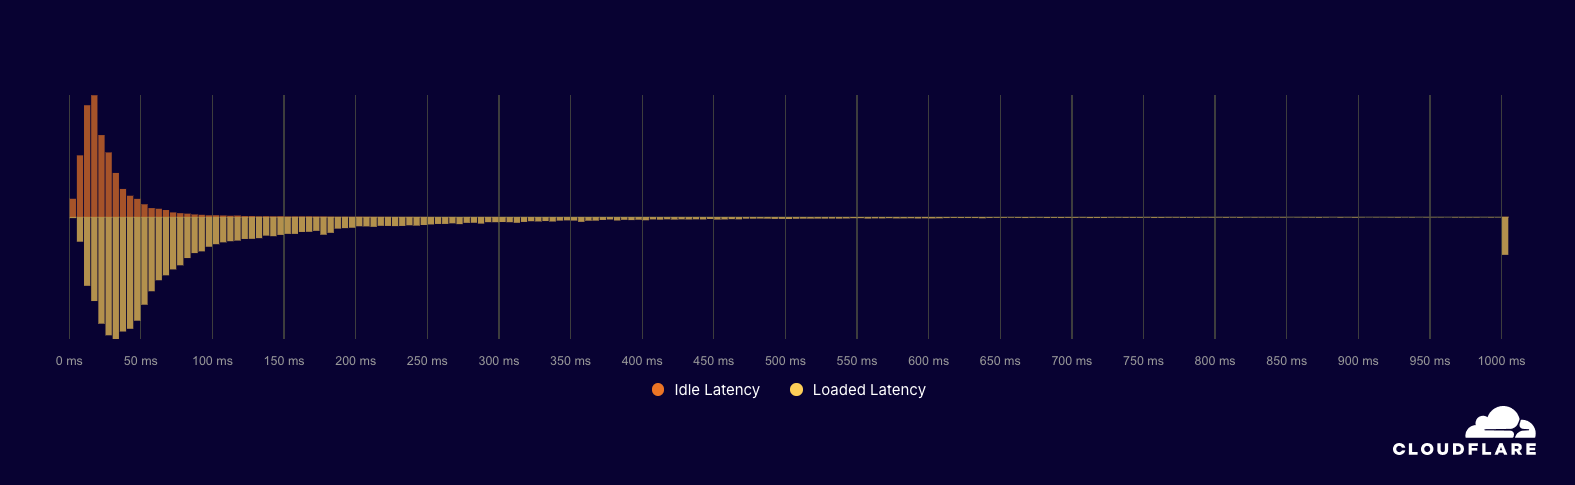
In 2024, Spain was a leader in download speed (292.6 Mbps) and upload speed (192.6 Mbps) metrics, and placed second globally for loaded latency (78.6 ms). (Loaded latency is the round-trip time when data-heavy applications are being used on the network.) Spain’s leadership in these connection quality metrics is supported by the strong progress that the country has made towards achieving the EU’s “Digital Decade” objectives, including fixed very high capacity network (VHCN) deployment, fiber-to-the-premises (FTTP) coverage, and 5G coverage with the latter two reaching 95.2% and 92.3% respectively. High speed fiber broadband connections are also relatively affordable, with research showing major providers offering 100 Mbps, 300 Mbps, 600 Mbps, and 1 Gbps packages, with the latter priced between €30 and €46 per month. The figures below for Spain show the largest clusters of speed measurements around the 100 Mbps mark, with slight bumps also visible around 300 Mbps, suggesting that the former package has the highest subscription rate, followed by the latter. Further, they show these connections are also relatively low latency, with 87% of idle latency measurements below 50 ms and 65% of loaded latency measurements below 100 ms, providing users with good gaming and videoconferencing/streaming experiences.
Measured download/upload speed distribution in Spain in 2024
Measured idle/loaded latency distribution in Spain in 2024
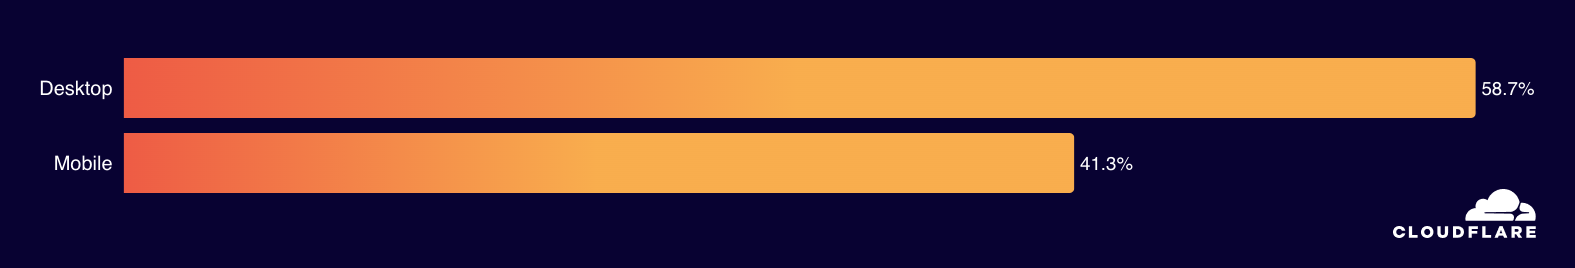
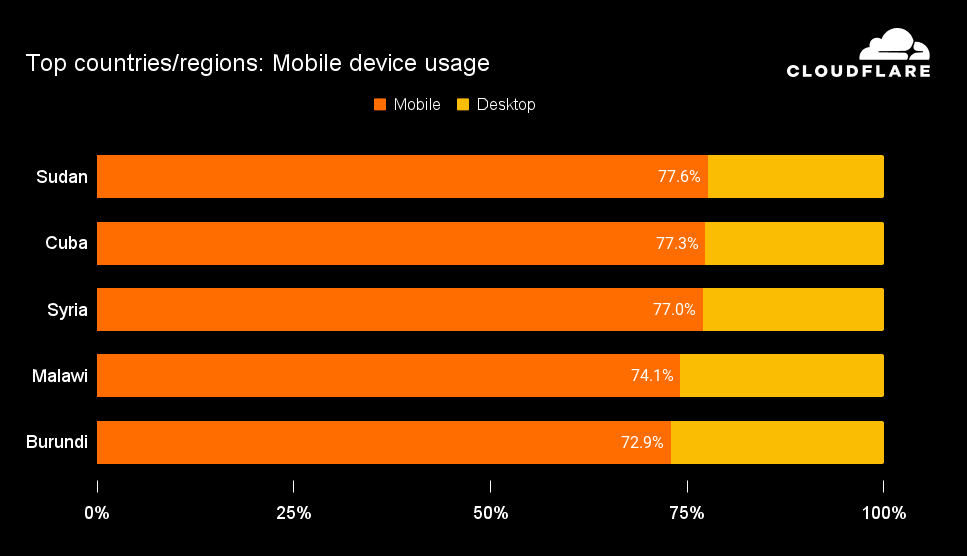
41.3% of global traffic comes from mobile devices. In nearly 100 countries/regions, the majority of traffic comes from mobile devices.
With approximately 70% of the world’s population using smartphones, and 91% of Americans owning a smartphone, these mobile devices have become an integral part of both our personal and professional lives, providing us with Internet access from nearly any place at any time. In some countries/regions, mobile devices primarily connect to the Internet via Wi-Fi, while other countries/regions are “mobile first”, where 4G/5G services are the primary means of Internet access.
Analysis of information contained with the user agent reported with each request to Cloudflare enables us to categorize it as coming from a mobile, desktop, or other type of device. Aggregating this categorization throughout the year at a global level, we found that 41.3% of traffic came from mobile devices, with 58.7% coming from desktop devices such as laptops and “classic” PCs. These traffic shares were in line with those measured in both 2023 and 2022, suggesting that mobile device usage has achieved a “steady state”. Over 77% of traffic came from mobile devices in Sudan, Cuba, and Syria, making them the countries/regions with the largest mobile device traffic share in 2024. Other countries/regions that had more than 50% of traffic come from mobile devices were concentrated in the Middle East/Africa, the Asia Pacific region, and South/Central America.
Global distribution of traffic by device type in 2024
Countries/regions with the largest shares of mobile device usage in 2024
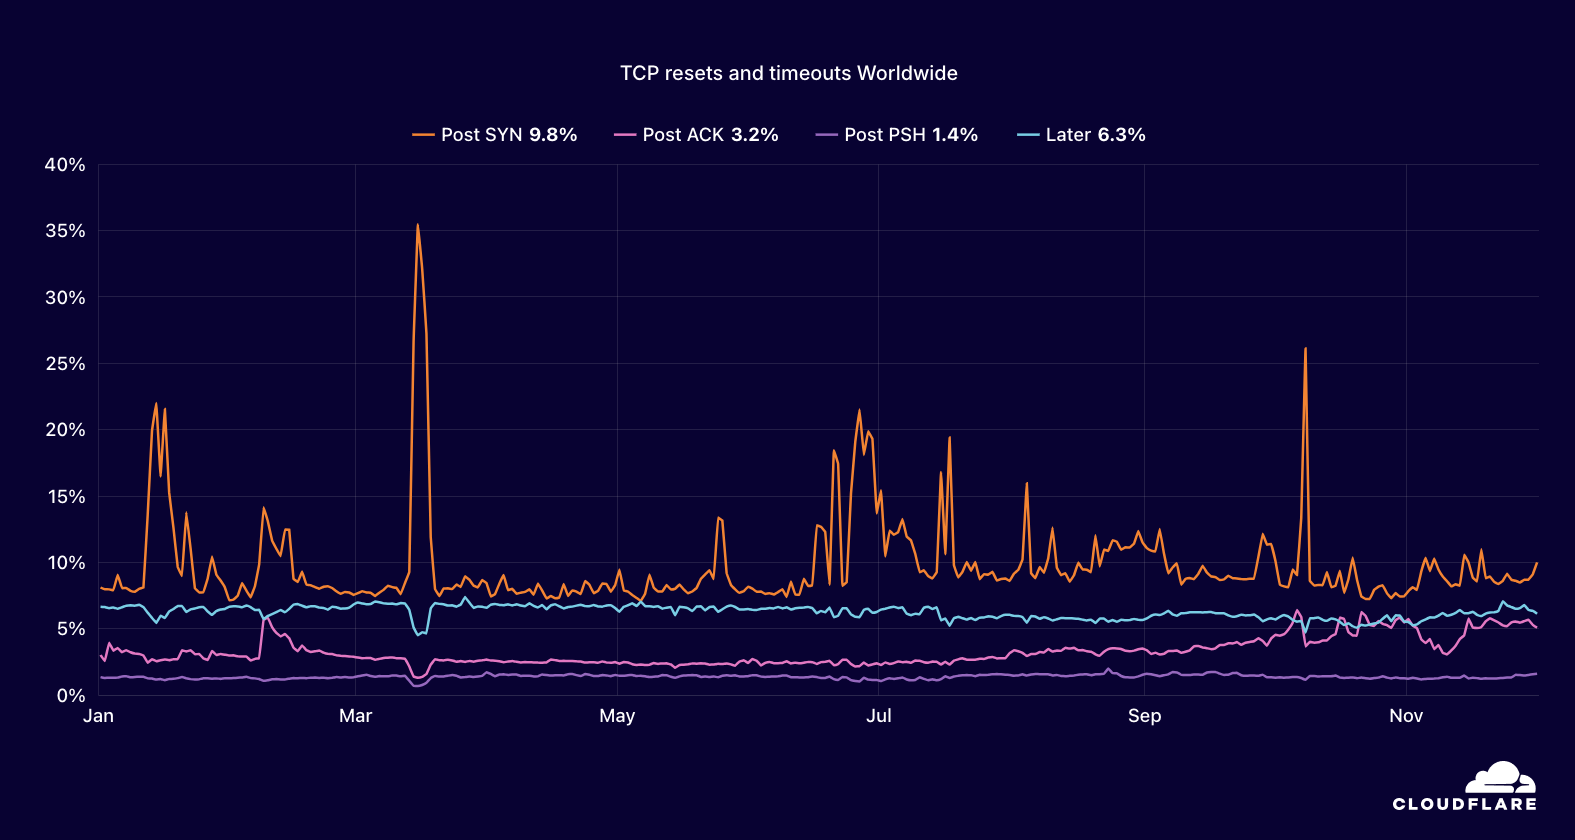
20.7% of TCP connections are unexpectedly terminated before any useful data can be exchanged.
Cloudflare is in a unique position to help measure the health and behaviors of Internet networks around the world. One way we do this is passively measuring rates of connections to Cloudflare that appear anomalous, meaning that they are unexpectedly terminated before any useful data exchange occurs. The underlying causes of connection anomalies are varied and range from DoS attacks to quirky client behavior to third-party connection tampering (e.g., when a network monitors and selectively disrupts connections to filter content).
Connection anomalies are symptoms — visible signs that “something abnormal” is happening in a network, but the underlying root cause is not always clear from the outset. However, we can gain a better understanding by incorporating previously-reported network behaviors, active measurements and on-the-ground reports, and macro trends across networks. Additional details on such analysis can be found in the blog posts A global assessment of third-party connection tampering andBringing insights into TCP resets and timeouts to Cloudflare Radar.
Insights into TCP connection anomalies were launched on Cloudflare Radar in September, with the plot lines in the associated graph corresponding to the stage of the TCP connection in which the connection anomalously closed (using shorthand, the first three messages we typically receive from the client in a TCP connection are “SYN” and “ACK” packets to establish a connection, and then a “PSH” packet indicating the requested resource). In aggregate globally, over 20% of connections to Cloudflare were terminated unexpectedly, with the largest share (nearly half) being closed “Post SYN” — that is, after our server has received a client’s SYN packet, but before we have received a subsequent acknowledgement (ACK) from the client or any useful data that would follow the acknowledgement. These terminations can often be attributed to DoS attacks or Internet scanning. Post-ACK (3.1% globally) and Post-PSH (1.4% globally) anomalies are more often associated with connection tampering, especially when they occur at high rates in specific networks.
Trends in TCP connection anomalies by stage in 2024
Security
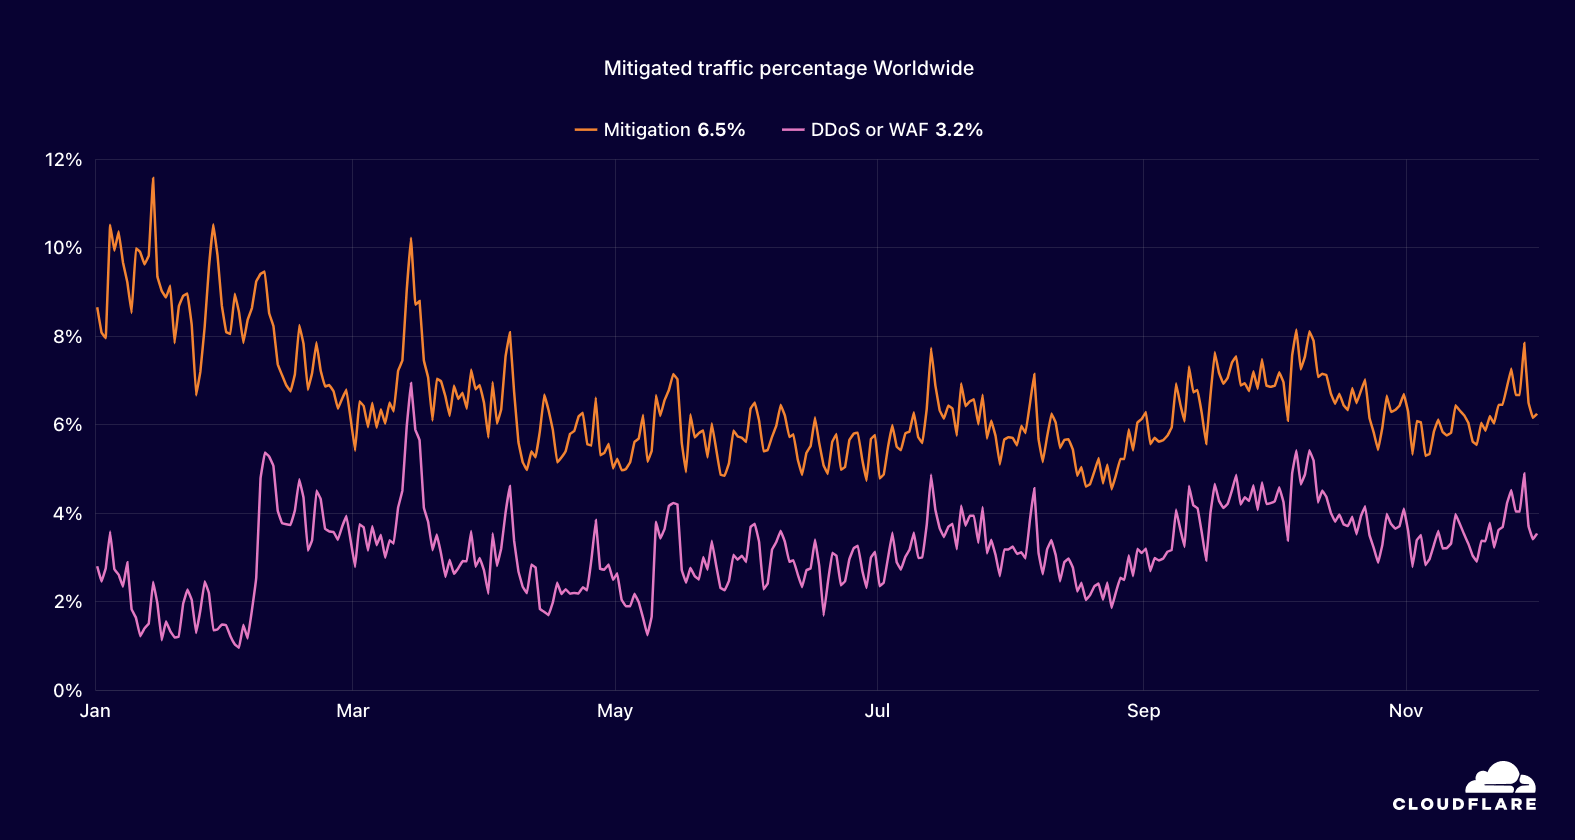
6.5% of global traffic was mitigated by Cloudflare’s systems as being potentially malicious or for customer-defined reasons.
To protect customers from threats posed by malicious bots used to attack websites and applications, Cloudflare mitigates this attack traffic using DDoS mitigation techniques or Web Application Firewall (WAF) Managed Rules. For a variety of other reasons, customers may also want Cloudflare to mitigate traffic using techniques like rate-limiting requests, or blocking all traffic from a given location, even if it isn’t malicious. Analyzing traffic to Cloudflare’s network throughout 2024, we looked at the overall share that was mitigated for any reason, as well as the share that was blocked as a DDoS attack or by WAF Managed Rules.
In 2024, 6.5% of global traffic was mitigated, up almost one percentage point from 2023. Just 3.2% was mitigated as a DDoS attack, or by WAF Managed Rules, a rate slightly higher than in 2023. More than 10% of the traffic originating from 44 countries/regions had mitigations generally applied, while DDoS/WAF mitigations were applied to more than 10% of the traffic originating from just seven countries/regions.
At a country/region level, Albania had one of the highest mitigated traffic shares throughout the year, at 42.9%, while Libya had one of the highest shares of traffic that was mitigated as a DDoS attack or by WAF Managed Rules, at 19.2%. In 2023’s Year in Review blog post, we highlighted the United States and Korea. This year, the share of mitigated traffic grew to 5.0% in the United States (up from 3.65% in 2023), while in South Korea, it dropped slightly to 8.1%, down from 8.36%.
Trends in mitigated traffic worldwide in 2024
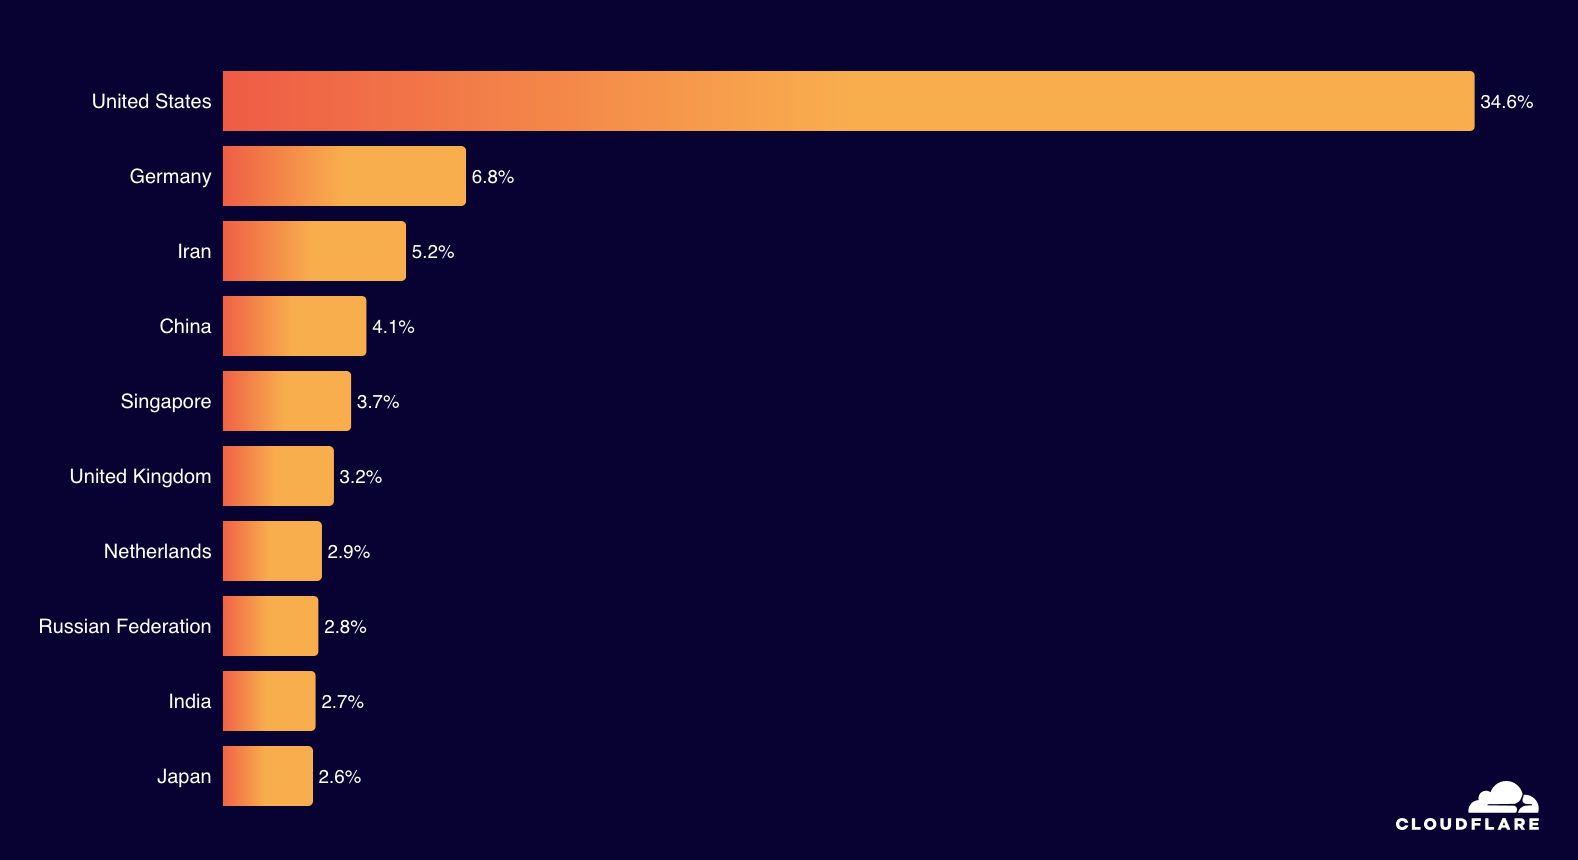
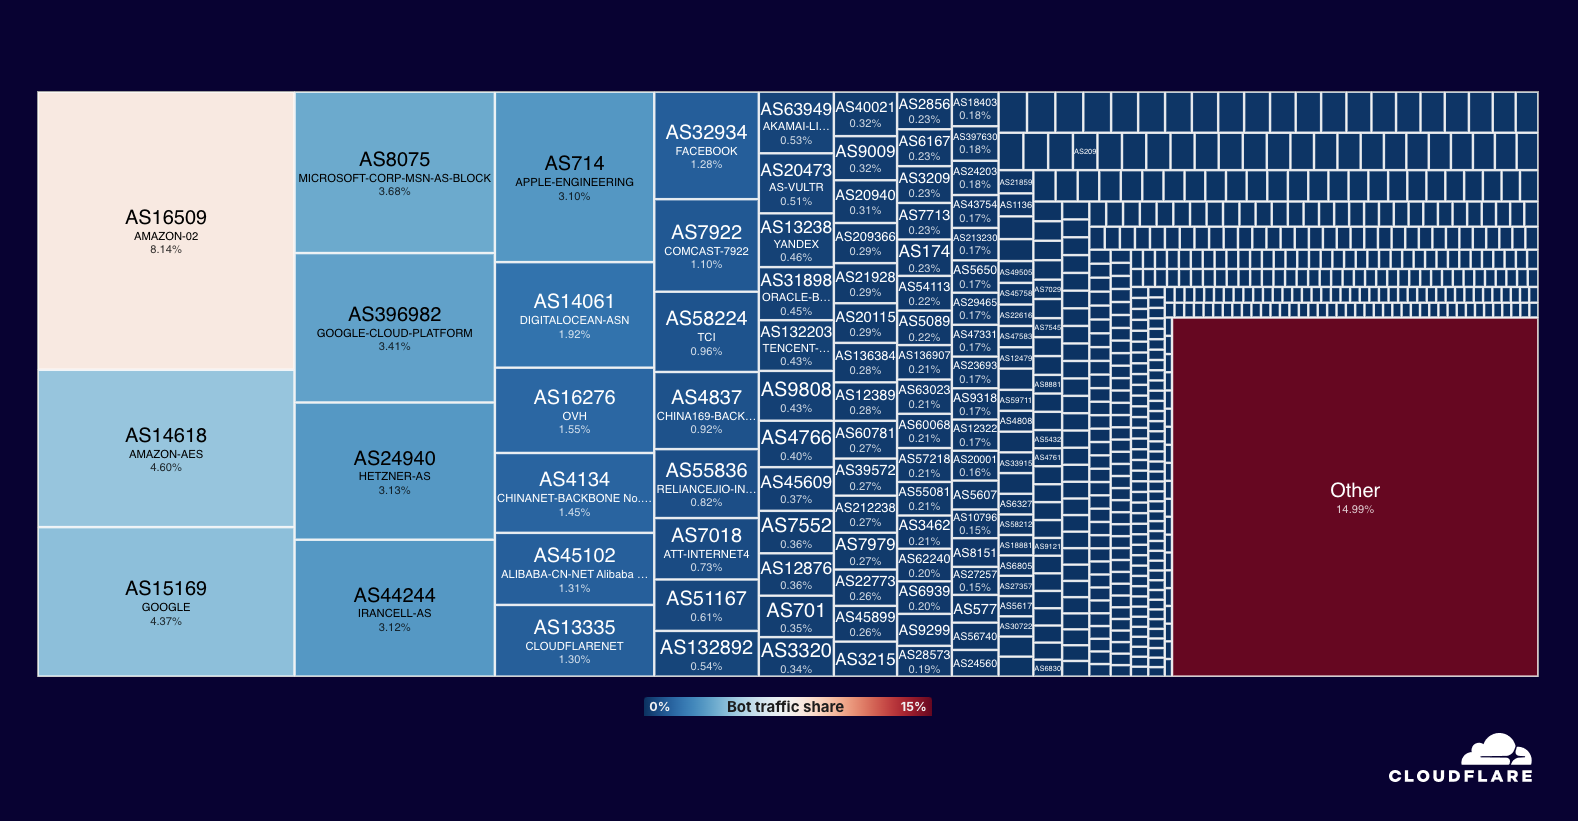
The United States was responsible for over a third of global bot traffic. Amazon Web Services was responsible for 12.7% of global bot traffic, and 7.8% came from Google.
Bot traffic describes any non-human Internet traffic, and by monitoring traffic suspected to be from bots site and application owners can spot and, if necessary, block potentially malicious activity. However, not all bots are malicious — bots can also be helpful, and Cloudflare maintains a list of verified bots that includes those used for things like search engine indexing, performance testing, and availability monitoring. Regardless of intent, we analyzed where bot traffic was originating from in 2024, using the IP address of a request to identify the network (autonomous system) and country/region associated with the bot making the request. Cloud platforms remained among the leading sources of bot traffic due to a number of factors. These include the ease of using automated tools to quickly provision compute resources, the relatively low cost of using these compute resources in an ephemeral manner, the broadly distributed geographic footprint of cloud platforms, and the platforms’ high-bandwidth Internet connectivity.
Globally, we found that 68.5% of observed bot traffic came from the top 10 countries in 2024, with the United States responsible for half of that total, over 5x the share of second place Germany. (In comparison to 2023, the US share was up slightly, while Germany’s was down slightly.) Among cloud platforms that originate bot traffic, Amazon Web Services was responsible for 12.7% of global bot traffic, and 7.8% came from Google. Microsoft, Hetzner, Digital Ocean, and OVH all also contributed more than a percent each.
Global bot traffic distribution by source country in 2024
Global bot traffic distribution by source network in 2024
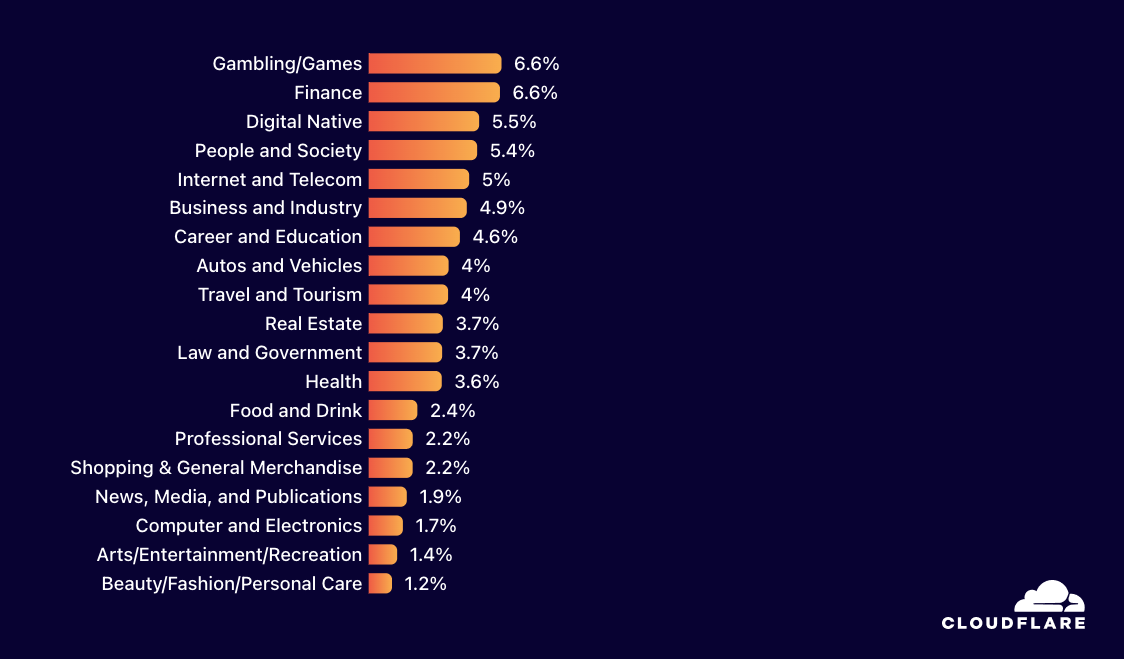
Globally, Gambling/Games was the most attacked industry, slightly ahead of 2023’s most targeted industry, Finance.
The industries targeted by attacks often shift over time, depending on the intent of the attackers. They may be trying to cause financial harm by attacking ecommerce sites during a busy shopping period, gain an advantage against opponents by attacking an online game, or make a political statement by attacking government-related sites. To identify industry-targeted attack activity during 2024, we analyzed mitigated traffic for customers that had an associated industry and vertical within their customer record. Mitigated traffic was aggregated weekly by source country/region across 19 target industries.
Companies in the Gambling/Games industry were, in aggregate, the most attacked during 2024, with 6.6% of global mitigated traffic targeting the industry. The industry was slightly ahead of Finance, which led 2023’s aggregate list. (Both industries are shown at 6.6% in the Summary view due to rounding.) Gambling/Games sites saw the largest shares of mitigated traffic in January and the first week of February, possibly related to National Football League playoffs in the United States, heading into the Super Bowl.
Attacks targeting Finance organizations were most active in May, reaching a peak of 15.3% of mitigated traffic the week of May 13. This is in line with the figure in our DDoS threat report for Q2 2024 that shows that Financial Services was the most attacked industry by request volume during the quarter in South America and the Middle East region.
As we have seen in the past, peak attack activity varied by industry on a weekly basis. The highest peaks for the year were seen in attacks targeting People & Society organizations (19.6% of mitigated traffic, week of January 1), the Autos & Vehicles industry (29.7% of mitigated traffic, week of January 15), and the Real Estate industry (27.5% of mitigated traffic, week of August 26).
Global mitigated traffic share by industry in 2024, summary view
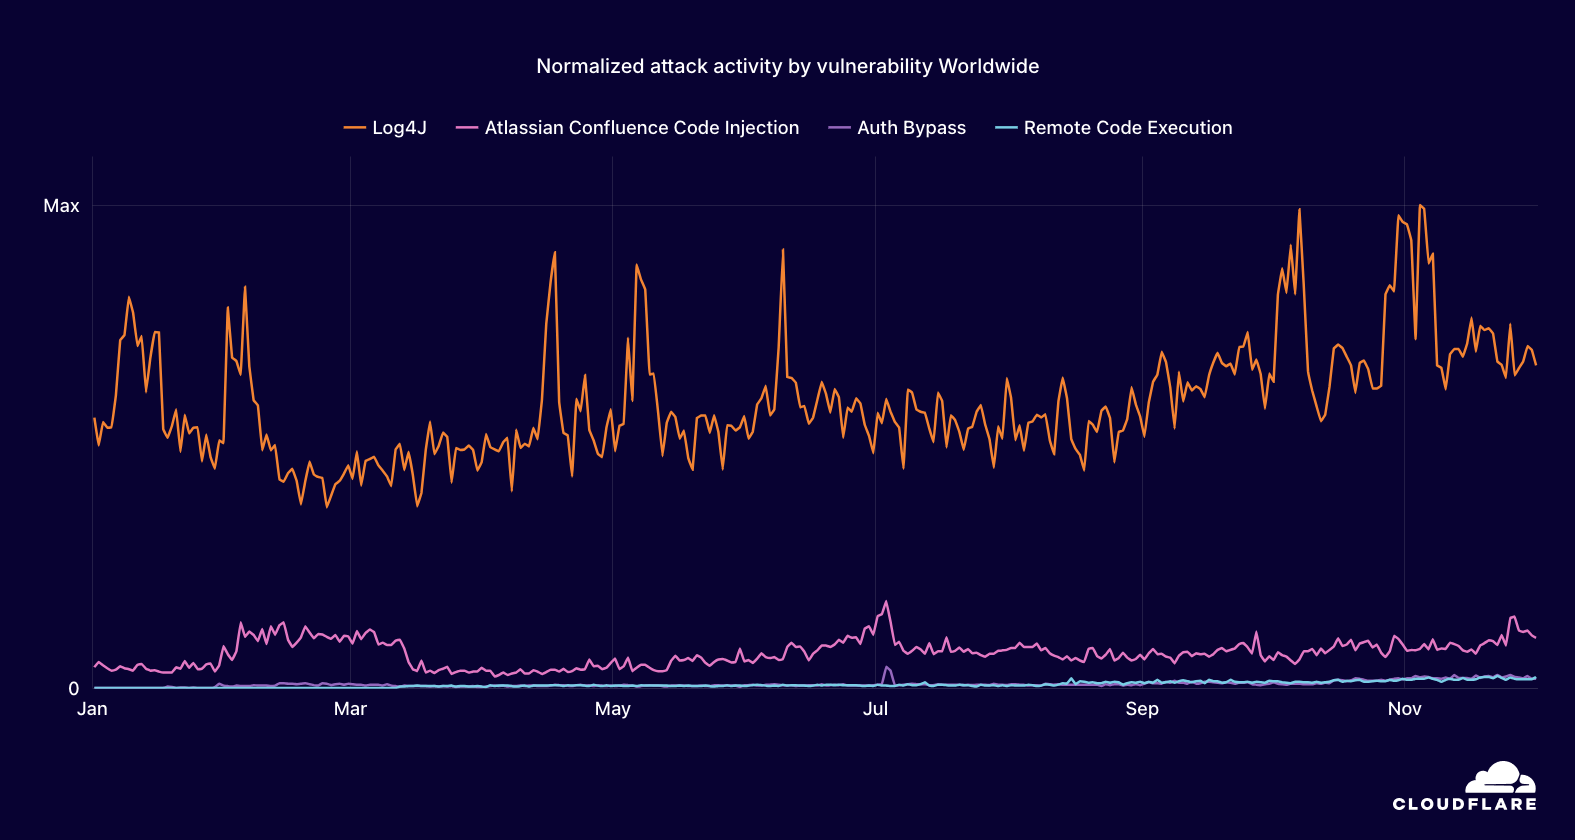
Log4j remains a persistent threat and was actively targeted throughout 2024.
In December 2021, we published a series of blog posts about the Log4j vulnerability, highlighting the threat that it posed, our observations of attempted exploitation, and the steps we took to protect customers. Two years on, in our 2023 Year in Review, we noted that even as an older vulnerability, Log4j remained a top target for attacks during 2023, with related attack activity significantly higher than other commonly exploited vulnerabilities.
In 2024, three years after the initial Log4j disclosure, we found that Log4j remains an active threat. This year, we compared normalized daily attack activity for Log4j with attack activity for Atlassian Confluence Code Injection, a vulnerability we examined in the 2023 Year in Review, as well as aggregated daily attack activity for multiple CVEs related to Authentication Bypass and Remote Code Execution vulnerabilities published in 2024.
Log4j attack activity appeared to trend generally upwards across the year, with several significant spikes visible during the first half of the year, and then again in October and November. In terms of the difference in activity, Log4j ranges from approximately 4x to over 20x the activity seen for Atlassian Confluence Code Injection, and as much as 100x the aggregated activity seen for Authentication Bypass or Remote Code Injection vulnerabilities.
Global attack activity trends for commonly exploited vulnerabilities in 2024
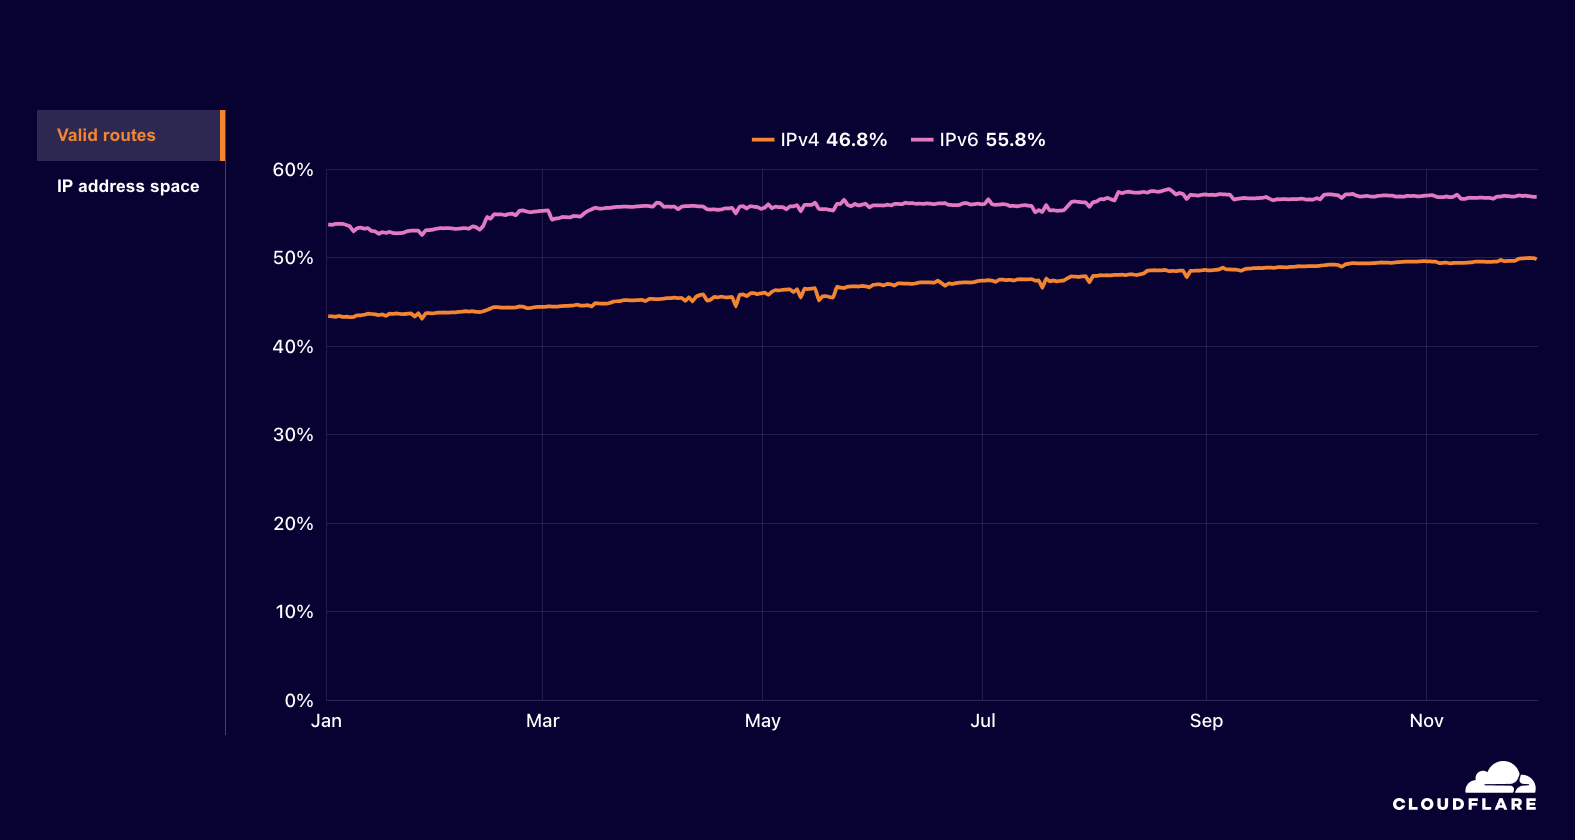
Routing security, measured as the share of RPKI valid routes and the share of covered IP address space, continued to improve globally throughout 2024.
As the routing protocol that underpins the Internet, Border Gateway Protocol (BGP) communicates routes between networks, enabling traffic to flow between source and destination. BGP, however, relies on trust between networks, and incorrect information shared between peers, whether or not it was shared intentionally, can send traffic to the wrong place, potentially with malicious results. Resource Public Key Infrastructure (RPKI) is a cryptographic method of signing records that associate a BGP route announcement with the correct originating autonomous system (AS) number, providing a way of ensuring that the information being shared originally came from a network that is allowed to do so. (It is important to note that this is only half of the challenge of implementing routing security, because network providers also need to validate these signatures and filter out invalid announcements to prevent sharing them further.)
Cloudflare has long been an advocate for routing security, including being a founding participant in the MANRS CDN and Cloud Programme and providing a public tool that enables users to test whether their Internet provider has implemented BGP safely. Building on insights available in the Routing page on Cloudflare Radar, we analyzed data from RIPE NCC’s RPKI daily archive to determine the share of RPKI valid routes (as opposed to those route announcements that are invalid or whose status is unknown) and how that share has changed over the course of 2024, as well as determining the share of IP address space covered by valid routes. The latter metric is of interest because a route announcement covering a significant amount of IP address space (millions of IPv4 addresses, for example) has a greater potential impact than an announcement covering a small block of IP address space (hundreds of IPv4 addresses, for example).
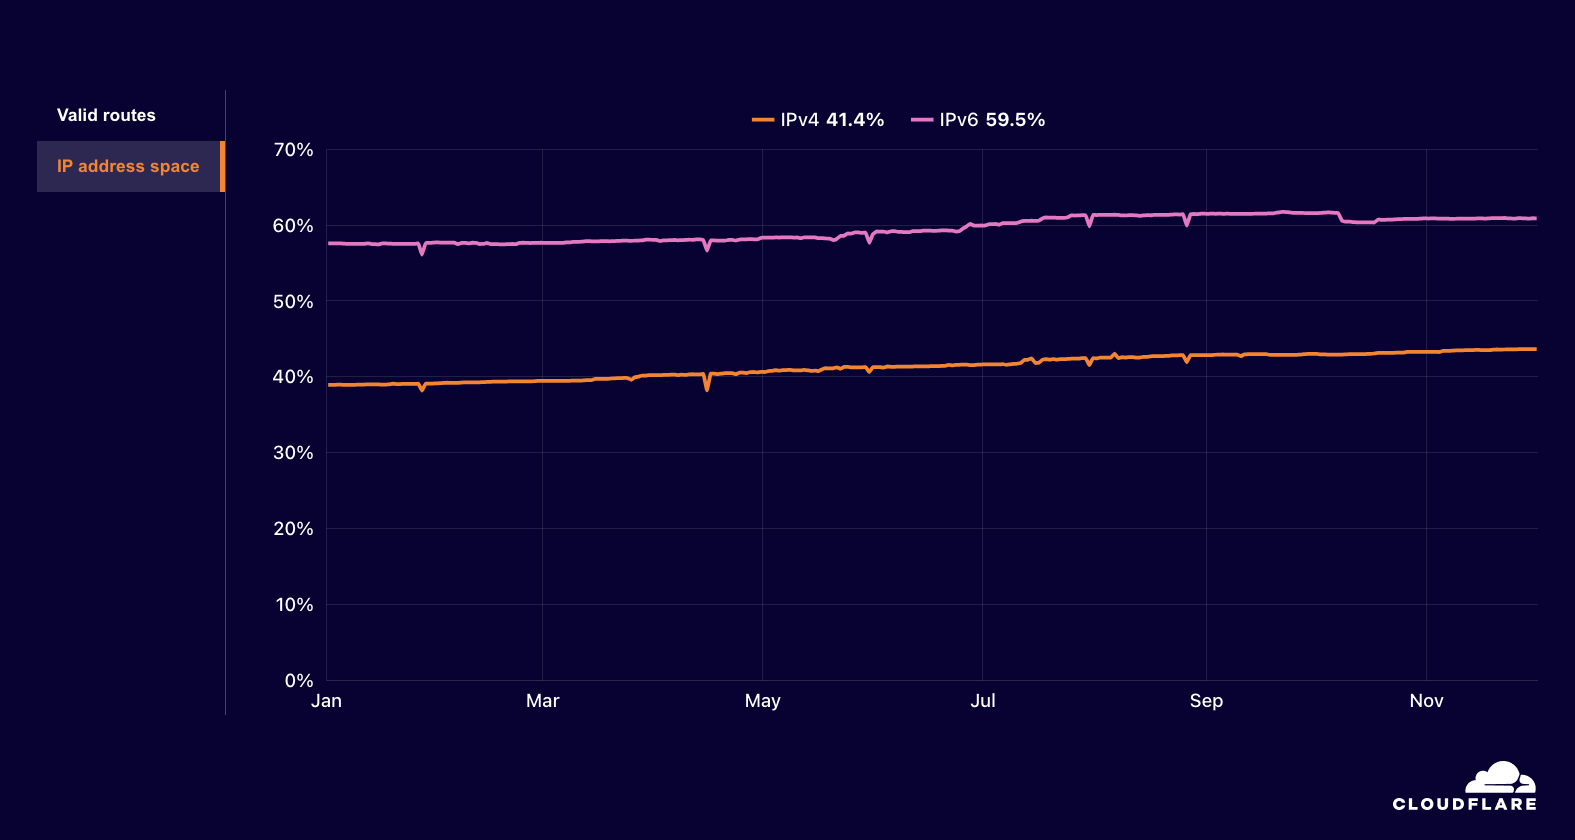
At a global level during 2024, we saw a 6.4 percentage point increase (from 43.4% to 49.8%) in valid IPv4 routes, and a 3.2 percentage point increase (from 53.7% to 56.9%) in valid IPv6 routes. Given the trajectory, it is likely that over half of IPv4 routes will be RPKI valid by the end of calendar year 2024. Looking at the global share of IP address space covered by valid routes, we saw a 4.7 percentage point increase (from 38.9% to 43.6%) for IPv4, and a 3.3 percentage point increase (from 57.6% to 60.9%) for IPv6.
Shares of global RPKI valid routing entries by IP version in 2024
Shares of globally announced IP address space covered by RPKI valid routes in 2024
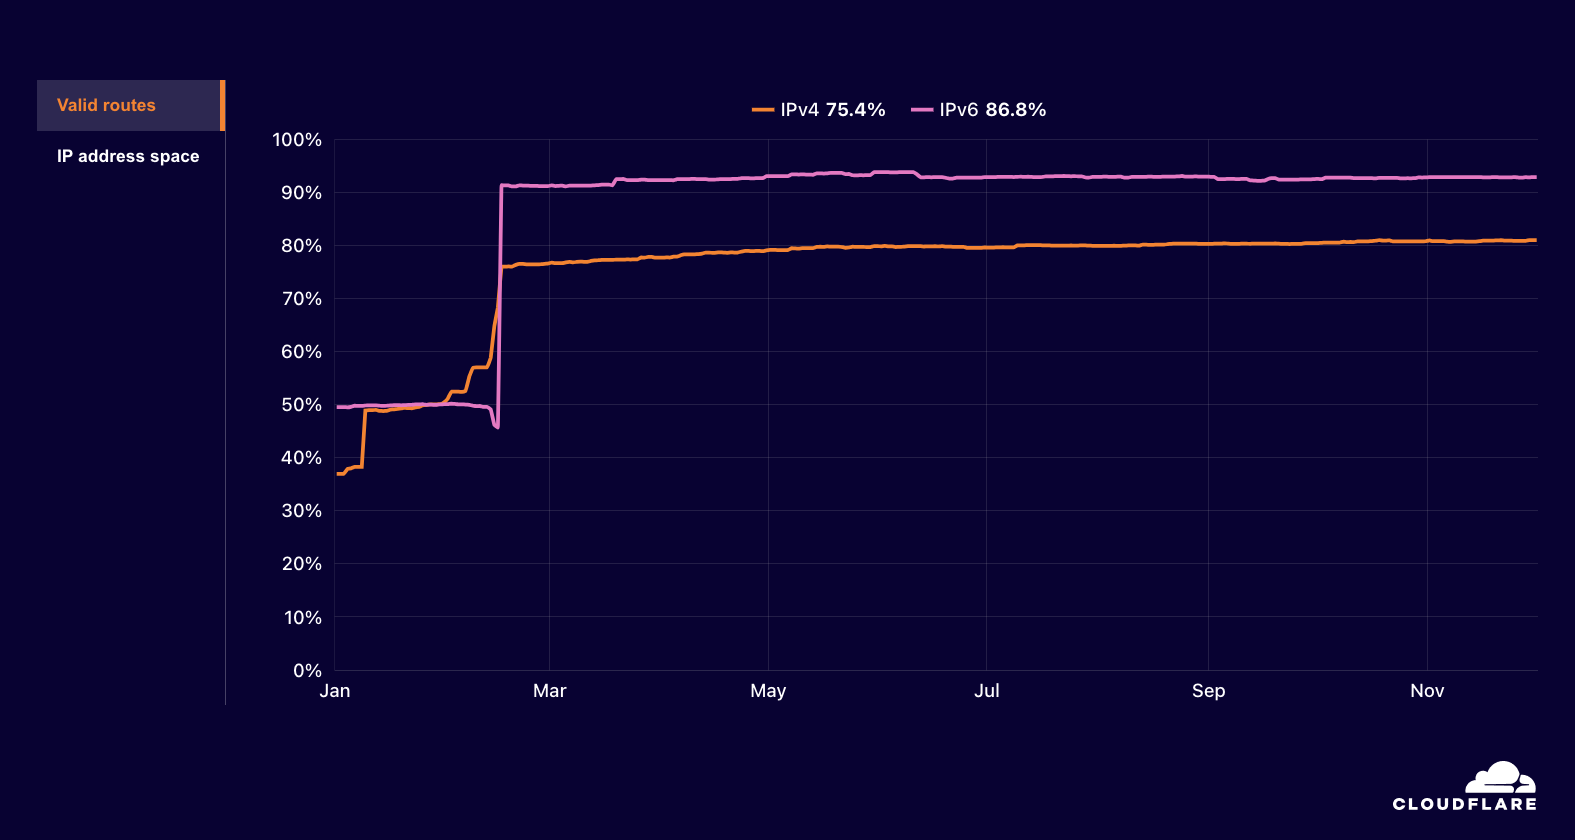
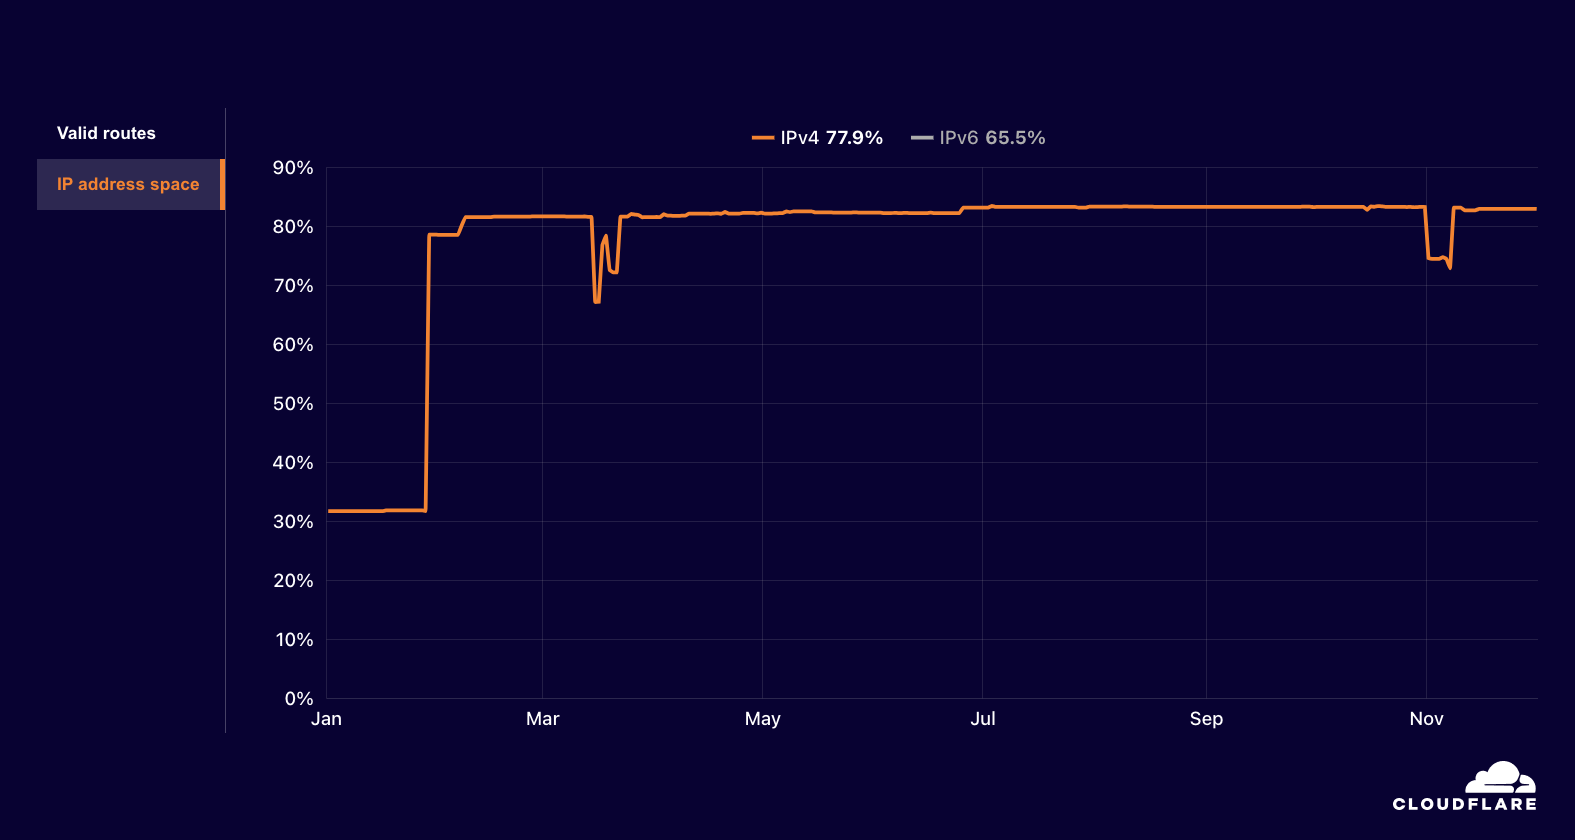
Spain started 2024 with less than half of its routes (both IPv4 and IPv6) RPKI valid. However, the share of valid routes grew significantly on February 15, when AS12479 (Orange Espagne) signed records associated with 98% of their IP address prefixes that were previously in an “unknown” (or NotFound) state of RPKI validity, thus converting these prefixes from unknown to valid. That drove an immediate increase for IPv4 to 76%, reaching 81% validity by December 1, and an immediate increase for IPv6 to 91%, reaching 92.9% validity by December 1. A notable change in covered IP address space was observed in Cameroon, where covered IPv4 space more than doubled at the end of January, growing from 32% to 82%. This was due to AS36912 (Orange Cameroun) signing records associated with all of their IPv4 address prefixes, changing the associated IP address space to RPKI valid.
IPv4 and IPv6 shares of RPKI valid routes for Spain in 2024
Share of IPv4 address space covered by RPKI valid routes for Cameroon in 2024
Email Security
An average of 4.3% of emails were determined to be malicious in 2024.
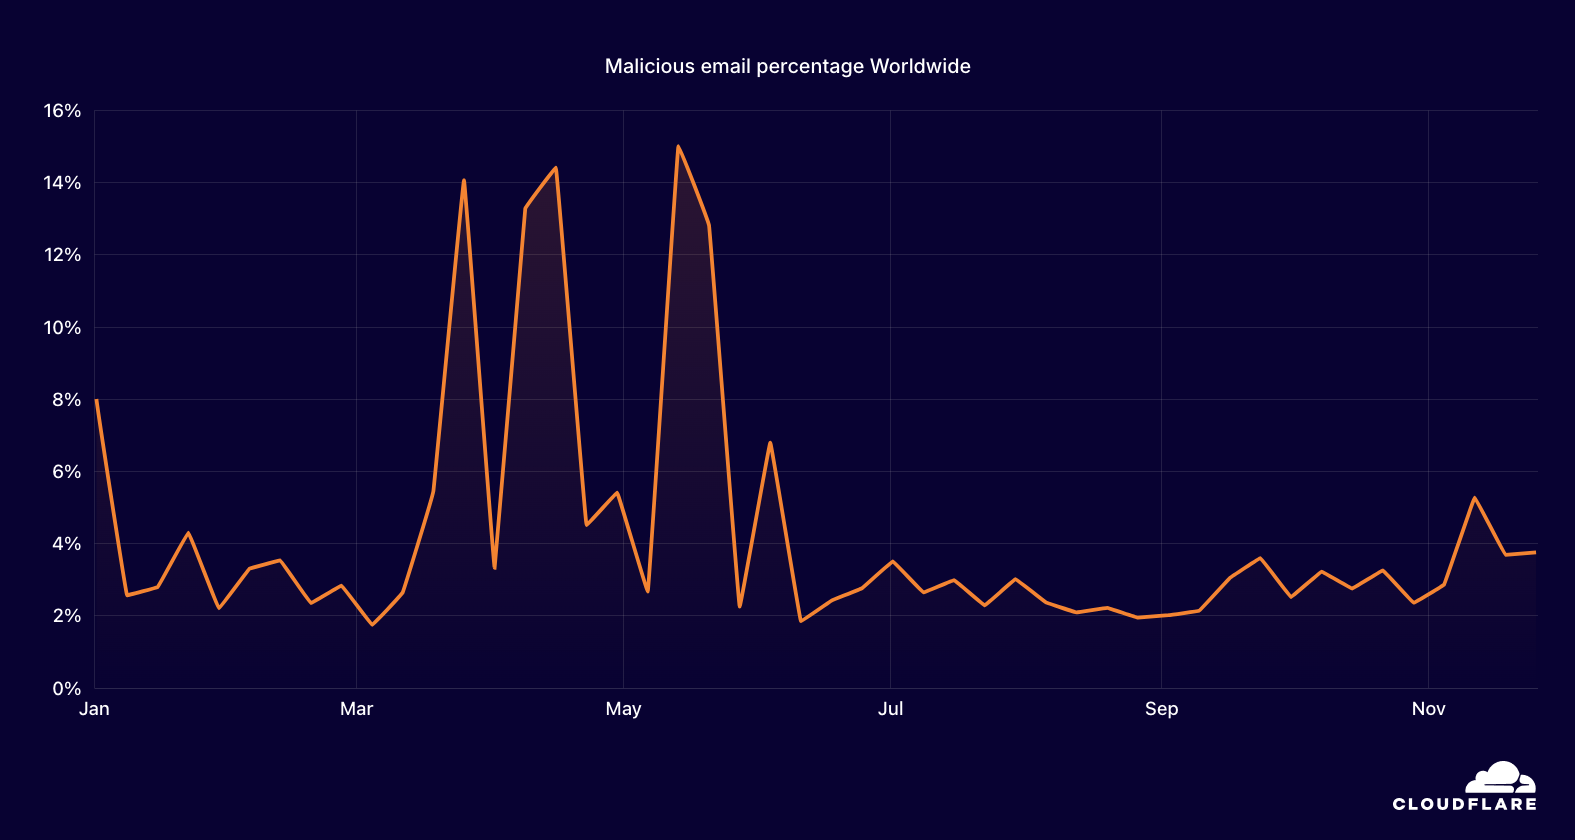
Despite the growing enterprise use of collaboration/messaging apps, email remains an important business application and is a very attractive entry point into enterprise networks for attackers. Attackers will send targeted malicious emails that attempt to impersonate an otherwise legitimate sender (such as a corporate executive), that try to get the user to click on a deceptive link, or that contain a dangerous attachment, among other types of threats. Cloudflare Email Security protects customers from email-based attacks, including those carried out through targeted malicious email messages. During 2024, an average of 4.3% of emails analyzed by Cloudflare were found to be malicious. Aggregated at a weekly level, spikes above 14% were seen in late March, early April, and mid-May. We believe that these spikes were related to targeted “backscatter” attacks, where the attacker flooded a target with undeliverable messages, which then bounced the messages to the victim, whose email had been set as the reply-to: address.
Global malicious email share trends in 2024
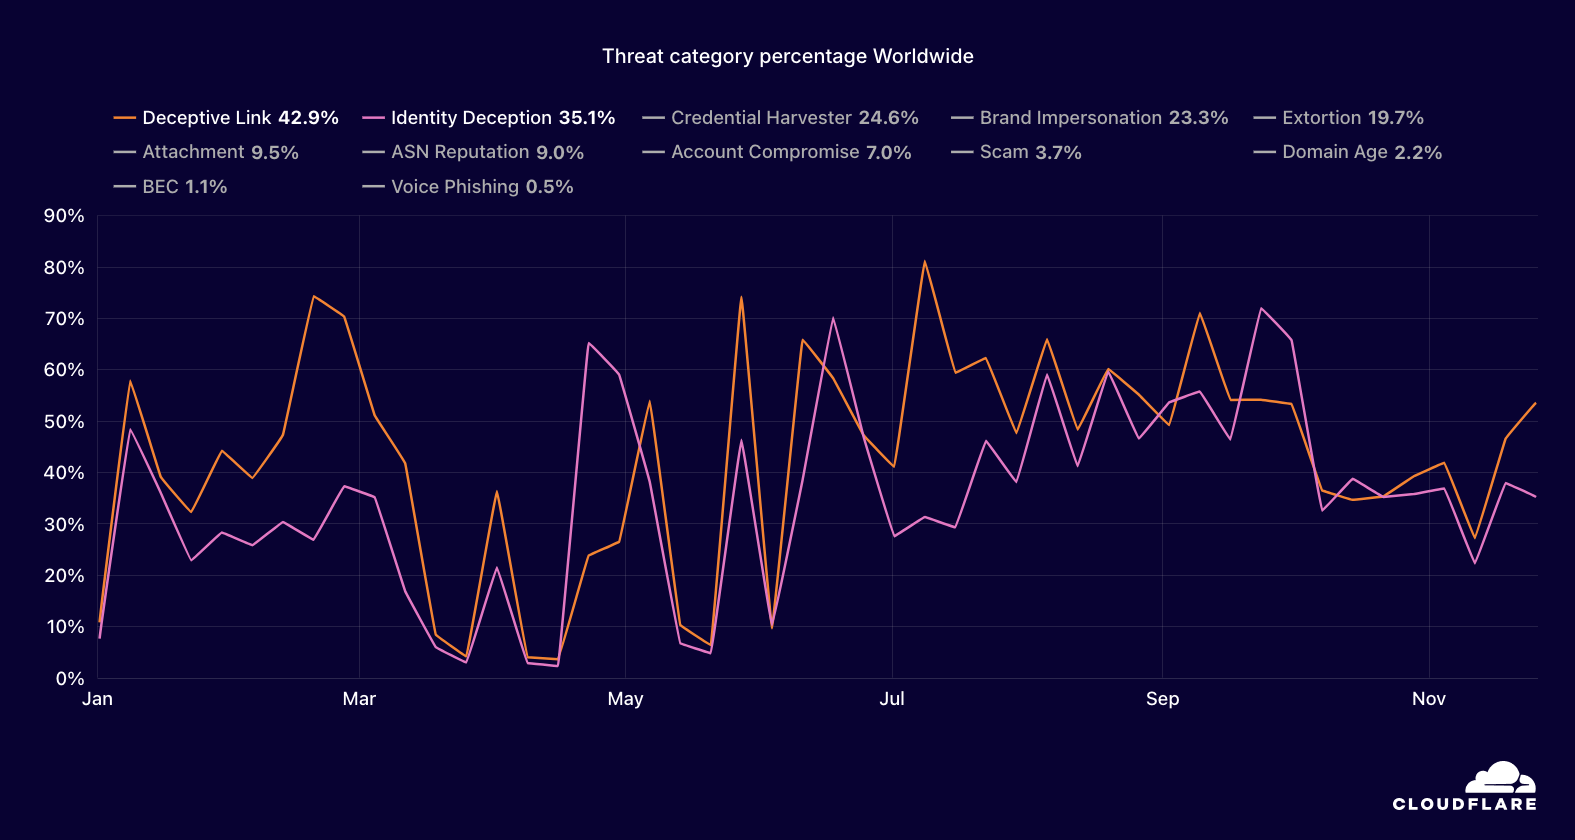
Deceptive links and identity deception were the two most common types of threats found in malicious email messages.
Attackers use a variety of techniques, which we refer to as threat categories, when they use malicious email messages as an attack vector. These categories are defined and explored in detail in our phishing threats report. In our analysis of malicious emails, we have found that such messages may contain multiple types of threats. In reviewing a weekly aggregation of threat activity trends for these categories, we found that, averaged across 2024, 42.9% of malicious email messages contained deceptive links, with the share reaching 70% at times throughout the year. Activity for this thread category was spiky, with low points seen in the March to May timeframe, and a general downward trend visible from July through November.
Identity deception was a similarly active threat category, with such threats also found in up to 70% of analyzed emails several weeks throughout the year. Averaged across 2024, 35.1% of emails contained attempted identity deception. The activity pattern for this threat category appears to be somewhat similar to deceptive links, with a number of the peaks and valleys occurring during the same weeks. At times, identity deception was a more prevalent threat in analyzed emails than deceptive links, as seen in the graph below.
Among other threat categories, extortion saw the most significant change throughout the year. After being found in 86% of malicious emails during the first week of January, its share gradually trended lower throughout the year, finishing November under 10%.
Global malicious email threat category trends for Deceptive Links and Identity Deception in 2024
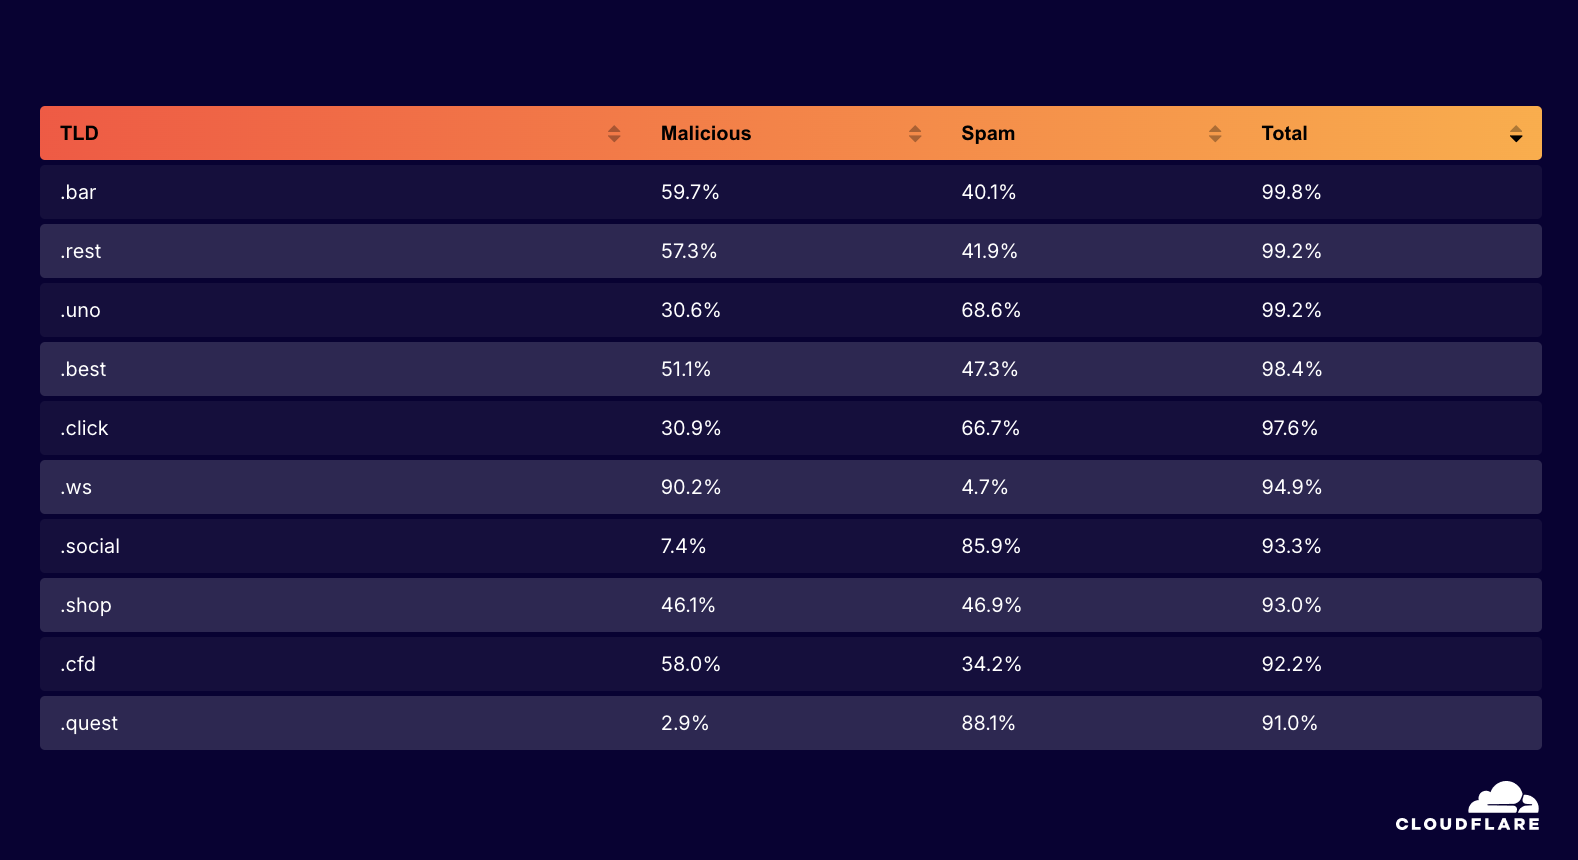
Over 99% of the email messages processed by Cloudflare Email Security from the .bar, .rest, and .uno top level domains (TLDs) were found to be either spam or malicious in nature.
In March 2024, we launched a set of email security insights on Cloudflare Radar, including visibility into so-called “dangerous domains” — those top level domains (TLDs) that were found to be the sources of the most spam or malicious email among messages analyzed by Cloudflare Email Security. The analysis is based on the sending domain’s TLD, found in the From: header of an email message. For example, if a message came from [email protected], then example.com is the sending domain, and .com is the associated TLD.
In aggregate across 2024, we found that the .bar, .rest, and .uno TLDs were the “most dangerous”, each with over 99% of analyzed email messages characterized as either spam or malicious. (These TLDs are all at least a decade old, and each sees at least some usage, with between 20,000 and 60,000 registered domain names.) Sorting by malicious email share, the .ws ccTLD (country code top level domain) belonging to Western Samoa came out on top, with over 90% of analyzed emails categorized as malicious. Sorting by spam email share, .quest is the biggest offender, with over 88% of emails originating from associated domains characterized as spam.
TLDs originating the largest total shares of malicious and spam email in 2024
Conclusion
The Internet is an amazingly complex and dynamic organism, constantly changing, growing, and evolving.
With the Cloudflare Radar 2024 Year In Review, we are providing insights into the change, growth, and evolution that we have measured and observed throughout the year. Trend graphs, maps, tables, and summary statistics provide our unique perspectives on Internet traffic, Internet quality, and Internet security, and how key metrics across these areas vary around the world and over time.
We strongly encourage you to visit the Cloudflare Radar 2024 Year In Review microsite and explore the trends for your country/region, and to consider how they impact your organization so that you are appropriately prepared for 2025. In addition, for insights into the top Internet services across multiple industry categories, we encourage you to read the companion Year in Review blog post, From ChatGPT to Temu: ranking top Internet services in 2024.
As it is every year, it truly is a team effort to produce the data, microsite, and content for our annual Year in Review, and I’d like to acknowledge those team members that contributed to this year’s effort. Thank you to: Jorge Pacheco, Sabina Zejnilovic, Carlos Azevedo, Mingwei Zhang (Data Analysis); André Jesus, Nuno Pereira (Front End Development); João Tomé (Most popular Internet services); Jackie Dutton, Kari Linder, Guille Lasarte (Communications); Eunice Giles (Brand Design); Jason Kincaid (blog editing); and Paula Tavares (Engineering Management), as well as countless other colleagues for their answers, edits, support, and ideas.
Cloudflare’s network spans more than 330 cities in over 120 countries, where we interconnect with over 13,000 network providers in order to provide a broad range of services to millions of customers. The breadth of both our network and our customer base provides us with a unique perspective on Internet resilience, enabling us to observe the impact of Internet disruptions. Thanks to Cloudflare Radar functionality released earlier this year, we can explore the impact from a routing perspective, as well as a traffic perspective, at both a network and location level.
As we have noted in the past, this post is intended as a summary overview of observed and confirmed disruptions, and is not an exhaustive or complete list of issues that have occurred during the quarter.
Over the past several years, we have seen multiple governments around the world implement Internet shutdowns in response to protests within their countries. Some shutdowns are more targeted, affecting only (a subset of) mobile Internet providers, while others are more aggressive, effectively cutting off Internet connectivity at a national level. In addition, we all too frequently see governments implement nationwide multi-hour Internet shutdowns in an effort to prevent students from cheating on national exams. Unfortunately, governments were active in both respects during the third quarter, as we observed multiple government directed Internet shutdowns. Several were covered in our August 1 blog post, A recent spate of Internet disruptions.
Bangladesh
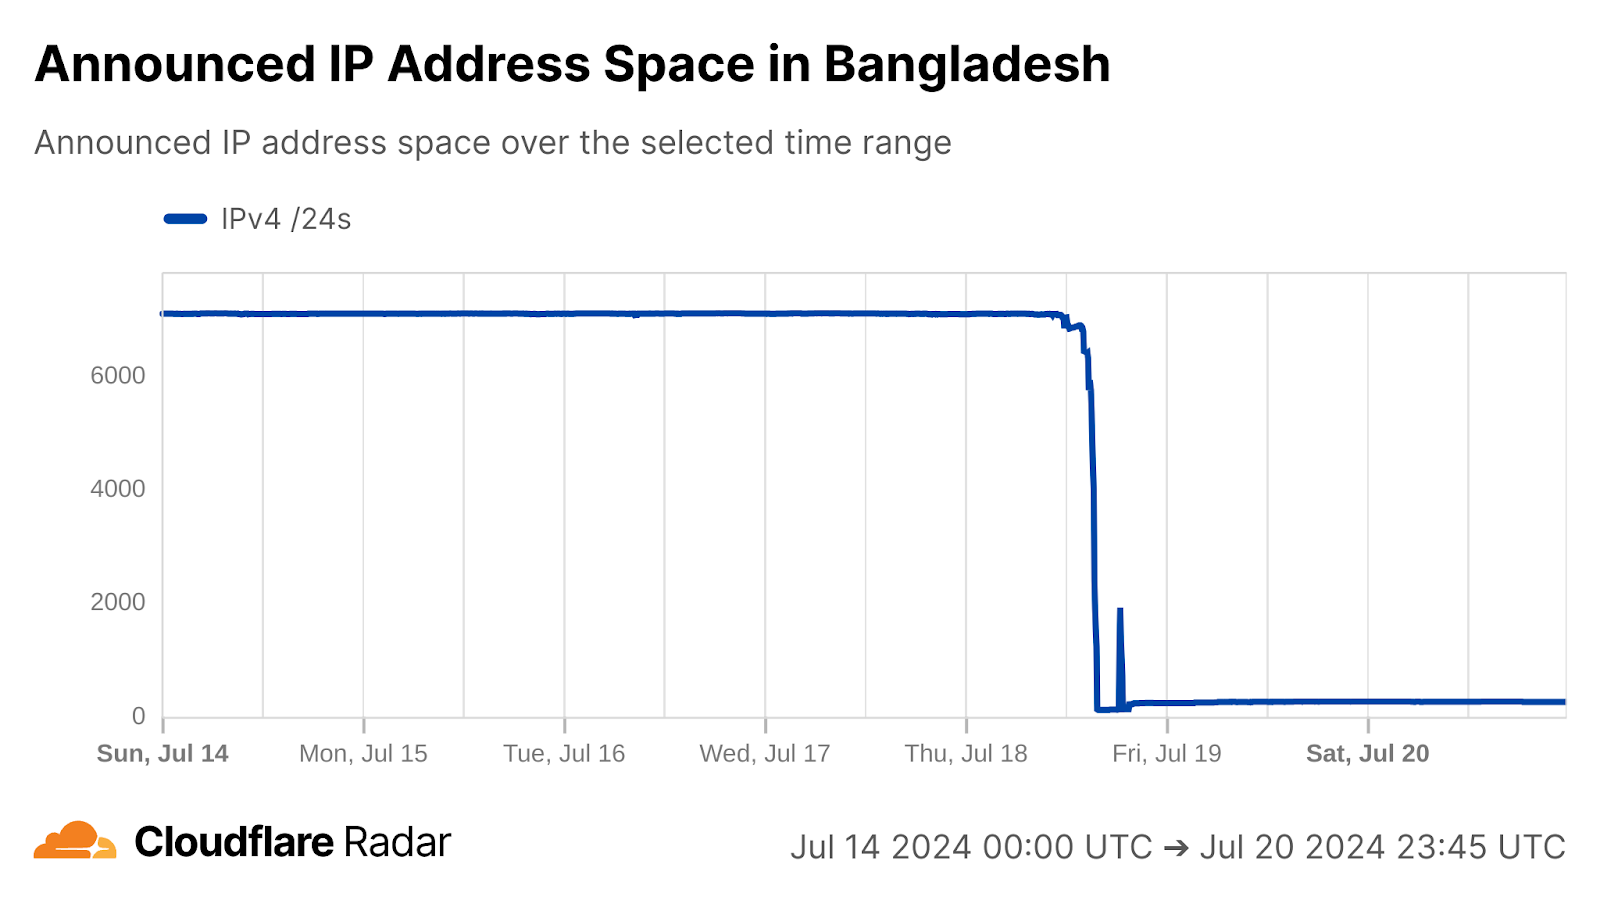
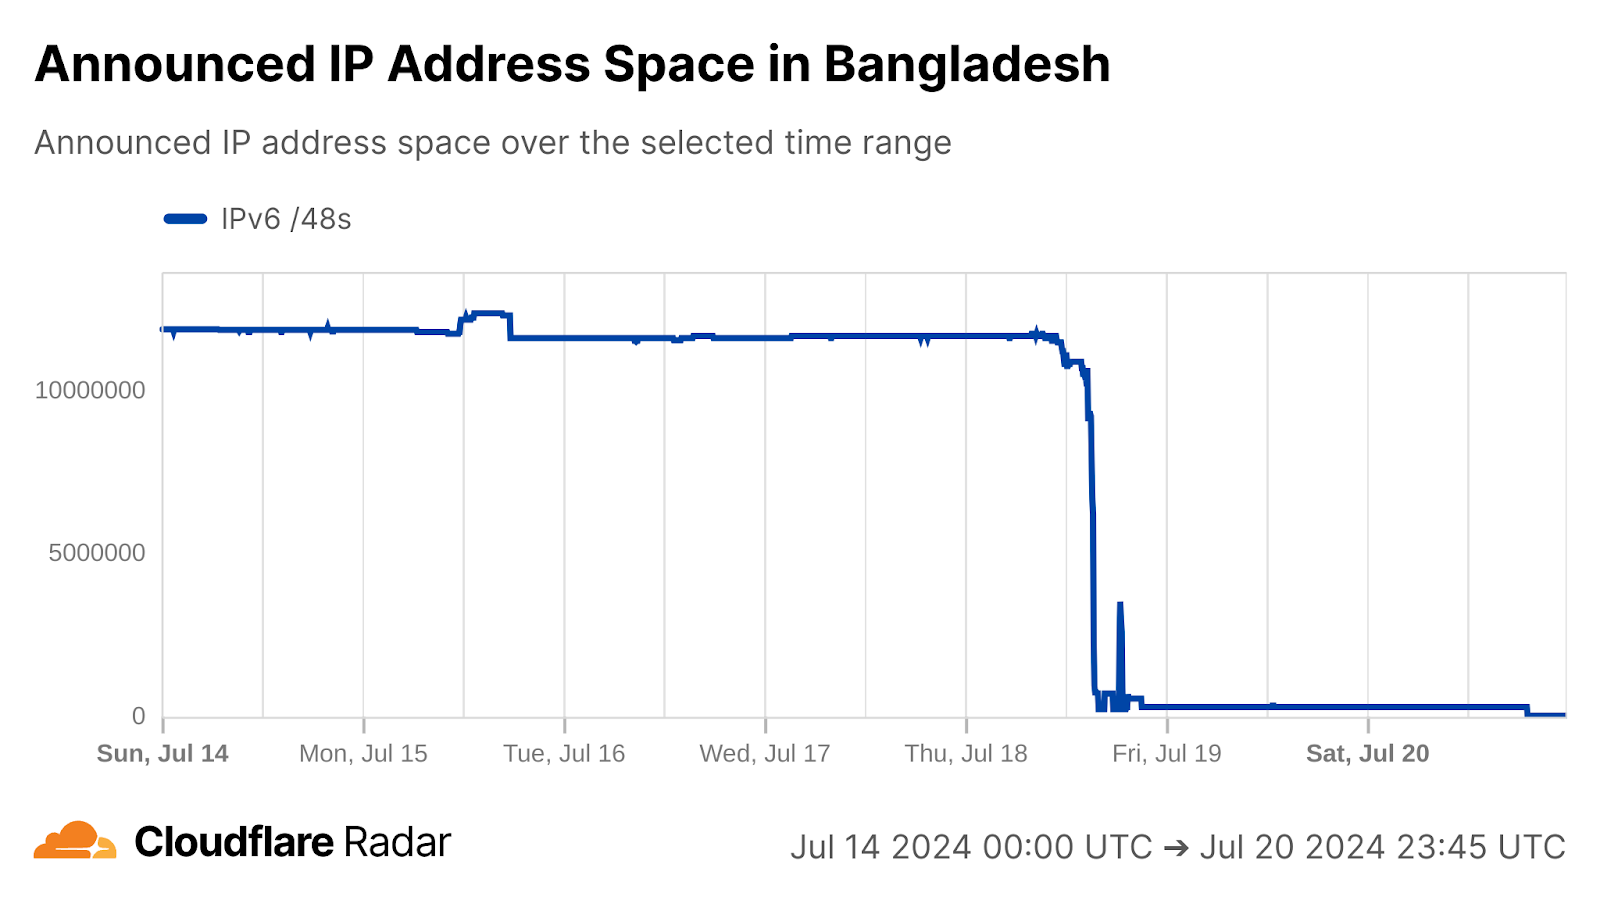
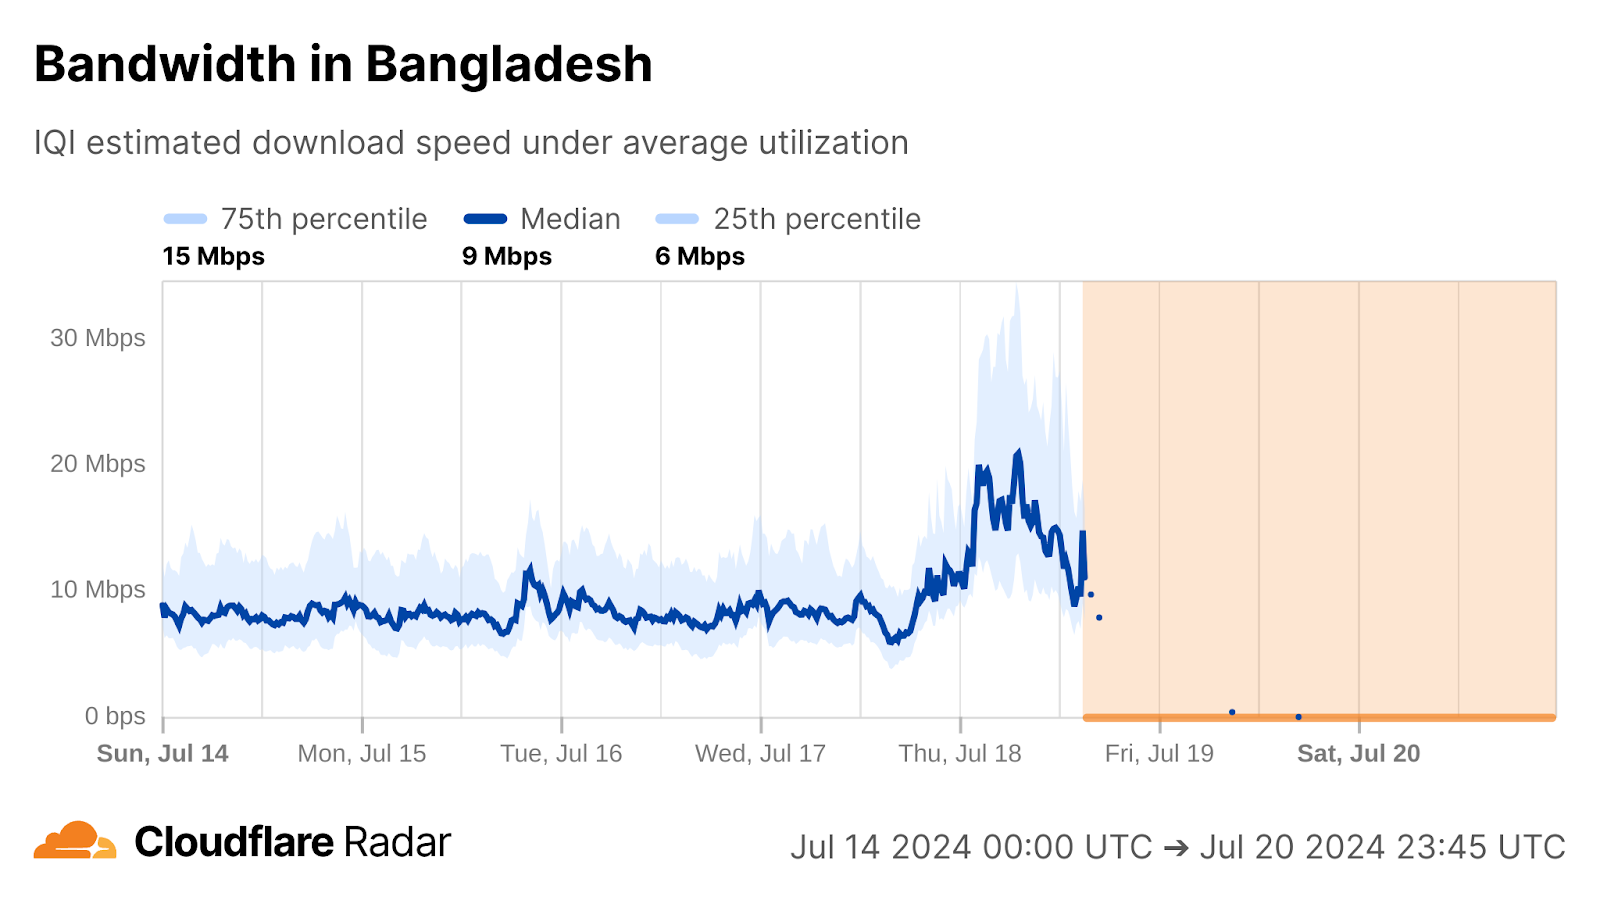
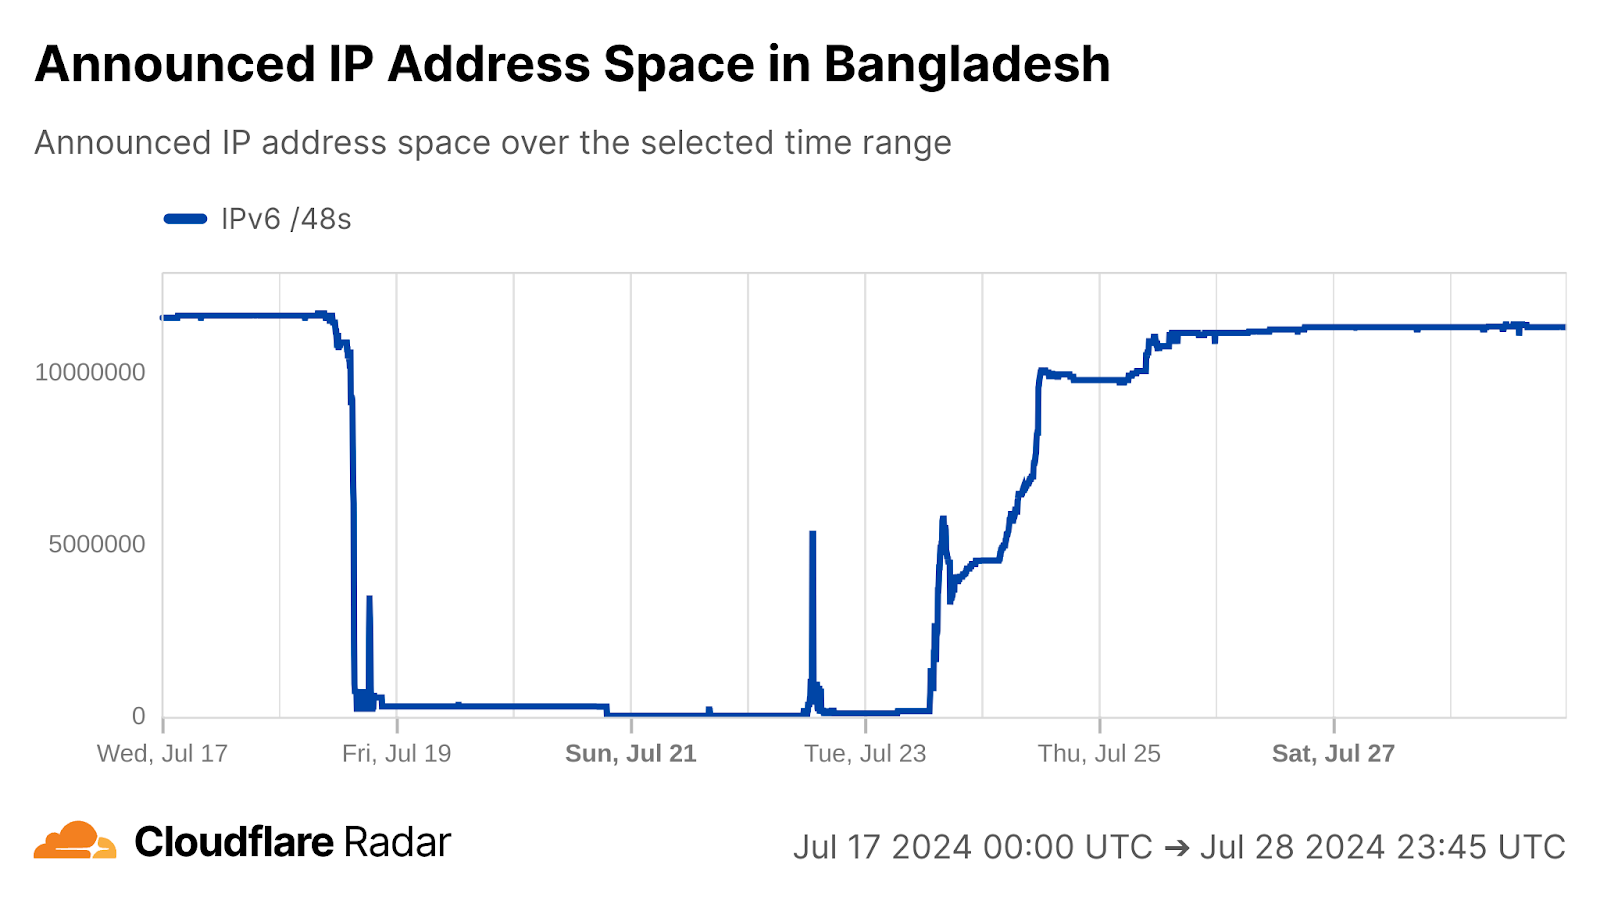
Violent student protests in Bangladesh against quotas in government jobs and rising unemployment rates led the government to order the nationwide shutdown of mobile Internet connectivity on July 18, reportedly to “ensure the security of citizens.” This government-directed shutdown ultimately became a near-complete Internet outage for the country, as broadband networks were taken offline as well. At a country level, Internet traffic in Bangladesh dropped to near zero just before 21:00 local time (15:00 UTC). Announced IP address space from the country dropped to near zero at that time as well, meaning that nearly every network in the country was disconnected from the Internet.
Traffic and announced IP address space at a national level began to recover around 18:00 local time (12:00 UTC) on July 23, and continued over the next several days, as fixed broadband connectivity was restored, with mobile connectivity returning on July 28. The initial restoration was characterized as a “trial run”, prioritizing banking, commercial sectors, technology firms, exporters, outsourcing providers and media outlets, according to the state minister for post, telecommunication and information technology.
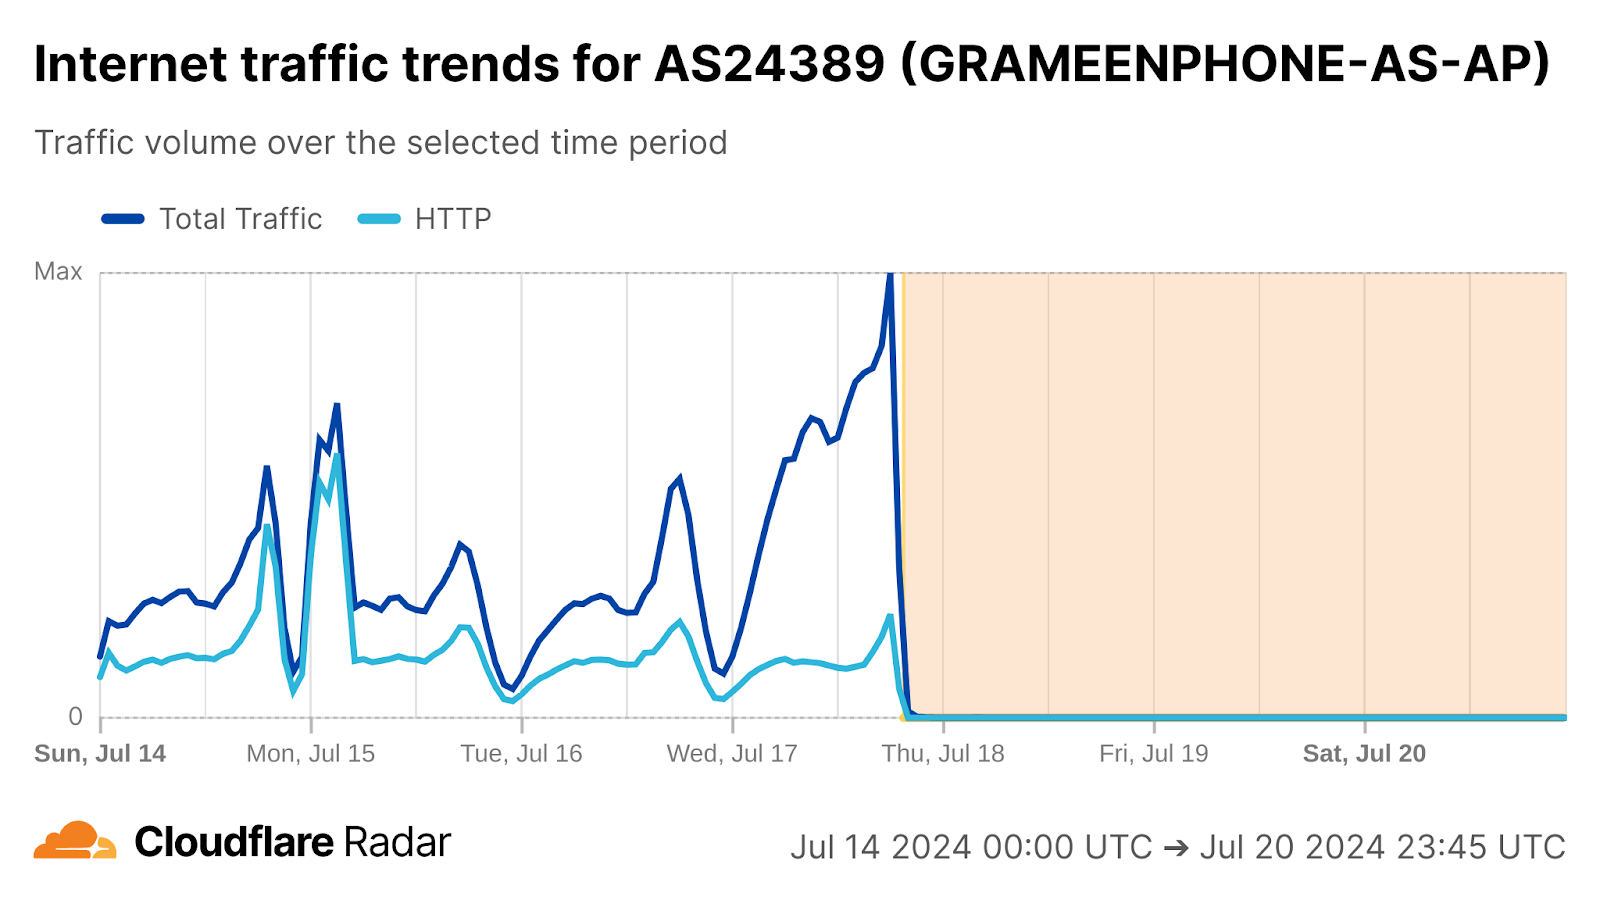
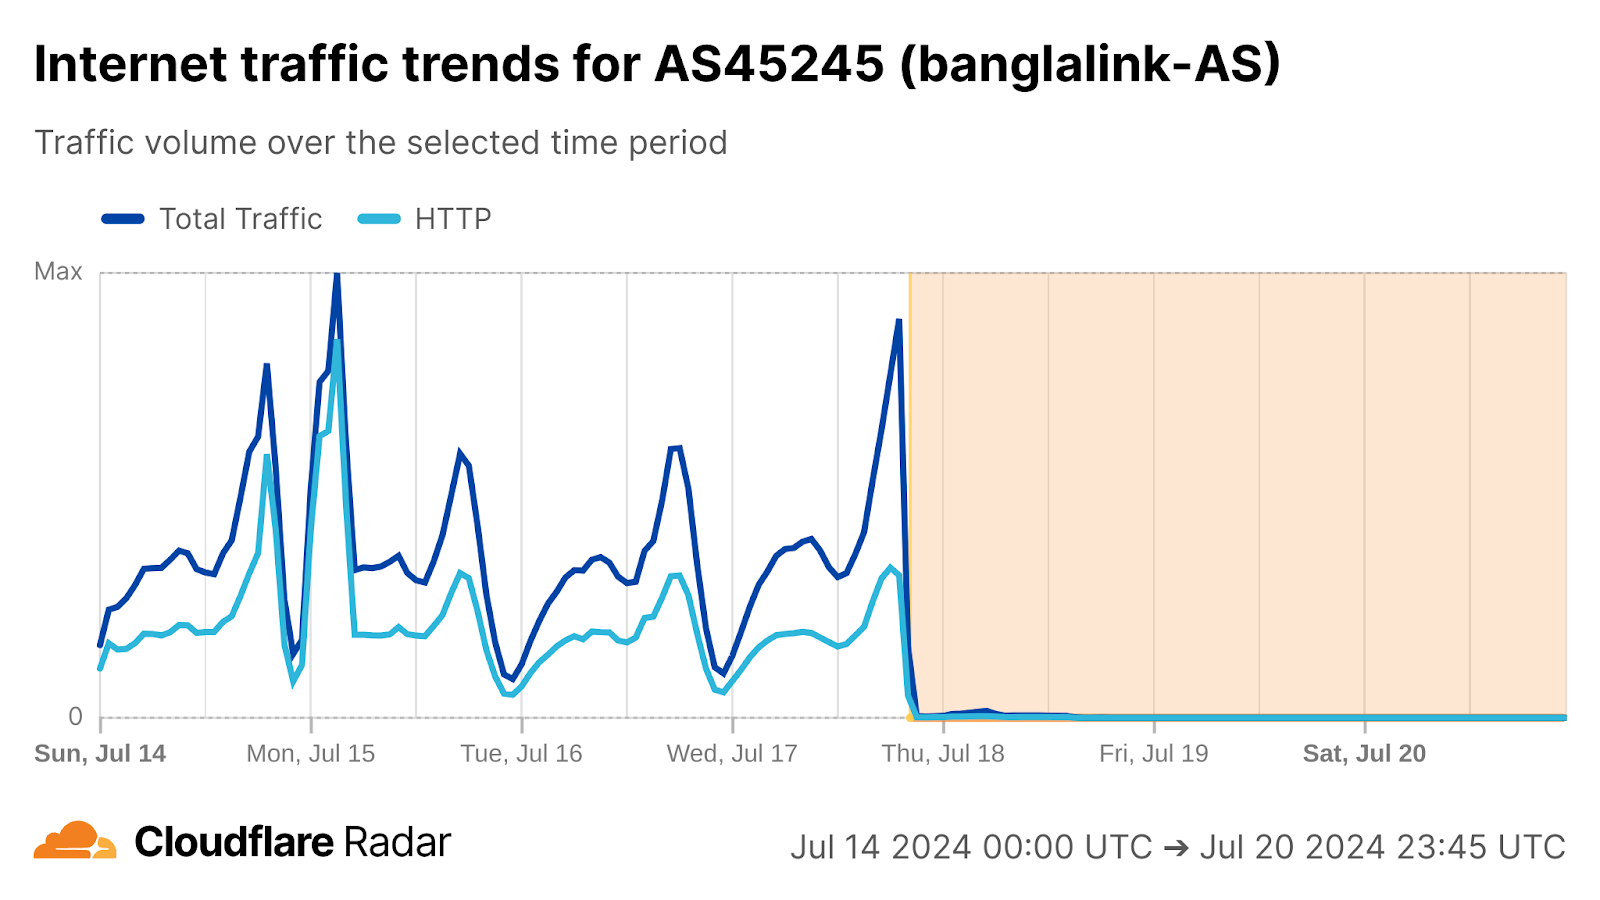
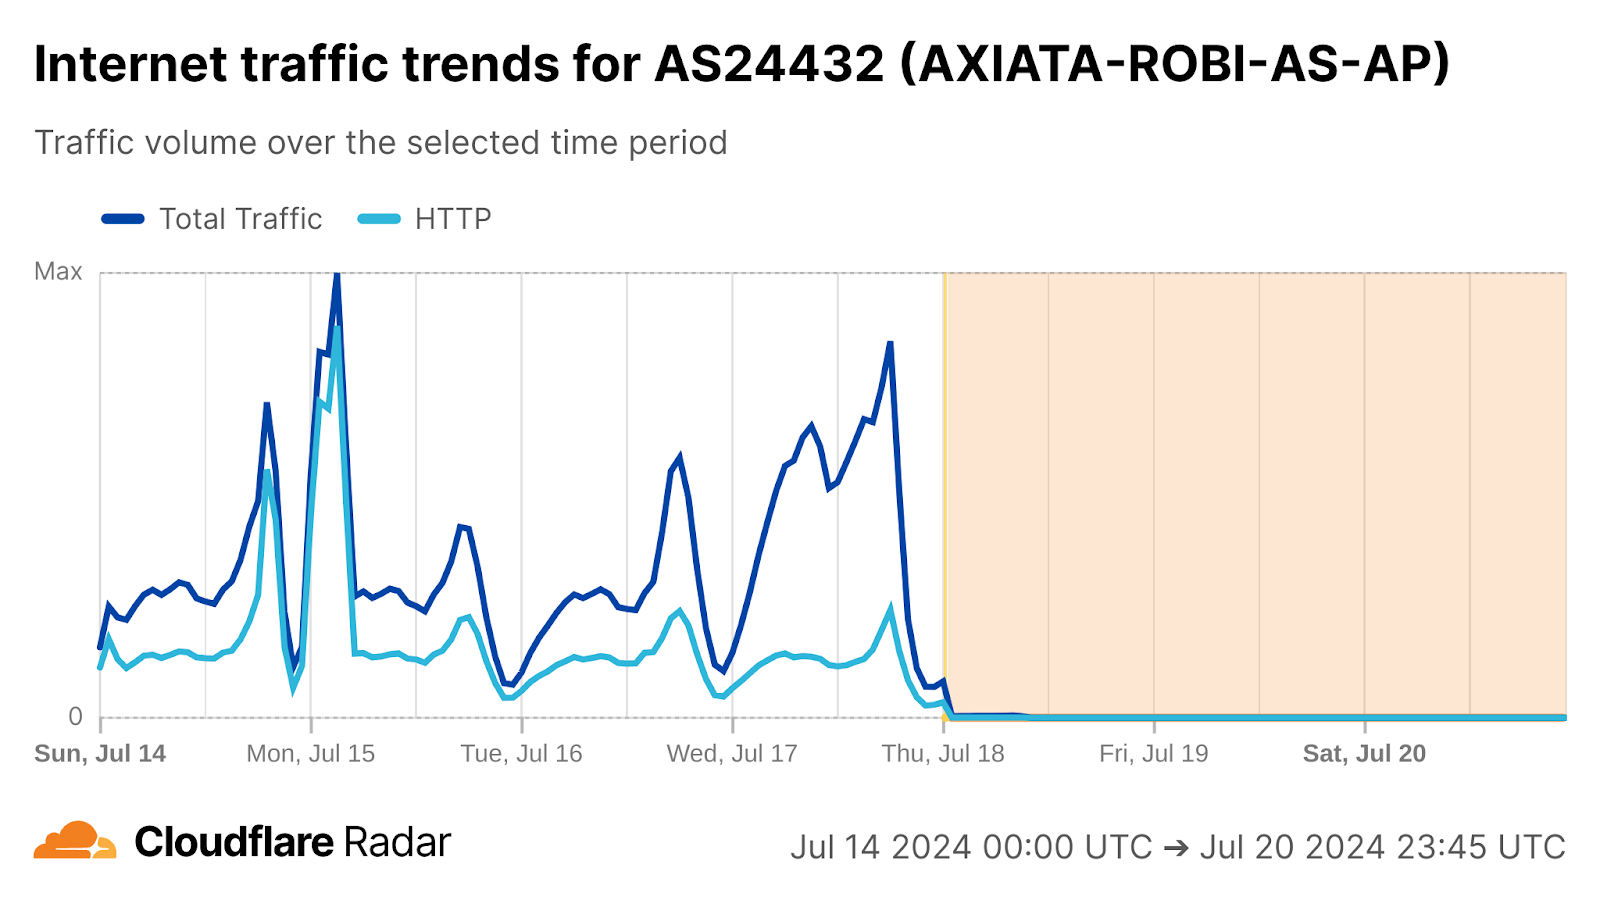
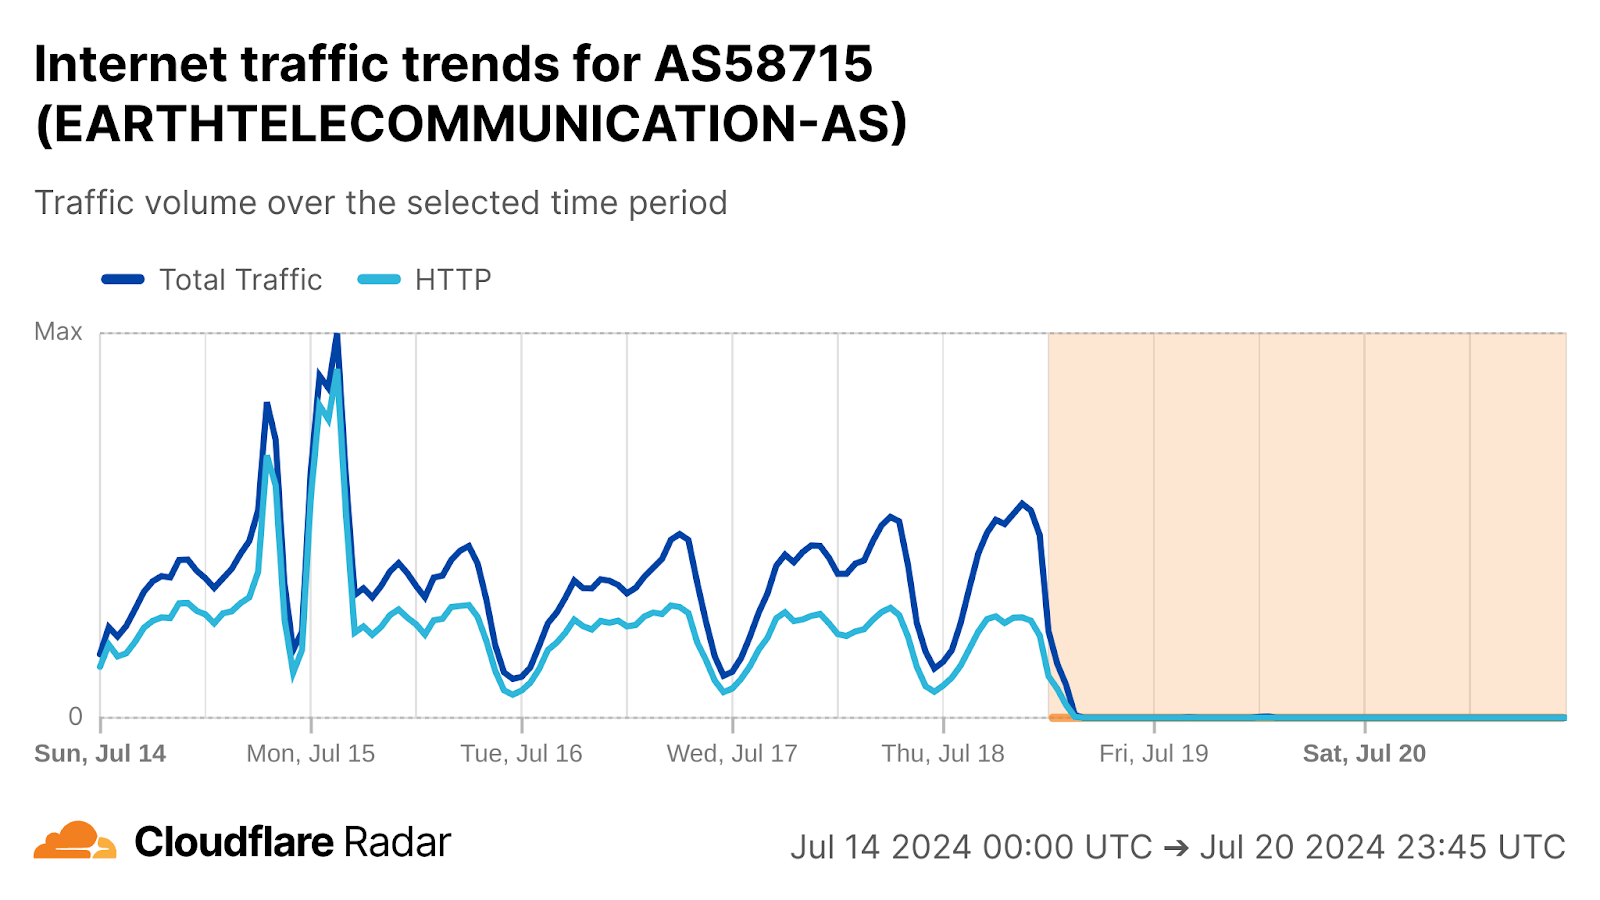
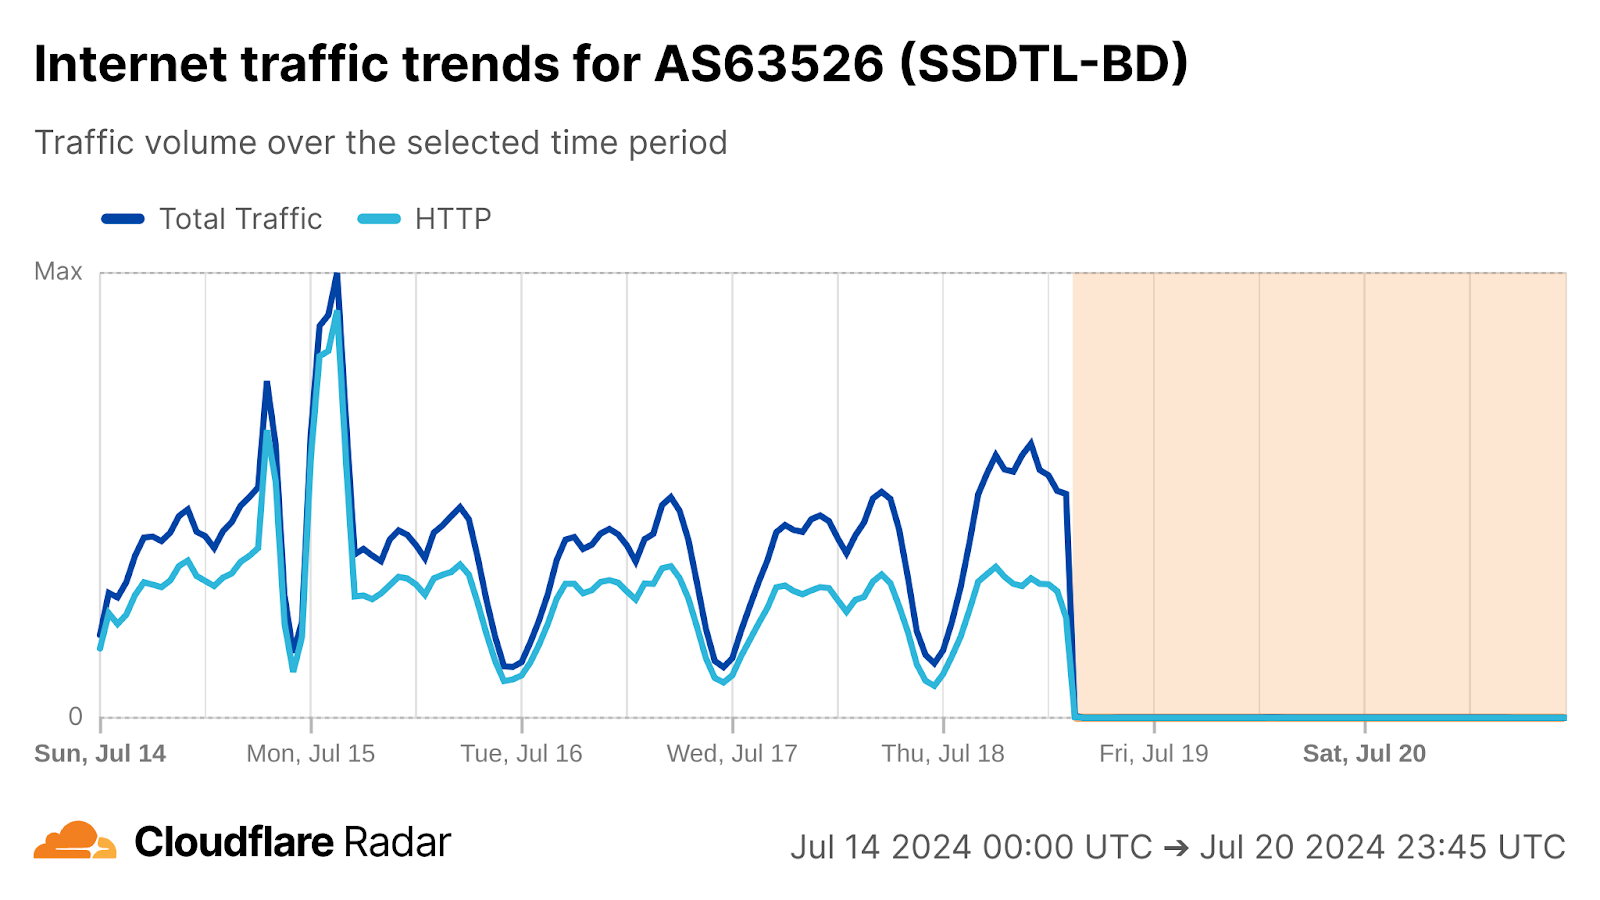
Ahead of this nationwide shutdown, we observed outages across several Bangladeshi network providers, perhaps foreshadowing what was to come. At AS24389 (Grameenphone), a complete Internet outage started at 01:30 local time on July 18 (19:30 UTC on July 17), with a total loss of both Internet traffic and announced IP address space.
These mobile connectivity outages lasted from July 18 through July 28. Just a few days after connectivity was restored, additional clashes between police and protestors drove the government to order mobile Internet connectivity to be shut down again. As shown in the graphs below, traffic on these mobile network providers dropped between 13:30 and 14:15 local time (07:30 to 08:15 UTC) on Sunday, August 4.
These protests ultimately led the government to order a full Internet shutdown in the country, with both traffic and announced IP address space dropping precipitously around 10:30 local time (04:30 UTC) on Monday, August 5. However, the shutdown appeared to be short-lived, as broadband connectivity began to recover around 13:20 local time (07:20 UTC), with mobile connectivity being restored around 14:00 local time (08:00 UTC).
Iraqi Kurdistan
Both Iraq and Iraqi Kurdistan (the autonomous Kurdistan region in the northern part of the country) regularly implement government directed Internet shutdowns to prevent cheating on secondary and baccalaureate exams. Within Iraqi Kurdistan, we observed two sets of exam-related Internet shutdowns during the third quarter. The impacts of the shutdowns are visible on traffic from networks that operate within the region, as well as on the country-level graphs for Iraq.
The first round of shutdowns occurred in July, impacting AS59625 (KorekTel), AS21277 (Newroz Telecom), AS48492 (IQ Online), and AS206206 (KNET) between 06:00 – 08:00 local time (03:00 – 05:00 UTC) on July 3, 7, 10, and 14. This is consistent with shutdowns observed in the second quarter, as well as in June 2023. None of the impacted networks experienced a drop in announced IP address space during these shutdowns.
The second set of shutdowns in Iraqi Kurdistan took place across multiple days during the back half of August. On August 17, 19, 21, 24, 26, 28, and 31, all four network providers were again impacted, as seen in the graphs below, with traffic dropping between 06:00 – 08:00 local time (03:00 – 05:00 UTC).
Iraq
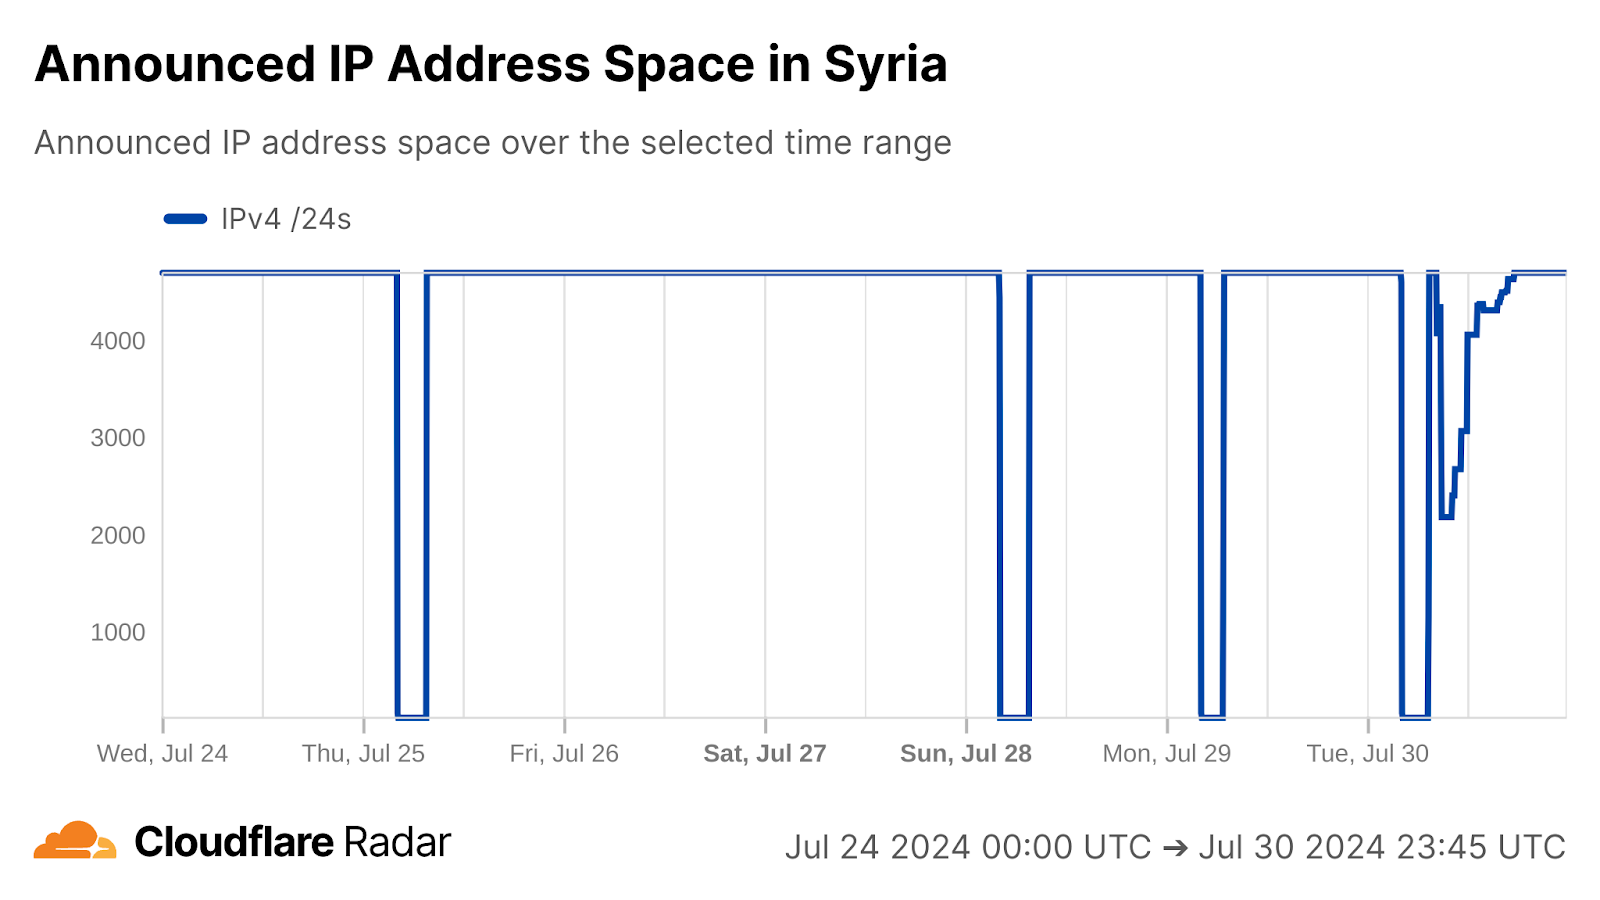
In Iraq, a second round of exams for 12th graders resulted in over two weeks of regular Internet shutdowns across the country occurring between 06:00 – 08:00 local time (03:00 – 05:00 UTC) on multiple days between August 29 and September 16, intended to prevent cheating on second ministerial exams for secondary education. Both HTTP traffic and announced IP address space from Iraq dropped during these shutdowns, as seen in the graphs below.
(Note that the red annotation bar visible on September 11 & 12 on both the country and network-level graphs below highlights an internal data pipeline issue, and is not associated with an Internet shutdown in Iraq.)
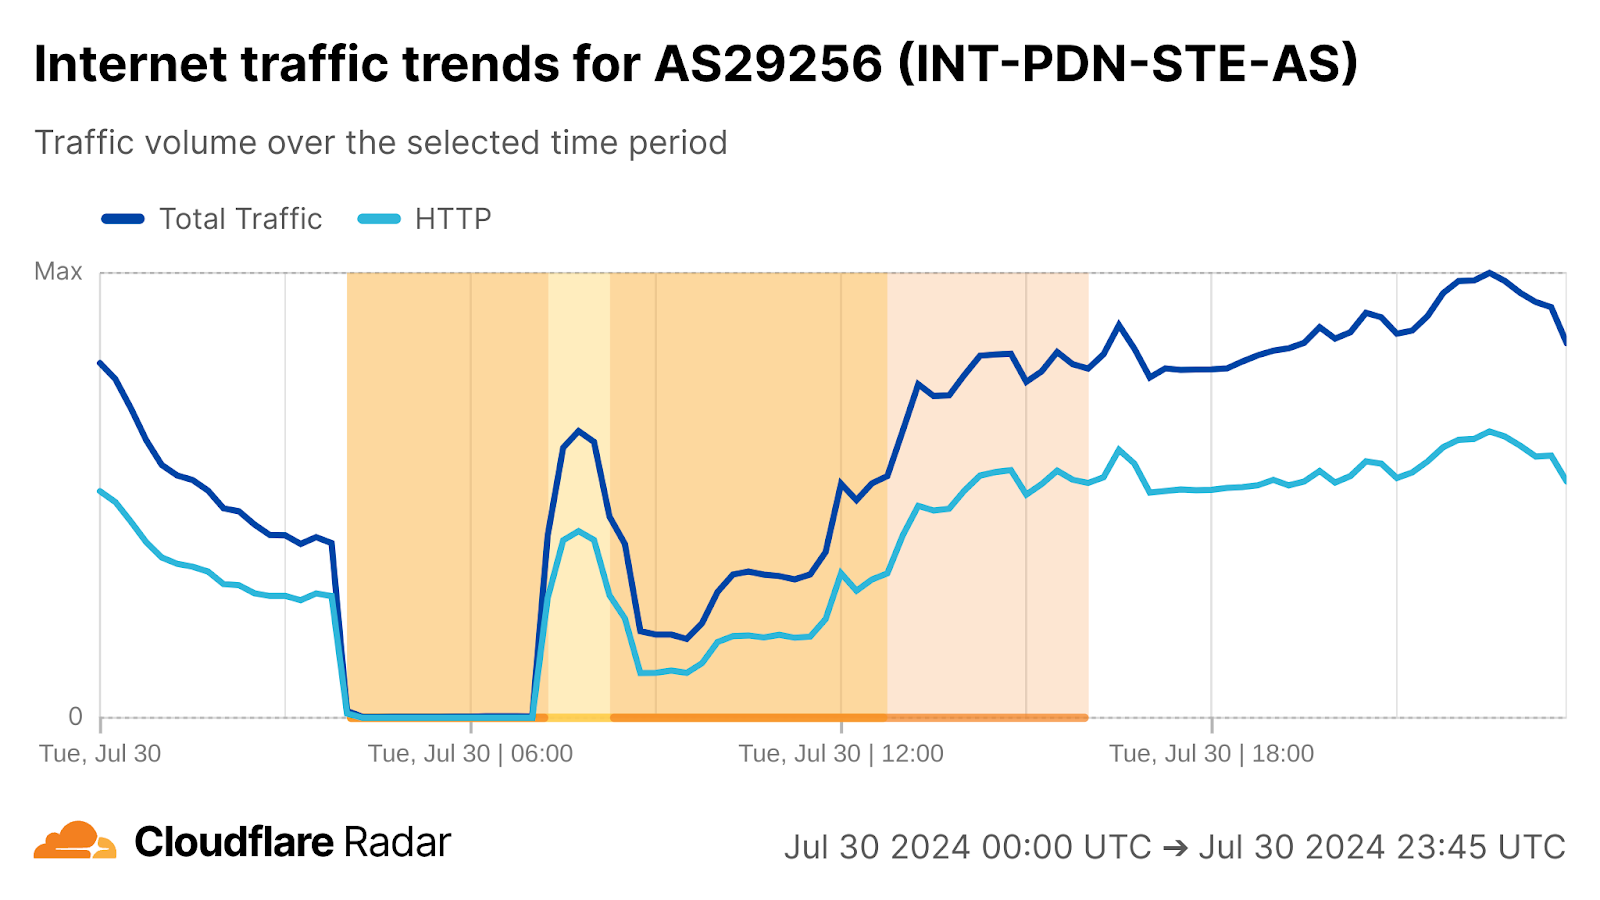
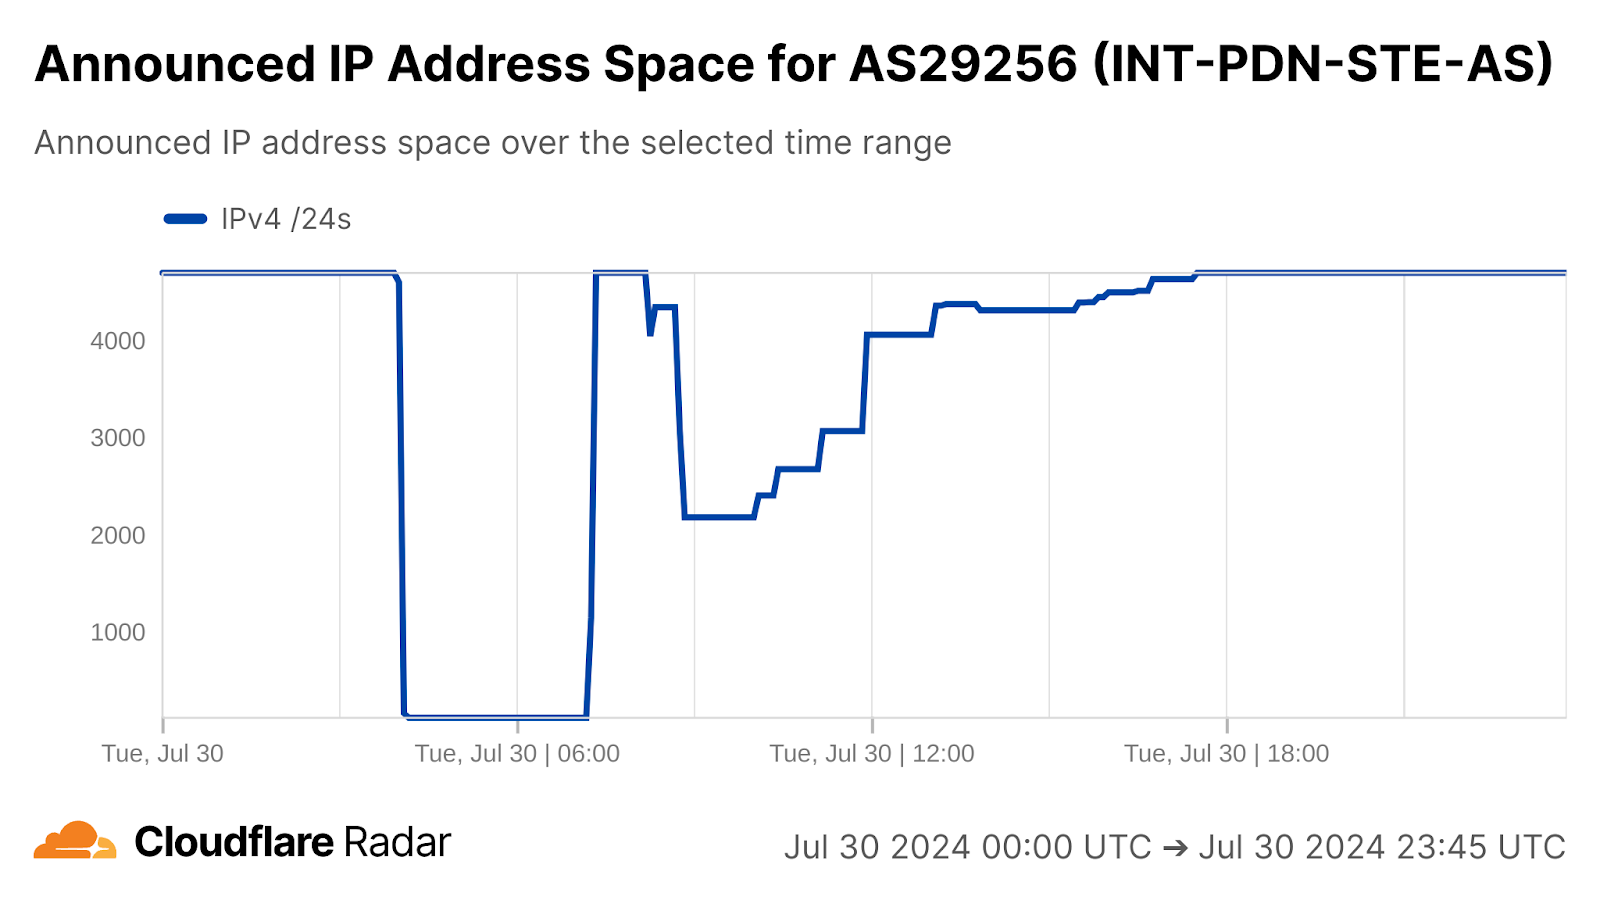
This round of government-directed shutdowns impacted multiple local network providers, including AS58322 (Halasat), AS51684 (AsiaCell), AS203214 (HulumTele), AS199739 (Earthlink), and AS59588 (ZAINAS). In reviewing the distribution of mobile device and desktop traffic at a network level, gaps were observed during the shutdowns on AS58322 and AS199739, and to a lesser extent, AS203214, suggesting that these networks were completely offline, while AS56184 and AS59588 remained at least partially online. (This is also corroborated by complete or partial loss of announced IP address space across these networks during the shutdowns.)
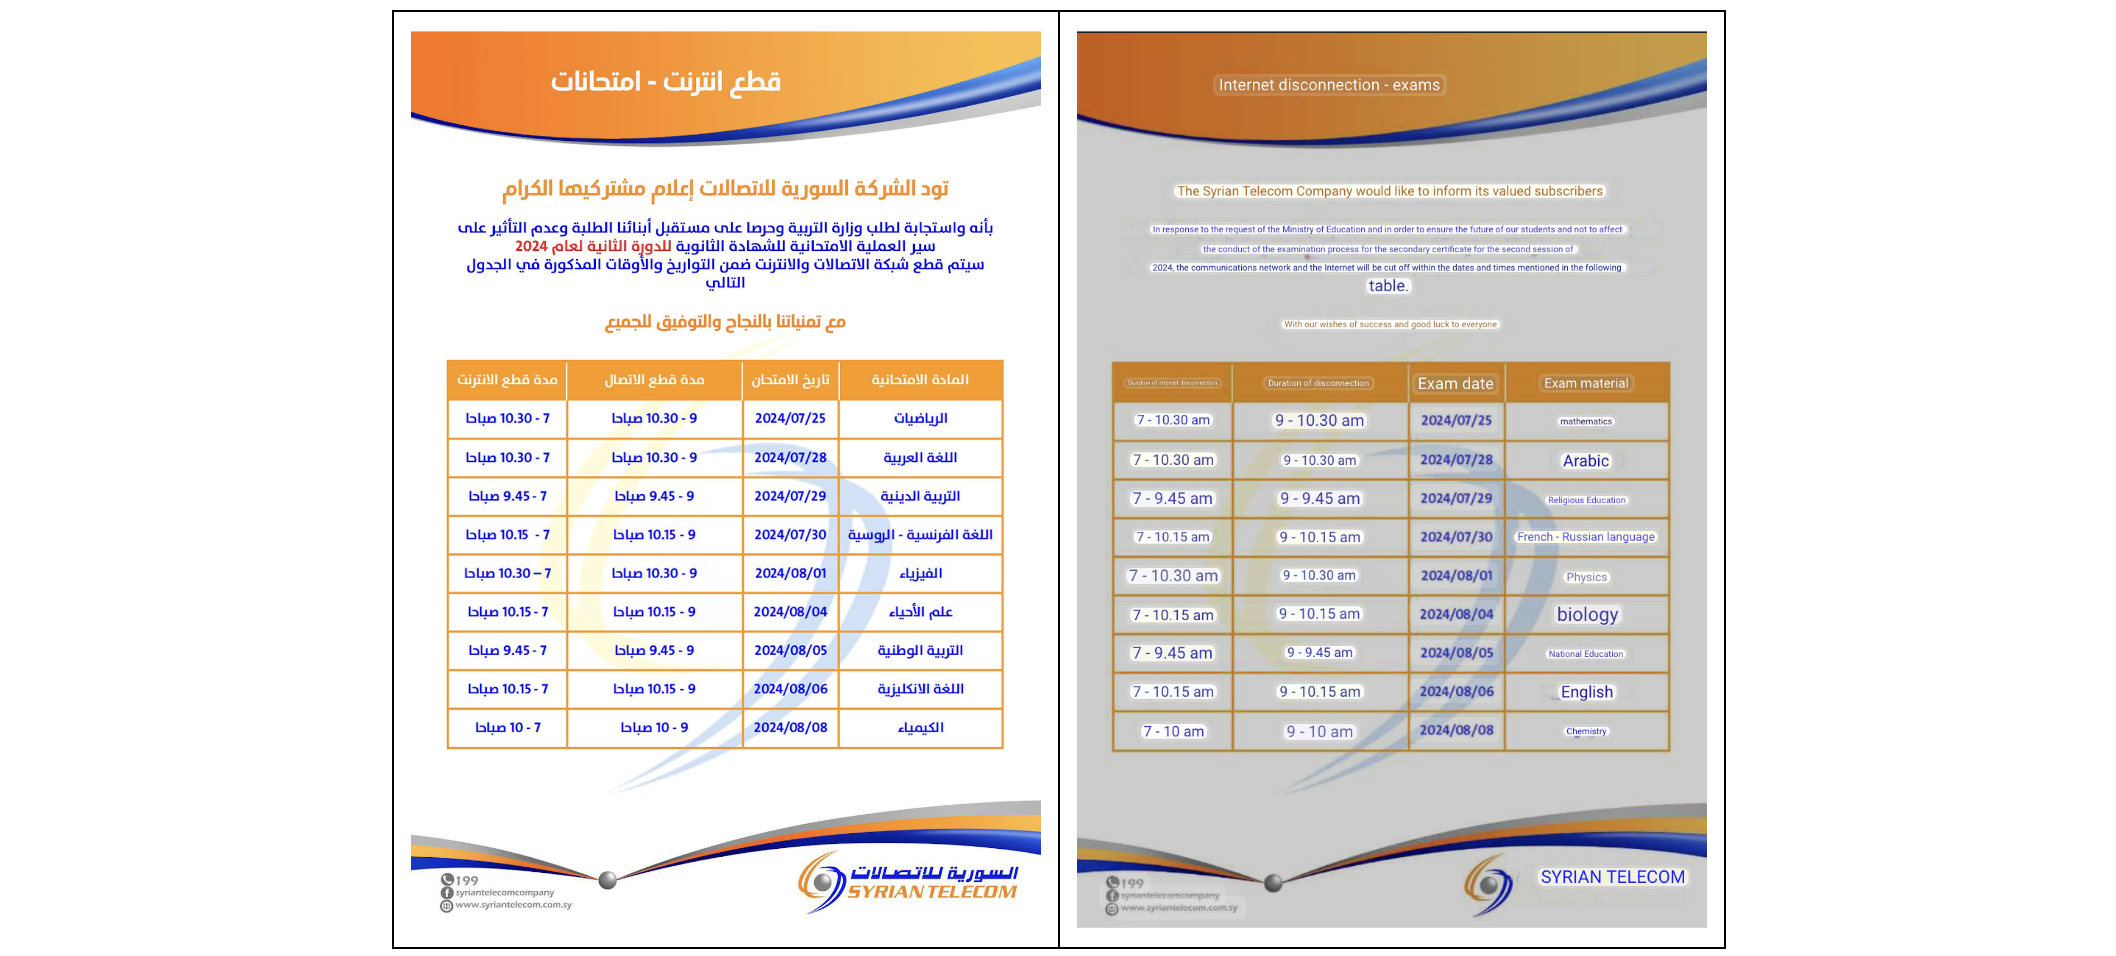
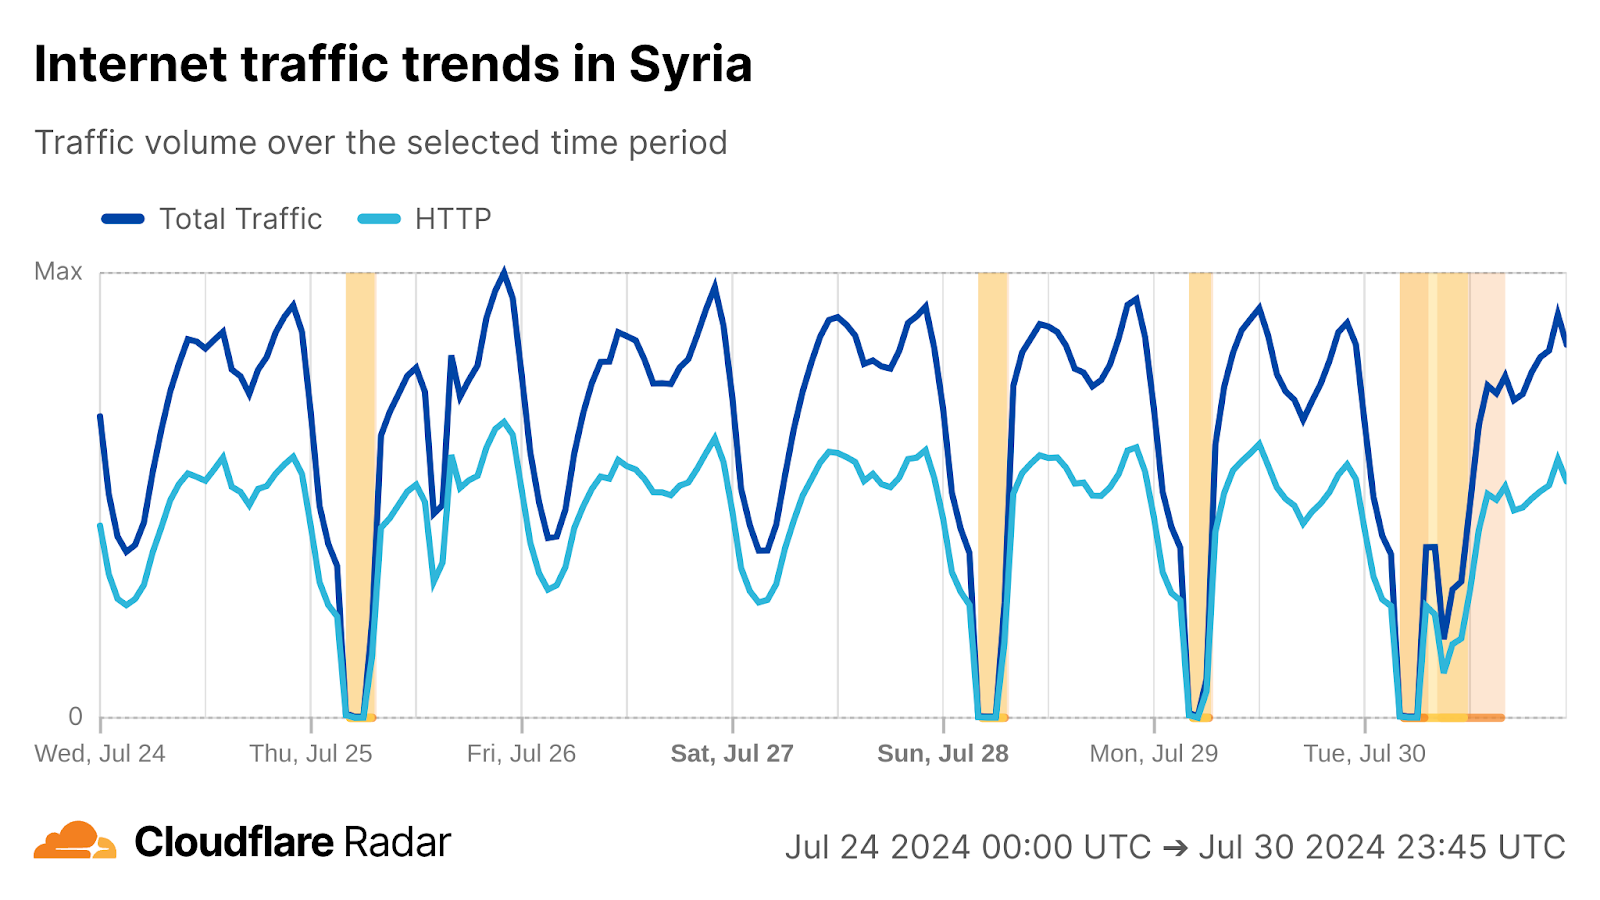
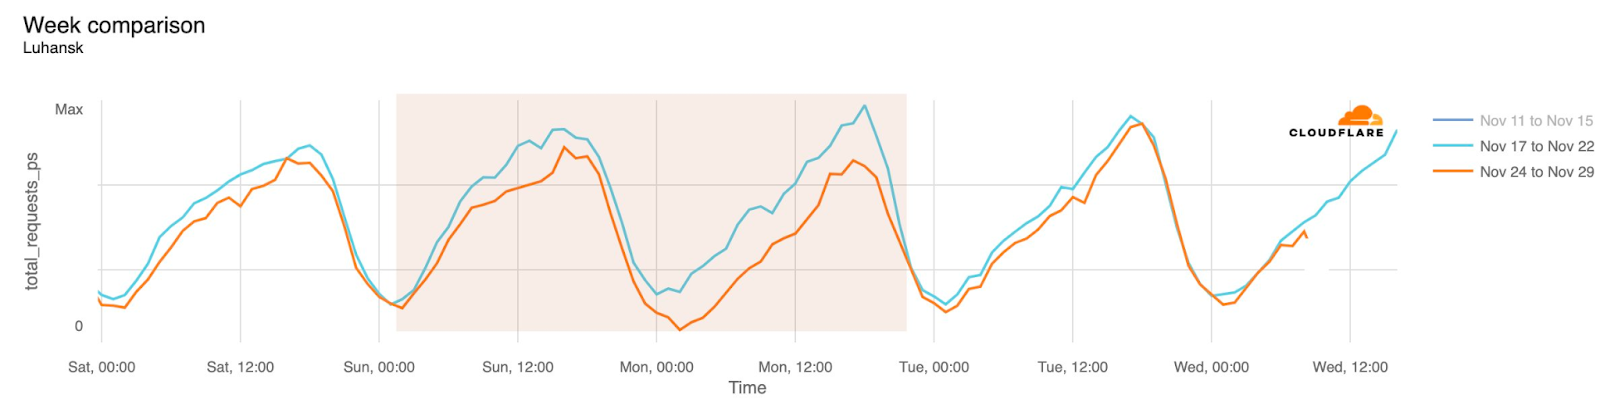
The length of the shutdowns varied by day — they all began at 07:00 local time (04:00 UTC), but the end times ranged between 09:45 -10:30 local time (06:45 – 07:30 UTC). The graphs below show the impact at a country level, as well as to AS29256 (Syrian Telecom), the primary telecommunications provider within the country.
On August 12, a round of baccalaureate exams began in Mauritania, and in an effort to prevent student cheating on the exams, the government instituted multiple Internet shutdowns that impacted several major mobile providers. Two shutdowns were observed on August 12, between 08:00 – 12:00 local time (08:00 – 12:00 UTC) and between 15:00 – 19:00 local time (15:00 – 19:00 UTC), and an additional one was observed on August 13, between 08:00 – 12:30 local time (08:00 – 12:30 UTC). Impacted network providers included AS37508 (Mattel), AS37541 (Chinguitel), and AS29544 (Mauritel). Announced IP address space for these networks remained unchanged during the shutdown periods, suggesting that that mobile subscriber connectivity was disabled, as opposed to the networks effectively being disconnected from the Internet, as we have seen in other countries.
Exam-related Internet shutdowns are, unfortunately, not new to Mauritania, as authorities in the country also implemented them between 2017 and 2020.
Cable cuts
Eswatini (Swaziland)
On July 14, MTN Eswatini (AS327765) informed customers via a post on X that “connection to the internet and data services is currently intermittent, because of fiber cable breaks resulting from wildfires.” This apparent connection disruption was visible in Cloudflare Radar between 19:30 and 20:15 local time (17:30 and 18:15 UTC).
Cameroon
In Cameroon, a fiber cut that occurred on August 4 during sanitation work disrupted mobile connectivity for Cameroon Telecommunications (AS15964 (Camtel)) customers for over half a day. According to a (translated) post on X from Camtel, “We inform you that due to the sanitation work carried out in the city of Yaoundé, at the place called Cradat, our Voice and Data services have been temporarily interrupted on the entire mobile network.” The observed disruption occurred between 03:00 – 16:30 local time (02:00 – 15:30 UTC). Although it initially started during a time when traffic was lower overnight anyway, both request and bytes traffic remained lower than the same time a week prior during the duration of the disruption.
Liberia
The Liberia Telecommunications Authority posted an announcement to their Facebook page on August 21 noting that “We have been informed by the CCL that the ACE Cable is experiencing interruptions.” (The Africa Coast to Europe (ACE) submarine cable connects multiple countries along the West Coast of Africa to Portugal and Europe.) The announcement further noted that the first signs of interruption occurred at 01:00 local time (and UTC), and that Lonestar Cell MTN (AS37410) was among the providers that had been “gravely affected” by the cut.
We observed traffic on Lonestar Cell MTN dropping just after 01:00, in line with the announcement. The network experienced a complete outage lasting over a day and a half, before traffic started to recover at 14:00 local time (and UTC) on August 22. In a Facebook post on August 22, Lonestar Cell MTN confirmed that Internet service had been restored, and that customer accounts would be credited with 500 MB of data for free.
Niger
A September 7 post on X from Airtel Niger alerted customers to Internet service disruptions caused by cuts on international fiber optic cables. As a land-locked country, Niger is dependent on terrestrial connections to networks in neighboring countries, but it isn’t clear which connection or country Airtel Niger’s post was referencing.
Two significant Internet disruptions were observed around the time of Airtel Niger’s post that we believe are related to the referenced fiber cuts. The first occurred between 18:00 – 21:00 local time (17:00 – 20:00 UTC) on September 6, visible at a country level and at a network level as well on AS37531 (Airtel Niger) and AS37233 (Orange Niger / Zamani Telecom). The second disruption occurred between 10:45 – 12:00 local time (09:45 – 11:00 UTC) on September 7, visible at a country level as well as on those two networks.
Haiti
Internet disruptions related to submarine cable failures often take a significant amount of time to resolve because of the challenges repair crews face in getting to, and accessing, the damaged portion of the cable, as it is frequently located deep underwater in the middle of an ocean. A September 14 submarine cable failure that impacted Digicel Haiti (AS27653) lasted for over a week for a similar, but slightly different, reason.
A significant loss of traffic on Digicel Haiti was first observed at 08:00 local time (12:00 UTC) on September 14. On September 16, Digicel Haiti posted a press release confirming that since September 14, a failure had been detected on an international submarine cable belonging to Cable and Wireless, and that the cable damage occurred at Kaliko Beach Club (the property is reportedly used as a cable entry point). Digicel noted that their technicians went to the scene of the damage immediately, but were denied access, apparently because of a business dispute dating back to 2021. The release also explained that technical teams had taken temporary steps to ensure the continuity of essential services, which prevented the incident from resulting in a complete loss of connectivity. On September 22, a subsequent press release posted by Digicel Haiti announced the restoration of Internet services as of 02:00 local time (06:00 UTC), and referenced vandalism as the cause of the cable damage.
The outage lasted for only an hour, between 15:45 and 16:45 local time (09:45 – 10:45 UTC), dropping both traffic and announced IP address space to zero. At a country level, traffic dropped as much as 72% as compared to the previous week. Given the complete loss of both traffic and IP address space, the damage likely occurred on the connection between Megacom and Rostelecom.
Severe weather
An active hurricane season during July, August, and September resulted in infrastructure damage caused by multiple hurricanes disrupting Internet connectivity in multiple places across the Caribbean and Southeastern United States.
Grenada & Saint Vincent and the Grenadines
At the start of the third quarter, Grenada and Saint Vincent and the Grenadines both suffered significant damage from Hurricane Beryl, reportedly causing destruction of infrastructure, buildings, agriculture, and the natural environment.
On July 1, traffic from Grenada dropped significantly at 10:00 local time (14:00 UTC), just ahead of landfall on Grenada’s Carriacou Island. The most significant impacts to traffic were seen for approximately the first 24 hours, though traffic did not return to expected pre-storm levels until around 10:00 local time (14:00 UTC) on July 5.
Internet traffic in Saint Vincent and the Grenadines was also disrupted by Hurricane Beryl, also falling at 10:00 local time (14:00 UTC). Similar to Grenada, the most significant impact was seen in the first 24 hours, with consistent gradual recovery seen after that time. However, traffic did not return to expected pre-storm levels until July 11.
Jamaica
As Hurricane Beryl continued across the Caribbean, it passed Jamaica on July 3. The associated damage that it caused impacted Internet connectivity on the island, with traffic dropping significantly around 14:00 local time (19:00 UTC). As the graph below shows, the disruption was preceded by higher than normal traffic volumes, presumably due to residents looking for information about Beryl. The disruption lasted nearly a week, with traffic returning to expected levels on July 10.
U.S. Virgin Islands
The following month, damage from Tropical Storm Ernesto caused power outages across the U.S. Virgin Islands, resulting in disruptions to Internet connectivity. Traffic from the islands dropped precipitously at 22:00 local time on August 13 (02:00 UTC on August 14) and remained lower for over two days, before returning to expected pre-storm levels around 11:00 local time (15:00 UTC) on August 16.
Bermuda
Over the course of the following few days, Ernesto strengthened from a tropical storm into a hurricane, but had weakened by the time it hit Bermuda on August 16/17. In this case, damage was reportedly limited to power outages, downed trees, and flooding, but even this limited damage disrupted Internet connectivity on the island. As the storm made landfall on the island, traffic levels dropped over 80% at 22:00 local time on August 16 (01:00 UTC on August 17). Traffic levels remained depressed for about two and a half days, recovering to expected levels around 09:00 local time (12:00 UTC) on August 19.
Nepal
Heavy rains in Nepal at the end of September resulted in flooding and landslides across much of the country, which in turn resulted in power outages and Internet disruptions. One such disruption believed to be associated with the impacts of the storm was observed on September 28, when AS23752 (Nepal Telecom), AS45650 (Vianet), AS139922 (Dishhome), and AS17501 (Worldlink) all saw traffic drop 50 – 70% between 14:15 – 16:00 local time (08:30 – 10:15 UTC).
United States
A disruption to traffic from AS11427 (Charter Communications/Spectrum) in Texas that occurred between 12:30 and 19:30 local time on July 9 (17:30 – 00:30 UTC) was caused by “a third-party infrastructure issue caused by the impact of Hurricane Beryl”, according to a July 9 post on X from the provider. Spectrum acknowledged the issue shortly after it began, and followed up again after service had been restored.
Hurricane Helene made landfall in northern Florida as a Category 4 storm late in the evening (local time) on September 26, and over the following hours and days, continued north through Georgia, South Carolina, and North Carolina, and into Tennessee. Even as it weakened, it caused historic flooding and damage to roads, homes, power lines, and telecommunications infrastructure. Below, we review the traffic impacts observed at a state level in three of the most impacted states, as well as exploring the impact at a network level for selected providers. (Doug Madory at Kentik published an excellent blog post exploring the impact of Helene from the perspective of their data, and the networks referenced below were informed by that post.)
Georgia
Helene entered Georgia early morning on Friday, September 27, and by midday (local time), peak traffic was approximately 20% lower than peak levels seen in the days ahead of the storm. (The lower peaks on September 28 & 29 are likely due to it being a weekend.) At a state level, peak traffic remained lower over the following week, with more recovery seen heading into the week of October 6.
One of the most significantly impacted network providers in Georgia was AS11240 (ATC Broadband), which saw traffic start to drop around 22:00 local time on September 26 (02:00 UTC on September 27). Subscribers and customers experienced a near complete outage until around 08:00 local time on September 30 (12:00 UTC), when traffic volumes slowly started to recover. The normal diurnal traffic pattern became more clear in the following days, with peak traffic levels continuing to increase over the next week as well.
The midday traffic peak on September 27 in South Carolina was just 65% of the preceding days, with the peaks remaining lower over the following two weekend days. Traffic remained somewhat lower during the week following Helene, with peak increases becoming more evident the week of October 6.
At AS19212 (Piedmont Rural Telephone) in South Carolina, traffic began to fall rapidly around midnight local time on September 27 (04:00 UTC), reaching a state of near complete outage over the next eight hours. A gradual recovery is visible over the following several days, with a more regular pattern becoming evident on October 1, with rapid growth over the following week, accelerating towards the end of the week.
Although a drop in traffic is visible in the graph for North Carolina on September 27, it occurs after a midday peak in line with previous days, and the magnitude is not as significant as that seen in South Carolina and Georgia. Traffic peaks over the following week are in line with the week preceding Helene’s arrival, with higher peaks seen the week of October 6.
North Carolina providers AS53488 (Morris Broadband) and AS53274 (Skyrunner) both experienced multi-day disruptions, likely related to damage from Helene. However, these disruptions took Morris Broadband completely offline several times over the course of a week — the announced IP address space graph below shows three distinct drops to zero, aligning with outages visible in the traffic graph, when the network was effectively disconnected from the Internet. A similar but less severe pattern was seen at Skyrunner, which lost 75-80% of announced IP address space for a two-day period covering September 27-29, aligning with an outage visible in the associated traffic graph.
A nationwide power outage in Venezuela on August 30 was, according to President Nicolás Maduro, the result of an attack on the Guri Reservoir, Venezuela’s largest hydroelectric project. A published report indicated that all 24 of the country’s states reported a total or partial loss of electricity supply. The loss of power unsurprisingly caused an Internet disruption, with country-level traffic dropping 82%, starting around 04:45 local time (08:45 UTC). Traffic began to increase as electricity returned to various parts of the country throughout the day, and returned to expected levels just after midnight local time on August 31 (04:00 UTC).
Kenya
On August 30, Kenya Power Care posted a Customer Alert on its Facebook page, issued at 21:57 local time (18:57 UTC), stating that “We have lost power supply to various parts of the country except North Rift region and sections of Western region.” Approximately a half hour before that alert, Kenya’s Internet traffic began to drop, falling as much as 61%. Just two hours later, Kenya Power Care posted a follow up, stating “Following the partial outage affecting several parts of the country this evening, we are pleased to report that power supply has now been restored to the entire Western region, as well as parts of Central Rift, South Nyanza, and Nairobi regions.” However, traffic did not return to expected levels for several more hours, taking until 06:00 local time (03:00 UTC).
A week later, on September 6, Kenya Power Care posted another similar Customer Alert, noting that “We are experiencing a power outage affecting several parts of the country, except sections of North Rift and Western regions.” This alert was issued at 09:20 local time (06:20 UTC), and follows a drop in Internet traffic that started around 09:00 local time (06:00 UTC). Traffic dropped approximately 45% during this power outage, and returned to expected levels around 16:00 local time (13:00 UTC). Traffic recovery aligns with a subsequent Customer Alert posted on Facebook, where Kenya Power Care stated “We are glad to report that normal electricity supply was restored across the country as at 3:49pm”.
A statement from Energy and Petroleum Cabinet Secretary Opiyo Wandayi, shared on Facebook by Kenya Power Care, explained the cause of the power outage: “Today, Friday 6th September 2024 at 8.56 am, the 220kV High Voltage Loiyangalani transmission line tripped at Suswa substation while evacuating 288MW from Lake Turkana Wind Power (LTWP) plant. This was followed by a trip on the Ethiopia – Kenya 500kV DC interconnector that was then carrying 200MW, resulting to a total loss of 488MW…”
Ecuador
According to a (translated) September 7 post on X from CENACE, the national electricity operator in Ecuador, “We inform the public that due to a fault in the Molino substation bar, which is connected to the Paute generation, there has been a power outage in some provinces of the country. Cenace’s technical team, in coordination with the distribution companies, is working to gradually restore electrical service. It is estimated that it will take 3 to 4 hours maximum for the supply to return to normal.” The post was published at 09:53 local time (14:53 UTC), approximately an hour after Internet traffic from the country began to drop. Traffic returned to expected levels just under four hours later, at around 12:30 local time (17:30 UTC), in line with CENACE’s predicted time for power to be fully restored.
On September 18/19, the first of several planned nightly power outages to enable needed grid maintenance in Ecuador disrupted Internet connectivity. Traffic dropped by over 60% as compared to the same time the prior week starting around 21:30 local (02:30 UTC), with the power outages reportedly scheduled for 22:00 – 06:00 local time. Internet traffic recovered to expected levels around 06:00 local time (11:00 UTC) as power was restored. Similar power cuts were reportedly planned from September 23 to September 27, but these power outages did not appear to impact traffic levels in Ecuador as compared to the previous week.
Senegal
Senegal’s power company, Senelec, posted a communiqué on X on September 12 that stated (translated) “Senelec informs its valued customers that an incident that occurred this morning at the Hann substation resulted in the loss of the OMVS interconnected network and disruptions to electricity distribution.” This disruption to electricity distribution also resulted in a disruption to Internet traffic, which dropped sharply at 13:00 local time (13:00 UTC), falling as much as 80%. Traffic recovered to expected levels by 20:00 local time (20:00 UTC) around the same time that Senelec posted a followup about the incident that stated (translated) “Effective restoration of electricity supply in all localities.”
Maintenance
Syria
As we discussed above, Internet users in Syria were impacted by an exam-related Internet shutdown from 07:00 – 10:15 local time (04:00 – 07:15 UTC) on July 30. However, just an hour after connectivity was restored, another disruption occurred, as seen in both the traffic and announced IP address space graphs below. According to a (translated) Facebook post from Syrian Telecom, “…during the periodic maintenance of one of the air conditioners in one of the technical halls, an explosion occurred, which caused the internet circuits to be temporarily out of service.” Traffic remained depressed for approximately eight hours, recovering to expected levels around 19:00 local time (16:00 UTC).
Cyberattack
Russia
Roskomnadzor, Russia’s Internet regulate, blamed a brief disruption in traffic observed in Russia and on AS12389 (Rostelecom) on August 21 on a distributed denial-of-service (DDoS) attack that targeted Russian telecommunications operators. The disruption was brief, lasting from around 13:45 until 14:30 Moscow time (10:45 – 11:30 UTC). Roskomnadzor subsequently stated “As of 3 PM Moscow time, the attack has been repelled, and services are operating normally.” The disruption reportedly impacted messaging services Telegram and WhatsApp, as well as Wikipedia, Yandex, VKontakte, telecom support services, and mobile banking apps. Some experts questioned the official explanation, suggesting instead that the disruption was due to centralized interference from Roskomnadzor.
Military action
Palestine
We have covered Internet disruptions related to the ongoing conflict in Gaza multiple times since October 2023, both on Cloudflare Radar’s presence on X, and on the Cloudflare blog (1, 2, 3). In many of these cases, Paltel (AS12975) has posted notices on social media regarding service disruptions and outages. On September 8, Paltel posted a message on its Facebook page, stating (translated) “We regret to announce the suspension of home internet services in the central and southern areas of the Gaza Strip, due to the ongoing aggression.”
Within the Gaza, Rafah, Deir al-Balah Governorates, we observed a sharp drop in traffic at 18:00 local time (16:00 UTC). The impact appeared to be most significant in Rafah and Deir al-Balah. Traffic returned to expected levels around 23:00 local time (21:00 UTC), and Paltel confirmed the service restoration in a subsequent Facebook post, stating (translated) “We would like to announce the return of home Internet services in central and southern Gaza Strip to the way it was before it was interrupted hours ago.”
Lebanon
Israeli airstrikes targeting the Lebanese capital of Beirut on September 28 likely knocked local network provider Solidere (AS42852) offline for several hours. The graph below shows a loss of traffic starting around 12:15 local time (10:15 UTC), at the same time a complete loss of announced IP address space occurred. Most of Solidere’s IP address space started to get announced again at 14:45 local time (12:45 UTC), and a slight increase in traffic was seen at that time as well. Traffic levels fully recovered just after 18:00 local time (16:00 UTC), and announced IP address space had stabilized by that time as well.
Fire
Algeria
A fire near a data center in Blida Province, Algeria disrupted connectivity on AS327931 (Djezzy) at 13:00 and local time (12:00 UTC) on July 24. According to a (translated) X post from Djezzy, “Djezzy announced fluctuations in its services in some areas of the country, as it was a victim of a fire that broke out on Wednesday, July 24, 2024, in a warehouse of one of the companies located near its technical center in the state of Blida.” The post from Djezzy predicted that “97% of the sites will be restored by around 3 am [July 25]”, but traffic did not return to expected levels until the end of the day on July 25.
Unknown
United States
On Monday, September 30, customers on Verizon’s mobile network in multiple cities across the United States reported experiencing a loss of connectivity. Impacted phones showed “SOS” instead of the usual bar-based signal strength indicator, and customers complained of an inability to make or receive calls on their mobile devices. Although initial reports of connectivity problems started around 09:00 ET (13:00 UTC), we didn’t see a noticeable change in request volume at an ASN level until about two hours later. AS6167 (CELLCO) is the autonomous system used by Verizon for its mobile network.
Just before 12:00 ET (16:00 UTC), Verizon published a social media post acknowledging the problem, stating “We are aware of an issue impacting service for some customers. Our engineers are engaged, and we are working quickly to identify and solve the issue.” As the graph below shows, a slight decline (-5%) in HTTP traffic as compared to traffic at the same time a week prior is first visible around 11:00 ET (15:00 UTC), and request volume fell as much as 9% below expected levels at 13:45 ET (17:45 UTC).
Media reports listed cities including Chicago, Indianapolis, New York City, Atlanta, Cincinnati, Omaha, Phoenix, Denver, Minneapolis, Seattle, Los Angeles, and Las Vegas as being most impacted. Traffic graphs illustrating the impacts seen in these cities can be found in our Impact of Verizon’s September 30 outage on Internet traffic blog post.
Traffic appeared to return to expected levels around 17:15 ET (21:15 UTC). At 19:18 ET (23:18 UTC), a social media post from Verizon noted “Verizon engineers have fully restored today’s network disruption that impacted some customers. Service has returned to normal levels.”
Pakistan
On July 31, Pakistan experienced a wide-scale Internet disruption that lasted approximately two hours, between 13:30 – 15:30 local time (08:30 – 10:30 UTC). Traffic only dropped ~45% at a country level, but AS17557 (PTCL) experienced a near complete loss of traffic, while traffic at AS24499 (Telenor Pakistan) dropped nearly 90%. Together, the two network providers serve an estimated nine million users, and are among the top five Internet service providers in the country.
The actual cause of the disruption is disputed. It was reported that the Pakistan Telecommunication Authority (PTA) attributed the disruptions to a technical glitch in the international submarine cable affecting the Pakistan Telecommunication Company Limited (PTCL) network. However, another published report noted “According to our sources, the government’s latest firewall edition to block the content was misconfigured, resulting in Internet connectivity disruption.” Additional details can be found in our August 1 blog post, A recent spate of Internet disruptions.
United Kingdom
On August 14, subscribers of UK service provider Vodafone (AS25135)reported problems accessing both mobile and landline Internet connections. Starting around 11:00 local time (10:00 UTC), we observed traffic starting to drop, ultimately falling 43% below the same time the prior week. The disruption was fairly short-lived, as traffic returned to expected levels by 13:30 local time (12:30 UTC). Vodafone did not acknowledge the issue on social media, nor did it provide a public explanation for what caused the disruption.
Conclusion
Although Internet disruptions observed during the third quarter had a variety of underlying causes, those caused by power outages due to aging or insufficiently maintained electrical infrastructure are worth highlighting. Of course, widespread power outages always create a massive inconvenience for impacted populations, but over the last several years, as communication, entertainment, commerce, and more have become increasingly reliant on the Internet, the impact of these outages has become even more significant, because losing electrical power largely means losing Internet connectivity. Although mobile connectivity may still be available in some cases, it is decidedly not a complete replacement, not to mention that mobile devices will eventually need to be recharged. While addressing the underlying infrastructure issues require non-trivial amounts of time, resources, and money, governments appear to be taking steps towards doing so.
Cloudflare Radar showcases global Internet traffic patterns, attack activity, and technology trends and insights. It is powered by data from Cloudflare’s global network, as well as aggregated and anonymized data from Cloudflare’s 1.1.1.1 public DNS Resolver, and is built on top of a rich, publicly accessible API. This API allows users to explore Radar data beyond the default set of visualizations, for example filtering by protocol, comparing metrics across multiple locations or autonomous systems, or examining trends over two different periods of time. However, not every user has the technical know-how to make a raw API query or process the JSON-formatted response.
Today, we are launching the Cloudflare Radar Data Explorer, which provides a simple Web-based interface to enable users to easily build more complex API queries, including comparisons and filters, and visualize the results. And as a complement to the Data Explorer, we are also launching an AI Assistant, which uses Cloudflare Workers AI to translate a user’s natural language statements or questions into the appropriate Radar API calls, the results of which are visualized in the Data Explorer. Below, we introduce the AI Assistant and Data Explorer, and also dig into how we used Cloudflare Developer Platform tools to build the AI Assistant.
Ask the AI Assistant
Sometimes, a user may know what they are looking for, but aren’t quite sure how to build the relevant API query by selecting from the available options and filters. (The sheer number may appear overwhelming.) In those cases, they can simply pose a question to the AI Assistant, like “Has there been an uptick in malicious email over the last week?” The AI Assistant makes a series of Workers AI and Radar API calls to retrieve the relevant data, which is visualized within seconds:
The AI Assistant pane is found on the right side of the page in desktop browsers, and appears when the user taps the “AI Assistant” button on a mobile browser. To use the AI Assistant, users just need to type their question into the “Ask me something” area at the bottom of the pane and submit it. A few sample queries are also displayed by default to provide examples of how and what to ask, and clicking on one submits it.
The submitted question is evaluated by the AI Assistant (more below on how that happens), and the resulting visualization is displayed in the Results section of the Data Explorer. In addition to the visualization of the results, the appropriate Data, Filter, and Compare options are selected in the Query section above the visualization, allowing the user to further tune or refine the results if necessary. The Keep current filters toggle within the AI Assistant pane allows users to build on the previous question. For example, with that toggle active, a user could ask “Traffic in the United States”, see the resultant graph, and then ask “Compare it with traffic in Mexico” to add Mexico’s data to the graph.
Building a query directly
For users that prefer a more hands-on approach, a wide variety of Radar datasets are available to explore, including traffic metrics, attacks, Internet quality, email security, and more. Once the user selects a dataset, the Breakdown By: dropdown is automatically populated with relevant options (if any), and Filter options are also dynamically populated. As the user selects additional options, the visualization in the Result section is automatically updated.
In addition to building the query of interest, Data Explorer also enables the user to compare the results, both against a specific date range and/or another location or autonomous system (AS). To compare results with the immediately previous period (the last seven days with the seven days before that, for instance), just toggle on the Previous period switch. Otherwise, clicking on the Date Range field brings up a calendar that enables the user to select a starting date — the corresponding date range is intelligently selected, based on the date range selected in the Filter section. To compare results across locations or ASNs, clicking on the “Location or ASN” field brings up a search box in which the user can enter a location (country/region) name, AS name, or AS number, with search results updating as the user types. Note that locations can be compared with other locations or ASes, and ASes can be compared with other ASes or locations. This enables a user, for example, to compare trends for their ISP with trends for their country.
Visualizing the results
Much of the value of Cloudflare Radar comes from its visualizations – the graphs, maps, and tables that illustrate the underlying data, and Data Explorer does not disappoint here. Depending on the dataset and filters selected, and the volume of data returned, results may be visualized in a time series graph, bar chart, treemap, or global choropleth map. The visualization type is determined automatically based on the contents of the API response. For example, the presence of countryalpha2 keys in the response means a choropleth map will be used, the presence of timestamps in the response means a line graph (“xychart”) should be shown, and more than 40 items in the response selects a treemap as the visualization type.
To illustrate the extended visualizations available in Data Explorer, the figure below is an expanded version of one that would normally be found on Radar’s Adoption & Usage page. The “standard” version of the graph plots the shares of the HTTP versions over the last seven days for the United States, as well as the summary share values. In this extended version of the graph generated in the Data Explorer, we compare data for the United States with HTTP version share data for AS701 (Verizon), for both the past seven days and the previous seven-day period. In addition to the comparisons plotted on the time series graph, the associated summary values are also compared in an accompanying bar chart. This comprehensive visualization makes comparisons easy.
For some combinations of datasets/filters/comparisons, time series graphs can get quite busy, with a significant number of lines being plotted. To isolate just a single line on the graph, double-click on the item in the legend. To add/remove additional lines back to/from the graph, single-click on the relevant legend item.
Similar to other visualizations on Radar, the resulting graphs or maps can be downloaded, copied, or embedded into another website or application. Simply click on the “Share” button above the visualization card to bring up the Share modal dialog. We hope to see these graphs shared in articles, blog posts, and presentations, and to see embedded visualizations with real-time data in your portals and operations centers!
Still want to use the API? No problem.
Although Data Explorer was designed to simplify the process of building, and viewing the results of, more complex API queries, we recognize that some users may still want to retrieve data directly from the API. To enable that, Data Explorer’s API section provides copyable API calls as a direct request URL and a cURL command. The raw data returned by the query is also available to copy or download as a JSON blob, for those users that want to save it locally, or paste it into another application for additional manipulation or analysis.
How we built the AI Assistant
Knowing all that AI is capable of these days, we thought that creating a system for an LLM to answer questions didn’t seem like an overly complex task. While there were some challenges, Cloudflare’s developer platform tools thankfully made it fairly straightforward.
LLM-assisted API querying
The main challenge we encountered in building the API Assistant was the large number of combinations of datasets and parameters that can potentially be visualized in the Data Explorer. There are around 100 API endpoints from which the data can be fetched, with most able to take multiple parameters.
There were a few potential approaches to getting started. One was to take a previously trained LLM and further train it with the API endpoint descriptions in order to have it return the output in the required structured format which would then be used to execute the API query. However, for the first version, we decided against this approach of fine-tuning, as we wanted to quickly test a few different models supported by Workers AI, and we wanted the flexibility to easily add or remove parameter combinations, as Data Explorer development was still under way. As such, we decided to start with prompt engineering, where all the endpoint-specific information is placed in the instructions sent to the LLM.
Putting the full detailed description of the API endpoints supported by the Data Explorer into the system prompt would be possible for an LLM with a larger context window (the number of tokens the model takes as input before generating output). Newer models are getting better with the needle in a haystack problem, which refers to the issue whereby LLMs do not retrieve information (the needle) equally well if it is placed in different positions within the long textual input (the haystack). However, it has been empirically shown that the position of information within the large context still matters. Additionally, many of the Radar API endpoints have quite similar descriptions, and putting all the descriptions in a single instruction could be more confusing for the model, and the processing time also increases with larger contexts. Based on this, we adopted the approach of having multiple inference calls to an LLM.
First, when the user enters a question, a Worker sends this question and a short general description of the available datasets to the LLM, asking it to determine the topic of the question. Then, based on the topic returned by the model, a system prompt is generated with the endpoint descriptions, including only those related to the topic. This prompt, along with the original question, is sent to the LLM asking it to select the appropriate endpoint and its specific parameters. At the same time, two parallel inference calls to the model are also made, one with the question and the system prompt related to the description of location parameters, and another with the description of time range parameters. Then, all three model outputs are put together and validated.
If the final output is a valid dataset and parameter combination, it is sent back to the Data Explorer, which executes the API query and displays the resulting visualization for the user. Different LLMs were tested for this task, and at the end, openhermes-2.5-mistral-7b, trained on code datasets, was selected as the best option. To give the model more context, not only is the user’s current question sent to the model, but the previous one and its response are as well, in case the next question asked by the user is related to the previous one. In addition, calls to the model are sent through Cloudflare’s AI Gateway, to allow for caching, rate limiting, and logging.
After the user is shown the result, they can indicate whether what was shown to them was useful or not by clicking the “thumbs up” or “thumbs down” icons in the response. This rating information is saved with the original question in D1, our serverless SQL database, so the results can be analyzed and applied to future AI Assistant improvements.
The full end-to-end data flow for the Cloudflare Radar AI Assistant is illustrated in the diagram below.
When the LLM doesn’t know the answer
In some cases, however, the LLM may not “know” the answer to the question posed by the user. If the model does not generate a valid final response, then the user is shown three alternative questions. The intent here is to guide the user into asking an answerable question — that is, a question that is answerable with data from Radar.
This is achieved using a previously compiled (static) list of various questions related to different Radar datasets. For each of these questions, their embedding is calculated using an embeddings model, and stored in our Vectorizevector database. “Embeddings” are numerical representations of textual data (vectors) capturing their semantic meaning and relationships, with similar text having vectors that are closer. When a user’s question does not generate a valid model response, the embedding of that question is calculated, and its vector is compared against all the stored vectors from the vector database, and the three most similar ones are selected. These three questions, determined to be similar to the user’s original question, are then shown to the user.
There are also cases when the LLM gives answers which do not correspond to what the user asked, as hallucinations are currently inevitable in LLMs, or when time durations are calculated inaccurately, as LLMs sometimes struggle with mathematical calculations. To help guard against this, AI Assistant responses are first validated against the API schema to confirm that the dataset and the parameter combination is valid. Additionally, Data Explorer dropdown options are automatically populated based on the AI Assistant’s response, and the chart titles are also automatically generated, so the user always knows exactly what data is shown in the visualization, even if it might not answer their actual question.
Looking ahead
We’re excited to enable more granular access to the rich datasets that currently power Cloudflare Radar. As we add new datasets in the future, such as DNS metrics, these will be available through Data Explorer and AI Assistant as well.
As noted above, Radar offers a predefined set of visualizations, and these serve as an excellent starting point for further exploration. We are adding links from each Radar visualization into Data Explorer, enabling users to further analyze the associated data to answer more specific questions. Clicking the “pie chart” icon next to a graph’s description brings up a Data Explorer page with the relevant metrics, options, and filters selected.
Correlating observations across two different metrics is another capability that we are also working on adding to Data Explorer. For example, if you are investigating an Internet disruption, you will be able to plot traffic trends and announced IP address space for a given country or autonomous system on the same graph to determine if both dropped concurrently.
But for now, use the Data Explorer and AI Assistant to go beyond what Cloudflare Radar offers, finding answers to your questions about what’s happening on the Internet. If you share Data Explorer visualizations on social media, be sure to tag us: @CloudflareRadar (X), noc.social/@cloudflareradar (Mastodon), and radar.cloudflare.com (Bluesky). You can also reach out on social media, or contact us via email, with suggestions for future Data Explorer and AI Assistant functionality.
Cloudflare Radar is constantly monitoring the Internet for widespread disruptions. In mid-July, we published our Q2 2024 Internet Disruption Summary, and here we examine recent several noteworthy disruptions detected in the first month of Q3, including traffic anomalies observed in Bangladesh, Syria, Pakistan, and Venezuela.
Bangladesh
Violent student protests in Bangladesh against quotas in government jobs and rising unemployment rates led the government to order the nationwide shutdown of mobile Internet connectivity on July 18, reportedly to “ensure the security of citizens.” This government-directed shutdown ultimately became a near-complete Internet outage for the country, as broadband networks were taken offline as well. At a country level, Internet traffic in Bangladesh dropped to near zero just before 21:00 local time (15:00 UTC). Announced IP address space from the country dropped to near zero at that time as well, meaning that nearly every network in the country was disconnected from the Internet.
However, ahead of this nationwide shutdown, we observed outages across several Bangladeshi network providers, perhaps foreshadowing what was to come. At AS24389 (Grameenphone), a complete Internet outage started at 01:30 local time on July 18 (19:30 UTC on July 17), with a total loss of both Internet traffic and announced IP address space.
In the days before the shutdown, both median bandwidth and latency at a country level for Bangladesh were fairly stable. However, Cloudflare Radar’s Internet Quality measurements at a country level show a clear increase in median bandwidth and a concurrent drop in median latency, both likely due to the loss of measurements from mobile network providers as they disconnected from the Internet.
Five days after the full Internet shutdown started, broadband Internet services providers in Bangladesh began to restore connectivity on July 23. The initial restoration was characterized as a “trial run”, prioritizing banking, commercial sectors, technology firms, exporters, outsourcing providers and media outlets, according to the state minister for post, telecommunication and information technology. Announced IP address space began to increase around 19:00 local time (13:00 UTC), with traffic volumes beginning to trend upwards at that same time, as selected networks reconnected to the Internet.
Unfortunately, Syria is no stranger to Internet shutdowns, as they occur yearly during nationwide exams, implemented with the intent of preventing cheating on those exams. Our recent blog post titled Exam-ining recent Internet shutdowns in Syria, Iraq, and Algeria examined the first round of 2024 exams, which took place between May 26 and June 13.
A second round of exams, and with them, multi-hour Internet shutdowns, began on July 25, and seen in the schedules below, published by Syrian Telecom on its Facebook page (English translation via Google Lens).
The Internet shutdowns implemented for the first four days of tests are clearly visible in the graph below, occurring on July 25, 28, 29, and 30.
However, you will also note another disruption is visible in both Syria’s Internet traffic and announced IP address space shortly after the planned shutdown on July 30. According to a (translated) Facebook post from Syrian Telecom, “while performing regular maintenance on one of the air conditioners located in one of the technical halls [data centers], an explosion occurred, causing the Internet circuits to temporarily go out of service.” This issue resulted in a disruption lasting approximately eight hours, between 11:00 – 19:00 local time (08:00 – 16:00 UTC) seen in both traffic and announced IP address space graphs for AS29256 (Syrian Telecom).
Pakistan
Closing out the month, on July 31, Pakistan experienced a wide-scale Internet disruption that lasted approximately two hours, between 13:30 – 15:30 local time (08:30 – 10:30 UTC). Traffic only dropped ~45% at a country level, but AS17557 (PTCL) experienced a near complete loss of traffic, while traffic at AS24499 (Telenor Pakistan) dropped nearly 90%. Together, the two network providers serve an estimated nine million users, and are among the top five Internet service providers in the country.
It was reported that the Pakistan Telecommunication Authority (PTA) attributed the disruptions to a technical glitch in the international submarine cable affecting the Pakistan Telecommunication Company Limited (PTCL) network. However, another published report noted “According to our sources, the government’s latest firewall edition to block the content was misconfigured, resulting in Internet connectivity disruption.” (Some additional information about the firewall can be found in this article.) The graphs below are from forthcoming TCP reset/timeout data on Cloudflare Radar, and show increased numbers of connections terminating immediately after the initial synchronization (SYN) packet used to establish new TCP connections (“Post SYN”) between 13:30 – 15:30 local time (08:30 – 10:30 UTC) on PTCL and Telenor Pakistan, coincident with the observed disruption. In other words, the rate of SYN packets arriving at Cloudflare was mostly consistent during the disruption, but there was a drop in other TCP packets, suggesting that the firewall explanation may be plausible.
A Facebook post from the Pakistan Telecommunication Authority (PTA) simply highlighted that the issue had been resolved, and that “The exact issue is being investigated by PTA to avoid such instances in future.”
Regardless of the actual cause, the disruption had a clear impact on the country’s financial markets, with a published report stating “The KSE-100 index suffered a sharp decline on Wednesday, plummeting over 740 points in the final hour of trading amid a nationwide internet outage. Analysts attributed the sudden drop to panic selling as investors struggled with limited market data.”
Venezuela
In the past, some countries have implemented government-directed Internet shutdowns as a means of limiting communication about or organizing of protests and demonstrations associated with contested elections. Although such protests and demonstrations sprang up in the wake of a contested presidential election in Venezuela that took place on July 28, Internet shutdowns did not follow. However, in monitoring Internet traffic in Venezuela during the days around the election, the Cloudflare Radar team did observe several notable drops in traffic, as compared to the same times the week prior.
After surging 35% at 05:00 local time (09:00 UTC) on Sunday, July 28 (election day), traffic dropped after the polls opened, down by as much as 23% at 09:00 local time (13:00 UTC). On July 29, the day following the election, traffic was as much as 28% lower than the same time the previous week at 06:15 local time (10:15 UTC) and 18:45 local time (22:45 UTC).
And while the observed drops in traffic appeared to be organic, and not caused by an Internet shutdown, it is worth noting that multiple websites are being blocked in Venezuela. An Internet Society Pulse blog post, published two days ahead of the election, reports that “Around 60 websites are currently blocked in Venezuela, including eight media sites and three that fact-check news and misinformation.”, citing data from the Open Observatory of Network Interference (OONI).
Cloudflare’s network spans more than 320 cities in over 120 countries, where we interconnect with over 13,000 network providers in order to provide a broad range of services to millions of customers. The breadth of both our network and our customer base provides us with a unique perspective on Internet resilience, enabling us to observe the impact of Internet disruptions. Thanks to Cloudflare Radar functionality released earlier this year, we can explore the impact from a routing perspective, as well as a traffic perspective, at both a network and location level.
As we have seen in previous years, nationwide exams take place across several MENA countries in the second quarter, and with them come government directed Internet shutdowns. Cable cuts, both terrestrial and submarine, caused Internet outages across a number of countries, with the ACE submarine cable being a particular source of problems. Maintenance, power outages, and technical problems also disrupted Internet connectivity, as did unknown issues. And as we have frequently seen in the two-plus years since the conflict began, Internet connectivity in Ukraine suffers as a result of Russian attacks.
As we have noted in the past, this post is intended as a summary overview of observed disruptions, and is not an exhaustive or complete list of issues that have occurred during the quarter.
Government directed
Syria, Algeria, Iraq
Each spring, governments in several countries in the Middle East and North Africa (MENA) region order local telecommunications providers to shut down or disrupt Internet connectivity across the country in an effort to prevent students from cheating on national secondary and high school exams. These shutdowns/disruptions generally occur for several hours per day over a multi-week period. We covered such events in 2023, 2022, and 2021, as they occurred in locations including Syria, Sudan, Algeria, and Iraq.
In June, we published Exam-ining recent Internet shutdowns in Syria, Iraq, and Algeria, which examined the daily Internet shutdowns that took place in Iraq and Syria, as well as the two multi-hour daily disruptions in Algeria, which appeared to be pursuing a content blocking strategy, rather than a full nationwide shutdown. The post examined the impact that these shutdowns have on Internet traffic, and also analyzed routing information and traffic from other Cloudflare services in an effort to better understand how these shutdowns are being implemented.
In addition to the shutdowns covered in the previously referenced blog post, Iraq implemented a second round of shutdowns that started on June 23, and ran through at least July 14. Some of these shutdowns impacted the same set of networks seen in the first round, and some impacted networks in the autonomous Kurdistan region in the north.
Both sets of shutdowns reviewed above appeared to have followed the same approach as the first round covered in the earlier blog post.
Kenya, Burundi, Uganda, Rwanda, Tanzania
Concerns over a potential Internet shutdown during planned protests against tax increases proposed in “Finance Bill 2024” by the Kenyan government led to the publication of a joint statement signed by multiple organizations. The statement strongly urged the Kenyan government to refrain from enforcing any
Internet shutdowns or information controls, and highlighted the “disastrous economic effects” such a move could have. In response, the Communications Authority of Kenya issued a press release stating that “For the avoidance of doubt, the Authority has no intention whatsoever to shut down Internet traffic or interfere with the quality of connectivity. Such actions would be a betrayal of the Constitution as a whole, the freedom of expression in particular and our own ethos.”
As protests escalated on June 25, Internet traffic in Kenya dropped at 16:30 local time (13:30 UTC). Initially, this outage was thought to be due to issues with one or more undersea cables that provide international connectivity to the country, with the potential cause supported by social media posts from Safaricom and Airtel.
Similar concurrent drops in Internet traffic were observed in Burundi, Uganda, Rwanda, and Tanzania, as shown below. Issues with submarine cables connected to one country can impact Internet connectivity in other countries if there is a dependency on that country/cable for upstream Internet connectivity. As such, the observed disruptions in those four countries were not that unusual. To that end, a (subsequently deleted) post on X from MTN Uganda noted: “Our esteemed customers, We are experiencing a degraded service on all our internet services due to an outage caused by our connectivity supply through Kenya. Our technical teams and partners are working jointly to resolve the issue in the shortest time possible. In the interim, we kindly advise our customers to use *165# to access Mobile Money and other app based services. Thank you.“
However, other participants in the Internet infrastructure community in Africa called the undersea cable outage explanation into question. Kyle Spencer, Executive Director of the Uganda Internet eXchange Point, posted on X that “I am told the Kenyan government ordered sea cable landing stations to disconnect circuits.” Ben Roberts, Group CTIO at Liquid Intelligent Technologies (a pan-African network infrastructure provider), posted “No cables are damaged this week.” In addition, outages on undersea cables are rarely, if ever, resolved in a matter of hours, as this disruption was – they frequently last for days or weeks.
On June 26, Safaricom’s CEO claimed “This outage was occasioned by reduced bandwidth on some cables that carry Internet traffic”, contradicting the company’s original claim. No additional information was forthcoming from Airtel or the Communications Authority of Kenya, but as noted above, some within the industry believe that the disruption that impacted connectivity in Kenya, Burundi, Uganda, Rwanda, and Tanzania was directed by the government of Kenya, and was not caused by submarine cable outages.
Cable cuts
Haiti
At 17:36 local time (21:36 UTC) on April 28, Digicel Haiti posted an “important note” on X that stated in part (translated) “On April 27, 2024, the company suffered several attacks on its international optical infrastructure in the Drouya area on National Road #1. The optical fiber was damaged by the impact of cartridges after the armed clashes in the area for a few days. It affected several services such as internet (data), SMS, MonCash and international calling. For now, we are happy to inform the population that all services are restored to 100%.” The graph below shows the impact of the fiber damage, with AS27653 (Digicel Haiti) suffering an Internet outage lasting nearly 24 hours, from around 17:30 local time (21:30 UTC) on April 27 through approximately 16:00 local time (20:00 UTC) on April 28, after which traffic quickly recovered.
Then on May 3, The Director General of Digicel Haiti posted on X that (translated) “Digicel is informing the general public that it suffered two more damages to its international fiber infrastructure at 2am this morning. We have restored Moncash services, SMS, and Fiber Optic connections. Our crews are already on their way to address the apparent landslide in the Canaan area.” The disruption caused by this fiber damage lasted for approximately eight hours, between 02:15 – 10:30 local time (06:15 – 14:30 UTC), and as seen in the graph below, appeared to have a nominal impact on traffic.
On Sunday, May 12, issues with the EASSy and Seacom submarine cables again disrupted connectivity to East Africa, impacting a number of countries previously affected by a set of cable cuts that occurred nearly three months earlier. Insight into these earlier cable cuts and the initial impact of May’s cable damage was covered in our East African Internet connectivity again impacted by submarine cable cuts blog post.
Traffic levels across a number of the impacted countries dropped just before 11:00 local time (08:00 UTC). The magnitude of the initial impact varied by country, with traffic initially dropping by 10-25% in Kenya, Uganda, Madagascar, and Mozambique, while traffic in Rwanda, Malawi, and Tanzania dropped by one-third or more than compared to the previous week. The overall impact was most significant in Tanzania, Madagascar, and Rwanda, as seen in the graphs below. Traffic returned to expected levels at various times over the following week, ranging from a day and a half later (May 13) in Kenya to a week later (May 19) in Rwanda.
Repairs to the EASSy and Seacom cables were completed on May 31. Repairs to the cables damaged in February were ongoing as of July 9, as their location in a war zone complicates repair efforts.
Chad
A reported fiber optic cable cut in Cameroon disrupted Internet connectivity for customers of Moov Africa TChad on May 25. The outage lasted three hours, between 15:15 -18:15 local time (14:15 – 17:15 UTC), with the impact visible at a country level as well. Routing was disrupted too, as the number of IPv4 /24 prefixes (256 IPv4 addresses) announced by Moov Africa Tchad fell from eight to three during the disruption.
The event was similar to one that occurred on January 10, when Moov Africa Tchad and country-level traffic was disrupted for over 12 hours “due to a cut in the optical fiber coming from Cameroon through which Chad has access to the Internet”. During that event, significant volatility was also observed from a routing perspective, as the volume of announced IPv4 address space shifted frequently at a network and country level during the disruption. As we noted last quarter, as a landlocked country, Chad is dependent on terrestrial Internet connections to/through neighboring countries, and the AfTerFibre cable map illustrates Chad’s reliance on limited cable paths through Cameroon and Sudan.
Gambia, Mauritania, Senegal
A reported “network interruption” on the Africa Coast to Europe (ACE) submarine cable disrupted traffic across networks in the Gambia, Mauritania, and Senegal on June 5. AS25250 (Gamtel), AS29544 (Mauritel), and AS37649 (Free/Tigo) all saw traffic drop around 23:00 local time (23:00 UTC). As seen in the graphs below, the outage lasted for nearly 11 hours, with traffic recovering just 10:00 local time on June 6 (10:00 UTC). Mauritel saw a near complete outage, while Gamtel and Free/Tigo saw less severe impacts, possibly because they were able to shift traffic to back up links.
Maintenance
Guinea, Gambia, Sierra Leone, Liberia
Above, we discussed an unexpected network interruption on the ACE submarine cable that caused outages across multiple countries on June 5. However, two months earlier, a planned outage for repair work on the cable also disrupted connectivity across multiple African countries. A communiqúe issued by the Ministry of Posts, Telecommunications and the Digital Economy in Guinea noted in part (translated) “…the ACE (Africa Coast to Europe) network will undergo a planned outage on April 8, 2024, between midnight and 2:00 a.m. morning in the following countries: Guinea, Senegal, Gambia, Sierra Leone and Liberia. This total outage of approximately 2 hours will affect Internet traffic and international calls.”
The graphs below show the impact to traffic in the listed countries for the planned two-hour repair window, though it appears that traffic did not return fully to expected levels after the repair window concluded – it is unclear why it remained slightly depressed. In addition, despite being listed as one of the impacted countries, no impact to traffic was observed in Senegal.
Guinea
Rounding out a trifecta of entries about the ACE submarine cable, planned maintenance work on the cable by GUILAB reportedly caused a multi-hour outage at AS37461 (Orange Guinea) and at a country level as well, lasting from 12:15 – 15:45 local time (12:15 – 15:45 UTC). (GUILAB is the company in charge of managing the capacity allocated to Guinea on the ACE submarine cable.) The maintenance work was reported by Orange Guinea in two X posts (1, 2), although these posts were subsequently deleted.
Power outage
Kenya
At 18:30 local time (15:30 UTC) on May 2, Kenya Power posted a “Power Outage Alert” on X that stated “At 5:40 PM (EAT) today, Thursday, 2nd May 2024, we experienced a system disturbance on the grid, resulting in power supply disruption in most parts of the country.” The graph below shows the resultant impact on Internet connectivity in the country, with traffic dropping sharply between 17:30 – 17:45 local time (14:30 – 14:45 UTC). The drop in traffic lasted until approximately 21:30 local time (18:30 UTC), the same time that Kenya Power posted a “Power Supply Restoration” notice on X, highlighting the restoration of power to parts of the country. Although the post-outage spike seen in the graph would suggest pent-up demand for online content, a longer-term view of Kenya’s Internet traffic shows traffic peaks at the same time (22:00 local time, 19:00 UTC) during the preceding two days as well.
Ecuador
A nationwide power outage in Ecuador on June 19 impacted hospitals, homes, and the subway, in addition to causing a major disruption to Internet connectivity. The graph below shows Ecuador’s Internet traffic dropping sharply just after 15:00 local time (20:00 UTC). A post on X from Public Works Minister Roberto Luque explained (translated) “The immediate report that we received from CENACE is that there is a failure in the transmission line that caused a cascade disconnection, so there is no energy service on a national scale.” A subsequent post pointed at a lack of investment in the underlying systems, and noted that as of 18:41 pm local time (23:41 UTC), “95% of the energy has already been restored”. After the initial sharp drop, traffic began to recover fairly quickly, and was effectively back to expected levels by the stated time.
Albania, Bosnia, Montenegro
A sudden increase in power consumption related to increased usage due to high temperatures, as well electrical systems being impacted by the heat, caused a widespread power outage across Montenegro, Bosnia, and Montenegro on June 21. The outage reportedly originated in Montenegro after a 400-kilowatt transmission line exploded. While power outages are generally more localized to a single country, or region within a country, power distribution systems are linked across Balkan countries as part of the Trans-Balkan Electricity Corridor.
Published reports (MSN, Reuters) noted that electrical networks went down 12:00 – 13:00 local time (10:00 – 11:00 UTC), and that electricity suppliers in the impacted countries started restoring power by mid-afternoon, and had it largely restored by the evening. The graphs below show traffic from Albania, Bosnia, and Montenegro starting to drop around 12:00 local time (10:00 UTC), reaching its nadir in Albania and Bosnia at 12:30 local time (10:30 UTC) and at 13:00 local time (11:00 UTC) in Montenegro. Traffic recovered gradually over the next several hours as power was restored, returning to expected levels by 15:30 local time (13:30 UTC).
Croatia was reportedly impacted by the power outage as well, but no adverse impact to traffic at a country level is visible during the timeframe that connectivity in the other countries was disrupted.
Military action
Ukraine
During the two-plus years of the Russia-Ukraine conflict, Ukraine’s power grid has been a frequent target for Russian air attacks. When damage to Ukraine’s electrical power infrastructure occurs as a result of these attacks, Internet connectivity is also disrupted. Attacks on May 21 caused power outages across a number of areas in Ukraine. The most significant impact was in Sumy, where traffic dropped as low as 82% below the previous week at 00:00 on May 22 local time (21:00 UTC). As the graphs below illustrate, traffic was also lower than the previous week for several hours in Kyiv, Kharkiv, and Vinnytsia, with traffic returning to expected levels by around 08:00 local time (05:00 UTC) on May 22.
\
Technical problems
Malaysia
As we’ve covered in previous quarterly posts, Internet outages and disruptions aren’t always due to significant wide-scale events like severe weather, power outages, or cable cuts. Sometimes more mundane technical issues can cause problems when users try to access the Internet. One example of this occurred on April 15 in Malaysia, when customers of Time Internet experienced a network outage for nearly two hours. The company explained the reason for the outage in a contrite post on their Facebook page, stating in part “This Internet service outage was by far the worst in our history – affecting approximately 40% of our customers. … At 5.38pm today, both our primary and secondary Secure DNS servers became unreachable. This means that any browser or service requiring a DNS address resolution was not able to reach its intended site.” Because subscribers could not reach Time Internet’s DNS resolvers, they were unable to resolve hostnames for Internet services, sites, and applications, including those delivered by Cloudflare. This resulted in the drop in traffic seen in the graph below, which started just after 17:00 local time (05:00 UTC), and began to recover approximately an hour later. The company did not provide any additional information on what caused the DNS servers to fail.
Nepal
In Nepal, a number of local Internet service providers including AS45650 (Vianet) and AS139922 (Dishhome) rely on Indian provider Bharti Airtel for upstream connectivity, enabling them to reach the rest of the Internet. A published report underscores the reliance, noting “Nepali ISPs buy 70 percent of their internet from Airtel.”
On April 25, these ISPs warned that their services could be interrupted because the Nepali government had not provided them with foreign exchange services that would enable them to pay bandwidth vendors such as Airtel, whom they reportedly owed USD $30 million to. On May 1, Airtel informed the delinquent Nepali providers that Internet services may be interrupted at any time due to the overdue payment, and on May 2, Airtel took that step. The graphs below show Vianet’s traffic dropping to near zero at 16:15 local time (10:30 UTC), recovering to expected levels six hours later. An hour later, at 17:15 local time (11:30 UTC), Dishhome’s traffic dropped significantly, though not as severely as Vianet’s. Dishhome’s traffic also recovered approximately six hours later.
A month later, on June 3, AS45650 (Vianet) and AS17501 (Worldlink) in Nepal experienced Internet disruptions that were reportedly caused by routing issues on Bharti Airtel’s network. On Worldlink, a drop in traffic occurred between 12:15 – 14:00 local time (06:30 – 08:15 UTC), while on Vianet, the loss of traffic took place between 12:15 – 13:15 local time (06:30 – 07:30 local time).
Unknown
Most of the Internet disruptions covered in this blog post series have a known root cause, whether admitted/stated by the impacted provider(s) or closely associated with a real world event (severe weather, power outage, etc.) However, other disruptions are observed and even publicized by the impacted provider, but no underlying reason for the outage is ever made public.
Malaysia
On May 21, CelcomDigi (AS10030)posted on X that it was experiencing an outage on its network, and that it was working to resolve the issue as soon as possible. However. just 12 minutes later, it published a second post stating that it had fully restored Celcom Internet service. These posts were made at 21:35 and 21:47 local time (13:35 and 13:47) respectively. However, as the graph below shows, traffic volumes had returned to expected levels over an hour earlier, as the observed Internet disruption on Celcom’s network lasted between 18:00 – 20:15 local time (10:00 – 12:15 UTC). (Note that the second disruption shown in the graph below was due to an internal Cloudflare data pipeline issue, and not any sort of problem with Celcom’s network.)
Starlink
SpaceX Starlink’s satellite Internet service is unique in that it has an international subscriber base, so outages on its network have a more wide-reaching impact than issues with an ISP that covers a single country. At 01:59 UTC on May 29, Starlinkshared on X that it was currently experiencing a network outage, and that it was actively implementing a solution. Twenty-eight minutes later, it posted “The network issue has been fully resolved.” This brief outage is visible in the graph below as a slight dip in traffic. However, what is particularly interesting is the spike in traffic to Cloudflare from Starlink’s network following the resolution of the outage. The sharp increase and rapid decline of the traffic curve after service was restored suggests that it may be related to an automated connectivity check of some kind, rather than pent-up user demand for content.
Chad
A near-complete Internet outage was observed in Chad on June 5 between 08:15 – 12:00 local time (07:15 – 11:00 UTC), as seen in the graph below. Routing was also impacted, as the number of IPv4 /24 address blocks (256 IPv4 addresses) announced by network providers in the country dropped by as much as 75% during the outage.
A news item covering the outage noted that only Starlink subscribers retained Internet access during the outage. It also noted that Chad has faced recurring Internet disruptions since 2016, either because of problems with fiber-optic cables, or due to government directed shutdowns in the name of national security. It is unclear what ultimately caused this particular outage.
India
With an estimated subscriber base in excess of over 460 million, any Internet disruption affecting Reliance Jio’s network (AS55836) is going to have a widespread impact across India. On June 18, Reliance Jio experienced two disruptions that occurred between 13:15 – 17:15 local time (07:45 – 11:45 UTC). Each disruption lasted less than an hour, and dropped traffic levels to approximately half of those seen at the same time a week prior. Both mobile and fiber connectivity was affected, and no additional information has been provided by Reliance Jio regarding the root cause of the connectivity issues.
Conclusion
As we become increasingly dependent on reliable Internet connectivity, we must recognize that that connectivity is itself reliant on a complex and interconnected foundation of physical, technical, and political factors. A failure in any one of these foundational components, whether due to a cable cut, power outage, misconfiguration, or government action, can have a significant impact, disrupting Internet connectivity for millions of users, potentially across multiple countries. While the resilience and reliability of the physical and technical components can be improved through redundancy and best practices, political factors have arguably proven to be the hardest to address. However, organizations like AccessNow, through their #KeepItOn campaign, mobilize people, communities, and civil society actors globally to fight against government-directed Internet shutdowns, which can have significant financial consequences.
Cloudflare’s network spans more than 310 cities in over 120 countries, where we interconnect with over 13,000 network providers in order to provide a broad range of services to millions of customers. The breadth of both our network and our customer base provides us with a unique perspective on Internet resilience, enabling us to observe the impact of Internet disruptions. Thanks to recently released Cloudflare Radar functionality, this quarter we have started to explore the impact from a routing perspective, as well as a traffic perspective, at both a network and location level.
The first quarter of 2024 kicked off with quite a few Internet disruptions. Damage to both terrestrial and submarine cables caused problems in a number of locations, while military action related to ongoing geopolitical conflicts impacted connectivity in other areas. Governments in several African countries, as well as Pakistan, ordered Internet shutdowns, focusing heavily on mobile connectivity. Malicious actors known as Anonymous Sudan claimed responsibility for cyberattacks that disrupted Internet connectivity in Israel and Bahrain. Maintenance and power outages forced users offline, resulting in observed drops in traffic. And in a more unusual turn, RPKI, DNS, and DNSSEC issues were among the technical problems that disrupted connectivity for subscribers across multiple network providers.
As we have noted in the past, this post is intended as a summary overview of observed disruptions, and is not an exhaustive or complete list of issues that have occurred during the quarter.
Cable cuts
Moov Africa Tchad
Reported fiber optic cable damage that occurred in Cameroon on January 10 further disrupted connectivity for customers of AS327802 (Moov Africa Tchad / Millicom) a telecommunications provider in Chad. According to a (translated) Facebook post from Moov Africa Tchad, “On the afternoon of January 10, 2024, there was a breakdown of the internet due to a cut in the optical fiber coming from Cameroon through which Chad has access to the internet, the one coming from Sudan being unavailable for a while.” It is unclear whether the referenced cable cut occurred in Cameroon or Chad, and the mentioned Sudan cable issue may be the one covered in our Q4 2023 summary post. As a landlocked country, Chad is dependent on terrestrial Internet connections to/through neighboring countries, and the AfTerFibre cable map illustrates Chad’s reliance on limited cable paths through Cameroon and Sudan.
The graphs below show that Moov Africa Tchad traffic was disrupted for over 12 hours starting midday (UTC) on January 10, and the disruption was visible at a country level as well. The fiber cut also resulted in significant volatility from a routing perspective, as the volume of announced IPv4 address space shifted frequently at a network and country level during the disruption.
On February 15, a brief (~30 minute) but complete significant Internet disruption was observed at AS37577 (Orange Burkina Faso). According to the translation of a communiqué posted by the provider on social media, “The incident is due to a fiber cut, which causes a disruption of Internet services for certain customers.” Orange did not specify whether it was a more localized fiber cut, or damage to one of the terrestrial fibers that cross the country. The incident took the network completely offline, as the ASN’s amount of announced IPv4 address space dropped to zero for the duration.
MTN Nigeria
MTN Nigeria turned to social media on February 28 to let customers know that “You have been experiencing challenges connecting to the network due to a major service outage caused by multiple fibre cuts, affecting voice and data services.” A published report described the impact, noting “Millions of customers nationwide were impacted by the hours-long outage, especially in Lagos.” Connectivity was disrupted for approximately seven hours between 13:30 – 20:30 local time (12:30 – 19:30 UTC), and the provider posted a followup note just before midnight local time stating that service had been fully restored.
Digicel Haiti
A 16-hour Internet disruption on March 2/3 at AS27653 (Digicel Haiti) was due to a double fiber cut as a result of violence related to attempts to oust Prime Minister Ariel Henry. Starting around 22:00 local time on March 2 (03:00 on March 3), a complete outage was observed for approximately nine hours. Some recovery in traffic occurred for approximately two-and-a-half hours, followed by a three hour near-complete disruption. Digicel Haiti effectively disappeared from the Internet during the nine-hour outage, as no IPv4 or IPv6 address space was announced by the network during that time.
SKY (Philippines)
A brief traffic disruption observed on AS23944 (SKY) in the Philippines on March 18 was likely related to a fiber cut. In an advisory posted by SKY on social media, they stated that “SKY services in several areas in Marikina, Pasig and Quezon City are currently affected by a cut-fiber issue”, listing 45 affected areas. Traffic was most significantly impacted between 20:00 – 21:00 local time (12:00 – 13:00 UTC), although full recovery took several more hours. Only a minor impact to routing resulting from the fiber cut was observed.
Multiple African countries
On March 14, damage to multiple submarine cables off the west coast of Africa impacted Internet connectivity across multiple countries in West and Southern Africa. The damage was reportedly caused by underwater rock falls, and in addition to disrupting Internet connectivity, also caused availability issues for Microsoft Azure and Office 365 cloud services.
Comparatively brief disruptions were observed in Niger, Guinea, and Gambia, lasting from under an hour to approximately two hours.
However, the disruptions stretched out across multiple days in countries including Togo, Liberia, and Ghana, where it took several weeks for traffic to return to previously observed peak levels.
Operators in impacted countries attempted to maintain availability by shifting traffic to Google’s Equiano submarine cable, which reportedly experienced a 4x increase in traffic, and Morocco’sMaroc Telecom West Africa submarine cable. Service on the SAT-3 cable was fully restored as of April 6, with repairs on ACE completed on April 17, repairs to WACS and MainOne expected to be done by April 28.
On February 24, three submarine cables that run through the Red Sea were damaged: the Seacom/Tata cable, the Asia Africa Europe-1 (AAE-1), and the Europe India Gateway (EIG). It is believed that the cables were cut by the anchor of the Rubymar, a cargo ship that was damaged by a ballistic missile on February 18. At the time of the disruption, Seacom confirmed the damage to their cable, while the owners of the other two cables did not publish similar confirmations.
On February 2, Cloudflare observed a loss of traffic at AS15706 (Sudatel) and AS36972 (MTN Sudan), with a similar loss occurring on February 7 at AS36998 (Zain Sudan / SDN Mobitel). The disruption at MTN Sudan aligns with a social media post from the provider, in which they stated (translated) “We regret the interruption of all services due to circumstances beyond our control. While we apologize for the inconvenience caused by this interruption, we assure you of our endeavor to restore the service as soon as possible, and you will be notified of the return of the service.” On February 5, several days after their outage started, Zain Sudan published a social media post that stated (translated) “Zain Sudan has been constantly striving to maintain communication and Internet service to serve its valued subscribers, and we would like to point out that the current network outage is due to circumstances beyond its control, with our hopes that safety will prevail, and that service will be restored as soon as possible.” Sudatel did not share any information about the status of its network. On February 4, Digital Rights Lab – Sudan posted on social media that “Our sources confirmed that @RSFSudan forces tookover data centers of ISPs in Khartoum, #Sudan.” It is likely that the Internet outages observed across these providers are related to these takeovers, part of the military conflict that has been underway in the country since April 15, 2023.
The disruptions on these networks varied in length. At Sudatel, traffic started to return on February 11. At Zain Sudan, traffic began to return on March 3, corroborated by a social media post that stated (translated) “Zain network is gradually returning to work and allows its subscribers to communicate for free for a limited time. Zain promises to continue working to restore its network in the rest of the states.” Traffic had not yet returned on MTN Sudan by the end of the first quarter.
Ukraine
In February, the Ukraine/Russia war reached the two-year mark, and over that time, we have covered a number of Internet outages in Ukraine caused by conflict-related attacks. On February 22, Russian air strikes on critical infrastructure in Ukraine damaged energy facilities across the country, resulting in widespread power outages. These power outages caused Internet disruptions across multiple regions in Ukraine, including Kharkiv, Zaporizhzhia, Odessa, Dnipropetrovsk Oblast, and Khmelnytskyi Oblast. Traffic initially dropped around 05:00 local time (03:00 UTC), falling as much as 68% in Kharkiv. However, all regions saw lower traffic levels for several days as compared to the week before.
The associated outages during the quarter varied in length, from just a few hours to over a week. Each outage is shown in the graphs below, which show Paltel traffic within four Palestinian governorates in the Gaza Strip region. While it appears that the Gaza governorate suffered a disruption to traffic as connectivity remained available, complete outages occurred in the Khan Yunis, Rafah, and Deir al-Balah governorates.
January 12-19
January 22-24
March 5
Cyberattacks
In addition to the previously discussed cyberattack that impacted connectivity for AS327802 (Moov Africa Tchad / Millicom) on January 11, several other observed Internet disruptions were caused by cyberattacks in the first quarter.
Anonymous Sudan also reportedly targeted AS31452 (Zain Bahrain) with a cyber attack. This attack appeared to be less severe than the one that targeted HotNet in Israel, but it also lasted significantly longer, with traffic disrupted between 20:45 on March 3 and 18:15 on March 4 local time (17:45 on March 3 to 15:15 on March 4 UTC). No impact to announced IP address space was observed. Zain Bahrain acknowledged the connectivity disruption in a social media post on March 4, noting (translated) “We would like to inform you that some customers may encounter difficulties in using some of our services. Our technical team works to avoid these difficulties as quickly as possible.”
Multiple networks in Ukraine
On March 13, an attack targeted a number of Ukrainian telecommunications providers, including AS16066 (Triangulum), AS34359 (Link Telecom Ukraine), AS197522 (Kalush Information Network), AS52074 (Mandarun), and AS29013 (LinkKremen). Triangulum appeared to be the most significantly impacted, experiencing a near complete loss of traffic between March 13 and March 20, as seen below. Triangulum posted a notice on its website, noting in part “On March 13, 2024, a hacker attack was carried out on a number of Ukrainian providers. At 10:28 a.m. on March 13, 2024, a large-scale technical failure occurred on our Company’s network, as a result of which it became impossible to provide electronic communication services. The Company’s employees, together with employees of the Cyber Police and the National Cyber Security Coordination Center, are taking comprehensive measures around the clock aimed at restoring the entire range of services as soon as possible. Services are being restored gradually. Full recovery may take several days.”
Other affected providers experienced comparatively shorter connectivity disruptions. The near complete outage at Mandarun lasted approximately a day, while the others saw outages lasting around seven hours, starting around 11:30 local time (09:30 UTC) on March 13, with connectivity returning to typical levels around 08:00 local time (06:00 UTC) on March 14.
Government directed
Comoros
Following protests against the re-election of President Azali Assoumani, authorities in Comorosreportedly shut down Internet connectivity on January 17. While some disruption was visible to traffic at a country level between 12:00 local time on January 17 (09:00 UTC) and 17:30 local time on January 19 (14:30 UTC), it was significantly more noticeable in the traffic from AS36939 (Comores Telecom), which saw several periods of near-complete outage across the two-day span. Although Comores Telecom announces a limited amount of IPv4 address space, it saw significant volatility on January 17 & 18, dropping to zero several times.
Sudatel Senegal/Expresso Telecom and Tigo/Free (Senegal)
On February 4, the Minister of Communication, Telecommunications, and Digital Affairs in Senegalordered the suspension of mobile Internet connectivity starting at 22:00 local time (22:00 UTC). The suspension followed protests that erupted in the wake of the postponement of the presidential election. Traffic from AS37196 (Sudatel Senegal/Expresso Telecom) fell sharply at the time the suspension went into effect, recovering around 07:30 local time (07:30 UTC) on February 7. Traffic from AS37649 (Tigo/Free) fell at around 09:30 local time (09:30 UTC) on February 5, with the provider notifying subscribers of the suspension via social media. Traffic on Tigo/Free recovered around midnight local time (00:00 UTC) on February 7, and the provider again used social media to inform subscribers of service availability. No changes were observed to announced IP address space for either provider, indicating that the suspension of mobile Internet connectivity was not done at a routing level.
A little more than a week later, on February 13, the government in Senegal again ordered the suspension of mobile Internet connectivity in an effort to prevent “the spread of hateful and subversive messages online.” ahead of a march planned by activist groups which aimed to express dissent against the postponement of the presidential election. The mobile Internet shutdown was most visible on Tigo/Free, which saw a significant disruption between 10:15 and 19:45 local time (10:15 – 19:45 UTC).
Pakistan
According to a published report, The Pakistan Telecommunication Authority (PTA) said that Internet services would remain available as citizens went to the polls on February 8 to elect a new government. However, on that day, Pakistani authorities cut mobile Internet access across the country as the nation’s voters went to cast their ballots, with the authorities attributing the move “to maintain law and order” in the wake of the violence that occurred the previous day. The impact of the ordered shutdown was visible across multiple Internet providers in Pakistan, including AS59257 (Zong/CMPak), AS24499 (Telenor Pakistan), and AS45669 (Jazz/Mobilink), lasting from 07:00 until 20:00 (02:00 – 15:00 UTC), with traffic returning to expected levels approximately nine hours later. A post on the Internet Society’s Pulse blog estimated that the shutdown cost Pakistan nearly USD $18.5M in lost Gross Domestic Product.
Chad
Several Internet disruptions were observed in Chad between February 28 and March 7. The first one started at 10:45 local time on February 28 and lasted until 18:00 local time on March 1 (09:45 on February 28 – 17:00 on March 1). Shorter disruptions lasting just a few hours each were also observed on March 3, 4, and 7. The apparent shutdowns came in the wake of political violence in the country. Notable drops in announced IPv4 address space aggregated across networks in the country were observed coincident with the February 28, March 3, and March 4 shutdowns, although it isn’t clear why a similar drop did not occur on March 7.
Power outages
Tajikistan
According to a published report, a widespread multi-hour power outage occurred in Tajikistan on March 1, possibly related to increased electricity usage by electric heaters as temperatures across the country neared freezing. The outage began around 11:00 local time (06:00 UTC), and lasted for approximately three hours. The impact on Internet traffic from the country is visible in the graph below. Although power was restored around 14:00 local time (09:00 UTC), Internet traffic did not return to expected levels until around 05:00 local time the next day (midnight UTC on March 2).
Although power outages most often have the biggest impact on Internet traffic, as computers and home/office routers shut down, this outage also appeared to impact network infrastructure within the country, as the aggregate volume of announced IPv4 address space across the country dipped slightly when the power was out.
Tanzania
On March 4, the Tanzania Electricity Corporation (TANESCO)posted a notice on social media regarding an ongoing power outage. It stated (translated) “The Tanzania Electricity Corporation (TANESCO) has notified the public that there has been an error in the National Grid system, resulting in a lack of electricity service in some areas of the country including Zanzibar. Our experts are continuing their efforts to ensure that the electricity service returns to its normal state. The organization apologizes for any inconvenience caused.” The power outage disrupted Internet connectivity in Tanzania, causing an observed drop in traffic between 13:30 and 23:00 local time (10:30 – 20:00 UTC).
Technical problems
Orange España
Network routing is the process of selecting a path across one or more networks, and on the Internet, routing relies on the Border Gateway Protocol (BGP). Historically, the exchange of BGP routing information was based on trust between providers, but over time, security mechanisms such as Resource Public Key Infrastructure (RPKI) have been developed to prevent abuse of the system by bad actors. RPKI is a cryptographic method of signing records that associate a BGP route announcement with the correct originating AS number. ROA (Route Origin Authorization) records provide a means of verifying that an IP address block holder has authorized an AS (Autonomous System) to originate routes to that one or more prefixes within the address block. Cloudflare has published a number of blog posts over the years about the importance of, and our support for, RPKI. Properly implemented and configured, RPKI and ROAs help support routing security, effectively preventing behavior like BGP hijacking.
Because Cloudflare enforces RPKI validation, we also rejected the RPKI-invalid routes. We would have started trying to reach Orange España over our default route toward some of our transit providers, but because they also perform RPKI validation, traffic would have been dropped within those provider networks as well. Because of this, from Cloudflare’s perspective, this incident caused a drop in traffic from Orange España between 16:45 and 19:45 local time (14:45 – 17:45 UTC) as well as a notable drop in announced IPv4 address space from AS12479.
On January 11, subscribers of AS34700 (MaxNet) in Ukraine experienced a nine-hour Internet outage. Initial traffic loss occurred around 16:00 local time (14:00 UTC), and recovered around 01:00 local time on January 12 (23:00 UTC on January 11). An initial social media post from the provider explained the reason for the outage, noting (translated) “Dear subscribers! Due to the flooding of one of the hub sites due to a utility malfunction, some areas of the city may be without services, partially or completely. We are doing our best to restore services, but it takes time. Further information regarding the opening times will be published as soon as the emergency works have been completed.” A subsequent post informed subscribers that Internet connectivity had been restored. The flooding apparently impacted core routing infrastructure as well, as the volume of IPv4 address space announced by MaxNet also fell to zero between 16:00 and 22:00 local time (14:00 – 20:00 UTC).
Plusnet (United Kingdom)
A traffic disruption observed on AS6871 (Plusnet) in the United Kingdom on January 15 was initially characterized as a “mass outage” by the provider in replies to customer complaints on social media. However, the underlying cause of the disruption turned out to be significantly less sensational – it was apparently linked to problems with their DNS servers. Because subscribers were unable to successfully resolve hostnames using Plusnet’s default DNS resolvers, this ultimately manifested itself as a drop in traffic from the network for approximately two hours, between 16:00 and 18:00 local time (and UTC). Users that had configured their systems to use a third-party DNS resolver, such as Cloudflare’s 1.1.1.1 service, did not experience a service disruption.
Russia
DNS issues also impacted users in Russia during January, though in a different way than Plusnet subscribers in the UK experienced. A reportedDNSSEC failure on January 30 resulted in .ru domains becoming inaccessible for several hours. (DNSSEC creates a secure domain name system by adding cryptographic signatures to existing DNS records. By checking its associated signature, you can verify that a requested DNS record comes from its authoritative name server and wasn’t altered en-route, as opposed to a fake record injected in a man-in-the-middle attack.)
The DNSSEC validation failure resulted in SERVFAIL responses to DNS lookups against Cloudflare’s 1.1.1.1 resolver for hostnames in the .ru country code top level domain (ccTLD). At peak, 68.4% of requests received SERVFAIL responses. The Coordination Center for the .ru ccTLD confirmed that it was working on the “technical problem affecting the .ru zone associated with the global DNSSEC infrastructure” but didn’t provide any additional details around the root cause of the problem, such as a potential issue with a DNSSEC key rollover. The .ru ccTLD experienced a similar DNSSEC-related outage for several hours on August 16, 2019, as well.
AT&T (United States)
Starting just before 04:00 Eastern / 03:00 Central (09:00 UTC) on February 22, AT&T subscribers in several cities across the United States experienced mobile service interruptions. Impacted cities included Atlanta, Houston, and Chicago, with connectivity disrupted for approximately eight hours. Cloudflare data showed that as the problem began, AT&T (AS7018) traffic dropped as much as 45% in Chicago and 18% in Dallas, as compared with the previous week.
According to a “network update” published by AT&T, “Based on our initial review, we believe that today’s outage was caused by the application and execution of an incorrect process used as we were expanding our network, not a cyber attack.”
Just before noon local time (05:15 UTC) on March 12, a significant drop in traffic was observed on AS136442 (Ocean Wave), a consumer fiber and business Internet service provider in Myanmar. A (translated) social media post from the provider noted “Ocean Wave customers, please be informed that there will be no internet/ slow connection due to network maintenance.” The connectivity disruption lasted approximately seven hours, with traffic returning to typical levels just before 19:00 local time (12:15 UTC).
Conclusion
Two notable submarine cable damage events during the first quarter again highlighted the importance of protecting submarine cables, and the risks associated with them passing through/near geopolitically sensitive areas. Given the reliance on submarine cables for carrying Internet traffic, this will continue to be an issue for many years to come.
The Orange España incident also shed light on the importance of securing operationally important resources with multi-factor authentication, a topic that Cloudflare has written about in the past. Organizations like RIPE play a critically important behind-the-scenes role in functioning of the Internet, arguably obligating them to take all practical precautions when it comes to securing their systems in order to prevent malicious actors from taking actions that could broadly disrupt Internet connectivity.
Cloudflare’s network spans more than 310 cities in over 120 countries, where we interconnect with over 13,000 network providers in order to provide a broad range of services to millions of customers. The breadth of both our network and our customer base provides us with a unique perspective on Internet resilience, enabling us to observe the impact of Internet disruptions.
During previous quarters, we tracked a number of government directed Internet shutdowns in Iraq, intended to prevent cheating on academic exams. We expected to do so again during the fourth quarter, but there turned out to be no need to, as discussed below. While we didn’t see that set of expected shutdowns, we did observe a number of other Internet outages and disruptions due to a number of commonly seen causes, including fiber/cable issues, power outages, extreme weather, infrastructure maintenance, general technical problems, cyberattacks, and unfortunately, military action. As we have noted in the past, this post is intended as a summary overview of observed disruptions, and is not an exhaustive or complete list of issues that have occurred during the quarter.
Government directed
Iraq
In a slight departure from the usual subject of this blog post, this time we lead off with coverage of government directed Internet shutdowns that didn’t happen. Iraq has been a frequent subject of this series of posts, as they have historically implemented daily multi-hour Internet shutdowns during exam periods, intended to prevent cheating. Earlier this year, there was some hope that this practice might be ending, and in our Q2 2023 Internet disruption summary post, we noted “In the weeks prior to the start of this year’s shutdowns, it was reported that the Iraqi Ministry of Communications had announced it had refused a request from the Ministry of Education to impose an Internet shutdown during the exams as part of efforts to prevent cheating. Unfortunately, this refusal was short-lived, with shutdowns ultimately starting two weeks later.” In addition to these second quarter shutdowns, they also occurred during the third quarter across multiple weeks in July, August, and September.
During the fourth quarter, the third round of 12th grade high school final exams was scheduled to begin on November 13 and end on November 21, taking place at 13:00 local time, as shown in the schedule below, which was published on the Iraqi Ministry of Education’s Facebook page.
November 2023 exam schedule in Iraq
However, in looking at Internet traffic for Iraq during that period, it appears that the nationwide Internet shutdowns that would have normally taken place did not occur, as the graph shows a very consistent diurnal pattern with no evidence of disruptions to Internet connectivity like we have seen in the past. Additionally, other civil society groups, academic researchers, and Internet analysts that also monitor these shutdowns did not report seeing any related drops in traffic. It is unclear whether a request for shutdowns was submitted by the Ministry of Education and again refused by the Ministry of Communications, or if no request was ever submitted for this round of exams. Regardless, we hope that Iraq continues to keep the Internet connected during future rounds of exams.
Military action
Palestine
On Saturday, October 7, 2023, attacks from the Palestinian group Hamas launched from the Gaza Strip against the south of Israel started a new conflict in the region, with Israel officially declaring the next day that it was at war. This had an almost immediate impact on Internet traffic in both Israel and Palestine, with traffic in the former showing ~170% growth as compared to the prior week, and ~100% growth in the latter as compared to the previous week. These trends are discussed in our October 9 blog post, Internet traffic patterns in Israel and Palestine following the October 2023 attacks.
On November 13, Telecom Namibia (AS36996)reported that it was experiencing interruptions to its fixed voice and data services in several areas, resulting from cable theft. The impact of these interruptions is shown in the figure below, with Internet traffic disrupted between 13:45 local time (11:45 UTC) on November 13 and 08:30 local time (06:30 UTC) on November 14. The disruption to connectivity due to cable theft was not an isolated incident, as the provider posted several additional notices on its social media accounts in November and December about similar occurrences.
Cuba
A day later, on November 14, ETECSA (AS27725)posted a notice about a terrestrial fiber cut that disrupted Internet services. As the state-owned telecommunications provider in Cuba, the cut impacted Internet traffic nationwide, as well as at a network level, as seen in the graphs below. The disruption was relatively short-lived, occurring between 06:30 – 08:15 local time (11:30 – 13:15 UTC), with a follow-up post announcing the re-establishment of Internet service.
Chad
On December 7 & 8, a near-complete outage observed in Chad was reportedly due to fiber optic cable cuts in neighboring countries. A published article cited SudaChad as claiming that the outage seen in the graphs below was due to an issue with CAMTEL, a Cameroonian partner. It also cites Moov Africa’s (formerly known as Millicom Chad)apology to customers, which points at “the fiber-optic cut in Cameroon and Sudan” as the root cause. Since simultaneous cuts in fiber optic cables in Chad’s two neighboring countries would certainly be an unusual occurrence, it isn’t clear if such an event happened, though routing data for SudaChad shows that the network’s two upstream providers are AS15706 (Sudatel) in Sudan and AS15964 (CAMNET) in Cameroon. The three providers are also partners on the WE-AFRICA-NA terrestrial cable, which stretches from Port-Sudan on the Red Sea in Sudan to Kribi on the Atlantic Ocean in Cameroon via Chad, but it isn’t known whether that cable system was involved in this outage.
The disruption lasted approximately fourteen hours, from 20:00 local time on December 7 until 10:15 local time on December 8 (19:00 UTC on December 7 until 09:15 UTC on December 8), with the impact visible country-wide, as well as at SudaChad and several downstream network providers.
Cyberattacks
Ukraine
Ukrainian Internet provider Kyivstar announced on the morning of December 12 that they were the “target of a powerful hacker attack”. They noted that the attack caused a “technical failure” that resulted in mobile communication and Internet access becoming temporarily unavailable. Although Kyivstar has been targeted by around 500 cyberattacks since Russia launched its invasion of Ukraine in February 2022, this was reportedly the largest attack to date. A subsequent report referenced an interview with Illia Vitiuk, the head of the cybersecurity department at Ukraine’s security service (SBU), in which he claimed that “the hackers attempted to penetrate Kyivstar in March 2023 or earlier, managed to get into the system at least as early as May, and likely gained full access to the network in November.”
Recovery took several days, with Kyivstar posting on December 15 that “the Internet is everywhere” but warning that connection speeds might be slightly reduced. These posts align with the traffic disruption shown in the figure below, which lasted from 06:30 local time (04:30 UTC) on December 12 until 14:00 local time (12:00 UTC) on December 15.
Power outages
Brunei
A major power outage in Brunei on October 17 disrupted key services including mobile and fixed Internet connectivity. Starting around 11:30 local time (03:30 UTC), traffic was disrupted for approximately 13 hours, recovering to expected levels around just after midnight local time on October 18 (16:45 UTC). Two Unified National Networksautonomous systems (AS10094 and AS131467) saw lower traffic volumes during the power outage.
Kenya
A widespread power outage in Kenya on November 11 disrupted Internet connectivity across the county for approximately seven hours. An X post from Kenya Power at 20:30 local time (17:30 UTC) reported a partial power outage, stating “We have lost power supply to parts of the country. Our engineers are working to restore supply to the affected areas.” Kenya Power kept customers informed of progress, posting updates at 22:00, 23:57, and the morning of November 12, with the final update reporting “We have successfully restored normal power supply in all the areas that were affected by the partial outage.”
Curaçao
On November 14, a Facebook post from Aqualectra, the water and power company in Curaçao, stated in part, “Around 14:00 this afternoon, a blackout occurred. Preliminary investigation indicates that one of the main cables responsible for transporting electricity between the substations at Nijlweg and Weis experienced a short circuit. It is important to emphasize that this is not due to a lack of production capacity.” The power outage resulted in a near complete loss of traffic at Flow Curaçao (AS52233), with significant disruptions also visible at United Telecommunication Services (AS11081) and at a country level, as seen in the graphs below. The disruption lasted eight hours, from 14:00 until 22:00 local time (18:00 UTC on November 14 until 02:00 UTC on November 15).
Sri Lanka
After stabilizing its electrical infrastructure in the wake of 2022’s problems with its electrical power grid, the failure of a main transmission line caused an island-wide power outage in Sri Lanka on December 9, in turn disrupting Internet connectivity. Traffic from the island nation initially dropped by around 50% starting around 16:45 local time (11:15 UTC). Repairs took several hours, with the country’s Internet traffic returning to expected levels around 01:00 local time on December 10 (19:30 UTC).
Panama
On the morning of December 24, Panamanian electric distribution company ENSAinitially reported an event that affected electrical services to their customers. A subsequent report posted just 30 minutes later provided additional details, pointing to an incident in the “National Interconnected System” that affected the electrical supply in a number of areas, but within an hour, it had spread nationally. Although the initial regional power issues did not have a noticeable impact on Panama’s Internet traffic, the loss of traffic in the graph below aligns with the national growth of the power outage, occurring at 11:45 local time (16:45 UTC). Traffic returned to expected levels at around 15:00 local time (20:00 UTC), aligning with an X post from ENSA stating that “At 3:12pm the supply of electrical energy to all our clients has been normalized after an event at the Transmission level originating in the Panama 1 Substation of ETESA.”
Weather
Ukraine
Internet disruptions in Ukraine due to the conflict there have been covered in multiple quarterly Internet disruption summary blog posts over the last two years. However, in November, connectivity in multiple areas of the country was disrupted by power outages caused by a major winter storm. Snow and high winds knocked out power to hundreds of towns and villages, damaging electrical power infrastructure. The impact is visible in the graphs below as a drop in traffic occurring around 01:00 local time on November 27 (23:00 UTC on November 26), observed in regions including Donetsk, Kherson Oblast, and Luhansk. Traffic appeared to return to expected levels early in the morning local time on November 28.
Mexico
On October 25, Hurricane Otis made landfall near Acapulco, a popular tourist destination in Mexico. In addition to catastrophic structural damage, it was reported that “more than 10,000 utility poles were destroyed, knocking out power and internet/communications across the region, while numerous transmission lines, electrical substations, and a power plant were also heavily damaged.” This damage to electrical and communications infrastructure in the area resulted in significant disruption to Internet connectivity. As shown in the graph below, Internet traffic from Acapulco dropped by around 80% as Otis made landfall. Traffic started to show some growth in early November, but peak volumes remained relatively consistent, and well below pre-hurricane levels, through the end of the year. (Several large spikes are visible on December 26 & 30, but it isn’t clear what those are associated with.) Although Acapulco’s tourism industry experienced a notable recovery heading into the end of the year, it appears that infrastructure recovery has not been quite as swift.
Fire
Hawaii
Last quarter, we reported on the impact of wildfires that started on August 7 in Hawaii, including killing nearly 100 people, as well as destroying homes, businesses, and infrastructure, causing power outages and disrupting Internet connectivity. One of the most impacted areas was the town of Lahaina, where Internet connectivity remained sparse for weeks after the fires began. Repair and restoration efforts continued throughout the fourth quarter, with traffic clearly growing throughout October, with peak levels in November and December approaching pre-fire levels.
Maintenance
Yemen
Two maintenance-related Internet disruptions impacted Internet connectivity in Yemen in the fourth quarter. The first lasted over four hours during the morning of November 10, from 03:10 – 07:45 local time (00:10 – 04:45 UTC), and followed two other disruptions the prior day. The impact was visible at a country level, as well as at a network level on PTC-YemenNet (AS30873).
An Associated Press article noted that in a statement to the state news agency, Yemen’s Public Telecom Corp. (PTC-YemenNet) blamed the outage on maintenance, apparently of the FALCON submarine cable. The article also cited a statement from GCX, the operator of the FALCON cable, regarding scheduled maintenance to the cable system that had been in planning for the previous three months.
The second maintenance-related disruption occurred on December 15 just before 23:00 local time (20:00 UTC). An X post from Mosfer Alnomeir, the Minister of Telecommunication and Information Technology in Yemen, explained what happened: “We note that half an hour ago there was an interruption in the Internet service that lasted approximately 30 minutes. This is while engineers carry out emergency replacement and upgrade work on some service equipment. Service was restored immediately. On behalf of the team, I say thank you for your understanding.” Once again, the impact was visible at both a country and network level.
Technical problems
Australia
“Changes to routing information” after a “routine software upgrade” were reportedly responsible for a multi-hour Internet outage at Australian telecommunications provider Optus (AS4804) on November 8 local time. Connectivity began to drop just after 04:00 Sydney time, with the outage lasting from 04:30 – 10:00 Sydney time (17:30 – 23:00 UTC on November 7). Traffic didn’t fully recover to expected levels until around 23:00 Sydney time (12:00 UTC).
The network issue impacted more than 10 million customers, as well as hospitals and payment and transport systems, and drew comparisons to July 2023’s outage at Canadian provider Rogers Communications. Optus submitted a report to the Australian Senate Standing Committee on Environment and Communications that detailed the cause of the outage, noting “It is now understood that the outage occurred due to approximately 90 PE routers automatically self-isolating in order to protect themselves from an overload of IP routing information. … This unexpected overload of IP routing information occurred after a software upgrade at one of the Singtel internet exchanges (known as STiX) in North America, one of Optus’ international networks. During the upgrade, the Optus network received changes in routing information from an alternate Singtel peering router. These routing changes were propagated through multiple layers of our IP Core network. As a result, at around 4:05am (AEDT), the pre-set safety limits on a significant number of Optus network routers were exceeded.” The report also detailed the recovery efforts and timelines for consumer Internet, DNS, and mobile services.
Armenia
Failure of international links caused a brief Internet disruption at Telecom Armenia (AS12297) on November 11, similar to a disruption that occurred almost exactly a year earlier. As shown in the graph below, the disruption began just around 15:15 local time (11:15 UTC), with short periods where traffic dropped to zero. Traffic recovered to expected levels by 21:00 local time (17:00 UTC). As one of the largest telecommunications providers in the country, the service disruption was visible at a country level as well.
United Kingdom
A sizable drop in traffic was observed between 15:00 and 21:30 local time (15:00 – 21:30 UTC) on mobile and broadband Internet provider Three UK (AS206067) on December 1, as seen in the graph below. Although the provider acknowledged that customers were experiencing issues and provided several updates (1, 2, 3, 4) on service restoration over the next day, it never disclosed any additional information on the cause of the disruption. However, a published report stated that Three UK blamed technical issues at one of its data centers as the cause of the problem, which impacted more than 20,000 users.
Egypt
On December 5, Telecom Egypt (AS8452)posted on X that a technical malfunction affecting one of their main network devices was responsible for an Internet disruption that occurred on their network, which also impacted connectivity on several other network providers, including LINKdotNET (AS24863), Vodadfone Egypt (AS24835), and Etisalat (AS36992), as well as traffic at a national level, as seen in the graphs below. Although one news report claimed that the disruption, which occurred between 14:15 – 00:00 local time (12:15 – 22:00 UTC), was due to damage to the FLAG and SeaMeWe-4 submarine cables, a subsequent post from Telecom Egypt about service restoration dispelled that claim, noting “The company also confirms that there is no truth to what has been circulated on some social media sites about the presence of a break in one of the submarine cables.”
Tunisia
A reported DNS server outage (albeit unconfirmed) at Tunisian Internet provider Topnet (AS37705) caused a brief Internet disruption for the provider’s customers on December 17, also impacting traffic volumes at a national level. The incident lasted less than two hours, from 13:00 – 14:45 local time (12:00 – 13:45 UTC).
Guinea
An unspecified incident on the Orange Guinée (AS37461) network impacted Internet connectivity, as well as telephone calls and text messages during the morning of December 22. The graph below shows a near-complete outage on the network between 09:15 – 11:30 local time (09:15 – 11:30 UTC). The provider posted a subsequent update regarding the restoration of calls, text messages, and Internet connectivity.
Conclusion
Within the Cloudflare Radar 2023 Year in Review, we highlighted over 180 major Internet disruptions that were observed year-to-date through the end of November, though the actual number was likely closer to 200 by the end of the year. While that may seem like a lot, it is worth nothing that the actual number is even higher, as these posts are not exhaustive in their coverage of such events. For example, while we covered the Internet shutdown in Manipur, India that took place across multiple months in 2023, internetshutdowns.in shows that over 90 more smaller localized shutdowns were put into place across the country.
Cloudflare operates in more than 300 cities in over 100 countries, where we interconnect with over 12,000 network providers in order to provide a broad range of services to millions of customers. The breadth of both our network and our customer base provides us with a unique perspective on Internet resilience, enabling us to observe the impact of Internet disruptions.
As we have noted in the past, this post is intended as a summary overview of observed disruptions, and is not an exhaustive or complete list of issues that have occurred during the quarter.
Government directed
Late spring often marks the start of a so-called “exam season” in several Middle Eastern and African countries, where students sit for a series of secondary school exams. In an attempt to prevent cheating on these exams, governments in the countries have taken to implementing wide-scale Internet shutdowns covering time periods just before and during the exams. We have covered these shutdowns in the past, including Sudan and Syria in 2021 and Syria, Sudan, and Algeria in 2022. This year, we saw governments in Iraq, Algeria, and Syria taking such actions.
Iraq
In the weeks prior to the start of this year’s shutdowns, it was reported that the Iraqi Ministry of Communications had announced it had refused a request from the Ministry of Education to impose an Internet shutdown during the exams as part of efforts to prevent cheating. Unfortunately, this refusal was short-lived, with shutdowns ultimately starting two weeks later.
In Iraq, two sets of shutdowns were observed: one impacted networks nationwide, except for the Kurdistan Region, while the other impacted networks within the Kurdistan Region. The former set of shutdowns were related to 9th and 12th grade exams, and were scheduled to occur from June 1 through July 15, between 04:00 and 08:00 local time (01:00 – 05:00 UTC). The graphs below show that during June, shutdowns took place on June 1, 4, 6, 8, 11, 13, 15, 17, 21, 22, 24, 25, and 26, resulting in significant disruptions to Internet connectivity. The shutdowns were implemented across a number of network providers, including AS203214 (HulumTele), AS59588 (Zain), AS199739 (Earthlink), AS203735 (Net Tech), AS51684 (Asiacell), and AS58322 (Halasat). The orange-highlighted areas in the graphs below show traffic on each network provider dropping to zero during the shutdowns.
As noted above, exam-related Internet shutdowns were also implemented in the Kurdistan region of Iraq. One report quoted the Minister of Education of the Kurdistan Regional Government as stating "The Internet will be turned off as needed during exams, but just like in previous years, the period of the Internet shutdown will not be lengthy, but rather short.” To that end, the observed shutdowns generally lasted about two hours, occurring between 06:30 and 08:30 local time (03:30 – 05:30 UTC) on June 3, 6, 10, 13, 17, and 24. The graphs below show the impact across three network providers in the region: AS21277 (Newroz Telecom), AS48492 (IQ Online), and AS59625 (KorekTel).
2023 marks the sixth year that Algeria has disrupted Internet connectivity to prevent cheating during nationwide exams. In 2022, we noted that “it appears that the Algerian government has shifted to a content blocking-based approach, instead of a wide-scale Internet shutdown.” It appears that the same approach was taken this year, as we again observed two nominal drops in traffic during each of the exam days, rather than a complete loss of traffic. These traffic shifts were observed on mobile network providers AS33779 (Ooredoo/Wataniya), AS327931 (Djezzy/Optimum), and AS327712 (Mobilis/Telecom Algeria). The first disruption takes place between 08:00 – 12:00 local time (07:00 – 11:00 UTC), with the second occurring between 14:00 – 17:00 local time (13:00 – 16:00 UTC).
Syria
After implementing four exam-related Internet shutdowns in 2022, this year saw just two. On June 25 and 26, Internet shutdowns took place between 05:00 – 08:30 local time (02:00 – 05:30 UTC). Syrian Telecom (AS29256), the government-affiliated telecommunications company, informed subscribers in a Facebook post that the Internet would be cut off at the request of the Ministry of Education.
Senegal
In Senegal, violent protests over the sentencing of opposition leader Ousmane Sonko to jail led the government to restrict access to platforms including WhatsApp, Facebook, Twitter, Instagram, TikTok, Telegram, Signal, and YouTube. On June 4, the Senegal Ministry of Communication issued a statement temporarily suspending mobile Internet access, with a followup statement on June 6 ending the suspension. These disruptions to mobile Internet access were visible on two network providers within the country: AS37196 (Sudatel Senegal) and AS37649 (Tigo/Free).
As shown in the graphs below, the shutdowns on Sudatel Senegal occurred from 15:00 local time on June 3 through 01:00 local time on June 5, and then again from 13:00 local time on June 5 until 01:00 local time on June 6. The three shutdowns seen on Tigo/Free took place between 15:30 – 19:00 local time on June 3, from 13:45 local time on June 4 until 02:05 local time on June 5, and from 13:05 local time on June 5 through 01:00 local time on June 6. (Senegal is UTC+0, so the local times are the same as UTC.)
Mauritania
In Mauritania, authorities cut off mobile Internet services after protests over the death of a young man in police custody. The shutdown began at 23:00 local time on May 30, and lasted six days, with connectivity returning at 23:00 local time on June 6. (Mauritania is UTC+0, so the local times are the same as UTC.) The graphs below show a near complete loss of Internet traffic during that period from AS37541 (Chinguitel) and AS37508 (Mattel), two mobile network providers within the country.
Pakistan
On May 9, Imran Khan, former Prime Minister of Pakistan was arrested on corruption charges. Following the arrest, violent protests erupted in several cities, leading the government of Pakistan to order the shutdown of mobile Internet services, as well as the blocking of several social media platforms. The figures below show the impact of the ordered shutdown to traffic on four mobile network providers within the country: AS24499 (Telenor Pakistan), AS59257 (China Mobile Pak), AS45669 (Mobilink/Jazz), and AS56167 (Ufone/PTML). The ordered shutdown caused a complete loss of Internet traffic from these networks that started at 22:00 local time (17:00 UTC) on May 9 at Telenor and China Mobile Pakistan, 18:00 local time (13:00 UTC) on Mobilink/Jazz, and 01:00 local time on May 10 (20:00 UTC on May 9) at Ufone/PTML. Traffic was restored at 22:00 local time (17:00 UTC) on May 12.
Looking at Cloudflare Radar’s recently launchedInternet Quality page for Pakistan during the duration of the shutdown, we observed that median latency within Pakistan dropped slightly after mobile networks were shut down, shown in the graph below. Prior to the shutdown, median latency (as observed to Cloudflare and a set of other providers) was in the 90-100ms range, while afterward, it averaged closer to 75ms. This may be a result of users shifting to lower latency fixed broadband connections – several fixed broadband providers in the country experienced increased traffic volumes while the mobile networks were unavailable.
Additional details about the mobile network shutdowns, content blocking, and the impact at an administrative unit and city level can be found in our May 12 blog post Cloudflare’s view of Internet disruptions in Pakistan.
India
Internet shutdowns are unfortunately frequent in India, with digital rights organization Access Now reporting at least 84 shutdowns within the country in 2022. The shutdowns are generally implemented at a more local level, and often last for a significant amount of time. One such shutdown took place in the northeastern Indian state of Manipur starting on May 3 after the escalation of ethnic conflict, and was reportedly intended to “thwart the design and activities of anti-national and anti-social elements… by stopping the spread of disinformation and false rumours'' and the likelihood of “serious disturbances to the entire peaceful coexistence of the communities and maintenance of public order”. Mobile data services were initially suspended for a five-day period, with the suspension continually extended through additional templated orders issued every five days.
The graphs below show the impact of the ordered shutdown to traffic from two major network providers in Manipur. Traffic from both AS45609 (Airtel) and AS9829 (BSNL) fell significantly around 18:00 local time (12:30 UTC) on May 4. Traffic on Airtel has remained low, and continued to drop further through the end of June. Traffic on BSNL showed slight signs of recovery starting in early June, but remains extremely low.
The shutdown order remains in place as of the time of this writing (late July).
Severe weather
Guam
On May 24, “Super Typhoon” Mawar wreaked havoc on the US territory of Guam, causing widespread physical damage after it made landfall, taking down trees, buildings, power lines, and communications infrastructure across the island. One result of this damage was a significant disruption to Internet connectivity, as shown in the country-level graph below. Restoration efforts started almost immediately, with Guam Power Authority, Docomo Pacific, and GTA Teleguam all posting regular status updates on their websites and/or social media accounts.
Among the two Internet providers, GTA Teleguam (AS9246) was largely able to complete service restoration in June, with traffic returning to pre-storm levels around June 17, as seen in the graph below. In fact, in a June 20 Facebook post they noted that “As of today, a majority of our wireless network cell sites are operational.” However, recovery at Docomo Pacific (AS3605) is taking significantly longer. The graph below shows that as of the end of June, traffic remained significantly below pre-storm levels.
Cable damage
Bolivia
On June 19, COTAS, a Bolivian telecommunications company, posted an update on their Facebook page that alerted users that a fiber optic cable had been cut in the town of Pongo. As seen in the graphs below, this cut significantly disrupted Internet connectivity across COTAS and two other network providers in the country: AS25620 (COTAS), AS27839 (Comteco), and AS52495 (Cotel) between 13:00 – 18:00 local time (17:00 – 22:00 UTC).
The Gambia
Gamtel, the state telecommunications company in The Gambia, notified subscribers via a Twitter post on June 7 of a localized fiber cut, and then of additional cable cuts on June 8. These fiber cuts disrupted Internet connectivity on AS25250 (Gamtel) between 14:00 local time on June 7 and 00:00 local time on June 9, with traffic volumes down as much as 80% as compared to the previous period. (The Gambia is UTC+0, so the local times are the same as UTC.)
Philippines
An advisory posted on Twitter by Philippines telecommunications provider PLDT at 18:43 local time (10:43 UTC) on June 5 stated “One of our submarine cable partners confirms a loss in some of its internet bandwidth capacity, and thus causing slower Internet browsing. We are working with our partners to provide alternate capacity that would restore the browsing experience in the next few hours.” The traffic graph below shows a minor disruption to Internet traffic for AS9299 (PLDT) starting around 14:00 local time (06:00 UTC), and the “slower Internet browsing” noted by PLDT is evident in the Internet quality graphs below, with increased latency and decreased bandwidth evident around that same time. PLDT stated in a subsequent tweet that as of 06:22 local time on June 6 (22:22 UTC on June 5), “Our submarine cable partner confirms supplementing additional capacity, restoring browser experience.”
Power outages
Curaçao
Aqualectra is the primary utility company in Curaçao, providing water and power services. On June 8, they posted a series of alerts to their Facebook page (1, 2, 3, 4) regarding a power outage impacting “all neighborhoods”, caused by a malfunction in one of the main power cables connected to the substation at Parera. This loss of power impacted Internet connectivity on the island, with a significant loss of traffic observed at a country level, as seen in the graph below, as well as across several Internet service providers, including AS11081 (UTS), AS52233 (Columbus Communications), and AS27660 (Curaçao Telecom). A followup Facebook post dated 01:25 local time on June 9 (05:25 UTC) confirmed the restoration of power to all neighborhoods.
Portugal
A power outage at an Equinix data center in Prior Velho (near Lisbon) on the afternoon of June 6 affected local utilities, banking services, and court networks, according to published reports (1, 2). Portuguese Internet service provider MEO was also impacted by the power outage, which caused a drop in traffic for AS3243 (MEO-RESIDENCIAL) and AS15525 (MEO-EMPRESAS), seen in the graphs below. The disruptions caused by the power outage also impacted connectivity quality within Portugal, as the Radar Internet quality graphs below highlight – a concurrent drop in bandwidth and increase in latency is visible, indicating that end users likely experienced poorer performance during that period of time.
Botswana
A countrywide power outage in Botswana on May 19 caused an Internet disruption that lasted about 90 minutes, from 10:45 until 12:15 local time (08:45 – 10:15 UTC), visible in the graph below. A tweet from Botswana Power Corporation provided public notice of the incident, but did not include a root cause.
Barbados
On April 4, The Barbados Light & Power Company tweeted an “Outage Notice”, stating “We are aware that our customers across the island are currently without electricity.” Posted at 11:46 local time (15:46 UTC), the notice comes shortly after a significant drop in traffic was observed country-wide, indicating that the power outage also impacted Internet connectivity across the country. After posting several additional updates throughout the day, a final update posted at 18:00 local time (22:00 UTC) indicated that power had been restored to 100% of impacted customers. The graph below shows that traffic took several additional hours to return to normal levels. (Note that the orange highlighting in the graph represents the duration of the disruption, and the red shading is related to an internal data collection issue.)
Technical problems
Namibia
A seven-hour Internet disruption observed in Namibia on June 15 and 16 was caused by unspecified “technical challenges” faced by Telecom Namibia. According to a tweet from the provider, “Telecom Namibia experienced technical challenges on its fixed and mobile data services on Thursday leading to intermittent Internet connectivity.” The impact of these challenges is visible in both the country- and network-level traffic graphs below.
Solomon Islands
Unspecified “technical reasons” also disrupted mobile Internet connectivity for Our Telekom customers in the Solomon Islands on April 26 and 27. An April 26 Facebook post from Our Telekom simply stated “Our mobile data network is currently down due to technical reasons.” The graphs below show a significant drop in traffic for AS45891 (Our Telekom/SBT) between 06:30 local time on April 27 (19:30 UTC on April 26) and 17:00 local time on April 27 (06:00 UTC). The loss of mobile traffic from Our Telekom also impacted traffic at a country level, as the graph shows a similar disruption for the Solomon Islands.
SpaceX Starlink
With an increasingly global service footprint, disruptions observed on SpaceX Starlink potentially impact users across multiple countries around the world. Just before midnight UTC on April 7, Internet traffic seen from AS14593 (SpaceX-Starlink) began to decline significantly. The disruption was short-lived, with traffic returning to expected levels within two hours. According to a Twitter post from Elon Musk, CEO of SpaceX, the problem was “Caused by expired ground station cert” (an expired digital certificate associated with one or more Starlink ground stations, likely preventing communication between the satellite constellation and the ground station(s)).
Madagascar
In Madagascar, a “problem with the backbone”, reported by Telma Madagascar, caused a loss of as much as two-thirds of Internet traffic between 09:15 – 14:00 local time (06:15 – 11:00 UTC) on April 7. The graphs below show that the backbone issue disrupted traffic at a national level, as well as for AS37054 (Telma Madagascar).
United Kingdom
On April 4, UK Internet provider Virgin Media suffered multiple service disruptions that impacted Internet connectivity for broadband customers. The first outage started just before 01:00 local time (midnight UTC)l, lasting until approximately 09:00 local time (08:00 UTC). The second outage started around 16:00 local time (15:00 UTC), with traffic volumes going up and down over the next several hours before appearing to stabilize around 21:30 local time (20:30 UTC).
Virgin Media’s Twitter account acknowledged the early morning disruption several hours after it began, posting “We’re aware of an issue that is affecting broadband services for Virgin Media customers as well as our contact centres. Our teams are currently working to identify and fix the problem as quickly as possible and we apologise to those customers affected.” A subsequent post after service restoration noted “We’ve restored broadband services for customers but are closely monitoring the situation as our engineers continue to investigate. We apologise for any inconvenience caused.”
However, the second disruption was acknowledged on Virgin Media’s Twitter account much more rapidly, with a post at 16:25 UTC stating “Unfortunately we have seen a repeat of an earlier issue which is causing intermittent broadband connectivity problems for some Virgin Media customers. We apologise again to those impacted, our teams are continuing to work flat out to find the root cause of the problem and fix it.”
Although no additional details have been shared via social media by Virgin Media about the outages or their resolution, some additional information was shared via Twitter by an apparent customer, who posted “Virgin Media engineers re-seated fibre cards and reset hub equipment to restore service. TTL was extended as a workaround to maintain stability whilst a permanent fix is implemented.”
A little more than a year later, on May 26, we observed an Internet outage at Miranda Media. Traffic started to fall around 16:30 local time (13:30 UTC), dropping to zero around 18:15 local time (15:15 UTC). The outage disrupted connectivity on the Crimean Peninsula and parts of occupied Ukraine and lasted until approximately 06:00 local time on May 27 (03:00 UTC). Published reports (1,2) suggest that the outage was due to a cyberattack targeting Miranda Media, reportedly carried out by Ukrainian hacktivists.
Russia
Russian satellite provider Dozor Teleport, whose customers include Russia’s Ministry of Defense, ships of the Northern Fleet, Russian energy firm Gazprom, remote oil fields, the Bilibino nuclear power plant, the Federal Security Service (FSB), Rosatom, and other organizations, experienced a multi-hour outage on June 29. The outage, which occurred between 01:30 – 17:30 UTC, was reportedly the result of a cyberattack that at least two groups claimed responsibility for.
Military action
Chad
Multiple Internet disruptions occurred in Chad on April 23 and 24, impacting several Internet providers, and were ultimately visible at a country level as well. As seen in the graphs below, the outages occurred from 04:30 – 06:00 local time (03:30 – 05:00 UTC) and 15:00 – 20:00 local time (14:00 – 19:00 UTC) on April 23, and 04:00 – 08:30 local time (03:00 – 07:30 UTC) on April 24. The impacted network providers in Chad included AS327802 (Millicom Chad), AS327756 (Airtel Chad), AS328594 (Sudat Chad), and AS327975 (ILNET-TELECOM). The outages were reportedly caused by damage to fiber infrastructure that links Chad with neighboring Cameroon and Sudan, with the latter experiencing Internet service disruptions amid clashes between the Sudanese Armed Forces (SAF) and Rapid Support Forces (RSF).
Sudan
As noted above, military action in Sudan disrupted Internet connectivity in Chad in April. Starting in mid-April, multiple Internet outages were observed at major Sudanese Internet providers, three of which are shown in the graphs below. The fighting in the country has led to fuel shortages and power cuts, ultimately disrupting Internet connectivity.
AS15706 (Sudatel) experienced complete Internet outages from 03:00 on April 23 to 17:00 on April 24 local time (01:00 on April 23 to 15:00 on April 24 UTC) and again from 03:00 on April 25 until 01:00 on April 28 local time (01:00 on April 25 to 23:00 on April 27 UTC). Internet connectivity on AS36972 (MTN) was disrupted between 03:00 and 12:00 local time on April 16 (01:00 – 10:00 UTC) and again between 20:00 on April 27 until 02:00 on April 29 (18:00 on April 27 to 00:00 on April 29). After a nominal multi-day recovery, a long-term near complete outage started on May 5, lasting for multiple weeks. Similar to MTN, multiple extended outages were also observed on AS33788 (Kanar Telecommunication). After seeing a significant drop in traffic midday on April 19, a near complete outage is visible between 12:00 on April 21 and 01:00 on April 29 (10:00 on April 21 to 23:00 on April 28 UTC), with a very brief minor recovery late in the day on April 24. A longer duration outage began around 00:00 local time on May 11 (22:00 on May 10 UTC), also lasting for multiple weeks.
Togo, Republic of Congo (Brazzaville), Burkina Faso
Repair work on the West Africa Cable System (WACS) submarine cable disrupted Internet connectivity across multiple countries, including Togo, Republic of Congo (Brazzaville), and Burkina Faso on April 6. According to the Google translation of a Facebook post from Canalbox Congo, the repair work was likely to cause “very strong disruptions on Internet connections with the risk of a total outage”. (Canalbox (GVA) is an African telecommunications operator that provides services across multiple countries in Africa.)
The graph below for AS36924 (GVA-Canalbox) shows three overlapping outage annotations, with each related to a disruption observed on that autonomous system (network) in one of the impacted countries. In the Republic of Congo (Brazzaville), a significant traffic disruption is visible between 16:15 – 23:15 local time (15:15 – 22:15 UTC). In Burkina Faso, the disruption happened earlier and was less severe, taking place between 09:15 – 18:00 local time (09:15 – 18:00 UTC), with a similar impact in Togo, where traffic was disrupted between 11:00 – 23:15 local time (11:00 – 23:15 UTC).
Conclusion
Because of how tightly interwoven the Internet has become with commerce, financial services, and everyday life around the world, any disruption to Internet connectivity ultimately carries an economic impact. The providers impacted by disruptions caused by unexpected or unavoidable events such as cable cuts or severe weather generally try to minimize the scope and duration of such disruptions, ultimately limiting the economic impact. However, in the case of government-directed Internet shutdowns, the damage to the economy is ultimately self-inflicted. The Internet Society’s new Net Loss Calculator now provides a way to quantify this damage, enabling the public, advocacy groups, and governments themselves to understand the potential cost of an Internet shutdown from gross domestic product (GDP), foreign direct investment (FDI), and unemployment perspectives.
Internet connections are most often marketed and sold on the basis of "speed", with providers touting the number of megabits or gigabits per second that their various service tiers are supposed to provide. This marketing has largely been successful, as most subscribers believe that "more is better”. Furthermore, many national broadband plans in countries around the world include specific target connection speeds. However, even with a high speed connection, gamers may encounter sluggish performance, while video conference participants may experience frozen video or audio dropouts. Speeds alone don't tell the whole story when it comes to Internet connection quality.
Additional factors like latency, jitter, and packet loss can significantly impact end user experience, potentially leading to situations where higher speed connections actually deliver a worse user experience than lower speed connections. Connection performance and quality can also vary based on usage – measured average speed will differ from peak available capacity, and latency varies under loaded and idle conditions.
The new Cloudflare Radar Internet Quality page
A little more than three years ago, as residential Internet connections were strained because of the shift towards working and learning from home due to the COVID-19 pandemic, Cloudflare announced the speed.cloudflare.com speed test tool, which enabled users to test the performance and quality of their Internet connection. Within the tool, users can download the results of their individual test as a CSV, or share the results on social media. However, there was no aggregated insight into Cloudflare speed test results at a network or country level to provide a perspective on connectivity characteristics across a larger population.
Today, we are launching these long-missing aggregated connection performance and quality insights on Cloudflare Radar. The new Internet Quality page provides both country and network (autonomous system) level insight into Internet connection performance (bandwidth) and quality (latency, jitter) over time. (Your Internet service provider is likely an autonomous system with its own autonomous system number (ASN), and many large companies, online platforms, and educational institutions also have their own autonomous systems and associated ASNs.) The insights we are providing are presented across two sections: the Internet Quality Index (IQI), which estimates average Internet quality based on aggregated measurements against a set of Cloudflare & third-party targets, and Connection Quality, which presents peak/best case connection characteristics based on speed.cloudflare.com test results aggregated over the previous 90 days. (Details on our approach to the analysis of this data are presented below.)
Users may note that individual speed test results, as well as the aggregate speed test results presented on the Internet Quality page will likely differ from those presented by other speed test tools. This can be due to a number of factors including differences in test endpoint locations (considering both geographic and network distance), test content selection, the impact of “rate boosting” by some ISPs, and testing over a single connection vs. multiple parallel connections. Infrequent testing (on any speed test tool) by users seeking to confirm perceived poor performance or validate purchased speeds will also contribute to the differences seen in the results published by the various speed test platforms.
And as we announced in April, Cloudflare has partnered with Measurement Lab (M-Lab) to create a publicly-available, queryable repository for speed test results. M-Lab is a non-profit third-party organization dedicated to providing a representative picture of Internet quality around the world. M-Lab produces and hosts the Network Diagnostic Tool, which is a very popular network quality test that records millions of samples a day. Given their mission to provide a publicly viewable, representative picture of Internet quality, we chose to partner with them to provide an accurate view of your Internet experience and the experience of others around the world using openly available data.
Connection speed & quality data is important
While most advertisements for fixed broadband and mobile connectivity tend to focus on download speeds (and peak speeds at that), there’s more to an Internet connection, and the user’s experience with that Internet connection, than that single metric. In addition to download speeds, users should also understand the upload speeds that their connection is capable of, as well as the quality of the connection, as expressed through metrics known as latency and jitter. Getting insight into all of these metrics provides a more well-rounded view of a given Internet connection, or in aggregate, the state of Internet connectivity across a geography or network.
The concept of download speeds are fairly well understood as a measure of performance. However, it is important to note that the average download speeds experienced by a user during common Web browsing activities, which often involves the parallel retrieval of multiple smaller files from multiple hosts, can differ significantly from peak download speeds, where the user is downloading a single large file (such as a video or software update), which allows the connection to reach maximum performance. The bandwidth (speed) available for upload is sometimes mentioned in ISP advertisements, but doesn’t receive much attention. (And depending on the type of Internet connection, there’s often a significant difference between the available upload and download speeds.) However, the importance of upload came to the forefront in 2020 as video conferencing tools saw a surge in usage as both work meetings and school classes shifted to the Internet during the COVID-19 pandemic. To share your audio and video with other participants, you need sufficient upload bandwidth, and this issue was often compounded by multiple people sharing a single residential Internet connection.
Latency is the time it takes data to move through the Internet, and is measured in the number of milliseconds that it takes a packet of data to go from a client (such as your computer or mobile device) to a server, and then back to the client. In contrast to speed metrics, lower latency is preferable. This is especially true for use cases like online gaming where latency can make a difference between a character’s life and death in the game, as well as video conferencing, where higher latency can cause choppy audio and video experiences, but it also impacts web page performance. The latency metric can be further broken down into loaded and idle latency. The former measures latency on a loaded connection, where bandwidth is actively being consumed, while the latter measures latency on an “idle” connection, when there is no other network traffic present. (These specific loaded and idle definitions are from the device’s perspective, and more specifically, from the speed test application’s perspective. Unless the speed test is being performed directly from a router, the device/application doesn't have insight into traffic on the rest of the network.) Jitter is the average variation found in consecutive latency measurements, and can be measured on both idle and loaded connections. A lower number means that the latency measurements are more consistent. As with latency, Internet connections should have minimal jitter, which helps provide more consistent performance.
Our approach to data analysis
The Internet Quality Index (IQI) and Connection Quality sections get their data from two different sources, providing two different (albeit related) perspectives. Under the hood they share some common principles, though.
IQI builds upon the mechanism we already use to regularly benchmark ourselves against other industry players. It is based on end user measurements against a set of Cloudflare and third-party targets, meant to represent a pattern that has become very common in the modern Internet, where most content is served from distribution networks with points of presence spread throughout the world. For this reason, and by design, IQI will show worse results for regions and Internet providers that rely on international (rather than peering) links for most content.
IQI is also designed to reflect the traffic load most commonly associated with web browsing, rather than more intensive use. This, and the chosen set of measurement targets, effectively biases the numbers towards what end users experience in practice (where latency plays an important role in how fast things can go).
For each metric covered by IQI, and for each ASN, we calculate the 25th percentile, median, and 75th percentile at 15 minute intervals. At the country level and above, the three calculated numbers for each ASN visible from that region are independently aggregated. This aggregation takes the estimated user population of each ASN into account, biasing the numbers away from networks that source a lot of automated traffic but have few end users.
The Connection Quality section gets its data from the Cloudflare Speed Test tool, which exercises a user's connection in order to see how well it is able to perform. It measures against the closest Cloudflare location, providing a good balance of realistic results and network proximity to the end user. We have a presence in 285 cities around the world, allowing us to be pretty close to most users.
Similar to the IQI, we calculate the 25th percentile, median, and 75th percentile for each ASN. But here these three numbers are immediately combined using an operation called the trimean — a single number meant to balance the best connection quality that most users have, with the best quality available from that ASN (users may not subscribe to the best available plan for a number of reasons).
Because users may choose to run a speed test for different motives at different times, and also because we take privacy very seriously and don’t record any personally identifiable information along with test results, we aggregate at 90-day intervals to capture as much variability as we can.
At the country level and above, the calculated trimean for each ASN in that region is aggregated. This, again, takes the estimated user population of each ASN into account, biasing the numbers away from networks that have few end users but which may still have technicians using the Cloudflare Speed Test to assess the performance of their network.
Navigating the Internet Quality page
The new Internet Quality page includes three views: Global, country-level, and autonomous system (AS). In line with the other pages on Cloudflare Radar, the country-level and AS pages show the same data sets, differing only in their level of aggregation. Below, we highlight the various components of the Internet Quality page.
Global
The top section of the global (worldwide) view includes time series graphs of the Internet Quality Index metrics aggregated at a continent level. The time frame shown in the graphs is governed by the selection made in the time frame drop down at the upper right of the page, and at launch, data for only the last three months is available. For users interested in examining a specific continent, clicking on the other continent names in the legend removes them from the graph. Although continent-level aggregation is still rather coarse, it still provides some insight into regional Internet quality around the world.
Further down the page, the Connection Quality section presents a choropleth map, with countries shaded according to the values of the speed, latency, or jitter metric selected from the drop-down menu. Hovering over a country displays a label with the country’s name and metric value, and clicking on the country takes you to the country’s Internet Quality page. Note that in contrast to the IQI section, the Connection Quality section always displays data aggregated over the previous 90 days.
Country-level
Within the country-level page (using Canada as an example in the figures below), the country’s IQI metrics over the selected time frame are displayed. These time series graphs show the median bandwidth, latency, and DNS response time within a shaded band bounded at the 25th and 75th percentile and represent the average expected user experience across the country, as discussed in the Our approach to data analysis section above.
Below that is the Connection Quality section, which provides a summary view of the country’s measured upload and download speeds, as well as latency and jitter, over the previous 90 days. The colored wedges in the Performance Summary graph are intended to illustrate aggregate connection quality at a glance, with an “ideal” connection having larger upload and download wedges and smaller latency and jitter wedges. Hovering over the wedges displays the metric’s value, which is also shown in the table to the right of the graph.
Below that, the Bandwidth and Latency/Jitter histograms illustrate the bucketed distribution of upload and download speeds, and latency and jitter measurements. In some cases, the speed histograms may show a noticeable bar at 1 Gbps, or 1000 ms (1 second) on the latency/jitter histograms. The presence of such a bar indicates that there is a set of measurements with values greater than the 1 Gbps/1000 ms maximum histogram values.
Autonomous system level
Within the upper-right section of the country-level page, a list of the top five autonomous systems within the country is shown. Clicking on an ASN takes you to the Performance page for that autonomous system. For others not displayed in the top five list, you can use the search bar at the top of the page to search by autonomous system name or number. The graphs shown within the AS level view are identical to those shown at a country level, but obviously at a different level of aggregation. You can find the ASN that you are connected to from the My Connection page on Cloudflare Radar.
Exploring connection performance & quality data
Digging into the IQI and Connection Quality visualizations can surface some interesting observations, including characterizing Internet connections, and the impact of Internet disruptions, including shutdowns and network issues. We explore some examples below.
Characterizing Internet connections
Verizon FiOS is a residential fiber-based Internet service available to customers in the United States. Fiber-based Internet services (as opposed to cable-based, DSL, dial-up, or satellite) will generally offer symmetric upload and download speeds, and the FiOS plans page shows this to be the case, offering 300 Mbps (upload & download), 500 Mbps (upload & download), and “1 Gig” (Verizon claims average wired speeds between 750-940 Mbps download / 750-880 Mbps upload) plans. Verizon carries FiOS traffic on AS701 (labeled UUNET due to a historical acquisition), and in looking at the bandwidth histogram for AS701, several things stand out. The first is a rough symmetry in upload and download speeds. (A cable-based Internet service provider, in contrast, would generally show a wide spread of download speeds, but have upload speeds clustered at the lower end of the range.) Another is the peaks around 300 Mbps and 750 Mbps, suggesting that the 300 Mbps and “1 Gig” plans may be more popular than the 500 Mbps plan. It is also clear that there are a significant number of test results with speeds below 300 Mbps. This is due to several factors: one is that Verizon also carries lower speed non-FiOS traffic on AS701, while another is that erratic nature of in-home WiFi often means that the speeds achieved on a test will be lower than the purchased service level.
Traffic shifts drive latency shifts
On May 9, 2023, the government of Pakistan ordered the shutdown of mobile network services in the wake of protests following the arrest of former Prime Minister Imran Khan. Our blog post covering this shutdown looked at the impact from a traffic perspective. Within the post, we noted that autonomous systems associated with fixed broadband networks saw significant increases in traffic when the mobile networks were shut down – that is, some users shifted to using fixed networks (home broadband) when mobile networks were unavailable.
Examining IQI data after the blog post was published, we found that the impact of this traffic shift was also visible in our latency data. As can be seen in the shaded area of the graph below, the shutdown of the mobile networks resulted in the median latency dropping about 25% as usage shifted from higher latency mobile networks to lower latency fixed broadband networks. An increase in latency is visible in the graph when mobile connectivity was restored on May 12.
Bandwidth shifts as a potential early warning sign
On April 4, UK mobile operator Virgin Media suffered several brief outages. In examining the IQI bandwidth graph for AS5089, the ASN used by Virgin Media (formerly branded as NTL), indications of a potential problem are visible several days before the outages occurred, as median bandwidth dropped by about a third, from around 35 Mbps to around 23 Mbps. The outages are visible in the circled area in the graph below. Published reports indicate that the problems lasted into April 5, in line with the lower median bandwidth measured through mid-day.
Submarine cable issues cause slower browsing
On June 5, Philippine Internet provider PLDTTweeted an advisory that noted “One of our submarine cable partners confirms a loss in some of its internet bandwidth capacity, and thus causing slower Internet browsing.” IQI latency and bandwidth graphs for AS9299, a primary ASN used by PLDT, shows clear shifts starting around 06:45 UTC (14:45 local time). Median bandwidth dropped by half, from 17 Mbps to 8 Mbps, while median latency increased by 75% from 37 ms to around 65 ms. 75th percentile latency also saw a significant increase, nearly tripling from 63 ms to 180 ms coincident with the reported submarine cable issue.
Conclusion
Making network performance and quality insights available on Cloudflare Radar supports Cloudflare’s mission to help build a better Internet. However, we’re not done yet – we have more enhancements planned. These include making data available at a more granular geographical level (such as state and possibly city), incorporating AIM scores to help assess Internet quality for specific types of use cases, and embedding the Cloudflare speed test directly on Radar using the open source JavaScript module.
In the meantime, we invite you to use speed.cloudflare.com to test the performance and quality of your Internet connection, share any country or AS-level insights you discover on social media (tag @CloudflareRadar on Twitter or @[email protected] on Mastodon), and explore the underlying data through the M-Lab repository or the Radar API.
The collective thoughts of the interwebz
Manage Consent
To provide the best experiences, we use technologies like cookies to store and/or access device information. Consenting to these technologies will allow us to process data such as browsing behavior or unique IDs on this site. Not consenting or withdrawing consent, may adversely affect certain features and functions.
Functional
Always active
The technical storage or access is strictly necessary for the legitimate purpose of enabling the use of a specific service explicitly requested by the subscriber or user, or for the sole purpose of carrying out the transmission of a communication over an electronic communications network.
Preferences
The technical storage or access is necessary for the legitimate purpose of storing preferences that are not requested by the subscriber or user.
Statistics
The technical storage or access that is used exclusively for statistical purposes.The technical storage or access that is used exclusively for anonymous statistical purposes. Without a subpoena, voluntary compliance on the part of your Internet Service Provider, or additional records from a third party, information stored or retrieved for this purpose alone cannot usually be used to identify you.
Marketing
The technical storage or access is required to create user profiles to send advertising, or to track the user on a website or across several websites for similar marketing purposes.