Post Syndicated from Netflix Technology Blog original https://netflixtechblog.com/bending-pause-times-to-your-will-with-generational-zgc-256629c9386b
The surprising and not so surprising benefits of generations in the Z Garbage Collector.
By Danny Thomas, JVM Ecosystem Team

The latest long term support release of the JDK delivers generational support for the Z Garbage Collector.
More than half of our critical streaming video services are now running on JDK 21 with Generational ZGC, so it’s a good time to talk about our experience and the benefits we’ve seen. If you’re interested in how we use Java at Netflix, Paul Bakker’s talk How Netflix Really Uses Java, is a great place to start.
Reduced tail latencies
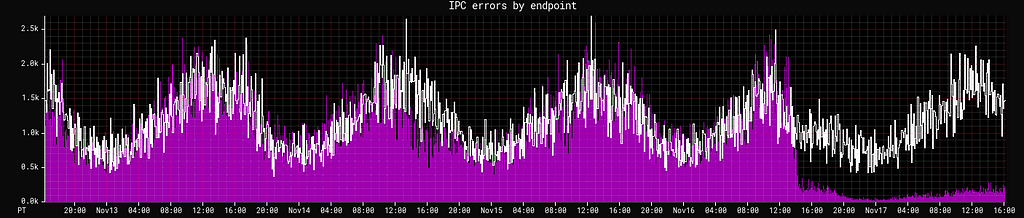
In both our GRPC and DGS Framework services, GC pauses are a significant source of tail latencies. That’s particularly true of our GRPC clients and servers, where request cancellations due to timeouts interact with reliability features such as retries, hedging and fallbacks. Each of these errors is a canceled request resulting in a retry so this reduction further reduces overall service traffic by this rate:
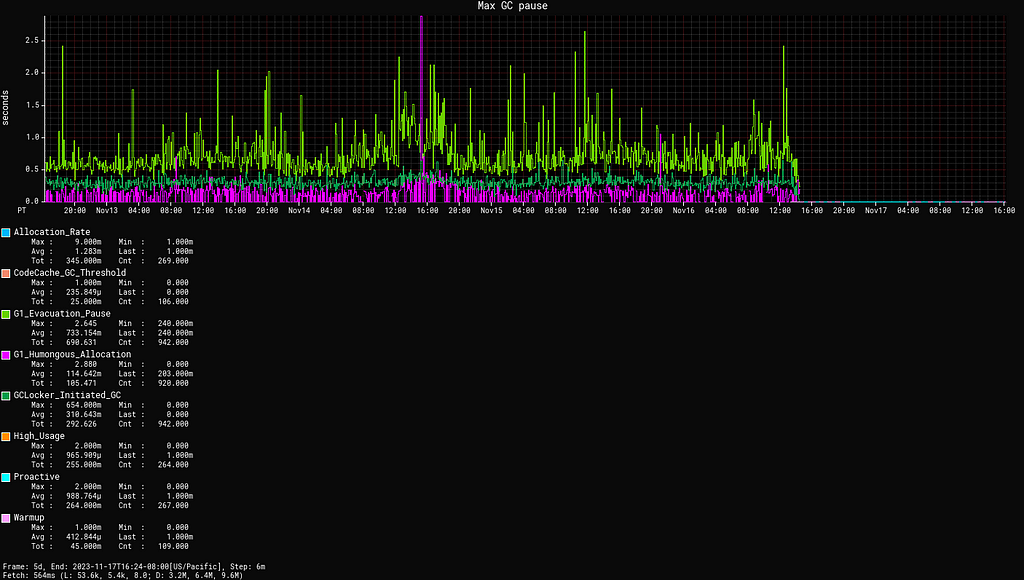
Removing the noise of pauses also allows us to identify actual sources of latency end-to-end, which would otherwise be hidden in the noise, as maximum pause time outliers can be significant:
Efficiency
Even after we saw very promising results in our evaluation, we expected the adoption of ZGC to be a trade off: a little less application throughput, due to store and load barriers, work performed in thread local handshakes, and the GC competing with the application for resources. We considered that an acceptable trade off, as avoiding pauses provided benefits that would outweigh that overhead.
In fact, we’ve found for our services and architecture that there is no such trade off. For a given CPU utilization target, ZGC improves both average and P99 latencies with equal or better CPU utilization when compared to G1.
The consistency in request rates, request patterns, response time and allocation rates we see in many of our services certainly help ZGC, but we’ve found it’s equally capable of handling less consistent workloads (with exceptions of course; more on that below).
Operational simplicity
Service owners often reach out to us with questions about excessive pause times and for help with tuning. We have several frameworks that periodically refresh large amounts of on-heap data to avoid external service calls for efficiency. These periodic refreshes of on-heap data are great at taking G1 by surprise, resulting in pause time outliers well beyond the default pause time goal.
This long lived on-heap data was the major contributor to us not adopting non-generational ZGC previously. In the worst case we evaluated, non-generational ZGC caused 36% more CPU utilization than G1 for the same workload. That became a nearly 10% improvement with generational ZGC.
Half of all services required for streaming video use our Hollow library for on-heap metadata. Removing pauses as a concern allowed us to remove array pooling mitigations, freeing hundreds of megabytes of memory for allocations.
Operational simplicity also stems from ZGC’s heuristics and defaults. No explicit tuning has been required to achieve these results. Allocation stalls are rare, typically coinciding with abnormal spikes in allocation rates, and are shorter than the average pause times we saw with G1.
Memory overhead
We expected that losing compressed references on heaps < 32G, due to colored pointers requiring 64-bits object pointers, would be a major factor in the choice of a garbage collector.
We’ve found that while that’s an important consideration for stop-the-world GCs, that’s not the case for ZGC where even on small heaps, the increase in allocation rate is amortized by the efficiency and operational improvements. Our thanks to Erik Österlund at Oracle for explaining the less intuitive benefits of colored pointers when it comes to concurrent garbage collectors, which lead us to evaluating ZGC more broadly than initially planned.
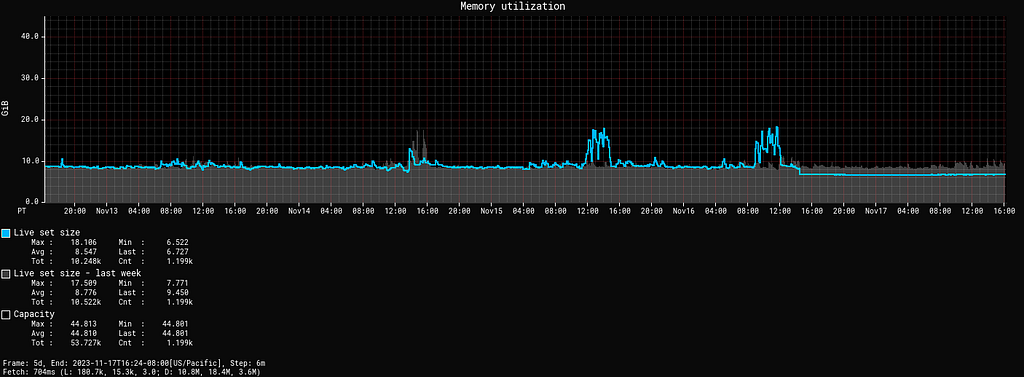
In the majority of cases ZGC is also able to consistently make more memory available to the application:
ZGC has a fixed overhead 3% of the heap size, requiring more native memory than G1. Except in a couple of cases, there’s been no need to lower the maximum heap size to allow for more headroom, and those were services with greater than average native memory needs.
Reference processing is also only performed in major collections with ZGC. We paid particular attention to deallocation of direct byte buffers, but we haven’t seen any impact thus far. This difference in reference processing did cause a performance problem with JSON thread dump support, but that’s a unusual situation caused by a framework accidentally creating an unused ExecutorService instance for every request.
Transparent huge pages
Even if you’re not using ZGC, you probably should be using huge pages, and transparent huge pages is the most convenient way to use them.
ZGC uses shared memory for the heap and many Linux distributions configure shmem_enabled to never, which silently prevents ZGC from using huge pages with -XX:+UseTransparentHugePages.
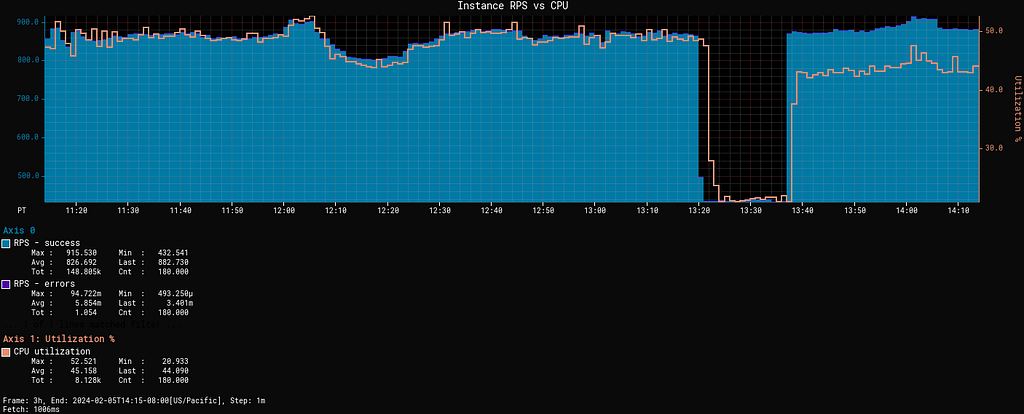
Here we have a service deployed with no other change but shmem_enabled going from never to advise, reducing CPU utilization significantly:
Our default configuration:
- Sets heap minimum and maximums to equal size
- Configures -XX:+UseTransparentHugePages -XX:+AlwaysPreTouch
- Uses the following transparent_hugepage configuration:
echo madvise | sudo tee /sys/kernel/mm/transparent_hugepage/enabled
echo advise | sudo tee /sys/kernel/mm/transparent_hugepage/shmem_enabled
echo defer | sudo tee /sys/kernel/mm/transparent_hugepage/defrag
echo 1 | sudo tee /sys/kernel/mm/transparent_hugepage/khugepaged/defrag
What workloads weren’t a good fit?
There is no best garbage collector. Each trades off collection throughput, application latency and resource utilization depending on the goal of the garbage collector.
For the workloads that have performed better with G1 vs ZGC, we’ve found that they tend to be more throughput oriented, with very spiky allocation rates and long running tasks holding objects for unpredictable periods.
A notable example was a service where very spiky allocation rates and large numbers of long lived objects, which happened to be a particularly good fit for G1’s pause time goal and old region collection heuristics. It allowed G1 to avoid unproductive work in GC cycles that ZGC couldn’t.
The switch to ZGC by default has provided the perfect opportunity for application owners to think about their choice of garbage collector. Several batch/precompute cases had been using G1 by default, where they would have seen better throughput from the parallel collector. In one large precompute workload we saw a 6–8% improvement in application throughput, shaving an hour off the batch time, versus G1.
Try it for yourself!
Left unquestioned, assumptions and expectations could have caused us to miss one of the most impactful changes we’ve made to our operational defaults in a decade. We’d encourage you to try generational ZGC for yourself. It might surprise you as much as it surprised us.
![]()
Bending pause times to your will with Generational ZGC was originally published in Netflix TechBlog on Medium, where people are continuing the conversation by highlighting and responding to this story.
