Tag Archives: stability

No version left behind: Our epic journey of GitLab upgrades

Post Syndicated from Grab Tech original https://engineering.grab.com/no-version-left-behind-our-epic-journey-of-gitlab-upgrades

In a tech-driven field, staying updated isn’t an option—it’s essential. At Grab, we’re committed to providing top-notch technology services. However, keeping pace can be demanding. At one point in time, our GitLab instance was trailing by roughly 14 months of releases. This blog post recounts our experience updating and formulating a consistent upgrade routine.

Recognising the need to upgrade

Our team, while skilled, was still learning GitLab’s complexities. Regular stability issues left us little time for necessary upgrades. Understanding the importance of upgrades for our operations to get latest patches for important security fixes and vulnerabilities, we started preparing for GitLab updates while managing system stability. This meant a quick learning and careful approach to updates.

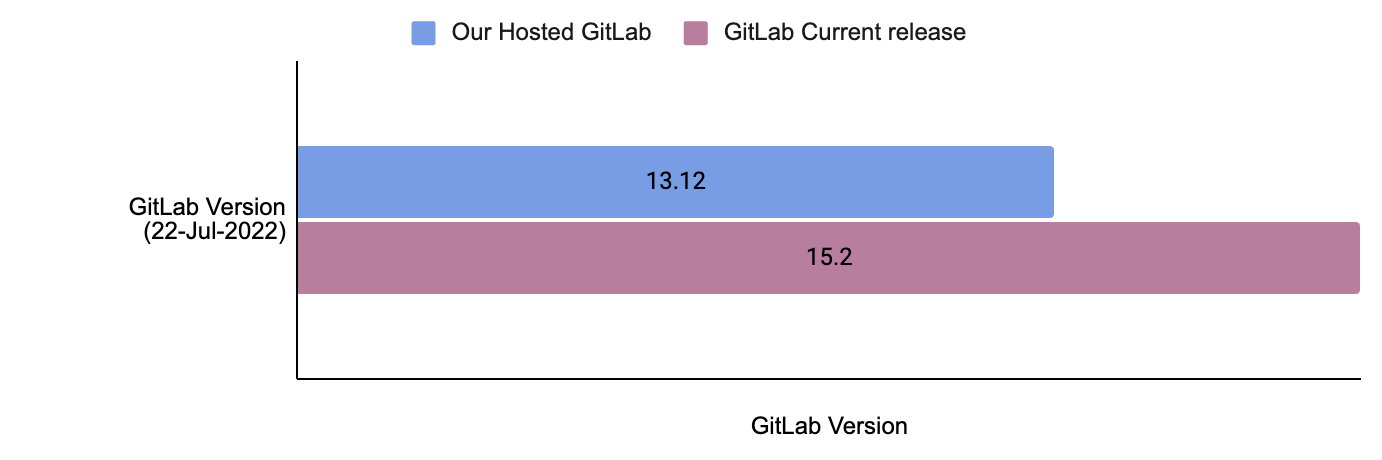
The following image illustrates the version discrepancy between our self-hosted GitLab instance and the official most recent release of GitLab as of July 2022. GitLab follows a set release schedule, issuing one minor update monthly and rolling out a major upgrade annually.

Fig 1. The difference between our hosted version and the latest available GitLab version by 22 July 2022

Addressing fears and concerns

We were concerned about potential downtime, data integrity, and the threat of encountering unforeseen issues. GitLab is critical for the daily activities of Grab engineers. It serves a critical user base of thousands of engineers actively using it, hosting multiple mono repositories with code bases ranging in size from 1GB to a sizable 15GB. When taking into account all its artefacts, the overall imprint of a monorepo can extend to an impressive 39TB.

Our self-hosted GitLab firmly intertwines with multiple critical components. We’ve aligned our systems with GitLab’s official reference architecture for 5,000 users. We use Terraform to configure complete infrastructure with immutable Amazon Machine Images (AMIs) built using Packer and Ansible. Our efficient GitLab setup is designed for reliable performance to serve our wide user base. However, any fault leading to outages can disrupt our engineers, resulting in a loss of productivity for hundreds of teams.

High-level GitLab Architecture Diagram

The above is the top level architecture diagram of our GitLab infrastructure. Here are the major components of the GitLab architecture and their functions: 

  • Gitaly: Handles low-level Git operations for GitLab, such as interacting directly with the code repository present on disk. It’s important to mention that these code repositories are also stored on the same Gitaly nodes, using the attached Amazon Elastic Block Store (Amazon EBS) disks.
  • Praefect: Praefect in GitLab acts as a manager, coordinating Gitaly nodes to maintain data consistency and high availability.
  • Sidekiq: The background processing framework for GitLab written in Ruby. It handles asynchronous tasks in GitLab, ensuring smooth operation without blocking the main application.
  • App Server: The core web application server that serves the GitLab user interface and interacts with other components.

The importance of preparation

Recognising the complexity of our task, we prioritised careful planning for a successful upgrade. We studied GitLab’s documentation, shared insights within the team, and planned to prevent data losses.

To minimise disruptions from major upgrades or database migrations, we scheduled these during weekends. We also developed a checklist and a systematic approach for each upgrade, which include the following:

  • Diligently go through the release notes for each version of GitLab that falls within the scope of our upgrade.
  • Read through all dependencies like RDS, Redis, and Elasticsearch to ensure version compatibility.
  • Create documentation outlining new features, any deprecated elements, and changes that could potentially impact our operations.
  • Generate immutable AMIs for various components reflecting the new version of GitLab.
  • Revisit and validate all the backup plans.
  • Refresh staging environment with production data for accurate, realistic testing and performance checks, and validation of migration scripts under conditions similar to the actual setup.
  • Upgrade the staging environment.
  • Conduct extensive testing, incorporating both automated and manual functional testing, as well as load testing.
  • Conduct rollback tests on the staging environment to the previous version to confirm the rollback procedure’s reliability.
  • Inform all impacted stakeholders, and provide a defined timeline for upcoming upgrades.

We systematically follow GitLab’s official documentation for each upgrade, ensuring compatibility across software versions and reviewing specific instructions and changes, including any deprecations or removals.

The first upgrade

Equipped with knowledge, backup plans, and a robust support system, we embarked on our first GitLab upgrade two years ago. We carefully followed our checklist, handling each important part systematically. GitLab comprises both stateful (Gitaly) and stateless (Praefect, Sidekiq, and App Server) components, all managed through auto-scaling groups. We use a ‘create before destroy’ strategy for deploying stateless components and an ‘in-place node rotation’ method via Terraform for stateful ones.

We deployed key parts like Gitaly, Praefect, Sidekiq, App Servers, Network File System (NFS) server, and Elasticsearch in a specific sequence. Starting with Gitaly, followed by Praefect, then Sidekiq and App Servers, and finally NFS and Elasticsearch. Our thorough testing showed this order to be the most dependable and safe.

However, the journey was full of challenges. For instance, we encountered issues such as the Gitaly cluster falling out of sync for monorepo and the Praefect server failing to distribute the load effectively. Praefect assigns a primary Gitaly node for each repository to host it. All write operations are sent to the repository’s primary node, while read requests are spread across all synced nodes in the Gitaly cluster. If the Gitaly nodes aren’t synced, Praefect will redirect all write and read operations to the repository’s primary node.

Gitaly is a stateful application, we upgraded each Gitaly node with the latest AMI using an in-place node rotation strategy. In older versions of GitLab (up to v14.0), if a Gitaly node is unhealthy, Praefect would immediately update the primary node for the repository to any healthy Gitaly node. After the rolling upgrade for a 3-node Gitaly cluster, repositories were mainly concentrated on only one Gitaly node.

In our situation, a very busy monorepo was assigned to a Gitaly node that was also the main node for many other repositories. When real traffic began after deployment, the Gitaly node had trouble syncing the monorepo with the other nodes in the cluster.

Because the Gitaly node was out of sync, Praefect started sending all changes and access requests for monorepo to this struggling Gitaly node. This increased the load on the Gitaly server, causing it to fail. We found this to be the main issue and decided to manually move our monorepo to a Gitaly node that was less crowded. We also added a step to validate primary node distribution to our deployment checklist.

This immediate failover behaviour changed in GitLab version 14.1. Now, a primary is only elected lazily when a write request arrives for any repository. However, since we enabled maintenance mode before the Gitaly deployment, we didn’t receive any write requests. As a result, we did not see a shift in the primary node of the monorepo with new GitLab versions.

Regular upgrades: Our new normal

Embracing the practice of consistent upgrades dramatically transformed the way we operate. We initiated frequent upgrades and implemented measures to reduce the actual deployment time.  

  • Perform all major testing in one day before deployment.
  • Prepare a detailed checklist to follow during the deployment activity.
  • Reduce the minimum number of App Server and Sidekiq Servers required just after we start the deployment.
  • Upgrade components like App Server and Sidekiq in parallel.
  • Automate smoke testing to examine all major workflows after deployment.

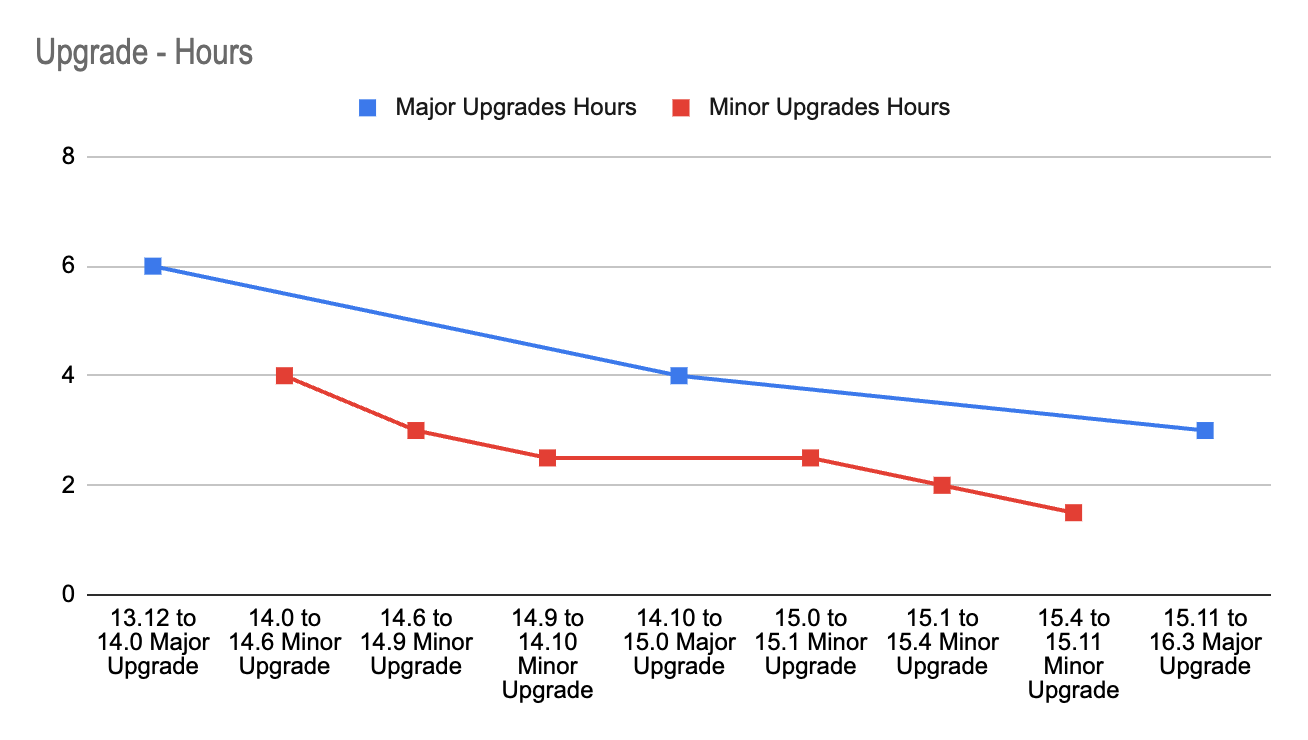
Leveraging the lessons learned and the experience gained with each upgrade, we successfully cut the time spent on the entire operation by 50%. The image-3 shows how we reduced our deployment time for major upgrades from 6 hours to 3 hours and our deployment time for minor upgrades from 4 to 1.5 hours.

Each upgrade enriched our comprehensive knowledge base, equipping us with insights into the possible behaviours of each component under varying circumstances. Our growing experience and enhanced knowledge helped us achieve successful upgrades with less downtime with each deployment.

Rather than moving up one minor version at a time, we learned about the feasibility of skipping versions. We began using the GitLab Upgrade Path. This method allowed us to skip several versions, closing the distance to the latest version with fewer deployments. This approach enabled us to catch up on 24 months’ worth of upgrades in just 11 months, even though we started 14 months behind. 

Time taken in hrs for each upgrade. The blue line depicts major and the red line is for minor upgrades

Overcoming challenges

Our journey was not without hurdles. We faced challenges in maintaining system stability during upgrades, navigating unexpected changes in functionality post upgrades, and ensuring data integrity.

However, these challenges served as an opportunity for our team to innovate and create robust workarounds. Here are a few highlights:

Unexpected project distribution: During upgrades and Gitaly server restarts, we observed unexpected migration of the monorepo to a crowded Gitaly server, resulting in higher rate limiting. We manually updated primary nodes for the monorepo and made this validation as a part of our deployment checklist.

NFS deprecation: We migrated all required data to S3 buckets and deprecated NFS to become more resilient and independent of Availability Zone (AZ).

Handling unexpected Continuous Integration (CI) operations: A sudden surge in CI operations sometimes resulted in rate limiting and interrupted more essential Git operations for developers. This is because GitLab uses different RPC calls and their concurrency for SSH and HTTP operations. We encouraged using HTTPS links for GitLab CI and automation script and SSH links for regular Git operations.

Right-sizing resources: We countered resource limitations by right-sizing our infrastructure, ensuring each component had optimal resources to function efficiently.

Performance testing: We conducted performance testing of our GitLab using the GitLab Performance Tool (GPT). In addition, we used our custom scripts to load test Grab specific use cases and mono repositories.

Limiting maintenance windows: Each deployment required a maintenance window or downtime. To minimise this, we structured our deployment processes more efficiently, reducing potential downtime and ensuring uninterrupted service for users.

Dependency on GitLab.com image registry: We introduced measures to host necessary images internally, which increased our resilience and allowed us to cut ties with external dependencies.

The results

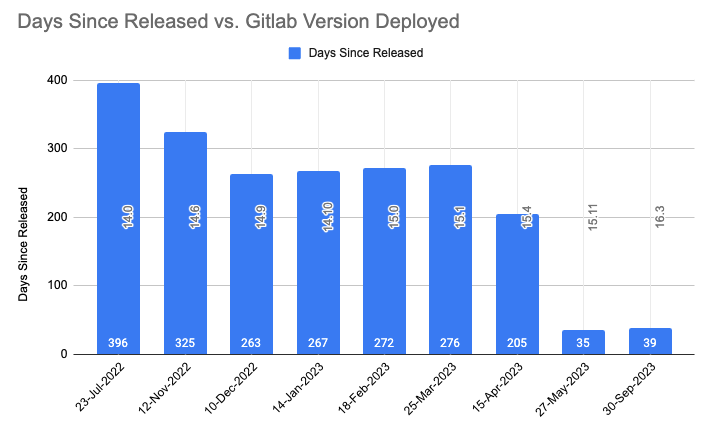
Through careful planning, we’ve improved our upgrade process, ensuring system stability and timely updates. We’ve also reduced the delay in aligning with official GitLab releases. The image below displays how the time delay between release date and deployment has been reduced with each upgrade. It sharply brought down from 396 days (around 14 months) to 35 days

At the time of this article, we’re just two minor versions behind the latest GitLab release, with a strong focus on security and resilience. We are also seeing a reduced number of reported issues after each upgrade.

Our refined process has allowed us to perform regular updates without any service disruptions. We aim to leverage these learnings to automate our upgrade deployments, painting a positive picture for our future updates, marked by efficiency and stability.

Time delay between official release date and date of deployment

Looking ahead

Our dedication extends beyond staying current with the most recent GitLab versions. With stabilised deployment, we are now focusing on:

  • Automated upgrades: Our efforts extend towards bringing in more automation to enhance efficiency. We’re already employing zero-downtime automated upgrades for patch versions involving no database migrations, utilising GitLab pipelines. Looking forward, we plan to automate minor version deployments as well, ensuring minimal human intervention during the upgrade process.
  • Automated runner onboarding for service teams: We’ve developed a ‘Runner as a Service’ solution for our service teams. Service teams can create their dedicated runners by providing minimal details, while we manage these runners centrally. This setup allows the service team to stay focused on development, ensuring smooth operations.
  • Improved communication and data safety: We’re regularly communicating new features and potential issues to our service teams. We also ensure targeted solutions for any disruptions. Additionally, we’re focusing on developing automated data validation via our data restoration process. 
  • Focus on development: With stabilised updates, we’ve created an environment where our development teams can focus more on crafting new features and supporting ongoing work, rather than handling upgrade issues.

Key takeaways

The upgrade process taught us the importance of adaptability, thorough preparation, effective communication, and continuous learning. Our ‘No Version Left Behind’ motto underscores the critical role of regular tech updates in boosting productivity, refining processes, and strengthening security. These insights will guide us as we navigate ongoing technological advancements.

Below are the key areas in which we improved:

Enhanced testing procedures: We’ve fine-tuned our testing strategies, using both automated and manual testing for GitLab, and regularly conducting performance tests before upgrades.

Approvals: We’ve designed approval workflows that allow us to obtain necessary clearances or approvals before each upgrade efficiently, further ensuring the smooth execution of our processes.

Improved communication: We’ve improved stakeholder communication, regularly sharing updates and detailed documents about new features, deprecated items, and significant changes with each upgrade.

Streamlined planning: We’ve improved our upgrade planning, strictly following our checklist and rotating the role of Upgrade Ownership among team members.

Optimised activity time: We’ve significantly reduced the time for production upgrade activity through advanced planning, automation, and eliminating unnecessary steps.

Efficient issue management: We’ve improved our ability to handle potential GitLab upgrade issues, with minimal to no issues occurring. We’re prepared to handle any incidents that could cause an outage.

Knowledge base creation and automation: We’ve created a GitLab knowledge base and continuously enhanced it with rich content, making it even more invaluable for training new team members and for reference during unexpected situations. We’ve also automated routine tasks to improve efficiency and reduce manual errors.

Join us

Grab is the leading superapp platform in Southeast Asia, providing everyday services that matter to consumers. More than just a ride-hailing and food delivery app, Grab offers a wide range of on-demand services in the region, including mobility, food, package and grocery delivery services, mobile payments, and financial services across 428 cities in eight countries.

Powered by technology and driven by heart, our mission is to drive Southeast Asia forward by creating economic empowerment for everyone. If this mission speaks to you, join our team today!

How Orpheus automatically routes around bad Internet weather

Post Syndicated from Chris Draper original http://blog.cloudflare.com/orpheus-saves-internet-requests-while-maintaining-speed/

How Orpheus automatically routes around bad Internet weather

How Orpheus automatically routes around bad Internet weather

Cloudflare’s mission is to help build a better Internet for everyone, and Orpheus plays an important role in realizing this mission. Orpheus identifies Internet connectivity outages beyond Cloudflare’s network in real time then leverages the scale and speed of Cloudflare’s network to find alternative paths around those outages. This ensures that everyone can reach a Cloudflare customer’s origin server no matter what is happening on the Internet. The end result is powerful: Cloudflare  protects customers from Internet incidents outside our network while maintaining the average latency and speed of our customer’s traffic.

A little less than two years ago, Cloudflare made Orpheus automatically available to all customers for free. Since then, Orpheus has saved 132 billion Internet requests from failing by intelligently routing them around connectivity outages, prevented 50+ Internet incidents from impacting our customers, and made our customer’s origins more reachable to everyone on the Internet. Let’s dive into how Orpheus accomplished these feats over the last year.

Increasing origin reachability

One service that Cloudflare offers is a reverse proxy that receives Internet requests from end users then applies any number of services like DDoS protection, caching, load balancing, and / or encryption. If the response to an end user’s request isn’t cached, Cloudflare routes the request to our customer’s origin servers. To be successful, end users need to be able to connect to Cloudflare, and Cloudflare needs to connect to our customer’s origin servers. With end users and customer origins around the world, and ~20% of websites using our network, this task is a tall order!

Orpheus provides origin reachability benefits to everyone using Cloudflare by identifying invalid paths on the Internet in real time, then routing traffic via alternative paths that are working as expected. This ensures Cloudflare can reach an origin no matter what problems are happening on the Internet on any given day.

Reducing 522 errors

At some point while browsing the Internet, you may have run into this 522 error.

How Orpheus automatically routes around bad Internet weather

This error indicates that you, the end user, was unable to access content on a Cloudflare customer’s origin server because Cloudflare couldn’t connect to the origin. Sometimes, this error occurs because the origin is offline for everyone, and ultimately the origin owner needs to fix the problem. Other times, this error can occur even when the origin server is up and able to receive traffic. In this case, some people can reach content on the origin server, but other people using a different Internet routing path cannot because of connectivity issues across the Internet.

Some days, a specific network may have excellent connectivity, while other days that network may be congested or have paths that are impassable altogether. The Internet is a massive and unpredictable network of networks, and the “weather” of the Internet changes every day.

When you see this error, Cloudflare attempted to connect to an origin on behalf of the end user, but did not receive a response back from the origin. Either the connection request never reached the origin, or the origin’s reply was dropped on the way back to Cloudflare. In the case of 522 errors, Cloudflare and the origin server could both be working as expected, but packets are dropped on the network path between them.

These 522 errors can cause a lot of frustration, and Orpheus was built to reduce them. The goal of Orpheus is to ensure that if at least one Cloudflare data center can connect to an origin, then anyone using Cloudflare’s network can also reach that origin, even if there are Internet connectivity problems happening outside of Cloudflare’s network.

Improving origin reachability for an example customer using Cloudflare

Let’s look at a concrete example of how Orpheus makes the Internet better for everyone by saving an origin request that would have otherwise failed. Imagine that you’re running an e-commerce website that sells dog toys online, and your store is hosted by an origin server in Chicago.

Imagine there are two different customers visiting your website at the same time: the first customer lives in Seattle, and the second customer lives in Tampa. The customer in Seattle reaches your origin just fine, but the customer in Tampa tries to connect to your origin and experiences a problem. It turns out that a construction crew accidentally damaged an Internet fiber line in Tampa, and Tampa is having connectivity issues with Chicago. As a result, any customer in Tampa receives a 522 error when they try to buy your dog toys online.

This is where Orpheus comes in to save the day. Orpheus detects that users in Tampa are receiving 522 errors when connecting to Chicago. Its database shows there is another route from Tampa through Boston and then to Chicago that is valid. As a result, Orpheus saves the end user’s request by rerouting it through Boston and taking an alternative path. Now, everyone in Tampa can still buy dog toys from your website hosted in Chicago, even though a fiber line was damaged unexpectedly.

How Orpheus automatically routes around bad Internet weather

How does Orpheus save requests that would otherwise fail via only BGP?

BGP (Border Gateway Protocol) is like the postal service of the Internet. It’s the protocol that makes the Internet work by enabling data routing. When someone requests data over the Internet, BGP is responsible for looking at all the available paths a request could take, then selecting a route.

BGP is designed to route around network failures by finding alternative paths to the destination IP address after the preferred path goes down. Sometimes, BGP does not route around a network failure at all. In this case, Cloudflare still receives BGP advertisements that an origin network is reachable via a particular autonomous system (AS), when actually packets sent through that AS will be dropped. In contrast, Orpheus will test alternate paths via synthetic probes and with real time traffic to ensure it is always using valid routes. Even when working as designed, BGP takes time to converge after a network disruption; Orpheus can react faster, find alternative paths to the origin that route around temporary or persistent errors, and ultimately save more Internet requests.

Additionally, BGP routes can be vulnerable to hijacking. If a BGP route is hijacked, Orpheus can prevent Internet requests from being dropped by invalid BGP routes by frequently testing all routes and examining the results to ensure they’re working as expected. In any of these cases, Orpheus routes around these BGP issues by taking advantage of the scale of Cloudflare’s global network which directly connects to 11,000 networks, features data centers across 275 cities, and has 172 Tbps of network capacity.

Let’s give an example of how Orpheus can save requests that would otherwise fail if only using BGP. Imagine an end user in Mumbai sends a request to a Cloudflare customer with an origin server in New York. For any request that misses Cloudflare’s cache, Cloudflare forwards the request from Mumbai to the website’s origin server in New York. Now imagine something happens, and the origin is no longer reachable from India: maybe a fiber optic cable was cut in Egypt, a different network advertised a BGP route it shouldn’t have, or an intermediary AS between Cloudflare and the origin was misconfigured that day.

In any of these scenarios, Orpheus can leverage the scale of Cloudflare’s global network to reach the origin in New York via an alternate path. While the direct path from Mumbai to New York may be unreachable, an alternate path from Mumbai, through London, then to New York may be available. This alternate path is valid because it uses different physical Internet connections that are unaffected by the issues with directly connecting from Mumbai to New York. In this case, Orpheus selects the alternate route through London and saves a request that would otherwise fail via the direct connection.

How Orpheus automatically routes around bad Internet weather

How Orpheus was built by reusing components of Argo Smart Routing

Back in 2017, Cloudflare released Argo Smart Routing which decreases latency by an average of 30%, improves security, and increases reliability. To help Cloudflare achieve its goal of helping build a better Internet for everyone, we decided to take the features that offered “increased reliability” in Argo Smart Routing and make them available to every Cloudflare user for free with Orpheus.

Argo Smart Routing’s architecture has two primary components: the data plane and the control plane. The control plane is responsible for computing the fastest routes between two locations and identifying potential failover paths in case the fastest route is down. The data plane is responsible for sending requests via the routes defined by the control plane, or detecting in real-time when a route is down and sending a request via a failover path as needed.

Orpheus was born with a simple technical idea: Cloudflare could deploy an alternate version of Argo’s control plane where the routing table only includes failover paths. Today, this alternate control plane makes up the core of Orpheus. If a request that travels through Cloudflare’s network is unable to connect to the origin via a preferred path, then Orpheus’s data plane selects a failover path from the routing table in its control plane. Orpheus prioritizes using failover paths that are more reliable to increase the likelihood a request uses the failover route and is successful.

Orpeus also takes advantage of a complex Internet monitoring system that we had already built for Argo Smart Routing. This system is constantly testing the health of many internet routing paths between different Cloudflare data centers and a customer’s origin by periodically opening then closing a TCP connection. This is called a synthetic probe, and the results are used for Argo Smart Routing, Orpheus, and even in other Cloudflare products. Cloudflare directly connects to 11,000 networks, and typically there are many different Internet routing paths that reach the same origin. Argo and Orpheus maintain a database of the results of all TCP connections that opened successfully or failed with their corresponding routing paths.

Scaling the Orpheus data plane to save requests for everyone

Cloudflare proxies millions of requests to customers' origins every second, and we had to make some improvements to Orpheus before it was ready to save users’ requests at scale. In particular, Cloudflare designed Orpheus to only process and reroute requests that would otherwise fail. In order to identify these requests, we added an error cache to Cloudflare’s layer 7 HTTP stack.

When you send an Internet request (TCP SYN) through Cloudflare to our customer’s origin, and Cloudflare doesn’t receive a response (TCP SYN/ACK), the end user receives a 522 error (learn more about TCP flags). Orpheus creates an entry in the error cache for each unique combination of a 522 error, origin address, and a specific route to that origin. The next time a request is sent to the same origin address via the same route, Orpheus will check the error cache for relevant entries. If there is a hit in the error cache, then Orpheus’s data plane will select an alternative route to prevent subsequent requests from failing.

To keep entries in the error cache updated, Orpheus will use live traffic to retry routes that previously failed to check their status. Routes in the error cache are periodically retried with a bounded exponential backoff. Unavailable routes are tested every 5th, 25th, 125th, 625th, and 3,125th request (the maximum bound). If the test request that’s sent down the original path fails, Orpheus saves the test request, sends it via the established alternate path, and updates the backoff counter. If a test request is successful, then the failed route is removed from the error cache, and normal routing operations are restored. Additionally, the error cache has an expiry period of 10 minutes. This prevents the cache from storing entries on failed routes that rarely receive additional requests.

The error cache has notable a trade-off; one direct-to-origin request must fail before Orpheus engages and saves subsequent requests. Clearly this isn’t ideal, and the Argo / Orpheus engineering team is hard at work improving Orpheus so it can prevent any request from failing.

Making Orpheus faster and more responsive

Orpheus does a great job of identifying congested or unreachable paths on the Internet, and re-routing requests that would have otherwise failed. However, there is always room for improvement, and Cloudflare has been hard at work to make Orpheus even better.

Since its release, Orpheus was built to select failover paths with the highest predicted reliability when it saves a request to an origin. This was an excellent first step, but sometimes a request that was re-routed by Orpheus would take an inefficient path that had better origin reachability but also increased latency. With recent improvements, the Orpheus routing algorithm balances both latency and origin reachability when selecting a new route for a request. If an end user makes a request to an origin, and that request is re-routed by Orpheus, it’s nearly as fast as any other request on Cloudflare’s network.

In addition to decreasing the latency of Orpheus requests, we’re working to make Orpheus more responsive to connectivity changes across the Internet. Today, Orpheus leverages synthetic probes to test whether Internet routes are reachable or unreachable. In the near future, Orpheus will also leverage real-time traffic data to more quickly identify Internet routes that are unreachable and reachable. This will enable Orpheus to re-route traffic around connectivity problems on the Internet within minutes rather than hours.

Expanding Orpheus to save WebSockets requests

Previously, Orpheus focused on saving HTTP and TCP Internet requests. Cloudflare has seen amazing benefits to origin reliability and Internet stability for these types of requests, and we’ve been hard at work to expand Orpheus to also save WebSocket requests from failing.

WebSockets is a common Internet protocol that prioritizes sending real time data between a client and server by maintaining an open connection between that client and server. Imagine that you (the client) have sent a request to see a website’s home page (which is generated by the server). When using HTTP, the connection between the client and server is established by the client, and the connection is closed once the request is completed. That means that if you send three requests to a website, three different connections are opened and closed for each request.

In contrast, when using the WebSockets protocol, one connection is established between the client and server. All requests moving in between the client and server are sent through this connection until the connection is terminated. In this case, you could send 10 requests to a website, and all of those requests would travel over the same connection. Due to these differences in protocol, Cloudflare had to adjust to Orpheus to make it capable of also saving WebSockets requests. Now all Cloudflare customers that use WebSockets in their Internet applications can expect the same level of stability and resiliency across their HTTP, TCP, and WebSockets traffic.

P.S. If you’re interested in working on Orpheus, drop us a line!

Orpheus and Argo Smart Routing

Orpheus runs on the same technology that powers Cloudflare’s Argo Smart Routing product. While Orpheus is designed to maximize origin reachability, Argo Smart Routing leverages network latency data to accelerate traffic on Cloudflare’s network and find the fastest route between an end user and a customer’s origin. On average, customers using Argo Smart Routing see that their web assets perform 30% faster. Together, Orpheus and Argo Smart Routing work to improve the end user experience for websites and contribute to Cloudflare’s goal of helping build a better Internet.

If you’re a Cloudflare customer, you are automatically using Orpheus behind the scenes and improving your website’s availability. If you want to make the web faster for your users, you can log in to the Cloudflare dashboard and add Argo Smart Routing to your contract or plan today.

Understanding memory usage in your Java application with Amazon CodeGuru Profiler

Post Syndicated from Fernando Ciciliati original https://aws.amazon.com/blogs/devops/understanding-memory-usage-in-your-java-application-with-amazon-codeguru-profiler/

“Where has all that free memory gone?” This is the question we ask ourselves every time our application emits that dreaded OutOfMemoyError just before it crashes. Amazon CodeGuru Profiler can help you find the answer.

Thanks to its brand-new memory profiling capabilities, troubleshooting and resolving memory issues in Java applications (or almost anything that runs on the JVM) is much easier. AWS launched the CodeGuru Profiler Heap Summary feature at re:Invent 2020. This is the first step in helping us, developers, understand what our software is doing with all that memory it uses.

The Heap Summary view shows a list of Java classes and data types present in the Java Virtual Machine heap, alongside the amount of memory they’re retaining and the number of instances they represent. The following screenshot shows an example of this view.

Amazon CodeGuru Profiler heap summary view example

Figure: Amazon CodeGuru Profiler Heap Summary feature

Because CodeGuru Profiler is a low-overhead, production profiling service designed to be always on, it can capture and represent how memory utilization varies over time, providing helpful visual hints about the object types and the data types that exhibit a growing trend in memory consumption.

In the preceding screenshot, we can see that several lines on the graph are trending upwards:

  • The red top line, horizontal and flat, shows how much memory has been reserved as heap space in the JVM. In this case, we see a heap size of 512 MB, which can usually be configured in the JVM with command line parameters like -Xmx.
  • The second line from the top, blue, represents the total memory in use in the heap, independent of their type.
  • The third, fourth, and fifth lines show how much memory space each specific type has been using historically in the heap. We can easily spot that java.util.LinkedHashMap$Entry and java.lang.UUID display growing trends, whereas byte[] has a flat line and seems stable in memory usage.

Types that exhibit constantly growing trend of memory utilization with time deserve a closer look. Profiler helps you focus your attention on these cases. Associating the information presented by the Profiler with your own knowledge of your application and code base, you can evaluate whether the amount of memory being used for a specific data type can be considered normal, or if it might be a memory leak – the unintentional holding of memory by an application due to the failure in freeing-up unused objects. In our example above, java.util.LinkedHashMap$Entry and java.lang.UUIDare good candidates for investigation.

To make this functionality available to customers, CodeGuru Profiler uses the power of Java Flight Recorder (JFR), which is now openly available with Java 8 (since OpenJDK release 262) and above. The Amazon CodeGuru Profiler agent for Java, which already does an awesome job capturing data about CPU utilization, has been extended to periodically collect memory retention metrics from JFR and submit them for processing and visualization via Amazon CodeGuru Profiler. Thanks to its high stability and low overhead, the Profiler agent can be safely deployed to services in production, because it is exactly there, under real workloads, that really interesting memory issues are most likely to show up.

Summary

For more information about CodeGuru Profiler and other AI-powered services in the Amazon CodeGuru family, see Amazon CodeGuru. If you haven’t tried the CodeGuru Profiler yet, start your 90-day free trial right now and understand why continuous profiling is becoming a must-have in every production environment. For Amazon CodeGuru customers who are already enjoying the benefits of always-on profiling, this new feature is available at no extra cost. Just update your Profiler agent to version 1.1.0 or newer, and enable Heap Summary in your agent configuration.


Happy profiling!