All posts by Jakub Sitnicki

The quantum state of a TCP port

Post Syndicated from Jakub Sitnicki original https://blog.cloudflare.com/the-quantum-state-of-a-tcp-port/

The quantum state of a TCP port

The quantum state of a TCP port

Have you noticed how simple questions sometimes lead to complex answers? Today we will tackle one such question. Category: our favorite – Linux networking.

When can two TCP sockets share a local address?

If I navigate to https://blog.cloudflare.com/, my browser will connect to a remote TCP address, might be 104.16.132.229:443 in this case, from the local IP address assigned to my Linux machine, and a randomly chosen local TCP port, say 192.0.2.42:54321. What happens if I then decide to head to a different site? Is it possible to establish another TCP connection from the same local IP address and port?

To find the answer let’s do a bit of learning by discovering. We have prepared eight quiz questions. Each will let you discover one aspect of the rules that govern local address sharing between TCP sockets under Linux. Fair warning, it might get a bit mind-boggling.

Questions are split into two groups by test scenario:

The quantum state of a TCP port

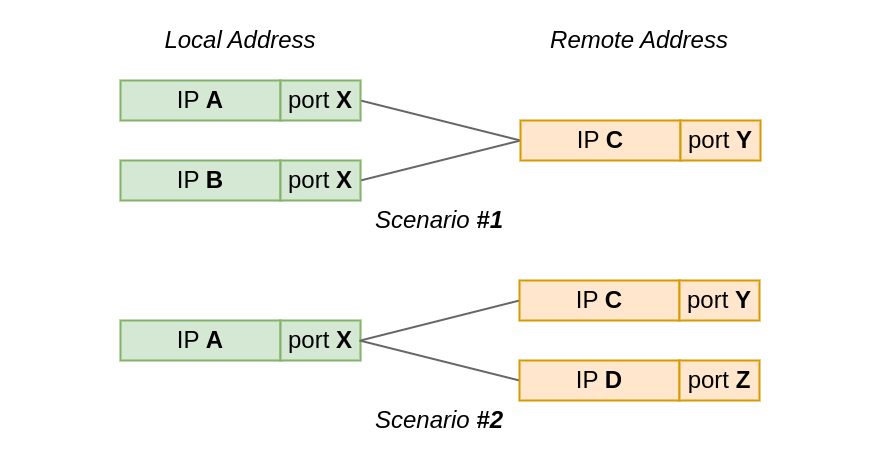
In the first test scenario, two sockets connect from the same local port to the same remote IP and port. However, the local IP is different for each socket.

While, in the second scenario, the local IP and port is the same for all sockets, but the remote address, or actually just the IP address, differs.

In our quiz questions, we will either:

  1. let the OS automatically select the the local IP and/or port for the socket, or
  2. we will explicitly assign the local address with bind() before connect()’ing the socket; a method also known as bind-before-connect.

Because we will be examining corner cases in the bind() logic, we need a way to exhaust available local addresses, that is (IP, port) pairs. We could just create lots of sockets, but it will be easier to tweak the system configuration and pretend that there is just one ephemeral local port, which the OS can assign to sockets:

sysctl -w net.ipv4.ip_local_port_range='60000 60000'

Each quiz question is a short Python snippet. Your task is to predict the outcome of running the code. Does it succeed? Does it fail? If so, what fails? Asking ChatGPT is not allowed 😉

There is always a common setup procedure to keep in mind. We will omit it from the quiz snippets to keep them short:

from os import system
from socket import *

# Missing constants
IP_BIND_ADDRESS_NO_PORT = 24

# Our network namespace has just *one* ephemeral port
system("sysctl -w net.ipv4.ip_local_port_range='60000 60000'")

# Open a listening socket at *:1234. We will connect to it.
ln = socket(AF_INET, SOCK_STREAM)
ln.bind(("", 1234))
ln.listen(SOMAXCONN)

With the formalities out of the way, let us begin. Ready. Set. Go!

Scenario #1: When the local IP is unique, but the local port is the same

In Scenario #1 we connect two sockets to the same remote address – 127.9.9.9:1234. The sockets will use different local IP addresses, but is it enough to share the local port?

local IP local port remote IP remote port
unique same same same
127.0.0.1
127.1.1.1
127.2.2.2
60_000 127.9.9.9 1234

Quiz #1

On the local side, we bind two sockets to distinct, explicitly specified IP addresses. We will allow the OS to select the local port. Remember: our local ephemeral port range contains just one port (60,000).

s1 = socket(AF_INET, SOCK_STREAM)
s1.bind(('127.1.1.1', 0))
s1.connect(('127.9.9.9', 1234))
s1.getsockname(), s1.getpeername()

s2 = socket(AF_INET, SOCK_STREAM)
s2.bind(('127.2.2.2', 0))
s2.connect(('127.9.9.9', 1234))
s2.getsockname(), s2.getpeername()

GOTO Answer #1

Quiz #2

Here, the setup is almost identical as before. However, we ask the OS to select the local IP address and port for the first socket. Do you think the result will differ from the previous question?

s1 = socket(AF_INET, SOCK_STREAM)
s1.connect(('127.9.9.9', 1234))
s1.getsockname(), s1.getpeername()

s2 = socket(AF_INET, SOCK_STREAM)
s2.bind(('127.2.2.2', 0))
s2.connect(('127.9.9.9', 1234))
s2.getsockname(), s2.getpeername()

GOTO Answer #2

Quiz #3

This quiz question is just like  the one above. We just changed the ordering. First, we connect a socket from an explicitly specified local address. Then we ask the system to select a local address for us. Obviously, such an ordering change should not make any difference, right?

s1 = socket(AF_INET, SOCK_STREAM)
s1.bind(('127.1.1.1', 0))
s1.connect(('127.9.9.9', 1234))
s1.getsockname(), s1.getpeername()

s2 = socket(AF_INET, SOCK_STREAM)
s2.connect(('127.9.9.9', 1234))
s2.getsockname(), s2.getpeername()

GOTO Answer #3

Scenario #2: When the local IP and port are the same, but the remote IP differs

In Scenario #2 we reverse our setup. Instead of multiple local IP’s and one remote address, we now have one local address 127.0.0.1:60000 and two distinct remote addresses. The question remains the same – can two sockets share the local port? Reminder: ephemeral port range is still of size one.

local IP local port remote IP remote port
same same unique same
127.0.0.1 60_000 127.8.8.8
127.9.9.9
1234

Quiz #4

Let’s start from the basics. We connect() to two distinct remote addresses. This is a warm up 🙂

s1 = socket(AF_INET, SOCK_STREAM)
s1.connect(('127.8.8.8', 1234))
s1.getsockname(), s1.getpeername()

s2 = socket(AF_INET, SOCK_STREAM)
s2.connect(('127.9.9.9', 1234))
s2.getsockname(), s2.getpeername()

GOTO Answer #4

Quiz #5

What if we bind() to a local IP explicitly but let the OS select the port – does anything change?

s1 = socket(AF_INET, SOCK_STREAM)
s1.bind(('127.0.0.1', 0))
s1.connect(('127.8.8.8', 1234))
s1.getsockname(), s1.getpeername()

s2 = socket(AF_INET, SOCK_STREAM)
s2.bind(('127.0.0.1', 0))
s2.connect(('127.9.9.9', 1234))
s2.getsockname(), s2.getpeername()

GOTO Answer #5

Quiz #6

This time we explicitly specify the local address and port. Sometimes there is a need to specify the local port.

s1 = socket(AF_INET, SOCK_STREAM)
s1.bind(('127.0.0.1', 60_000))
s1.connect(('127.8.8.8', 1234))
s1.getsockname(), s1.getpeername()

s2 = socket(AF_INET, SOCK_STREAM)
s2.bind(('127.0.0.1', 60_000))
s2.connect(('127.9.9.9', 1234))
s2.getsockname(), s2.getpeername()

GOTO Answer #6

Quiz #7

Just when you thought it couldn’t get any weirder, we add SO_REUSEADDR into the mix.

First, we ask the OS to allocate a local address for us. Then we explicitly bind to the same local address, which we know the OS must have assigned to the first socket. We enable local address reuse for both sockets. Is this allowed?

s1 = socket(AF_INET, SOCK_STREAM)
s1.setsockopt(SOL_SOCKET, SO_REUSEADDR, 1)
s1.connect(('127.8.8.8', 1234))
s1.getsockname(), s1.getpeername()

s2 = socket(AF_INET, SOCK_STREAM)
s2.setsockopt(SOL_SOCKET, SO_REUSEADDR, 1)
s2.bind(('127.0.0.1', 60_000))
s2.connect(('127.9.9.9', 1234))
s2.getsockname(), s2.getpeername()

GOTO Answer #7

Quiz #8

Finally, a cherry on top. This is Quiz #7 but in reverse. Common sense dictates that the outcome should be the same, but is it?

s1 = socket(AF_INET, SOCK_STREAM)
s1.setsockopt(SOL_SOCKET, SO_REUSEADDR, 1)
s1.bind(('127.0.0.1', 60_000))
s1.connect(('127.9.9.9', 1234))
s1.getsockname(), s1.getpeername()

s2 = socket(AF_INET, SOCK_STREAM)
s2.setsockopt(SOL_SOCKET, SO_REUSEADDR, 1)
s2.connect(('127.8.8.8', 1234))
s2.getsockname(), s2.getpeername()

GOTO Answer #8

The secret tri-state life of a local TCP port

Is it all clear now? Well, probably no. It feels like reverse engineering a black box. So what is happening behind the scenes? Let’s take a look.

Linux tracks all TCP ports in use in a hash table named bhash. Not to be confused with with ehash table, which tracks sockets with both local and remote address already assigned.

The quantum state of a TCP port

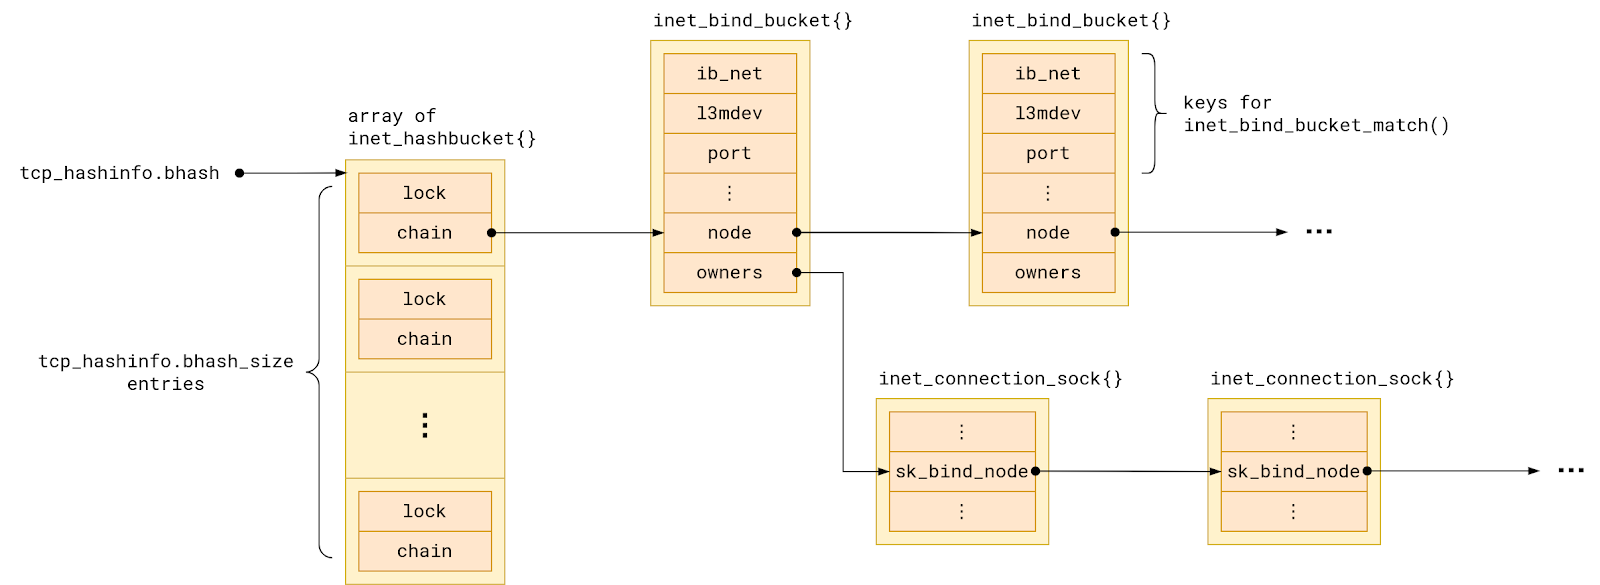
Each hash table entry points to a chain of so-called bind buckets, which group together sockets which share a local port. To be precise, sockets are grouped into buckets by:

  • the network namespace they belong to, and
  • the VRF device they are bound to, and
  • the local port number they are bound to.

But in the simplest possible setup – single network namespace, no VRFs – we can say that sockets in a bind bucket are grouped by their local port number.

The set of sockets in each bind bucket, that is sharing a local port, is backed by a linked list named owners.

When we ask the kernel to assign a local address to a socket, its task is to check for a conflict with any existing socket. That is because a local port number can be shared only under some conditions:

/* There are a few simple rules, which allow for local port reuse by
 * an application.  In essence:
 *
 *   1) Sockets bound to different interfaces may share a local port.
 *      Failing that, goto test 2.
 *   2) If all sockets have sk->sk_reuse set, and none of them are in
 *      TCP_LISTEN state, the port may be shared.
 *      Failing that, goto test 3.
 *   3) If all sockets are bound to a specific inet_sk(sk)->rcv_saddr local
 *      address, and none of them are the same, the port may be
 *      shared.
 *      Failing this, the port cannot be shared.
 *
 * The interesting point, is test #2.  This is what an FTP server does
 * all day.  To optimize this case we use a specific flag bit defined
 * below.  As we add sockets to a bind bucket list, we perform a
 * check of: (newsk->sk_reuse && (newsk->sk_state != TCP_LISTEN))
 * As long as all sockets added to a bind bucket pass this test,
 * the flag bit will be set.
 * ...
 */

The comment above hints that the kernel tries to optimize for the happy case of no conflict. To this end the bind bucket holds additional state which aggregates the properties of the sockets it holds:

struct inet_bind_bucket {
        /* ... */
        signed char          fastreuse;
        signed char          fastreuseport;
        kuid_t               fastuid;
#if IS_ENABLED(CONFIG_IPV6)
        struct in6_addr      fast_v6_rcv_saddr;
#endif
        __be32               fast_rcv_saddr;
        unsigned short       fast_sk_family;
        bool                 fast_ipv6_only;
        /* ... */
};

Let’s focus our attention just on the first aggregate property – fastreuse. It has existed since, now prehistoric, Linux 2.1.90pre1. Initially in the form of a bit flag, as the comment says, only to evolve to a byte-sized field over time.

The other six fields came on much later with the introduction of SO_REUSEPORT in Linux 3.9. Because they play a role only when there are sockets with the SO_REUSEPORT flag set. We are going to ignore them today.

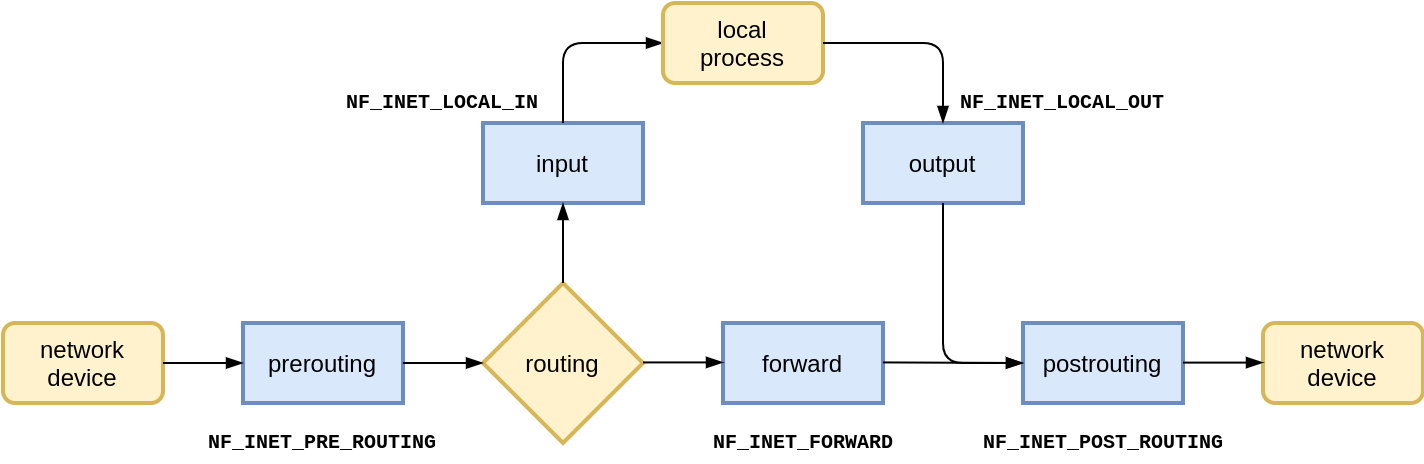
Whenever the Linux kernel needs to bind a socket to a local port, it first has to look for the bind bucket for that port. What makes life a bit more complicated is the fact that the search for a TCP bind bucket exists in two places in the kernel. The bind bucket lookup can happen early – at bind() time – or late – at connect() – time. Which one gets called depends on how the connected socket has been set up:

The quantum state of a TCP port

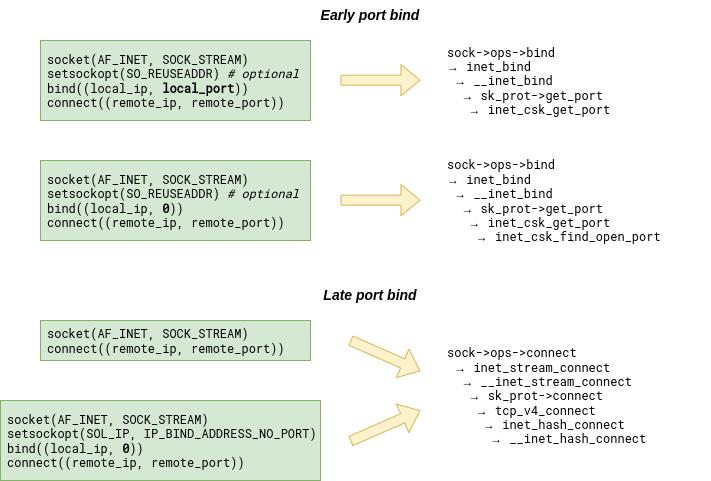
However, whether we land in inet_csk_get_port or __inet_hash_connect, we always end up walking the bucket chain in the bhash looking for the bucket with a matching port number. The bucket might already exist or we might have to create it first. But once it exists, its fastreuse field is in one of three possible states: -1, 0, or +1. As if Linux developers were inspired by quantum mechanics.

That state reflects two aspects of the bind bucket:

  1. What sockets are in the bucket?
  2. When can the local port be shared?

So let us try to decipher the three possible fastreuse states then, and what they mean in each case.

First, what does the fastreuse property say about the owners of the bucket, that is the sockets using that local port?

fastreuse is owners list contains
-1 sockets connect()’ed from an ephemeral port
0 sockets bound without SO_REUSEADDR
+1 sockets bound with SO_REUSEADDR

While this is not the whole truth, it is close enough for now. We will soon get to the bottom of it.

When it comes port sharing, the situation is far less straightforward:

Can I … when … fastreuse = -1 fastreuse = 0 fastreuse = +1
bind() to the same port (ephemeral or specified) yes IFF local IP is unique ① idem ← idem
bind() to the specific port with SO_REUSEADDR yes IFF local IP is unique OR conflicting socket uses SO_REUSEADDR ① ← idem yes
connect() from the same ephemeral port to the same remote (IP, port) yes IFF local IP unique ③ no no
connect() from the same ephemeral port to a unique remote (IP, port) yes no no

① Determined by inet_csk_bind_conflict() called from inet_csk_get_port() (specific port bind) or inet_csk_get_port()inet_csk_find_open_port() (ephemeral port bind).

② Because inet_csk_get_port() skips conflict check for fastreuse == 1 buckets.

③ Because inet_hash_connect()__inet_hash_connect() skips buckets with fastreuse != -1.

While it all looks rather complicated at first sight, we can distill the table above into a few statements that hold true, and are a bit easier to digest:

  • bind(), or early local address allocation, always succeeds if there is no local IP address conflict with any existing socket,
  • connect(), or late local address allocation, always fails when TCP bind bucket for a local port is in any state other than fastreuse = -1,
  • connect() only succeeds if there is no local and remote address conflict,
  • SO_REUSEADDR socket option allows local address sharing, if all conflicting sockets also use it (and none of them is in the listening state).

This is crazy. I don’t believe you.

Fortunately, you don’t have to. With drgn, the programmable debugger, we can examine the bind bucket state on a live kernel:

#!/usr/bin/env drgn

"""
dump_bhash.py - List all TCP bind buckets in the current netns.

Script is not aware of VRF.
"""

import os

from drgn.helpers.linux.list import hlist_for_each, hlist_for_each_entry
from drgn.helpers.linux.net import get_net_ns_by_fd
from drgn.helpers.linux.pid import find_task


def dump_bind_bucket(head, net):
    for tb in hlist_for_each_entry("struct inet_bind_bucket", head, "node"):
        # Skip buckets not from this netns
        if tb.ib_net.net != net:
            continue

        port = tb.port.value_()
        fastreuse = tb.fastreuse.value_()
        owners_len = len(list(hlist_for_each(tb.owners)))

        print(
            "{:8d}  {:{sign}9d}  {:7d}".format(
                port,
                fastreuse,
                owners_len,
                sign="+" if fastreuse != 0 else " ",
            )
        )


def get_netns():
    pid = os.getpid()
    task = find_task(prog, pid)
    with open(f"/proc/{pid}/ns/net") as f:
        return get_net_ns_by_fd(task, f.fileno())


def main():
    print("{:8}  {:9}  {:7}".format("TCP-PORT", "FASTREUSE", "#OWNERS"))

    tcp_hashinfo = prog.object("tcp_hashinfo")
    net = get_netns()

    # Iterate over all bhash slots
    for i in range(0, tcp_hashinfo.bhash_size):
        head = tcp_hashinfo.bhash[i].chain
        # Iterate over bind buckets in the slot
        dump_bind_bucket(head, net)


main()

Let’s take this script for a spin and try to confirm what Table 1 claims to be true. Keep in mind that to produce the ipython --classic session snippets below I’ve used the same setup as for the quiz questions.

Two connected sockets sharing ephemeral port 60,000:

>>> s1 = socket(AF_INET, SOCK_STREAM)
>>> s1.connect(('127.1.1.1', 1234))
>>> s2 = socket(AF_INET, SOCK_STREAM)
>>> s2.connect(('127.2.2.2', 1234))
>>> !./dump_bhash.py
TCP-PORT  FASTREUSE  #OWNERS
    1234          0        3
   60000         -1        2
>>>

Two bound sockets reusing port 60,000:

>>> s1 = socket(AF_INET, SOCK_STREAM)
>>> s1.setsockopt(SOL_SOCKET, SO_REUSEADDR, 1)
>>> s1.bind(('127.1.1.1', 60_000))
>>> s2 = socket(AF_INET, SOCK_STREAM)
>>> s2.setsockopt(SOL_SOCKET, SO_REUSEADDR, 1)
>>> s2.bind(('127.1.1.1', 60_000))
>>> !./dump_bhash.py
TCP-PORT  FASTREUSE  #OWNERS
    1234          0        1
   60000         +1        2
>>> 

A mix of bound sockets with and without REUSEADDR sharing port 60,000:

>>> s1 = socket(AF_INET, SOCK_STREAM)
>>> s1.setsockopt(SOL_SOCKET, SO_REUSEADDR, 1)
>>> s1.bind(('127.1.1.1', 60_000))
>>> !./dump_bhash.py
TCP-PORT  FASTREUSE  #OWNERS
    1234          0        1
   60000         +1        1
>>> s2 = socket(AF_INET, SOCK_STREAM)
>>> s2.bind(('127.2.2.2', 60_000))
>>> !./dump_bhash.py
TCP-PORT  FASTREUSE  #OWNERS
    1234          0        1
   60000          0        2
>>>

With such tooling, proving that Table 2 holds true is just a matter of writing a bunch of exploratory tests.

But what has happened in that last snippet? The bind bucket has clearly transitioned from one fastreuse state to another. This is what Table 1 fails to capture. And it means that we still don’t have the full picture.

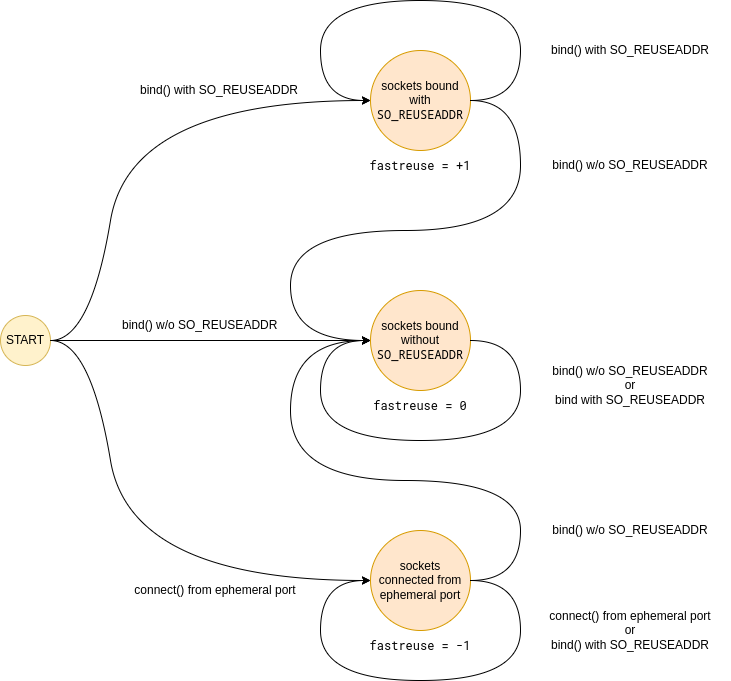
We have yet to find out when the bucket’s fastreuse state can change. This calls for a state machine.

Das State Machine

As we have just seen, a bind bucket does not need to stay in the initial fastreuse state throughout its lifetime. Adding sockets to the bucket can trigger a state change. As it turns out, it can only transition into fastreuse = 0, if we happen to bind() a socket that:

  1. doesn’t conflict existing owners, and
  2. doesn’t have the SO_REUSEADDR option enabled.
The quantum state of a TCP port

And while we could have figured it all out by carefully reading the code in inet_csk_get_port → inet_csk_update_fastreuse, it certainly doesn’t hurt to confirm our understanding with a few more tests.

Now that we have the full picture, this begs the question…

Why are you telling me all this?

Firstly, so that the next time bind() syscall rejects your request with EADDRINUSE, or connect() refuses to cooperate by throwing the EADDRNOTAVAIL error, you will know what is happening, or at least have the tools to find out.

Secondly, because we have previously advertised a technique for opening connections from a specific range of ports which involves bind()’ing sockets with the SO_REUSEADDR option. What we did not realize back then, is that there exists a corner case when the same port can’t be shared with the regular, connect()‘ed sockets. While that is not a deal-breaker, it is good to understand the consequences.

To make things better, we have worked with the Linux community to extend the kernel API with a new socket option that lets the user specify the local port range. The new option will be available in the upcoming Linux 6.3. With it we no longer have to resort to bind()-tricks. This makes it possible to yet again share a local port with regular connect()‘ed sockets.

Closing thoughts

Today we posed a relatively straightforward question – when can two TCP sockets share a local address? – and worked our way towards an answer. An answer that is too complex to compress it into a single sentence. What is more, it’s not even the full answer. After all, we have decided to ignore the existence of the SO_REUSEPORT feature, and did not consider conflicts with TCP listening sockets.

If there is a simple takeaway, though, it is that bind()’ing a socket can have tricky consequences. When using bind() to select an egress IP address, it is best to combine it with IP_BIND_ADDRESS_NO_PORT socket option, and leave the port assignment to the kernel. Otherwise we might unintentionally block local TCP ports from being reused.

It is too bad that the same advice does not apply to UDP, where IP_BIND_ADDRESS_NO_PORT does not really work today. But that is another story.

Until next time 🖖.

If you enjoy scratching your head while reading the Linux kernel source code, we are hiring.

Assembly within! BPF tail calls on x86 and ARM

Post Syndicated from Jakub Sitnicki original https://blog.cloudflare.com/assembly-within-bpf-tail-calls-on-x86-and-arm/

Assembly within! BPF tail calls on x86 and ARM

Assembly within! BPF tail calls on x86 and ARM

Early on when we learn to program, we get introduced to the concept of recursion. And that it is handy for computing, among other things, sequences defined in terms of recurrences. Such as the famous Fibonnaci numbersFn = Fn-1 + Fn-2.

Assembly within! BPF tail calls on x86 and ARM

Later on, perhaps when diving into multithreaded programming, we come to terms with the fact that the stack space for call frames is finite. And that there is an “okay” way and a “cool” way to calculate the Fibonacci numbers using recursion:

// fib_okay.c

#include <stdint.h>

uint64_t fib(uint64_t n)
{
        if (n == 0 || n == 1)
                return 1;

        return fib(n - 1) + fib(n - 2);
}

Listing 1. An okay Fibonacci number generator implementation

// fib_cool.c

#include <stdint.h>

static uint64_t fib_tail(uint64_t n, uint64_t a, uint64_t b)
{
    if (n == 0)
        return a;
    if (n == 1)
        return b;

    return fib_tail(n - 1, b, a + b);
}

uint64_t fib(uint64_t n)
{
    return fib_tail(n, 1, 1);
}

Listing 2. A better version of the same

If we take a look at the machine code the compiler produces, the “cool” variant translates to a nice and tight sequence of instructions:

⚠ DISCLAIMER: This blog post is assembly-heavy. We will be looking at assembly code for x86-64, arm64 and BPF architectures. If you need an introduction or a refresher, I can recommend “Low-Level Programming” by Igor Zhirkov for x86-64, and “Programming with 64-Bit ARM Assembly Language” by Stephen Smith for arm64. For BPF, see the Linux kernel documentation.

Assembly within! BPF tail calls on x86 and ARM

Listing 3. fib_cool.c compiled for x86-64 and arm64

The “okay” variant, disappointingly, leads to more instructions than a listing can fit. It is a spaghetti of basic blocks.

Assembly within! BPF tail calls on x86 and ARM

But more importantly, it is not free of x86 call instructions.

$ objdump -d fib_okay.o | grep call
 10c:   e8 00 00 00 00          call   111 <fib+0x111>
$ objdump -d fib_cool.o | grep call
$

This has an important consequence – as fib recursively calls itself, the stacks keep growing. We can observe it with a bit of help from the debugger.

$ gdb --quiet --batch --command=trace_rsp.gdb --args ./fib_okay 6
Breakpoint 1 at 0x401188: file fib_okay.c, line 3.
[Thread debugging using libthread_db enabled]
Using host libthread_db library "/lib64/libthread_db.so.1".
n = 6, %rsp = 0xffffd920
n = 5, %rsp = 0xffffd900
n = 4, %rsp = 0xffffd8e0
n = 3, %rsp = 0xffffd8c0
n = 2, %rsp = 0xffffd8a0
n = 1, %rsp = 0xffffd880
n = 1, %rsp = 0xffffd8c0
n = 2, %rsp = 0xffffd8e0
n = 1, %rsp = 0xffffd8c0
n = 3, %rsp = 0xffffd900
n = 2, %rsp = 0xffffd8e0
n = 1, %rsp = 0xffffd8c0
n = 1, %rsp = 0xffffd900
13
[Inferior 1 (process 50904) exited normally]
$

While the “cool” variant makes no use of the stack.

$ gdb --quiet --batch --command=trace_rsp.gdb --args ./fib_cool 6
Breakpoint 1 at 0x40118a: file fib_cool.c, line 13.
[Thread debugging using libthread_db enabled]
Using host libthread_db library "/lib64/libthread_db.so.1".
n = 6, %rsp = 0xffffd938
13
[Inferior 1 (process 50949) exited normally]
$

Where did the calls go?

The smart compiler turned the last function call in the body into a regular jump. Why was it allowed to do that?

It is the last instruction in the function body we are talking about. The caller stack frame is going to be destroyed right after we return anyway. So why keep it around when we can reuse it for the callee’s stack frame?

This optimization, known as tail call elimination, leaves us with no function calls in the “cool” variant of our fib implementation. There was only one call to eliminate – right at the end.

Once applied, the call becomes a jump (loop). If assembly is not your second language, decompiling the fib_cool.o object file with Ghidra helps see the transformation:

long fib(ulong param_1)

{
  long lVar1;
  long lVar2;
  long lVar3;
  
  if (param_1 < 2) {
    lVar3 = 1;
  }
  else {
    lVar3 = 1;
    lVar2 = 1;
    do {
      lVar1 = lVar3;
      param_1 = param_1 - 1;
      lVar3 = lVar2 + lVar1;
      lVar2 = lVar1;
    } while (param_1 != 1);
  }
  return lVar3;
}

Listing 4. fib_cool.o decompiled by Ghidra

This is very much desired. Not only is the generated machine code much shorter. It is also way faster due to lack of calls, which pop up on the profile for fib_okay.

But I am no performance ninja and this blog post is not about compiler optimizations. So why am I telling you about it?

Assembly within! BPF tail calls on x86 and ARM
Alex Dunkel (Maky), CC BY-SA 3.0, via Wikimedia Commons

Tail calls in BPF

The concept of tail call elimination made its way into the BPF world. Although not in the way you might expect. Yes, the LLVM compiler does get rid of the trailing function calls when building for -target bpf. The transformation happens at the intermediate representation level, so it is backend agnostic. This can save you some BPF-to-BPF function calls, which you can spot by looking for call -N instructions in the BPF assembly.

However, when we talk about tail calls in the BPF context, we usually have something else in mind. And that is a mechanism, built into the BPF JIT compiler, for chaining BPF programs.

We first adopted BPF tail calls when building our XDP-based packet processing pipeline. Thanks to it, we were able to divide the processing logic into several XDP programs. Each responsible for doing one thing.

Assembly within! BPF tail calls on x86 and ARM
Slide from “XDP based DDoS Mitigation” talk by Arthur Fabre

BPF tail calls have served us well since then. But they do have their caveats. Until recently it was impossible to have both BPF tails calls and BPF-to-BPF function calls in the same XDP program on arm64, which is one of the supported architectures for us.

Why? Before we get to that, we have to clarify what a BPF tail call actually does.

A tail call is a tail call is a tail call

BPF exposes the tail call mechanism through the bpf_tail_call helper, which we can invoke from our BPF code. We don’t directly point out which BPF program we would like to call. Instead, we pass it a BPF map (a container) capable of holding references to BPF programs (BPF_MAP_TYPE_PROG_ARRAY), and an index into the map.

long bpf_tail_call(void *ctx, struct bpf_map *prog_array_map, u32 index)

       Description
              This  special  helper is used to trigger a "tail call", or
              in other words, to jump into  another  eBPF  program.  The
              same  stack frame is used (but values on stack and in reg‐
              isters for the caller are not accessible to  the  callee).
              This  mechanism  allows  for  program chaining, either for
              raising the maximum number of available eBPF instructions,
              or  to  execute  given programs in conditional blocks. For
              security reasons, there is an upper limit to the number of
              successive tail calls that can be performed.

bpf-helpers(7) man page

At first glance, this looks somewhat similar to the execve(2) syscall. It is easy to mistake it for a way to execute a new program from the current program context. To quote the excellent BPF and XDP Reference Guide from the Cilium project documentation:

Tail calls can be seen as a mechanism that allows one BPF program to call another, without returning to the old program. Such a call has minimal overhead as unlike function calls, it is implemented as a long jump, reusing the same stack frame.

But once we add BPF function calls into the mix, it becomes clear that the BPF tail call mechanism is indeed an implementation of tail call elimination, rather than a way to replace one program with another:

Tail calls, before the actual jump to the target program, will unwind only its current stack frame. As we can see in the example above, if a tail call occurs from within the sub-function, the function’s (func1) stack frame will be present on the stack when a program execution is at func2. Once the final function (func3) function terminates, all the previous stack frames will be unwinded and control will get back to the caller of BPF program caller.

Alas, one with sometimes slightly surprising semantics. Consider the code like below, where a BPF function calls the bpf_tail_call() helper:

struct {
    __uint(type, BPF_MAP_TYPE_PROG_ARRAY);
    __uint(max_entries, 1);
    __uint(key_size, sizeof(__u32));
    __uint(value_size, sizeof(__u32));
} bar SEC(".maps");

SEC("tc")
int serve_drink(struct __sk_buff *skb __unused)
{
    return 0xcafe;
}

static __noinline
int bring_order(struct __sk_buff *skb)
{
    bpf_tail_call(skb, &bar, 0);
    return 0xf00d;
}

SEC("tc")
int server1(struct __sk_buff *skb)
{
    return bring_order(skb);    
}

SEC("tc")
int server2(struct __sk_buff *skb)
{
    __attribute__((musttail)) return bring_order(skb);  
}

We have two seemingly not so different BPF programs – server1() and server2(). They both call the same BPF function bring_order(). The function tail calls into the serve_drink() program, if the bar[0] map entry points to it (let’s assume that).

Do both server1 and server2 return the same value? Turns out that – no, they don’t. We get a hex 🍔 from server1, and a ☕ from server2. How so?

First thing to notice is that a BPF tail call unwinds just the current function stack frame. Code past the bpf_tail_call() invocation in the function body never executes, providing the tail call is successful (the map entry was set, and the tail call limit has not been reached).

When the tail call finishes, control returns to the caller of the function which made the tail call. Applying this to our example, the control flow is serverX() --> bring_order() --> bpf_tail_call() --> serve_drink() -return-> serverX() for both programs.

The second thing to keep in mind is that the compiler does not know that the bpf_tail_call() helper changes the control flow. Hence, the unsuspecting compiler optimizes the code as if the execution would continue past the BPF tail call.

Assembly within! BPF tail calls on x86 and ARM
The call graph for server1() and server2() is the same, but the return value differs due to build time optimizations.

In our case, the compiler thinks it is okay to propagate the constant which bring_order() returns to server1(). Possibly catching us by surprise, if we didn’t check the generated BPF assembly.

We can prevent it by forcing the compiler to make a tail call to bring_order(). This way we ensure that whatever bring_order() returns will be used as the server2() program result.

🛈 General rule – for least surprising results, use musttail attribute when calling a function that contain a BPF tail call.

How does the bpf_tail_call() work underneath then? And why the BPF verifier wouldn’t let us mix the function calls with tail calls on arm64? Time to dig deeper.

Assembly within! BPF tail calls on x86 and ARM
Public Domain image

BPF tail call on x86-64

What does a bpf_tail_call() helper call translate to after BPF JIT for x86-64 has compiled it? How does the implementation guarantee that we don’t end up in a tail call loop forever?

To find out we will need to piece together a few things.

First, there is the BPF JIT compiler source code, which lives in arch/x86/net/bpf_jit_comp.c. Its code is annotated with helpful comments. We will focus our attention on the following call chain within the JIT:

do_jit() 🔗
  emit_prologue() 🔗
  push_callee_regs() 🔗
  for (i = 1; i <= insn_cnt; i++, insn++) {
    switch (insn->code) {
    case BPF_JMP | BPF_CALL:
      /* emit function call */ 🔗
    case BPF_JMP | BPF_TAIL_CALL:
      emit_bpf_tail_call_direct() 🔗
    case BPF_JMP | BPF_EXIT:
      /* emit epilogue */ 🔗
    }
  }

It is sometimes hard to visualize the generated instruction stream just from reading the compiler code. Hence, we will also want to inspect the input – BPF instructions – and the output – x86-64 instructions – of the JIT compiler.

To inspect BPF and x86-64 instructions of a loaded BPF program, we can use bpftool prog dump. However, first we must populate the BPF map used as the tail call jump table. Otherwise, we might not be able to see the tail call jump!

This is due to optimizations that use instruction patching when the index into the program array is known at load time.

# bpftool prog loadall ./tail_call_ex1.o /sys/fs/bpf pinmaps /sys/fs/bpf
# bpftool map update pinned /sys/fs/bpf/jmp_table key 0 0 0 0 value pinned /sys/fs/bpf/target_prog
# bpftool prog dump xlated pinned /sys/fs/bpf/entry_prog
int entry_prog(struct __sk_buff * skb):
; bpf_tail_call(skb, &jmp_table, 0);
   0: (18) r2 = map[id:24]
   2: (b7) r3 = 0
   3: (85) call bpf_tail_call#12
; return 0xf00d;
   4: (b7) r0 = 61453
   5: (95) exit
# bpftool prog dump jited pinned /sys/fs/bpf/entry_prog
int entry_prog(struct __sk_buff * skb):
bpf_prog_4f697d723aa87765_entry_prog:
; bpf_tail_call(skb, &jmp_table, 0);
   0:   nopl   0x0(%rax,%rax,1)
   5:   xor    %eax,%eax
   7:   push   %rbp
   8:   mov    %rsp,%rbp
   b:   push   %rax
   c:   movabs $0xffff888102764800,%rsi
  16:   xor    %edx,%edx
  18:   mov    -0x4(%rbp),%eax
  1e:   cmp    $0x21,%eax
  21:   jae    0x0000000000000037
  23:   add    $0x1,%eax
  26:   mov    %eax,-0x4(%rbp)
  2c:   nopl   0x0(%rax,%rax,1)
  31:   pop    %rax
  32:   jmp    0xffffffffffffffe3   // bug? 🤔
; return 0xf00d;
  37:   mov    $0xf00d,%eax
  3c:   leave
  3d:   ret

There is a caveat. The target addresses for tail call jumps in bpftool prog dump jited output will not make any sense. To discover the real jump targets, we have to peek into the kernel memory. That can be done with gdb after we find the address of our JIT’ed BPF programs in /proc/kallsyms:

# tail -2 /proc/kallsyms
ffffffffa0000720 t bpf_prog_f85b2547b00cbbe9_target_prog        [bpf]
ffffffffa0000748 t bpf_prog_4f697d723aa87765_entry_prog [bpf]
# gdb -q -c /proc/kcore -ex 'x/18i 0xffffffffa0000748' -ex 'quit'
[New process 1]
Core was generated by `earlyprintk=serial,ttyS0,115200 console=ttyS0 psmouse.proto=exps "virtme_stty_c'.
#0  0x0000000000000000 in ?? ()
   0xffffffffa0000748:  nopl   0x0(%rax,%rax,1)
   0xffffffffa000074d:  xor    %eax,%eax
   0xffffffffa000074f:  push   %rbp
   0xffffffffa0000750:  mov    %rsp,%rbp
   0xffffffffa0000753:  push   %rax
   0xffffffffa0000754:  movabs $0xffff888102764800,%rsi
   0xffffffffa000075e:  xor    %edx,%edx
   0xffffffffa0000760:  mov    -0x4(%rbp),%eax
   0xffffffffa0000766:  cmp    $0x21,%eax
   0xffffffffa0000769:  jae    0xffffffffa000077f
   0xffffffffa000076b:  add    $0x1,%eax
   0xffffffffa000076e:  mov    %eax,-0x4(%rbp)
   0xffffffffa0000774:  nopl   0x0(%rax,%rax,1)
   0xffffffffa0000779:  pop    %rax
   0xffffffffa000077a:  jmp    0xffffffffa000072b
   0xffffffffa000077f:  mov    $0xf00d,%eax
   0xffffffffa0000784:  leave
   0xffffffffa0000785:  ret
# gdb -q -c /proc/kcore -ex 'x/7i 0xffffffffa0000720' -ex 'quit'
[New process 1]
Core was generated by `earlyprintk=serial,ttyS0,115200 console=ttyS0 psmouse.proto=exps "virtme_stty_c'.
#0  0x0000000000000000 in ?? ()
   0xffffffffa0000720:  nopl   0x0(%rax,%rax,1)
   0xffffffffa0000725:  xchg   %ax,%ax
   0xffffffffa0000727:  push   %rbp
   0xffffffffa0000728:  mov    %rsp,%rbp
   0xffffffffa000072b:  mov    $0xcafe,%eax
   0xffffffffa0000730:  leave
   0xffffffffa0000731:  ret
#

Lastly, it will be handy to have a cheat sheet of mapping between BPF registers (r0, r1, …) to hardware registers (rax, rdi, …) that the JIT compiler uses.

BPF x86-64
r0 rax
r1 rdi
r2 rsi
r3 rdx
r4 rcx
r5 r8
r6 rbx
r7 r13
r8 r14
r9 r15
r10 rbp
internal r9-r12

Now we are prepared to work out what happens when we use a BPF tail call.

Assembly within! BPF tail calls on x86 and ARM

In essence, bpf_tail_call() emits a jump into another function, reusing the current stack frame. It is just like a regular optimized tail call, but with a twist.

Because of the BPF security guarantees – execution terminates, no stack overflows – there is a limit on the number of tail calls we can have (MAX_TAIL_CALL_CNT = 33).

Counting the tail calls across BPF programs is not something we can do at load-time. The jump table (BPF program array) contents can change after the program has been verified. Our only option is to keep track of tail calls at run-time. That is why the JIT’ed code for the bpf_tail_call() helper checks and updates the tail_call_cnt counter.

The updated count is then passed from one BPF program to another, and from one BPF function to another, as we will see, through the rax register (r0 in BPF).

Luckily for us, the x86-64 calling convention dictates that the rax register does not partake in passing function arguments, but rather holds the function return value. The JIT can repurpose it to pass an additional – hidden – argument.

The function body is, however, free to make use of the r0/rax register in any way it pleases. This explains why we want to save the tail_call_cnt passed via rax onto stack right after we jump to another program. bpf_tail_call() can later load the value from a known location on the stack.

This way, the code emitted for each bpf_tail_call() invocation, and the BPF function prologue work in tandem, keeping track of tail call count across BPF program boundaries.

But what if our BPF program is split up into several BPF functions, each with its own stack frame? What if these functions perform BPF tail calls? How is the tail call count tracked then?

Mixing BPF function calls with BPF tail calls

BPF has its own terminology when it comes to functions and calling them, which is influenced by the internal implementation. Function calls are referred to as BPF to BPF calls. Also, the main/entry function in your BPF code is called “the program”, while all other functions are known as “subprograms”.

Each call to subprogram allocates a stack frame for local state, which persists until the function returns. Naturally, BPF subprogram calls can be nested creating a call chain. Just like nested function calls in user-space.

BPF subprograms are also allowed to make BPF tail calls. This, effectively, is a mechanism for extending the call chain to another BPF program and its subprograms.

If we cannot track how long the call chain can be, and how much stack space each function uses, we put ourselves at risk of overflowing the stack. We cannot let this happen, so BPF enforces limitations on when and how many BPF tail calls can be done:

static int check_max_stack_depth(struct bpf_verifier_env *env)
{
        …
        /* protect against potential stack overflow that might happen when
         * bpf2bpf calls get combined with tailcalls. Limit the caller's stack
         * depth for such case down to 256 so that the worst case scenario
         * would result in 8k stack size (32 which is tailcall limit * 256 =
         * 8k).
         *
         * To get the idea what might happen, see an example:
         * func1 -> sub rsp, 128
         *  subfunc1 -> sub rsp, 256
         *  tailcall1 -> add rsp, 256
         *   func2 -> sub rsp, 192 (total stack size = 128 + 192 = 320)
         *   subfunc2 -> sub rsp, 64
         *   subfunc22 -> sub rsp, 128
         *   tailcall2 -> add rsp, 128
         *    func3 -> sub rsp, 32 (total stack size 128 + 192 + 64 + 32 = 416)
         *
         * tailcall will unwind the current stack frame but it will not get rid
         * of caller's stack as shown on the example above.
         */
        if (idx && subprog[idx].has_tail_call && depth >= 256) {
                verbose(env,
                        "tail_calls are not allowed when call stack of previous frames is %d bytes. Too large\n",
                        depth);
                return -EACCES;
        }
        …
}

While the stack depth can be calculated by the BPF verifier at load-time, we still need to keep count of tail call jumps at run-time. Even when subprograms are involved.

This means that we have to pass the tail call count from one BPF subprogram to another, just like we did when making a BPF tail call, so we yet again turn to value passing through the rax register.

Assembly within! BPF tail calls on x86 and ARM
Control flow in a BPF program with a function call followed by a tail call.

🛈 To keep things simple, BPF code in our examples does not allocate anything on stack. I encourage you to check how the JIT’ed code changes when you add some local variables. Just make sure the compiler does not optimize them out.

To make it work, we need to:

① load the tail call count saved on stack into rax before call’ing the subprogram,
② adjust the subprogram prologue, so that it does not reset the rax like the main program does,
③ save the passed tail call count on subprogram’s stack for the bpf_tail_call() helper to consume it.

A bpf_tail_call() within our suprogram will then:

④ load the tail call count from stack,
⑤ unwind the BPF stack, but keep the current subprogram’s stack frame in tact, and
⑥ jump to the target BPF program.

Now we have seen how all the pieces of the puzzle fit together to make BPF tail work on x86-64 safely. The only open question is does it work the same way on other platforms like arm64? Time to shift gears and dive into a completely different BPF JIT implementation.

Assembly within! BPF tail calls on x86 and ARM
Based on an image by Wutthichai Charoenburi, CC BY 2.0

Tail calls on arm64

If you try loading a BPF program that uses both BPF function calls (aka BPF to BPF calls) and BPF tail calls on an arm64 machine running the latest 5.15 LTS kernel, or even the latest 5.19 stable kernel, the BPF verifier will kindly ask you to reconsider your choice:

# uname -rm
5.19.12 aarch64
# bpftool prog loadall tail_call_ex2.o /sys/fs/bpf
libbpf: prog 'entry_prog': BPF program load failed: Invalid argument
libbpf: prog 'entry_prog': -- BEGIN PROG LOAD LOG --
0: R1=ctx(off=0,imm=0) R10=fp0
; __attribute__((musttail)) return sub_func(skb);
0: (85) call pc+1
caller:
 R10=fp0
callee:
 frame1: R1=ctx(off=0,imm=0) R10=fp0
; bpf_tail_call(skb, &jmp_table, 0);
2: (18) r2 = 0xffffff80c38c7200       ; frame1: R2_w=map_ptr(off=0,ks=4,vs=4,imm=0)
4: (b7) r3 = 0                        ; frame1: R3_w=P0
5: (85) call bpf_tail_call#12
tail_calls are not allowed in non-JITed programs with bpf-to-bpf calls
processed 4 insns (limit 1000000) max_states_per_insn 0 total_states 0 peak_states 0 mark_read 0
-- END PROG LOAD LOG --
…
#

That is a pity! We have been looking forward to reaping the benefits of code sharing with BPF to BPF calls in our lengthy machine generated BPF programs. So we asked – how hard could it be to make it work?

After all, BPF JIT for arm64 already can handle BPF tail calls and BPF to BPF calls, when used in isolation.

It is “just” a matter of understanding the existing JIT implementation, which lives in arch/arm64/net/bpf_jit_comp.c, and identifying the missing pieces.

To understand how BPF JIT for arm64 works, we will use the same method as before – look at its code together with sample input (BPF instructions) and output (arm64 instructions).

We don’t have to read the whole source code. It is enough to zero in on a few particular code paths:

bpf_int_jit_compile() 🔗
  build_prologue() 🔗
  build_body() 🔗
    for (i = 0; i < prog->len; i++) {
       build_insn() 🔗
         switch (code) {
         case BPF_JMP | BPF_CALL:
           /* emit function call */ 🔗
         case BPF_JMP | BPF_TAIL_CALL:
           emit_bpf_tail_call() 🔗
         }
    }
  build_epilogue() 🔗

One thing that the arm64 architecture, and RISC architectures in general, are known for is that it has a plethora of general purpose registers (x0-x30). This is a good thing. We have more registers to allocate to JIT internal state, like the tail call count. A cheat sheet of what roles the hardware registers play in the BPF JIT will be helpful:

BPF arm64
r0 x7
r1 x0
r2 x1
r3 x2
r4 x3
r5 x4
r6 x19
r7 x20
r8 x21
r9 x22
r10 x25
internal x9-x12, x26 (tail_call_cnt), x27

Now let’s try to understand the state of things by looking at the JIT’s input and output for two particular scenarios: (1) a BPF tail call, and (2) a BPF to BPF call.

It is hard to read assembly code selectively. We will have to go through all instructions one by one, and understand what each one is doing.

⚠ Brace yourself. Time to decipher a bit of ARM64 assembly. If this will be your first time reading ARM64 assembly, you might want to at least skim through this Guide to ARM64 / AArch64 Assembly on Linux before diving in.

Scenario #1: A single BPF tail call – tail_call_ex1.bpf.c

Input: BPF assembly (bpftool prog dump xlated)

   0: (18) r2 = map[id:4]           // jmp_table map
   2: (b7) r3 = 0
   3: (85) call bpf_tail_call#12
   4: (b7) r0 = 61453               // 0xf00d
   5: (95) exit

Output: ARM64 assembly (bpftool prog dump jited)

 0:   paciasp                            // Sign LR (ROP protection) ①
 4:   stp     x29, x30, [sp, #-16]!      // Save FP and LR registers ②
 8:   mov     x29, sp                    // Set up Frame Pointer
 c:   stp     x19, x20, [sp, #-16]!      // Save callee-saved registers ③
10:   stp     x21, x22, [sp, #-16]!      // ⋮ 
14:   stp     x25, x26, [sp, #-16]!      // ⋮ 
18:   stp     x27, x28, [sp, #-16]!      // ⋮ 
1c:   mov     x25, sp                    // Set up BPF stack base register (r10)
20:   mov     x26, #0x0                  // Initialize tail_call_cnt ④
24:   sub     x27, x25, #0x0             // Calculate FP bottom ⑤
28:   sub     sp, sp, #0x200             // Set up BPF program stack ⑥
2c:   mov     x1, #0xffffff80ffffffff    // r2 = map[id:4] ⑦
30:   movk    x1, #0xc38c, lsl #16       // ⋮ 
34:   movk    x1, #0x7200                // ⋮
38:   mov     x2, #0x0                   // r3 = 0
3c:   mov     w10, #0x24                 // = offsetof(struct bpf_array, map.max_entries) ⑧
40:   ldr     w10, [x1, x10]             // Load array->map.max_entries
44:   add     w2, w2, #0x0               // = index (0)
48:   cmp     w2, w10                    // if (index >= array->map.max_entries)
4c:   b.cs    0x0000000000000088         //     goto out;
50:   mov     w10, #0x21                 // = MAX_TAIL_CALL_CNT (33)
54:   cmp     x26, x10                   // if (tail_call_cnt >= MAX_TAIL_CALL_CNT)
58:   b.cs    0x0000000000000088         //     goto out;
5c:   add     x26, x26, #0x1             // tail_call_cnt++;
60:   mov     w10, #0x110                // = offsetof(struct bpf_array, ptrs)
64:   add     x10, x1, x10               // = &array->ptrs
68:   lsl     x11, x2, #3                // = index * sizeof(array->ptrs[0])
6c:   ldr     x11, [x10, x11]            // prog = array->ptrs[index];
70:   cbz     x11, 0x0000000000000088    // if (prog == NULL) goto out;
74:   mov     w10, #0x30                 // = offsetof(struct bpf_prog, bpf_func)
78:   ldr     x10, [x11, x10]            // Load prog->bpf_func
7c:   add     x10, x10, #0x24            // += PROLOGUE_OFFSET * AARCH64_INSN_SIZE (4)
80:   add     sp, sp, #0x200             // Unwind BPF stack
84:   br      x10                        // goto *(prog->bpf_func + prologue_offset)
88:   mov     x7, #0xf00d                // r0 = 0xf00d
8c:   add     sp, sp, #0x200             // Unwind BPF stack ⑨
90:   ldp     x27, x28, [sp], #16        // Restore used callee-saved registers
94:   ldp     x25, x26, [sp], #16        // ⋮
98:   ldp     x21, x22, [sp], #16        // ⋮
9c:   ldp     x19, x20, [sp], #16        // ⋮
a0:   ldp     x29, x30, [sp], #16        // ⋮
a4:   add     x0, x7, #0x0               // Set return value
a8:   autiasp                            // Authenticate LR
ac:   ret                                // Return to caller

① BPF program prologue starts with Pointer Authentication Code (PAC), which protects against Return Oriented Programming attacks. PAC instructions are emitted by JIT only if CONFIG_ARM64_PTR_AUTH_KERNEL is enabled.

Arm 64 Architecture Procedure Call Standard mandates that the Frame Pointer (register X29) and the Link Register (register X30), aka the return address, of the caller should be recorded onto the stack.

③ Registers X19 to X28, and X29 (FP) plus X30 (LR), are callee saved. ARM64 BPF JIT does not use registers X23 and X24 currently, so they are not saved.

④ We track the tail call depth in X26. No need to save it onto stack since we use a register dedicated just for this purpose.

⑤ FP bottom is an optimization that allows store/loads to BPF stack with a single instruction and an immediate offset value.

⑥ Reserve space for the BPF program stack. The stack layout is now as shown in a diagram in build_prologue() source code.

⑦ The BPF function body starts here.

bpf_tail_call() instructions start here.

⑨ The epilogue starts here.

Whew! That was a handful 😅.

Notice that the BPF tail call implementation on arm64 is not as optimized as on x86-64. There is no code patching to make direct jumps when the target program index is known at the JIT-compilation time. Instead, the target address is always loaded from the BPF program array.

Ready for the second scenario? I promise it will be shorter. Function prologue and epilogue instructions will look familiar, so we are going to keep annotations down to a minimum.

Scenario #2: A BPF to BPF call – sub_call_ex1.bpf.c

Input: BPF assembly (bpftool prog dump xlated)

int entry_prog(struct __sk_buff * skb):
   0: (85) call pc+1#bpf_prog_a84919ecd878b8f3_sub_func
   1: (95) exit
int sub_func(struct __sk_buff * skb):
   2: (b7) r0 = 61453                   // 0xf00d
   3: (95) exit

Output: ARM64 assembly

int entry_prog(struct __sk_buff * skb):
bpf_prog_163e74e7188910f2_entry_prog:
   0:   paciasp                                 // Begin prologue
   4:   stp     x29, x30, [sp, #-16]!           // ⋮
   8:   mov     x29, sp                         // ⋮
   c:   stp     x19, x20, [sp, #-16]!           // ⋮
  10:   stp     x21, x22, [sp, #-16]!           // ⋮
  14:   stp     x25, x26, [sp, #-16]!           // ⋮
  18:   stp     x27, x28, [sp, #-16]!           // ⋮
  1c:   mov     x25, sp                         // ⋮
  20:   mov     x26, #0x0                       // ⋮
  24:   sub     x27, x25, #0x0                  // ⋮
  28:   sub     sp, sp, #0x0                    // End prologue
  2c:   mov     x10, #0xffffffffffff5420        // Build sub_func()+0x0 address
  30:   movk    x10, #0x8ff, lsl #16            // ⋮
  34:   movk    x10, #0xffc0, lsl #32           // ⋮
  38:   blr     x10 ------------------.         // Call sub_func()+0x0 
  3c:   add     x7, x0, #0x0 <----------.       // r0 = sub_func()
  40:   mov     sp, sp                | |       // Begin epilogue
  44:   ldp     x27, x28, [sp], #16   | |       // ⋮
  48:   ldp     x25, x26, [sp], #16   | |       // ⋮
  4c:   ldp     x21, x22, [sp], #16   | |       // ⋮
  50:   ldp     x19, x20, [sp], #16   | |       // ⋮
  54:   ldp     x29, x30, [sp], #16   | |       // ⋮
  58:   add     x0, x7, #0x0          | |       // ⋮
  5c:   autiasp                       | |       // ⋮
  60:   ret                           | |       // End epilogue
                                      | |
int sub_func(struct __sk_buff * skb): | |
bpf_prog_a84919ecd878b8f3_sub_func:   | |
   0:   paciasp <---------------------' |       // Begin prologue
   4:   stp     x29, x30, [sp, #-16]!   |       // ⋮
   8:   mov     x29, sp                 |       // ⋮
   c:   stp     x19, x20, [sp, #-16]!   |       // ⋮
  10:   stp     x21, x22, [sp, #-16]!   |       // ⋮
  14:   stp     x25, x26, [sp, #-16]!   |       // ⋮
  18:   stp     x27, x28, [sp, #-16]!   |       // ⋮
  1c:   mov     x25, sp                 |       // ⋮
  20:   mov     x26, #0x0               |       // ⋮
  24:   sub     x27, x25, #0x0          |       // ⋮
  28:   sub     sp, sp, #0x0            |       // End prologue
  2c:   mov     x7, #0xf00d             |       // r0 = 0xf00d
  30:   mov     sp, sp                  |       // Begin epilogue
  34:   ldp     x27, x28, [sp], #16     |       // ⋮
  38:   ldp     x25, x26, [sp], #16     |       // ⋮
  3c:   ldp     x21, x22, [sp], #16     |       // ⋮
  40:   ldp     x19, x20, [sp], #16     |       // ⋮
  44:   ldp     x29, x30, [sp], #16     |       // ⋮
  48:   add     x0, x7, #0x0            |       // ⋮
  4c:   autiasp                         |       // ⋮
  50:   ret ----------------------------'       // End epilogue

We have now seen what a BPF tail call and a BPF function/subprogram call compiles down to. Can you already spot what would go wrong if mixing the two was allowed?

That’s right! Every time we enter a BPF subprogram, we reset the X26 register, which holds the tail call count, to zero (mov x26, #0x0). This is bad. It would let users create program chains longer than the MAX_TAIL_CALL_CNT limit.

How about we just skip this step when emitting the prologue for BPF subprograms?

@@ -246,6 +246,7 @@ static bool is_lsi_offset(int offset, int scale)
 static int build_prologue(struct jit_ctx *ctx, bool ebpf_from_cbpf)
 {
        const struct bpf_prog *prog = ctx->prog;
+       const bool is_main_prog = prog->aux->func_idx == 0;
        const u8 r6 = bpf2a64[BPF_REG_6];
        const u8 r7 = bpf2a64[BPF_REG_7];
        const u8 r8 = bpf2a64[BPF_REG_8];
@@ -299,7 +300,7 @@ static int build_prologue(struct jit_ctx *ctx, bool ebpf_from_cbpf)
        /* Set up BPF prog stack base register */
        emit(A64_MOV(1, fp, A64_SP), ctx);

-       if (!ebpf_from_cbpf) {
+       if (!ebpf_from_cbpf && is_main_prog) {
                /* Initialize tail_call_cnt */
                emit(A64_MOVZ(1, tcc, 0, 0), ctx);

Believe it or not. This is everything that was missing to get BPF tail calls working with function calls on arm64. The feature will be enabled in the upcoming Linux 6.0 release.

Outro

From recursion to tweaking the BPF JIT. How did we get here? Not important. It’s all about the journey.

Along the way we have unveiled a few secrets behind BPF tails calls, and hopefully quenched your thirst for low-level programming. At least for today.

All that is left is to sit back and watch the fruits of our work. With GDB hooked up to a VM, we can observe how a BPF program calls into a BPF function, and from there tail calls to another BPF program:

https://demo-gdb-step-thru-bpf.pages.dev/

Until next time 🖖.

Missing Manuals – io_uring worker pool

Post Syndicated from Jakub Sitnicki original https://blog.cloudflare.com/missing-manuals-io_uring-worker-pool/

Missing Manuals - io_uring worker pool

Chances are you might have heard of io_uring. It first appeared in Linux 5.1, back in 2019, and was advertised as the new API for asynchronous I/O. Its goal was to be an alternative to the deemed-to-be-broken-beyond-repair AIO, the “old” asynchronous I/O API.

Calling io_uring just an asynchronous I/O API doesn’t do it justice, though. Underneath the API calls, io_uring is a full-blown runtime for processing I/O requests. One that spawns threads, sets up work queues, and dispatches requests for processing. All this happens “in the background” so that the user space process doesn’t have to, but can, block while waiting for its I/O requests to complete.

A runtime that spawns threads and manages the worker pool for the developer makes life easier, but using it in a project begs the questions:

1. How many threads will be created for my workload by default?

2. How can I monitor and control the thread pool size?

I could not find the answers to these questions in either the Efficient I/O with io_uring article, or the Lord of the io_uring guide – two well-known pieces of available documentation.

And while a recent enough io_uring man page touches on the topic:

By default, io_uring limits the unbounded workers created to the maximum processor count set by RLIMIT_NPROC and the bounded workers is a function of the SQ ring size and the number of CPUs in the system.

… it also leads to more questions:

3. What is an unbounded worker?

4. How does it differ from a bounded worker?

Things seem a bit under-documented as is, hence this blog post. Hopefully, it will provide the clarity needed to put io_uring to work in your project when the time comes.

Before we dig in, a word of warning. This post is not meant to be an introduction to io_uring. The existing documentation does a much better job at showing you the ropes than I ever could. Please give it a read first, if you are not familiar yet with the io_uring API.

Not all I/O requests are created equal

io_uring can perform I/O on any kind of file descriptor; be it a regular file or a special file, like a socket. However, the kind of file descriptor that it operates on makes a difference when it comes to the size of the worker pool.

You see, I/O requests get classified into two categories by io_uring:

io-wq divides work into two categories:
1. Work that completes in a bounded time, like reading from a regular file or a block device. This type of work is limited based on the size of the SQ ring.
2. Work that may never complete, we call this unbounded work. The amount of workers here is limited by RLIMIT_NPROC.

This answers the latter two of our open questions. Unbounded workers handle I/O requests that operate on neither regular files (S_IFREG) nor block devices (S_ISBLK). This is the case for network I/O, where we work with sockets (S_IFSOCK), and other special files like character devices (e.g. /dev/null).

We now also know that there are different limits in place for how many bounded vs unbounded workers there can be running. So we have to pick one before we dig further.

Capping the unbounded worker pool size

Pushing data through sockets is Cloudflare’s bread and butter, so this is what we are going to base our test workload around. To put it in io_uring lingo – we will be submitting unbounded work requests.

While doing that, we will observe how io_uring goes about creating workers.

To observe how io_uring goes about creating workers we will ask it to read from a UDP socket multiple times. No packets will arrive on the socket, so we will have full control over when the requests complete.

Here is our test workload – udp_read.rs.

$ ./target/debug/udp-read -h
udp-read 0.1.0
read from UDP socket with io_uring

USAGE:
    udp-read [FLAGS] [OPTIONS]

FLAGS:
    -a, --async      Set IOSQE_ASYNC flag on submitted SQEs
    -h, --help       Prints help information
    -V, --version    Prints version information

OPTIONS:
    -c, --cpu <cpu>...                     CPU to run on when invoking io_uring_enter for Nth ring (specify multiple
                                           times) [default: 0]
    -w, --workers <max-unbound-workers>    Maximum number of unbound workers per NUMA node (0 - default, that is
                                           RLIMIT_NPROC) [default: 0]
    -r, --rings <num-rings>                Number io_ring instances to create per thread [default: 1]
    -t, --threads <num-threads>            Number of threads creating io_uring instances [default: 1]
    -s, --sqes <sqes>                      Number of read requests to submit per io_uring (0 - fill the whole queue)
                                           [default: 0]

While it is parametrized for easy experimentation, at its core it doesn’t do much. We fill the submission queue with read requests from a UDP socket and then wait for them to complete. But because data doesn’t arrive on the socket out of nowhere, and there are no timeouts set up, nothing happens. As a bonus, we have complete control over when requests complete, which will come in handy later.

Let’s run the test workload to convince ourselves that things are working as expected. strace won’t be very helpful when using io_uring. We won’t be able to tie I/O requests to system calls. Instead, we will have to turn to in-kernel tracing.

Thankfully, io_uring comes with a set of ready to use static tracepoints, which save us the trouble of digging through the source code to decide where to hook up dynamic tracepoints, known as kprobes.

We can discover the tracepoints with perf list or bpftrace -l, or by browsing the events/ directory on the tracefs filesystem, usually mounted under /sys/kernel/tracing.

$ sudo perf list 'io_uring:*'

List of pre-defined events (to be used in -e):

  io_uring:io_uring_complete                         [Tracepoint event]
  io_uring:io_uring_cqring_wait                      [Tracepoint event]
  io_uring:io_uring_create                           [Tracepoint event]
  io_uring:io_uring_defer                            [Tracepoint event]
  io_uring:io_uring_fail_link                        [Tracepoint event]
  io_uring:io_uring_file_get                         [Tracepoint event]
  io_uring:io_uring_link                             [Tracepoint event]
  io_uring:io_uring_poll_arm                         [Tracepoint event]
  io_uring:io_uring_poll_wake                        [Tracepoint event]
  io_uring:io_uring_queue_async_work                 [Tracepoint event]
  io_uring:io_uring_register                         [Tracepoint event]
  io_uring:io_uring_submit_sqe                       [Tracepoint event]
  io_uring:io_uring_task_add                         [Tracepoint event]
  io_uring:io_uring_task_run                         [Tracepoint event]

Judging by the number of tracepoints to choose from, io_uring takes visibility seriously. To help us get our bearings, here is a diagram that maps out paths an I/O request can take inside io_uring code annotated with tracepoint names – not all of them, just those which will be useful to us.

Missing Manuals - io_uring worker pool

Starting on the left, we expect our toy workload to push entries onto the submission queue. When we publish submitted entries by calling io_uring_enter(), the kernel consumes the submission queue and constructs internal request objects. A side effect we can observe is a hit on the io_uring:io_uring_submit_sqe tracepoint.

$ sudo perf stat -e io_uring:io_uring_submit_sqe -- timeout 1 ./udp-read

 Performance counter stats for 'timeout 1 ./udp-read':

              4096      io_uring:io_uring_submit_sqe

       1.049016083 seconds time elapsed

       0.003747000 seconds user
       0.013720000 seconds sys

But, as it turns out, submitting entries is not enough to make io_uring spawn worker threads. Our process remains single-threaded:

$ ./udp-read & p=$!; sleep 1; ps -o thcount $p; kill $p; wait $p
[1] 25229
THCNT
    1
[1]+  Terminated              ./udp-read

This shows that io_uring is smart. It knows that sockets support non-blocking I/O, and they can be polled for readiness to read.

So, by default, io_uring performs a non-blocking read on sockets. This is bound to fail with -EAGAIN in our case. What follows is that io_uring registers a wake-up call (io_async_wake()) for when the socket becomes readable. There is no need to perform a blocking read, when we can wait to be notified.

This resembles polling the socket with select() or [e]poll() from user space. There is no timeout, if we didn’t ask for it explicitly by submitting an IORING_OP_LINK_TIMEOUT request. io_uring will simply wait indefinitely.

We can observe io_uring when it calls vfs_poll, the machinery behind non-blocking I/O, to monitor the sockets. If that happens, we will be hitting the io_uring:io_uring_poll_arm tracepoint. Meanwhile, the wake-ups that follow, if the polled file becomes ready for I/O, can be recorded with the io_uring:io_uring_poll_wake tracepoint embedded in io_async_wake() wake-up call.

This is what we are experiencing. io_uring is polling the socket for read-readiness:

$ sudo bpftrace -lv t:io_uring:io_uring_poll_arm
tracepoint:io_uring:io_uring_poll_arm
    void * ctx
    void * req
    u8 opcode
    u64 user_data
    int mask
    int events      
$ sudo bpftrace -e 't:io_uring:io_uring_poll_arm { @[probe, args->opcode] = count(); } i:s:1 { exit(); }' -c ./udp-read
Attaching 2 probes...


@[tracepoint:io_uring:io_uring_poll_arm, 22]: 4096
$ sudo bpftool btf dump id 1 format c | grep 'IORING_OP_.*22'
        IORING_OP_READ = 22,
$

To make io_uring spawn worker threads, we have to force the read requests to be processed concurrently in a blocking fashion. We can do this by marking the I/O requests as asynchronous. As io_uring_enter(2) man-page says:

  IOSQE_ASYNC
         Normal operation for io_uring is to try and  issue  an
         sqe  as non-blocking first, and if that fails, execute
         it in an async manner. To support more efficient over‐
         lapped  operation  of  requests  that  the application
         knows/assumes will always (or most of the time) block,
         the  application can ask for an sqe to be issued async
         from the start. Available since 5.6.

This will trigger a call to io_queue_sqe() → io_queue_async_work(), which deep down invokes create_io_worker() → create_io_thread() to spawn a new task to process work. Remember that last function, create_io_thread() – it will come up again later.

Our toy program sets the IOSQE_ASYNC flag on requests when we pass the --async command line option to it. Let’s give it a try:

$ ./udp-read --async & pid=$!; sleep 1; ps -o pid,thcount $pid; kill $pid; wait $pid
[2] 3457597
    PID THCNT
3457597  4097
[2]+  Terminated              ./udp-read --async
$

The thread count went up by the number of submitted I/O requests (4,096). And there is one extra thread – the main thread. io_uring has spawned workers.

If we trace it again, we see that requests are now taking the blocking-read path, and we are hitting the io_uring:io_uring_queue_async_work tracepoint on the way.

$ sudo perf stat -a -e io_uring:io_uring_poll_arm,io_uring:io_uring_queue_async_work -- ./udp-read --async
^C./udp-read: Interrupt

 Performance counter stats for 'system wide':

                 0      io_uring:io_uring_poll_arm
              4096      io_uring:io_uring_queue_async_work

       1.335559294 seconds time elapsed

$

In the code, the fork happens in the io_queue_sqe() function, where we are now branching off to io_queue_async_work(), which contains the corresponding tracepoint.

We got what we wanted. We are now using the worker thread pool.

However, having 4,096 threads just for reading one socket sounds like overkill. If we were to limit the number of worker threads, how would we go about that? There are four ways I know of.

Method 1 – Limit the number of in-flight requests

If we take care to never have more than some number of in-flight blocking I/O requests, then we will have more or less the same number of workers. This is because:

  1. io_uring spawns workers only when there is work to process. We control how many requests we submit and can throttle new submissions based on completion notifications.
  2. io_uring retires workers when there is no more pending work in the queue. Although, there is a grace period before a worker dies.

The downside of this approach is that by throttling submissions, we reduce batching. We will have to drain the completion queue, refill the submission queue, and switch context with io_uring_enter() syscall more often.

We can convince ourselves that this method works by tweaking the number of submitted requests, and observing the thread count as the requests complete. The --sqes <n> option (submission queue entries) controls how many read requests get queued by our workload. If we want a request to complete, we simply need to send a packet toward the UDP socket we are reading from. The workload does not refill the submission queue.

$ ./udp-read --async --sqes 8 & pid=$!
[1] 7264
$ ss -ulnp | fgrep pid=$pid
UNCONN 0      0          127.0.0.1:52763      0.0.0.0:*    users:(("udp-read",pid=7264,fd=3))
$ ps -o thcount $pid; nc -zu 127.0.0.1 52763; echo -e '\U1F634'; sleep 5; ps -o thcount $pid
THCNT
    9
😴
THCNT
    8
$

After sending one packet, the run queue length shrinks by one, and the thread count soon follows.

This works, but we can do better.

Method 2 – Configure IORING_REGISTER_IOWQ_MAX_WORKERS

In 5.15 the io_uring_register() syscall gained a new command for setting the maximum number of bound and unbound workers.

  IORING_REGISTER_IOWQ_MAX_WORKERS
         By default, io_uring limits the unbounded workers cre‐
         ated   to   the   maximum   processor   count  set  by
         RLIMIT_NPROC and the bounded workers is a function  of
         the SQ ring size and the number of CPUs in the system.
         Sometimes this can be excessive (or  too  little,  for
         bounded),  and  this  command provides a way to change
         the count per ring (per NUMA node) instead.

         arg must be set to an unsigned int pointer to an array
         of  two values, with the values in the array being set
         to the maximum count of workers per NUMA node. Index 0
         holds  the bounded worker count, and index 1 holds the
         unbounded worker  count.  On  successful  return,  the
         passed  in array will contain the previous maximum va‐
         lyes for each type. If the count being passed in is 0,
         then  this  command returns the current maximum values
         and doesn't modify the current setting.  nr_args  must
         be set to 2, as the command takes two values.

         Available since 5.15.

By the way, if you would like to grep through the io_uring man pages, they live in the liburing repo maintained by Jens Axboe – not the go-to repo for Linux API man-pages maintained by Michael Kerrisk.

Since it is a fresh addition to the io_uring API, the io-uring Rust library we are using has not caught up yet. But with a bit of patching, we can make it work.

We can tell our toy program to set IORING_REGISTER_IOWQ_MAX_WORKERS (= 19 = 0x13) by running it with the --workers <N> option:

$ strace -o strace.out -e io_uring_register ./udp-read --async --workers 8 &
[1] 3555377
$ pstree -pt $!
strace(3555377)───udp-read(3555380)─┬─{iou-wrk-3555380}(3555381)
                                    ├─{iou-wrk-3555380}(3555382)
                                    ├─{iou-wrk-3555380}(3555383)
                                    ├─{iou-wrk-3555380}(3555384)
                                    ├─{iou-wrk-3555380}(3555385)
                                    ├─{iou-wrk-3555380}(3555386)
                                    ├─{iou-wrk-3555380}(3555387)
                                    └─{iou-wrk-3555380}(3555388)
$ cat strace.out
io_uring_register(4, 0x13 /* IORING_REGISTER_??? */, 0x7ffd9b2e3048, 2) = 0
$

This works perfectly. We have spawned just eight io_uring worker threads to handle 4k of submitted read requests.

Question remains – is the set limit per io_uring instance? Per thread? Per process? Per UID? Read on to find out.

Method 3 – Set RLIMIT_NPROC resource limit

A resource limit for the maximum number of new processes is another way to cap the worker pool size. The documentation for the IORING_REGISTER_IOWQ_MAX_WORKERS command mentions this.

This resource limit overrides the IORING_REGISTER_IOWQ_MAX_WORKERS setting, which makes sense because bumping RLIMIT_NPROC above the configured hard maximum requires CAP_SYS_RESOURCE capability.

The catch is that the limit is tracked per UID within a user namespace.

Setting the new process limit without using a dedicated UID or outside a dedicated user namespace, where other processes are running under the same UID, can have surprising effects.

Why? io_uring will try over and over again to scale up the worker pool, only to generate a bunch of -EAGAIN errors from create_io_worker() if it can’t reach the configured RLIMIT_NPROC limit:

$ prlimit --nproc=8 ./udp-read --async &
[1] 26348
$ ps -o thcount $!
THCNT
    3
$ sudo bpftrace --btf -e 'kr:create_io_thread { @[retval] = count(); } i:s:1 { print(@); clear(@); } END { clear(@); }' -c '/usr/bin/sleep 3' | cat -s
Attaching 3 probes...
@[-11]: 293631
@[-11]: 306150
@[-11]: 311959

$ mpstat 1 3
Linux 5.15.9-cloudflare-2021.12.8 (bullseye)    01/04/22        _x86_64_        (4 CPU)
                                   🔥🔥🔥
02:52:46     CPU    %usr   %nice    %sys %iowait    %irq   %soft  %steal  %guest  %gnice   %idle
02:52:47     all    0.00    0.00   25.00    0.00    0.00    0.00    0.00    0.00    0.00   75.00
02:52:48     all    0.00    0.00   25.13    0.00    0.00    0.00    0.00    0.00    0.00   74.87
02:52:49     all    0.00    0.00   25.30    0.00    0.00    0.00    0.00    0.00    0.00   74.70
Average:     all    0.00    0.00   25.14    0.00    0.00    0.00    0.00    0.00    0.00   74.86
$

We are hogging one core trying to spawn new workers. This is not the best use of CPU time.

So, if you want to use RLIMIT_NPROC as a safety cap over the IORING_REGISTER_IOWQ_MAX_WORKERS limit, you better use a “fresh” UID or a throw-away user namespace:

$ unshare -U prlimit --nproc=8 ./udp-read --async --workers 16 &
[1] 3555870
$ ps -o thcount $!
THCNT
    9

Anti-Method 4 – cgroup process limit – pids.max file

There is also one other way to cap the worker pool size – limit the number of tasks (that is, processes and their threads) in a control group.

It is an anti-example and a potential misconfiguration to watch out for, because just like with RLIMIT_NPROC, we can fall into the same trap where io_uring will burn CPU:

$ systemd-run --user -p TasksMax=128 --same-dir --collect --service-type=exec ./udp-read --async
Running as unit: run-ra0336ff405f54ad29726f1e48d6a3237.service
$ systemd-cgls --user-unit run-ra0336ff405f54ad29726f1e48d6a3237.service
Unit run-ra0336ff405f54ad29726f1e48d6a3237.service (/user.slice/user-1000.slice/[email protected]/app.slice/run-ra0336ff405f54ad29726f1e48d6a3237.service):
└─823727 /blog/io-uring-worker-pool/./udp-read --async
$ cat /sys/fs/cgroup/user.slice/user-1000.slice/[email protected]/app.slice/run-ra0336ff405f54ad29726f1e48d6a3237.service/pids.max
128
$ ps -o thcount 823727
THCNT
  128
$ sudo bpftrace --btf -e 'kr:create_io_thread { @[retval] = count(); } i:s:1 { print(@); clear(@); }'
Attaching 2 probes...
@[-11]: 163494
@[-11]: 173134
@[-11]: 184887
^C

@[-11]: 76680
$ systemctl --user stop run-ra0336ff405f54ad29726f1e48d6a3237.service
$

Here, we again see io_uring wasting time trying to spawn more workers without success. The kernel does not let the number of tasks within the service’s control group go over the limit.

Okay, so we know what is the best and the worst way to put a limit on the number of io_uring workers. But is the limit per io_uring instance? Per user? Or something else?

One ring, two ring, three ring, four …

Your process is not limited to one instance of io_uring, naturally. In the case of a network proxy, where we push data from one socket to another, we could have one instance of io_uring servicing each half of the proxy.

Missing Manuals - io_uring worker pool

How many worker threads will be created in the presence of multiple io_urings? That depends on whether your program is single- or multithreaded.

In the single-threaded case, if the main thread creates two io_urings, and configures each io_uring to have a maximum of two unbound workers, then:

$ unshare -U ./udp-read --async --threads 1 --rings 2 --workers 2 &
[3] 3838456
$ pstree -pt $!
udp-read(3838456)─┬─{iou-wrk-3838456}(3838457)
                  └─{iou-wrk-3838456}(3838458)
$ ls -l /proc/3838456/fd
total 0
lrwx------ 1 vagrant vagrant 64 Dec 26 03:32 0 -> /dev/pts/0
lrwx------ 1 vagrant vagrant 64 Dec 26 03:32 1 -> /dev/pts/0
lrwx------ 1 vagrant vagrant 64 Dec 26 03:32 2 -> /dev/pts/0
lrwx------ 1 vagrant vagrant 64 Dec 26 03:32 3 -> 'socket:[279241]'
lrwx------ 1 vagrant vagrant 64 Dec 26 03:32 4 -> 'anon_inode:[io_uring]'
lrwx------ 1 vagrant vagrant 64 Dec 26 03:32 5 -> 'anon_inode:[io_uring]'

… a total of two worker threads will be spawned.

While in the case of a multithreaded program, where two threads create one io_uring each, with a maximum of two unbound workers per ring:

$ unshare -U ./udp-read --async --threads 2 --rings 1 --workers 2 &
[2] 3838223
$ pstree -pt $!
udp-read(3838223)─┬─{iou-wrk-3838224}(3838227)
                  ├─{iou-wrk-3838224}(3838228)
                  ├─{iou-wrk-3838225}(3838226)
                  ├─{iou-wrk-3838225}(3838229)
                  ├─{udp-read}(3838224)
                  └─{udp-read}(3838225)
$ ls -l /proc/3838223/fd
total 0
lrwx------ 1 vagrant vagrant 64 Dec 26 02:53 0 -> /dev/pts/0
lrwx------ 1 vagrant vagrant 64 Dec 26 02:53 1 -> /dev/pts/0
lrwx------ 1 vagrant vagrant 64 Dec 26 02:53 2 -> /dev/pts/0
lrwx------ 1 vagrant vagrant 64 Dec 26 02:53 3 -> 'socket:[279160]'
lrwx------ 1 vagrant vagrant 64 Dec 26 02:53 4 -> 'socket:[279819]'
lrwx------ 1 vagrant vagrant 64 Dec 26 02:53 5 -> 'anon_inode:[io_uring]'
lrwx------ 1 vagrant vagrant 64 Dec 26 02:53 6 -> 'anon_inode:[io_uring]'

… four workers will be spawned in total – two for each of the program threads. This is reflected by the owner thread ID present in the worker’s name (iou-wrk-<tid>).

So you might think – “It makes sense! Each thread has their own dedicated pool of I/O workers, which service all the io_uring instances operated by that thread.”

And you would be right1. If we follow the code – task_struct has an instance of io_uring_task, aka io_uring context for the task2. Inside the context, we have a reference to the io_uring work queue (struct io_wq), which is actually an array of work queue entries (struct io_wqe). More on why that is an array soon.

Moving down to the work queue entry, we arrive at the work queue accounting table (struct io_wqe_acct [2]), with one record for each type of work – bounded and unbounded. This is where io_uring keeps track of the worker pool limit (max_workers) the number of existing workers (nr_workers).

Missing Manuals - io_uring worker pool

The perhaps not-so-obvious consequence of this arrangement is that setting just the RLIMIT_NPROC limit, without touching IORING_REGISTER_IOWQ_MAX_WORKERS, can backfire for multi-threaded programs.

See, when the maximum number of workers for an io_uring instance is not configured, it defaults to RLIMIT_NPROC. This means that io_uring will try to scale the unbounded worker pool to RLIMIT_NPROC for each thread that operates on an io_uring instance.

Missing Manuals - io_uring worker pool

A multi-threaded process, by definition, creates threads. Now recall that the process management in the kernel tracks the number of tasks per UID within the user namespace. Each spawned thread depletes the quota set by RLIMIT_NPROC. As a consequence, io_uring will never be able to fully scale up the worker pool, and will burn the CPU trying to do so.

$ unshare -U prlimit --nproc=4 ./udp-read --async --threads 2 --rings 1 &
[1] 26249
vagrant@bullseye:/blog/io-uring-worker-pool$ pstree -pt $!
udp-read(26249)─┬─{iou-wrk-26251}(26252)
                ├─{iou-wrk-26251}(26253)
                ├─{udp-read}(26250)
                └─{udp-read}(26251)
$ sudo bpftrace --btf -e 'kretprobe:create_io_thread { @[retval] = count(); } interval:s:1 { print(@); clear(@); } END { clear(@); }' -c '/usr/bin/sleep 3' | cat -s
Attaching 3 probes...
@[-11]: 517270
@[-11]: 509508
@[-11]: 461403

$ mpstat 1 3
Linux 5.15.9-cloudflare-2021.12.8 (bullseye)    01/04/22        _x86_64_        (4 CPU)
                                   🔥🔥🔥
02:23:23     CPU    %usr   %nice    %sys %iowait    %irq   %soft  %steal  %guest  %gnice   %idle
02:23:24     all    0.00    0.00   50.13    0.00    0.00    0.00    0.00    0.00    0.00   49.87
02:23:25     all    0.00    0.00   50.25    0.00    0.00    0.00    0.00    0.00    0.00   49.75
02:23:26     all    0.00    0.00   49.87    0.00    0.00    0.50    0.00    0.00    0.00   49.62
Average:     all    0.00    0.00   50.08    0.00    0.00    0.17    0.00    0.00    0.00   49.75
$

NUMA, NUMA, yay 🎶

Lastly, there’s the case of NUMA systems with more than one memory node. io_uring documentation clearly says that IORING_REGISTER_IOWQ_MAX_WORKERS configures the maximum number of workers per NUMA node.

That is why, as we have seen, io_wq.wqes is an array. It contains one entry, struct io_wqe, for each NUMA node. If your servers are NUMA systems like Cloudflare, that is something to take into account.

Luckily, we don’t need a NUMA machine to experiment. QEMU happily emulates NUMA architectures. If you are hardcore enough, you can configure the NUMA layout with the right combination of -smp and -numa options.

But why bother when the libvirt provider for Vagrant makes it so simple to configure a 2 node / 4 CPU layout:

    libvirt.numa_nodes = [
      {:cpus => "0-1", :memory => "2048"},
      {:cpus => "2-3", :memory => "2048"}
    ]

Let’s confirm how io_uring behaves on a NUMA system.
Here’s our NUMA layout with two vCPUs per node ready for experimentation:

$ numactl -H
available: 2 nodes (0-1)
node 0 cpus: 0 1
node 0 size: 1980 MB
node 0 free: 1802 MB
node 1 cpus: 2 3
node 1 size: 1950 MB
node 1 free: 1751 MB
node distances:
node   0   1
  0:  10  20
  1:  20  10

If we once again run our test workload and ask it to create a single io_uring with a maximum of two workers per NUMA node, then:

$ ./udp-read --async --threads 1 --rings 1 --workers 2 &
[1] 693
$ pstree -pt $!
udp-read(693)─┬─{iou-wrk-693}(696)
              └─{iou-wrk-693}(697)

… we get just two workers on a machine with two NUMA nodes. Not the outcome we were hoping for.

Why are we not reaching the expected pool size of <max workers> × <# NUMA nodes> = 2 × 2 = 4 workers? And is it possible to make it happen?

Reading the code reveals that – yes, it is possible. However, for the per-node worker pool to be scaled up for a given NUMA node, we have to submit requests, that is, call io_uring_enter(), from a CPU that belongs to that node. In other words, the process scheduler and thread CPU affinity have a say in how many I/O workers will be created.

We can demonstrate the effect that jumping between CPUs and NUMA nodes has on the worker pool by operating two instances of io_uring. We already know that having more than one io_uring instance per thread does not impact the worker pool limit.

This time, however, we are going to ask the workload to pin itself to a particular CPU before submitting requests with the --cpu option – first it will run on CPU 0 to enter the first ring, then on CPU 2 to enter the second ring.

$ strace -e sched_setaffinity,io_uring_enter ./udp-read --async --threads 1 --rings 2 --cpu 0 --cpu 2 --workers 2 & sleep 0.1 && echo
[1] 6949
sched_setaffinity(0, 128, [0])          = 0
io_uring_enter(4, 4096, 0, 0, NULL, 128) = 4096
sched_setaffinity(0, 128, [2])          = 0
io_uring_enter(5, 4096, 0, 0, NULL, 128) = 4096
io_uring_enter(4, 0, 1, IORING_ENTER_GETEVENTS, NULL, 128
$ pstree -pt 6949
strace(6949)───udp-read(6953)─┬─{iou-wrk-6953}(6954)
                              ├─{iou-wrk-6953}(6955)
                              ├─{iou-wrk-6953}(6956)
                              └─{iou-wrk-6953}(6957)
$

Voilà. We have reached the said limit of <max workers> x <# NUMA nodes>.

Outro

That is all for the very first installment of the Missing Manuals. io_uring has more secrets that deserve a write-up, like request ordering or handling of interrupted syscalls, so Missing Manuals might return soon.

In the meantime, please tell us what topic would you nominate to have a Missing Manual written?

Oh, and did I mention that if you enjoy putting cutting edge Linux APIs to use, we are hiring? Now also remotely 🌎.

_____

1And it probably does not make the users of runtimes that implement a hybrid threading model, like Golang, too happy.
2To the Linux kernel, processes and threads are just kinds of tasks, which either share or don’t share some resources.

The tale of a single register value

Post Syndicated from Jakub Sitnicki original https://blog.cloudflare.com/the-tale-of-a-single-register-value/

The tale of a single register value

“Once you eliminate the impossible, whatever remains, no matter how improbable, must be the truth.” — Sherlock Holmes

Intro

The tale of a single register value

It’s not every day that you get to debug what may well be a packet of death. It was certainly the first time for me.

What do I mean by “a packet of death”? A software bug where the network stack crashes in reaction to a single received network packet, taking down the whole operating system with it. Like in the well known case of Windows ping of death.

Challenge accepted.

It starts with an oops

Around a year ago we started seeing kernel crashes in the Linux ipv4 stack. Servers were crashing sporadically, but we learned the hard way to never ignore cases like that — when possible we always trace crashes. We also couldn’t tie it to a particular kernel version, which could indicate a regression which hopefully could be tracked down to a single faulty change in the Linux kernel.

The crashed servers were leaving behind only a crash report, affectionately known as a “kernel oops”. Let’s take a look at it and go over what information we have there.

The tale of a single register value

Parts of the oops, like offsets into functions, need to be decoded in order to be human-readable. Fortunately Linux comes with the decode_stacktrace.sh script that did the work for us.

All we need is to install a kernel debug and source packages before running the script. We will use the latest version of the script as it has been significantly improved since Linux v5.4 came out.

$ RELEASE=`uname -r`
$ apt install linux-image-$RELEASE-dbg linux-source-$RELEASE
$ curl -sLO https://git.kernel.org/pub/scm/linux/kernel/git/torvalds/linux.git/plain/scripts/decode_stacktrace.sh
$ curl -sLO https://git.kernel.org/pub/scm/linux/kernel/git/torvalds/linux.git/plain/scripts/decodecode
$ chmod +x decode_stacktrace.sh decodecode
$ ./decode_stacktrace.sh -r 5.4.14-cloudflare-2020.1.11 < oops.txt > oops-decoded.txt

When decoded, the oops report is even longer than before! But that is a good thing. There is new information there that can help us.

The tale of a single register value

What has happened?

With this much input we can start sketching a picture of what could have happened. First thing to check is where exactly did we crash?

The report points at line 5160 in the skb_gso_transport_seglen() function. If we take a look at the source code, we can get a rough idea of what happens there. We are processing a Generic Segmentation Offload (GSO) packet carrying an encapsulated TCP packet. What is a GSO packet? In this context it’s a batch of consecutive TCP segments, travelling through the network stack together to amortize the processing cost. We will look more at the GSO later.

net/core/skbuff.c:
5150) static unsigned int skb_gso_transport_seglen(const struct sk_buff *skb)
5151) {
          …
5155)     if (skb->encapsulation) {
                  …
5159)             if (likely(shinfo->gso_type & (SKB_GSO_TCPV4 | SKB_GSO_TCPV6)))
5160)                     thlen += inner_tcp_hdrlen(skb); 👈
5161)     } else if (…) {
          …
5172)     return thlen + shinfo->gso_size;
5173) }

The exact line where we crashed belongs to an if-branch that handles tunnel traffic. It calculates the length of the TCP header of the inner packet, that is the encapsulated one. We do that to compute the length of the outer L4 segment, which accounts for the inner packet length:

The tale of a single register value

To understand how the length of the inner TCP header is computed we have to peel off a few layers of inlined function calls:

inner_tcp_hdrlen(skb)
⇓
inner_tcp_hdr(skb)->doff * 4
⇓
((struct tcphdr *)skb_inner_transport_header(skb))->doff * 4
⇓
((struct tcphdr *)(skb->head + skb->inner_transport_header))->doff * 4

Now it is clear that inner_tcp_hdrlen(skb) simply reads the Data Offset field (doff) inside the inner TCP header. Because Data Offset carries the number of 32-bit words in the TCP header, we multiply it by 4 to get the TCP header length in bytes.

From the memory access point of view, to read the Data Offset value we need to:

  1. load skb->head value from address skb + offsetof(struct sk_buff, head)
  2. load skb->inner_transport_header value from address skb + offsetof(struct sk_buff, inner_transport_header),
  3. load the TCP Data Offset from skb->head + skb->inner_transport_header + offsetof(struct tcphdr, doff)

Potentially, any of these loads could trigger a page fault. But it’s unlikely that skb contains an invalid address since we accessed the skb->encapsulation field without crashing just a few lines earlier. Our main suspect is the last load.

The invalid memory address we attempt to load from should be in one of the CPU registers at the time of the exception. And we have the CPU register snapshot in the oops report. Which register holds the address? That has been decided by the compiler. We will need to take a look at the instruction stream to discover that.

Remember the disassembly in the decoded kernel oops? Now is the time to go back to it. Hint, it’s in AT&T syntax. But to give everyone a fair chance to follow along, here’s the same disassembly but in Intel syntax. (Alright, alright. You caught me. I just can’t read the AT&T syntax.)

All code
========
   0:   c0 41 83 e0             rol    BYTE PTR [rcx-0x7d],0xe0
   4:   11 f6                   adc    esi,esi
   6:   87 81 00 00 00 20       xchg   DWORD PTR [rcx+0x20000000],eax
   c:   74 30                   je     0x3e
   e:   0f b7 87 aa 00 00 00    movzx  eax,WORD PTR [rdi+0xaa]
  15:   0f b7 b7 b2 00 00 00    movzx  esi,WORD PTR [rdi+0xb2]
  1c:   48 01 c1                add    rcx,rax
  1f:   48 29 f0                sub    rax,rsi
  22:   45 85 c0                test   r8d,r8d
  25:   48 89 c6                mov    rsi,rax
  28:   74 0d                   je     0x37
  2a:*  0f b6 41 0c             movzx  eax,BYTE PTR [rcx+0xc]           <-- trapping instruction
  2e:   c0 e8 04                shr    al,0x4
  31:   0f b6 c0                movzx  eax,al
  34:   8d 04 86                lea    eax,[rsi+rax*4]
  37:   0f b7 52 04             movzx  edx,WORD PTR [rdx+0x4]
  3b:   01 d0                   add    eax,edx
  3d:   c3                      ret
  3e:   45                      rex.RB
  3f:   85                      .byte 0x85

Code starting with the faulting instruction
===========================================
   0:   0f b6 41 0c             movzx  eax,BYTE PTR [rcx+0xc]
   4:   c0 e8 04                shr    al,0x4
   7:   0f b6 c0                movzx  eax,al
   a:   8d 04 86                lea    eax,[rsi+rax*4]
   d:   0f b7 52 04             movzx  edx,WORD PTR [rdx+0x4]
  11:   01 d0                   add    eax,edx
  13:   c3                      ret
  14:   45                      rex.RB
  15:   85                      .byte 0x85

When the trapped page fault happened, we tried to load from address %rcx + 0xc, or 12 bytes from whatever memory location %rcx held. Which is hardly a coincidence since the Data Offset field is 12 bytes into the TCP header.

This means that %rcx holds the computed skb->head + skb->inner_transport_header address. Let’s take a look at it:

RSP: 0018:ffffa4740d344ba0 EFLAGS: 00010202
RAX: 000000000000feda RBX: ffff9d982becc900 RCX: ffff9d9624bbaffc
RDX: ffff9d9624babec0 RSI: 000000000000feda RDI: ffff9d982becc900
…

The RCX value doesn’t look particularly suspicious. We can say that:

  1. it’s in a kernel virtual address space because it is greater than 0xffff000000000000 – expected, and
  2. it is very close to the 4 KiB page boundary (0xffff9d9624bbb000 – 4),

… and not much more.

We must go back further in the instruction stream. Where did the value in %rcx come from? What I like to do is try to correlate the machine code leading up to the crash with pseudo source code:

<function entry>                # %rdi = skb
…
movzx  eax,WORD PTR [rdi+0xaa]  # %eax = skb->inner_transport_header
movzx  esi,WORD PTR [rdi+0xb2]  # %esi = skb->transport_header
add    rcx,rax                  # %rcx = skb->head + skb->inner_transport_header
sub    rax,rsi                  # %rax = skb->inner_transport_header - skb->transport_header
test   r8d,r8d
mov    rsi,rax                  # %rsi = skb->inner_transport_header - skb->transport_header
je     0x37
movzx  eax,BYTE PTR [rcx+0xc]   # %eax = *(skb->head + skb->inner_transport_header + offsetof(struct tcphdr, doff))

How did I decode that assembly snippet? We know that the skb address was passed to our function in the %rdi register because the System V AMD64 ABI calling convention dictates that. If the %rdi register hasn’t been clobbered by any function calls, or reused because the compiler decided so, then maybe, just maybe, it still holds the skb address.

If 0xaa and 0xb2 are offsets into an sk_buff structure, then pahole tool can tell us which fields they correspond to:

$ pahole --hex -C sk_buff /usr/lib/debug/vmlinux-5.4.14-cloudflare-2020.1.11 | grep '\(head\|inner_transport_header\|transport_header\);'
        __u16                      inner_transport_header; /*  0xaa   0x2 */
        __u16                      transport_header;     /*  0xb2   0x2 */
        unsigned char *            head;                 /*  0xc0   0x8 */

To confirm our guesswork, we can disassemble the whole function in gdb.

It would be great to find out the value of the inner_transport_header and transport_header offsets. But the registers that were holding them, %rax and %rsi, respectively, were reused after the offset values were loaded.

However, we can still examine the difference between inner_transport_header and transport_header that both %rax and %rsi hold. Let’s take a look.

The suspicious offset

Here are the register values from the oops as a reminder:

RAX: 000000000000feda RBX: ffff9d982becc900 RCX: ffff9d9624bbaffc
RDX: ffff9d9624babec0 RSI: 000000000000feda RDI: ffff9d982becc900

From the register snapshot we can tell that:

%rax = %rsi = skb->inner_transport_header - skb->transport_header = 0xfeda = 65242

That is clearly suspicious. We expect that skb->transport_header < skb->inner_transport_header, so either

  1. skb->inner_transport_header > 0xfeda, which would mean that between outer and inner L4 packets there is 65k+ bytes worth of headers – unlikely, or
  2. 0xfeda is a garbage value, perhaps an effect of an underflow if skb->inner_transport_header < skb->transport_header.

Let’s entertain the theory that an underflow has occurred.

Any other scenario, be it an out-of-bounds write or a use-after-free that corrupted the memory, is a scary prospect where we don’t stand much chance of debugging it without help from tools like KASAN report.

But if we assume for a moment that it’s an underflow, then the task is simple 😉. We “just” need to audit all places where skb->inner_transport_header or skb->transport_header offsets could have been updated while the skb buffer travelled through the network stack.

That raises the question — what path did the packet take through the network stack before it brought the machine down?

Packet path

It is time to take a look at the call trace in the oops report. If we walk through it, it is apparent that a veth device received a packet. The packet then got routed and forwarded to some other network device. The kernel crashed before the egress device transmitted the packet out.

The tale of a single register value

What immediately draws our attention is the veth_poll() function in the call trace. Polling inside a virtual device that acts as a simple pipe joining two network namespaces together? Puzzling!

The regular operation mode of a veth device is that transmission of a packet from one side of a veth-pair results in immediate, in-line, on the same CPU, reception of the packet by the other side of the pair. There shouldn’t be any polling, context switches or such.

However, in Linux v4.19 veth driver gained support for native mode eXpress Data Path (XDP). XDP relies on NAPI, an interface between the network drivers and the Linux network stack. NAPI requires that drivers register a poll() callback for fetching received packets.

The NAPI receive path in the veth driver is taken only when there is an XDP program attached. The fork occurs in veth_forward_skb, where the TX path ends and a RX path on the other side begins.

The tale of a single register value

This is an important observation because only on the NAPI/XDP path in the veth driver, received packets might get aggregated by the Generic Receive Offload.

Super-packets

Early on we’ve noted that the crash happens when processing a GSO packet. I’ve promised we will get back to it and now is the time.

Generic Segmentation Offload (GSO) is all about delaying the L4 segmentation process until the very last moment. So called super-packets, that exceed the egress route MTU in size, travel all the way through the network stack, only to be cut into MTU-sized segments just before handing the data over to the network driver for transmission. This way we process just one big packet on the transmit path, instead of a few smaller ones and save on CPU cycles in all the IP-level stack functions like routing, nftables, traffic control

Where do these super-packets come from? They can be a result of large write to a socket, or as is our case, they can be received from one network and forwarded to another network.

The latter case, that is forwarding a super-packet, happens when Generic Receive Offload (GRO) kicks in during receive. GRO is the opposite process of GSO. Smaller, MTU-sized packets get merged to form a super-packet early on the receive path. The goal is the same — process less by pushing just one packet through the network stack layers.

Not just any packets can be fused together by GRO. Loosely speaking, any two packets to be merged must form a logical sequence in the network flow, and carry the same metadata in protocol headers. It is critical that no information is lost in the aggregation process. Otherwise, GSO won’t be able to reconstruct the segment stream when serializing packets in the network card transmission code.

To this end, each network protocol that supports GRO provides a callback which signals whether the above conditions hold true. GRO implementation (dev_gro_receive()) then walks through the packet headers, the outer as well as the inner ones, and delegates the pre-merge check to the right protocol callback. If all stars align, the packets get spliced at the end of the callback chain (skb_gro_receive()).

I will be frank. The code that performs GRO is pretty complex, and I spent a significant amount of time staring into it. Hat tip to its authors. However, for our little investigation it will be enough to understand that a TCP stream encapsulated with GRE1 would trigger callback chain like so:

The tale of a single register value

Armed with basic GRO/GSO understanding we are ready to take a shot at reproducing the crash.

The reproducer

Let’s recap what we know:

  1. a super-packet was received from a veth device,
  2. the veth device had an XDP program attached,
  3. the packet was forwarded to another device,
  4. the egress device was transmitting a GSO super-packet,
  5. the packet was encapsulated,
  6. the super-packet must have been produced by GRO on ingress.

This paints a pretty clear picture on what the setup should look like:

The tale of a single register value

We can work with that. A simple shell script will be our setup machinery.

We will be sending traffic from 10.1.1.1 to 10.2.2.2. Our traffic pattern will be a TCP stream consisting of two consecutive segments so that GRO can merge something. A Scapy script will be great for that. Let’s call it send-a-pair.py and give it a run:

$ { sleep 5; sudo ip netns exec A ./send-a-pair.py; } &
[1] 1603
$ sudo ip netns exec B tcpdump -i BA -n -nn -ttt 'ip and not arp'
…
 00:00:00.020506 IP 10.1.1.1 > 10.2.2.2: GREv0, length 1480: IP 192.168.1.1.12345 > 192.168.2.2.443: Flags [.], seq 0:1436, ack 1, win 8192, length 1436
 00:00:00.000082 IP 10.1.1.1 > 10.2.2.2: GREv0, length 1480: IP 192.168.1.1.12345 > 192.168.2.2.443: Flags [.], seq 1436:2872, ack 1, win 8192, length 1436

Where is our super-packet? Look at the packet sizes, the GRO didn’t merge anything.

Turns out NAPI is just too fast at fetching the packets from the Rx ring. We need a little buffering on transmit to increase our chances of GRO batching:

# Help GRO
ip netns exec A tc qdisc add dev AB root netem delay 200us slot 5ms 10ms packets 2 bytes 64k

With the delay in place, things look better:

 00:00:00.016972 IP 10.1.1.1 > 10.2.2.2: GREv0, length 2916: IP 192.168.1.1.12345 > 192.168.2.2.443: Flags [.], seq 0:2872, ack 1, win 8192, length 2872

8192 bytes shown by tcpdump clearly indicate GRO in action. And we are even hitting the crash point:

$ sudo bpftrace -e 'kprobe:skb_gso_transport_seglen { print(kstack()); }' -c '/usr/bin/ip netns exec A ./send-a-pair.py'
Attaching 1 probe...

        skb_gso_transport_seglen+1
        skb_gso_validate_network_len+17
        __ip_finish_output+293
        ip_output+113
        ip_forward+876
        ip_rcv+188
        __netif_receive_skb_one_core+128
        netif_receive_skb_internal+47
        napi_gro_flush+151
        napi_complete_done+183
        veth_poll+1697
        net_rx_action+314
        …

^C

…but we are not crashing. We will need to dig deeper.

We know what packet metadata skb_gso_transport_seglen() looks at — the header offsets, then encapsulation flag, and GSO info. Let’s dump all of it:

$ sudo bpftrace ./why-no-crash.bt -c '/usr/bin/ip netns exec A ./send-a-pair.py'
Attaching 2 probes...
DEV  LEN  NH  TH  ENC INH ITH GSO SIZE SEGS TYPE FUNC
sink 2936 270 290 1   294 254  |  1436 2    0x41 skb_gso_transport_seglen

Since the skb->encapsulation flag (ENC) is set, both outer and inner header offsets should be valid. Are they?

The outer network / L3 header (NH) looks sane. When XDP is enabled, it reserves 256 bytes of headroom before the headers. 14 byte long Ethernet header follows the headroom. The IPv4 header should then start at 270 bytes into the packet buffer.

The outer transport / L4 header offset is as expected as well. The IPv4 header takes 20 bytes, and the GRE header follows it.

The inner network header (INH) begins at the offset of 294 bytes. This makes sense because the GRE header in its most basic form is 4 bytes long.

The surprise comes last. The inner transport header offset points somewhere near the end of headroom which XDP reserves. Instead, it should start at 314, following the inner IPv4 header.

The tale of a single register value

Is this the smoking gun we were looking for?

The bug

skb_gso_transport_seglen() calculates the length of the outer L4 segment when given a GSO packet. If the inner_transport_header offset is off, then the result of the calculation might be off as well. Worth checking.

We know that our segments are 1500 bytes long. That makes the L4 part 1480 bytes long. What does skb_gso_transport_seglen() say though?

$ sudo bpftrace -e 'kretprobe:skb_gso_transport_seglen { print(retval); }' -c …
Attaching 1 probe...
1460

Seems that we don’t agree. But if skb_gso_transport_seglen() is getting garbage on input we can’t really blame it.

If inner_transport_header is not correct, that TCP Data Offset read that we know happens inside the function cannot end well.

If we map it out, it looks like we are loading part of the source MAC address (upper 4 bits of the 5th byte, to be precise) and interpreting it as TCP Data Offset.

The tale of a single register value

Are we? There is an easy way to check.

If we ask nicely, tcpdump will tell us what the MAC addresses are:

The tale of a single register value

Plugging that into the calculations that skb_gso_transport_seglen()

thlen = inner_transport_header(skb) - transport_header(skb) = 254 - 290 = -36
thlen += inner_transport_header(skb)->doff * 4 = -36 + (0xf * 4) = -36 + 60 = 24
retval = gso_size + thlen = 1436 + 24 = 1460

…checks out!

Does this mean that I can control the return value by setting source MAC address?!

                                               👇
$ sudo ip -n A link set AB address be:d6:07:5e:05:11 # Change the MAC address 
$ sudo bpftrace -e 'kretprobe:skb_gso_transport_seglen { print(retval); }' -c …
Attaching 1 probe...
1400

Yes! 1436 + (-36) + (0 * 4) = 1400. This is it.

However, how does all this tie it to the original crash? The badly calculated L4 segment length will make GSO emit shorter segments on egress. But that’s all.

Remember the suspicious offset from the crash report?

%rax = %rsi = skb->inner_transport_header - skb->transport_header = 0xfeda = 65242

We now know that skb->transport_header should be 290. That makes skb->inner_transport_header = 65242 + 290 = 65532 = 0xfffc.

Which means that when we triggered the page fault we were trying to load memory from a location at

skb->head + skb->inner_transport_header + offsetof(tcphdr, doff) = skb->head + 0xfffc + 12 = 0xffff9d9624bbb008

Solving it for skb->head yields 0xffff9d9624bbb008 - 0xfffc - 12 = 0xffff9d9624bab000.

And this makes sense. The skb->head buffer is page-aligned, meaning it’s a multiple of 4 KiB on x86-64 platforms — the 12 least significant bits the address are 0.

However, the address we were trying to read was (0xfffc+12)/4096 ~= 16 pages (or 64 KiB) past the skb->head page boundary (0xffff9d9624babfff).

The tale of a single register value

Who knows if there was memory mapped to this address?! Looks like from time to time there wasn’t anything mapped there and the kernel page fault handling code went “oops!”.

The fix

It is finally time to understand who sets the header offsets in a super-packet.

Once GRO is done merging segments, it flushes the super-packet down the pipe by kicking off a chain of gro_complete callbacks:

napi_gro_complete → inet_gro_complete → gre_gro_complete → inet_gro_complete → tcp4_gro_complete → tcp_gro_complete

These callbacks are responsible for updating the header offsets and populating the GSO-related fields in skb_shared_info struct. Later on the transmit side will consume this data.

Let’s see how the packet metadata changes as it travels through the gro_complete callbacks2 by adding a few more tracepoint to our bpftrace script:

$ sudo bpftrace ./why-no-crash.bt -c '/usr/bin/ip netns exec A ./send-a-pair.py'
Attaching 7 probes...
DEV  LEN  NH  TH  ENC INH ITH GSO SIZE SEGS TYPE FUNC
BA   2936 294 314 0   254 254  |  1436 0    0x00 napi_gro_complete
BA   2936 294 314 0   254 254  |  1436 0    0x00 inet_gro_complete
BA   2936 294 314 0   254 254  |  1436 0    0x00 gre_gro_complete
BA   2936 294 314 1   254 254  |  1436 0    0x40 inet_gro_complete
BA   2936 294 314 1   294 254  |  1436 0    0x40 tcp4_gro_complete
BA   2936 294 314 1   294 254  |  1436 0    0x41 tcp_gro_complete
sink 2936 270 290 1   294 254  |  1436 2    0x41 skb_gso_transport_seglen

As the packet travels through the gro_complete callbacks, the inner network header (INH) offset gets updated after we have processed the inner IPv4 header.

However, the same thing did not happen to the inner transport header (ITH) that is causing trouble. We need to fix that.

--- a/net/ipv4/tcp_offload.c
+++ b/net/ipv4/tcp_offload.c
@@ -298,6 +298,9 @@ int tcp_gro_complete(struct sk_buff *skb)
        if (th->cwr)
                skb_shinfo(skb)->gso_type |= SKB_GSO_TCP_ECN;

+       if (skb->encapsulation)
+               skb->inner_transport_header = skb->transport_header;
+
        return 0;
 }
 EXPORT_SYMBOL(tcp_gro_complete);

With the patch in place, the header offsets are finally all sane and skb_gso_transport_seglen() return value is as expected:

$ sudo bpftrace ./why-no-crash.bt -c '/usr/bin/ip netns exec A ./send-a-pair.py'
Attaching 2 probes...
DEV  LEN  NH  TH  ENC INH ITH GSO SIZE SEGS TYPE FUNC
sink 2936 270 290 1   294 314  |  1436 2    0x41 skb_gso_transport_seglen

$ sudo bpftrace -e 'kretprobe:skb_gso_transport_seglen { print(retval); }' -c …
Attaching 1 probe...
1480

Don’t worry, though. The fix is already likely in your kernel long time ago. Patch d51c5907e980 (“net, gro: Set inner transport header offset in tcp/udp GRO hook”) has been merged into Linux v5.14, and backported to v5.10.58 and v5.4.140 LTS kernels. The Linux kernel community has got you covered. But please, keep on updating your production kernels.

Outro

What a journey! We have learned a ton and fixed a real bug in the Linux kernel. In the end it was not a Packet of Death. Maybe next time we can find one 😉

Enjoyed the read? Why not join Cloudflare and help us fix the remaining bugs in the Linux kernel? We are hiring in Lisbon, London, and Austin.

And if you would like to see more kernel blog posts, please let us know!


1Why GRE and not some other type of encapsulation? If you follow our blog closely, you might already know that Cloudflare Magic Transit uses veth pairs to route traffic into and out of network namespaces. It also happens to use GRE encapsulation. If you are curious why we chose network namespaces linked with veth pairs, be sure to watch the How we built Magic Transit talk.
2Just turn off GRO on all other network devices in use to get a clean output (sudo ethtool -K enp0s5 gro off).

Conntrack turns a blind eye to dropped SYNs

Post Syndicated from Jakub Sitnicki original https://blog.cloudflare.com/conntrack-turns-a-blind-eye-to-dropped-syns/

Intro

Conntrack turns a blind eye to dropped SYNs

We have been working with conntrack, the connection tracking layer in the Linux kernel, for years. And yet, despite the collected know-how, questions about its inner workings occasionally come up. When they do, it is hard to resist the temptation to go digging for answers.

One such question popped up while writing the previous blog post on conntrack:

“Why are there no entries in the conntrack table for SYN packets dropped by the firewall?”

Ready for a deep dive into the network stack? Let’s find out.

Conntrack turns a blind eye to dropped SYNs
Image by chulmin park from Pixabay

We already know from last time that conntrack is in charge of tracking incoming and outgoing network traffic. By running conntrack -L we can inspect existing network flows, or as conntrack calls them, connections.

So if we spin up a toy VM, connect to it over SSH, and inspect the contents of the conntrack table, we will see…

$ vagrant init fedora/33-cloud-base
$ vagrant up
…
$ vagrant ssh
Last login: Sun Jan 31 15:08:02 2021 from 192.168.122.1
[vagrant@ct-vm ~]$ sudo conntrack -L
conntrack v1.4.5 (conntrack-tools): 0 flow entries have been shown.

… nothing!

Even though the conntrack kernel module is loaded:

[vagrant@ct-vm ~]$ lsmod | grep '^nf_conntrack\b'
nf_conntrack          163840  1 nf_conntrack_netlink

Hold on a minute. Why is the SSH connection to the VM not listed in conntrack entries? SSH is working. With each keystroke we are sending packets to the VM. But conntrack doesn’t register it.

Isn’t conntrack an integral part of the network stack that sees every packet passing through it? 🤔

Conntrack turns a blind eye to dropped SYNs
Based on an image by Jan Engelhardt CC BY-SA 3.0

Clearly everything we learned about conntrack last time is not the whole story.

Calling into conntrack

Our little experiment with SSH’ing into a VM begs the question — how does conntrack actually get notified about network packets passing through the stack?

We can walk the receive path step by step and we won’t find any direct calls into the conntrack code in either the IPv4 or IPv6 stack. Conntrack does not interface with the network stack directly.

Instead, it relies on the Netfilter framework, and its set of hooks baked into in the stack:

int ip_rcv(struct sk_buff *skb, struct net_device *dev, …)
{
    …
    return NF_HOOK(NFPROTO_IPV4, NF_INET_PRE_ROUTING,
               net, NULL, skb, dev, NULL,
               ip_rcv_finish);
}

Netfilter users, like conntrack, can register callbacks with it. Netfilter will then run all registered callbacks when its hook processes a network packet.

For the INET family, that is IPv4 and IPv6, there are five Netfilter hooks  to choose from:

Conntrack turns a blind eye to dropped SYNs
Based on Nftables – Packet flow and Netfilter hooks in detail, thermalcircle.de, CC BY-SA 4.0

Which ones does conntrack use? We will get to that in a moment.

First, let’s focus on the trigger. What makes conntrack register its callbacks with Netfilter?

The SSH connection doesn’t show up in the conntrack table just because the module is loaded. We already saw that. This means that conntrack doesn’t register its callbacks with Netfilter at module load time.

Or at least, it doesn’t do it by default. Since Linux v5.1 (May 2019) the conntrack module has the enable_hooks parameter, which causes conntrack to register its callbacks on load:

[vagrant@ct-vm ~]$ modinfo nf_conntrack
…
parm:           enable_hooks:Always enable conntrack hooks (bool)

Going back to our toy VM, let’s try to reload the conntrack module with enable_hooks set:

[vagrant@ct-vm ~]$ sudo rmmod nf_conntrack_netlink nf_conntrack
[vagrant@ct-vm ~]$ sudo modprobe nf_conntrack enable_hooks=1
[vagrant@ct-vm ~]$ sudo conntrack -L
tcp      6 431999 ESTABLISHED src=192.168.122.204 dst=192.168.122.1 sport=22 dport=34858 src=192.168.122.1 dst=192.168.122.204 sport=34858 dport=22 [ASSURED] mark=0 secctx=system_u:object_r:unlabeled_t:s0 use=1
conntrack v1.4.5 (conntrack-tools): 1 flow entries have been shown.
[vagrant@ct-vm ~]$

Nice! The conntrack table now contains an entry for our SSH session.

The Netfilter hook notified conntrack about SSH session packets passing through the stack.

Now that we know how conntrack gets called, we can go back to our question — can we observe a TCP SYN packet dropped by the firewall with conntrack?

Listing Netfilter hooks

That is easy to check:

  1. Add a rule to drop anything coming to port tcp/25702

[vagrant@ct-vm ~]$ sudo iptables -t filter -A INPUT -p tcp --dport 2570 -j DROP

2) Connect to the VM on port tcp/2570 from the outside

host $ nc -w 1 -z 192.168.122.204 2570

3) List conntrack table entries

[vagrant@ct-vm ~]$ sudo conntrack -L
tcp      6 431999 ESTABLISHED src=192.168.122.204 dst=192.168.122.1 sport=22 dport=34858 src=192.168.122.1 dst=192.168.122.204 sport=34858 dport=22 [ASSURED] mark=0 secctx=system_u:object_r:unlabeled_t:s0 use=1
conntrack v1.4.5 (conntrack-tools): 1 flow entries have been shown.

No new entries. Conntrack didn’t record a new flow for the dropped SYN.

But did it process the SYN packet? To answer that we have to find out which callbacks conntrack registered with Netfilter.

Netfilter keeps track of callbacks registered for each hook in instances of struct nf_hook_entries. We can reach these objects through the Netfilter state (struct netns_nf), which lives inside network namespace (struct net).

struct netns_nf {
    …
    struct nf_hook_entries __rcu *hooks_ipv4[NF_INET_NUMHOOKS];
    struct nf_hook_entries __rcu *hooks_ipv6[NF_INET_NUMHOOKS];
    …
}

struct nf_hook_entries, if you look at its definition, is a bit of an exotic construct. A glance at how the object size is calculated during its allocation gives a hint about its memory layout:

    struct nf_hook_entries *e;
    size_t alloc = sizeof(*e) +
               sizeof(struct nf_hook_entry) * num +
               sizeof(struct nf_hook_ops *) * num +
               sizeof(struct nf_hook_entries_rcu_head);

It’s an element count, followed by two arrays glued together, and some RCU-related state which we’re going to ignore. The two arrays have the same size, but hold different kinds of values.

We can walk the second array, holding pointers to struct nf_hook_ops, to discover the registered callbacks and their priority. Priority determines the invocation order.

Conntrack turns a blind eye to dropped SYNs

With drgn, a programmable C debugger tailored for the Linux kernel, we can locate the Netfilter state in kernel memory, and walk its contents relatively easily. Given we know what we are looking for.

[vagrant@ct-vm ~]$ sudo drgn
drgn 0.0.8 (using Python 3.9.1, without libkdumpfile)
…
>>> pre_routing_hook = prog['init_net'].nf.hooks_ipv4[0]
>>> for i in range(0, pre_routing_hook.num_hook_entries):
...     pre_routing_hook.hooks[i].hook
...
(nf_hookfn *)ipv4_conntrack_defrag+0x0 = 0xffffffffc092c000
(nf_hookfn *)ipv4_conntrack_in+0x0 = 0xffffffffc093f290
>>>

Neat! We have a way to access Netfilter state.

Let’s take it to the next level and list all registered callbacks for each Netfilter hook (using less than 100 lines of Python):

[vagrant@ct-vm ~]$ sudo /vagrant/tools/list-nf-hooks
🪝 ipv4 PRE_ROUTING
       -400 → ipv4_conntrack_defrag     ☜ conntrack callback
       -300 → iptable_raw_hook
       -200 → ipv4_conntrack_in         ☜ conntrack callback
       -150 → iptable_mangle_hook
       -100 → nf_nat_ipv4_in

🪝 ipv4 LOCAL_IN
       -150 → iptable_mangle_hook
          0 → iptable_filter_hook
         50 → iptable_security_hook
        100 → nf_nat_ipv4_fn
 2147483647 → ipv4_confirm
…

The output from our script shows that conntrack has two callbacks registered with the PRE_ROUTING hook – ipv4_conntrack_defrag and ipv4_conntrack_in. But are they being called?

Conntrack turns a blind eye to dropped SYNs
Based on Netfilter PRE_ROUTING hook, thermalcircle.de, CC BY-SA 4.0

Tracing conntrack callbacks

We expect that when the Netfilter PRE_ROUTING hook processes a TCP SYN packet, it will invoke ipv4_conntrack_defrag and then ipv4_conntrack_in callbacks.

To confirm it we will put to use the tracing powers of BPF 🐝. BPF programs can run on entry to functions. These kinds of programs are known as BPF kprobes. In our case we will attach BPF kprobes to conntrack callbacks.

Usually, when working with BPF, we would write the BPF program in C and use clang -target bpf to compile it. However, for tracing it will be much easier to use bpftrace. With bpftrace we can write our BPF kprobe program in a high-level language inspired by AWK:

kprobe:ipv4_conntrack_defrag,
kprobe:ipv4_conntrack_in
{
    $skb = (struct sk_buff *)arg1;
    $iph = (struct iphdr *)($skb->head + $skb->network_header);
    $th = (struct tcphdr *)($skb->head + $skb->transport_header);

    if ($iph->protocol == 6 /* IPPROTO_TCP */ &&
        $th->dest == 2570 /* htons(2570) */ &&
        $th->syn == 1) {
        time("%H:%M:%S ");
        printf("%s:%u > %s:%u tcp syn %s\n",
               ntop($iph->saddr),
               (uint16)($th->source << 8) | ($th->source >> 8),
               ntop($iph->daddr),
               (uint16)($th->dest << 8) | ($th->dest >> 8),
               func);
    }
}

What does this program do? It is roughly an equivalent of a tcpdump filter:

dst port 2570 and tcp[tcpflags] & tcp-syn != 0

But only for packets passing through conntrack PRE_ROUTING callbacks.

(If you haven’t used bpftrace, it comes with an excellent reference guide and gives you the ability to explore kernel data types on the fly with bpftrace -lv 'struct iphdr'.)

Let’s run the tracing program while we connect to the VM from the outside (nc -z 192.168.122.204 2570):

[vagrant@ct-vm ~]$ sudo bpftrace /vagrant/tools/trace-conntrack-prerouting.bt
Attaching 3 probes...
Tracing conntrack prerouting callbacks... Hit Ctrl-C to quit
13:22:56 192.168.122.1:33254 > 192.168.122.204:2570 tcp syn ipv4_conntrack_defrag
13:22:56 192.168.122.1:33254 > 192.168.122.204:2570 tcp syn ipv4_conntrack_in
^C

[vagrant@ct-vm ~]$

Conntrack callbacks have processed the TCP SYN packet destined to tcp/2570.

But if conntrack saw the packet, why is there no corresponding flow entry in the conntrack table?

Going down the rabbit hole

What actually happens inside the conntrack PRE_ROUTING callbacks?

To find out, we can trace the call chain that starts on entry to the conntrack callback. The function_graph tracer built into the Ftrace framework is perfect for this task.

But because all incoming traffic goes through the PRE_ROUTING hook, including our SSH connection, our trace will be polluted with events from SSH traffic. To avoid that, let’s switch from SSH access to a serial console.

When using libvirt as the Vagrant provider, you can connect to the serial console with virsh:

host $ virsh -c qemu:///session list
 Id   Name                State
-----------------------------------
 1    conntrack_default   running

host $ virsh -c qemu:///session console conntrack_default
Once connected to the console and logged into the VM, we can record the call chain using the trace-cmd wrapper for Ftrace:
[vagrant@ct-vm ~]$ sudo trace-cmd start -p function_graph -g ipv4_conntrack_defrag -g ipv4_conntrack_in
  plugin 'function_graph'
[vagrant@ct-vm ~]$ # … connect from the host with `nc -z 192.168.122.204 2570` …
[vagrant@ct-vm ~]$ sudo trace-cmd stop
[vagrant@ct-vm ~]$ sudo cat /sys/kernel/debug/tracing/trace
# tracer: function_graph
#
# CPU  DURATION                  FUNCTION CALLS
# |     |   |                     |   |   |   |
 1)   1.219 us    |  finish_task_switch();
 1)   3.532 us    |  ipv4_conntrack_defrag [nf_defrag_ipv4]();
 1)               |  ipv4_conntrack_in [nf_conntrack]() {
 1)               |    nf_conntrack_in [nf_conntrack]() {
 1)   0.573 us    |      get_l4proto [nf_conntrack]();
 1)               |      nf_ct_get_tuple [nf_conntrack]() {
 1)   0.487 us    |        nf_ct_get_tuple_ports [nf_conntrack]();
 1)   1.564 us    |      }
 1)   0.820 us    |      hash_conntrack_raw [nf_conntrack]();
 1)   1.255 us    |      __nf_conntrack_find_get [nf_conntrack]();
 1)               |      init_conntrack.constprop.0 [nf_conntrack]() {  ❷
 1)   0.427 us    |        nf_ct_invert_tuple [nf_conntrack]();
 1)               |        __nf_conntrack_alloc [nf_conntrack]() {      ❶
                             … 
 1)   3.680 us    |        }
                           … 
 1) + 15.847 us   |      }
                         … 
 1) + 34.595 us   |    }
 1) + 35.742 us   |  }
 …
[vagrant@ct-vm ~]$

What catches our attention here is the allocation, __nf_conntrack_alloc() (❶), inside init_conntrack() (❷). __nf_conntrack_alloc() creates a struct nf_conn object which represents a tracked connection.

This object is not created in vain. A glance at init_conntrack() source shows that it is pushed onto a list of unconfirmed connections3.

Conntrack turns a blind eye to dropped SYNs

What does it mean that a connection is unconfirmed? As conntrack(8) man page explains:

unconfirmed:
       This table shows new entries, that are not yet inserted into the
       conntrack table. These entries are attached to packets that  are
       traversing  the  stack, but did not reach the confirmation point
       at the postrouting hook.

Perhaps we have been looking for our flow in the wrong table? Does the unconfirmed table have a record for our dropped TCP SYN?

Pulling the rabbit out of the hat

I have bad news…

[vagrant@ct-vm ~]$ sudo conntrack -L unconfirmed
conntrack v1.4.5 (conntrack-tools): 0 flow entries have been shown.
[vagrant@ct-vm ~]$

The flow is not present in the unconfirmed table. We have to dig deeper.

Let’s for a moment assume that a struct nf_conn object was added to the unconfirmed list. If the list is now empty, then the object must have been removed from the list before we inspected its contents.

Has an entry been removed from the unconfirmed table? What function removes entries from the unconfirmed table?

It turns out that nf_ct_add_to_unconfirmed_list() which init_conntrack() invokes, has its opposite defined just right beneath it – nf_ct_del_from_dying_or_unconfirmed_list().

It is worth a shot to check if this function is being called, and if so, from where. For that we can again use a BPF tracing program, attached to function entry. However, this time our program will record a kernel stack trace:

kprobe:nf_ct_del_from_dying_or_unconfirmed_list { @[kstack()] = count(); exit(); }

With bpftrace running our one-liner, we connect to the VM from the host with nc as before:

[vagrant@ct-vm ~]$ sudo bpftrace -e 'kprobe:nf_ct_del_from_dying_or_unconfirmed_list { @[kstack()] = count(); exit(); }'
Attaching 1 probe...

@[
    nf_ct_del_from_dying_or_unconfirmed_list+1 ❹
    destroy_conntrack+78
    nf_conntrack_destroy+26
    skb_release_head_state+78
    kfree_skb+50 ❸
    nf_hook_slow+143 ❷
    ip_local_deliver+152 ❶
    ip_sublist_rcv_finish+87
    ip_sublist_rcv+387
    ip_list_rcv+293
    __netif_receive_skb_list_core+658
    netif_receive_skb_list_internal+444
    napi_complete_done+111
    …
]: 1

[vagrant@ct-vm ~]$

Bingo. The conntrack delete function was called, and the captured stack trace shows that on local delivery path (❶), where LOCAL_IN Netfilter hook runs (❷), the packet is destroyed (❸). Conntrack must be getting called when sk_buff (the packet and its metadata) is destroyed. This causes conntrack to remove the unconfirmed flow entry (❹).

It makes sense. After all we have a DROP rule in the filter/INPUT chain. And that iptables -j DROP rule has a significant side effect. It cleans up an entry in the conntrack unconfirmed table!

This explains why we can’t observe the flow in the unconfirmed table. It lives for only a very short period of time.

Not convinced? You don’t have to take my word for it. I will prove it with a dirty trick!

Making the rabbit disappear, or actually appear

If you recall the output from list-nf-hooks that we’ve seen earlier, there is another conntrack callback there – ipv4_confirm, which I have ignored:

[vagrant@ct-vm ~]$ sudo /vagrant/tools/list-nf-hooks
…
🪝 ipv4 LOCAL_IN
       -150 → iptable_mangle_hook
          0 → iptable_filter_hook
         50 → iptable_security_hook
        100 → nf_nat_ipv4_fn
 2147483647 → ipv4_confirm              ☜ another conntrack callback
… 

ipv4_confirm is “the confirmation point” mentioned in the conntrack(8) man page. When a flow gets confirmed, it is moved from the unconfirmed table to the main conntrack table.

The callback is registered with a “weird” priority – 2,147,483,647. It’s the maximum positive value of a 32-bit signed integer can hold, and at the same time, the lowest possible priority a callback can have.

This ensures that the ipv4_confirm callback runs last. We want the flows to graduate from the unconfirmed table to the main conntrack table only once we know the corresponding packet has made it through the firewall.

Luckily for us, it is possible to have more than one callback registered with the same priority. In such cases, the order of registration matters. We can put that to use. Just for educational purposes.

Good old iptables won’t be of much help here. Its Netfilter callbacks have hard-coded priorities which we can’t change. But nftables, the iptables successor, is much more flexible in this regard. With nftables we can create a rule chain with arbitrary priority.

So this time, let’s use nftables to install a filter rule to drop traffic to port tcp/2570. The trick, though, is to register our chain before conntrack registers itself. This way our filter will run last.

First, delete the tcp/2570 drop rule in iptables and unregister conntrack.

vm # iptables -t filter -F
vm # rmmod nf_conntrack_netlink nf_conntrack

Then add tcp/2570 drop rule in nftables, with lowest possible priority.

vm # nft add table ip my_table
vm # nft add chain ip my_table my_input { type filter hook input priority 2147483647 \; }
vm # nft add rule ip my_table my_input tcp dport 2570 counter drop
vm # nft -a list ruleset
table ip my_table { # handle 1
        chain my_input { # handle 1
                type filter hook input priority 2147483647; policy accept;
                tcp dport 2570 counter packets 0 bytes 0 drop # handle 4
        }
}

Finally, re-register conntrack hooks.

vm # modprobe nf_conntrack enable_hooks=1

The registered callbacks for the LOCAL_IN hook now look like this:

vm # /vagrant/tools/list-nf-hooks
…
🪝 ipv4 LOCAL_IN
       -150 → iptable_mangle_hook
          0 → iptable_filter_hook
         50 → iptable_security_hook
        100 → nf_nat_ipv4_fn
 2147483647 → ipv4_confirm, nft_do_chain_ipv4
…

What happens if we connect to port tcp/2570 now?

vm # conntrack -L
tcp      6 115 SYN_SENT src=192.168.122.1 dst=192.168.122.204 sport=54868 dport=2570 [UNREPLIED] src=192.168.122.204 dst=192.168.122.1 sport=2570 dport=54868 mark=0 secctx=system_u:object_r:unlabeled_t:s0 use=1
conntrack v1.4.5 (conntrack-tools): 1 flow entries have been shown.

We have fooled conntrack 💥

Conntrack promoted the flow from the unconfirmed to the main conntrack table despite the fact that the firewall dropped the packet. We can observe it.

Outro

Conntrack processes every received packet4 and creates a flow for it. A flow entry is always created even if the packet is dropped shortly after. The flow might never be promoted to the main conntrack table and can be short lived.

However, this blog post is not really about conntrack. Its internals have been covered by magazines, papers, books, and on other blogs long before. We probably could have learned elsewhere all that has been shown here.

For us, conntrack was really just an excuse to demonstrate various ways to discover the inner workings of the Linux network stack. As good as any other.

Today we have powerful introspection tools like drgn, bpftrace, or Ftrace, and a cross referencer to plow through the source code, at our fingertips. They help us look under the hood of a live operating system and gradually deepen our understanding of its workings.

I have to warn you, though. Once you start digging into the kernel, it is hard to stop…

………..
1Actually since Linux v5.10 (Dec 2020) there is an additional Netfilter hook for the INET family named NF_INET_INGRESS. The new hook type allows users to attach nftables chains to the Traffic Control ingress hook.
2Why did I pick this port number? Because 2570 = 0x0a0a. As we will see later, this saves us the trouble of converting between the network byte order and the host byte order.
3To be precise, there are multiple lists of unconfirmed connections. One per each CPU. This is a common pattern in the kernel. Whenever we want to prevent CPUs from contending for access to a shared state, we give each CPU a private instance of the state.
4Unless we explicitly exclude it from being tracked with iptables -j NOTRACK.