Depending on your configuration, the Linux kernel can produce a hung task warning message in its log. Searching the Internet and the kernel documentation, you can find a brief explanation that the kernel process is stuck in the uninterruptable state and hasn’t been scheduled on the CPU for an unexpectedly long period of time. That explains the warning’s meaning, but doesn’t provide the reason it occurred. In this blog post we’re going to explore how the hung task warning works, why it happens, whether it is a bug in the Linux kernel or application itself, and whether it is worth monitoring at all.
INFO: task XXX:1495882 blocked for more than YYY seconds.
The hung task message in the kernel log looks like this:
INFO: task XXX:1495882 blocked for more than YYY seconds.
     Tainted: G          O       6.6.39-cloudflare-2024.7.3 #1
"echo 0 > /proc/sys/kernel/hung_task_timeout_secs" disables this message.
task:XXX         state:D stack:0     pid:1495882 ppid:1      flags:0x00004002
. . .
Processes in Linux can be in different states. Some of them are running or ready to run on the CPU — they are in the TASK_RUNNING state. Others are waiting for some signal or event to happen, e.g. network packets to arrive or terminal input from a user. They are in a TASK_INTERRUPTIBLE state and can spend an arbitrary length of time in this state until being woken up by a signal. The most important thing about these states is that they still can receive signals, and be terminated by a signal. In contrast, a process in the TASK_UNINTERRUPTIBLE state is waiting only for certain special classes of events to wake them up, and can’t be interrupted by a signal. The signals are not delivered until the process emerges from this state and only a system reboot can clear the process. It’s marked with the letter D in the log shown above.
What if this wake up event doesn’t happen or happens with a significant delay? (A “significant delay” may be on the order of seconds or minutes, depending on the system.) Then our dependent process is hung in this state. What if this dependent process holds some lock and prevents other processes from acquiring it? Or if we see many processes in the D state? Then it might tell us that some of the system resources are overwhelmed or are not working correctly. At the same time, this state is very valuable, especially if we want to preserve the process memory. It might be useful if part of the data is written to disk and another part is still in the process memory — we don’t want inconsistent data on a disk. Or maybe we want a snapshot of the process memory when the bug is hit. To preserve this behaviour, but make it more controlled, a new state was introduced in the kernel: TASK_KILLABLE — it still protects a process, but allows termination with a fatal signal.
How Linux identifies the hung process
The Linux kernel has a special thread called khungtaskd. It runs regularly depending on the settings, iterating over all processes in the D state. If a process is in this state for more than YYY seconds, we’ll see a message in the kernel log. There are settings for this daemon that can be changed according to your wishes:
At Cloudflare, we changed the notification threshold kernel.hung_task_timeout_secs from the default 120 seconds to 10 seconds. You can adjust the value for your system depending on configuration and how critical this delay is for you. If the process spends more than hung_task_timeout_secs seconds in the D state, a log entry is written, and our internal monitoring system emits an alert based on this log. Another important setting here is kernel.hung_task_warnings — the total number of messages that will be sent to the log. We limit it to 200 messages and reset it every 15 minutes. It allows us not to be overwhelmed by the same issue, and at the same time doesn’t stop our monitoring for too long. You can make it unlimited by setting the value to “-1”.
To better understand the root causes of the hung tasks and how a system can be affected, we’re going to review more detailed examples.
Example #1 or XFS
Typically, there is a meaningful process or application name in the log, but sometimes you might see something like this:
INFO: task kworker/13:0:834409 blocked for more than 11 seconds.
 	Tainted: G      	O   	6.6.39-cloudflare-2024.7.3 #1
"echo 0 > /proc/sys/kernel/hung_task_timeout_secs" disables this message.
task:kworker/13:0	state:D stack:0 	pid:834409 ppid:2   flags:0x00004000
Workqueue: xfs-sync/dm-6 xfs_log_worker
In this log, kworker is the kernel thread. It’s used as a deferring mechanism, meaning a piece of work will be scheduled to be executed in the future. Under kworker, the work is aggregated from different tasks, which makes it difficult to tell which application is experiencing a delay. Luckily, the kworker is accompanied by the Workqueue line. Workqueue is a linked list, usually predefined in the kernel, where these pieces of work are added and performed by the kworker in the order they were added to the queue. The Workqueue name xfs-sync and the function which it points to, xfs_log_worker, might give a good clue where to look. Here we can make an assumption that the XFS is under pressure and check the relevant metrics. It helped us to discover that due to some configuration changes, we forgot no_read_workqueue / no_write_workqueue flags that were introduced some time ago to speed up Linux disk encryption.
Summary: In this case, nothing critical happened to the system, but the hung tasks warnings gave us an alert that our file system had slowed down.
Example #2 or Coredump
Let’s take a look at the next hung task log and its decoded stack trace:
The stack trace says that the process or application test was blocked for more than 5 seconds. We might recognise this user space application by the name, but why is it blocked? It’s always helpful to check the stack trace when looking for a cause. The most interesting line here is do_exit (linux/kernel/exit.c:433 (discriminator 4) linux/kernel/exit.c:825 (discriminator 4)). The source code points to the coredump_task_exit function. Additionally, checking the process metrics revealed that the application crashed during the time when the warning message appeared in the log. When a process is terminated based on some set of signals (abnormally), the Linux kernel can provide a core dump file, if enabled. The mechanism — when a process terminates, the kernel makes a snapshot of the process memory before exiting and either writes it to a file or sends it through the socket to another handler — can be systemd-coredump or your custom one. When it happens, the kernel moves the process to the D state to preserve its memory and early termination. The higher the process memory usage, the longer it takes to get a core dump file, and the higher the chance of getting a hung task warning.
Let’s check our hypothesis by triggering it with a small Go program. We’ll use the default Linux coredump handler and will decrease the hung task threshold to 1 second.
This program reads a 10 GB file into process memory. Let’s create the file:
$ yes this is 10GB file | head -c 10GB > test.file
The last step is to build the Go program, crash it, and watch our kernel log:
$ go mod init test
$ go build .
$ GOTRACEBACK=crash ./test
$ (Ctrl+\)
Hooray! We can see our hung task warning:
$ sudo dmesg -T | tail -n 31
INFO: task test:8734 blocked for more than 22 seconds.
      Not tainted 6.6.72-cloudflare-2025.1.7 #1
      Blocked by coredump.
"echo 0 > /proc/sys/kernel/hung_task_timeout_secs" disables this message.
task:test            state:D stack:0     pid:8734  ppid:8406   task_flags:0x400448 flags:0x00004000
By the way, have you noticed the Blocked by coredump. line in the log? It was recently added to the upstream code to improve visibility and remove the blame from the process itself. The patch also added the task_flags information, as Blocked by coredump is detected via the flag PF_POSTCOREDUMP, and knowing all the task flags is useful for further root-cause analysis.
Summary: This example showed that even if everything suggests that the application is the problem, the real root cause can be something else — in this case, coredump.
Example #3 or rtnl_mutex
This one was tricky to debug. Usually, the alerts are limited by one or two different processes, meaning only a certain application or subsystem experiences an issue. In this case, we saw dozens of unrelated tasks hanging for minutes with no improvements over time. Nothing else was in the log, most of the system metrics were fine, and existing traffic was being served, but it was not possible to ssh to the server. New Kubernetes container creations were also stalling. Analyzing the stack traces of different tasks initially revealed that all the traces were limited to just three functions:
Further investigation showed that all of these functions were waiting for rtnl_lock to be acquired. It looked like some application acquired the rtnl_mutex and didn’t release it. All other processes were in the D state waiting for this lock.
The RTNL lock is primarily used by the kernel networking subsystem for any network-related config, for both writing and reading. The RTNL is a global mutex lock, although upstream efforts are being made for splitting up RTNL per network namespace (netns).
From the hung task reports, we can observe the “victims” that are being stalled waiting for the lock, but how do we identify the task that is holding this lock for too long? For troubleshooting this, we leveraged BPF via a bpftrace script, as this allows us to inspect the running kernel state. The kernel’s mutex implementation has a struct member called owner. It contains a pointer to the task_struct from the mutex-owning process, except it is encoded as type atomic_long_t. This is because the mutex implementation stores some state information in the lower 3-bits (mask 0x7) of this pointer. Thus, to read and dereference this task_struct pointer, we must first mask off the lower bits (0x7).
Our bpftrace script to determine who holds the mutex is as follows:
In this script, the rtnl_mutex lock is a global lock whose address can be exposed via /proc/kallsyms – using bpftrace helper function kaddr(), we can access the struct mutex pointer from the kallsyms. Thus, we can periodically (via interval:s:10) check if someone is holding this lock.
In the output we had this:
rtnl_mutex->owner = 3895365 calico-node
This allowed us to quickly identify calico-node as the process holding the RTNL lock for too long. To quickly observe where this process itself is stalled, the call stack is available via /proc/3895365/stack. This showed us that the root cause was a Wireguard config change, with function wg_set_device() holding the RTNL lock, and peer_remove_after_dead() waiting too long for a napi_disable() call. We continued debugging via a tool called drgn, which is a programmable debugger that can debug a running kernel via a Python-like interactive shell. We still haven’t discovered the root cause for the Wireguard issue and have asked the upstream for help, but that is another story.
Summary: The hung task messages were the only ones which we had in the kernel log. Each stack trace of these messages was unique, but by carefully analyzing them, we could spot similarities and continue debugging with other instruments.
Epilogue
Your system might have different hung task warnings, and we have many others not mentioned here. Each case is unique, and there is no standard approach to debug them. But hopefully this blog post helps you better understand why it’s good to have these warnings enabled, how they work, and what the meaning is behind them. We tried to provide some navigation guidance for the debugging process as well:
analyzing the stack trace might be a good starting point for debugging it, even if all the messages look unrelated, like we saw in example #3
keep in mind that the alert might be misleading, pointing to the victim and not the offender, as we saw in example #2 and example #3
if the kernel doesn’t schedule your application on the CPU, puts it in the D state, and emits the warning – the real problem might exist in the application code
Good luck with your debugging, and hopefully this material will help you on this journey!
Netflix operates a highly efficient cloud computing infrastructure that supports a wide array of applications essential for our SVOD (Subscription Video on Demand), live streaming and gaming services. Utilizing Amazon AWS, our infrastructure is hosted across multiple geographic regions worldwide. This global distribution allows our applications to deliver content more effectively by serving traffic closer to our customers. Like any distributed system, our applications occasionally require data synchronization between regions to maintain seamless service delivery.
The following diagram shows a simplified cloud network topology for cross-region traffic.
The Problem At First Glance
Our Cloud Network Engineering on-call team received a request to address a network issue affecting an application with cross-region traffic. Initially, it appeared that the application was experiencing timeouts, likely due to suboptimal network performance. As we all know, the longer the network path, the more devices the packets traverse, increasing the likelihood of issues. For this incident, the client application is located in an internal subnet in the US region while the server application is located in an external subnet in a European region. Therefore, it is natural to blame the network since packets need to travel long distances through the internet.
As network engineers, our initial reaction when the network is blamed is typically, “No, it can’t be the network,” and our task is to prove it. Given that there were no recent changes to the network infrastructure and no reported AWS issues impacting other applications, the on-call engineer suspected a noisy neighbor issue and sought assistance from the Host Network Engineering team.
Blame the Neighbors
In this context, a noisy neighbor issue occurs when a container shares a host with other network-intensive containers. These noisy neighbors consume excessive network resources, causing other containers on the same host to suffer from degraded network performance. Despite each container having bandwidth limitations, oversubscription can still lead to such issues.
Upon investigating other containers on the same host — most of which were part of the same application — we quickly eliminated the possibility of noisy neighbors. The network throughput for both the problematic container and all others was significantly below the set bandwidth limits. We attempted to resolve the issue by removing these bandwidth limits, allowing the application to utilize as much bandwidth as necessary. However, the problem persisted.
Blame the Network
We observed some TCP packets in the network marked with the RST flag, a flag indicating that a connection should be immediately terminated. Although the frequency of these packets was not alarmingly high, the presence of any RST packets still raised suspicion on the network. To determine whether this was indeed a network-induced issue, we conducted a tcpdump on the client. In the packet capture file, we spotted one TCP stream that was closed after exactly 30 seconds.
SYN at 18:47:06
After the 3-way handshake (SYN,SYN-ACK,ACK), the traffic started flowing normally. Nothing strange until FIN at 18:47:36 (30 seconds later)
The packet capture results clearly indicated that it was the client application that initiated the connection termination by sending a FIN packet. Following this, the server continued to send data; however, since the client had already decided to close the connection, it responded with RST packets to all subsequent data from the server.
To ensure that the client wasn’t closing the connection due to packet loss, we also conducted a packet capture on the server side to verify that all packets sent by the server were received. This task was complicated by the fact that the packets passed through a NAT gateway (NGW), which meant that on the server side, the client’s IP and port appeared as those of the NGW, differing from those seen on the client side. Consequently, to accurately match TCP streams, we needed to identify the TCP stream on the client side, locate the raw TCP sequence number, and then use this number as a filter on the server side to find the corresponding TCP stream.
With packet capture results from both the client and server sides, we confirmed that all packets sent by the server were correctly received before the client sent a FIN.
Now, from the network point of view, the story is clear. The client initiated the connection requesting data from the server. The server kept sending data to the client with no problem. However, at a certain point, despite the server still having data to send, the client chose to terminate the reception of data. This led us to suspect that the issue might be related to the client application itself.
Blame the Application
In order to fully understand the problem, we now need to understand how the application works. As shown in the diagram below, the application runs in the us-east-1 region. It reads data from cross-region servers and writes the data to consumers within the same region. The client runs as containers, whereas the servers are EC2 instances.
Notably, the cross-region read was problematic while the write path was smooth. Most importantly, there is a 30-second application-level timeout for reading the data. The application (client) errors out if it fails to read an initial batch of data from the servers within 30 seconds. When we increased this timeout to 60 seconds, everything worked as expected. This explains why the client initiated a FIN — because it lost patience waiting for the server to transfer data.
Could it be that the server was updated to send data more slowly? Could it be that the client application was updated to receive data more slowly? Could it be that the data volume became too large to be completely sent out within 30 seconds? Sadly, we received negative answers for all 3 questions from the application owner. The server had been operating without changes for over a year, there were no significant updates in the latest rollout of the client, and the data volume had remained consistent.
Blame the Kernel
If both the network and the application weren’t changed recently, then what changed? In fact, we discovered that the issue coincided with a recent Linux kernel upgrade from version 6.5.13 to 6.6.10. To test this hypothesis, we rolled back the kernel upgrade and it did restore normal operation to the application.
Honestly speaking, at that time I didn’t believe it was a kernel bug because I assumed the TCP implementation in the kernel should be solid and stable (Spoiler alert: How wrong was I!). But we were also out of ideas from other angles.
There were about 14k commits between the good and bad kernel versions. Engineers on the team methodically and diligently bisected between the two versions. When the bisecting was narrowed to a couple of commits, a change with “tcp” in its commit message caught our attention. The final bisecting confirmed that this commit was our culprit.
Interestingly, while reviewing the email history related to this commit, we found that another user had reported a Python test failure following the same kernel upgrade. Although their solution was not directly applicable to our situation, it suggested that a simpler test might also reproduce our problem. Using strace, we observed that the application configured the following socket options when communicating with the server:
We then developed a minimal client-server C application that transfers a file from the server to the client, with the client configuring the same set of socket options. During testing, we used a 10M file, which represents the volume of data typically transferred within 30 seconds before the client issues a FIN. On the old kernel, this cross-region transfer completed in 22 seconds, whereas on the new kernel, it took 39 seconds to finish.
The Root Cause
With the help of the minimal reproduction setup, we were ultimately able to pinpoint the root cause of the problem. In order to understand the root cause, it’s essential to have a grasp of the TCP receive window.
TCP Receive Window
Simply put, the TCP receive window is how the receiver tells the sender “This is how many bytes you can send me without me ACKing any of them”. Assuming the sender is the server and the receiver is the client, then we have:
The Window Size
Now that we know the TCP receive window size could affect the throughput, the question is, how is the window size calculated? As an application writer, you can’t decide the window size, however, you can decide how much memory you want to use for buffering received data. This is configured using SO_RCVBUF socket option we saw in the strace result above. However, note that the value of this option means how much application data can be queued in the receive buffer. In man 7 socket, there is
SO_RCVBUF
Sets or gets the maximum socket receive buffer in bytes. The kernel doubles this value (to allow space for bookkeeping overhead) when it is set using setsockopt(2), and this doubled value is returned by getsockopt(2). The default value is set by the /proc/sys/net/core/rmem_default file, and the maximum allowed value is set by the /proc/sys/net/core/rmem_max file. The minimum (doubled) value for this option is 256.
This means, when the user gives a value X, then the kernel stores 2X in the variable sk->sk_rcvbuf. In other words, the kernel assumes that the bookkeeping overhead is as much as the actual data (i.e. 50% of the sk_rcvbuf).
sysctl_tcp_adv_win_scale
However, the assumption above may not be true because the actual overhead really depends on a lot of factors such as Maximum Transmission Unit (MTU). Therefore, the kernel provided this sysctl_tcp_adv_win_scale which you can use to tell the kernel what the actual overhead is. (I believe 99% of people also don’t know how to set this parameter correctly and I’m definitely one of them. You’re the kernel, if you don’t know the overhead, how can you expect me to know?).
Obsolete since linux-6.6 Count buffering overhead as bytes/2^tcp_adv_win_scale (if tcp_adv_win_scale > 0) or bytes-bytes/2^(-tcp_adv_win_scale), if it is <= 0.
Possible values are [-31, 31], inclusive.
Default: 1
For 99% of people, we’re just using the default value 1, which in turn means the overhead is calculated by rcvbuf/2^tcp_adv_win_scale = 1/2 * rcvbuf. This matches the assumption when setting the SO_RCVBUF value.
Let’s recap. Assume you set SO_RCVBUF to 65536, which is the value set by the application as shown in the setsockopt syscall. Then we have:
(Note, this calculation is simplified. The real calculation is more complex.)
In short, the receive window size before the kernel upgrade was 65536. With this window size, the application was able to transfer 10M data within 30 seconds.
The Change
This commit obsoleted sysctl_tcp_adv_win_scale and introduced a scaling_ratio that can more accurately calculate the overhead or window size, which is the right thing to do. With the change, the window size is now rcvbuf * scaling_ratio.
So how is scaling_ratio calculated? It is calculated using skb->len/skb->truesize where skb->len is the length of the tcp data length in an skb and truesize is the total size of the skb. This is surely a more accurate ratio based on real data rather than a hardcoded 50%. Now, here is the next question: during the TCP handshake before any data is transferred, how do we decide the initial scaling_ratio? The answer is, a magic and conservative ratio was chosen with the value being roughly 0.25.
In short, the receive window size halved after the kernel upgrade. Hence the throughput was cut in half, causing the data transfer time to double.
Naturally, you may ask, I understand that the initial window size is small, but why doesn’t the window grow when we have a more accurate ratio of the payload later (i.e. skb->len/skb->truesize)? With some debugging, we eventually found out that the scaling_ratio does get updated to a more accurate skb->len/skb->truesize, which in our case is around 0.66. However, another variable, window_clamp, is not updated accordingly. window_clamp is the maximum receive window allowed to be advertised, which is also initialized to 0.25 * rcvbuf using the initial scaling_ratio. As a result, the receive window size is capped at this value and can’t grow bigger.
The Fix
In theory, the fix is to update window_clamp along with scaling_ratio. However, in order to have a simple fix that doesn’t introduce other unexpected behaviors, our final fix was to increase the initial scaling_ratio from 25% to 50%. This will make the receive window size backward compatible with the original default sysctl_tcp_adv_win_scale.
Meanwhile, notice that the problem is not only caused by the changed kernel behavior but also by the fact that the application sets SO_RCVBUF and has a 30-second application-level timeout. In fact, the application is Kafka Connect and both settings are the default configurations (receive.buffer.bytes=64k and request.timeout.ms=30s). We also created a kafka ticket to change receive.buffer.bytes to -1 to allow Linux to auto tune the receive window.
Conclusion
This was a very interesting debugging exercise that covered many layers of Netflix’s stack and infrastructure. While it technically wasn’t the “network” to blame, this time it turned out the culprit was the software components that make up the network (i.e. the TCP implementation in the kernel).
If tackling such technical challenges excites you, consider joining our Cloud Infrastructure Engineering teams. Explore opportunities by visiting Netflix Jobs and searching for Cloud Engineering positions.
The Linux kernel is the heart of many modern production systems. It decides when any code is allowed to run and which programs/users can access which resources. It manages memory, mediates access to hardware, and does a bulk of work under the hood on behalf of programs running on top. Since the kernel is always involved in any code execution, it is in the best position to protect the system from malicious programs, enforce the desired system security policy, and provide security features for safer production environments.
In this post, we will review some Linux kernel security configurations we use at Cloudflare and how they help to block or minimize a potential system compromise.
Secure boot
When a machine (either a laptop or a server) boots, it goes through several boot stages:
Within a secure boot architecture each stage from the above diagram verifies the integrity of the next stage before passing execution to it, thus forming a so-called secure boot chain. This way “trustworthiness” is extended to every component in the boot chain, because if we verified the code integrity of a particular stage, we can trust this code to verify the integrity of the next stage.
We have previously covered how Cloudflare implements secure boot in the initial stages of the boot process. In this post, we will focus on the Linux kernel.
Secure boot is the cornerstone of any operating system security mechanism. The Linux kernel is the primary enforcer of the operating system security configuration and policy, so we have to be sure that the Linux kernel itself has not been tampered with. In our previous post about secure boot we showed how we use UEFI Secure Boot to ensure the integrity of the Linux kernel.
But what happens next? After the kernel gets executed, it may try to load additional drivers, or as they are called in the Linux world, kernel modules. And kernel module loading is not confined just to the boot process. A module can be loaded at any time during runtime — a new device being plugged in and a driver is needed, some additional extensions in the networking stack are required (for example, for fine-grained firewall rules), or just manually by the system administrator.
However, uncontrolled kernel module loading might pose a significant risk to system integrity. Unlike regular programs, which get executed as user space processes, kernel modules are pieces of code which get injected and executed directly in the Linux kernel address space. There is no separation between the code and data in different kernel modules and core kernel subsystems, so everything can access everything. This means that a rogue kernel module can completely nullify the trustworthiness of the operating system and make secure boot useless. As an example, consider a simple Debian 12 (Bookworm installation), but with SELinux configured and enforced:
ignat@dev:~$ lsb_release --all
No LSB modules are available.
Distributor ID:	Debian
Description:	Debian GNU/Linux 12 (bookworm)
Release:	12
Codename:	bookworm
ignat@dev:~$ uname -a
Linux dev 6.1.0-18-cloud-amd64 #1 SMP PREEMPT_DYNAMIC Debian 6.1.76-1 (2024-02-01) x86_64 GNU/Linux
ignat@dev:~$ sudo getenforce
Enforcing
From the above, we can see that if the kernel configuration has CONFIG_SECURITY_SELINUX_DEVELOP enabled, the structure would have a boolean variable enforcing, which controls the enforcement status of SELinux at runtime. This is exactly what the above $ sudo getenforce command returns. We can double check that the Debian kernel indeed has the configuration option enabled:
Good! Now that we have a variable in the kernel, which is responsible for some security enforcement, we can try to attack it. One problem though is the __randomize_layout attribute: since CONFIG_SECURITY_SELINUX_DISABLE is actually not set for our Debian kernel, normally enforcing would be the first member of the struct. Thus if we know where the struct is, we immediately know the position of the enforcing flag. With __randomize_layout, during kernel compilation the compiler might place members at arbitrary positions within the struct, so it is harder to create generic exploits. But arbitrary struct randomization within the kernel may introduce performance impact, so is often disabled and it is disabled for the Debian kernel:
We can also confirm the compiled position of the enforcing flag using the pahole tool and either kernel debug symbols, if available, or (on modern kernels, if enabled) in-kernel BTF information. We will use the latter:
With these two files we can build a full fledged kernel module according to the official kernel docs:
ignat@dev:~$ cd mymod/
ignat@dev:~/mymod$ ls
Kbuild  mymod.c
ignat@dev:~/mymod$ make -C /lib/modules/`uname -r`/build M=$PWD
make: Entering directory '/usr/src/linux-headers-6.1.0-18-cloud-amd64'
  CC [M]  /home/ignat/mymod/mymod.o
  MODPOST /home/ignat/mymod/Module.symvers
  CC [M]  /home/ignat/mymod/mymod.mod.o
  LD [M]  /home/ignat/mymod/mymod.ko
  BTF [M] /home/ignat/mymod/mymod.ko
Skipping BTF generation for /home/ignat/mymod/mymod.ko due to unavailability of vmlinux
make: Leaving directory '/usr/src/linux-headers-6.1.0-18-cloud-amd64'
If we try to load this module now, the system may not allow it due to the SELinux policy:
ignat@dev:~/mymod$ sudo insmod mymod.ko
insmod: ERROR: could not load module mymod.ko: Permission denied
We can workaround it by copying the module into the standard module path somewhere:
Not only did we disable the SELinux protection via a malicious kernel module, we did it quietly. Normal sudo setenforce 0, even if allowed, would go through the official selinuxfs interface and would emit an audit message. Our code manipulated the kernel memory directly, so no one was alerted. This illustrates why uncontrolled kernel module loading is very dangerous and that is why most security standards and commercial security monitoring products advocate for close monitoring of kernel module loading.
But we don’t need to monitor kernel modules at Cloudflare. Let’s repeat the exercise on a Cloudflare production kernel (module recompilation skipped for brevity):
ignat@dev:~/mymod$ uname -a
Linux dev 6.6.17-cloudflare-2024.2.9 #1 SMP PREEMPT_DYNAMIC Mon Sep 27 00:00:00 UTC 2010 x86_64 GNU/Linux
ignat@dev:~/mymod$ sudo insmod /lib/modules/`uname -r`/kernel/crypto/mymod.ko
insmod: ERROR: could not insert module /lib/modules/6.6.17-cloudflare-2024.2.9/kernel/crypto/mymod.ko: Key was rejected by service
We get a Key was rejected by service error when trying to load a module, and the kernel log will have the following message:
ignat@dev:~/mymod$ sudo dmesg | tail -n 1
[41515.037031] Loading of unsigned module is rejected
For completeness it is worth noting that the Debian stock kernel also supports module signatures, but does not enforce it:
ignat@dev:~$ grep MODULE_SIG /boot/config-6.1.0-18-cloud-amd64
CONFIG_MODULE_SIG_FORMAT=y
CONFIG_MODULE_SIG=y
# CONFIG_MODULE_SIG_FORCE is not set
…
The above configuration means that the kernel will validate a module signature, if available. But if not – the module will be loaded anyway with a warning message emitted and the kernel will be tainted.
Key management for kernel module signing
Signed kernel modules are great, but it creates a key management problem: to sign a module we need a signing keypair that is trusted by the kernel. The public key of the keypair is usually directly embedded into the kernel binary, so the kernel can easily use it to verify module signatures. The private key of the pair needs to be protected and secure, because if it is leaked, anyone could compile and sign a potentially malicious kernel module which would be accepted by our kernel.
But what is the best way to eliminate the risk of losing something? Not to have it in the first place! Luckily the kernel build system will generate a random keypair for module signing, if none is provided. At Cloudflare, we use that feature to sign all the kernel modules during the kernel compilation stage. When the compilation and signing is done though, instead of storing the key in a secure place, we just destroy the private key:
So with the above process:
The kernel build system generated a random keypair, compiles the kernel and modules
The public key is embedded into the kernel image, the private key is used to sign all the modules
The private key is destroyed
With this scheme not only do we not have to worry about module signing key management, we also use a different key for each kernel we release to production. So even if a particular build process is hijacked and the signing key is not destroyed and potentially leaked, the key will no longer be valid when a kernel update is released.
There are some flexibility downsides though, as we can’t “retrofit” a new kernel module for an already released kernel (for example, for a new piece of hardware we are adopting). However, it is not a practical limitation for us as we release kernels often (roughly every week) to keep up with a steady stream of bug fixes and vulnerability patches in the Linux Kernel.
KEXEC
KEXEC (or kexec_load()) is an interesting system call in Linux, which allows for one kernel to directly execute (or jump to) another kernel. The idea behind this is to switch/update/downgrade kernels faster without going through a full reboot cycle to minimize the potential system downtime. However, it was developed quite a while ago, when secure boot and system integrity was not quite a concern. Therefore its original design has security flaws and is known to be able to bypass secure boot and potentially compromise system integrity.
struct kexec_segment {
	const void *buf;
	size_t bufsz;
	const void *mem;
	size_t memsz;
};
...
long kexec_load(unsigned long entry, unsigned long nr_segments, struct kexec_segment *segments, unsigned long flags);
So the kernel expects just a collection of buffers with code to execute. Back in those days there was not much desire to do a lot of data parsing inside the kernel, so the idea was to parse the to-be-executed kernel image in user space and provide the kernel with only the data it needs. Also, to switch kernels live, we need an intermediate program which would take over while the old kernel is shutting down and the new kernel has not yet been executed. In the kexec world this program is called purgatory. Thus the problem is evident: we give the kernel a bunch of code and it will happily execute it at the highest privilege level. But instead of the original kernel or purgatory code, we can easily provide code similar to the one demonstrated earlier in this post, which disables SELinux (or does something else to the kernel).
At Cloudflare we have had kexec_load() disabled for some time now just because of this. The advantage of faster reboots with kexec comes with a (small) risk of improperly initialized hardware, so it was not worth using it even without the security concerns. However, kexec does provide one useful feature — it is the foundation of the Linux kernel crashdumping solution. In a nutshell, if a kernel crashes in production (due to a bug or some other error), a backup kernel (previously loaded with kexec) can take over, collect and save the memory dump for further investigation. This allows to more effectively investigate kernel and other issues in production, so it is a powerful tool to have.
Luckily, since the original problems with kexec were outlined, Linux developed an alternative secure interface for kexec: instead of buffers with code it expects file descriptors with the to-be-executed kernel image and initrd and does parsing inside the kernel. Thus, only a valid kernel image can be supplied. On top of this, we can configure and require kexec to ensure the provided images are properly signed, so only authorized code can be executed in the kexec scenario. A secure configuration for kexec looks something like this:
ignat@dev:~$ grep KEXEC /boot/config-`uname -r`
CONFIG_KEXEC_CORE=y
CONFIG_HAVE_IMA_KEXEC=y
# CONFIG_KEXEC is not set
CONFIG_KEXEC_FILE=y
CONFIG_KEXEC_SIG=y
CONFIG_KEXEC_SIG_FORCE=y
CONFIG_KEXEC_BZIMAGE_VERIFY_SIG=y
…
Above we ensure that the legacy kexec_load() system call is disabled by disabling CONFIG_KEXEC, but still can configure Linux Kernel crashdumping via the new kexec_file_load() system call via CONFIG_KEXEC_FILE=y with enforced signature checks (CONFIG_KEXEC_SIG=y and CONFIG_KEXEC_SIG_FORCE=y).
Note that stock Debian kernel has the legacy kexec_load() system call enabled and does not enforce signature checks for kexec_file_load() (similar to module signature checks):
ignat@dev:~$ grep KEXEC /boot/config-6.1.0-18-cloud-amd64
CONFIG_KEXEC=y
CONFIG_KEXEC_FILE=y
CONFIG_ARCH_HAS_KEXEC_PURGATORY=y
CONFIG_KEXEC_SIG=y
# CONFIG_KEXEC_SIG_FORCE is not set
CONFIG_KEXEC_BZIMAGE_VERIFY_SIG=y
…
Kernel Address Space Layout Randomization (KASLR)
Even on the stock Debian kernel if you try to repeat the exercise we described in the “Secure boot” section of this post after a system reboot, you will likely see it would fail to disable SELinux now. This is because we hardcoded the kernel address of the selinux_state structure in our malicious kernel module, but the address changed now:
ignat@dev:~$ sudo grep selinux_state /proc/kallsyms
ffffffffb41bcae0 B selinux_state
This is to combat targeted exploitation (like the malicious module in this post) based on the knowledge of the location of internal kernel structures and code. It is especially useful for popular Linux distribution kernels, like the Debian one, because most users use the same binary and anyone can download the debug symbols and the System.map file with all the addresses of the kernel internals. Just to note: it will not prevent the module loading and doing harm, but it will likely not achieve the targeted effect of disabling SELinux. Instead, it will modify a random piece of kernel memory potentially causing the kernel to crash.
Both the Cloudflare kernel and the Debian one have this feature enabled:
While KASLR helps with targeted exploits, it is quite easy to bypass since everything is shifted by a single random offset as shown on the diagram above. Thus if the attacker knows at least one runtime kernel address, they can recover this offset by subtracting the runtime address from the compile time address of the same symbol (function or data structure) from the kernel’s System.map file. Once they know the offset, they can recover the addresses of all other symbols by adjusting them by this offset.
Therefore, modern kernels take precautions not to leak kernel addresses at least to unprivileged users. One of the main tunables for this is the kptr_restrict sysctl. It is a good idea to set it at least to 1 to not allow regular users to see kernel pointers:
(shell/bash)
ignat@dev:~$ sudo grep selinux_state /proc/kallsyms
ffffffffb41bcae0 B selinux_state
Similar to kptr_restrict sysctl there is also dmesg_restrict, which if set, would prevent regular users from reading the kernel log (which may also leak kernel pointers via its messages). While you need to explicitly set kptr_restrict sysctl to a non-zero value on each boot (or use some system sysctl configuration utility, like this one), you can configure dmesg_restrict initial value via the CONFIG_SECURITY_DMESG_RESTRICT kernel configuration option. Both the Cloudflare kernel and the Debian one enforce dmesg_restrict this way:
Worth noting that /proc/kallsyms and the kernel log are not the only sources of potential kernel pointer leaks. There is a lot of legacy in the Linux kernel and [new sources are continuously being found and patched]. That’s why it is very important to stay up to date with the latest kernel bugfix releases.
Lockdown LSM
Linux Security Modules (LSM) is a hook-based framework for implementing security policies and Mandatory Access Control in the Linux Kernel. We have [covered our usage of another LSM module, BPF-LSM, previously].
BPF-LSM is a useful foundational piece for our kernel security, but in this post we want to mention another useful LSM module we use — the Lockdown LSM. Lockdown can be in three states (controlled by the /sys/kernel/security/lockdown special file):
none is the state where nothing is enforced and the module is effectively disabled. When Lockdown is in the integrity state, the kernel tries to prevent any operation, which may compromise its integrity. We already covered some examples of these in this post: loading unsigned modules and executing unsigned code via KEXEC. But there are other potential ways (which are mentioned in the LSM’s man page), all of which this LSM tries to block. confidentiality is the most restrictive mode, where Lockdown will also try to prevent any information leakage from the kernel. In practice this may be too restrictive for server workloads as it blocks all runtime debugging capabilities, like perf or eBPF.
Let’s see the Lockdown LSM in action. On a barebones Debian system the initial state is none meaning nothing is locked down:
ignat@dev:~$ uname -a
Linux dev 6.1.0-18-cloud-amd64 #1 SMP PREEMPT_DYNAMIC Debian 6.1.76-1 (2024-02-01) x86_64 GNU/Linux
ignat@dev:~$ cat /sys/kernel/security/lockdown
[none] integrity confidentiality
It is worth noting that we can only put the system into a more restrictive state, but not back. That is, once in integrity mode we can only switch to confidentiality mode, but not back to none:
ignat@dev:~$ echo none | sudo tee /sys/kernel/security/lockdown
none
tee: /sys/kernel/security/lockdown: Operation not permitted
Now we can see that even on a stock Debian kernel, which as we discovered above, does not enforce module signatures by default, we cannot load a potentially malicious unsigned kernel module anymore:
ignat@dev:~$ sudo insmod mymod/mymod.ko
insmod: ERROR: could not insert module mymod/mymod.ko: Operation not permitted
And the kernel log will helpfully point out that this is due to Lockdown LSM:
ignat@dev:~$ sudo dmesg | tail -n 1
[21728.820129] Lockdown: insmod: unsigned module loading is restricted; see man kernel_lockdown.7
As we can see, Lockdown LSM helps to tighten the security of a kernel, which otherwise may not have other enforcing bits enabled, like the stock Debian one.
ignat@dev:~$ grep LOCK_DOWN /boot/config-6.6.17-cloudflare-2024.2.9
# CONFIG_LOCK_DOWN_KERNEL_FORCE_NONE is not set
CONFIG_LOCK_DOWN_KERNEL_FORCE_INTEGRITY=y
# CONFIG_LOCK_DOWN_KERNEL_FORCE_CONFIDENTIALITY is not set
Conclusion
In this post we reviewed some useful Linux kernel security configuration options we use at Cloudflare. This is only a small subset, and there are many more available and even more are being constantly developed, reviewed, and improved by the Linux kernel community. We hope that this post will shed some light on these security features and that, if you haven’t already, you may consider enabling them in your Linux systems.
Watch on Cloudflare TV
Tune in for more news, announcements and thought-provoking discussions! Don’t miss the full Security Week hub page.
Have you noticed how simple questions sometimes lead to complex answers? Today we will tackle one such question. Category: our favorite – Linux networking.
When can two TCP sockets share a local address?
If I navigate to https://blog.cloudflare.com/, my browser will connect to a remote TCP address, might be 104.16.132.229:443 in this case, from the local IP address assigned to my Linux machine, and a randomly chosen local TCP port, say 192.0.2.42:54321. What happens if I then decide to head to a different site? Is it possible to establish another TCP connection from the same local IP address and port?
To find the answer let’s do a bit of learning by discovering. We have prepared eight quiz questions. Each will let you discover one aspect of the rules that govern local address sharing between TCP sockets under Linux. Fair warning, it might get a bit mind-boggling.
Questions are split into two groups by test scenario:
In the first test scenario, two sockets connect from the same local port to the same remote IP and port. However, the local IP is different for each socket.
While, in the second scenario, the local IP and port is the same for all sockets, but the remote address, or actually just the IP address, differs.
In our quiz questions, we will either:
let the OS automatically select the the local IP and/or port for the socket, or
Because we will be examining corner cases in the bind() logic, we need a way to exhaust available local addresses, that is (IP, port) pairs. We could just create lots of sockets, but it will be easier to tweak the system configuration and pretend that there is just one ephemeral local port, which the OS can assign to sockets:
Each quiz question is a short Python snippet. Your task is to predict the outcome of running the code. Does it succeed? Does it fail? If so, what fails? Asking ChatGPT is not allowed 😉
There is always a common setup procedure to keep in mind. We will omit it from the quiz snippets to keep them short:
from os import system
from socket import *

# Missing constants
IP_BIND_ADDRESS_NO_PORT = 24

# Our network namespace has just *one* ephemeral port
system("sysctl -w net.ipv4.ip_local_port_range='60000 60000'")

# Open a listening socket at *:1234. We will connect to it.
ln = socket(AF_INET, SOCK_STREAM)
ln.bind(("", 1234))
ln.listen(SOMAXCONN)
With the formalities out of the way, let us begin. Ready. Set. Go!
Scenario #1: When the local IP is unique, but the local port is the same
In Scenario #1 we connect two sockets to the same remote address – 127.9.9.9:1234. The sockets will use different local IP addresses, but is it enough to share the local port?
local IP
local port
remote IP
remote port
unique
same
same
same
127.0.0.1 127.1.1.1 127.2.2.2
60_000
127.9.9.9
1234
Quiz #1
On the local side, we bind two sockets to distinct, explicitly specified IP addresses. We will allow the OS to select the local port. Remember: our local ephemeral port range contains just one port (60,000).
Here, the setup is almost identical as before. However, we ask the OS to select the local IP address and port for the first socket. Do you think the result will differ from the previous question?
This quiz question is just like the one above. We just changed the ordering. First, we connect a socket from an explicitly specified local address. Then we ask the system to select a local address for us. Obviously, such an ordering change should not make any difference, right?
Scenario #2: When the local IP and port are the same, but the remote IP differs
In Scenario #2 we reverse our setup. Instead of multiple local IP’s and one remote address, we now have one local address 127.0.0.1:60000 and two distinct remote addresses. The question remains the same – can two sockets share the local port? Reminder: ephemeral port range is still of size one.
local IP
local port
remote IP
remote port
same
same
unique
same
127.0.0.1
60_000
127.8.8.8 127.9.9.9
1234
Quiz #4
Let’s start from the basics. We connect() to two distinct remote addresses. This is a warm up 🙂
Just when you thought it couldn’t get any weirder, we add SO_REUSEADDR into the mix.
First, we ask the OS to allocate a local address for us. Then we explicitly bind to the same local address, which we know the OS must have assigned to the first socket. We enable local address reuse for both sockets. Is this allowed?
Is it all clear now? Well, probably no. It feels like reverse engineering a black box. So what is happening behind the scenes? Let’s take a look.
Linux tracks all TCP ports in use in a hash table named bhash. Not to be confused with with ehash table, which tracks sockets with both local and remote address already assigned.
Each hash table entry points to a chain of so-called bind buckets, which group together sockets which share a local port. To be precise, sockets are grouped into buckets by:
But in the simplest possible setup – single network namespace, no VRFs – we can say that sockets in a bind bucket are grouped by their local port number.
The set of sockets in each bind bucket, that is sharing a local port, is backed by a linked list named owners.
When we ask the kernel to assign a local address to a socket, its task is to check for a conflict with any existing socket. That is because a local port number can be shared only under some conditions:
/* There are a few simple rules, which allow for local port reuse by
 * an application.  In essence:
 *
 *   1) Sockets bound to different interfaces may share a local port.
 *      Failing that, goto test 2.
 *   2) If all sockets have sk->sk_reuse set, and none of them are in
 *      TCP_LISTEN state, the port may be shared.
 *      Failing that, goto test 3.
 *   3) If all sockets are bound to a specific inet_sk(sk)->rcv_saddr local
 *      address, and none of them are the same, the port may be
 *      shared.
 *      Failing this, the port cannot be shared.
 *
 * The interesting point, is test #2.  This is what an FTP server does
 * all day.  To optimize this case we use a specific flag bit defined
 * below.  As we add sockets to a bind bucket list, we perform a
 * check of: (newsk->sk_reuse && (newsk->sk_state != TCP_LISTEN))
 * As long as all sockets added to a bind bucket pass this test,
 * the flag bit will be set.
 * ...
 */
The comment above hints that the kernel tries to optimize for the happy case of no conflict. To this end the bind bucket holds additional state which aggregates the properties of the sockets it holds:
Let’s focus our attention just on the first aggregate property – fastreuse. It has existed since, now prehistoric, Linux 2.1.90pre1. Initially in the form of a bit flag, as the comment says, only to evolve to a byte-sized field over time.
The other six fields came on much later with the introduction of SO_REUSEPORT in Linux 3.9. Because they play a role only when there are sockets with the SO_REUSEPORT flag set. We are going to ignore them today.
Whenever the Linux kernel needs to bind a socket to a local port, it first has to look for the bind bucket for that port. What makes life a bit more complicated is the fact that the search for a TCP bind bucket exists in two places in the kernel. The bind bucket lookup can happen early – at bind() time – or late – at connect() – time. Which one gets called depends on how the connected socket has been set up:
However, whether we land in inet_csk_get_port or __inet_hash_connect, we always end up walking the bucket chain in the bhash looking for the bucket with a matching port number. The bucket might already exist or we might have to create it first. But once it exists, its fastreuse field is in one of three possible states: -1, 0, or +1. As if Linux developers were inspired by quantum mechanics.
That state reflects two aspects of the bind bucket:
What sockets are in the bucket?
When can the local port be shared?
So let us try to decipher the three possible fastreuse states then, and what they mean in each case.
First, what does the fastreuse property say about the owners of the bucket, that is the sockets using that local port?
fastreuse is
owners list contains
-1
sockets connect()’ed from an ephemeral port
0
sockets bound without SO_REUSEADDR
+1
sockets bound with SO_REUSEADDR
While this is not the whole truth, it is close enough for now. We will soon get to the bottom of it.
When it comes port sharing, the situation is far less straightforward:
yes IFF local IP is unique OR conflicting socket uses SO_REUSEADDR ①
← idem
yes ②
connect() from the same ephemeral port to the same remote (IP, port)
yes IFF local IP unique ③
no ③
no ③
connect() from the same ephemeral port to a unique remote (IP, port)
yes ③
no ③
no ③
① Determined by inet_csk_bind_conflict() called from inet_csk_get_port() (specific port bind) or inet_csk_get_port() → inet_csk_find_open_port() (ephemeral port bind).
③ Because inet_hash_connect() → __inet_hash_connect()skips buckets with fastreuse != -1.
While it all looks rather complicated at first sight, we can distill the table above into a few statements that hold true, and are a bit easier to digest:
bind(), or early local address allocation, always succeeds if there is no local IP address conflict with any existing socket,
connect(), or late local address allocation, always fails when TCP bind bucket for a local port is in any state other than fastreuse = -1,
connect() only succeeds if there is no local and remote address conflict,
SO_REUSEADDR socket option allows local address sharing, if all conflicting sockets also use it (and none of them is in the listening state).
This is crazy. I don’t believe you.
Fortunately, you don’t have to. With drgn, the programmable debugger, we can examine the bind bucket state on a live kernel:
#!/usr/bin/env drgn

"""
dump_bhash.py - List all TCP bind buckets in the current netns.

Script is not aware of VRF.
"""

import os

from drgn.helpers.linux.list import hlist_for_each, hlist_for_each_entry
from drgn.helpers.linux.net import get_net_ns_by_fd
from drgn.helpers.linux.pid import find_task


def dump_bind_bucket(head, net):
    for tb in hlist_for_each_entry("struct inet_bind_bucket", head, "node"):
        # Skip buckets not from this netns
        if tb.ib_net.net != net:
            continue

        port = tb.port.value_()
        fastreuse = tb.fastreuse.value_()
        owners_len = len(list(hlist_for_each(tb.owners)))

        print(
            "{:8d}  {:{sign}9d}  {:7d}".format(
                port,
                fastreuse,
                owners_len,
                sign="+" if fastreuse != 0 else " ",
            )
        )


def get_netns():
    pid = os.getpid()
    task = find_task(prog, pid)
    with open(f"/proc/{pid}/ns/net") as f:
        return get_net_ns_by_fd(task, f.fileno())


def main():
    print("{:8}  {:9}  {:7}".format("TCP-PORT", "FASTREUSE", "#OWNERS"))

    tcp_hashinfo = prog.object("tcp_hashinfo")
    net = get_netns()

    # Iterate over all bhash slots
    for i in range(0, tcp_hashinfo.bhash_size):
        head = tcp_hashinfo.bhash[i].chain
        # Iterate over bind buckets in the slot
        dump_bind_bucket(head, net)


main()
Let’s take this script for a spin and try to confirm what Table 1 claims to be true. Keep in mind that to produce the ipython --classic session snippets below I’ve used the same setup as for the quiz questions.
Two connected sockets sharing ephemeral port 60,000:
With such tooling, proving that Table 2 holds true is just a matter of writing a bunch of exploratory tests.
But what has happened in that last snippet? The bind bucket has clearly transitioned from one fastreuse state to another. This is what Table 1 fails to capture. And it means that we still don’t have the full picture.
We have yet to find out when the bucket’s fastreuse state can change. This calls for a state machine.
Das State Machine
As we have just seen, a bind bucket does not need to stay in the initial fastreuse state throughout its lifetime. Adding sockets to the bucket can trigger a state change. As it turns out, it can only transition into fastreuse = 0, if we happen to bind() a socket that:
Now that we have the full picture, this begs the question…
Why are you telling me all this?
Firstly, so that the next time bind() syscall rejects your request with EADDRINUSE, or connect() refuses to cooperate by throwing the EADDRNOTAVAIL error, you will know what is happening, or at least have the tools to find out.
Secondly, because we have previously advertised a technique for opening connections from a specific range of ports which involves bind()’ing sockets with the SO_REUSEADDR option. What we did not realize back then, is that there exists a corner case when the same port can’t be shared with the regular, connect()‘ed sockets. While that is not a deal-breaker, it is good to understand the consequences.
To make things better, we have worked with the Linux community to extend the kernel API with a new socket option that lets the user specify the local port range. The new option will be available in the upcoming Linux 6.3. With it we no longer have to resort to bind()-tricks. This makes it possible to yet again share a local port with regular connect()‘ed sockets.
Closing thoughts
Today we posed a relatively straightforward question – when can two TCP sockets share a local address? – and worked our way towards an answer. An answer that is too complex to compress it into a single sentence. What is more, it’s not even the full answer. After all, we have decided to ignore the existence of the SO_REUSEPORT feature, and did not consider conflicts with TCP listening sockets.
If there is a simple takeaway, though, it is that bind()’ing a socket can have tricky consequences. When using bind() to select an egress IP address, it is best to combine it with IP_BIND_ADDRESS_NO_PORT socket option, and leave the port assignment to the kernel. Otherwise we might unintentionally block local TCP ports from being reused.
It is too bad that the same advice does not apply to UDP, where IP_BIND_ADDRESS_NO_PORT does not really work today. But that is another story.
Until next time 🖖.
If you enjoy scratching your head while reading the Linux kernel source code, we are hiring.
We want our digital data to be safe. We want to visit websites, send bank details, type passwords, sign documents online, login into remote computers, encrypt data before storing it in databases and be sure that nobody can tamper with it. Cryptography can provide a high degree of data security, but we need to protect cryptographic keys.
At the same time, we can’t have our key written somewhere securely and just access it occasionally. Quite the opposite, it’s involved in every request where we do crypto-operations. If a site supports TLS, then the private key is used to establish each connection.
Unfortunately cryptographic keys sometimes leak and when it happens, it is a big problem. Many leaks happen because of software bugs and security vulnerabilities. In this post we will learn how the Linux kernel can help protect cryptographic keys from a whole class of potential security vulnerabilities: memory access violations.
Memory access violations
According to the NSA, around 70% of vulnerabilities in both Microsoft’s and Google’s code were related to memory safety issues. One of the consequences of incorrect memory accesses is leaking security data (including cryptographic keys). Cryptographic keys are just some (mostly random) data stored in memory, so they may be subject to memory leaks like any other in-memory data. The below example shows how a cryptographic key may accidentally leak via stack memory reuse:
broken.c
#include <stdio.h>
#include <stdint.h>

static void encrypt(void)
{
    uint8_t key[] = "hunter2";
    printf("encrypting with super secret key: %s\n", key);
}

static void log_completion(void)
{
    /* oh no, we forgot to init the msg */
    char msg[8];
    printf("not important, just fyi: %s\n", msg);
}

int main(void)
{
    encrypt();
    /* notify that we're done */
    log_completion();
    return 0;
}
Compile and run our program:
$ gcc -o broken broken.c
$ ./broken
encrypting with super secret key: hunter2
not important, just fyi: hunter2
Oops, we printed the secret key in the “fyi” logger instead of the intended log message! There are two problems with the code above:
we didn’t securely destroy the key in our pseudo-encryption function (by overwriting the key data with zeroes, for example), when we finished using it
our buggy logging function has access to any memory within our process
And while we can probably easily fix the first problem with some additional code, the second problem is the inherent result of how software runs inside the operating system.
Each process is given a block of contiguous virtual memory by the operating system. It allows the kernel to share limited computer resources among several simultaneously running processes. This approach is called virtual memory management. Inside the virtual memory a process has its own address space and doesn’t have access to the memory of other processes, but it can access any memory within its address space. In our example we are interested in a piece of process memory called the stack.
The stack consists of stack frames. A stack frame is dynamically allocated space for the currently running function. It contains the function’s local variables, arguments and return address. When compiling a function the compiler calculates how much memory needs to be allocated and requests a stack frame of this size. Once a function finishes execution the stack frame is marked as free and can be used again. A stack frame is a logical block, it doesn’t provide any boundary checks, it’s not erased, just marked as free. Additionally, the virtual memory is a contiguous block of addresses. Both of these statements give the possibility for malware/buggy code to access data from anywhere within virtual memory.
The stack of our program broken.c will look like:
At the beginning we have a stack frame of the main function. Further, the main() function calls encrypt() which will be placed on the stack immediately below the main() (the code stack grows downwards). Inside encrypt() the compiler requests 8 bytes for the key variable (7 bytes of data + C-null character). When encrypt() finishes execution, the same memory addresses are taken by log_completion(). Inside the log_completion() the compiler allocates eight bytes for the msg variable. Accidentally, it was put on the stack at the same place where our private key was stored before. The memory for msg was only allocated, but not initialized, the data from the previous function left as is.
Additionally, to the code bugs, programming languages provide unsafe functions known for the safe-memory vulnerabilities. For example, for C such functions are printf(), strcpy(), gets(). The function printf() doesn’t check how many arguments must be passed to replace all placeholders in the format string. The function arguments are placed on the stack above the function stack frame, printf() fetches arguments according to the numbers and type of placeholders, easily going off its arguments and accessing data from the stack frame of the previous function.
The NSA advises us to use safety-memory languages like Python, Go, Rust. But will it completely protect us?
The Python compiler will definitely check boundaries in many cases for you and notify with an error:
>>> print("x: {}, y: {}, {}".format(1, 2))
Traceback (most recent call last):
  File "<stdin>", line 1, in <module>
IndexError: Replacement index 2 out of range for positional args tuple
However, this is a quote from one of 36 (for now) vulnerabilities:
Python 2.7.14 is vulnerable to a Heap-Buffer-Overflow as well as a Heap-Use-After-Free.
Golang has its own list of overflow vulnerabilities, and has an unsafe package. The name of the package speaks for itself, usual rules and checks don’t work inside this package.
Heartbleed
In 2014, the Heartbleed bug was discovered. The (at the time) most used cryptography library OpenSSL leaked private keys. We experienced it too.
Mitigation
So memory bugs are a fact of life, and we can’t really fully protect ourselves from them. But, given the fact that cryptographic keys are much more valuable than the other data, can we do better protecting the keys at least?
As we already said, a memory address space is normally associated with a process. And two different processes don’t share memory by default, so are naturally isolated from each other. Therefore, a potential memory bug in one of the processes will not accidentally leak a cryptographic key from another process. The security of ssh-agent builds on this principle. There are always two processes involved: a client/requester and the agent.
The agent will never send a private key over its request channel. Instead, operations that require a private key will be performed by the agent, and the result will be returned to the requester. This way, private keys are not exposed to clients using the agent.
A requester is usually a network-facing process and/or processing untrusted input. Therefore, the requester is much more likely to be susceptible to memory-related vulnerabilities but in this scheme it would never have access to cryptographic keys (because keys reside in a separate process address space) and, thus, can never leak them.
At Cloudflare, we employ the same principle in Keyless SSL. Customer private keys are stored in an isolated environment and protected from Internet-facing connections.
Linux Kernel Key Retention Service
The client/requester and agent approach provides better protection for secrets or cryptographic keys, but it brings some drawbacks:
we need to develop and maintain two different programs instead of one
we also need to design a well-defined-interface for communication between the two processes
we need to implement the communication support between two processes (Unix sockets, shared memory, etc.)
we might need to authenticate and support ACLs between the processes, as we don’t want any requester on our system to be able to use our cryptographic keys stored inside the agent
we need to ensure the agent process is up and running, when working with the client/requester process
What if we replace the agent process with the Linux kernel itself?
it is already running on our system (otherwise our software would not work)
it has a well-defined interface for communication (system calls)
Initially it was designed for kernel services like dm-crypt/ecryptfs, but later was opened to use by userspace programs. It gives us some advantages:
the keys are stored outside the process address space
the well-defined-interface and the communication layer is implemented via syscalls
the keys are kernel objects and so have associated permissions and ACLs
the keys lifecycle can be implicitly bound to the process lifecycle
The Linux Kernel Key Retention Service operates with two types of entities: keys and keyrings, where a keyring is a key of a special type. If we put it into analogy with files and directories, we can say a key is a file and a keyring is a directory. Moreover, they represent a key hierarchy similar to a filesystem tree hierarchy: keyrings reference keys and other keyrings, but only keys can hold the actual cryptographic material similar to files holding the actual data.
Keys have types. The type of key determines which operations can be performed over the keys. For example, keys of user and logon types can hold arbitrary blobs of data, but logon keys can never be read back into userspace, they are exclusively used by the in-kernel services.
For the purposes of using the kernel instead of an agent process the most interesting type of keys is the asymmetric type. It can hold a private key inside the kernel and provides the ability for the allowed applications to either decrypt or sign some data with the key. Currently, only RSA keys are supported, but work is underway to add ECDSA key support.
While keys are responsible for safeguarding the cryptographic material inside the kernel, keyrings determine key lifetime and shared access. In its simplest form, when a particular keyring is destroyed, all the keys that are linked only to that keyring are securely destroyed as well. We can create custom keyrings manually, but probably one the most powerful features of the service are the “special keyrings”.
These keyrings are created implicitly by the kernel and their lifetime is bound to the lifetime of a different kernel object, like a process or a user. (Currently there are four categories of “implicit” keyrings), but for the purposes of this post we’re interested in two most widely used ones: process keyrings and user keyrings.
User keyring lifetime is bound to the existence of a particular user and this keyring is shared between all the processes of the same UID. Thus, one process, for example, can store a key in a user keyring and another process running as the same user can retrieve/use the key. When the UID is removed from the system, all the keys (and other keyrings) under the associated user keyring will be securely destroyed by the kernel.
Process keyrings are bound to some processes and may be of three types differing in semantics: process, thread and session. A process keyring is bound and private to a particular process. Thus, any code within the process can store/use keys in the keyring, but other processes (even with the same user id or child processes) cannot get access. And when the process dies, the keyring and the associated keys are securely destroyed. Besides the advantage of storing our secrets/keys in an isolated address space, the process keyring gives us the guarantee that the keys will be destroyed regardless of the reason for the process termination: even if our application crashed hard without being given an opportunity to execute any clean up code – our keys will still be securely destroyed by the kernel.
A thread keyring is similar to a process keyring, but it is private and bound to a particular thread. For example, we can build a multithreaded web server, which can serve TLS connections using multiple private keys, and we can be sure that connections/code in one thread can never use a private key, which is associated with another thread (for example, serving a different domain name).
A session keyring makes its keys available to the current process and all its children. It is destroyed when the topmost process terminates and child processes can store/access keys, while the topmost process exists. It is mostly useful in shell and interactive environments, when we employ the keyctl tool to access the Linux Kernel Key Retention Service, rather than using the kernel system call interface. In the shell, we generally can’t use the process keyring as every executed command creates a new process. Thus, if we add a key to the process keyring from the command line – that key will be immediately destroyed, because the “adding” process terminates, when the command finishes executing. Let’s actually confirm this with bpftrace.
In one terminal we will trace the user_destroy function, which is responsible for deleting a user key:
And in another terminal let’s try to add a key to the process keyring:
$ keyctl add user mykey hunter2 @p
742524855
Going back to the first terminal we can immediately see:
…
Attaching 1 probe...
destroying key 742524855
And we can confirm the key is not available by trying to access it:
$ keyctl print 742524855
keyctl_read_alloc: Required key not available
So in the above example, the key “mykey” was added to the process keyring of the subshell executing keyctl add user mykey hunter2 @p. But since the subshell process terminated the moment the command was executed, both its process keyring and the added key were destroyed.
Instead, the session keyring allows our interactive commands to add keys to our current shell environment and subsequent commands to consume them. The keys will still be securely destroyed, when our main shell process terminates (likely, when we log out from the system).
So by selecting the appropriate keyring type we can ensure the keys will be securely destroyed, when not needed. Even if the application crashes! This is a very brief introduction, but it will allow you to play with our examples, for the whole context, please, reach the official documentation.
Replacing the ssh-agent with the Linux Kernel Key Retention Service
We gave a long description of how we can replace two isolated processes with the Linux Kernel Retention Service. It’s time to put our words into code. We talked about ssh-agent as well, so it will be a good exercise to replace our private key stored in memory of the agent with an in-kernel one. We picked the most popular SSH implementation OpenSSH as our target.
Some minor changes need to be added to the code to add functionality to retrieve a key from the kernel:
$ autoreconf
$ ./configure --with-libs=-lkeyutils --disable-pkcs11
…
$ make
…
Note that we instruct the build system to additionally link with libkeyutils, which provides convenient wrappers to access the Linux Kernel Key Retention Service. Additionally, we had to disable PKCS11 support as the code has a function with the same name as in `libkeyutils`, so there is a naming conflict. There might be a better fix for this, but it is out of scope for this post.
Now that we have the patched OpenSSH – let’s test it. Firstly, we need to generate a new SSH RSA key that we will use to access the system. Because the Linux kernel only supports private keys in the PKCS8 format, we’ll use it from the start (instead of the default OpenSSH format):
Normally, we would be using `ssh-add` to add this key to our ssh agent. In our case we need to use a replacement script, which would add the key to our current session keyring:
ssh-add-keyring.sh
#/bin/bash -e

in=$1
key_desc=$2
keyring=$3

in_pub=$in.pub
key=$(mktemp)
out="${in}_keyring"

function finish {
    rm -rf $key
}
trap finish EXIT

# https://github.com/openssh/openssh-portable/blob/master/PROTOCOL.key
# null-terminanted openssh-key-v1
printf 'openssh-key-v1\0' > $key
# cipher: none
echo '00000004' | xxd -r -p >> $key
echo -n 'none' >> $key
# kdf: none
echo '00000004' | xxd -r -p >> $key
echo -n 'none' >> $key
# no kdf options
echo '00000000' | xxd -r -p >> $key
# one key in the blob
echo '00000001' | xxd -r -p >> $key

# grab the hex public key without the (00000007 || ssh-rsa) preamble
pub_key=$(awk '{ print $2 }' $in_pub | base64 -d | xxd -s 11 -p | tr -d '\n')
# size of the following public key with the (0000000f || ssh-rsa-keyring) preamble
printf '%08x' $(( ${#pub_key} / 2 + 19 )) | xxd -r -p >> $key
# preamble for the public key
# ssh-rsa-keyring in prepended with length of the string
echo '0000000f' | xxd -r -p >> $key
echo -n 'ssh-rsa-keyring' >> $key
# the public key itself
echo $pub_key | xxd -r -p >> $key

# the private key is just a key description in the Linux keyring
# ssh will use it to actually find the corresponding key serial
# grab the comment from the public key
comment=$(awk '{ print $3 }' $in_pub)
# so the total size of the private key is
# two times the same 4 byte int +
# (0000000f || ssh-rsa-keyring) preamble +
# a copy of the public key (without preamble) +
# (size || key_desc) +
# (size || comment )
priv_sz=$(( 8 + 19 + ${#pub_key} / 2 + 4 + ${#key_desc} + 4 + ${#comment} ))
# we need to pad the size to 8 bytes
pad=$(( 8 - $(( priv_sz % 8 )) ))
# so, total private key size
printf '%08x' $(( $priv_sz + $pad )) | xxd -r -p >> $key
# repeated 4-byte int
echo '0102030401020304' | xxd -r -p >> $key
# preamble for the private key
echo '0000000f' | xxd -r -p >> $key
echo -n 'ssh-rsa-keyring' >> $key
# public key
echo $pub_key | xxd -r -p >> $key
# private key description in the keyring
printf '%08x' ${#key_desc} | xxd -r -p >> $key
echo -n $key_desc >> $key
# comment
printf '%08x' ${#comment} | xxd -r -p >> $key
echo -n $comment >> $key
# padding
for (( i = 1; i <= $pad; i++ )); do
    echo 0$i | xxd -r -p >> $key
done

echo '-----BEGIN OPENSSH PRIVATE KEY-----' > $out
base64 $key >> $out
echo '-----END OPENSSH PRIVATE KEY-----' >> $out
chmod 600 $out

# load the PKCS8 private key into the designated keyring
openssl pkcs8 -in $in -topk8 -outform DER -nocrypt | keyctl padd asymmetric $key_desc $keyring
Depending on how our kernel was compiled, we might also need to load some kernel modules for asymmetric private key support:
$ sudo modprobe pkcs8_key_parser
$ ./ssh-add-keyring.sh ~/.ssh/id_rsa myssh @s
Enter pass phrase for ~/.ssh/id_rsa:
723263309
Finally, our private ssh key is added to the current session keyring with the name “myssh”. In addition, the ssh-add-keyring.sh will create a pseudo-private key file in ~/.ssh/id_rsa_keyring, which needs to be passed to the main ssh process. It is a pseudo-private key, because it doesn’t have any sensitive cryptographic material. Instead, it only has the “myssh” identifier in a native OpenSSH format. If we use multiple SSH keys, we have to tell the main ssh process somehow which in-kernel key name should be requested from the system.
Before we start testing it, let’s make sure our SSH server (running locally) will accept the newly generated key as a valid authentication:
$ cat ~/.ssh/id_rsa.pub >> ~/.ssh/authorized_keys
Now we can try to SSH into the system:
$ SSH_AUTH_SOCK="" ./ssh -i ~/.ssh/id_rsa_keyring localhost
The authenticity of host 'localhost (::1)' can't be established.
ED25519 key fingerprint is SHA256:3zk7Z3i9qZZrSdHvBp2aUYtxHACmZNeLLEqsXltynAY.
This key is not known by any other names.
Are you sure you want to continue connecting (yes/no/[fingerprint])? yes
Warning: Permanently added 'localhost' (ED25519) to the list of known hosts.
Linux dev 5.15.79-cloudflare-2022.11.6 #1 SMP Mon Sep 27 00:00:00 UTC 2010 x86_64
…
It worked! Notice that we’re resetting the `SSH_AUTH_SOCK` environment variable to make sure we don’t use any keys from an ssh-agent running on the system. Still the login flow does not request any password for our private key, the key itself is resident of the kernel address space, and we reference it using its serial for signature operations.
User or session keyring?
In the example above, we set up our SSH private key into the session keyring. We can check if it is there:
We might have used user keyring as well. What is the difference? Currently, the “myssh” key lifetime is limited to the current login session. That is, if we log out and login again, the key will be gone, and we would have to run the ssh-add-keyring.sh script again. Similarly, if we log in to a second terminal, we won’t see this key:
Notice that the serial number of the session keyring _ses in the second terminal is different. A new keyring was created and “myssh” key along with the previous session keyring doesn’t exist anymore:
$ SSH_AUTH_SOCK="" ./ssh -i ~/.ssh/id_rsa_keyring localhost
Load key "/home/ignat/.ssh/id_rsa_keyring": key not found
…
If instead we tell ssh-add-keyring.sh to load the private key into the user keyring (replace @s with @u in the command line parameters), it will be available and accessible from both login sessions. In this case, during logout and re-login, the same key will be presented. Although, this has a security downside – any process running as our user id will be able to access and use the key.
Summary
In this post we learned about one of the most common ways that data, including highly valuable cryptographic keys, can leak. We talked about some real examples, which impacted many users around the world, including Cloudflare. Finally, we learned how the Linux Kernel Retention Service can help us to protect our cryptographic keys and secrets.
We also introduced a working patch for OpenSSH to use this cool feature of the Linux kernel, so you can easily try it yourself. There are still many Linux Kernel Key Retention Service features left untold, which might be a topic for another blog post. Stay tuned!
Early on when we learn to program, we get introduced to the concept of recursion. And that it is handy for computing, among other things, sequences defined in terms of recurrences. Such as the famous Fibonnaci numbers – Fn = Fn-1 + Fn-2.
Later on, perhaps when diving into multithreaded programming, we come to terms with the fact that the stack space for call frames is finite. And that there is an “okay” way and a “cool” way to calculate the Fibonacci numbers using recursion:
This has an important consequence – as fib recursively calls itself, the stacks keep growing. We can observe it with a bit of help from the debugger.
$ gdb --quiet --batch --command=trace_rsp.gdb --args ./fib_okay 6
Breakpoint 1 at 0x401188: file fib_okay.c, line 3.
[Thread debugging using libthread_db enabled]
Using host libthread_db library "/lib64/libthread_db.so.1".
n = 6, %rsp = 0xffffd920
n = 5, %rsp = 0xffffd900
n = 4, %rsp = 0xffffd8e0
n = 3, %rsp = 0xffffd8c0
n = 2, %rsp = 0xffffd8a0
n = 1, %rsp = 0xffffd880
n = 1, %rsp = 0xffffd8c0
n = 2, %rsp = 0xffffd8e0
n = 1, %rsp = 0xffffd8c0
n = 3, %rsp = 0xffffd900
n = 2, %rsp = 0xffffd8e0
n = 1, %rsp = 0xffffd8c0
n = 1, %rsp = 0xffffd900
13
[Inferior 1 (process 50904) exited normally]
$
While the “cool” variant makes no use of the stack.
$ gdb --quiet --batch --command=trace_rsp.gdb --args ./fib_cool 6
Breakpoint 1 at 0x40118a: file fib_cool.c, line 13.
[Thread debugging using libthread_db enabled]
Using host libthread_db library "/lib64/libthread_db.so.1".
n = 6, %rsp = 0xffffd938
13
[Inferior 1 (process 50949) exited normally]
$
Where did the calls go?
The smart compiler turned the last function call in the body into a regular jump. Why was it allowed to do that?
It is the last instruction in the function body we are talking about. The caller stack frame is going to be destroyed right after we return anyway. So why keep it around when we can reuse it for the callee’s stack frame?
This optimization, known as tail call elimination, leaves us with no function calls in the “cool” variant of our fib implementation. There was only one call to eliminate – right at the end.
Once applied, the call becomes a jump (loop). If assembly is not your second language, decompiling the fib_cool.o object file with Ghidra helps see the transformation:
long fib(ulong param_1)

{
  long lVar1;
  long lVar2;
  long lVar3;

  if (param_1 < 2) {
    lVar3 = 1;
  }
  else {
    lVar3 = 1;
    lVar2 = 1;
    do {
      lVar1 = lVar3;
      param_1 = param_1 - 1;
      lVar3 = lVar2 + lVar1;
      lVar2 = lVar1;
    } while (param_1 != 1);
  }
  return lVar3;
}
Listing 4. fib_cool.o decompiled by Ghidra
This is very much desired. Not only is the generated machine code much shorter. It is also way faster due to lack of calls, which pop up on the profile for fib_okay.
But I am no performance ninja and this blog post is not about compiler optimizations. So why am I telling you about it?
The concept of tail call elimination made its way into the BPF world. Although not in the way you might expect. Yes, the LLVM compiler does get rid of the trailing function calls when building for -target bpf. The transformation happens at the intermediate representation level, so it is backend agnostic. This can save you some BPF-to-BPF function calls, which you can spot by looking for call -N instructions in the BPF assembly.
However, when we talk about tail calls in the BPF context, we usually have something else in mind. And that is a mechanism, built into the BPF JIT compiler, for chaining BPF programs.
We first adopted BPF tail calls when building our XDP-based packet processing pipeline. Thanks to it, we were able to divide the processing logic into several XDP programs. Each responsible for doing one thing.
BPF tail calls have served us well since then. But they do have their caveats. Until recently it was impossible to have both BPF tails calls and BPF-to-BPF function calls in the same XDP program on arm64, which is one of the supported architectures for us.
Why? Before we get to that, we have to clarify what a BPF tail call actually does.
A tail call is a tail call is a tail call
BPF exposes the tail call mechanism through the bpf_tail_call helper, which we can invoke from our BPF code. We don’t directly point out which BPF program we would like to call. Instead, we pass it a BPF map (a container) capable of holding references to BPF programs (BPF_MAP_TYPE_PROG_ARRAY), and an index into the map.
long bpf_tail_call(void *ctx, struct bpf_map *prog_array_map, u32 index)

       Description
              This  special  helper is used to trigger a "tail call", or
              in other words, to jump into  another  eBPF  program.  The
              same  stack frame is used (but values on stack and in reg‐
              isters for the caller are not accessible to  the  callee).
              This  mechanism  allows  for  program chaining, either for
              raising the maximum number of available eBPF instructions,
              or  to  execute  given programs in conditional blocks. For
              security reasons, there is an upper limit to the number of
              successive tail calls that can be performed.
At first glance, this looks somewhat similar to the execve(2) syscall. It is easy to mistake it for a way to execute a new program from the current program context. To quote the excellent BPF and XDP Reference Guide from the Cilium project documentation:
Tail calls can be seen as a mechanism that allows one BPF program to call another, without returning to the old program. Such a call has minimal overhead as unlike function calls, it is implemented as a long jump, reusing the same stack frame.
But once we add BPF function calls into the mix, it becomes clear that the BPF tail call mechanism is indeed an implementation of tail call elimination, rather than a way to replace one program with another:
Tail calls, before the actual jump to the target program, will unwind only its current stack frame. As we can see in the example above, if a tail call occurs from within the sub-function, the function’s (func1) stack frame will be present on the stack when a program execution is at func2. Once the final function (func3) function terminates, all the previous stack frames will be unwinded and control will get back to the caller of BPF program caller.
Alas, one with sometimes slightly surprising semantics. Consider the code like below, where a BPF function calls the bpf_tail_call() helper:
We have two seemingly not so different BPF programs – server1() and server2(). They both call the same BPF function bring_order(). The function tail calls into the serve_drink() program, if the bar[0] map entry points to it (let’s assume that).
Do both server1 and server2 return the same value? Turns out that – no, they don’t. We get a hex 🍔 from server1, and a ☕ from server2. How so?
First thing to notice is that a BPF tail call unwinds just the current function stack frame. Code past the bpf_tail_call() invocation in the function body never executes, providing the tail call is successful (the map entry was set, and the tail call limit has not been reached).
When the tail call finishes, control returns to the caller of the function which made the tail call. Applying this to our example, the control flow is serverX() --> bring_order() --> bpf_tail_call() --> serve_drink() -return-> serverX() for both programs.
The second thing to keep in mind is that the compiler does not know that the bpf_tail_call() helper changes the control flow. Hence, the unsuspecting compiler optimizes the code as if the execution would continue past the BPF tail call.
The call graph for server1() and server2() is the same, but the return value differs due to build time optimizations.
In our case, the compiler thinks it is okay to propagate the constant which bring_order() returns to server1(). Possibly catching us by surprise, if we didn’t check the generated BPF assembly.
We can prevent it by forcing the compiler to make a tail call to bring_order(). This way we ensure that whatever bring_order() returns will be used as the server2() program result.
🛈 General rule – for least surprising results, use musttail attribute when calling a function that contain a BPF tail call.
How does the bpf_tail_call() work underneath then? And why the BPF verifier wouldn’t let us mix the function calls with tail calls on arm64? Time to dig deeper.
What does a bpf_tail_call() helper call translate to after BPF JIT for x86-64 has compiled it? How does the implementation guarantee that we don’t end up in a tail call loop forever?
To find out we will need to piece together a few things.
First, there is the BPF JIT compiler source code, which lives in arch/x86/net/bpf_jit_comp.c. Its code is annotated with helpful comments. We will focus our attention on the following call chain within the JIT:
It is sometimes hard to visualize the generated instruction stream just from reading the compiler code. Hence, we will also want to inspect the input – BPF instructions – and the output – x86-64 instructions – of the JIT compiler.
To inspect BPF and x86-64 instructions of a loaded BPF program, we can use bpftool prog dump. However, first we must populate the BPF map used as the tail call jump table. Otherwise, we might not be able to see the tail call jump!
This is due to optimizations that use instruction patching when the index into the program array is known at load time.
There is a caveat. The target addresses for tail call jumps in bpftool prog dump jited output will not make any sense. To discover the real jump targets, we have to peek into the kernel memory. That can be done with gdb after we find the address of our JIT’ed BPF programs in /proc/kallsyms:
Lastly, it will be handy to have a cheat sheet of mapping between BPF registers (r0, r1, …) to hardware registers (rax, rdi, …) that the JIT compiler uses.
BPF
x86-64
r0
rax
r1
rdi
r2
rsi
r3
rdx
r4
rcx
r5
r8
r6
rbx
r7
r13
r8
r14
r9
r15
r10
rbp
internal
r9-r12
Now we are prepared to work out what happens when we use a BPF tail call.
In essence, bpf_tail_call() emits a jump into another function, reusing the current stack frame. It is just like a regular optimized tail call, but with a twist.
Because of the BPF security guarantees – execution terminates, no stack overflows – there is a limit on the number of tail calls we can have (MAX_TAIL_CALL_CNT = 33).
Counting the tail calls across BPF programs is not something we can do at load-time. The jump table (BPF program array) contents can change after the program has been verified. Our only option is to keep track of tail calls at run-time. That is why the JIT’ed code for the bpf_tail_call() helper checks and updates the tail_call_cnt counter.
The updated count is then passed from one BPF program to another, and from one BPF function to another, as we will see, through the rax register (r0 in BPF).
Luckily for us, the x86-64 calling convention dictates that the rax register does not partake in passing function arguments, but rather holds the function return value. The JIT can repurpose it to pass an additional – hidden – argument.
The function body is, however, free to make use of the r0/rax register in any way it pleases. This explains why we want to save the tail_call_cnt passed via rax onto stack right after we jump to another program. bpf_tail_call() can later load the value from a known location on the stack.
This way, the code emitted for each bpf_tail_call() invocation, and the BPF function prologue work in tandem, keeping track of tail call count across BPF program boundaries.
But what if our BPF program is split up into several BPF functions, each with its own stack frame? What if these functions perform BPF tail calls? How is the tail call count tracked then?
Mixing BPF function calls with BPF tail calls
BPF has its own terminology when it comes to functions and calling them, which is influenced by the internal implementation. Function calls are referred to as BPF to BPF calls. Also, the main/entry function in your BPF code is called “the program”, while all other functions are known as “subprograms”.
Each call to subprogram allocates a stack frame for local state, which persists until the function returns. Naturally, BPF subprogram calls can be nested creating a call chain. Just like nested function calls in user-space.
BPF subprograms are also allowed to make BPF tail calls. This, effectively, is a mechanism for extending the call chain to another BPF program and its subprograms.
static int check_max_stack_depth(struct bpf_verifier_env *env)
{
        …
        /* protect against potential stack overflow that might happen when
         * bpf2bpf calls get combined with tailcalls. Limit the caller's stack
         * depth for such case down to 256 so that the worst case scenario
         * would result in 8k stack size (32 which is tailcall limit * 256 =
         * 8k).
         *
         * To get the idea what might happen, see an example:
         * func1 -> sub rsp, 128
         *  subfunc1 -> sub rsp, 256
         *  tailcall1 -> add rsp, 256
         *   func2 -> sub rsp, 192 (total stack size = 128 + 192 = 320)
         *   subfunc2 -> sub rsp, 64
         *   subfunc22 -> sub rsp, 128
         *   tailcall2 -> add rsp, 128
         *    func3 -> sub rsp, 32 (total stack size 128 + 192 + 64 + 32 = 416)
         *
         * tailcall will unwind the current stack frame but it will not get rid
         * of caller's stack as shown on the example above.
         */
        if (idx && subprog[idx].has_tail_call && depth >= 256) {
                verbose(env,
                        "tail_calls are not allowed when call stack of previous frames is %d bytes. Too large\n",
                        depth);
                return -EACCES;
        }
        …
}
While the stack depth can be calculated by the BPF verifier at load-time, we still need to keep count of tail call jumps at run-time. Even when subprograms are involved.
This means that we have to pass the tail call count from one BPF subprogram to another, just like we did when making a BPF tail call, so we yet again turn to value passing through the rax register.
Control flow in a BPF program with a function call followed by a tail call.
🛈 To keep things simple, BPF code in our examples does not allocate anything on stack. I encourage you to check how the JIT’ed code changes when you add some local variables. Just make sure the compiler does not optimize them out.
To make it work, we need to:
① load the tail call count saved on stack into rax before call’ing the subprogram, ② adjust the subprogram prologue, so that it does not reset the rax like the main program does, ③ save the passed tail call count on subprogram’s stack for the bpf_tail_call() helper to consume it.
A bpf_tail_call() within our suprogram will then:
④ load the tail call count from stack, ⑤ unwind the BPF stack, but keep the current subprogram’s stack frame in tact, and ⑥ jump to the target BPF program.
Now we have seen how all the pieces of the puzzle fit together to make BPF tail work on x86-64 safely. The only open question is does it work the same way on other platforms like arm64? Time to shift gears and dive into a completely different BPF JIT implementation.
If you try loading a BPF program that uses both BPF function calls (aka BPF to BPF calls) and BPF tail calls on an arm64 machine running the latest 5.15 LTS kernel, or even the latest 5.19 stable kernel, the BPF verifier will kindly ask you to reconsider your choice:
That is a pity! We have been looking forward to reaping the benefits of code sharing with BPF to BPF calls in our lengthy machine generated BPF programs. So we asked – how hard could it be to make it work?
After all, BPF JIT for arm64 already can handle BPF tail calls and BPF to BPF calls, when used in isolation.
It is “just” a matter of understanding the existing JIT implementation, which lives in arch/arm64/net/bpf_jit_comp.c, and identifying the missing pieces.
To understand how BPF JIT for arm64 works, we will use the same method as before – look at its code together with sample input (BPF instructions) and output (arm64 instructions).
We don’t have to read the whole source code. It is enough to zero in on a few particular code paths:
One thing that the arm64 architecture, and RISC architectures in general, are known for is that it has a plethora of general purpose registers (x0-x30). This is a good thing. We have more registers to allocate to JIT internal state, like the tail call count. A cheat sheet of what roles the hardware registers play in the BPF JIT will be helpful:
BPF
arm64
r0
x7
r1
x0
r2
x1
r3
x2
r4
x3
r5
x4
r6
x19
r7
x20
r8
x21
r9
x22
r10
x25
internal
x9-x12, x26 (tail_call_cnt), x27
Now let’s try to understand the state of things by looking at the JIT’s input and output for two particular scenarios: (1) a BPF tail call, and (2) a BPF to BPF call.
It is hard to read assembly code selectively. We will have to go through all instructions one by one, and understand what each one is doing.
⚠ Brace yourself. Time to decipher a bit of ARM64 assembly. If this will be your first time reading ARM64 assembly, you might want to at least skim through this Guide to ARM64 / AArch64 Assembly on Linux before diving in.
① BPF program prologue starts with Pointer Authentication Code (PAC), which protects against Return Oriented Programming attacks. PAC instructions are emitted by JIT only if CONFIG_ARM64_PTR_AUTH_KERNEL is enabled.
③ Registers X19 to X28, and X29 (FP) plus X30 (LR), are callee saved. ARM64 BPF JIT does not use registers X23 and X24 currently, so they are not saved.
④ We track the tail call depth in X26. No need to save it onto stack since we use a register dedicated just for this purpose.
⑥ Reserve space for the BPF program stack. The stack layout is now as shown in a diagram in build_prologue() source code.
⑦ The BPF function body starts here.
⑧ bpf_tail_call() instructions start here.
⑨ The epilogue starts here.
Whew! That was a handful 😅.
Notice that the BPF tail call implementation on arm64 is not as optimized as on x86-64. There is no code patching to make direct jumps when the target program index is known at the JIT-compilation time. Instead, the target address is always loaded from the BPF program array.
Ready for the second scenario? I promise it will be shorter. Function prologue and epilogue instructions will look familiar, so we are going to keep annotations down to a minimum.
We have now seen what a BPF tail call and a BPF function/subprogram call compiles down to. Can you already spot what would go wrong if mixing the two was allowed?
That’s right! Every time we enter a BPF subprogram, we reset the X26 register, which holds the tail call count, to zero (mov x26, #0x0). This is bad. It would let users create program chains longer than the MAX_TAIL_CALL_CNT limit.
How about we just skip this step when emitting the prologue for BPF subprograms?
Believe it or not. This is everything that was missing to get BPF tail calls working with function calls on arm64. The feature will be enabled in the upcoming Linux 6.0 release.
Outro
From recursion to tweaking the BPF JIT. How did we get here? Not important. It’s all about the journey.
Along the way we have unveiled a few secrets behind BPF tails calls, and hopefully quenched your thirst for low-level programming. At least for today.
All that is left is to sit back and watch the fruits of our work. With GDB hooked up to a VM, we can observe how a BPF program calls into a BPF function, and from there tail calls to another BPF program:
Chances are you might have heard of io_uring. It first appeared in Linux 5.1, back in 2019, and was advertised as the new API for asynchronous I/O. Its goal was to be an alternative to the deemed-to-be-broken-beyond-repair AIO, the “old” asynchronous I/O API.
Calling io_uring just an asynchronous I/O API doesn’t do it justice, though. Underneath the API calls, io_uring is a full-blown runtime for processing I/O requests. One that spawns threads, sets up work queues, and dispatches requests for processing. All this happens “in the background” so that the user space process doesn’t have to, but can, block while waiting for its I/O requests to complete.
A runtime that spawns threads and manages the worker pool for the developer makes life easier, but using it in a project begs the questions:
1. How many threads will be created for my workload by default?
2. How can I monitor and control the thread pool size?
By default, io_uring limits the unbounded workers created to the maximum processor count set by RLIMIT_NPROC and the bounded workers is a function of the SQ ring size and the number of CPUs in the system.
… it also leads to more questions:
3. What is an unbounded worker?
4. How does it differ from a bounded worker?
Things seem a bit under-documented as is, hence this blog post. Hopefully, it will provide the clarity needed to put io_uring to work in your project when the time comes.
Before we dig in, a word of warning. This post is not meant to be an introduction to io_uring. The existing documentation does a much better job at showing you the ropes than I ever could. Please give it a read first, if you are not familiar yet with the io_uring API.
Not all I/O requests are created equal
io_uring can perform I/O on any kind of file descriptor; be it a regular file or a special file, like a socket. However, the kind of file descriptor that it operates on makes a difference when it comes to the size of the worker pool.
io-wq divides work into two categories: 1. Work that completes in a bounded time, like reading from a regular file or a block device. This type of work is limited based on the size of the SQ ring. 2. Work that may never complete, we call this unbounded work. The amount of workers here is limited by RLIMIT_NPROC.
This answers the latter two of our open questions. Unbounded workers handle I/O requests that operate on neither regular files (S_IFREG) nor block devices (S_ISBLK). This is the case for network I/O, where we work with sockets (S_IFSOCK), and other special files like character devices (e.g. /dev/null).
We now also know that there are different limits in place for how many bounded vs unbounded workers there can be running. So we have to pick one before we dig further.
Capping the unbounded worker pool size
Pushing data through sockets is Cloudflare’s bread and butter, so this is what we are going to base our test workload around. To put it in io_uring lingo – we will be submitting unbounded work requests.
While doing that, we will observe how io_uring goes about creating workers.
To observe how io_uring goes about creating workers we will ask it to read from a UDP socket multiple times. No packets will arrive on the socket, so we will have full control over when the requests complete.
$ ./target/debug/udp-read -h
udp-read 0.1.0
read from UDP socket with io_uring

USAGE:
    udp-read [FLAGS] [OPTIONS]

FLAGS:
    -a, --async      Set IOSQE_ASYNC flag on submitted SQEs
    -h, --help       Prints help information
    -V, --version    Prints version information

OPTIONS:
    -c, --cpu <cpu>...                     CPU to run on when invoking io_uring_enter for Nth ring (specify multiple
                                           times) [default: 0]
    -w, --workers <max-unbound-workers>    Maximum number of unbound workers per NUMA node (0 - default, that is
                                           RLIMIT_NPROC) [default: 0]
    -r, --rings <num-rings>                Number io_ring instances to create per thread [default: 1]
    -t, --threads <num-threads>            Number of threads creating io_uring instances [default: 1]
    -s, --sqes <sqes>                      Number of read requests to submit per io_uring (0 - fill the whole queue)
                                           [default: 0]
While it is parametrized for easy experimentation, at its core it doesn’t do much. We fill the submission queue with read requests from a UDP socket and then wait for them to complete. But because data doesn’t arrive on the socket out of nowhere, and there are no timeouts set up, nothing happens. As a bonus, we have complete control over when requests complete, which will come in handy later.
Let’s run the test workload to convince ourselves that things are working as expected. strace won’t be very helpful when using io_uring. We won’t be able to tie I/O requests to system calls. Instead, we will have to turn to in-kernel tracing.
Thankfully, io_uring comes with a set of ready to use static tracepoints, which save us the trouble of digging through the source code to decide where to hook up dynamic tracepoints, known as kprobes.
We can discover the tracepoints with perf list or bpftrace -l, or by browsing the events/ directory on the tracefs filesystem, usually mounted under /sys/kernel/tracing.
$ sudo perf list 'io_uring:*'

List of pre-defined events (to be used in -e):

  io_uring:io_uring_complete                         [Tracepoint event]
  io_uring:io_uring_cqring_wait                      [Tracepoint event]
  io_uring:io_uring_create                           [Tracepoint event]
  io_uring:io_uring_defer                            [Tracepoint event]
  io_uring:io_uring_fail_link                        [Tracepoint event]
  io_uring:io_uring_file_get                         [Tracepoint event]
  io_uring:io_uring_link                             [Tracepoint event]
  io_uring:io_uring_poll_arm                         [Tracepoint event]
  io_uring:io_uring_poll_wake                        [Tracepoint event]
  io_uring:io_uring_queue_async_work                 [Tracepoint event]
  io_uring:io_uring_register                         [Tracepoint event]
  io_uring:io_uring_submit_sqe                       [Tracepoint event]
  io_uring:io_uring_task_add                         [Tracepoint event]
  io_uring:io_uring_task_run                         [Tracepoint event]
Judging by the number of tracepoints to choose from, io_uring takes visibility seriously. To help us get our bearings, here is a diagram that maps out paths an I/O request can take inside io_uring code annotated with tracepoint names – not all of them, just those which will be useful to us.
Starting on the left, we expect our toy workload to push entries onto the submission queue. When we publish submitted entries by calling io_uring_enter(), the kernel consumes the submission queue and constructs internal request objects. A side effect we can observe is a hit on the io_uring:io_uring_submit_sqe tracepoint.
$ sudo perf stat -e io_uring:io_uring_submit_sqe -- timeout 1 ./udp-read

 Performance counter stats for 'timeout 1 ./udp-read':

              4096      io_uring:io_uring_submit_sqe

       1.049016083 seconds time elapsed

       0.003747000 seconds user
       0.013720000 seconds sys
But, as it turns out, submitting entries is not enough to make io_uring spawn worker threads. Our process remains single-threaded:
So, by default, io_uring performs a non-blocking read on sockets. This is bound to fail with -EAGAIN in our case. What follows is that io_uring registers a wake-up call (io_async_wake()) for when the socket becomes readable. There is no need to perform a blocking read, when we can wait to be notified.
This resembles polling the socket with select() or [e]poll() from user space. There is no timeout, if we didn’t ask for it explicitly by submitting an IORING_OP_LINK_TIMEOUT request. io_uring will simply wait indefinitely.
We can observe io_uring when it calls vfs_poll, the machinery behind non-blocking I/O, to monitor the sockets. If that happens, we will be hitting the io_uring:io_uring_poll_arm tracepoint. Meanwhile, the wake-ups that follow, if the polled file becomes ready for I/O, can be recorded with the io_uring:io_uring_poll_wake tracepoint embedded in io_async_wake() wake-up call.
This is what we are experiencing. io_uring is polling the socket for read-readiness:
To make io_uring spawn worker threads, we have to force the read requests to be processed concurrently in a blocking fashion. We can do this by marking the I/O requests as asynchronous. As io_uring_enter(2) man-page says:
  IOSQE_ASYNC
         Normal operation for io_uring is to try and  issue  an
         sqe  as non-blocking first, and if that fails, execute
         it in an async manner. To support more efficient over‐
         lapped  operation  of  requests  that  the application
         knows/assumes will always (or most of the time) block,
         the  application can ask for an sqe to be issued async
         from the start. Available since 5.6.
The thread count went up by the number of submitted I/O requests (4,096). And there is one extra thread – the main thread. io_uring has spawned workers.
If we trace it again, we see that requests are now taking the blocking-read path, and we are hitting the io_uring:io_uring_queue_async_work tracepoint on the way.
$ sudo perf stat -a -e io_uring:io_uring_poll_arm,io_uring:io_uring_queue_async_work -- ./udp-read --async
^C./udp-read: Interrupt

 Performance counter stats for 'system wide':

                 0      io_uring:io_uring_poll_arm
              4096      io_uring:io_uring_queue_async_work

       1.335559294 seconds time elapsed

$
We got what we wanted. We are now using the worker thread pool.
However, having 4,096 threads just for reading one socket sounds like overkill. If we were to limit the number of worker threads, how would we go about that? There are four ways I know of.
Method 1 – Limit the number of in-flight requests
If we take care to never have more than some number of in-flight blocking I/O requests, then we will have more or less the same number of workers. This is because:
io_uring spawns workers only when there is work to process. We control how many requests we submit and can throttle new submissions based on completion notifications.
io_uring retires workers when there is no more pending work in the queue. Although, there is a grace period before a worker dies.
The downside of this approach is that by throttling submissions, we reduce batching. We will have to drain the completion queue, refill the submission queue, and switch context with io_uring_enter() syscall more often.
We can convince ourselves that this method works by tweaking the number of submitted requests, and observing the thread count as the requests complete. The --sqes <n> option (submission queue entries) controls how many read requests get queued by our workload. If we want a request to complete, we simply need to send a packet toward the UDP socket we are reading from. The workload does not refill the submission queue.
In 5.15 the io_uring_register() syscall gained a new command for setting the maximum number of bound and unbound workers.
  IORING_REGISTER_IOWQ_MAX_WORKERS
         By default, io_uring limits the unbounded workers cre‐
         ated   to   the   maximum   processor   count  set  by
         RLIMIT_NPROC and the bounded workers is a function  of
         the SQ ring size and the number of CPUs in the system.
         Sometimes this can be excessive (or  too  little,  for
         bounded),  and  this  command provides a way to change
         the count per ring (per NUMA node) instead.

         arg must be set to an unsigned int pointer to an array
         of  two values, with the values in the array being set
         to the maximum count of workers per NUMA node. Index 0
         holds  the bounded worker count, and index 1 holds the
         unbounded worker  count.  On  successful  return,  the
         passed  in array will contain the previous maximum va‐
         lyes for each type. If the count being passed in is 0,
         then  this  command returns the current maximum values
         and doesn't modify the current setting.  nr_args  must
         be set to 2, as the command takes two values.

         Available since 5.15.
By the way, if you would like to grep through the io_uring man pages, they live in the liburing repo maintained by Jens Axboe – not the go-to repo for Linux API man-pages maintained by Michael Kerrisk.
Since it is a fresh addition to the io_uring API, the io-uring Rust library we are using has not caught up yet. But with a bit of patching, we can make it work.
We can tell our toy program to set IORING_REGISTER_IOWQ_MAX_WORKERS (= 19 = 0x13) by running it with the --workers <N> option:
This works perfectly. We have spawned just eight io_uring worker threads to handle 4k of submitted read requests.
Question remains – is the set limit per io_uring instance? Per thread? Per process? Per UID? Read on to find out.
Method 3 – Set RLIMIT_NPROC resource limit
A resource limit for the maximum number of new processes is another way to cap the worker pool size. The documentation for the IORING_REGISTER_IOWQ_MAX_WORKERS command mentions this.
This resource limit overrides the IORING_REGISTER_IOWQ_MAX_WORKERS setting, which makes sense because bumping RLIMIT_NPROC above the configured hard maximum requires CAP_SYS_RESOURCE capability.
Setting the new process limit without using a dedicated UID or outside a dedicated user namespace, where other processes are running under the same UID, can have surprising effects.
Why? io_uring will try over and over again to scale up the worker pool, only to generate a bunch of -EAGAIN errors from create_io_worker() if it can’t reach the configured RLIMIT_NPROC limit:
We are hogging one core trying to spawn new workers. This is not the best use of CPU time.
So, if you want to use RLIMIT_NPROC as a safety cap over the IORING_REGISTER_IOWQ_MAX_WORKERS limit, you better use a “fresh” UID or a throw-away user namespace:
Anti-Method 4 – cgroup process limit – pids.max file
There is also one other way to cap the worker pool size – limit the number of tasks (that is, processes and their threads) in a control group.
It is an anti-example and a potential misconfiguration to watch out for, because just like with RLIMIT_NPROC, we can fall into the same trap where io_uring will burn CPU:
Here, we again see io_uring wasting time trying to spawn more workers without success. The kernel does not let the number of tasks within the service’s control group go over the limit.
Okay, so we know what is the best and the worst way to put a limit on the number of io_uring workers. But is the limit per io_uring instance? Per user? Or something else?
One ring, two ring, three ring, four …
Your process is not limited to one instance of io_uring, naturally. In the case of a network proxy, where we push data from one socket to another, we could have one instance of io_uring servicing each half of the proxy.
How many worker threads will be created in the presence of multiple io_urings? That depends on whether your program is single- or multithreaded.
In the single-threaded case, if the main thread creates two io_urings, and configures each io_uring to have a maximum of two unbound workers, then:
… four workers will be spawned in total – two for each of the program threads. This is reflected by the owner thread ID present in the worker’s name (iou-wrk-<tid>).
So you might think – “It makes sense! Each thread has their own dedicated pool of I/O workers, which service all the io_uring instances operated by that thread.”
And you would be right1. If we follow the code – task_struct has an instance of io_uring_task, aka io_uring context for the task2. Inside the context, we have a reference to the io_uring work queue (struct io_wq), which is actually an array of work queue entries (struct io_wqe). More on why that is an array soon.
Moving down to the work queue entry, we arrive at the work queue accounting table (struct io_wqe_acct [2]), with one record for each type of work – bounded and unbounded. This is where io_uring keeps track of the worker pool limit (max_workers) the number of existing workers (nr_workers).
The perhaps not-so-obvious consequence of this arrangement is that setting just the RLIMIT_NPROC limit, without touching IORING_REGISTER_IOWQ_MAX_WORKERS, can backfire for multi-threaded programs.
See, when the maximum number of workers for an io_uring instance is not configured, it defaults to RLIMIT_NPROC. This means that io_uring will try to scale the unbounded worker pool to RLIMIT_NPROC for each thread that operates on an io_uring instance.
A multi-threaded process, by definition, creates threads. Now recall that the process management in the kernel tracks the number of tasks per UID within the user namespace. Each spawned thread depletes the quota set by RLIMIT_NPROC. As a consequence, io_uring will never be able to fully scale up the worker pool, and will burn the CPU trying to do so.
Lastly, there’s the case of NUMA systems with more than one memory node. io_uring documentation clearly says that IORING_REGISTER_IOWQ_MAX_WORKERS configures the maximum number of workers per NUMA node.
That is why, as we have seen, io_wq.wqes is an array. It contains one entry, struct io_wqe, for each NUMA node. If your servers are NUMA systems like Cloudflare, that is something to take into account.
Luckily, we don’t need a NUMA machine to experiment. QEMU happily emulates NUMA architectures. If you are hardcore enough, you can configure the NUMA layout with the right combination of -smp and -numa options.
But why bother when the libvirt provider for Vagrant makes it so simple to configure a 2 node / 4 CPU layout:
… we get just two workers on a machine with two NUMA nodes. Not the outcome we were hoping for.
Why are we not reaching the expected pool size of <max workers> × <# NUMA nodes> = 2 × 2 = 4 workers? And is it possible to make it happen?
Reading the code reveals that – yes, it is possible. However, for the per-node worker pool to be scaled up for a given NUMA node, we have to submit requests, that is, call io_uring_enter(), from a CPU that belongs to that node. In other words, the process scheduler and thread CPU affinity have a say in how many I/O workers will be created.
We can demonstrate the effect that jumping between CPUs and NUMA nodes has on the worker pool by operating two instances of io_uring. We already know that having more than one io_uring instance per thread does not impact the worker pool limit.
This time, however, we are going to ask the workload to pin itself to a particular CPU before submitting requests with the --cpu option – first it will run on CPU 0 to enter the first ring, then on CPU 2 to enter the second ring.
Voilà. We have reached the said limit of <max workers> x <# NUMA nodes>.
Outro
That is all for the very first installment of the Missing Manuals. io_uring has more secrets that deserve a write-up, like request ordering or handling of interrupted syscalls, so Missing Manuals might return soon.
In the meantime, please tell us what topic would you nominate to have a Missing Manual written?
Oh, and did I mention that if you enjoy putting cutting edge Linux APIs to use, we are hiring? Now also remotely 🌎.
_____
1And it probably does not make the users of runtimes that implement a hybrid threading model, like Golang, too happy. 2To the Linux kernel, processes and threads are just kinds of tasks, which either share or don’t share some resources.
We have been working with conntrack, the connection tracking layer in the Linux kernel, for years. And yet, despite the collected know-how, questions about its inner workings occasionally come up. When they do, it is hard to resist the temptation to go digging for answers.
We already know from last time that conntrack is in charge of tracking incoming and outgoing network traffic. By running conntrack -L we can inspect existing network flows, or as conntrack calls them, connections.
So if we spin up a toy VM, connect to it over SSH, and inspect the contents of the conntrack table, we will see…
$ vagrant init fedora/33-cloud-base
$ vagrant up
…
$ vagrant ssh
Last login: Sun Jan 31 15:08:02 2021 from 192.168.122.1
[vagrant@ct-vm ~]$ sudo conntrack -L
conntrack v1.4.5 (conntrack-tools): 0 flow entries have been shown.
… nothing!
Even though the conntrack kernel module is loaded:
Hold on a minute. Why is the SSH connection to the VM not listed in conntrack entries? SSH is working. With each keystroke we are sending packets to the VM. But conntrack doesn’t register it.
Isn’t conntrack an integral part of the network stack that sees every packet passing through it? 🤔
Clearly everything we learned about conntrack last time is not the whole story.
Calling into conntrack
Our little experiment with SSH’ing into a VM begs the question — how does conntrack actually get notified about network packets passing through the stack?
We can walk the receive path step by step and we won’t find any direct calls into the conntrack code in either the IPv4 or IPv6 stack. Conntrack does not interface with the network stack directly.
Instead, it relies on the Netfilter framework, and its set of hooks baked into in the stack:
Netfilter users, like conntrack, can register callbacks with it. Netfilter will then run all registered callbacks when its hook processes a network packet.
For the INET family, that is IPv4 and IPv6, there are five Netfilter hooks to choose from:
Which ones does conntrack use? We will get to that in a moment.
First, let’s focus on the trigger. What makes conntrack register its callbacks with Netfilter?
The SSH connection doesn’t show up in the conntrack table just because the module is loaded. We already saw that. This means that conntrack doesn’t register its callbacks with Netfilter at module load time.
Or at least, it doesn’t do it by default. Since Linux v5.1 (May 2019) the conntrack module has the enable_hooks parameter, which causes conntrack to register its callbacks on load:
Nice! The conntrack table now contains an entry for our SSH session.
The Netfilter hook notified conntrack about SSH session packets passing through the stack.
Now that we know how conntrack gets called, we can go back to our question — can we observe a TCP SYN packet dropped by the firewall with conntrack?
Listing Netfilter hooks
That is easy to check:
Add a rule to drop anything coming to port tcp/25702
[vagrant@ct-vm ~]$ sudo iptables -t filter -A INPUT -p tcp --dport 2570 -j DROP
2) Connect to the VM on port tcp/2570 from the outside
host $ nc -w 1 -z 192.168.122.204 2570
3) List conntrack table entries
[vagrant@ct-vm ~]$ sudo conntrack -L
tcp      6 431999 ESTABLISHED src=192.168.122.204 dst=192.168.122.1 sport=22 dport=34858 src=192.168.122.1 dst=192.168.122.204 sport=34858 dport=22 [ASSURED] mark=0 secctx=system_u:object_r:unlabeled_t:s0 use=1
conntrack v1.4.5 (conntrack-tools): 1 flow entries have been shown.
No new entries. Conntrack didn’t record a new flow for the dropped SYN.
But did it process the SYN packet? To answer that we have to find out which callbacks conntrack registered with Netfilter.
Netfilter keeps track of callbacks registered for each hook in instances of struct nf_hook_entries. We can reach these objects through the Netfilter state (struct netns_nf), which lives inside network namespace (struct net).
struct nf_hook_entries, if you look at its definition, is a bit of an exotic construct. A glance at how the object size is calculated during its allocation gives a hint about its memory layout:
It’s an element count, followed by two arrays glued together, and some RCU-related state which we’re going to ignore. The two arrays have the same size, but hold different kinds of values.
We can walk the second array, holding pointers to struct nf_hook_ops, to discover the registered callbacks and their priority. Priority determines the invocation order.
With drgn, a programmable C debugger tailored for the Linux kernel, we can locate the Netfilter state in kernel memory, and walk its contents relatively easily. Given we know what we are looking for.
[vagrant@ct-vm ~]$ sudo drgn
drgn 0.0.8 (using Python 3.9.1, without libkdumpfile)
…
>>> pre_routing_hook = prog['init_net'].nf.hooks_ipv4[0]
>>> for i in range(0, pre_routing_hook.num_hook_entries):
...     pre_routing_hook.hooks[i].hook
...
(nf_hookfn *)ipv4_conntrack_defrag+0x0 = 0xffffffffc092c000
(nf_hookfn *)ipv4_conntrack_in+0x0 = 0xffffffffc093f290
>>>
Neat! We have a way to access Netfilter state.
Let’s take it to the next level and list all registered callbacks for each Netfilter hook (using less than 100 lines of Python):
The output from our script shows that conntrack has two callbacks registered with the PRE_ROUTING hook – ipv4_conntrack_defrag and ipv4_conntrack_in. But are they being called?
We expect that when the Netfilter PRE_ROUTING hook processes a TCP SYN packet, it will invoke ipv4_conntrack_defrag and then ipv4_conntrack_in callbacks.
To confirm it we will put to use the tracing powers of BPF 🐝. BPF programs can run on entry to functions. These kinds of programs are known as BPF kprobes. In our case we will attach BPF kprobes to conntrack callbacks.
Usually, when working with BPF, we would write the BPF program in C and use clang -target bpf to compile it. However, for tracing it will be much easier to use bpftrace. With bpftrace we can write our BPF kprobe program in a high-level language inspired by AWK:
What does this program do? It is roughly an equivalent of a tcpdump filter:
dst port 2570 and tcp[tcpflags] & tcp-syn != 0
But only for packets passing through conntrack PRE_ROUTING callbacks.
(If you haven’t used bpftrace, it comes with an excellent reference guide and gives you the ability to explore kernel data types on the fly with bpftrace -lv 'struct iphdr'.)
Let’s run the tracing program while we connect to the VM from the outside (nc -z 192.168.122.204 2570):
[vagrant@ct-vm ~]$ sudo bpftrace /vagrant/tools/trace-conntrack-prerouting.bt
Attaching 3 probes...
Tracing conntrack prerouting callbacks... Hit Ctrl-C to quit
13:22:56 192.168.122.1:33254 > 192.168.122.204:2570 tcp syn ipv4_conntrack_defrag
13:22:56 192.168.122.1:33254 > 192.168.122.204:2570 tcp syn ipv4_conntrack_in
^C

[vagrant@ct-vm ~]$
Conntrack callbacks have processed the TCP SYN packet destined to tcp/2570.
But if conntrack saw the packet, why is there no corresponding flow entry in the conntrack table?
Going down the rabbit hole
What actually happens inside the conntrack PRE_ROUTING callbacks?
To find out, we can trace the call chain that starts on entry to the conntrack callback. The function_graph tracer built into the Ftrace framework is perfect for this task.
But because all incoming traffic goes through the PRE_ROUTING hook, including our SSH connection, our trace will be polluted with events from SSH traffic. To avoid that, let’s switch from SSH access to a serial console.
When using libvirt as the Vagrant provider, you can connect to the serial console with virsh:
host $ virsh -c qemu:///session list
 Id   Name                State
-----------------------------------
 1    conntrack_default   running

host $ virsh -c qemu:///session console conntrack_default
Once connected to the console and logged into the VM, we can record the call chain using the trace-cmd wrapper for Ftrace:
[vagrant@ct-vm ~]$ sudo trace-cmd start -p function_graph -g ipv4_conntrack_defrag -g ipv4_conntrack_in
  plugin 'function_graph'
[vagrant@ct-vm ~]$ # … connect from the host with `nc -z 192.168.122.204 2570` …
[vagrant@ct-vm ~]$ sudo trace-cmd stop
[vagrant@ct-vm ~]$ sudo cat /sys/kernel/debug/tracing/trace
# tracer: function_graph
#
# CPU  DURATION                  FUNCTION CALLS
# |     |   |                     |   |   |   |
 1)   1.219 us    |  finish_task_switch();
 1)   3.532 us    |  ipv4_conntrack_defrag [nf_defrag_ipv4]();
 1)               |  ipv4_conntrack_in [nf_conntrack]() {
 1)               |    nf_conntrack_in [nf_conntrack]() {
 1)   0.573 us    |      get_l4proto [nf_conntrack]();
 1)               |      nf_ct_get_tuple [nf_conntrack]() {
 1)   0.487 us    |        nf_ct_get_tuple_ports [nf_conntrack]();
 1)   1.564 us    |      }
 1)   0.820 us    |      hash_conntrack_raw [nf_conntrack]();
 1)   1.255 us    |      __nf_conntrack_find_get [nf_conntrack]();
 1)               |      init_conntrack.constprop.0 [nf_conntrack]() {  ❷
 1)   0.427 us    |        nf_ct_invert_tuple [nf_conntrack]();
 1)               |        __nf_conntrack_alloc [nf_conntrack]() {      ❶
                             …
 1)   3.680 us    |        }
                           …
 1) + 15.847 us   |      }
                         …
 1) + 34.595 us   |    }
 1) + 35.742 us   |  }
 …
[vagrant@ct-vm ~]$
What catches our attention here is the allocation, __nf_conntrack_alloc() (❶), inside init_conntrack() (❷). __nf_conntrack_alloc() creates a struct nf_conn object which represents a tracked connection.
This object is not created in vain. A glance at init_conntrack()source shows that it is pushed onto a list of unconfirmed connections3.
What does it mean that a connection is unconfirmed? As conntrack(8) man page explains:
unconfirmed:
       This table shows new entries, that are not yet inserted into the
       conntrack table. These entries are attached to packets that  are
       traversing  the  stack, but did not reach the confirmation point
       at the postrouting hook.
Perhaps we have been looking for our flow in the wrong table? Does the unconfirmed table have a record for our dropped TCP SYN?
Pulling the rabbit out of the hat
I have bad news…
[vagrant@ct-vm ~]$ sudo conntrack -L unconfirmed
conntrack v1.4.5 (conntrack-tools): 0 flow entries have been shown.
[vagrant@ct-vm ~]$
The flow is not present in the unconfirmed table. We have to dig deeper.
Let’s for a moment assume that a struct nf_conn object was added to the unconfirmed list. If the list is now empty, then the object must have been removed from the list before we inspected its contents.
Has an entry been removed from the unconfirmed table? What function removes entries from the unconfirmed table?
It turns out that nf_ct_add_to_unconfirmed_list() which init_conntrack() invokes, has its opposite defined just right beneath it – nf_ct_del_from_dying_or_unconfirmed_list().
It is worth a shot to check if this function is being called, and if so, from where. For that we can again use a BPF tracing program, attached to function entry. However, this time our program will record a kernel stack trace:
Bingo. The conntrack delete function was called, and the captured stack trace shows that on local delivery path (❶), where LOCAL_IN Netfilter hook runs (❷), the packet is destroyed (❸). Conntrack must be getting called when sk_buff (the packet and its metadata) is destroyed. This causes conntrack to remove the unconfirmed flow entry (❹).
It makes sense. After all we have a DROP rule in the filter/INPUT chain. And that iptables -j DROP rule has a significant side effect. It cleans up an entry in the conntrack unconfirmed table!
This explains why we can’t observe the flow in the unconfirmed table. It lives for only a very short period of time.
Not convinced? You don’t have to take my word for it. I will prove it with a dirty trick!
Making the rabbit disappear, or actually appear
If you recall the output from list-nf-hooks that we’ve seen earlier, there is another conntrack callback there – ipv4_confirm, which I have ignored:
ipv4_confirm is “the confirmation point” mentioned in the conntrack(8) man page. When a flow gets confirmed, it is moved from the unconfirmed table to the main conntrack table.
The callback is registered with a “weird” priority – 2,147,483,647. It’s the maximum positive value of a 32-bit signed integer can hold, and at the same time, the lowest possible priority a callback can have.
This ensures that the ipv4_confirm callback runs last. We want the flows to graduate from the unconfirmed table to the main conntrack table only once we know the corresponding packet has made it through the firewall.
Luckily for us, it is possible to have more than one callback registered with the same priority. In such cases, the order of registration matters. We can put that to use. Just for educational purposes.
Good old iptables won’t be of much help here. Its Netfilter callbacks have hard-coded priorities which we can’t change. But nftables, the iptablessuccessor, is much more flexible in this regard. With nftables we can create a rule chain with arbitrary priority.
So this time, let’s use nftables to install a filter rule to drop traffic to port tcp/2570. The trick, though, is to register our chain before conntrack registers itself. This way our filter will run last.
First, delete the tcp/2570 drop rule in iptables and unregister conntrack.
vm # iptables -t filter -F
vm # rmmod nf_conntrack_netlink nf_conntrack
Then add tcp/2570 drop rule in nftables, with lowest possible priority.
vm # nft add table ip my_table
vm # nft add chain ip my_table my_input { type filter hook input priority 2147483647 \; }
vm # nft add rule ip my_table my_input tcp dport 2570 counter drop
vm # nft -a list ruleset
table ip my_table { # handle 1
        chain my_input { # handle 1
                type filter hook input priority 2147483647; policy accept;
                tcp dport 2570 counter packets 0 bytes 0 drop # handle 4
        }
}
Finally, re-register conntrack hooks.
vm # modprobe nf_conntrack enable_hooks=1
The registered callbacks for the LOCAL_IN hook now look like this:
vm # conntrack -L
tcp      6 115 SYN_SENT src=192.168.122.1 dst=192.168.122.204 sport=54868 dport=2570 [UNREPLIED] src=192.168.122.204 dst=192.168.122.1 sport=2570 dport=54868 mark=0 secctx=system_u:object_r:unlabeled_t:s0 use=1
conntrack v1.4.5 (conntrack-tools): 1 flow entries have been shown.
We have fooled conntrack 💥
Conntrack promoted the flow from the unconfirmed to the main conntrack table despite the fact that the firewall dropped the packet. We can observe it.
Outro
Conntrack processes every received packet4 and creates a flow for it. A flow entry is always created even if the packet is dropped shortly after. The flow might never be promoted to the main conntrack table and can be short lived.
However, this blog post is not really about conntrack. Its internals have been covered by magazines, papers, books, and on other blogs long before. We probably could have learned elsewhere all that has been shown here.
For us, conntrack was really just an excuse to demonstrate various ways to discover the inner workings of the Linux network stack. As good as any other.
Today we have powerful introspection tools like drgn, bpftrace, or Ftrace, and a cross referencer to plow through the source code, at our fingertips. They help us look under the hood of a live operating system and gradually deepen our understanding of its workings.
I have to warn you, though. Once you start digging into the kernel, it is hard to stop…
……….. 1Actually since Linux v5.10 (Dec 2020) there is an additional Netfilter hook for the INET family named NF_INET_INGRESS. The new hook type allows users to attach nftables chains to the Traffic Control ingress hook. 2Why did I pick this port number? Because 2570 = 0x0a0a. As we will see later, this saves us the trouble of converting between the network byte order and the host byte order. 3To be precise, there are multiple lists of unconfirmed connections. One per each CPU. This is a common pattern in the kernel. Whenever we want to prevent CPUs from contending for access to a shared state, we give each CPU a private instance of the state. 4Unless we explicitly exclude it from being tracked with iptables -j NOTRACK.
The collective thoughts of the interwebz
Manage Consent
To provide the best experiences, we use technologies like cookies to store and/or access device information. Consenting to these technologies will allow us to process data such as browsing behavior or unique IDs on this site. Not consenting or withdrawing consent, may adversely affect certain features and functions.
Functional
Always active
The technical storage or access is strictly necessary for the legitimate purpose of enabling the use of a specific service explicitly requested by the subscriber or user, or for the sole purpose of carrying out the transmission of a communication over an electronic communications network.
Preferences
The technical storage or access is necessary for the legitimate purpose of storing preferences that are not requested by the subscriber or user.
Statistics
The technical storage or access that is used exclusively for statistical purposes.The technical storage or access that is used exclusively for anonymous statistical purposes. Without a subpoena, voluntary compliance on the part of your Internet Service Provider, or additional records from a third party, information stored or retrieved for this purpose alone cannot usually be used to identify you.
Marketing
The technical storage or access is required to create user profiles to send advertising, or to track the user on a website or across several websites for similar marketing purposes.
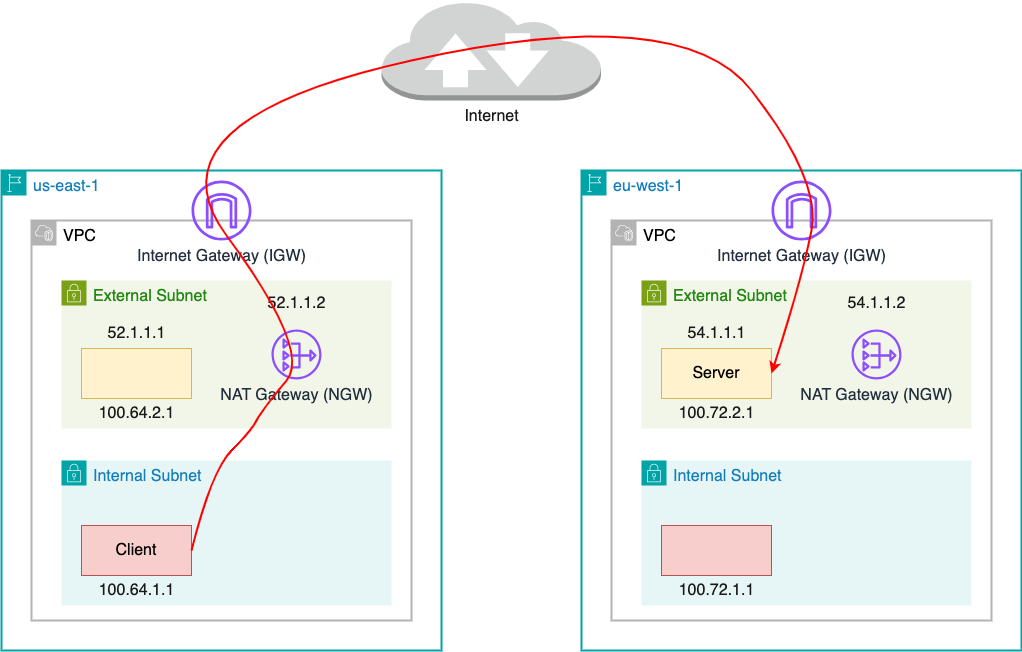

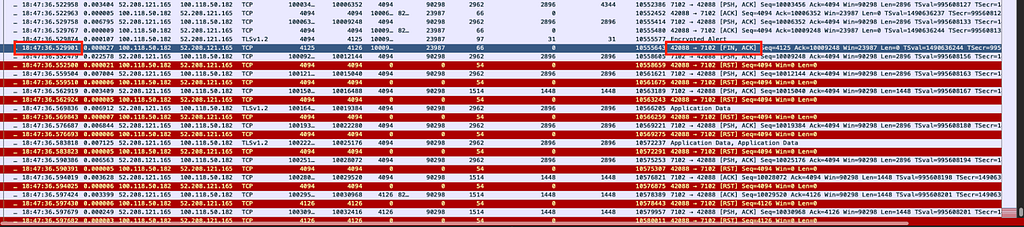
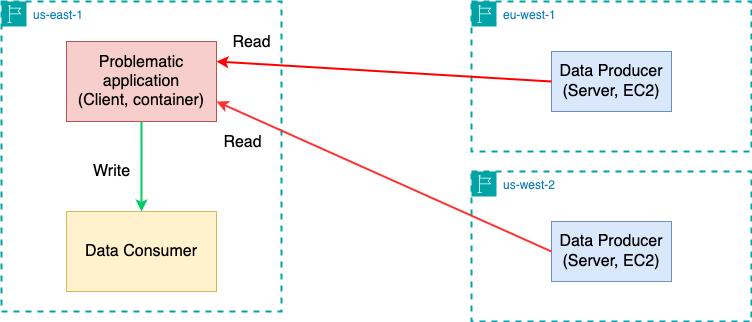
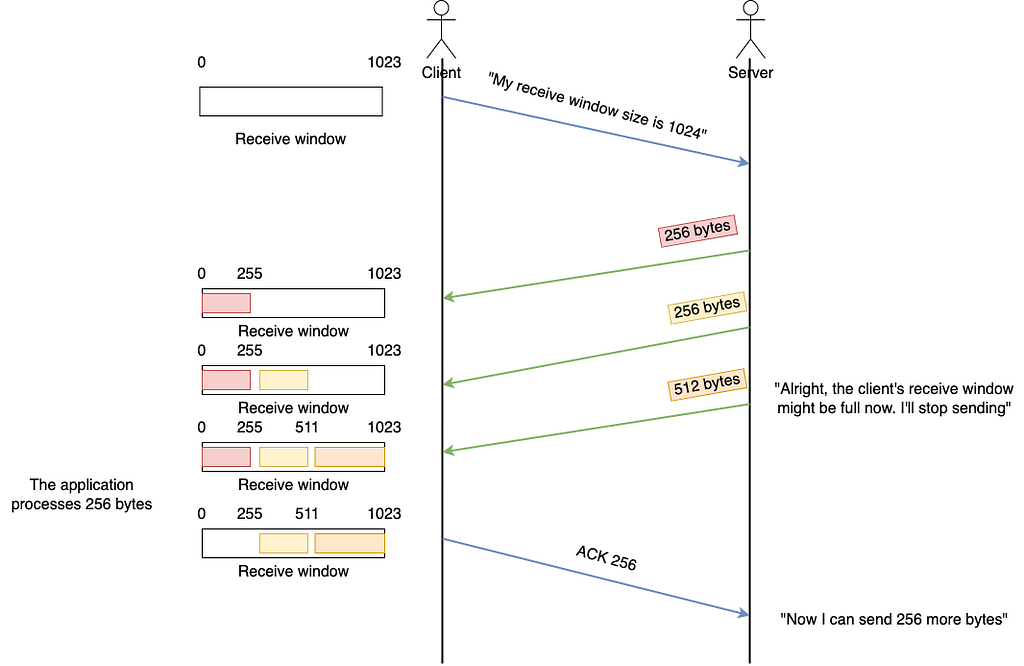
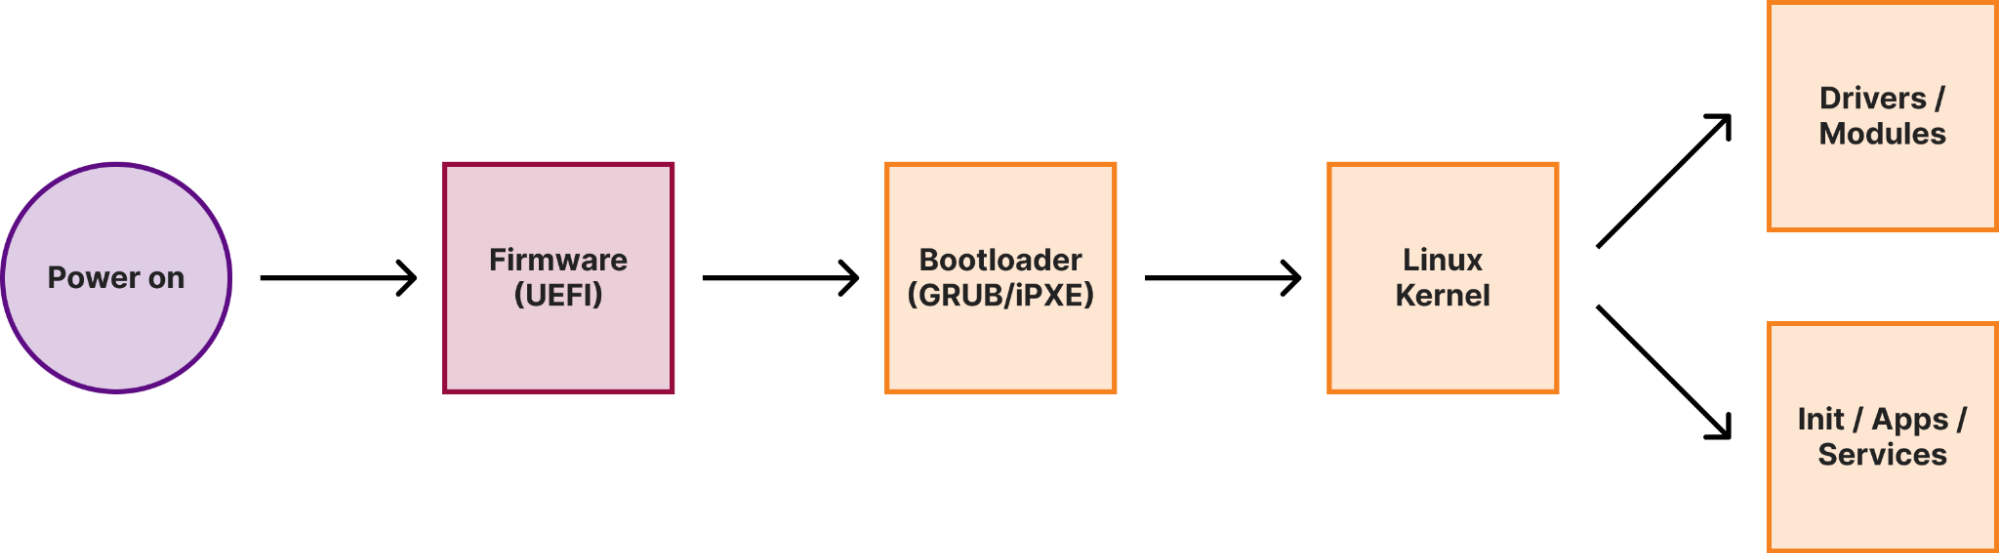
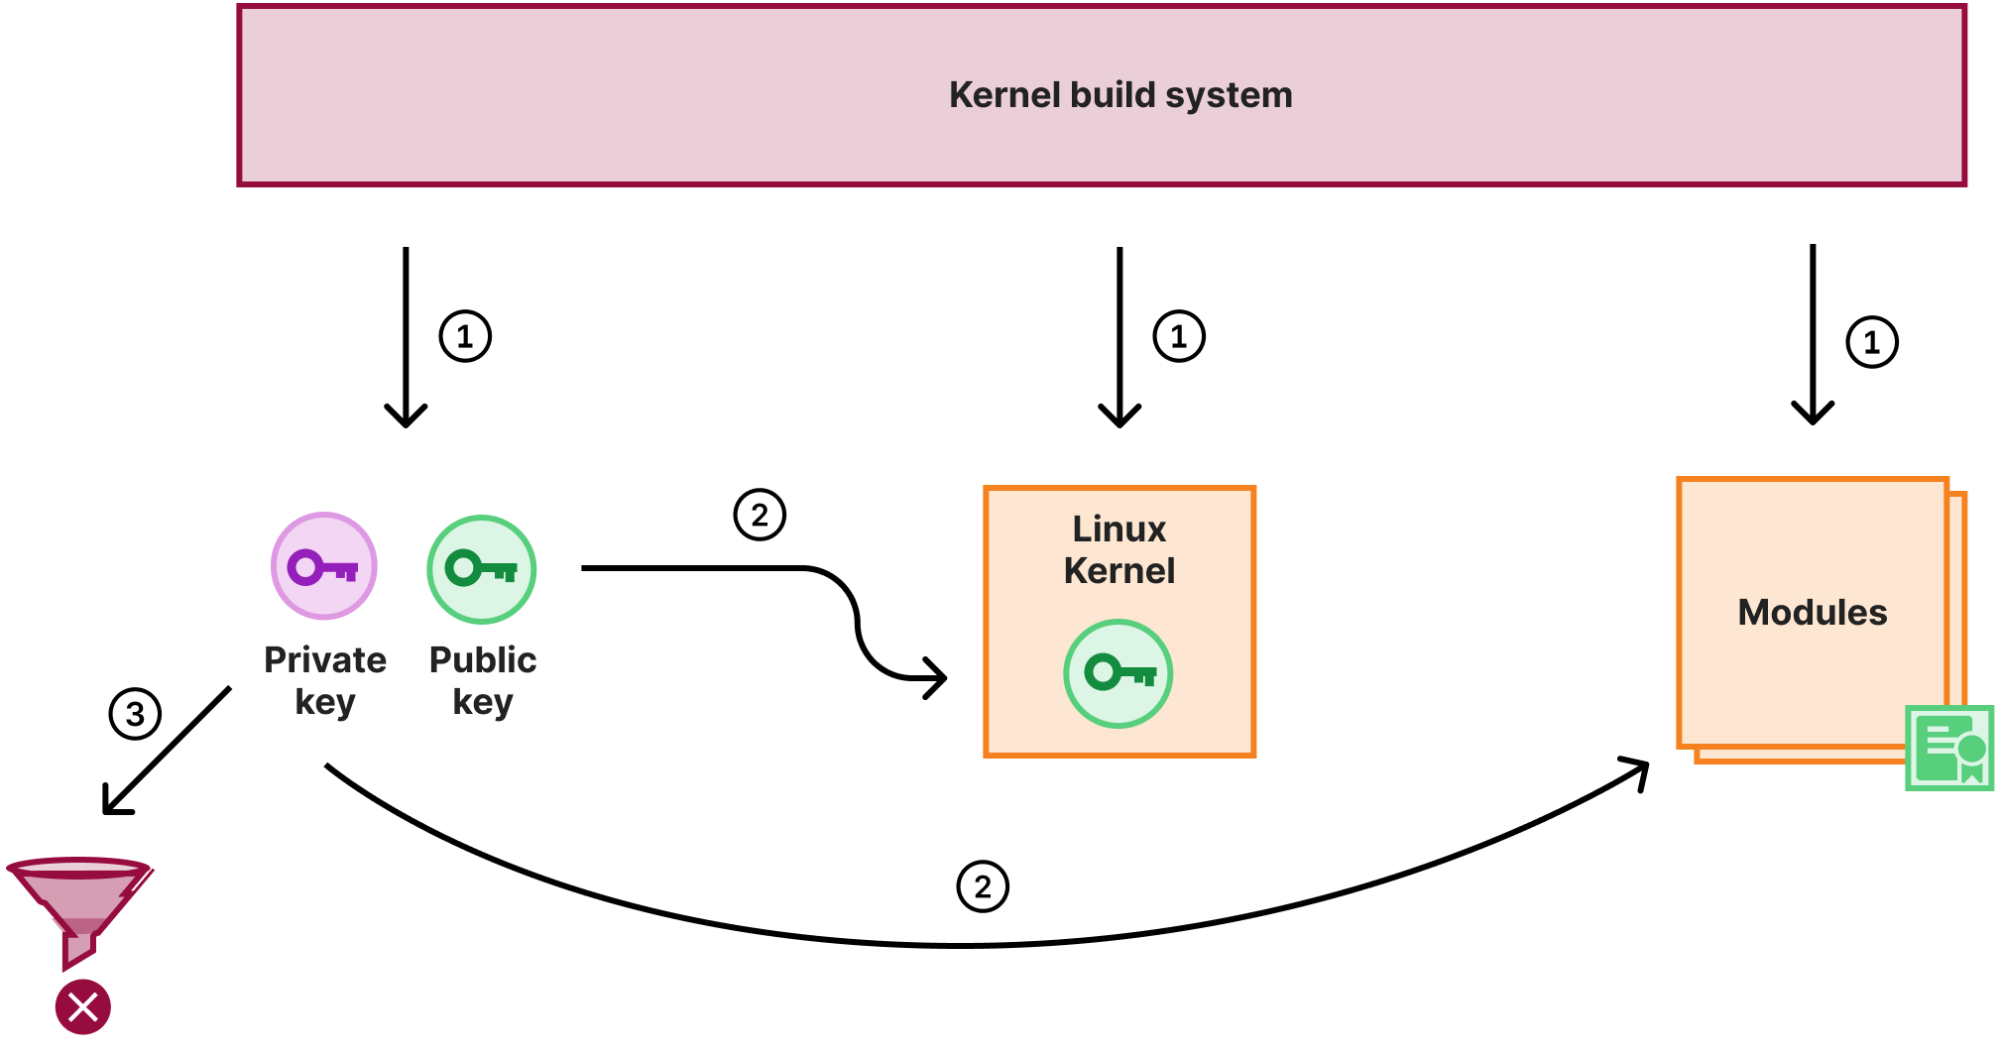
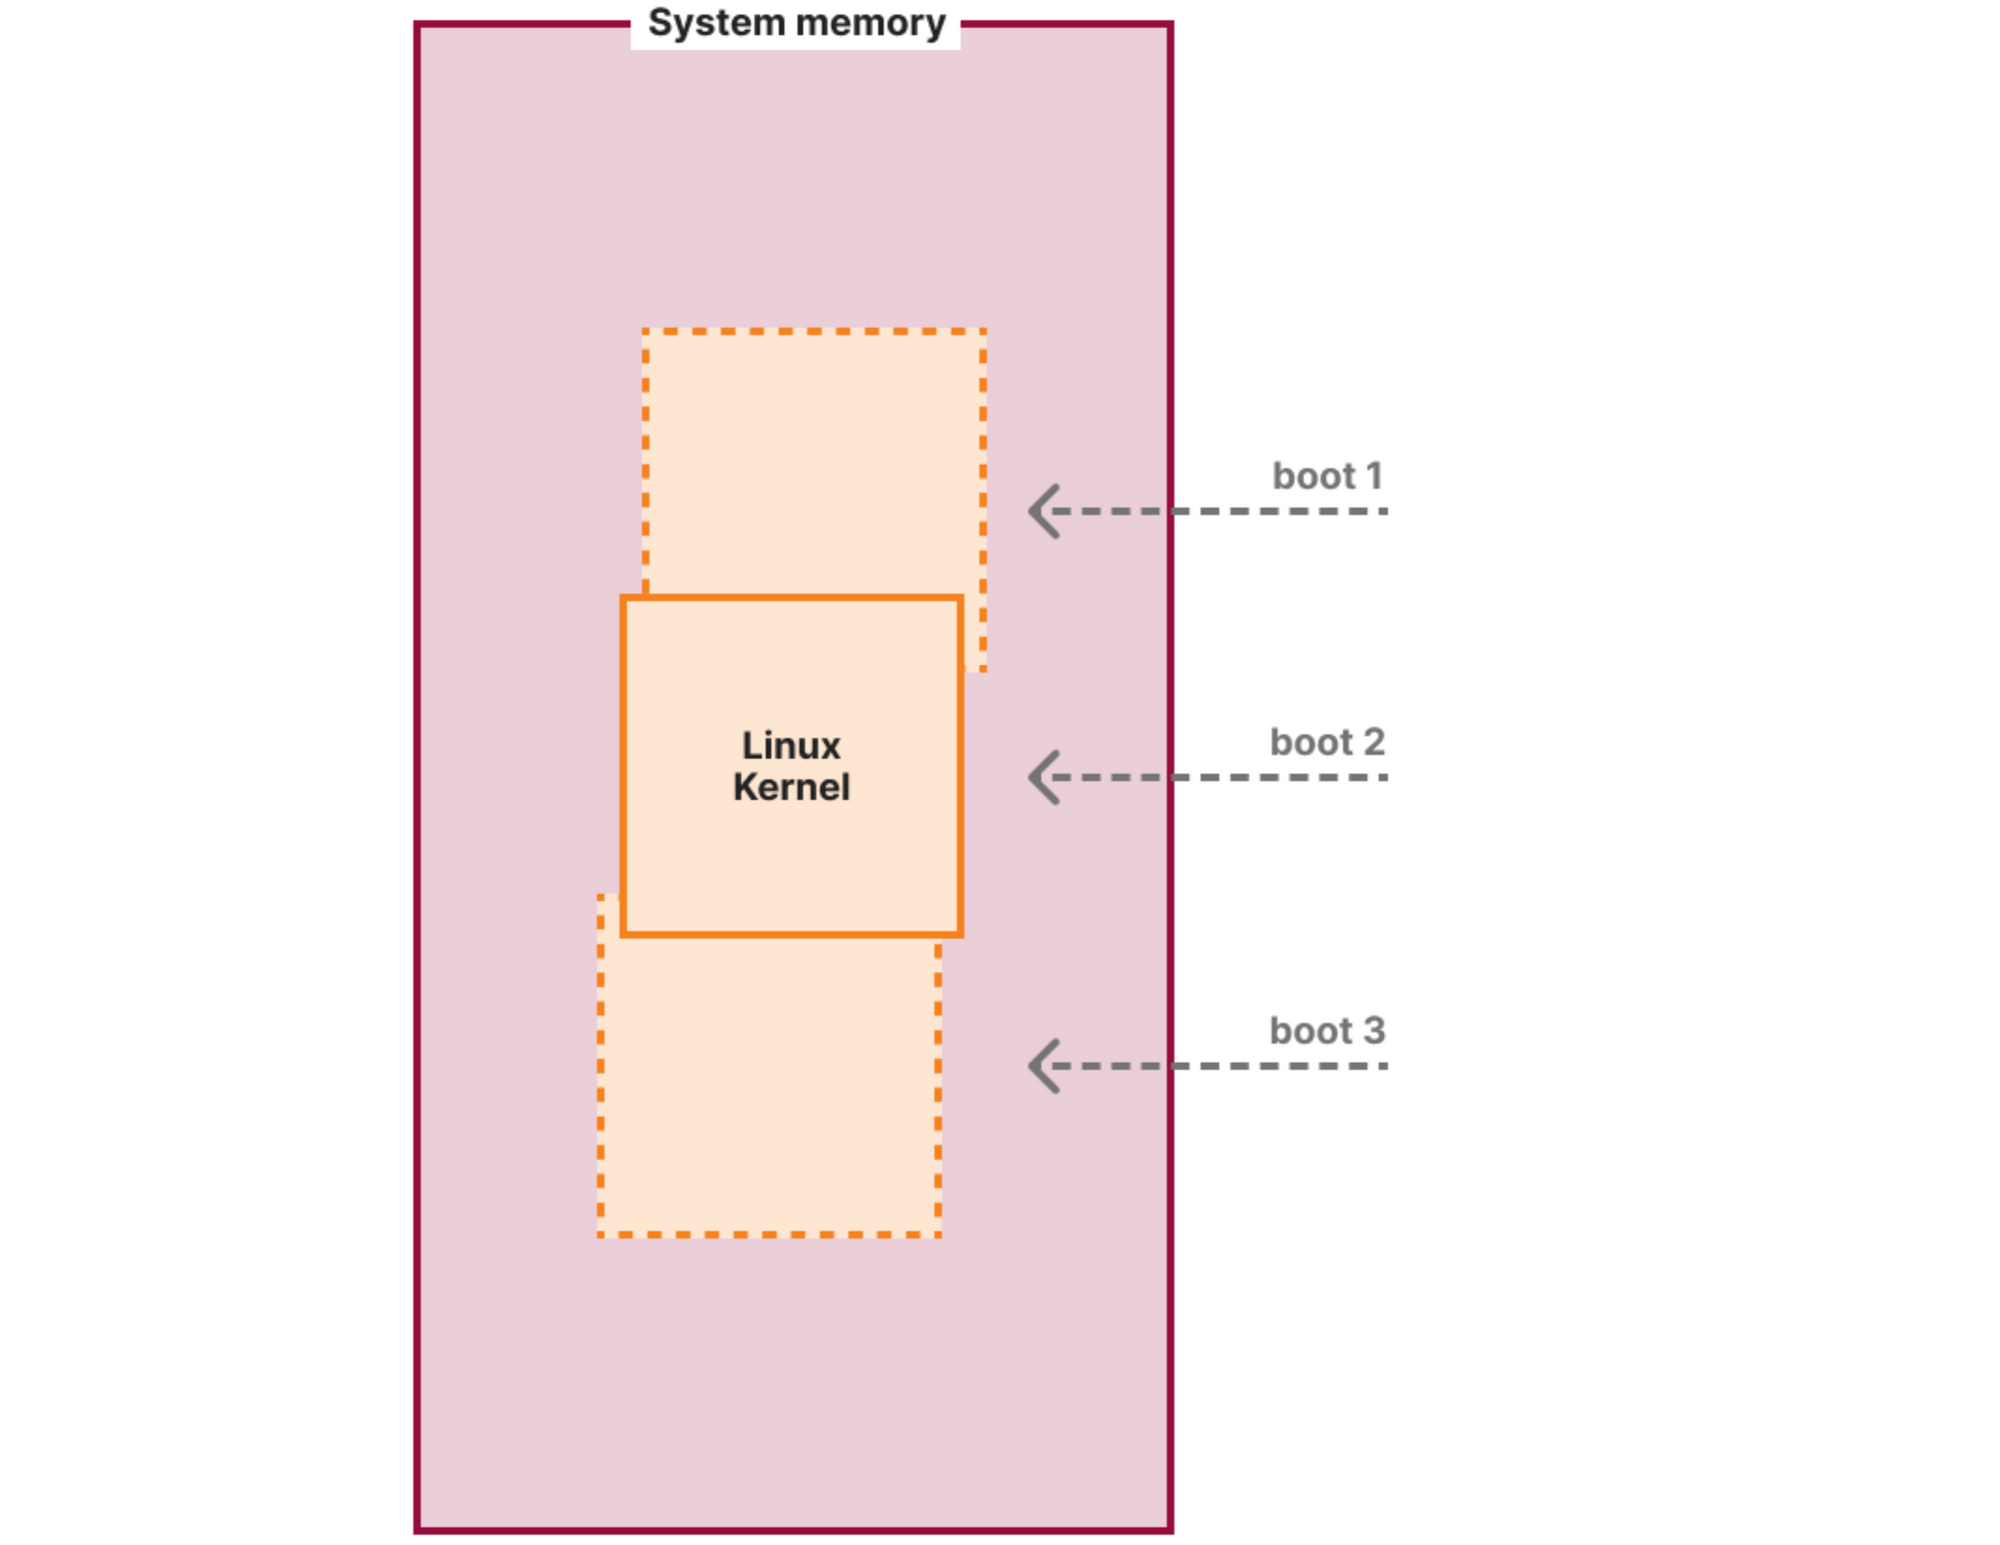


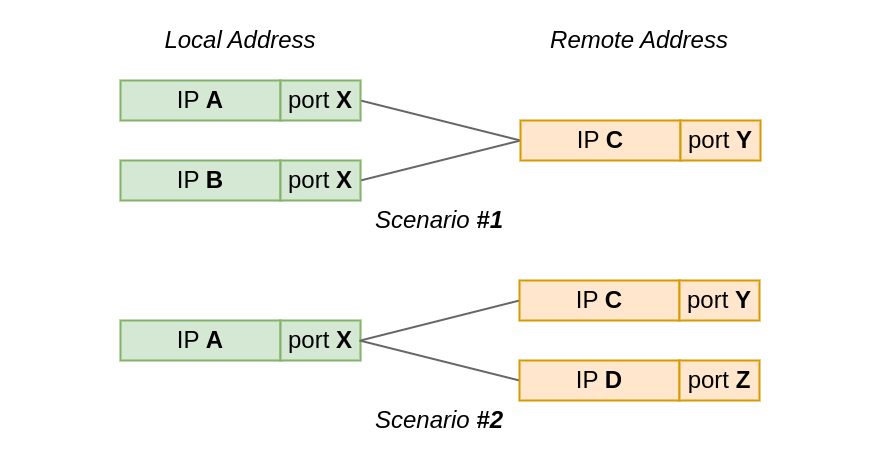
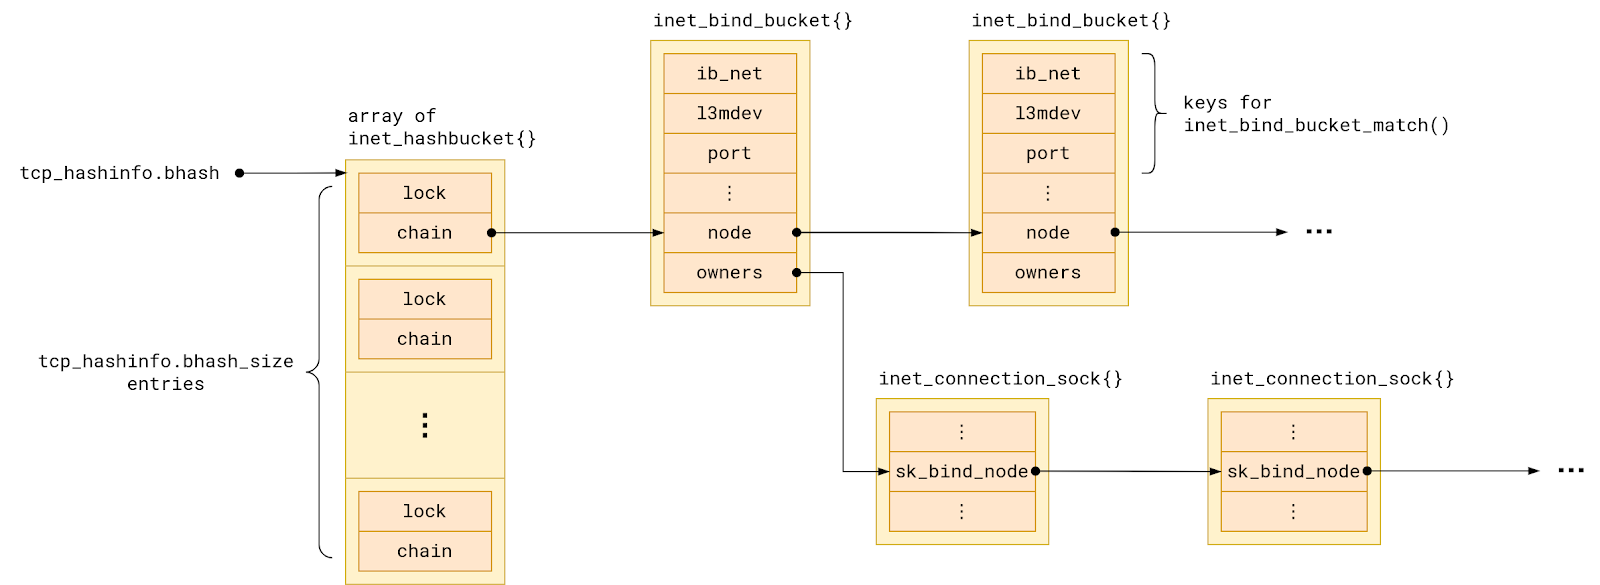
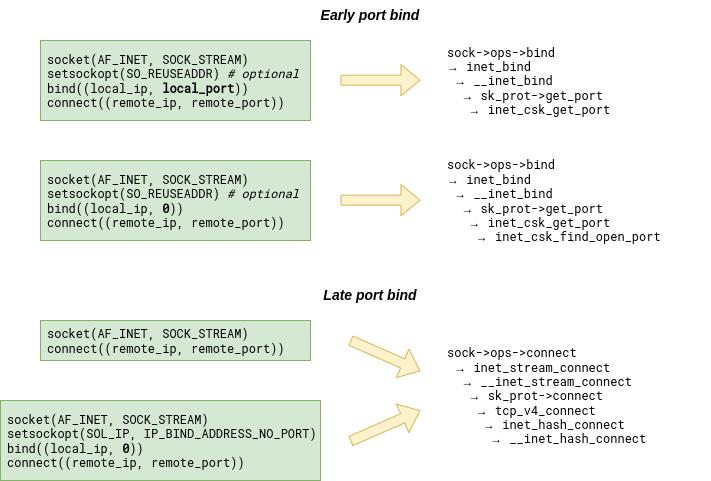
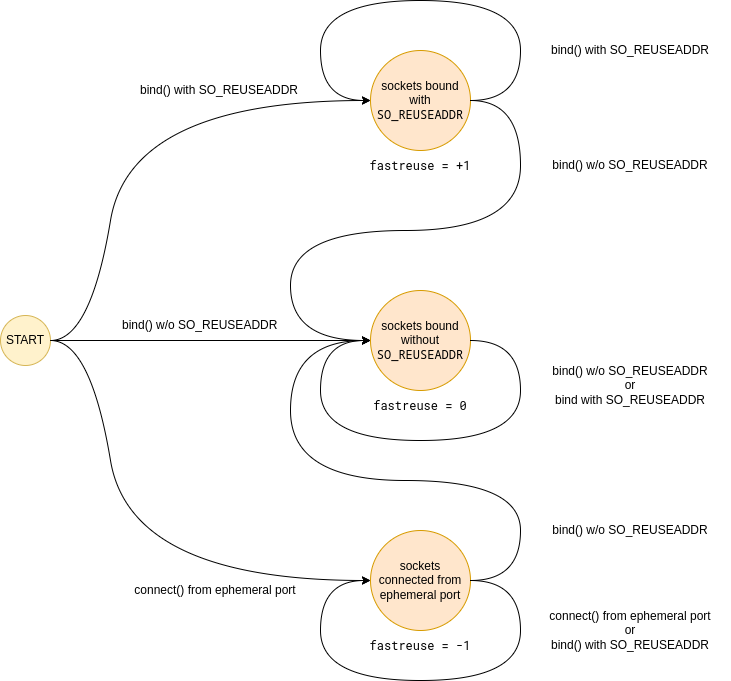


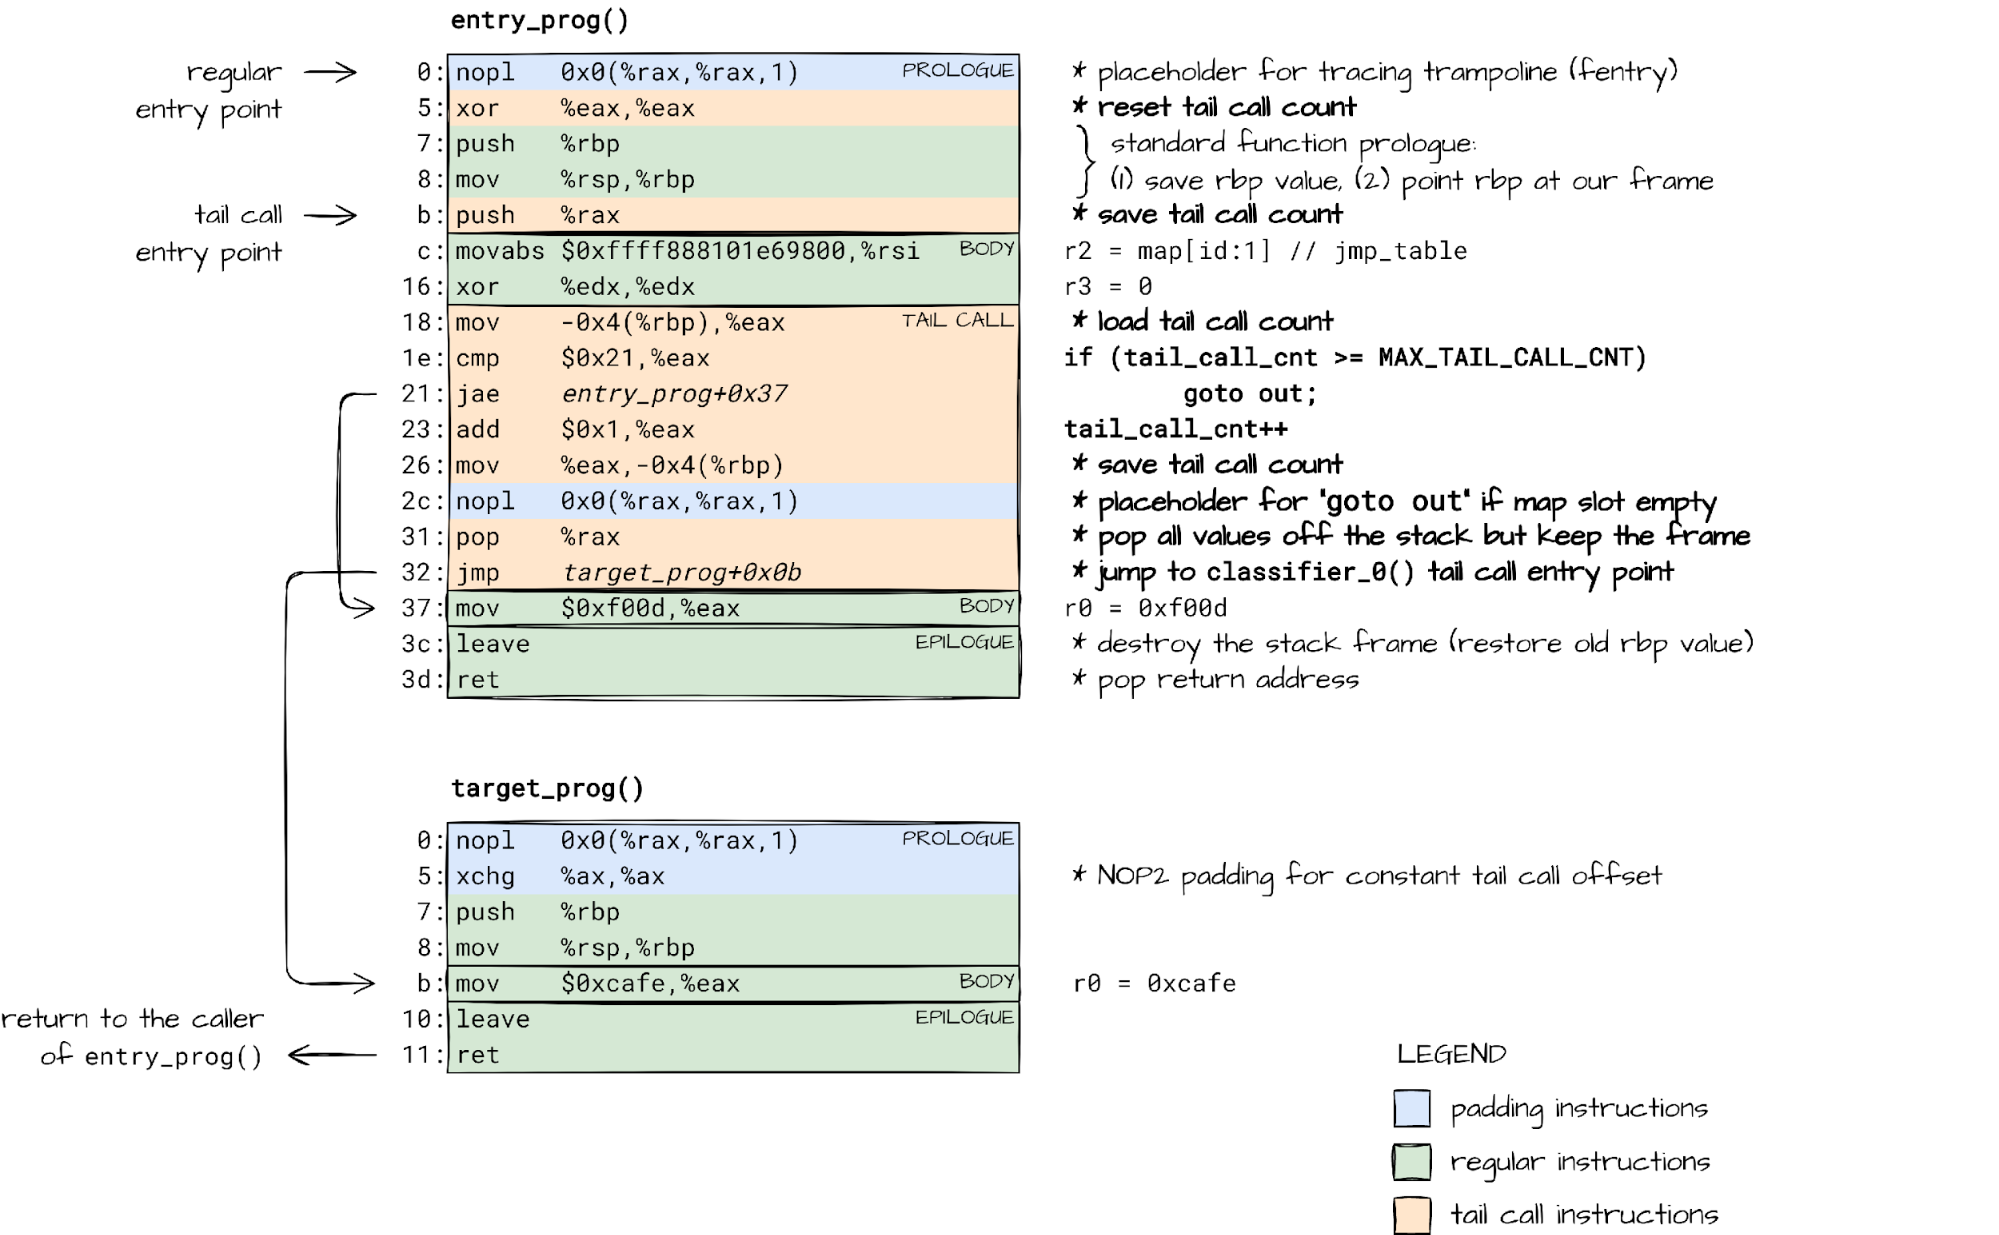
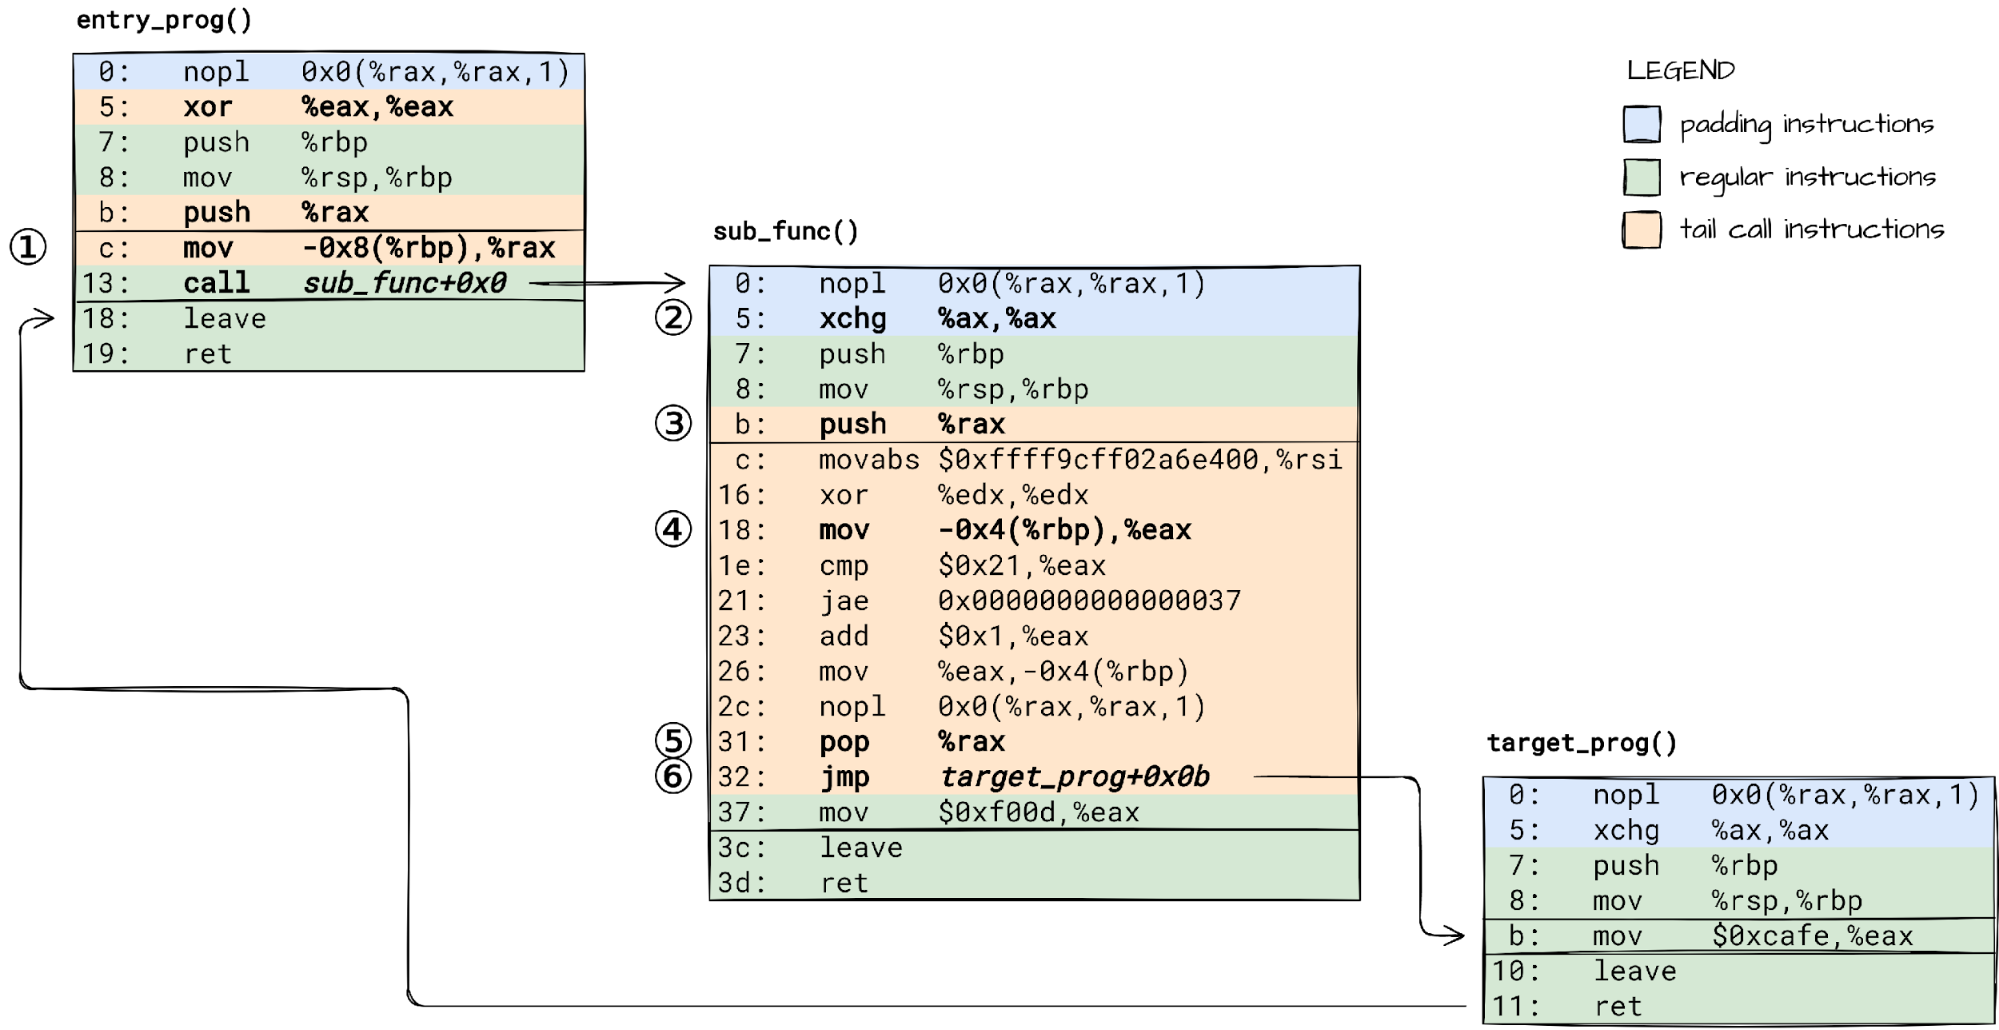

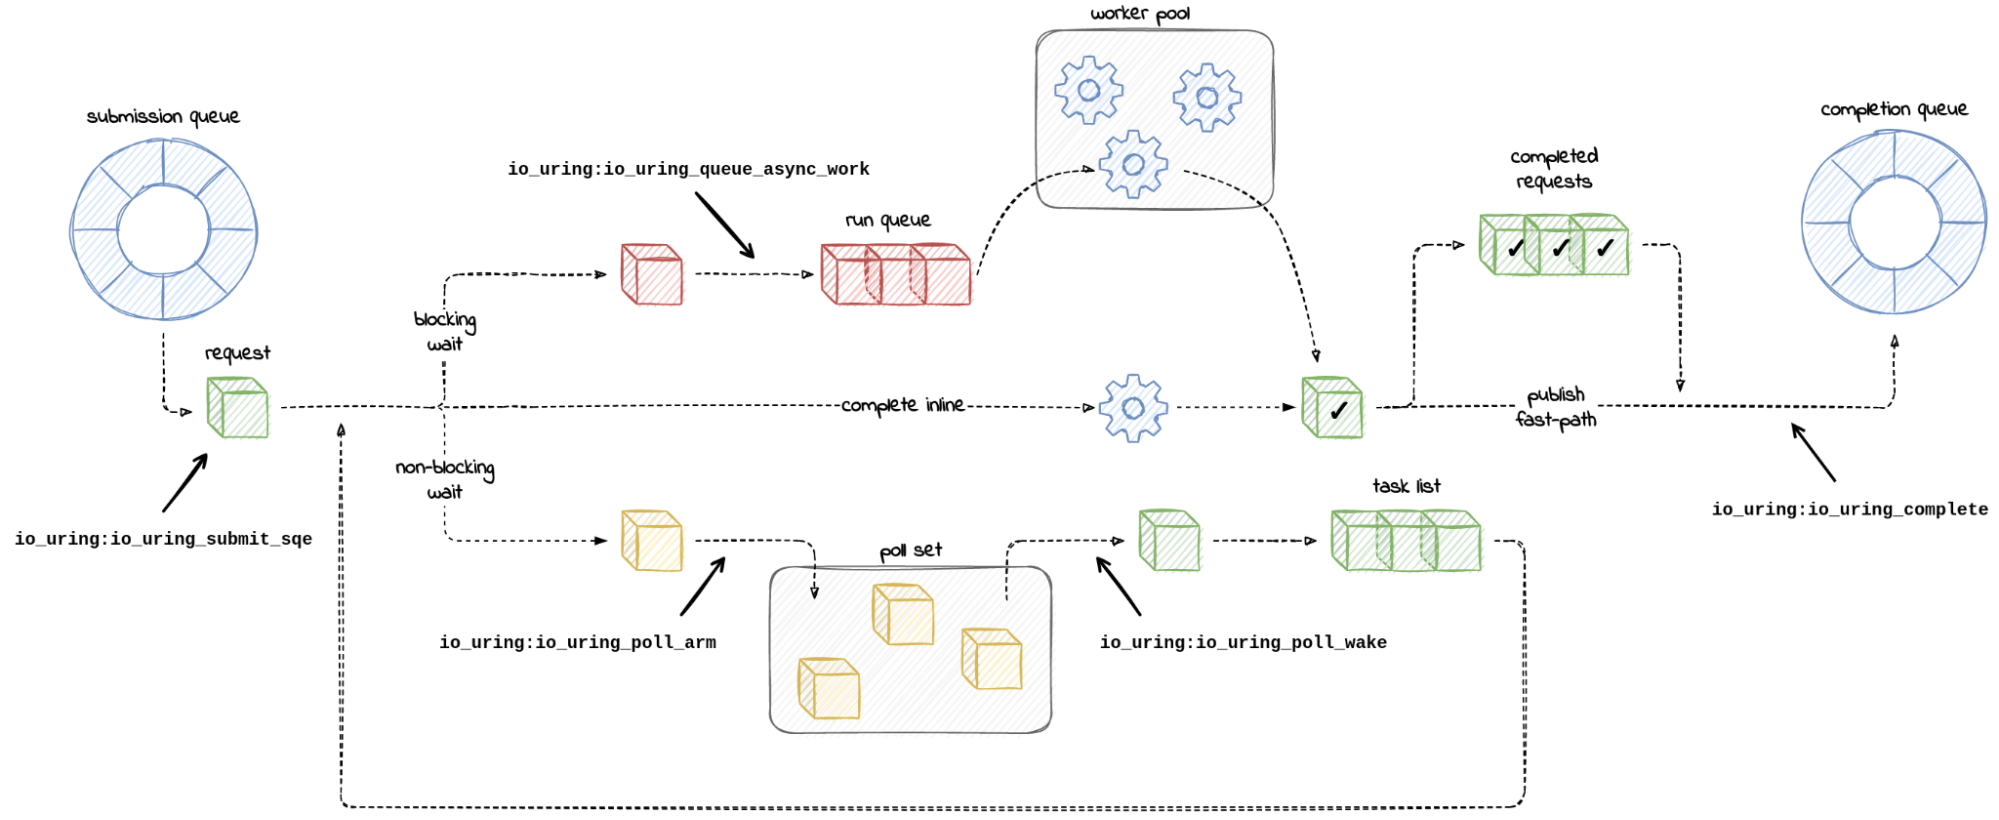
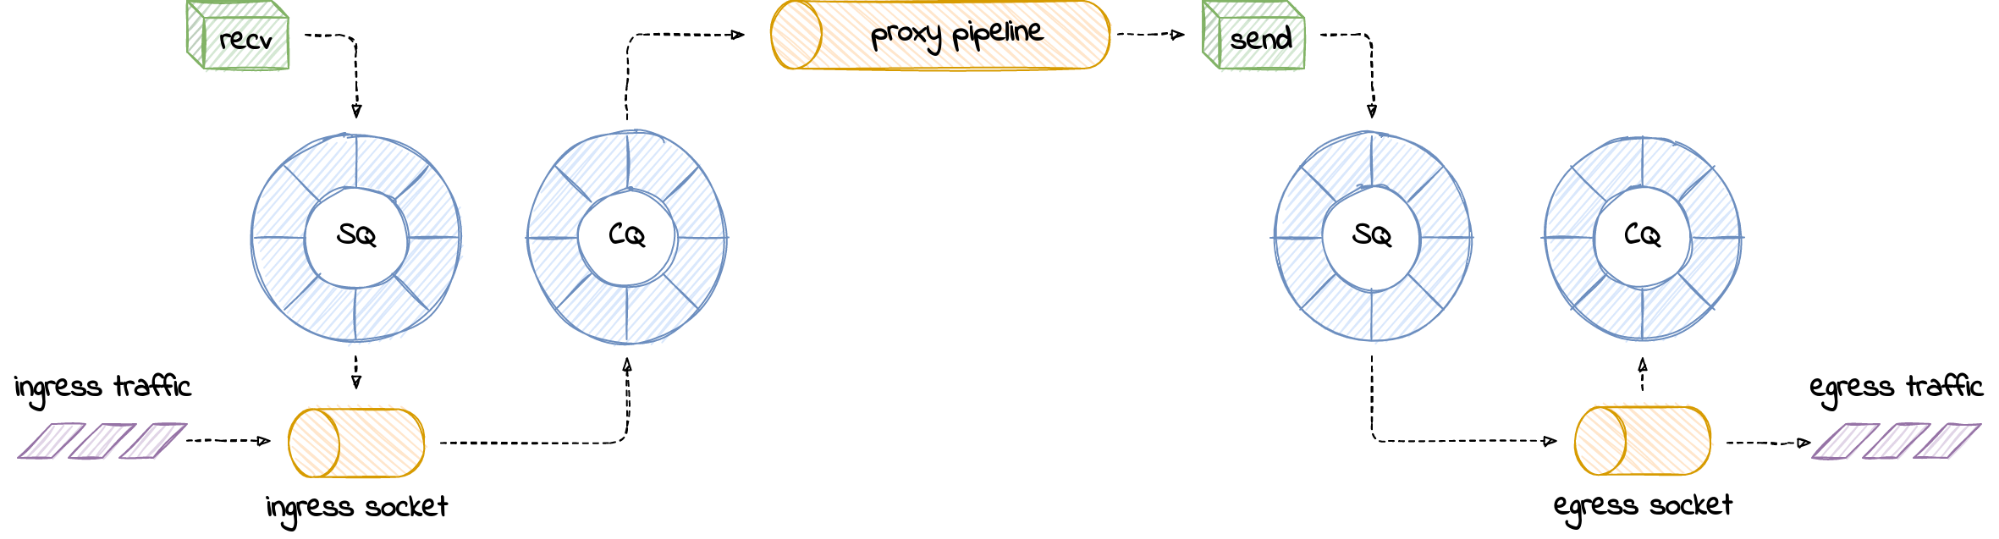
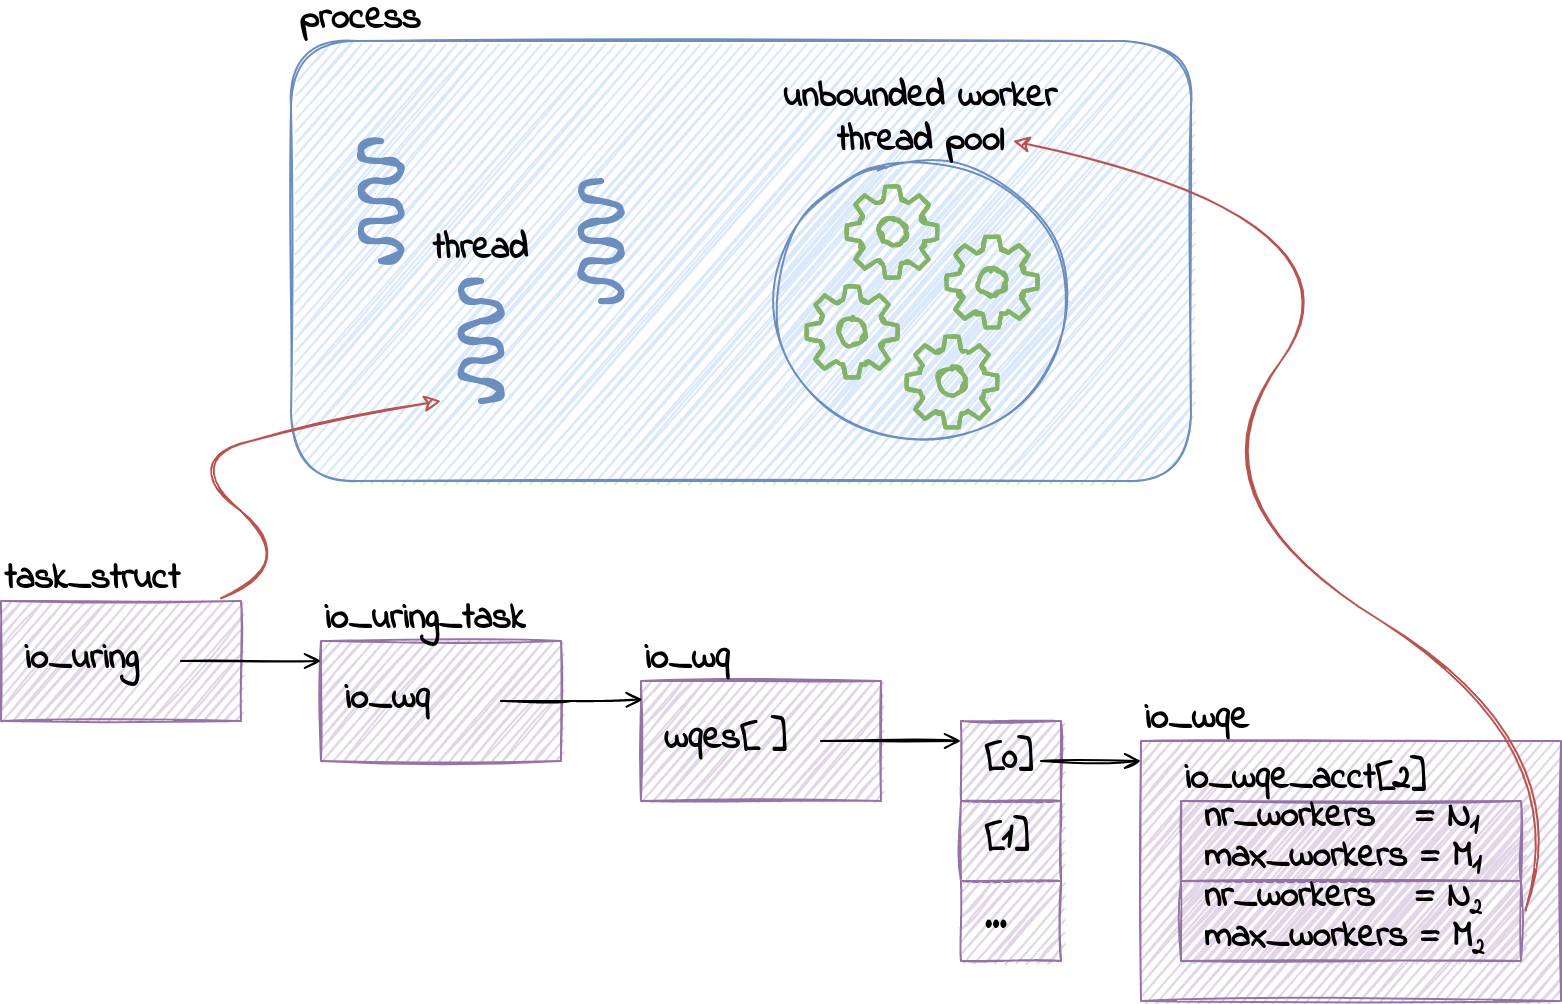
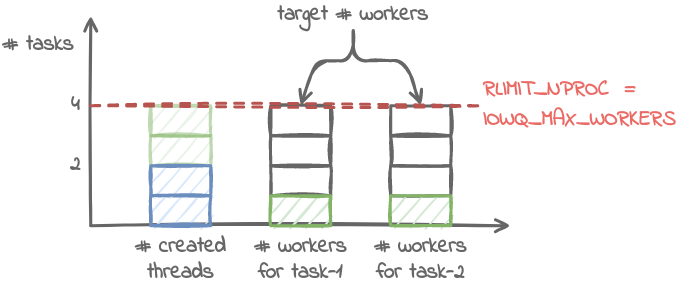


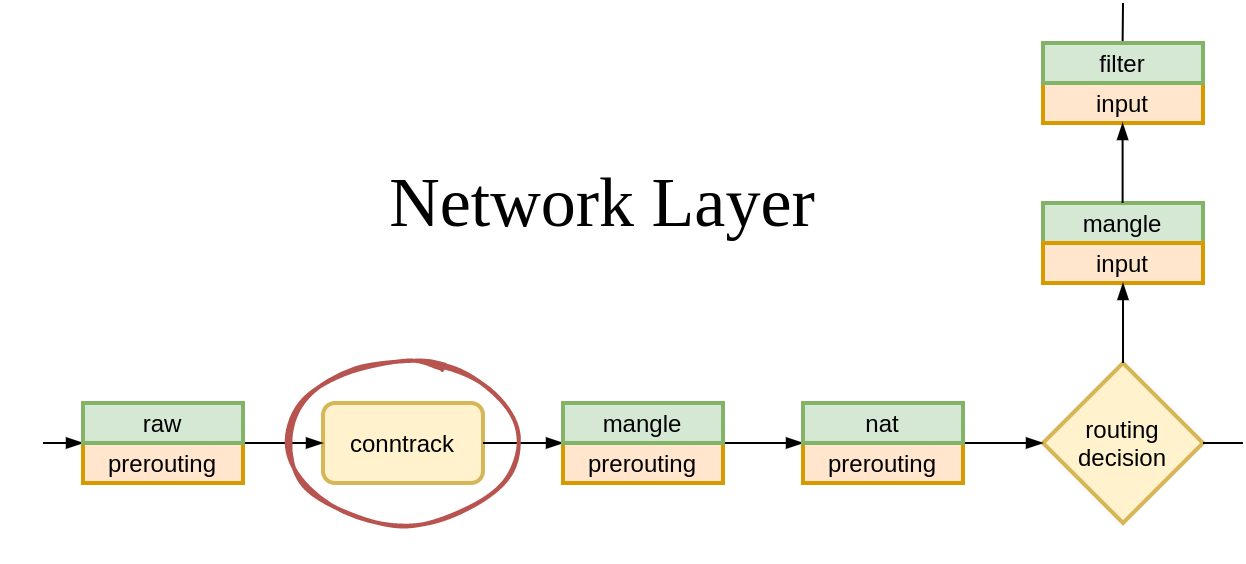
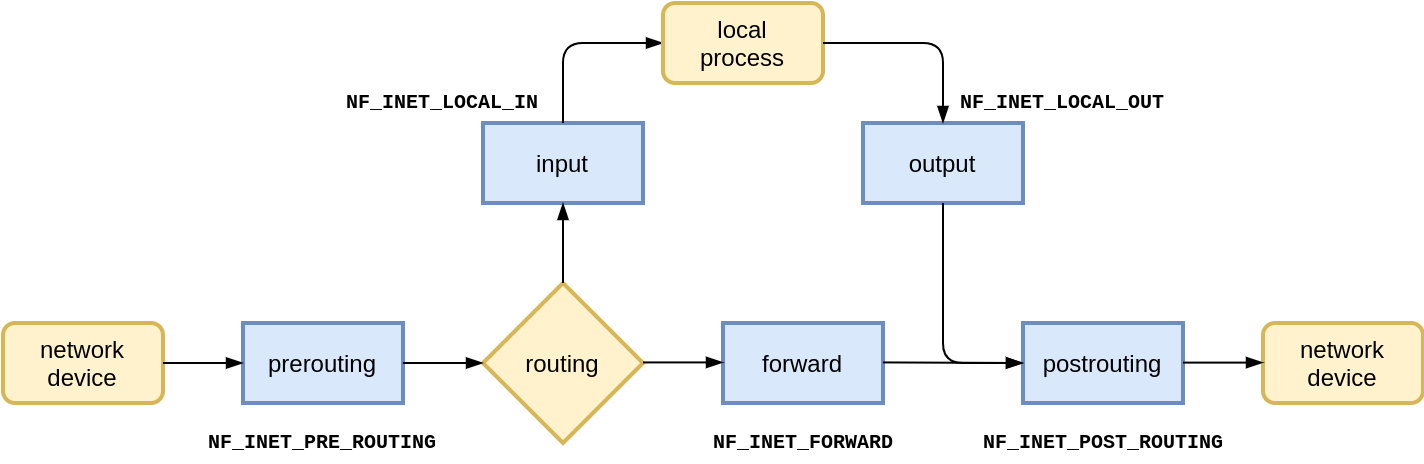
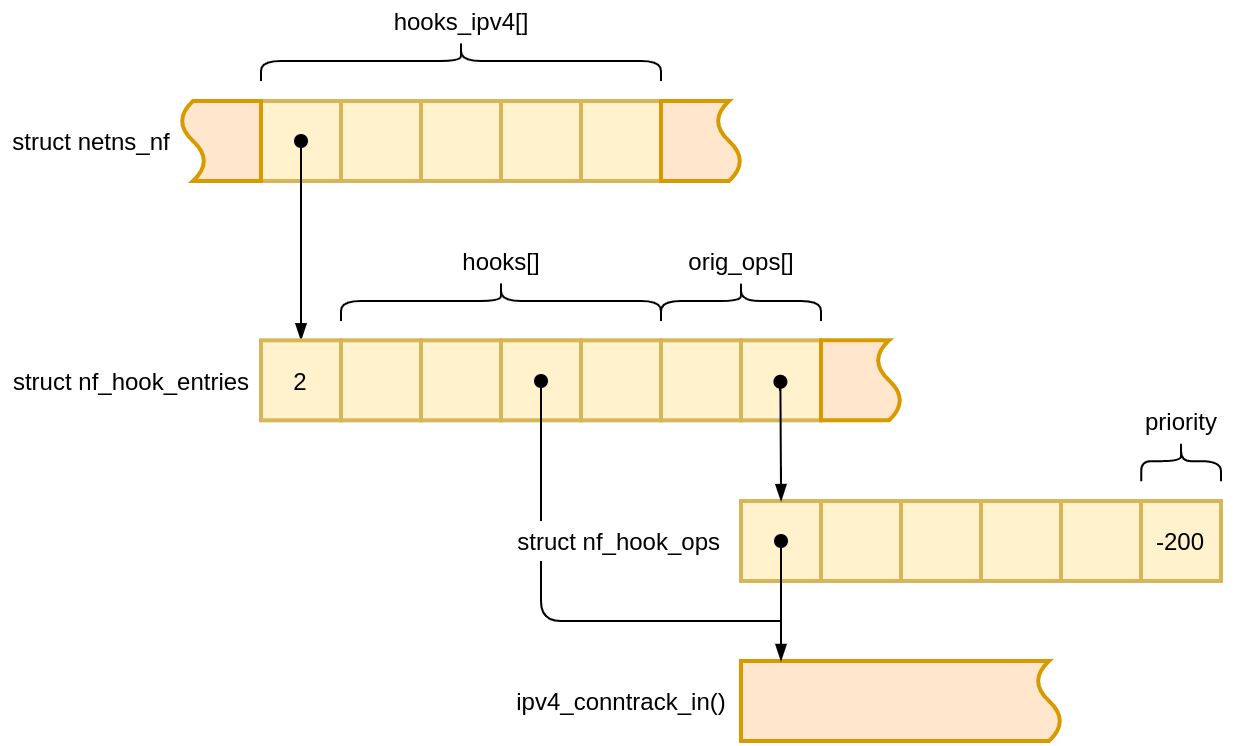
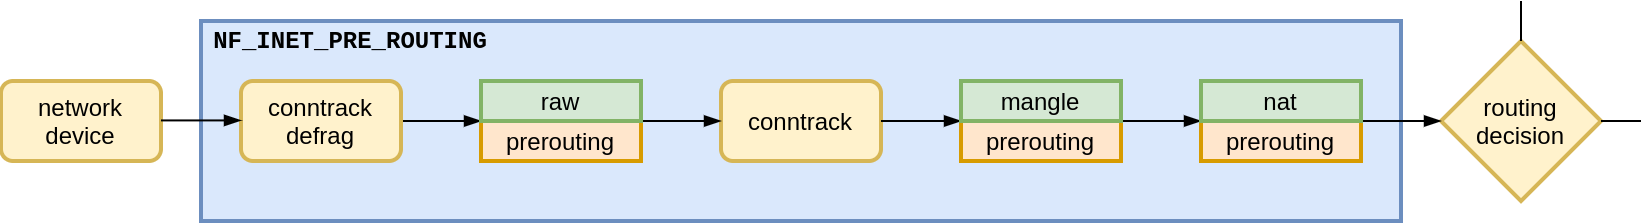
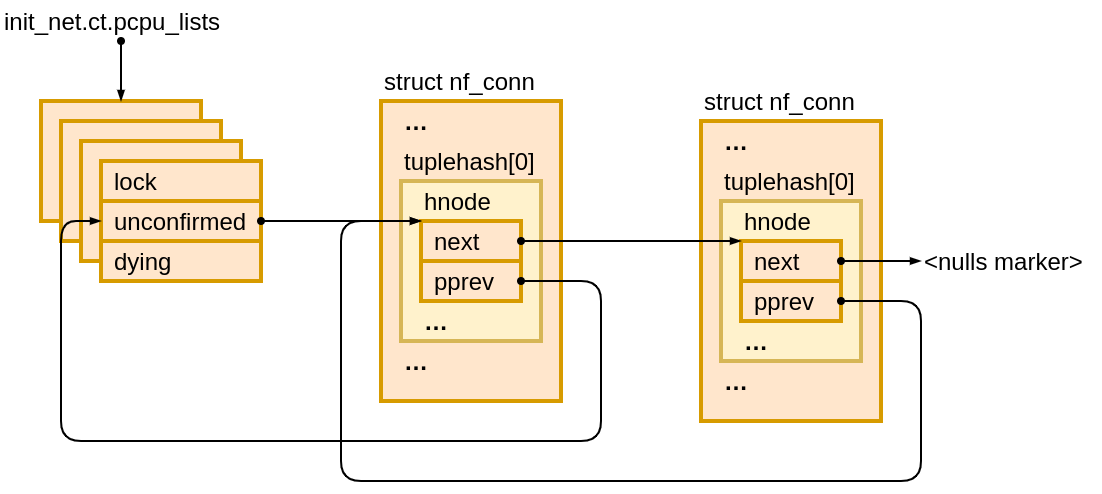