We blogged previously about some trends concerning the first round of the 2022 French presidential election, held on April 10. Here we take a look at the run-off election this Sunday, April 24, that ended up re-electing Emmanuel Macron as President of France.
First, the two main trends: French-language news sites outside France were clearly impacted by the local rule that states that exit polls can only be published after 20:00.
And Internet traffic was similar on both the election days (April 10 and 24) and that includes the increase in use of mobile devices and interest in news websites — there we also saw a clear interest in the Macron-Le Pen debate on April 20.
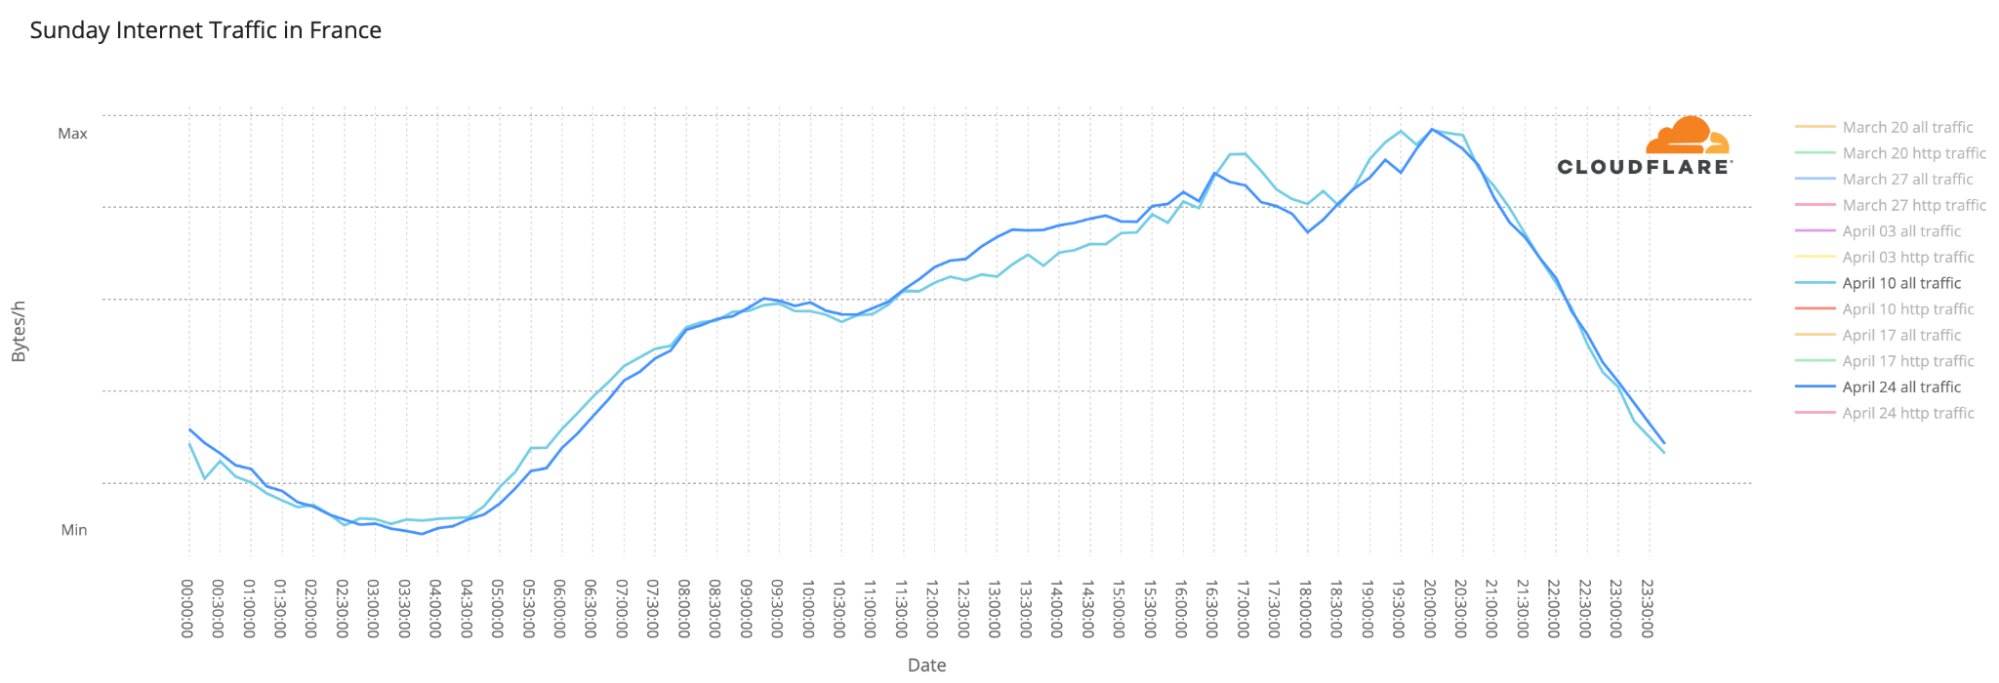
We have discussed before that election days usually don’t have a major impact on overall Internet traffic. Let’s compare April 10 with 24, the two Sundays when the elections were held. The trends throughout the day are incredibly similar (with a slight increase in traffic on April 24), even with a two-week gap between them.
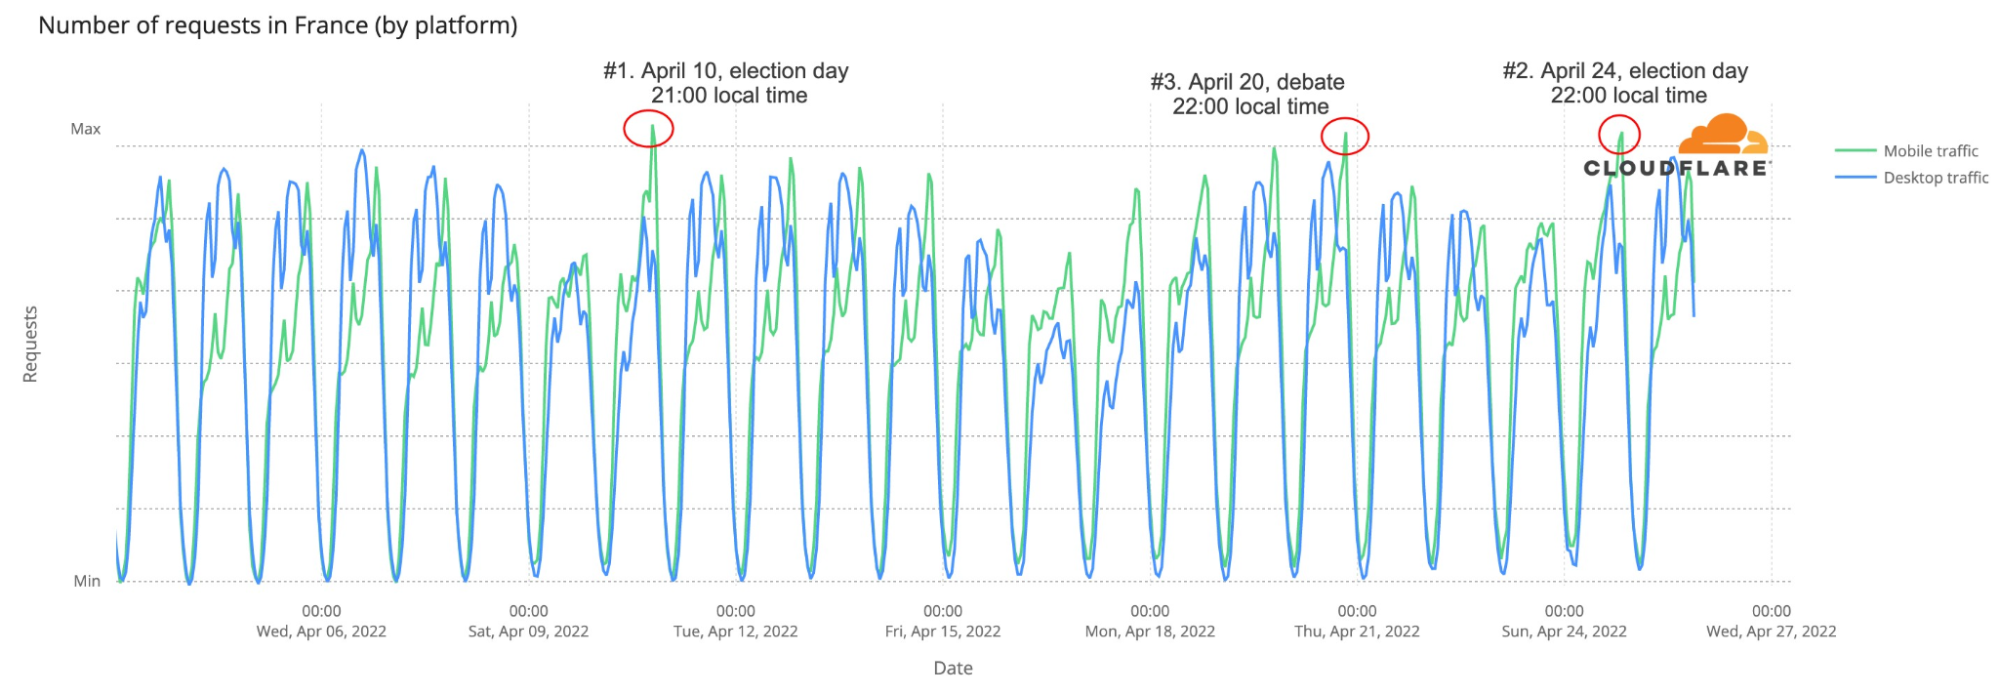
Another election-day trend is the use of mobile devices to access the Internet, mainly at night. The largest spikes in number of requests made using mobile devices in France during April seemed to be all election-related:
#1. April 10 (first round of the election), 21:00 local time. 58% of traffic by mobile devices.
#2. April 24 (second round of the election), 22:00. 57% mobile traffic.
#3. April 20 (presidential debate), 22:00. 56% mobile traffic.
Not only did both the election Sundays (after the polling stations were closed) have an impact on mobile traffic in France, but the presidential debate (Wednesday, April 20) had the same type of impact, increasing requests from mobile devices.
The TV debate was seen by 15.6 million viewers in France and lasted between 21:00 and 22:45, local time; at the same time mobile traffic was higher than in any other Wednesday and was the #3 spike of April, with 10% more mobile requests than in the previous Wednesday at the same time.
The special case of French-language news sites
For the elections, local rules state that French media is barred from publishing partial results or polls of any kind until 20:00, the time when voting stations in metropolitan France officially close. So, that means that French news outlets have to wait for the allotted hour to give official projections.
Given that, we looked at French-language news websites from French-speaking countries like Switzerland and Belgium. They aren’t bound by French law and can show information about exit polls earlier (bear in mind that in most French cities polling stations close at 19:00 and only in the bigger cities does it go on until 20:00).
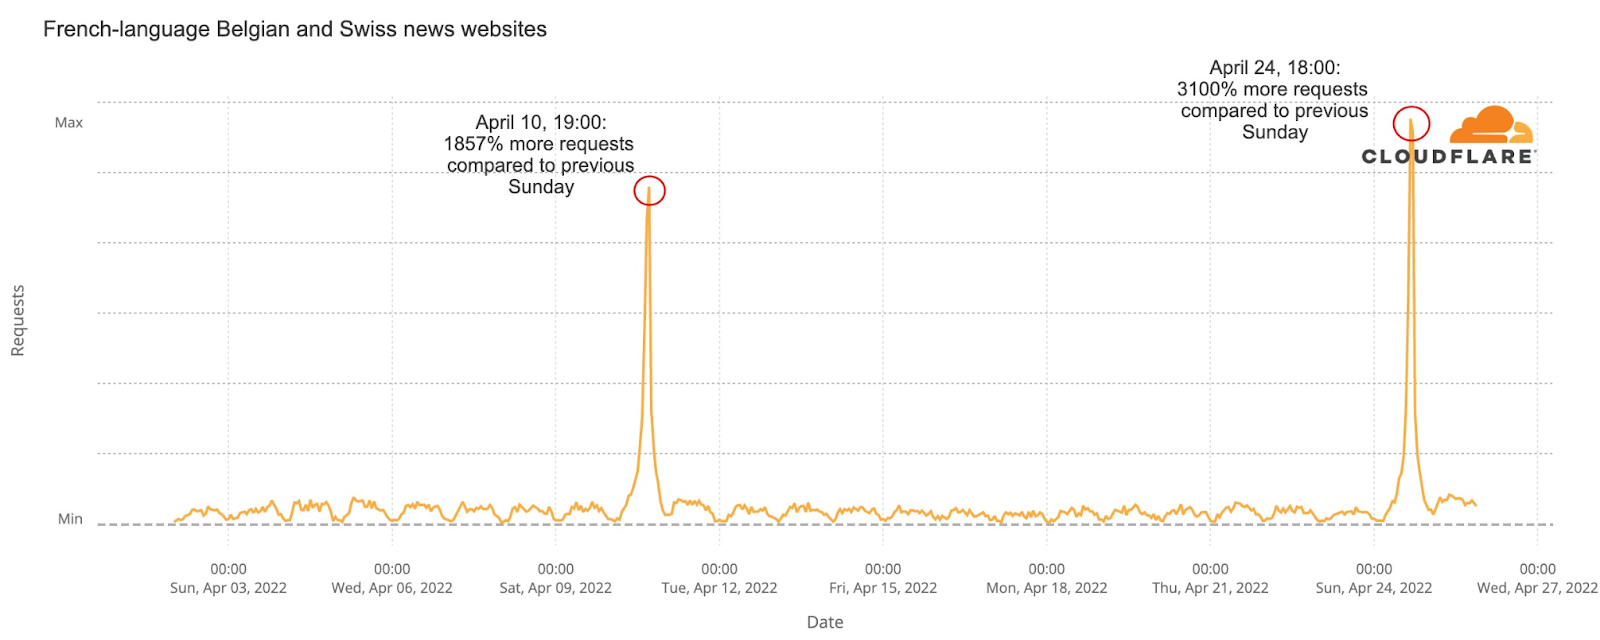
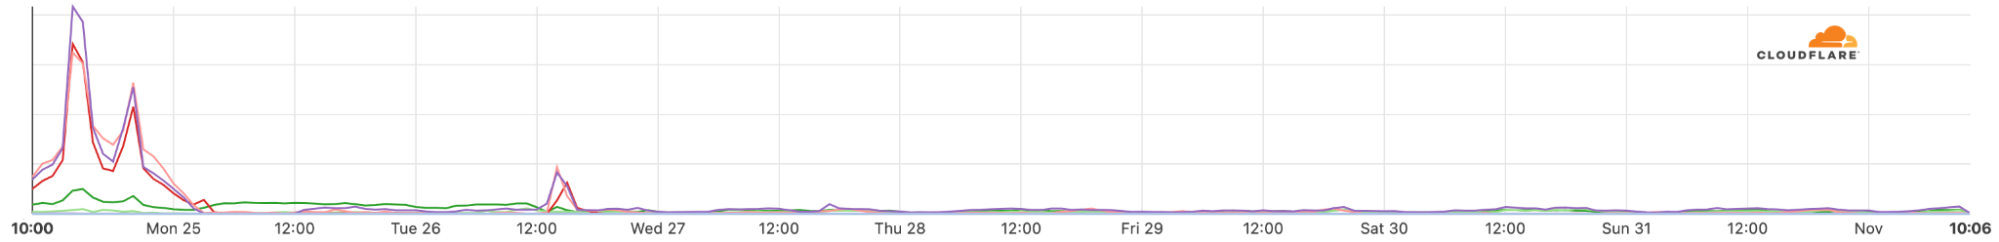
We can clearly see that requests to French-language news sites outside France clearly spiked earlier than those in France. News websites in France had spikes after 20:00 local time on both elections days, but Belgian and Swiss news sites had major increases in traffic at 19:00 on April 10 (1857% more than the previous Sunday!). For the runoff elections on April 24, the biggest spike of the month was at 18:00 (3100% more requests than the previous Sunday), but it was also higher than on previous days one hour later, at 19:00 (3080% higher).
There are no spikes at all related to the French debate (April 20), so that seems to show that those Belgian and Swiss news sites had a huge increase of French citizens eager to see the polls before 20:00.
Election results change online patterns
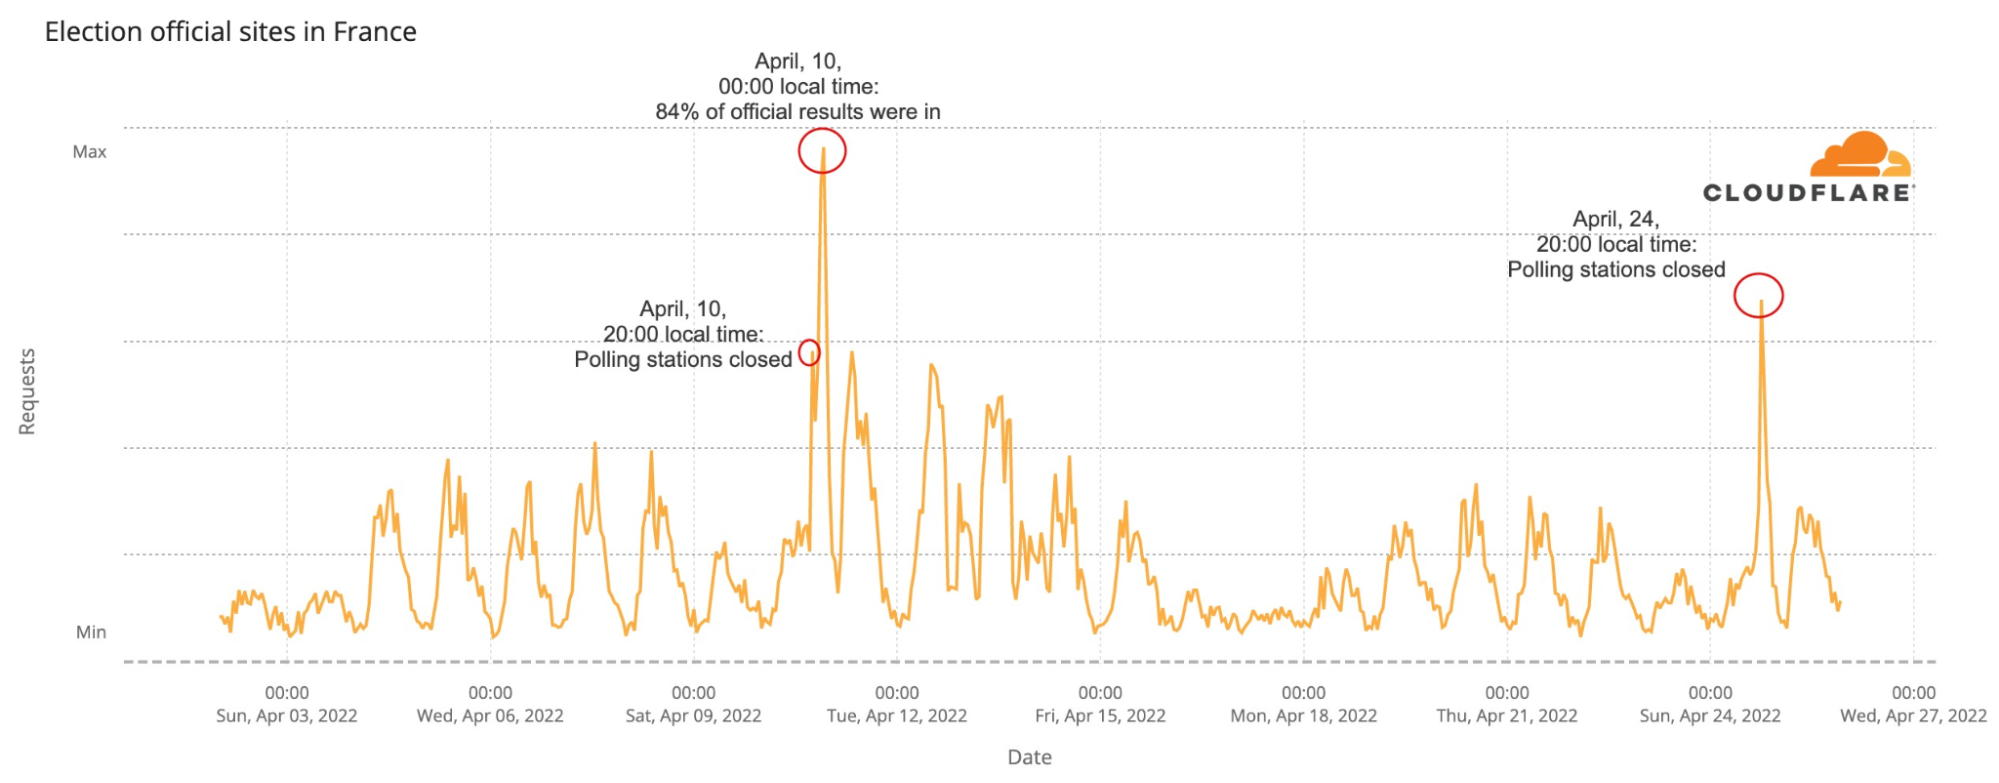
We saw two weeks ago that official election websites had a clear spike in requests on April 10, the first round of the elections. Here we’re looking at DNS request trends to get a sense of traffic to Internet properties.
Official French election-related websites had an increase in traffic throughout the week prior to the first round, after Monday, April 4, but it’s no surprise that the two major spikes were on both the elections’ day. How much? Here is the breakdown by bigger spikes in traffic:
#1. April 10 (first round of the election), 00:00 local time. 925% more requests than the previous Sunday (at the same time).
#2. April 24 (second round of the election), 20:00. 707% more requests.
#3. April 10 (first round of the election), 20:00. 370% more requests.
#3. April 11, 10:00. 115% more requests than the previous Monday.
(there’s a draw at these last two spikes)
News sites go up after polling stations close
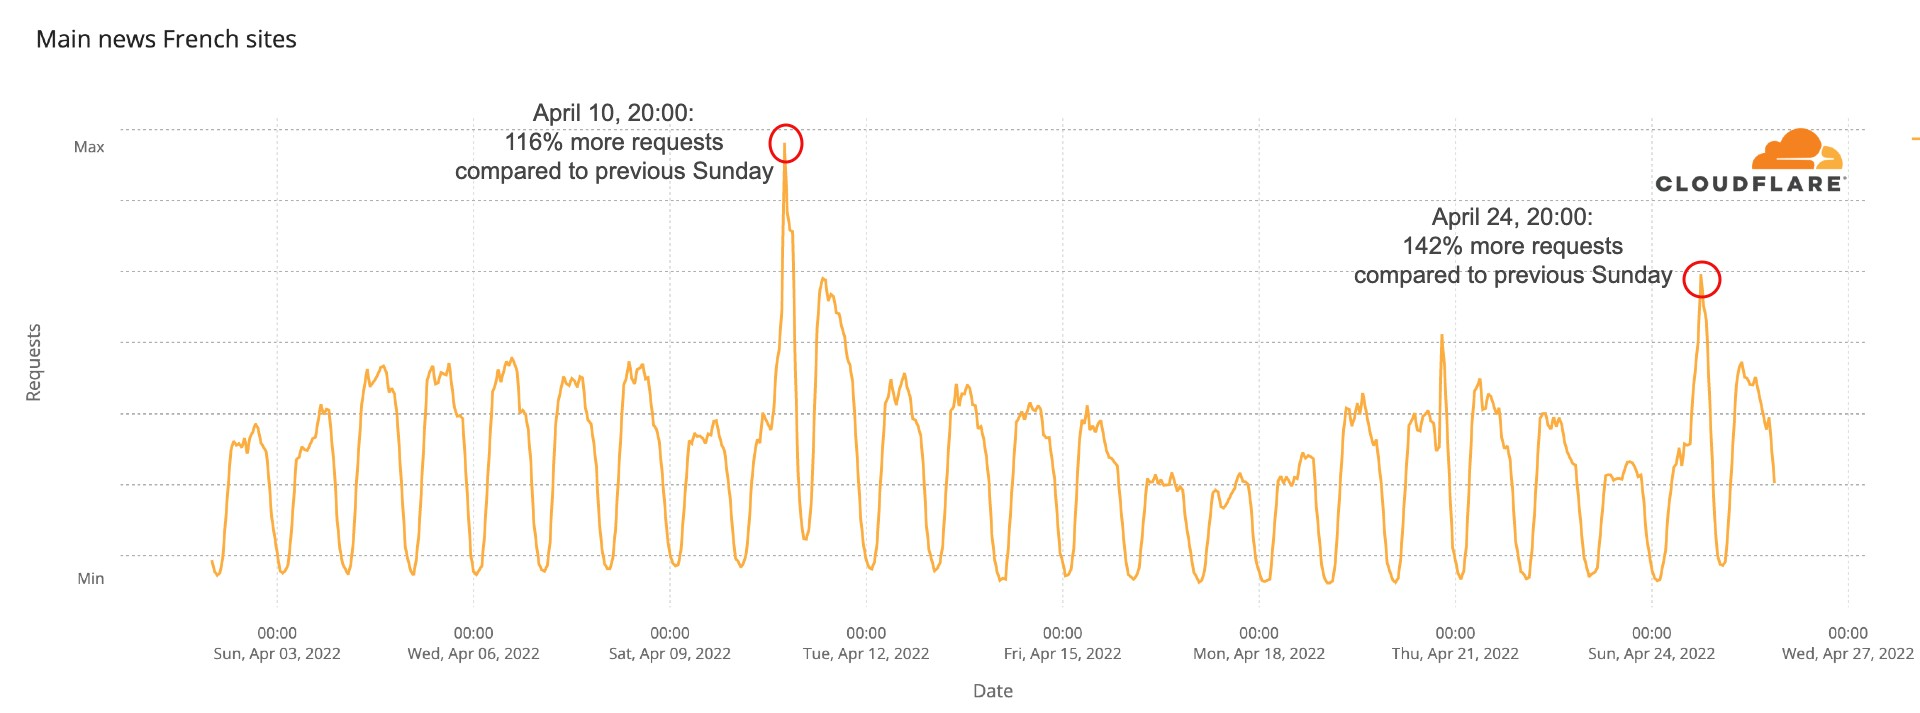
Regarding the main French news websites, as we saw two weeks ago, 20:00 local time, after the polling stations are all closed, and the first major polls are revealed continues to be the time of the biggest spikes of the whole month.
The biggest spike of the month in our aggregate DNS chart, that shows trends from 12 news websites, was definitely on April 10, the first round election day, around 20:00 local time, when those domains had 116% more traffic than at the same time on the previous Sunday. And the second-biggest spike was the runoff election day, on April 24, at the same time (20:00 local time), with an increase of 142% in traffic compared to the previous Sunday at the same time.
Very close to those two spikes is Monday morning, April 11, after the first round of the elections. At 10:00 local time requests were 45% higher than in the previous Monday. The Macron-Le Pen debate on Wednesday, April 20, also had a spike. At 21:00, when it was starting, requests were 56% higher than on the previous Wednesday.
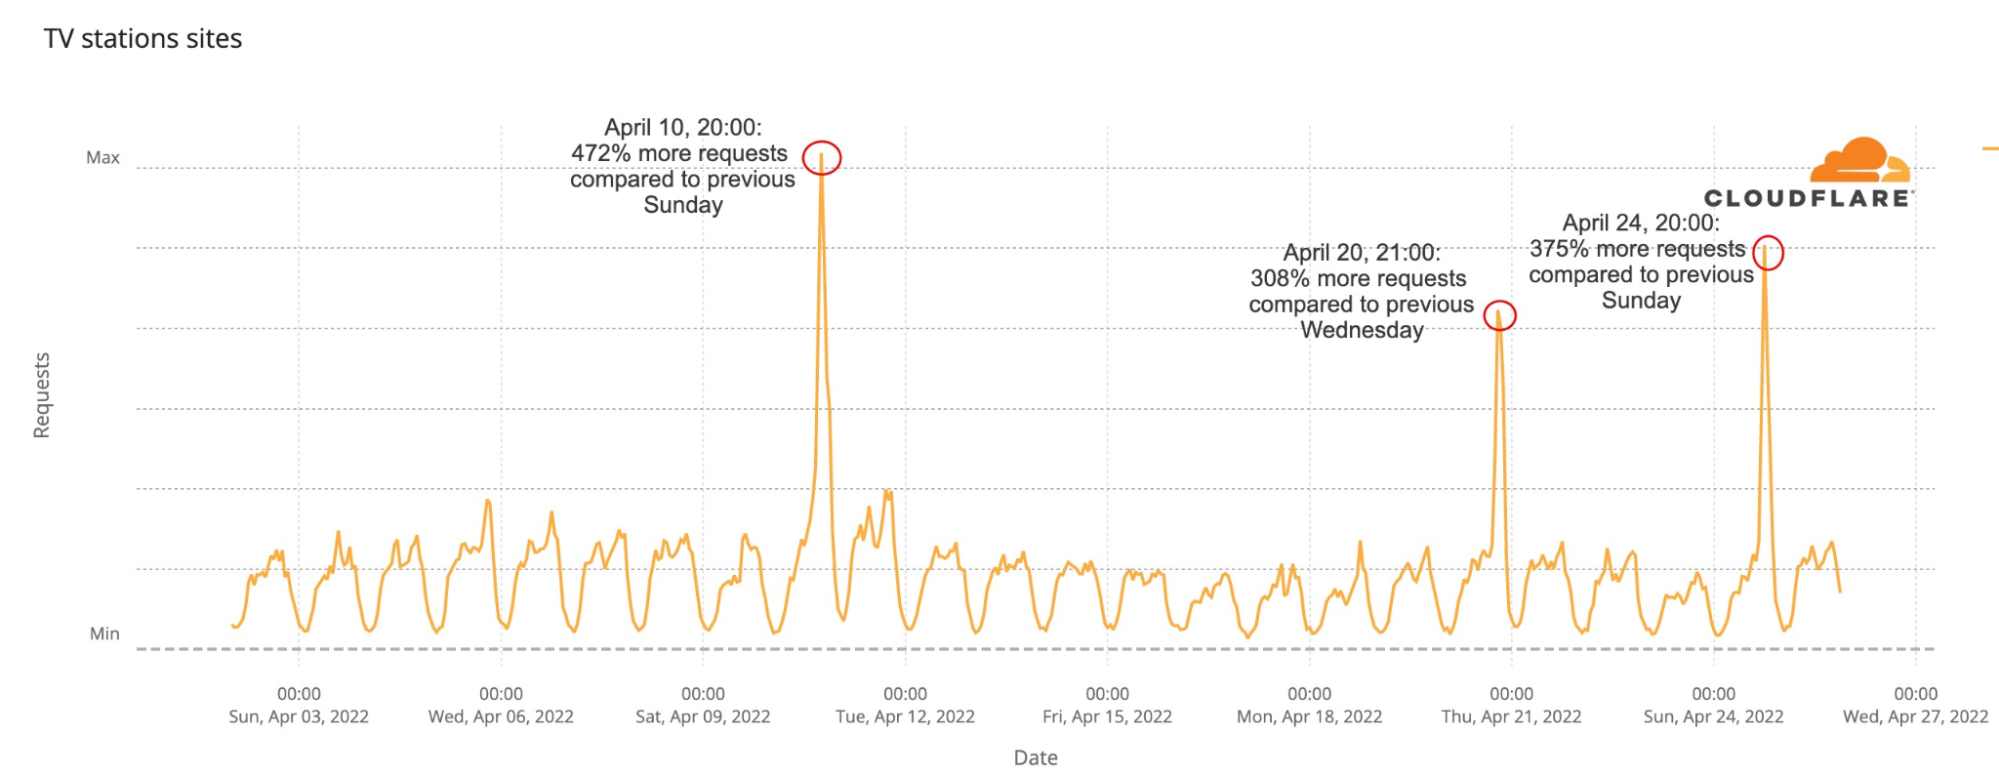
The same trend is seen on the major French TV station websites, with a clear isolated spike on April 10 (the first round election day) at 20:00 local time, with a 472% increase in traffic compared to the previous Sunday, when the main exit polls were announced. Something similar, at the same time (20:00), on April 24, with a 375% increase in requests compared to the previous Sunday.
That’s only matched, again, by the April 20 debate. At 21:00 traffic was 308% higher than the previous Wednesday, so people were clearly taking notice of the debate and checking news outlets and TV station websites — there were French sites like france.tv that transmitted via streaming.
Conclusion
When people are really eager to see something as important as election results, they go and search where the first polls are (in this case, before 20:00 local time, they are outside France).
Also, in two different election moments in France separated by two weeks, there are clear similarities in Internet trends that show the way people use the Internet during election periods. That’s more clear when results start to arrive, but also a debate as important for a presidential election as the Le Pen-Macron one, also impacts not only the Internet traffic but also the attention to news and TV websites.
Nous avons publié un article de blog consacré à certaines tendances concernant le premier tour de l’élection présidentielle française de 2022, qui s’est déroulé le 10 avril. Nous nous intéressons ici au second tour de l’élection, qui a eu lieu le dimanche 24 avril et a abouti à la réélection d’Emmanuel Macron à la présidence de la France.
Tout d’abord, les deux principales tendances : les sites d’information francophones situés hors de France ont été clairement impactés par la réglementation locale, qui stipule que les estimations ne peuvent être publiées qu’après 20 heures.
Le trafic Internet a été similaire les deux jours de l’élection (les 10 et 24 avril), et cela inclut l’augmentation de l’utilisation des appareils mobiles et l’intérêt pour les sites d’actualités – – là aussi, nous avons constaté un net intérêt pour le débat Macron-Le Pen du 20 avril.
Nous avons déjà évoqué le fait que les jours d’élections n’ont généralement pas un impact majeur sur le trafic Internet global. Comparons les journées des 10 et 24 avril, les deux dimanches où ont eu lieu les élections. Les tendances tout au long de la journée sont incroyablement similaires (avec une légère augmentation du trafic le 24 avril), même à deux semaines d’intervalle.
Une autre tendance des jours d’élection est l’utilisation d’appareils mobiles pour accéder à l’internet, principalement la nuit. Les plus importants pics du nombre de requêtes transmises depuis des appareils mobiles en France au mois d’avril semblent être tous liés aux élections :
N°1. 10 avril (premier tour de l’élection), 21 heures, heure locale. 58 % du trafic provenait d’appareils mobiles.
N°2. 24 avril (deuxième tour de l’élection), 22 heures. 57 % de trafic mobile.
N°3. 20 avril (débat présidentiel), 22 heures. 56 % de trafic mobile.
Les deux dimanches de l’élection (après la fermeture des bureaux de vote) ont eu un impact sur le trafic mobile en France, et le débat présidentiel (mercredi 20 avril) a eu un impact semblable, entraînant une augmentation des requêtes provenant d’appareils mobiles.
Le débat télévisé a été regardé par 15,6 millions de téléspectateurs en France et a été diffusé de 21 heures à 22h45, heure locale ; au même moment, le trafic mobile a été plus élevé que tout autre mercredi et a constitué le pic n°3 du mois d’avril, avec une augmentation de 10 % des requêtes mobiles par rapport au mercredi précédent à la même heure.
Le cas particulier des sites d’actualités en langue française
Pour les élections, la réglementation locale stipule que les médias français ne peuvent pas publier de résultats partiels ou de sondages de quelque nature que ce soit avant 20 heures, heure de fermeture officielle des bureaux de vote en France métropolitaine. Cela signifie donc que les médias français doivent attendre l’heure prévue pour annoncer les estimations officielles.
Nous avons donc consulté les sites web d’actualités en langue française de pays francophones tels que la Suisse et la Belgique. Ces sites ne sont pas liés par la loi française et peuvent diffuser plus tôt des informations concernant les estimations (n’oubliez pas que dans la plupart des villes françaises, les bureaux de vote ferment à 19 heures, et qu’ils ne restent ouverts jusqu’à 20 heures que dans les grandes villes).
Nous voyons clairement que les requêtes transmises aux sites d’actualités francophones situés hors de France ont connu un pic plus tôt dans la journée que celles transmises aux sites situés en France. Les sites d’actualités situés en France ont connu des pics après 20 heures, heure locale, lors des deux jours des élections, mais les sites d’information belges et suisses ont connu des hausses de trafic importantes à 19 heures le 10 avril (1857 % de plus que le dimanche précédent !). Pour le second tour des élections le 24 avril, le pic le plus important du mois a été enregistré à 18 heures (3100 % de requêtes en plus par rapport au dimanche précédent), mais il était également plus élevé que les jours précédents une heure plus tard, à 19 heures (3080 % de plus).
Aucun pic n’est lié au débat français (20 avril), ce qui semble indiquer que les sites d’actualités belges et suisses ont connu une forte augmentation de la fréquentation due au nombre de citoyens français désireux de consulter les sondages avant 20 heures.
Les résultats des élections modifient les modèles en ligne
Nous avons constaté, il y a deux semaines, que les sites web officiels des élections ont connu un pic de requêtes clairement visible le 10 avril, date du premier tour des élections. Nous examinons ici les tendances des requêtes DNS pour évaluer le trafic circulant vers les propriétés Internet.
Les sites officiels français dédiés aux élections ont connu une augmentation du trafic tout au long de la semaine précédant le premier tour, après le lundi 4 avril, mais c’est sans surprise que les deux pics majeurs ont été observés le jour des élections. Quel volume ? Voici la répartition en fonction des plus grands pics de trafic :
N°1. 10 avril (premier tour de l’élection), minuit, heure locale. 925 % de requêtes en plus par rapport au dimanche précédent (à la même heure).
N°2. 24 avril (deuxième tour de l’élection), 20 heures. 707 % de requêtes en plus.
N°3. 10 avril (premier tour de l’élection), 20 heures. 370 % de requêtes en plus.
N°3. 11 avril 10 heures. 115 % de requêtes en plus par rapport au lundi précédent.
(Ces deux derniers pics sont égaux)
La fréquentation des sites d’actualités augmente après la fermeture des bureaux de vote
En ce qui concerne les principaux sites d’actualités français, comme nous l’avons vu il y a deux semaines, c’est à 20 heures, heure locale, après la fermeture de tous les bureaux de vote et la révélation des premiers grands sondages que les plus importants pics mensuels continuent d’être observés.
Le plus important pic du mois sur notre graphique DNS agrégé, qui présente les tendances de 12 sites d’actualités, a sans conteste été observé le 10 avril, jour du premier tour des élections, vers 20 heures, heure locale, lorsque ces domaines ont enregistré un trafic 116 % supérieur au dimanche précédent à la même heure. Le deuxième pic le plus important a été enregistré le jour du second tour des élections, le 24 avril, à la même heure (20 heures, heure locale), avec une augmentation de 142 % du trafic par rapport au dimanche précédent à la même heure.
Très proche de ces deux pics se trouve le lundi matin du 11 avril, après le premier tour des élections. À 10 heures, heure locale, le nombre de requêtes était supérieur de 45 % à celui enregistré le lundi précédent. Le débat Macron-Le Pen, le mercredi 20 avril, a également provoqué un pic. À 21 heures, heure de début du débat, le nombre de requêtes était 56 % plus élevé que le mercredi précédent.
On observe la même tendance sur les sites des grandes chaînes de télévision françaises, avec un pic clair et isolé à 20 h, heure locale, le 10 avril (jour du premier tour des élections) et une augmentation de 472 % du trafic par rapport au dimanche précédent, lors de l’annonce des principales estimations. Un pic semblable est constaté à la même heure (20 heures), le 24 avril, avec une augmentation de 375 % des demandes par rapport au dimanche précédent.
Ce pic n’est égalé, une fois encore, que par le débat du 20 avril. À 21 heures, le trafic était 308 % plus élevé que le mercredi précédent, ce qui signifie que le public était clairement attentif au débat et consultait les sites des médias et des chaînes de télévision. Certains sites français, comme france.tv, diffusaient en streaming.
Conclusion
Lorsque les personnes sont vraiment impatientes de consulter une information aussi importante que les résultats d’une élection, ils cherchent les sites sur lesquels sont diffusées les premiers estimations (dans ce cas, avant 20 heures, heure locale, ils sont situés hors de France).
Par ailleurs, lors de deux échéances électorales différentes en France, à deux semaines d’intervalle, on observe de nettes similitudes dans les tendances Internet qui montrent de quelle façon les personnes utilisent l’Internet en période électorale. Cela devient plus clair lorsque les résultats commencent à arriver, mais un débat aussi important pour une élection présidentielle que le débat Le Pen-Macron a également un impact non seulement sur le trafic Internet, mais également sur l’attention portée aux sites d’information et de télévision.
Vous pouvez garder un œil sur ces tendances grâce à Cloudflare Radar.
“Our new Constitution is now established, and has an appearance that promises permanency; but in this world nothing can be said to be certain, except death and taxes.” — Benjamin Franklin, in a letter to Jean-Baptiste Le Roy, 1789
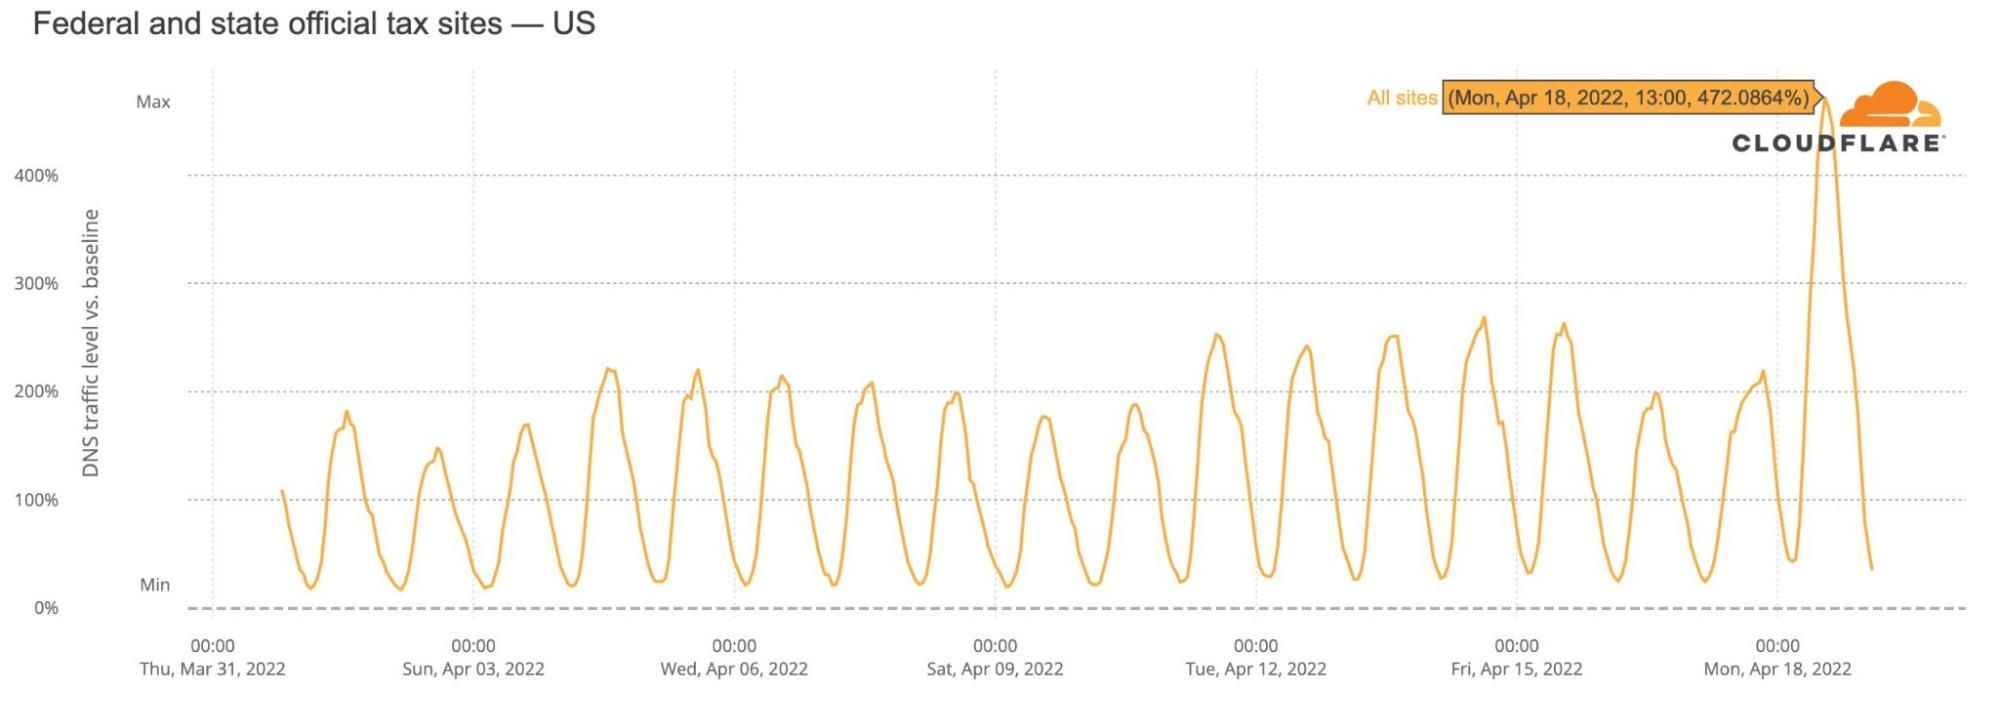
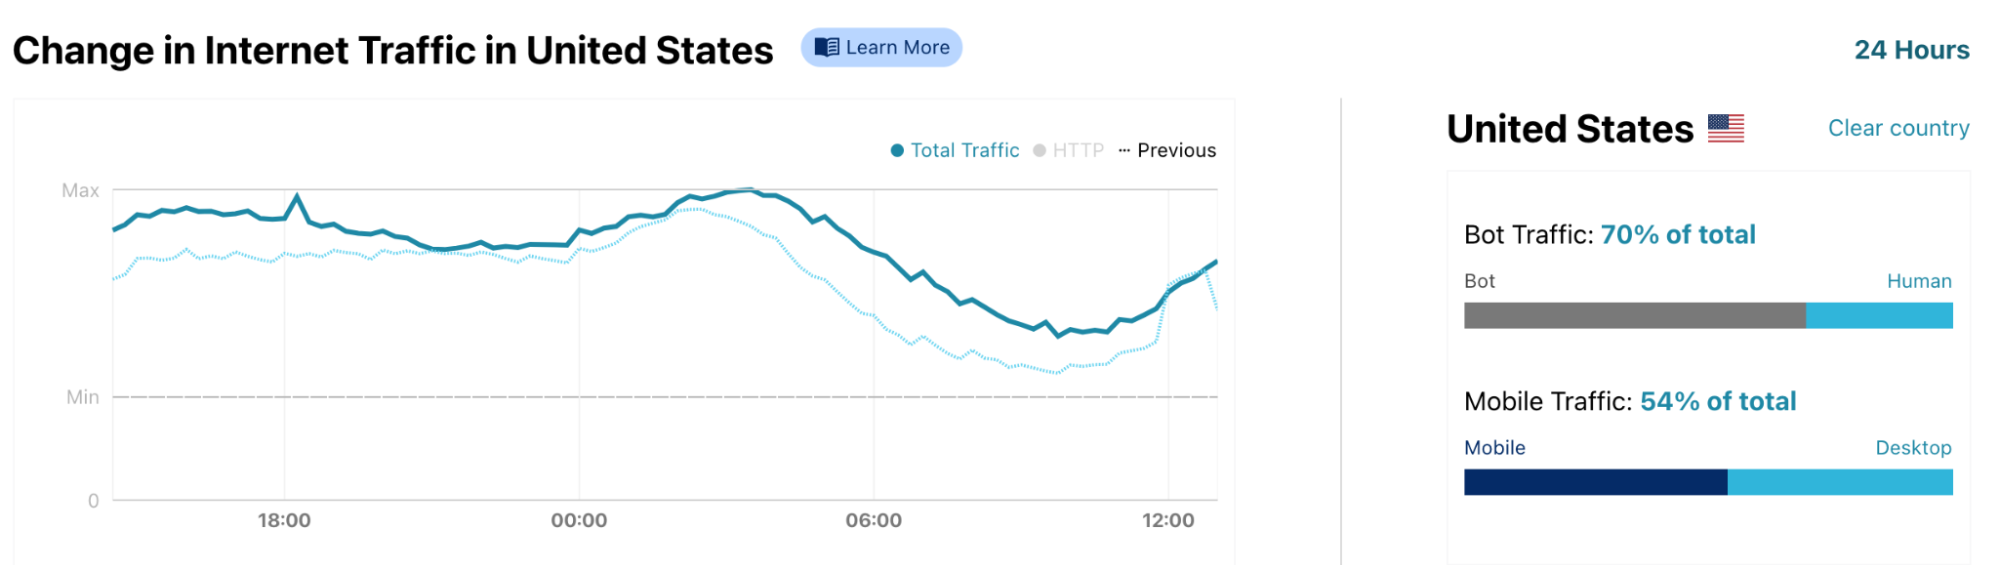
The famous expression highlighting that only “death and taxes” seem certain in life (something that goes back to the beginning of civilization and to Ancient Egypt) is on people’s minds during the month of April in the United States. This past Monday, April 18, 2022, was Tax Day. So, were US citizens procrastinators, leaving their federal (and state) tax returns to the last day? Traffic to tax-related official federal and state websites seems to show it: there was a spike of more than 470% on April 18.
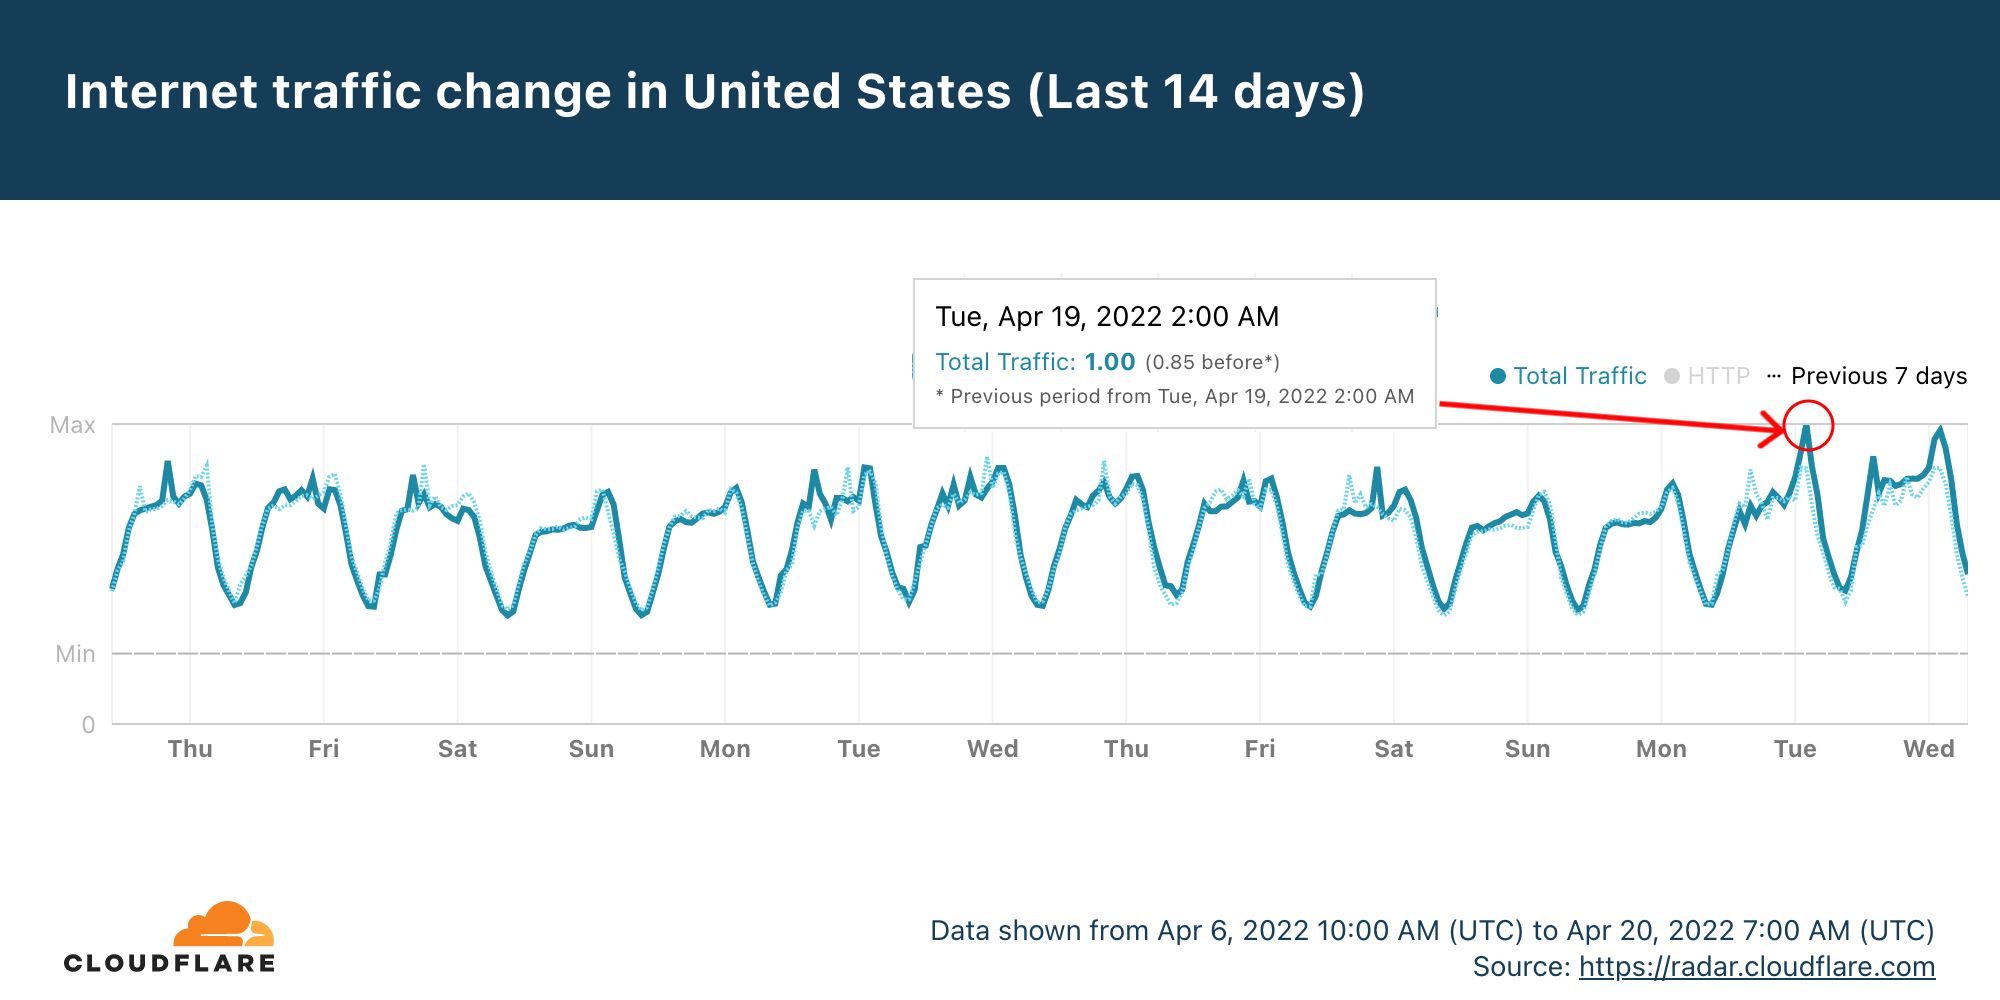
Just for reference, we can see on Cloudflare Radar that Internet traffic in the US, from our perspective, wasn’t significantly impacted on Monday, April 18, although there was a clear peak, higher than in the previous 14 days, that night at 22:00 EST (that’s 02:00 UTC on April 19). So, traffic (that includes DNS and HTTP requests from our standpoint) was 18% higher compared to the same time on the previous Monday.
For the following charts, Cloudflare Radar uses a variety of sources to provide aggregate information about Internet traffic and attack trends. In this blog post, we will use DNS name resolution data as a proxy for traffic to Internet services, as we did for Super Bowl LVI or for the Oscars 2022.
In this case, the baseline value for the charts (that we use to get the percent growth) was calculated by taking the mean DNS traffic level for the associated Internet services on March 31 — a typical day before from the April 18 deadline. On these charts, we are using the EST timezone.
Let’s start with an aggregate of all the federal and state level official tax-related sites. This Monday, DNS requests jumped at 13:00 EST to 472% more than usual (the average on March 31 for all the 51 sites we’re checking is the baseline here). That’s 203% more than the previous highest growth day in April.
Here are the top five days in April ranked by traffic increase:
US federal and state official tax sites peaks in requests
Monday, April 18 (Tax Day 2022), 13:00 — 472% growth.
Thursday, April 14, 15:00 — 269%.
Friday, April 15, 15:00 — 264%.
Monday, April 11, 13:00 — 252%.
Wednesday, April 13, 14:00 — 251%.
Taxes on weekdays
Another trend in the previous chart is that people seem to use more weekdays in April than the weekends to submit their taxes (or to visit official tax-related sites). That’s a trend we see not only for federal sites, but also for the state ones (even more in the latter).
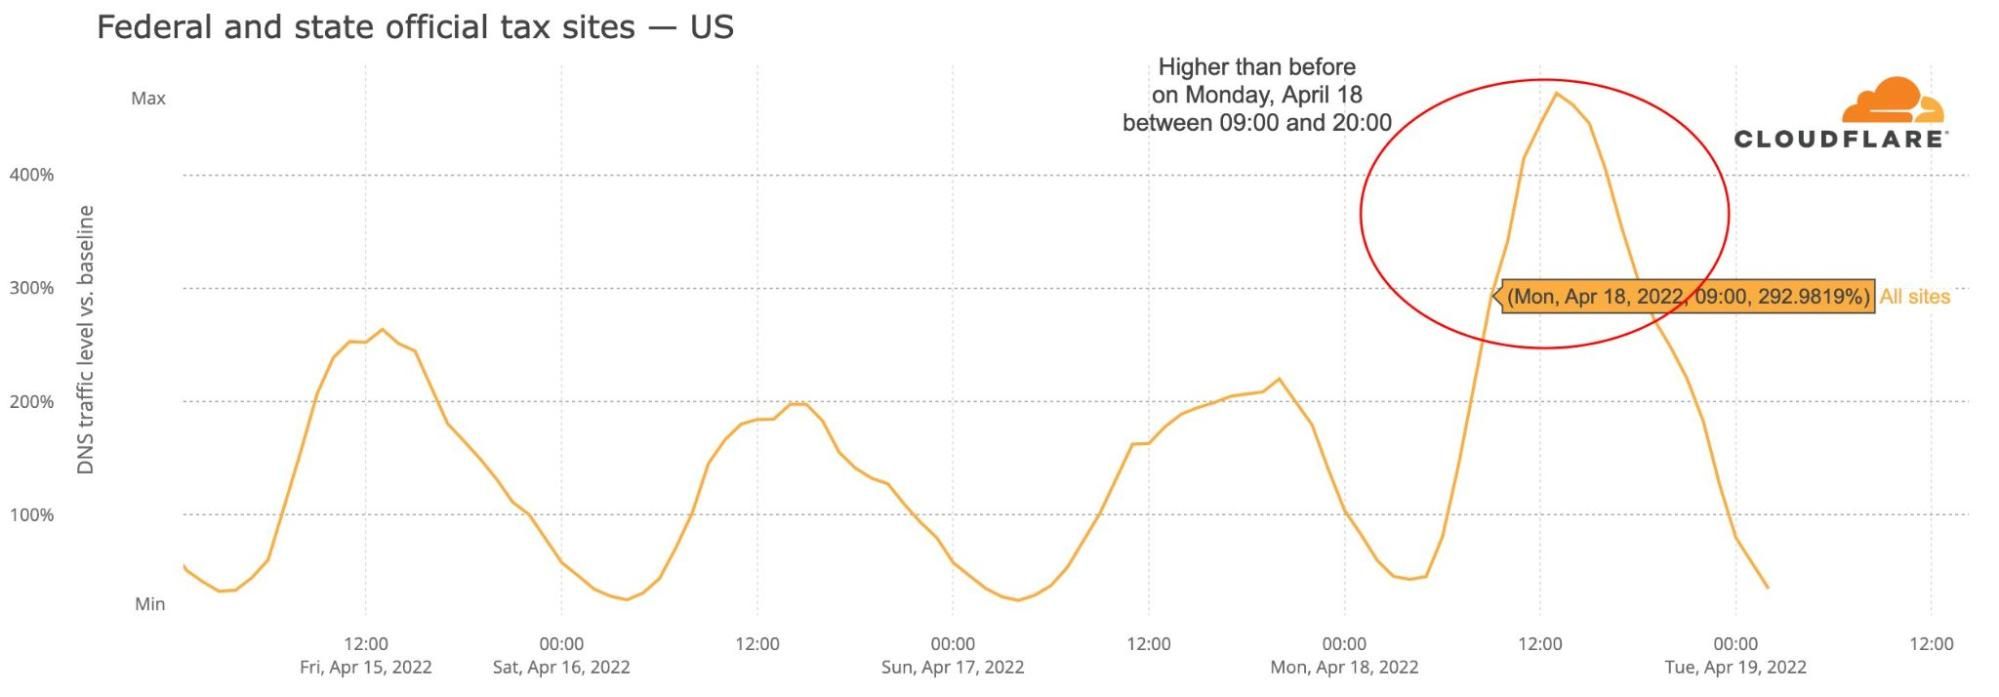
State official tax sites also have a bigger growth in requests in April, from our perspective, than federal, but the general growth is very clear right from the beginning of April, with a relevant peak going up to 221% of increase in traffic at 13:00 EST on April 4.
Another more specific trend regarding Tax Day 2022 was that traffic was higher than before any other day in April right around 09:00 (with 293% increase) and it continued that way until 20:00.
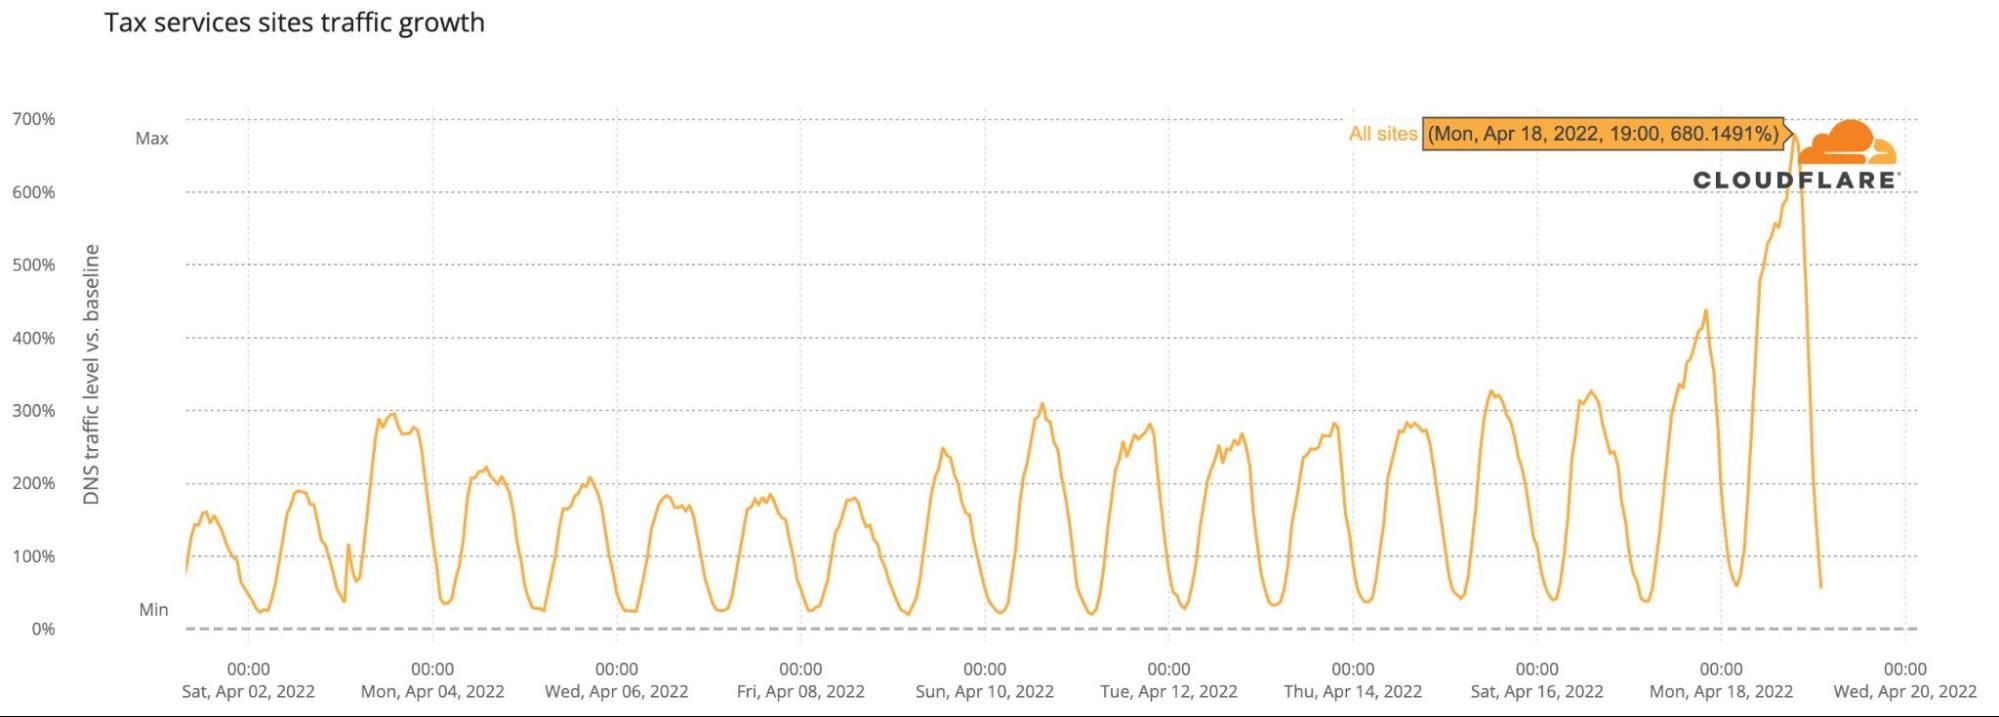
Tax services with a growth up to 680%
In the taxes filling realm there are also many services, some smaller and local, others national and well known, that help people to do the inevitable business of dealing with sales, income, property, license or other taxes.
The peak was reached on Monday, April 18, at 19:00 EST with a growth in requests of 680%. It was a busy afternoon and evening across the US for tax services.
And here’s the top five ranking of traffic growth for tax services sites in April:
US tax services sites peaks in requests
Monday, April 18 (Tax Day 2022), 19:00 — 680% growth
Sunday, April 17, 20:00 — 439%
Friday, April 15, 12:00 — 328%
Saturday, April 16, 14:00 — 326%
Sunday, April 10, 15:00 — 311%
For these types of sites, there are more spikes of traffic on the weekends than on weekdays and that started right at the beginning of April, with Sunday, April 3, reaching 295% in growth, not that far from the peaks on the days prior to Tax Day 2022.
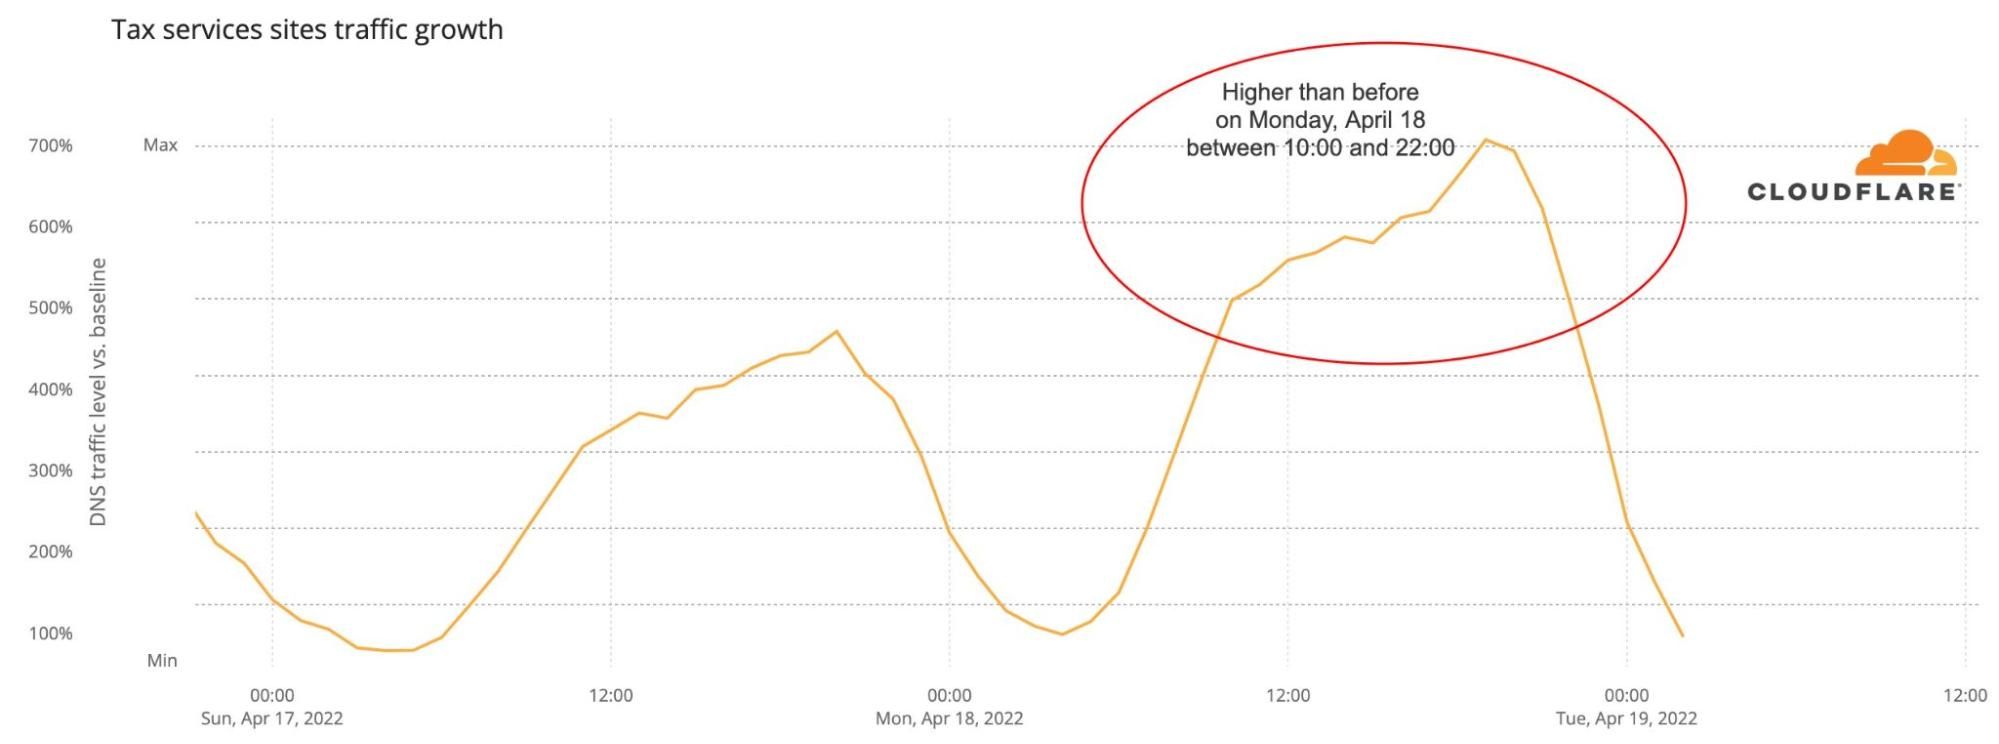
We can also see in a more detailed view in the next chart that at 10:00 on Tax Day 2022 requests growth were already at an all month high with more than 478% of increase. The sustained growth was maintained throughout the day and only after 22:00 (474%) did it drop lower than in previous days.
Conclusion
No surprise, people are aware of the deadlines for their tax returns, and many do leave it to the last day and that is very clear looking at the trends related to tax sites.
If you’re curious about these types of trends, check Cloudflare Radar for up-to-date insights about all the countries on Earth.
The first round of the 2022 French presidential elections were held this past Sunday, April 10, 2022, and a run-off will be held on April 24 between the top two candidates, Emmanuel Macron and Marine Le Pen. Looking at Internet trends in France for Sunday, it appears that when people were voting Internet traffic went down, and, no surprise, it went back up when results are coming in — that includes major spikes to news and election-related websites.
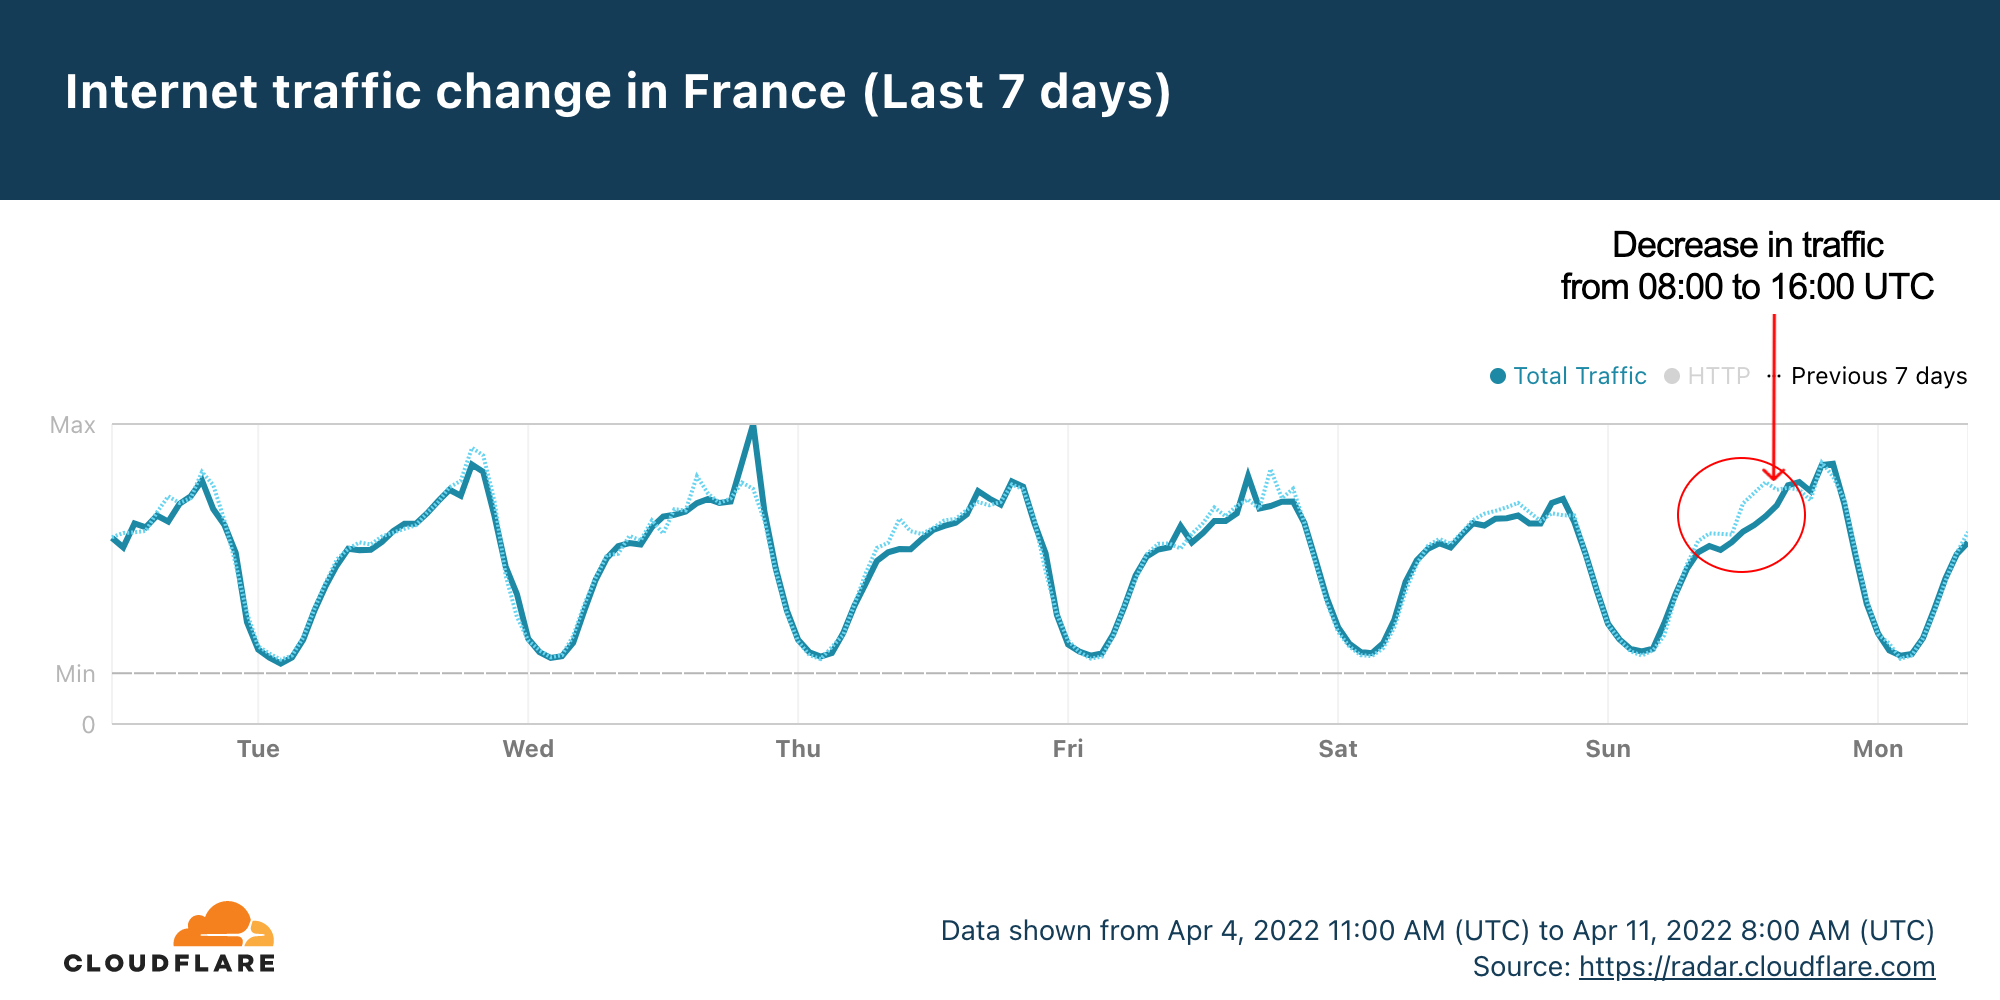
Cloudflare Radar data shows that Sundays are usually high-traffic days in France. But this Sunday looked a little different.
The seven-day Radar chart shows that there was a decrease in traffic compared to the previous Sunday between 08:00 and 16:00 UTC, that’s 10:00 and 18:00 in local time — bear in mind that polling stations in France were open between 08:00 and 19:00 (or 20:00 in big cities) local time. So, the decrease in traffic was ‘inside’ the period when French citizens were allowed to vote.
That’s a similar trend we have seen in other elections, like the Portuguese one back in January 2022.
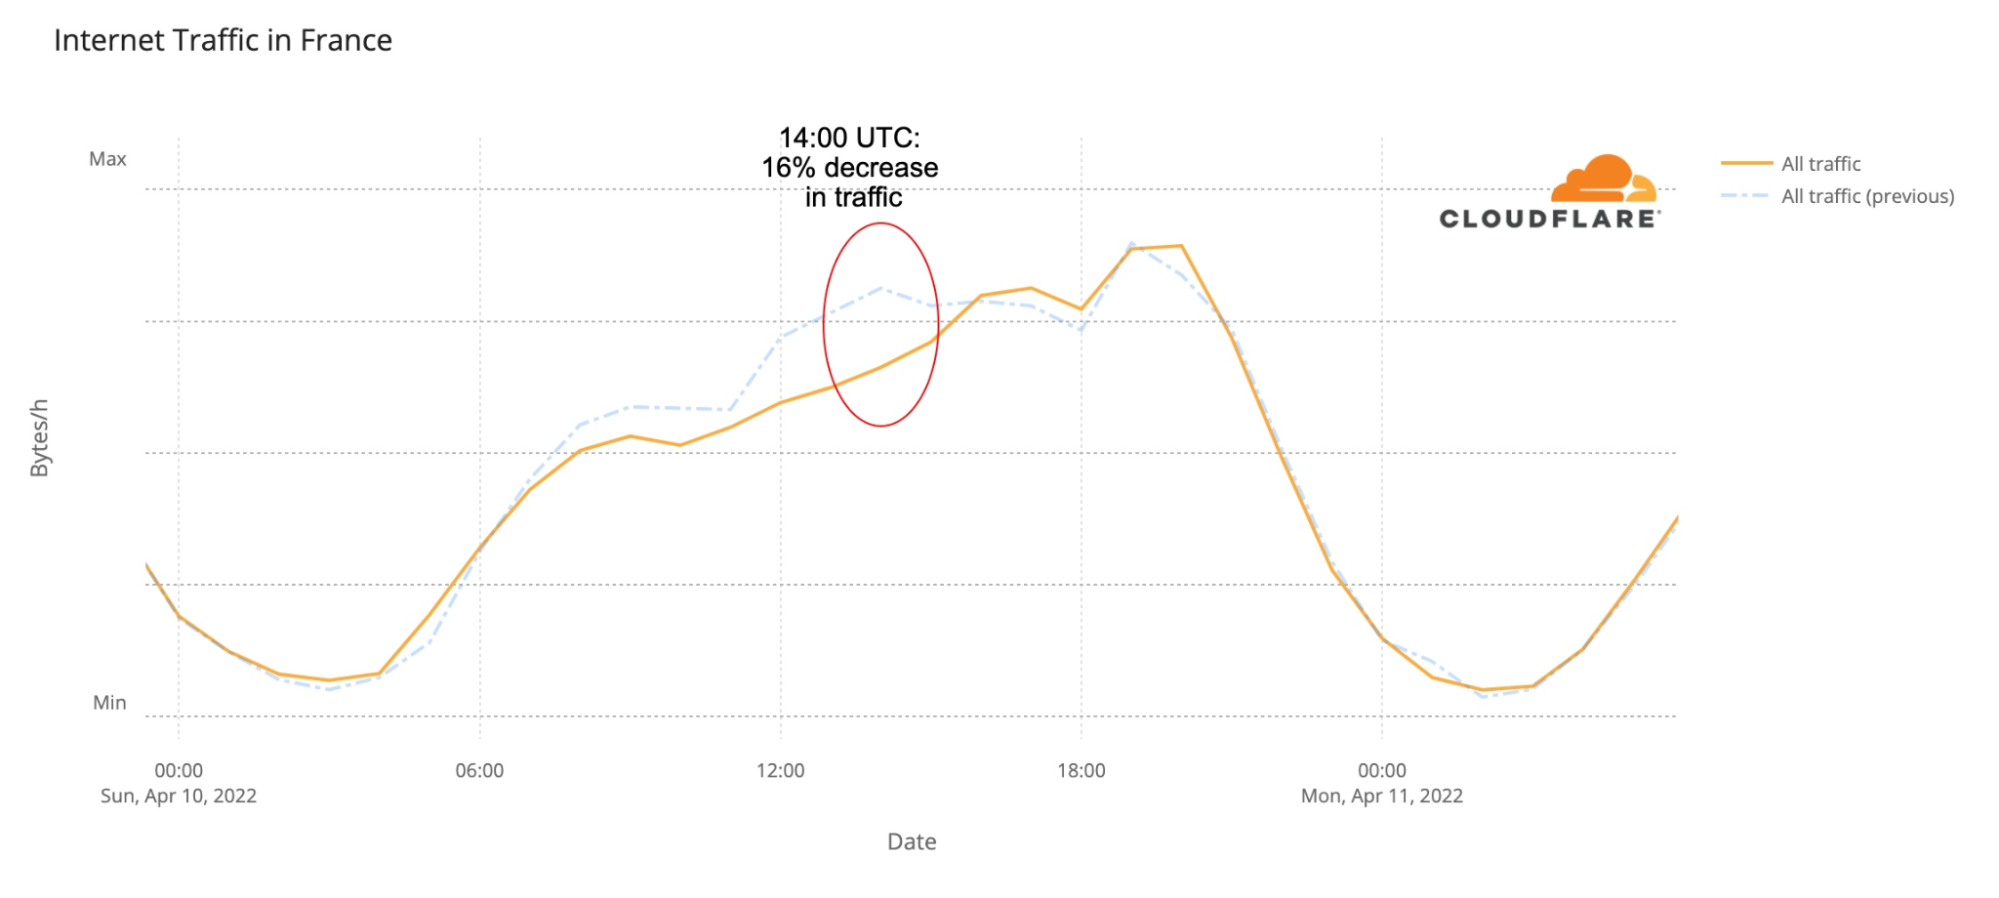
The time of the French election day with the largest difference compared to the previous Sunday was 14:00 UTC (16:00 in local time), when traffic decreased as much as 16% (as the previous 7-day chart shows). That’s clear in this chart:
That doesn’t show us precisely how people use the Internet differently on an election day — note that we already saw in the past how the weather, times of the year or even events affect human behaviour and subsequently Internet trends.
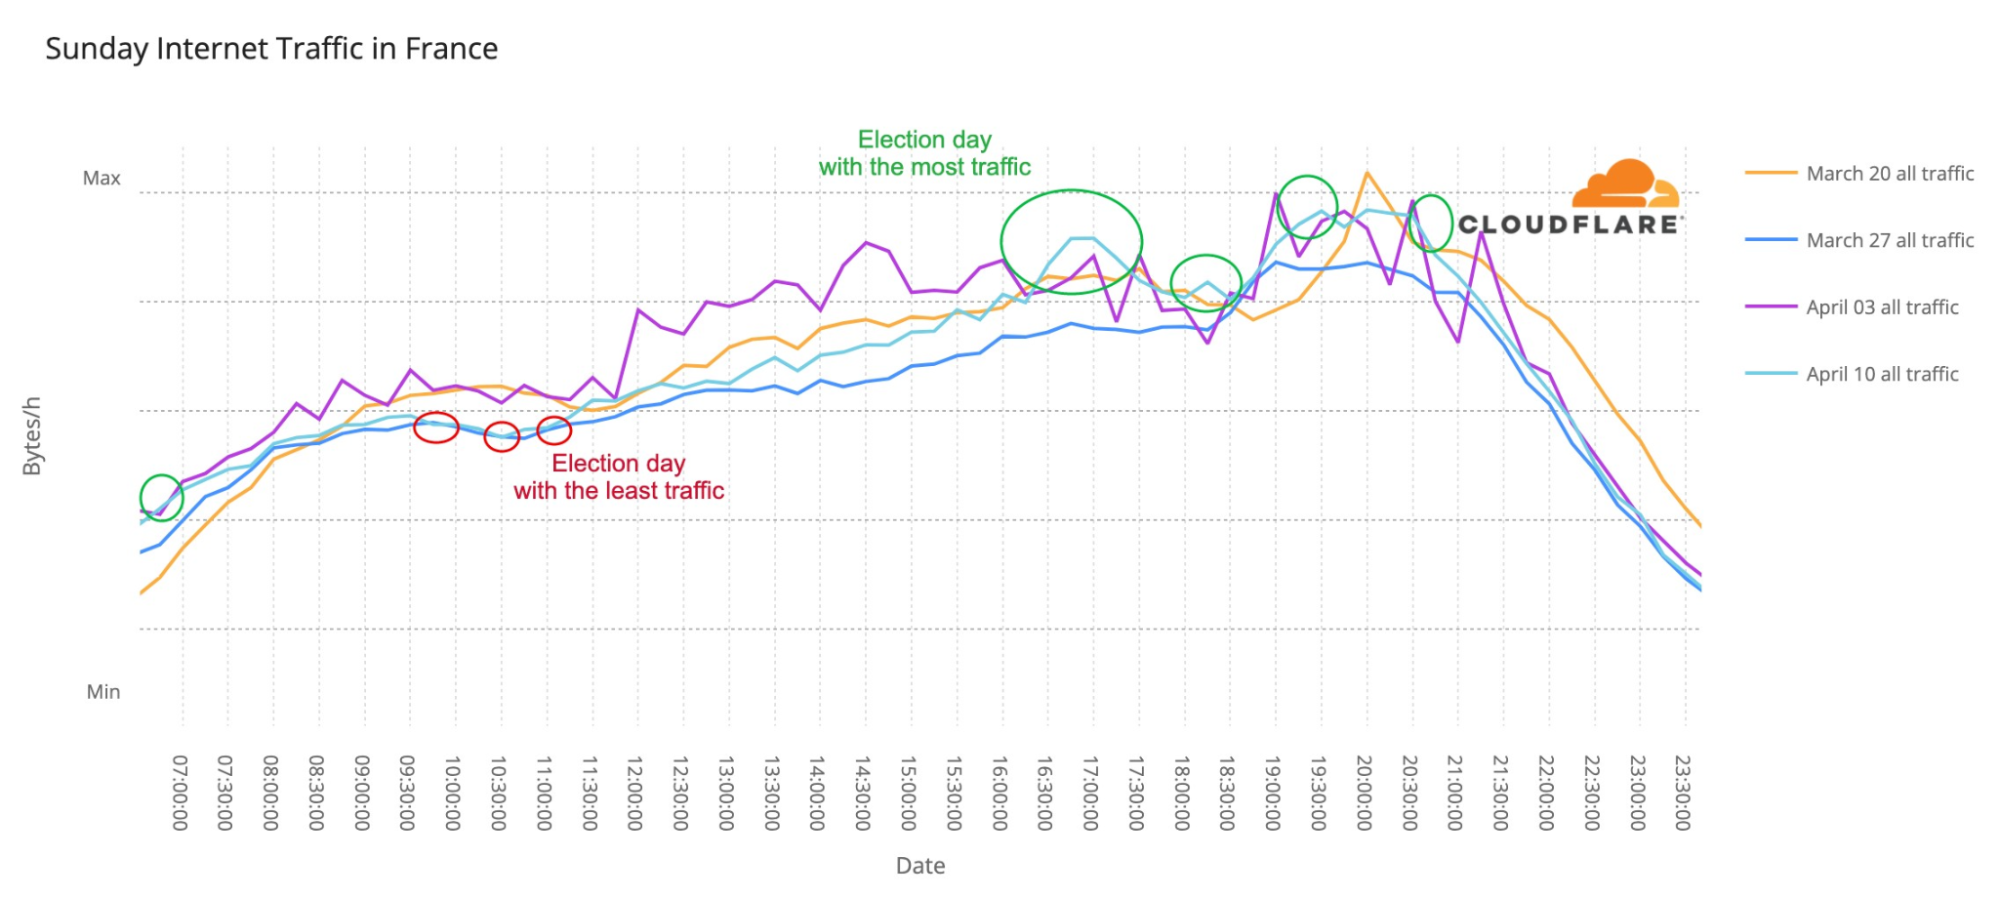
Let’s look deeper into those trends. We know that weekdays, weekends and even Sundays have, in many countries, specific patterns so, when we compare the previous four Sundays in France since March 20, we can see some trends highlighted in the next chart:
April 10, Election Day, was the Sunday with the most traffic of the previous month at 06:30 UTC (08:30 local time) and in several periods between 16:30 and 20:45 UTC (18:30 and 22:45 local time).
April 10, Election Day, was the Sunday with the least traffic of the previous month in several periods between 09:45 and 11:15 (11:45 and 13:15 local time) and it was the #3 out of #4 with less traffic between 12:15 and 16:15 (14:15 and 18:15 local time).
This seems to show patterns such as: before going to vote more people than usual were online on Sunday, Election Day (08:30 local time), but traffic went down considerably in the late morning period between (11:30-13:15) and again after lunch (14:15 and 18:15) shortly before the polling stations were closed.
The first exit polls started to be published around 18:40 local time (seen in the second and biggest green circle in the previous chart), but the main exit poll was at 20:00 local time, when all the polling stations were already closed, at that time Internet traffic in France was at its highest compared to Sundays during the past 30 days (seen in the third green circle in the previous chart, 18:00 UTC).
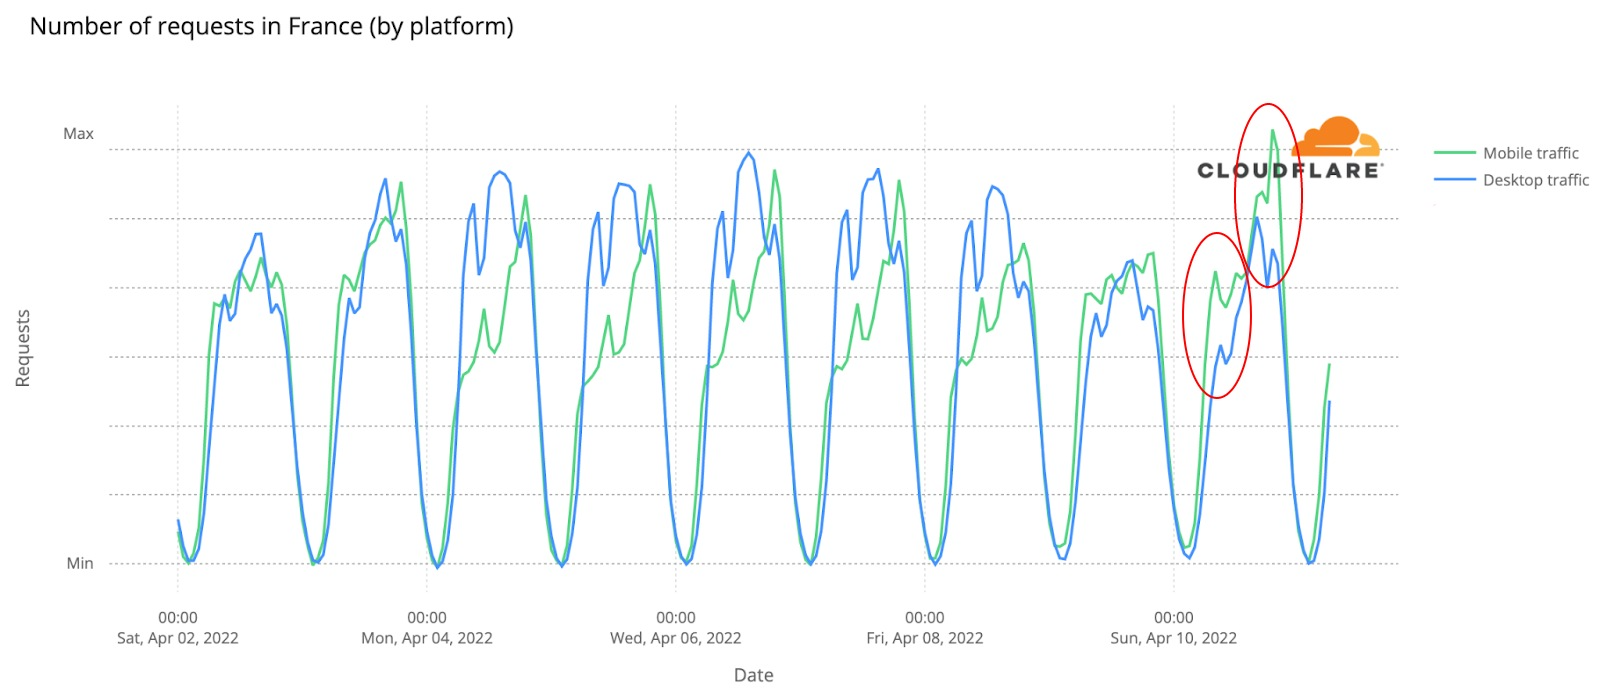
How about mobile devices’ usage trends? People in France were definitely using their mobile devices more on Election Day, and that is also evident when compared to the previous Sunday, April 3.
On Election Day, April 10, 2022, at around 09:00 local time mobile usage represented 60% of Internet traffic and had another spike at 21:00 local time with 58% (the seven-day average for mobile usage in France is 48%).
When results arrive, people go online
Official websites usually aren’t the most popular sites in a given country, their popularity is mostly connected to when citizens have to fill in their tax forms online or want to see something like election results — although news media outlets are also important there. Here we’re looking at DNS request trends to get a sense of traffic to Internet properties.
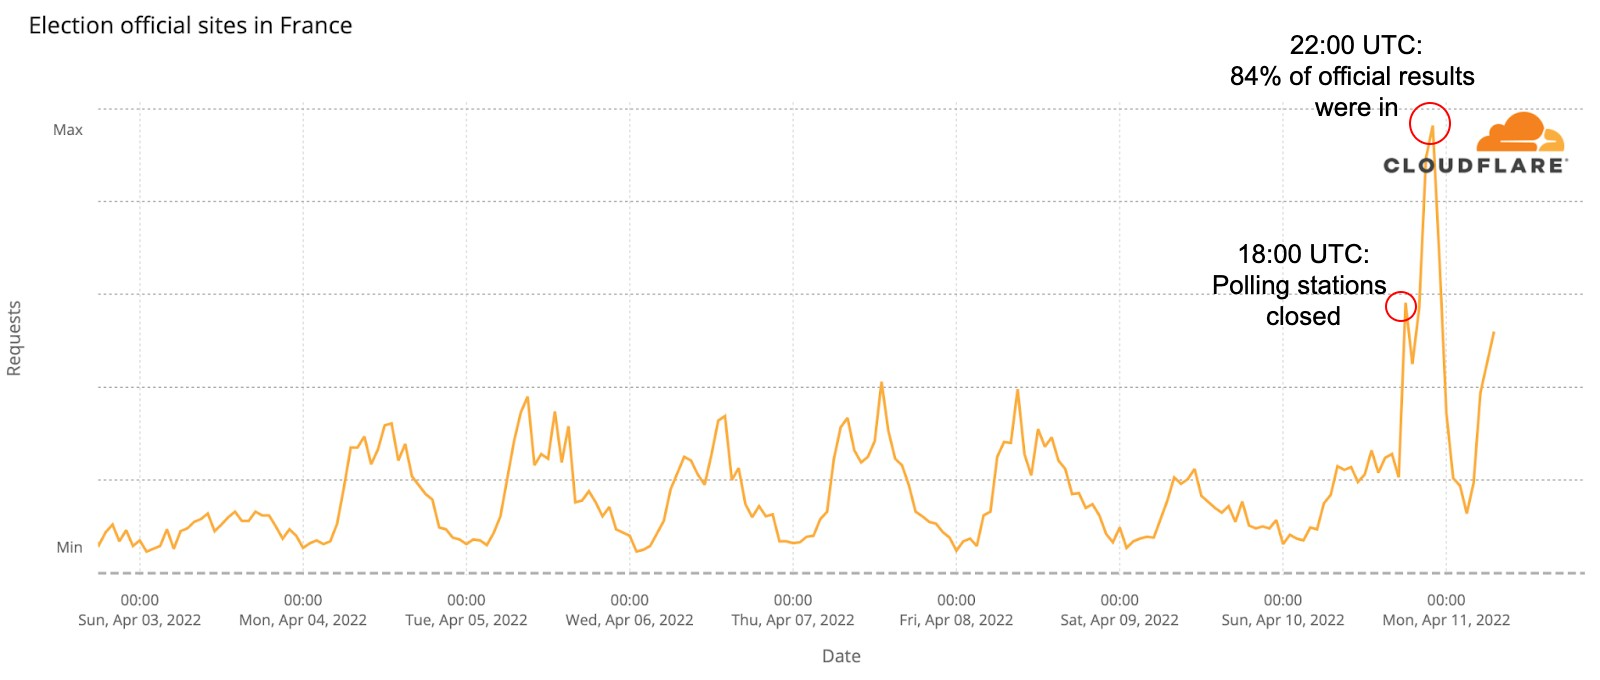
Official French election-related websites like elections.interieur.gouv.fr (where the results are published) had an increase in traffic throughout the week mainly after Monday, April 4, but on election day there were two major spikes.
The first spike in traffic was around 20:00 local time (370% more than the previous Sunday at the same time), when all the polling stations were already closed and the first major polls were revealed. But the main spike was later, at midnight (local time), when 84% of the votes were already counted and published — Macron was leading (27%) followed closely by Le Pen (25%). That spike represented 925% more requests than in the previous Sunday.
The news Internet traffic spike ‘knocks’ at 20:00
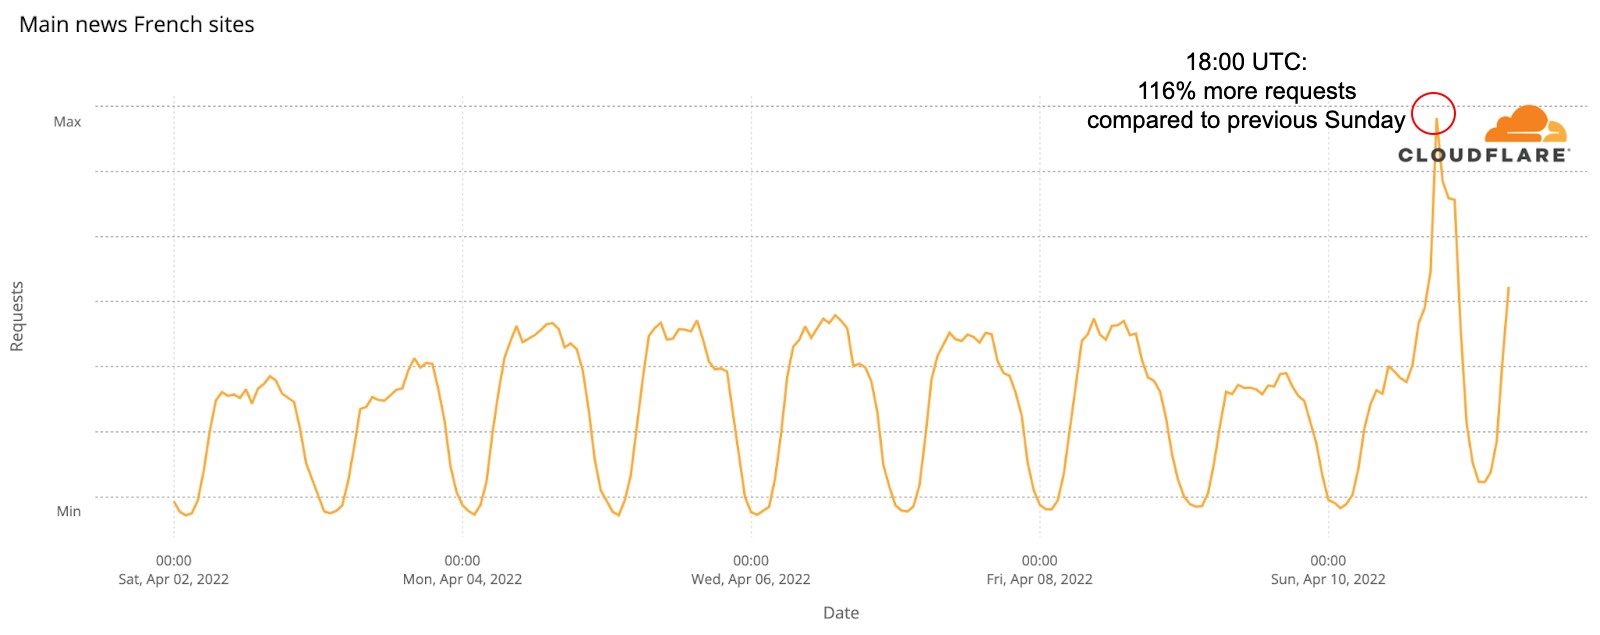
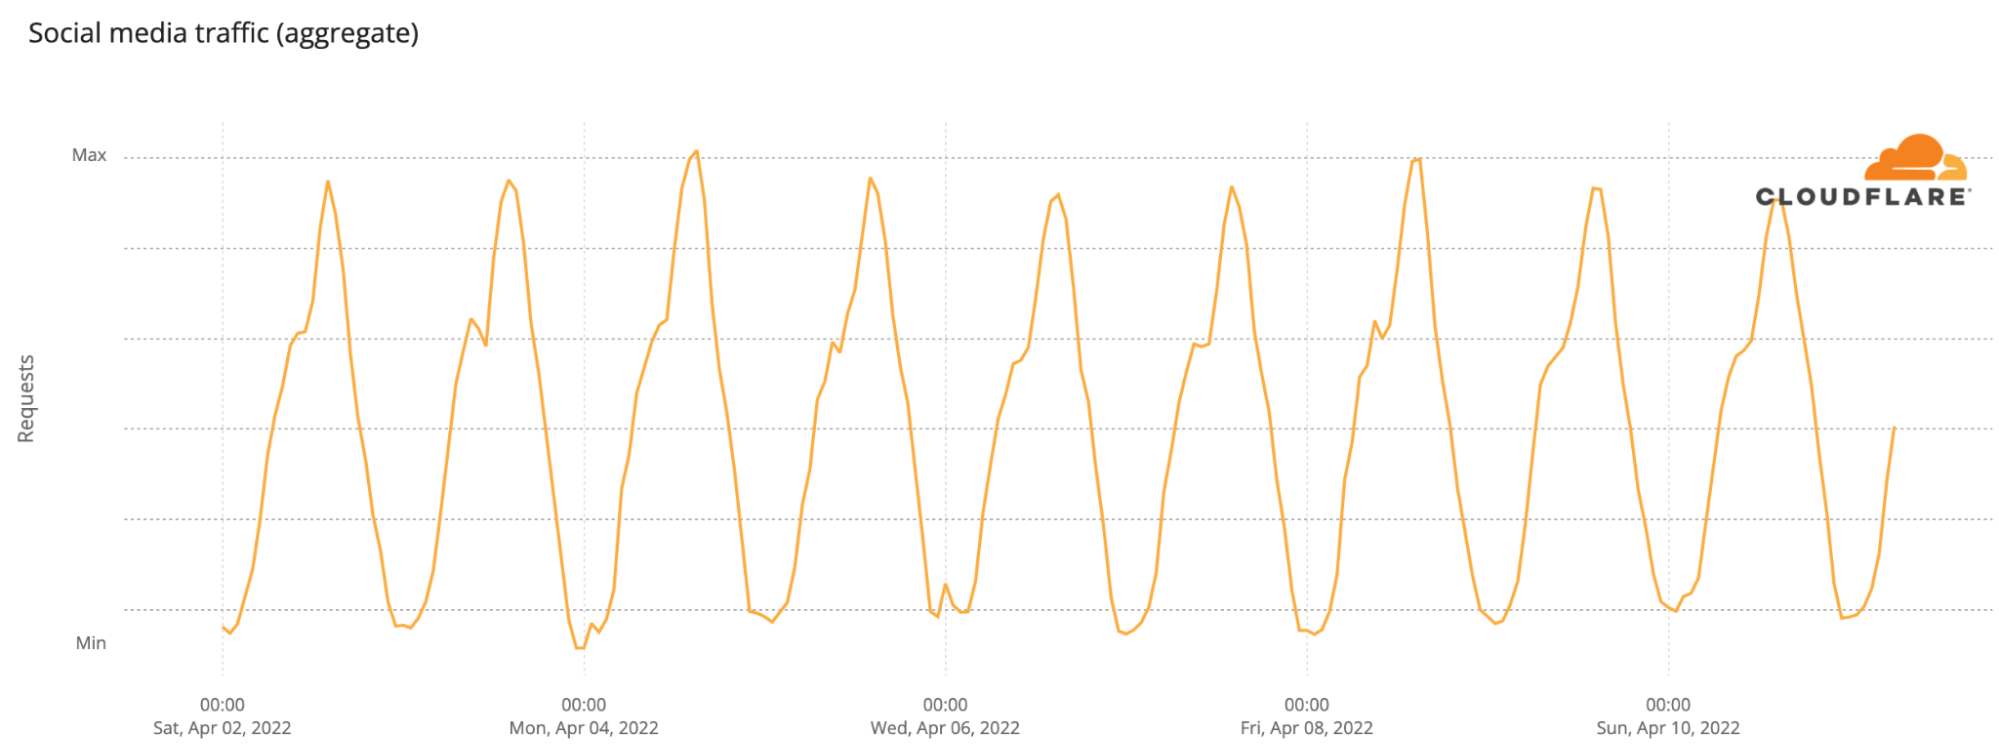
When there are elections in a country, people tend to see the analysis and results using media outlets from radio to TV, but also the Internet — media websites and social media. Let’s focus on French media outlets. The biggest spike of the week in our aggregate DNS chart, that shows trends from 12 news websites, was definitely on Election Day, around 20:00 local time, when those domains had 116% more traffic than at the same time on the previous Sunday.
Nonetheless, after 16:00 local time, traffic started to increase to those news outlets and by 18:00 local time it had its largest spike of the week with sustained growth until 20:00. At 23:00 local time there was another increase in traffic and after that it started to decrease. But, this Monday morning, traffic at 08:00 was already higher again than during the previous week (Election Day excluded). So, no surprise, Sunday night was when people were looking more into the news.
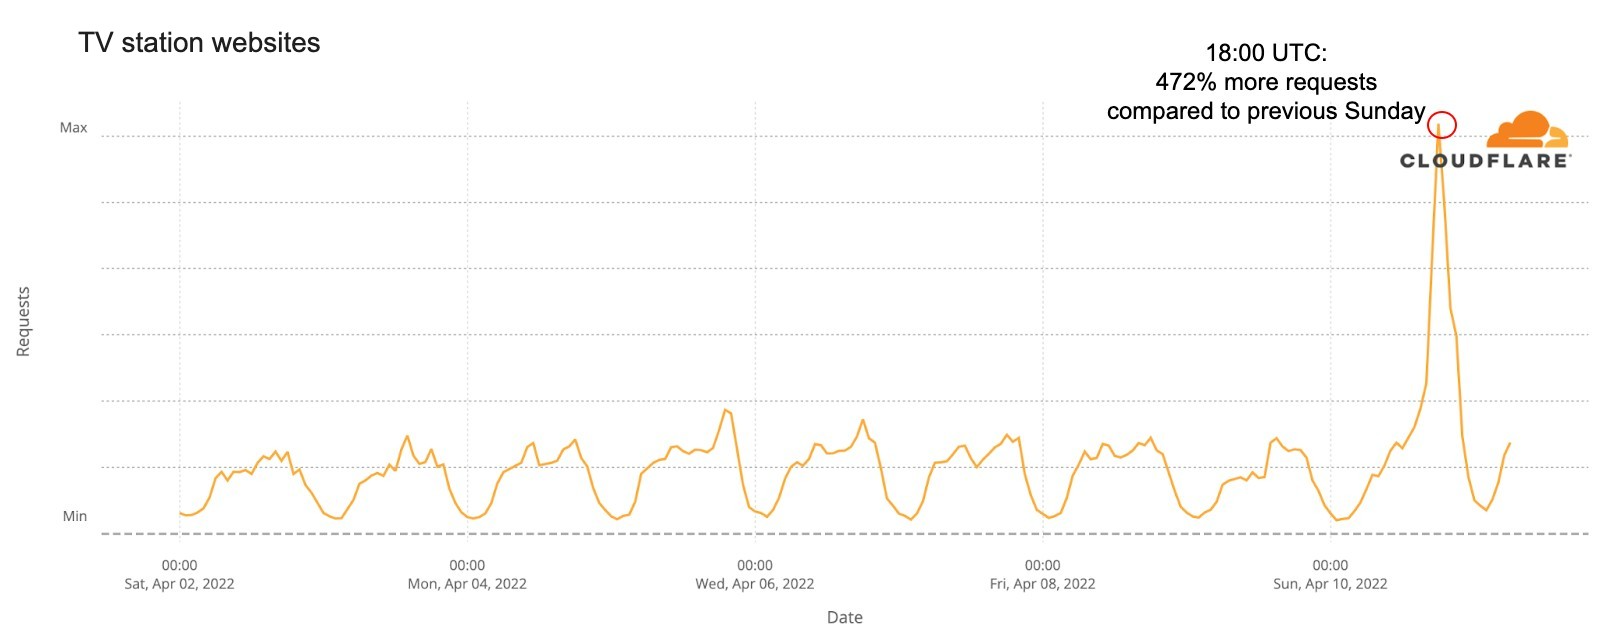
The same trend is seen on the major French TV station websites, with an even more isolated spike at 20:00 local time and a 472% increase in traffic compared to the previous Sunday, when the main exit polls were announced.
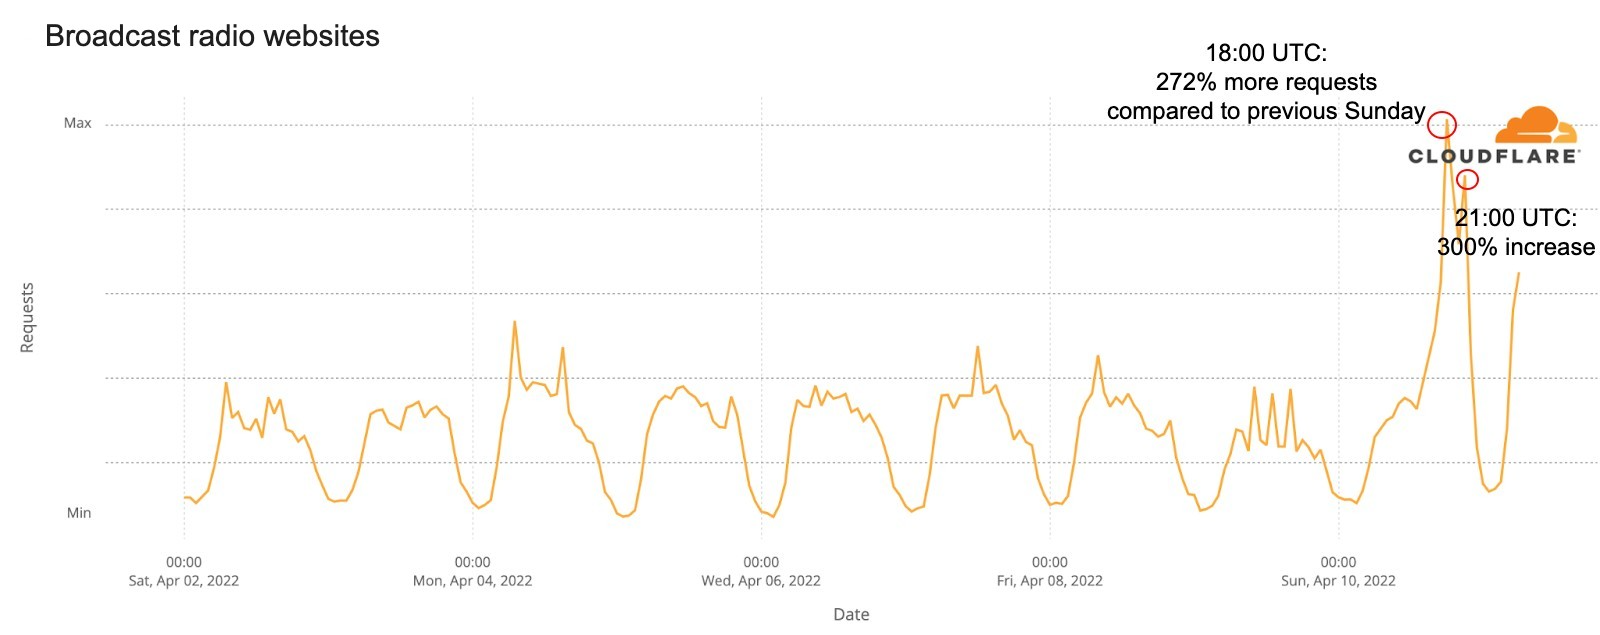
This was also similar to the broadcast radio website trends. Besides the 20:00 local time spike (272% increase compared to the previous Sunday), there was also a big one at 23:00 local time (300%) and a Monday morning spike with higher than before traffic (82% increase):
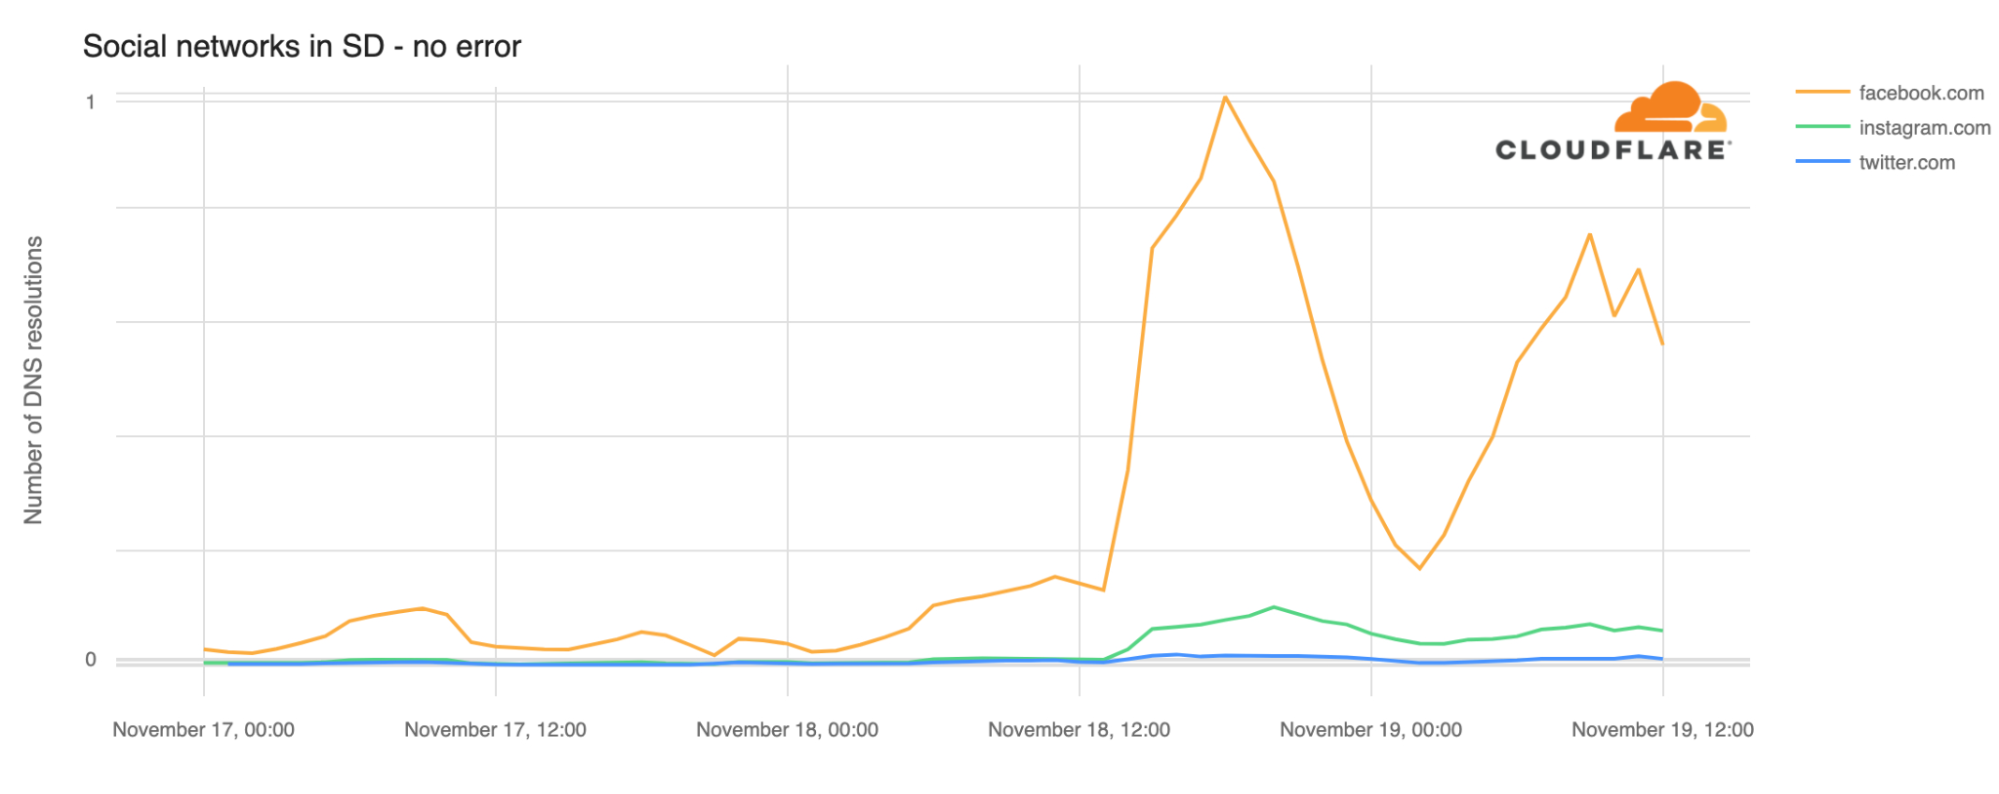
How about social media?
Regarding social media in France (looking at the aggregate DNS of the several sites), there’s no clear trend regarding the elections, but there were slightly fewer requests than on the previous Sunday. So social media doesn’t appear to have been as impacted by the elections as news websites.
Conclusion
Although there aren’t big changes in Internet traffic, like those seen in countries that shut down the Internet during election periods, Election Day seems to influence human and Internet patterns, in this case when results started to pour in on election night people went to news or official election websites.
The 94th Academy Awards happened this past Sunday, March 27, 2022. In the global event we got to see several Oscars attributed to winners like CODA, Jane Campion (the director of The Power of the Dog) and also Dune (which won six Oscars), but also moments that had a clear impact in the Internet traffic, like the altercation on stage between Will Smith and Chris Rock.
Cloudflare Radar uses a variety of sources to provide aggregate information about Internet traffic and attack trends. In this blog post, we will use DNS name resolution data as a proxy for traffic to Internet services, as we did for the Super Bowl LVI.
The baseline value for the charts (that are only focused on the US) was calculated by taking the mean DNS traffic level for the associated Internet services between 08:00 – 12:00 PST on Sunday (March 27, 2022) — usually we use UTC, but we chose to use Los Angeles time as that’s where the event took place.
The event started with Beyoncé singing at 17:00 PST and ended at around 20:30. In terms of growth in traffic, the start of the show didn’t show much for social media, although TikTok and Twitter started to decrease in DNS requests after that time.
Will Smith makes Twitter and TikTok rise in requests
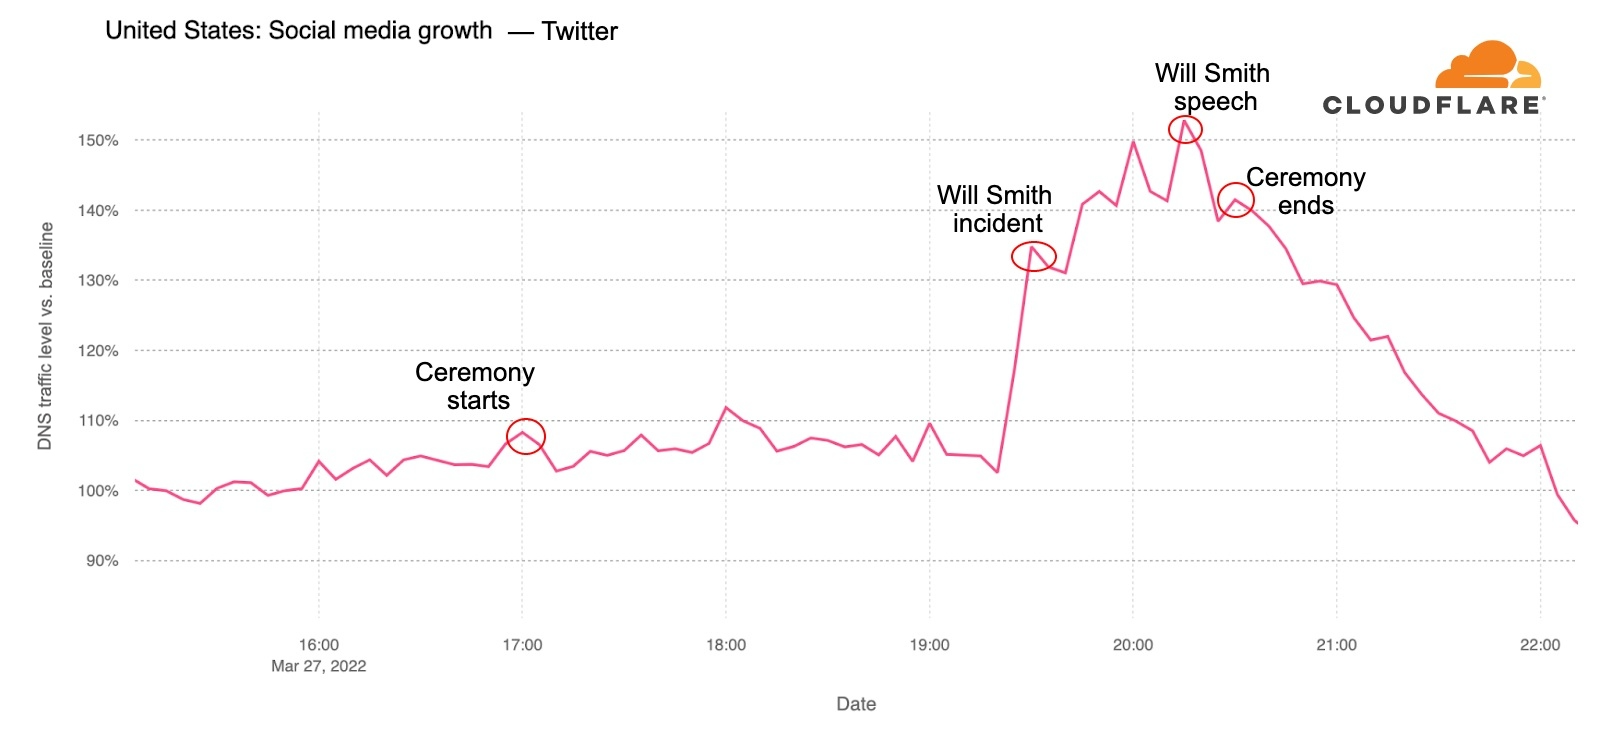
Twitter and TikTok were the social networks that seemed most impacted by the moment Will Smith went on stage and started an altercation with Chris Rock after a joke.
For Twitter, the major change in DNS requests was exactly after that incident (at 19:25); before that, at 18:00, the moment Sebastián Yatra performed Encanto’s Dos Oruguitas song also had a small spike.
There were 32% more DNS requests for Twitter a few minutes after the altercation, and that growth peaked at 20:15 with 51% more requests than there were at 19:20 — that was after Will Smith (20:05) gave his acceptance and apology speech, when he was awarded the Best Actor Oscar. The ceremony ended at 20:30, and after that traffic went down.
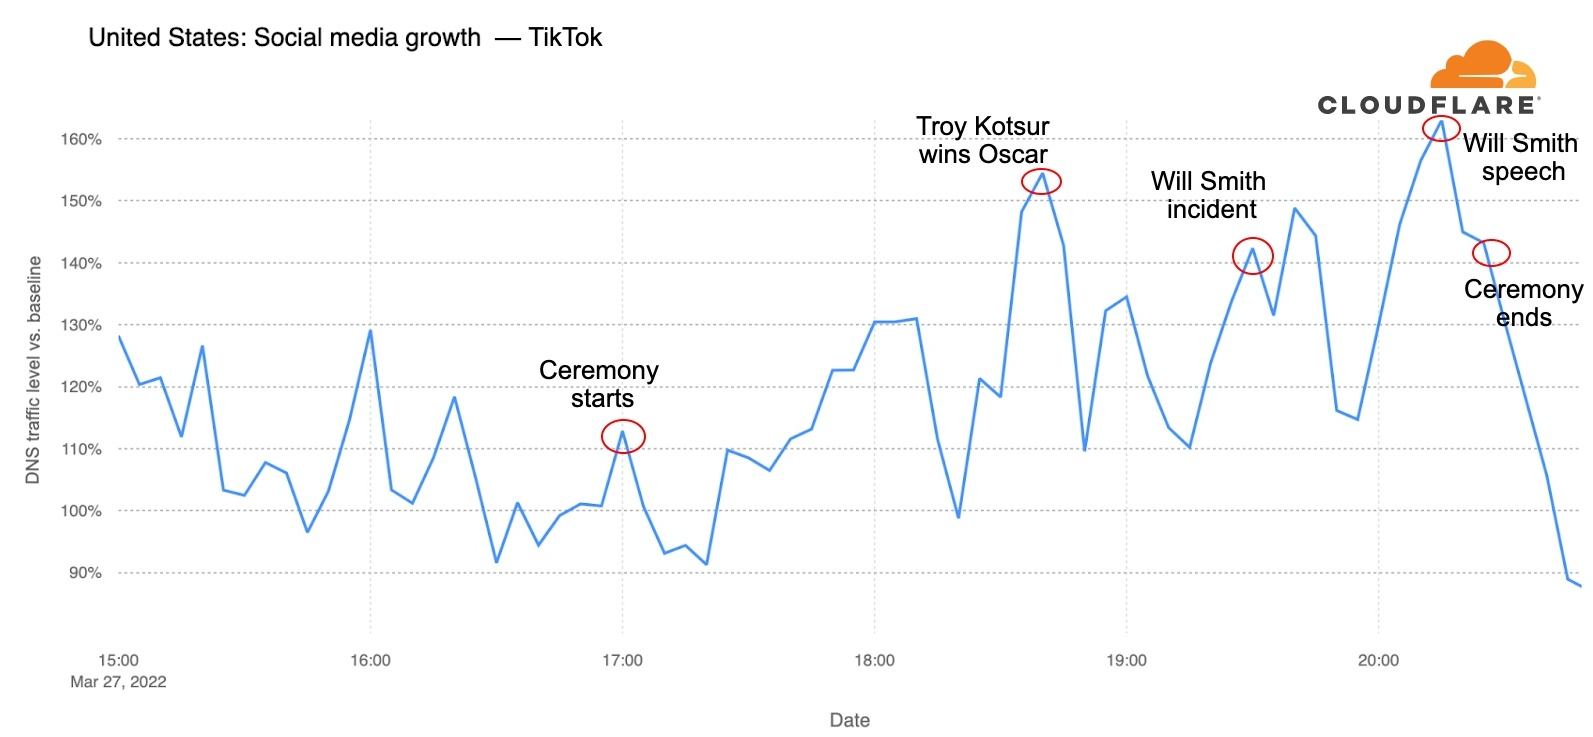
TikTok also seemed to be used during the ceremony and the breaks, and after a spike during one of the commercial breaks, around 18:40, after Troy Kotsur won the Best Supporting Actor Oscar for his role in CODA.
The Will Smith incident seems to be associated with an increase of 20% in requests from 19:20 to 19:30. The trend continued with a 25% increase (19:40) and a peak of 40% more traffic at 20:15, right after Will Smith’s speech. After the ceremony ended (20:30), traffic went down.
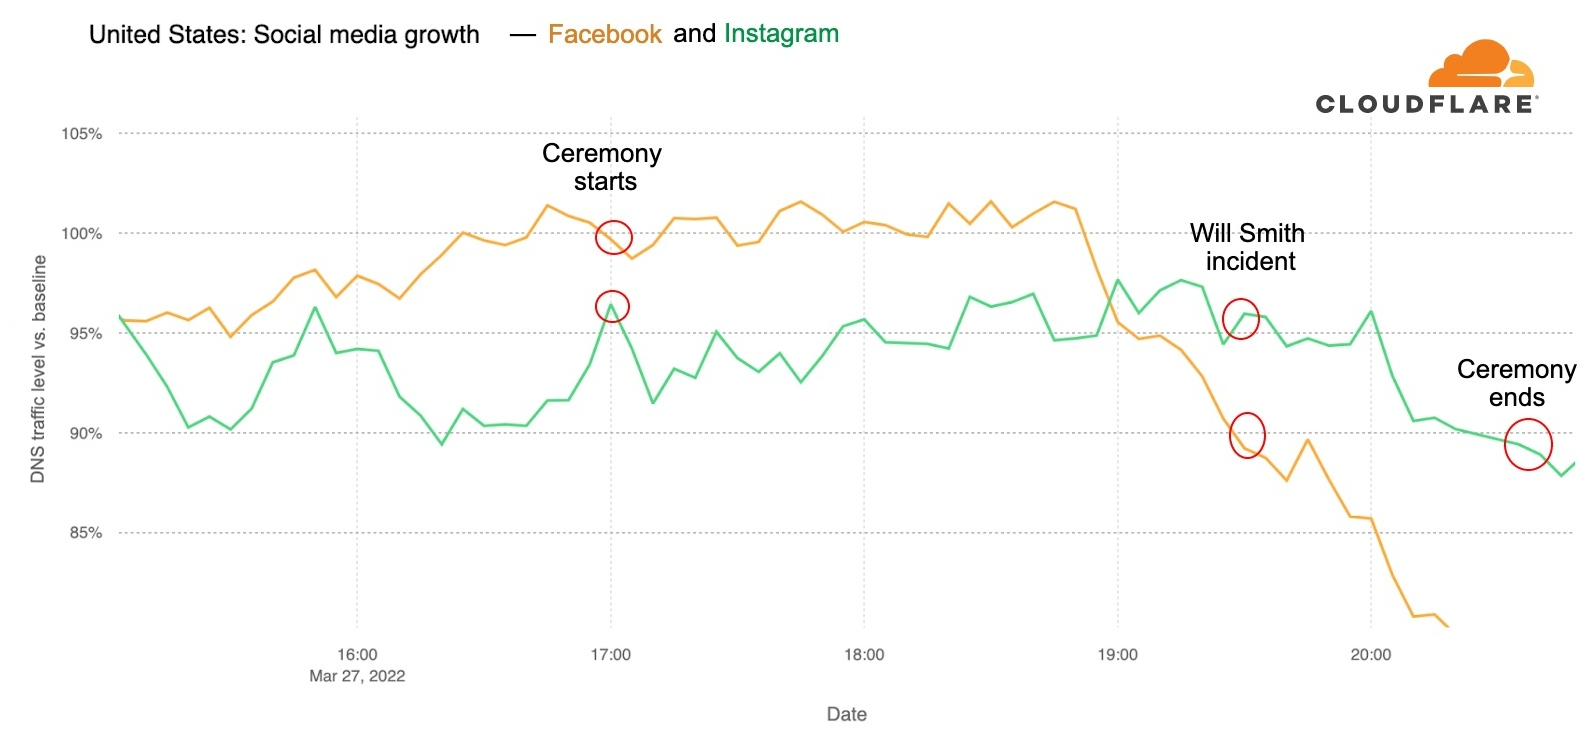
Facebook (yellow line) and Instagram (green) weren’t particularly impacted, although there’s a decrease in traffic after the ceremony started and requests start to decrease after 19:00, especially Facebook.
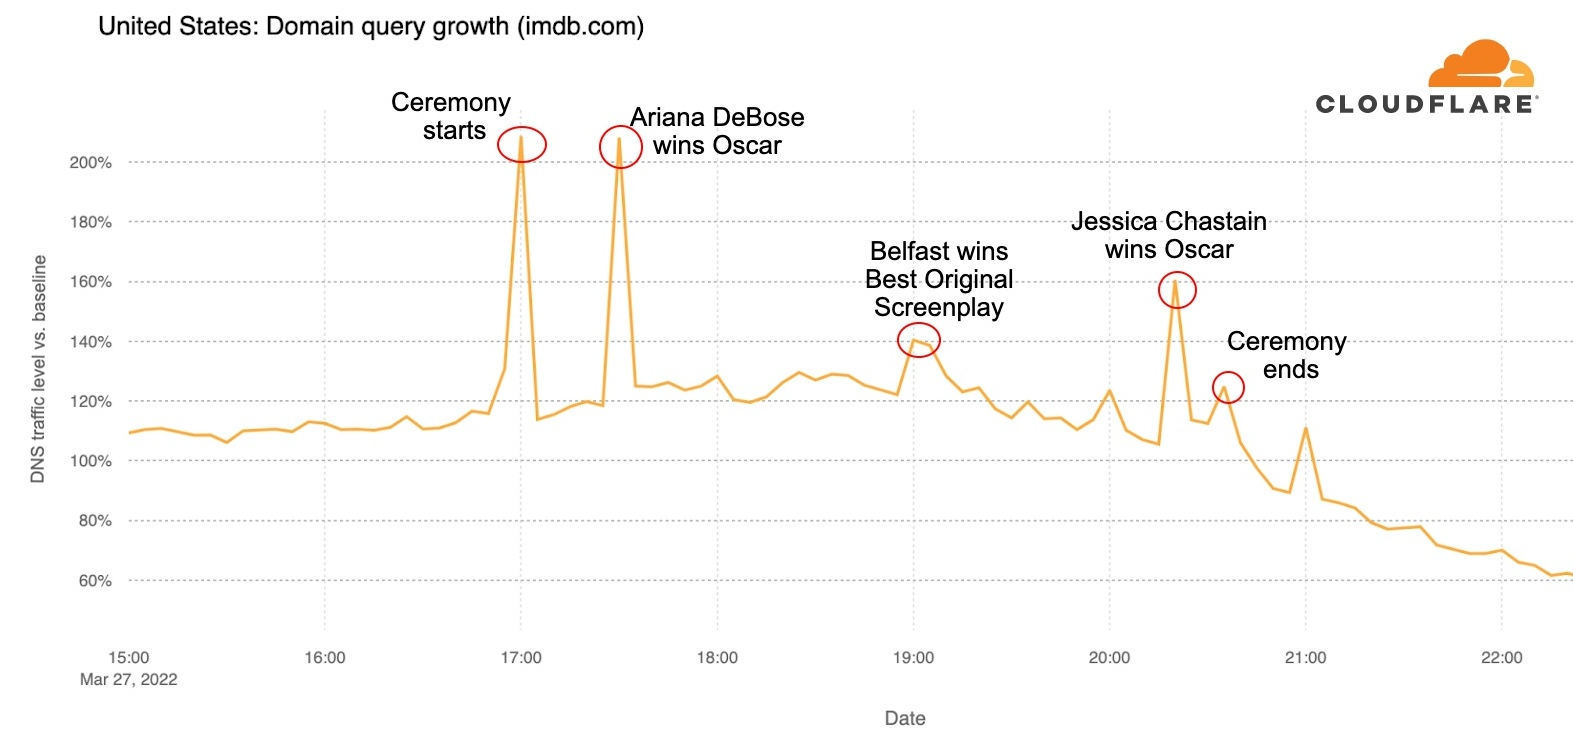
Actresses made IMDb.com tick
One of the main sources of information about the movie industry is IMDb.com, the Internet Movie Database, and traffic to the site was impacted by the Oscars in a way not related to the Will Smith incident. Requests almost doubled (93% increase) in the minutes before the Oscars started (between 16:50 and 17:00).
And there was another clear spike right after Ariana DeBose won (at 17:23) the Best Supporting Actress Oscar for West Side Story, with almost 90% growth in traffic compared to the previous 10 minutes.
There is also an increase at 19:00, when Kenneth Branagh won the Best Original Screenplay Oscar for writing Belfast. The other major spike in traffic, with 55% increase compared to the previous minutes, was right around the time Jessica Chastain got the Oscar for Best Actress for her role in the movie The Eyes of Tammy Faye.
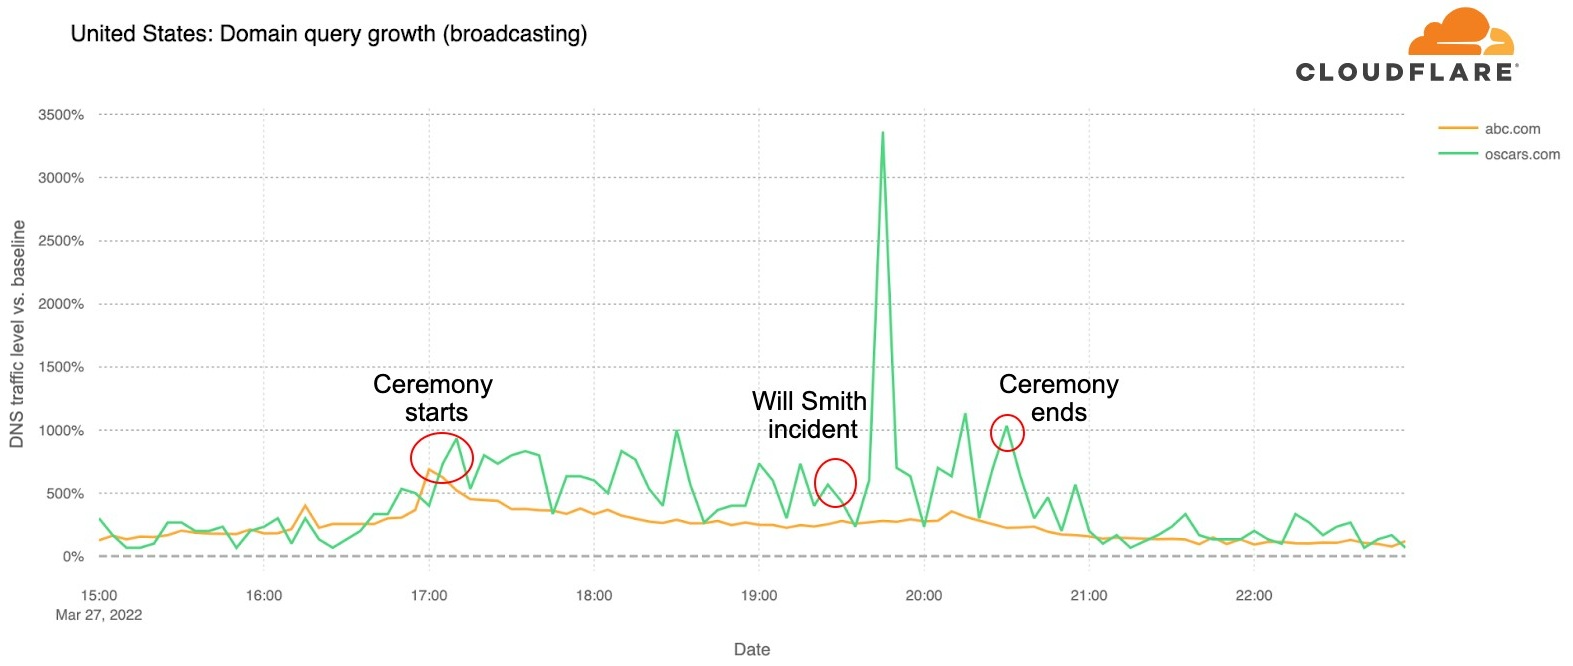
ABC and Oscars.com trends
ABC was the official broadcaster for the 2022 Oscars, and throughout the event had good numbers: two hours before the ceremony, ABC.com and also their dedicated page Oscars.com (that redirects to abc.com/shows/oscars) had between 200 to 600% more traffic than in our baseline (the morning period, 08:00 – 12:00 PST).
The biggest spike was around 19:45, a few minutes after the Will Smith incident. This was around the time Questlove received the Best Documentary Oscar for Summer of Soul (…Or, When the Revolution Could Not Be Televised), and there was a reunion for The Godfather, with Francis Ford Coppola and actors Al Pacino and Robert DeNiro, on stage.
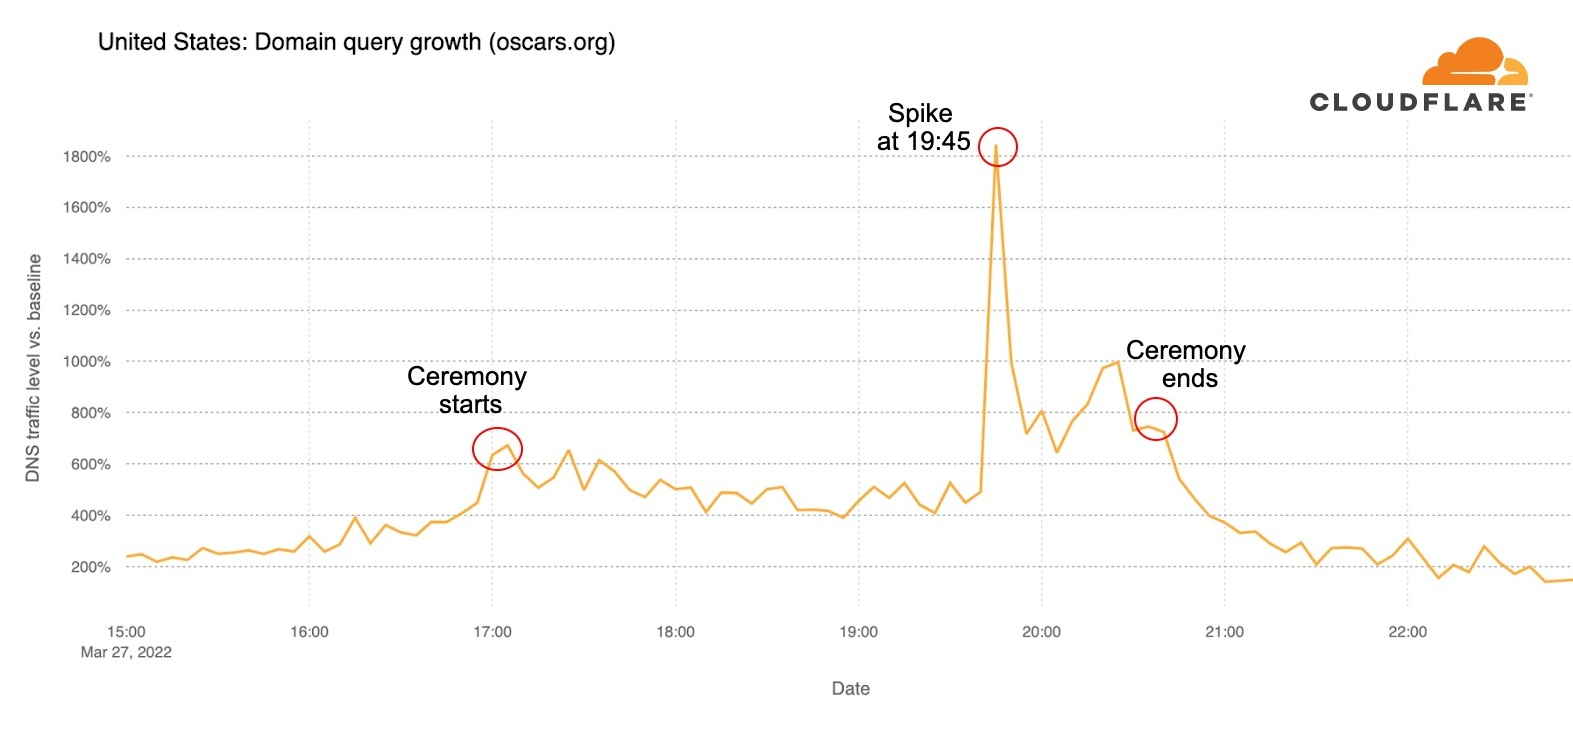
Oscars official website
The official Oscars.org website also had some trends worth mentioning. Requests to the site increased 400% in the hour before the ceremony started, from 16:00 to 17:00, and remained high after that.
But at 19:45 there was a clearer spike in traffic of around 1,300% increase compared to the previous 10 minutes — that was 20 minutes after the Will Smith incident, right after Questlove’s Oscar and at the time of The Godfather reunion. There was another spike right after the Best Actress award and before the event ended. The full list of winners was published on Oscars.org right after 20:30.
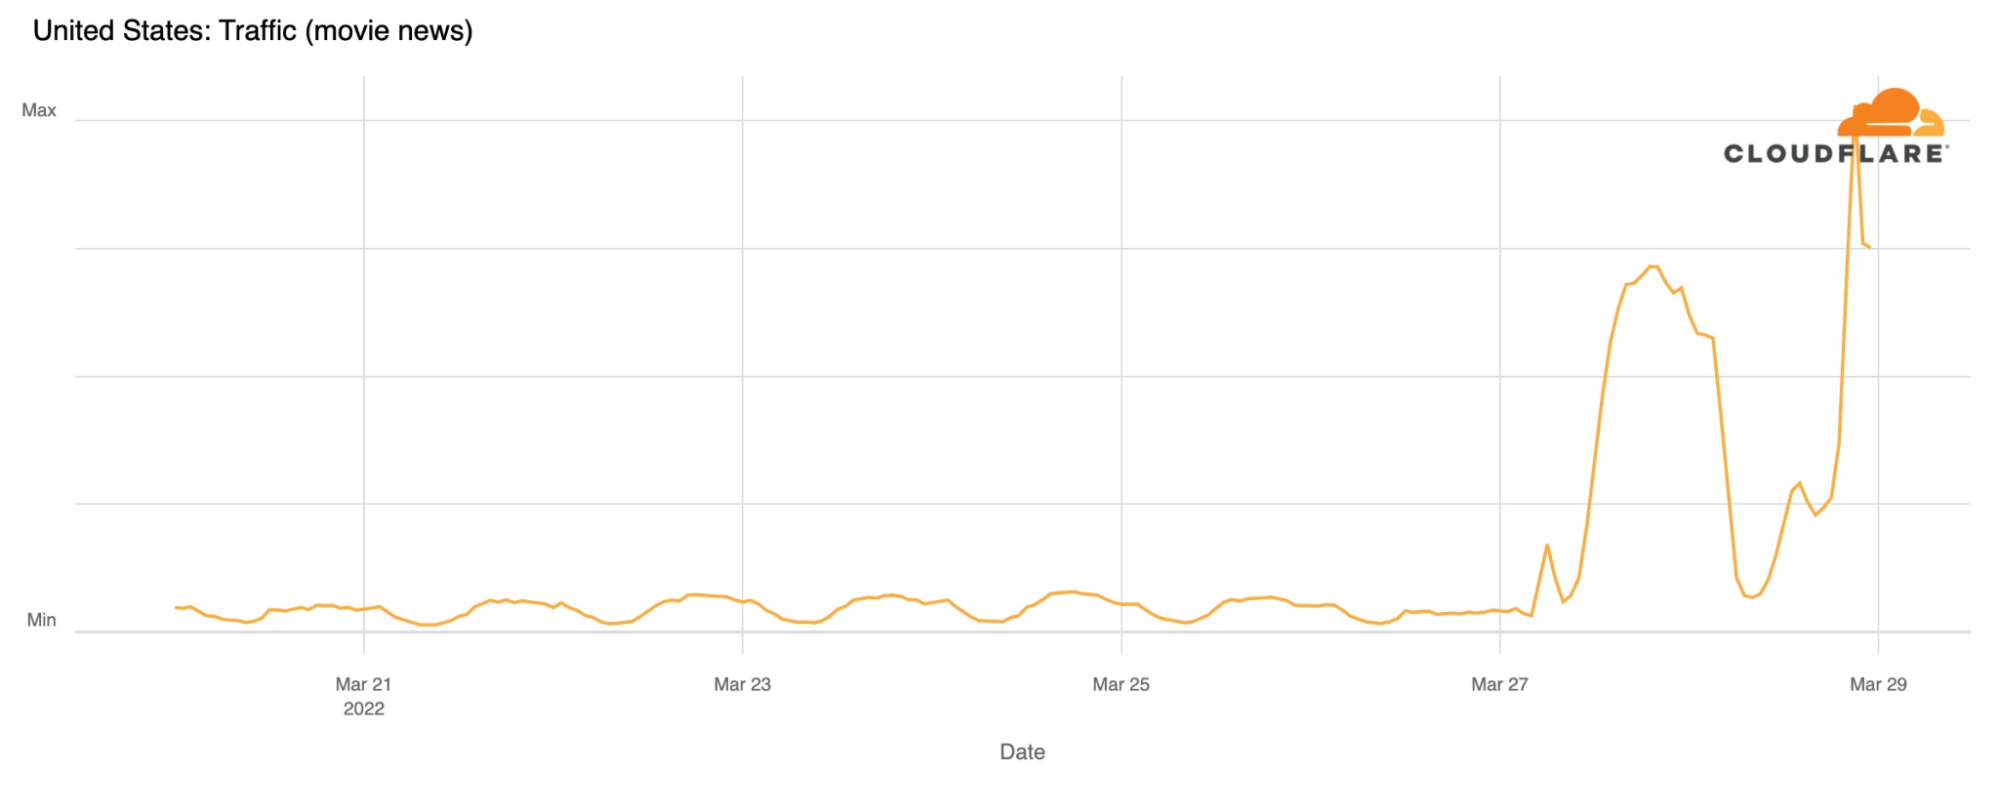
Movie news sites trends
So, how about the trends for movie news sites like Variety, Hollywood Reporter, Vulture or E Online? For this we went on to look at the whole Oscars week (the baseline is a mean of the previous Sunday, March 20, 2022). The Oscars Sunday, March 27, was definitely the main day of the week, with DNS requests for those websites growing 833% more than the best days of the week.
That growth was even higher the next day, Monday, March 28, 2022, when traffic rose to 1,200% more than the best days of the previous week.
Conclusion
As we saw with the Super Bowl LVI, an out of the ordinary moment in a popular event, even when it’s broadcasted via television, causes changes in social media and Internet traffic. In the case of the Super Bowl LVI it was the Coinbase ad; here it was an unexpected incident on stage.
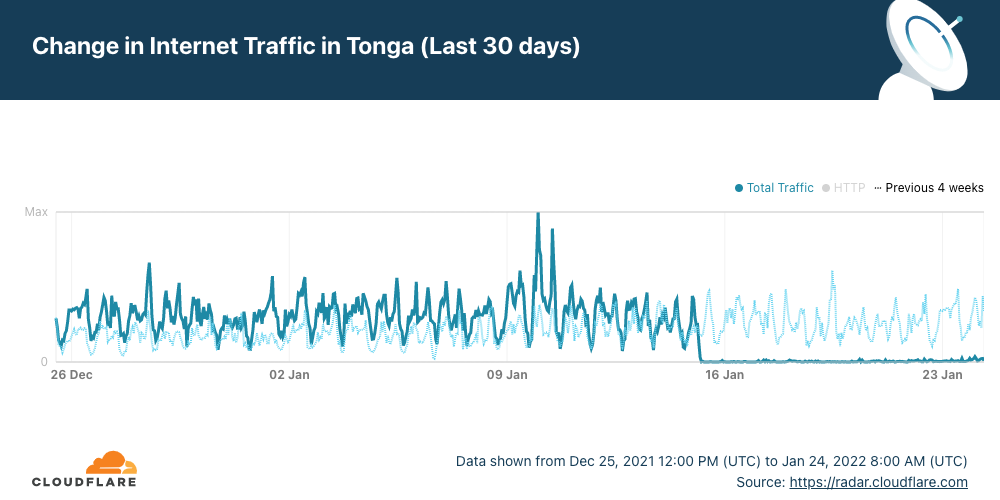
Tonga, the South Pacific archipelago nation (with 169 islands), was reconnected to the Internet this early morning (UTC) and is back online after successful repairs to the undersea cable that was damaged on Saturday, January 15, 2022, by the January 14, volcanic eruption.
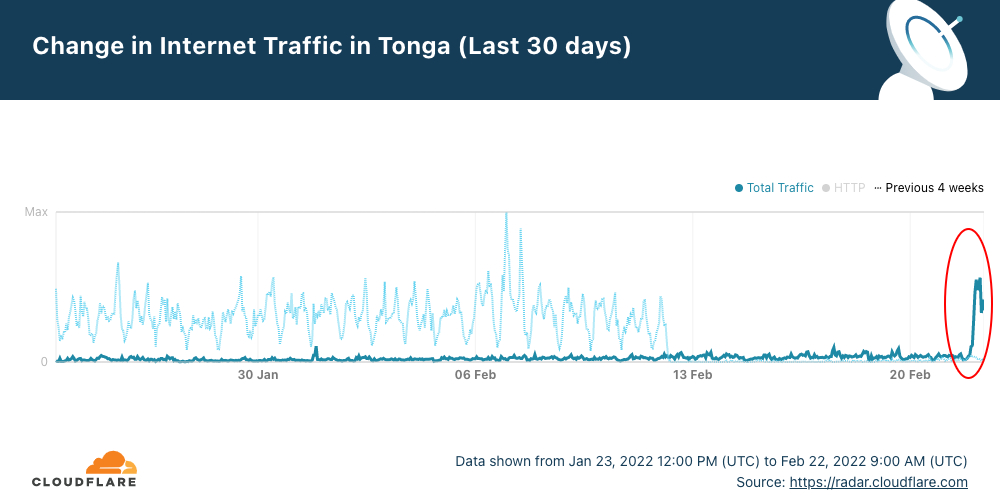
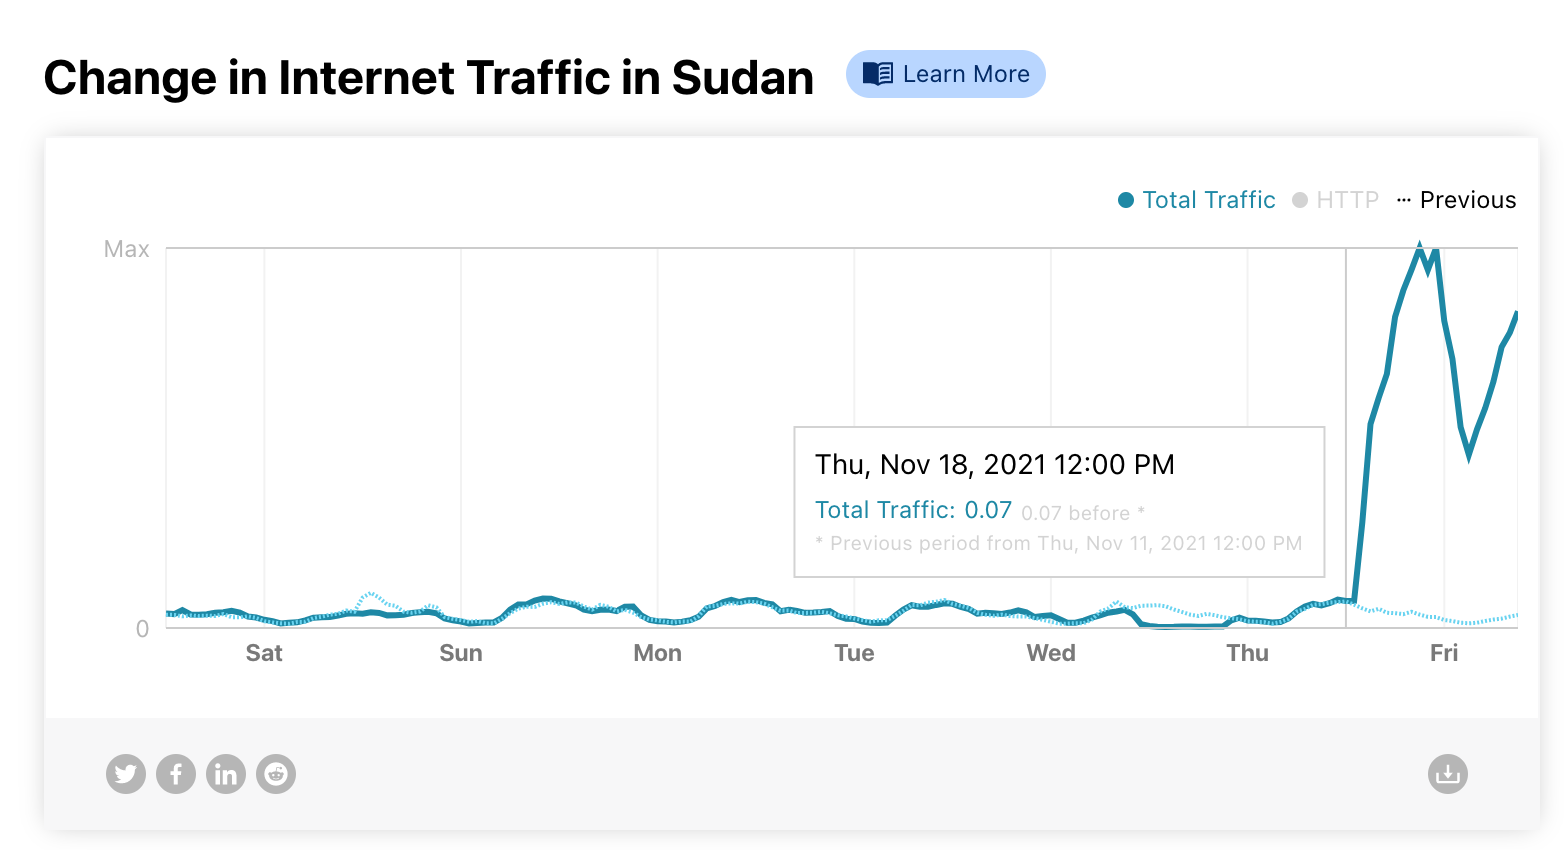
After 38 days without full access to the Internet, Cloudflare Radar shows that a little after midnight (UTC) — it was around 13:00 local time — on February 22, 2022, Internet traffic in Tonga started to increase to levels similar to those seen before the eruption.
The faded line shows what was normal in Tonga at the start of the year, and the dark blue line shows the evolution of traffic in the last 30 days. Digicel, Tonga’s main ISP announced at 02:13 UTC that “data connectivity has been restored on the main island Tongatapu and Eua after undersea submarine cable repairs”.
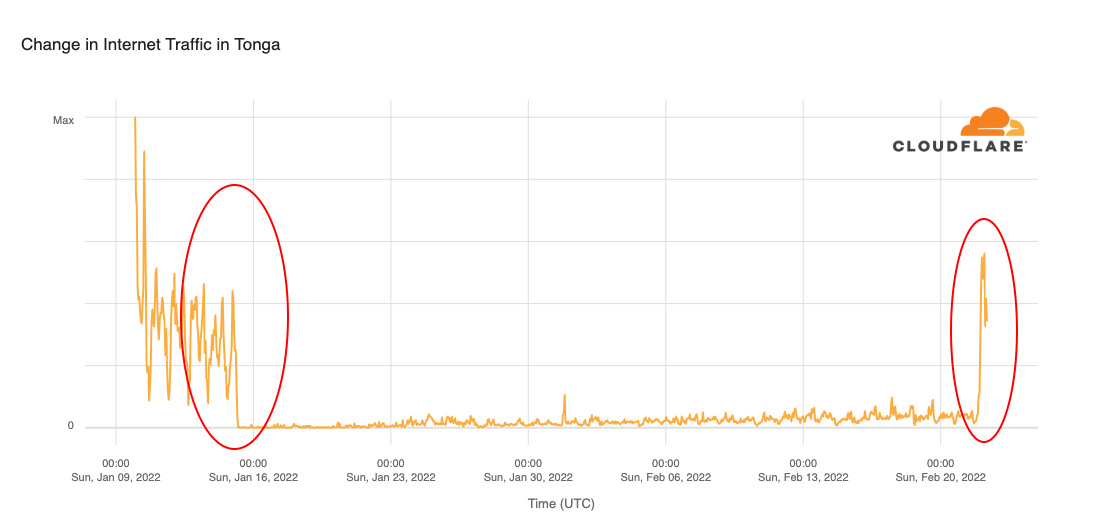
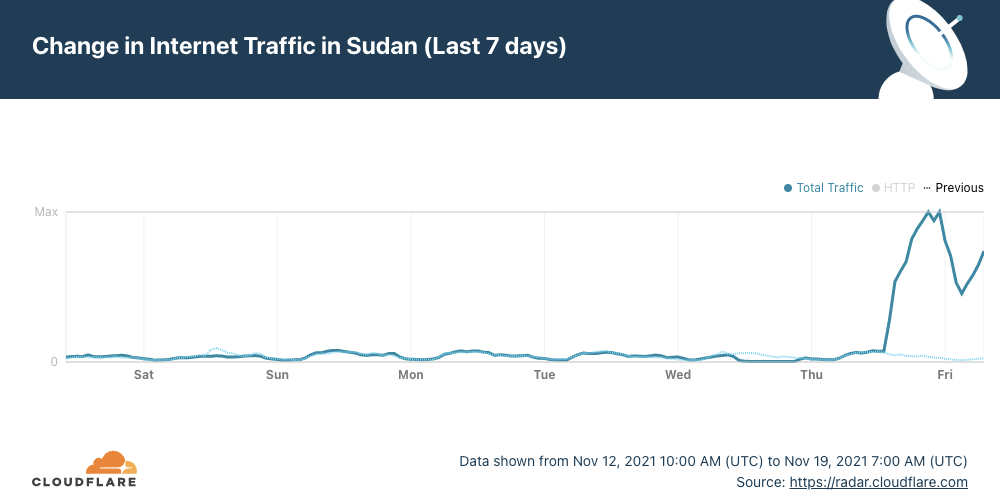
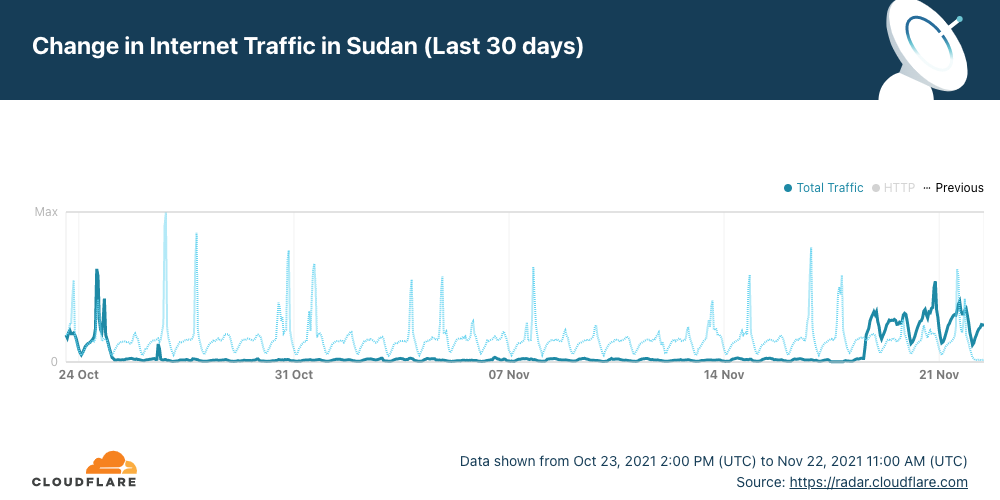
When we expand the view to the previous 45 days, we can see more clearly how Internet traffic evolved before the volcanic eruption and after the undersea cable was repaired.
The repair ship Reliance took 20 days to replace a 92 km (57 mile) section of the 827 km submarine fiber optical cable that connects Tonga to Fiji and international networks and had “multiple faults and breaks due to the volcanic eruption”, according to Digicel.
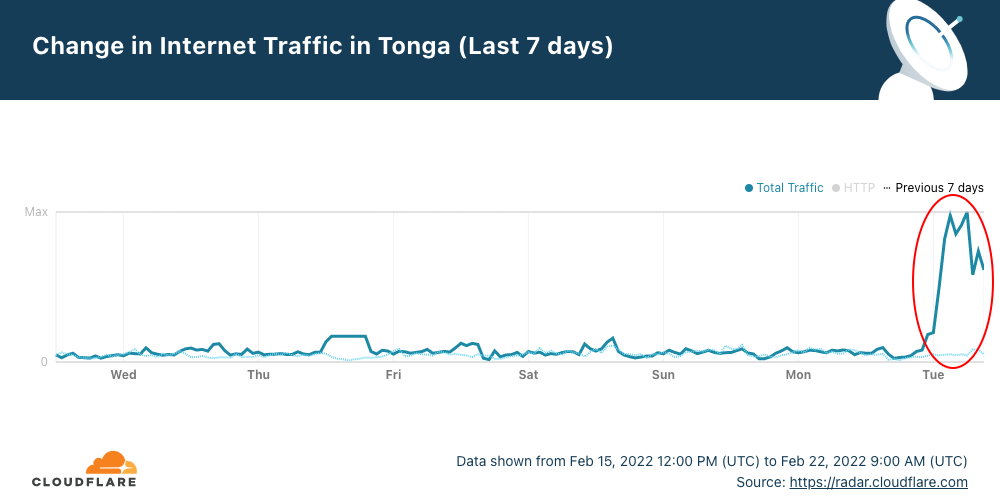
Tonga Cable chief executive James Panuve told Reuters that people on the main island “will have access almost immediately”, and that was what we saw on Radar with a large increase in traffic persisting.
The residual traffic we saw from Tonga a few days after January 15, 2022, comes from satellite services that were used with difficulty by some businesses.
James Panuve also highlighted that the undersea work is still being finished to repair the domestic cable connecting the main island of Tongatapu with outlying islands that were worst hit by the tsunami, which, he told Reuters, could take six to nine months more.
So, for some of the people who live on the 36 inhabited islands, normal use of the Internet could take a lot longer. Tonga has a population of around 105,000, 70% of whom reside on the main island, Tongatapu and around 5% (5,000) live on the nearby island of Eua (now also connected to the Internet).
Telecommunication companies in neighboring Pacific islands, particularly New Caledonia, provided lengths of cable when Tonga ran out, said Panuve.
A world of undersea cables for the world’s communications
We have mentioned before, for example in our first blog post about the Tonga outage, how undersea cables are important to global Internet traffic that is mostly carried by a complex network that connects countries and continents.
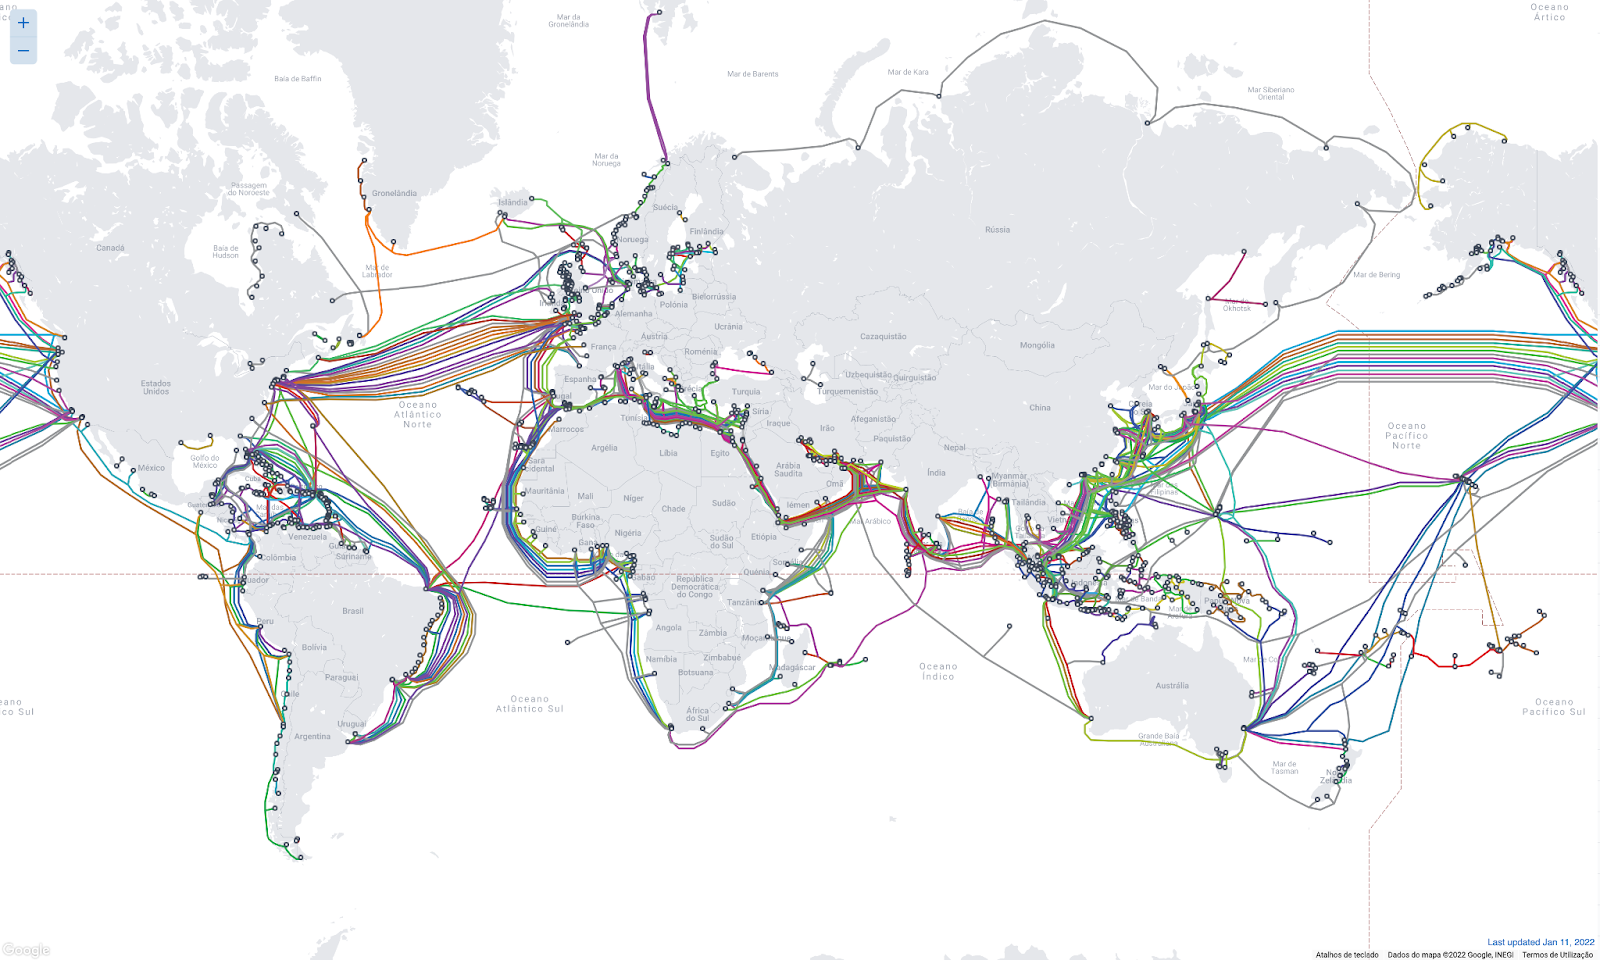
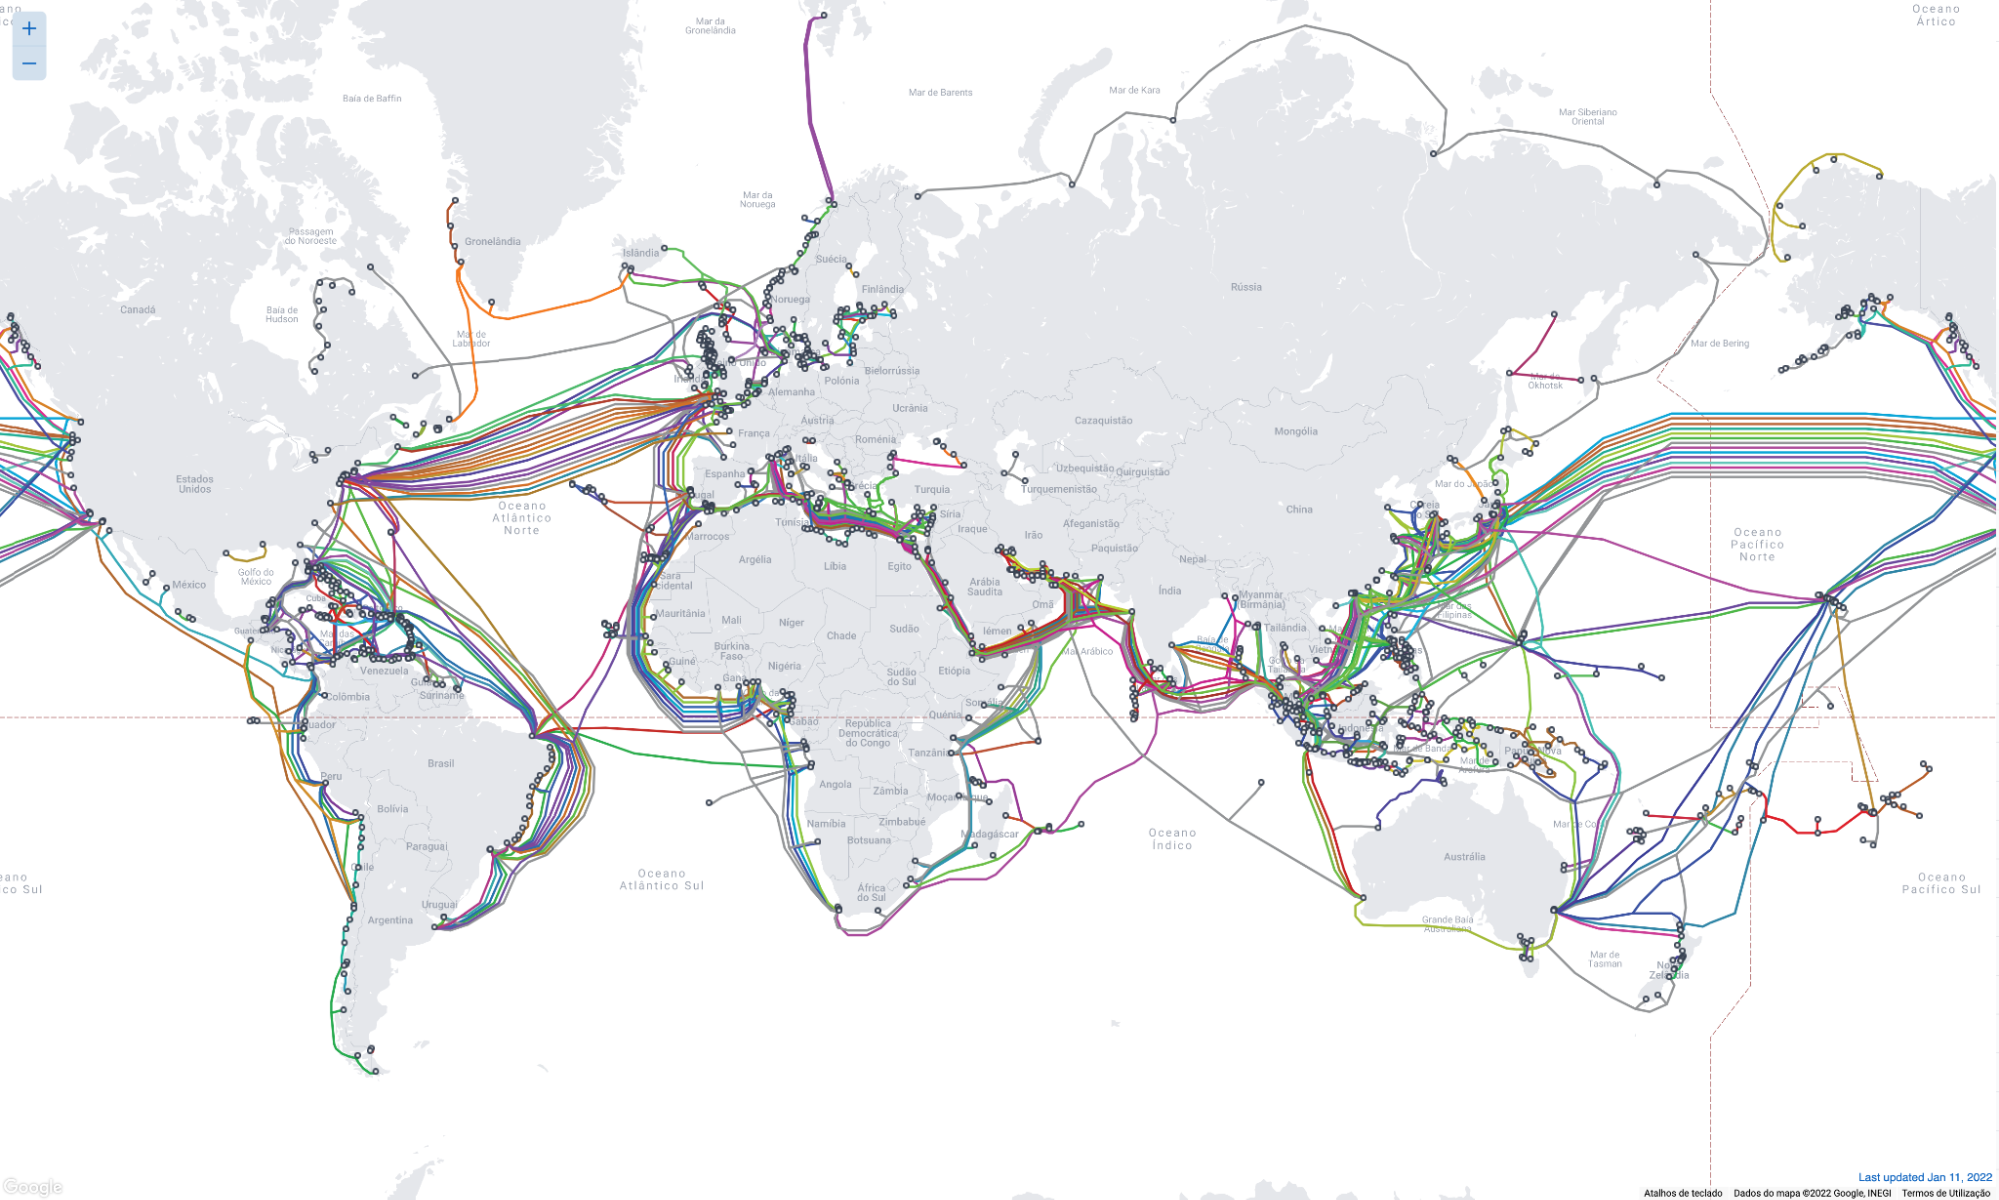
The full submarine cable system (the first communications cables laid were from the 1850s and carried telegraphy traffic) is what makes most of the world’s Internet function between countries and continents. There are 428 active submarine cables (36 are planned), running to an estimated 1.3 million km around the globe.
World map of submarine cables. Antartida is the only continent not yet reached by a submarine telecommunications cable. Source: TeleGeography (www.submarinecablemap.com
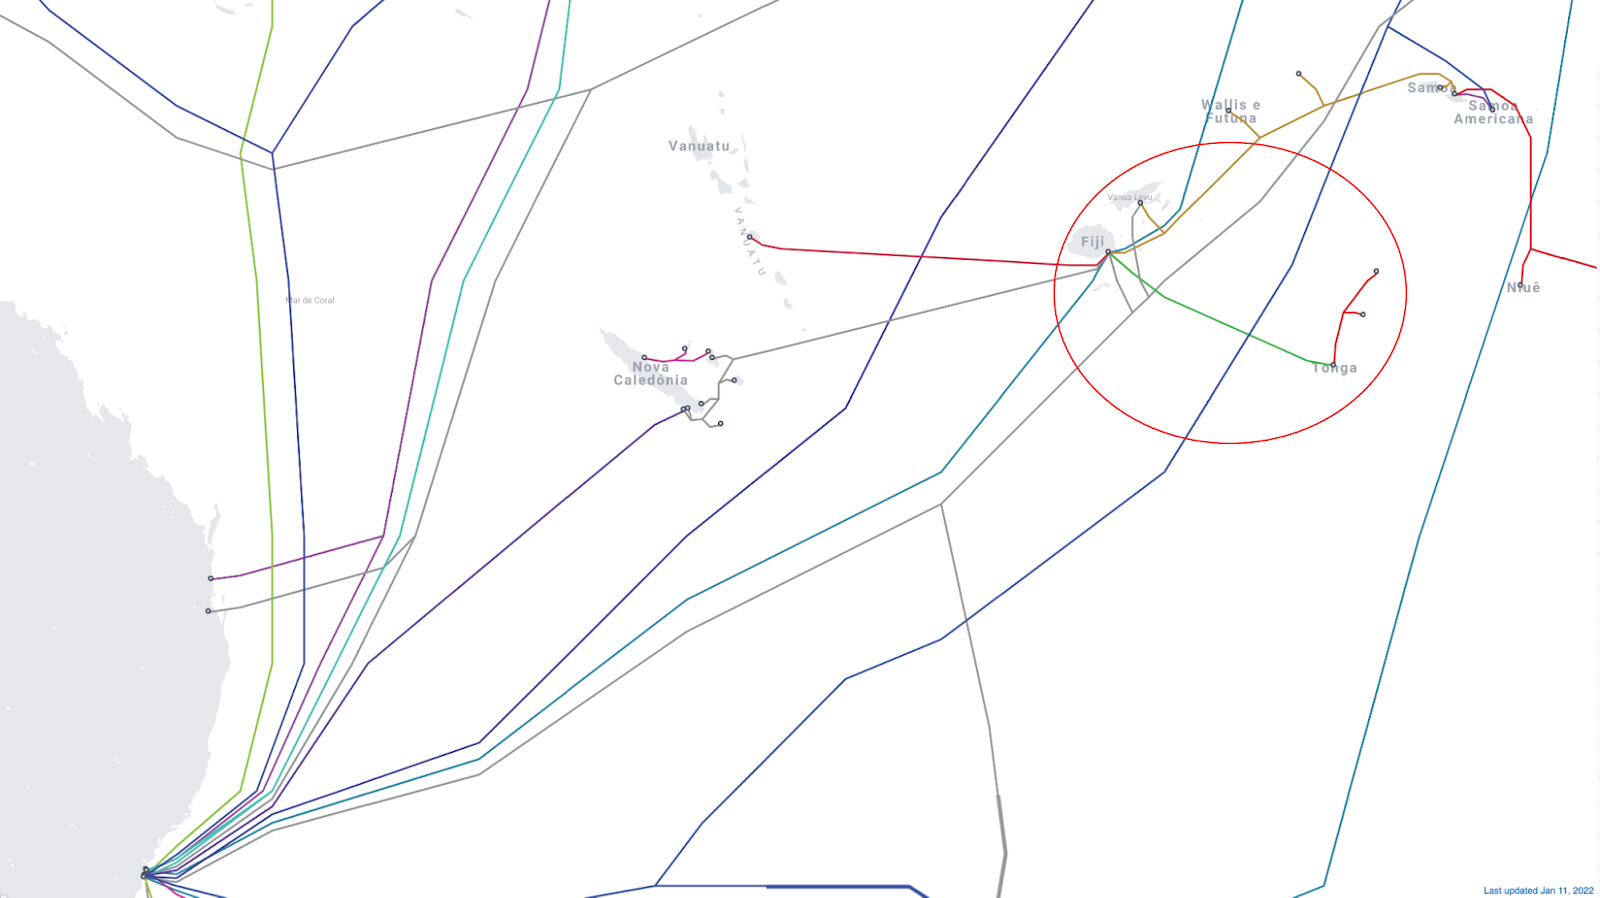
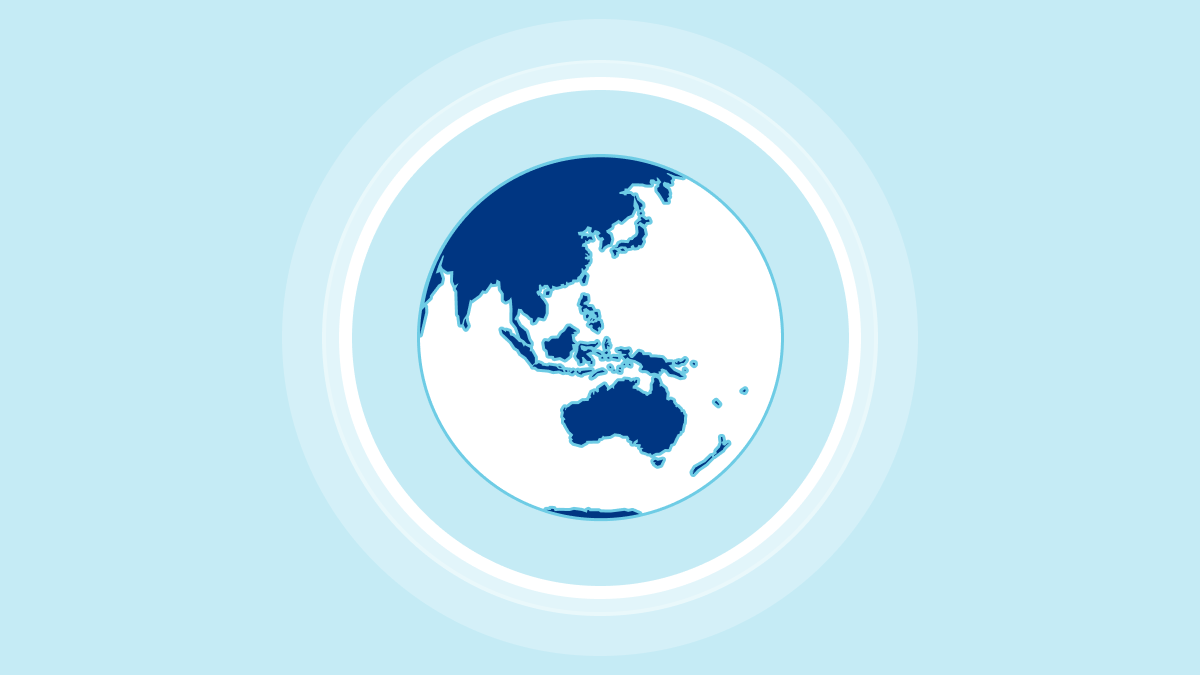
The reliability of submarine Internet is high, especially when multiple paths are available in the event of a cable break. That wasn’t the case for the Tonga outage, given that the 827 km submarine cable only connects Fiji to the Tonga archipelago — Fiji is connected to the main Southern Cross Cable, as the next image illustrates.
Submarine Cable Map shows the undersea cables that connect Australia to Fiji and the following connections to other archipelagos like Tonga. Source: TeleGeography (www.submarinecablemap.com)
In a recent conversation on a Cloudflare TV segment we discussed the importance of undersea cables with Tom Paseka, Network Strategist who is celebrating 10 years at Cloudflare and worked previously for undersea cable companies in Australia. Here’s a clip:
“It’s ridiculous for a country to get all worked up about a game—except the Super Bowl, of course. Now that’s important.” – Andy Rooney, American radio and television writer
When the Super Bowl is on, there are more winners than just one of the teams playing, especially when we look at Internet trends. By now, everyone knows that the Los Angeles Rams won, but we also want to look at which Super Bowl advertisers were the biggest winners, and how traffic to food delivery services, social media and messaging apps, and sports and betting websites changed throughout the game.
We covered some of these questions during our Super Bowl live-tweeting on our Cloudflare Radar account. (Hint: follow us if you’re interested in Internet trends).
Cloudflare Radar uses a variety of sources to provide aggregate information about Internet traffic and attack trends. In this blog post, as we did last year, we use DNS name resolution data to estimate traffic to websites. We can’t see who visited the websites mentioned, or what anyone did on the websites, but DNS can give us an estimate of the interest generated by the ads or across a set of sites in the categories listed above.
The baseline value for the charts was calculated by taking the mean traffic level for the associated websites during 12:00 – 15:00 EST on Super Bowl Sunday (February 13, 2022).
The Big Picture
Focusing on the two teams that made it to the big game and to get the ball rolling already, the Bengals website had some spikes before kickoff and during the second half, but the Rams website had a great run and just like on the field, had their biggest peak at the end.
The @Bengals website had some spikes before kickoff and during the second half but @RamsNFL had a great run and just like on the field, had their biggest peak at the end. Congratulations to the #Rams for winning the #SuperBowl. pic.twitter.com/YfJgv0RHXP
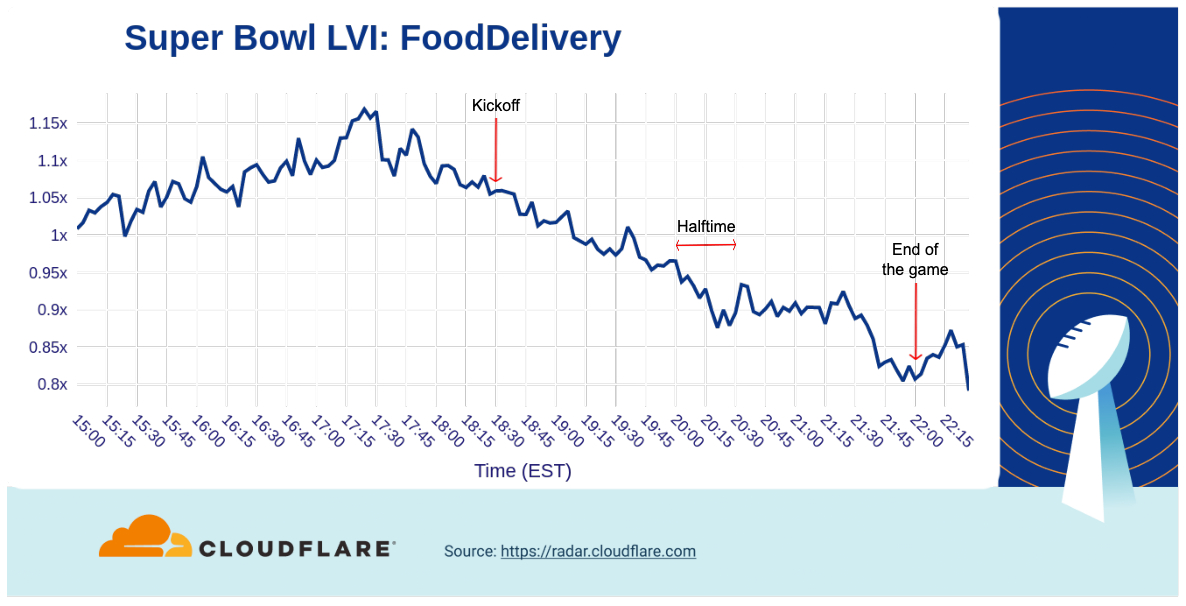
Super Bowl Sunday is not only about the ads – part of the excitement around watching the game with friends and family is having a great assortment of food and snacks. So, let’s start with the aggregated traffic to a set of food delivery services that clearly builds to a peak around 17:30, one hour before kickoff. After that, traffic generally decreases but increases slightly after the second half starts.
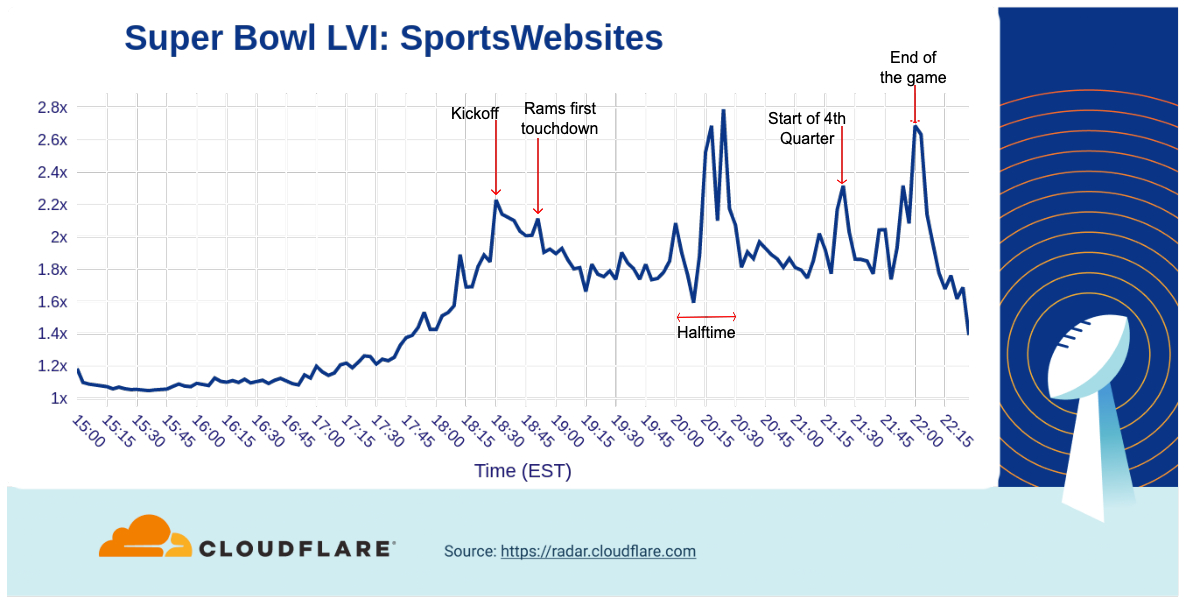
When we look at traffic to sports websites, there’s a build up to a peak as the game began at 18:30.
As the game progressed, traffic dropped off, but spiked three times during halftime (between 20:00 and 20:30). After the Rams victory was assured, traffic to those websites saw a final peak.
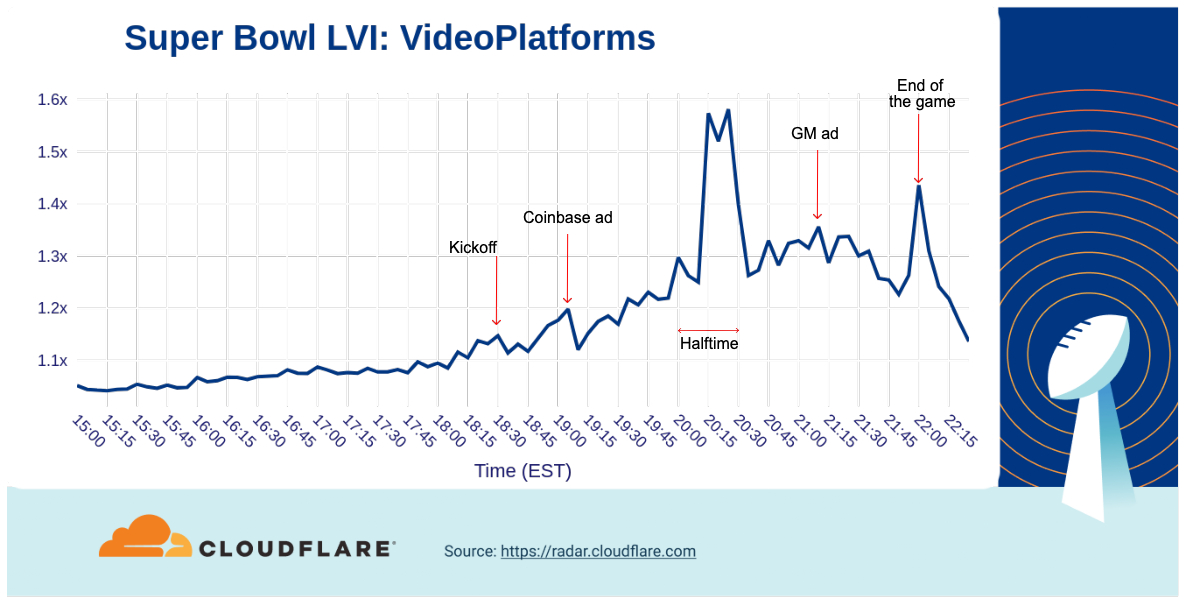
We can also see below that aggregated traffic to video platforms had a pattern similar to sports websites, with two peaks at halftime and a third notable one at the end of the game. After kickoff (18:30) the first peak occurred around the same time Coinbase’s bouncing QR code commercial aired.
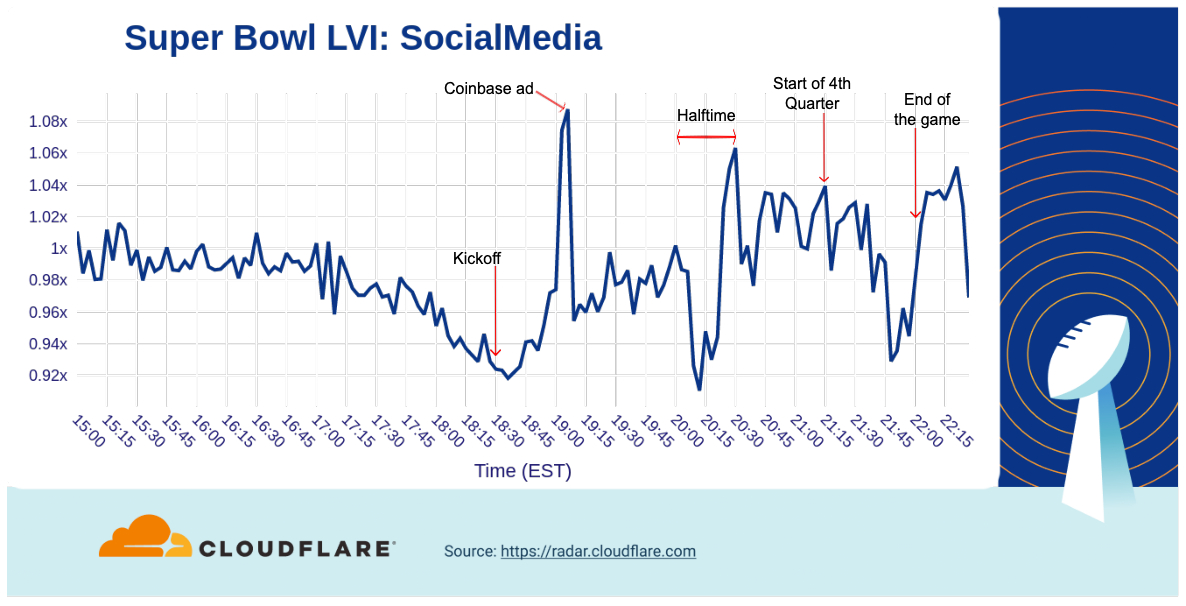
How about social media? Aggregate traffic to social media sites started to decrease after 17:00, hitting its lowest point just before kickoff.
During the game, there was a clear spike (the biggest of the afternoon/evening) after the Coinbase QR code ad aired. At halftime, social media traffic dropped off before peaking again right before the second half started. A final peak occurred after the game ended.
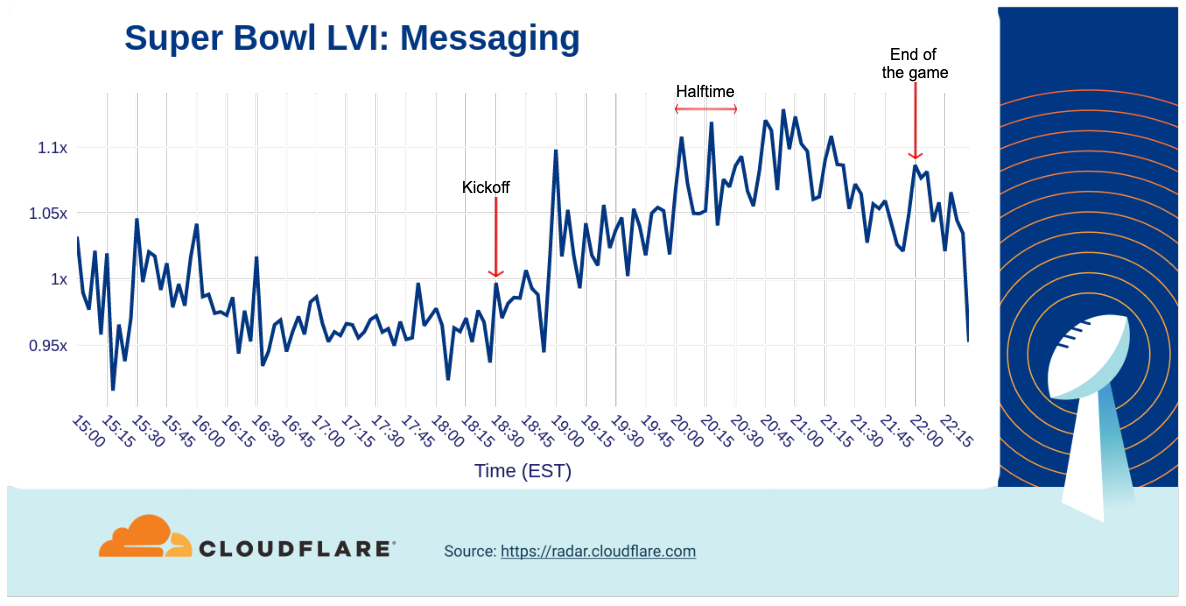
Finally, let’s look at messaging services. Among this set of domains, there wasn’t as much of a decrease as we saw in social media heading into kickoff, but there was a spike around 19:00 after the second batch of commercials was aired. Traffic continued to grow through halftime and into the third quarter before starting to drop heading towards the end of the game. Similar to several of the other categories above, messaging traffic again rose after the end of the game.
The Internet Impact of Commercials
Historically, many people have watched the Super Bowl as much for the ads as the actual football game. (Maybe even more so some years…) Many of the advertisements are now posted online ahead of Super Bowl Sunday. Given that, do these commercials still drive traffic to the company’s web site while the game is on?” As we saw in 2021, the answer remains a resounding yes.
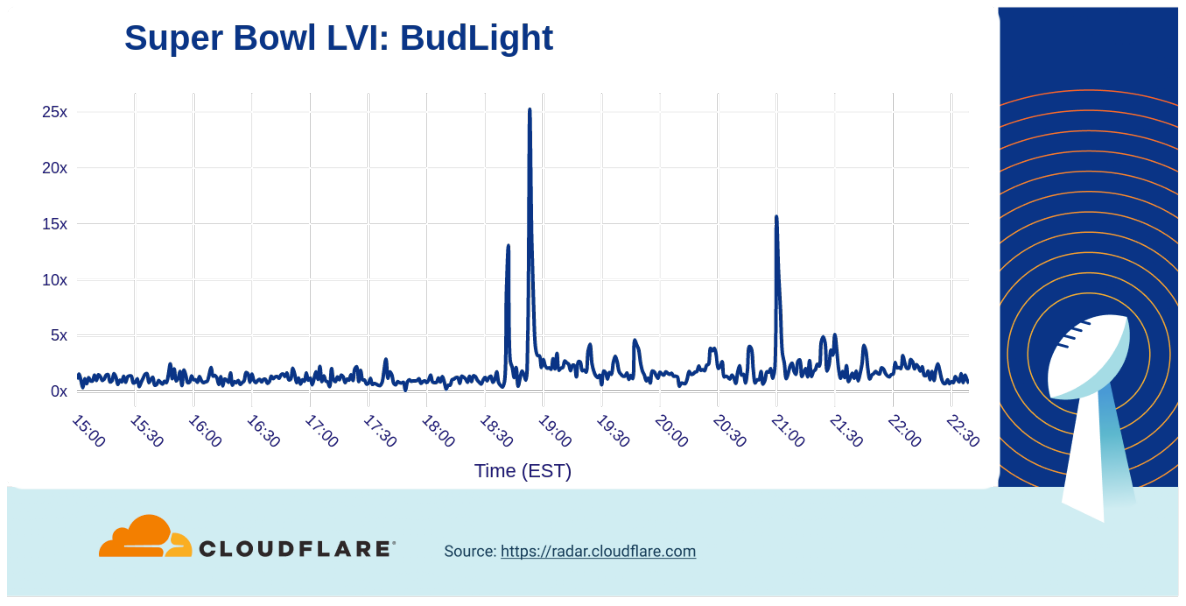
The first Bud Light ad during the game (at 18:52) drove a more than 25x increase to their site, and the Bud Light Seltzer Hard Soda ad with Guy Fieri at 21:00 drove a second peak in traffic, with a 15x increase over baseline.
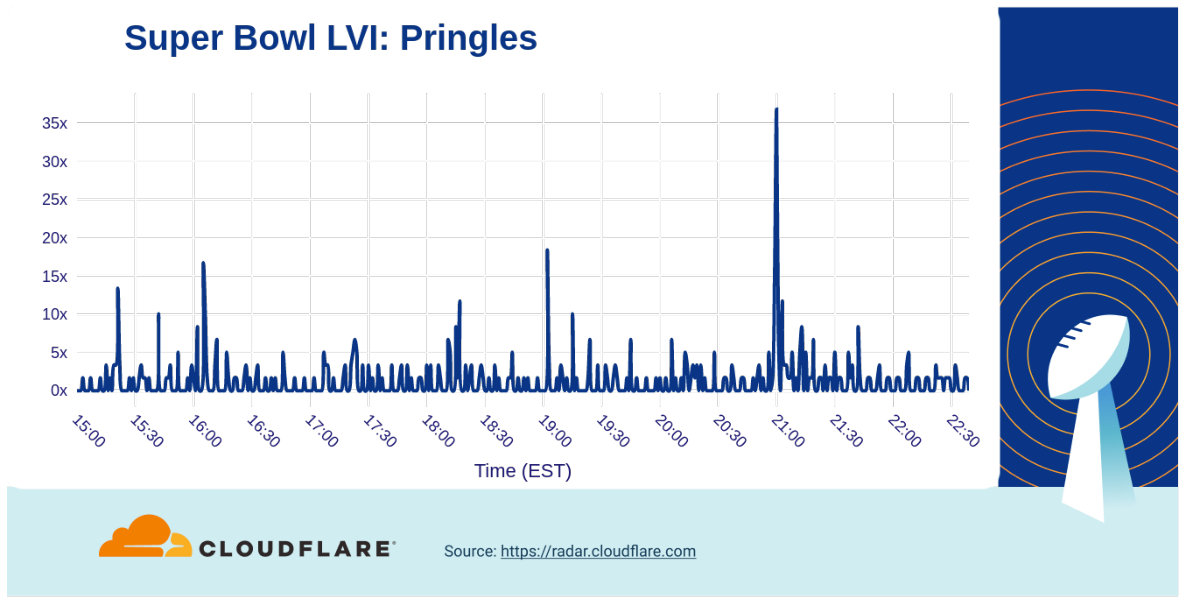
The Pringles commercial (at 21:00), where a hand stuck in a Pringles can really stuck with viewers, resulted in a greater than 35x increase. On the other hand, Lays got a 30x bump in traffic from their wedding memories ad at 20:53.
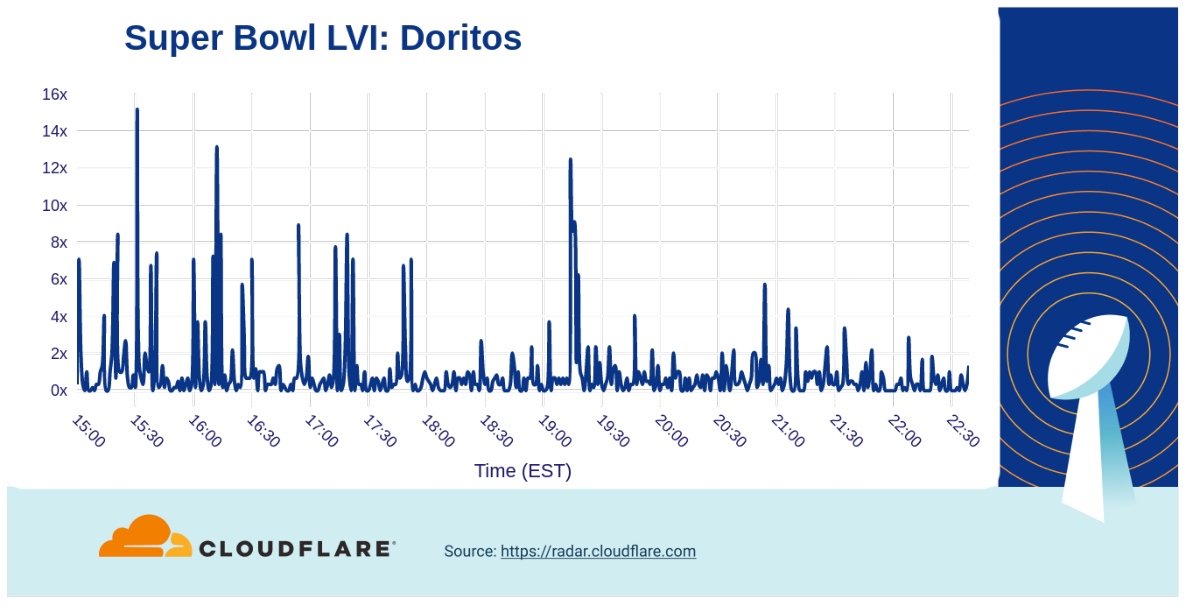
The Doritos website had already experienced some spikes throughout the afternoon, but jungle animals singing the Salt-N-Pepa hit ‘Push It’ (19:13) drove a more than 12x increase in traffic. However, last year’s ad with a flat virtual Matthew McConaughey seemed to have more impact.
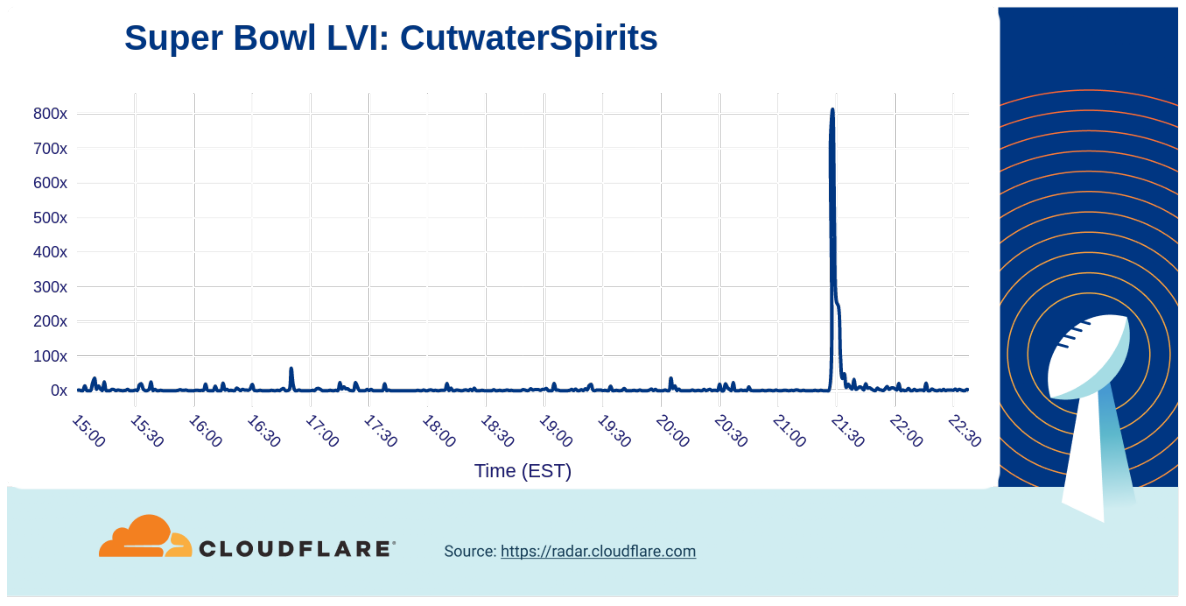
Brands that might not be so well known often get a large traffic boost from their Super Bowl commercials. For example, the cocktail company Cutwater Spirits “here’s to the lazy ones” ad, their first at the Super Bowl, resulted in an 800x increase in traffic. (The Michelob Ultra bowling ad with Peyton Manning drive a similar increase in traffic.:
Financial services: the QR code
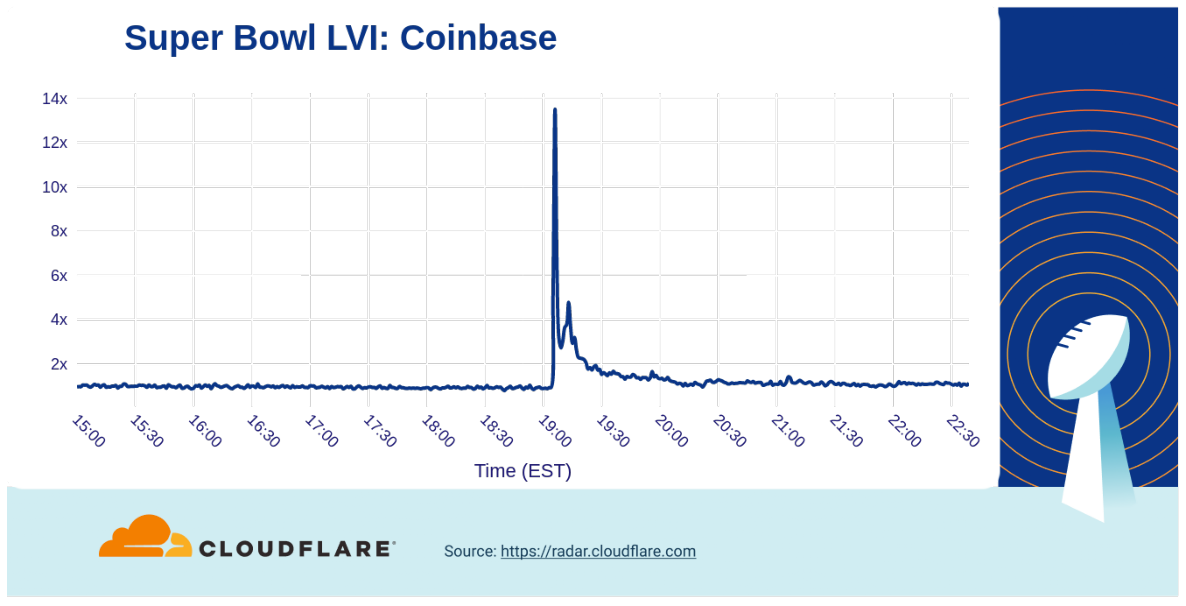
We already saw that the Coinbase ad seems to have made social media tick up after its ad aired, but what about traffic to them? The ad drove a 14x increase in traffic. (However, it is worth noting that scanning the QR code in the advertisement took viewers to drops.coinbase.com – this specific hostname is not included in the traffic analyzed for this graph.)
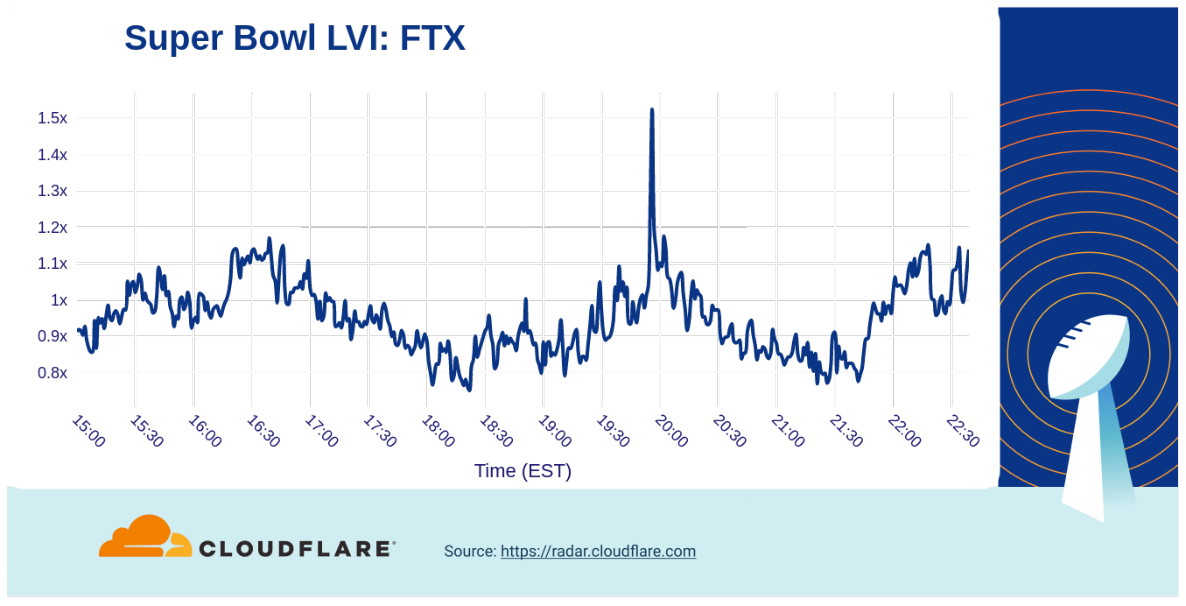
In comparison, the Crypto.com ad featuring LeBron James having a conversation with his 2003 self generated a 3x increase in traffic to their website, while the FTX ad where Larry David gives bad advice through human history only resulted in 1.5x traffic growth.
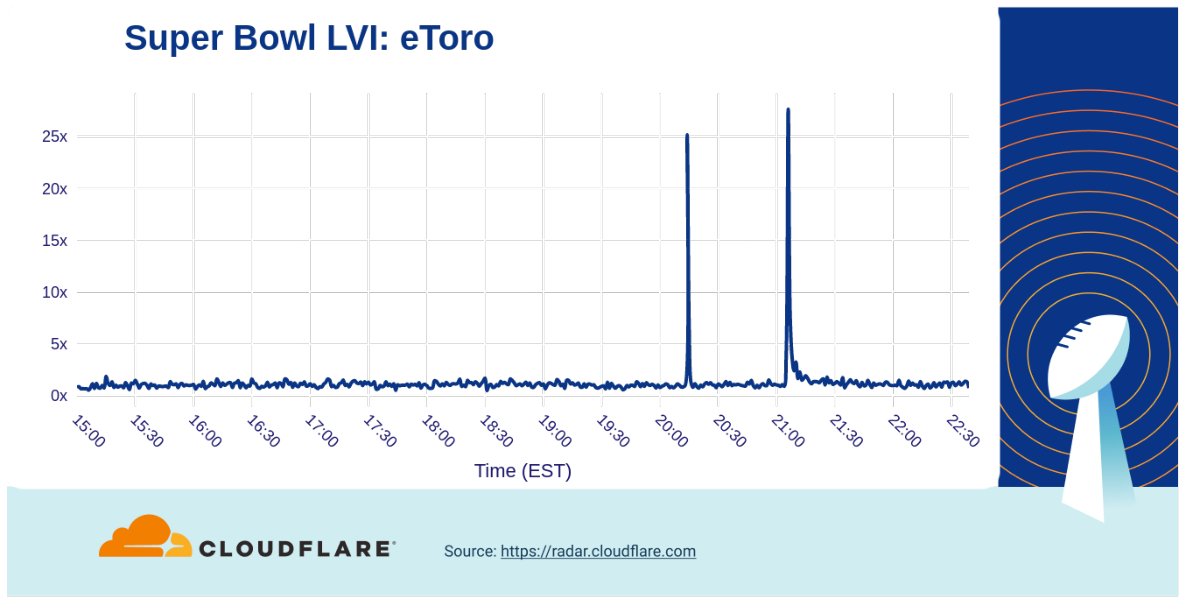
On the other hand, the eToro “to the moon” ad that ran during the second half of the game drove a 25x increase in traffic (at halftime there was another 20x bump).
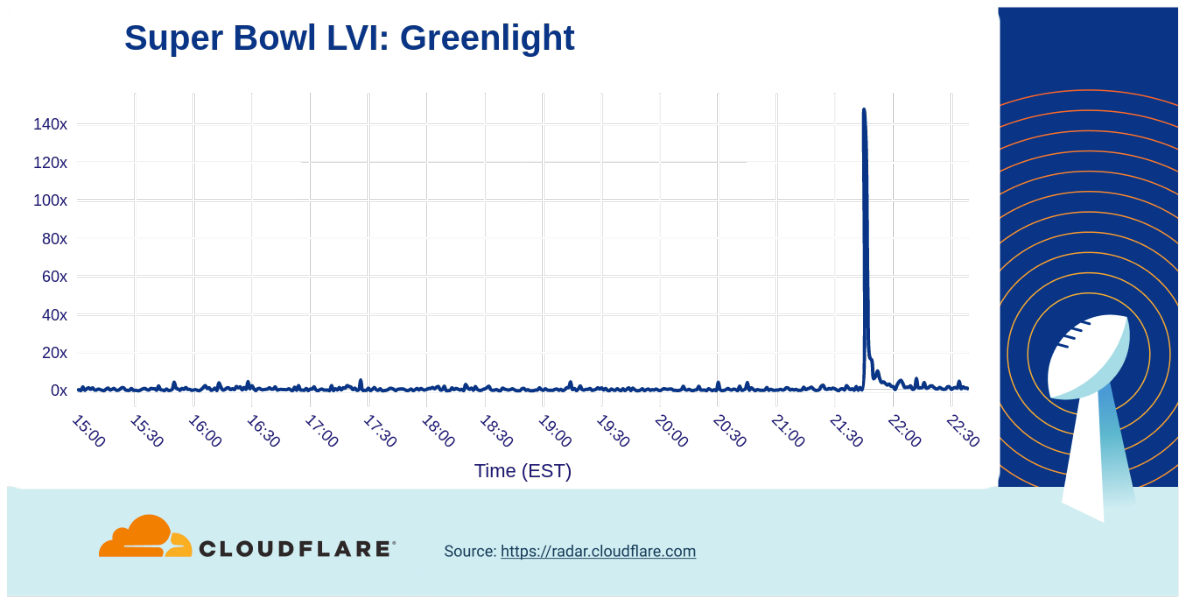
In the classic financial services world, there was another kid on the block that experienced a much bigger bump (140x) in traffic growth. The Greenlight ad featuring Modern Family’s Phil Dunphy’s (Ty Burrell) purchasing habits aired late in the game, (21:45) but clearly made an impact.
Electric cars (Dr. Evil) takeover
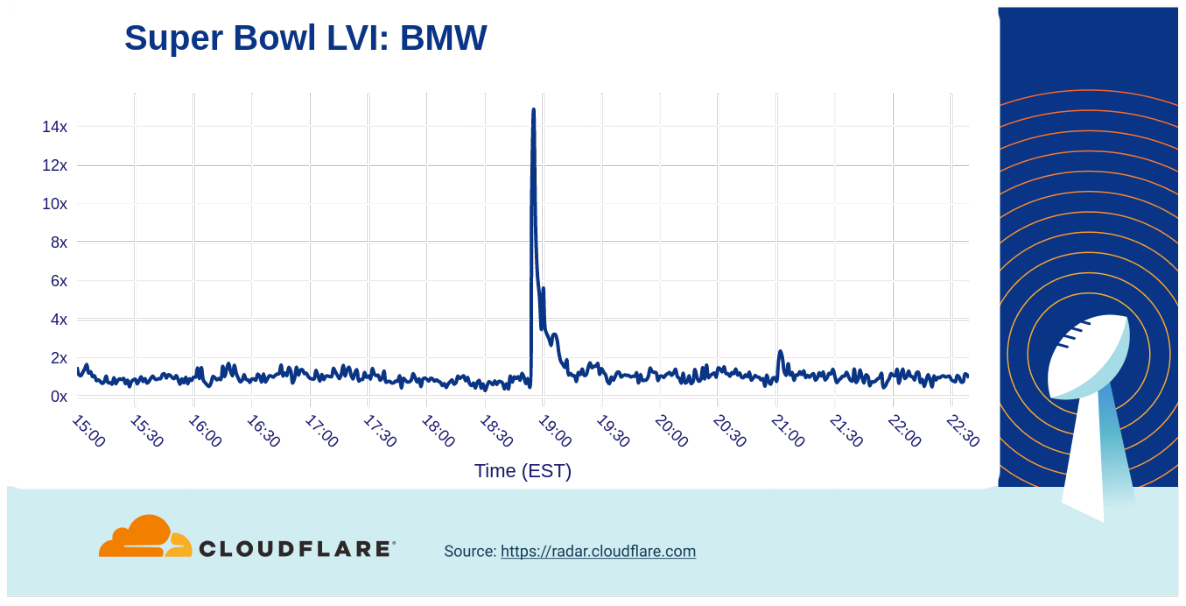
Car commercials have aired for many years during the Super Bowl, teasing new models and technologies. In 2022, electric cars were (again) a popular subject of Super Bowl ads. Bending modern day, 80’s nostalgia, and ancient mythology, BMW rocked down to Electric Avenue as their ad (18:54) resulted in a 14x increase over baseline in traffic.
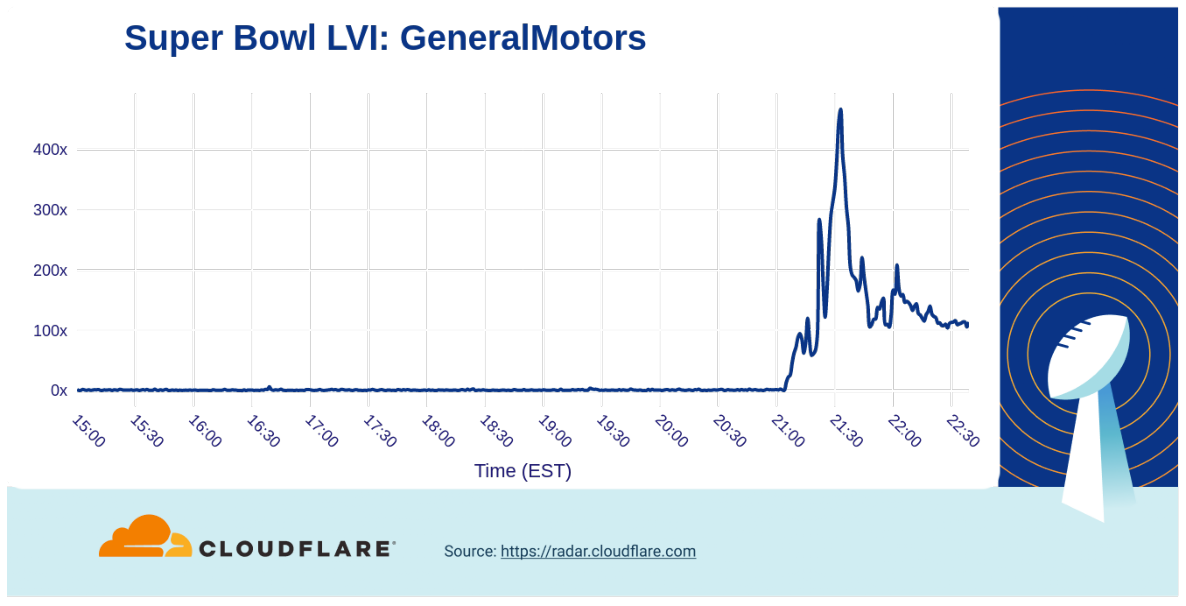
However, our data showed that there was a clear winner among automobile makers: the Dr. Evil (one of Mike Myers’s characters from Austin Powers) takeover of General Motors ad drove traffic to a peak of over 400x above baseline.
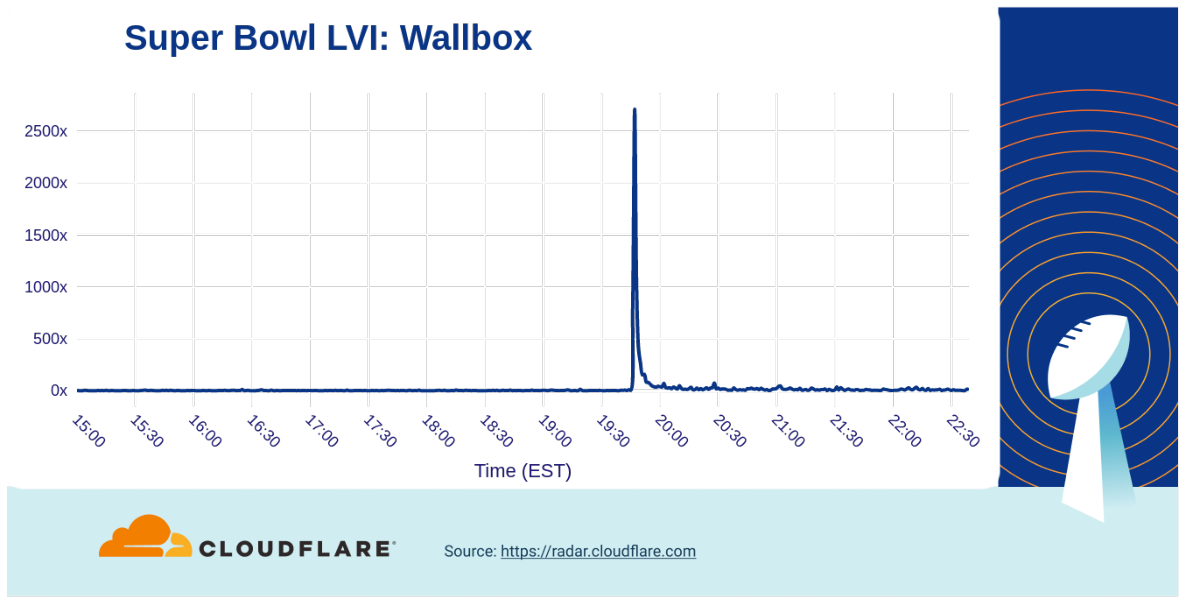
Ads from other car vendors including Toyota (5x), Kia (16x), Vroom (70x), Nissan (30x) also generated attention and increased traffic to their websites. Highlighting the importance of charging to the electric car ecosystem, the first ever Super Bowl ad from Wallbox (a manufacturer of electric car chargers) powered a huge increase in traffic to their website, reaching a peak over 2,500x higher than baseline.
Last but not least
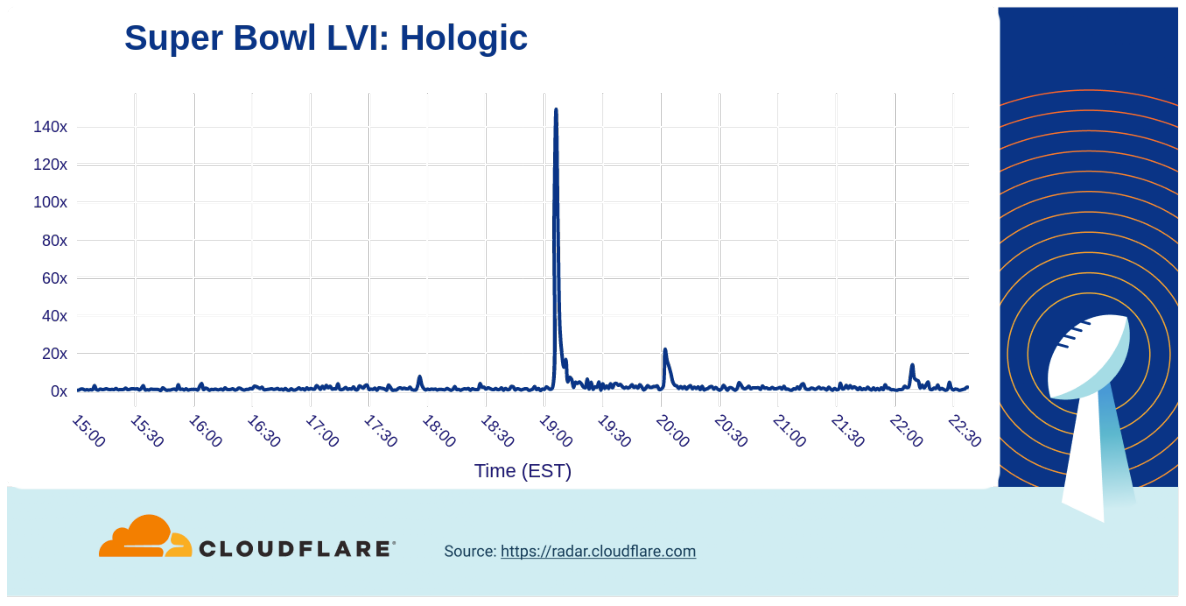
One of the health-related products that had made its mark on the Super Bowl was the early detection medical service Hologic that featured Mary J. Blige. They experienced a 140x traffic spike.
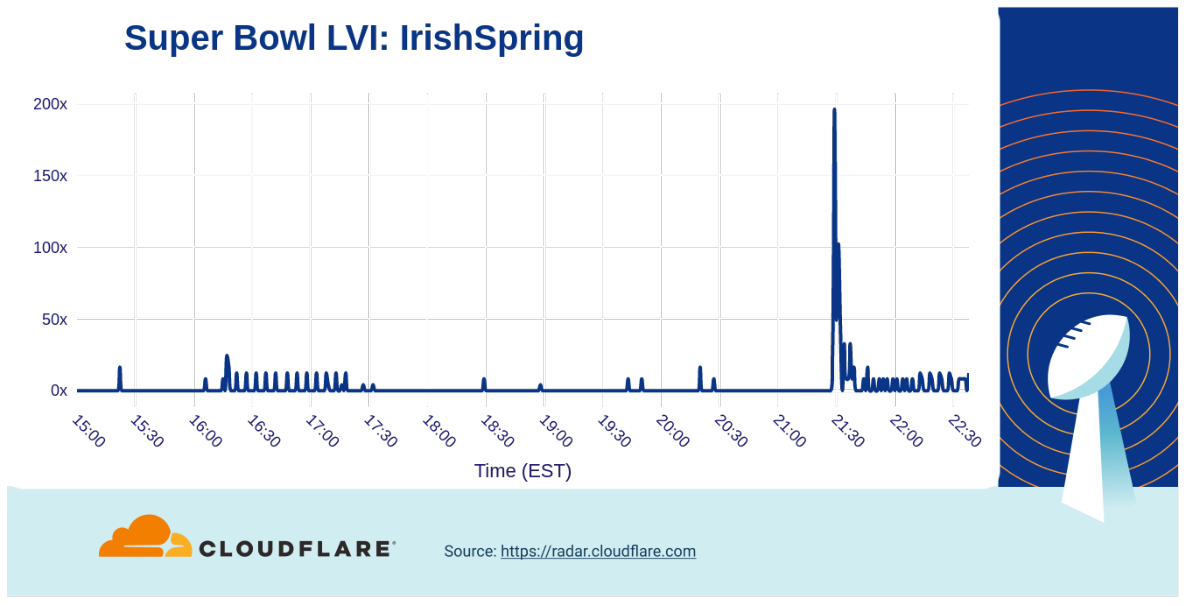
Another example that really showed that having a successful Super Bowl commercial doesn’t stink was for Irish Spring soap. Their good ‘smelling’ ad drove a traffic increase to their website of nearly 200x over baseline.
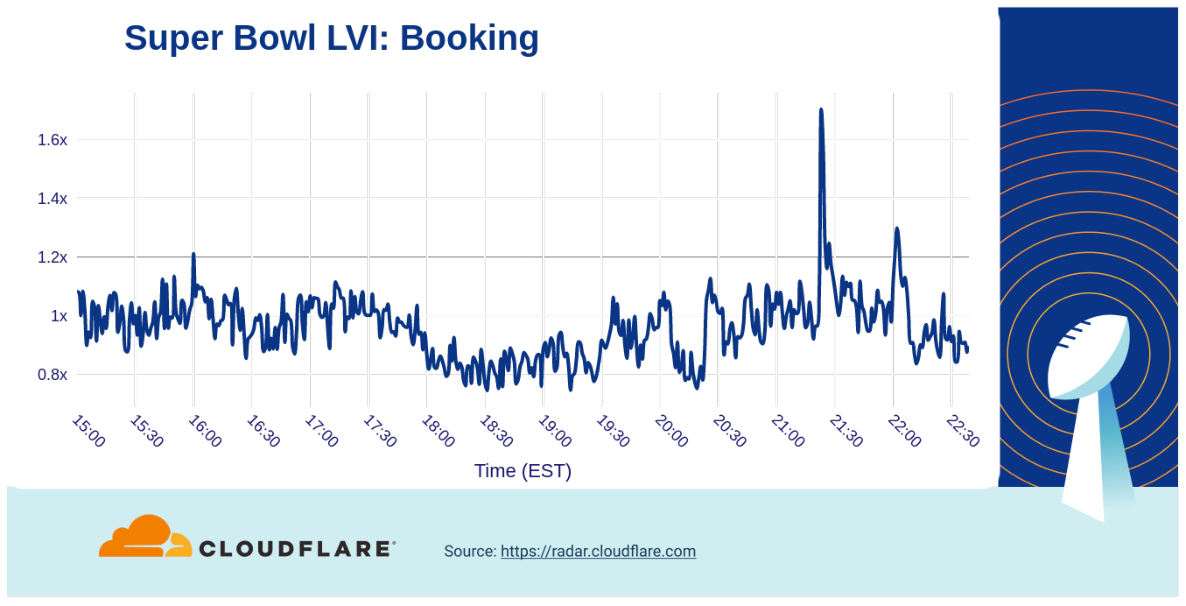
Among ads for travel-related companies, the biggest increase in traffic we saw was from Booking.com (21:23), with the adventures of Idris Elba gaining them a 1.6x bump.
Several ads promoted shows and movie trailers, including Dr. Strange 2 and Amazon Prime Video’s The Rings of Power, but the trailer for Jordan Peele’s Nope movie generated a nearly 40x increase in traffic.
And the winner is…
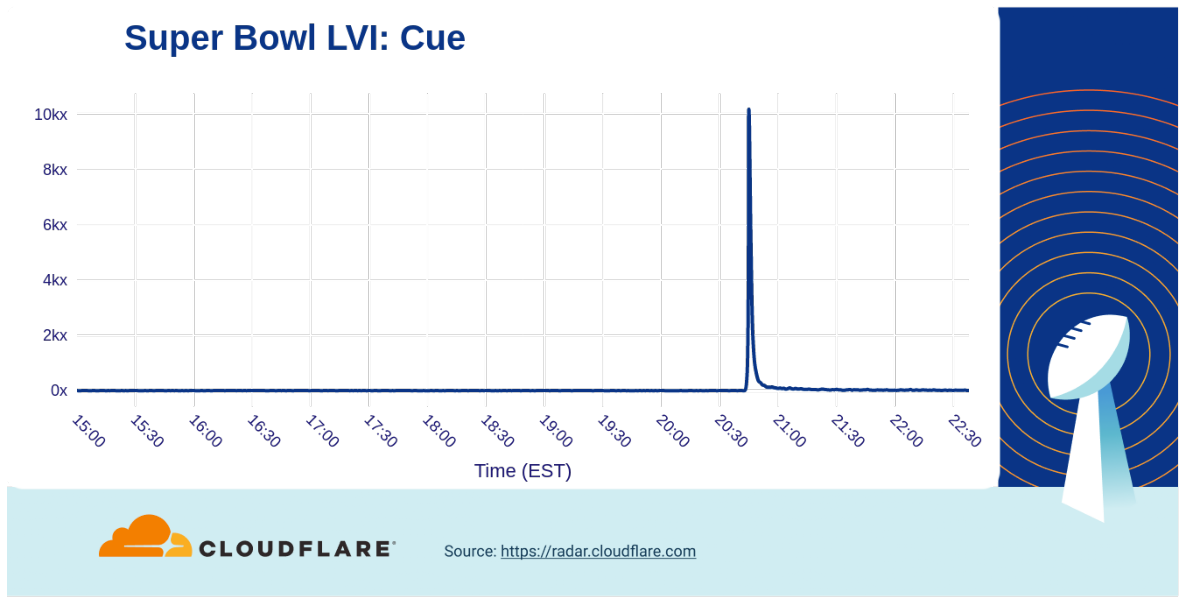
Popular smart home gadgets appeared to be jealous of the new COVID-19 testing device from Cue Health, but Super Bowl viewers were clearly curious about it. The company’s ad drove an astronomical 10,000x increase in traffic to their website after it aired.
Conclusion
We saw again that when humans change their behavior that impacts the Internet traffic (the network of networks is, after all, a human invention for humans).
Remember, visit Cloudflare Radar for up to date Internet traffic and attack trends and follow the Cloudflare Radar Twitter account for regular insights on Internet events.
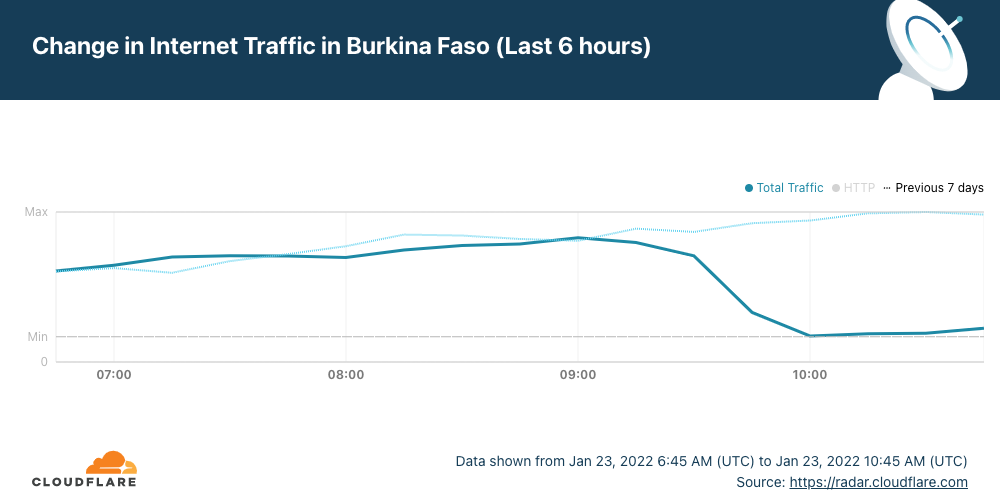
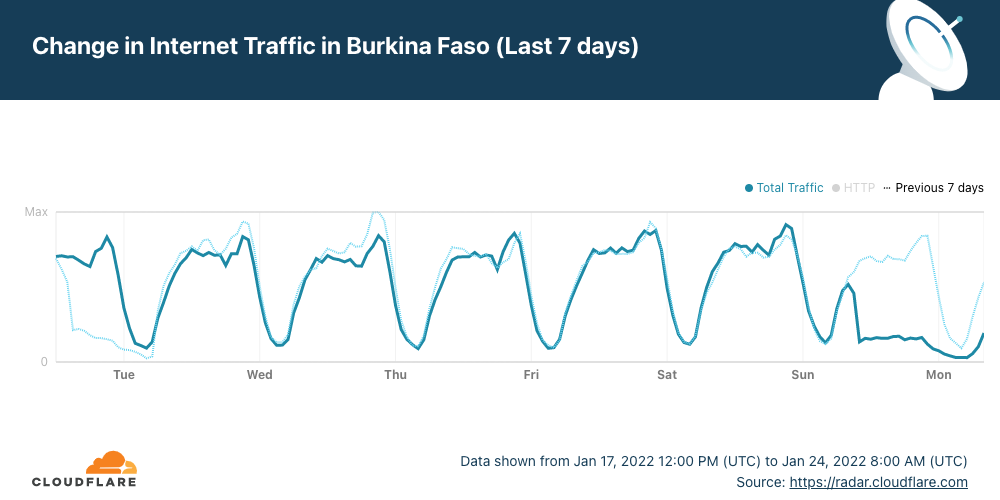
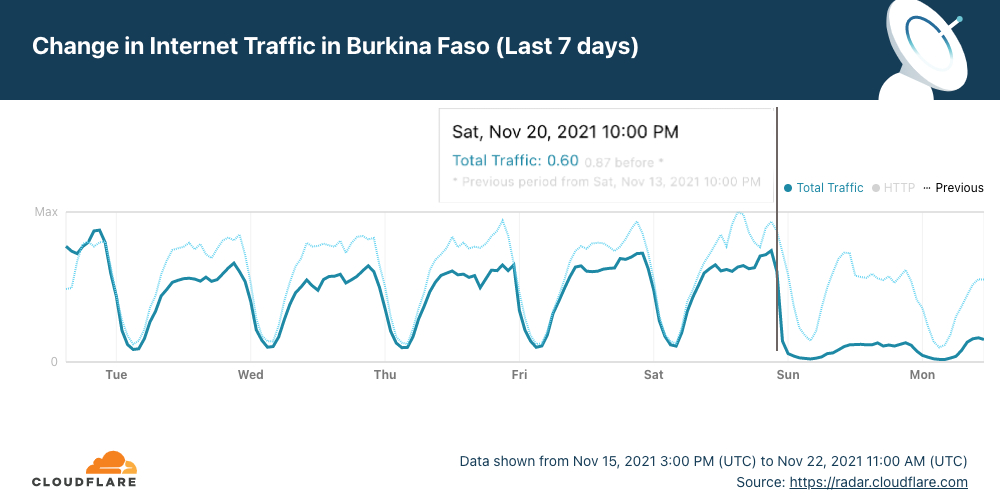
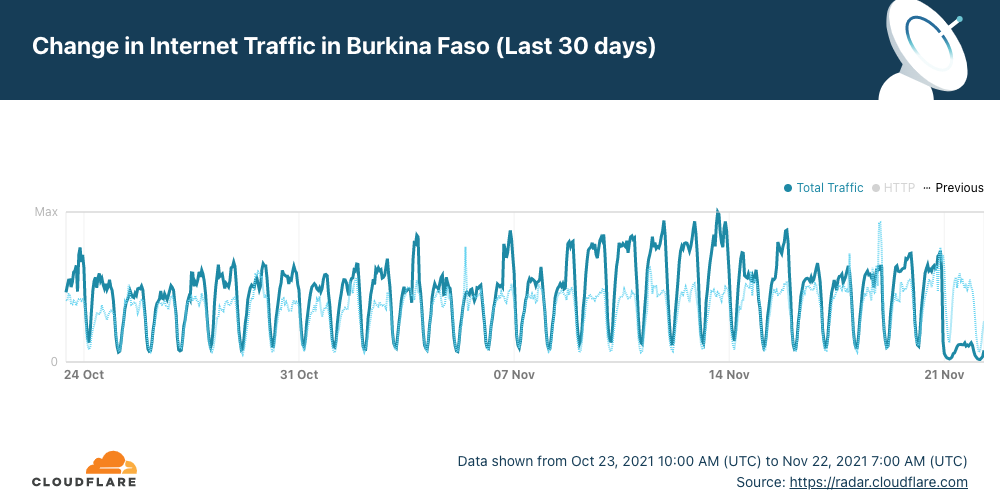
The early hours of Sunday, January 23, 2022, started in Burkina Faso with an Internet outage or shutdown. Heavy gunfire in an army mutiny could be related to the outage according to the New York Times (“mobile Internet services were shut down”). As of today, there are three countries affected by major Internet disruptions — Tonga and Yemen are the others.
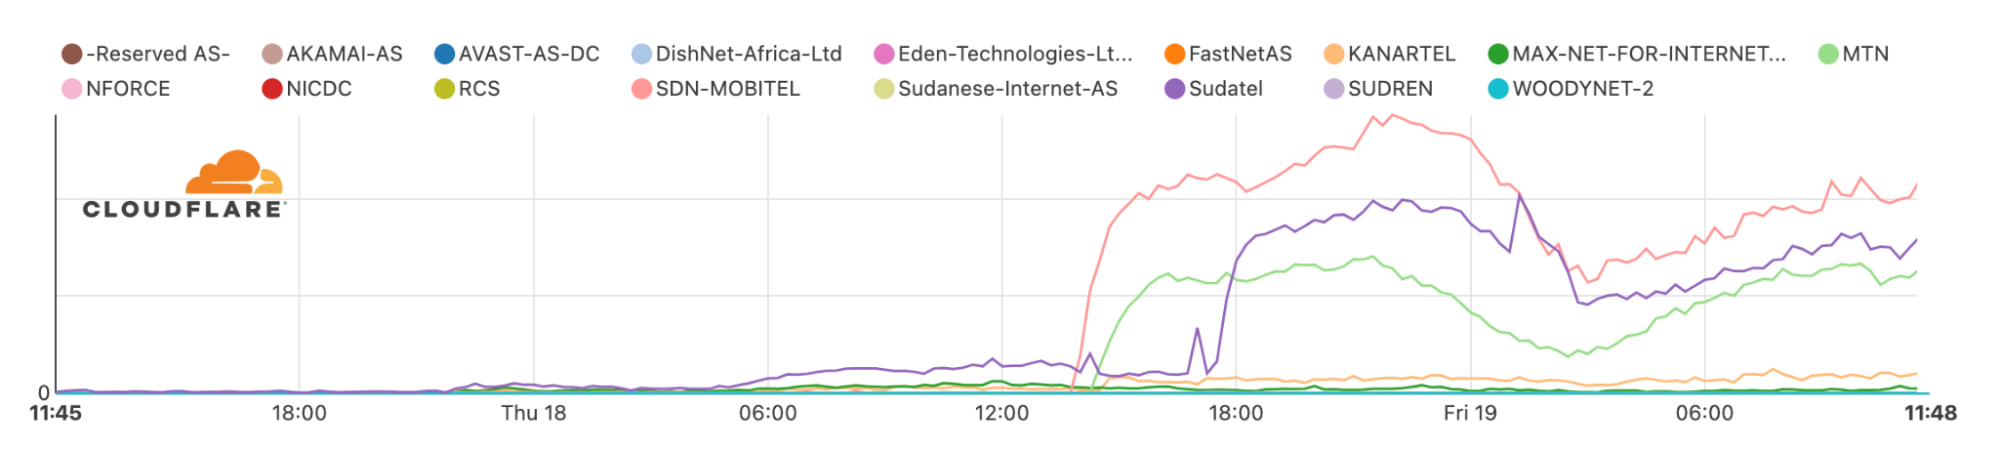
Cloudflare Radar shows that Internet traffic dropped significantly in the West African country after ~09:15 UTC (the same in local time) and remains low more than 24 hours later. Burkina Faso also had a mobile Internet shutdown on January 10, 2022, and another we reported in late November 2021.
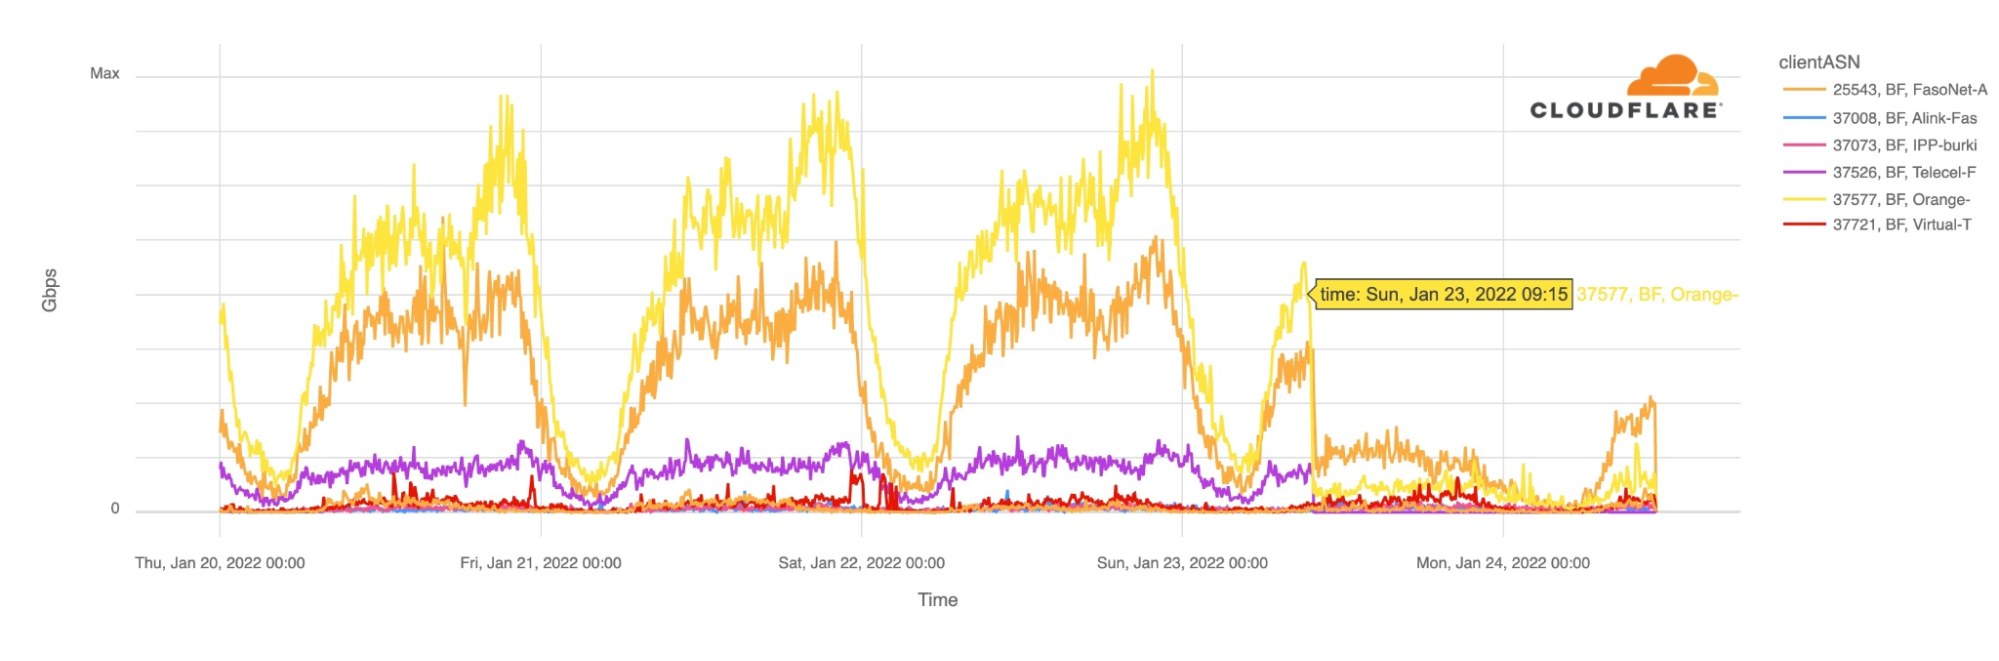
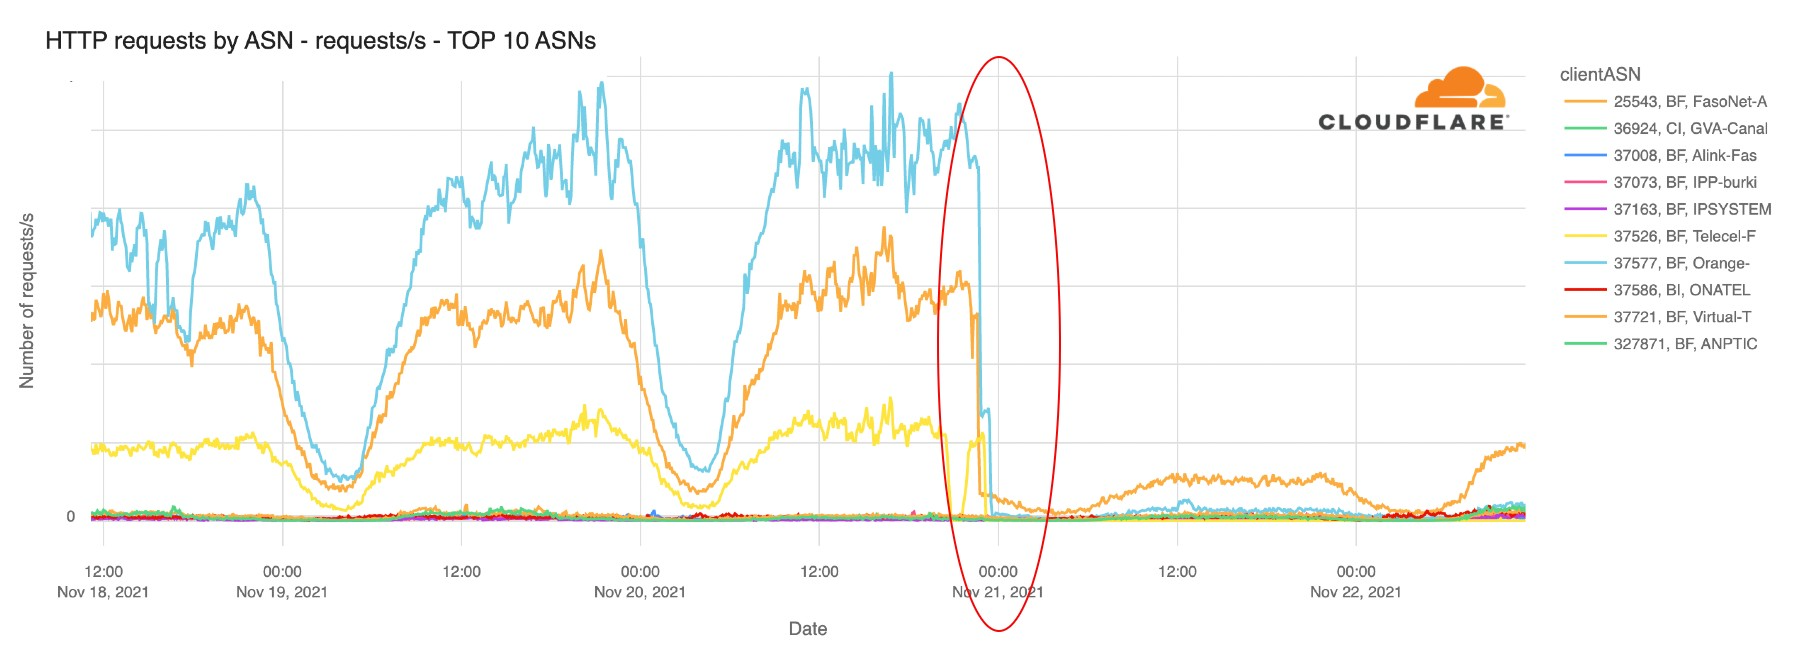
The main ISPs from Burkina Faso were affected. The two leading Internet Service Providers Orange and FasoNet lost Internet traffic after 09:15 UTC, but also Telecel Faso, as the next chart shows. This morning, at around 10:00 UTC there was some traffic from FasoNet but less than half of what we saw at the same time in preceding days.
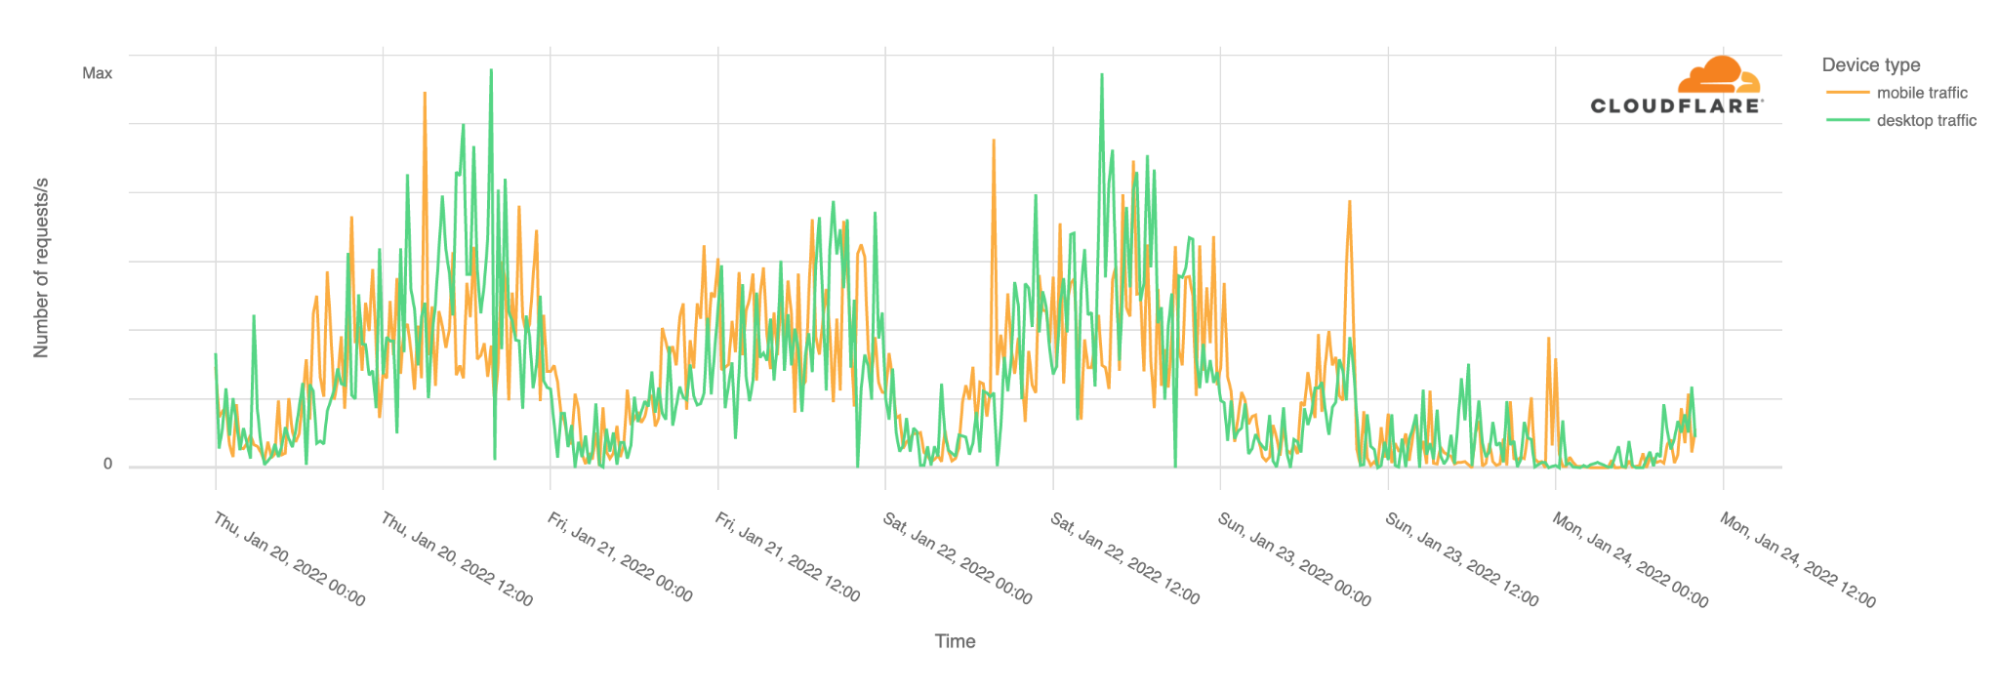
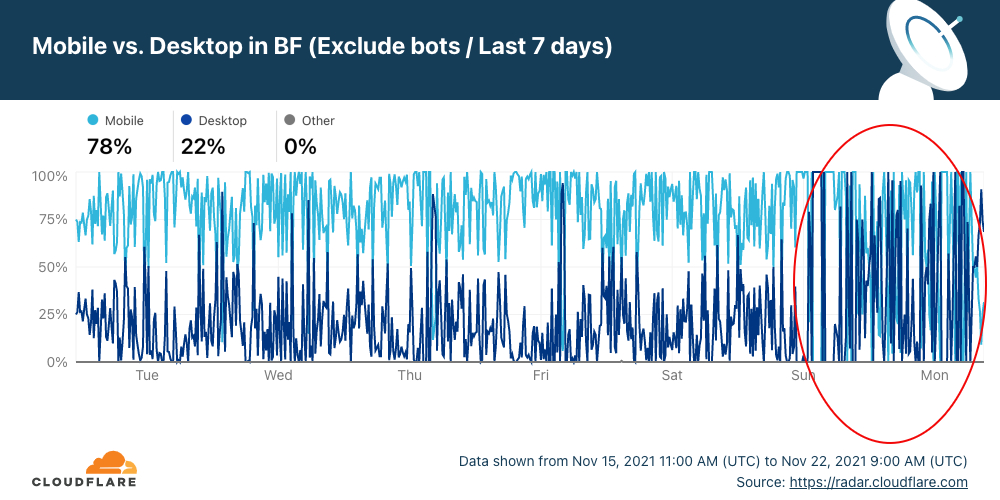
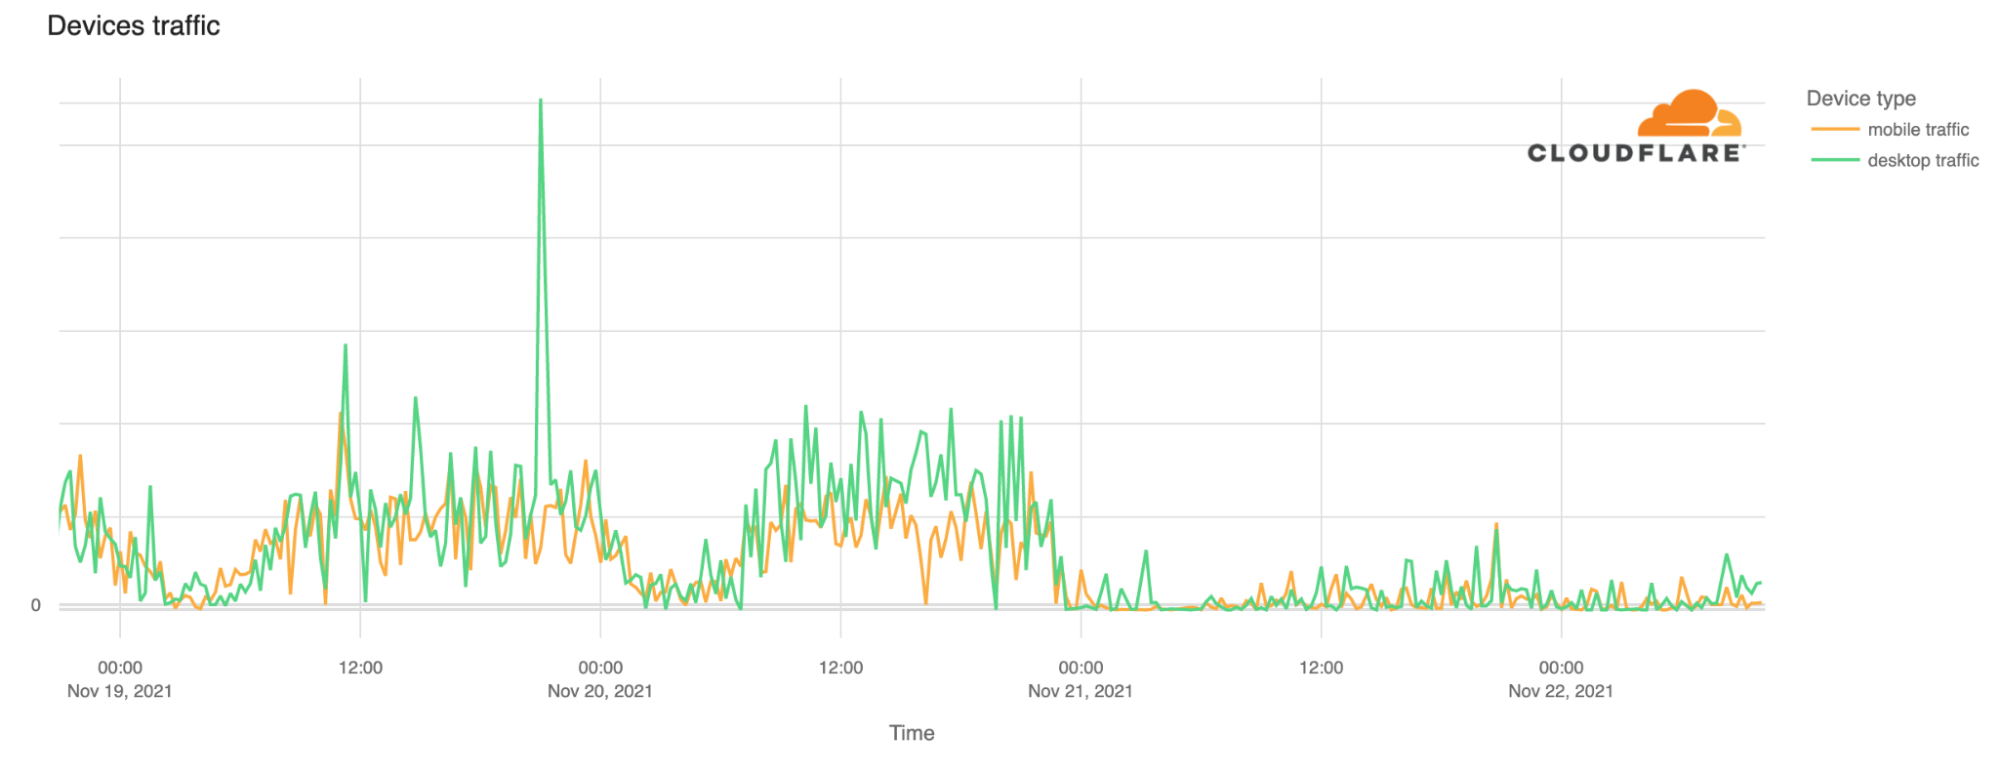
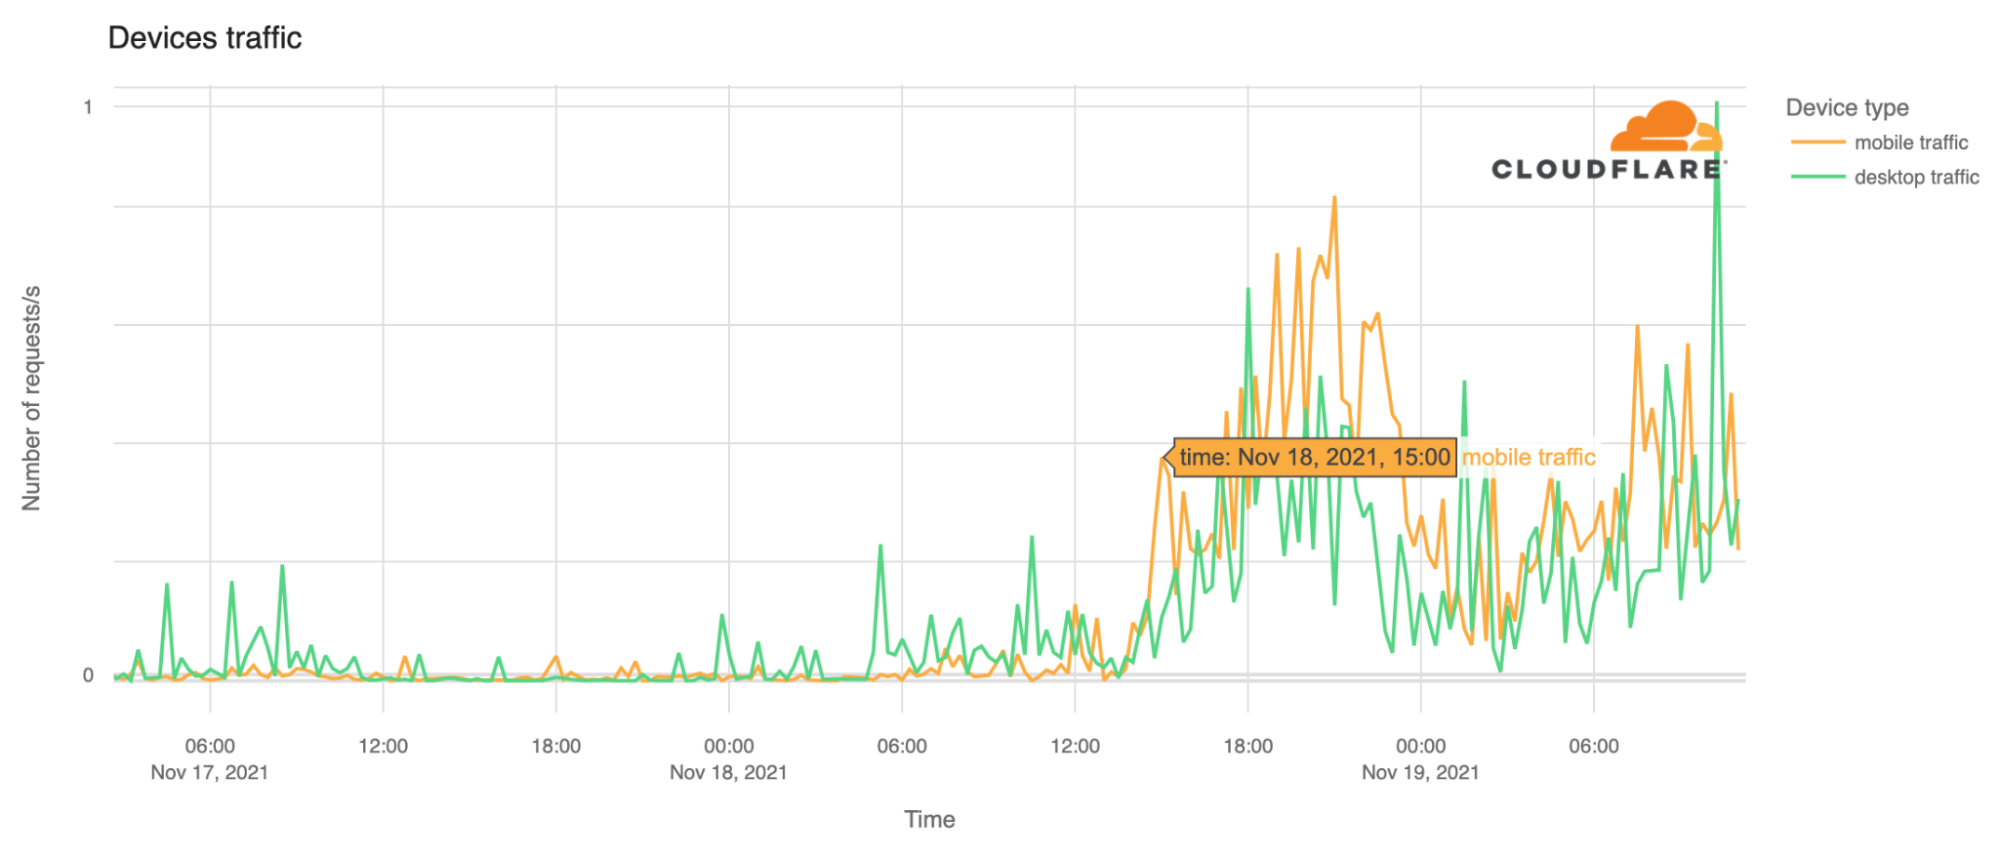
It’s not only mobile traffic that is affected. Desktop traffic is also impacted. In Burkina Faso, our data shows that mobile devices normally represent 70% of Internet traffic.
With the Burkina Faso disruption, three countries are currently mostly without access to the Internet for different reasons.
In Tonga, the nine day-long outage that we also explained is related to problems in the undersea cable caused by the large volcanic eruption in the South Pacific archipelago.
Several significant Internet disruptions have already occurred in 2022 for different reasons:
1. An Internet outage that lasted a few hours in The Gambia because of a cable problem (on January 4). 2. A six days Internet shutdown in Kazakhstan because of unrest (from January 5 to January 11). 3. A mobile Internet shutdown in Burkina Faso because of a coup plot (on January 10). 4. An Internet outage in Tonga because of a volcanic eruption (ongoing since January 15). 5. An Internet outage in Yemen because of airstrikes that affected a telecommunications building (ongoing since January 20,). 6. This second Internet disruption in Burkina Faso is related to military unrest (ongoing since January 23).
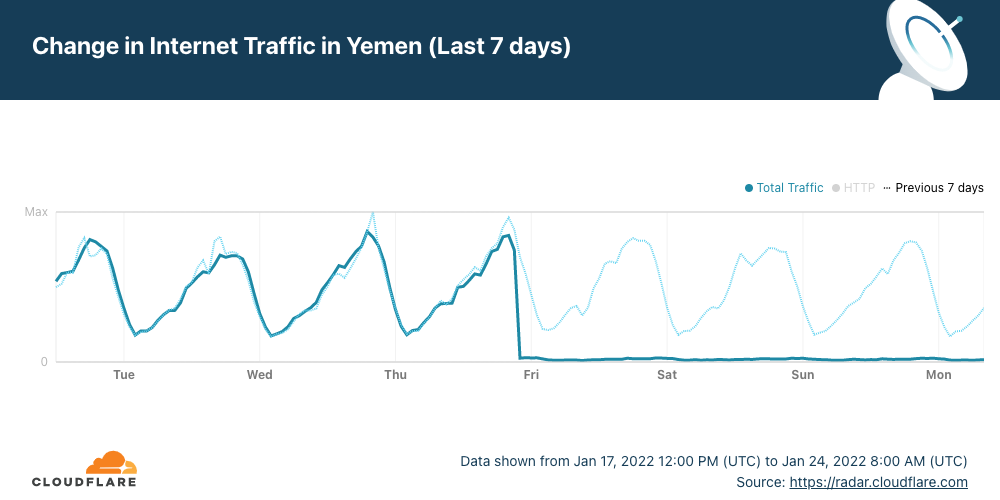
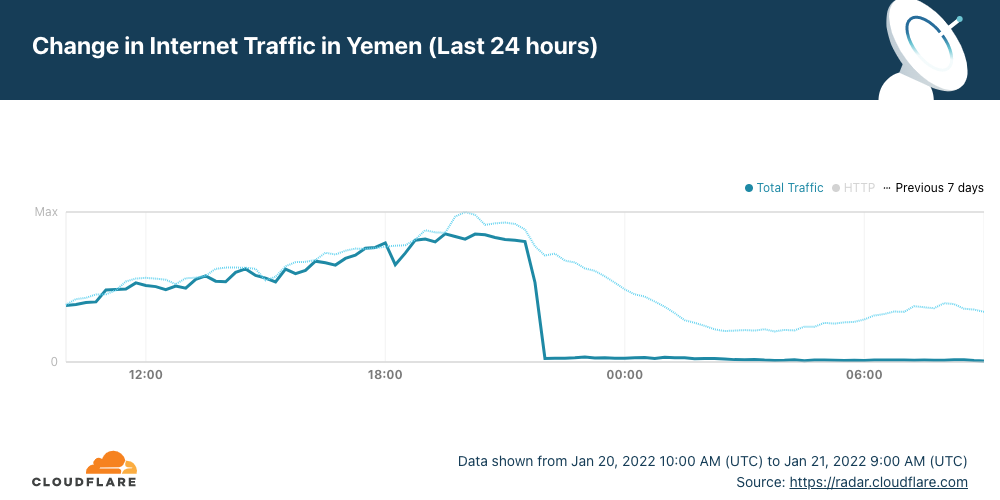
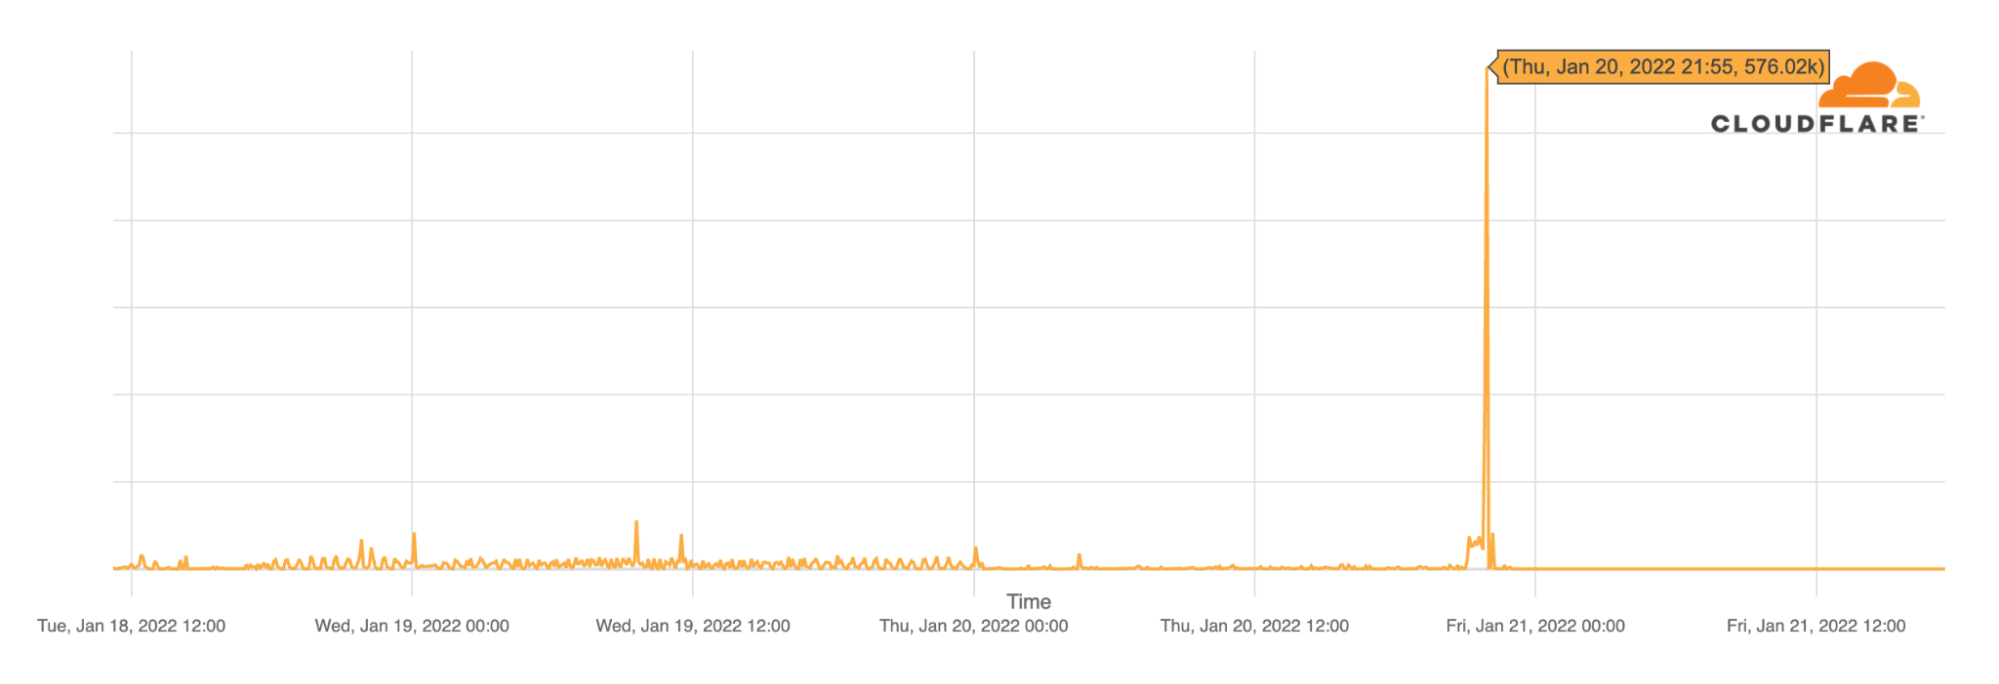
The early hours of Friday, January 21, 2022, started in Yemen with a country-wide Internet outage. According to local and global news reports airstrikes are happening in the country and the outage is likely related as there are reports that a telecommunications building in Al-Hudaydah where the FALCON undersea cable lands.
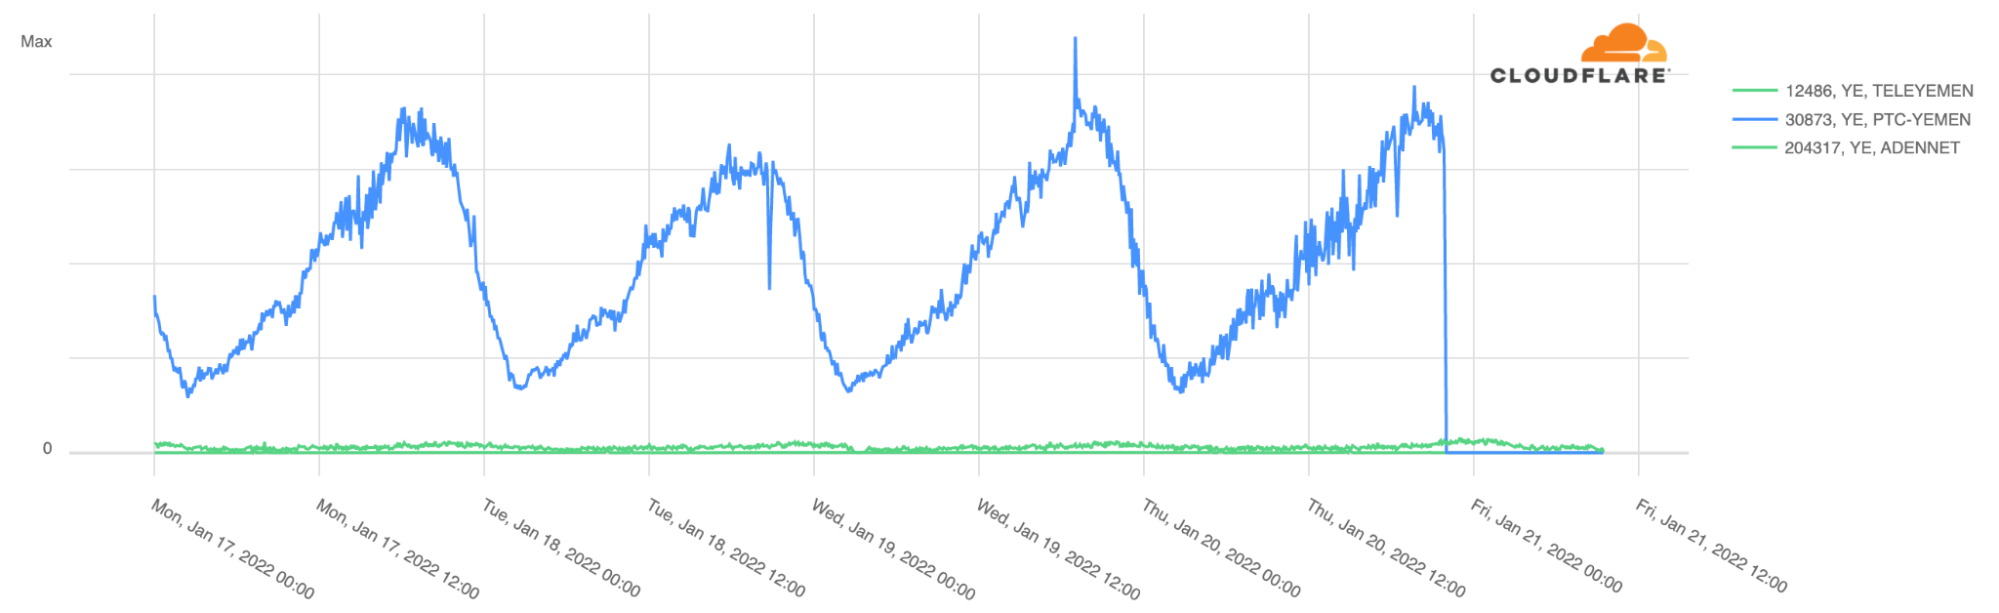
The outage affected the main state-owned ISP, Public Telecommunication Corporation (AS30873 in blue in the next chart), which represents almost all the Internet traffic in the country.
Looking at BGP (Border Gateway Protocol) updates from Yemen’s ASNs around the time of the outage, we see a clear spike at the same time the main ASN was affected ~21:55 UTC, January 20, 2022. These update messages are BGP signalling that Yemen’s main ASN was no longer routable, something similar to what we saw happening in The Gambia and Kazakhstan but for very different reasons.
So far, 2022 has started with a few significant Internet disruptions for different reasons:
1. An Internet outage in The Gambia because of a cable problem. 2. An Internet shutdown in Kazakhstan because of unrest. 3. A mobile Internet shutdown in Burkina Faso because of a coup plot. 4. An Internet outage in Tonga because of a volcanic eruption (still ongoing).
You can keep an eye on Cloudflare Radar to monitor this situation as it unfolds.
2022 only has 19 days of existence but so far this January, there have already been four significant Internet disruptions:
1. An Internet outage in The Gambia because of a cable problem. 2. An Internet shutdown in Kazakhstan because of unrest. 3. A mobile Internet shutdown in Burkina Faso because of a coup plot. 4. An Internet outage in Tonga because of a volcanic eruption.
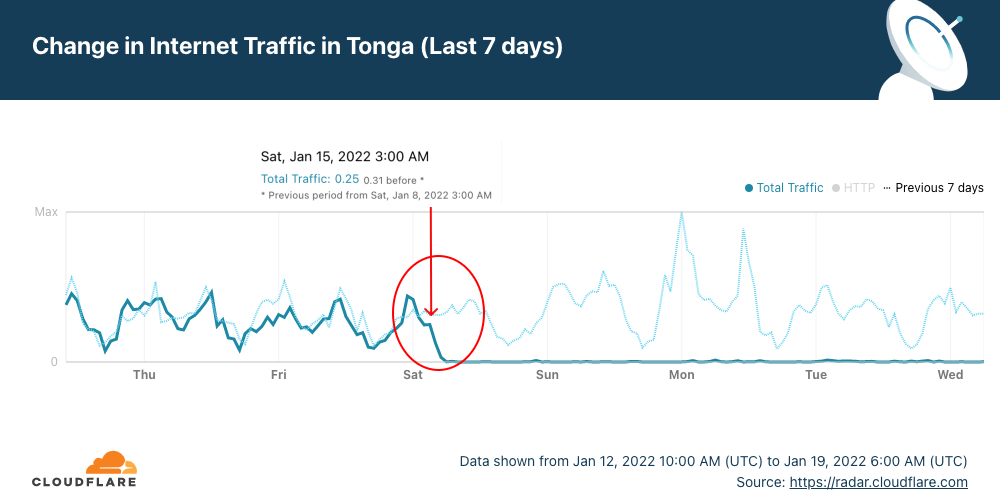
The latest Internet outage, in the South Pacific country of Tonga (with 169 islands), is still ongoing. It started with the large eruption of Hunga Tonga–Hunga Haʻapai, an uninhabited volcanic island of the Tongan archipelago on Friday, January 14, 2022. The next day, Cloudflare Radar shows that the Internet outage started at around 03:00 UTC (16:00 local time) — Saturday, January 15, 2022 — and is ongoing for more than four days. Tonga’s 105,000 residents are almost entirely unreachable, according to the BBC.
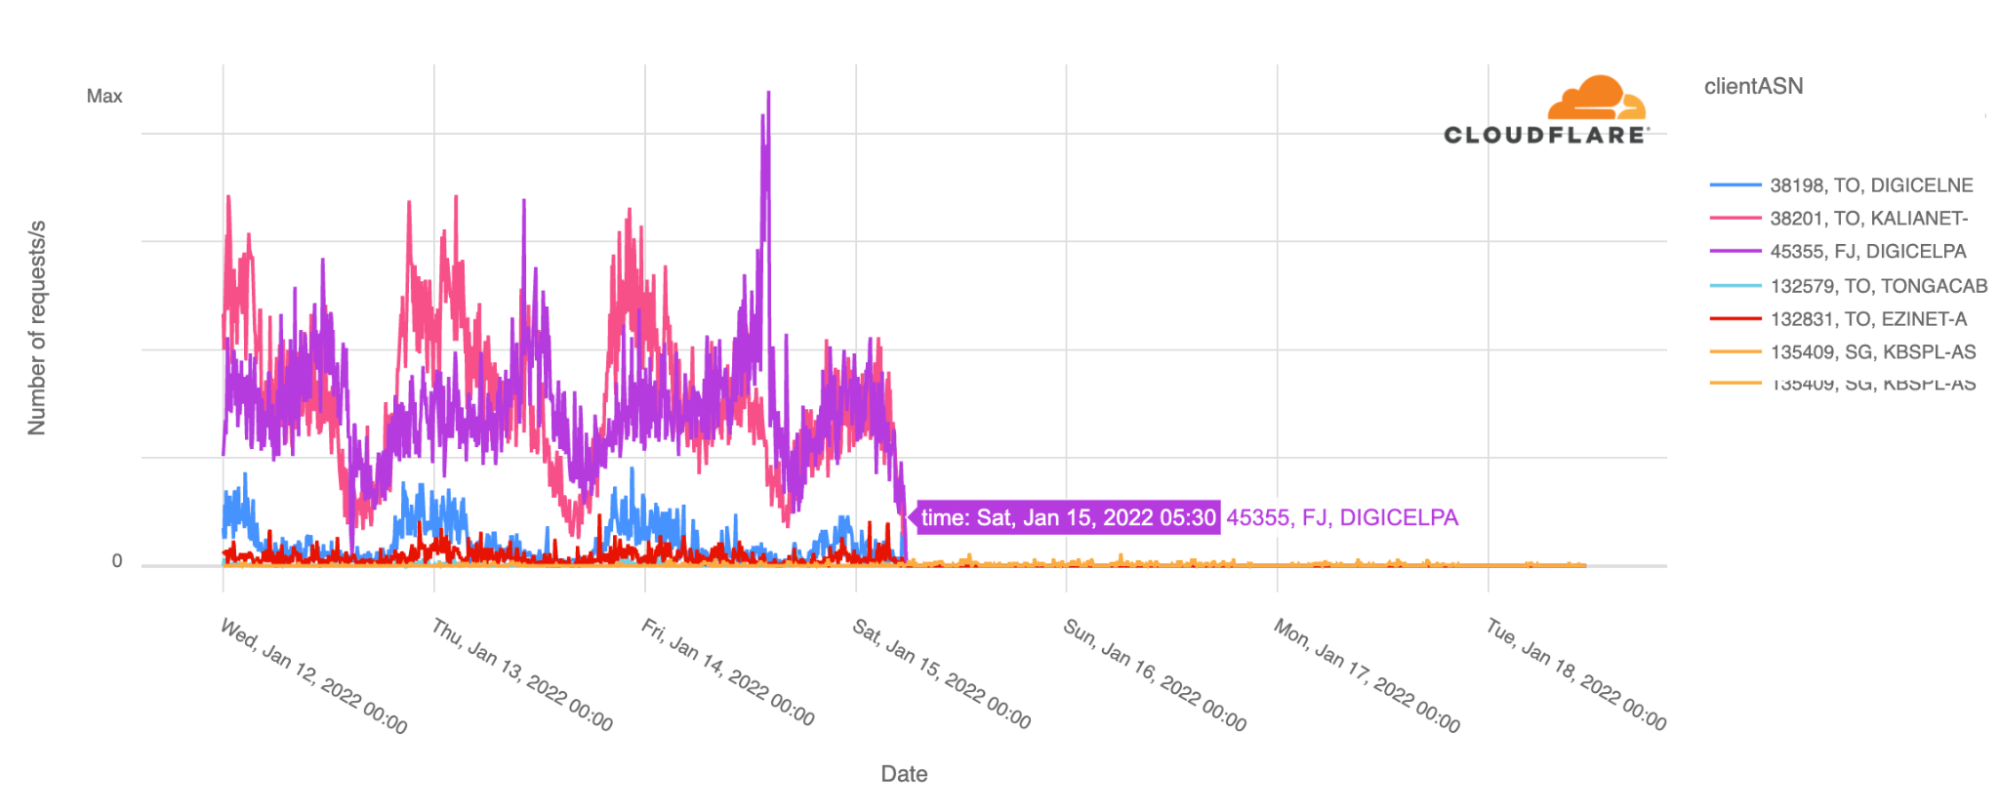
When we focus on the number of requests by ASN, the country’s main ISPs Digicel and Kalianet started to lose traffic after 03:00 UTC and by 05:30 UTC January 15, 2022, Cloudflare saw close to no traffic at all from them, as shown in the graph below.
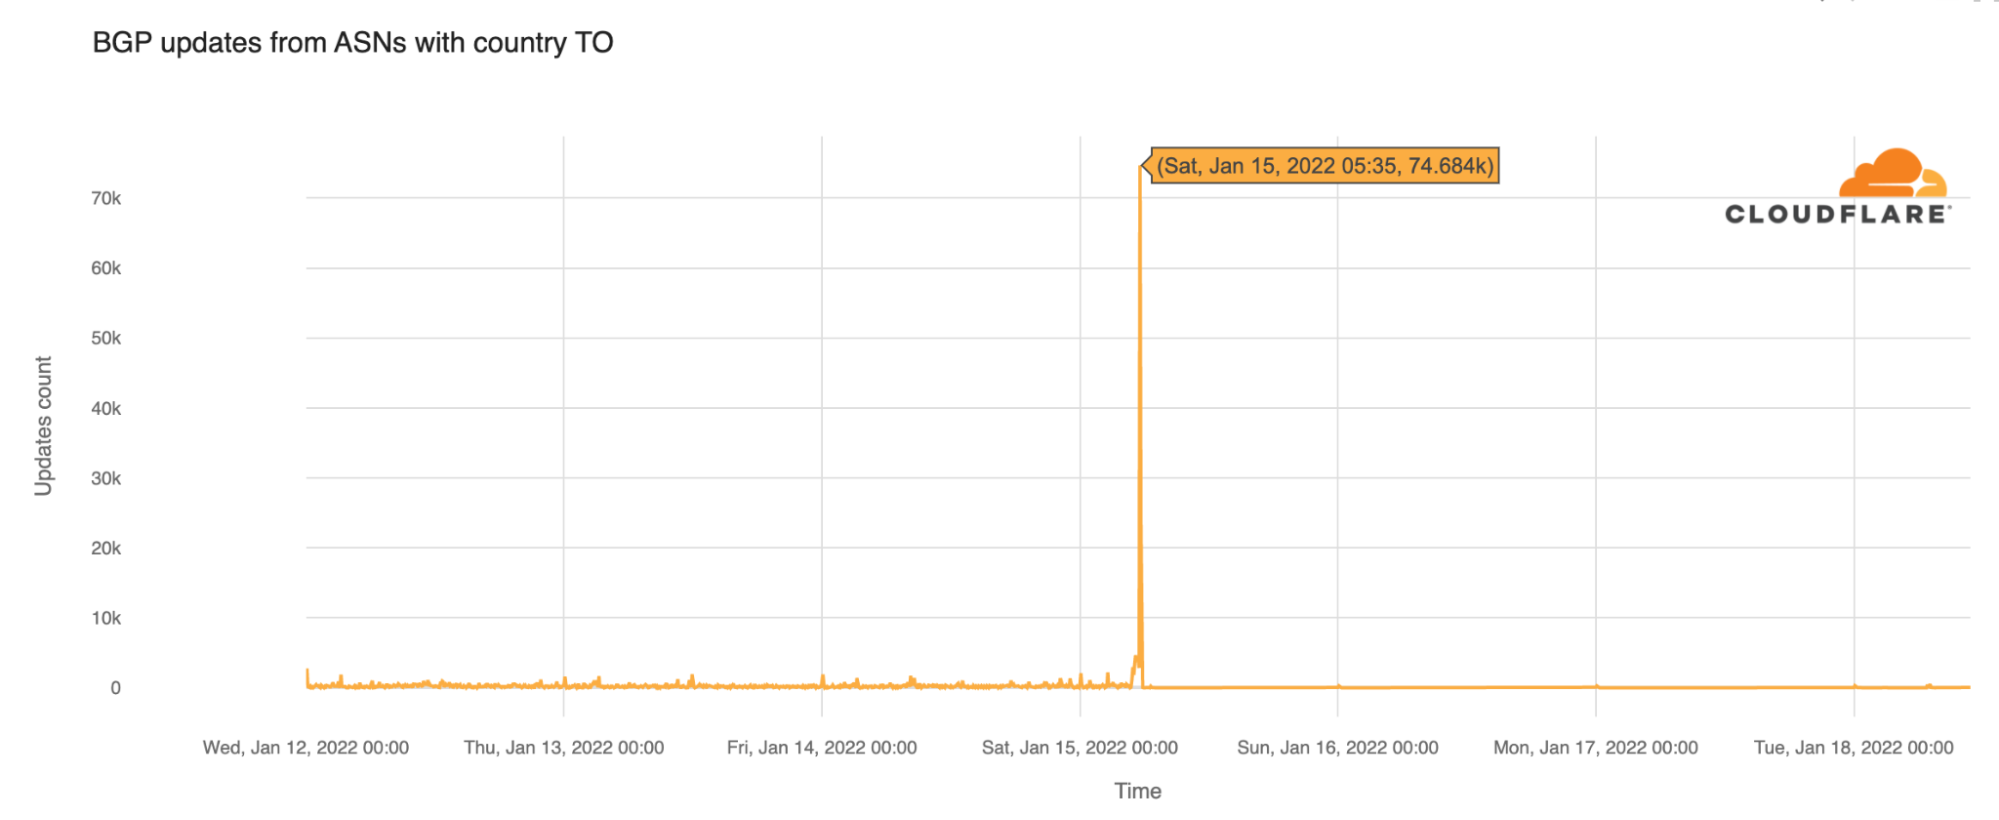
Looking at the BGP (Border Gateway Protocol) updates from Tonga’s ASNs around the time of the outage, we see a clear spike at 05:35 UTC (18:35 local time). These update messages are BGP signalling that the Tongan ASNs are no longer routable. We saw the same trend in The Gambia outage of January 4, 2022 — there you can read about the importance of BGP as a mechanism to exchange routing information between autonomous systems on the Internet, something that was also seen in the 2021 Facebook outage.
BGP updates from Tongan ASNs around the time of the outage.
Cloudflare Radar data doesn’t show any significant disruptions for Internet traffic in Tonga’s neighbours American Samoa (although there was a small decrease in traffic on Friday and Saturday, January 14 and 15, 2022 in comparison with the previous week) and Fiji. In American Samoa, all schools were closed on Friday, January 14, because of severe weather, and on the same day, after the volcanic eruption, there were tsunami warnings and evacuation to higher ground was advised (that continued through the weekend).
Tonga, as a geographically remote Polynesian country more than 800 km from the Fiji archipelago, is highly dependent on the Internet for communications. That is something that was improved five years ago with an infrastructure connectivity program from the World Bank. Prior to that, the country was dependent on satellite links for Internet that included a very small percentage of the population.
Repairs could take a few weeks
Southern Cross Cable Network confirmed that the 827 km fiber-optic undersea communications cable connecting Tonga to the outside world may have been broken. The company is assisting Tonga Cable Limited (TCL), which owns the single cable that provides Internet access and almost all communications to and from the archipelago.
The eruption resulted in a fault in the international cable 37 kilometres from Nukuʻalofa (Tonga’s capital), and a further fault in a domestic cable 47 km from the capital.
TCL announced that it has already met with the US cable company SubCom to start preparations for SubCom’s cable repair ship Reliance to be dispatched from Papua New Guinea to Tonga, possibly via Samoa (more than 4,000 km away).
The repairs could take “at least” four weeks, given that a repair to a fiber-optic cable that has been cut on the seabed is considered more complicated than misconfigurations, power outages or other types of infrastructure damage. “The site conditions in Tonga have to be assessed thoroughly because of volcanic activities,” according to TCL chairman Samiuela Fonua.
Fonua also mentioned that the last cable cut (back in 2019) took nearly two weeks to repair, but this time the site conditions will determine the time it will take — the two cables are not far away from the eruption site (the volcano is still active). According to ZDNet, in 2019 Tonga signed a 15-year deal with Kacific for satellite connectivity, but since then the satellite provider says it is waiting on the Tongan government to activate its contract.
Svalbard Undersea Cable System also disrupted in January
Also in January, Space Norway, the operator of the world’s most northern submarine cable — the Svalbard Undersea Cable System — announced that on January 7 it located a disruption in one of the two twin submarine fiber optic communication cables connecting Longyearbyen with Andøya north of Harstad in northern Norway (in the area where the seabed goes from 300 meters down to 2,700 meters in the Greenland Sea). A repair mission is being planned.
A world of undersea cables for the world’s communications
A significant amount of Internet traffic is carried by a complex network of undersea fiber-optic cables that connect countries and continents. The full submarine cable system (the first communications cables laid were from the 1850s and carried telegraphy traffic) is what makes most of the world’s Internet function between countries and continents. There are 428 active submarine cables (36 are planned), running in an estimate of 1.3 million km around the globe.
World map of submarine cables. Antarctica is the only continent not yet reached by a submarine telecommunications cable. Source: TeleGeography (www.submarinecablemap.com)
This gives a sense that the Internet is literally a network of networks in a world where estimates indicate that around 99% of the data traffic that is crossing oceans is carried by these undersea cables (satellite Internet, so far, is still residual — SpaceX has around 145,000 users).
The reliability of submarine cables is high, especially when multiple paths are available in the event of a cable break. That’s not the case for the Tonga outage, given that the 827 km submarine cable only connects Fiji to the Tonga archipelago — Fiji is connected to the main Southern Cross Cable, as the next image illustrates.
Submarine Cable Map shows the undersea cables that connect Australia to Fiji and the following connections to other archipelagos like Tonga. Source: TeleGeography (www.submarinecablemap.com)
🇹🇴Volcano Tonga-Hunga erupted Sat 15JAN22, causing extensive damage to the region, cutting off communications over both the TDCE domestic cable and the 🇹🇴-🇫🇯 international cable
The total carrying capacity of submarine cables is enormous (EllaLink, the optical submarine cable linking the European and South American continents, for example, has 100 Tbps capacity) and grows year after year as the world gets more and more connected. For example, Google has recently finished a new cable with 350 Tbps of capacity. But, a transoceanic submarine cable system costs several hundred million dollars to construct. One of the latest, between Portugal and Egypt, with a total of 8,700 kilometers, is budgeted at 326 million euros.
The Tonga outage was not the only one of 2022 (so far) that happened because of cable problems. The Gambia outage that affected the country’s main ISP, Gamtel, was because of “a primary link failure at ACE”, the cable system that serves 24 countries, from Europe to Africa, namely in the points of cable connections from Senegal to The Gambia.
In spite of these two fiber cable problems being separated by a few days at the start of 2022, Internet outages are more common because of situations like misconfigurations, power outages, extreme weather or the frequent state-imposed shutdowns to deal with unrest, elections or exams — recently this was the case of Sudan or Kazakhstan.
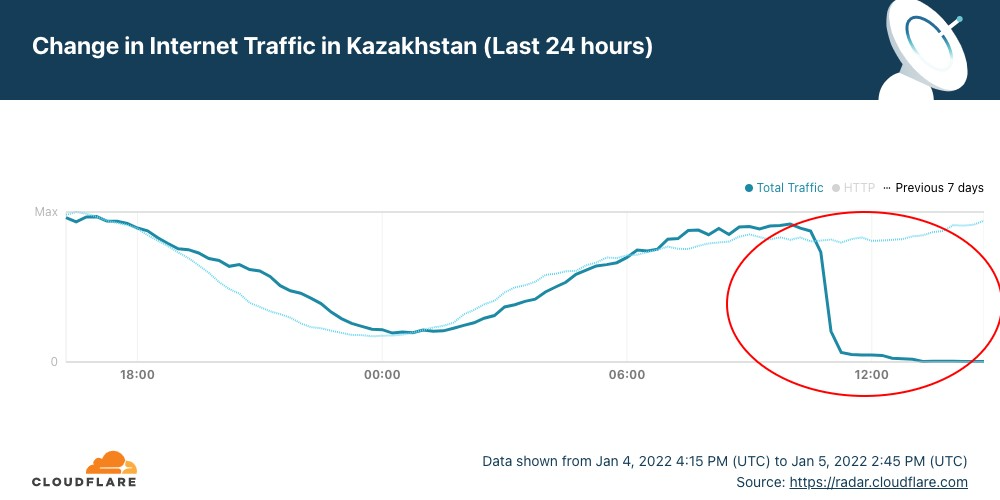
In Kazakhstan, the year had barely got going when yesterday disruptions of Internet access ended up in a nationwide Internet shutdown from today, January 5, 2022. The disruptions and subsequent shutdown happened amid mass protests against sudden energy price rises.
Cloudflare Radar shows that the full shutdown happened after 10:30 UTC (16:30 local time). But it was preceded by restrictions to mobile Internet access yesterday.
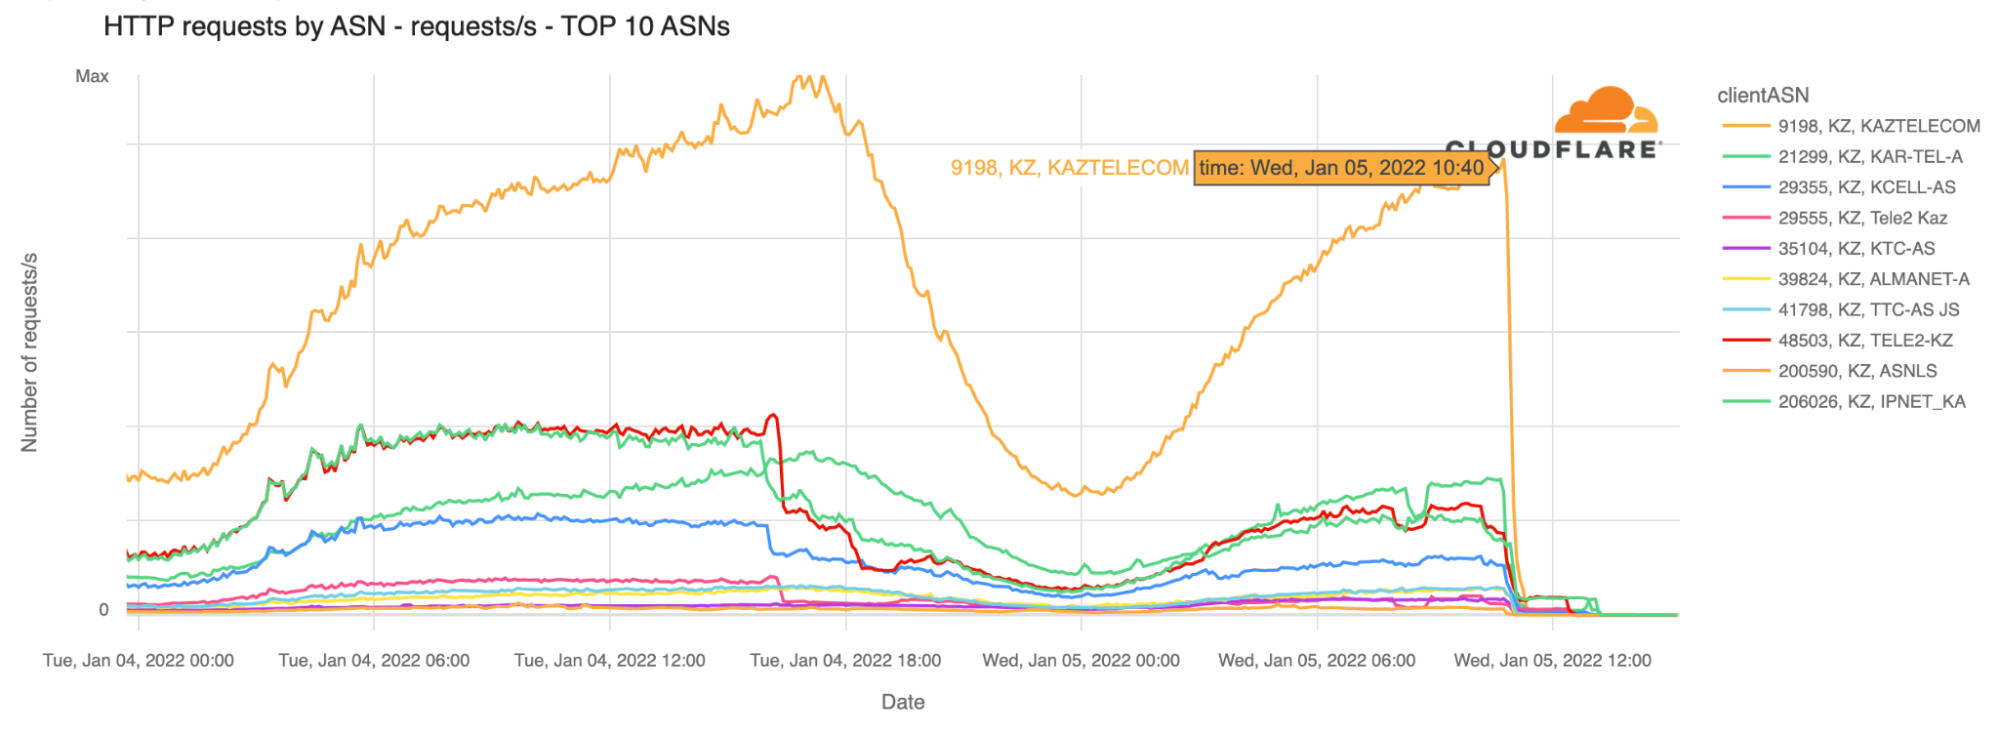
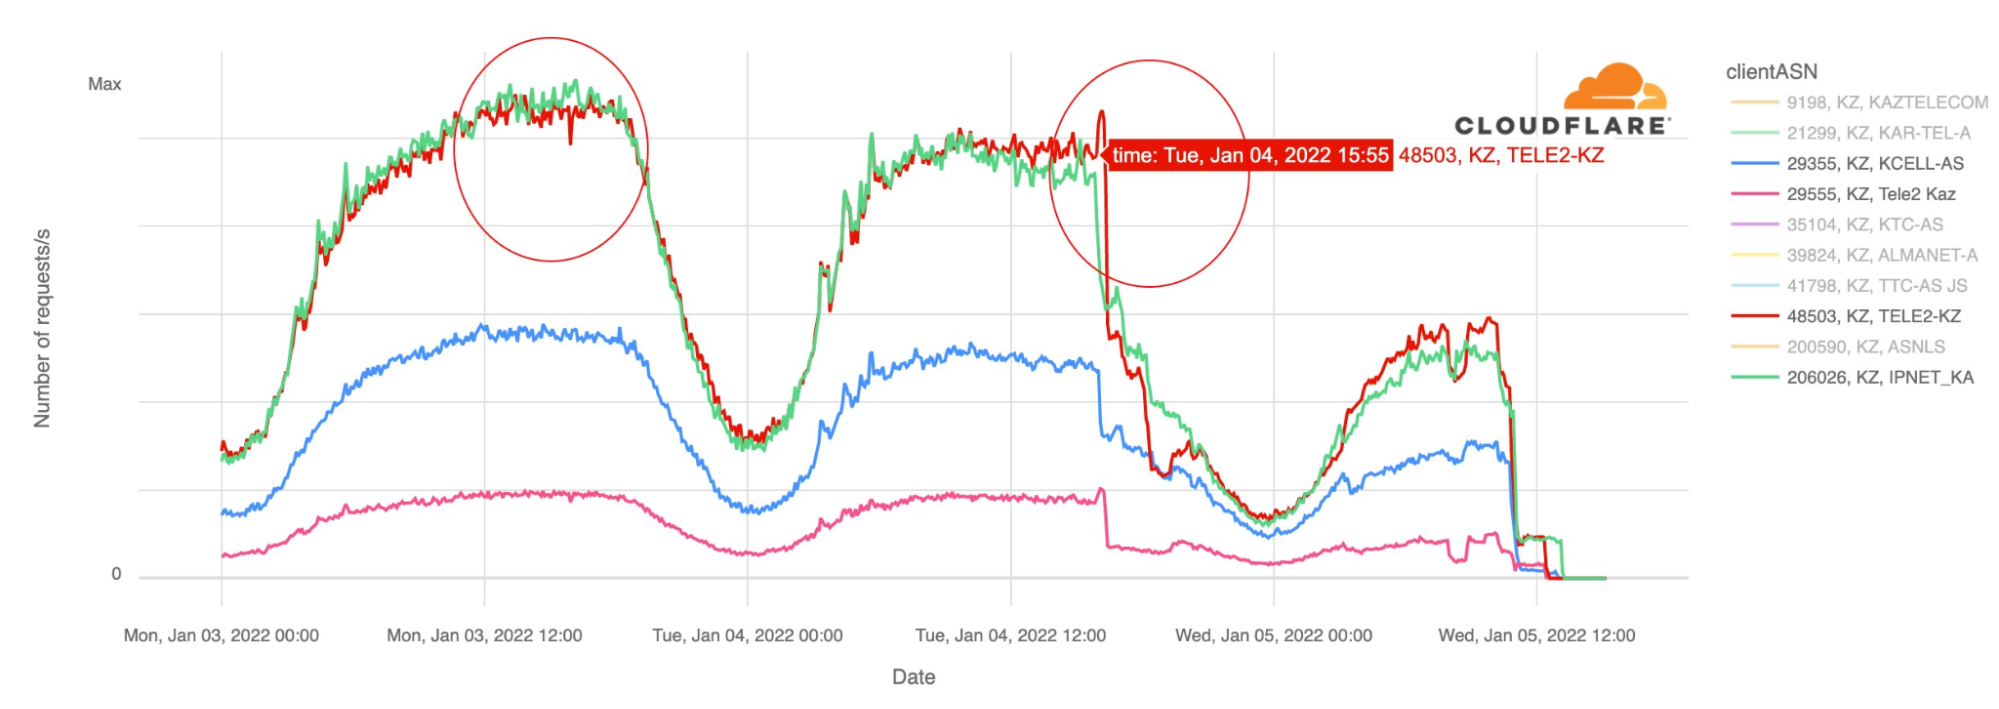
Our data confirm that Kazakhstan’s ASNs were affected after that time (around 18:30 local time). That’s particularly evident with the largest telecommunication company in the country, Kaz Telecom, as the next chart shows.
The first disruptions reported affected mobile services, and we can see that at around 14:30 UTC yesterday, January 4, 2022, there was significantly less mobile devices traffic than the day before around the same time. Kazakhstan is a country where mobile represents something like 75% of Internet traffic (shown on Radar), a usual trend in the region. So mobile disruption has a big impact on the country’s Internet, even before the shutdown that affected almost all connectivity.
When we focus on other ASNs besides Kaz Telecom such as the leading mobile Internet services Tele2 or Kcell we can see a big drop in traffic yesterday after 16:00 UTC, confirming local reports. Mobile traffic did not drop to zero which may indicate throttling rather than a full shutdown. Today, however, the Internet, mobile or not, is shut down.
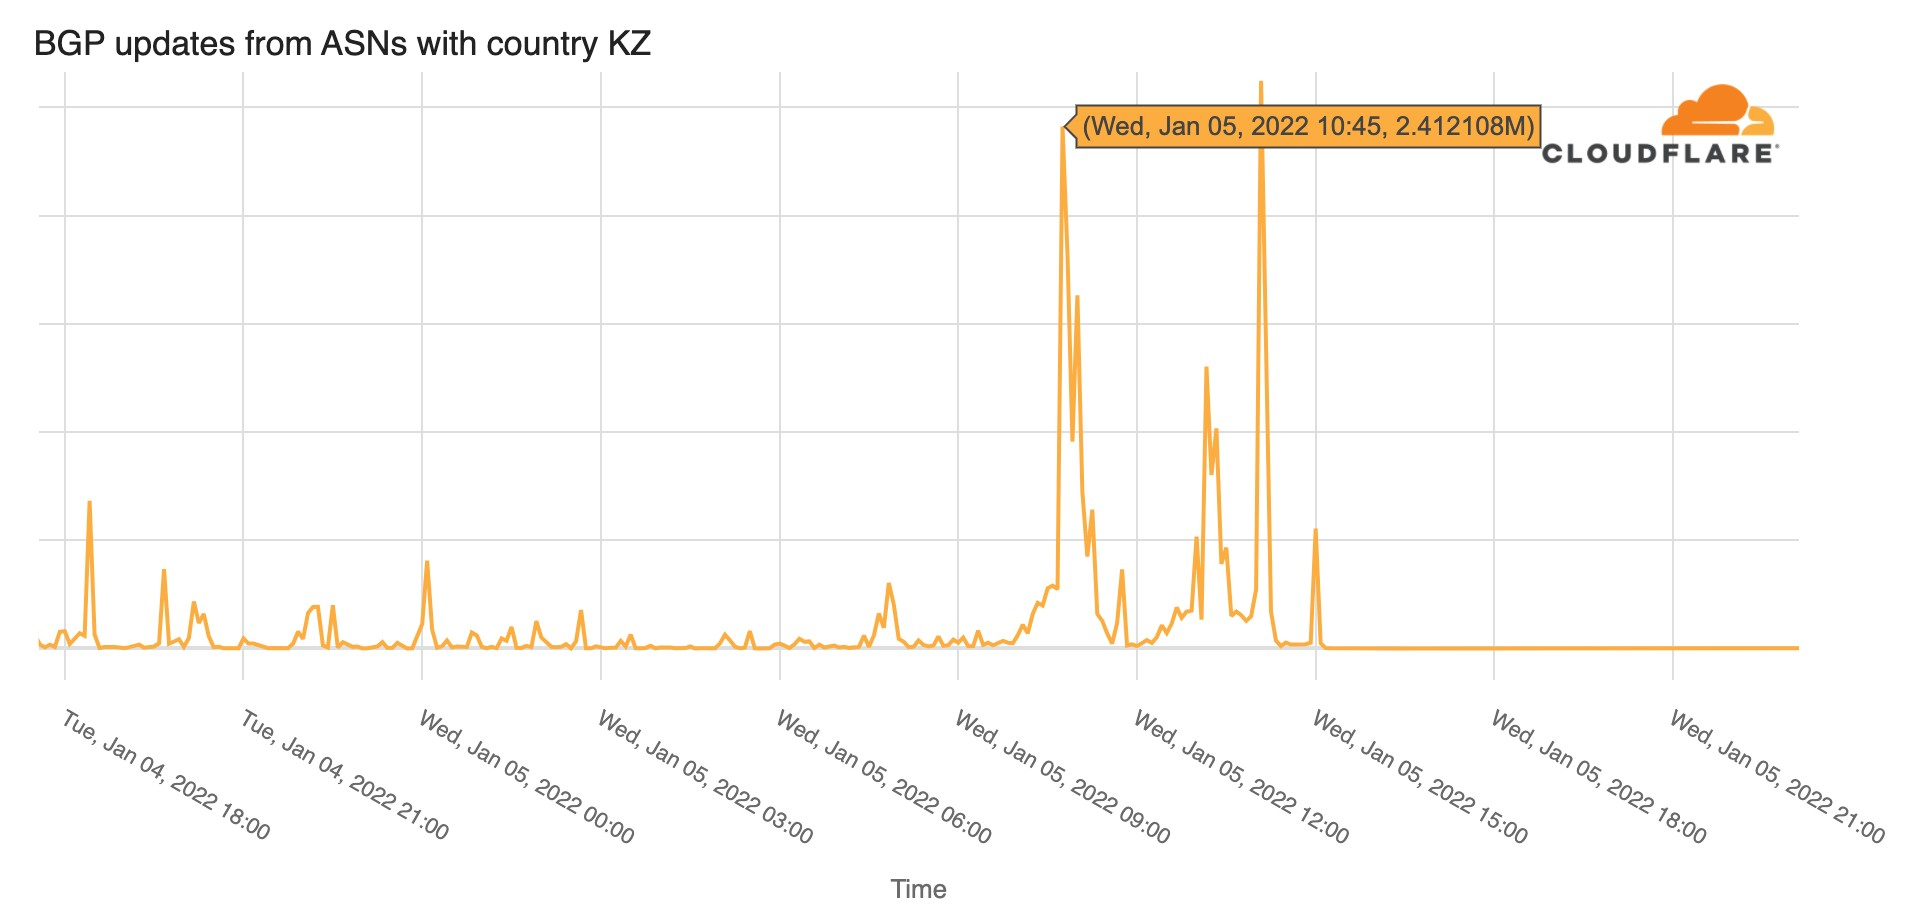
Looking at BGP (Border Gateway Protocol) updates from Kazakhstan’s ASNs around the time of the shutdown, we see a clear spike at exactly the same time the bigger ASNs were affected ~10:45 UTC, January 5, 2022. These update messages are BGP signaling that Kazakhstan’s ASNs are no longer routable, something similar to what we saw happening in The Gambia yesterday but for very different reasons.
The Kazakhstan case is similar to other state-imposed shutdowns that also happen all too frequently, generally used to deal with situations of unrest, elections or even exams. There are similarities with the Sudan 25-day shutdown that we reported at the end of 2021, the Sudanese prime minister resigned this week in the aftermath of those shutdowns, but it’s very different from the Internet outage in The Gambia that we reported today.
You can keep an eye on Cloudflare Radar to monitor how we see Internet traffic globally and in every country.
In 2021, we continued to live with the effects of the COVID pandemic and Internet traffic was also impacted by it. Although learning and exercising may have started to get back to something close to normal (depending on the country), the effects of what started almost two years ago on the way people work and communicate seems to be here to stay, and the lockdowns or restrictions continue to have an impact on where and how people go online.
So, Cloudflare Radar’s 2021 Year In Review is out with interactive maps and charts you can use to explore what changed on the Internet throughout this past year. Year In Review is part of Cloudflare Radar. We launched Radar in September 2020 to give anyone access to Internet use and abuse trends.
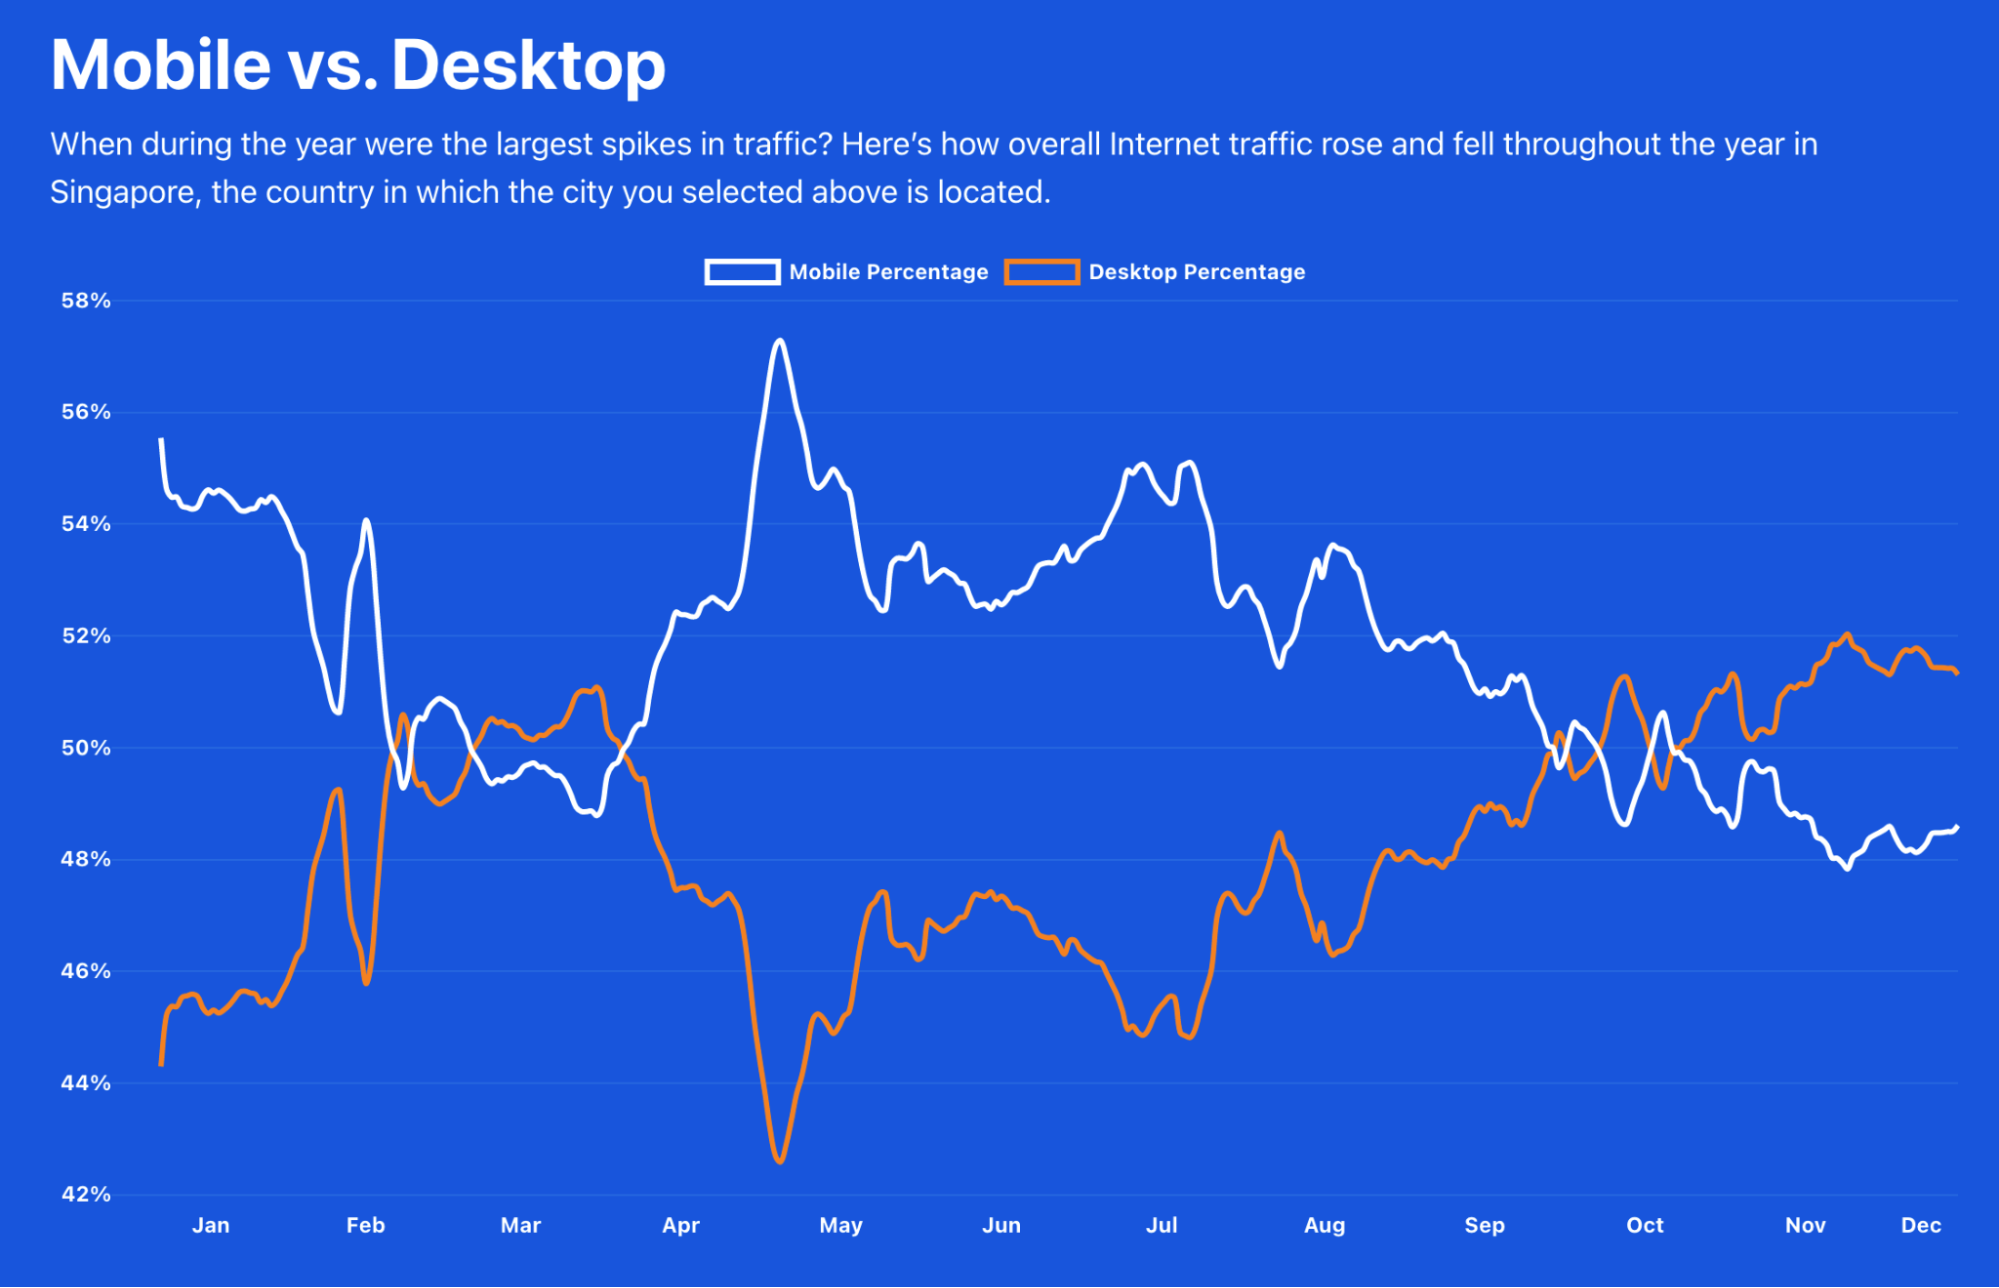
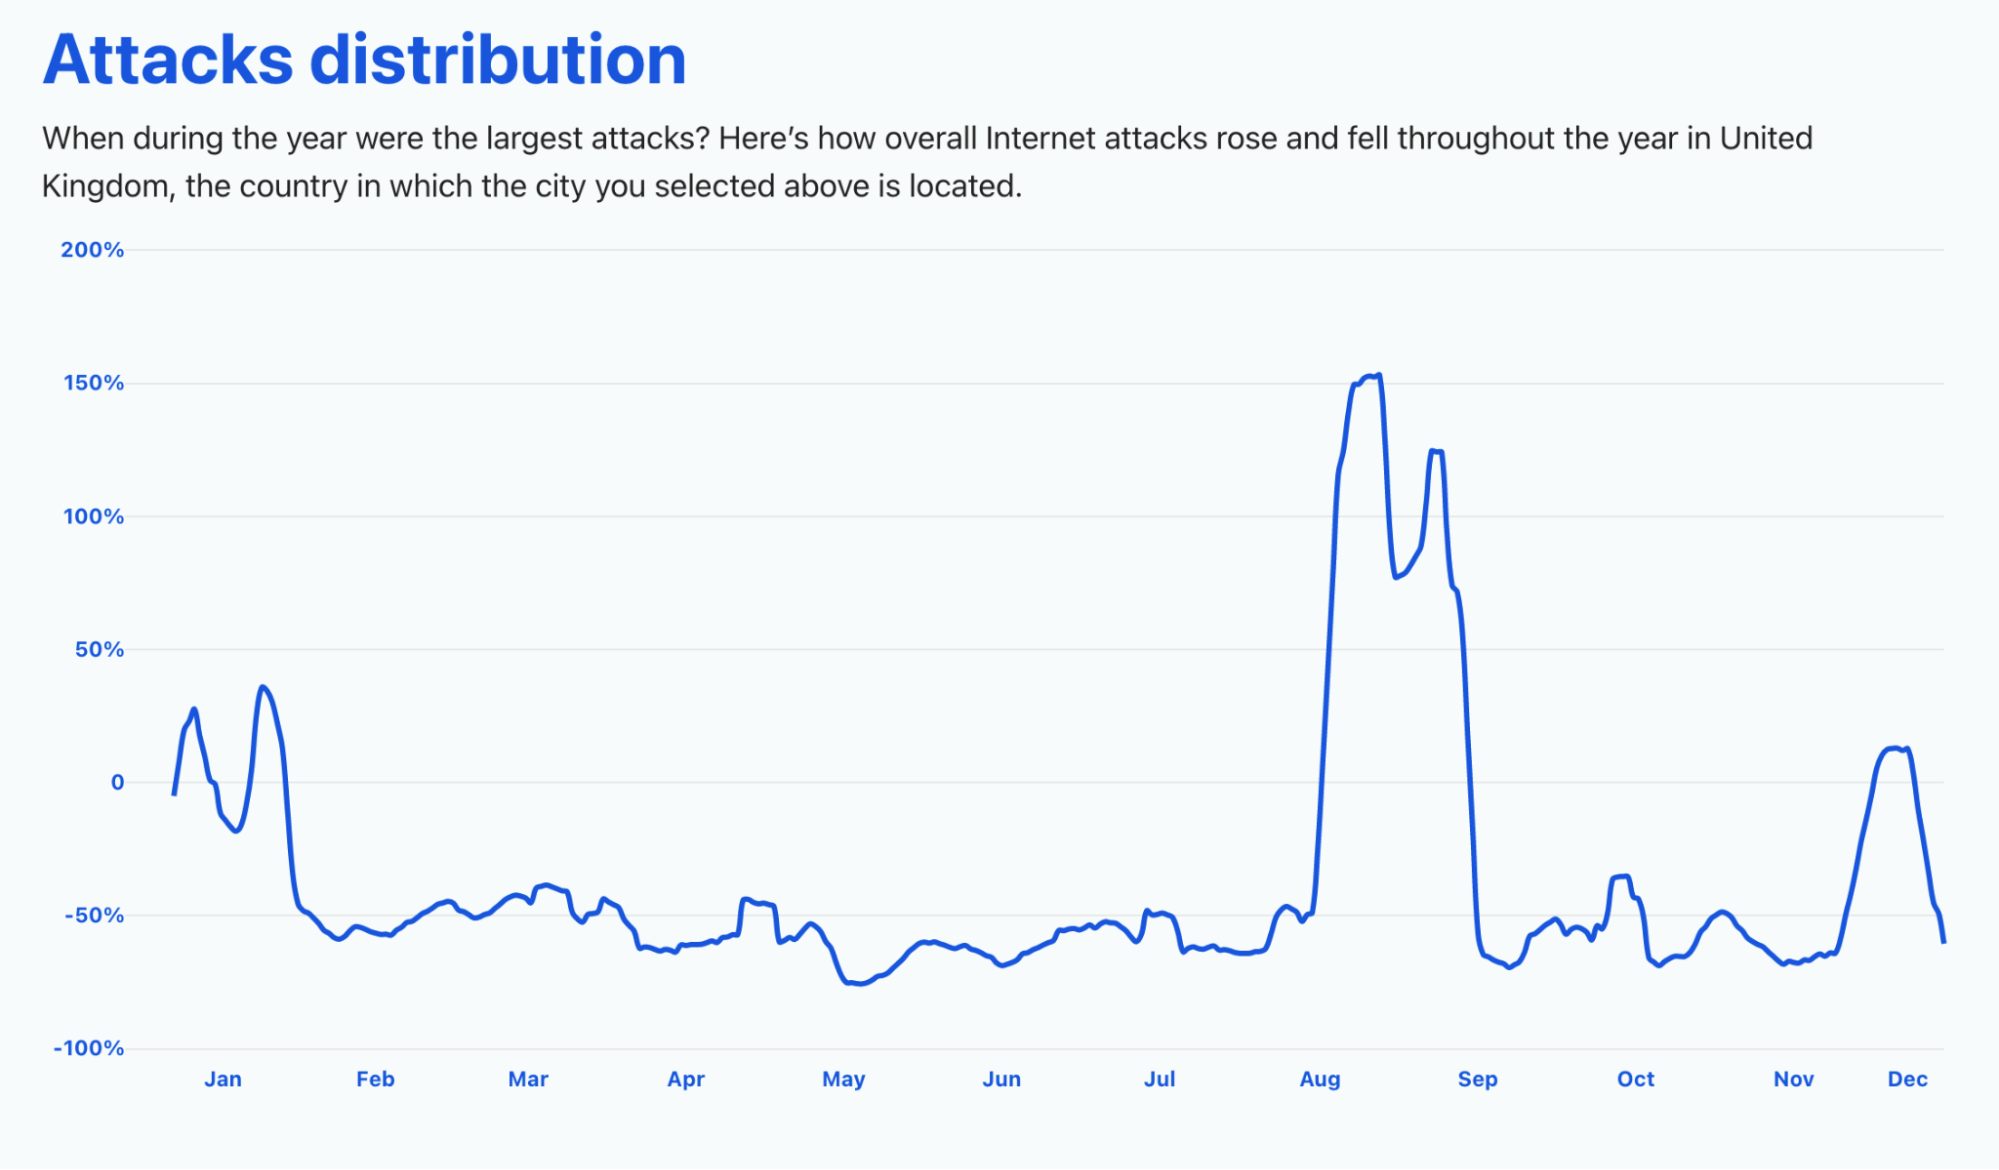
This year we’ve added a mobile vs desktop traffic chart, but also the attack distribution that shows the evolution throughout the year — the beginning of July 2021, more than a month after the famous Colonial Pipeline cyberattack, was the time of the year when attacks worldwide peaked.
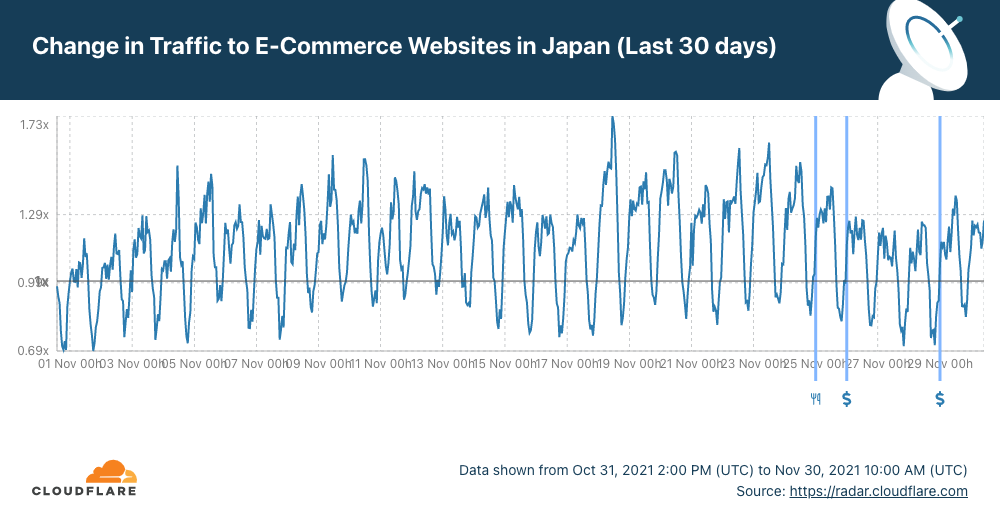
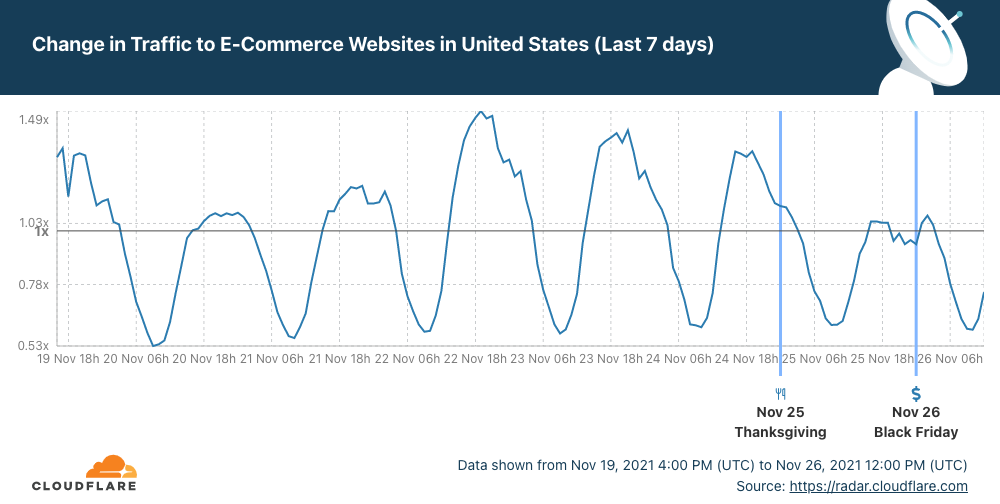
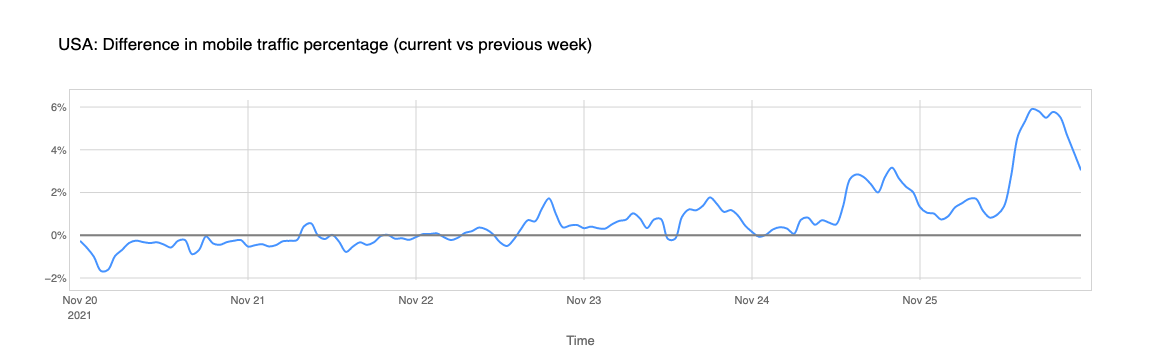
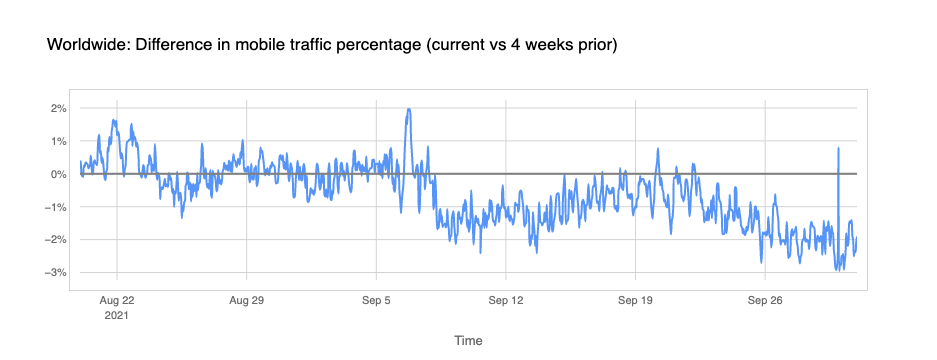
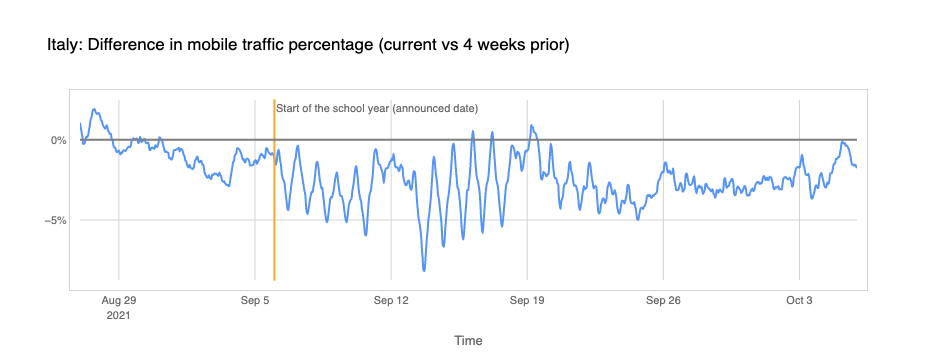
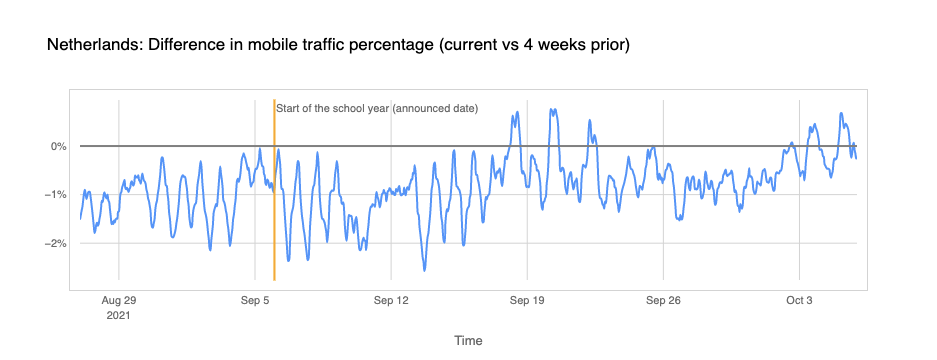
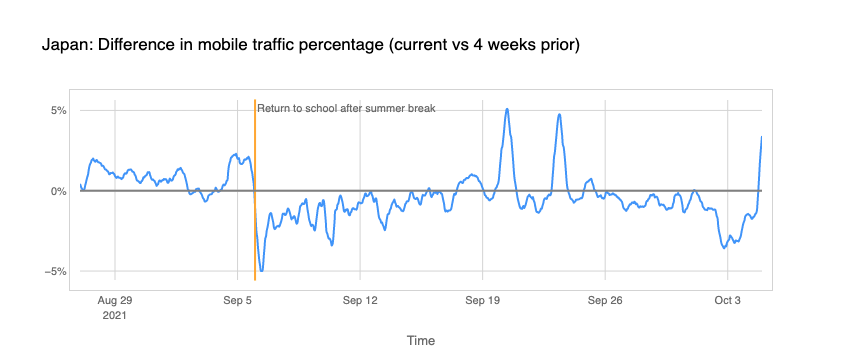
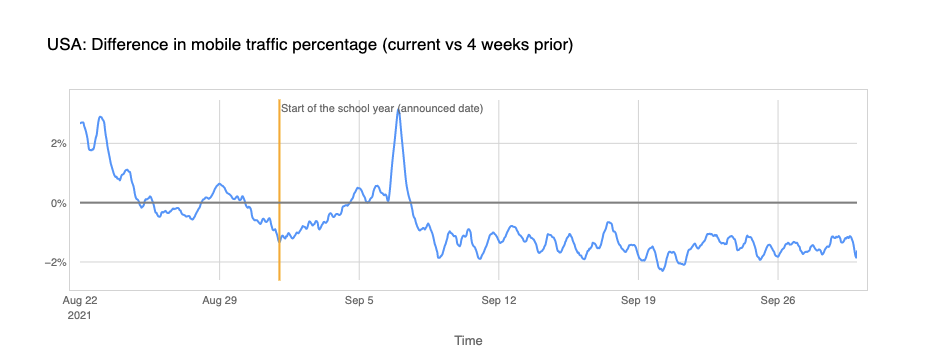
There are also interesting pandemic-related trends like the (lack) of Internet activity in Tokyo with the Summer Olympics in town and how Thanksgiving week in the US in late November affected mobile traffic in the United States.
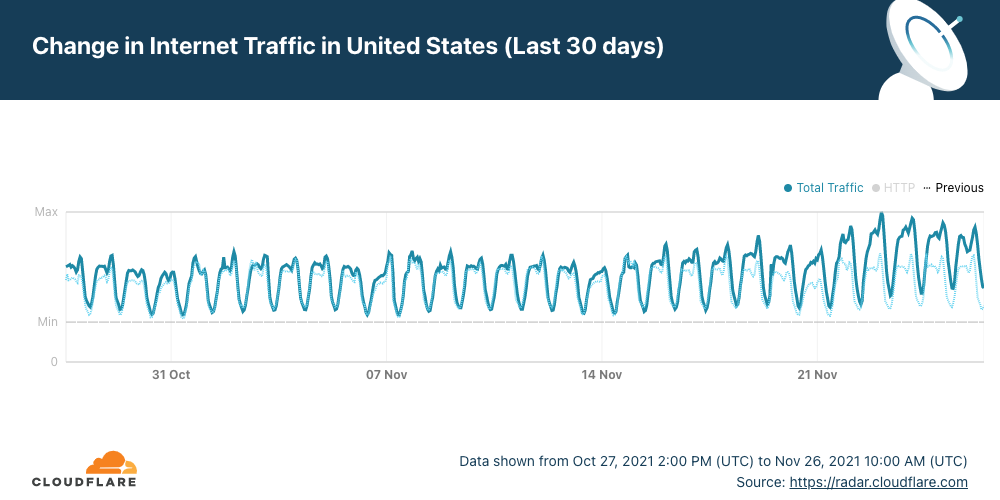
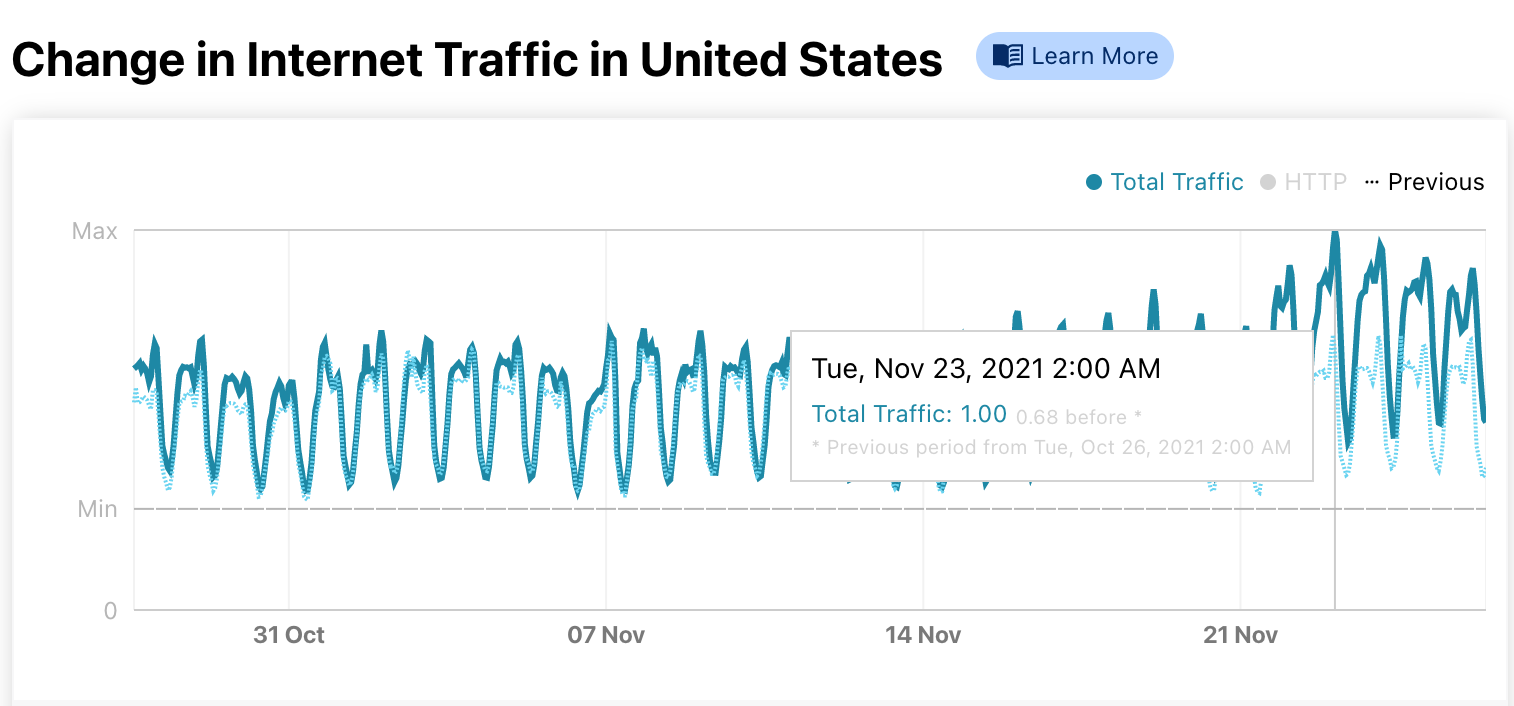
In 2020 by late April we saw that the Internet had seen incredible, sudden growth in traffic because of lockdowns and that was sustained throughout the year as we showed in our 2020 Year In Review. 2021 told a slightly different story, depending on the country.
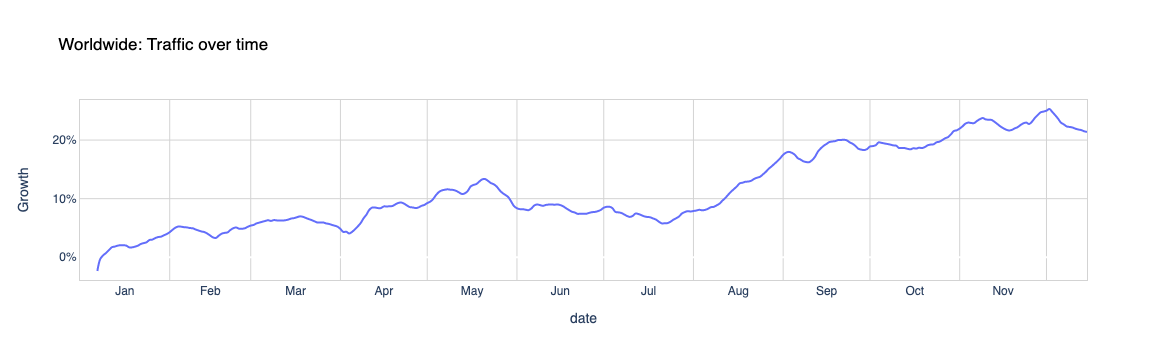
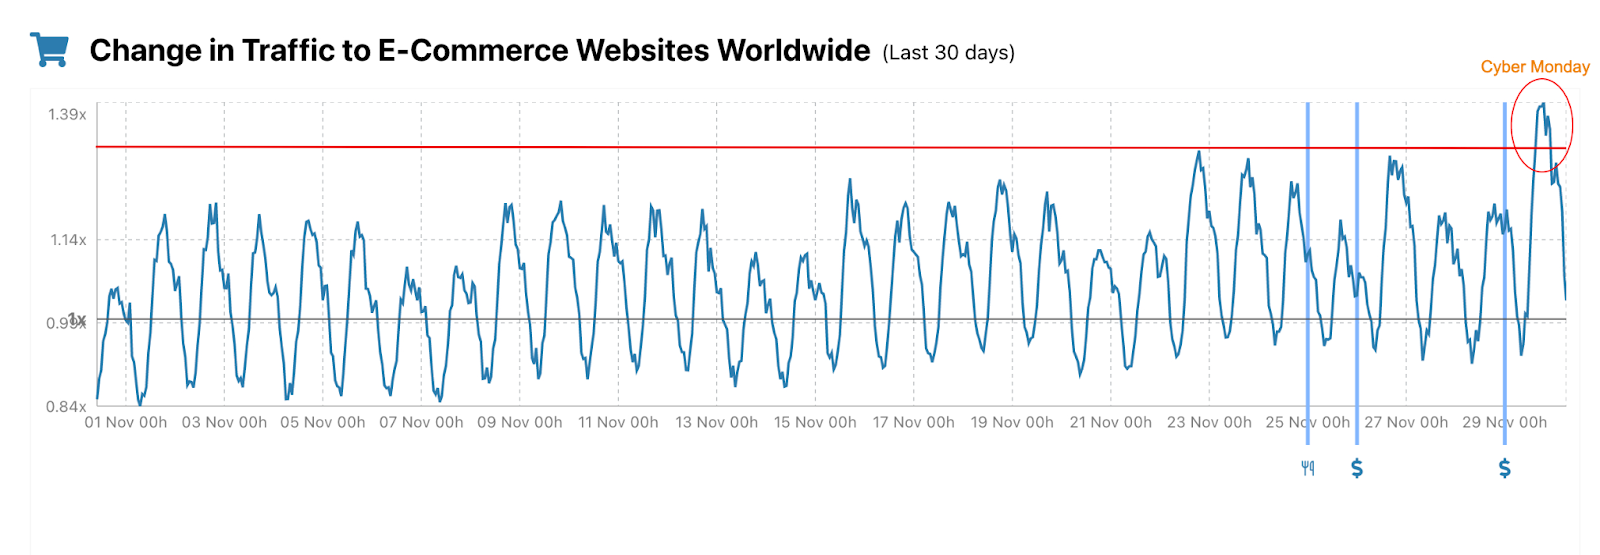
The big April-March and May Internet traffic peak from 2020 related to the pandemic wasn’t there, in the same way, this year — it was more distributed depending on the local restrictions. In 2021, Internet traffic, globally, continued to grow throughout the year, and it was at the end of the year that was higher (a normal trend, given there’s a growth in categories like online shopping and the colder season in the Northern Hemisphere, where most Internet traffic occurs, affects human behaviour).
The day of the year with the highest growth in traffic worldwide, from our standpoint, was December 2, 2021, with 20% more than the first week of the year — the Y-axis shows the percentage change in Internet traffic using a cohort of top domains from each country. But in May there was also a bump (highlighted in red as a possible pandemic-related occurrence), although not as high as we saw in the March-May period of last year.
Spikes in Internet traffic — Worldwide 2021
#1 November-December1 (+23%) #2 September (+20%) #3 October (+19%) #4 August (+16%) #5 May (+13%) 1Beginning of December
When we focus on specific countries using our Year In Review 2021 page you can see that new restrictions or lockdowns affected (again) Internet traffic and, in some countries, that is more evident than others.
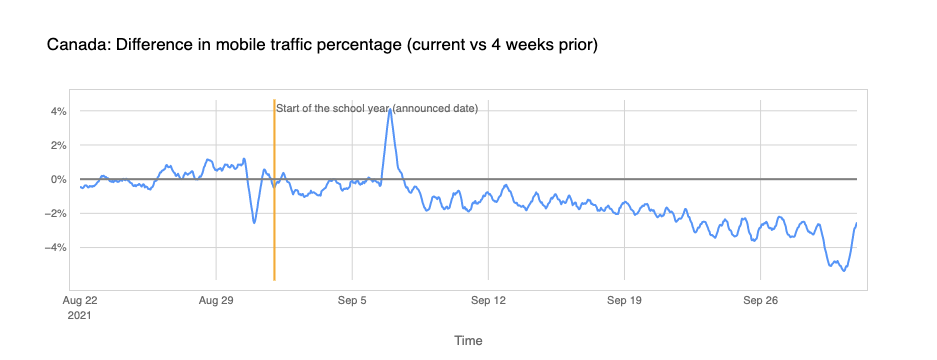
In the following table, we show the months with the highest traffic growth (the percentage shown focus on the spikes). From our standpoint the last four months of the year usually have the highest growth in traffic after September, but Canada, the UK, Germany, France, Portugal, South Korea and Brazil seemed to show (in red) an impact of restrictions in their Internet traffic — with higher increases in the first five months of the year.
Months with the largest traffic growth — 2021
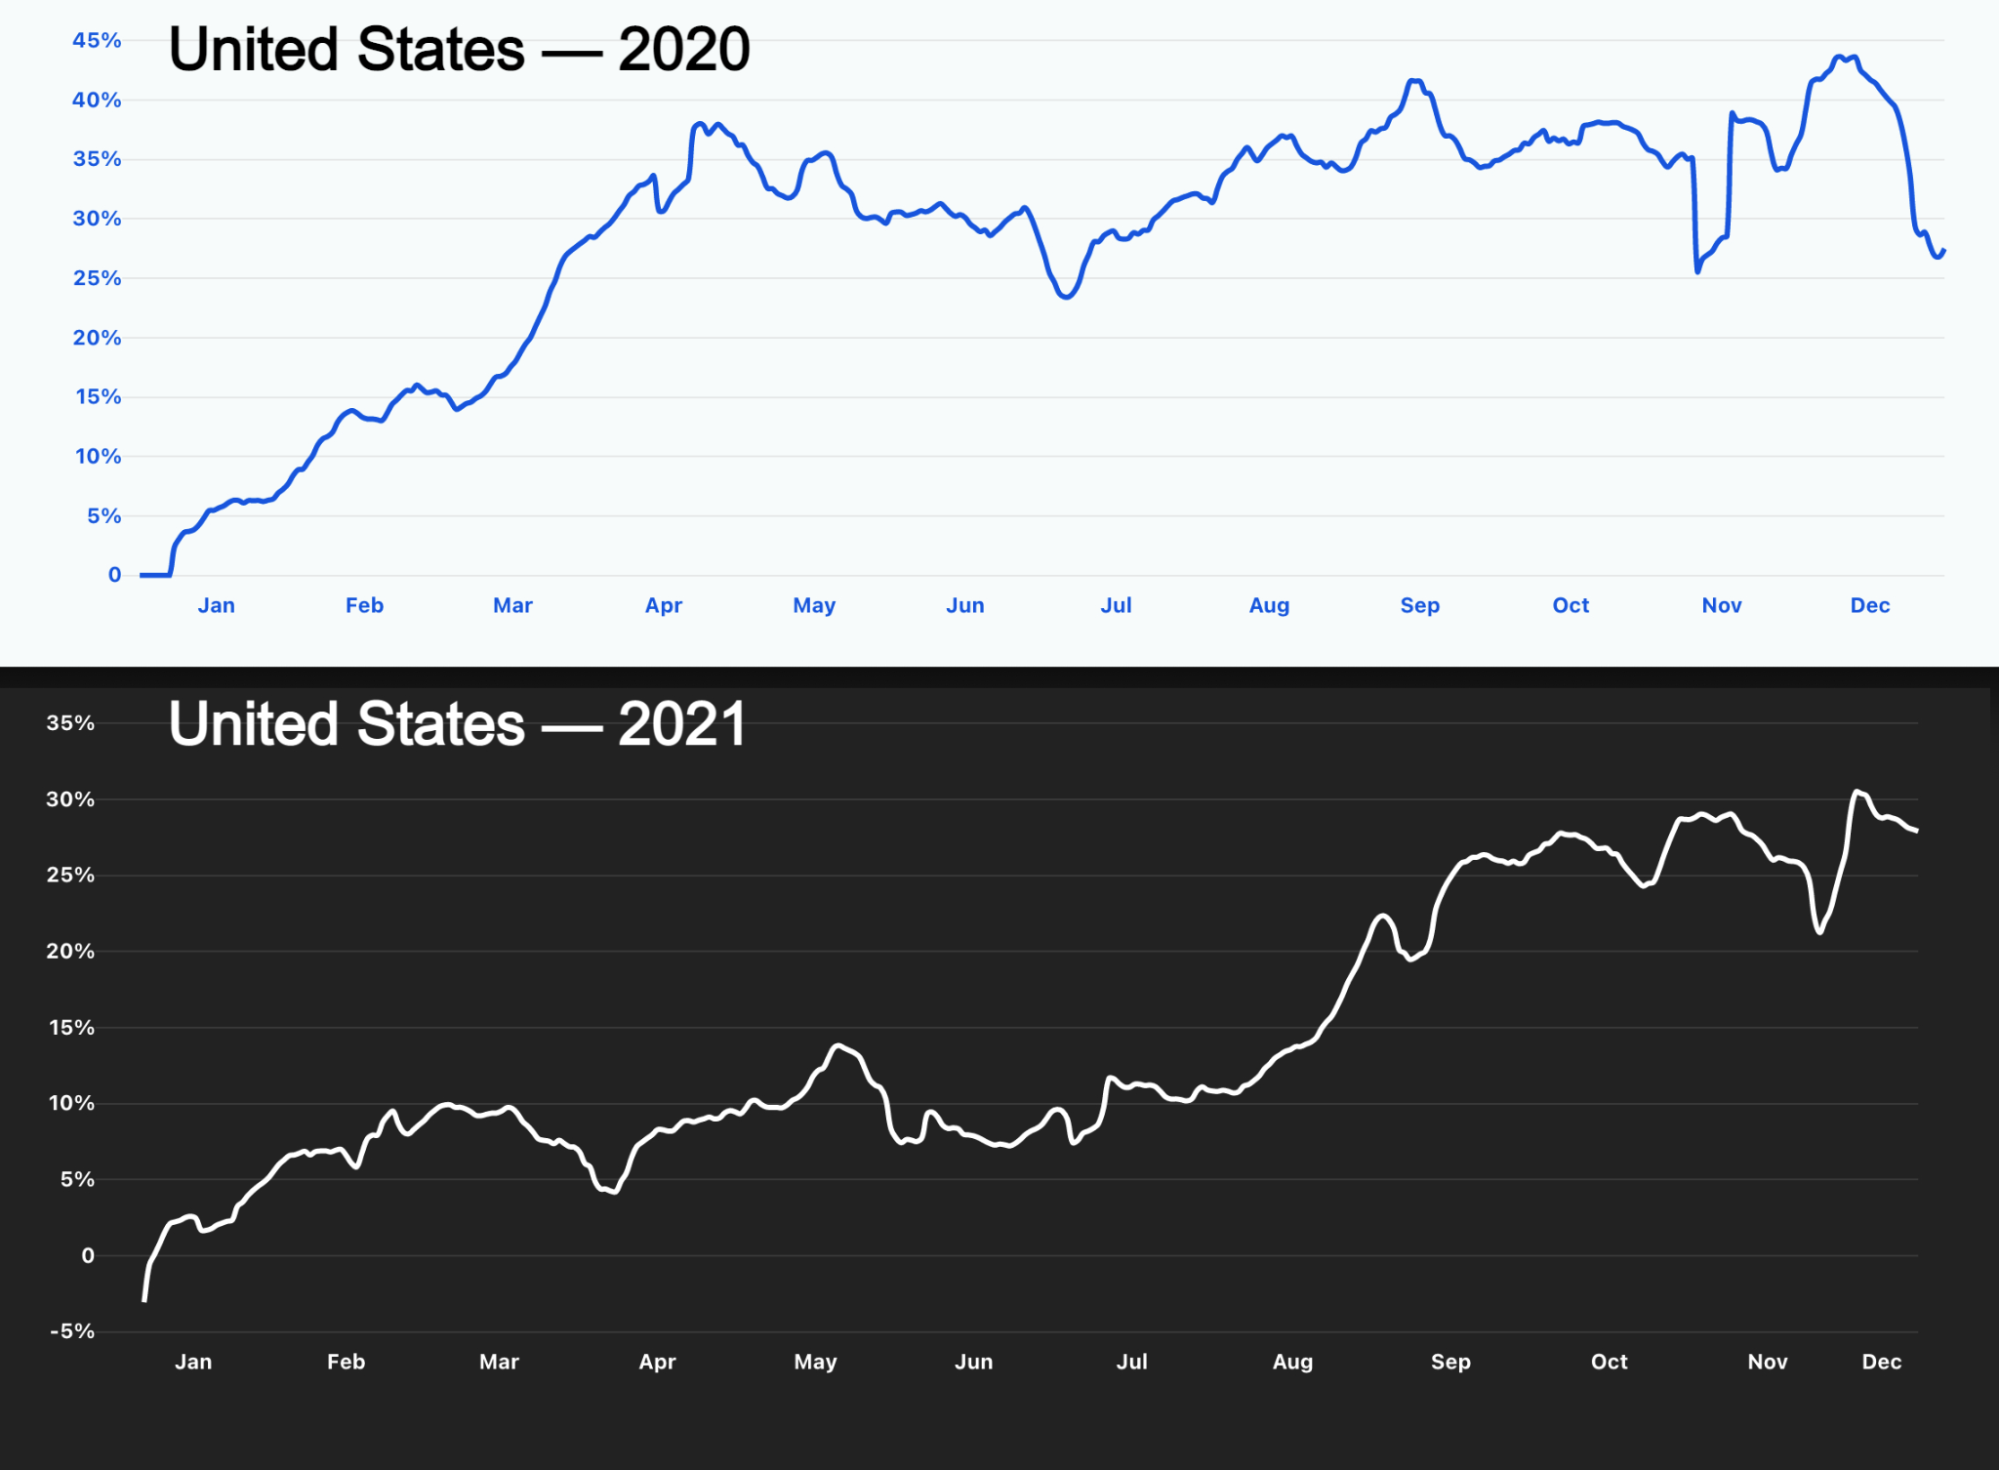
United States
#1 November-Dec (+30%) #2 October (+26%) #3 September (+25%) #4 August (+15%) #5 May (+13%)
Canada
#1 November-Dec (+21%) #2 October (+10%) #3 April (+9%) #4 May (+8%) #5 March (+7%)
UK
#1 November-Dec (+23%) #2 March (+13%) #3 October (+12%) #4 February (+7%) #5 September (+5%)
Germany
#1 November-Dec (+25%) #2 October (+15%) #3 May (+7%) #4 February (+6%) #5 September (+5%)
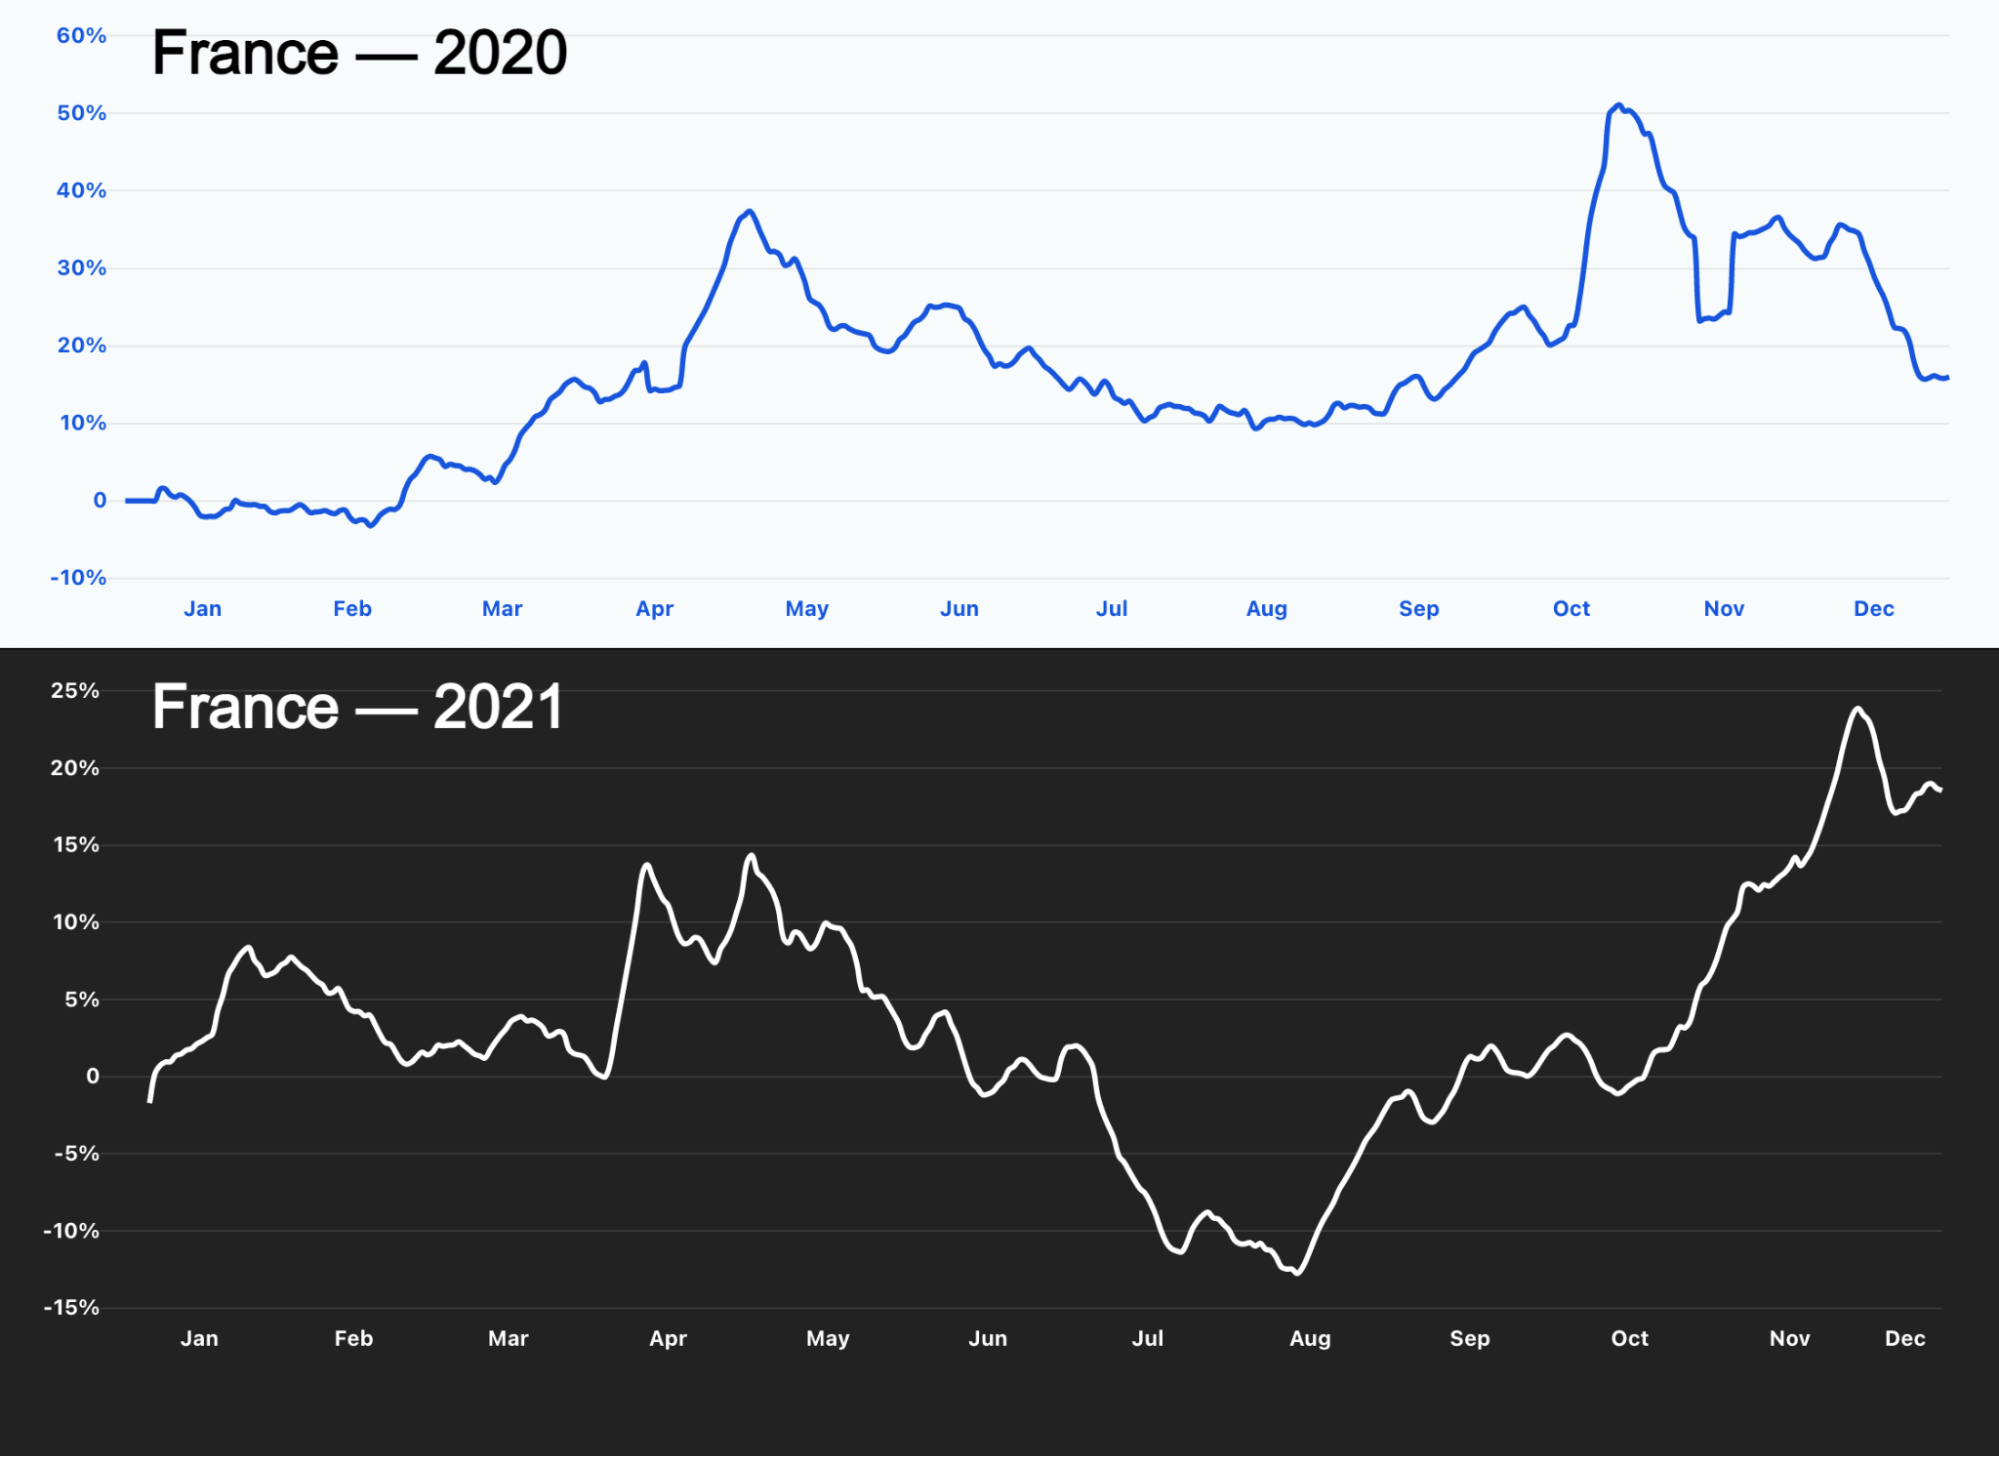
France
#1 November-Dec (+24%) #2 May (+14%) #3 April (+13%) #4 January (+8%) #5 February (+7%)
Japan
#1 November-Dec (+32%) #2 October (+28%) #3 September (+28%) #4 August (+24%) #5 July (+18%)
Australia
#1 November-Dec (+42%) #2 September (+38%) #3 October (+37%) #4 August (+32%) #5 July (+27%)
Singapore
#1 November-Dec (+62%) #2 October (+58%) #3 September (+58%) #4 August (+41%) #5 July (+31%)
Portugal
#1February (+38%) #2 March (+23%) #3 January (+22%) #4 November-Dec (+18%) #5 April (+17%)
South Korea
#1 April (+21%) #2 May (+16%) #3 February (+10%) #4 August (+7%) #5 September (+7%)
Brazil
#1 May (+25%) #2 June (+23%) #3 November-Dec (+22%) #4 April (+21%) #5 July (+21%)
India
#1 November-Dec (+24%) #2 September (+22%) #3 October (+21%) #4 August (+19%) #5 July (+10%)
When we look at those countries’ trends we can see that Canada had lockdowns at the beginning of February that went through March and May, depending on the area of the country. That is in line with what we’ve seen in 2020: when restrictions/lockdowns are up, people tend to use the Internet more to communicate, work, exercise and learn.
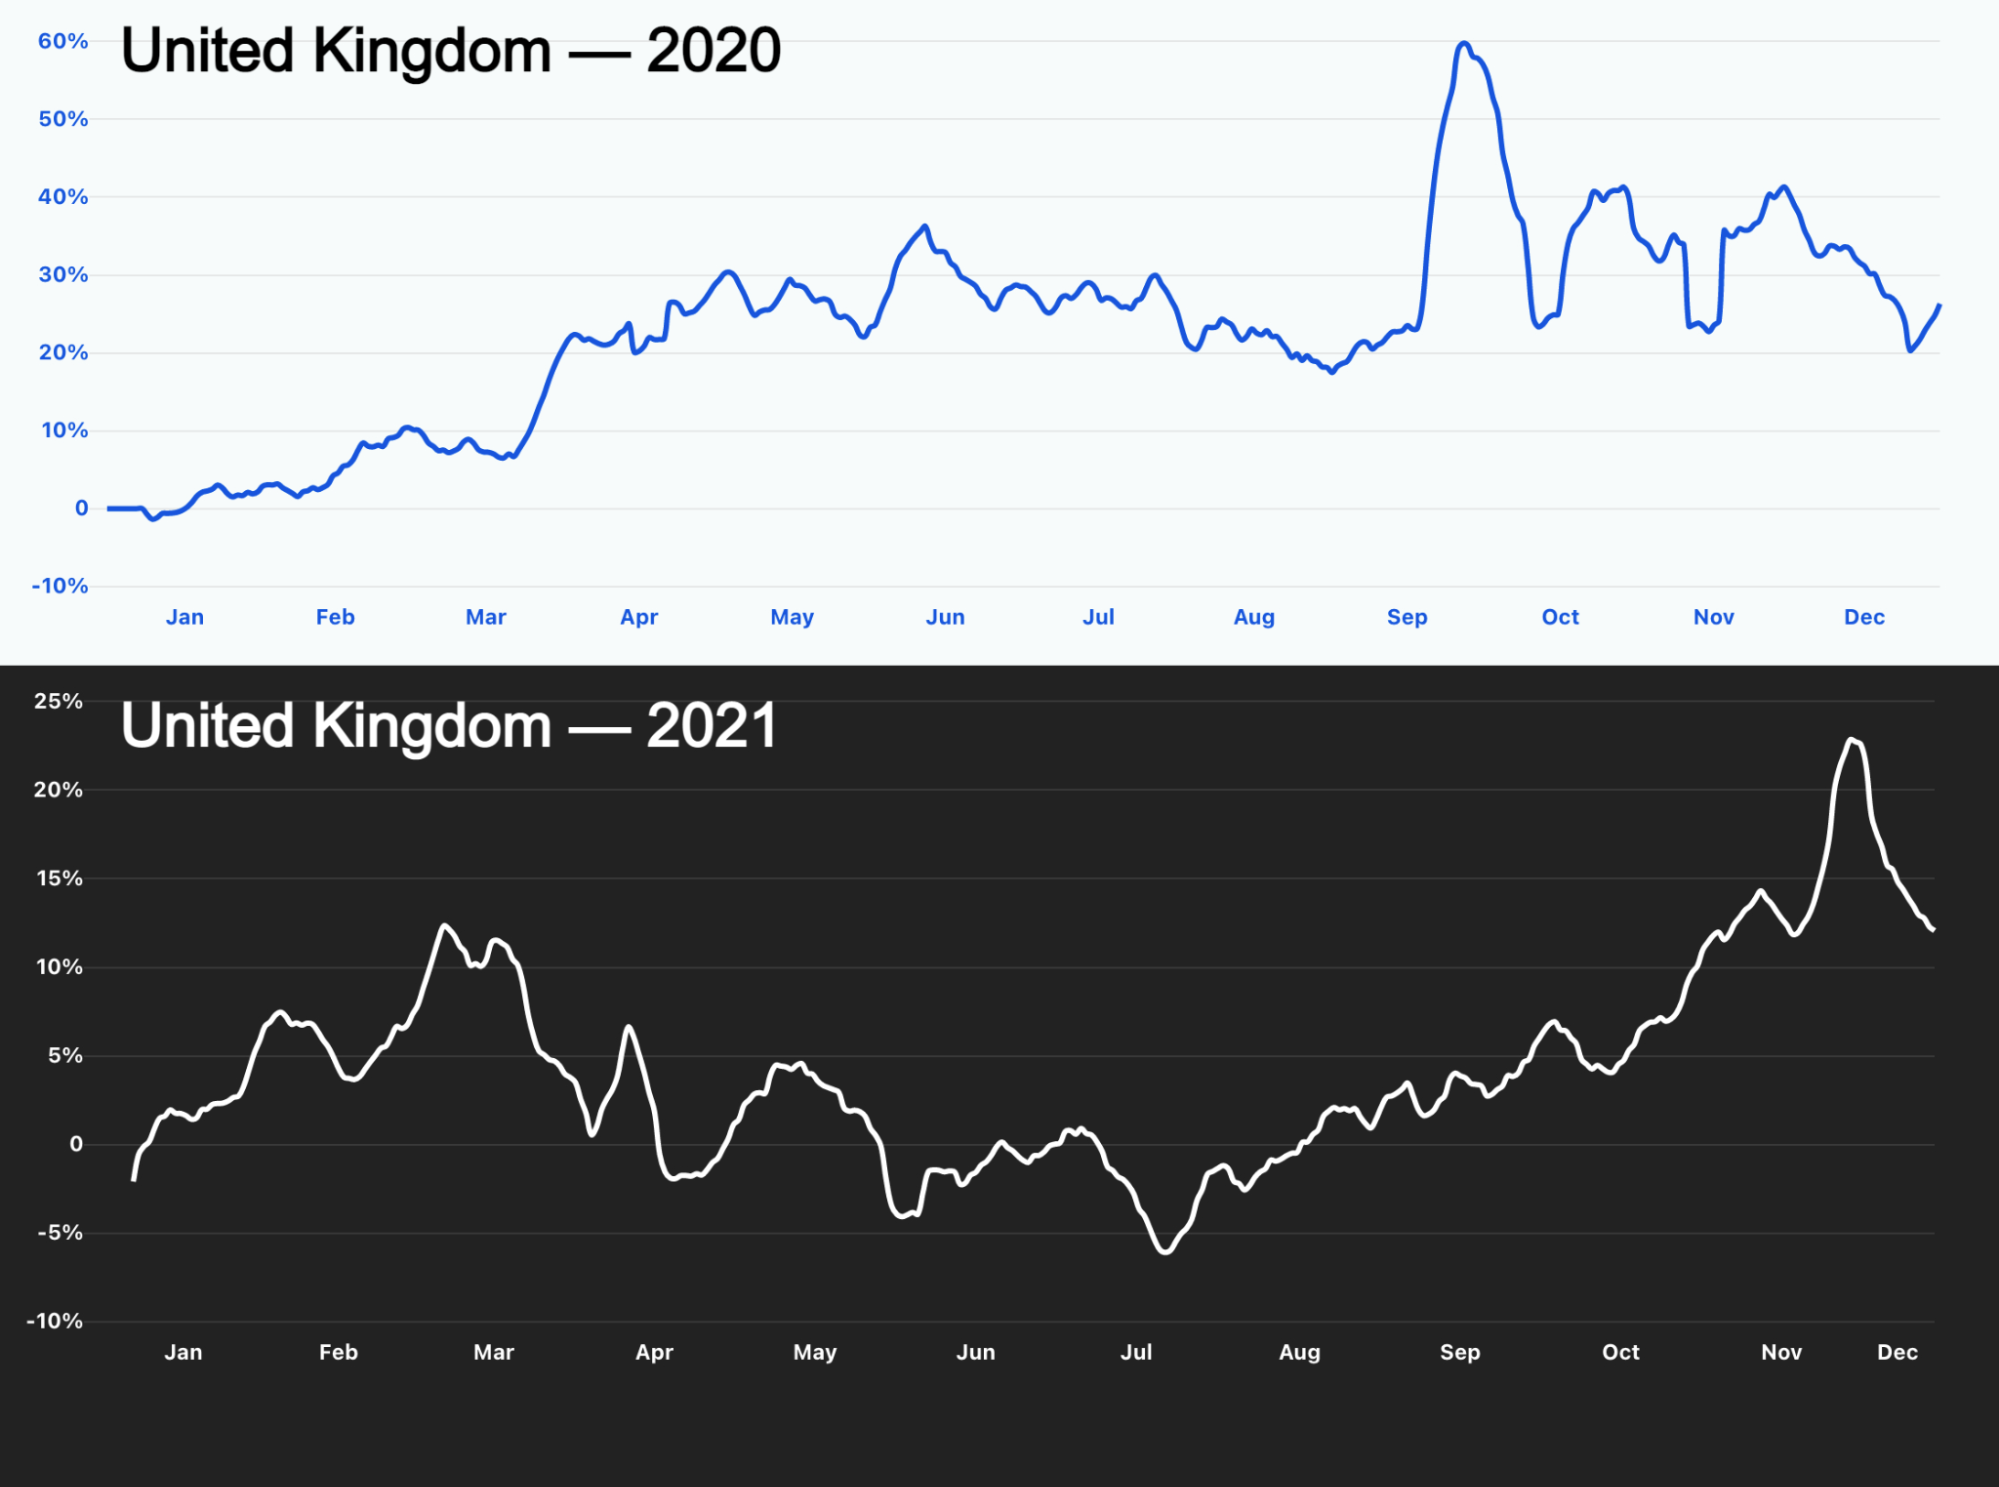
Most of Europe also started 2021 with lockdowns and restrictions that included schools — so online learning was back on. That’s clear in the UK. From January to March showed a high increase in traffic percentage that went down when restrictions were relaxed.
The lines here show Internet traffic growth from our standpoint throughout 2020 and 2021 in the UK
The same happens in Portugal, where new measures on January 21, 2021, put the three first months of the year in the top 3 of the year in terms of growth of traffic, and April was #5.
We can also check the example of France. Lockdowns were imposed again especially during April and May 2021, and we can see the growth in Internet traffic during those months, slightly more timid than the first lockdown of 2020, but nonetheless evident in the 2021 chart.
Germany had the same situation in May (in April work from home was again the rule and the relaxation of measures for vaccinated people only began in mid-May), but in February the lockdown that started at the end of 2020 (and included schools) was also having an impact on Internet traffic.
In South Korea there was also an impact of the beginning of the year lockdown seen in spikes through February, April and May 2021.
Internet traffic growth in the United States had a very different year in 2021 than it had the year before, when the first lockdown had a major effect on Internet growth, but still, May was a month of high growth — it was in mid-May that there were new guidelines from the CDC about masks.
Mobile traffic: The Thanksgiving effect
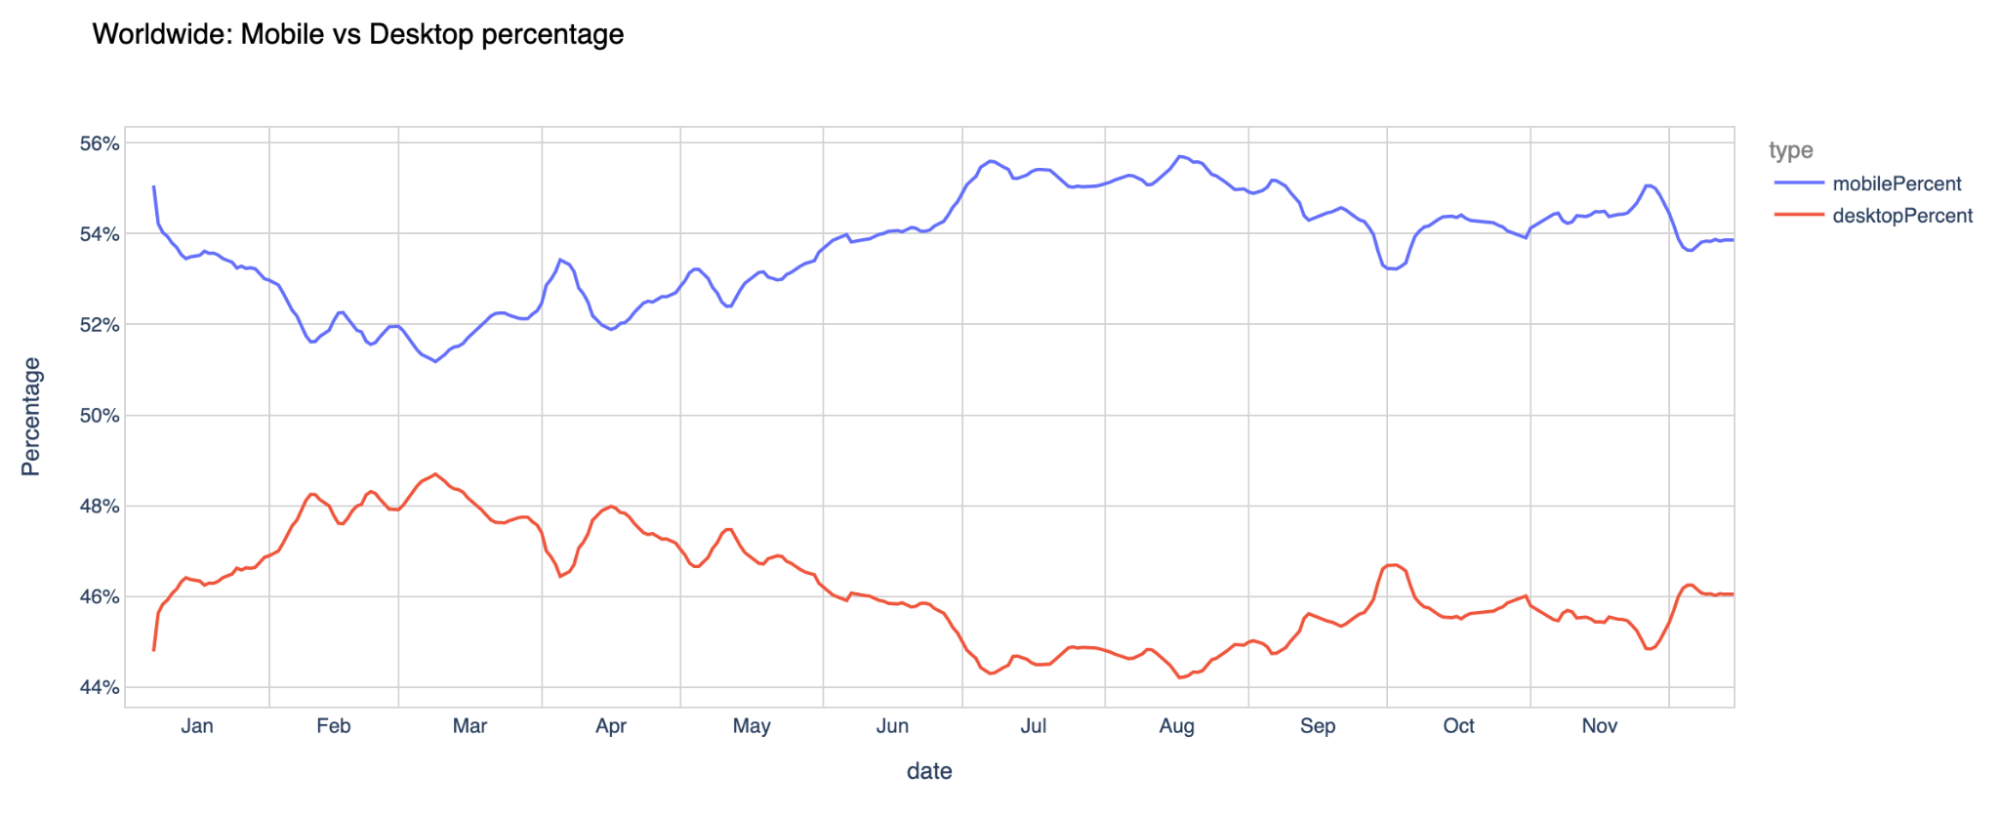
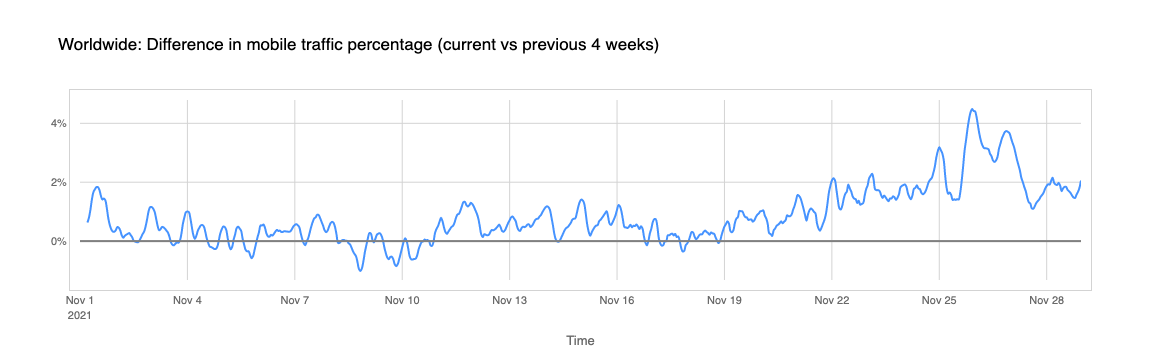
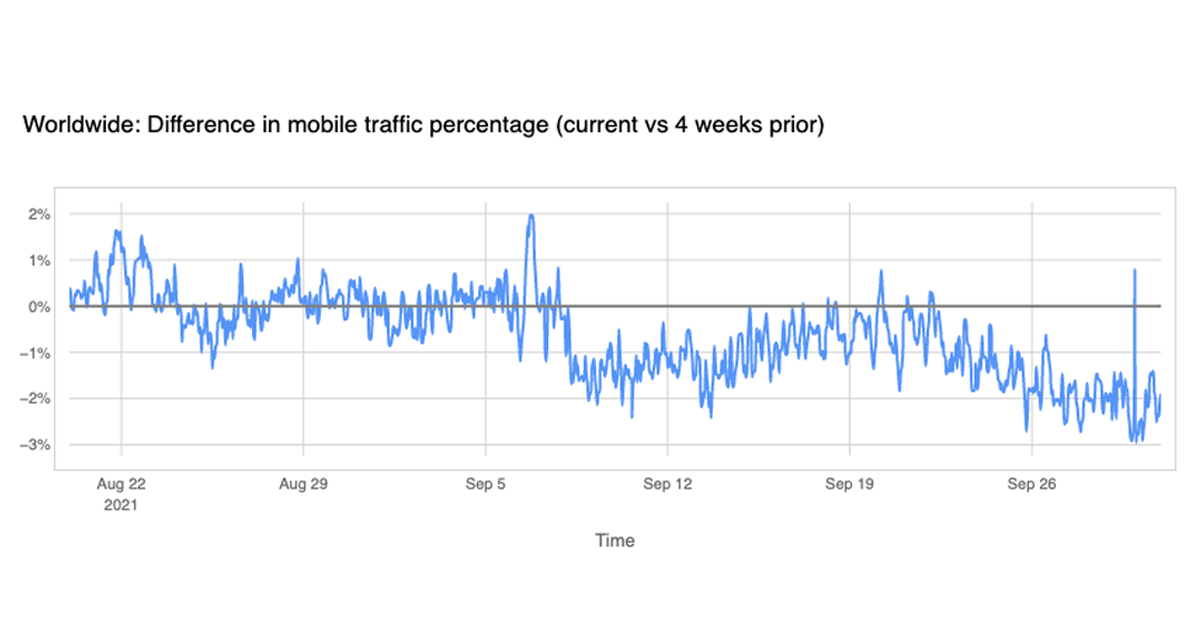
Another trend worldwide from 2021 is the mobile traffic percentage evolution. Worldwide, from our standpoint, the more mobile-friendly months of the year — where mobile devices were more prevalent to go online — were July and August (typical vacations months in most of the Northern Hemisphere), but January and November were also very strong.
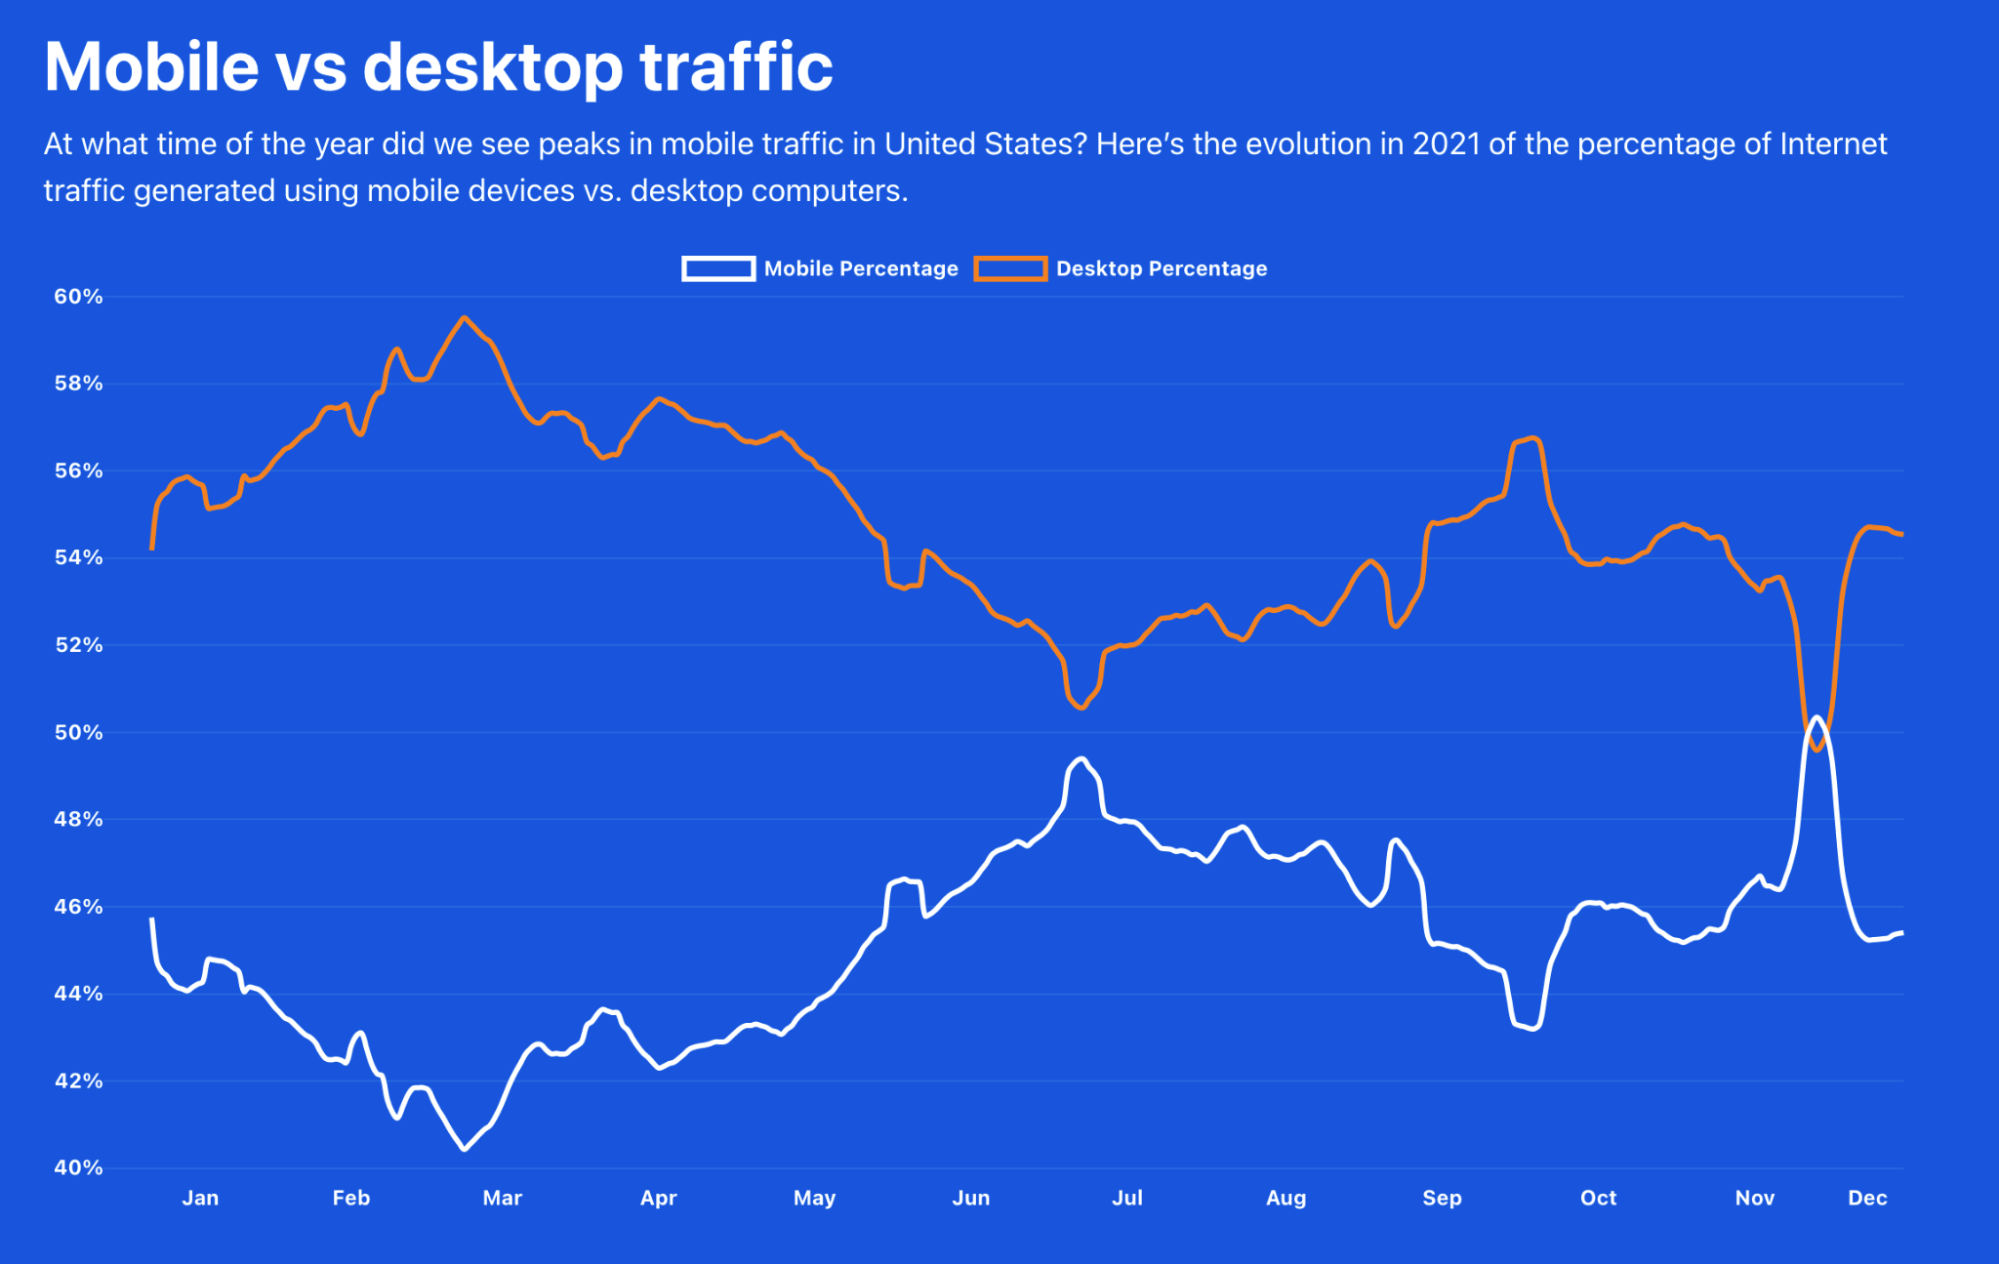
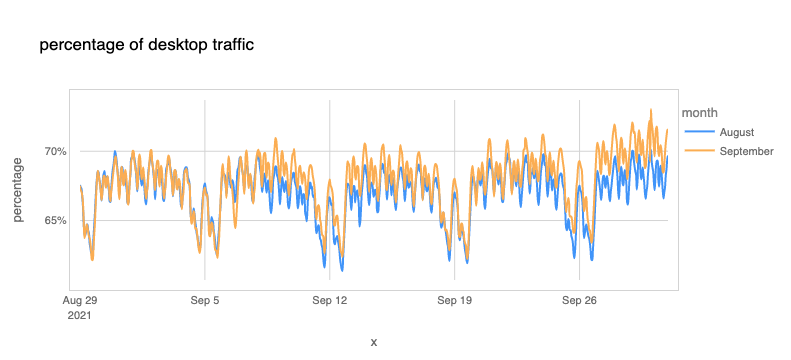
On our Year in Review page, you can also see the new mobile vs desktop traffic chart. The evolution of the importance of mobile traffic is different depending on the country.
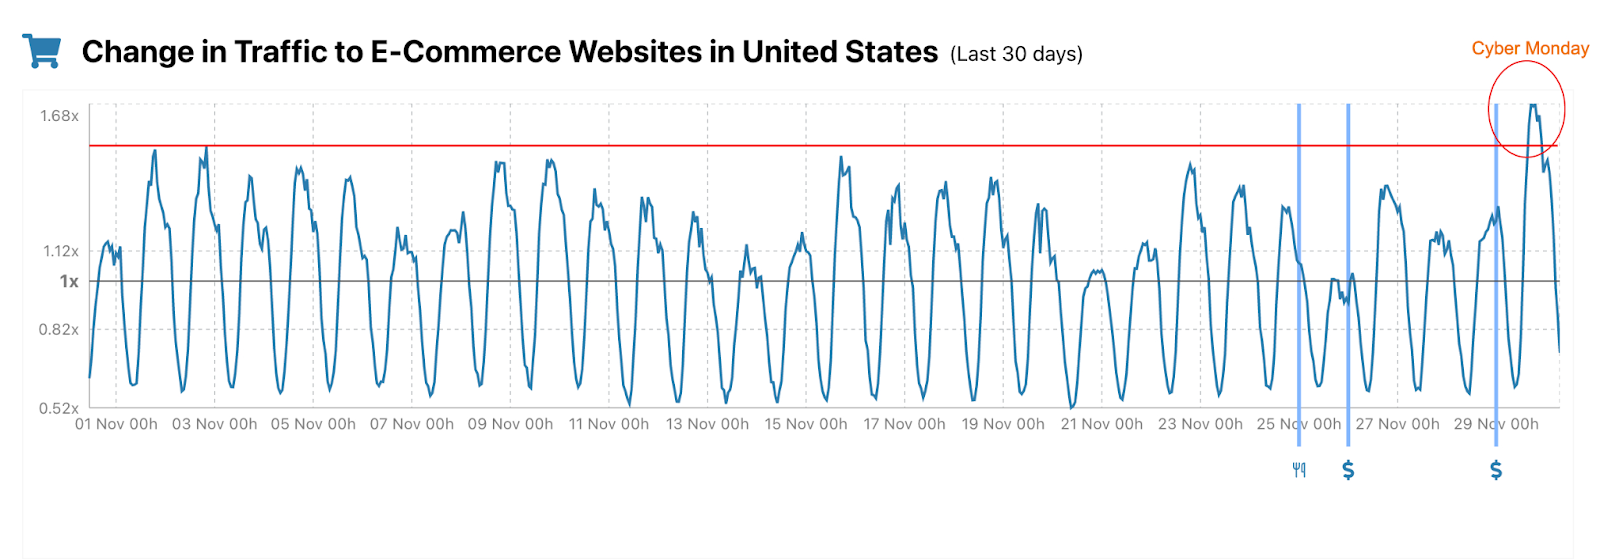
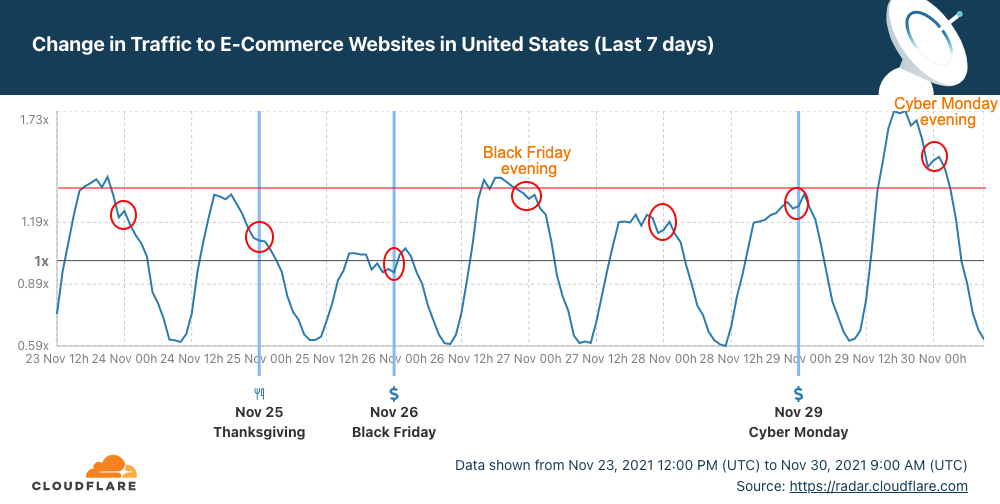
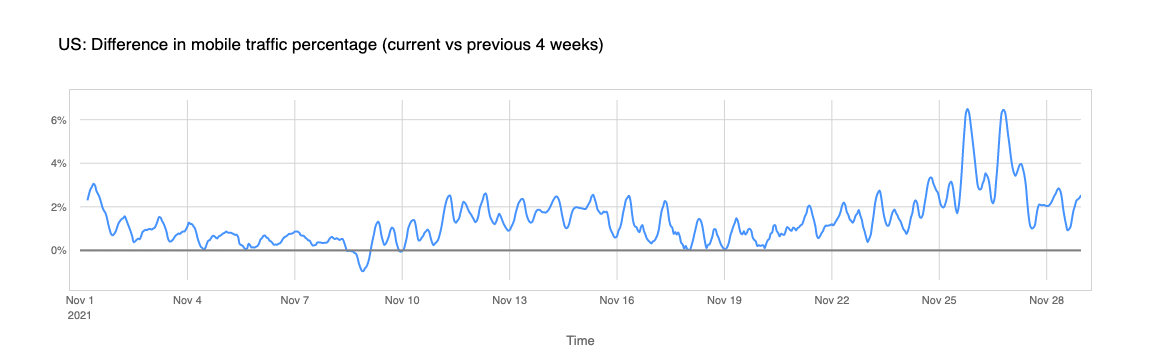
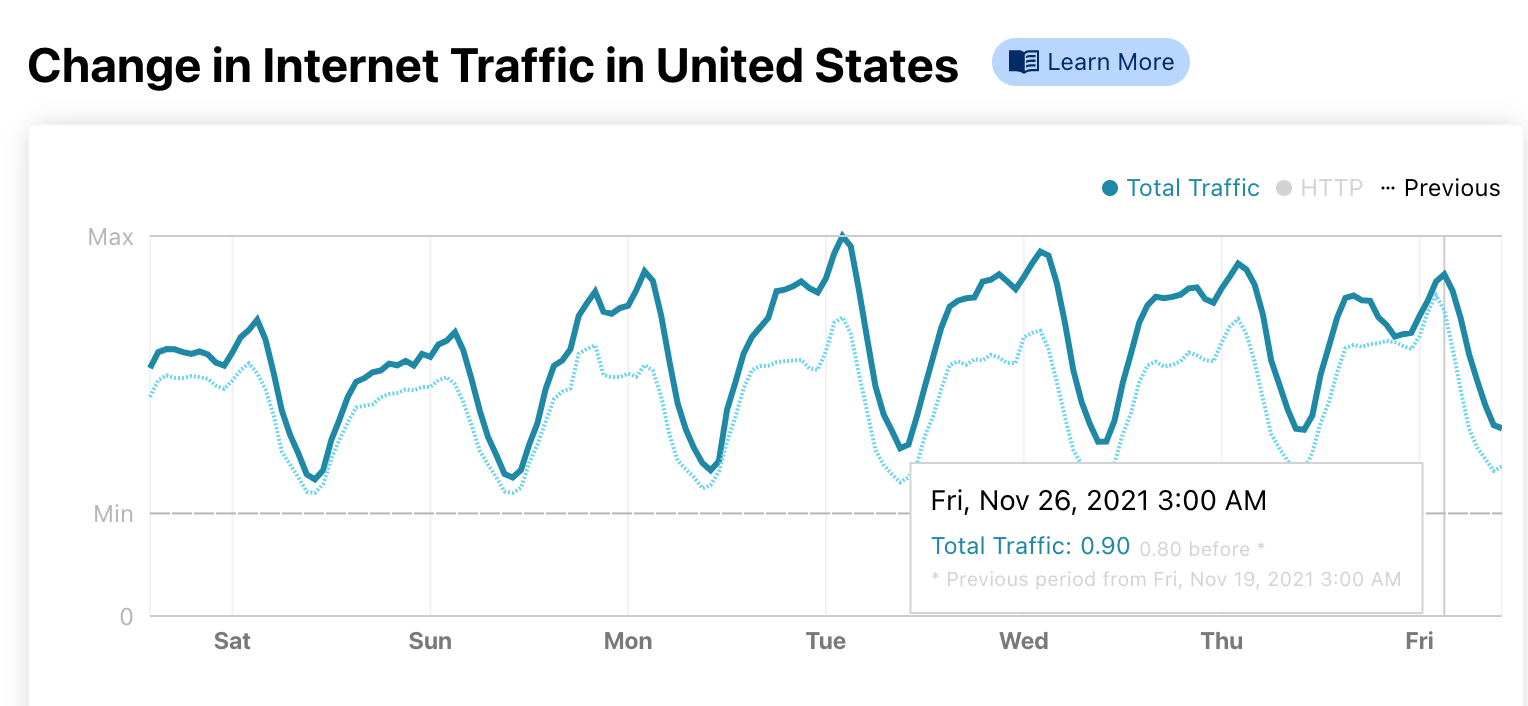
For example, the United States has more desktop traffic throughout the year, but in 2021, during the Thanksgiving (November 25) week, mobile traffic took the lead for the first and only time in the whole year. We can also see that in July mobile traffic was also high in terms of relevance.
The UK has a similar trend, with June, July and August being the only months of the year when mobile traffic is prevalent compared to desktop.
If we go to the other side of the planet, to Singapore, there the mobile percentage is usually higher than desktop, and we see a completely different trend than in the US. Mobile traffic was higher in May, and desktop only went above mobile in some days of February, some in March, and especially after the end of October.
Where people accessed the Internet
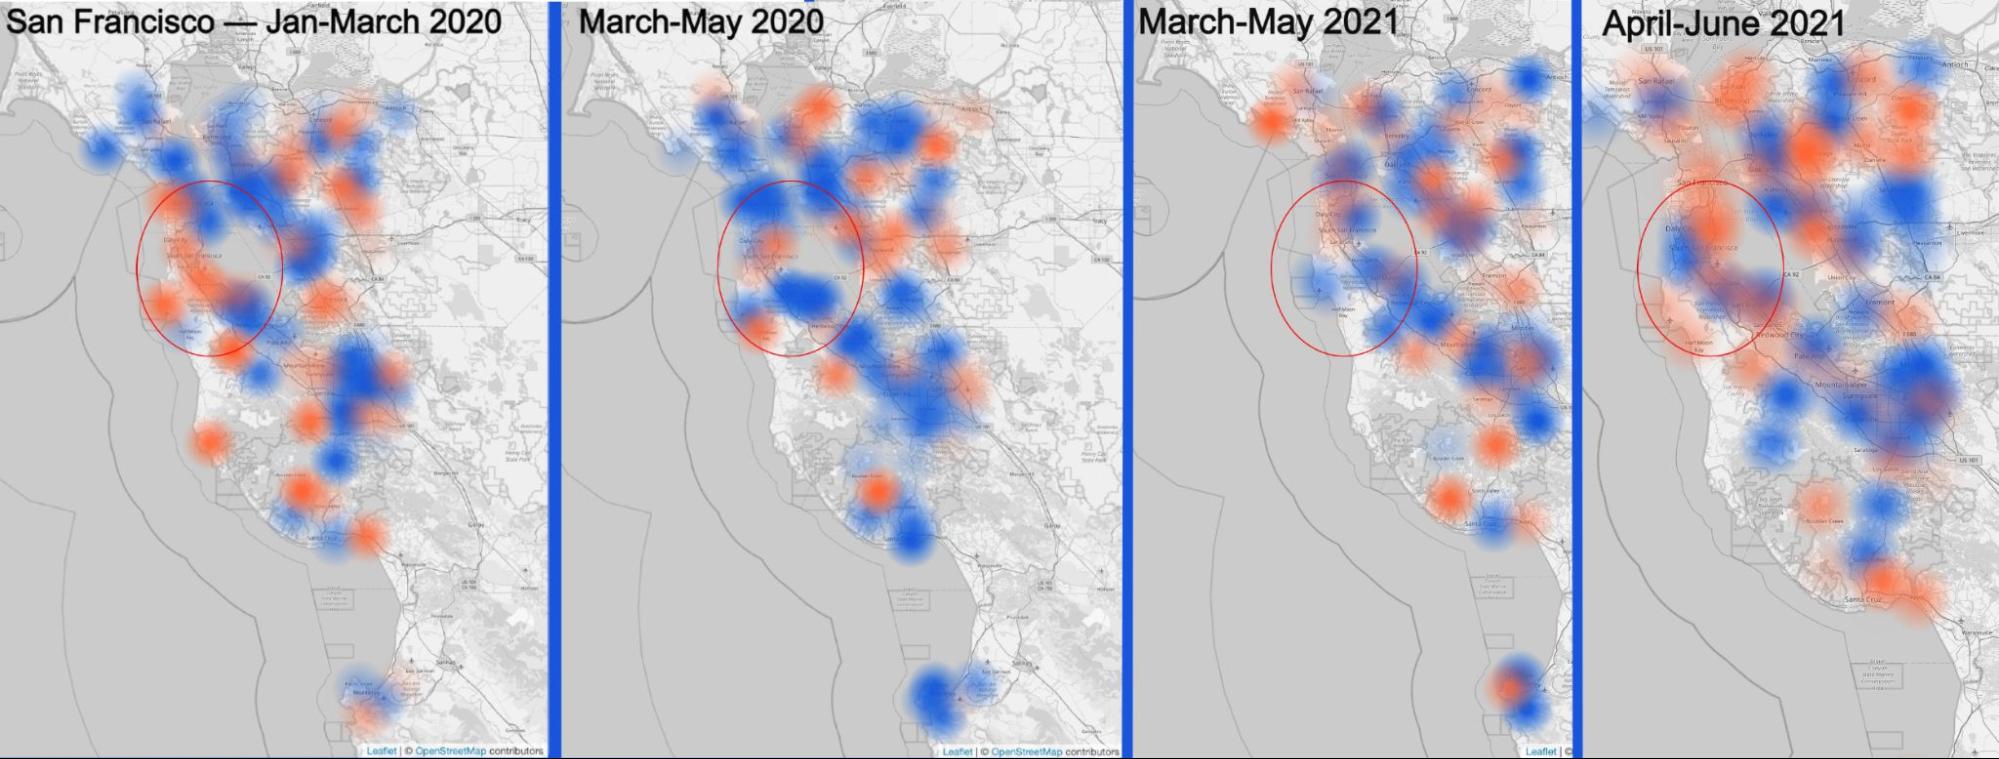
We also have, again, available the possibility of selecting a city from the map of our Year in Review to zoom into a city to see the change in Internet use throughout the year. Let’s zoom in on San Francisco.
The following agglomeration of maps highlights (all available in our Year in Review site) the change in Internet use comparing the start of 2020, mid-January to mid-March — you can see that there’s still some increase in traffic, in orange —, to the total lockdown situation of April and May, with more blue areas (decrease in traffic).
The red circles shows San Francisco and its surroundings (home of a lot of companies) in a map that compares working hours Internet use on a weekday between two months.
The same trend is seen already in May 2021 in a time when remote work continued to be strong — especially in tech companies (employees moved from the Bay Area). Only in June of this year, there was some increase in traffic (more orange areas), especially further away from San Francisco (in residential areas).
London: From lockdown to a Euro Championship final
London tells us a different story. Looking through the evolution since the start of 2020 we can see that in March (compared to January) we have an increase in traffic (in orange) outside London (where blue is dominant).
The Internet activity only starts to get heavier in June, in time for the kick-off of the 2020 UEFA European Championship. The tournament played in several cities in Europe had a lot of restrictions and a number of games were played in London at Wembley Stadium — where Italy won the final by beating England on penalties. But at the time of the final, July, and especially August, blue was already dominant again — so people seemed to leave the London area. Only in September and October did the traffic start to pick up again, but mostly outside the city centre.
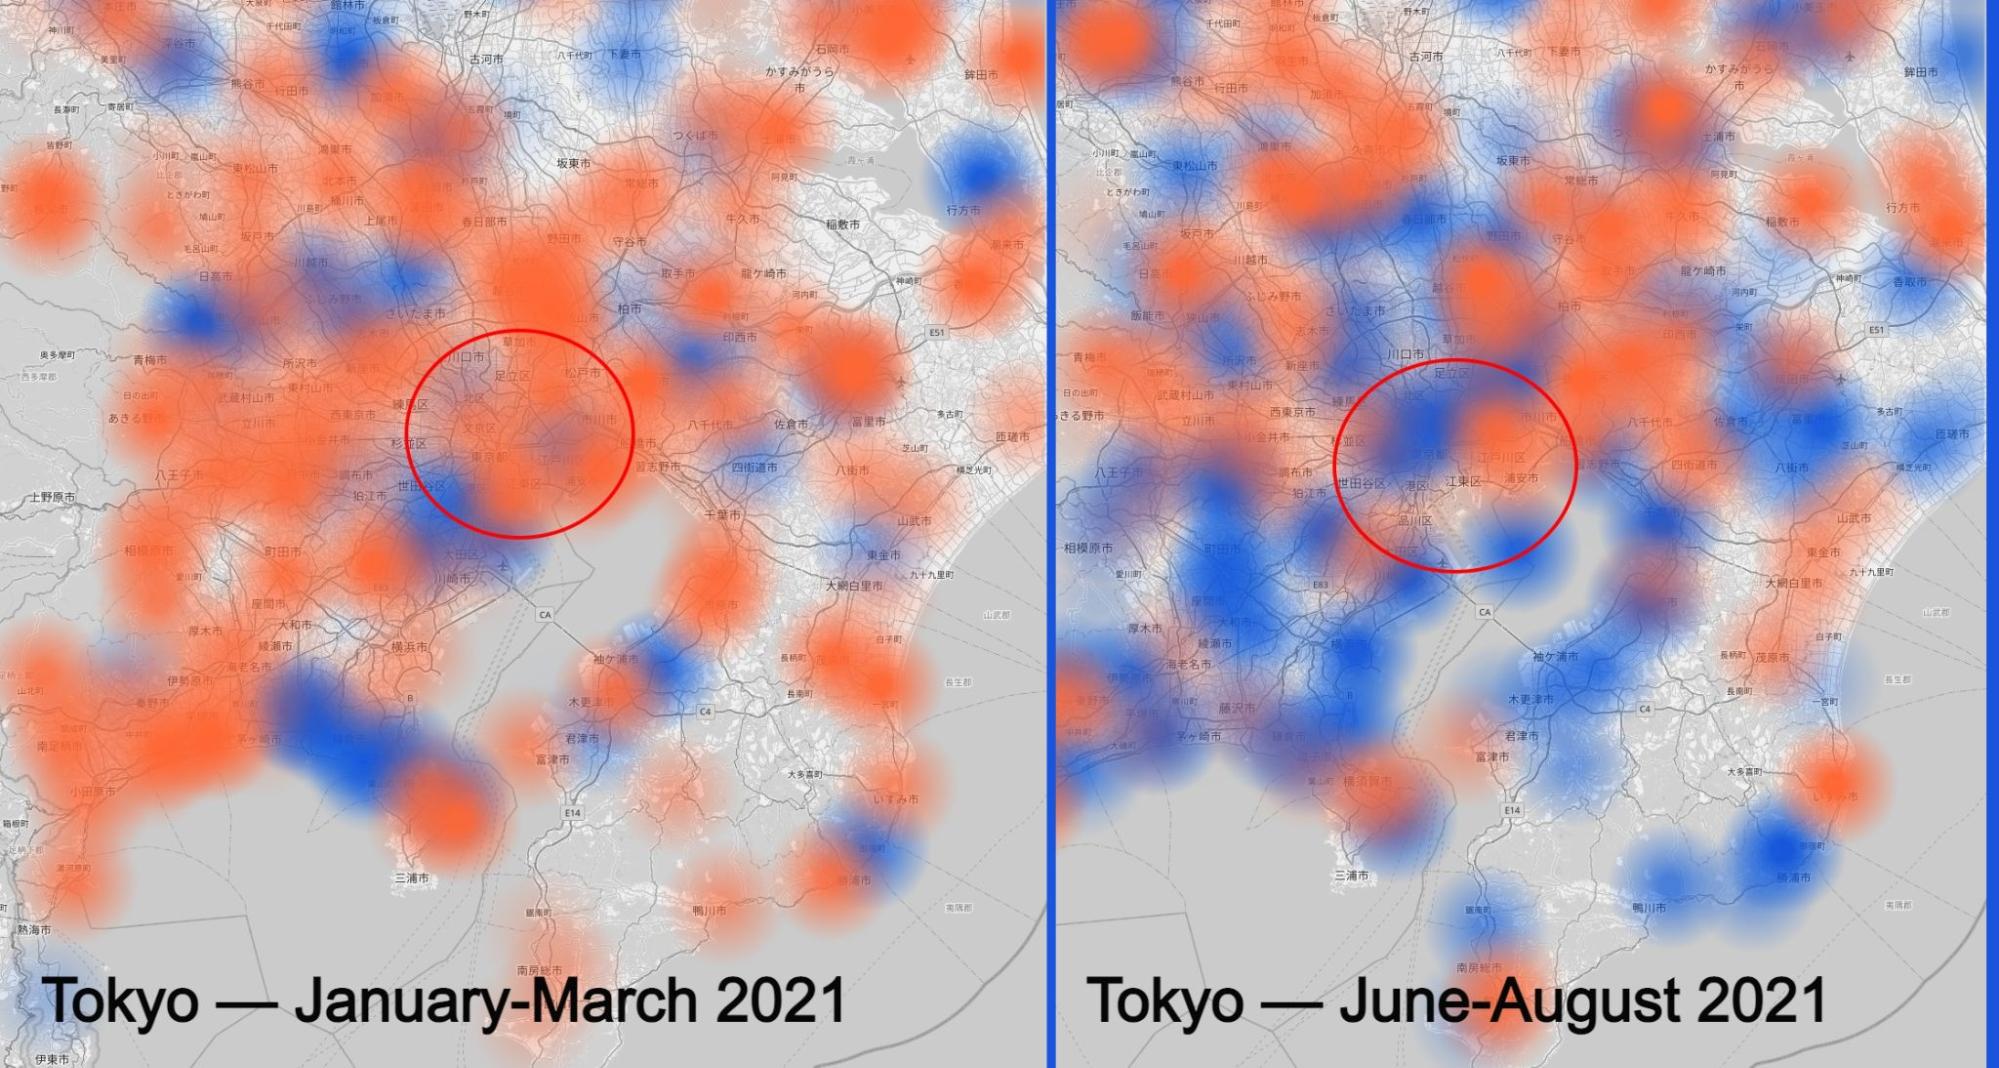
The Summer Olympics impact? Tokyo with low activity
After the UEFA European Championship, came the other big event postponed back in 2020, the Tokyo Summer Olympics. Our map seems to show the troubled months before the event with the pandemic numbers and the restrictions rising before the dates of the major event — late July and the first days of August.
There were athletes, but not fans from around the world and even locals weren’t attending — it was largely an event held behind closed doors with no public spectators permitted due to the declaration of a state of emergency in the Greater Tokyo Area. We can see that in our charts, especially when looking at the increase in activity in March (compared to January) and the decrease in August (compared to June), even with a global event in town (Tokyo is in the red circle).
There’s also another interesting trend pandemic-related in Lisbon, Portugal. With the lockdowns put in place since mid-January, the comparison with March shows the centre of the city losing Internet traffic and the residential areas outside Lisbon gaining it (in orange in the animation). But in April the activity decreased even around Lisbon and only started to get heavier in May when restrictions were more a lot more relaxed.
Lockdowns bring more traffic to Berlin
A different trend can be seen in Berlin, Germany. Internet activity in the city and its surroundings was very high in March and in April (compared to the previous two months) at a time when lockdowns were in place — nonetheless, in 2020 the activity decreased in April with the first major lockdown.
But in May and June, with the relaxation in restrictions, Internet activity decreased (blue) giving the idea that people left the city or, at least, weren’t using the Internet so much. Only in August did Internet activity begin to pick up again, but decreased once more in the colder months of November and December.
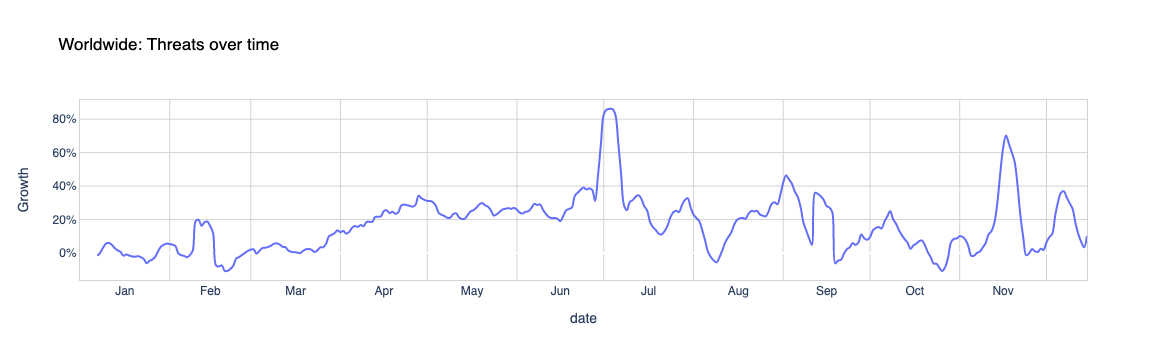
Cyberattacks: Threats that came in July
In terms of worldwide attacks, July and November (the month of Black Friday, when it reached a 78% in increase) were definitely the months with the highest peak of the year. The biggest peak was at the beginning of July 2021, when it reached 82%. That was more than a month after the Colonial Pipeline ransomware cyberattack — May was also the month of an attack on part of Toshiba and, in the same week, the Irish health system and of the meat processing company JBS.
The week of December 6 (the same when the Log4j vulnerability was disclosed) also had an increase in attacks — 42% more, and there was also a clear increase (42%) in the beginning of October, around the time of the Facebook outage.
In our dedicated page you can check — for the first time this year — the attack distribution in a selection of countries.
The UK had a very noticeable peak in overall Internet attacks (a growth of 150%) in August and that continued through September. We already saw that the beginning of the year, because of lockdowns, also had an increase in Internet traffic, and we can also see an increase in attacks in January 2021, but also in late November — around the time of the Black Friday week.
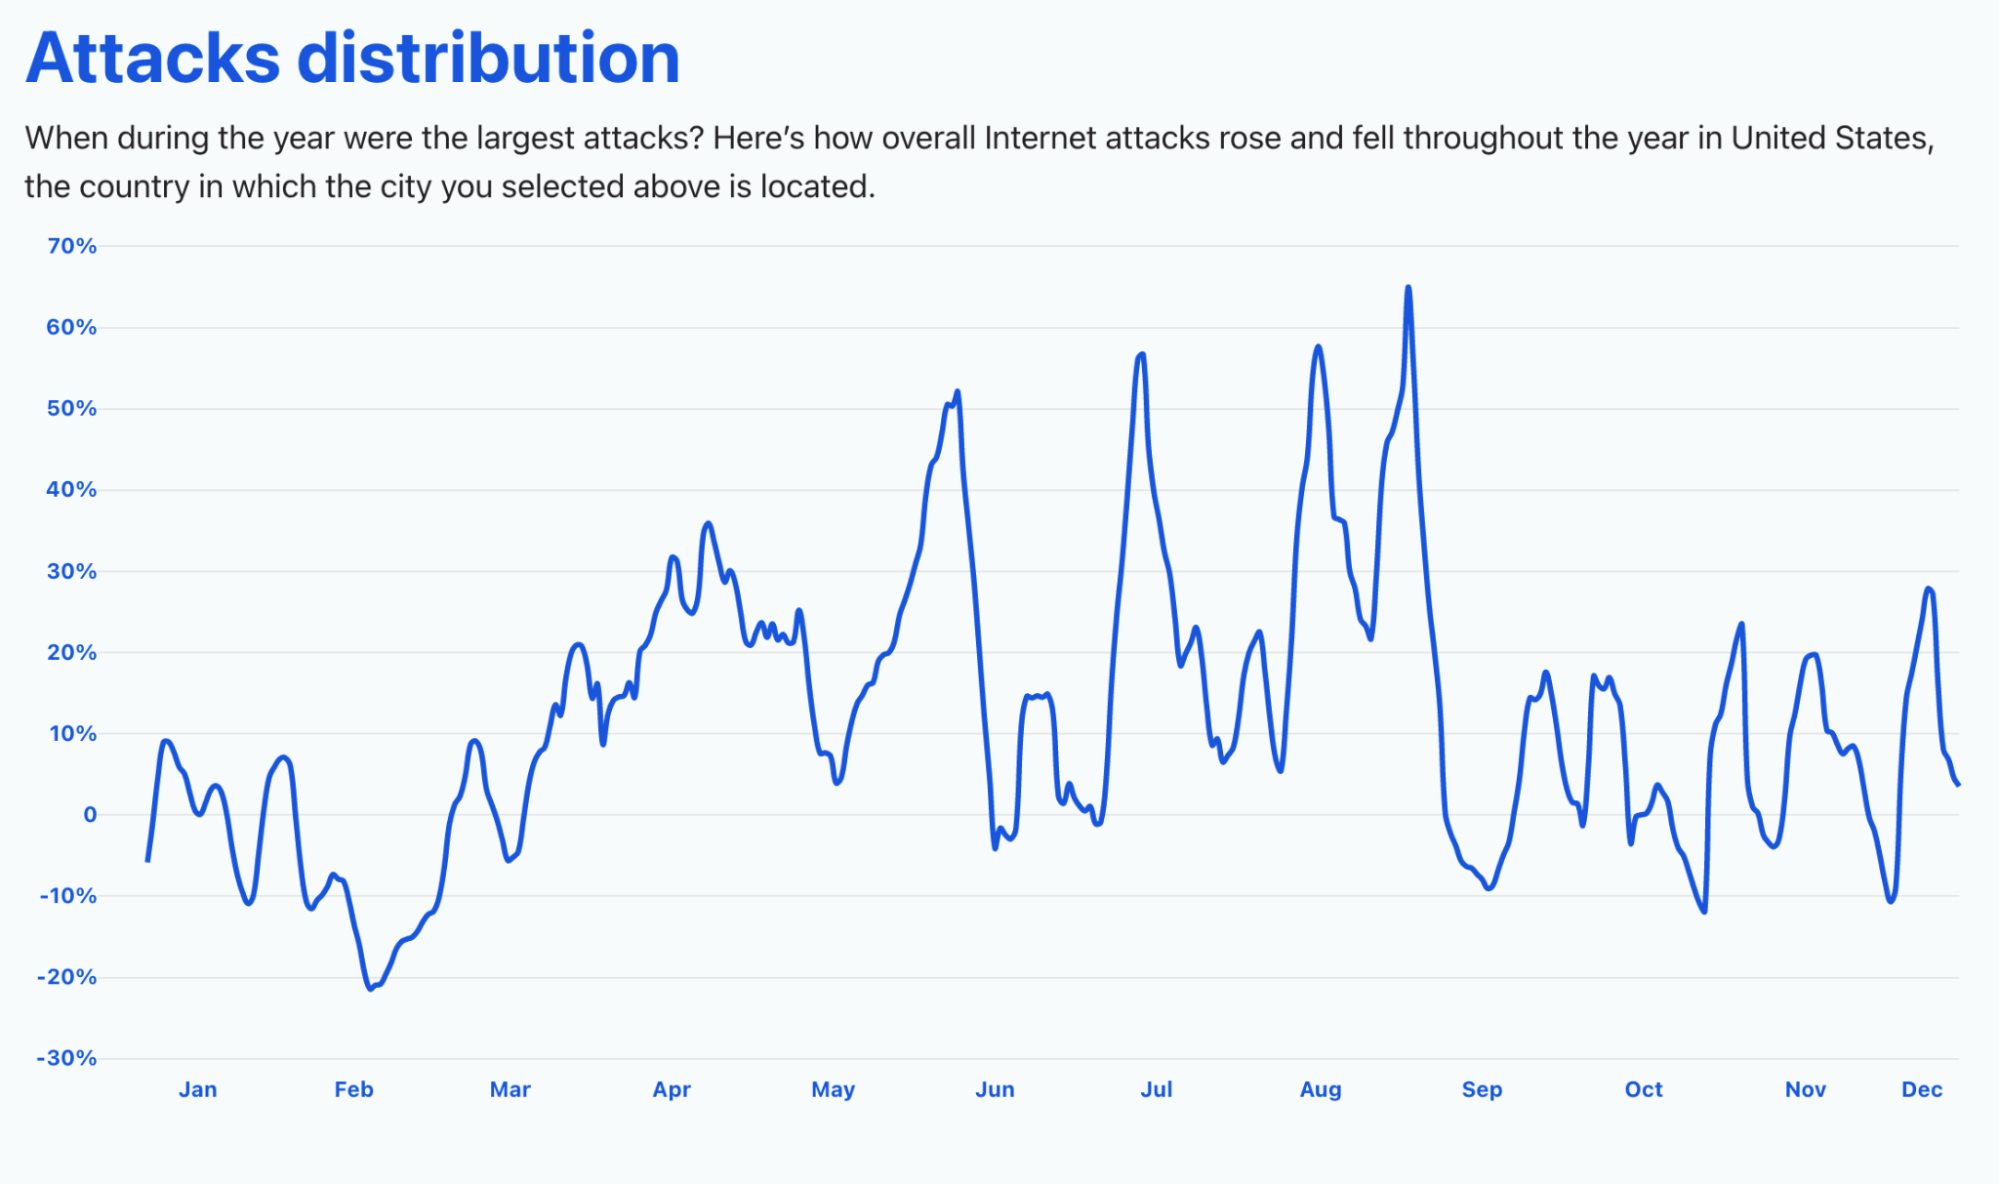
The United States, on the other hand, saw a growth in threats that was more uniform throughout the year. The biggest spike was between August and September (a time when students, depending on the state, were going back to school), with 65% of growth. July also had a big spike in threats (58%), but also late May (48%) — that was the month of the Colonial Pipeline ransomware cyberattack. Late November also had a spike (29%).
Countries like France had their peak in attacks (420% more) in late September and Germany it was in June (425%), but also in October (380%) and in November (350%).
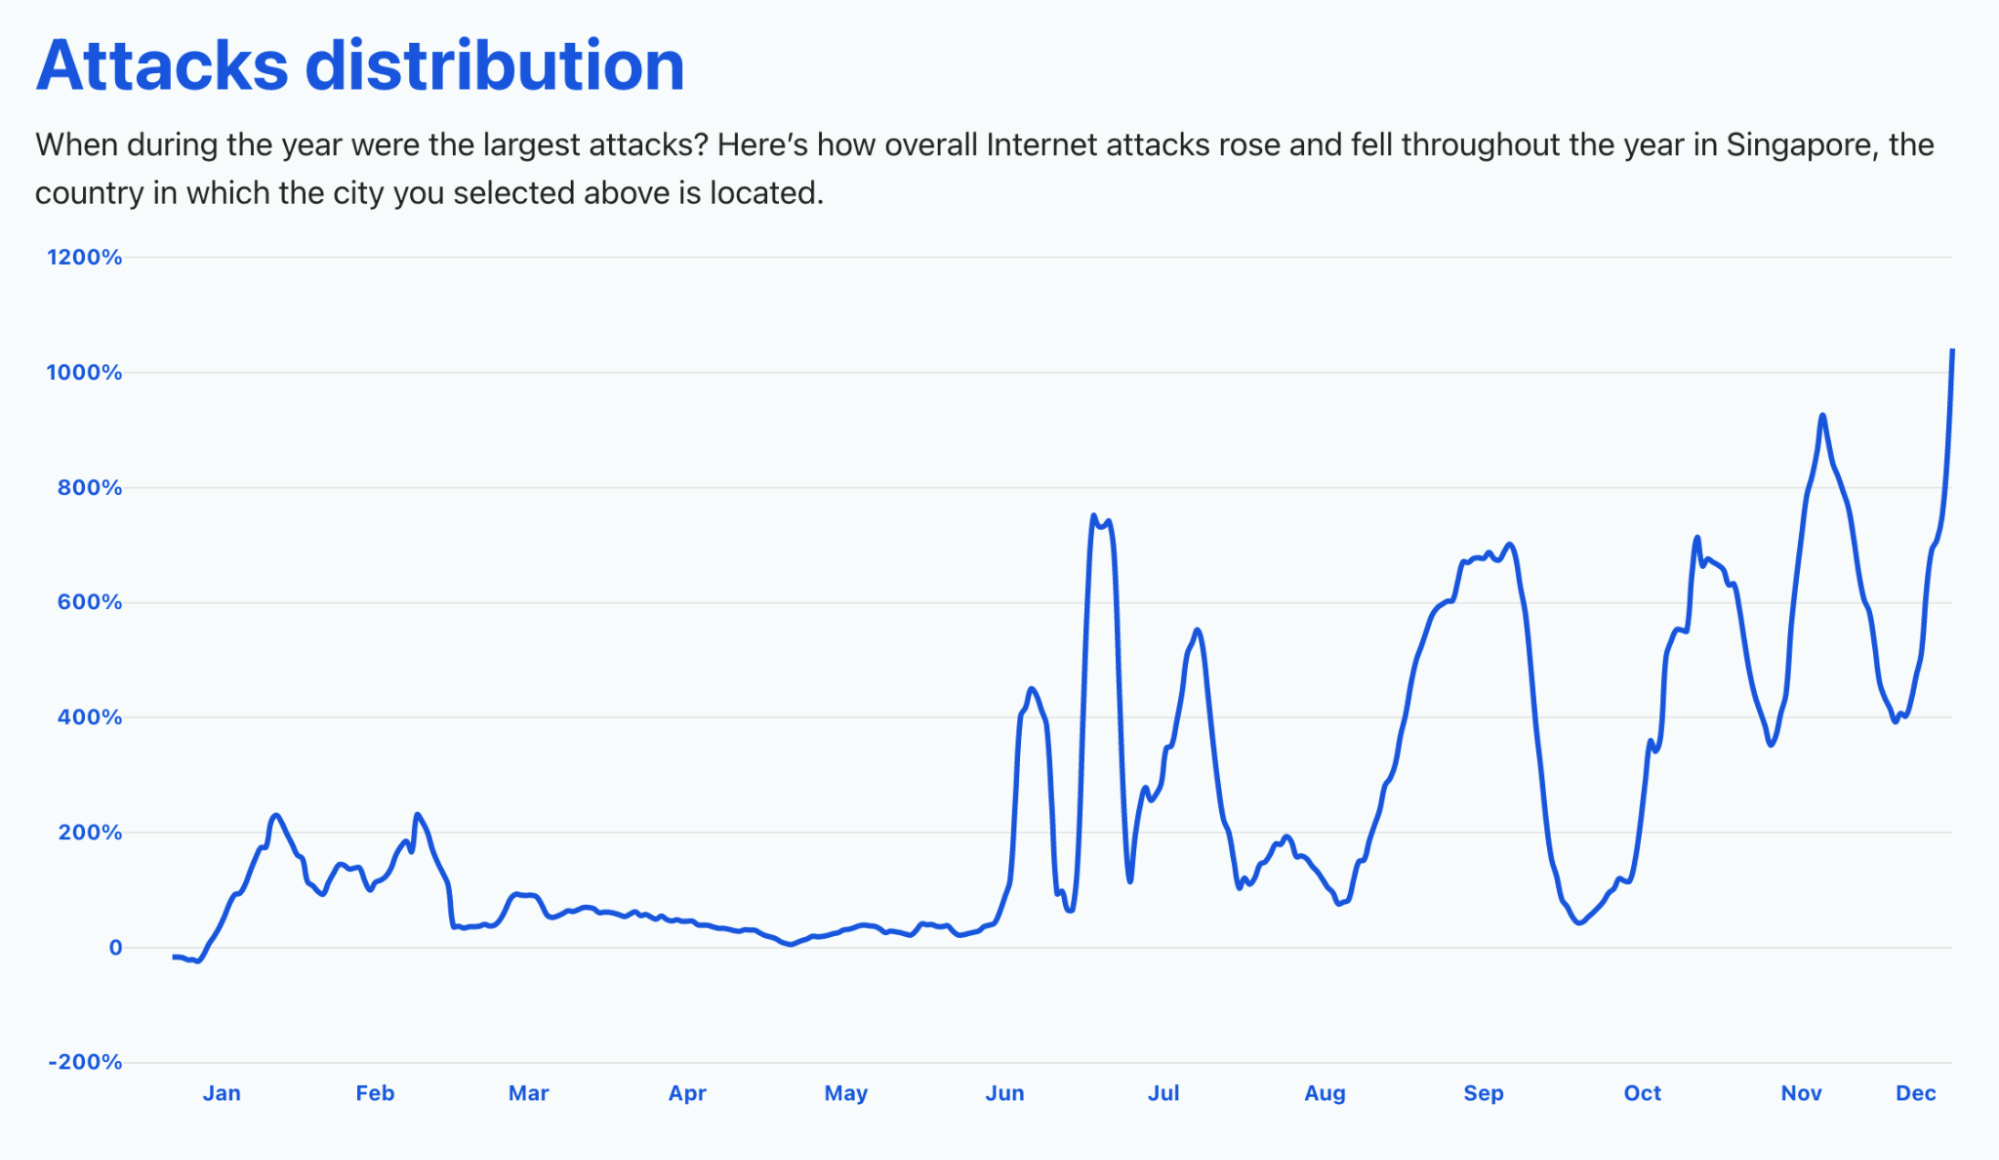
The same trend can be seen in Singapore, but with an even higher growth. It reached 1,000% more threats in late November and 900% in the same month, around the time of the famous Singles’ Day (11.11, on November 11), the main e-commerce event in the region.
Also in the region, Australia, for example, also saw a big increase (more than 100%) in attacks in the beginning of September. In Japan, it was more in late May (over 40% of growth in threats).
What people did online in 2021
Last year we saw how the e-commerce category jumped in several countries after the first major lockdown — late March.
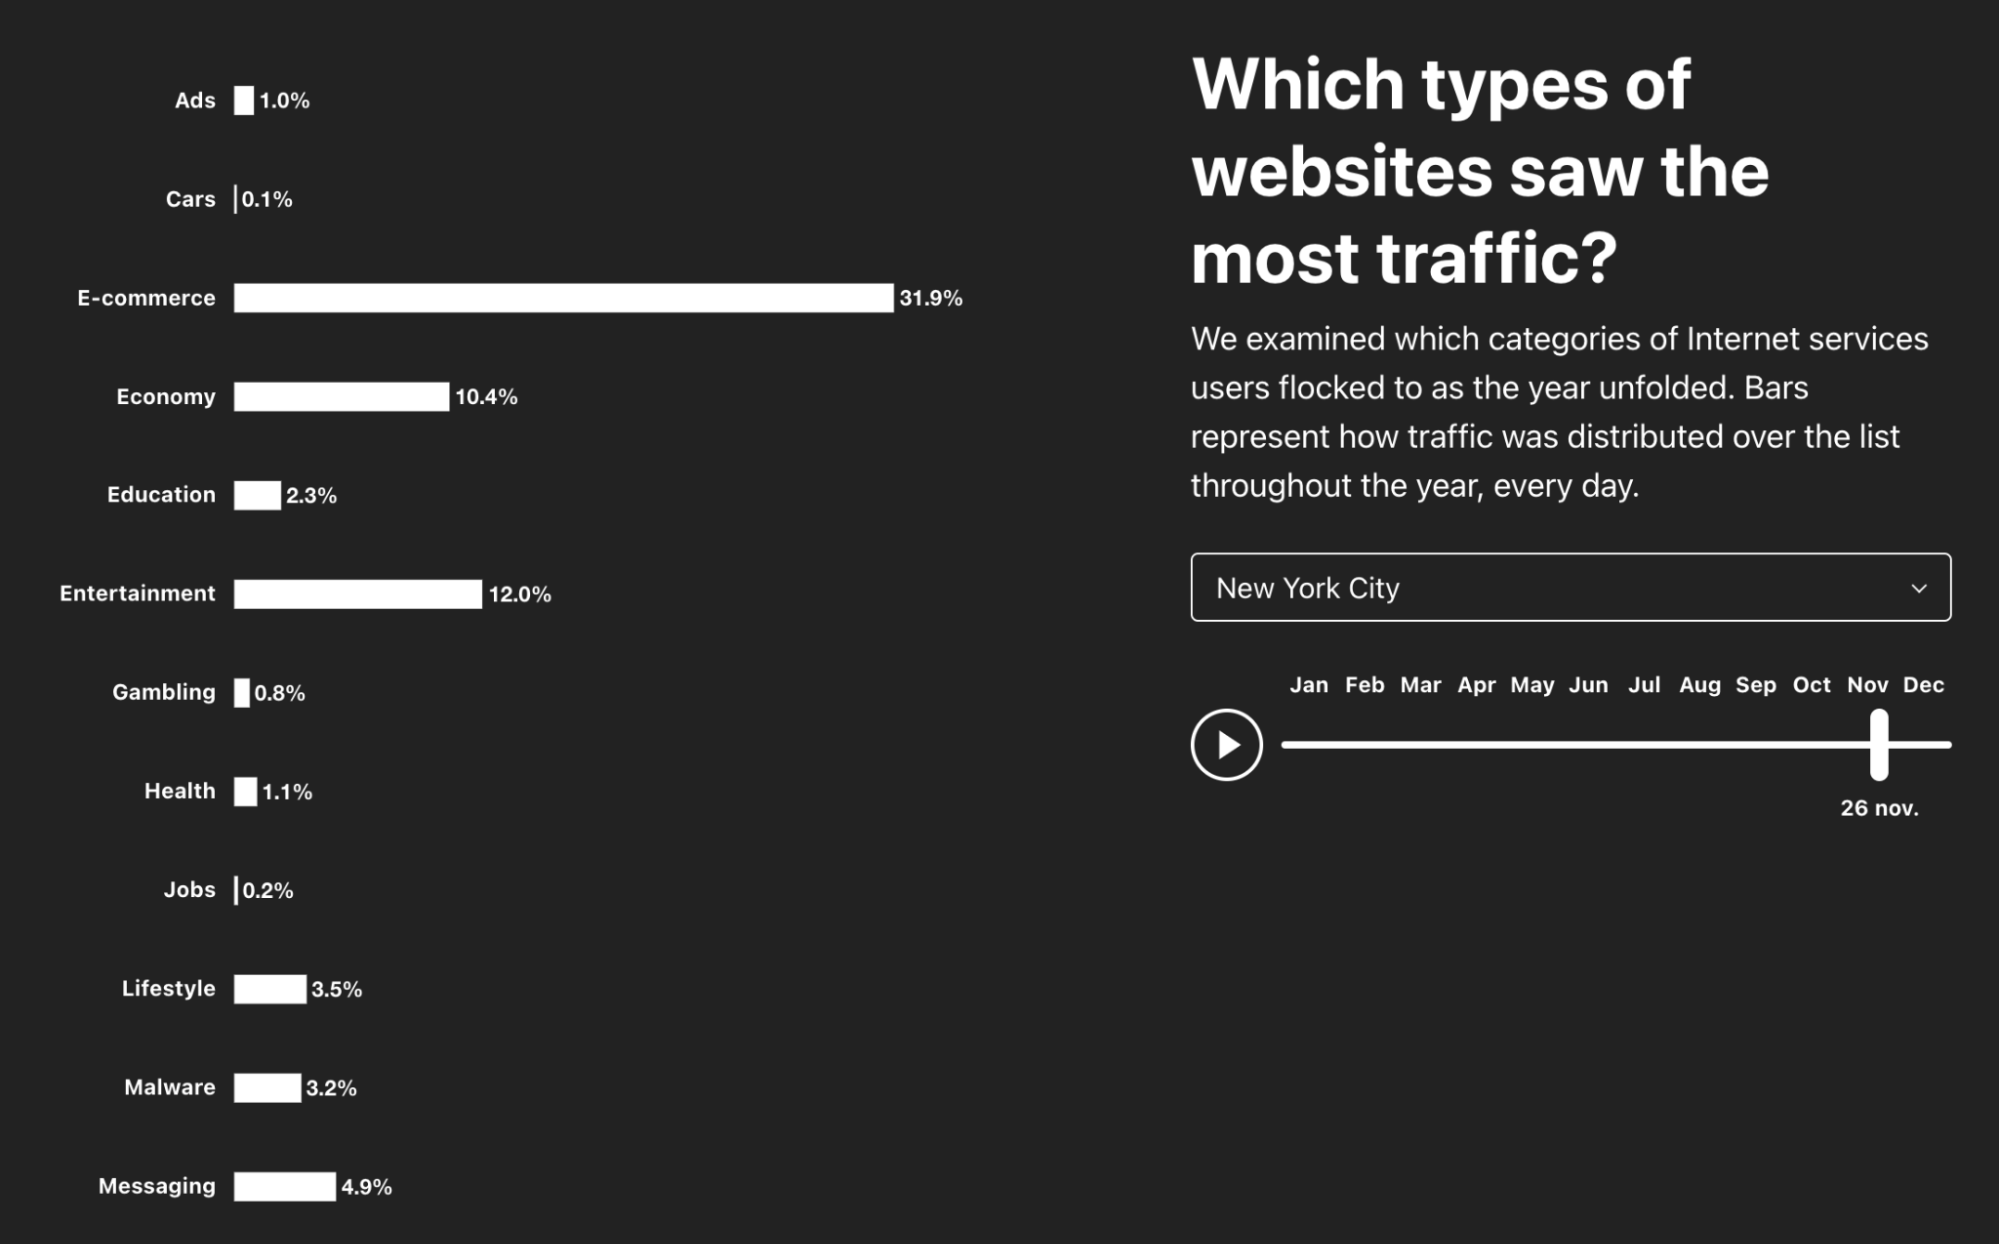
In New York, Black Friday, November 26, 2021, was the day of the whole year that e-commerce traffic peaked — it represented 31.9% of traffic, followed by Cyber Monday, November 29, with 26.6% (San Francisco has the same trend). It’s also interesting to see that in 2020 the same category peaked Black Friday, November 27, 2020 (24.3%) but April 22, during the first lockdowns, was a close second at 23.1% (this year the category only had ~14% in April).
Also with no surprise, messaging traffic peaked (20.6%) in the city that never sleeps on the first day of the year, January 1, 2021, to celebrate the New Year.
London calling (pre-Valentine messages)
But countries, cities and the people who live there have different patterns and in London messaging traffic actually peaks at 21.5% of traffic on Friday, February 12, 2021 (two days before Valentine’s Day). While in London, let’s check if Black Friday was also big outside the US. And the answer is: yes! E-commerce traffic peaked at 20.7% of traffic precisely on Black Friday, November 26.
The pandemic also has an influence in the types of websites people use and in London, travel websites had the biggest percentage in traffic on August 8, with only 1.4% — in Munich it was 1.1% on August 11. On the other hand, in New York and San Francisco, travel websites always had less than 1% of traffic.
Going back to Europe, Paris, France, saw a different trend. Travel websites had 1.9% of traffic on June 7, 2021, precisely the week that the pandemic restrictions were lifted — France opened to international travelers on June 9, 2021. The “City of Light” (and love) had its biggest day of the year for messaging websites (24.4%) on Sunday, January 31 — a time when there were new restrictions announced to try to avoid a total lockdown.
The hacker attack: 2021 methods
Our Year in Review site also lets you dig into which attack methods gained the most traction in 2021. It is a given that hackers continued to run their tools to attack websites, overwhelm APIs, and try to exfiltrate data — recently the Log4j vulnerability exposed the Internet to new possible exploitation.
Just to give some examples, in Paris “faking search engine bots” represented 48.3% of the attacks selected for the chart on January 14, 2021, but “SQL Injection” got to 59% on April 29.
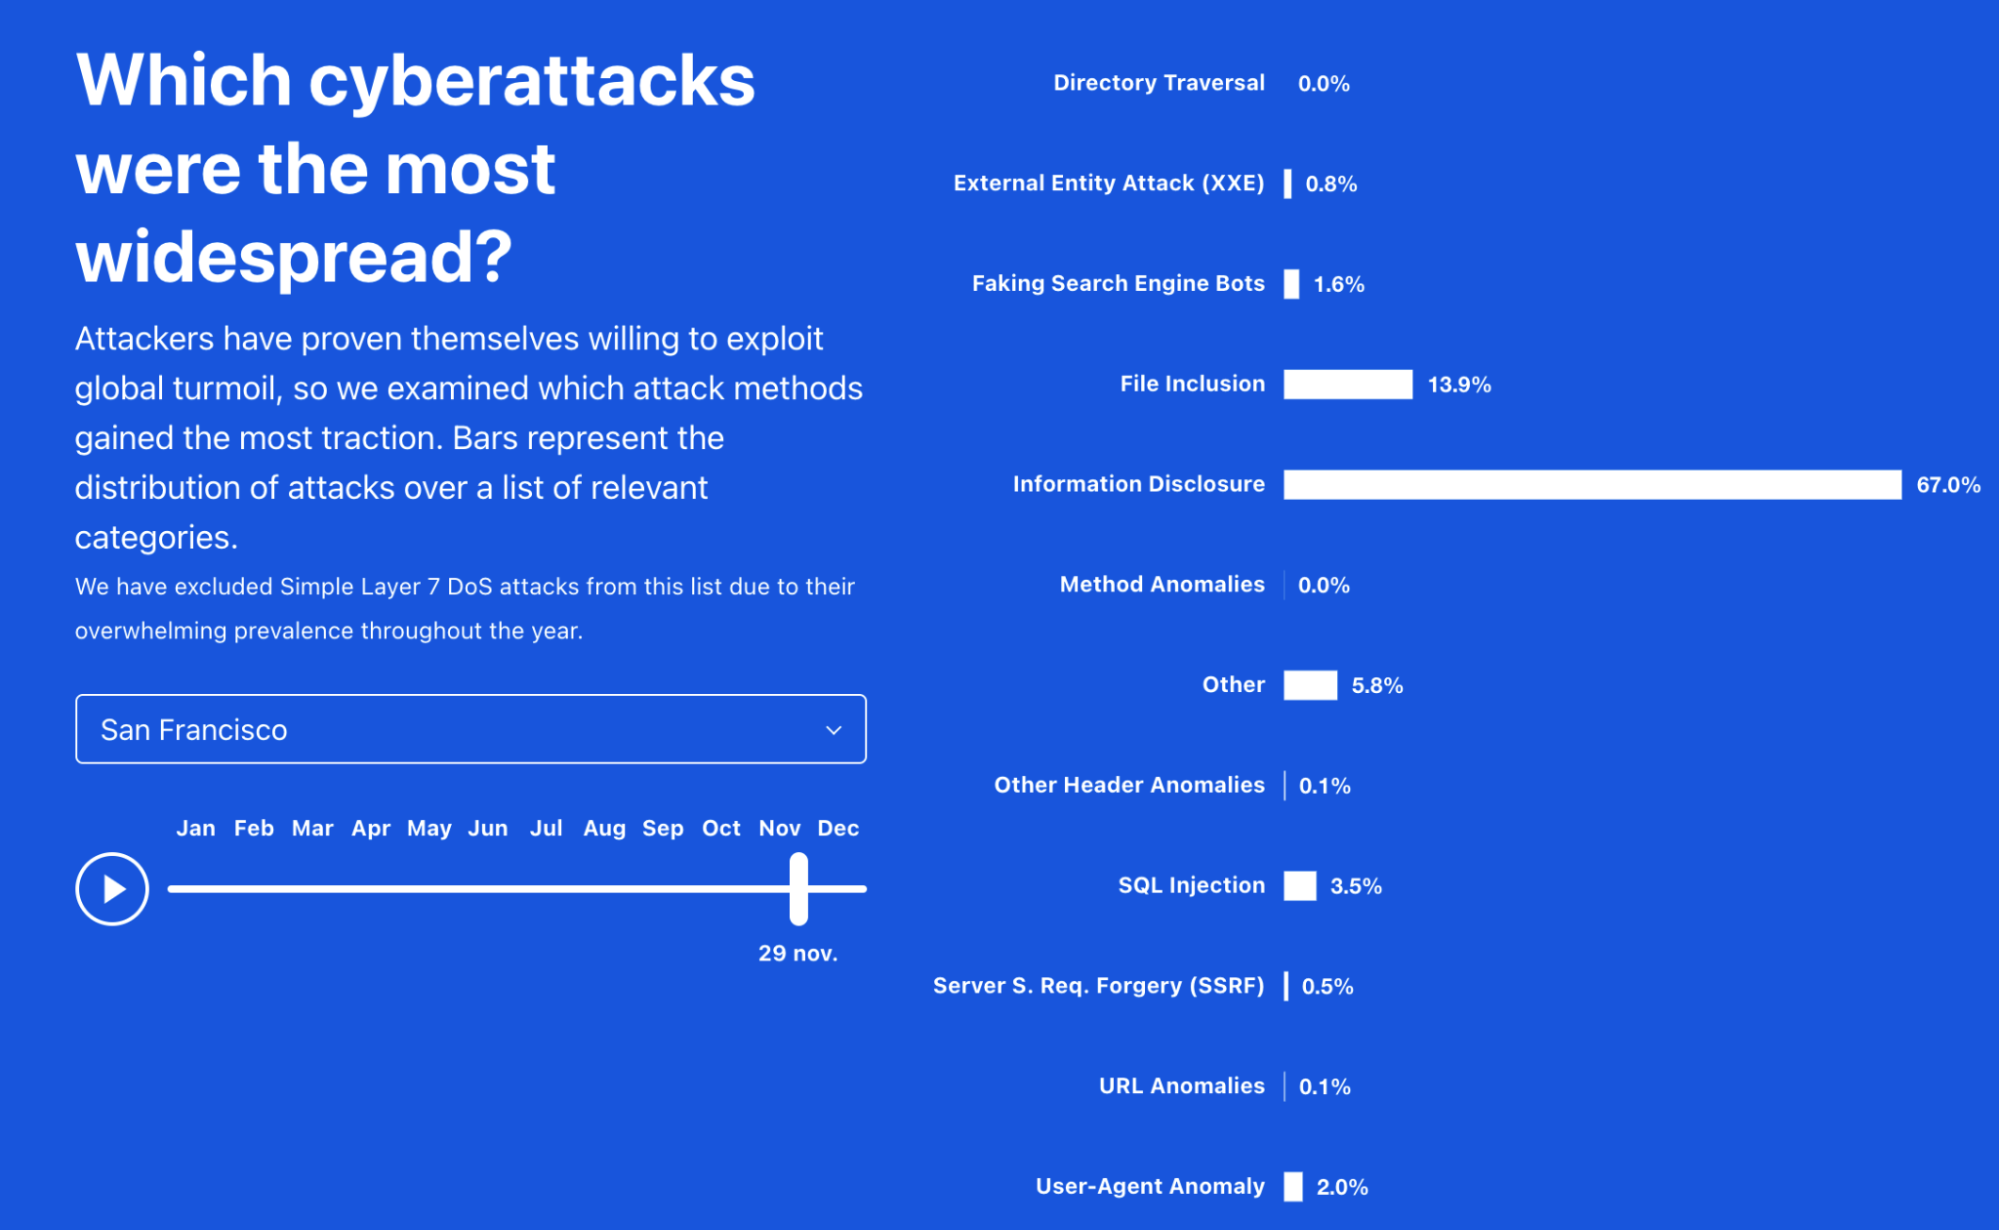
Cyberattacks distribution throughout the year in San Francisco
In London “User-Agent Anomaly” was also relevant in some parts of the year, but in San Francisco it was mostly “information disclosure” that was more prevalent, especially in late November, at a time when online shopping was booming — in December “file inclusion” vulnerability had a bigger percentage.
Now it’s your turn: explore more
To explore data for 2021 (but also 2020), you can check out Cloudflare Radar’s Year In Review page. To go deep into any specific country with up-to-date data about current trends, start at Cloudflare Radar’s homepage.
The years come and go, Internet traffic continues to grow (at least so far and with some ‘help’ from the pandemic), and Internet applications, be they websites, IoT devices or mobile apps, continue to evolve throughout the year, depending on if they attract human beings.
We’ll have a more broad Internet traffic-related Year in Review 2021 in the next few days (you can check the 2020 one here), but for now, let’s focus on the most popular domains this year according to our data on Cloudflare Radar and those domains’ changes in our popularity ranking. With Alexa.com going away, if you need a domain ranking, you can get it from Cloudflare.
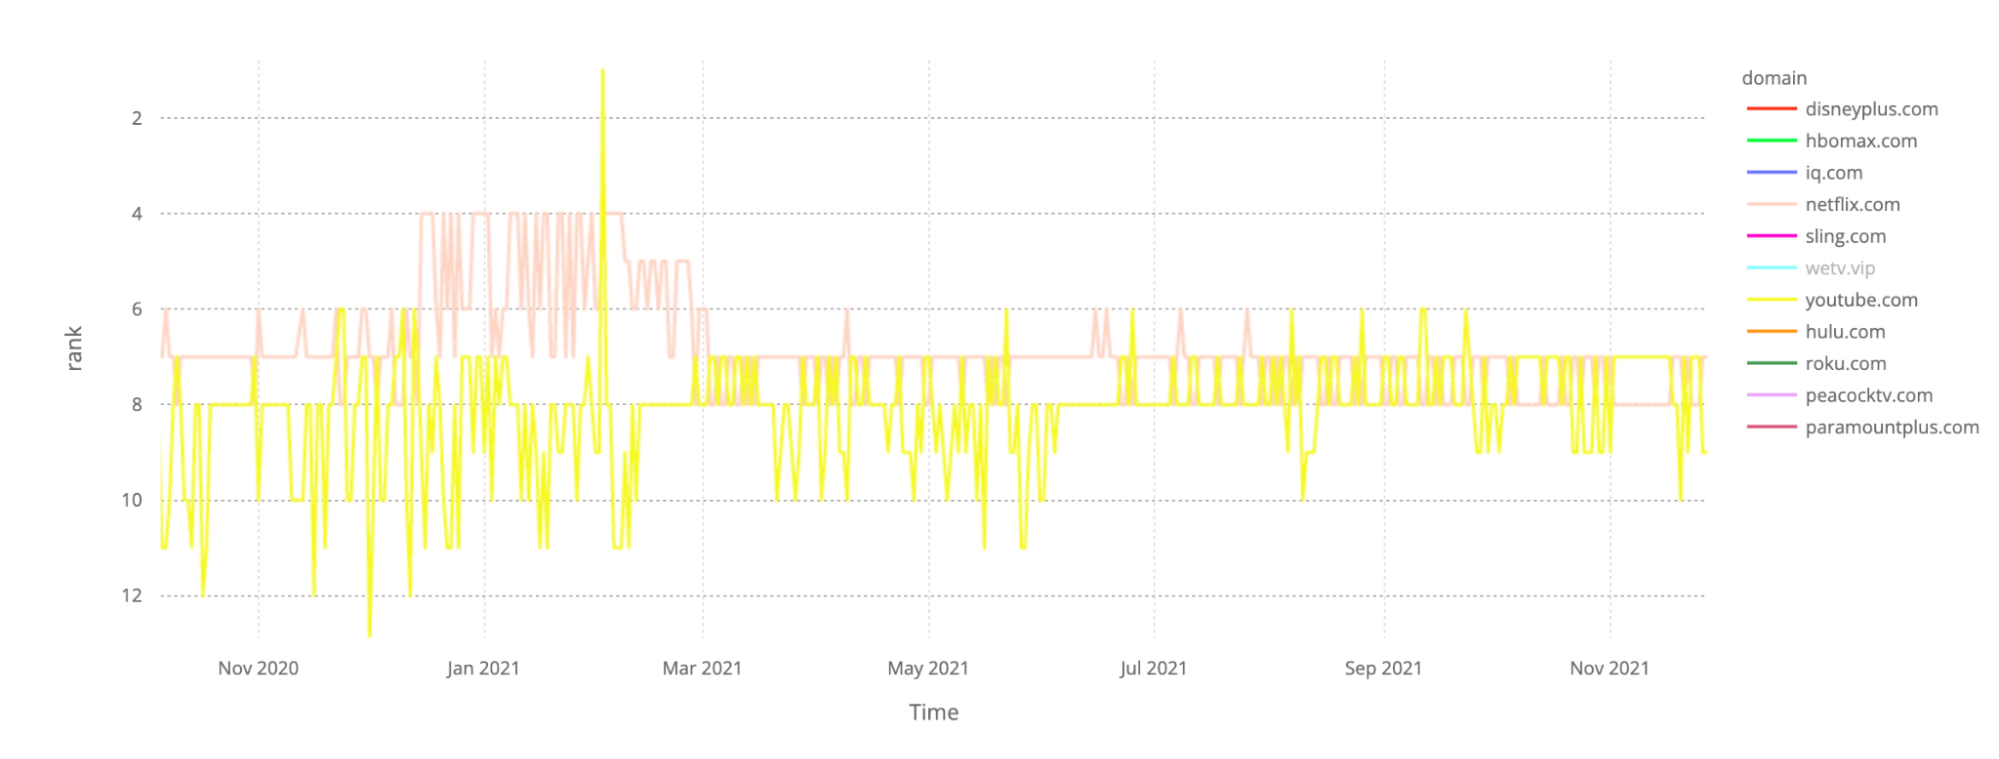
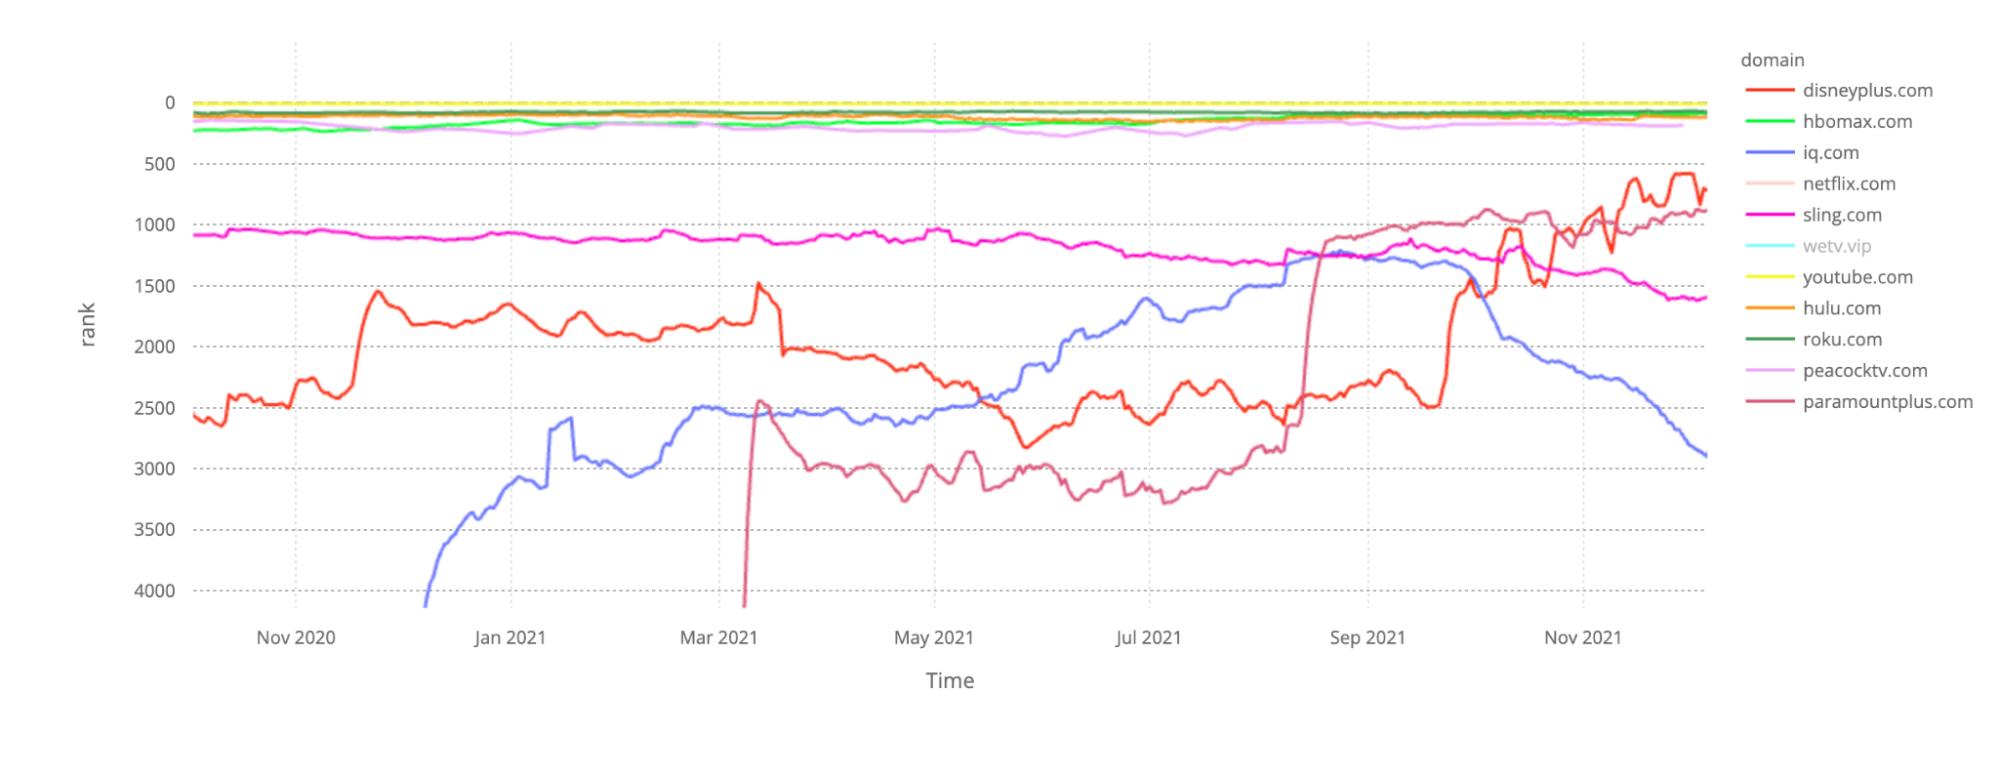
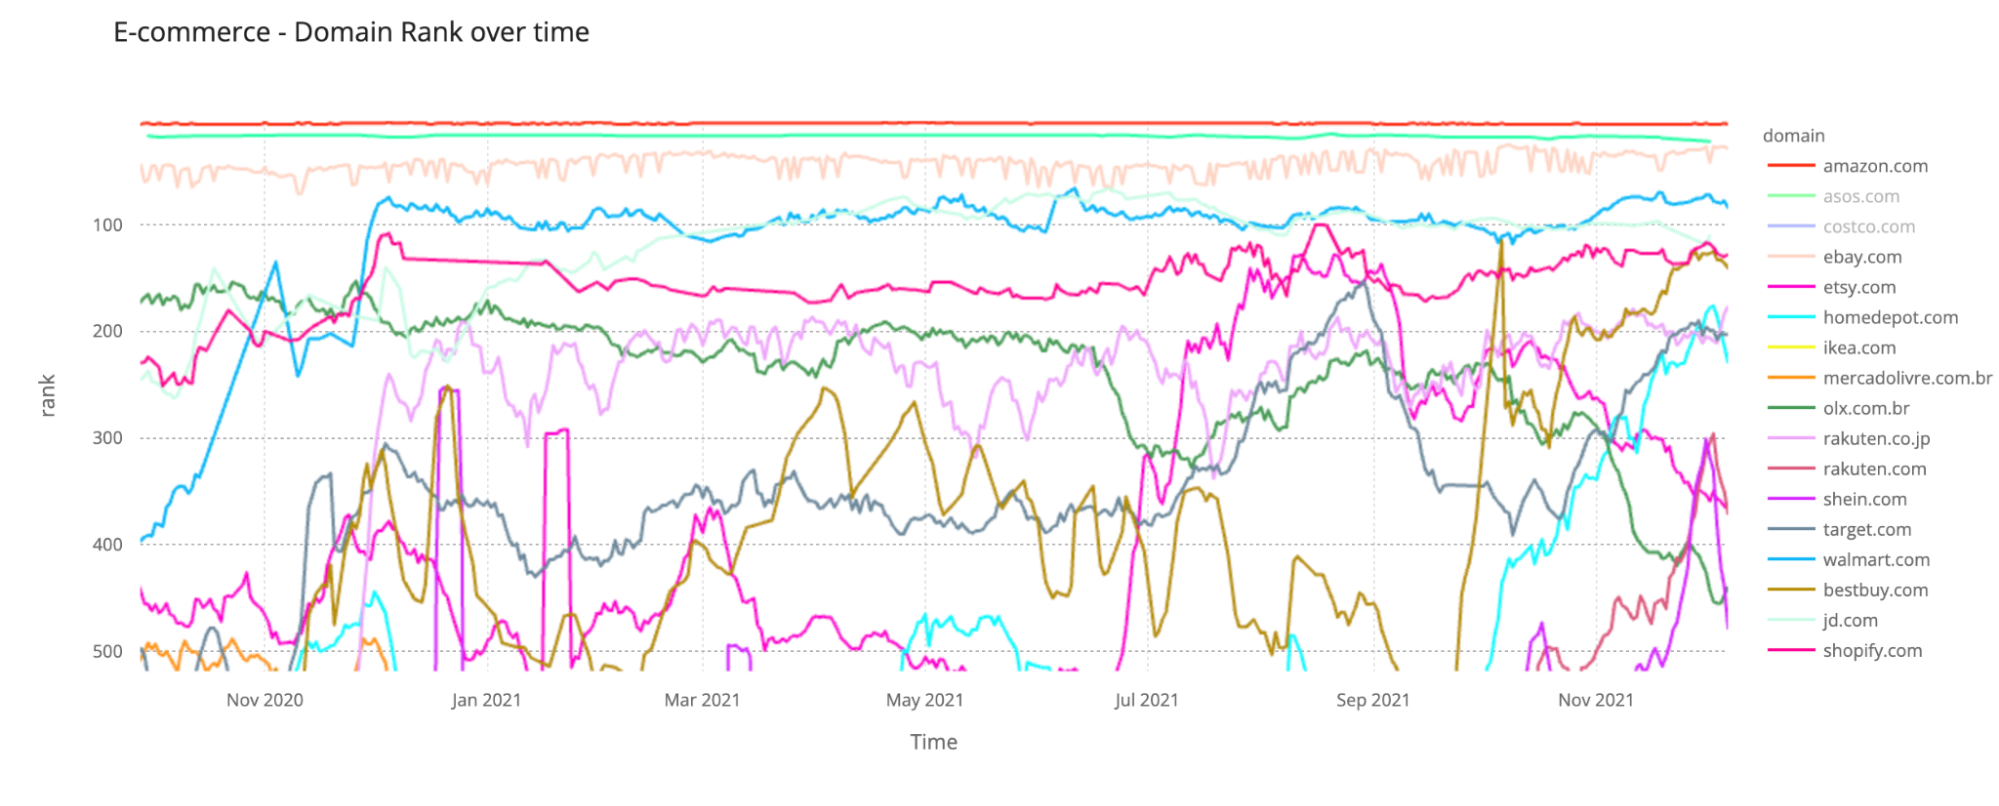
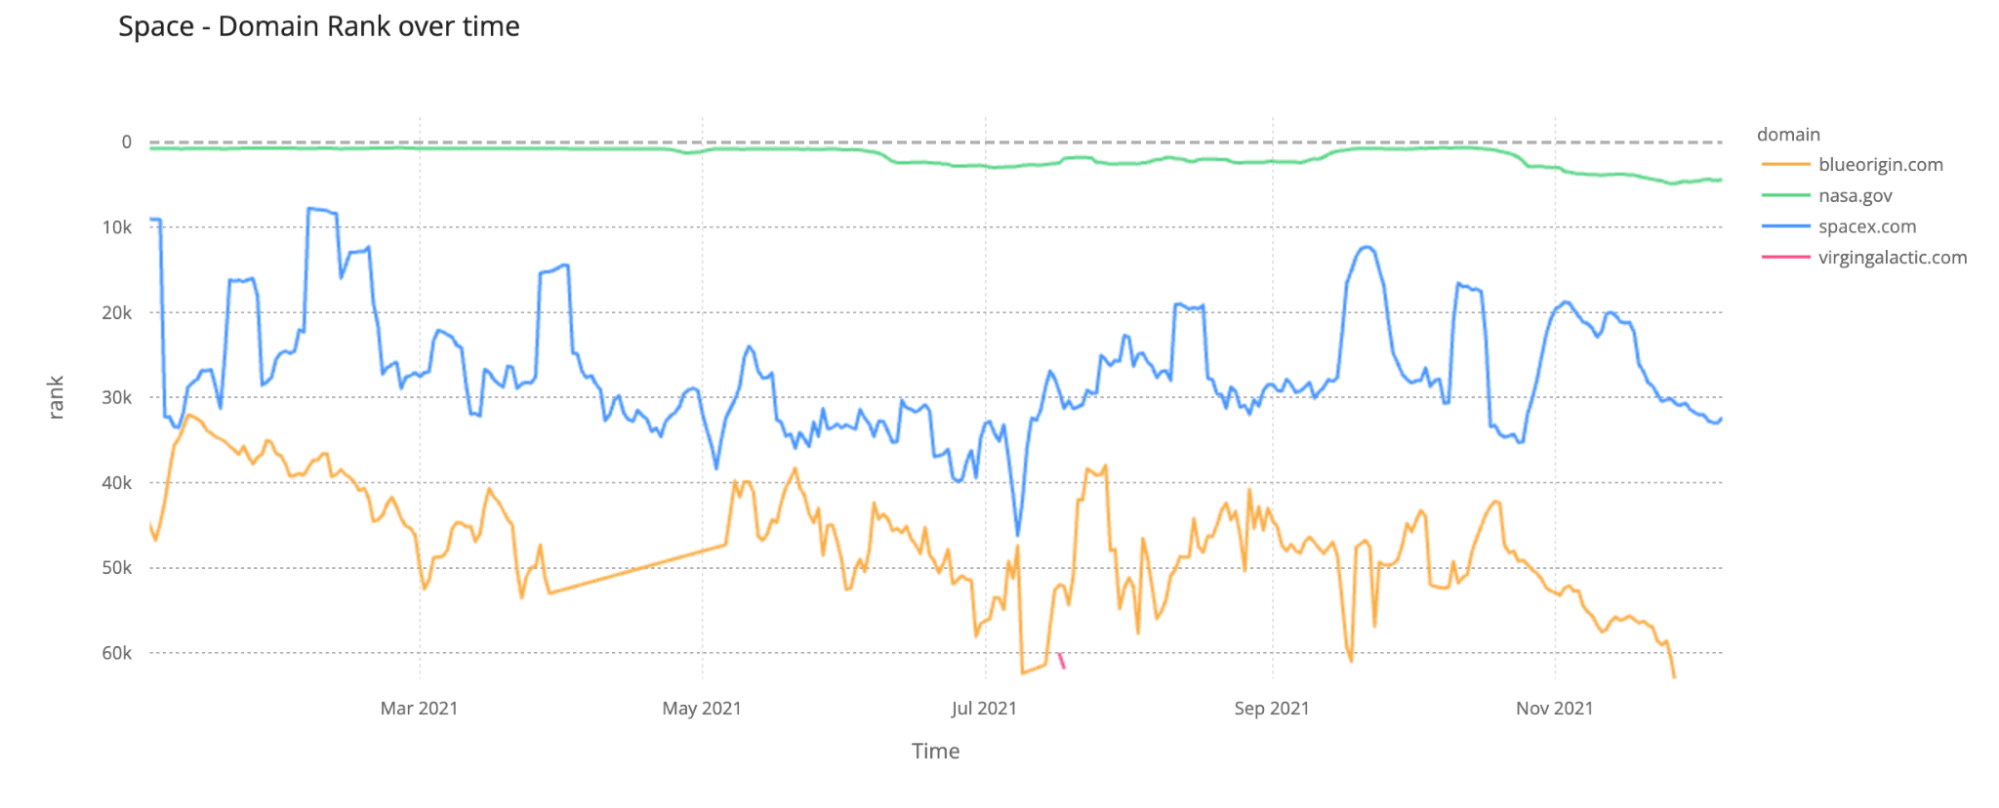
We’ll focus on space (NASA and SpaceX flew higher), e-commerce (Amazon and Taobao rule), and social media (TikTok ‘danced’ to take the crown from Facebook). We’ll also take a little ‘bite’ on video streaming wars. Netflix is a Squid Game of its own and January 2021 was at the highest in our ranking — probably lockdown and pandemic-related.
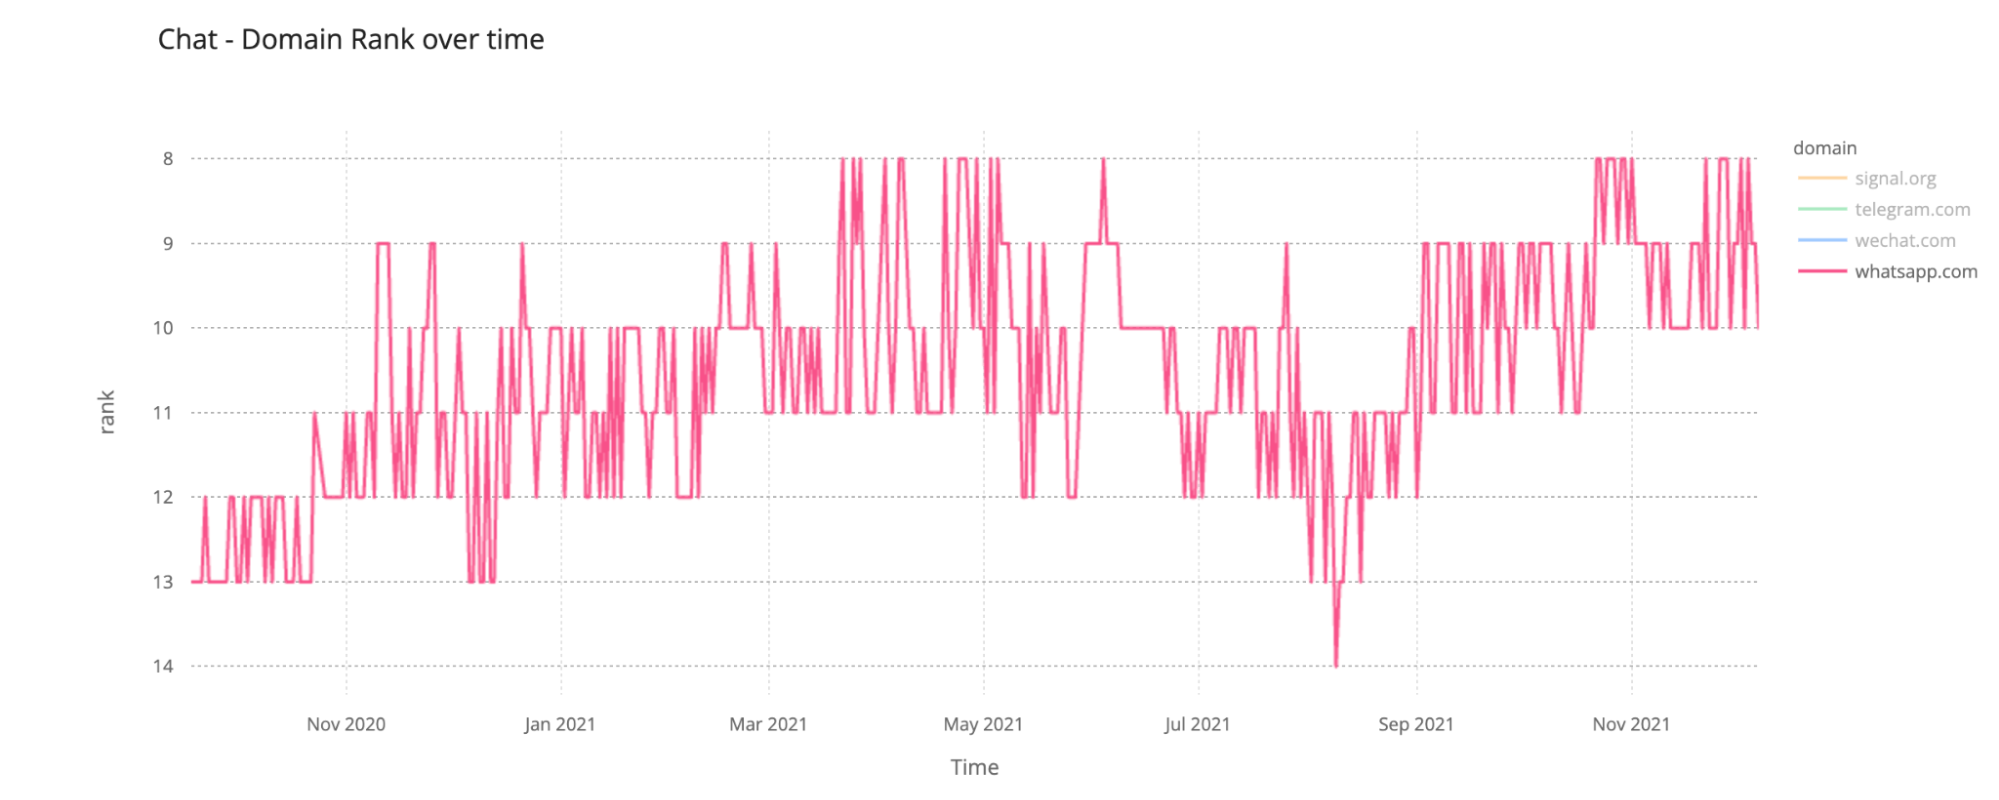
Chat domains (WhatsApp, what else) will also be present and, of course, the less established metaverse domains of sorts (Roblox took the lead from Fortnite late in the game). Come with us, let’s travel through 2021.
The following will show the way Cloudflare saw Internet traffic focusing on specific domains (some of which have many websites aggregated into them) and their highs and lows in our global popularity ranking.
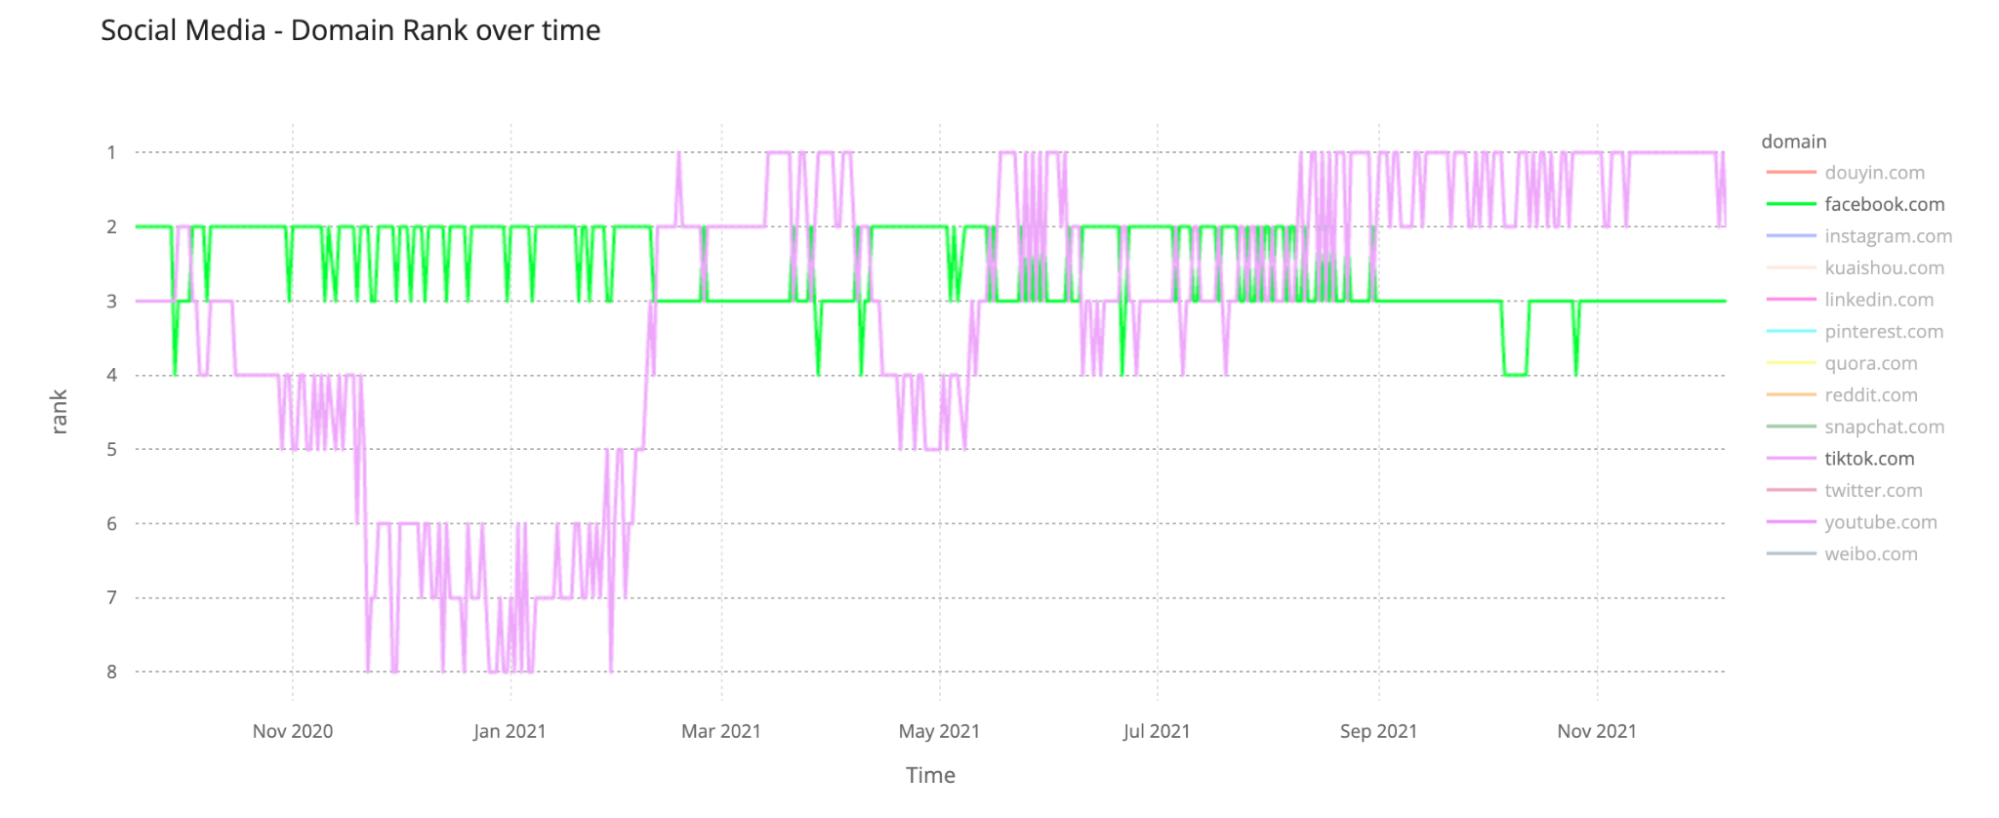
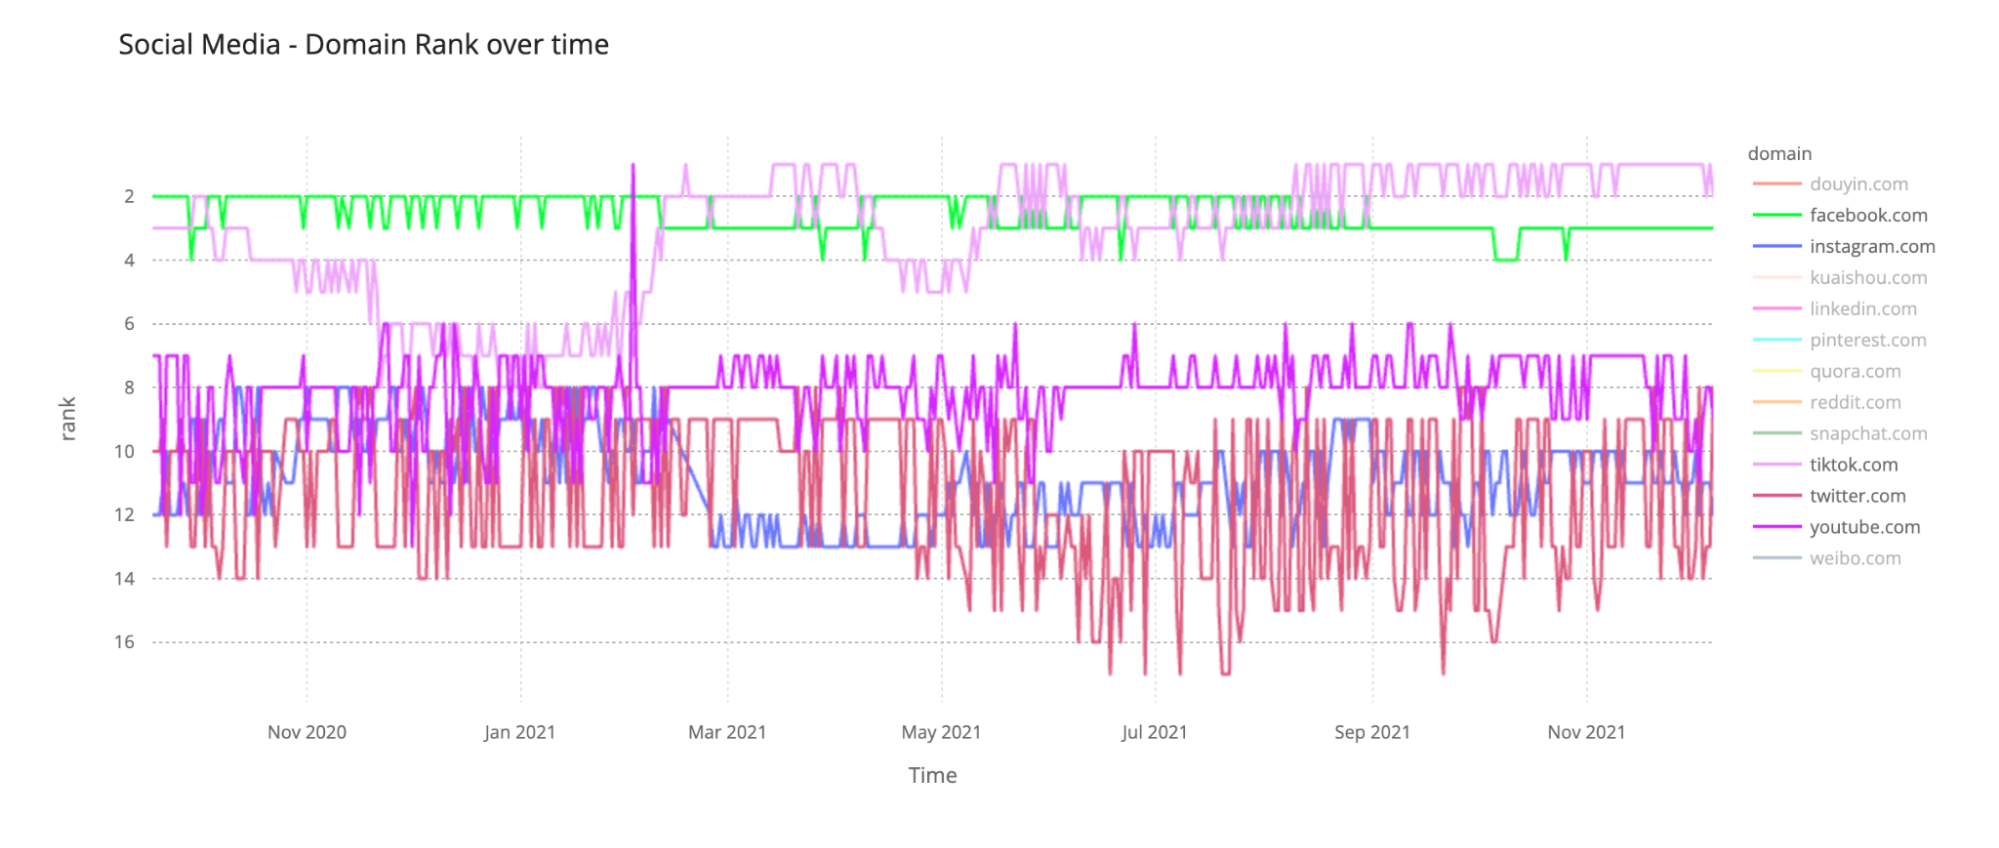
Top Sites: Google dethroned by the young ‘padawan’ TikTok
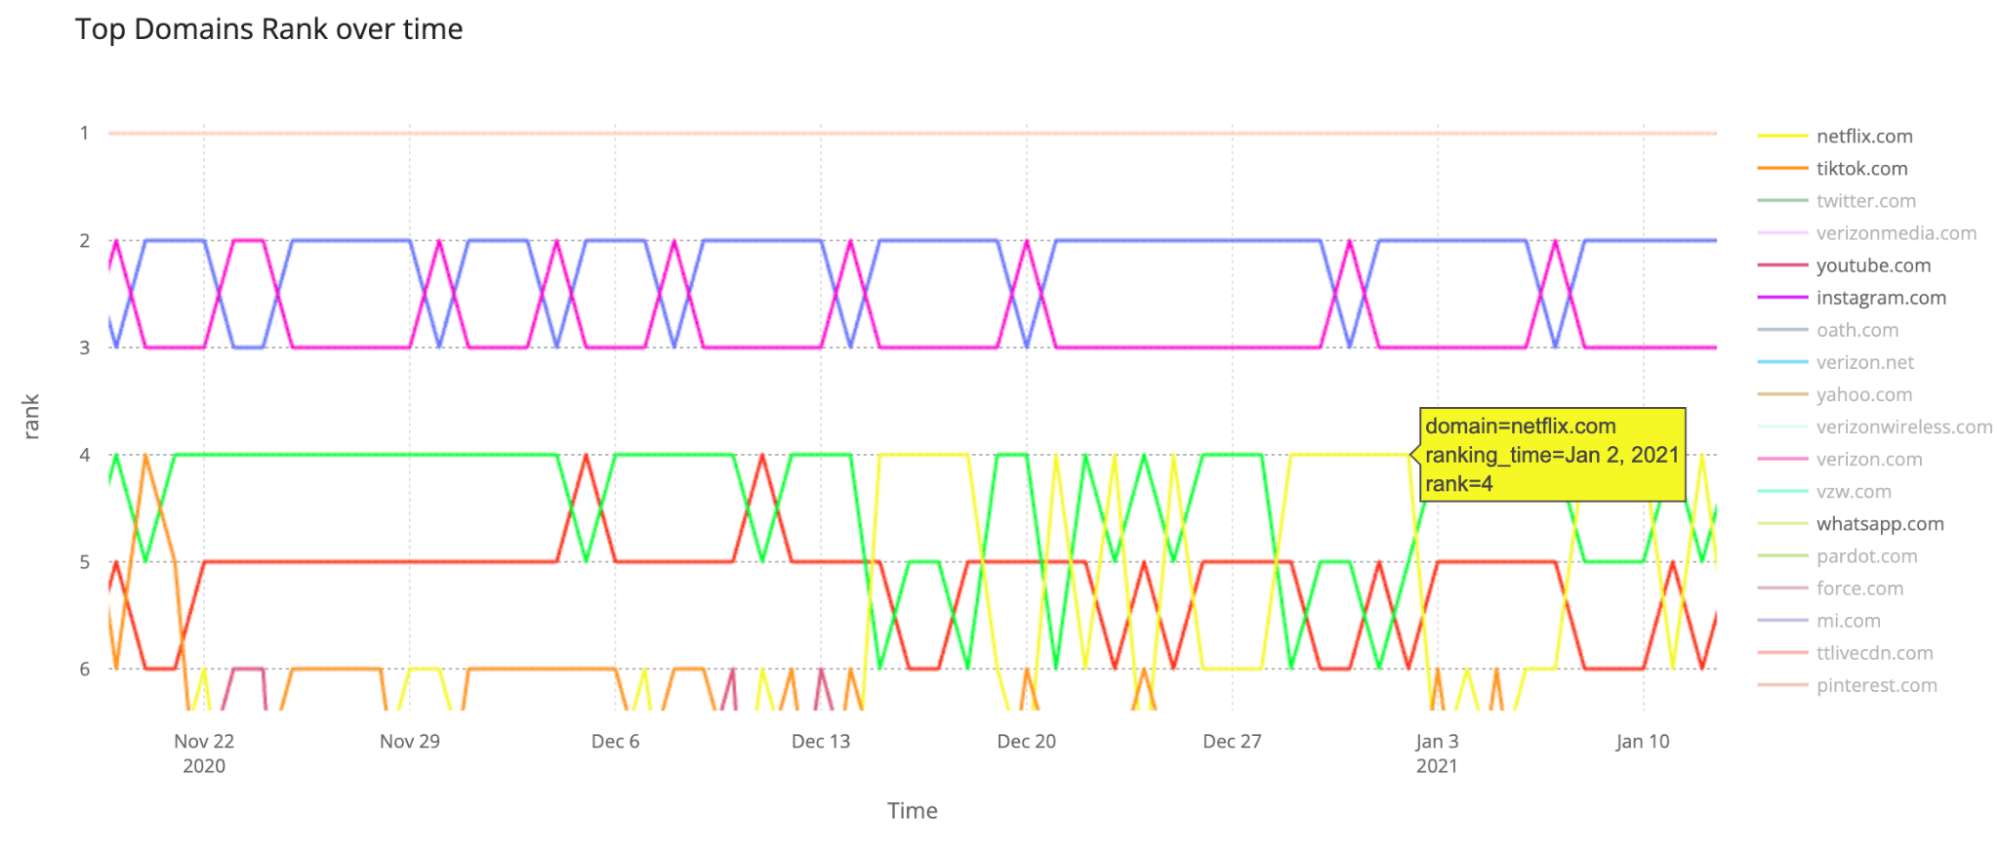
Let’s start with our Top Domains Ranking and 2021 brought us a very interesting duel for the Number 1 spot in our global ranking. Google.com (which includes Maps, Translate, Photos, Flights, Books, and News, among others) ended 2020 as the undefeated leader in our ranking — from September to December of last year it was always on top. Back then TikTok.com was only ranked #7 or #8.
Amazon was #5 in November, but Netflix surpassed in December 2020 (on some days it was higher than Apple, in #4); Instagram and Twitter were constantly changing positions throughout November and December.
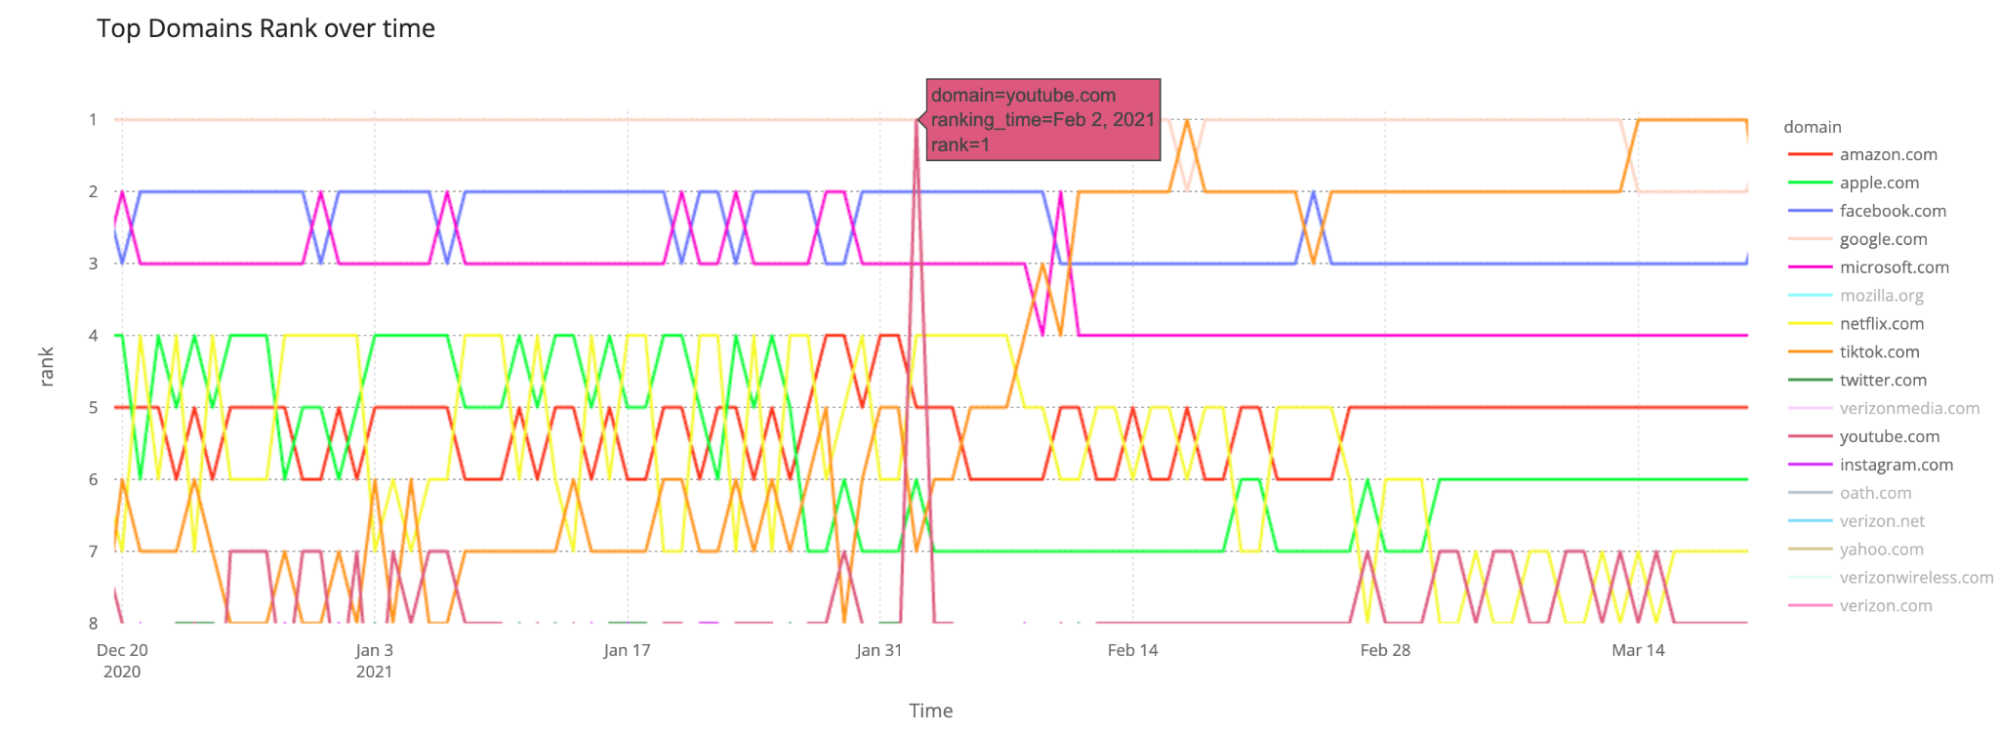
2021 told a different story. It was on February 17, 2021, that TikTok got the top spot for a day. Back in March, TikTok got a few more days and also in May, but it was after August 10, 2021, that TikTok took the lead on most days. There were some days when Google was #1, but October and November were mostly TikTok’s days, including on Thanksgiving (November 25) and Black Friday (November 26).
There are other trends we can see comparing both years — for 2020 we only show data of the end of the year, after September (Cloudflare Radar was launched that month). For example, Facebook.com was steadily number #2 across 2020, but with TikTok.com going up Facebook is now a solid #3, followed by Microsoft.com (Office365 and Teams numbers are included there) and by Apple.com (App Store and Apple TV+ numbers are included), the same trend as in 2020.
Amazon.com is the juggernaut that follows, but it is interesting to see that since January 2021 the e-commerce website (we will talk more about that category in a few paragraphs) jumped in front of Apple.com. But Apple got back in front, after September, with some exceptions like November 28, 2021, the day before Cyber Monday — and also December 1 and 6.
Christmas time, Netflix time
Netflix had a great 2020 Christmas but also January 2021, especially at the weekend
Another trend is that Netflix surpassed Amazon in December 2020, especially around Christmas week. On some days around 2020 Christmas, Netflix was even higher than Apple, in #4, that is the case with December 23, 25, and from December 29 to January 2, 2021.
February 2, 2021: The day YouTube (and an aerobics instructor) ruled the world
In our global popularity ranking we also saw another trend: YouTube, usually ranked #6 or #7, got to the top spot of our list on February 2, 2021 — and only on that day.
This fitness instructor video that happened while the Myanmar coup d’état was happening went viral on February 2, 2021, leading to the creation of thousands of memes
Why? One can only guess, but back then, although it was the week of the Super Bowl (some commercials, like the one from Doritos with Matthew McConaughey, were out on that day), there was another big newsworthy event: the Myanmar coup d’état on February 1, 2021. How can a coup in a Southeast Asian country have an impact on YouTube? A video of a fitness instructor who unwittingly filmed as the takeover unfolds behind her took the Internet by storm and became viral as the memes started to pour in.
That February day was also the one where Donald Trump announced his new legal team for the impeachment trial after the previous one quit, and Jeff Bezos announced he would step down as Amazon’s CEO. That was also the week prior to a record in YouTube’s history. On February 11, 2021, the video “Baby Shark Dance” from Korean education brand Pinkfong was the new most-viewed YouTube video of all time, surpassing the former record holder “Despacito” by Luis Fonsi.
Google Trends also shows that the week of February 2 was the one in 2021 that “YouTube” was more searched on Google.
Social media: There’s a new kid in town
In what was the second year of the pandemic, social media domains continued high on our ranking. The nine main social media applications were all in our top 100 list of most popular global domains — the only one out is Quora.com (during 2021 it was between #687 and #242).
We can see that TikTok (who also surpassed Google, as we explained before in the global #1 spot) took Facebook from its crown of the most popular social media website-domain in our ranking. So, that should mean that TikTok got more Internet traffic from our standpoint (our ranking is derived from our public DNS resolver 1.1.1.1 and so it’s not related to the number of unique users or visitors it gets per month) — Facebook is, by far, the platform with more users worldwide).
Top 10 — Most popular social media domains (late) 2021
The Facebook outage — that we explained from our standpoint extensively — on October 4, 2021, also had an impact on Facebook’s position in our ranking, leading to Facebook.com losing its #3 position (it was #4) for seven days in a row in that week. This number of days in #4 was something that never happened before (since September 2020) to the social media giant.
Looking to the top 10 list, it’s also clear that, just looking to social media domains, YouTube comes third and Twitter got a bump up and beat Instagram in 2021, getting the #5 place (barely, in what was a very close race). Back in late 2020 Twitter was behind Instagram in our ranking.
LinkedIn is the ninth most popular social media domain in our ranking and is still in our top 100 and throughout 2021 it got higher in our list, especially in February and March. The social media for professionals then started to drop in June and July (in the Northern Hemisphere’s summer), starting in late August to climb again and by November it reached the #52 place, the highest of the year in our global ranking — in January it was ~#78. In a year when terms like The Great Resignation and the reset of people and organizations’ mindsets were talked about, it makes sense to see this social media platform growing.
Streaming: The (Squid) Netflix Game rules
The so-called video streaming wars got another important round in 2021 with new players appearing and old ones having amazing numbers — not only in subscribers, revenue, and content budgets but also in… Internet traffic. In our ranking, Netflix is still the undefeated hero.
We added YouTube.com (its most important service is free) to the list to compare with the big numbers from Netflix, and still, the Squid Game phenomenon platform won our ranking for most of the year. Amazon Prime is not included because the streaming service mainly uses Amazon.com (ranked #5 or #6 most of the year) as a domain.
The days of the year when Netflix was more popular? January was a great month with Netflix reaching the #4 spot in our global ranking in the first two days of the year (and also all the weekends of January, Fridays included), going through February in the #5 place. For the rest of 2021, the platform was mostly #7. Yes, on the weekends Netflix seems to have a better performance in our ranking.
Roku.com seems to be the next video streaming platform after those two traffic giants, getting around the #80 position in our ranking through 2021. In late 2020 Hulu.com was the next one, but HBOMax.com surpassed Hulu in July 2021 and entered our top 100 list. In 2021, Disneyplus.com also rose in our ranking and surpassed the app-based TV service Sling.com later in the year. Our top 10 chart also includes Iq.com (iQiyi), the Chinese online video platform.
Top 10 — Most popular video streaming domains (late) 2021
In the chart Netflix.com, more dominant in most days, is in pink and YouTube.com is in yellowNetflix and YouTube, but also Roku, HBOMax, Hulu.com and Peacocktv are a lot higher in our list than the others — Disney+ is getting there
E-commerce: Podium to Amazon, Taobao and eBay
Since the pandemic started e-commerce has continued to strive and grow at an even faster pace than before. The top four e-commerce domains (Amazon, Taobao, eBay and Walmart) in our global ranking are all in the top 100 and that happens steadily throughout the year.
The fifth in the e-commerce list, the Chinese giant Jd.com had a few periods that it also entered the top 100 mainly in May and especially June — on the day of the 618 shopping event, on June 18, 2021, it reached #68 on our list, beating Walmart.com and almost catching Ebay.com.
In the following list it is easy to see that Jd.com surpassed Shopify.com in 2021, occupying the #5 place, and also Bestbuy.com and Target.com rose from one year to another.
Top 10 — Most popular e-commerce domains (late) 2021
Shein.com went ahead of Bestbuy.com and Target.com from December 19 to 24, 2020*
Here are other trends:
Amazon.com is a domain, as we already explained, with more than e-commerce services (that’s why globally it ranks between #4 and #6). In 2021, it had some good days in January and in late April 2021, reaching #4, but by the end of the year it got its best days in our ranking, especially on the day before Cyber Monday, November 28, and on December 1 and 6 — it reached #5.
Taobao.com had its best day of the year in our global ranking on August 20 — #15 — and by the popular Chinese shopping day, Singles’ Day, November 11, it was #17.
Ebay.com had a solid year and a good late August (#29 on August 31) and grew more after Cyber Monday, peaking on December 1, reaching #27.
Shopify had a great August (reaching #100 on August 18), the same with Etsy.com that peaked at #128 on August 21. Walmart had a great June (#66) and also end of November (it reached #70).
Ikea.com had a big increase in importance throughout the year and got very near to Homedepot.com’s position in September (peaked in the #695 position in our global ranking), staying up through November.
Best Buy peaked on October 6 and had a high growth throughout November, also matching Shopify in December.
When we look to Shein.com we see that it peaked last Christmas and is on the rise since November 2021
Shein.com, the global Chinese online fast-fashion retailer, went high in our ranking for the Christmas of 2020 — it went ahead of Bestbuy.com and Target.com from December 19 to 24, 2020, reaching the #253 position. In March, it had another peak, and it got the best position in 2021 in our ranking after Cyber Monday — it reached #301 on December 1, 2021.
2021: A Space Odyssey (for NASA, SpaceX, Blue Origin and Virgin Galactic)
This year was also a big year for space travel with several achievements. Spacecraft from three Mars exploration programs from the United Arab Emirates, China, and the United States arrived at Mars in February — NASA’s Perseverance rover landed on February 18, 2021, and after that the Ingenuity drone made history, being the first powered aircraft flight on another planet in human history. And there is also another big space event just around the corner — the James Webb Telescope launch.
Virgin Galactic (July 11), Blue Origin (July 20) and SpaceX (September 16 — but with several other events before that regarding satellites and reuse of space capsules) also stormed the Internet with space tourism achievements with different scopes. Only SpaceX offered an orbital ride.
In terms of domains, NASA.gov was way ahead of the others, but Elon Musk’s SpaceX.com was definitely second in our global ranking, followed by Blueorigin.com. Virgingalactic.com only appears once in our top 100k ranking on July 17 and 18 (a few days after Richard Branson’s spaceflight).
Since last year NASA is high on our global ranking, in the top 1,000 domains of our list, but after the rover Perseverance landed on Mars on February 18 NASA.gov entered our top 700 ranking — the highest day of that month was February 25, when it reached #657. In the summer it went down in our ranking, but it picked up in late September and on October 13, 2021, reached the highest position of the year (#637). That was the day the press conference about NASA’s Lucy mission, the agency’s first to Jupiter’s Trojan asteroids, took place (the launch was on October 16).
SpaceX.com had a great start of February, it entered our top 8,000, a month with a launch of 60 new Starlink internet satellites into orbit amidst a missed rocket landing and a fresh $850 million of new investment. And then it was after September 16, 2021, with the first orbital launch of an all-private crew, Inspiration4, that it flew again in our ranking.
For Blue Origin, after a strong start of the year — it reached our #32,000 on January 10 (a few days before New Shepard 4’s first test flight) — it went up between July 20- 27 after its first crewed flight, with Jeff Bezos onboard. It also went up in our ranking a few days after October 13, 2021 (the day William Shatner flew aboard a Blue Origin suborbital capsule).
Messaging or chat: WhatsApp, what else?
There aren’t as many messaging or chat platforms as there are popular social media sites, video streaming, or e-commerce platforms. So, this ranking is slim, and even slimmer because Messenger (uses Facebook.com) or iMessage (uses Apple.com) aren’t included. Snapchat is both a social media platform and a messaging app — the same with Instagram — and we added them in the social media ranking. If they were here they would be higher than WeChat but behind WhatsApp — Instagram actually started 2021 (it got to #8) in front of WhatsApp until February and went as low as #13 and Snapchat went between #29 to #16.
From our standpoint, WhatsApp is the undisputed leader of the messaging apps ranging from as low as #13 in our global ranking to as high as #8. Its best parts of the year were late March, late April, late October and then late November going through December 2021 as #8 in our ranking.
How Signal skyrocketed in January (and WeChat in February)
All the others are far away in our ranking, but 2021 brought three trends we should highlight:
Signal.org had an incredible month of January — on January 3 it was in #1815 in our ranking and by January 20 it rose to #766, a climb in more than 1,000 positions in just 17 days. Why? WhatsApp’s new privacy policy was in the headlines in the second week of January.
WeChat.com also had an amazing jump in our ranking, but more in February and by April it surpassed Signal.org — it went from #3142 at the start of February to #979 by April 25 and by October both of the messaging apps were almost tied at ~#370 and had a significantly higher place in our ranking than in late 2020.
Telegram.com on the other hand had a decrease in ranking throughout the year and ended up in the top 38,000.
“You can’t just materialize anywhere in the Metaverse, like Captain Kirk beaming down from on high. This would be confusing and irritating to the people around you. It would break the metaphor. Materializing out of nowhere (or vanishing back into Reality) is considered to be a private function best done in the confines of your own House.“ ― Neal Stephenson, Snow Crash (1992)
Metaverse: Don’t mess with Roblox
Back in November, we heard in the halls of Web Summit — the 42,000 in-person tech global event in Lisbon — that in a way the metaverse is already here (Roblox’s Global Head of Music had some thoughts on virtual concerts). But we’re still far from the promise of almost living in the virtual world that books like Neal Stephenson’s Snow Crash or Ernest Cline’s Ready Player One showed us.
Oculus shipped a lot of headsets and there are immersive experiences out there that are Metaverse-like (a step further than the now-usual-for-most spending all day working, learning, communicating through a screen) and we focused on that ones, like Fortnite, Roblox, Second Life (the oldest, from 2003), Minecraft and Oculus. But Oculus.com doesn’t have enough direct traffic (playing games using Oculus headset could direct the traffic elsewhere) to be in our top 100k domains ranking, and the same happens with Minecraft.
Oculus.com and Minecraft.net are not in our 100,000 ranking
The (short) list from 2020 and 2021 shows us that Roblox.com surpassed Epicgames.com (the home of the popular Fortnite) for the first time in July reaching back then #27 in our list. But it was after late September that it was consistently in front of the rival game platform, ending the year on a good note reaching #20 in our ranking.
Epicgames.com (Fortnite) started the year a lot better, reaching #14 on January 5, 2021, but it started to lose importance in February and that deepened after May, but mostly in July and August. It never truly recovered and ended the year between #26 and #47, depending on the day.
Conclusion: Human (online) trends
The Internet is not a quiet place, the same way humans on Earth (especially during a pandemic) aren’t quiet or passive but active and reactive. Although on the top of our domain ranking there don’t seem to be drastic ups and downs throughout the year (TikTok, and YouTube, were the exceptions), we saw how an event like the Myanmar coup and the subsequent viral video may have brought YouTube to #1 on our ranking. We also saw how e-commerce was affected throughout the year, how space-related websites had a big (online) year with important events, and how Netflix rose around Christmas time.
And remember: you can keep an eye on Cloudflare Radar to monitor how we see Internet traffic globally and in every country.
November comes, the temperatures start to get colder for most of the planet’s population (87% live in the Northern Hemisphere) and many are also starting to prepare for the festive season. That also brings significant changes in Internet traffic, most notably the online shopping kind of traffic.
So, what were the November days that e-commerce websites had the most traffic in the US and what about worldwide? Is humanity using more mobile Internet at this time? And what are the most popular days online — is Black Friday the winner?
Let’s start with e-commerce — we added a chart to Radar that shows trends for e-commerce by country. The worldwide trend is pretty evident: Cyber Monday, the day for supposedly last-minute discounts, was the clear winner.
Worldwide most popular days for e-commerce
#1. Cyber Monday, November 29.
#2. Monday, November 23.
#3. Black Friday, November 26 — November 24 is pretty close to Black Friday. All in all a very good week in terms of e-commerce traffic.
US: November e-commerce traffic ‘rain’
When we focus on the United States, the country that instituted Black Friday (the day after US Thanksgiving has since become a “retail bonanza” in other countries), the trend is a little different when we look to the full month of November.
US most popular days for e-commerce
#1. Cyber Monday, November 29.
#2. Monday, November 2.
#3. Sunday, November 1.
The Black Friday week definitely had a big impact on e-commerce traffic, but besides the clear winner, Cyber Monday, the podium was actually completed with the first two days in November. Those days have a big traffic peak, but the Black Friday week has more sustained traffic over five days.
When we look just at last week, Black Friday isn’t actually the most popular day, it’s Monday, November 22 — that isn’t surprising given that shoppers also “returned to stores” on Black Friday 2021 and didn’t do everything online.
Despite this, Black Friday 2021 had definitely more sustained traffic throughout the day. The line in the next chart stays up on November 26 (Black Friday) for several hours after 12:00 UTC, early morning in the US, more than in the previous days.
For example, when we look at the 00:00 UTC mark in those red circles (19:00 US East Coast time; 16:00 US West Coast time), Black Friday evening was the most popular evening of the week — even more than November 22. In the past few days, only Cyber Monday had (a lot) more traffic than Black Friday.
And we can also notice the “pause” in online shopping for Thanksgiving Day (we wrote a blog post about that).
2021: How about the UK, France, Germany or India?
With our new Radar tool for e-commerce websites, everyone can see the trends for their country looking back to the previous seven or 30 days. We can give some interesting examples by looking at some countries.
In the UK, for example, the most popular day was Black Friday, followed by Cyber Monday.
In Germany, Black Friday 2021, followed by Cyber Monday, were the most popular days although there’s a bigger traffic peak on November 2.
In the neighbourhood, ‘down’ in France, the most popular days for e-commerce were Thursday, November 18, and Tuesday, November 23. Those days were even bigger than Black Friday or Cyber Monday — there’s also a clear sustained increase in traffic in the Black Friday week.
Now let’s ‘travel’ to India, the fastest growing online retail market in the world, which also had the Black Friday week as the best week of the month for online shopping. Cyber Monday was the most popular day, followed by Wednesday, November 24, and also Black Friday.
One exception seems to be Japan. The start of the Black Friday week and the end of the previous week were the better periods for online shopping traffic — November 18, 23 and 20 were much better days than Black Friday or Cyber Monday.
The mobile traffic percentage rose by the end of November
So how about November? If we look at the worldwide trend, it’s pretty clear that after Sunday, November 22, the mobile traffic percentage went up — Internet traffic from mobile devices represented 55% of the total in the past week.
We can also see in the next chart that Black Friday, November 26, saw an increase of more than 4% in the mobile traffic percentage, compared to the same period of the previous month. So, people were using their mobile devices a lot more to go online — 4% more.
Now let’s go to the US, where Thanksgiving (as we explained before) had a big influence on Internet traffic. That trend is even more pronounced, specifically on Thanksgiving day, November 25 (mobile traffic percentage grew more than 6%), but also on Black Friday, November 26. At the weekend mobile traffic went back down.
And remember: you can keep an eye on Cloudflare Radar to monitor how we see Internet traffic globally and in every country.
So, if you like to keep up with the tradition in the United States you and your family yesterday (November 25, 2021) celebrated Thanksgiving. So on a special day, with family gatherings for many and with a lot of cooking if you’re into the tradition (roast turkey, stuffing and pumpkin pie), it makes sense that different Internet patterns show up on Cloudflare Radar.
First, let’s look at shopping habits. After a busy Monday, Tuesday and Wednesday, online shopping paused for Thanksgiving Day and dipped at lunchtime. So in a very good week for e-Commerce, Thanksgiving was an exception, especially at the extended lunchtime.
Now, let’s focus on Internet traffic at the time of the Thanksgiving Dinner. First, what time is that? Every family is different, but a 2018 survey of US consumers showed that for 42% early afternoon (between 13:00 and 15:00 is the preferred time to sit at the table and start to dig in). But 16:00 seems to be the “correct time” — The Atlantic explains why.
Cloudflare Radar shows that Internet traffic in the US increased this past seven days, compared with the previous period, and that makes sense given that it’s traditionally a good week for online shopping. But we can also see in the next chart that the time of Thanksgiving dinner in the continental US was a clear exception.
The circle in red in the chart clearly shows us that yesterday afternoon in the US the Internet traffic was a lot slower than the previous days at the same time and that’s more evident between 21:00 and 01:00 UTC (we use that as a standard timezone in Radar). That time period is “translated” for the East Coast between 16:00 and 20:00 EST and for the West Coast the time between 13:00 to 17:00 PST.
Internet traffic is going up
We can also use Cloudflare Radar to see that in the last two weeks Internet traffic in the US has been increasing (compared with the same period of the previous month). In a time of the year when temperatures go down, Internet traffic was definitely going up. That’s more evident this week after Sunday, November 21.
The biggest spike of the last 30 days, so far (maybe today, Black Friday, November 26, will change that — you can see the live trends using Radar), was definitely in the evening of Monday, November 22 (~02:00 UTC, November 23). This past Tuesday night, November 23, was the second day of the month with the highest traffic in the US, and the third day was actually the next day (Wednesday, November 24).
We can also see on Radar (represented in the next chart) that after several days of the Internet traffic peaks being reached at around 02:00 UTC (which “translates” to 21:00 EST and 18:00 PST), this Thanksgiving Day it was reached later, at about 03:00 UTC (22:00 EST and 19:00 PST).
Mobile traffic goes up in the busiest online week of the month
Another interesting trend regarding Thanksgiving week in the US is how there are more people this week using mobile devices to access the Internet than in the previous weeks.
Yesterday, November 25, mobile traffic represented 54% of the Internet traffic in the US. That’s 8% more than the usual 46% of mobile traffic percentage in the US that we registered in the last 30 days — in the last seven days that number goes up to 49%.
We can actually see this more clearly when we only focus on mobile traffic. This past Thursday, Thanksgiving Day, the mobile traffic percentage in the US increased by about 6% compared to the previous week:
Conclusion
When we announced Cloudflare Radar, back in September 2020, we explained how Internet use follows patterns that humans create. Throughout the pandemic we saw different trends caused by people being more at home than usual, but Internet patterns also change at specific times of the year (like when students go back to school or when it’s colder outside) or on some holidays like Thanksgiving.
Like we saw in the US yesterday, a holiday can affect Internet traffic as a whole, but also the time of the day we are online most, the devices we use to access the Internet and the types of websites we visit (e-commerce websites are getting an increase in traffic this week).
And remember: you can keep an eye on Cloudflare Radar to monitor how we see Internet traffic globally and in every country.
Opening night of Web Summit 2021, at the Altice Arena in Lisbon, Portugal. Photo by Sam Barnes/Web Summit
Global in-person events were back in a big way at the start of November (1-4) in Lisbon, Portugal, with Web Summit 2021 gathering more than 42,000 attendees from 128 countries. I was there to discover Internet trends and meet interesting people. What I saw was the contagious excitement of people from all corners of the world coming together for what seemed like a type of normality in a time when the Internet “is almost as important as having water”, according to Sonia Jorge from the World Wide Web Foundation.
Here’s some of what I heard in the halls.
With a lot happening on a screen, the lockdowns throughout the pandemic showed us a glimpse of what the metaverse could be, just without VR or AR headsets. Think about the way many were able to use virtual tools to work all day, learn, collaborate, order food, supplies, and communicate with friends and family — all from their homes.
While many had this experience, many others were unable to, with some talks at the event focusing on the digital divide and how “Internet access is a basic human right”, according to the grandson of Nelson Mandela — we interviewed him, and you can watch the conversation below.
The future already has some paths laid out, and many were discussed at the event.
The pandemic helped to accelerate most of them, especially by bringing more people (in some countries) to the digital world.
The CPO of Meta, Chris Cox, shared how the company previously known as Facebook has some ideas about the future of augmented reality, and how they want to see those ideas play out in the next five to 10 years. “We want to get the conversation going,” he said.
Also present at the event was Jon Vlassopulos, Global Head of Music, Roblox. He explained how virtual concerts on the video game platform could be the future of music performances, and even bring free tickets to fans of famous music stars like Adele. Stars like Zara Larsson, KSI and Ava Max have already performed on Roblox and “they’re making big money from selling digital merchandise”.
On the other hand, Paddy Cosgrave, CEO of Web Summit, says that there’s something magical about in-person big events that can’t be replicated in full online events. However, the real and virtual world can complement each other — it was announced that CES 2022 will use a combination of Web Summit online and offline software.
Web3 was another big part of the discussion, sometimes in clear sight, other times embedded in the many conversations about blockchain, NFTs and cryptocurrencies, and as a vision for a decentralized web (we’re actually working on that).
Speakers also focused on data privacy and security, ethics in AI and data protection. Ownership to the user and sovereignty were topics discussed and emphasized by Sir Tim Berners-Lee on the last day of the event.
The workplace was also a popular topic, as well as the changes it underwent in the past couple of years. We heard about the importance of diversity in the workplace, as well as the future of work — is it going to be flexible, hybrid, full remote or something in between? Speakers also mentioned The Great Resignation and the reset of people’s and organizations’ mindsets.
Using AI to hire and motivate people was also in the air, as well as big topics like the digitalization of healthcare, mental health, behaviour changes in humans (young and adult) who are more and more on the Internet and even the decentralization of financial services.
And here are some examples of the different speakers at the event we talked to:
Vice-Admiral Gouveia e Melo: Vaccination, misinformation and leadership
Portuguese Navy officer and coordinator of the Task Force for the Portugal COVID-19 vaccination plan
Portugal has achieved an 86% vaccination rate on the vice-admiral’s watch. He brought a sense of mission to a task that involved organization, focus and the use of both digital and communication tools.
The country started the vaccination process late but is now one of the countries with a higher vaccination rate in the world. We talked with the vice-admiral about how the Internet helped, but also how it created problems related to disinformation and misinformation, and we asked about the dangers of controlling speech online. Finally, we asked for bits of leadership advice.
Sonia Jorge: The need for Internet — affordable, fast and for everyone
Executive Director World Wide Web Foundation (Alliance for Affordable Internet)
“The Internet is now an essential public good that everybody needs at this time just like we need to drink water or to have electricity and shelter. We should do more to bring everyone into the digital society.”
In some countries around the world Internet access is very limited. In some places people have to go to a particular plaza to have access to the Internet — five years ago John Graham-Cumming saw something similar in Cuba. Sonia Jorge knows that very well. She is trying to bring affordable Internet to everyone and that challenge is more difficult than it appears.
She explains that the world is far behind in the UN’s goals for Internet access — today only about half of the earth’s population has any Internet access at all. But many of those who have access to the World Wide Web have limited possibilities to be online: “some have access once a month, for example.” So the digital divide is real, and it “should worry everyone”.
The pandemic caused health and economic difficulties that didn’t help the mission of bringing good, fast and reliable Internet to everyone. Nevertheless, Sonia — who is Portuguese and moved to the US to study when she was 17 — saw that many African countries like Nigeria began to realize that the Internet is really important for knowledge and also for the possibilities it opens in terms of cultural, financial and societal growth.
Sonia also highlights that there is a big disparity in the world between men and women in terms of Internet access.
David Kiron: The future of work and how AI (and philosophy) can help
Editorial director of MIT Sloan Management Review
Technology will play a significant role in the future of work. In a way, that “future” is already here, but isn’t evenly distributed — and researchers are just beginning to study it. David Kiron goes on to explain the challenge for some people to be “really seen by their leadership when you’re not in the office.”
The former senior researcher at Harvard Business School tells us how companies started valuing employees even more through the pandemic. There’s also an opportunity for different ways of work interaction through digital tools — “Zoom calls aren’t it.” He’s also worried that the pandemic caused a great reset that is driving many out of the workforce entirely: “There’s a trend of working moms opting out,” for example.
About the metaverse and a universe of universes:“If tech leaders spent more time reading philosophy they might have a better sense of where the world is going (…) more and more leaders of companies are taking on the philosopher’s role.”
And how can AI help? “Once you get AI going in a company we saw in our new study that there’s a big bump in morale, collaboration, learning and people’s sense on what they should be doing”. AI can also help better identify talent and match candidates to skills that are already represented in a company, but he also highlights that “humans play a role in all the stages of the hiring and working process.”
David Kiron explains that “if you’re not asking the right questions to your AI teams you’re going to be behind other companies that are doing better questions”. He adds that AI can help with performance, but it also helps “redefine what performance means in your organization by finding other metrics to look at.”
Ana Maiques: neuroscience & women in tech
Co-founder and CEO of neuroscience-based medical device company Neuroelectrics
We talked to Ana about the future of the Internet. She thinks moving forward there will be more fluid interfaces — not only limited to computers and smartphones, but we will have different devices that go beyond VR headsets and that will lead to new types of interactions. In the neuroscience field, she has big hopes in the technology that Neuroelectrics, her company, is developing in Barcelona, Spain. They work with devices that use non-invasive transcranial electrical stimulation to treat the brain in diseases like epilepsy, depression and Alzheimer.
Neuroelectricsis also developing a process called digital copy (for better personalized treatments) that could be useful in the future if someone develops one of these problems. But she says humankind is still very far from the dangers of something like a mind-reading device or the possibility of reading and downloading thoughts and dreams: “it’s fun to think of science fiction possibilities, but we need to act now on things and problems that are affecting us today.”
She also talks about the difficulties of being a woman in the tech business and raising money. “But little by little I see more women and that’s why it’s important to get out there and explain to women that they can do it.”
Siyabulela Mandela: The Internet is a human right
Director for Africa Journalists for Human Rights
The grandson of Nelson Mandela is on a mission to help journalists in Africa to be free to publish human rights stories. He explains how the Internet is critical for this mission and “a human rights issue”. Not only does the Internet give communities access to trustworthy information, but it also helps them become aware of their rights, gives access to financial tools and allows them to grow in our era.
He also highlights how the Internet can be misused, for example when it becomes a vehicle for misinformation, or when governments shut down Internet access to control communities — in Sudan the Internet has been cut off since October 25, 2021 (you can track that information on Cloudflare Radar).
Carlos Moedas: The light (and innovation) in Lisbon
Newly elected Mayor of Lisbon; previous European Commissioner for Research, Science and Innovation
Why is Lisbon attracting so many tech companies and talent? Carlos Moedas welcomes Cloudflare to his city — we’re growing fast in the city, and we have more than 80 job openings in the country. He also talks about why Portugal’s capital is so special and should be considered by company leaders who want to grow innovative companies. Paddy Cosgrave, from the Web Summit, told us something similar four weeks ago.
The ambition? “Make Lisbon the capital of innovation of the world” or, at least, of Europe. The new mayor also has a project called Unicorn Factory to achieve just that.
Sudarsan Reddy: Why is Cloudflare Tunnel relevant?
Cloudflare engineer from the Tunnel Team
Also, at the event was our very own engineer Sudarsan Reddy (based in Lisbon). We asked him some questions about Cloudflare Tunnel, our tunneling software that lets you quickly secure and encrypt application traffic to any type of infrastructure, so you can hide your server IP addresses, block direct attacks, and get back to delivering great applications.
Sudarsan focuses on what Tunnel is, why it is relevant, how it works and examples of situations where it can make a difference.
Yusuf Sherwani: Addiction treated online
Co-founder & CEO, Quit Genius
Yusuf graduated as a doctor from Imperial College School of Medicine, in London, but joined two passions, healthcare and technology, when he co-founded Quit Genius. He explains how in just 18 months the pandemic accelerated the adoption of digital health by 10 years, and there’s no going back. “The Internet enables people to unlock improvements to their lives, and digital healthcare went from being convenient to a necessity”.
We dig into the benefits of digital healthcare, but also the scrutiny that is needed in technology, now that it is more powerful than ever and cemented in people’s lives. Yusuf also gives examples of how his digital clinic is helping people in treating tobacco, vaping, alcohol, and opioid addictions.
Yusuf has co-authored 12 peer-reviewed studies on behavioural health and substance addictions. He was featured on the Forbes 30 Under 30 List of 2018 and in Fast Company’s 100 Most Creative People in Business.
David Shrier: From sharing economy to blockchain
American futurist and Professor of Practice, AI & Innovation with Imperial College Business School in London
David sums up how the pandemic has affected people’s relationship with technology: “Everyone is tired of Zoom calls, but the convenience opened people’s minds”.
We also talk about the digital divide, about human-centered ways of working with AI, and we also address the potential in VR and AR and how nobody saw the sharing economy coming 20 years ago and, now, “it’s incredible to see how people embraced blockchain and the digitalization of financial services”.
Dame Til Wykes: The mental health discussion went viral
Professor of Clinical Psychology and Rehabilitation at King’s College London, Director of the NIHR Clinical Research Network: Mental Health
As someone with experience in the psychology field for more than 50 years, Dame Til Wykes still had to learn new ways of engaging with patients throughout the pandemic — and even learn which buttons to push on a computer to make Zoom calls. COVID-19 and the hardships of the pandemic made people more aware and ready to talk about their mental health issues, like anxiety or depression. But the pandemic wasn’t the same for everyone and Dame Til Wykes is worried about some of the effects, “most of them remain to be seen”.
Remote consultations were a big help, but she reminds us that in her field it is important to see the whole person and not just the face — for example, “if someone is tapping a foot nervously while giving us a smile, that tells us something that we cannot see in a Zoom call”. She also mentions the adoption of meditation apps bringing a form of help to some was another positive trend in this difficult period, as well as the reset button the pandemic brought to some people’s lives.
A few days after Sudan restored access to the Internet, people living in Burkina Faso are facing an Internet shutdown. On Saturday, Cloudflare Radar shows that after 22:00 UTC (the same local time) Internet traffic went down significantly, something that has happened in the context of social tensions in the country that started on November 14, 2021, and after this Saturday’s shooting of protesters that tried to block a French military convoy.
It is clear when we look at the last 30 days, that Sunday and today, Monday, November 22, are days almost without Internet traffic in Burkina Faso.
All the Internet Service Providers (ISP) of the country were significantly affected by what we could see in our data. That is evident when we look at HTTP traffic by ASN (Autonomous System Number). Orange, FasoNet and Telecel are the three most used ISPs in the country and this chart clearly shows how they were impacted.
Mobile traffic affected
Burkina Faso is a mobile-first country because mobile is the main way of accessing the Internet — in the last 30 days the mobile traffic percentage represented 77% of the total Internet traffic in the country.
We can also see in Cloudflare Radar that desktop traffic percentage went up after Saturday night (the dark blue line in the chart), something that indicates that mobile networks were the main focus of the shutdown.
Looking at the number of requests we get a better ‘picture’ of the situation and how the desktop traffic percentage started to take over compared to mobile traffic in the last few days.
In the case of Sudan, the Internet shutdown went on for 25 days. You can keep an eye on Cloudflare Radar to monitor how the Burkina Faso situation evolves, but also you can see the Internet traffic globally and in every country.
Internet traffic started to come back in Sudan (with limitations) on Thursday, November 18, 2021. This happened after 25 days of an almost complete shutdown that affected the whole country. It’s a simple line going up on a chart for us, but for a country that also meant that Internet access was (at least in part) back on with all of what comes with it for businesses, communities, families and society as a whole.
You can see that trend on Cloudflare Radar, in particular after 13:00 UTC (15:00 local time). After that Internet traffic went up like we haven’t seen at all in the previous three weeks.
Internet access was mostly cut off on October 25, 2021, after a political turmoil in the country. A Sudanese court previously ordered the restoration of Internet access on November 9, but until last Thursday, November 18, there were no signs of services returning to normal. The biggest Internet access shutdown in recent history in the country was back in 2019 — for a full 36 days.
Looking back at the last 30 days Cloudflare Radar shows very distinctively a big difference from what was previously normal in the country.
On Wednesday, November 17, (around 11:00 UTC) we saw a further drop in traffic getting Internet traffic in the country close to zero.
Now our data shows that the Internet in Sudan picked up firstly thanks to two ISPs, Mobitel and MTN. One of the largest in the country, Sudatel (purple line) for a few hours was also still mostly down, but it came back later in the evening (~18:00 UTC).
In terms of social media, our data also shows that especially Facebook traffic went up at the same time Internet access was beginning to pick up but went down a few hours later. According to local reports, there could be restrictions to social media on mobile networks in the country.
Mobile traffic saw a big increase, especially after 14:00 UTC. That is normal behaviour in a country where mobile traffic is king (back in October we showed in our blog post about mobile traffic how Sudan was one of the countries in the world with a large percentage of mobile traffic — 83%).
Internet shutdowns are not that rare
We’ve said it before here in our blog, but it is always good to emphasize: Internet disruptions, including shutdowns and social media restrictions, are common occurrences in some countries and Sudan is one where this happens more frequently than most countries according to Human Rights Watch.
In our June 22, 2021, blog, we talked about Sudan when the country decided to shut down the Internet to prevent cheating in exams, but there were situations in the past more similar to this days-long shutdown — something that usually happens when there’s political unrest.
The country’s longest recorded network disruption was back in 2018, when Sudanese authorities cut off access to social media (and messaging apps like WhatsApp) for 68 consecutive days from December 21, 2018, to February 26, 2019. After that, there was a full mobile Internet shutdown reported from June 3 to July 9, 2019, that lasted 36 days.
This time, in 2021, it was 25 days when the Internet access was reduced to just a trickle of traffic getting through.
You can keep an eye on Cloudflare Radar to monitor how we see the Internet traffic globally and in every country.
For many (especially in the Northern Hemisphere, where about 87% of humans live), September is the “get back to school” (or work) month after a summer break and that also reflects changes in the Internet traffic, particularly in mobile usage.
Looking at our data (you can see many of these insights in Cloudflare Radar) there’s a global trend: mobile traffic lost importance (compared with desktop traffic) in September. The next chart shows there was less percentage of Internet traffic from mobile devices after Monday, September 6, 2021, with a difference of -2% in some days, compared with the previous four weeks (August), and in late September it’s more than -3%.
We can also see that the percentage of desktop traffic increased in September compared to August (we compare here to complete weeks between both months because there are significant differences between weekdays and weekends).
A few of weeks ago, we saw there are considerable differences between countries regarding the importance of mobile usage. Getting back to work (or office hours) usually means an increase in desktop traffic. In that blog we highlighted the advantages that mobile devices brought to developing countries — many had their first contact with the Internet via a smartphone.
Different calendars to consider
Looking at September 2021, those shifts in Internet trends are more dependent on countries that start their school period at this time of the year and also there are the COVID lockdowns effects (more limited this year) to consider.
In the Northern Hemisphere, many countries start school in September after a break during the summer.
Europe: Back to school brings less time to be mobile
Europe is mostly coherent, and it is easier to check for mobile traffic patterns there. Most countries start school in the first 14 days of September, although Finland, Norway, Sweden and Denmark start in late August (like some states in the US, for example).
There are some countries in Europe where the mobile traffic went down in September more clearly (the overall picture in the continent is similar to the worldwide situation we described). Poland, Malta, Portugal, Italy, Spain registered a drop in specific periods of a few days in September of more than 5% in the mobile traffic percentage of the total Internet traffic.
Let’s ‘travel’ to Spain, a country where mobile traffic usually represents 45% of Internet traffic (in August this number was higher). Spanish schools officially opened for the new school year on Monday, September 6, and mobile traffic percentage lost more than 5% of its importance in some days of that week, a trend that grew the following week.
Portugal: A public holiday makes mobile usage go up
Portugal shows the same trend as other European countries but as shown in the following chart there was an apparent increase in mobile traffic percentage on October 5, 2021.
That Tuesday, Cloudflare’s Lisbon office was closed; the same happened across the country because it happens to be a public holiday, Republic Day. With most people not having to work in the middle of the week, the percentage of mobile traffic has risen (most visible at 19:00 local time).
Downs and ups
In Italy, we can see the same pattern, and it was also in the second week of school that mobile traffic percentage went down up to 8%. But by the end of September, it began to normalise to the values of the end of August.
The trend of mobile traffic going back to having the same level as late August is more clear in the Netherlands.
Japan, where the school year starts in April, but there’s a summer break through July and August (this year there were changes related to COVID), also shows the same trend of a decrease in mobile traffic that we saw in the Netherlands after school returned on September 6, 2021.
US: Start of the school year influenced by COVID
The United States had an atypical start of the school year because of COVID. Many states pushed the return to school from August to September (New York City started on September 13), and there were several schools with online classes because of the pandemic, but there’s also a drop in mobile traffic percentage, especially after Monday, September 6.
Further north of the continent, Canada (the school year officially started on September 1) saw mobile traffic lose more of its importance after September 6, a trend that grew by the end of the month.
China saw a decrease in mobile traffic percentage right away in the beginning of September (when the school year started), but mobile recovered in the last week of the month.
Russia with different patterns
Then there are countries with trends that go the other way around. Russia saw an increase (and not a decrease like in most countries of the Northern Hemisphere) in mobile traffic percentage a few days before the school year. But news reports show that many schools were closed because of COVID and only started to open by September 20 (the next chart shows precisely a decrease of mobile traffic percentage in that week.
The same trend is observed in Cyprus — the only EU country where mobile traffic percentage increases after the first week of school. That could be related with some school closures in the past few weeks COVID related.
Nigeria: COVID impact
When we go to Africa, Nigeria is just above the Earth’s equator line and is the most populous country on the continent (population: 206 million), and the school year was officially scheduled to start on September 13. But reports from UNICEF show that school reopening was postponed a few weeks because of the pandemic situation in Nigeria.
This seems to go along the same lines as our data shows: mobile traffic percentage grew on the week of September 13 and only started to come down by the end of September and the beginning of October.
Conclusion: September, September, the back to school/work centre
September brings shifts in the Internet traffic trends that seem to have an impact on the way people access the Internet and that goes beyond mobile usage, we can also see that worldwide: the Internet traffic percentage grew significantly — some days more than 10% — in September compared to August (like the graph shows).
It’s not that surprising when you realise that most people on Earth live in the Northern Hemisphere, where August is a summer and vacation month for many – although countries like India have the rainy monsoon season in August and Mid-September before autumn, for example. So September is not only the month wherein some countries students go back to school, but also when many go back to work.
It’s not every day that there is no Internet access in an entire country. In the case of Sudan, it has been five days without Internet after political turmoil that started last Monday, October 25, 2021 (as we described).
The outage continues with almost a flat line and just a trickle of Internet traffic from Sudan. Cloudflare Radar shows that the Internet in Sudan is still almost completely cut off.
There was a blip of traffic on Tuesday at ~14:00 UTC, for about one hour, but it flattened out again, and it continues like that — anyone can track the evolution on the Sudan page of Cloudflare Radar.
Internet shutdowns are not that rare
Internet disruptions, including shutdowns and social media restrictions, are common occurrences in some countries and Sudan is one where this happens more frequently than most countries according to Human Rights Watch. In our June blog, we talked about Sudan when the country decided to shut down the Internet to prevent cheating in exams, but there were situations in the past more similar to this days-long shutdown — something that usually happens when there’s political unrest.
The country’s longest recorded network disruption was back in 2018, when Sudanese authorities cut off access to social media (and messaging apps like WhatsApp) for 68 consecutive days from December 21, 2018 to February 26, 2019. There was a full mobile Internet shutdown reported from June 3 to July 9, 2019 that lasted 36 days.
You can keep an eye on Cloudflare Radar to monitor how we see the Internet traffic globally and in every country.
The collective thoughts of the interwebz
Manage Consent
To provide the best experiences, we use technologies like cookies to store and/or access device information. Consenting to these technologies will allow us to process data such as browsing behavior or unique IDs on this site. Not consenting or withdrawing consent, may adversely affect certain features and functions.
Functional
Always active
The technical storage or access is strictly necessary for the legitimate purpose of enabling the use of a specific service explicitly requested by the subscriber or user, or for the sole purpose of carrying out the transmission of a communication over an electronic communications network.
Preferences
The technical storage or access is necessary for the legitimate purpose of storing preferences that are not requested by the subscriber or user.
Statistics
The technical storage or access that is used exclusively for statistical purposes.The technical storage or access that is used exclusively for anonymous statistical purposes. Without a subpoena, voluntary compliance on the part of your Internet Service Provider, or additional records from a third party, information stored or retrieved for this purpose alone cannot usually be used to identify you.
Marketing
The technical storage or access is required to create user profiles to send advertising, or to track the user on a website or across several websites for similar marketing purposes.